UNITED STATES
SECURITIES AND EXCHANGE COMMISSION
Washington, D.C. 20549
FORM N-CSR
CERTIFIED SHAREHOLDER REPORT OF REGISTERED
MANAGEMENT INVESTMENT COMPANIES
| | | | | | | | | | | | | | | | | | | | |
| Investment Company Act file number | 811-05188 |
| |
| AMERICAN CENTURY VARIABLE PORTFOLIOS, INC. |
| (Exact name of registrant as specified in charter) |
| |
| 4500 MAIN STREET, KANSAS CITY, MISSOURI | 64111 |
| (Address of principal executive offices) | (Zip Code) |
| |
JOHN PAK
4500 MAIN STREET, KANSAS CITY, MISSOURI 64111 |
| (Name and address of agent for service) |
| |
| Registrant’s telephone number, including area code: | 816-531-5575 |
| |
| Date of fiscal year end: | 12-31 |
| |
| Date of reporting period: | 12-31-2021 |
ITEM 1. REPORTS TO STOCKHOLDERS.
(a) Provided under separate cover.
| | | | | |
| |
| Annual Report |
| |
| December 31, 2021 |
| |
| VP Balanced Fund |
| Class I (AVBIX) |
| Class II (AVBTX) |
| | | | | |
| Performance | |
| Portfolio Commentary | |
| Fund Characteristics | |
| Shareholder Fee Example | |
| Schedule of Investments | |
| Statement of Assets and Liabilities | |
| Statement of Operations | |
| Statement of Changes in Net Assets | |
| Notes to Financial Statements | |
| Financial Highlights | |
| Report of Independent Registered Public Accounting Firm | |
| Management | |
| |
| |
| |
| Additional Information | |
| |
| |
| |
| |
Any opinions expressed in this report reflect those of the author as of the date of the report, and do not necessarily represent the opinions of American Century Investments® or any other person in the American Century Investments organization. Any such opinions are subject to change at any time based upon market or other conditions and American Century Investments disclaims any responsibility to update such opinions. These opinions may not be relied upon as investment advice and, because investment decisions made by American Century Investments funds are based on numerous factors, may not be relied upon as an indication of trading intent on behalf of any American Century Investments fund. Security examples are used for representational purposes only and are not intended as recommendations to purchase or sell securities. Performance information for comparative indices and securities is provided to American Century Investments by third party vendors. To the best of American Century Investments’ knowledge, such information is accurate at the time of printing.
| | | | | | | | | | | | | | | | | | | | |
| Total Returns as of December 31, 2021 |
| | | Average Annual Returns | |
| Ticker
Symbol | 1 year | 5 years | 10 years | Since
Inception | Inception
Date |
| Class I | AVBIX | 15.77% | 11.33% | 9.90% | — | 5/1/91 |
| S&P 500 Index | — | 28.71% | 18.46% | 16.54% | — | — |
| Bloomberg U.S. Aggregate Bond Index | — | -1.54% | 3.57% | 2.90% | — | — |
| Blended Index | — | 15.86% | 12.62% | 11.14% | — | — |
| Class II | AVBTX | 15.48% | 11.05% | — | 10.58% | 5/2/16 |
Average annual returns since inception are presented when ten years of performance history is not available.
Fund returns would have been lower if a portion of the fees had not been waived. The blended index combines monthly returns of two widely known indices in proportion to the asset mix of the fund. The S&P 500 Index represents 60% of the index and the remaining 40% is represented by the Bloomberg U.S. Aggregate Bond Index.
The performance information presented does not include the fees and charges assessed with investments in variable insurance products, those charges are disclosed in the separate account prospectus. The inclusion of such fees and charges would lower performance.
Data presented reflect past performance. Past performance is no guarantee of future results. Current performance may be higher or lower than the performance shown. Total returns for periods less than one year are not annualized. Investment return and principal value will fluctuate, and redemption value may be more or less than original cost. Data assumes reinvestment of dividends and capital gains, and none of the charts reflect the deduction of taxes that a shareholder would pay on fund distributions or the redemption of fund shares. To obtain performance data current to the most recent month end, please call 1-800-345-6488 or visit ipro.americancentury.com (for Investment Professionals). For additional information about the fund, please consult the prospectus.
| | |
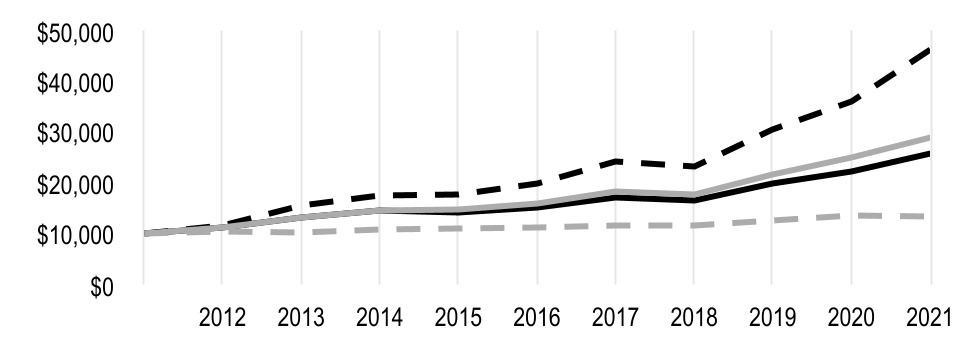
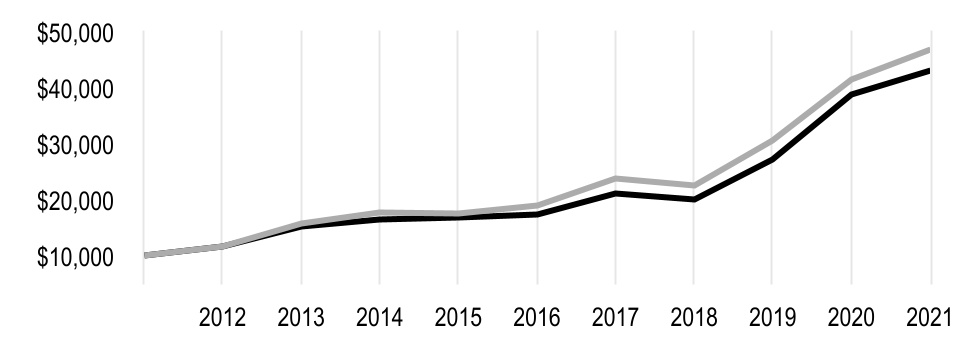
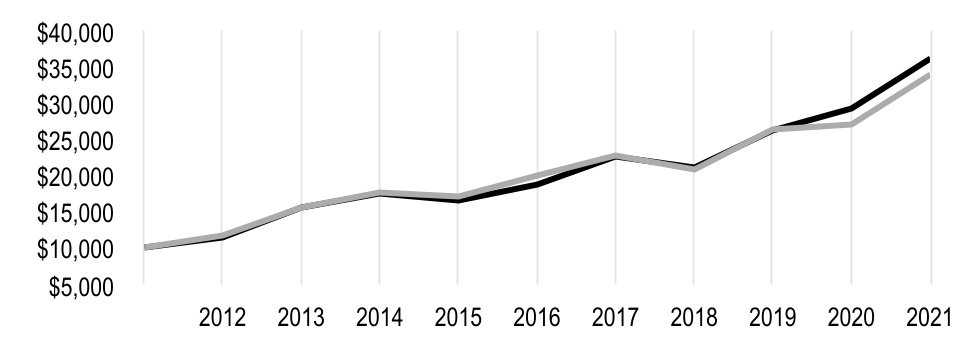
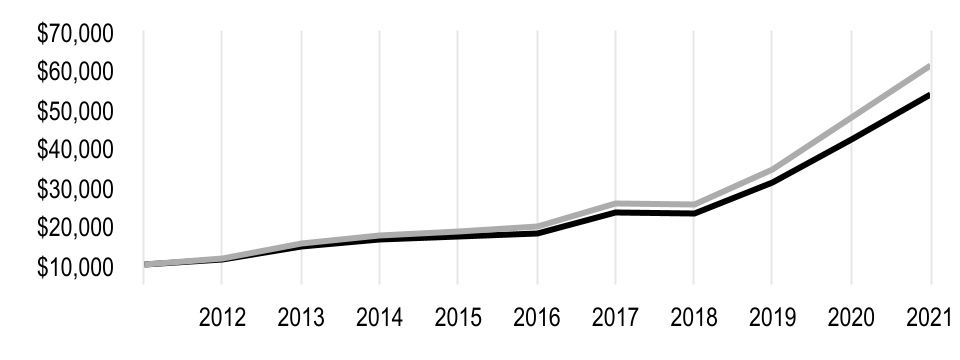
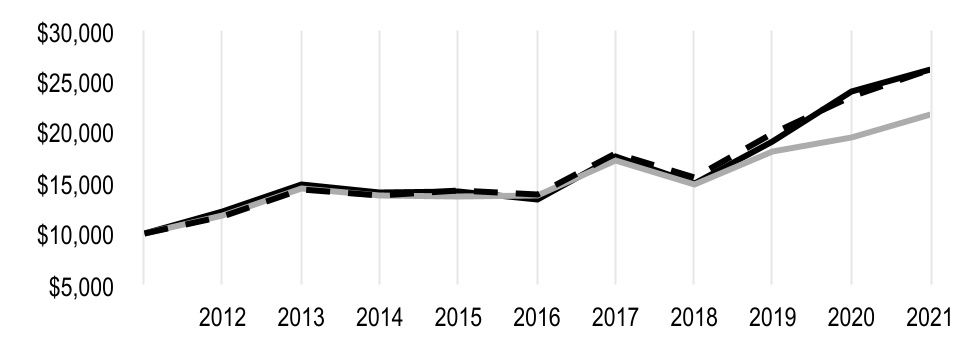
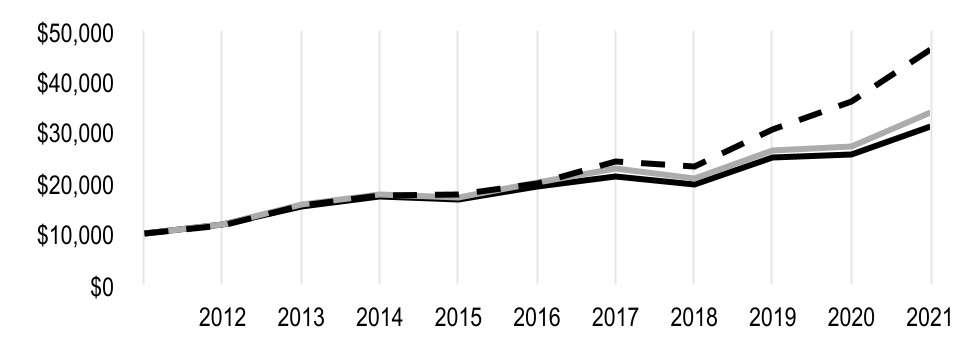
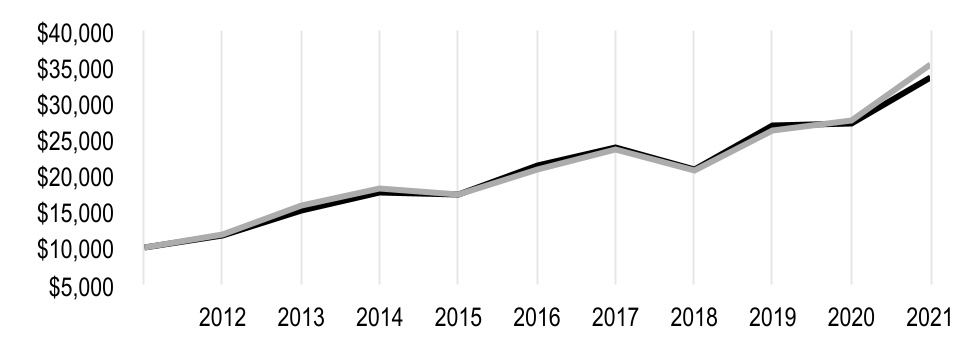
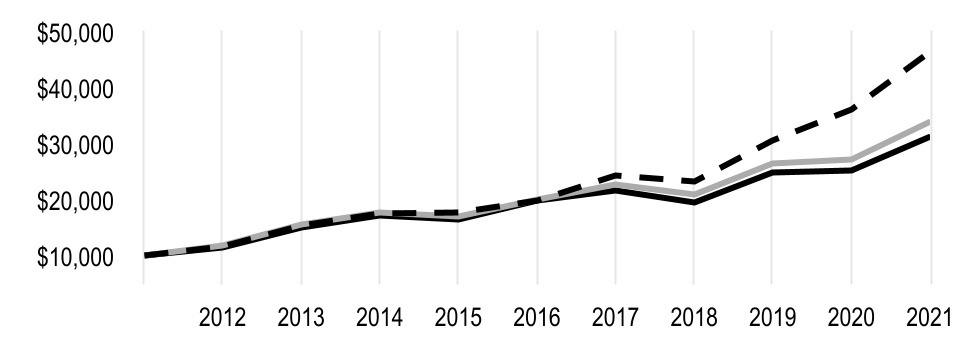
| Growth of $10,000 Over 10 Years |
| $10,000 investment made December 31, 2011 |
| Performance for other share classes will vary due to differences in fee structure. |
| | | | | |
| Value on December 31, 2021 |
| Class I — $25,713 |
|
| S&P 500 Index — $46,257 |
|
| Bloomberg U.S. Aggregate Bond Index — $13,307 |
|
| Blended Index — $28,759 |
|
Ending value of Class I would have been lower if a portion of the fees had not been waived.
| | | | | |
| Total Annual Fund Operating Expenses |
| Class I | Class II |
| 0.90% | 1.15% |
The total annual fund operating expenses shown is as stated in the fund’s prospectus current as of the date of this report. The prospectus may vary from the expense ratio shown elsewhere in this report because it is based on a different time period, includes acquired fund fees and expenses, and, if applicable, does not include fee waivers or expense reimbursements.
Data presented reflect past performance. Past performance is no guarantee of future results. Current performance may be higher or lower than the performance shown. Total returns for periods less than one year are not annualized. Investment return and principal value will fluctuate, and redemption value may be more or less than original cost. Data assumes reinvestment of dividends and capital gains, and none of the charts reflect the deduction of taxes that a shareholder would pay on fund distributions or the redemption of fund shares. To obtain performance data current to the most recent month end, please call 1-800-345-6488 or visit ipro.americancentury.com (for Investment Professionals). For additional information about the fund, please consult the prospectus.
Equity Portfolio Managers: Joseph Reiland, Justin Brown and Robert Bove
As of September 1, 2021, Joseph Reiland, Justin Brown and Robert Bove joined the portfolio management team, replacing Steve Rossi and Guan Wang. This reflects the equity allocation’s transition to the U.S. Sustainable Large Cap Core strategy. The equity allocation retains the S&P 500 Index as its benchmark.
Fixed-Income Portfolio Managers: Bob Gahagan, Charles Tan and Jason Greenblath
Brian Howell left the portfolio management team August 1, 2021. He is retiring, effective December 31, 2021. Jason Greenblath joined the team in his place.
Performance Summary
VP Balanced returned 15.77%* for the year ended December 31, 2021. By comparison, a blended index consisting of 60% S&P 500 Index and 40% Bloomberg U.S. Aggregate Bond Index returned 15.86%. Because the vast majority of the portfolio’s risk and return come from its stock allocation, we begin by discussing the performance of the equity portion of VP Balanced.
Information Technology and Financials Stocks Led Equity Detractors
The equity portfolio’s performance was driven by underperformance in the information technology, financials and communication services sectors. In the computer and peripherals industry, an overweight position in Seagate Technology, a maker of computer disk drives, detracted from results, and we exited the position during the period. An underweight position in Apple also hindered performance. The company posted strong year-over-year results despite some supply chain constraints in the fourth quarter.
Allocation decisions in the financials sector, especially in the capital markets, insurance and banking industries, were leading sources of weakness. In capital markets, an underweight position in The Charles Schwab Corp. hampered relative results. The online brokerage firm, along with others in this industry, have benefited from a surge in retail accounts during the pandemic, and trading activity has grown as equity markets recovered. Underweighting Wells Fargo & Co. and JPMorgan Chase & Co. stocks was detrimental as banking stocks benefited from the economic recovery and rising interest rates. During the period, we exited our positions in Charles Schwab and Well Fargo.
In the communication services sector, an underweight to Alphabet, parent company of Google, detracted from performance compared with the benchmark. The company reported strong advertising revenues despite changes to Apple’s operating system that allow users to opt out of targeted advertisements. An overweight to video game maker Take-Two Interactive Software weighed on returns in the entertainment industry. Despite stronger earnings, Take-Two’s stock price declined as investors were disappointed in the company’s lower year-over-year sales. We exited this position during the period.
Health Care, Consumer Staples and Materials Sectors Contributed to Equity Results
Positions in the health care, consumer staples and materials sectors benefited performance. In health care, selections in the health care providers and services industry drove returns. Shares of
*All fund returns referenced in this commentary are for Class I shares. Fund returns would have been lower if a portion of the fees had not been waived. Performance for other share classes will vary due to differences in fee structure; when Class I performance exceeds that of the index, other share classes may not. See page 2 for returns for all share classes.
CVS Health performed well as the strong demand for prescriptions and COVID-19 vaccines helped lift results. AMN Healthcare Services, a staffing company, contributed as it benefited from strong demand for hospital personnel. In the biotechnology industry, an overweight position in Moderna
was advantageous despite a decline late in the year as the company posted strong sales of its COVID-19 vaccine and booster shots. We exited our positions in AMN Healthcare Services and Moderna during the period. In consumer staples, an underweight position in the beverages industry benefited returns, as did an overweight position in Kroger, the food retailer. The company’s digital business continued to drive results and help it cope with labor shortages. We exited this position during the period. Rising demand for industrial metals amid the economic recovery boosted metals prices, benefiting the portfolio’s holdings in the metals and mining industry.
Bond Segment Gains Contribute to Relative Performance
Bonds produced modest declines as yields rose during the year (bond prices and yields move in opposite directions). Late in 2020, the approval of coronavirus vaccines resulted in a shift in sentiment as investors anticipated the lifting of lockdowns and an acceleration of economic growth. In addition, inflation concerns grew during the period due to a stronger economic outlook, loose monetary policy and massive fiscal spending. Inflation concerns and uncertainty about the Federal Reserve’s (Fed) plans to begin reducing its bond purchases weighed further on the market toward the end of the period. Nevertheless, at times bonds benefited from uncertainty when the delta and omicron variants of the virus emerged and threatened to interfere with the economic recovery. Rising inflation throughout the economy led the Fed to raise its inflation forecast and take a more hawkish stance. The Fed began tapering its asset purchases in November and by December, policymakers indicated they would speed up the process amid surging inflation. The Fed also hinted it might hike rates three times in 2022, which contributed to rising Treasury yields.
In this environment, Treasury bonds performed poorly. Investment-grade corporate bonds also declined but held up better, benefiting from the profit recovery in corporate America. The high-yield market also produced positive results, buoyed by attractive yields and the prospect of an improvement in the economy.
A Look Ahead
We remain optimistic that the U.S. economy will continue to expand in 2022. Manufacturing remains robust, home prices are still rising, consumer savings and net worth are solid, and the labor market continues to improve. Furthermore, corporate fundamentals remain strong. Record fiscal spending and continued, albeit waning, Fed support also are aiding the economy. However, we remain mindful of ongoing challenges from supply chain disruptions, inflation, Fed policy and geopolitical events. Inflationary concerns have prompted the Fed to accelerate its taper timeline. Once tapering concludes in early 2022, the Fed likely will hike rates to combat inflation. The Fed faces a difficult challenge in tempering inflation without stifling economic growth. The good news is the Fed has options. If the economy slows, policymakers can slow or halt tapering or hold rates steady for a longer period.
Record government spending, a growing economy and elevated inflation should continue to push Treasury yields higher. However, given the U.S. already has the highest yields among the developed markets, we don’t expect rates to skyrocket. In our view, 2.25% may represent the ceiling for the 10-year Treasury yield. Accordingly, we expect to maintain our short-duration strategy. We expect annual headline inflation to peak in the first quarter of 2022. From there it may moderate, but it likely will persist well above pre-pandemic levels. Several trends, including record federal spending and deficits, rising wages and housing costs, supply/demand imbalances and onshoring efforts, will continue to pressure prices.
We expect market volatility to ramp up in the coming months. Investors face a mix of uncertainties related to the pandemic, supply chains, global growth, geopolitics and more. A Fed policy error—that is, hiking rates sooner/faster than the market expects or the economy can handle—remains a key risk we’re monitoring. At the same time, we will look for attractive buying opportunities that often emerge during volatile periods. We believe active security selection remains key to outperformance.
| | | | | |
| DECEMBER 31, 2021 |
| Types of Investments in Portfolio | % of net assets |
| Common Stocks | 61.0% |
| U.S. Treasury Securities | 15.2% |
| Corporate Bonds | 10.4% |
| U.S. Government Agency Mortgage-Backed Securities | 4.4% |
| Collateralized Loan Obligations | 2.7% |
| Asset-Backed Securities | 2.5% |
| Collateralized Mortgage Obligations | 2.3% |
| Commercial Mortgage-Backed Securities | 0.9% |
| Municipal Securities | 0.6% |
| U.S. Government Agency Securities | 0.2% |
| Bank Loan Obligations | 0.1% |
| Sovereign Governments and Agencies | —* |
| Preferred Stocks | —* |
| Temporary Cash Investments | 0.7% |
| Other Assets and Liabilities | (1.0)% |
| *Category is less than 0.05% of total net assets. |
| |
| Top Five Common Stocks Industries | % of net assets |
| Software | 6.3% |
| Interactive Media and Services | 3.8% |
| Semiconductors and Semiconductor Equipment | 3.7% |
| IT Services | 2.9% |
| Capital Markets | 2.8% |
Fund shareholders may incur two types of costs: (1) transaction costs, including sales charges (loads) on purchase payments and redemption/exchange fees; and (2) ongoing costs, including management fees; distribution and service (12b-1) fees; and other fund expenses. This example is intended to help you understand your ongoing costs (in dollars) of investing in your fund and to compare these costs with the ongoing cost of investing in other mutual funds.
The example is based on an investment of $1,000 made at the beginning of the period and held for the entire period from July 1, 2021 to December 31, 2021.
Actual Expenses
The table provides information about actual account values and actual expenses for each class. You may use the information, together with the amount you invested, to estimate the expenses that you paid over the period. First, identify the share class you own. Then simply divide your account value by $1,000 (for example, an $8,600 account value divided by $1,000 = 8.6), then multiply the result by the number under the heading “Expenses Paid During Period” to estimate the expenses you paid on your account during this period.
Hypothetical Example for Comparison Purposes
The table also provides information about hypothetical account values and hypothetical expenses based on the actual expense ratio of each class of your fund and an assumed rate of return of 5% per year before expenses, which is not the actual return of a fund’s share class. The hypothetical account values and expenses may not be used to estimate the actual ending account balance or expenses you paid for the period. You may use this information to compare the ongoing costs of investing in your fund and other funds. To do so, compare this 5% hypothetical example with the 5% hypothetical examples that appear in the shareholder reports of the other funds.
Please note that the expenses shown in the table are meant to highlight your ongoing costs only and do not reflect any transactional costs, such as sales charges (loads) or redemption/exchange fees. Therefore, the table is useful in comparing ongoing costs only, and will not help you determine the relative total costs of owning different funds. In addition, if these transactional costs were included, your costs would have been higher.
| | | | | | | | | | | | | | |
| Beginning
Account Value
7/1/21 | Ending
Account Value
12/31/21 | Expenses Paid During Period(1) 7/1/21 - 12/31/21 | Annualized Expense Ratio(1) |
| Actual | | | | |
| Class I | $1,000 | $1,067.70 | $4.27 | 0.82% |
| Class II | $1,000 | $1,066.40 | $5.57 | 1.07% |
| Hypothetical | | | | |
| Class I | $1,000 | $1,021.07 | $4.18 | 0.82% |
| Class II | $1,000 | $1,019.81 | $5.45 | 1.07% |
(1)Expenses are equal to the class's annualized expense ratio listed in the table above, multiplied by the average account value over the period, multiplied by 184, the number of days in the most recent fiscal half-year, divided by 365, to reflect the one-half year period. Annualized expense ratio reflects actual expenses, including any applicable fee waivers or expense reimbursements and excluding any acquired fund fees and expenses.
DECEMBER 31, 2021
| | | | | | | | |
| Shares/
Principal Amount | Value |
| COMMON STOCKS — 61.0% |
|
|
| Aerospace and Defense — 0.5% | | |
| Lockheed Martin Corp. | 5,619 | | $ | 1,997,049 | |
| Air Freight and Logistics — 0.6% | | |
| Expeditors International of Washington, Inc. | 1,264 | | 169,742 | |
| United Parcel Service, Inc., Class B | 11,041 | | 2,366,528 | |
| | 2,536,270 | |
| Auto Components — 0.6% | | |
Aptiv plc(1) | 15,219 | | 2,510,374 | |
| Automobiles — 1.4% | | |
Rivian Automotive, Inc., Class A(1) | 6,949 | | 720,542 | |
Tesla, Inc.(1) | 4,441 | | 4,693,160 | |
| | 5,413,702 | |
| Banks — 2.6% | | |
| Bank of America Corp. | 79,038 | | 3,516,400 | |
| JPMorgan Chase & Co. | 25,908 | | 4,102,532 | |
| Regions Financial Corp. | 126,650 | | 2,760,970 | |
| | 10,379,902 | |
| Beverages — 0.9% | | |
| PepsiCo, Inc. | 19,782 | | 3,436,331 | |
| Biotechnology — 0.4% | | |
| Amgen, Inc. | 4,526 | | 1,018,214 | |
Vertex Pharmaceuticals, Inc.(1) | 2,109 | | 463,137 | |
| | 1,481,351 | |
| Building Products — 1.1% | | |
| Johnson Controls International plc | 38,249 | | 3,110,026 | |
| Masco Corp. | 18,138 | | 1,273,651 | |
| | 4,383,677 | |
| Capital Markets — 2.8% | | |
| Ameriprise Financial, Inc. | 5,079 | | 1,532,131 | |
| BlackRock, Inc. | 2,423 | | 2,218,402 | |
| Intercontinental Exchange, Inc. | 8,163 | | 1,116,454 | |
| Morgan Stanley | 37,734 | | 3,703,969 | |
| S&P Global, Inc. | 5,269 | | 2,486,599 | |
| | 11,057,555 | |
| Chemicals — 1.7% | | |
| Air Products and Chemicals, Inc. | 3,540 | | 1,077,080 | |
| Ecolab, Inc. | 4,804 | | 1,126,970 | |
| Linde plc | 8,708 | | 3,016,713 | |
| Sherwin-Williams Co. (The) | 4,251 | | 1,497,032 | |
| | 6,717,795 | |
| Communications Equipment — 0.7% | | |
| Cisco Systems, Inc. | 45,433 | | 2,879,089 | |
| Consumer Finance — 0.5% | | |
| American Express Co. | 12,058 | | 1,972,689 | |
| Containers and Packaging — 0.4% | | |
| Ball Corp. | 15,513 | | 1,493,436 | |
| | | | | | | | |
| Shares/
Principal Amount | Value |
| Diversified Telecommunication Services — 0.1% | | |
| Verizon Communications, Inc. | 8,826 | | $ | 458,599 | |
| Electric Utilities — 1.2% | | |
| NextEra Energy, Inc. | 51,146 | | 4,774,991 | |
| Electrical Equipment — 0.9% | | |
| Eaton Corp. plc | 10,051 | | 1,737,014 | |
Generac Holdings, Inc.(1) | 714 | | 251,271 | |
| Rockwell Automation, Inc. | 4,594 | | 1,602,617 | |
| | 3,590,902 | |
| Electronic Equipment, Instruments and Components — 1.4% |
| CDW Corp. | 9,780 | | 2,002,748 | |
| Cognex Corp. | 12,452 | | 968,268 | |
Keysight Technologies, Inc.(1) | 11,853 | | 2,447,763 | |
| | 5,418,779 | |
| Energy Equipment and Services — 0.6% | | |
| Schlumberger NV | 74,679 | | 2,236,636 | |
| Entertainment — 1.0% | | |
| Electronic Arts, Inc. | 6,828 | | 900,613 | |
Walt Disney Co. (The)(1) | 20,197 | | 3,128,313 | |
| | 4,028,926 | |
| Equity Real Estate Investment Trusts (REITs) — 1.5% | | |
| ProLogis, Inc. | 35,031 | | 5,897,819 | |
| Food and Staples Retailing — 1.0% | | |
| Costco Wholesale Corp. | 2,713 | | 1,540,170 | |
| Sysco Corp. | 28,956 | | 2,274,494 | |
| | 3,814,664 | |
| Food Products — 0.5% | | |
| Mondelez International, Inc., Class A | 25,572 | | 1,695,679 | |
Vital Farms, Inc.(1) | 8,510 | | 153,691 | |
| | 1,849,370 | |
| Health Care Equipment and Supplies — 1.1% | | |
Edwards Lifesciences Corp.(1) | 19,606 | | 2,539,958 | |
| Medtronic plc | 14,558 | | 1,506,025 | |
| ResMed, Inc. | 1,913 | | 498,298 | |
| | 4,544,281 | |
| Health Care Providers and Services — 2.4% | | |
| Cigna Corp. | 11,111 | | 2,551,419 | |
| CVS Health Corp. | 23,947 | | 2,470,373 | |
| Humana, Inc. | 2,207 | | 1,023,739 | |
| UnitedHealth Group, Inc. | 7,189 | | 3,609,884 | |
| | 9,655,415 | |
| Hotels, Restaurants and Leisure — 1.2% | | |
Booking Holdings, Inc.(1) | 669 | | 1,605,085 | |
Chipotle Mexican Grill, Inc.(1) | 666 | | 1,164,334 | |
Expedia Group, Inc.(1) | 10,680 | | 1,930,090 | |
| | 4,699,509 | |
| Household Products — 0.9% | | |
| Colgate-Palmolive Co. | 12,135 | | 1,035,601 | |
| Procter & Gamble Co. (The) | 16,540 | | 2,705,613 | |
| | 3,741,214 | |
| Industrial Conglomerates — 0.7% | | |
| Honeywell International, Inc. | 12,890 | | 2,687,694 | |
| | | | | | | | |
| Shares/
Principal Amount | Value |
| Insurance — 1.0% | | |
| Marsh & McLennan Cos., Inc. | 8,556 | | $ | 1,487,204 | |
| Prudential Financial, Inc. | 9,906 | | 1,072,225 | |
| Travelers Cos., Inc. (The) | 8,434 | | 1,319,331 | |
| | 3,878,760 | |
| Interactive Media and Services — 3.8% | | |
Alphabet, Inc., Class A(1) | 3,394 | | 9,832,554 | |
Alphabet, Inc., Class C(1) | 737 | | 2,132,576 | |
Meta Platforms, Inc., Class A(1) | 9,146 | | 3,076,257 | |
| | 15,041,387 | |
| Internet and Direct Marketing Retail — 2.2% | | |
Amazon.com, Inc.(1) | 2,585 | | 8,619,269 | |
| IT Services — 2.9% | | |
| Accenture plc, Class A | 8,077 | | 3,348,320 | |
| Mastercard, Inc., Class A | 8,142 | | 2,925,584 | |
PayPal Holdings, Inc.(1) | 13,258 | | 2,500,194 | |
| Visa, Inc., Class A | 13,396 | | 2,903,047 | |
| | 11,677,145 | |
| Life Sciences Tools and Services — 1.3% | | |
| Agilent Technologies, Inc. | 15,758 | | 2,515,765 | |
| Thermo Fisher Scientific, Inc. | 4,069 | | 2,714,999 | |
| | 5,230,764 | |
| Machinery — 1.3% | | |
| Cummins, Inc. | 7,374 | | 1,608,565 | |
| Deere & Co. | 336 | | 115,211 | |
| Parker-Hannifin Corp. | 7,042 | | 2,240,201 | |
| Xylem, Inc. | 9,658 | | 1,158,187 | |
| | 5,122,164 | |
| Media — 0.3% | | |
| Comcast Corp., Class A | 24,068 | | 1,211,342 | |
| Multiline Retail — 0.3% | | |
| Target Corp. | 4,769 | | 1,103,737 | |
| Oil, Gas and Consumable Fuels — 0.7% | | |
| ConocoPhillips | 39,980 | | 2,885,756 | |
| Personal Products — 0.3% | | |
| Estee Lauder Cos., Inc. (The), Class A | 3,296 | | 1,220,179 | |
| Pharmaceuticals — 2.0% | | |
| Bristol-Myers Squibb Co. | 36,473 | | 2,274,092 | |
| Merck & Co., Inc. | 23,038 | | 1,765,632 | |
| Novo Nordisk A/S, B Shares | 11,717 | | 1,316,122 | |
| Zoetis, Inc. | 10,301 | | 2,513,753 | |
| | 7,869,599 | |
| Professional Services — 0.1% | | |
| IHS Markit Ltd. | 3,074 | | 408,596 | |
| Road and Rail — 0.7% | | |
| Norfolk Southern Corp. | 5,074 | | 1,510,581 | |
| Union Pacific Corp. | 4,738 | | 1,193,644 | |
| | 2,704,225 | |
| Semiconductors and Semiconductor Equipment — 3.7% | | |
Advanced Micro Devices, Inc.(1) | 11,846 | | 1,704,640 | |
| Applied Materials, Inc. | 15,414 | | 2,425,547 | |
| | | | | | | | |
| Shares/
Principal Amount | Value |
| ASML Holding NV | 2,987 | | $ | 2,392,646 | |
| NVIDIA Corp. | 19,692 | | 5,791,614 | |
| Texas Instruments, Inc. | 13,113 | | 2,471,407 | |
| | 14,785,854 | |
| Software — 6.3% | | |
Adobe, Inc.(1) | 3,650 | | 2,069,769 | |
| Microsoft Corp. | 58,783 | | 19,769,899 | |
salesforce.com, Inc.(1) | 6,119 | | 1,555,021 | |
ServiceNow, Inc.(1) | 1,191 | | 773,090 | |
Workday, Inc., Class A(1) | 2,466 | | 673,662 | |
| | 24,841,441 | |
| Specialty Retail — 1.9% | | |
| Home Depot, Inc. (The) | 11,594 | | 4,811,626 | |
| TJX Cos., Inc. (The) | 23,518 | | 1,785,487 | |
| Tractor Supply Co. | 3,417 | | 815,296 | |
| | 7,412,409 | |
| Technology Hardware, Storage and Peripherals — 2.7% | | |
| Apple, Inc. | 60,834 | | 10,802,293 | |
| Textiles, Apparel and Luxury Goods — 0.8% | | |
Deckers Outdoor Corp.(1) | 2,083 | | 763,024 | |
| NIKE, Inc., Class B | 15,700 | | 2,616,719 | |
| | 3,379,743 | |
TOTAL COMMON STOCKS (Cost $188,113,432) | | 241,852,682 | |
| U.S. TREASURY SECURITIES — 15.2% |
|
|
| U.S. Treasury Bonds, 5.00%, 5/15/37 | $ | 100,000 | | 145,590 | |
| U.S. Treasury Bonds, 3.50%, 2/15/39 | 500,000 | | 627,422 | |
| U.S. Treasury Bonds, 4.625%, 2/15/40 | 600,000 | | 861,961 | |
| U.S. Treasury Bonds, 1.875%, 2/15/41 | 1,100,000 | | 1,089,129 | |
| U.S. Treasury Bonds, 2.00%, 11/15/41 | 300,000 | | 303,516 | |
| U.S. Treasury Bonds, 3.125%, 11/15/41 | 100,000 | | 120,199 | |
| U.S. Treasury Bonds, 3.00%, 5/15/42 | 1,300,000 | | 1,539,891 | |
| U.S. Treasury Bonds, 2.75%, 11/15/42 | 550,000 | | 627,043 | |
| U.S. Treasury Bonds, 2.875%, 5/15/43 | 300,000 | | 348,727 | |
| U.S. Treasury Bonds, 2.50%, 2/15/45 | 600,000 | | 660,070 | |
| U.S. Treasury Bonds, 3.00%, 11/15/45 | 200,000 | | 240,344 | |
| U.S. Treasury Bonds, 2.75%, 8/15/47 | 100,000 | | 116,406 | |
| U.S. Treasury Bonds, 3.375%, 11/15/48 | 1,110,000 | | 1,452,756 | |
| U.S. Treasury Bonds, 2.25%, 8/15/49 | 500,000 | | 535,332 | |
| U.S. Treasury Bonds, 2.375%, 11/15/49 | 750,000 | | 824,180 | |
| U.S. Treasury Bonds, 2.00%, 2/15/50 | 200,000 | | 203,227 | |
| U.S. Treasury Bonds, 1.875%, 2/15/51 | 200,000 | | 197,953 | |
| U.S. Treasury Bonds, 2.375%, 5/15/51 | 1,600,000 | | 1,767,750 | |
| U.S. Treasury Bonds, 2.00%, 8/15/51 | 3,200,000 | | 3,263,000 | |
| U.S. Treasury Inflation Indexed Notes, 0.125%, 10/15/25 | 1,066,310 | | 1,149,888 | |
| U.S. Treasury Inflation Indexed Notes, 0.25%, 7/15/29 | 108,164 | | 121,278 | |
| U.S. Treasury Inflation Indexed Notes, 0.125%, 7/15/30 | 215,824 | | 241,658 | |
| U.S. Treasury Inflation Indexed Notes, 0.125%, 7/15/31 | 206,460 | | 232,276 | |
| U.S. Treasury Notes, 0.25%, 4/15/23 | 100,000 | | 99,676 | |
| U.S. Treasury Notes, 0.125%, 8/31/23 | 1,500,000 | | 1,486,934 | |
| U.S. Treasury Notes, 0.50%, 11/30/23 | 1,600,000 | | 1,594,000 | |
| | | | | | | | |
| Shares/
Principal Amount | Value |
| U.S. Treasury Notes, 2.875%, 11/30/23 | $ | 3,400,000 | | $ | 3,539,453 | |
| U.S. Treasury Notes, 0.125%, 12/15/23 | 1,000,000 | | 988,594 | |
| U.S. Treasury Notes, 0.125%, 1/15/24 | 500,000 | | 493,730 | |
| U.S. Treasury Notes, 2.375%, 2/29/24 | 400,000 | | 413,625 | |
| U.S. Treasury Notes, 0.25%, 3/15/24 | 1,800,000 | | 1,778,695 | |
| U.S. Treasury Notes, 0.375%, 4/15/24 | 2,400,000 | | 2,376,187 | |
| U.S. Treasury Notes, 0.75%, 11/15/24 | 5,500,000 | | 5,469,922 | |
| U.S. Treasury Notes, 1.00%, 12/15/24 | 6,400,000 | | 6,407,750 | |
| U.S. Treasury Notes, 0.25%, 5/31/25 | 200,000 | | 194,578 | |
| U.S. Treasury Notes, 0.25%, 8/31/25 | 1,700,000 | | 1,646,941 | |
U.S. Treasury Notes, 1.625%, 10/31/26(2) | 1,300,000 | | 1,322,395 | |
| U.S. Treasury Notes, 1.25%, 11/30/26 | 1,300,000 | | 1,299,391 | |
| U.S. Treasury Notes, 1.75%, 12/31/26 | 700,000 | | 716,598 | |
| U.S. Treasury Notes, 1.50%, 1/31/27 | 100,000 | | 101,125 | |
| U.S. Treasury Notes, 1.125%, 2/28/27 | 2,700,000 | | 2,679,328 | |
| U.S. Treasury Notes, 0.50%, 4/30/27 | 1,500,000 | | 1,439,180 | |
| U.S. Treasury Notes, 0.50%, 6/30/27 | 200,000 | | 191,422 | |
| U.S. Treasury Notes, 0.50%, 8/31/27 | 800,000 | | 763,531 | |
| U.S. Treasury Notes, 0.625%, 12/31/27 | 1,300,000 | | 1,244,191 | |
| U.S. Treasury Notes, 1.25%, 3/31/28 | 400,000 | | 396,531 | |
| U.S. Treasury Notes, 1.25%, 4/30/28 | 1,350,000 | | 1,338,029 | |
| U.S. Treasury Notes, 1.25%, 6/30/28 | 1,100,000 | | 1,089,000 | |
| U.S. Treasury Notes, 1.375%, 10/31/28 | 200,000 | | 199,250 | |
| U.S. Treasury Notes, 1.50%, 11/30/28 | 4,000,000 | | 4,016,875 | |
| U.S. Treasury Notes, 1.625%, 5/15/31 | 400,000 | | 405,219 | |
TOTAL U.S. TREASURY SECURITIES (Cost $59,322,913) | | 60,361,746 | |
| CORPORATE BONDS — 10.4% |
|
|
| Aerospace and Defense — 0.2% | | |
| Boeing Co. (The), 2.20%, 2/4/26 | 150,000 | | 150,086 | |
| Boeing Co. (The), 3.625%, 2/1/31 | 220,000 | | 234,876 | |
| Boeing Co. (The), 5.81%, 5/1/50 | 80,000 | | 108,537 | |
| Raytheon Technologies Corp., 4.125%, 11/16/28 | 210,000 | | 235,103 | |
| | 728,602 | |
Air Freight and Logistics† | | |
GXO Logistics, Inc., 2.65%, 7/15/31(3) | 115,000 | | 113,746 | |
| Airlines — 0.1% | | |
| American Airlines Pass Through Trust, Series 2021-1, Class A, 2.875%, 1/11/36 | 61,000 | | 60,684 | |
British Airways Pass Through Trust, Series 2021-1, Class A, 2.90%, 9/15/36(3) | 133,987 | | 133,978 | |
Delta Air Lines, Inc. / SkyMiles IP Ltd., 4.75%, 10/20/28(3) | 196,000 | | 214,185 | |
| | 408,847 | |
Auto Components† | | |
| Aptiv plc, 3.10%, 12/1/51 | 100,000 | | 95,433 | |
| Automobiles — 0.3% | | |
| Ford Motor Credit Co. LLC, 3.10%, 5/4/23 | 200,000 | | 204,013 | |
| General Motors Co., 5.15%, 4/1/38 | 130,000 | | 156,968 | |
| General Motors Financial Co., Inc., 2.75%, 6/20/25 | 274,000 | | 282,960 | |
| General Motors Financial Co., Inc., 2.70%, 8/20/27 | 96,000 | | 97,724 | |
| General Motors Financial Co., Inc., 2.40%, 10/15/28 | 158,000 | | 157,687 | |
| Toyota Motor Credit Corp., MTN, 1.90%, 4/6/28 | 140,000 | | 140,397 | |
| | 1,039,749 | |
| | | | | | | | |
| Shares/
Principal Amount | Value |
| Banks — 1.3% | | |
| Banco Santander SA, 5.18%, 11/19/25 | $ | 200,000 | | $ | 222,834 | |
| Banco Santander SA, VRN, 1.72%, 9/14/27 | 200,000 | | 196,474 | |
| Bank of America Corp., MTN, VRN, 2.68%, 6/19/41 | 250,000 | | 241,061 | |
| Bank of America Corp., VRN, 3.42%, 12/20/28 | 294,000 | | 314,094 | |
| Bank of America Corp., VRN, 2.57%, 10/20/32 | 344,000 | | 345,903 | |
| Bank of America Corp., VRN, 2.48%, 9/21/36 | 105,000 | | 101,821 | |
Bank of Ireland Group plc, VRN, 2.03%, 9/30/27(3) | 200,000 | | 196,625 | |
| Barclays plc, 4.84%, 5/9/28 | 200,000 | | 220,482 | |
| Barclays plc, VRN, 2.28%, 11/24/27 | 145,000 | | 145,344 | |
| Citigroup, Inc., VRN, 0.78%, 10/30/24 | 340,000 | | 338,118 | |
| Citigroup, Inc., VRN, 3.52%, 10/27/28 | 413,000 | | 443,353 | |
Commonwealth Bank of Australia, VRN, 3.61%, 9/12/34(3) | 200,000 | | 209,316 | |
| FNB Corp., 2.20%, 2/24/23 | 140,000 | | 141,221 | |
| HSBC Holdings plc, VRN, 2.80%, 5/24/32 | 80,000 | | 80,332 | |
| JPMorgan Chase & Co., VRN, 1.58%, 4/22/27 | 105,000 | | 103,817 | |
| JPMorgan Chase & Co., VRN, 2.07%, 6/1/29 | 579,000 | | 574,605 | |
| JPMorgan Chase & Co., VRN, 3.16%, 4/22/42 | 155,000 | | 162,105 | |
National Australia Bank Ltd., 2.33%, 8/21/30(3) | 250,000 | | 239,780 | |
Societe Generale SA, 5.00%, 1/17/24(3) | 340,000 | | 362,075 | |
| US Bancorp, VRN, 2.49%, 11/3/36 | 140,000 | | 139,615 | |
| Wells Fargo & Co., VRN, 3.07%, 4/30/41 | 210,000 | | 215,795 | |
| Westpac Banking Corp., VRN, 2.89%, 2/4/30 | 70,000 | | 71,523 | |
| Westpac Banking Corp., VRN, 3.02%, 11/18/36 | 78,000 | | 77,190 | |
| | 5,143,483 | |
| Beverages — 0.1% | | |
| Anheuser-Busch Cos. LLC / Anheuser-Busch InBev Worldwide, Inc., 4.90%, 2/1/46 | 165,000 | | 209,030 | |
| Anheuser-Busch InBev Worldwide, Inc., 4.75%, 1/23/29 | 240,000 | | 279,596 | |
| | 488,626 | |
| Biotechnology — 0.1% | | |
| AbbVie, Inc., 3.20%, 11/21/29 | 145,000 | | 155,193 | |
| AbbVie, Inc., 4.40%, 11/6/42 | 80,000 | | 95,674 | |
| Amgen, Inc., 1.65%, 8/15/28 | 190,000 | | 186,341 | |
| | 437,208 | |
Building Products† | | |
| Lennox International, Inc., 1.70%, 8/1/27 | 50,000 | | 49,171 | |
| Capital Markets — 1.0% | | |
| Bain Capital Specialty Finance, Inc., 2.95%, 3/10/26 | 75,000 | | 74,844 | |
| Bain Capital Specialty Finance, Inc., 2.55%, 10/13/26 | 306,000 | | 297,578 | |
Blackstone Secured Lending Fund, 2.85%, 9/30/28(3) | 95,000 | | 92,688 | |
Blue Owl Finance LLC, 3.125%, 6/10/31(3) | 57,000 | | 55,838 | |
Blue Owl Finance LLC, 4.125%, 10/7/51(3) | 146,000 | | 146,955 | |
| Deutsche Bank AG, VRN, 3.96%, 11/26/25 | 215,000 | | 227,189 | |
| Deutsche Bank AG, VRN, 2.31%, 11/16/27 | 150,000 | | 150,021 | |
| Deutsche Bank AG, VRN, 4.30%, 5/24/28 | 200,000 | | 205,544 | |
| Goldman Sachs Group, Inc. (The), 3.50%, 1/23/25 | 93,000 | | 98,111 | |
| Goldman Sachs Group, Inc. (The), VRN, 2.91%, 6/5/23 | 445,000 | | 448,753 | |
| Goldman Sachs Group, Inc. (The), VRN, 1.95%, 10/21/27 | 136,000 | | 135,464 | |
| Goldman Sachs Group, Inc. (The), VRN, 2.91%, 7/21/42 | 150,000 | | 149,415 | |
| Golub Capital BDC, Inc., 2.50%, 8/24/26 | 59,000 | | 58,044 | |
| Hercules Capital, Inc., 2.625%, 9/16/26 | 109,000 | | 108,149 | |
| | | | | | | | |
| Shares/
Principal Amount | Value |
| Main Street Capital Corp., 3.00%, 7/14/26 | $ | 96,000 | | $ | 96,382 | |
| Moody's Corp., 3.10%, 11/29/61 | 70,000 | | 69,604 | |
| Morgan Stanley, MTN, VRN, 2.24%, 7/21/32 | 50,000 | | 48,957 | |
| Morgan Stanley, VRN, 1.59%, 5/4/27 | 410,000 | | 406,175 | |
| Morgan Stanley, VRN, 2.48%, 9/16/36 | 184,000 | | 177,377 | |
Owl Rock Core Income Corp., 3.125%, 9/23/26(3) | 260,000 | | 251,317 | |
Owl Rock Technology Finance Corp., 6.75%, 6/30/25(3) | 111,000 | | 124,084 | |
Owl Rock Technology Finance Corp., 3.75%, 6/17/26(3) | 81,000 | | 83,523 | |
| Owl Rock Technology Finance Corp., 2.50%, 1/15/27 | 144,000 | | 141,112 | |
| Prospect Capital Corp., 3.71%, 1/22/26 | 145,000 | | 147,600 | |
| Prospect Capital Corp., 3.44%, 10/15/28 | 140,000 | | 134,825 | |
UBS Group AG, VRN, 1.49%, 8/10/27(3) | 220,000 | | 214,728 | |
| | 4,144,277 | |
Chemicals† | | |
International Flavors & Fragrances, Inc., 1.83%, 10/15/27(3) | 59,000 | | 57,964 | |
| Westlake Chemical Corp., 2.875%, 8/15/41 | 55,000 | | 53,613 | |
| | 111,577 | |
| Commercial Services and Supplies — 0.1% | | |
| Republic Services, Inc., 2.30%, 3/1/30 | 115,000 | | 115,421 | |
| Republic Services, Inc., 2.375%, 3/15/33 | 68,000 | | 67,767 | |
| Waste Connections, Inc., 2.60%, 2/1/30 | 40,000 | | 40,858 | |
| Waste Connections, Inc., 2.95%, 1/15/52 | 84,000 | | 82,899 | |
| Waste Management, Inc., 2.50%, 11/15/50 | 50,000 | | 47,719 | |
| | 354,664 | |
Construction and Engineering† | | |
| Quanta Services, Inc., 2.35%, 1/15/32 | 165,000 | | 160,391 | |
Construction Materials† | | |
| Eagle Materials, Inc., 2.50%, 7/1/31 | 116,000 | | 114,574 | |
| Consumer Finance — 0.2% | | |
| AerCap Ireland Capital DAC / AerCap Global Aviation Trust, 3.00%, 10/29/28 | 150,000 | | 152,238 | |
| AerCap Ireland Capital DAC / AerCap Global Aviation Trust, 3.40%, 10/29/33 | 61,000 | | 62,181 | |
Avolon Holdings Funding Ltd., 4.25%, 4/15/26(3) | 101,000 | | 107,135 | |
Avolon Holdings Funding Ltd., 4.375%, 5/1/26(3) | 4,000 | | 4,290 | |
Avolon Holdings Funding Ltd., 2.75%, 2/21/28(3) | 150,000 | | 147,288 | |
| SLM Corp., 3.125%, 11/2/26 | 193,000 | | 191,350 | |
| | 664,482 | |
Containers and Packaging† | | |
| Berry Global, Inc., 1.57%, 1/15/26 | 80,000 | | 78,372 | |
| WRKCo, Inc., 3.00%, 9/15/24 | 72,000 | | 75,099 | |
| | 153,471 | |
| Diversified Consumer Services — 0.1% | | |
| Duke University, 3.30%, 10/1/46 | 110,000 | | 120,663 | |
| Novant Health, Inc., 3.17%, 11/1/51 | 85,000 | | 89,414 | |
| Pepperdine University, 3.30%, 12/1/59 | 105,000 | | 112,092 | |
| | 322,169 | |
| Diversified Financial Services — 0.2% | | |
Blackstone Private Credit Fund, 2.625%, 12/15/26(3) | 148,000 | | 144,372 | |
Blackstone Private Credit Fund, 3.25%, 3/15/27(3) | 146,000 | | 147,598 | |
| Block Financial LLC, 3.875%, 8/15/30 | 82,000 | | 87,832 | |
| PG&E Energy Recovery Funding LLC, 2.82%, 7/15/48 | 250,000 | | 249,137 | |
| | 628,939 | |
| | | | | | | | |
| Shares/
Principal Amount | Value |
| Diversified Telecommunication Services — 0.4% | | |
| AT&T, Inc., 2.55%, 12/1/33 | $ | 232,000 | | $ | 227,175 | |
| AT&T, Inc., 3.55%, 9/15/55 | 216,000 | | 217,149 | |
British Telecommunications plc, 3.25%, 11/8/29(3) | 220,000 | | 225,122 | |
Ooredoo International Finance Ltd., 2.625%, 4/8/31(3) | 200,000 | | 201,225 | |
| Telefonica Emisiones SA, 4.90%, 3/6/48 | 320,000 | | 385,828 | |
| Verizon Communications, Inc., 4.33%, 9/21/28 | 113,000 | | 128,478 | |
| Verizon Communications, Inc., 1.75%, 1/20/31 | 140,000 | | 132,672 | |
| Verizon Communications, Inc., 2.65%, 11/20/40 | 106,000 | | 100,904 | |
| Verizon Communications, Inc., 2.99%, 10/30/56 | 80,000 | | 75,905 | |
| | 1,694,458 | |
| Electric Utilities — 0.7% | | |
| AEP Texas, Inc., 2.10%, 7/1/30 | 130,000 | | 125,203 | |
Alfa Desarrollo SpA, 4.55%, 9/27/51(3) | 100,000 | | 98,862 | |
| Baltimore Gas and Electric Co., 2.25%, 6/15/31 | 81,000 | | 81,153 | |
| Berkshire Hathaway Energy Co., 3.50%, 2/1/25 | 190,000 | | 201,179 | |
Comision Federal de Electricidad, 4.68%, 2/9/51(3) | 200,000 | | 188,548 | |
| Commonwealth Edison Co., 3.20%, 11/15/49 | 115,000 | | 121,407 | |
| Duke Energy Carolinas LLC, 2.55%, 4/15/31 | 54,000 | | 55,490 | |
| Duke Energy Corp., 2.55%, 6/15/31 | 60,000 | | 60,121 | |
| Duke Energy Florida LLC, 1.75%, 6/15/30 | 120,000 | | 115,299 | |
| Duke Energy Florida LLC, 3.85%, 11/15/42 | 30,000 | | 33,738 | |
| Duke Energy Progress LLC, 2.00%, 8/15/31 | 160,000 | | 156,475 | |
| Duke Energy Progress LLC, 4.15%, 12/1/44 | 115,000 | | 135,435 | |
| Entergy Arkansas LLC, 2.65%, 6/15/51 | 60,000 | | 55,921 | |
| Exelon Corp., 4.45%, 4/15/46 | 60,000 | | 71,848 | |
| Florida Power & Light Co., 4.125%, 2/1/42 | 69,000 | | 82,292 | |
| Florida Power & Light Co., 2.875%, 12/4/51 | 60,000 | | 61,005 | |
| Indiana Michigan Power Co., 3.25%, 5/1/51 | 57,000 | | 58,739 | |
| MidAmerican Energy Co., 4.40%, 10/15/44 | 110,000 | | 135,010 | |
| NextEra Energy Capital Holdings, Inc., 3.55%, 5/1/27 | 50,000 | | 54,205 | |
| Northern States Power Co., 3.20%, 4/1/52 | 90,000 | | 95,711 | |
| Pacific Gas and Electric Co., 4.20%, 6/1/41 | 55,000 | | 55,446 | |
| PacifiCorp, 3.30%, 3/15/51 | 100,000 | | 103,917 | |
| PacifiCorp, 2.90%, 6/15/52 | 70,000 | | 68,873 | |
| Public Service Co. of Colorado, 1.875%, 6/15/31 | 108,000 | | 105,102 | |
| Southern Co. Gas Capital Corp., 1.75%, 1/15/31 | 120,000 | | 112,597 | |
| Southern Co. Gas Capital Corp., 3.95%, 10/1/46 | 25,000 | | 27,508 | |
| Xcel Energy, Inc., 3.40%, 6/1/30 | 120,000 | | 128,901 | |
| | 2,589,985 | |
Energy Equipment and Services† | | |
| Halliburton Co., 2.92%, 3/1/30 | 110,000 | | 113,285 | |
| Entertainment — 0.1% | | |
Netflix, Inc., 3.625%, 6/15/25(3) | 27,000 | | 28,481 | |
| Netflix, Inc., 4.875%, 4/15/28 | 199,000 | | 227,203 | |
| | 255,684 | |
| Equity Real Estate Investment Trusts (REITs) — 0.7% | | |
| Broadstone Net Lease LLC, 2.60%, 9/15/31 | 83,000 | | 80,657 | |
| Corporate Office Properties LP, 2.00%, 1/15/29 | 175,000 | | 168,417 | |
| Crown Castle International Corp., 3.30%, 7/1/30 | 115,000 | | 121,440 | |
| CubeSmart LP, 2.25%, 12/15/28 | 68,000 | | 68,067 | |
| | | | | | | | |
| Shares/
Principal Amount | Value |
| EPR Properties, 4.75%, 12/15/26 | $ | 94,000 | | $ | 100,523 | |
| EPR Properties, 4.95%, 4/15/28 | 243,000 | | 262,421 | |
| EPR Properties, 3.60%, 11/15/31 | 57,000 | | 56,454 | |
| GLP Capital LP / GLP Financing II, Inc., 5.375%, 4/15/26 | 120,000 | | 133,784 | |
| LXP Industrial Trust, 2.375%, 10/1/31 | 205,000 | | 196,930 | |
| National Health Investors, Inc., 3.00%, 2/1/31 | 274,000 | | 264,651 | |
| Office Properties Income Trust, 2.40%, 2/1/27 | 125,000 | | 121,078 | |
| Phillips Edison Grocery Center Operating Partnership I LP, 2.625%, 11/15/31 | 76,000 | | 74,028 | |
| Piedmont Operating Partnership LP, 2.75%, 4/1/32 | 135,000 | | 132,326 | |
| Rexford Industrial Realty LP, 2.15%, 9/1/31 | 151,000 | | 142,737 | |
| Sabra Health Care LP, 3.20%, 12/1/31 | 274,000 | | 268,062 | |
| STORE Capital Corp., 4.625%, 3/15/29 | 56,000 | | 62,829 | |
| STORE Capital Corp., 2.70%, 12/1/31 | 71,000 | | 69,508 | |
| Tanger Properties LP, 2.75%, 9/1/31 | 300,000 | | 291,629 | |
| | 2,615,541 | |
| Food and Staples Retailing — 0.1% | | |
| Sysco Corp., 5.95%, 4/1/30 | 173,000 | | 216,156 | |
| Food Products — 0.1% | | |
JDE Peet's NV, 2.25%, 9/24/31(3) | 197,000 | | 189,737 | |
| Kraft Heinz Foods Co., 5.00%, 6/4/42 | 132,000 | | 164,560 | |
| Mondelez International, Inc., 2.75%, 4/13/30 | 172,000 | | 177,442 | |
| | 531,739 | |
| Health Care Equipment and Supplies — 0.2% | | |
Baxter International, Inc., 1.92%, 2/1/27(3) | 173,000 | | 173,740 | |
Baxter International, Inc., 2.54%, 2/1/32(3) | 250,000 | | 252,836 | |
| Zimmer Biomet Holdings, Inc., 1.45%, 11/22/24 | 310,000 | | 309,310 | |
| | 735,886 | |
| Health Care Providers and Services — 0.5% | | |
| Centene Corp., 2.45%, 7/15/28 | 190,000 | | 187,443 | |
| Centene Corp., 4.625%, 12/15/29 | 85,000 | | 91,816 | |
| Centene Corp., 3.375%, 2/15/30 | 136,000 | | 138,728 | |
| CVS Health Corp., 1.75%, 8/21/30 | 100,000 | | 95,411 | |
| CVS Health Corp., 4.78%, 3/25/38 | 30,000 | | 36,582 | |
| Duke University Health System, Inc., 3.92%, 6/1/47 | 30,000 | | 35,730 | |
| HCA, Inc., 2.375%, 7/15/31 | 185,000 | | 182,324 | |
| HCA, Inc., 3.50%, 7/15/51 | 120,000 | | 122,624 | |
| Humana, Inc., 2.15%, 2/3/32 | 398,000 | | 385,298 | |
| Kaiser Foundation Hospitals, 3.00%, 6/1/51 | 105,000 | | 108,324 | |
Roche Holdings, Inc., 2.61%, 12/13/51(3) | 240,000 | | 236,145 | |
Universal Health Services, Inc., 1.65%, 9/1/26(3) | 147,000 | | 144,438 | |
Universal Health Services, Inc., 2.65%, 10/15/30(3) | 150,000 | | 149,001 | |
| | 1,913,864 | |
Hotels, Restaurants and Leisure† | | |
| Marriott International, Inc., 3.50%, 10/15/32 | 130,000 | | 136,331 | |
| Household Durables — 0.1% | | |
| D.R. Horton, Inc., 2.50%, 10/15/24 | 90,000 | | 92,684 | |
| Safehold Operating Partnership LP, 2.85%, 1/15/32 | 155,000 | | 152,114 | |
| | 244,798 | |
| Insurance — 0.5% | | |
| Assured Guaranty US Holdings, Inc., 3.60%, 9/15/51 | 95,000 | | 99,027 | |
Athene Global Funding, 1.99%, 8/19/28(3) | 271,000 | | 263,544 | |
| | | | | | | | |
| Shares/
Principal Amount | Value |
Athene Global Funding, 2.67%, 6/7/31(3) | $ | 48,000 | | $ | 47,606 | |
Brighthouse Financial Global Funding, 2.00%, 6/28/28(3) | 99,000 | | 97,438 | |
Equitable Financial Life Global Funding, 1.80%, 3/8/28(3) | 100,000 | | 98,411 | |
Global Atlantic Fin Co., 3.125%, 6/15/31(3) | 82,000 | | 81,256 | |
Guardian Life Global Funding, 1.625%, 9/16/28(3) | 169,000 | | 163,792 | |
Hill City Funding Trust, 4.05%, 8/15/41(3) | 200,000 | | 193,786 | |
Principal Life Global Funding II, 1.50%, 11/17/26(3) | 445,000 | | 437,932 | |
Sammons Financial Group, Inc., 3.35%, 4/16/31(3) | 32,000 | | 32,277 | |
SBL Holdings, Inc., 5.125%, 11/13/26(3) | 115,000 | | 125,225 | |
| Stewart Information Services Corp., 3.60%, 11/15/31 | 164,000 | | 166,239 | |
| | 1,806,533 | |
| Internet and Direct Marketing Retail — 0.1% | | |
| Amazon.com, Inc., 2.875%, 5/12/41 | 280,000 | | 291,313 | |
| IT Services — 0.1% | | |
| Fiserv, Inc., 2.65%, 6/1/30 | 130,000 | | 132,061 | |
| Global Payments, Inc., 2.15%, 1/15/27 | 145,000 | | 145,660 | |
| | 277,721 | |
| Life Sciences Tools and Services — 0.1% | | |
| Danaher Corp., 2.80%, 12/10/51 | 115,000 | | 113,698 | |
| Illumina, Inc., 2.55%, 3/23/31 | 193,000 | | 193,154 | |
| | 306,852 | |
Machinery† | | |
| Cummins, Inc., 2.60%, 9/1/50 | 90,000 | | 83,156 | |
| Media — 0.4% | | |
| Charter Communications Operating LLC / Charter Communications Operating Capital, 3.50%, 6/1/41 | 133,000 | | 129,906 | |
| Charter Communications Operating LLC / Charter Communications Operating Capital, 5.125%, 7/1/49 | 220,000 | | 255,800 | |
| Comcast Corp., 3.75%, 4/1/40 | 155,000 | | 173,856 | |
Directv Financing LLC / Directv Financing Co-Obligor, Inc., 5.875%, 8/15/27(3) | 80,000 | | 82,016 | |
| Discovery Communications LLC, 4.65%, 5/15/50 | 85,000 | | 99,973 | |
| Grupo Televisa SAB, 5.00%, 5/13/45 | 200,000 | | 236,615 | |
| Time Warner Cable LLC, 4.50%, 9/15/42 | 215,000 | | 234,904 | |
| ViacomCBS, Inc., 4.20%, 6/1/29 | 95,000 | | 105,683 | |
| ViacomCBS, Inc., 4.375%, 3/15/43 | 90,000 | | 102,625 | |
| | 1,421,378 | |
| Metals and Mining — 0.1% | | |
Glencore Funding LLC, 2.625%, 9/23/31(3) | 160,000 | | 155,651 | |
| Steel Dynamics, Inc., 3.45%, 4/15/30 | 70,000 | | 74,875 | |
| Teck Resources Ltd., 6.25%, 7/15/41 | 130,000 | | 172,762 | |
| | 403,288 | |
| Multi-Utilities — 0.3% | | |
| Ameren Corp., 1.95%, 3/15/27 | 65,000 | | 65,229 | |
| Ameren Corp., 3.50%, 1/15/31 | 150,000 | | 161,995 | |
| CenterPoint Energy, Inc., 4.25%, 11/1/28 | 126,000 | | 140,117 | |
| CenterPoint Energy, Inc., 2.65%, 6/1/31 | 98,000 | | 99,435 | |
| Dominion Energy, Inc., 2.25%, 8/15/31 | 70,000 | | 68,433 | |
| Dominion Energy, Inc., 4.90%, 8/1/41 | 90,000 | | 111,032 | |
| NiSource, Inc., 5.65%, 2/1/45 | 105,000 | | 142,117 | |
| Sempra Energy, 3.25%, 6/15/27 | 30,000 | | 31,667 | |
| WEC Energy Group, Inc., 1.375%, 10/15/27 | 170,000 | | 164,066 | |
| | 984,091 | |
| | | | | | | | |
| Shares/
Principal Amount | Value |
Multiline Retail† | | |
| Dollar Tree, Inc., 2.65%, 12/1/31 | $ | 170,000 | | $ | 170,557 | |
| Oil, Gas and Consumable Fuels — 0.8% | | |
Aker BP ASA, 3.75%, 1/15/30(3) | 300,000 | | 318,003 | |
| BP Capital Markets America, Inc., 3.06%, 6/17/41 | 90,000 | | 91,249 | |
| Cenovus Energy, Inc., 2.65%, 1/15/32 | 100,000 | | 97,948 | |
Continental Resources, Inc., 2.27%, 11/15/26(3) | 107,000 | | 106,310 | |
Continental Resources, Inc., 2.875%, 4/1/32(3) | 77,000 | | 75,436 | |
| Diamondback Energy, Inc., 3.50%, 12/1/29 | 110,000 | | 116,765 | |
| Enbridge, Inc., 3.40%, 8/1/51 | 110,000 | | 111,773 | |
| Energy Transfer LP, 3.60%, 2/1/23 | 30,000 | | 30,589 | |
| Energy Transfer LP, 4.25%, 3/15/23 | 110,000 | | 113,061 | |
| Energy Transfer LP, 3.75%, 5/15/30 | 150,000 | | 159,119 | |
| Energy Transfer LP, 4.90%, 3/15/35 | 95,000 | | 107,653 | |
| Enterprise Products Operating LLC, 4.85%, 3/15/44 | 150,000 | | 180,992 | |
| Enterprise Products Operating LLC, 3.30%, 2/15/53 | 79,000 | | 78,746 | |
| Equinor ASA, 3.25%, 11/18/49 | 70,000 | | 74,342 | |
Flex Intermediate Holdco LLC, 3.36%, 6/30/31(3) | 70,000 | | 70,376 | |
Galaxy Pipeline Assets Bidco Ltd., 2.94%, 9/30/40(3) | 325,000 | | 324,234 | |
| Kinder Morgan Energy Partners LP, 6.50%, 9/1/39 | 85,000 | | 113,438 | |
| Petroleos Mexicanos, 3.50%, 1/30/23 | 80,000 | | 80,905 | |
SA Global Sukuk Ltd., 2.69%, 6/17/31(3) | 325,000 | | 327,512 | |
| Sabine Pass Liquefaction LLC, 5.625%, 3/1/25 | 230,000 | | 255,533 | |
| TransCanada PipeLines Ltd., 2.50%, 10/12/31 | 107,000 | | 106,520 | |
| Transcontinental Gas Pipe Line Co. LLC, 3.25%, 5/15/30 | 90,000 | | 94,967 | |
| | 3,035,471 | |
Paper and Forest Products† | | |
Georgia-Pacific LLC, 2.10%, 4/30/27(3) | 130,000 | | 131,693 | |
| Pharmaceuticals — 0.2% | | |
| Bristol-Myers Squibb Co., 2.55%, 11/13/50 | 113,000 | | 107,203 | |
| Merck & Co., Inc., 1.70%, 6/10/27 | 115,000 | | 115,758 | |
| Merck & Co., Inc., 2.15%, 12/10/31 | 120,000 | | 120,434 | |
| Royalty Pharma plc, 2.20%, 9/2/30 | 75,000 | | 72,683 | |
| Utah Acquisition Sub, Inc., 3.95%, 6/15/26 | 290,000 | | 312,994 | |
| Viatris, Inc., 4.00%, 6/22/50 | 43,000 | | 45,899 | |
| | 774,971 | |
Real Estate Management and Development† | | |
| Essential Properties LP, 2.95%, 7/15/31 | 160,000 | | 157,875 | |
| Road and Rail — 0.2% | | |
| Burlington Northern Santa Fe LLC, 4.15%, 4/1/45 | 105,000 | | 126,506 | |
| Burlington Northern Santa Fe LLC, 3.30%, 9/15/51 | 70,000 | | 76,186 | |
| CSX Corp., 3.25%, 6/1/27 | 120,000 | | 128,775 | |
DAE Funding LLC, 3.375%, 3/20/28(3) | 215,000 | | 217,822 | |
| Union Pacific Corp., 2.40%, 2/5/30 | 100,000 | | 102,022 | |
| Union Pacific Corp., MTN, 3.55%, 8/15/39 | 160,000 | | 177,671 | |
| | 828,982 | |
| Semiconductors and Semiconductor Equipment — 0.3% | | |
| Broadcom, Inc., 4.75%, 4/15/29 | 103,000 | | 117,353 | |
| Intel Corp., 2.80%, 8/12/41 | 200,000 | | 199,906 | |
| Microchip Technology, Inc., 4.25%, 9/1/25 | 349,000 | | 362,519 | |
NXP BV / NXP Funding LLC / NXP USA, Inc., 4.30%, 6/18/29(3) | 65,000 | | 72,893 | |
| | | | | | | | |
| Shares/
Principal Amount | Value |
| Qorvo, Inc., 4.375%, 10/15/29 | $ | 157,000 | | $ | 166,871 | |
Qorvo, Inc., 3.375%, 4/1/31(3) | 109,000 | | 111,133 | |
| | 1,030,675 | |
| Software — 0.1% | | |
| Autodesk, Inc., 2.40%, 12/15/31 | 199,000 | | 198,646 | |
| Oracle Corp., 3.60%, 4/1/40 | 220,000 | | 221,012 | |
| | 419,658 | |
| Specialty Retail — 0.1% | | |
| AutoNation, Inc., 1.95%, 8/1/28 | 107,000 | | 104,711 | |
| Home Depot, Inc. (The), 2.375%, 3/15/51 | 270,000 | | 248,762 | |
| Lowe's Cos., Inc., 2.625%, 4/1/31 | 225,000 | | 230,435 | |
| | 583,908 | |
| Technology Hardware, Storage and Peripherals — 0.2% | | |
| Apple, Inc., 2.65%, 2/8/51 | 270,000 | | 266,155 | |
| Dell International LLC / EMC Corp., 4.90%, 10/1/26 | 210,000 | | 236,678 | |
| Dell International LLC / EMC Corp., 8.10%, 7/15/36 | 54,000 | | 82,293 | |
Dell International LLC / EMC Corp., 3.375%, 12/15/41(3) | 135,000 | | 133,657 | |
| Dell International LLC / EMC Corp., 8.35%, 7/15/46 | 23,000 | | 38,320 | |
HP, Inc., 2.65%, 6/17/31(3) | 200,000 | | 197,388 | |
| | 954,491 | |
| Thrifts and Mortgage Finance — 0.1% | | |
Nationwide Building Society, VRN, 4.125%, 10/18/32(3) | 250,000 | | 266,736 | |
Trading Companies and Distributors† | | |
Aircastle Ltd., 5.25%, 8/11/25(3) | 128,000 | | 140,868 | |
Water Utilities† | | |
| Essential Utilities, Inc., 2.70%, 4/15/30 | 130,000 | | 132,225 | |
| | |
| Wireless Telecommunication Services — 0.2% | | |
| T-Mobile USA, Inc., 4.75%, 2/1/28 | 287,000 | | 302,564 | |
| T-Mobile USA, Inc., 3.50%, 4/15/31 | 136,000 | | 141,727 | |
T-Mobile USA, Inc., 3.40%, 10/15/52(3) | 105,000 | | 104,711 | |
| Vodafone Group plc, VRN, 4.125%, 6/4/81 | 165,000 | | 163,611 | |
| | 712,613 | |
TOTAL CORPORATE BONDS (Cost $40,926,862) | | 41,122,191 | |
| U.S. GOVERNMENT AGENCY MORTGAGE-BACKED SECURITIES — 4.4% |
| Adjustable-Rate U.S. Government Agency Mortgage-Backed Securities — 0.1% |
| FHLMC, VRN, 2.14%, (12-month LIBOR plus 1.87%), 7/1/36 | 4,021 | | 4,230 | |
| FHLMC, VRN, 2.20%, (1-year H15T1Y plus 2.14%), 10/1/36 | 9,568 | | 10,244 | |
| FHLMC, VRN, 2.35%, (1-year H15T1Y plus 2.26%), 4/1/37 | 14,198 | | 15,107 | |
| FHLMC, VRN, 2.12%, (12-month LIBOR plus 1.86%), 7/1/41 | 6,695 | | 7,054 | |
| FHLMC, VRN, 2.89%, (12-month LIBOR plus 1.63%), 1/1/44 | 13,294 | | 13,747 | |
| FHLMC, VRN, 2.62%, (12-month LIBOR plus 1.60%), 6/1/45 | 18,316 | | 19,066 | |
| FHLMC, VRN, 1.88%, (12-month LIBOR plus 1.63%), 8/1/46 | 57,797 | | 59,953 | |
| FHLMC, VRN, 3.08%, (12-month LIBOR plus 1.64%), 9/1/47 | 40,431 | | 42,075 | |
| FNMA, VRN, 1.73%, (6-month LIBOR plus 1.57%), 6/1/35 | 8,271 | | 8,611 | |
| FNMA, VRN, 1.77%, (6-month LIBOR plus 1.57%), 6/1/35 | 8,200 | | 8,538 | |
| FNMA, VRN, 2.22%, (1-year H15T1Y plus 2.16%), 3/1/38 | 11,761 | | 12,562 | |
| FNMA, VRN, 3.19%, (12-month LIBOR plus 1.61%), 3/1/47 | 28,505 | | 29,501 | |
| | 230,688 | |
| Fixed-Rate U.S. Government Agency Mortgage-Backed Securities — 4.3% |
| FHLMC, 3.00%, 6/1/51 | 635,831 | | 659,104 | |
| | | | | | | | |
| Shares/
Principal Amount | Value |
| FHLMC, 3.00%, 7/1/51 | $ | 456,829 | | $ | 473,550 | |
| FHLMC, 2.50%, 8/1/51 | 1,248,226 | | 1,276,128 | |
| FHLMC, 2.50%, 9/1/51 | 645,082 | | 659,038 | |
| FHLMC, 2.50%, 9/1/51 | 611,296 | | 625,126 | |
| FHLMC, 3.50%, 9/1/51 | 322,093 | | 339,312 | |
| FHLMC, 2.50%, 10/1/51 | 618,521 | | 632,323 | |
| FHLMC, 2.00%, 12/1/51 | 747,575 | | 746,195 | |
| FHLMC, 2.50%, 12/1/51 | 367,289 | | 375,490 | |
| FHLMC, 2.50%, 1/1/52 | 650,000 | | 663,990 | |
| FNMA, 3.50%, 3/1/34 | 18,146 | | 19,176 | |
| FNMA, 4.50%, 9/1/41 | 14,454 | | 15,992 | |
| FNMA, 3.50%, 5/1/42 | 174,543 | | 188,509 | |
| FNMA, 3.50%, 6/1/42 | 38,311 | | 41,391 | |
| FNMA, 3.00%, 6/1/51 | 77,365 | | 81,176 | |
| FNMA, 3.50%, 7/1/51 | 934,854 | | 991,388 | |
| FNMA, 3.50%, 8/1/51 | 154,003 | | 163,797 | |
| FNMA, 3.50%, 9/1/51 | 339,202 | | 359,118 | |
| FNMA, 2.50%, 11/1/51 | 648,916 | | 663,597 | |
| FNMA, 2.50%, 12/1/51 | 300,000 | | 306,787 | |
| FNMA, 2.50%, 1/1/52 | 650,000 | | 663,990 | |
| GNMA, 2.50%, TBA | 1,538,000 | | 1,575,127 | |
| GNMA, 3.00%, TBA | 370,000 | | 382,850 | |
| GNMA, 7.00%, 4/20/26 | 3,406 | | 3,691 | |
| GNMA, 7.50%, 8/15/26 | 2,344 | | 2,563 | |
| GNMA, 7.00%, 2/15/28 | 475 | | 477 | |
| GNMA, 6.50%, 5/15/28 | 198 | | 217 | |
| GNMA, 6.50%, 5/15/28 | 669 | | 740 | |
| GNMA, 7.00%, 5/15/31 | 9,289 | | 10,663 | |
| GNMA, 5.50%, 11/15/32 | 17,281 | | 19,765 | |
| GNMA, 4.50%, 1/15/40 | 13,618 | | 15,300 | |
| GNMA, 4.50%, 6/15/41 | 25,328 | | 28,956 | |
| GNMA, 3.50%, 3/15/46 | 230,886 | | 246,960 | |
| GNMA, 3.50%, 6/20/51 | 750,009 | | 782,249 | |
| GNMA, 3.00%, 7/20/51 | 237,999 | | 246,630 | |
| GNMA, 3.00%, 8/20/51 | 382,333 | | 396,821 | |
| GNMA, 2.50%, 9/20/51 | 505,111 | | 518,065 | |
| GNMA, 3.00%, 9/20/51 | 489,701 | | 508,092 | |
| GNMA, 3.00%, 10/20/51 | 459,404 | | 476,757 | |
| GNMA, 3.00%, 11/20/51 | 666,911 | | 692,392 | |
| UMBS, 2.50%, TBA | 1,325,000 | | 1,351,920 | |
| | 17,205,412 | |
TOTAL U.S. GOVERNMENT AGENCY MORTGAGE-BACKED SECURITIES (Cost $17,532,153) | 17,436,100 | |
| COLLATERALIZED LOAN OBLIGATIONS — 2.7% |
|
|
ABPCI Direct Lending Fund CLO IV Ltd., Series 2017-2A, Class BR, VRN, 2.03%, (3-month LIBOR plus 1.90%), 10/27/33(3) | 200,000 | | 200,182 | |
Aimco CLO Ltd., Series 2019-10A, Class BR, VRN, 1.73%, (3-month LIBOR plus 1.60%), 7/22/32(3) | 375,000 | | 374,293 | |
Anchorage Capital CLO Ltd., Series 2021-19A, Class B1, VRN, 2.01%, (3-month LIBOR plus 1.85%), 10/15/34(3) | 300,000 | | 300,424 | |
Anchorage Credit Opportunities CLO Ltd., Series 2019-1A, Class A1, VRN, 2.08%, (3-month LIBOR plus 1.95%), 1/20/32(3) | 275,000 | | 275,515 | |
| | | | | | | | |
| Shares/
Principal Amount | Value |
Apidos CLO XXVI, Series 2017-26A, Class BR, VRN, 2.07%, (3-month LIBOR plus 1.95%), 7/18/29(3) | $ | 275,000 | | $ | 274,393 | |
ARES LII CLO Ltd., Series 2019-52A, Class BR, VRN, 1.78%, (3-month LIBOR plus 1.65%), 4/22/31(3) | 200,000 | | 200,099 | |
ARES LII CLO Ltd., Series 2019-52A, Class CR, VRN, 2.23%, (3-month LIBOR plus 2.10%), 4/22/31(3) | 200,000 | | 200,259 | |
Ares XL CLO Ltd., Series 2016-40A, Class BRR, VRN, 1.92%, (3-month LIBOR plus 1.80%), 1/15/29(3) | 300,000 | | 299,406 | |
Bain Capital Credit CLO Ltd., Series 2019-2A, Class BR, VRN, 1.72%, (3-month LIBOR plus 1.60%), 10/17/32(3) | 150,000 | | 149,884 | |
BDS Ltd., Series 2021-FL7, Class C, VRN, 1.81%, (1-month LIBOR plus 1.70%), 6/16/36(3) | 400,000 | | 395,136 | |
Bean Creek CLO Ltd., Series 2015-1A, Class AR, VRN, 1.15%, (3-month LIBOR plus 1.02%), 4/20/31(3) | 200,000 | | 199,701 | |
Canyon Capital CLO Ltd., Series 2017-1A, Class BR, VRN, 1.72%, (3-month LIBOR plus 1.60%), 7/15/30(3) | 250,000 | | 249,939 | |
Carlyle Global Market Strategies CLO Ltd., Series 2013-1A, Class BRR, VRN, 2.36%, (3-month LIBOR plus 2.20%), 8/14/30(3) | 225,000 | | 225,049 | |
CarVal CLO III Ltd., Series 2019-2A, Class BR, VRN, 1.73%, (3-month LIBOR plus 1.60%), 7/20/32(3) | 250,000 | | 250,124 | |
Cedar Funding Ltd., Series 2019-10A, Class BR, VRN, 1.73%, (3-month LIBOR plus 1.60%), 10/20/32(3) | 200,000 | | 200,099 | |
Cerberus Loan Funding XXXIII LP, Series 2021-3A, Class A, VRN, 1.68%, (3-month LIBOR plus 1.56%), 7/23/33(3) | 275,000 | | 275,991 | |
Cerberus Loan Funding XXXVI LP, Series 2021-6A, Class A, VRN, 1.55%, (3-month LIBOR plus 1.40%), 11/22/33(3) | 275,000 | | 275,038 | |
Elmwood CLO X Ltd., Series 2021-3A, Class B, VRN, 1.69%, (3-month LIBOR plus 1.60%), 10/20/34(3) | 200,000 | | 199,608 | |
Goldentree Loan Management US CLO Ltd., Series 2019-5A, Class BR, VRN, 1.68%, (3-month LIBOR plus 1.55%), 10/20/32(3) | 350,000 | | 349,344 | |
KKR CLO Ltd., Series 2018, Class BR, VRN, 1.72%, (3-month LIBOR plus 1.60%), 7/18/30(3) | 200,000 | | 199,951 | |
KKR CLO Ltd., Series 2022A, Class A, VRN, 1.28%, (3-month LIBOR plus 1.15%), 7/20/31(3) | 175,000 | | 175,142 | |
KKR CLO Ltd., Series 2030A, Class BR, VRN, 2.85%, (3-month LIBOR plus 1.60%), 10/17/31(3) | 325,000 | | 324,480 | |
KREF Ltd., Series 2021-FL2, Class AS, VRN, 1.41%, (1-month LIBOR plus 1.30%), 2/15/39(3) | 106,500 | | 106,266 | |
KREF Ltd., Series 2021-FL2, Class B, VRN, 1.76%, (1-month LIBOR plus 1.65%), 2/15/39(3) | 300,000 | | 299,577 | |
Madison Park Funding XXI Ltd., Series 2016-21A, Class A2RR, VRN, 1.77%, (3-month LIBOR plus 1.65%), 10/15/32(3) | 175,000 | | 174,656 | |
Madison Park Funding XXII Ltd., Series 2016-22A, Class A1R, VRN, 1.38%, (3-month LIBOR plus 1.26%), 1/15/33(3) | 125,000 | | 124,911 | |
Madison Park Funding XXXVII Ltd., Series 2019-37A, Class BR, VRN, 1.77%, (3-month LIBOR plus 1.65%), 7/15/33(3) | 375,000 | | 374,322 | |
MF1 Ltd., Series 2021-FL7, Class AS, VRN, 1.56%, (1-month LIBOR plus 1.45%), 10/16/36(3) | 450,000 | | 448,577 | |
Octagon Investment Partners XV Ltd., Series 2013-1A, Class BRR, VRN, 1.63%, (3-month LIBOR plus 1.50%), 7/19/30(3) | 275,000 | | 272,908 | |
Parallel Ltd., Series 2019-1A, Class BR, VRN, 1.93%, (3-month LIBOR plus 1.80%), 7/20/32(3) | 300,000 | | 299,444 | |
Park Avenue Institutional Advisers CLO Ltd., Series 2018-1A, Class BR, VRN, 2.23%, (3-month LIBOR plus 2.10%), 10/20/31(3) | 275,000 | | 274,276 | |
Regata XII Funding Ltd., Series 2019-1A, Class BR, VRN, 1.72%, (3-month LIBOR plus 1.60%), 10/15/32(3) | 275,000 | | 274,472 | |
Rockford Tower CLO Ltd., Series 2017-3A, Class A, VRN, 1.32%, (3-month LIBOR plus 1.19%), 10/20/30(3) | 300,000 | | 299,880 | |
| | | | | | | | |
| Shares/
Principal Amount | Value |
Sound Point CLO XXII Ltd., Series 2019-1A, Class BR, VRN, 1.83%, (3-month LIBOR plus 1.70%), 1/20/32(3) | $ | 475,000 | | $ | 474,728 | |
TCW CLO Ltd., Series 2018-1A, Class BR, VRN, 1.81%, (3-month LIBOR plus 1.65%), 4/25/31(3) | 300,000 | | 300,150 | |
THL Credit Wind River CLO Ltd., Series 2013-2A, Class BR2, VRN, 1.69%, (3-month LIBOR plus 1.57%), 10/18/30(3) | 400,000 | | 399,355 | |
THL Credit Wind River CLO Ltd., Series 2019-3A, Class BR, VRN, 1.77%, (3-month LIBOR plus 1.65%), 4/15/31(3) | 300,000 | | 300,149 | |
Voya CLO Ltd., Series 2013-2A, Class A1R, VRN, 1.09%, (3-month LIBOR plus 0.97%), 4/25/31(3) | 250,000 | | 249,914 | |
Voya CLO Ltd., Series 2016-4A, Class B2R, VRN, 1.68%, (3-month LIBOR plus 1.55%), 7/20/29(3) | 350,000 | | 349,784 | |
TOTAL COLLATERALIZED LOAN OBLIGATIONS (Cost $10,623,387) | | 10,617,426 | |
| ASSET-BACKED SECURITIES — 2.5% |
|
|
321 Henderson Receivables VI LLC, Series 2010-1A, Class B SEQ, 9.31%, 7/15/61(3) | 209,742 | | 240,488 | |
Aaset Trust, Series 2021-2A, Class A SEQ, 2.80%, 1/15/47(3) | 550,000 | | 547,356 | |
Aligned Data Centers Issuer LLC, Series 2021-1A, Class B, 2.48%, 8/15/46(3) | 226,000 | | 223,605 | |
Blackbird Capital Aircraft, Series 2021-1A, Class A SEQ, 2.44%, 7/15/46(3) | 292,187 | | 289,035 | |
CARS-DB5 LP, Series 2021-1A, Class A4 SEQ, 2.76%, 8/15/51(3) | 300,000 | | 297,445 | |
Castlelake Aircraft Structured Trust, Series 2017-1R, Class A SEQ, 2.74%, 8/15/41(3) | 239,634 | | 236,905 | |
| Clsec Holdings 22t LLC, Series 2021-1, Class B, 3.46%, 5/11/37 | 547,852 | | 550,986 | |
DI Issuer LLC, Series 2021-1A, Class A2 SEQ, 3.72%, 9/15/51(3) | 650,000 | | 648,483 | |
FirstKey Homes Trust, Series 2020-SFR2, Class D, 1.97%, 10/19/37(3) | 400,000 | | 390,078 | |
FirstKey Homes Trust, Series 2021-SFR1, Class D, 2.19%, 8/17/38(3) | 300,000 | | 294,550 | |
FirstKey Homes Trust, Series 2021-SFR1, Class E1, 2.39%, 8/17/38(3) | 400,000 | | 391,478 | |
Flexential Issuer, Series 2021-1A, Class A2 SEQ, 3.25%, 11/27/51(3) | 625,000 | | 622,510 | |
Global SC Finance SRL, Series 2021-2A, Class A SEQ, 1.95%, 8/17/41(3) | 216,763 | | 214,484 | |
Goodgreen Trust, Series 2018-1A, Class A, VRN, 3.93%, 10/15/53(3) | 95,251 | | 99,095 | |
Goodgreen Trust, Series 2020-1A, Class A SEQ, 2.63%, 4/15/55(3) | 238,613 | | 238,684 | |
Goodgreen Trust, Series 2021-1A, Class A SEQ, 2.66%, 10/15/56(3) | 183,058 | | 181,432 | |
J.G. Wentworth XXXIX LLC, Series 2017-2A, Class B, 5.09%, 9/17/74(3) | 62,125 | | 73,489 | |
JG Wentworth XLII LLC, Series 2018-2A, Class B, 4.70%, 10/15/77(3) | 200,000 | | 218,711 | |
Lunar Structured Aircraft Portfolio Notes, Series 2021-1, Class A SEQ, 2.64%, 10/15/46(3) | 442,767 | | 441,370 | |
MAPS Trust, Series 2021-1A, Class A SEQ, 2.52%, 6/15/46(3) | 580,746 | | 576,262 | |
Navigator Aircraft ABS Ltd., Series 2021-1, Class A SEQ, 2.77%, 11/15/46(3) | 422,786 | | 422,268 | |
New Economy Assets Phase 1 Sponsor LLC, Series 2021-1, Class A1 SEQ, 1.91%, 10/20/61(3) | 625,000 | | 613,796 | |
New Economy Assets Phase 1 Sponsor LLC, Series 2021-1, Class B1, 2.41%, 10/20/61(3) | 725,000 | | 727,825 | |
Progress Residential Trust, Series 2021-SFR2, Class D, 2.20%, 4/19/38(3) | 225,000 | | 220,428 | |
| | | | | | | | |
| Shares/
Principal Amount | Value |
Progress Residential Trust, Series 2021-SFR3, Class C, 2.09%, 5/17/26(3) | $ | 200,000 | | $ | 197,320 | |
Progress Residential Trust, Series 2021-SFR8, Class E1, 2.38%, 10/17/38(3) | 300,000 | | 292,879 | |
Sierra Timeshare Receivables Funding LLC, Series 2021-1A, Class C, 1.79%, 11/20/37(3) | 128,035 | | 126,600 | |
Slam Ltd., Series 2021-1A, Class A SEQ, 2.43%, 6/15/46(3) | 242,200 | | 238,080 | |
Taco Bell Funding LLC, Series 2021-1A, Class A23 SEQ, 2.54%, 8/25/51(3) | 225,000 | | 220,696 | |
VSE VOI Mortgage LLC, Series 2016-A, Class A SEQ, 2.54%, 7/20/33(3) | 125,271 | | 125,137 | |
VSE VOI Mortgage LLC, Series 2018-A, Class B, 3.72%, 2/20/36(3) | 64,570 | | 66,324 | |
TOTAL ASSET-BACKED SECURITIES (Cost $10,107,879) | | 10,027,799 | |
| COLLATERALIZED MORTGAGE OBLIGATIONS — 2.3% |
|
|
| Private Sponsor Collateralized Mortgage Obligations — 1.8% |
| ABN Amro Mortgage Corp., Series 2003-4, Class A4, 5.50%, 3/25/33 | 1,060 | | 1,076 | |
| Adjustable Rate Mortgage Trust, Series 2004-4, Class 4A1, VRN, 2.48%, 3/25/35 | 16,085 | | 16,378 | |
Angel Oak Mortgage Trust, Series 2021-7, Class A1, VRN, 1.98%, 10/25/66(3) | 240,022 | | 239,493 | |
| Banc of America Mortgage Trust, Series 2004-E, Class 2A6 SEQ, VRN, 2.80%, 6/25/34 | 11,392 | | 11,656 | |
Bellemeade Re Ltd., Series 2019-3A, Class B1, VRN, 2.60%, (1-month LIBOR plus 2.50%), 7/25/29(3) | 130,000 | | 130,200 | |
Bellemeade Re Ltd., Series 2019-3A, Class M1C, VRN, 2.05%, (1-month LIBOR plus 1.95%), 7/25/29(3) | 120,000 | | 120,155 | |
Bellemeade Re Ltd., Series 2020-2A, Class M1C, VRN, 4.10%, (1-month LIBOR plus 4.00%), 8/26/30(3) | 166,046 | | 167,599 | |
Chase Mortgage Finance Corp., Series 2021-CL1, Class M1, VRN, 1.25%, (SOFR plus 1.20%), 2/25/50(3) | 157,159 | | 157,624 | |
| Citigroup Mortgage Loan Trust, Inc., Series 2004-UST1, Class A5, VRN, 1.94%, 8/25/34 | 10,423 | | 10,695 | |
| Countrywide Home Loan Mortgage Pass-Through Trust, Series 2005-17, Class 1A11, 5.50%, 9/25/35 | 406 | | 395 | |
Credit Suisse Mortgage Trust, Series 2021-NQM2, Class A2 SEQ, VRN, 1.38%, 2/25/66(3) | 146,635 | | 145,219 | |
Credit Suisse Mortgage Trust, Series 2021-NQM3, Class A3 SEQ, VRN, 1.63%, 4/25/66(3) | 116,274 | | 115,017 | |
Credit Suisse Mortgage Trust, Series 2021-RPL3, Class A1 SEQ, VRN, 2.00%, 1/25/60(3) | 159,218 | | 160,168 | |
Deephaven Residential Mortgage Trust, Series 2021-3, Class A3, VRN, 1.55%, 8/25/66(3) | 140,295 | | 138,820 | |
Deephaven Residential Mortgage Trust, Series 2021-4, Class A1, VRN, 1.93%, 11/25/66(3) | 321,573 | | 320,844 | |
Eagle RE Ltd., Series 2021-1, Class M1C, VRN, 2.75%, (SOFR plus 2.70%), 10/25/33(3) | 175,000 | | 178,104 | |
| First Horizon Alternative Mortgage Securities Trust, Series 2004-AA4, Class A1, VRN, 2.31%, 10/25/34 | 3,227 | | 3,348 | |
GCAT Trust, Series 2021-CM2, Class A1 SEQ, VRN, 2.35%, 8/25/66(3) | 616,404 | | 615,883 | |
GCAT Trust, Series 2021-NQM1, Class A3 SEQ, VRN, 1.15%, 1/25/66(3) | 152,226 | | 150,625 | |
| GSR Mortgage Loan Trust, Series 2004-7, Class 3A1, VRN, 2.16%, 6/25/34 | 4,958 | | 4,937 | |
| GSR Mortgage Loan Trust, Series 2004-AR5, Class 3A3, VRN, 2.60%, 5/25/34 | 6,721 | | 6,648 | |
| | | | | | | | |
| Shares/
Principal Amount | Value |
| GSR Mortgage Loan Trust, Series 2005-AR1, Class 3A1, VRN, 2.74%, 1/25/35 | $ | 9,349 | | $ | 9,694 | |
Home RE Ltd., Series 2020-1, Class M1B, VRN, 3.35%, (1-month LIBOR plus 3.25%), 10/25/30(3) | 226,212 | | 226,947 | |
Home RE Ltd., Series 2021-1 Class M1B, VRN, 1.65%, (1-month LIBOR plus 1.55%), 7/25/33(3) | 140,000 | | 139,581 | |
Imperial Fund Mortgage Trust, Series 2021-NQM4, Class A1, VRN, 2.09%, 1/25/57(3) | 199,379 | | 198,930 | |
JP Morgan Mortgage Trust, Series 2017-1, Class A2, VRN, 3.47%, 1/25/47(3) | 37,448 | | 37,626 | |
JP Morgan Mortgage Trust, Series 2020-3, Class A15, VRN, 3.50%, 8/25/50(3) | 83,604 | | 84,299 | |
JP Morgan Mortgage Trust, Series 2021-12, Class A4 SEQ, VRN, 2.50%, 2/25/52(3) | 390,870 | | 394,574 | |
JP Morgan Mortgage Trust, Series 2021-13, Class A3, VRN, 2.50%, 4/25/52(3) | 409,230 | | 409,112 | |
| MASTR Adjustable Rate Mortgages Trust, Series 2004-13, Class 3A7, VRN, 2.73%, 11/21/34 | 33,417 | | 33,835 | |
| Merrill Lynch Mortgage Investors Trust, Series 2005-3, Class 2A, VRN, 2.11%, 11/25/35 | 19,344 | | 19,261 | |
| Merrill Lynch Mortgage Investors Trust, Series 2005-A2, Class A1, VRN, 2.83%, 2/25/35 | 13,199 | | 13,367 | |
MFA Trust, Series 2021-INV2, Class A3 SEQ, VRN, 2.26%, 11/25/56(3) | 272,503 | | 270,133 | |
Newrez Warehouse Securitization Trust, Series 2021-1, Class A, VRN, 0.85%, (1-month LIBOR plus 0.75%), 5/25/55(3) | 250,000 | | 249,669 | |
Oceanview Mortgage Trust, Series 2021-5, Class A4 SEQ, VRN, 2.50%, 10/25/51(3) | 355,804 | | 358,962 | |
PRMI Securitization Trust, Series 2021-1, Class A5, VRN, 2.50%, 4/25/51(3) | 326,806 | | 322,156 | |
PSMC Trust, Series 2021-2, Class A3 SEQ, VRN, 2.50%, 5/25/51(3) | 131,662 | | 133,156 | |
PSMC Trust, Series 2021-3, Class A3 SEQ, VRN, 2.50%, 8/25/51(3) | 394,681 | | 398,421 | |
Sequoia Mortgage Trust, Series 2021-5, Class A4 SEQ, VRN, 2.50%, 7/25/51(3) | 164,954 | | 166,517 | |
Sofi Mortgage Trust, Series 2016-1A, Class 1A4 SEQ, VRN, 3.00%, 11/25/46(3) | 8,290 | | 8,387 | |
Starwood Mortgage Residential Trust, Series 2020-2, Class B1E, VRN, 3.00%, 4/25/60(3) | 156,000 | | 156,429 | |
| Structured Adjustable Rate Mortgage Loan Trust, Series 2004-8, Class 2A1, VRN, 2.36%, 7/25/34 | 16,915 | | 17,379 | |
Verus Securitization Trust, Series 2021-7, Class A1, VRN, 1.83%, 10/25/66(3) | 221,633 | | 221,308 | |
Verus Securitization Trust, Series 2021-R2, Class A2, VRN, 1.12%, 2/25/64(3) | 127,369 | | 127,142 | |
Verus Securitization Trust, Series 2021-R2, Class A3, VRN, 1.23%, 2/25/64(3) | 152,843 | | 152,055 | |
Wells Fargo Mortgage Backed Securities Trust, Series 2021-2, Class A3, VRN, 2.50%, 6/25/51(3) | 286,049 | | 288,588 | |
| | 7,132,412 | |
| U.S. Government Agency Collateralized Mortgage Obligations — 0.5% |
| FHLMC, Series 2014-DN3, Class M3, VRN, 4.10%, (1-month LIBOR plus 4.00%), 8/25/24 | 39,612 | | 40,360 | |
| FHLMC, Series 2015-HQ2, Class M3, VRN, 3.35%, (1-month LIBOR plus 3.25%), 5/25/25 | 20,953 | | 21,181 | |
| FHLMC, Series 2016-DNA2, Class M3, VRN, 4.75%, (1-month LIBOR plus 4.65%), 10/25/28 | 123,601 | | 128,146 | |
FHLMC, Series 2019-DNA2, Class M2, VRN, 2.55%, (1-month LIBOR plus 2.45%), 3/25/49(3) | 89,177 | | 90,174 | |
| | | | | | | | |
| Shares/
Principal Amount | Value |
FHLMC, Series 2020-DNA3, Class M2, VRN, 3.10%, (1-month LIBOR plus 3.00%), 6/25/50(3) | $ | 22,672 | | $ | 22,712 | |
FHLMC, Series 2020-DNA5, Class M2, VRN, 2.85%, (SOFR plus 2.80%), 10/25/50(3) | 177,116 | | 178,613 | |
FHLMC, Series 2020-HQA3, Class M2, VRN, 3.70%, (1-month LIBOR plus 3.60%), 7/25/50(3) | 28,743 | | 28,869 | |
FHLMC, Series 2021-DNA6, Class M2, VRN, 1.55%, (SOFR plus 1.50%), 10/25/41(3) | 615,000 | | 615,286 | |
| FHLMC, Series 5123, Class HI, IO, 5.00%, 1/25/42 | 235,398 | | 41,544 | |
| FHLMC, Series 5146, Class DI, IO, 5.50%, 7/25/39 | 92,813 | | 17,391 | |
| FNMA, Series 2013-C01, Class M2, VRN, 5.35%, (1-month LIBOR plus 5.25%), 10/25/23 | 209,229 | | 217,837 | |
| FNMA, Series 2014-C02, Class 2M2, VRN, 2.70%, (1-month LIBOR plus 2.60%), 5/25/24 | 42,667 | | 43,308 | |
| FNMA, Series 2014-C04, Class 1M2, VRN, 5.00%, (1-month LIBOR plus 4.90%), 11/25/24 | 68,769 | | 71,665 | |
| FNMA, Series 2015-C04, Class 1M2, VRN, 5.80%, (1-month LIBOR plus 5.70%), 4/25/28 | 151,505 | | 159,801 | |
| FNMA, Series 2015-C04, Class 2M2, VRN, 5.65%, (1-month LIBOR plus 5.55%), 4/25/28 | 347,636 | | 362,562 | |
| FNMA, Series 2017-C03, Class 1M2C, VRN, 3.10%, (1-month LIBOR plus 3.00%), 10/25/29 | 40,000 | | 41,182 | |
| | 2,080,631 | |
TOTAL COLLATERALIZED MORTGAGE OBLIGATIONS (Cost $9,230,558) | | 9,213,043 | |
| COMMERCIAL MORTGAGE-BACKED SECURITIES — 0.9% |
|
|
BDS Ltd., Series 2021-FL8, Class C, VRN, 1.65%, (1-month LIBOR plus 1.55%), 1/18/36(3) | 200,000 | | 198,776 | |
BDS Ltd., Series 2021-FL8, Class D, VRN, 2.00%, (1-month LIBOR plus 1.90%), 1/18/36(3) | 150,000 | | 148,814 | |
BX Commercial Mortgage Trust, Series 2020-VIV2, Class C, VRN, 3.54%, 3/9/44(3) | 325,000 | | 330,358 | |
BX Commercial Mortgage Trust, Series 2020-VIVA, Class D, VRN, 3.55%, 3/11/44(3) | 400,000 | | 399,866 | |
BX Commercial Mortgage Trust, Series 2021-VOLT, Class F, VRN, 2.51%, (1-month LIBOR plus 2.40%), 9/15/36(3) | 400,000 | | 397,336 | |
BXMT, Ltd., Series 2020-FL2, Class C, VRN, 1.81%, (SOFR plus 1.76%), 2/15/38(3) | 386,000 | | 386,331 | |
ELP Commercial Mortgage Trust, Series 2021-ELP, Class E, VRN, 2.23%, (1-month LIBOR plus 2.12%), 11/15/38(3) | 513,000 | | 511,253 | |
OPG Trust, Series 2021-PORT, Class E, VRN, 1.64%, (1-month LIBOR plus 1.53%), 10/15/36(3) | 504,000 | | 495,511 | |
PFP Ltd., Series 2019-5, Class B, VRN, 1.76%, (1-month LIBOR plus 1.65%), 4/14/36(3) | 200,000 | | 199,765 | |
PFP Ltd., Series 2021-8, Class C, VRN, 1.91%, (1-month LIBOR plus 1.80%), 8/9/37(3) | 425,000 | | 423,148 | |
TOTAL COMMERCIAL MORTGAGE-BACKED SECURITIES (Cost $3,526,525) | | 3,491,158 | |
| MUNICIPAL SECURITIES — 0.6% |
|
|
| Bay Area Toll Authority Rev., 6.92%, 4/1/40 | 70,000 | | 104,729 | |
| California State University Rev., 2.98%, 11/1/51 | 200,000 | | 204,352 | |
| Dallas Area Rapid Transit Rev., 6.00%, 12/1/44 | 25,000 | | 37,233 | |
| Foothill-Eastern Transportation Corridor Agency Rev., 4.09%, 1/15/49 | 85,000 | | 91,552 | |
| Golden State Tobacco Securitization Corp. Rev., 2.75%, 6/1/34 | 225,000 | | 226,901 | |
| Grand Parkway Transportation Corp. Rev., 3.24%, 10/1/52 | 70,000 | | 70,876 | |
| Houston GO, 3.96%, 3/1/47 | 25,000 | | 30,215 | |
| Los Angeles Department of Airports Rev., 6.58%, 5/15/39 | 25,000 | | 33,318 | |
| | | | | | | | |
| Shares/
Principal Amount | Value |
| Metropolitan Transportation Authority Rev., 6.81%, 11/15/40 | $ | 15,000 | | $ | 21,410 | |
| Metropolitan Water Reclamation District of Greater Chicago GO, 5.72%, 12/1/38 | 200,000 | | 275,762 | |
| Michigan Strategic Fund Rev., (Flint Water Advocacy Fund), 3.23%, 9/1/47 | 200,000 | | 201,505 | |
| Missouri Highway & Transportation Commission Rev., 5.45%, 5/1/33 | 20,000 | | 25,159 | |
| New Jersey Turnpike Authority Rev., 7.41%, 1/1/40 | 65,000 | | 104,749 | |
| New Jersey Turnpike Authority Rev., 7.10%, 1/1/41 | 85,000 | | 133,508 | |
| New York City Water & Sewer System Rev., 5.95%, 6/15/42 | 45,000 | | 67,687 | |
| Ohio Turnpike & Infrastructure Commission Rev., 3.22%, 2/15/48 | 100,000 | | 101,987 | |
| Ohio Water Development Authority Water Pollution Control Loan Fund Rev., 4.88%, 12/1/34 | 30,000 | | 35,416 | |
| Port Authority of New York & New Jersey Rev., 4.93%, 10/1/51 | 40,000 | | 55,537 | |
| Regents of the University of California Medical Center Pooled Rev., 3.26%, 5/15/60 | 100,000 | | 107,843 | |
| Rutgers The State University of New Jersey Rev., 5.67%, 5/1/40 | 45,000 | | 60,787 | |
| Sacramento Municipal Utility District Rev., 6.16%, 5/15/36 | 25,000 | | 34,757 | |
| Santa Clara Valley Transportation Authority Rev., 5.88%, 4/1/32 | 30,000 | | 35,964 | |
| State of California GO, 4.60%, 4/1/38 | 120,000 | | 138,214 | |
| State of California GO, 7.55%, 4/1/39 | 70,000 | | 116,954 | |
| State of California GO, 7.30%, 10/1/39 | 15,000 | | 23,557 | |
| State of California GO, 7.60%, 11/1/40 | 20,000 | | 34,518 | |
TOTAL MUNICIPAL SECURITIES (Cost $2,149,171) | | 2,374,490 | |
| U.S. GOVERNMENT AGENCY SECURITIES — 0.2% |
|
|
| FNMA, 0.75%, 10/8/27 | 600,000 | | 579,164 | |
| FNMA, 6.625%, 11/15/30 | 100,000 | | 141,323 | |
| Tennessee Valley Authority, 1.50%, 9/15/31 | 100,000 | | 98,601 | |
TOTAL U.S. GOVERNMENT AGENCY SECURITIES (Cost $818,933) | | 819,088 | |
BANK LOAN OBLIGATIONS(4) — 0.1% |
|
|
| Media — 0.1% | | |
DirecTV Financing, LLC, Term Loan, 8/2/27(5) | 205,000 | | 205,453 | |
Pharmaceuticals† | | |
Horizon Therapeutics USA Inc., 2021 Term Loan B, 2.25%,
(1-month LIBOR plus 1.75%), 3/15/28 | 183,080 | | 182,704 | |
TOTAL BANK LOAN OBLIGATIONS (Cost $388,805) | | 388,157 | |
SOVEREIGN GOVERNMENTS AND AGENCIES† |
|
|
Peru† | | |
| Peruvian Government International Bond, 5.625%, 11/18/50 | 30,000 | | 42,285 | |
Poland† | | |
| Republic of Poland Government International Bond, 3.00%, 3/17/23 | 10,000 | | 10,275 | |
Uruguay† | | |
| Uruguay Government International Bond, 4.125%, 11/20/45 | 20,000 | | 23,825 | |
TOTAL SOVEREIGN GOVERNMENTS AND AGENCIES (Cost $61,254) | | 76,385 | |
PREFERRED STOCKS† |
|
|
Banks† | | |
SVB Financial Group, 4.25% (Cost $46,000) | 46,000 | | 46,730 | |
| | | | | | | | |
| Shares/
Principal Amount | Value |
| TEMPORARY CASH INVESTMENTS — 0.7% |
|
|
State Street Institutional U.S. Government Money Market Fund, Premier Class (Cost $2,874,735) | 2,874,735 | | $ | 2,874,735 | |
TOTAL INVESTMENT SECURITIES — 101.0% (Cost $345,722,607) |
| 400,701,730 | |
| OTHER ASSETS AND LIABILITIES — (1.0)% |
| (4,056,192) | |
| TOTAL NET ASSETS — 100.0% |
| $ | 396,645,538 | |
| | | | | | | | | | | | | | | | | | | | |
| FORWARD FOREIGN CURRENCY EXCHANGE CONTRACTS | | |
| Currency Purchased | Currency Sold | Counterparty | Settlement Date | Unrealized Appreciation
(Depreciation) |
| EUR | 39,608 | | USD | 44,719 | | Credit Suisse AG | 3/31/22 | $ | 456 | |
| USD | 1,942,912 | | EUR | 1,715,822 | | Credit Suisse AG | 3/31/22 | (14,119) | |
| USD | 68,565 | | EUR | 60,427 | | Credit Suisse AG | 3/31/22 | (357) | |
| USD | 66,818 | | EUR | 58,904 | | UBS AG | 3/31/22 | (366) | |
| | | | | | $ | (14,386) | |
| | | | | | | | | | | | | | |
| FUTURES CONTRACTS PURCHASED |
| Reference Entity | Contracts | Expiration Date | Notional
Amount | Unrealized
Appreciation
(Depreciation)^ |
| U.S. Treasury 2-Year Notes | 31 | March 2022 | $ | 6,763,328 | | $ | (1,090) | |
| U.S. Treasury 5-Year Notes | 3 | March 2022 | 362,930 | | (1,014) | |
| U.S. Treasury Long Bonds | 10 | March 2022 | 1,604,375 | | 11,809 | |
| | | $ | 8,730,633 | | $ | 9,705 | |
^Amount represents value and unrealized appreciation (depreciation).
| | | | | | | | | | | | | | |
| FUTURES CONTRACTS SOLD |
| Reference Entity | Contracts | Expiration
Date | Notional
Amount | Unrealized
Appreciation
(Depreciation)^ |
| U.S. Treasury 10-Year Ultra Notes | 2 | March 2022 | $ | 292,875 | | $ | (285) | |
^Amount represents value and unrealized appreciation (depreciation).
| | | | | | | | | | | | | | | | | | | | | | | |
| CENTRALLY CLEARED TOTAL RETURN SWAP AGREEMENTS |
| Floating Rate Index | Pay/Receive Floating
Rate Index at Termination | Fixed Rate | Termination
Date | Notional
Amount | Premiums Paid (Received) | Unrealized
Appreciation
(Depreciation) | Value |
| CPURNSA | Receive | 1.78% | 8/5/24 | $ | 1,000,000 | | $ | (508) | | $ | 83,138 | | $ | 82,630 | |
| CPURNSA | Receive | 2.34% | 2/5/26 | $ | 1,200,000 | | 408 | | 86,855 | | 87,263 | |
| CPURNSA | Receive | 2.33% | 2/8/26 | $ | 1,500,000 | | 509 | | 108,717 | | 109,226 | |
| CPURNSA | Receive | 2.30% | 2/24/26 | $ | 1,500,000 | | 509 | | 109,798 | | 110,307 | |
| CPURNSA | Receive | 2.40% | 2/9/31 | $ | 750,000 | | 508 | | 60,301 | | 60,809 | |
| | | | | $ | 1,426 | | $ | 448,809 | | $ | 450,235 | |
| | | | | | | | |
| NOTES TO SCHEDULE OF INVESTMENTS |
| CPURNSA | - | U.S. Consumer Price Index Urban Consumers Not Seasonally Adjusted Index |
| EUR | - | Euro |
| FHLMC | - | Federal Home Loan Mortgage Corporation |
| FNMA | - | Federal National Mortgage Association |
| GNMA | - | Government National Mortgage Association |
| GO | - | General Obligation |
| H15T1Y | - | Constant Maturity U.S. Treasury Note Yield Curve Rate Index |
| IO | - | Interest Only |
| LIBOR | - | London Interbank Offered Rate |
| MTN | - | Medium Term Note |
| SEQ | - | Sequential Payer |
| SOFR | - | Secured Overnight Financing Rate |
| TBA | - | To-Be-Announced. Security was purchased on a forward commitment basis with an approximate principal amount and maturity date. Actual principal amount and maturity date will be determined upon settlement. |
| UMBS | - | Uniform Mortgage-Backed Securities |
| USD | - | United States Dollar |
| VRN | - | Variable Rate Note. The rate adjusts periodically based upon the terms set forth in the security’s offering documents. The rate shown is effective at the period end and the reference rate and spread, if any, is indicated. The security's effective maturity date may be shorter than the final maturity date shown. |
†Category is less than 0.05% of total net assets.
(1)Non-income producing.
(2)Security, or a portion thereof, has been pledged at the custodian bank or with a broker for collateral requirements on forward commitments, forward foreign currency exchange contracts, futures contracts and/or swap agreements. At the period end, the aggregate value of securities pledged was $258,095.
(3)Security was purchased pursuant to Rule 144A or Section 4(2) under the Securities Act of 1933 and may be sold in transactions exempt from registration, normally to qualified institutional investors. The aggregate value of these securities at the period end was $40,818,120, which represented 10.3% of total net assets.
(4)The interest rate on a bank loan obligation adjusts periodically based on a predetermined schedule. Rate or range of rates shown is effective at period end. The maturity date on a bank loan obligation may be less than indicated as a result of contractual or optional prepayments. These prepayments cannot be predicted with certainty.
(5)The interest rate will be determined upon settlement of the bank loan obligation after period end.
See Notes to Financial Statements.
| | |
| Statement of Assets and Liabilities |
| | | | | |
| DECEMBER 31, 2021 | |
| Assets | |
| Investment securities, at value (cost of $345,722,607) | $ | 400,701,730 | |
| Cash | 16,599 | |
| Receivable for investments sold | 380,604 | |
| Receivable for capital shares sold | 194,509 | |
| Receivable for variation margin on futures contracts | 5,328 | |
| Receivable for variation margin on swap agreements | 13,462 | |
| Unrealized appreciation on forward foreign currency exchange contracts | 456 | |
| Dividends and interest receivable | 677,064 | |
| 401,989,752 | |
| |
| Liabilities | |
| Payable for investments purchased | 4,918,678 | |
| Payable for capital shares redeemed | 106,698 | |
| Unrealized depreciation on forward foreign currency exchange contracts | 14,842 | |
| Accrued management fees | 269,634 | |
| Distribution fees payable | 34,362 | |
| 5,344,214 | |
| |
| Net Assets | $ | 396,645,538 | |
| |
| Net Assets Consist of: | |
| Capital (par value and paid-in surplus) | $ | 288,407,349 | |
| Distributable earnings | 108,238,189 | |
| $ | 396,645,538 | |
| | | | | | | | | | | |
| Net Assets | Shares Outstanding | Net Asset Value Per Share |
| Class I, $0.01 Par Value | $231,836,992 | 24,238,176 | $9.56 |
| Class II, $0.01 Par Value | $164,808,546 | 17,230,676 | $9.56 |
See Notes to Financial Statements.
| | | | | |
| YEAR ENDED DECEMBER 31, 2021 | |
| Investment Income (Loss) | |
| Income: | |
| Dividends (net of foreign taxes withheld of $3,560) | $ | 2,827,240 | |
| Interest (net of foreign taxes withheld of $51) | 2,585,009 | |
| 5,412,249 | |
| |
| Expenses: | |
| Management fees | 3,272,787 | |
| Distribution fees - Class II | 377,873 | |
| Directors' fees and expenses | 9,053 | |
| Other expenses | 669 | |
| 3,660,382 | |
Fees waived(1) | (196,552) | |
| 3,463,830 | |
| |
| Net investment income (loss) | 1,948,419 | |
| |
| Realized and Unrealized Gain (Loss) | |
| Net realized gain (loss) on: | |
| Investment transactions | 53,211,251 | |
| Forward foreign currency exchange contract transactions | 78,977 | |
| Futures contract transactions | 577,732 | |
| Swap agreement transactions | (37,353) | |
| Foreign currency translation transactions | (3,927) | |
| 53,826,680 | |
| |
| Change in net unrealized appreciation (depreciation) on: | |
| Investments | (2,362,135) | |
| Forward foreign currency exchange contracts | (14,386) | |
| Futures contracts | (1,165) | |
| Swap agreements | 442,924 | |
| (1,934,762) | |
| |
| Net realized and unrealized gain (loss) | 51,891,918 | |
| |
| Net Increase (Decrease) in Net Assets Resulting from Operations | $ | 53,840,337 | |
(1)Amount consists of $116,222 and $80,330 for Class I and Class II, respectively.
See Notes to Financial Statements.
| | |
| Statement of Changes in Net Assets |
| | | | | | | | |
| YEARS ENDED DECEMBER 31, 2021 AND DECEMBER 31, 2020 |
| Increase (Decrease) in Net Assets | December 31, 2021 | December 31, 2020 |
| Operations | | |
| Net investment income (loss) | $ | 1,948,419 | | $ | 2,795,736 | |
| Net realized gain (loss) | 53,826,680 | | 17,174,829 | |
| Change in net unrealized appreciation (depreciation) | (1,934,762) | | 16,651,319 | |
| Net increase (decrease) in net assets resulting from operations | 53,840,337 | | 36,621,884 | |
| | |
| Distributions to Shareholders | | |
| From earnings: | | |
| Class I | (11,576,800) | | (8,182,728) | |
| Class II | (7,504,684) | | (5,078,102) | |
| Decrease in net assets from distributions | (19,081,484) | | (13,260,830) | |
| | |
| Capital Share Transactions | | |
| Net increase (decrease) in net assets from capital share transactions (Note 5) | 20,941,188 | | 30,652,420 | |
| | |
| Net increase (decrease) in net assets | 55,700,041 | | 54,013,474 | |
| | |
| Net Assets | | |
| Beginning of period | 340,945,497 | | 286,932,023 | |
| End of period | $ | 396,645,538 | | $ | 340,945,497 | |
See Notes to Financial Statements.
| | |
| Notes to Financial Statements |
DECEMBER 31, 2021
1. Organization
American Century Variable Portfolios, Inc. (the corporation) is registered under the Investment Company Act of 1940, as amended (the 1940 Act), as an open-end management investment company and is organized as a Maryland corporation. VP Balanced Fund (the fund) is one fund in a series issued by the corporation. The fund’s investment objective is to seek long-term capital growth and current income by investing approximately 60% of its assets in equity securities and the remainder in bonds and other fixed-income securities. The fund offers Class I and Class II.
2. Significant Accounting Policies
The following is a summary of significant accounting policies consistently followed by the fund in preparation of its financial statements. The fund is an investment company and follows accounting and reporting guidance in accordance with accounting principles generally accepted in the United States of America. This may require management to make certain estimates and assumptions at the date of the financial statements. Actual results could differ from these estimates. Management evaluated the impact of events or transactions occurring through the date the financial statements were issued that would merit recognition or disclosure.
Investment Valuations — The fund determines the fair value of its investments and computes its net asset value (NAV) per share at the close of regular trading (usually 4 p.m. Eastern time) on the New York Stock Exchange (NYSE) on each day the NYSE is open. The Board of Directors has adopted valuation policies and procedures to guide the investment advisor in the fund’s investment valuation process and to provide methodologies for the oversight of the fund’s pricing function.
Equity securities that are listed or traded on a domestic securities exchange are valued at the last reported sales price or at the official closing price as provided by the exchange. Equity securities traded on foreign securities exchanges are generally valued at the closing price of such securities on the exchange where primarily traded or at the close of the NYSE, if that is earlier. If no last sales price is reported, or if local convention or regulation so provides, the mean of the latest bid and asked prices may be used. Securities traded over-the-counter are valued at the mean of the latest bid and asked prices, the last sales price, or the official closing price. Equity securities initially expressed in local currencies are translated into U.S. dollars at the mean of the appropriate currency exchange rate at the close of the NYSE as provided by an independent pricing service.
Fixed income securities are valued at the evaluated mean as provided by independent pricing services or at the mean of the most recent bid and asked prices as provided by investment dealers. Corporate bonds, U.S. Treasury and Government Agency securities, convertible bonds, bank loan obligations, municipal securities, and sovereign governments and agencies are valued using market models that consider trade data, quotations from dealers and active market makers, relevant yield curve and spread data, creditworthiness, trade data or market information on comparable securities, and other relevant security specific information. Mortgage-related and asset-backed securities are valued based on models that consider trade data, prepayment and default projections, benchmark yield and spread data and estimated cash flows of each tranche of the issuer. Collateralized loan obligations are valued based on discounted cash flow models that consider trade and economic data, prepayment assumptions and default projections.
Hybrid securities are valued at the evaluated mean as provided by independent pricing services or at the mean of the most recent bid and asked prices as provided by investment dealers. Preferred stocks and convertible preferred stocks with perpetual maturities are valued using market models that consider trade data, quotations from dealers and active market makers, relevant yield curve and spread data, creditworthiness, trade data or market information on comparable securities, and other relevant security specific information.
Open-end management investment companies are valued at the reported NAV per share. Exchange-traded futures contracts are valued at the settlement price as provided by the appropriate exchange. Swap agreements are valued at an evaluated mean as provided by independent pricing services or independent brokers. Forward foreign currency exchange contracts are valued at the mean of the appropriate forward exchange rate at the close of the NYSE as provided by an independent pricing service.
If the fund determines that the market price for an investment is not readily available or the valuation methods mentioned above do not reflect an investment’s fair value, such investment is valued as determined in good faith by the Board of Directors or its delegate, in accordance with policies and procedures adopted by the Board of Directors. In its determination of fair value, the fund may review several factors including, but not limited to, market information regarding the specific investment or comparable investments and correlation with other investment types, futures indices or general market indicators. Circumstances that may cause the fund to use these procedures to value an investment include, but are not limited to: an investment has been declared in default or is distressed; trading in a security has been suspended during the trading day or a security is not actively trading on its principal exchange; prices received from a regular pricing source are deemed unreliable; or there is a foreign market holiday and no trading occurred.
The fund monitors for significant events occurring after the close of an investment’s primary exchange but before the fund’s NAV per share is determined. Significant events may include, but are not limited to: corporate announcements and transactions; governmental action and political unrest that could impact a specific investment or an investment sector; or armed conflicts, natural disasters and similar events that could affect investments in a specific country or region. The fund also monitors for significant fluctuations between domestic and foreign markets, as evidenced by the U.S. market or such other indicators that the Board of Directors, or its delegate, deems appropriate. The fund may apply a model-derived factor to the closing price of equity securities traded on foreign securities exchanges. The factor is based on observable market data as provided by an independent pricing service.
Security Transactions — Security transactions are accounted for as of the trade date. Net realized gains and losses are determined on the identified cost basis, which is also used for federal income tax purposes.
Investment Income — Dividend income less foreign taxes withheld, if any, is recorded as of the ex-dividend date. Distributions received on securities that represent a return of capital or long-term capital gain are recorded as a reduction of cost of investments and/or as a realized gain. The fund may estimate the components of distributions received that may be considered nontaxable distributions or long-term capital gain distributions for income tax purposes. Interest income less foreign taxes withheld, if any, is recorded on the accrual basis and includes paydown gain (loss) and accretion of discounts and amortization of premiums. Inflation adjustments related to inflation-linked debt securities are reflected as interest income.
Foreign Currency Translations — All assets and liabilities initially expressed in foreign currencies are translated into U.S. dollars at prevailing exchange rates at period end. The fund may enter into spot foreign currency exchange contracts to facilitate transactions denominated in a foreign currency. Purchases and sales of investment securities, dividend and interest income, spot foreign currency exchange contracts, and expenses are translated at the rates of exchange prevailing on the respective dates of such transactions. Net realized and unrealized foreign currency exchange gains or losses related to investment securities are a component of net realized gain (loss) on investment transactions and change in net unrealized appreciation (depreciation) on investments, respectively.
Forward Commitments — The fund may engage in securities transactions on a forward commitment basis. In these transactions, the securities’ prices and yields are fixed on the date of the commitment. The fund may sell a to-be-announced (TBA) security and at the same time make a commitment to purchase the same security at a future date at a specified price. Conversely, the fund may purchase a TBA security and at the same time make a commitment to sell the same security at a future date at a specified price. These types of transactions are known as “TBA roll” transactions and are accounted for as purchases and sales. The fund will segregate cash, cash equivalents or other appropriate liquid securities on its records in amounts sufficient to meet the purchase price.
Income Tax Status — It is the fund’s policy to distribute substantially all net investment income and net realized gains to shareholders and to otherwise qualify as a regulated investment company under provisions of the Internal Revenue Code. Accordingly, no provision has been made for income taxes. The fund files U.S. federal, state, local and non-U.S. tax returns as applicable. The fund's tax returns are subject to examination by the relevant taxing authority until expiration of the applicable statute of limitations, which is generally three years from the date of filing but can be longer in certain jurisdictions. At this time, management believes there are no uncertain tax positions which, based on their technical merit, would not be sustained upon examination and for which it is reasonably possible that the total amounts of unrecognized tax benefits will significantly change in the next twelve months.
Multiple Class — All shares of the fund represent an equal pro rata interest in the net assets of the class to which such shares belong, and have identical voting, dividend, liquidation and other rights and the same terms and conditions, except for class specific expenses and exclusive rights to vote on matters affecting only individual classes. Income, non-class specific expenses, and realized and unrealized capital gains and losses of the fund are allocated to each class of shares based on their relative net assets.
Segregated Assets — In accordance with the 1940 Act, the fund segregates assets on its books and records to cover certain types of investment securities and other financial instruments. American Century Investment Management, Inc. (ACIM) (the investment advisor) monitors, on a daily basis, the securities segregated to ensure the fund designates a sufficient amount of liquid assets, marked-to-market daily. The fund may also receive assets or be required to pledge assets at the custodian bank or with a broker for collateral requirements.
Distributions to Shareholders — Distributions from net investment income, if any, are generally declared and paid quarterly. Distributions from net realized gains, if any, are generally declared and paid annually.
Indemnifications — Under the corporation’s organizational documents, its officers and directors are indemnified against certain liabilities arising out of the performance of their duties to the fund. In addition, in the normal course of business, the fund enters into contracts that provide general indemnifications. The maximum exposure under these arrangements is unknown as this would involve future claims that may be made against a fund. The risk of material loss from such claims is considered by management to be remote.
3. Fees and Transactions with Related Parties
Certain officers and directors of the corporation are also officers and/or directors of American Century Companies, Inc. (ACC). The corporation’s investment advisor, ACIM, the corporation's distributor, American Century Investment Services, Inc. (ACIS), and the corporation’s transfer agent, American Century Services, LLC, are wholly owned, directly or indirectly, by ACC.
Management Fees — The corporation has entered into a management agreement with ACIM, under which ACIM provides the fund with investment advisory and management services in exchange for a single, unified management fee (the fee) per class. The agreement provides that ACIM will pay all expenses of managing and operating the fund, except brokerage expenses, taxes, interest, fees and expenses of the independent directors (including legal counsel fees), extraordinary expenses, and expenses incurred in connection with the provision of shareholder services and distribution services under a plan adopted pursuant to Rule 12b-1 under the 1940 Act. The fee is computed and accrued daily based on each class's daily net assets and paid monthly in arrears. The rate of the fee is determined by applying a fee rate calculation formula. This formula takes into account the fund's assets as well as certain assets, if any, of other clients of the investment advisor outside the American Century Investments family of funds (such as subadvised funds and separate accounts) that use very similar investment teams and strategies (strategy assets). The management fee schedule ranges from 0.80% to 0.90% for each class. From January 1, 2021 through July 31, 2021, the investment advisor agreed to waive 0.04% of the fund’s management fee. Effective August 1, 2021, the investment advisor agreed to waive 0.07% of the fund's management fee. The investment advisor expects this waiver to continue until July 31, 2022 and cannot terminate it prior to such date without the approval of the Board of Directors. The effective annual management fee for each class for the period ended December 31, 2021 was 0.88% before waiver and 0.83% after waiver.
Distribution Fees — The Board of Directors has adopted the Master Distribution Plan (the plan) for Class II, pursuant to Rule 12b-1 of the 1940 Act. The plan provides that Class II will pay ACIS an annual distribution fee equal to 0.25%. The fee is computed and accrued daily based on the Class II daily net assets and paid monthly in arrears. The distribution fee provides compensation for expenses incurred in connection with distributing shares of Class II including, but not limited to, payments to brokers, dealers, and financial institutions that have entered into sales agreements with respect to shares of the fund. Fees incurred under the plan during the period ended December 31, 2021 are detailed in the Statement of Operations.
Directors' Fees and Expenses — The Board of Directors is responsible for overseeing the investment advisor’s management and operations of the fund. The directors receive detailed information about the fund and its investment advisor regularly throughout the year, and meet at least quarterly with management of the investment advisor to review reports about fund operations. The fund’s officers do not receive compensation from the fund.
Interfund Transactions — The fund may enter into security transactions with other American Century Investments funds and other client accounts of the investment advisor, in accordance with the 1940 Act rules and procedures adopted by the Board of Directors. The rules and procedures require, among other things, that these transactions be effected at the independent current market price of the security. During the period, the interfund purchases and sales were $1,191,615 and $1,437,333, respectively. The effect of interfund transactions on the Statement of Operations was $227,570 in net realized gain (loss) on investment transactions.
4. Investment Transactions
Purchases of investment securities, excluding short-term investments, for the period ended December 31, 2021 totaled $723,601,351, of which $207,333,448 represented U.S. Treasury and Government Agency obligations.
Sales of investment securities, excluding short-term investments, for the period ended December 31, 2021 totaled $726,788,007, of which $220,321,193 represented U.S. Treasury and Government Agency obligations.
5. Capital Share Transactions
Transactions in shares of the fund were as follows:
| | | | | | | | | | | | | | |
| Year ended
December 31, 2021 | Year ended
December 31, 2020 |
| Shares | Amount | Shares | Amount |
| Class I/Shares Authorized | 150,000,000 | | | 150,000,000 | | |
| Sold | 3,224,057 | | $ | 29,266,636 | | 3,608,958 | | $ | 29,012,147 | |
| Issued in reinvestment of distributions | 1,339,166 | | 11,576,800 | | 1,159,946 | | 8,182,728 | |
| Redeemed | (3,395,173) | | (30,808,282) | | (3,394,452) | | (27,050,942) | |
| 1,168,050 | | 10,035,154 | | 1,374,452 | | 10,143,933 | |
| Class II/Shares Authorized | 75,000,000 | | | 75,000,000 | | |
| Sold | 1,940,892 | | 17,683,643 | | 3,454,204 | | 27,693,286 | |
| Issued in reinvestment of distributions | 869,949 | | 7,504,684 | | 723,855 | | 5,078,102 | |
| Redeemed | (1,579,626) | | (14,282,293) | | (1,549,473) | | (12,262,901) | |
| 1,231,215 | | 10,906,034 | | 2,628,586 | | 20,508,487 | |
| Net increase (decrease) | 2,399,265 | | $ | 20,941,188 | | 4,003,038 | | $ | 30,652,420 | |
6. Fair Value Measurements
The fund’s investments valuation process is based on several considerations and may use multiple inputs to determine the fair value of the investments held by the fund. In conformity with accounting principles generally accepted in the United States of America, the inputs used to determine a valuation are classified into three broad levels.
•Level 1 valuation inputs consist of unadjusted quoted prices in an active market for identical investments.
•Level 2 valuation inputs consist of direct or indirect observable market data (including quoted prices for comparable investments, evaluations of subsequent market events, interest rates, prepayment speeds, credit risk, etc.). These inputs also consist of quoted prices for identical investments initially expressed in local currencies that are adjusted through translation into U.S. dollars.
•Level 3 valuation inputs consist of unobservable data (including a fund’s own assumptions).
The level classification is based on the lowest level input that is significant to the fair valuation measurement. The valuation inputs are not necessarily an indication of the risks associated with investing in these securities or other financial instruments.
The following is a summary of the level classifications as of period end. The Schedule of Investments provides additional information on the fund’s portfolio holdings.
| | | | | | | | | | | |
| Level 1 | Level 2 | Level 3 |
| Assets | | | |
| Investment Securities | | | |
| Common Stocks | $ | 238,143,914 | | $ | 3,708,768 | | — | |
| U.S. Treasury Securities | — | | 60,361,746 | | — | |
| Corporate Bonds | — | | 41,122,191 | | — | |
| U.S. Government Agency Mortgage-Backed Securities | — | | 17,436,100 | | — | |
| Collateralized Loan Obligations | — | | 10,617,426 | | — | |
| Asset-Backed Securities | — | | 10,027,799 | | — | |
| Collateralized Mortgage Obligations | — | | 9,213,043 | | — | |
| Commercial Mortgage-Backed Securities | — | | 3,491,158 | | — | |
| Municipal Securities | — | | 2,374,490 | | — | |
| U.S. Government Agency Securities | — | | 819,088 | | — | |
| Bank Loan Obligations | — | | 388,157 | | — | |
| Sovereign Governments and Agencies | — | | 76,385 | | — | |
| Preferred Stocks | — | | 46,730 | | — | |
| Temporary Cash Investments | 2,874,735 | | — | | — | |
| $ | 241,018,649 | | $ | 159,683,081 | | — | |
| Other Financial Instruments | | | |
| Futures Contracts | $ | 11,809 | | — | | — | |
| Swap Agreements | — | | $ | 450,235 | | — | |
| Forward Foreign Currency Exchange Contracts | — | | 456 | | — | |
| $ | 11,809 | | $ | 450,691 | | — | |
| | | |
| Liabilities | | | |
| Other Financial Instruments | | | |
| Futures Contracts | $ | 2,389 | | — | | — | |
| Forward Foreign Currency Exchange Contracts | — | | $ | 14,842 | | — | |
| $ | 2,389 | | $ | 14,842 | | — | |
7. Derivative Instruments
Credit Risk — The fund is subject to credit risk in the normal course of pursuing its investment objectives. The value of a bond generally declines as the credit quality of its issuer declines. Credit default swap agreements enable a fund to buy/sell protection against a credit event of a specific issuer or index. A fund may attempt to enhance returns by selling protection or attempt to mitigate credit risk by buying protection. The buyer/seller of credit protection against a security or basket of securities may pay/receive an up-front or periodic payment to compensate for/against potential default events. Changes in value, including the periodic amounts of interest to be paid or received on swap agreements, are recorded as unrealized appreciation (depreciation) on swap agreements. Upon entering into a centrally cleared swap, a fund is required to deposit cash or securities (initial margin) with a financial intermediary in an amount equal to a certain percentage of the notional amount. Subsequent payments (variation margin) are made or received daily, in cash, by a fund. The variation margin is equal to the daily change in the value and is a component of unrealized gains and losses. Realized gain or loss is recorded upon receipt or payment of a periodic settlement or termination of swap agreements. Net realized and unrealized gains or losses occurring during the holding period of swap agreements are a component of net realized gain (loss) on swap agreement transactions and change in net unrealized appreciation (depreciation) on swap agreements, respectively. The risks of entering into swap agreements include the possible lack of liquidity, failure of the counterparty to meet its obligations, and that there may be unfavorable changes in the underlying investments or instruments. The fund's average notional amount held during the period was $3,066,667.
Equity Price Risk — The fund is subject to equity price risk in the normal course of pursuing its investment objectives. A fund may enter into futures contracts based on an equity index in order to manage its exposure to changes in market conditions. A fund may purchase futures contracts to gain exposure to increases in market value or sell futures contracts to protect against a decline in market value. Upon entering into a futures contract, a fund is required to deposit either cash or securities in an amount equal to a certain percentage of the contract value (initial margin). Subsequent payments (variation margin) are made or received daily, in cash, by a fund. The variation margin is equal to the daily change in the contract value and is recorded as unrealized gains and losses. A fund recognizes a realized gain or loss when the contract is closed or expires. Net realized and unrealized gains or losses occurring during the holding period of futures contracts are a component of net realized gain (loss) on futures contract transactions and change in net unrealized appreciation (depreciation) on futures contracts, respectively. One of the risks of entering into futures contracts is the possibility that the change in value of the contract may not correlate with the changes in value of the underlying securities. The fund's average notional exposure to equity price risk derivative instruments held during the period was $2,037,433 futures contracts purchased.
Foreign Currency Risk — The fund is subject to foreign currency exchange rate risk in the normal course of pursuing its investment objectives. The value of foreign investments held by a fund may be significantly affected by changes in foreign currency exchange rates. The dollar value of a foreign security generally decreases when the value of the dollar rises against the foreign currency in which the security is denominated and tends to increase when the value of the dollar declines against such foreign currency. A fund may enter into forward foreign currency exchange contracts to reduce a fund's exposure to foreign currency exchange rate fluctuations. The net U.S. dollar value of foreign currency underlying all contractual commitments held by a fund and the resulting unrealized appreciation or depreciation are determined daily. Realized gain or loss is recorded upon settlement of the contract. Net realized and unrealized gains or losses occurring during the holding period of forward foreign currency exchange contracts are a component of net realized gain (loss) on forward foreign currency exchange contract transactions and change in net unrealized appreciation (depreciation) on forward foreign currency exchange contracts, respectively. A fund bears the risk of an unfavorable change in the foreign currency exchange rate underlying the forward contract. Additionally, losses, up to the fair value, may arise if the counterparties do not perform under the contract terms. The fund's average U.S. dollar exposure to foreign currency risk derivative instruments held during the period was $2,737,557.
Interest Rate Risk — The fund is subject to interest rate risk in the normal course of pursuing its investment objectives. The value of bonds generally declines as interest rates rise. A fund may enter into futures contracts based on a bond index or a specific underlying security. A fund may purchase futures contracts to gain exposure to increases in market value or sell futures contracts to protect against a decline in market value. Upon entering into a futures contract, a fund will segregate cash, cash equivalents or other appropriate liquid securities on its records in amounts sufficient to meet requirements. Subsequent payments (variation margin) are made or received daily, in cash, by a fund. The variation margin is equal to the daily change in the contract value and is recorded as unrealized gains and losses. A fund recognizes a realized gain or loss when the futures contract is closed or expires. Net realized and unrealized gains or losses occurring during the holding period of futures contracts are a component of net realized gain (loss) on futures contract transactions and change in net unrealized appreciation (depreciation) on futures contracts, respectively. One of the risks of entering into futures contracts is the possibility that the change in value of the contract may not correlate with the changes in value of the underlying securities. The fund's average notional exposure to interest rate risk derivative instruments held during the period was $10,650,958 futures contracts purchased and $2,509,474 futures contracts sold.
Other Contracts — A fund may enter into total return swap agreements in order to attempt to obtain or preserve a particular return or spread at a lower cost than obtaining a return or spread through purchases and/or sales of instruments in other markets or gain exposure to certain markets in the most economical way possible. A fund will segregate cash, cash equivalents or other appropriate liquid securities on its records in amounts sufficient to meet requirements. Changes in value, including the periodic amounts of interest to be paid or received on swap agreements, are recorded as unrealized appreciation (depreciation) on swap agreements. Upon entering into a centrally cleared swap, a fund is required to deposit cash or securities (initial margin) with a financial intermediary in an amount equal to a certain percentage of the notional amount. Subsequent payments (variation margin) are made or received daily, in cash, by a fund. The variation margin is equal to the daily change in the value and is a component of unrealized gains and losses. Realized gain or loss is recorded upon receipt or payment of a periodic settlement or termination of swap agreements. Net realized and unrealized gains or losses occurring during the holding period of swap agreements are a component of net realized gain (loss) on swap agreement transactions and change in net unrealized appreciation (depreciation) on swap agreements, respectively. The risks of entering into swap agreements include the possible lack of liquidity, failure of the counterparty to meet its obligations, and that there may be unfavorable changes in the underlying investments or instruments, including inflationary risk. The fund's average notional amount held during the period was $5,687,500.
Value of Derivative Instruments as of December 31, 2021
| | | | | | | | | | | | | | |
| Asset Derivatives | | Liability Derivatives |
| Type of Risk Exposure | Location on Statement of Assets and Liabilities | Value | Location on Statement of Assets and Liabilities | Value |
| Foreign Currency Risk | Unrealized appreciation on forward foreign currency exchange contracts | $ | 456 | | Unrealized depreciation on forward foreign currency exchange contracts | $ | 14,842 | |
| Interest Rate Risk | Receivable for variation margin on futures contracts* | 5,328 | | Payable for variation margin on futures contracts* | — | |
| Other Contracts | Receivable for variation margin on swap agreements* | 13,462 | | Payable for variation margin on swap agreements* | — | |
| | $ | 19,246 | | | $ | 14,842 | |
*Included in the unrealized appreciation (depreciation) on futures contracts or centrally cleared swap agreements, as applicable, as reported in the Schedule of Investments.
Effect of Derivative Instruments on the Statement of Operations for the Year Ended December 31, 2021
| | | | | | | | | | | | | | |
| Net Realized Gain (Loss) | Change in Net Unrealized
Appreciation (Depreciation) |
| Type of Risk Exposure | Location on Statement of Operations | Value | Location on Statement of Operations | Value |
| Credit Risk | Net realized gain (loss) on swap agreement transactions | $ | (49,206) | | Change in net unrealized appreciation (depreciation) on swap agreements | — | |
| Equity Price Risk | Net realized gain (loss) on futures contract transactions | 605,201 | | Change in net unrealized appreciation (depreciation) on futures contracts | $ | (13,128) | |
| Foreign Currency Risk | Net realized gain (loss) on forward foreign currency exchange contract transactions | 78,977 | | Change in net unrealized appreciation (depreciation) on forward foreign currency exchange contracts | (14,386) | |
| Interest Rate Risk | Net realized gain (loss) on futures contract transactions | (27,469) | | Change in net unrealized appreciation (depreciation) on futures contracts | 11,963 | |
| Other Contracts | Net realized gain (loss) on swap agreement transactions | 11,853 | | Change in net unrealized appreciation (depreciation) on swap agreements | 442,924 | |
| | $ | 619,356 | | | $ | 427,373 | |
8. Risk Factors
The value of the fund’s shares will go up and down, sometimes rapidly or unpredictably, based on the performance of the securities owned by the fund and other factors generally affecting the securities market. Market risks, including political, regulatory, economic and social developments, can affect the value of the fund’s investments. Natural disasters, public health emergencies, terrorism and other unforeseeable events may lead to increased market volatility and may have adverse long-term effects on world economies and markets generally.
The fund may invest in instruments that have variable or floating coupon rates based on the London Interbank Offered Rate (LIBOR). LIBOR is a benchmark interest rate intended to be representative of the rate at which certain major international banks lend to one another over short-terms. Financial institutions have started the process of phasing out LIBOR and the transition process to a replacement rate may lead to increased volatility or illiquidity in markets for instruments that rely on LIBOR. This could result in a change to the value of such instruments or a change in the cost of temporary borrowing for the fund.
The fund’s investment process may result in high portfolio turnover, which could mean high transaction costs, affecting both performance and capital gains tax liabilities to investors.
9. Federal Tax Information
The tax character of distributions paid during the years ended December 31, 2021 and December 31, 2020 were as follows:
| | | | | | | | |
| 2021 | 2020 |
| Distributions Paid From | | |
| Ordinary income | $ | 4,410,666 | | $ | 6,184,293 | |
| Long-term capital gains | $ | 14,670,818 | | $ | 7,076,537 | |
The book-basis character of distributions made during the year from net investment income or net realized gains may differ from their ultimate characterization for federal income tax purposes. These differences reflect the differing character of certain income items and net realized gains and losses for financial statement and tax purposes, and may result in reclassification among certain capital accounts on the financial statements.
As of period end, the federal tax cost of investments and the components of distributable earnings on a tax-basis were as follows:
| | | | | |
| Federal tax cost of investments | $ | 346,151,286 | |
| Gross tax appreciation of investments | $ | 59,683,907 | |
| Gross tax depreciation of investments | (5,133,463) | |
| Net tax appreciation (depreciation) of investments | 54,550,444 | |
| Net tax appreciation (depreciation) on derivatives | 448,809 | |
| Net tax appreciation (depreciation) | $ | 54,999,253 | |
| Other book-to-tax adjustments | $ | (51,988) | |
| Undistributed ordinary income | $ | 26,655,501 | |
| Accumulated long-term gains | $ | 26,635,423 | |
The difference between book-basis and tax-basis unrealized appreciation (depreciation) is attributable primarily to the tax deferral of losses on wash sales. Other book-to-tax adjustments are attributable primarily to the tax deferral of losses on straddle positions.
| | | | | | | | | | | | | | | | | | | | | | | | | | | | | | | | | | | | | | | | | | | | | | | |
| For a Share Outstanding Throughout the Years Ended December 31 (except as noted) |
| Per-Share Data | | | | | | Ratios and Supplemental Data | |
| | Income From Investment Operations: | Distributions From: | | | Ratio to Average Net Assets of: | | |
| Net Asset
Value,
Beginning
of Period | Net Investment
Income (Loss)(1) | Net
Realized
and
Unrealized
Gain (Loss) | Total From
Investment
Operations | Net
Investment
Income | Net
Realized
Gains | Total
Distributions | Net Asset
Value,
End
of Period | Total Return(2) | Operating
Expenses | Operating
Expenses
(before
expense
waiver) | Net
Investment
Income
(Loss) | Net
Investment
Income (Loss) (before expense waiver) | Portfolio
Turnover
Rate | Net
Assets,
End of
Period (in thousands) |
| Class I | | | | | | | | | | | | | | |
| 2021 | $8.73 | 0.06 | 1.27 | 1.33 | (0.07) | (0.43) | (0.50) | $9.56 | 15.77% | 0.83% | 0.88% | 0.63% | 0.58% | 195% | $231,837 | |
| 2020 | $8.18 | 0.08 | 0.84 | 0.92 | (0.09) | (0.28) | (0.37) | $8.73 | 12.53% | 0.85% | 0.89% | 1.03% | 0.99% | 189% | $201,325 | |
| 2019 | $7.09 | 0.11 | 1.27 | 1.38 | (0.12) | (0.17) | (0.29) | $8.18 | 19.85% | 0.79% | 0.90% | 1.48% | 1.37% | 115% | $177,510 | |
| 2018 | $7.53 | 0.12 | (0.40) | (0.28) | (0.11) | (0.05) | (0.16) | $7.09 | (3.83)% | 0.76% | 0.90% | 1.55% | 1.41% | 120% | $142,595 | |
| 2017 | $6.97 | 0.11 | 0.84 | 0.95 | (0.11) | (0.28) | (0.39) | $7.53 | 13.91% | 0.80% | 0.91% | 1.52% | 1.41% | 114% | $136,993 | |
| Class II | | | | | | | | | | | | | | |
| 2021 | $8.73 | 0.03 | 1.27 | 1.30 | (0.04) | (0.43) | (0.47) | $9.56 | 15.48% | 1.08% | 1.13% | 0.38% | 0.33% | 195% | $164,809 | |
| 2020 | $8.18 | 0.06 | 0.85 | 0.91 | (0.08) | (0.28) | (0.36) | $8.73 | 12.27% | 1.10% | 1.14% | 0.78% | 0.74% | 189% | $139,620 | |
| 2019 | $7.10 | 0.09 | 1.26 | 1.35 | (0.10) | (0.17) | (0.27) | $8.18 | 19.39% | 1.04% | 1.15% | 1.23% | 1.12% | 115% | $109,422 | |
| 2018 | $7.53 | 0.10 | (0.39) | (0.29) | (0.09) | (0.05) | (0.14) | $7.10 | (3.93)% | 1.01% | 1.15% | 1.30% | 1.16% | 120% | $74,928 | |
| 2017 | $6.97 | 0.09 | 0.85 | 0.94 | (0.10) | (0.28) | (0.38) | $7.53 | 13.63% | 1.05% | 1.16% | 1.27% | 1.16% | 114% | $54,363 | |
| | |
| Notes to Financial Highlights |
(1)Computed using average shares outstanding throughout the period.
(2)Total returns are calculated based on the net asset value of the last business day. Total returns for periods less than one year are not annualized. The total returns presented do not include the fees and charges assessed with investments in variable insurance products, those charges are disclosed in the separate account prospectus. The inclusion of such fees and charges would lower total return.
See Notes to Financial Statements.
| | |
| Report of Independent Registered Public Accounting Firm |
To the Shareholders and the Board of Directors of American Century Variable Portfolios, Inc.:
Opinion on the Financial Statements and Financial Highlights
We have audited the accompanying statement of assets and liabilities, including the schedule of investments, of VP Balanced Fund (the “Fund”), one of the funds constituting the American Century Variable Portfolios, Inc., as of December 31, 2021, the related statement of operations for the year then ended, the statements of changes in net assets for each of the two years in the period then ended, the financial highlights for each of the five years in the period then ended, and the related notes. In our opinion, the financial statements and financial highlights present fairly, in all material respects, the financial position of VP Balanced Fund of the American Century Variable Portfolios, Inc. as of December 31, 2021, and the results of its operations for the year then ended, the changes in its net assets for each of the two years in the period then ended, and the financial highlights for each of the five years in the period then ended, in conformity with accounting principles generally accepted in the United States of America.
Basis for Opinion
These financial statements and financial highlights are the responsibility of the Fund's management. Our responsibility is to express an opinion on the Fund’s financial statements and financial highlights based on our audits. We are a public accounting firm registered with the Public Company Accounting Oversight Board (United States) (PCAOB) and are required to be independent with respect to the Fund in accordance with the U.S. federal securities laws and the applicable rules and regulations of the Securities and Exchange Commission and the PCAOB.
We conducted our audits in accordance with the standards of the PCAOB. Those standards require that we plan and perform the audit to obtain reasonable assurance about whether the financial statements and financial highlights are free of material misstatement, whether due to error or fraud. The Fund is not required to have, nor were we engaged to perform, an audit of its internal control over financial reporting. As part of our audits, we are required to obtain an understanding of internal control over financial reporting but not for the purpose of expressing an opinion on the effectiveness of the Fund’s internal control over financial reporting. Accordingly, we express no such opinion.
Our audits included performing procedures to assess the risks of material misstatement of the financial statements and financial highlights, whether due to error or fraud, and performing procedures that respond to those risks. Such procedures included examining, on a test basis, evidence regarding the amounts and disclosures in the financial statements and financial highlights. Our audits also included evaluating the accounting principles used and significant estimates made by management, as well as evaluating the overall presentation of the financial statements and financial highlights. Our procedures included confirmation of securities owned as of December 31, 2021, by correspondence with the custodian and brokers; when replies were not received from brokers, we performed other auditing procedures. We believe that our audits provide a reasonable basis for our opinion.
/s/ Deloitte & Touche LLP
Kansas City, Missouri
February 10, 2022
We have served as the auditor of one or more American Century investment companies since 1997.
The Board of Directors
The individuals listed below serve as directors of the funds. Each director will continue to serve in this capacity until death, retirement, resignation or removal from office. The board has adopted a mandatory retirement age for directors who are not “interested persons,” as that term is defined in the Investment Company Act (independent directors). Independent directors shall retire on December 31 of the year in which they reach their 75th birthday.
Mr. Thomas is an “interested person” because he currently serves as President and Chief Executive Officer of American Century Companies, Inc. (ACC), the parent company of American Century Investment Management, Inc. (ACIM or the advisor). The other directors (more than three-fourths of the total number) are independent. They are not employees, directors or officers of, and have no financial interest in, ACC or any of its wholly owned, direct or indirect, subsidiaries, including ACIM, American Century Investment Services, Inc. (ACIS) and American Century Services, LLC (ACS), and they do not have any other affiliations, positions or relationships that would cause them to be considered “interested persons” under the Investment Company Act. The directors serve in this capacity for seven (in the case of Jonathan S. Thomas, 16; and Stephen E. Yates, 8) registered investment companies in the American Century Investments family of funds.
The following table presents additional information about the directors. The mailing address for each director is 4500 Main Street, Kansas City, Missouri 64111.
| | | | | | | | | | | | | | | | | |
Name
(Year of Birth) | Position(s) Held with Funds | Length of Time Served | Principal Occupation(s) During Past 5 Years | Number of American Century Portfolios Overseen by Director | Other Directorships Held During Past 5 Years |
| Independent Directors | | |
| Thomas W. Bunn (1953) | Director | Since 2017 | Retired | 72 | SquareTwo Financial |
Chris H. Cheesman
(1962)
| Director | Since 2019
| Retired. Senior Vice President & Chief Audit Executive, AllianceBernstein (1999 to 2018)
| 72 | Alleghany Corporation |
Barry Fink
(1955) | Director | Since 2012 (independent since 2016) | Retired | 72 | None |
Rajesh K. Gupta
(1960)
| Director | Since 2019
| Partner Emeritus, SeaCrest Investment Management and SeaCrest Wealth Management (2019 to Present); Chief Executive Officer and Chief Investment Officer, SeaCrest Investment Management (2006 to 2019); Chief Executive Officer and Chief Investment Officer, SeaCrest Wealth Management (2008 to 2019) | 72 | None |
| | | | | | | | | | | | | | | | | |
Name
(Year of Birth) | Position(s) Held with Funds | Length of Time Served | Principal Occupation(s) During Past 5 Years | Number of American Century Portfolios Overseen by Director | Other Directorships Held During Past 5 Years |
| Independent Directors | | |
Lynn Jenkins
(1963)
| Director | Since 2019
| Consultant, LJ Strategies (2019 to present); United States Representative, U.S. House of Representatives (2009 to 2018) | 72 | MGP Ingredients, Inc. (2019 to 2021) |
Jan M. Lewis
(1957) | Director | Since 2011 | Retired | 72 | None |
John R. Whitten(1) (1946) | Director | Since 2008 | Retired | 72 | Onto Innovation Inc. (2019 to 2020); Rudolph Technologies, Inc. (2006 to 2019) |
Stephen E. Yates
(1948) | Director and Chairman of the Board | Since 2012 (Chairman since 2018) | Retired | 108 | None |
| Interested Director | |
Jonathan S. Thomas
(1963) | Director | Since 2007 | President and Chief Executive Officer, ACC (2007 to present). Also serves as Chief Executive Officer, ACS; Director, ACC and other ACC subsidiaries | 146 | None |
(1) Effective December 31, 2021, John R. Whitten retired from the Board of Directors.
The Statement of Additional Information has additional information about the fund's directors and is available without charge, upon request, by calling 1-800-378-9878.
Officers
The following table presents certain information about the executive officers of the funds. Each officer serves as an officer for 16 (in the case of Robert J. Leach, 15) investment companies in the American Century family of funds. No officer is compensated for his or her service as an officer of the funds. The listed officers are interested persons of the funds and are appointed or re-appointed on an annual basis. The mailing address for each officer listed below is 4500 Main Street, Kansas City, Missouri 64111.
| | | | | | | | |
Name
(Year of Birth) | Offices with the Funds | Principal Occupation(s) During the Past Five Years |
Patrick Bannigan
(1965) | President since 2019 | Executive Vice President and Director, ACC (2012 to present); Chief Financial Officer, Chief Accounting Officer and Treasurer, ACC (2015 to present). Also serves as President, ACS; Vice President, ACIM; Chief Financial Officer, Chief Accounting Officer and/or Director, ACIM, ACS and other ACC subsidiaries |
R. Wes Campbell
(1974) | Chief Financial Officer and Treasurer since 2018 | Vice President, ACS, (2020 to present); Investment Operations and Investment Accounting, ACS (2000 to present) |
Amy D. Shelton
(1964) | Chief Compliance Officer and Vice President since 2014 | Chief Compliance Officer, American Century funds, (2014 to present); Chief Compliance Officer, ACIM (2014 to present); Chief Compliance Officer, ACIS (2009 to present). Also serves as Vice President, ACIS |
John Pak
(1968) | General Counsel and
Senior Vice President since 2021 | General Counsel and Senior Vice President, ACC (2021 to present); Also serves as General Counsel and Senior Vice President, ACIM, ACS and ACIS. Chief Legal Officer of Investment and Wealth Management, The Bank of New York Mellon (2014 to 2021) |
C. Jean Wade
(1964) | Vice President since 2012 | Senior Vice President, ACS (2017 to present); Vice President, ACS (2000 to 2017)
|
Robert J. Leach
(1966) | Vice President since 2006 | Vice President, ACS (2000 to present) |
David H. Reinmiller
(1963) | Vice President since 2000 | Attorney, ACC (1994 to present). Also serves as Vice President, ACIM and ACS |
Ward D. Stauffer
(1960) | Secretary since 2005 | Attorney, ACC (2003 to present) |
Proxy Voting Policies
A description of the policies that the fund's investment advisor uses in exercising the voting rights associated with the securities purchased and/or held by the fund is available without charge, upon request, by calling 1-800-378-9878. It is also available on American Century Investments’ website at americancentury.com/proxy and on the Securities and Exchange Commission’s website at sec.gov. Information regarding how the investment advisor voted proxies relating to portfolio securities during the most recent 12-month period ended June 30 is available on americancentury.com/proxy. It is also available at sec.gov.
Quarterly Portfolio Disclosure
The fund files its complete schedule of portfolio holdings with the Securities and Exchange Commission (SEC) for the first and third quarters of each fiscal year as an exhibit to its reports on Form N-PORT. These portfolio holdings are available on the fund's website at ipro.americancentury.com (for Investment Professionals) and, upon request, by calling 1-800-378-9878. The fund’s Form N-PORT reports are available on the SEC’s website at sec.gov.
Other Tax Information
The following information is provided pursuant to provisions of the Internal Revenue Code.
For corporate taxpayers, the fund hereby designates $2,278,022, or up to the maximum amount
allowable, of ordinary income distributions paid during the fiscal year ended December 31, 2021 as
qualified for the corporate dividends received deduction.
The fund hereby designates $14,670,818, or up to the maximum amount allowable, as long-term capital gain distributions (20% rate gain distributions) for the fiscal year ended December 31, 2021.
The fund hereby designates $2,115,529 as qualified short-term capital gain distributions for purposes of Internal Revenue Code Section 871 for the fiscal year ended December 31, 2021.
| | | | | | | | |
| |
| | |
| Contact Us | americancentury.com | |
| Automated Information Line | 1-800-345-8765 | |
| Investment Professional Service Representatives | 1-800-345-6488 | |
| Telecommunications Relay Service for the Deaf | 711 | |
| | |
| American Century Variable Portfolios, Inc. | |
| | |
Investment Advisor: American Century Investment Management, Inc. Kansas City, Missouri | |
| | |
| This report and the statements it contains are submitted for the general information of our shareholders. The report is not authorized for distribution to prospective investors unless preceded or accompanied by an effective prospectus. | |
| | |
©2022 American Century Proprietary Holdings, Inc. All rights reserved.
CL-ANN-91439 2202 | |
| | | | | |
| |
| Annual Report |
| |
| December 31, 2021 |
| |
| VP Capital Appreciation Fund |
| Class I (AVCIX) |
| Class II (AVCWX) |
| Class Y (AVCYX) |
| | | | | |
| Performance | |
| Portfolio Commentary | |
| Fund Characteristics | |
| Shareholder Fee Example | |
| Schedule of Investments | |
| Statement of Assets and Liabilities | |
| Statement of Operations | |
| Statement of Changes in Net Assets | |
| Notes to Financial Statements | |
| Financial Highlights | |
| Report of Independent Registered Public Accounting Firm | |
| Management | |
| |
| |
| |
| Additional Information | |
Any opinions expressed in this report reflect those of the author as of the date of the report, and do not necessarily represent the opinions of American Century Investments® or any other person in the American Century Investments organization. Any such opinions are subject to change at any time based upon market or other conditions and American Century Investments disclaims any responsibility to update such opinions. These opinions may not be relied upon as investment advice and, because investment decisions made by American Century Investments funds are based on numerous factors, may not be relied upon as an indication of trading intent on behalf of any American Century Investments fund. Security examples are used for representational purposes only and are not intended as recommendations to purchase or sell securities. Performance information for comparative indices and securities is provided to American Century Investments by third party vendors. To the best of American Century Investments’ knowledge, such information is accurate at the time of printing.
| | | | | | | | | | | | | | | | | | | | |
| Total Returns as of December 31, 2021 |
| | | Average Annual Returns | |
| Ticker
Symbol | 1 year | 5 years | 10 years | Since
Inception | Inception
Date |
| Class I | AVCIX | 11.16% | 19.89% | 15.64% | — | 11/20/87 |
| Russell Midcap Growth Index | — | 12.73% | 19.82% | 16.61% | — | — |
| Class II | AVCWX | 11.05% | 19.73% | — | 14.64% | 4/25/14 |
| Class Y | AVCYX | 11.57% | — | — | 20.29% | 9/22/17 |
Average annual returns since inception are presented when ten years of performance history is not available. Fund returns would have been lower if a portion of the fees had not been waived.
The performance information presented does not include the fees and charges assessed with investments in variable insurance products, those charges are disclosed in the separate account prospectus. The inclusion of such fees and charges would lower performance.
Data presented reflect past performance. Past performance is no guarantee of future results. Current performance may be higher or lower than the performance shown. Total returns for periods less than one year are not annualized. Investment return and principal value will fluctuate, and redemption value may be more or less than original cost. Data assumes reinvestment of dividends and capital gains, and none of the charts reflect the deduction of taxes that a shareholder would pay on fund distributions or the redemption of fund shares. To obtain performance data current to the most recent month end, please call 1-800-345-6488 or visit ipro.americancentury.com (for Investment Professionals). For additional information about the fund, please consult the prospectus.
| | |
| Growth of $10,000 Over 10 Years |
| $10,000 investment made December 31, 2011 |
| Performance for other share classes will vary due to differences in fee structure. |
| | | | | |
| Value on December 31, 2021 |
| Class I — $42,833 |
|
| Russell Midcap Growth Index — $46,550 |
|
| |
|
| |
|
Ending value of Class I would have been lower if a portion of the fees had not been waived.
| | | | | | | | |
| Total Annual Fund Operating Expenses | |
| Class I | Class II | Class Y |
| 1.00% | 1.15% | 0.65% |
The total annual fund operating expenses shown is as stated in the fund’s prospectus current as of the date of this report. The prospectus may vary from the expense ratio shown elsewhere in this report because it is based on a different time period, includes acquired fund fees and expenses, and, if applicable, does not include fee waivers or expense reimbursements.
Data presented reflect past performance. Past performance is no guarantee of future results. Current performance may be higher or lower than the performance shown. Total returns for periods less than one year are not annualized. Investment return and principal value will fluctuate, and redemption value may be more or less than original cost. Data assumes reinvestment of dividends and capital gains, and none of the charts reflect the deduction of taxes that a shareholder would pay on fund distributions or the redemption of fund shares. To obtain performance data current to the most recent month end, please call 1-800-345-6488 or visit ipro.americancentury.com (for Investment Professionals). For additional information about the fund, please consult the prospectus.
Portfolio Managers: Rob Brookby and Nalin Yogasundram
Performance Summary
VP Capital Appreciation returned 11.16%* for the 12 months ended December 31, 2021, lagging the 12.73% return of the fund’s benchmark, the Russell Midcap Growth Index.
U.S. stocks posted strong returns during the reporting period, supported by federal government stimulus and low interest rates. The rollout of COVID-19 vaccines allowed the economy to reopen, and despite concerns about the coronavirus variants, inflationary pressures and supply chain constraints, several market indices ended the 12-month period near record highs. Mid-cap value stocks significantly outpaced growth stocks, largely due to investors transitioning to defensive stocks during the fourth quarter.
The health care and consumer discretionary sectors detracted from performance relative to the benchmark due primarily to stock selection. Stock choices in the information technology and materials sectors contributed positively.
Health Care Stocks Detracted
Stock choices in the health care sector weighed on performance. Biotechnology company Moderna outperformed on the success of its COVID-19 vaccine. Moderna’s messenger RNA technology is also seen as having potentially wider applications. Our lack of exposure detracted from relative results. Home health and hospice care provider Amedisys lagged after it offered disappointing forward guidance as the pandemic hurt its ability to hire and retain staff.
Other key detractors included Las Vegas Sands, an operator of casino resorts in Macau and Singapore. The stock was pressured by possible new dividend regulations in Macau that would be harmful to shareholders and concerns about China’s increasing interference in certain sectors. We eliminated our holding because of these uncertainties. SelectQuote offers consumers a platform to compare insurance policies. SelectQuote and the insurance industry in general have struggled with plan persistency, the percentage of policyholders that continue paying premiums. As a result, SelectQuote offered disappointing guidance for next year. We sold our holding.
An underweight allocation to Xilinx relative to the benchmark detracted. The programmable logic device maker outperformed amid strong business results. Xilinx also received a boost from news that it would be acquired by Advanced Micro Devices in a deal that is expected to close early in 2022. We sold our holding. Coupa Software, a cost management software company, lagged despite reporting strong revenue and earnings. Like many technology stocks that performed well in 2020, Coupa was a victim of investors shifting from high-growth to cyclical stocks early in 2021.
Information Technology Stocks Were Top Contributors
Stock selection in the software industry helped drive the information technology sector outperformance relative to the benchmark, and many top contributors came from the industry. HubSpot provides software that allows small businesses to efficiently run and grow their businesses. It offers innovative solutions, and HubSpot benefited from growth in small business formation coming out of the recession, providing a tailwind of new customer acquisition. Atlassian provides collaborative tools used by small and midsized companies and increasingly larger companies. As pandemic restrictions eased and workers started returning to the office, Atlassian
*All fund returns referenced in this commentary are for Class I shares. Fund returns would have been lower if a portion of the fees had not been waived. Performance for other share classes will vary due to differences in fee structure; when Class I performance exceeds that of the fund’s benchmark, other share classes may not. See page 2 for returns for all share classes.
saw renewed growth for its software, driving strong revenue and earnings. Cybersecurity firm Palo
Alto Networks outperformed as companies beefed up their vigilance because of increasing ransomware and other attacks. Demand for Palo Alto’s firewalls and other cloud-based offerings led to strong earnings, and management raised guidance. Manhattan Associates provides cloud-based supply chain management software. The company reported better-than-expected quarterly earnings throughout the year. Manhattan Associates benefited from the restrictions due to the pandemic, and we believe the transition to online buying and curbside pickup are secular trends that fit with the company’s strengths.
Elsewhere in information technology, revenue exceeded expectations in the most recent quarter for Arista Networks, which sells data center networking equipment. Arista is benefiting from the pandemic-driven increase in software and internet adoption, which now requires a similar level of investment in infrastructure. Marvell Technology sells semiconductor chips to a variety of enterprises. Marvell is starting to see the benefit of several years of investment in leading-edge technology as growth rates accelerate in 5G, data center and automobiles. The stock outperformed because its guidance for the next two years was much better than expected.
Stock selection in the materials sector aided performance. Materials in general benefited from greater demand and firmer pricing due to global supply chain disruptions. Stock decisions in the chemicals industry helped drive outperformance in the sector. Albemarle was a top contributor on demand for lithium, a key ingredient of batteries for electric vehicles. In industrials, a position in U.K.-based electrical equipment company nVent Electric was a meaningful contributor to relative results. Management raised guidance at its most recent quarterly report.
Outlook
Our process uses a combined top-down, bottom-up fundamental framework aimed at identifying mid-cap companies producing attractive, sustainable growth. We seek to reduce unintended, nonfundamental risks and align the portfolio with fundamental, company-specific risks that we believe will be rewarded over time. As a result of this approach, our sector and industry allocations reflect where we are finding opportunities at a given time.
At year-end, the portfolio was positioned toward secular trends. We see longer-term opportunities in infrastructure build-out, cyber security, decarbonization, automation and the emergence of newer themes such as the metaverse.
| | | | | |
| DECEMBER 31, 2021 |
| Types of Investments in Portfolio | % of net assets |
| Common Stocks | 99.2% |
| Temporary Cash Investments | 0.7% |
| Temporary Cash Investments - Securities Lending Collateral | 0.6% |
| Other Assets and Liabilities | (0.5)% |
| |
| Top Five Industries | % of net assets |
| Software | 17.4% |
| Life Sciences Tools and Services | 6.5% |
| Electrical Equipment | 5.9% |
| Health Care Equipment and Supplies | 5.2% |
| Semiconductors and Semiconductor Equipment | 5.0% |
Fund shareholders may incur two types of costs: (1) transaction costs, including sales charges (loads) on purchase payments and redemption/exchange fees; and (2) ongoing costs, including management fees; distribution and service (12b-1) fees; and other fund expenses. This example is intended to help you understand your ongoing costs (in dollars) of investing in your fund and to compare these costs with the ongoing cost of investing in other mutual funds.
The example is based on an investment of $1,000 made at the beginning of the period and held for the entire period from July 1, 2021 to December 31, 2021.
Actual Expenses
The table provides information about actual account values and actual expenses for each class. You may use the information, together with the amount you invested, to estimate the expenses that you paid over the period. First, identify the share class you own. Then simply divide your account value by $1,000 (for example, an $8,600 account value divided by $1,000 = 8.6), then multiply the result by the number under the heading “Expenses Paid During Period” to estimate the expenses you paid on your account during this period.
Hypothetical Example for Comparison Purposes
The table also provides information about hypothetical account values and hypothetical expenses based on the actual expense ratio of each class of your fund and an assumed rate of return of 5% per year before expenses, which is not the actual return of a fund’s share class. The hypothetical account values and expenses may not be used to estimate the actual ending account balance or expenses you paid for the period. You may use this information to compare the ongoing costs of investing in your fund and other funds. To do so, compare this 5% hypothetical example with the 5% hypothetical examples that appear in the shareholder reports of the other funds.
Please note that the expenses shown in the table are meant to highlight your ongoing costs only and do not reflect any transactional costs, such as sales charges (loads) or redemption/exchange fees. Therefore, the table is useful in comparing ongoing costs only, and will not help you determine the relative total costs of owning different funds. In addition, if these transactional costs were included, your costs would have been higher.
| | | | | | | | | | | | | | |
| Beginning
Account Value
7/1/21 | Ending
Account Value
12/31/21 | Expenses Paid During Period(1) 7/1/21 - 12/31/21 | Annualized Expense Ratio(1) |
| Actual | | | | |
| Class I | $1,000 | $1,019.60 | $4.63 | 0.91% |
| Class II | $1,000 | $1,018.90 | $5.39 | 1.06% |
| Class Y | $1,000 | $1,021.50 | $2.85 | 0.56% |
| Hypothetical | | | | |
| Class I | $1,000 | $1,020.62 | $4.63 | 0.91% |
| Class II | $1,000 | $1,019.86 | $5.40 | 1.06% |
| Class Y | $1,000 | $1,022.38 | $2.85 | 0.56% |
(1)Expenses are equal to the class's annualized expense ratio listed in the table above, multiplied by the average account value over the period, multiplied by 184, the number of days in the most recent fiscal half-year, divided by 365, to reflect the one-half year period. Annualized expense ratio reflects actual expenses, including any applicable fee waivers or expense reimbursements and excluding any acquired fund fees and expenses.
DECEMBER 31, 2021
| | | | | | | | |
| Shares | Value |
| COMMON STOCKS — 99.2% |
|
|
| Aerospace and Defense — 0.9% | | |
| HEICO Corp. | 41,699 | | $ | 6,013,830 | |
| Auto Components — 1.8% | | |
Aptiv plc(1) | 70,765 | | 11,672,687 | |
| Beverages — 0.5% | | |
Celsius Holdings, Inc.(1) | 46,550 | | 3,471,233 | |
| Biotechnology — 3.3% | | |
Alnylam Pharmaceuticals, Inc.(1) | 39,580 | | 6,711,977 | |
Horizon Therapeutics plc(1) | 76,736 | | 8,269,071 | |
Natera, Inc.(1) | 44,350 | | 4,141,847 | |
Turning Point Therapeutics, Inc.(1) | 45,869 | | 2,187,951 | |
| | 21,310,846 | |
| Building Products — 2.7% | | |
| Trane Technologies plc | 61,202 | | 12,364,640 | |
| Zurn Water Solutions Corp. | 149,956 | | 5,458,398 | |
| | 17,823,038 | |
| Capital Markets — 4.2% | | |
| LPL Financial Holdings, Inc. | 98,742 | | 15,807,607 | |
| MSCI, Inc. | 19,295 | | 11,821,853 | |
| | 27,629,460 | |
| Chemicals — 1.8% | | |
| Albemarle Corp. | 19,863 | | 4,643,373 | |
| Element Solutions, Inc. | 292,906 | | 7,111,758 | |
| | 11,755,131 | |
| Communications Equipment — 4.9% | | |
Arista Networks, Inc.(1) | 130,537 | | 18,764,694 | |
F5, Inc.(1) | 55,009 | | 13,461,252 | |
| | 32,225,946 | |
| Containers and Packaging — 2.8% | | |
| Avery Dennison Corp. | 56,250 | | 12,182,063 | |
| Ball Corp. | 63,608 | | 6,123,542 | |
| | 18,305,605 | |
| Electrical Equipment — 5.9% | | |
| AMETEK, Inc. | 75,973 | | 11,171,070 | |
Generac Holdings, Inc.(1) | 13,439 | | 4,729,453 | |
| nVent Electric plc | 176,860 | | 6,720,680 | |
Plug Power, Inc.(1) | 86,696 | | 2,447,428 | |
| Regal Rexnord Corp. | 48,227 | | 8,207,271 | |
| Rockwell Automation, Inc. | 15,807 | | 5,514,272 | |
| | 38,790,174 | |
| Electronic Equipment, Instruments and Components — 4.1% | | |
| Cognex Corp. | 110,708 | | 8,608,654 | |
Keysight Technologies, Inc.(1) | 87,138 | | 17,994,868 | |
| | 26,603,522 | |
| Entertainment — 2.3% | | |
Live Nation Entertainment, Inc.(1) | 50,743 | | 6,073,430 | |
ROBLOX Corp., Class A(1) | 25,692 | | 2,650,387 | |
| | | | | | | | |
| Shares | Value |
Roku, Inc.(1) | 28,056 | | $ | 6,402,379 | |
| | 15,126,196 | |
| Health Care Equipment and Supplies — 5.2% | | |
Align Technology, Inc.(1) | 8,207 | | 5,393,476 | |
DexCom, Inc.(1) | 20,356 | | 10,930,154 | |
IDEXX Laboratories, Inc.(1) | 20,684 | | 13,619,587 | |
| Teleflex, Inc. | 11,608 | | 3,812,996 | |
| | 33,756,213 | |
| Health Care Providers and Services — 1.2% | | |
Amedisys, Inc.(1) | 27,301 | | 4,419,486 | |
R1 RCM, Inc.(1) | 141,658 | | 3,610,862 | |
| | 8,030,348 | |
| Health Care Technology — 1.5% | | |
Veeva Systems, Inc., Class A(1) | 38,340 | | 9,795,103 | |
| Hotels, Restaurants and Leisure — 5.0% | | |
Airbnb, Inc., Class A(1) | 33,420 | | 5,564,096 | |
Chipotle Mexican Grill, Inc.(1) | 6,408 | | 11,202,786 | |
Hilton Worldwide Holdings, Inc.(1) | 100,327 | | 15,650,009 | |
| | 32,416,891 | |
| Interactive Media and Services — 2.0% | | |
Match Group, Inc.(1) | 65,176 | | 8,619,526 | |
Pinterest, Inc., Class A(1) | 127,546 | | 4,636,297 | |
| | 13,255,823 | |
| Internet and Direct Marketing Retail — 1.7% | | |
Chewy, Inc., Class A(1)(2) | 69,933 | | 4,123,949 | |
Etsy, Inc.(1) | 32,779 | | 7,176,634 | |
| | 11,300,583 | |
| IT Services — 4.9% | | |
Block, Inc.(1) | 25,274 | | 4,082,004 | |
Cloudflare, Inc., Class A(1) | 43,417 | | 5,709,336 | |
EPAM Systems, Inc.(1) | 16,112 | | 10,770,066 | |
Okta, Inc.(1) | 39,688 | | 8,896,859 | |
Twilio, Inc., Class A(1) | 10,786 | | 2,840,385 | |
| | 32,298,650 | |
| Leisure Products — 0.3% | | |
Peloton Interactive, Inc., Class A(1) | 47,114 | | 1,684,797 | |
| Life Sciences Tools and Services — 6.5% | | |
10X Genomics, Inc., Class A(1) | 30,459 | | 4,537,173 | |
| Agilent Technologies, Inc. | 54,659 | | 8,726,309 | |
| Bio-Techne Corp. | 17,761 | | 9,188,476 | |
Mettler-Toledo International, Inc.(1) | 8,288 | | 14,066,476 | |
Repligen Corp.(1) | 22,557 | | 5,973,996 | |
| | 42,492,430 | |
| Machinery — 2.8% | | |
| Graco, Inc. | 72,237 | | 5,823,747 | |
| Parker-Hannifin Corp. | 38,986 | | 12,402,226 | |
| | 18,225,973 | |
| Professional Services — 3.5% | | |
CoStar Group, Inc.(1) | 69,150 | | 5,464,924 | |
| Jacobs Engineering Group, Inc. | 72,021 | | 10,027,484 | |
| Verisk Analytics, Inc. | 33,211 | | 7,596,352 | |
| | 23,088,760 | |
| | | | | | | | |
| Shares | Value |
| Road and Rail — 0.5% | | |
Lyft, Inc., Class A(1) | 75,591 | | $ | 3,230,003 | |
| Semiconductors and Semiconductor Equipment — 5.0% | | |
Enphase Energy, Inc.(1) | 42,533 | | 7,780,987 | |
| Marvell Technology, Inc. | 168,829 | | 14,770,849 | |
| Monolithic Power Systems, Inc. | 8,384 | | 4,136,079 | |
| Skyworks Solutions, Inc. | 40,647 | | 6,305,976 | |
| | 32,993,891 | |
| Software — 17.4% | | |
Atlassian Corp. plc, Class A(1) | 27,701 | | 10,562,114 | |
Autodesk, Inc.(1) | 22,321 | | 6,276,442 | |
Cadence Design Systems, Inc.(1) | 127,214 | | 23,706,329 | |
Coupa Software, Inc.(1) | 11,161 | | 1,763,996 | |
Datadog, Inc., Class A(1) | 45,185 | | 8,047,900 | |
DocuSign, Inc.(1) | 50,093 | | 7,629,665 | |
HubSpot, Inc.(1) | 15,681 | | 10,336,131 | |
Manhattan Associates, Inc.(1) | 80,541 | | 12,523,320 | |
Palantir Technologies, Inc., Class A(1) | 423,788 | | 7,717,180 | |
Palo Alto Networks, Inc.(1) | 45,224 | | 25,178,914 | |
| | 113,741,991 | |
| Specialty Retail — 3.5% | | |
Burlington Stores, Inc.(1) | 25,773 | | 7,513,087 | |
Carvana Co.(1) | 23,645 | | 5,480,675 | |
Five Below, Inc.(1) | 19,753 | | 4,086,698 | |
Floor & Decor Holdings, Inc., Class A(1) | 41,993 | | 5,459,510 | |
| | 22,539,970 | |
| Textiles, Apparel and Luxury Goods — 1.7% | | |
lululemon athletica, Inc.(1) | 28,997 | | 11,350,876 | |
| Trading Companies and Distributors — 1.3% | | |
| W.W. Grainger, Inc. | 16,083 | | 8,334,854 | |
TOTAL COMMON STOCKS (Cost $421,410,198) | | 649,264,824 | |
| TEMPORARY CASH INVESTMENTS — 0.7% |
|
|
| Repurchase Agreement, BMO Capital Markets Corp., (collateralized by various U.S. Treasury obligations, 2.00% - 2.375%, 4/30/24 - 5/15/51, valued at $1,000,173), in a joint trading account at 0.01%, dated 12/31/21, due 1/3/22 (Delivery value $980,345) | | 980,344 | |
| Repurchase Agreement, Fixed Income Clearing Corp., (collateralized by various U.S. Treasury obligations, 3.125%, 8/15/44, valued at $3,334,431), at 0.01%, dated 12/31/21, due 1/3/22 (Delivery value $3,269,003) | | 3,269,000 | |
| State Street Institutional U.S. Government Money Market Fund, Premier Class | 848,979 | | 848,979 | |
TOTAL TEMPORARY CASH INVESTMENTS (Cost $5,098,323) | | 5,098,323 | |
TEMPORARY CASH INVESTMENTS - SECURITIES LENDING COLLATERAL(3) — 0.6% |
State Street Navigator Securities Lending Government Money Market Portfolio (Cost $3,687,180) | 3,687,180 | | 3,687,180 | |
TOTAL INVESTMENT SECURITIES — 100.5% (Cost $430,195,701) |
| 658,050,327 | |
| OTHER ASSETS AND LIABILITIES — (0.5)% |
| (3,591,788) | |
| TOTAL NET ASSETS — 100.0% |
| $ | 654,458,539 | |
| | | | | | | | |
| NOTES TO SCHEDULE OF INVESTMENTS |
(1)Non-income producing.
(2)Security, or a portion thereof, is on loan. At the period end, the aggregate value of securities on loan was $3,871,557. The amount of securities on loan indicated may not correspond with the securities on loan identified because securities with pending sales are in the process of recall from the brokers.
(3)Investment of cash collateral from securities on loan. At the period end, the aggregate value of the collateral held by the fund was $3,957,961, which includes securities collateral of $270,781.
See Notes to Financial Statements.
| | |
| Statement of Assets and Liabilities |
| | | | | |
| DECEMBER 31, 2021 | |
| Assets |
| Investment securities, at value (cost of $426,508,521) — including $3,871,557 of securities on loan | $ | 654,363,147 | |
Investment made with cash collateral received for securities on loan, at value
(cost of $3,687,180) | 3,687,180 | |
| Total investment securities, at value (cost of $430,195,701) | 658,050,327 | |
| Cash | 36,101 | |
| Receivable for investments sold | 328,077 | |
| Receivable for capital shares sold | 161,265 | |
| Dividends and interest receivable | 29,416 | |
| Securities lending receivable | 657 | |
| 658,605,843 | |
| |
| Liabilities | |
| Payable for collateral received for securities on loan | 3,687,180 | |
| Payable for capital shares redeemed | 114,924 | |
| Accrued management fees | 344,076 | |
| Distribution fees payable | 1,124 | |
| 4,147,304 | |
| |
| Net Assets | $ | 654,458,539 | |
| |
| Net Assets Consist of: | |
| Capital (par value and paid-in surplus) | $ | 361,079,776 | |
| Distributable earnings | 293,378,763 | |
| $ | 654,458,539 | |
| | | | | | | | | | | |
| Net Assets | Shares Outstanding | Net Asset Value Per Share |
| Class I, $0.01 Par Value | $121,049,820 | 6,471,389 | $18.71 |
| Class II, $0.01 Par Value | $5,484,754 | 298,556 | $18.37 |
| Class Y, $0.01 Par Value | $527,923,965 | 27,739,275 | $19.03 |
See Notes to Financial Statements.
| | | | | |
| YEAR ENDED DECEMBER 31, 2021 |
| Investment Income (Loss) |
| Income: | |
| Dividends (net of foreign taxes withheld of $1,665) | $ | 1,804,270 | |
| Securities lending, net | 7,041 | |
| Interest | 1,173 | |
| 1,812,484 | |
| |
| Expenses: | |
| Management fees | 4,824,346 | |
| Distribution fees - Class II | 10,774 | |
| Directors' fees and expenses | 17,009 | |
| Other expenses | 547 | |
| 4,852,676 | |
Fees waived(1) | (511,011) | |
| 4,341,665 | |
| |
| Net investment income (loss) | (2,529,181) | |
| |
| Realized and Unrealized Gain (Loss) | |
| Net realized gain (loss) on: | |
| Investment transactions | 69,060,641 | |
| Forward foreign currency exchange contract transactions | 522,599 | |
| Foreign currency translation transactions | (4,592) | |
| 69,578,648 | |
| |
| Change in net unrealized appreciation (depreciation) on: | |
| Investments | 6,832,637 | |
| Forward foreign currency exchange contracts | 46,962 | |
| Translation of assets and liabilities in foreign currencies | (166) | |
| 6,879,433 | |
| |
| Net realized and unrealized gain (loss) | 76,458,081 | |
| |
| Net Increase (Decrease) in Net Assets Resulting from Operations | $ | 73,928,900 | |
(1)Amount consists of $92,786, $3,229 and $414,996 for Class I, Class II and Class Y, respectively.
See Notes to Financial Statements.
| | |
| Statement of Changes in Net Assets |
| | | | | | | | |
| YEARS ENDED DECEMBER 31, 2021 AND DECEMBER 31, 2020 |
| Increase (Decrease) in Net Assets | December 31, 2021 | December 31, 2020 |
| Operations | | |
| Net investment income (loss) | $ | (2,529,181) | | $ | (616,522) | |
| Net realized gain (loss) | 69,578,648 | | 81,835,893 | |
| Change in net unrealized appreciation (depreciation) | 6,879,433 | | 118,630,088 | |
| Net increase (decrease) in net assets resulting from operations | 73,928,900 | | 199,849,459 | |
| | |
| Distributions to Shareholders | | |
| From earnings: | | |
| Class I | (14,793,552) | | (10,198,085) | |
| Class II | (282,053) | | (167,591) | |
| Class Y | (66,710,745) | | (46,364,992) | |
| Decrease in net assets from distributions | (81,786,350) | | (56,730,668) | |
| | |
| Capital Share Transactions | | |
| Net increase (decrease) in net assets from capital share transactions (Note 5) | (10,387,527) | | 10,955,847 | |
| | |
| Net increase (decrease) in net assets | (18,244,977) | | 154,074,638 | |
| | |
| Net Assets | | |
| Beginning of period | 672,703,516 | | 518,628,878 | |
| End of period | $ | 654,458,539 | | $ | 672,703,516 | |
See Notes to Financial Statements.
| | |
| Notes to Financial Statements |
DECEMBER 31, 2021
1. Organization
American Century Variable Portfolios, Inc. (the corporation) is registered under the Investment Company Act of 1940, as amended (the 1940 Act), as an open-end management investment company and is organized as a Maryland corporation. VP Capital Appreciation Fund (the fund) is one fund in a series issued by the corporation. The fund’s investment objective is to seek capital growth. The fund offers Class I, Class II and Class Y.
2. Significant Accounting Policies
The following is a summary of significant accounting policies consistently followed by the fund in preparation of its financial statements. The fund is an investment company and follows accounting and reporting guidance in accordance with accounting principles generally accepted in the United States of America. This may require management to make certain estimates and assumptions at the date of the financial statements. Actual results could differ from these estimates. Management evaluated the impact of events or transactions occurring through the date the financial statements were issued that would merit recognition or disclosure.
Investment Valuations — The fund determines the fair value of its investments and computes its net asset value (NAV) per share at the close of regular trading (usually 4 p.m. Eastern time) on the New York Stock Exchange (NYSE) on each day the NYSE is open. The Board of Directors has adopted valuation policies and procedures to guide the investment advisor in the fund’s investment valuation process and to provide methodologies for the oversight of the fund’s pricing function.
Equity securities that are listed or traded on a domestic securities exchange are valued at the last reported sales price or at the official closing price as provided by the exchange. Equity securities traded on foreign securities exchanges are generally valued at the closing price of such securities on the exchange where primarily traded or at the close of the NYSE, if that is earlier. If no last sales price is reported, or if local convention or regulation so provides, the mean of the latest bid and asked prices may be used. Securities traded over-the-counter are valued at the mean of the latest bid and asked prices, the last sales price, or the official closing price. Equity securities initially expressed in local currencies are translated into U.S. dollars at the mean of the appropriate currency exchange rate at the close of the NYSE as provided by an independent pricing service.
Open-end management investment companies are valued at the reported NAV per share. Repurchase agreements are valued at cost, which approximates fair value. Forward foreign currency exchange contracts are valued at the mean of the appropriate forward exchange rate at the close of the NYSE as provided by an independent pricing service.
If the fund determines that the market price for an investment is not readily available or the valuation methods mentioned above do not reflect an investment’s fair value, such investment is valued as determined in good faith by the Board of Directors or its delegate, in accordance with policies and procedures adopted by the Board of Directors. In its determination of fair value, the fund may review several factors including, but not limited to, market information regarding the specific investment or comparable investments and correlation with other investment types, futures indices or general market indicators. Circumstances that may cause the fund to use these procedures to value an investment include, but are not limited to: an investment has been declared in default or is distressed; trading in a security has been suspended during the trading day or a security is not actively trading on its principal exchange; prices received from a regular pricing source are deemed unreliable; or there is a foreign market holiday and no trading occurred.
The fund monitors for significant events occurring after the close of an investment’s primary exchange but before the fund’s NAV per share is determined. Significant events may include, but are not limited to: corporate announcements and transactions; governmental action and political unrest that could impact a specific investment or an investment sector; or armed conflicts, natural disasters and similar events that could affect investments in a specific country or region. The fund also monitors for significant fluctuations between domestic and foreign markets, as evidenced by the U.S. market or such other indicators that the Board of Directors, or its delegate, deems appropriate. The fund may apply a model-derived factor to the closing price of equity securities traded on foreign securities exchanges. The factor is based on observable market data as provided by an independent pricing service.
Security Transactions — Security transactions are accounted for as of the trade date. Net realized gains and losses are determined on the identified cost basis, which is also used for federal income tax purposes.
Investment Income — Dividend income less foreign taxes withheld, if any, is recorded as of the ex-dividend date. Distributions received on securities that represent a return of capital or long-term capital gain are recorded as a reduction of cost of investments and/or as a realized gain. The fund may estimate the components of distributions received that may be considered nontaxable distributions or long-term capital gain distributions for income tax purposes. Interest income is recorded on the accrual basis and includes accretion of discounts and amortization of premiums. Securities lending income is net of fees and rebates earned by the lending agent for its services.
Foreign Currency Translations — All assets and liabilities initially expressed in foreign currencies are translated into U.S. dollars at prevailing exchange rates at period end. The fund may enter into spot foreign currency exchange contracts to facilitate transactions denominated in a foreign currency. Purchases and sales of investment securities, dividend and interest income, spot foreign currency exchange contracts, and expenses are translated at the rates of exchange prevailing on the respective dates of such transactions. Net realized and unrealized foreign currency exchange gains or losses related to investment securities are a component of net realized gain (loss) on investment transactions and change in net unrealized appreciation (depreciation) on investments, respectively.
Repurchase Agreements — The fund may enter into repurchase agreements with institutions that American Century Investment Management, Inc. (ACIM) (the investment advisor) has determined are creditworthy pursuant to criteria adopted by the Board of Directors. The fund requires that the collateral, represented by securities, received in a repurchase transaction be transferred to the custodian in a manner sufficient to enable the fund to obtain those securities in the event of a default under the repurchase agreement. ACIM monitors, on a daily basis, the securities transferred to ensure the value, including accrued interest, of the securities under each repurchase agreement is equal to or greater than amounts owed to the fund under each repurchase agreement.
Joint Trading Account — Pursuant to an Exemptive Order issued by the Securities and Exchange Commission, the fund, along with certain other funds in the American Century Investments family of funds, may transfer uninvested cash balances into a joint trading account. These balances are invested in one or more repurchase agreements that are collateralized by U.S. Treasury or Agency obligations.
Segregated Assets — In accordance with the 1940 Act, the fund segregates assets on its books and records to cover certain types of investment securities and other financial instruments. ACIM monitors, on a daily basis, the securities segregated to ensure the fund designates a sufficient amount of liquid assets, marked-to-market daily. The fund may also receive assets or be required to pledge assets at the custodian bank or with a broker for collateral requirements.
Income Tax Status — It is the fund’s policy to distribute substantially all net investment income and net realized gains to shareholders and to otherwise qualify as a regulated investment company under provisions of the Internal Revenue Code. Accordingly, no provision has been made for income taxes. The fund files U.S. federal, state, local and non-U.S. tax returns as applicable. The fund's tax returns are subject to examination by the relevant taxing authority until expiration of the applicable statute of limitations, which is generally three years from the date of filing but can be longer in certain jurisdictions. At this time, management believes there are no uncertain tax positions which, based on their technical merit, would not be sustained upon examination and for which it is reasonably possible that the total amounts of unrecognized tax benefits will significantly change in the next twelve months.
Multiple Class — All shares of the fund represent an equal pro rata interest in the net assets of the class to which such shares belong, and have identical voting, dividend, liquidation and other rights and the same terms and conditions, except for class specific expenses and exclusive rights to vote on matters affecting only individual classes. Income, non-class specific expenses, and realized and unrealized capital gains and losses of the fund are allocated to each class of shares based on their relative net assets.
Distributions to Shareholders — Distributions from net investment income and net realized gains, if any, are generally declared and paid annually.
Indemnifications — Under the corporation’s organizational documents, its officers and directors are indemnified against certain liabilities arising out of the performance of their duties to the fund. In addition, in the normal course of business, the fund enters into contracts that provide general indemnifications. The maximum exposure under these arrangements is unknown as this would involve future claims that may be made against a fund. The risk of material loss from such claims is considered by management to be remote.
Securities Lending — Securities are lent to qualified financial institutions and brokers. State Street Bank & Trust Co. serves as securities lending agent to the fund pursuant to a Securities Lending Agreement. The lending of securities exposes the fund to risks such as: the borrowers may fail to return the loaned securities, the borrowers may not be able to provide additional collateral, the fund may experience delays in recovery of the loaned securities or delays in access to collateral, or the fund may experience losses related to the investment collateral. To minimize certain risks, loan counterparties pledge collateral in the form of cash and/or securities. The lending agent has agreed to indemnify the fund in the case of default of any securities borrowed. Cash collateral received is invested in the State Street Navigator Securities Lending Government Money Market Portfolio, a money market mutual fund registered under the 1940 Act. The loans may also be secured by U.S. government securities in an amount at least equal to the market value of the securities loaned, plus accrued interest and dividends, determined on a daily basis and adjusted accordingly. By lending securities, the fund seeks to increase its net investment income through the receipt of interest and fees. Such income is reflected separately within the Statement of Operations. The value of loaned securities and related collateral outstanding at period end, if any, are shown on a gross basis within the Schedule of Investments and Statement of Assets and Liabilities.
The following table reflects a breakdown of transactions accounted for as secured borrowings, the gross obligation by the type of collateral pledged, and the remaining contractual maturity of those transactions as of December 31, 2021.
| | | | | | | | | | | | | | | | | |
| Remaining Contractual Maturity of Agreements |
| Overnight and
Continuous | <30 days | Between
30 & 90 days | >90 days | Total |
Securities Lending Transactions(1) | | | | |
| Common Stocks | $ | 3,687,180 | | — | | — | | — | | $ | 3,687,180 | |
| Gross amount of recognized liabilities for securities lending transactions | $ | 3,687,180 | |
(1)Amount represents the payable for cash collateral received for securities on loan. This will generally be in the Overnight and Continuous column as the securities are typically callable on demand.
3. Fees and Transactions with Related Parties
Certain officers and directors of the corporation are also officers and/or directors of American Century Companies, Inc. (ACC). The corporation’s investment advisor, ACIM, the corporation's distributor, American Century Investment Services, Inc. (ACIS), and the corporation’s transfer agent, American Century Services, LLC, are wholly owned, directly or indirectly, by ACC.
Management Fees — The corporation has entered into a management agreement with ACIM, under which ACIM provides the fund with investment advisory and management services in exchange for a single, unified management fee (the fee) per class. The agreement provides that ACIM will pay all expenses of managing and operating the fund, except brokerage expenses, taxes, interest, fees and expenses of the independent directors (including legal counsel fees), extraordinary expenses, and expenses incurred in connection with the provision of shareholder services and distribution services under a plan adopted pursuant to Rule 12b-1 under the 1940 Act. The fee is computed and accrued daily based on each class's daily net assets and paid monthly in arrears. The difference in the fee among the classes is a result of their separate arrangements for non-Rule 12b-1 shareholder services. It is not the result of any difference in advisory or custodial fees or other expenses related to the management of the fund's assets, which do not vary by class. The rate of the fee is determined by applying a fee rate calculation formula. This formula takes into account the fund's assets as well as certain assets, if any, of other clients of the investment advisor outside the American Century Investments family of funds (such as subadvised funds and separate accounts) that use very similar investment teams and strategies (strategy assets). From January 1, 2021 through July 31, 2021, the investment advisor agreed to waive 0.07% of the fund's management fee. Effective August 1, 2021, the investment advisor agreed to waive 0.08% of the fund's management fee. The investment advisor expects this waiver to continue until July 31, 2022 and cannot terminate it prior to such date without the approval of the Board of Directors.
The management fee schedule range and the effective annual management fee before and after waiver for each class for the period ended December 31, 2021 are as follows:
| | | | | | | | | | | |
| | Effective Annual Management Fee |
| Management Fee Schedule Range | Before Waiver | After Waiver |
| Class I | 0.90% to 1.00% | 0.99% | 0.91% |
| Class II | 0.80% to 0.90% | 0.89% | 0.81% |
| Class Y | 0.55% to 0.65% | 0.64% | 0.56% |
Distribution Fees — The Board of Directors has adopted the Master Distribution Plan (the plan) for Class II, pursuant to Rule 12b-1 of the 1940 Act. The plan provides that Class II will pay ACIS an annual distribution fee equal to 0.25%. The fee is computed and accrued daily based on the Class II daily net assets and paid monthly in arrears. The distribution fee provides compensation for expenses incurred in connection with distributing shares of Class II including, but not limited to, payments to brokers, dealers, and financial institutions that have entered into sales agreements with respect to shares of the fund. Fees incurred under the plan during the period ended December 31, 2021 are detailed in the Statement of Operations.
Directors' Fees and Expenses — The Board of Directors is responsible for overseeing the investment advisor’s management and operations of the fund. The directors receive detailed information about the fund and its investment advisor regularly throughout the year, and meet at least quarterly with management of the investment advisor to review reports about fund operations. The fund’s officers do not receive compensation from the fund.
Interfund Transactions — The fund may enter into security transactions with other American Century Investments funds and other client accounts of the investment advisor, in accordance with the 1940 Act rules and procedures adopted by the Board of Directors. The rules and procedures require, among other things, that these transactions be effected at the independent current market price of the security. During the period, the interfund sales were $155,690 and there were no interfund purchases. The effect of interfund transactions on the Statement of Operations was $23,460 in net realized gain (loss) on investment transactions.
4. Investment Transactions
Purchases and sales of investment securities, excluding short-term investments, for the period ended December 31, 2021 were $279,653,742 and $374,370,121, respectively.
5. Capital Share Transactions
Transactions in shares of the fund were as follows:
| | | | | | | | | | | | | | |
| Year ended
December 31, 2021 | Year ended
December 31, 2020 |
| Shares | Amount | Shares | Amount |
| Class I/Shares Authorized | 195,000,000 | | | 195,000,000 | | |
| Sold | 471,668 | | $ | 8,836,272 | | 656,017 | | $ | 9,888,174 | |
| Issued in reinvestment of distributions | 891,178 | | 14,793,552 | | 996,880 | | 10,198,085 | |
| Redeemed | (1,094,548) | | (20,783,291) | | (1,098,568) | | (16,803,198) | |
| 268,298 | | 2,846,533 | | 554,329 | | 3,283,061 | |
| Class II/Shares Authorized | 25,000,000 | | | 25,000,000 | | |
| Sold | 306,608 | | 5,434,526 | | 31,386 | | 485,471 | |
| Issued in reinvestment of distributions | 17,283 | | 282,053 | | 16,610 | | 167,591 | |
| Redeemed | (143,030) | | (2,480,089) | | (19,719) | | (284,819) | |
| 180,861 | | 3,236,490 | | 28,277 | | 368,243 | |
| Class Y/Shares Authorized | 180,000,000 | | | 180,000,000 | | |
| Sold | 473,418 | | 9,202,938 | | 1,409,658 | | 23,526,949 | |
| Issued in reinvestment of distributions | 3,959,095 | | 66,710,745 | | 4,492,732 | | 46,364,992 | |
| Redeemed | (4,940,342) | | (92,384,233) | | (4,194,963) | | (62,587,398) | |
| (507,829) | | (16,470,550) | | 1,707,427 | | 7,304,543 | |
| Net increase (decrease) | (58,670) | | $ | (10,387,527) | | 2,290,033 | | $ | 10,955,847 | |
6. Fair Value Measurements
The fund’s investments valuation process is based on several considerations and may use multiple inputs to determine the fair value of the investments held by the fund. In conformity with accounting principles generally accepted in the United States of America, the inputs used to determine a valuation are classified into three broad levels.
•Level 1 valuation inputs consist of unadjusted quoted prices in an active market for identical investments.
•Level 2 valuation inputs consist of direct or indirect observable market data (including quoted prices for comparable investments, evaluations of subsequent market events, interest rates, prepayment speeds, credit risk, etc.). These inputs also consist of quoted prices for identical investments initially expressed in local currencies that are adjusted through translation into U.S. dollars.
•Level 3 valuation inputs consist of unobservable data (including a fund’s own assumptions).
The level classification is based on the lowest level input that is significant to the fair valuation measurement. The valuation inputs are not necessarily an indication of the risks associated with investing in these securities or other financial instruments.
The following is a summary of the level classifications as of period end. The Schedule of Investments provides additional information on the fund’s portfolio holdings.
| | | | | | | | | | | |
| Level 1 | Level 2 | Level 3 |
| Assets | | | |
| Investment Securities | | | |
| Common Stocks | $ | 649,264,824 | | — | | — | |
| Temporary Cash Investments | 848,979 | | $ | 4,249,344 | | — | |
| Temporary Cash Investments - Securities Lending Collateral | 3,687,180 | | — | | — | |
| $ | 653,800,983 | | $ | 4,249,344 | | — | |
7. Derivative Instruments
Foreign Currency Risk — The fund is subject to foreign currency exchange rate risk in the normal course of pursuing its investment objectives. The value of foreign investments held by a fund may be significantly affected by changes in foreign currency exchange rates. The dollar value of a foreign security generally decreases when the value of the dollar rises against the foreign currency in which the security is denominated and tends to increase when the value of the dollar declines against such foreign currency. A fund may enter into forward foreign currency exchange contracts to reduce a fund's exposure to foreign currency exchange rate fluctuations. The net U.S. dollar value of foreign currency underlying all contractual commitments held by a fund and the resulting unrealized appreciation or depreciation are determined daily. Realized gain or loss is recorded upon settlement of the contract. Net realized and unrealized gains or losses occurring during the holding period of forward foreign currency exchange contracts are a component of net realized gain (loss) on forward foreign currency exchange contract transactions and change in net unrealized appreciation (depreciation) on forward foreign currency exchange contracts, respectively. A fund bears the risk of an unfavorable change in the foreign currency exchange rate underlying the forward contract. Additionally, losses, up to the fair value, may arise if the counterparties do not perform under the contract terms. The fund's average U.S. dollar exposure to foreign currency risk derivative instruments held during the period was $11,769,248.
At period end, the fund did not have any derivative instruments disclosed on the Statement of Assets and Liabilities. For the year ended December 31, 2021, the effect of foreign currency risk derivative instruments on the Statement of Operations was $522,599 in net realized gain (loss) on forward foreign currency exchange contract transactions and $46,962 in change in net unrealized appreciation (depreciation) on forward foreign currency exchange contracts.
8. Risk Factors
The value of the fund’s shares will go up and down, sometimes rapidly or unpredictably, based on the performance of the securities owned by the fund and other factors generally affecting the securities market. Market risks, including political, regulatory, economic and social developments, can affect the value of the fund’s investments. Natural disasters, public health emergencies, terrorism and other unforeseeable events may lead to increased market volatility and may have adverse long-term effects on world economies and markets generally.
The fund invests in common stocks of small companies. Because of this, the fund may be subject to greater risk and market fluctuations than a fund investing in larger, more established companies.
9. Federal Tax Information
The tax character of distributions paid during the years ended December 31, 2021 and December 31, 2020 were as follows:
| | | | | | | | |
| 2021 | 2020 |
| Distributions Paid From | | |
| Ordinary income | $ | 5,203,323 | | $ | 412,078 | |
| Long-term capital gains | $ | 76,583,027 | | $ | 56,318,590 | |
The book-basis character of distributions made during the year from net investment income or net realized gains may differ from their ultimate characterization for federal income tax purposes. These differences reflect the differing character of certain income items and net realized gains and losses for financial statement and tax purposes, and may result in reclassification among certain capital accounts on the financial statements.
As of period end, the federal tax cost of investments and the components of distributable earnings on a tax-basis were as follows:
| | | | | |
| Federal tax cost of investments | $ | 432,220,817 | |
| Gross tax appreciation of investments | $ | 246,377,843 | |
| Gross tax depreciation of investments | (20,548,333) | |
| Net tax appreciation (depreciation) of investments | 225,829,510 | |
| Net tax appreciation (depreciation) on derivatives and translation of assets and liabilities in foreign currencies | (50) | |
| Net tax appreciation (depreciation) | $ | 225,829,460 | |
| Undistributed ordinary income | $ | 10,990,040 | |
| Accumulated long-term gains | $ | 56,559,263 | |
The difference between book-basis and tax-basis unrealized appreciation (depreciation) is attributable primarily to the tax deferral of losses on wash sales.
| | | | | | | | | | | | | | | | | | | | | | | | | | | | | | | | | | | | | | | | | | | | | | | |
| For a Share Outstanding Throughout the Years Ended December 31 (except as noted) | | | | | | | |
| Per-Share Data | | | | | | | Ratios and Supplemental Data |
| | | Income From Investment Operations: | Distributions From: | | | Ratio to Average Net Assets of: | | |
| Net Asset
Value,
Beginning
of Period | Net Investment Income (Loss)(1) | Net
Realized and Unrealized
Gain (Loss) | Total From Investment Operations | Net
Investment
Income | Net
Realized
Gains | Total
Distributions | Net Asset
Value,
End of Period | Total Return(2) | Operating
Expenses | Operating
Expenses
(before
expense
waiver) | Net
Investment
Income
(Loss) | Net
Investment
Income (Loss) (before expense waiver) | Portfolio
Turnover
Rate | Net
Assets,
End of Period
(in
thousands) |
| Class I |
| 2021 | $19.27 | (0.12) | 1.97 | 1.85 | — | (2.41) | (2.41) | $18.71 | 11.16% | 0.91% | 0.99% | (0.65)% | (0.73)% | 41% | $121,050 | |
| 2020 | $15.96 | (0.06) | 5.21 | 5.15 | — | (1.84) | (1.84) | $19.27 | 42.46% | 0.90% | 1.00% | (0.41)% | (0.51)% | 83% | $119,549 | |
| 2019 | $14.17 | (0.03) | 4.65 | 4.62 | — | (2.83) | (2.83) | $15.96 | 35.56% | 0.88% | 1.00% | (0.18)% | (0.30)% | 94% | $90,134 | |
| 2018 | $15.03 | (0.05) | (0.73) | (0.78) | — | (0.08) | (0.08) | $14.17 | (5.20)% | 0.93% | 1.00% | (0.29)% | (0.36)% | 103% | $145,373 | |
| 2017 | $13.98 | (0.02) | 2.97 | 2.95 | — | (1.90) | (1.90) | $15.03 | 21.79% | 0.99% | 1.01% | (0.15)% | (0.17)% | 58% | $157,356 | |
| Class II |
| 2021 | $18.99 | (0.14) | 1.93 | 1.79 | — | (2.41) | (2.41) | $18.37 | 11.05% | 1.06% | 1.14% | (0.80)% | (0.88)% | 41% | $5,485 | |
| 2020 | $15.78 | (0.08) | 5.13 | 5.05 | — | (1.84) | (1.84) | $18.99 | 42.29% | 1.05% | 1.15% | (0.56)% | (0.66)% | 83% | $2,235 | |
| 2019 | $14.06 | (0.05) | 4.60 | 4.55 | — | (2.83) | (2.83) | $15.78 | 35.32% | 1.03% | 1.15% | (0.33)% | (0.45)% | 94% | $1,411 | |
| 2018 | $14.94 | (0.07) | (0.73) | (0.80) | — | (0.08) | (0.08) | $14.06 | (5.36)% | 1.08% | 1.15% | (0.44)% | (0.51)% | 103% | $1,053 | |
| 2017 | $13.92 | (0.04) | 2.96 | 2.92 | — | (1.90) | (1.90) | $14.94 | 21.67% | 1.14% | 1.16% | (0.30)% | (0.32)% | 58% | $1,697 | |
| | | | | | | | | | | | | | | | | | | | | | | | | | | | | | | | | | | | | | | | | | | | | | | |
| For a Share Outstanding Throughout the Years Ended December 31 (except as noted) | | | | | | | |
| Per-Share Data | | | | | | | Ratios and Supplemental Data |
| | | Income From Investment Operations: | Distributions From: | | | Ratio to Average Net Assets of: | | |
| Net Asset
Value,
Beginning
of Period | Net Investment Income (Loss)(1) | Net
Realized and Unrealized
Gain (Loss) | Total From Investment Operations | Net
Investment
Income | Net
Realized
Gains | Total
Distributions | Net Asset
Value,
End of Period | Total Return(2) | Operating
Expenses | Operating
Expenses
(before
expense
waiver) | Net
Investment
Income
(Loss) | Net
Investment
Income (Loss) (before expense waiver) | Portfolio
Turnover
Rate | Net
Assets,
End of Period
(in
thousands) |
| Class Y |
| 2021 | $19.50 | (0.06) | 2.00 | 1.94 | — | (2.41) | (2.41) | $19.03 | 11.57% | 0.56% | 0.64% | (0.30)% | (0.38)% | 41% | $527,924 | |
| 2020 | $16.09 | (0.01) | 5.28 | 5.27 | (0.02) | (1.84) | (1.86) | $19.50 | 43.00% | 0.55% | 0.65% | (0.06)% | (0.16)% | 83% | $550,919 | |
| 2019 | $14.23 | 0.03 | 4.67 | 4.70 | (0.01) | (2.83) | (2.84) | $16.09 | 36.02% | 0.53% | 0.65% | 0.17% | 0.05% | 94% | $427,083 | |
| 2018 | $15.05 | 0.01 | (0.75) | (0.74) | — | (0.08) | (0.08) | $14.23 | (4.92)% | 0.58% | 0.65% | 0.06% | (0.01)% | 103% | $318,830 | |
2017(3) | $15.19 | 0.01 | 1.03 | 1.04 | — | (1.18) | (1.18) | $15.05 | 6.78% | 0.62%(4) | 0.66%(4) | 0.25%(4) | 0.21%(4) | 58%(5) | $366,900 | |
| | |
| Notes to Financial Highlights |
(1)Computed using average shares outstanding throughout the period.
(2)Total returns are calculated based on the net asset value of the last business day. Total returns for periods less than one year are not annualized. The total returns presented do not include the fees and charges assessed with investments in variable insurance products, those charges are disclosed in the separate account prospectus. The inclusion of such fees and charges would lower total return.
(3)September 22, 2017 (commencement of sale) through December 31, 2017.
(4)Annualized.
(5)Portfolio turnover is calculated at the fund level. Percentage indicated was calculated for the year ended December 31, 2017.
See Notes to Financial Statements.
| | |
| Report of Independent Registered Public Accounting Firm |
To the Shareholders and the Board of Directors of American Century Variable Portfolios, Inc.:
Opinion on the Financial Statements and Financial Highlights
We have audited the accompanying statement of assets and liabilities, including the schedule of investments, of VP Capital Appreciation Fund (the “Fund”), one of the funds constituting the American Century Variable Portfolios, Inc., as of December 31, 2021, the related statement of operations for the year then ended, the statements of changes in net assets for each of the two years in the period then ended, the financial highlights for each of the five years in the period then ended, and the related notes. In our opinion, the financial statements and financial highlights present fairly, in all material respects, the financial position of VP Capital Appreciation Fund of the American Century Variable Portfolios, Inc. as of December 31, 2021, and the results of its operations for the year then ended, the changes in its net assets for each of the two years in the period then ended, and the financial highlights for each of the five years in the period then ended, in conformity with accounting principles generally accepted in the United States of America.
Basis for Opinion
These financial statements and financial highlights are the responsibility of the Fund's management. Our responsibility is to express an opinion on the Fund’s financial statements and financial highlights based on our audits. We are a public accounting firm registered with the Public Company Accounting Oversight Board (United States) (PCAOB) and are required to be independent with respect to the Fund in accordance with the U.S. federal securities laws and the applicable rules and regulations of the Securities and Exchange Commission and the PCAOB.
We conducted our audits in accordance with the standards of the PCAOB. Those standards require that we plan and perform the audit to obtain reasonable assurance about whether the financial statements and financial highlights are free of material misstatement, whether due to error or fraud. The Fund is not required to have, nor were we engaged to perform, an audit of its internal control over financial reporting. As part of our audits, we are required to obtain an understanding of internal control over financial reporting but not for the purpose of expressing an opinion on the effectiveness of the Fund’s internal control over financial reporting. Accordingly, we express no such opinion.
Our audits included performing procedures to assess the risks of material misstatement of the financial statements and financial highlights, whether due to error or fraud, and performing procedures that respond to those risks. Such procedures included examining, on a test basis, evidence regarding the amounts and disclosures in the financial statements and financial highlights. Our audits also included evaluating the accounting principles used and significant estimates made by management, as well as evaluating the overall presentation of the financial statements and financial highlights. Our procedures included confirmation of securities owned as of December 31, 2021, by correspondence with the custodian and brokers; when replies were not received from brokers, we performed other auditing procedures. We believe that our audits provide a reasonable basis for our opinion.
/s/ Deloitte & Touche LLP
Kansas City, Missouri
February 10, 2022
We have served as the auditor of one or more American Century investment companies since 1997.
The Board of Directors
The individuals listed below serve as directors of the funds. Each director will continue to serve in this capacity until death, retirement, resignation or removal from office. The board has adopted a mandatory retirement age for directors who are not “interested persons,” as that term is defined in the Investment Company Act (independent directors). Independent directors shall retire on December 31 of the year in which they reach their 75th birthday.
Mr. Thomas is an “interested person” because he currently serves as President and Chief Executive Officer of American Century Companies, Inc. (ACC), the parent company of American Century Investment Management, Inc. (ACIM or the advisor). The other directors (more than three-fourths of the total number) are independent. They are not employees, directors or officers of, and have no financial interest in, ACC or any of its wholly owned, direct or indirect, subsidiaries, including ACIM, American Century Investment Services, Inc. (ACIS) and American Century Services, LLC (ACS), and they do not have any other affiliations, positions or relationships that would cause them to be considered “interested persons” under the Investment Company Act. The directors serve in this capacity for seven (in the case of Jonathan S. Thomas, 16; and Stephen E. Yates, 8) registered investment companies in the American Century Investments family of funds.
The following table presents additional information about the directors. The mailing address for each director is 4500 Main Street, Kansas City, Missouri 64111.
| | | | | | | | | | | | | | | | | |
Name
(Year of Birth) | Position(s) Held with Funds | Length of Time Served | Principal Occupation(s) During Past 5 Years | Number of American Century Portfolios Overseen by Director | Other Directorships Held During Past 5 Years |
| Independent Directors | | |
| Thomas W. Bunn (1953) | Director | Since 2017 | Retired | 72 | SquareTwo Financial |
Chris H. Cheesman
(1962)
| Director | Since 2019
| Retired. Senior Vice President & Chief Audit Executive, AllianceBernstein (1999 to 2018)
| 72 | Alleghany Corporation |
Barry Fink
(1955) | Director | Since 2012 (independent since 2016) | Retired | 72 | None |
Rajesh K. Gupta
(1960)
| Director | Since 2019
| Partner Emeritus, SeaCrest Investment Management and SeaCrest Wealth Management (2019 to Present); Chief Executive Officer and Chief Investment Officer, SeaCrest Investment Management (2006 to 2019); Chief Executive Officer and Chief Investment Officer, SeaCrest Wealth Management (2008 to 2019) | 72 | None |
| | | | | | | | | | | | | | | | | |
Name
(Year of Birth) | Position(s) Held with Funds | Length of Time Served | Principal Occupation(s) During Past 5 Years | Number of American Century Portfolios Overseen by Director | Other Directorships Held During Past 5 Years |
| Independent Directors | | |
Lynn Jenkins
(1963)
| Director | Since 2019
| Consultant, LJ Strategies (2019 to present); United States Representative, U.S. House of Representatives (2009 to 2018) | 72 | MGP Ingredients, Inc. (2019 to 2021) |
Jan M. Lewis
(1957) | Director | Since 2011 | Retired | 72 | None |
John R. Whitten(1) (1946) | Director | Since 2008 | Retired | 72 | Onto Innovation Inc. (2019 to 2020); Rudolph Technologies, Inc. (2006 to 2019) |
Stephen E. Yates
(1948) | Director and Chairman of the Board | Since 2012 (Chairman since 2018) | Retired | 108 | None |
| Interested Director | |
Jonathan S. Thomas
(1963) | Director | Since 2007 | President and Chief Executive Officer, ACC (2007 to present). Also serves as Chief Executive Officer, ACS; Director, ACC and other ACC subsidiaries | 146 | None |
(1) Effective December 31, 2021, John R. Whitten retired from the Board of Directors.
The Statement of Additional Information has additional information about the fund's directors and is available without charge, upon request, by calling 1-800-378-9878.
Officers
The following table presents certain information about the executive officers of the funds. Each officer serves as an officer for 16 (in the case of Robert J. Leach, 15) investment companies in the American Century family of funds. No officer is compensated for his or her service as an officer of the funds. The listed officers are interested persons of the funds and are appointed or re-appointed on an annual basis. The mailing address for each officer listed below is 4500 Main Street, Kansas City, Missouri 64111.
| | | | | | | | |
Name
(Year of Birth) | Offices with the Funds | Principal Occupation(s) During the Past Five Years |
Patrick Bannigan
(1965) | President since 2019 | Executive Vice President and Director, ACC (2012 to present); Chief Financial Officer, Chief Accounting Officer and Treasurer, ACC (2015 to present). Also serves as President, ACS; Vice President, ACIM; Chief Financial Officer, Chief Accounting Officer and/or Director, ACIM, ACS and other ACC subsidiaries |
R. Wes Campbell
(1974) | Chief Financial Officer and Treasurer since 2018 | Vice President, ACS, (2020 to present); Investment Operations and Investment Accounting, ACS (2000 to present) |
Amy D. Shelton
(1964) | Chief Compliance Officer and Vice President since 2014 | Chief Compliance Officer, American Century funds, (2014 to present); Chief Compliance Officer, ACIM (2014 to present); Chief Compliance Officer, ACIS (2009 to present). Also serves as Vice President, ACIS |
John Pak
(1968) | General Counsel and
Senior Vice President since 2021 | General Counsel and Senior Vice President, ACC (2021 to present); Also serves as General Counsel and Senior Vice President, ACIM, ACS and ACIS. Chief Legal Officer of Investment and Wealth Management, The Bank of New York Mellon (2014 to 2021) |
C. Jean Wade
(1964) | Vice President since 2012 | Senior Vice President, ACS (2017 to present); Vice President, ACS (2000 to 2017)
|
Robert J. Leach
(1966) | Vice President since 2006 | Vice President, ACS (2000 to present) |
David H. Reinmiller
(1963) | Vice President since 2000 | Attorney, ACC (1994 to present). Also serves as Vice President, ACIM and ACS |
Ward D. Stauffer
(1960) | Secretary since 2005 | Attorney, ACC (2003 to present) |
Proxy Voting Policies
A description of the policies that the fund's investment advisor uses in exercising the voting rights associated with the securities purchased and/or held by the fund is available without charge, upon request, by calling 1-800-378-9878. It is also available on American Century Investments’ website at americancentury.com/proxy and on the Securities and Exchange Commission’s website at sec.gov. Information regarding how the investment advisor voted proxies relating to portfolio securities during the most recent 12-month period ended June 30 is available on americancentury.com/proxy. It is also available at sec.gov.
Quarterly Portfolio Disclosure
The fund files its complete schedule of portfolio holdings with the Securities and Exchange Commission (SEC) for the first and third quarters of each fiscal year as an exhibit to its reports on Form N-PORT. These portfolio holdings are available on the fund's website at ipro.americancentury.com (for Investment Professionals) and, upon request, by calling 1-800-378-9878. The fund’s Form N-PORT reports are available on the SEC’s website at sec.gov.
Other Tax Information
The following information is provided pursuant to provisions of the Internal Revenue Code.
For corporate taxpayers, the fund hereby designates $2,107,032, or up to the maximum amount allowable, of ordinary income distributions paid during the fiscal year ended December 31, 2021 as qualified for the corporate dividends received deduction.
The fund hereby designates $76,583,027, or up to the maximum amount allowable, as long-term capital gain distributions (20% rate gain distributions) for the fiscal year ended December 31, 2021.
The fund hereby designates $5,203,323 as qualified short-term capital gain distributions for purposes of Internal Revenue Code Section 871 for the fiscal year ended December 31, 2021.
| | | | | | | | |
| |
| | |
| Contact Us | americancentury.com | |
| Automated Information Line | 1-800-345-8765 | |
| Investment Professional Service Representatives | 1-800-345-6488 | |
| Telecommunications Relay Service for the Deaf | 711 | |
| | |
| American Century Variable Portfolios, Inc. | |
| | |
Investment Advisor: American Century Investment Management, Inc. Kansas City, Missouri | |
| | |
| This report and the statements it contains are submitted for the general information of our shareholders. The report is not authorized for distribution to prospective investors unless preceded or accompanied by an effective prospectus. | |
| | |
©2022 American Century Proprietary Holdings, Inc. All rights reserved.
CL-ANN-91442 2202 | |
| | | | | |
| |
| Annual Report |
| |
| December 31, 2021 |
| |
| VP Disciplined Core Value Fund |
| Class I (AVGIX) |
| Class II (AVPGX) |
| | | | | |
| Performance | |
| Portfolio Commentary | |
| Fund Characteristics | |
| Shareholder Fee Example | |
| Schedule of Investments | |
| Statement of Assets and Liabilities | |
| Statement of Operations | |
| Statement of Changes in Net Assets | |
| Notes to Financial Statements | |
| Financial Highlights | |
| Report of Independent Registered Public Accounting Firm | |
| Management | |
| |
| |
| |
| Additional Information | |
Any opinions expressed in this report reflect those of the author as of the date of the report, and do not necessarily represent the opinions of American Century Investments® or any other person in the American Century Investments organization. Any such opinions are subject to change at any time based upon market or other conditions and American Century Investments disclaims any responsibility to update such opinions. These opinions may not be relied upon as investment advice and, because investment decisions made by American Century Investments funds are based on numerous factors, may not be relied upon as an indication of trading intent on behalf of any American Century Investments fund. Security examples are used for representational purposes only and are not intended as recommendations to purchase or sell securities. Performance information for comparative indices and securities is provided to American Century Investments by third party vendors. To the best of American Century Investments’ knowledge, such information is accurate at the time of printing.
| | | | | | | | | | | | | | | | | | |
| Total Returns as of December 31, 2021 |
| | | Average Annual Returns | |
| Ticker
Symbol | 1 year | 5 years | 10 years | | Inception
Date |
| Class I | AVGIX | 23.65% | 13.96% | 13.69% | | 10/30/97 |
| Russell 1000 Value Index | — | 25.16% | 11.16% | 12.96% | | — |
| Class II | AVPGX | 23.34% | 13.68% | 13.41% | | 5/1/02 |
The performance information presented does not include the fees and charges assessed with investments in variable insurance products, those charges are disclosed in the separate account prospectus. The inclusion of such fees and charges would lower performance.
| | |
| Growth of $10,000 Over 10 Years |
| $10,000 investment made December 31, 2011 |
| Performance for other share classes will vary due to differences in fee structure. |
| | | | | |
| Value on December 31, 2021 |
| Class I — $36,109 |
|
| Russell 1000 Value Index — $33,846 |
|
| | | | | |
| Total Annual Fund Operating Expenses |
| Class I | Class II |
| 0.70% | 0.95% |
The total annual fund operating expenses shown is as stated in the fund’s prospectus current as of the date of this report. The prospectus may vary from the expense ratio shown elsewhere in this report because it is based on a different time period, includes acquired fund fees and expenses, and, if applicable, does not include fee waivers or expense reimbursements.
Data presented reflect past performance. Past performance is no guarantee of future results. Current performance may be higher or lower than the performance shown. Total returns for periods less than one year are not annualized. Investment return and principal value will fluctuate, and redemption value may be more or less than original cost. Data assumes reinvestment of dividends and capital gains, and none of the charts reflect the deduction of taxes that a shareholder would pay on fund distributions or the redemption of fund shares. To obtain performance data current to the most recent month end, please call 1-800-345-6488 or visit ipro.americancentury.com (for Investment Professionals). For additional information about the fund, please consult the prospectus.
Portfolio Managers: Steven Rossi and Yulin Long
Performance Summary
VP Disciplined Core Value returned 23.65%* for the year ended December 31, 2021, compared with the 25.16% return of its benchmark, the Russell 1000 Value Index.
VP Disciplined Core Value’s stock selection process incorporates factors of valuation, quality, growth and sentiment, while striving to minimize unintended risks along industries and other risk characteristics. The fund’s returns were primarily driven by stock selection and allocation decisions in the financials sector. Selections in the industrials and consumer staples sectors also hindered performance. An overweight position in the health care sector and selections in the information technology sector added to relative results.
Financials Detracted Most from Performance
Selection and allocation decisions in the financials sector contributed the most to the fund’s relative performance. Although we maintained a large position in the banking industry, our underweight exposure versus the benchmark was detrimental, as banks generally benefited from rising interest rates and an improving economy. Certain selections, especially an underweight to Wells Fargo & Co., which we later exited, also weighed on returns. An underweight to the insurance industry produced an adverse effect as well, as did an overweight to Mercury General. While the company met revenue expectations, claims spiked late in the year due to extreme weather and wildfires. We eliminated the position.
The industrials sector also detracted from results, with stock selections being the primary hindrance. In the building products industry, an overweight to Owens Corning was detrimental as shares lagged late in the year on a weaker outlook for 2022. We exited this position during the period, leaving the fund with no exposure to the building products industry. In the aerospace and defense industry, an overweight position in Spirit AeroSystems Holdings detracted. The company depends heavily on The Boeing Co., especially on sales of its 737 MAX airliner, and shares experienced volatility stemming from concern about the global recovery and from uncertain demand for the airliner. We exited this position during the period. A position in Boeing that was initiated late in the year also detracted from results, as did overweight positions in certain airline stocks. In the consumer staples sector, stock selection was the primary hindrance. A slight overweight position in The Clorox Co. detracted from returns as the company’s earnings failed to match strong results during the height of the pandemic in 2020. We exited this position during the period. An underweight of The Procter & Gamble Co. was also a drag on performance. The company posted better-than-expected sales and earnings as consumers spent more on personal care products. The company noted that higher prices also benefited results. We exited this position during the period.
Health Care Added to Relative Performance
The health care sector was the primary area of strength during the reporting period, driven by health care providers and services and makers of health care equipment and supplies. Overweight positioning among several health care providers and services companies, such as HCA Healthcare, McKesson and Anthem, enhanced performance versus the benchmark. Certain underweight positions among health care equipment and supplies companies, including Medtronic, were also beneficial. On the other hand, overweight positions in Hill-Rom Holdings and Penumbra also added to returns. We exited our positions in HCA Healthcare, Medtronic, Hill-Rom Holdings and Penumbra during the period.
*All fund returns referenced in this commentary are for Class I shares. Performance for other share classes will vary due to differences in fee structure; when Class I performance exceeds that of the fund’s benchmark, other share classes may not. See page 2 for returns for all share classes.
Positioning among pharmaceuticals companies also weighed on relative results. An underweight position in Pfizer, the first U.S. pharmaceuticals company to develop and receive U.S. Food and Drug Administration approval for a highly effective coronavirus vaccine, was detrimental.
A Look Ahead
As we start 2022, global economies continue to recover from the coronavirus pandemic. We believe our disciplined investment approach is particularly beneficial during periods of likely volatility, and we adhere to our process regardless of the market environment. Our systematic investment strategy is designed to take advantage of opportunities at the individual company level. We believe this approach is the most powerful way to capitalize on market inefficiencies that lead to the mispricing of individual stocks. Our strategy is designed to provide broad U.S. equity market exposure with strong current income and risk management.
As of December 31, 2021, our largest relative exposure is in the information technology sector, where we are finding substantial opportunities in the technology, hardware, storage and peripherals and software industries. We also see compelling opportunities in the consumer discretionary and health care sectors. In consumer discretionary, we are overweight the specialty retail industry. In health care, we are overweight the health care providers and services and biotechnology industries. In contrast, we are notably underweight to financials sector stocks, particularly among insurance companies. We also find limited opportunities in the communication services sector, especially in the diversified telecommunication services and media industries.
| | | | | |
| DECEMBER 31, 2021 |
| Types of Investments in Portfolio | % of net assets |
| Common Stocks | 99.0% |
| Temporary Cash Investments | 1.0% |
| Other Assets and Liabilities | —* |
| *Category is less than 0.05% of total net assets. | |
| |
| Top Five Industries | % of net assets |
| Pharmaceuticals | 7.5% |
| Health Care Providers and Services | 7.5% |
| Banks | 6.2% |
| Capital Markets | 5.9% |
| Oil, Gas and Consumable Fuels | 5.4% |
Fund shareholders may incur two types of costs: (1) transaction costs, including sales charges (loads) on purchase payments and redemption/exchange fees; and (2) ongoing costs, including management fees; distribution and service (12b-1) fees; and other fund expenses. This example is intended to help you understand your ongoing costs (in dollars) of investing in your fund and to compare these costs with the ongoing cost of investing in other mutual funds.
The example is based on an investment of $1,000 made at the beginning of the period and held for the entire period from July 1, 2021 to December 31, 2021.
Actual Expenses
The table provides information about actual account values and actual expenses for each class. You may use the information, together with the amount you invested, to estimate the expenses that you paid over the period. First, identify the share class you own. Then simply divide your account value by $1,000 (for example, an $8,600 account value divided by $1,000 = 8.6), then multiply the result by the number under the heading “Expenses Paid During Period” to estimate the expenses you paid on your account during this period.
Hypothetical Example for Comparison Purposes
The table also provides information about hypothetical account values and hypothetical expenses based on the actual expense ratio of each class of your fund and an assumed rate of return of 5% per year before expenses, which is not the actual return of a fund’s share class. The hypothetical account values and expenses may not be used to estimate the actual ending account balance or expenses you paid for the period. You may use this information to compare the ongoing costs of investing in your fund and other funds. To do so, compare this 5% hypothetical example with the 5% hypothetical examples that appear in the shareholder reports of the other funds.
Please note that the expenses shown in the table are meant to highlight your ongoing costs only and do not reflect any transactional costs, such as sales charges (loads) or redemption/exchange fees. Therefore, the table is useful in comparing ongoing costs only, and will not help you determine the relative total costs of owning different funds. In addition, if these transactional costs were included, your costs would have been higher.
| | | | | | | | | | | | | | |
| Beginning
Account Value
7/1/21 | Ending
Account Value
12/31/21 | Expenses Paid During Period(1) 7/1/21 - 12/31/21 | Annualized Expense Ratio(1) |
| Actual |
| Class I | $1,000 | $1,062.00 | $3.64 | 0.70% |
| Class II | $1,000 | $1,060.70 | $4.93 | 0.95% |
| Hypothetical |
| Class I | $1,000 | $1,021.68 | $3.57 | 0.70% |
| Class II | $1,000 | $1,020.42 | $4.84 | 0.95% |
(1)Expenses are equal to the class's annualized expense ratio listed in the table above, multiplied by the average account value over the period, multiplied by 184, the number of days in the most recent fiscal half-year, divided by 365, to reflect the one-half year period. Annualized expense ratio reflects actual expenses, including any applicable fee waivers or expense reimbursements and excluding any acquired fund fees and expenses.
DECEMBER 31, 2021
| | | | | | | | |
| Shares | Value |
| COMMON STOCKS — 99.0% | | |
| Aerospace and Defense — 1.0% | | |
Boeing Co. (The)(1) | 18,572 | | $ | 3,738,915 | |
| General Dynamics Corp. | 4,360 | | 908,929 | |
| | 4,647,844 | |
| Air Freight and Logistics — 1.0% | | |
| FedEx Corp. | 17,604 | | 4,553,099 | |
| Auto Components — 0.3% | | |
| Magna International, Inc. | 17,171 | | 1,389,345 | |
| Automobiles — 0.9% | | |
| Ford Motor Co. | 205,685 | | 4,272,077 | |
| Banks — 6.2% | | |
| Bank of America Corp. | 202,985 | | 9,030,803 | |
| Citigroup, Inc. | 20,508 | | 1,238,478 | |
| First Horizon Corp. | 211,661 | | 3,456,424 | |
| JPMorgan Chase & Co. | 79,410 | | 12,574,574 | |
| KeyCorp | 77,148 | | 1,784,433 | |
| | 28,084,712 | |
| Biotechnology — 2.2% | | |
| AbbVie, Inc. | 72,938 | | 9,875,805 | |
| Capital Markets — 5.9% | | |
| Affiliated Managers Group, Inc. | 15,481 | | 2,546,779 | |
| Carlyle Group, Inc. (The) | 44,946 | | 2,467,535 | |
| Cboe Global Markets, Inc. | 30,626 | | 3,993,630 | |
| Intercontinental Exchange, Inc. | 21,859 | | 2,989,655 | |
| Janus Henderson Group plc | 27,735 | | 1,163,206 | |
| Jefferies Financial Group, Inc. | 61,977 | | 2,404,708 | |
| KKR & Co., Inc. | 39,589 | | 2,949,381 | |
| Morgan Stanley | 52,481 | | 5,151,535 | |
| T. Rowe Price Group, Inc. | 14,207 | | 2,793,665 | |
| | 26,460,094 | |
| Chemicals — 2.2% | | |
Axalta Coating Systems Ltd.(1) | 44,430 | | 1,471,522 | |
| Celanese Corp. | 19,312 | | 3,245,575 | |
| CF Industries Holdings, Inc. | 18,391 | | 1,301,715 | |
| Olin Corp. | 48,520 | | 2,790,870 | |
| Tronox Holdings plc, Class A | 39,002 | | 937,218 | |
| | 9,746,900 | |
| Commercial Services and Supplies — 1.0% | | |
| Waste Management, Inc. | 27,195 | | 4,538,846 | |
| Communications Equipment — 0.5% | | |
Lumentum Holdings, Inc.(1) | 19,729 | | 2,086,736 | |
| Construction and Engineering — 2.4% | | |
Dycom Industries, Inc.(1) | 9,419 | | 883,125 | |
| EMCOR Group, Inc. | 31,321 | | 3,989,982 | |
MasTec, Inc.(1) | 34,584 | | 3,191,412 | |
| Quanta Services, Inc. | 23,903 | | 2,740,718 | |
| | 10,805,237 | |
| | | | | | | | |
| Shares | Value |
| Containers and Packaging — 1.4% | | |
Berry Global Group, Inc.(1) | 25,081 | | $ | 1,850,476 | |
| International Paper Co. | 65,438 | | 3,074,277 | |
| WestRock Co. | 29,579 | | 1,312,125 | |
| | 6,236,878 | |
| Distributors — 1.0% | | |
| LKQ Corp. | 78,616 | | 4,719,318 | |
| Diversified Consumer Services — 0.3% | | |
| H&R Block, Inc. | 65,346 | | 1,539,552 | |
| Diversified Financial Services — 1.9% | | |
Berkshire Hathaway, Inc., Class B(1) | 28,869 | | 8,631,831 | |
| Diversified Telecommunication Services — 0.9% | | |
| Lumen Technologies, Inc. | 326,705 | | 4,100,148 | |
| Electric Utilities — 0.4% | | |
| Evergy, Inc. | 28,250 | | 1,938,233 | |
| Electrical Equipment — 0.7% | | |
| Acuity Brands, Inc. | 9,268 | | 1,962,221 | |
Atkore, Inc.(1) | 12,665 | | 1,408,221 | |
| | 3,370,442 | |
| Equity Real Estate Investment Trusts (REITs) — 3.0% | | |
| Iron Mountain, Inc. | 55,741 | | 2,916,926 | |
| ProLogis, Inc. | 35,277 | | 5,939,236 | |
| SBA Communications Corp. | 7,939 | | 3,088,430 | |
| Weyerhaeuser Co. | 39,202 | | 1,614,338 | |
| | 13,558,930 | |
| Food and Staples Retailing — 3.5% | | |
| Albertsons Cos., Inc., Class A | 24,402 | | 736,696 | |
| Costco Wholesale Corp. | 3,598 | | 2,042,585 | |
| Kroger Co. (The) | 77,404 | | 3,503,305 | |
Sprouts Farmers Market, Inc.(1) | 74,340 | | 2,206,411 | |
| Walgreens Boots Alliance, Inc. | 69,524 | | 3,626,372 | |
| Walmart, Inc. | 23,995 | | 3,471,837 | |
| | 15,587,206 | |
| Food Products — 1.4% | | |
| Archer-Daniels-Midland Co. | 41,287 | | 2,790,588 | |
| Tyson Foods, Inc., Class A | 38,369 | | 3,344,242 | |
| | 6,134,830 | |
| Health Care Equipment and Supplies — 1.9% | | |
| Abbott Laboratories | 39,354 | | 5,538,682 | |
| Becton Dickinson and Co. | 4,314 | | 1,084,885 | |
Hologic, Inc.(1) | 27,822 | | 2,130,052 | |
| | 8,753,619 | |
| Health Care Providers and Services — 7.5% | | |
AMN Healthcare Services, Inc.(1) | 12,648 | | 1,547,230 | |
| Anthem, Inc. | 10,457 | | 4,847,238 | |
Centene Corp.(1) | 16,044 | | 1,322,025 | |
| CVS Health Corp. | 15,348 | | 1,583,300 | |
| Humana, Inc. | 2,401 | | 1,113,728 | |
| McKesson Corp. | 38,495 | | 9,568,702 | |
Molina Healthcare, Inc.(1) | 9,051 | | 2,878,942 | |
| Quest Diagnostics, Inc. | 25,494 | | 4,410,717 | |
| UnitedHealth Group, Inc. | 13,082 | | 6,568,995 | |
| | 33,840,877 | |
| | | | | | | | |
| Shares | Value |
| Hotels, Restaurants and Leisure — 0.3% | | |
| International Game Technology plc | 42,679 | | $ | 1,233,850 | |
| Household Durables — 0.7% | | |
Mohawk Industries, Inc.(1) | 12,601 | | 2,295,650 | |
Tri Pointe Homes, Inc.(1) | 32,911 | | 917,888 | |
| | 3,213,538 | |
| Independent Power and Renewable Electricity Producers — 0.3% | |
| Vistra Corp. | 51,344 | | 1,169,103 | |
| Industrial Conglomerates — 1.7% | | |
| 3M Co. | 32,709 | | 5,810,100 | |
| Honeywell International, Inc. | 7,836 | | 1,633,884 | |
| | 7,443,984 | |
| Insurance — 1.5% | | |
| Allstate Corp. (The) | 11,497 | | 1,352,622 | |
| Fidelity National Financial, Inc. | 48,354 | | 2,523,112 | |
| Marsh & McLennan Cos., Inc. | 6,528 | | 1,134,697 | |
| Progressive Corp. (The) | 15,080 | | 1,547,962 | |
| | 6,558,393 | |
| Interactive Media and Services — 2.0% | | |
Alphabet, Inc., Class A(1) | 1,039 | | 3,010,025 | |
Alphabet, Inc., Class C(1) | 1,537 | | 4,447,448 | |
Ziff Davis, Inc.(1) | 14,611 | | 1,619,775 | |
| | 9,077,248 | |
| IT Services — 4.5% | | |
| Accenture plc, Class A | 12,904 | | 5,349,353 | |
Akamai Technologies, Inc.(1) | 31,902 | | 3,733,810 | |
| Cognizant Technology Solutions Corp., Class A | 75,751 | | 6,720,629 | |
GoDaddy, Inc., Class A(1) | 20,867 | | 1,770,774 | |
| International Business Machines Corp. | 20,516 | | 2,742,168 | |
| | 20,316,734 | |
| Leisure Products — 0.4% | | |
| Polaris, Inc. | 17,270 | | 1,898,146 | |
| Life Sciences Tools and Services — 1.9% | | |
Charles River Laboratories International, Inc.(1) | 5,699 | | 2,147,269 | |
Mettler-Toledo International, Inc.(1) | 1,149 | | 1,950,094 | |
| PerkinElmer, Inc. | 22,932 | | 4,610,708 | |
| | 8,708,071 | |
| Machinery — 2.7% | | |
| AGCO Corp. | 44,678 | | 5,183,542 | |
| Cummins, Inc. | 7,412 | | 1,616,854 | |
| Donaldson Co., Inc. | 57,717 | | 3,420,309 | |
| Snap-on, Inc. | 9,880 | | 2,127,954 | |
| | 12,348,659 | |
| Media — 1.0% | | |
| Comcast Corp., Class A | 91,308 | | 4,595,532 | |
| Metals and Mining — 0.9% | | |
| Nucor Corp. | 27,147 | | 3,098,830 | |
| Steel Dynamics, Inc. | 16,335 | | 1,013,914 | |
| | 4,112,744 | |
| Multi-Utilities — 1.6% | | |
| Brookfield Infrastructure Partners LP | 115,801 | | 7,041,859 | |
| Multiline Retail — 1.4% | | |
| Dillard's, Inc., Class A | 5,251 | | 1,286,600 | |
| | | | | | | | |
| Shares | Value |
| Kohl's Corp. | 38,573 | | $ | 1,905,121 | |
| Target Corp. | 12,919 | | 2,989,973 | |
| | 6,181,694 | |
| Oil, Gas and Consumable Fuels — 5.4% | | |
| Antero Midstream Corp. | 117,558 | | 1,137,961 | |
| APA Corp. | 73,856 | | 1,985,988 | |
| Chevron Corp. | 38,099 | | 4,470,918 | |
| Devon Energy Corp. | 41,521 | | 1,829,000 | |
| Diamondback Energy, Inc. | 23,219 | | 2,504,169 | |
| Enviva Partners LP | 20,022 | | 1,409,949 | |
| Equinor ASA, ADR | 32,863 | | 865,283 | |
| Exxon Mobil Corp. | 29,286 | | 1,792,010 | |
| MPLX LP | 59,079 | | 1,748,148 | |
| Phillips 66 | 12,477 | | 904,083 | |
| Royal Dutch Shell plc, Class A ADR | 30,990 | | 1,344,966 | |
| Targa Resources Corp. | 41,123 | | 2,148,266 | |
| Williams Cos., Inc. (The) | 84,714 | | 2,205,953 | |
| | 24,346,694 | |
| Paper and Forest Products — 0.5% | | |
| Louisiana-Pacific Corp. | 26,163 | | 2,049,871 | |
| Pharmaceuticals — 7.5% | | |
Jazz Pharmaceuticals plc(1) | 15,864 | | 2,021,074 | |
| Johnson & Johnson | 65,346 | | 11,178,740 | |
| Merck & Co., Inc. | 61,490 | | 4,712,593 | |
| Pfizer, Inc. | 161,886 | | 9,559,368 | |
| Roche Holding AG | 7,440 | | 3,086,567 | |
| Zoetis, Inc. | 13,927 | | 3,398,606 | |
| | 33,956,948 | |
| Professional Services — 1.0% | | |
CACI International, Inc., Class A(1) | 5,073 | | 1,365,702 | |
| Leidos Holdings, Inc. | 32,862 | | 2,921,432 | |
| | 4,287,134 | |
| Real Estate Management and Development — 0.2% | | |
CBRE Group, Inc., Class A(1) | 8,381 | | 909,422 | |
| Road and Rail — 2.4% | | |
| ArcBest Corp. | 8,423 | | 1,009,497 | |
| Knight-Swift Transportation Holdings, Inc. | 25,147 | | 1,532,458 | |
| Landstar System, Inc. | 15,511 | | 2,776,779 | |
| Ryder System, Inc. | 27,441 | | 2,261,962 | |
| Union Pacific Corp. | 12,236 | | 3,082,615 | |
| | 10,663,311 | |
| Semiconductors and Semiconductor Equipment — 4.5% | | |
| Broadcom, Inc. | 6,740 | | 4,484,863 | |
Cirrus Logic, Inc.(1) | 20,708 | | 1,905,550 | |
| Kulicke & Soffa Industries, Inc. | 13,721 | | 830,669 | |
| NXP Semiconductors NV | 14,038 | | 3,197,576 | |
Onto Innovation, Inc.(1) | 27,572 | | 2,791,114 | |
Qorvo, Inc.(1) | 14,764 | | 2,308,942 | |
Synaptics, Inc.(1) | 6,311 | | 1,827,098 | |
| Taiwan Semiconductor Manufacturing Co. Ltd., ADR | 24,411 | | 2,936,887 | |
| | 20,282,699 | |
| Software — 1.4% | | |
| Microsoft Corp. | 6,795 | | 2,285,294 | |
| | | | | | | | |
| Shares | Value |
| Oracle Corp. (New York) | 33,741 | | $ | 2,942,553 | |
Teradata Corp.(1) | 28,328 | | 1,203,090 | |
| | 6,430,937 | |
| Specialty Retail — 3.1% | | |
Academy Sports & Outdoors, Inc.(1) | 31,671 | | 1,390,357 | |
AutoNation, Inc.(1) | 26,662 | | 3,115,455 | |
| Bath & Body Works, Inc. | 27,570 | | 1,924,110 | |
| Dick's Sporting Goods, Inc. | 16,422 | | 1,888,366 | |
| Penske Automotive Group, Inc. | 16,852 | | 1,806,871 | |
| Signet Jewelers Ltd. | 13,934 | | 1,212,676 | |
Urban Outfitters, Inc.(1) | 34,580 | | 1,015,269 | |
| Williams-Sonoma, Inc. | 10,768 | | 1,821,192 | |
| | 14,174,296 | |
| Technology Hardware, Storage and Peripherals — 3.5% | | |
| Apple, Inc. | 22,302 | | 3,960,166 | |
Dell Technologies, Inc., Class C(1) | 85,106 | | 4,780,404 | |
| Hewlett Packard Enterprise Co. | 89,072 | | 1,404,665 | |
| HP, Inc. | 81,250 | | 3,060,688 | |
| Seagate Technology Holdings plc | 21,891 | | 2,473,245 | |
| | 15,679,168 | |
| Textiles, Apparel and Luxury Goods — 0.8% | | |
| Hanesbrands, Inc. | 105,723 | | 1,767,689 | |
| Levi Strauss & Co., Class A | 65,077 | | 1,628,877 | |
| | 3,396,566 | |
| Thrifts and Mortgage Finance — 0.3% | | |
| Radian Group, Inc. | 69,034 | | 1,458,688 | |
TOTAL COMMON STOCKS (Cost $395,444,975) | | 446,407,848 | |
| TEMPORARY CASH INVESTMENTS — 1.0% | | |
| Repurchase Agreement, BMO Capital Markets Corp., (collateralized by various U.S. Treasury obligations, 2.00% - 2.375%, 4/30/24 - 5/15/51, valued at $913,636), in a joint trading account at 0.01%, dated 12/31/21, due 1/3/22 (Delivery value $895,523) | | 895,522 | |
| Repurchase Agreement, Fixed Income Clearing Corp., (collateralized by various U.S. Treasury obligations, 3.125%, 8/15/44, valued at $3,045,795), at 0.01%, dated 12/31/21, due 1/3/22 (Delivery value $2,986,002) | | 2,986,000 | |
| State Street Institutional U.S. Government Money Market Fund, Premier Class | 760,287 | | 760,287 | |
TOTAL TEMPORARY CASH INVESTMENTS (Cost $4,641,809) | | 4,641,809 | |
TOTAL INVESTMENT SECURITIES — 100.0% (Cost $400,086,784) | | 451,049,657 | |
OTHER ASSETS AND LIABILITIES† | | (517) | |
| TOTAL NET ASSETS — 100.0% | | $ | 451,049,140 | |
| | | | | | | | |
| NOTES TO SCHEDULE OF INVESTMENTS |
| ADR | - | American Depositary Receipt |
†Category is less than 0.05% of total net assets.
(1)Non-income producing.
See Notes to Financial Statements.
| | |
| Statement of Assets and Liabilities |
| | | | | |
| DECEMBER 31, 2021 | |
| Assets |
| Investment securities, at value (cost of $400,086,784) | $ | 451,049,657 | |
| Cash | 79,927 | |
| Receivable for capital shares sold | 46,284 | |
| Dividends and interest receivable | 215,604 | |
| 451,391,472 | |
| |
| Liabilities |
| Payable for capital shares redeemed | 71,133 | |
| Accrued management fees | 262,767 | |
| Distribution fees payable | 8,432 | |
| 342,332 | |
| |
| Net Assets | $ | 451,049,140 | |
| |
| Net Assets Consist of: |
| Capital (par value and paid-in surplus) | $ | 303,554,777 | |
| Distributable earnings | 147,494,363 | |
| $ | 451,049,140 | |
| | | | | | | | | | | |
| Net Assets | Shares Outstanding | Net Asset Value Per Share |
| Class I, $0.01 Par Value | $410,286,798 | 38,283,300 | $10.72 |
| Class II, $0.01 Par Value | $40,762,342 | 3,802,541 | $10.72 |
See Notes to Financial Statements.
| | | | | |
| YEAR ENDED DECEMBER 31, 2021 |
| Investment Income (Loss) | |
| Income: | |
| Dividends (net of foreign taxes withheld of $12,659) | $ | 7,830,873 | |
| Interest | 921 | |
| 7,831,794 | |
| |
| Expenses: | |
| Management fees | 3,069,988 | |
| Distribution fees - Class II | 92,551 | |
| Directors' fees and expenses | 10,735 | |
| Other expenses | 1,560 | |
| 3,174,834 | |
| |
| Net investment income (loss) | 4,656,960 | |
| |
| Realized and Unrealized Gain (Loss) | |
| Net realized gain (loss) on: | |
| Investment transactions | 97,709,050 | |
| Futures contract transactions | 624,061 | |
| Foreign currency translation transactions | (7,214) | |
| 98,325,897 | |
| |
| Change in net unrealized appreciation (depreciation) on: | |
| Investments | (11,761,396) | |
| Futures contracts | (59,239) | |
| (11,820,635) | |
| |
| Net realized and unrealized gain (loss) | 86,505,262 | |
| |
| Net Increase (Decrease) in Net Assets Resulting from Operations | $ | 91,162,222 | |
See Notes to Financial Statements.
| | |
| Statement of Changes in Net Assets |
| | | | | | | | |
| YEARS ENDED DECEMBER 31, 2021 AND DECEMBER 31, 2020 |
| Increase (Decrease) in Net Assets | December 31, 2021 | December 31, 2020 |
| Operations | | |
| Net investment income (loss) | $ | 4,656,960 | | $ | 7,061,949 | |
| Net realized gain (loss) | 98,325,897 | | 63,633,820 | |
| Change in net unrealized appreciation (depreciation) | (11,820,635) | | (31,433,570) | |
| Net increase (decrease) in net assets resulting from operations | 91,162,222 | | 39,262,199 | |
| | |
| Distributions to Shareholders | | |
| From earnings: | | |
| Class I | (63,373,538) | | (22,814,371) | |
| Class II | (5,351,050) | | (1,701,714) | |
| Decrease in net assets from distributions | (68,724,588) | | (24,516,085) | |
| | |
| Capital Share Transactions | | |
| Net increase (decrease) in net assets from capital share transactions (Note 5) | 36,571,754 | | (6,112,240) | |
| | |
| Net increase (decrease) in net assets | 59,009,388 | | 8,633,874 | |
| | |
| Net Assets | | |
| Beginning of period | 392,039,752 | | 383,405,878 | |
| End of period | $ | 451,049,140 | | $ | 392,039,752 | |
See Notes to Financial Statements.
| | |
| Notes to Financial Statements |
DECEMBER 31, 2021
1. Organization
American Century Variable Portfolios, Inc. (the corporation) is registered under the Investment Company Act of 1940, as amended (the 1940 Act), as an open-end management investment company and is organized as a Maryland corporation. VP Disciplined Core Value Fund (the fund) is one fund in a series issued by the corporation. The fund’s investment objective is to seek capital growth by investing in common stocks. Income is a secondary objective. The fund offers Class I and Class II.
2. Significant Accounting Policies
The following is a summary of significant accounting policies consistently followed by the fund in preparation of its financial statements. The fund is an investment company and follows accounting and reporting guidance in accordance with accounting principles generally accepted in the United States of America. This may require management to make certain estimates and assumptions at the date of the financial statements. Actual results could differ from these estimates. Management evaluated the impact of events or transactions occurring through the date the financial statements were issued that would merit recognition or disclosure.
Investment Valuations — The fund determines the fair value of its investments and computes its net asset value (NAV) per share at the close of regular trading (usually 4 p.m. Eastern time) on the New York Stock Exchange (NYSE) on each day the NYSE is open. The Board of Directors has adopted valuation policies and procedures to guide the investment advisor in the fund’s investment valuation process and to provide methodologies for the oversight of the fund’s pricing function.
Equity securities that are listed or traded on a domestic securities exchange are valued at the last reported sales price or at the official closing price as provided by the exchange. Equity securities traded on foreign securities exchanges are generally valued at the closing price of such securities on the exchange where primarily traded or at the close of the NYSE, if that is earlier. If no last sales price is reported, or if local convention or regulation so provides, the mean of the latest bid and asked prices may be used. Securities traded over-the-counter are valued at the mean of the latest bid and asked prices, the last sales price, or the official closing price. Equity securities initially expressed in local currencies are translated into U.S. dollars at the mean of the appropriate currency exchange rate at the close of the NYSE as provided by an independent pricing service.
Open-end management investment companies are valued at the reported NAV per share. Repurchase agreements are valued at cost, which approximates fair value. Exchange-traded futures contracts are valued at the settlement price as provided by the appropriate exchange.
If the fund determines that the market price for an investment is not readily available or the valuation methods mentioned above do not reflect an investment’s fair value, such investment is valued as determined in good faith by the Board of Directors or its delegate, in accordance with policies and procedures adopted by the Board of Directors. In its determination of fair value, the fund may review several factors including, but not limited to, market information regarding the specific investment or comparable investments and correlation with other investment types, futures indices or general market indicators. Circumstances that may cause the fund to use these procedures to value an investment include, but are not limited to: an investment has been declared in default or is distressed; trading in a security has been suspended during the trading day or a security is not actively trading on its principal exchange; prices received from a regular pricing source are deemed unreliable; or there is a foreign market holiday and no trading occurred.
The fund monitors for significant events occurring after the close of an investment’s primary exchange but before the fund’s NAV per share is determined. Significant events may include, but are not limited to: corporate announcements and transactions; governmental action and political unrest that could impact a specific investment or an investment sector; or armed conflicts, natural disasters and similar events that could affect investments in a specific country or region. The fund also monitors for significant fluctuations between domestic and foreign markets, as evidenced by the U.S. market or such other indicators that the Board of Directors, or its delegate, deems appropriate. The fund may apply a model-derived factor to the closing price of equity securities traded on foreign securities exchanges. The factor is based on observable market data as provided by an independent pricing service.
Security Transactions — Security transactions are accounted for as of the trade date. Net realized gains and losses are determined on the identified cost basis, which is also used for federal income tax purposes.
Investment Income — Dividend income less foreign taxes withheld, if any, is recorded as of the ex-dividend date. Distributions received on securities that represent a return of capital or long-term capital gain are recorded as a reduction of cost of investments and/or as a realized gain. The fund may estimate the components of distributions received that may be considered nontaxable distributions or long-term capital gain distributions for income tax purposes. Interest income is recorded on the accrual basis and includes accretion of discounts and amortization of premiums.
Foreign Currency Translations — All assets and liabilities initially expressed in foreign currencies are translated into U.S. dollars at prevailing exchange rates at period end. The fund may enter into spot foreign currency exchange contracts to facilitate transactions denominated in a foreign currency. Purchases and sales of investment securities, dividend and interest income, spot foreign currency exchange contracts, and expenses are translated at the rates of exchange prevailing on the respective dates of such transactions. Net realized and unrealized foreign currency exchange gains or losses related to investment securities are a component of net realized gain (loss) on investment transactions and change in net unrealized appreciation (depreciation) on investments, respectively.
Repurchase Agreements — The fund may enter into repurchase agreements with institutions that American Century Investment Management, Inc. (ACIM) (the investment advisor) has determined are creditworthy pursuant to criteria adopted by the Board of Directors. The fund requires that the collateral, represented by securities, received in a repurchase transaction be transferred to the custodian in a manner sufficient to enable the fund to obtain those securities in the event of a default under the repurchase agreement. ACIM monitors, on a daily basis, the securities transferred to ensure the value, including accrued interest, of the securities under each repurchase agreement is equal to or greater than amounts owed to the fund under each repurchase agreement.
Joint Trading Account — Pursuant to an Exemptive Order issued by the Securities and Exchange Commission, the fund, along with certain other funds in the American Century Investments family of funds, may transfer uninvested cash balances into a joint trading account. These balances are invested in one or more repurchase agreements that are collateralized by U.S. Treasury or Agency obligations.
Segregated Assets — In accordance with the 1940 Act, the fund segregates assets on its books and records to cover certain types of investment securities and other financial instruments. ACIM monitors, on a daily basis, the securities segregated to ensure the fund designates a sufficient amount of liquid assets, marked-to-market daily. The fund may also receive assets or be required to pledge assets at the custodian bank or with a broker for collateral requirements.
Income Tax Status — It is the fund’s policy to distribute substantially all net investment income and net realized gains to shareholders and to otherwise qualify as a regulated investment company under provisions of the Internal Revenue Code. Accordingly, no provision has been made for income taxes. The fund files U.S. federal, state, local and non-U.S. tax returns as applicable. The fund's tax returns are subject to examination by the relevant taxing authority until expiration of the applicable statute of limitations, which is generally three years from the date of filing but can be longer in certain jurisdictions. At this time, management believes there are no uncertain tax positions which, based on their technical merit, would not be sustained upon examination and for which it is reasonably possible that the total amounts of unrecognized tax benefits will significantly change in the next twelve months.
Multiple Class — All shares of the fund represent an equal pro rata interest in the net assets of the class to which such shares belong, and have identical voting, dividend, liquidation and other rights and the same terms and conditions, except for class specific expenses and exclusive rights to vote on matters affecting only individual classes. Income, non-class specific expenses, and realized and unrealized capital gains and losses of the fund are allocated to each class of shares based on their relative net assets.
Distributions to Shareholders — Distributions from net investment income, if any, are generally declared and paid quarterly. Distributions from net realized gains, if any, are generally declared and paid annually.
Indemnifications — Under the corporation’s organizational documents, its officers and directors are indemnified against certain liabilities arising out of the performance of their duties to the fund. In addition, in the normal course of business, the fund enters into contracts that provide general indemnifications. The maximum exposure under these arrangements is unknown as this would involve future claims that may be made against a fund. The risk of material loss from such claims is considered by management to be remote.
3. Fees and Transactions with Related Parties
Certain officers and directors of the corporation are also officers and/or directors of American Century Companies, Inc. (ACC). The corporation’s investment advisor, ACIM, the corporation's distributor, American Century Investment Services, Inc. (ACIS), and the corporation’s transfer agent, American Century Services, LLC, are wholly owned, directly or indirectly, by ACC.
Management Fees — The corporation has entered into a management agreement with ACIM, under which ACIM provides the fund with investment advisory and management services in exchange for a single, unified management fee (the fee) per class. The agreement provides that ACIM will pay all expenses of managing and operating the fund, except brokerage expenses, taxes, interest, fees and expenses of the independent directors (including legal counsel fees), extraordinary expenses, and expenses incurred in connection with the provision of shareholder services and distribution services under a plan adopted pursuant to Rule 12b-1 under the 1940 Act. The fee is computed and accrued daily based on each class's daily net assets and paid monthly in arrears. The rate of the fee is determined by applying a fee rate calculation formula. This formula takes into account the fund's assets as well as certain assets, if any, of other clients of the investment advisor outside the American Century Investments family of funds (such as subadvised funds and separate accounts) that use very similar investment teams and strategies (strategy assets). The management fee schedule ranges from 0.65% to 0.70% for each class. The effective annual management fee for each class for the period ended December 31, 2021 was 0.70%.
Distribution Fees — The Board of Directors has adopted the Master Distribution Plan (the plan) for Class II, pursuant to Rule 12b-1 of the 1940 Act. The plan provides that Class II will pay ACIS an annual distribution fee equal to 0.25%. The fee is computed and accrued daily based on the Class II daily net assets and paid monthly in arrears. The distribution fee provides compensation for expenses incurred in connection with distributing shares of Class II including, but not limited to, payments to brokers, dealers, and financial institutions that have entered into sales agreements with respect to shares of the fund. Fees incurred under the plan during the period ended December 31, 2021 are detailed in the Statement of Operations.
Directors' Fees and Expenses — The Board of Directors is responsible for overseeing the investment advisor’s management and operations of the fund. The directors receive detailed information about the fund and its investment advisor regularly throughout the year, and meet at least quarterly with management of the investment advisor to review reports about fund operations. The fund’s officers do not receive compensation from the fund.
Interfund Transactions — The fund may enter into security transactions with other American Century Investments funds and other client accounts of the investment advisor, in accordance with the 1940 Act rules and procedures adopted by the Board of Directors. The rules and procedures require, among other things, that these transactions be effected at the independent current market price of the security. During the period, the interfund purchases and sales were $6,898,860 and $2,770,905, respectively. The effect of interfund transactions on the Statement of Operations was $1,133,375 in net realized gain (loss) on investment transactions.
4. Investment Transactions
Purchases and sales of investment securities, excluding short-term investments, for the period ended December 31, 2021 were $1,063,391,802 and $1,087,879,280, respectively.
5. Capital Share Transactions
Transactions in shares of the fund were as follows:
| | | | | | | | | | | | | | |
| Year ended
December 31, 2021 | Year ended
December 31, 2020 |
| Shares | Amount | Shares | Amount |
| Class I/Shares Authorized | 300,000,000 | |
| 300,000,000 | | |
| Sold | 3,634,562 | | $ | 37,826,575 | | 3,616,992 | | $ | 32,755,485 | |
| Issued in reinvestment of distributions | 6,487,592 | | 63,373,538 | | 3,043,495 | | 22,814,371 | |
| Redeemed | (7,057,131) | | (73,434,628) | | (6,535,034) | | (59,404,857) | |
| 3,065,023 | | 27,765,485 | | 125,453 | | (3,835,001) | |
| Class II/Shares Authorized | 50,000,000 | |
| 50,000,000 | | |
| Sold | 1,038,975 | | 10,836,300 | | 739,646 | | 6,874,542 | |
| Issued in reinvestment of distributions | 547,975 | | 5,351,050 | | 227,833 | | 1,701,714 | |
| Redeemed | (704,601) | | (7,381,081) | | (1,201,206) | | (10,853,495) | |
| 882,349 | | 8,806,269 | | (233,727) | | (2,277,239) | |
| Net increase (decrease) | 3,947,372 | | $ | 36,571,754 | | (108,274) | | $ | (6,112,240) | |
6. Fair Value Measurements
The fund’s investments valuation process is based on several considerations and may use multiple inputs to determine the fair value of the investments held by the fund. In conformity with accounting principles generally accepted in the United States of America, the inputs used to determine a valuation are classified into three broad levels.
•Level 1 valuation inputs consist of unadjusted quoted prices in an active market for identical investments.
•Level 2 valuation inputs consist of direct or indirect observable market data (including quoted prices for comparable investments, evaluations of subsequent market events, interest rates, prepayment speeds, credit risk, etc.). These inputs also consist of quoted prices for identical investments initially expressed in local currencies that are adjusted through translation into U.S. dollars.
•Level 3 valuation inputs consist of unobservable data (including a fund’s own assumptions).
The level classification is based on the lowest level input that is significant to the fair valuation measurement. The valuation inputs are not necessarily an indication of the risks associated with investing in these securities or other financial instruments.
The following is a summary of the level classifications as of period end. The Schedule of Investments provides additional information on the fund’s portfolio holdings.
| | | | | | | | | | | |
| Level 1 | Level 2 | Level 3 |
| Assets | | | |
| Investment Securities | | | |
| Common Stocks | $ | 441,931,936 | | $ | 4,475,912 | | — | |
| Temporary Cash Investments | 760,287 | | 3,881,522 | | — | |
| $ | 442,692,223 | | $ | 8,357,434 | | — | |
7. Derivative Instruments
Equity Price Risk — The fund is subject to equity price risk in the normal course of pursuing its investment objectives. A fund may enter into futures contracts based on an equity index in order to manage its exposure to changes in market conditions. A fund may purchase futures contracts to gain exposure to increases in market value or sell futures contracts to protect against a decline in market value. Upon entering into a futures contract, a fund is required to deposit either cash or securities in an amount equal to a certain percentage of the contract value (initial margin). Subsequent payments (variation margin) are made or received daily, in cash, by a fund. The variation margin is equal to the daily change in the contract value and is recorded as unrealized gains and losses. A fund recognizes a realized gain or loss when the contract is closed or expires. Net realized and unrealized gains or losses occurring during the holding period of futures contracts are a component of net realized gain (loss) on futures contract transactions and change in net unrealized appreciation (depreciation) on futures contracts, respectively. One of the risks of entering into futures contracts is the possibility that the change in value of the contract may not correlate with the changes in value of the underlying securities. The fund's average notional exposure to equity price risk derivative instruments held during the period was $3,734,399 futures contracts purchased.
At period end, the fund did not have any derivative instruments disclosed on the Statement of Assets and Liabilities. For the year ended December 31, 2021, the effect of equity price risk derivative instruments on the Statement of Operations was $624,061 in net realized gain (loss) on futures contract transactions and $(59,239) in change in net unrealized appreciation (depreciation) on futures contracts.
8. Risk Factors
The value of the fund’s shares will go up and down, sometimes rapidly or unpredictably, based on the performance of the securities owned by the fund and other factors generally affecting the securities market. Market risks, including political, regulatory, economic and social developments, can affect the value of the fund’s investments. Natural disasters, public health emergencies, terrorism and other unforeseeable events may lead to increased market volatility and may have adverse long-term effects on world economies and markets generally.
The fund’s investment process may result in high portfolio turnover, which could mean high transaction costs, affecting both performance and capital gains tax liabilities to investors.
9. Federal Tax Information
The tax character of distributions paid during the years ended December 31, 2021 and December 31, 2020 were as follows:
| | | | | | | | |
| 2021 | 2020 |
| Distributions Paid From | | |
| Ordinary income | $ | 4,602,670 | | $ | 6,969,649 | |
| Long-term capital gains | $ | 64,121,918 | | $ | 17,546,436 | |
The book-basis character of distributions made during the year from net investment income or net realized gains may differ from their ultimate characterization for federal income tax purposes. These differences reflect the differing character of certain income items and net realized gains and losses for financial statement and tax purposes, and may result in reclassification among certain capital accounts on the financial statements.
As of period end, the federal tax cost of investments and the components of distributable earnings on a tax-basis were as follows:
| | | | | |
| Federal tax cost of investments | $ | 400,735,037 | |
| Gross tax appreciation of investments | $ | 57,593,554 | |
| Gross tax depreciation of investments | (7,278,934) | |
| Net tax appreciation (depreciation) of investments | $ | 50,314,620 | |
| Undistributed ordinary income | $ | 54,918,409 | |
| Accumulated long-term gains | $ | 42,261,334 | |
The difference between book-basis and tax-basis unrealized appreciation (depreciation) is attributable primarily to the tax deferral of losses on wash sales.
| | | | | | | | | | | | | | | | | | | | | | | | | | | | | | | | | | | | | | | | | |
| For a Share Outstanding Throughout the Years Ended December 31 (except as noted) |
| Per-Share Data | Ratios and Supplemental Data |
| | | Income From Investment Operations: | Distributions From: | | | Ratio to Average Net Assets of: | | |
| | Net Asset
Value,
Beginning
of Period | Net Investment Income (Loss)(1) | Net
Realized and Unrealized
Gain (Loss) | Total From Investment Operations | Net
Investment
Income | Net
Realized
Gains | Total
Distributions | Net
Asset Value,
End of Period | Total Return(2) | Operating
Expenses | Net
Investment
Income
(Loss) | Portfolio
Turnover
Rate | Net Assets,
End of
Period
(in thousands) |
| Class I |
| 2021 | $10.28 | 0.11 | 2.13 | 2.24 | (0.11) | (1.69) | (1.80) | $10.72 | 23.65% | 0.70% | 1.09% | 248% | $410,287 | |
| 2020 | $10.02 | 0.19 | 0.73 | 0.92 | (0.18) | (0.48) | (0.66) | $10.28 | 11.81% | 0.70% | 2.03% | 163% | $362,015 | |
| 2019 | $9.02 | 0.20 | 1.85 | 2.05 | (0.20) | (0.85) | (1.05) | $10.02 | 23.95% | 0.70% | 2.07% | 83% | $351,774 | |
| 2018 | $10.71 | 0.22 | (0.90) | (0.68) | (0.20) | (0.81) | (1.01) | $9.02 | (6.87)% | 0.70% | 2.11% | 70% | $315,041 | |
| 2017 | $9.32 | 0.24 | 1.62 | 1.86 | (0.24) | (0.23) | (0.47) | $10.71 | 20.49% | 0.71% | 2.47% | 76% | $378,295 | |
| Class II |
| 2021 | $10.28 | 0.09 | 2.13 | 2.22 | (0.09) | (1.69) | (1.78) | $10.72 | 23.34% | 0.95% | 0.84% | 248% | $40,762 | |
| 2020 | $10.03 | 0.16 | 0.73 | 0.89 | (0.16) | (0.48) | (0.64) | $10.28 | 11.45% | 0.95% | 1.78% | 163% | $30,024 | |
| 2019 | $9.02 | 0.17 | 1.87 | 2.04 | (0.18) | (0.85) | (1.03) | $10.03 | 23.75% | 0.95% | 1.82% | 83% | $31,632 | |
| 2018 | $10.72 | 0.19 | (0.91) | (0.72) | (0.17) | (0.81) | (0.98) | $9.02 | (7.19)% | 0.95% | 1.86% | 70% | $26,938 | |
| 2017 | $9.32 | 0.22 | 1.62 | 1.84 | (0.21) | (0.23) | (0.44) | $10.72 | 20.30% | 0.96% | 2.22% | 76% | $26,833 | |
| | |
| Notes to Financial Highlights |
(1)Computed using average shares outstanding throughout the period.
(2)Total returns are calculated based on the net asset value of the last business day. Total returns for periods less than one year are not annualized. The total returns presented do not include the fees and charges assessed with investments in variable insurance products, those charges are disclosed in the separate account prospectus. The inclusion of such fees and charges would lower total return.
See Notes to Financial Statements.
| | |
| Report of Independent Registered Public Accounting Firm |
To the Shareholders and the Board of Directors of American Century Variable Portfolios, Inc.:
Opinion on the Financial Statements and Financial Highlights
We have audited the accompanying statement of assets and liabilities, including the schedule of investments, of VP Disciplined Core Value Fund (the “Fund”), one of the funds constituting the American Century Variable Portfolios, Inc., as of December 31, 2021, the related statement of operations for the year then ended, the statements of changes in net assets for each of the two years in the period then ended, the financial highlights for each of the five years in the period then ended, and the related notes. In our opinion, the financial statements and financial highlights present fairly, in all material respects, the financial position of VP Disciplined Core Value Fund of the American Century Variable Portfolios, Inc. as of December 31, 2021, and the results of its operations for the year then ended, the changes in its net assets for each of the two years in the period then ended, and the financial highlights for each of the five years in the period then ended, in conformity with accounting principles generally accepted in the United States of America.
Basis for Opinion
These financial statements and financial highlights are the responsibility of the Fund's management. Our responsibility is to express an opinion on the Fund’s financial statements and financial highlights based on our audits. We are a public accounting firm registered with the Public Company Accounting Oversight Board (United States) (PCAOB) and are required to be independent with respect to the Fund in accordance with the U.S. federal securities laws and the applicable rules and regulations of the Securities and Exchange Commission and the PCAOB.
We conducted our audits in accordance with the standards of the PCAOB. Those standards require that we plan and perform the audit to obtain reasonable assurance about whether the financial statements and financial highlights are free of material misstatement, whether due to error or fraud. The Fund is not required to have, nor were we engaged to perform, an audit of its internal control over financial reporting. As part of our audits, we are required to obtain an understanding of internal control over financial reporting but not for the purpose of expressing an opinion on the effectiveness of the Fund’s internal control over financial reporting. Accordingly, we express no such opinion.
Our audits included performing procedures to assess the risks of material misstatement of the financial statements and financial highlights, whether due to error or fraud, and performing procedures that respond to those risks. Such procedures included examining, on a test basis, evidence regarding the amounts and disclosures in the financial statements and financial highlights. Our audits also included evaluating the accounting principles used and significant estimates made by management, as well as evaluating the overall presentation of the financial statements and financial highlights. Our procedures included confirmation of securities owned as of December 31, 2021, by correspondence with the custodian and brokers; when replies were not received from brokers, we performed other auditing procedures. We believe that our audits provide a reasonable basis for our opinion.
/s/ Deloitte & Touche LLP
Kansas City, Missouri
February 10, 2022
We have served as the auditor of one or more American Century investment companies since 1997.
The Board of Directors
The individuals listed below serve as directors of the funds. Each director will continue to serve in this capacity until death, retirement, resignation or removal from office. The board has adopted a mandatory retirement age for directors who are not “interested persons,” as that term is defined in the Investment Company Act (independent directors). Independent directors shall retire on December 31 of the year in which they reach their 75th birthday.
Mr. Thomas is an “interested person�� because he currently serves as President and Chief Executive Officer of American Century Companies, Inc. (ACC), the parent company of American Century Investment Management, Inc. (ACIM or the advisor). The other directors (more than three-fourths of the total number) are independent. They are not employees, directors or officers of, and have no financial interest in, ACC or any of its wholly owned, direct or indirect, subsidiaries, including ACIM, American Century Investment Services, Inc. (ACIS) and American Century Services, LLC (ACS), and they do not have any other affiliations, positions or relationships that would cause them to be considered “interested persons” under the Investment Company Act. The directors serve in this capacity for seven (in the case of Jonathan S. Thomas, 16; and Stephen E. Yates, 8) registered investment companies in the American Century Investments family of funds.
The following table presents additional information about the directors. The mailing address for each director is 4500 Main Street, Kansas City, Missouri 64111.
| | | | | | | | | | | | | | | | | |
Name
(Year of Birth) | Position(s) Held with Funds | Length of Time Served | Principal Occupation(s) During Past 5 Years | Number of American Century Portfolios Overseen by Director | Other Directorships Held During Past 5 Years |
| Independent Directors | | |
| Thomas W. Bunn (1953) | Director | Since 2017 | Retired | 72 | SquareTwo Financial |
Chris H. Cheesman
(1962)
| Director | Since 2019
| Retired. Senior Vice President & Chief Audit Executive, AllianceBernstein (1999 to 2018)
| 72 | Alleghany Corporation |
Barry Fink
(1955) | Director | Since 2012 (independent since 2016) | Retired | 72 | None |
Rajesh K. Gupta
(1960)
| Director | Since 2019
| Partner Emeritus, SeaCrest Investment Management and SeaCrest Wealth Management (2019 to Present); Chief Executive Officer and Chief Investment Officer, SeaCrest Investment Management (2006 to 2019); Chief Executive Officer and Chief Investment Officer, SeaCrest Wealth Management (2008 to 2019) | 72 | None |
| | | | | | | | | | | | | | | | | |
Name
(Year of Birth) | Position(s) Held with Funds | Length of Time Served | Principal Occupation(s) During Past 5 Years | Number of American Century Portfolios Overseen by Director | Other Directorships Held During Past 5 Years |
| Independent Directors | | |
Lynn Jenkins
(1963)
| Director | Since 2019
| Consultant, LJ Strategies (2019 to present); United States Representative, U.S. House of Representatives (2009 to 2018) | 72 | MGP Ingredients, Inc. (2019 to 2021) |
Jan M. Lewis
(1957) | Director | Since 2011 | Retired | 72 | None |
John R. Whitten(1) (1946) | Director | Since 2008 | Retired | 72 | Onto Innovation Inc. (2019 to 2020); Rudolph Technologies, Inc. (2006 to 2019) |
Stephen E. Yates
(1948) | Director and Chairman of the Board | Since 2012 (Chairman since 2018) | Retired | 108 | None |
| Interested Director | |
Jonathan S. Thomas
(1963) | Director | Since 2007 | President and Chief Executive Officer, ACC (2007 to present). Also serves as Chief Executive Officer, ACS; Director, ACC and other ACC subsidiaries | 146 | None |
(1) Effective December 31, 2021, John R. Whitten retired from the Board of Directors.
The Statement of Additional Information has additional information about the fund's directors and is available without charge, upon request, by calling 1-800-378-9878.
Officers
The following table presents certain information about the executive officers of the funds. Each officer serves as an officer for 16 (in the case of Robert J. Leach, 15) investment companies in the American Century family of funds. No officer is compensated for his or her service as an officer of the funds. The listed officers are interested persons of the funds and are appointed or re-appointed on an annual basis. The mailing address for each officer listed below is 4500 Main Street, Kansas City, Missouri 64111.
| | | | | | | | |
Name
(Year of Birth) | Offices with the Funds | Principal Occupation(s) During the Past Five Years |
Patrick Bannigan
(1965) | President since 2019 | Executive Vice President and Director, ACC (2012 to present); Chief Financial Officer, Chief Accounting Officer and Treasurer, ACC (2015 to present). Also serves as President, ACS; Vice President, ACIM; Chief Financial Officer, Chief Accounting Officer and/or Director, ACIM, ACS and other ACC subsidiaries |
R. Wes Campbell
(1974) | Chief Financial Officer and Treasurer since 2018 | Vice President, ACS, (2020 to present); Investment Operations and Investment Accounting, ACS (2000 to present) |
Amy D. Shelton
(1964) | Chief Compliance Officer and Vice President since 2014 | Chief Compliance Officer, American Century funds, (2014 to present); Chief Compliance Officer, ACIM (2014 to present); Chief Compliance Officer, ACIS (2009 to present). Also serves as Vice President, ACIS |
John Pak
(1968) | General Counsel and
Senior Vice President since 2021 | General Counsel and Senior Vice President, ACC (2021 to present); Also serves as General Counsel and Senior Vice President, ACIM, ACS and ACIS. Chief Legal Officer of Investment and Wealth Management, The Bank of New York Mellon (2014 to 2021) |
C. Jean Wade
(1964) | Vice President since 2012 | Senior Vice President, ACS (2017 to present); Vice President, ACS (2000 to 2017)
|
Robert J. Leach
(1966) | Vice President since 2006 | Vice President, ACS (2000 to present) |
David H. Reinmiller
(1963) | Vice President since 2000 | Attorney, ACC (1994 to present). Also serves as Vice President, ACIM and ACS |
Ward D. Stauffer
(1960) | Secretary since 2005 | Attorney, ACC (2003 to present) |
Proxy Voting Policies
A description of the policies that the fund's investment advisor uses in exercising the voting rights associated with the securities purchased and/or held by the fund is available without charge, upon request, by calling 1-800-378-9878. It is also available on American Century Investments’ website at americancentury.com/proxy and on the Securities and Exchange Commission’s website at sec.gov. Information regarding how the investment advisor voted proxies relating to portfolio securities during the most recent 12-month period ended June 30 is available on americancentury.com/proxy. It is also available at sec.gov.
Quarterly Portfolio Disclosure
The fund files its complete schedule of portfolio holdings with the Securities and Exchange Commission (SEC) for the first and third quarters of each fiscal year as an exhibit to its reports on Form N-PORT. These portfolio holdings are available on the fund's website at ipro.americancentury.com (for Investment Professionals) and, upon request, by calling 1-800-378-9878. The fund’s Form N-PORT reports are available on the SEC’s website at sec.gov.
Other Tax Information
The following information is provided pursuant to provisions of the Internal Revenue Code.
For corporate taxpayers, the fund hereby designates $4,602,670, or up to the maximum amount
allowable, of ordinary income distributions paid during the fiscal year ended December 31, 2021 as
qualified for the corporate dividends received deduction.
The fund hereby designates $64,121,918, or up to the maximum amount allowable, as long-term
capital gain distributions (20% rate gain distributions) for the fiscal year ended December 31, 2021.
The fund hereby designates $66,173 as qualified short-term capital gain distributions for
purposes of Internal Revenue Code Section 871 for the fiscal year ended December 31, 2021.
| | | | | | | | |
| |
| | |
| Contact Us | americancentury.com | |
| Automated Information Line | 1-800-345-8765 | |
| Investment Professional Service Representatives | 1-800-345-6488 | |
| Telecommunications Relay Service for the Deaf | 711 | |
| | |
| American Century Variable Portfolios, Inc. | |
| | |
Investment Advisor: American Century Investment Management, Inc. Kansas City, Missouri | |
| | |
| This report and the statements it contains are submitted for the general information of our shareholders. The report is not authorized for distribution to prospective investors unless preceded or accompanied by an effective prospectus. | |
| | |
©2022 American Century Proprietary Holdings, Inc. All rights reserved.
CL-ANN-91438 2202 | |
| | | | | |
| |
| Annual Report |
| |
| December 31, 2021 |
| |
| VP Growth Fund |
| Class I (AWRIX) |
| Class II (AWREX) |
| | | | | |
| Performance | |
| Portfolio Commentary | |
| Fund Characteristics | |
| Shareholder Fee Example | |
| Schedule of Investments | |
| Statement of Assets and Liabilities | |
| Statement of Operations | |
| Statement of Changes in Net Assets | |
| Notes to Financial Statements | |
| Financial Highlights | |
| Report of Independent Registered Public Accounting Firm | |
| Management | |
| |
| |
| |
| Additional Information | |
Any opinions expressed in this report reflect those of the author as of the date of the report, and do not necessarily represent the opinions of American Century Investments® or any other person in the American Century Investments organization. Any such opinions are subject to change at any time based upon market or other conditions and American Century Investments disclaims any responsibility to update such opinions. These opinions may not be relied upon as investment advice and, because investment decisions made by American Century Investments funds are based on numerous factors, may not be relied upon as an indication of trading intent on behalf of any American Century Investments fund. Security examples are used for representational purposes only and are not intended as recommendations to purchase or sell securities. Performance information for comparative indices and securities is provided to American Century Investments by third party vendors. To the best of American Century Investments’ knowledge, such information is accurate at the time of printing.
| | | | | | | | | | | | | | | | | |
| Total Returns as of December 31, 2021 |
| | | | Average Annual
Returns | |
| | Ticker Symbol | 1 year | 5 years | 10 years | Inception Date |
| Class I | AWRIX | 27.40% | 24.50% | 18.22% | 5/2/11 |
| Russell 1000 Growth Index | — | 27.60% | 25.30% | 19.77% | — |
| Class II | AWREX | 27.14% | 24.30% | 18.04% | 5/2/11 |
Fund returns would have been lower if a portion of the fees had not been waived.
The performance information presented does not include the fees and charges assessed with investments in variable insurance products, those charges are disclosed in the separate account prospectus. The inclusion of such fees and charges would lower performance.
Data presented reflect past performance. Past performance is no guarantee of future results. Current performance may be higher or lower than the performance shown. Total returns for periods less than one year are not annualized. Investment return and principal value will fluctuate, and redemption value may be more or less than original cost. Data assumes reinvestment of dividends and capital gains, and none of the charts reflect the deduction of taxes that a shareholder would pay on fund distributions or the redemption of fund shares. To obtain performance data current to the most recent month end, please call 1-800-345-6488 or visit ipro.americancentury.com (for Investment Professionals). For additional information about the fund, please consult the prospectus.
| | |
| Growth of $10,000 Over 10 Years |
| $10,000 investment made December 31, 2011 |
| Performance for other share classes will vary due to differences in fee structure. |
| | | | | |
| Value on December 31, 2021 |
| Class I — $53,391 |
|
| Russell 1000 Growth Index — $60,825 |
|
| |
|
| |
|
Ending value of Class I would have been lower if a portion of the fees had not been waived.
| | | | | |
| Total Annual Fund Operating Expenses |
| Class I | Class II |
| 0.92% | 1.07% |
The total annual fund operating expenses shown is as stated in the fund’s prospectus current as of the date of this report. The prospectus may vary from the expense ratio shown elsewhere in this report because it is based on a different time period, includes acquired fund fees and expenses, and, if applicable, does not include fee waivers or expense reimbursements.
Data presented reflect past performance. Past performance is no guarantee of future results. Current performance may be higher or lower than the performance shown. Total returns for periods less than one year are not annualized. Investment return and principal value will fluctuate, and redemption value may be more or less than original cost. Data assumes reinvestment of dividends and capital gains, and none of the charts reflect the deduction of taxes that a shareholder would pay on fund distributions or the redemption of fund shares. To obtain performance data current to the most recent month end, please call 1-800-345-6488 or visit ipro.americancentury.com (for Investment Professionals). For additional information about the fund, please consult the prospectus.
Portfolio Managers: Joe Reiland, Justin Brown and Scott Marolf
Gregory Woodhams left the portfolio management team September 1, 2021. He retired effective December 31, 2021. Joe Reiland was named portfolio manager.
Performance Summary
VP Growth returned 27.14%* for the 12 months ended December 31, 2021, lagging the 27.60% return of the fund’s benchmark, the Russell 1000 Growth Index.
U.S. stocks posted strong returns during the reporting period, supported by federal government stimulus and low interest rates. The rollout of COVID-19 vaccines allowed the economy to reopen, and despite concerns about the coronavirus variants, inflationary pressures and supply chain constraints, several market indices ended the 12-month period near record highs. Within the Russell 1000 Growth Index, all sectors posted double-digit gains, led by energy, which surged on demand and limited supply as the economy began to reopen. Utilities was the weakest sector.
An underweight allocation to information technology and stock selection in the sector detracted from performance. Stock selection in the communication services and industrials sectors benefited performance relative to the benchmark.
Information Technology Hampered Performance
Stock selection in the IT services industry helped drive underperformance in information technology. Visa provided guidance below expectations due to lower travel-related cross-border spending. In addition, sentiment for the credit card networks weakened due to the rise of alternatives, such as buy now, pay later and cryptocurrency, along with potential competitive headwinds from Amazon. PayPal Holdings detracted. This digital finance company provided guidance significantly below expectations because of weaker-than-anticipated declines in payment volumes from eBay and because e-commerce growth has returned to more normal levels after a pandemic-fueled surge. In addition, reports of a potential Pinterest acquisition were viewed unfavorably by investors.
Zendesk, a cloud-based customer support software company, missed revenue and earnings forecasts due to lower revenue from one of its consumption-based products and a greater mix shift to enterprise deals, which have larger, longer-term contracts over time but recognize less revenue up front. We view this as a positive long-term sign for the business despite the impact to revenue in the near term. Splunk offers cloud-based data analysis software that helps companies understand how efficiently their internal operations are running. Investors appeared concerned about increasing competition, and Splunk experienced some leadership changes.
Stock choices among insurers weighed on relative performance in the financials sector. SelectQuote offers consumers a platform to compare insurance policies. The company and the insurance industry, in general, have struggled with plan persistency, the percentage of policyholders that continue paying premiums. As a result, SelectQuote offered disappointing guidance for next year.
The Walt Disney Co. was a key detractor. The entertainment company’s stock lagged primarily because new subscribers to its Disney Plus streaming service missed expectations. This was mostly due to a pull forward of new subscribers in 2020 because of the pandemic and the lack of new market launches. We continue to like Disney’s media shift to streaming.
*All fund returns referenced in this commentary are for Class II shares. Fund returns would have been lower if a portion of the fees had not been waived. Performance for other share classes will vary due to differences in fee structure; when Class II performance exceeds that of the fund’s benchmark, other share classes may not. See page 2 for returns for all share classes.
Communication Services Stocks Were Top Contributors
Interactive media and services stocks led outperformance in the communication services sector. Alphabet was a major industry contributor. Digital advertising remains strong for Google’s parent company, driven by sustained e-commerce and reopening activity. YouTube, in particular, was strong as new advertising products across both brand and direct response were favorably received.
Other top contributors included NVIDIA, a gaming and artificial intelligence chipmaker. NVIDIA reported better-than-expected earnings and offered positive forward guidance based on strength in data center and gaming CPUs. ASML Holding, a Netherlands-based semiconductor equipment manufacturer, outperformed due to strong demand for its extreme ultraviolet lithography technology that allows semiconductor manufacturers to make smaller and more efficient chips. Demand for semiconductors has been strong and manufacturers need new equipment to increase production.
Microsoft reported strong revenue and earnings growth, and the stock also received a tailwind from large-capitalization software returning to favor. Not owning benchmark component Zoom Video Communications helped performance. After Zoom benefited from the pandemic in 2020, investors reallocated capital in 2021 to stocks that would likely benefit from the reopening of the economy. Zoom was a victim of the market’s swing, and our lack of exposure was helpful.
Outlook
We believe stock selection—rather than sector allocation or market timing via the use of cash—is the most efficient means of generating superior risk-adjusted returns. As a result of this approach, the portfolio’s sector and industry selection, as well as capitalization range allocations, are primarily due to identifying what we believe to be superior individual securities.
We maintained a relatively balanced approach to sector exposures, ending the period with modest overweights in health care, industrials and consumer staples.
| | | | | |
| DECEMBER 31, 2021 |
| Types of Investments in Portfolio | % of net assets |
| Common Stocks | 92.7% |
| Exchange-Traded Funds | 7.1% |
| Temporary Cash Investments | 0.3% |
| Temporary Cash Investments - Securities Lending Collateral | 0.6% |
| Other Assets and Liabilities | (0.7)% |
| |
| Top Five Industries* | % of net assets |
| Software | 15.4% |
| Interactive Media and Services | 9.2% |
| Semiconductors and Semiconductor Equipment | 8.6% |
| Technology Hardware, Storage and Peripherals | 8.1% |
| IT Services | 7.2% |
*Exposure indicated excludes Exchange-Traded Funds. The Schedule of Investments provides additional information on the fund's portfolio holdings.
Fund shareholders may incur two types of costs: (1) transaction costs, including sales charges (loads) on purchase payments and redemption/exchange fees; and (2) ongoing costs, including management fees; distribution and service (12b-1) fees; and other fund expenses. This example is intended to help you understand your ongoing costs (in dollars) of investing in your fund and to compare these costs with the ongoing cost of investing in other mutual funds.
The example is based on an investment of $1,000 made at the beginning of the period and held for the entire period from July 1, 2021 to December 31, 2021.
Actual Expenses
The table provides information about actual account values and actual expenses for each class. You may use the information, together with the amount you invested, to estimate the expenses that you paid over the period. First, identify the share class you own. Then simply divide your account value by $1,000 (for example, an $8,600 account value divided by $1,000 = 8.6), then multiply the result by the number under the heading “Expenses Paid During Period” to estimate the expenses you paid on your account during this period.
Hypothetical Example for Comparison Purposes
The table also provides information about hypothetical account values and hypothetical expenses based on the actual expense ratio of each class of your fund and an assumed rate of return of 5% per year before expenses, which is not the actual return of a fund’s share class. The hypothetical account values and expenses may not be used to estimate the actual ending account balance or expenses you paid for the period. You may use this information to compare the ongoing costs of investing in your fund and other funds. To do so, compare this 5% hypothetical example with the 5% hypothetical examples that appear in the shareholder reports of the other funds.
Please note that the expenses shown in the table are meant to highlight your ongoing costs only and do not reflect any transactional costs, such as sales charges (loads) or redemption/exchange fees. Therefore, the table is useful in comparing ongoing costs only, and will not help you determine the relative total costs of owning different funds. In addition, if these transactional costs were included, your costs would have been higher.
| | | | | | | | | | | | | | |
| Beginning
Account Value
7/1/21 | Ending
Account Value
12/31/21 | Expenses Paid During Period(1) 7/1/21 - 12/31/21 | Annualized Expense Ratio(1) |
| Actual | | | | |
| Class I | $1,000 | $1,115.00 | $4.26 | 0.80% |
| Class II | $1,000 | $1,113.90 | $5.06 | 0.95% |
| Hypothetical | | | | |
| Class I | $1,000 | $1,021.17 | $4.08 | 0.80% |
| Class II | $1,000 | $1,020.42 | $4.84 | 0.95% |
(1)Expenses are equal to the class's annualized expense ratio listed in the table above, multiplied by the average account value over the period, multiplied by 184, the number of days in the most recent fiscal half-year, divided by 365, to reflect the one-half year period. Annualized expense ratio reflects actual expenses, including any applicable fee waivers or expense reimbursements and excluding any acquired fund fees and expenses.
DECEMBER 31, 2021
| | | | | | | | |
| Shares | Value |
| COMMON STOCKS — 92.7% |
|
|
| Air Freight and Logistics — 1.8% | | |
| United Parcel Service, Inc., Class B | 596 | | $ | 127,746 | |
| Auto Components — 1.8% | | |
Aptiv plc(1) | 773 | | 127,506 | |
| Automobiles — 3.6% | | |
Rivian Automotive, Inc., Class A(1) | 225 | | 23,330 | |
Tesla, Inc.(1) | 229 | | 242,003 | |
| | 265,333 | |
| Beverages — 1.9% | | |
| PepsiCo, Inc. | 777 | | 134,973 | |
| Biotechnology — 1.4% | | |
| Amgen, Inc. | 195 | | 43,869 | |
CRISPR Therapeutics AG(1)(2) | 144 | | 10,913 | |
Natera, Inc.(1) | 167 | | 15,596 | |
Vertex Pharmaceuticals, Inc.(1) | 157 | | 34,477 | |
| | 104,855 | |
| Building Products — 1.0% | | |
| Masco Corp. | 547 | | 38,410 | |
Trex Co., Inc.(1) | 279 | | 37,674 | |
| | 76,084 | |
| Capital Markets — 1.6% | | |
| S&P Global, Inc. | 243 | | 114,679 | |
| Chemicals — 0.8% | | |
| Air Products and Chemicals, Inc. | 187 | | 56,897 | |
| Electrical Equipment — 2.3% | | |
Ballard Power Systems, Inc.(1)(2) | 876 | | 11,003 | |
Generac Holdings, Inc.(1) | 151 | | 53,140 | |
| Rockwell Automation, Inc. | 291 | | 101,515 | |
| | 165,658 | |
| Electronic Equipment, Instruments and Components — 2.2% | | |
| CDW Corp. | 216 | | 44,232 | |
| Cognex Corp. | 643 | | 50,000 | |
Keysight Technologies, Inc.(1) | 331 | | 68,355 | |
| | 162,587 | |
| Entertainment — 2.0% | | |
Liberty Media Corp.-Liberty Formula One, Class C(1) | 489 | | 30,924 | |
Take-Two Interactive Software, Inc.(1) | 181 | | 32,167 | |
Walt Disney Co. (The)(1) | 529 | | 81,937 | |
| | 145,028 | |
| Equity Real Estate Investment Trusts (REITs) — 1.1% | | |
| SBA Communications Corp. | 211 | | 82,083 | |
| Food Products — 0.9% | | |
| Mondelez International, Inc., Class A | 881 | | 58,419 | |
Vital Farms, Inc.(1) | 390 | | 7,043 | |
| | 65,462 | |
| Health Care Equipment and Supplies — 2.7% | | |
DexCom, Inc.(1) | 101 | | 54,232 | |
| | | | | | | | |
| Shares | Value |
Edwards Lifesciences Corp.(1) | 293 | | $ | 37,958 | |
IDEXX Laboratories, Inc.(1) | 49 | | 32,264 | |
Intuitive Surgical, Inc.(1) | 192 | | 68,986 | |
| | 193,440 | |
| Health Care Providers and Services — 1.8% | | |
Guardant Health, Inc.(1) | 104 | | 10,402 | |
| UnitedHealth Group, Inc. | 241 | | 121,016 | |
| | 131,418 | |
| Hotels, Restaurants and Leisure — 1.4% | | |
Chipotle Mexican Grill, Inc.(1) | 26 | | 45,454 | |
Dutch Bros, Inc., Class A(1) | 160 | | 8,146 | |
Expedia Group, Inc.(1) | 256 | | 46,264 | |
| | 99,864 | |
| Household Products — 0.7% | | |
| Procter & Gamble Co. (The) | 327 | | 53,491 | |
| Insurance — 0.1% | | |
SelectQuote, Inc.(1) | 964 | | 8,734 | |
| Interactive Media and Services — 9.2% | | |
Alphabet, Inc., Class A(1) | 164 | | 475,115 | |
Meta Platforms, Inc., Class A(1) | 457 | | 153,712 | |
Snap, Inc., Class A(1) | 443 | | 20,834 | |
Twitter, Inc.(1) | 499 | | 21,567 | |
| | 671,228 | |
| Internet and Direct Marketing Retail — 6.1% | | |
Amazon.com, Inc.(1) | 125 | | 416,793 | |
Chewy, Inc., Class A(1)(2) | 495 | | 29,190 | |
| | 445,983 | |
| IT Services — 7.2% | | |
Okta, Inc.(1) | 136 | | 30,487 | |
PayPal Holdings, Inc.(1) | 843 | | 158,973 | |
Shopify, Inc., Class A(1) | 14 | | 19,283 | |
Twilio, Inc., Class A(1) | 76 | | 20,014 | |
| Visa, Inc., Class A | 1,374 | | 297,760 | |
| | 526,517 | |
| Life Sciences Tools and Services — 1.4% | | |
10X Genomics, Inc., Class A(1) | 109 | | 16,237 | |
| Agilent Technologies, Inc. | 425 | | 67,851 | |
Repligen Corp.(1) | 71 | | 18,803 | |
| | 102,891 | |
| Personal Products — 0.7% | | |
| Estee Lauder Cos., Inc. (The), Class A | 129 | | 47,756 | |
| Pharmaceuticals — 1.7% | | |
| Novo Nordisk A/S, B Shares | 310 | | 34,821 | |
| Zoetis, Inc. | 367 | | 89,559 | |
| | 124,380 | |
| Road and Rail — 1.1% | | |
Lyft, Inc., Class A(1) | 633 | | 27,048 | |
| Union Pacific Corp. | 198 | | 49,882 | |
| | 76,930 | |
| Semiconductors and Semiconductor Equipment — 8.6% | | |
Advanced Micro Devices, Inc.(1) | 951 | | 136,849 | |
| Analog Devices, Inc. | 456 | | 80,151 | |
| | | | | | | | |
| Shares | Value |
| ASML Holding NV | 143 | | $ | 114,546 | |
| NVIDIA Corp. | 1,011 | | 297,345 | |
| | 628,891 | |
| Software — 15.4% | | |
Datadog, Inc., Class A(1) | 277 | | 49,337 | |
DocuSign, Inc.(1) | 154 | | 23,456 | |
| Microsoft Corp. | 2,481 | | 834,410 | |
PagerDuty, Inc.(1) | 723 | | 25,124 | |
Paycor HCM, Inc.(1)(2) | 196 | | 5,647 | |
salesforce.com, Inc.(1) | 179 | | 45,489 | |
Splunk, Inc.(1) | 267 | | 30,897 | |
Workday, Inc., Class A(1) | 190 | | 51,904 | |
Zendesk, Inc.(1) | 539 | | 56,212 | |
| | 1,122,476 | |
| Specialty Retail — 2.4% | | |
| Home Depot, Inc. (The) | 427 | | 177,209 | |
| Technology Hardware, Storage and Peripherals — 8.1% | | |
| Apple, Inc. | 3,329 | | 591,130 | |
| Textiles, Apparel and Luxury Goods — 1.7% | | |
| NIKE, Inc., Class B | 755 | | 125,836 | |
TOTAL COMMON STOCKS (Cost $2,949,458) | | 6,757,065 | |
| EXCHANGE-TRADED FUNDS — 7.1% |
|
|
| Invesco QQQ Trust Series 1 | 654 | | 260,194 | |
| iShares Russell 1000 Growth ETF | 849 | | 259,446 | |
TOTAL EXCHANGE-TRADED FUNDS (Cost $477,161) | | 519,640 | |
| TEMPORARY CASH INVESTMENTS — 0.3% |
|
|
| Repurchase Agreement, BMO Capital Markets Corp., (collateralized by various U.S. Treasury obligations, 2.00% - 2.375%, 4/30/24 - 5/15/51, valued at $9,864), in a joint trading account at 0.01%, dated 12/31/21, due 1/3/22 (Delivery value $9,669) | | 9,669 | |
| State Street Institutional U.S. Government Money Market Fund, Premier Class | 8,367 | | 8,367 | |
TOTAL TEMPORARY CASH INVESTMENTS (Cost $18,036) | | 18,036 | |
TEMPORARY CASH INVESTMENTS - SECURITIES LENDING COLLATERAL(3) — 0.6% |
State Street Navigator Securities Lending Government Money Market Portfolio (Cost $46,766) | 46,766 | | 46,766 | |
TOTAL INVESTMENT SECURITIES — 100.7% (Cost $3,491,421) |
| 7,341,507 | |
| OTHER ASSETS AND LIABILITIES — (0.7)% |
| (51,848) | |
| TOTAL NET ASSETS — 100.0% |
| $ | 7,289,659 | |
| | | | | | | | | | | | | | | | | | | | |
| FORWARD FOREIGN CURRENCY EXCHANGE CONTRACTS | | |
| Currency Purchased | Currency Sold | Counterparty | Settlement Date | Unrealized Appreciation
(Depreciation) |
| EUR | 1,896 | | USD | 2,141 | | Credit Suisse AG | 3/31/22 | $ | 22 | |
| USD | 93,015 | | EUR | 82,143 | | Credit Suisse AG | 3/31/22 | (676) | |
| USD | 3,282 | | EUR | 2,893 | | Credit Suisse AG | 3/31/22 | (17) | |
| USD | 3,199 | | EUR | 2,820 | | UBS AG | 3/31/22 | (18) | |
| | | | | | $ | (689) | |
| | | | | | | | |
| NOTES TO SCHEDULE OF INVESTMENTS |
| EUR | - | Euro |
| USD | - | United States Dollar |
(1)Non-income producing.
(2)Security, or a portion thereof, is on loan. At the period end, the aggregate value of securities on loan was $56,752. The amount of securities on loan indicated may not correspond with the securities on loan identified because securities with pending sales are in the process of recall from the brokers.
(3)Investment of cash collateral from securities on loan. At the period end, the aggregate value of the collateral held by the fund was $58,127, which includes securities collateral of $11,361.
See Notes to Financial Statements.
| | |
| Statement of Assets and Liabilities |
| | | | | |
| DECEMBER 31, 2021 | |
| Assets | |
Investment securities, at value (cost of $3,444,655) — including $56,752 of
securities on loan | $ | 7,294,741 | |
Investment made with cash collateral received for securities on loan, at value
(cost of $46,766) | 46,766 | |
| Total investment securities, at value (cost of $3,491,421) | 7,341,507 | |
| Unrealized appreciation on forward foreign currency exchange contracts | 22 | |
| Dividends receivable | 1,424 | |
| Securities lending receivable | 57 | |
| 7,343,010 | |
| |
| Liabilities | |
| Payable for collateral received for securities on loan | 46,766 | |
| Payable for capital shares redeemed | 238 | |
| Unrealized depreciation on forward foreign currency exchange contracts | 711 | |
| Accrued management fees | 4,437 | |
| Distribution fees payable | 1,199 | |
| 53,351 | |
| |
| Net Assets | $ | 7,289,659 | |
| |
| Net Assets Consist of: | |
| Capital (par value and paid-in surplus) | $ | 2,926,649 | |
| Distributable earnings | 4,363,010 | |
| $ | 7,289,659 | |
| | | | | | | | | | | |
| Net Assets | Shares Outstanding | Net Asset Value Per Share |
| Class I, $0.01 Par Value | $1,608,349 | 73,756 | $21.81 |
| Class II, $0.01 Par Value | $5,681,310 | 261,623 | $21.72 |
See Notes to Financial Statements.
| | | | | |
| YEAR ENDED DECEMBER 31, 2021 |
| Investment Income (Loss) | |
| Income: | |
| Dividends (net of foreign taxes withheld of $284) | $ | 35,135 | |
| Securities lending, net | 263 | |
| 35,398 | |
| |
| Expenses: | |
| Management fees | 51,990 | |
| Distribution fees - Class II | 13,694 | |
| Directors' fees and expenses | 145 | |
| Other expenses | 27 | |
| 65,856 | |
Fees waived(1) | (9,494) | |
| 56,362 | |
| |
| Net investment income (loss) | (20,964) | |
| |
| Realized and Unrealized Gain (Loss) | |
| Net realized gain (loss) on: | |
| Investment transactions | 543,696 | |
| Forward foreign currency exchange contract transactions | 7,980 | |
| Foreign currency translation transactions | (81) | |
| 551,595 | |
| |
| Change in net unrealized appreciation (depreciation) on: | |
| Investments | 917,236 | |
| Forward foreign currency exchange contracts | (905) | |
| 916,331 | |
| |
| Net realized and unrealized gain (loss) | 1,467,926 | |
| |
| Net Increase (Decrease) in Net Assets Resulting from Operations | $ | 1,446,962 | |
(1)Amount consists of $595 and $8,899 for Class I and Class II, respectively.
See Notes to Financial Statements.
| | |
| Statement of Changes in Net Assets |
| | | | | | | | |
| YEARS ENDED DECEMBER 31, 2021 AND DECEMBER 31, 2020 |
| Increase (Decrease) in Net Assets | December 31, 2021 | December 31, 2020 |
| Operations | | |
| Net investment income (loss) | $ | (20,964) | | $ | (5,594) | |
| Net realized gain (loss) | 551,595 | | 953,019 | |
| Change in net unrealized appreciation (depreciation) | 916,331 | | 600,984 | |
| Net increase (decrease) in net assets resulting from operations | 1,446,962 | | 1,548,409 | |
| | |
| Distributions to Shareholders |
| From earnings: | | |
| Class I | (2,122) | | (597) | |
| Class II | (934,935) | | (377,935) | |
| Decrease in net assets from distributions | (937,057) | | (378,532) | |
| | |
| Capital Share Transactions |
| Net increase (decrease) in net assets from capital share transactions (Note 5) | 1,524,253 | | (1,502,276) | |
| | |
| Net increase (decrease) in net assets | 2,034,158 | | (332,399) | |
| | |
| Net Assets |
| Beginning of period | 5,255,501 | | 5,587,900 | |
| End of period | $ | 7,289,659 | | $ | 5,255,501 | |
See Notes to Financial Statements.
| | |
| Notes to Financial Statements |
DECEMBER 31, 2021
1. Organization
American Century Variable Portfolios, Inc. (the corporation) is registered under the Investment Company Act of 1940, as amended (the 1940 Act), as an open-end management investment company and is organized as a Maryland corporation. VP Growth Fund (the fund) is one fund in a series issued by the corporation. The fund’s investment objective is to seek long-term capital growth. The fund offers Class I and Class II.
2. Significant Accounting Policies
The following is a summary of significant accounting policies consistently followed by the fund in preparation of its financial statements. The fund is an investment company and follows accounting and reporting guidance in accordance with accounting principles generally accepted in the United States of America. This may require management to make certain estimates and assumptions at the date of the financial statements. Actual results could differ from these estimates. Management evaluated the impact of events or transactions occurring through the date the financial statements were issued that would merit recognition or disclosure.
Investment Valuations — The fund determines the fair value of its investments and computes its net asset value (NAV) per share at the close of regular trading (usually 4 p.m. Eastern time) on the New York Stock Exchange (NYSE) on each day the NYSE is open. The Board of Directors has adopted valuation policies and procedures to guide the investment advisor in the fund’s investment valuation process and to provide methodologies for the oversight of the fund’s pricing function.
Equity securities that are listed or traded on a domestic securities exchange are valued at the last reported sales price or at the official closing price as provided by the exchange. Equity securities traded on foreign securities exchanges are generally valued at the closing price of such securities on the exchange where primarily traded or at the close of the NYSE, if that is earlier. If no last sales price is reported, or if local convention or regulation so provides, the mean of the latest bid and asked prices may be used. Securities traded over-the-counter are valued at the mean of the latest bid and asked prices, the last sales price, or the official closing price. Equity securities initially expressed in local currencies are translated into U.S. dollars at the mean of the appropriate currency exchange rate at the close of the NYSE as provided by an independent pricing service.
Open-end management investment companies are valued at the reported NAV per share. Repurchase agreements are valued at cost, which approximates fair value. Forward foreign currency exchange contracts are valued at the mean of the appropriate forward exchange rate at the close of the NYSE as provided by an independent pricing service.
If the fund determines that the market price for an investment is not readily available or the valuation methods mentioned above do not reflect an investment’s fair value, such investment is valued as determined in good faith by the Board of Directors or its delegate, in accordance with policies and procedures adopted by the Board of Directors. In its determination of fair value, the fund may review several factors including, but not limited to, market information regarding the specific investment or comparable investments and correlation with other investment types, futures indices or general market indicators. Circumstances that may cause the fund to use these procedures to value an investment include, but are not limited to: an investment has been declared in default or is distressed; trading in a security has been suspended during the trading day or a security is not actively trading on its principal exchange; prices received from a regular pricing source are deemed unreliable; or there is a foreign market holiday and no trading occurred.
The fund monitors for significant events occurring after the close of an investment’s primary exchange but before the fund’s NAV per share is determined. Significant events may include, but are not limited to: corporate announcements and transactions; governmental action and political unrest that could impact a specific investment or an investment sector; or armed conflicts, natural disasters and similar events that could affect investments in a specific country or region. The fund also monitors for significant fluctuations between domestic and foreign markets, as evidenced by the U.S. market or such other indicators that the Board of Directors, or its delegate, deems appropriate. The fund may apply a model-derived factor to the closing price of equity securities traded on foreign securities exchanges. The factor is based on observable market data as provided by an independent pricing service.
Security Transactions — Security transactions are accounted for as of the trade date. Net realized gains and losses are determined on the identified cost basis, which is also used for federal income tax purposes.
Investment Income — Dividend income less foreign taxes withheld, if any, is recorded as of the ex-dividend date. Distributions received on securities that represent a return of capital or long-term capital gain are recorded as a reduction of cost of investments and/or as a realized gain. The fund may estimate the components of distributions received that may be considered nontaxable distributions or long-term capital gain distributions for income tax purposes. Securities lending income is net of fees and rebates earned by the lending agent for its services.
Foreign Currency Translations — All assets and liabilities initially expressed in foreign currencies are translated into U.S. dollars at prevailing exchange rates at period end. The fund may enter into spot foreign currency exchange contracts to facilitate transactions denominated in a foreign currency. Purchases and sales of investment securities, dividend and interest income, spot foreign currency exchange contracts, and expenses are translated at the rates of exchange prevailing on the respective dates of such transactions. Net realized and unrealized foreign currency exchange gains or losses related to investment securities are a component of net realized gain (loss) on investment transactions and change in net unrealized appreciation (depreciation) on investments, respectively.
Repurchase Agreements — The fund may enter into repurchase agreements with institutions that American Century Investment Management, Inc. (ACIM) (the investment advisor) has determined are creditworthy pursuant to criteria adopted by the Board of Directors. The fund requires that the collateral, represented by securities, received in a repurchase transaction be transferred to the custodian in a manner sufficient to enable the fund to obtain those securities in the event of a default under the repurchase agreement. ACIM monitors, on a daily basis, the securities transferred to ensure the value, including accrued interest, of the securities under each repurchase agreement is equal to or greater than amounts owed to the fund under each repurchase agreement.
Joint Trading Account — Pursuant to an Exemptive Order issued by the Securities and Exchange Commission, the fund, along with certain other funds in the American Century Investments family of funds, may transfer uninvested cash balances into a joint trading account. These balances are invested in one or more repurchase agreements that are collateralized by U.S. Treasury or Agency obligations.
Segregated Assets — In accordance with the 1940 Act, the fund segregates assets on its books and records to cover certain types of investment securities and other financial instruments. ACIM monitors, on a daily basis, the securities segregated to ensure the fund designates a sufficient amount of liquid assets, marked-to-market daily. The fund may also receive assets or be required to pledge assets at the custodian bank or with a broker for collateral requirements.
Income Tax Status — It is the fund’s policy to distribute substantially all net investment income and net realized gains to shareholders and to otherwise qualify as a regulated investment company under provisions of the Internal Revenue Code. Accordingly, no provision has been made for income taxes. The fund files U.S. federal, state, local and non-U.S. tax returns as applicable. The fund's tax returns are subject to examination by the relevant taxing authority until expiration of the applicable statute of limitations, which is generally three years from the date of filing but can be longer in certain jurisdictions. At this time, management believes there are no uncertain tax positions which, based on their technical merit, would not be sustained upon examination and for which it is reasonably possible that the total amounts of unrecognized tax benefits will significantly change in the next twelve months.
Multiple Class — All shares of the fund represent an equal pro rata interest in the net assets of the class to which such shares belong, and have identical voting, dividend, liquidation and other rights and the same terms and conditions, except for class specific expenses and exclusive rights to vote on matters affecting only individual classes. Income, non-class specific expenses, and realized and unrealized capital gains and losses of the fund are allocated to each class of shares based on their relative net assets.
Distributions to Shareholders — Distributions from net investment income and net realized gains, if any, are generally declared and paid annually.
Indemnifications — Under the corporation’s organizational documents, its officers and directors are indemnified against certain liabilities arising out of the performance of their duties to the fund. In addition, in the normal course of business, the fund enters into contracts that provide general indemnifications. The maximum exposure under these arrangements is unknown as this would involve future claims that may be made against a fund. The risk of material loss from such claims is considered by management to be remote.
Securities Lending — Securities are lent to qualified financial institutions and brokers. State Street Bank & Trust Co. serves as securities lending agent to the fund pursuant to a Securities Lending Agreement. The lending of securities exposes the fund to risks such as: the borrowers may fail to return the loaned securities, the borrowers may not be able to provide additional collateral, the fund may experience delays in recovery of the loaned securities or delays in access to collateral, or the fund may experience losses related to the investment collateral. To minimize certain risks, loan counterparties pledge collateral in the form of cash and/or securities. The lending agent has agreed to indemnify the fund in the case of default of any securities borrowed. Cash collateral received is invested in the State Street Navigator Securities Lending Government Money Market Portfolio, a money market mutual fund registered under the 1940 Act. The loans may also be secured by U.S. government securities in an amount at least equal to the market value of the securities loaned, plus accrued interest and dividends, determined on a daily basis and adjusted accordingly. By lending securities, the fund seeks to increase its net investment income through the receipt of interest and fees. Such income is reflected separately within the Statement of Operations. The value of loaned securities and related collateral outstanding at period end, if any, are shown on a gross basis within the Schedule of Investments and Statement of Assets and Liabilities.
The following table reflects a breakdown of transactions accounted for as secured borrowings, the gross obligation by the type of collateral pledged, and the remaining contractual maturity of those transactions as of December 31, 2021.
| | | | | | | | | | | | | | | | | |
| Remaining Contractual Maturity of Agreements |
| Overnight and Continuous | <30 days | Between 30 & 90 days | >90 days | Total |
Securities Lending Transactions(1) | | | | |
| Common Stocks | $ | 46,766 | | — | | — | | — | | $ | 46,766 | |
| Gross amount of recognized liabilities for securities lending transactions | $ | 46,766 | |
(1)Amount represents the payable for cash collateral received for securities on loan. This will generally be in the Overnight and Continuous column as the securities are typically callable on demand.
3. Fees and Transactions with Related Parties
Certain officers and directors of the corporation are also officers and/or directors of American Century Companies, Inc. (ACC). The corporation’s investment advisor, ACIM, the corporation's distributor, American Century Investment Services, Inc. (ACIS), and the corporation’s transfer agent, American Century Services, LLC, are wholly owned, directly or indirectly, by ACC.
Management Fees — The corporation has entered into a management agreement with ACIM, under which ACIM provides the fund with investment advisory and management services in exchange for a single, unified management fee (the fee) per class. The agreement provides that ACIM will pay all expenses of managing and operating the fund, except brokerage expenses, taxes, interest, fees and expenses of the independent directors (including legal counsel fees), extraordinary expenses, and expenses incurred in connection with the provision of shareholder services and distribution services under a plan adopted pursuant to Rule 12b-1 under the 1940 Act. The fee is computed and accrued daily based on each class's daily net assets and paid monthly in arrears. The difference in the fee among the classes is a result of their separate arrangements for non-Rule 12b-1 shareholder services. It is not the result of any difference in advisory or custodial fees or other expenses related to the management of the fund’s assets, which do not vary by class. From January 1, 2021 through July 31, 2021, the investment advisor agreed to waive 0.21% of the fund's management fee. Effective August 1, 2021, the investment advisor agreed to waive 0.10% of the fund's management fee. The investment advisor expects this waiver to continue until July 31, 2022 and cannot terminate it prior to such date without the approval of the Board of Directors.
The annual management fee and the effective annual management fee before and after waiver for each class for the period ended December 31, 2021 are as follows:
| | | | | | | | | | | |
| | Effective Annual Management Fee |
| Annual Management Fee* | Before Waiver | After Waiver |
| Class I | 0.90% | 0.96% | 0.80% |
| Class II | 0.80% | 0.86% | 0.70% |
*Prior to August 1, 2021, the annual management fee was 1.00% for Class I and 0.90% for Class II.
Distribution Fees — The Board of Directors has adopted the Master Distribution Plan (the plan) for Class II, pursuant to Rule 12b-1 of the 1940 Act. The plan provides that Class II will pay ACIS an annual distribution fee equal to 0.25%. The fee is computed and accrued daily based on the Class II daily net assets and paid monthly in arrears. The distribution fee provides compensation for expenses incurred in connection with distributing shares of Class II including, but not limited to, payments to brokers, dealers, and financial institutions that have entered into sales agreements with respect to shares of the fund. Fees incurred under the plan during the period ended December 31, 2021 are detailed in the Statement of Operations.
Directors' Fees and Expenses — The Board of Directors is responsible for overseeing the investment advisor’s management and operations of the fund. The directors receive detailed information about the fund and its investment advisor regularly throughout the year, and meet at least quarterly with management of the investment advisor to review reports about fund operations. The fund’s officers do not receive compensation from the fund.
Interfund Transactions — The fund may enter into security transactions with other American Century Investments funds and other client accounts of the investment advisor, in accordance with the 1940 Act rules and procedures adopted by the Board of Directors. The rules and procedures require, among other things, that these transactions be effected at the independent current market price of the security. During the period, the interfund purchases were $1,299 and there were no interfund sales.
4. Investment Transactions
Purchases and sales of investment securities, excluding short-term investments, for the period ended December 31, 2021 were $3,007,340 and $2,437,449, respectively.
5. Capital Share Transactions
Transactions in shares of the fund were as follows:
| | | | | | | | | | | | | | |
| Year ended
December 31, 2021 | Year ended
December 31, 2020 |
| Shares | Amount | Shares | Amount |
| Class I/Shares Authorized | 50,000,000 | | | 50,000,000 | | |
| Sold | 74,297 | | $ | 1,510,062 | | 41 | | $ | 800 | |
| Issued in reinvestment of distributions | 124 | | 2,122 | | 47 | | 597 | |
| Redeemed | (1,224) | | (26,345) | | — | | — | |
| 73,197 | | 1,485,839 | | 88 | | 1,397 | |
| Class II/Shares Authorized | 50,000,000 | | | 50,000,000 | | |
| Sold | 14,810 | | 294,899 | | 19,373 | | 346,969 | |
| Issued in reinvestment of distributions | 54,707 | | 934,935 | | 29,735 | | 377,935 | |
| Redeemed | (59,160) | | (1,191,420) | | (125,695) | | (2,228,577) | |
| 10,357 | | 38,414 | | (76,587) | | (1,503,673) | |
| Net increase (decrease) | 83,554 | | $ | 1,524,253 | | (76,499) | | $ | (1,502,276) | |
6. Fair Value Measurements
The fund’s investments valuation process is based on several considerations and may use multiple inputs to determine the fair value of the investments held by the fund. In conformity with accounting principles generally accepted in the United States of America, the inputs used to determine a valuation are classified into three broad levels.
•Level 1 valuation inputs consist of unadjusted quoted prices in an active market for identical investments.
•Level 2 valuation inputs consist of direct or indirect observable market data (including quoted prices for comparable investments, evaluations of subsequent market events, interest rates, prepayment speeds, credit risk, etc.). These inputs also consist of quoted prices for identical investments initially expressed in local currencies that are adjusted through translation into U.S. dollars.
•Level 3 valuation inputs consist of unobservable data (including a fund’s own assumptions).
The level classification is based on the lowest level input that is significant to the fair valuation measurement. The valuation inputs are not necessarily an indication of the risks associated with investing in these securities or other financial instruments.
The following is a summary of the level classifications as of period end. The Schedule of Investments provides additional information on the fund’s portfolio holdings.
| | | | | | | | | | | |
| Level 1 | Level 2 | Level 3 |
| Assets | | | |
| Investment Securities | | | |
| Common Stocks | $ | 6,607,698 | | $ | 149,367 | | — | |
| Exchange-Traded Funds | 519,640 | | — | | — | |
| Temporary Cash Investments | 8,367 | | 9,669 | | — | |
| Temporary Cash Investments - Securities Lending Collateral | 46,766 | | — | | — | |
| $ | 7,182,471 | | $ | 159,036 | | — | |
| Other Financial Instruments | | | |
| Forward Foreign Currency Exchange Contracts | — | | $ | 22 | | — | |
| | | |
| Liabilities | | | |
| Other Financial Instruments | | | |
| Forward Foreign Currency Exchange Contracts | — | | $ | 711 | | — | |
7. Derivative Instruments
Foreign Currency Risk — The fund is subject to foreign currency exchange rate risk in the normal course of pursuing its investment objectives. The value of foreign investments held by a fund may be significantly affected by changes in foreign currency exchange rates. The dollar value of a foreign security generally decreases when the value of the dollar rises against the foreign currency in which the security is denominated and tends to increase when the value of the dollar declines against such foreign currency. A fund may enter into forward foreign currency exchange contracts to reduce a fund's exposure to foreign currency exchange rate fluctuations. The net U.S. dollar value of foreign currency underlying all contractual commitments held by a fund and the resulting unrealized appreciation or depreciation are determined daily. Realized gain or loss is recorded upon settlement of the contract. Net realized and unrealized gains or losses occurring during the holding period of forward foreign currency exchange contracts are a component of net realized gain (loss) on forward foreign currency exchange contract transactions and change in net unrealized appreciation (depreciation) on forward foreign currency exchange contracts, respectively. A fund bears the risk of an unfavorable change in the foreign currency exchange rate underlying the forward contract. Additionally, losses, up to the fair value, may arise if the counterparties do not perform under the contract terms. The fund's average U.S. dollar exposure to foreign currency risk derivative instruments held during the period was $119,072.
The value of foreign currency risk derivative instruments as of December 31, 2021, is disclosed on the Statement of Assets and Liabilities as an asset of $22 in unrealized appreciation on forward foreign currency exchange contracts and a liability of $711 in unrealized depreciation on forward foreign currency exchange contracts. For the year ended December 31, 2021, the effect of foreign currency risk derivative instruments on the Statement of Operations was $7,980 in net realized gain (loss) on forward foreign currency exchange contract transactions and $(905) in change in net unrealized appreciation (depreciation) on forward foreign currency exchange contracts.
8. Risk Factors
The value of the fund’s shares will go up and down, sometimes rapidly or unpredictably, based on the performance of the securities owned by the fund and other factors generally affecting the securities market. Market risks, including political, regulatory, economic and social developments, can affect the value of the fund’s investments. Natural disasters, public health emergencies, terrorism and other unforeseeable events may lead to increased market volatility and may have adverse long-term effects on world economies and markets generally.
9. Federal Tax Information
The tax character of distributions paid during the years ended December 31, 2021 and December 31, 2020 were as follows:
| | | | | | | | |
| 2021 | 2020 |
| Distributions Paid From | | |
| Ordinary income | $ | 37,465 | | $ | 36,258 | |
| Long-term capital gains | $ | 899,592 | | $ | 342,274 | |
The book-basis character of distributions made during the year from net investment income or net realized gains may differ from their ultimate characterization for federal income tax purposes. These differences reflect the differing character of certain income items and net realized gains and losses for financial statement and tax purposes, and may result in reclassification among certain capital accounts on the financial statements.
As of period end, the federal tax cost of investments and the components of distributable earnings on a tax-basis were as follows:
| | | | | |
| Federal tax cost of investments | $ | 3,510,240 | |
| Gross tax appreciation of investments | $ | 3,894,489 | |
| Gross tax depreciation of investments | (63,222) | |
| Net tax appreciation (depreciation) of investments | $ | 3,831,267 | |
| Undistributed ordinary income | $ | 48,637 | |
| Accumulated long-term gains | $ | 483,106 | |
The difference between book-basis and tax-basis unrealized appreciation (depreciation) is attributable primarily to the tax deferral of losses on wash sales.
| | | | | | | | | | | | | | | | | | | | | | | | | | | | | | | | | | | | | | | | | | | | | | | |
| For a Share Outstanding Throughout the Years Ended December 31 (except as noted) | | | |
| Per-Share Data | | | Ratios and Supplemental Data |
| | Income From Investment Operations: | Distributions From: | | | Ratio to Average Net Assets of: | | |
| Net Asset
Value,
Beginning
of Period | Net Investment Income (Loss)(1) | Net
Realized
and
Unrealized
Gain (Loss) | Total From
Investment
Operations | Net
Investment
Income | Net
Realized
Gains | Total
Distributions | Net Asset
Value,
End
of Period | Total Return(2) | Operating
Expenses | Operating
Expenses
(before
expense
waiver) | Net
Investment
Income
(Loss) | Net
Investment
Income
(Loss)
(before
expense
waiver) | Portfolio
Turnover
Rate | Net
Assets,
End of
Period
(in thousands) |
| Class I |
| 2021 | $20.91 | (0.05) | 4.75 | 4.70 | — | (3.80) | (3.80) | $21.81 | 27.40% | 0.80% | 0.96% | (0.21)% | (0.37)% | 41% | $1,608 | |
| 2020 | $17.05 | 0.01 | 5.11 | 5.12 | (0.07) | (1.19) | (1.26) | $20.91 | 34.87% | 0.81% | 1.01% | 0.04% | (0.16)% | 48% | $12 | |
| 2019 | $14.34 | 0.07 | 4.66 | 4.73 | (0.06) | (1.96) | (2.02) | $17.05 | 35.48% | 0.81% | 1.00% | 0.43% | 0.24% | 52% | $8 | |
| 2018 | $14.87 | 0.05 | (0.24) | (0.19) | (0.04) | (0.30) | (0.34) | $14.34 | (1.36)% | 0.82% | 1.00% | 0.28% | 0.10% | 63% | $6 | |
| 2017 | $13.27 | 0.05 | 3.84 | 3.89 | (0.12) | (2.17) | (2.29) | $14.87 | 30.38% | 0.84% | 1.01% | 0.35% | 0.18% | 60% | $150 | |
| Class II |
| 2021 | $20.87 | (0.07) | 4.72 | 4.65 | — | (3.80) | (3.80) | $21.72 | 27.14% | 0.95% | 1.11% | (0.36)% | (0.52)% | 41% | $5,681 | |
| 2020 | $17.02 | (0.02) | 5.12 | 5.10 | (0.06) | (1.19) | (1.25) | $20.87 | 34.67% | 0.96% | 1.16% | (0.11)% | (0.31)% | 48% | $5,244 | |
| 2019 | $14.31 | 0.04 | 4.67 | 4.71 | (0.04) | (1.96) | (2.00) | $17.02 | 35.33% | 0.96% | 1.15% | 0.28% | 0.09% | 52% | $5,580 | |
| 2018 | $14.85 | 0.02 | (0.24) | (0.22) | (0.02) | (0.30) | (0.32) | $14.31 | (1.59)% | 0.97% | 1.15% | 0.13% | (0.05)% | 63% | $4,688 | |
| 2017 | $13.25 | 0.03 | 3.84 | 3.87 | (0.10) | (2.17) | (2.27) | $14.85 | 30.22% | 0.99% | 1.16% | 0.20% | 0.03% | 60% | $5,363 | |
| | | | | | | | |
| Notes to Financial Highlights |
(1)Computed using average shares outstanding throughout the period.
(2)Total returns are calculated based on the net asset value of the last business day. Total returns for periods less than one year are not annualized. The total returns presented do not include the fees and charges assessed with investments in variable insurance products, those charges are disclosed in the separate account prospectus. The inclusion of such fees and charges would lower total return.
See Notes to Financial Statements.
| | |
| Report of Independent Registered Public Accounting Firm |
To the Shareholders and the Board of Directors of American Century Variable Portfolios, Inc.:
Opinion on the Financial Statements and Financial Highlights
We have audited the accompanying statement of assets and liabilities, including the schedule of investments, of VP Growth Fund (the “Fund”), one of the funds constituting the American Century Variable Portfolios, Inc., as of December 31, 2021, the related statement of operations for the year then ended, the statements of changes in net assets for each of the two years in the period then ended, the financial highlights for each of the five years in the period then ended, and the related notes. In our opinion, the financial statements and financial highlights present fairly, in all material respects, the financial position of VP Growth Fund of the American Century Variable Portfolios, Inc. as of December 31, 2021, and the results of its operations for the year then ended, the changes in its net assets for each of the two years in the period then ended, and the financial highlights for each of the five years in the period then ended, in conformity with accounting principles generally accepted in the United States of America.
Basis for Opinion
These financial statements and financial highlights are the responsibility of the Fund's management. Our responsibility is to express an opinion on the Fund’s financial statements and financial highlights based on our audits. We are a public accounting firm registered with the Public Company Accounting Oversight Board (United States) (PCAOB) and are required to be independent with respect to the Fund in accordance with the U.S. federal securities laws and the applicable rules and regulations of the Securities and Exchange Commission and the PCAOB.
We conducted our audits in accordance with the standards of the PCAOB. Those standards require that we plan and perform the audit to obtain reasonable assurance about whether the financial statements and financial highlights are free of material misstatement, whether due to error or fraud. The Fund is not required to have, nor were we engaged to perform, an audit of its internal control over financial reporting. As part of our audits, we are required to obtain an understanding of internal control over financial reporting but not for the purpose of expressing an opinion on the effectiveness of the Fund’s internal control over financial reporting. Accordingly, we express no such opinion.
Our audits included performing procedures to assess the risks of material misstatement of the financial statements and financial highlights, whether due to error or fraud, and performing procedures that respond to those risks. Such procedures included examining, on a test basis, evidence regarding the amounts and disclosures in the financial statements and financial highlights. Our audits also included evaluating the accounting principles used and significant estimates made by management, as well as evaluating the overall presentation of the financial statements and financial highlights. Our procedures included confirmation of securities owned as of December 31, 2021, by correspondence with the custodian and brokers; when replies were not received from brokers, we performed other auditing procedures. We believe that our audits provide a reasonable basis for our opinion.
/s/ Deloitte & Touche LLP
Kansas City, Missouri
February 10, 2022
We have served as the auditor of one or more American Century investment companies since 1997.
The Board of Directors
The individuals listed below serve as directors of the funds. Each director will continue to serve in this capacity until death, retirement, resignation or removal from office. The board has adopted a mandatory retirement age for directors who are not “interested persons,” as that term is defined in the Investment Company Act (independent directors). Independent directors shall retire on December 31 of the year in which they reach their 75th birthday.
Mr. Thomas is an “interested person” because he currently serves as President and Chief Executive Officer of American Century Companies, Inc. (ACC), the parent company of American Century Investment Management, Inc. (ACIM or the advisor). The other directors (more than three-fourths of the total number) are independent. They are not employees, directors or officers of, and have no financial interest in, ACC or any of its wholly owned, direct or indirect, subsidiaries, including ACIM, American Century Investment Services, Inc. (ACIS) and American Century Services, LLC (ACS), and they do not have any other affiliations, positions or relationships that would cause them to be considered “interested persons” under the Investment Company Act. The directors serve in this capacity for seven (in the case of Jonathan S. Thomas, 16; and Stephen E. Yates, 8) registered investment companies in the American Century Investments family of funds.
The following table presents additional information about the directors. The mailing address for each director is 4500 Main Street, Kansas City, Missouri 64111.
| | | | | | | | | | | | | | | | | |
Name
(Year of Birth) | Position(s) Held with Funds | Length of Time Served | Principal Occupation(s) During Past 5 Years | Number of American Century Portfolios Overseen by Director | Other Directorships Held During Past 5 Years |
| Independent Directors | | |
| Thomas W. Bunn (1953) | Director | Since 2017 | Retired | 72 | SquareTwo Financial |
Chris H. Cheesman
(1962)
| Director | Since 2019
| Retired. Senior Vice President & Chief Audit Executive, AllianceBernstein (1999 to 2018)
| 72 | Alleghany Corporation |
Barry Fink
(1955) | Director | Since 2012 (independent since 2016) | Retired | 72 | None |
Rajesh K. Gupta
(1960)
| Director | Since 2019
| Partner Emeritus, SeaCrest Investment Management and SeaCrest Wealth Management (2019 to Present); Chief Executive Officer and Chief Investment Officer, SeaCrest Investment Management (2006 to 2019); Chief Executive Officer and Chief Investment Officer, SeaCrest Wealth Management (2008 to 2019) | 72 | None |
| | | | | | | | | | | | | | | | | |
Name
(Year of Birth) | Position(s) Held with Funds | Length of Time Served | Principal Occupation(s) During Past 5 Years | Number of American Century Portfolios Overseen by Director | Other Directorships Held During Past 5 Years |
| Independent Directors | | |
Lynn Jenkins
(1963)
| Director | Since 2019
| Consultant, LJ Strategies (2019 to present); United States Representative, U.S. House of Representatives (2009 to 2018) | 72 | MGP Ingredients, Inc. (2019 to 2021) |
Jan M. Lewis
(1957) | Director | Since 2011 | Retired | 72 | None |
John R. Whitten(1) (1946) | Director | Since 2008 | Retired | 72 | Onto Innovation Inc. (2019 to 2020); Rudolph Technologies, Inc. (2006 to 2019) |
Stephen E. Yates
(1948) | Director and Chairman of the Board | Since 2012 (Chairman since 2018) | Retired | 108 | None |
| Interested Director | |
Jonathan S. Thomas
(1963) | Director | Since 2007 | President and Chief Executive Officer, ACC (2007 to present). Also serves as Chief Executive Officer, ACS; Director, ACC and other ACC subsidiaries | 146 | None |
(1) Effective December 31, 2021, John R. Whitten retired from the Board of Directors.
The Statement of Additional Information has additional information about the fund's directors and is available without charge, upon request, by calling 1-800-378-9878.
Officers
The following table presents certain information about the executive officers of the funds. Each officer serves as an officer for 16 (in the case of Robert J. Leach, 15) investment companies in the American Century family of funds. No officer is compensated for his or her service as an officer of the funds. The listed officers are interested persons of the funds and are appointed or re-appointed on an annual basis. The mailing address for each officer listed below is 4500 Main Street, Kansas City, Missouri 64111.
| | | | | | | | |
Name
(Year of Birth) | Offices with the Funds | Principal Occupation(s) During the Past Five Years |
Patrick Bannigan
(1965) | President since 2019 | Executive Vice President and Director, ACC (2012 to present); Chief Financial Officer, Chief Accounting Officer and Treasurer, ACC (2015 to present). Also serves as President, ACS; Vice President, ACIM; Chief Financial Officer, Chief Accounting Officer and/or Director, ACIM, ACS and other ACC subsidiaries |
R. Wes Campbell
(1974) | Chief Financial Officer and Treasurer since 2018 | Vice President, ACS, (2020 to present); Investment Operations and Investment Accounting, ACS (2000 to present) |
Amy D. Shelton
(1964) | Chief Compliance Officer and Vice President since 2014 | Chief Compliance Officer, American Century funds, (2014 to present); Chief Compliance Officer, ACIM (2014 to present); Chief Compliance Officer, ACIS (2009 to present). Also serves as Vice President, ACIS |
John Pak
(1968) | General Counsel and
Senior Vice President since 2021 | General Counsel and Senior Vice President, ACC (2021 to present); Also serves as General Counsel and Senior Vice President, ACIM, ACS and ACIS. Chief Legal Officer of Investment and Wealth Management, The Bank of New York Mellon (2014 to 2021) |
C. Jean Wade
(1964) | Vice President since 2012 | Senior Vice President, ACS (2017 to present); Vice President, ACS (2000 to 2017)
|
Robert J. Leach
(1966) | Vice President since 2006 | Vice President, ACS (2000 to present) |
David H. Reinmiller
(1963) | Vice President since 2000 | Attorney, ACC (1994 to present). Also serves as Vice President, ACIM and ACS |
Ward D. Stauffer
(1960) | Secretary since 2005 | Attorney, ACC (2003 to present) |
Proxy Voting Policies
A description of the policies that the fund's investment advisor uses in exercising the voting rights associated with the securities purchased and/or held by the fund is available without charge, upon request, by calling 1-800-378-9878. It is also available on American Century Investments’ website at americancentury.com/proxy and on the Securities and Exchange Commission’s website at sec.gov. Information regarding how the investment advisor voted proxies relating to portfolio securities during the most recent 12-month period ended June 30 is available on americancentury.com/proxy. It is also available at sec.gov.
Quarterly Portfolio Disclosure
The fund files its complete schedule of portfolio holdings with the Securities and Exchange Commission (SEC) for the first and third quarters of each fiscal year as an exhibit to its reports on Form N-PORT. These portfolio holdings are available on the fund's website at ipro.americancentury.com (for Investment Professionals) and, upon request, by calling 1-800-378-9878. The fund’s Form N-PORT reports are available on the SEC’s website at sec.gov.
Other Tax Information
The following information is provided pursuant to provisions of the Internal Revenue Code.
For corporate taxpayers, the fund hereby designates $37,465, or up to the maximum amount allowable, of ordinary income distributions paid during the fiscal year ended December 31, 2021 as qualified for the corporate dividends received deduction.
The fund hereby designates $899,592, or up to the maximum amount allowable, as long-term capital gain distributions (20% rate gain distributions) for the fiscal year ended December 31, 2021.
The fund hereby designates $37,465 as qualified short-term capital gain distributions for purposes of Internal Revenue Code Section 871 for the fiscal year ended December 31, 2021.
| | | | | | | | |
| |
| | |
| Contact Us | americancentury.com | |
| Automated Information Line | 1-800-345-8765 | |
| Investment Professional Service Representatives | 1-800-345-6488 | |
| Telecommunications Relay Service for the Deaf | 711 | |
| | |
| American Century Variable Portfolios, Inc. | |
| | |
Investment Advisor: American Century Investment Management, Inc. Kansas City, Missouri | |
| | |
| This report and the statements it contains are submitted for the general information of our shareholders. The report is not authorized for distribution to prospective investors unless preceded or accompanied by an effective prospectus. | |
| | |
©2022 American Century Proprietary Holdings, Inc. All rights reserved.
CL-ANN-91447 2202 | |
| | | | | |
| |
| Annual Report |
| |
| December 31, 2021 |
| |
| VP International Fund |
| Class I (AVIIX) |
| Class II (ANVPX) |
| | | | | |
| Performance | |
| Portfolio Commentary | |
| Fund Characteristics | |
| Shareholder Fee Example | |
| Schedule of Investments | |
| Statement of Assets and Liabilities | |
| Statement of Operations | |
| Statement of Changes in Net Assets | |
| Notes to Financial Statements | |
| Financial Highlights | |
| Report of Independent Registered Public Accounting Firm | |
| Management | |
| |
| |
| |
| Additional Information | |
Any opinions expressed in this report reflect those of the author as of the date of the report, and do not necessarily represent the opinions of American Century Investments® or any other person in the American Century Investments organization. Any such opinions are subject to change at any time based upon market or other conditions and American Century Investments disclaims any responsibility to update such opinions. These opinions may not be relied upon as investment advice and, because investment decisions made by American Century Investments funds are based on numerous factors, may not be relied upon as an indication of trading intent on behalf of any American Century Investments fund. Security examples are used for representational purposes only and are not intended as recommendations to purchase or sell securities. Performance information for comparative indices and securities is provided to American Century Investments by third party vendors. To the best of American Century Investments’ knowledge, such information is accurate at the time of printing.
| | | | | | | | | | | | | | | | | | |
| Total Returns as of December 31, 2021 | |
| | | Average Annual Returns | |
| Ticker
Symbol | 1 year | 5 years | 10 years | | Inception
Date |
| Class I | AVIIX | 8.75% | 14.35% | 10.06% | | 5/1/94 |
| MSCI EAFE Index | — | 11.26% | 9.54% | 8.02% | | — |
| MSCI EAFE Growth Index | — | 11.25% | 13.58% | 10.07% | | — |
| Class II | ANVPX | 8.60% | 14.16% | 9.89% | | 8/15/01 |
Fund returns would have been lower if a portion of the fees had not been waived.
The performance information presented does not include the fees and charges assessed with investments in variable insurance products, those charges are disclosed in the separate account prospectus. The inclusion of such fees and charges would lower performance.
Data presented reflect past performance. Past performance is no guarantee of future results. Current performance may be higher or lower than the performance shown. Total returns for periods less than one year are not annualized. Investment return and principal value will fluctuate, and redemption value may be more or less than original cost. Data assumes reinvestment of dividends and capital gains, and none of the charts reflect the deduction of taxes that a shareholder would pay on fund distributions or the redemption of fund shares. To obtain performance data current to the most recent month end, please call 1-800-345-6488 or visit ipro.americancentury.com (for Investment Professionals). For additional information about the fund, please consult the prospectus.
| | |
| Growth of $10,000 Over 10 Years |
| $10,000 investment made December 31, 2011 |
| Performance for other share classes will vary due to differences in fee structure. |
| | | | | |
| Value on December 31, 2021 |
| Class I — $26,095 |
|
| MSCI EAFE Index —$21,650 |
|
| MSCI EAFE Growth Index — $26,117 |
|
| |
|
Ending value of Class I would have been lower if a portion of the fees had not been waived.
| | | | | |
| Total Annual Fund Operating Expenses |
| Class I | Class II |
| 1.07% | 1.22% |
The total annual fund operating expenses shown is as stated in the fund’s prospectus current as of the date of this report. The prospectus may vary from the expense ratio shown elsewhere in this report because it is based on a different time period, includes acquired fund fees and expenses, and, if applicable, does not include fee waivers or expense reimbursements.
Data presented reflect past performance. Past performance is no guarantee of future results. Current performance may be higher or lower than the performance shown. Total returns for periods less than one year are not annualized. Investment return and principal value will fluctuate, and redemption value may be more or less than original cost. Data assumes reinvestment of dividends and capital gains, and none of the charts reflect the deduction of taxes that a shareholder would pay on fund distributions or the redemption of fund shares. To obtain performance data current to the most recent month end, please call 1-800-345-6488 or visit ipro.americancentury.com (for Investment Professionals). For additional information about the fund, please consult the prospectus.
Portfolio Managers: Raj Gandhi and Jim Zhao
Performance Summary
VP International gained 8.75%* for the fiscal year ended December 31, 2021. The fund underperformed its benchmark, the MSCI EAFE Index, which returned 11.26% for the same period.
As the rollout of COVID-19 vaccines ramped up in early 2021, raised hopes for a return to normalized economic activity spurred strong gains among non-U.S. equities. The year was marked by extreme volatility and rotation in and out of growth versus value. Initially, markets favored stocks exposed to economic expansion. Names that had previously lagged, such as banks, oil producers and automobile manufacturers, rallied. However, as the recovery cycle matured, markets returned to rewarding individual companies demonstrating strong fundamentals and earnings improvement. Increased economic activity led to a strong corporate earnings recovery. In the second half of the period, global supply chain issues and disruptions due to the emergence of new coronavirus variants combined with rising energy costs and inflation concerns to create greater market volatility. Concerns over rising interest rates amid aggressive policy shifts by central banks in response to higher inflation prompted a market rotation out of higher-multiple stocks in the fourth quarter. Corporate earnings remained strong, although the rate of improvement slowed late in the period, and demand strength supported upbeat expectations for continued earnings recovery. Stocks ended the period on a high note, as investors revised their worst-case fears around the impact of the omicron variant on global economic growth.
Stock selection in consumer discretionary and financials, including the resulting underweight in banks, detracted from relative returns, as did selection in energy. On the upside, holdings in health care, communication services and materials aided relative performance, with notable individual contribution by several information technology and industrials stocks. From a geographic perspective, stock selection in the U.K. and positioning in China and Brazil detracted, whereas positioning in Japan aided returns.
Consumer Names Constrain Returns
Among consumer discretionary holdings, retailers Magazine Luiza and ASOS detracted from performance. Magazine Luiza’s stock declined amid intensifying competition in Brazil’s e-commerce market. In addition, weakness in the broader Brazilian market appeared to be slowing consumption trends, and we exited the position. ASOS’ stock fell when management lowered sales guidance for 2021. We sold the stock as ASOS appeared to be struggling to turn around its U.S. operations, and U.S. commercial momentum had been a key pillar of the growth story. Automotive supplier Valeo also weighed on returns as concerns over the impact of semiconductor shortages on automobile production pressured the stock. We sold Valeo as we believed the stock price fully reflected the company’s earnings power, and we had concerns about its joint venture with Siemens.
Within financials, stock selection weighed on returns, most notably in banks and insurance. Among banks, our bottom-up selection process led to an underweight relative to the benchmark, which detracted as bank stocks benefited from expectations for rising interest rates. Stock of insurer AIA Group underperformed due to concerns over the impact of COVID-19 disruptions on revenue growth.
*All fund returns referenced in this commentary are for Class I shares. Fund returns would have been lower if a portion of the fees had not been waived. Performance for other share classes will vary due to differences in fee structure; when Class I performance exceeds that of the fund’s benchmark, other share classes may not. See page 2 for returns for all share classes.
In energy, Neste’s stock declined due to challenges related to near-term maintenance costs and higher input prices due to a shortage of feedstocks for renewable diesel. In addition, our focus on sustainable earnings growth kept us away from most traditional oil and gas energy stocks, which outperformed amid sharply higher energy prices, further pressuring the fund’s relative returns.
Among individual contributors, Zur Rose Group weakened on the announcement that gematik, the agency responsible for digitalizing Germany’s health care system, delayed the January 1, 2022, deadline for converting to mandatory use of e-prescriptions. We exited the position on concerns about short-term risk to earnings estimates.
Health care holdings overall, however, contributed to relative performance. Pharmaceuticals company Novo Nordisk reported revenue and earnings that exceeded expectations driven by strong demand for its oral diabetes and weight loss drugs.
Notable individual contributors included construction equipment leasing company Ashtead Group, information technology services provider Capgemini, human resources technology solutions provider Recruit Holdings and semiconductor equipment manufacturer ASML Holding. The common theme among these top contributors was strong earnings growth.
Portfolio Positioning
We remain committed to our disciplined, bottom-up process of identifying companies exhibiting accelerating, sustainable growth. We believe we will see a return to a more normalized earnings environment in 2022. As the rate of growth has likely peaked, in our view, earnings sustainability will be key to stock performance. We continue to maintain exposure to companies benefiting from strong secular trends, such as green energy and carbon reduction, including firms involved in wind generation, electric vehicle components and emissions testing. Higher infrastructure spending, increased nonresidential construction and corporate capital investment bodes well for the portfolio’s construction-related names in materials and industrials, including some that are also exposed to carbon-reduction trends. Accelerated digital transformation continues to support varied information technology holdings in areas such as IT services, artificial intelligence, cloud computing, automation and software.
As a result of our bottom-up stock selection process, we remain notably overweight to information technology and underweight to consumer staples. Geographically, we retain a large exposure to European stocks. We continue to be underweight to Japan and Asia in general and have reduced our exposure to China.
| | | | | |
| DECEMBER 31, 2021 | |
| Types of Investments in Portfolio | % of net assets |
| Common Stocks | 98.9% |
| Temporary Cash Investments | 1.2% |
| Other Assets and Liabilities | (0.1)% |
| |
| Top Five Countries | % of net assets |
| France | 16.8% |
| Japan | 13.3% |
| United Kingdom | 11.1% |
| Switzerland | 7.7% |
| Netherlands | 6.9% |
Fund shareholders may incur two types of costs: (1) transaction costs, including sales charges (loads) on purchase payments and redemption/exchange fees; and (2) ongoing costs, including management fees; distribution and service (12b-1) fees; and other fund expenses. This example is intended to help you understand your ongoing costs (in dollars) of investing in your fund and to compare these costs with the ongoing cost of investing in other mutual funds.
The example is based on an investment of $1,000 made at the beginning of the period and held for the entire period from July 1, 2021 to December 31, 2021.
Actual Expenses
The table provides information about actual account values and actual expenses for each class. You may use the information, together with the amount you invested, to estimate the expenses that you paid over the period. First, identify the share class you own. Then simply divide your account value by $1,000 (for example, an $8,600 account value divided by $1,000 = 8.6), then multiply the result by the number under the heading “Expenses Paid During Period” to estimate the expenses you paid on your account during this period.
Hypothetical Example for Comparison Purposes
The table also provides information about hypothetical account values and hypothetical expenses based on the actual expense ratio of each class of your fund and an assumed rate of return of 5% per year before expenses, which is not the actual return of a fund’s share class. The hypothetical account values and expenses may not be used to estimate the actual ending account balance or expenses you paid for the period. You may use this information to compare the ongoing costs of investing in your fund and other funds. To do so, compare this 5% hypothetical example with the 5% hypothetical examples that appear in the shareholder reports of the other funds.
Please note that the expenses shown in the table are meant to highlight your ongoing costs only and do not reflect any transactional costs, such as sales charges (loads) or redemption/exchange fees. Therefore, the table is useful in comparing ongoing costs only, and will not help you determine the relative total costs of owning different funds. In addition, if these transactional costs were included, your costs would have been higher.
| | | | | | | | | | | | | | |
| Beginning
Account Value
7/1/21 | Ending
Account Value
12/31/21 | Expenses Paid During Period(1) 7/1/21 - 12/31/21 | Annualized Expense Ratio(1) |
| Actual | | | | |
| Class I | $1,000 | $1,018.50 | $5.19 | 1.02% |
| Class II | $1,000 | $1,017.10 | $5.95 | 1.17% |
| Hypothetical | | | | |
| Class I | $1,000 | $1,020.06 | $5.19 | 1.02% |
| Class II | $1,000 | $1,019.31 | $5.96 | 1.17% |
(1)Expenses are equal to the class's annualized expense ratio listed in the table above, multiplied by the average account value over the period, multiplied by 184, the number of days in the most recent fiscal half-year, divided by 365, to reflect the one-half year period. Annualized expense ratio reflects actual expenses, including any applicable fee waivers or expense reimbursements and excluding any acquired fund fees and expenses.
DECEMBER 31, 2021
| | | | | | | | |
| Shares | Value |
| COMMON STOCKS — 98.9% |
|
|
| Australia — 4.0% | | |
Atlassian Corp. plc, Class A(1) | 7,110 | | $ | 2,710,972 | |
| CSL Ltd. | 20,250 | | 4,282,879 | |
NEXTDC Ltd.(1) | 110,030 | | 1,021,698 | |
Xero Ltd.(1) | 10,810 | | 1,106,503 | |
| | 9,122,052 | |
| Austria — 1.3% | | |
| Erste Group Bank AG | 64,090 | | 3,004,563 | |
| Belgium — 1.4% | | |
| KBC Group NV | 37,410 | | 3,214,313 | |
| Canada — 5.5% | | |
| Canadian Pacific Railway Ltd. | 36,650 | | 2,636,007 | |
| First Quantum Minerals Ltd. | 54,080 | | 1,294,124 | |
| GFL Environmental, Inc. | 64,572 | | 2,444,050 | |
Shopify, Inc., Class A(1) | 1,820 | | 2,505,930 | |
| Toronto-Dominion Bank (The) | 45,070 | | 3,455,384 | |
| | 12,335,495 | |
| China — 1.9% | | |
| Li Ning Co. Ltd. | 166,000 | | 1,821,026 | |
| Shenzhou International Group Holdings Ltd. | 44,800 | | 867,492 | |
Wuxi Biologics Cayman, Inc.(1) | 131,500 | | 1,556,815 | |
| | 4,245,333 | |
| Denmark — 4.6% | | |
| Carlsberg A/S, B Shares | 15,730 | | 2,715,749 | |
| DSV A/S | 4,027 | | 938,405 | |
| Novo Nordisk A/S, B Shares | 45,770 | | 5,141,155 | |
| Pandora A/S | 13,160 | | 1,636,983 | |
| | 10,432,292 | |
| Finland — 0.6% | | |
| Neste Oyj | 29,070 | | 1,430,702 | |
| France — 16.8% | | |
| Air Liquide SA | 17,930 | | 3,127,069 | |
Airbus SE(1) | 15,880 | | 2,031,748 | |
| Bureau Veritas SA | 53,660 | | 1,781,454 | |
| Capgemini SE | 17,870 | | 4,379,588 | |
| Dassault Systemes SE | 44,770 | | 2,656,891 | |
| Edenred | 28,856 | | 1,332,522 | |
| L'Oreal SA | 7,360 | | 3,509,341 | |
| LVMH Moet Hennessy Louis Vuitton SE | 7,640 | | 6,313,953 | |
| Pernod Ricard SA | 17,470 | | 4,202,891 | |
| Safran SA | 9,310 | | 1,139,760 | |
| Schneider Electric SE | 25,260 | | 4,966,000 | |
| Teleperformance | 5,720 | | 2,557,275 | |
| | 37,998,492 | |
| Germany — 5.5% | | |
| Brenntag SE | 14,110 | | 1,274,187 | |
| Daimler AG | 30,660 | | 2,342,551 | |
| | | | | | | | |
| Shares | Value |
| Infineon Technologies AG | 62,583 | | $ | 2,881,224 | |
| Puma SE | 25,920 | | 3,165,460 | |
| Symrise AG | 18,650 | | 2,758,235 | |
| | 12,421,657 | |
| Hong Kong — 2.1% | | |
| AIA Group Ltd. | 290,600 | | 2,932,980 | |
| Techtronic Industries Co. Ltd. | 86,000 | | 1,714,401 | |
| | 4,647,381 | |
| India — 1.1% | | |
| HDFC Bank Ltd. | 123,930 | | 2,453,469 | |
| Indonesia — 0.5% | | |
| Bank Central Asia Tbk PT | 2,292,600 | | 1,174,156 | |
| Ireland — 3.8% | | |
| CRH plc | 62,770 | | 3,323,045 | |
ICON plc(1) | 9,310 | | 2,883,307 | |
Ryanair Holdings plc, ADR(1) | 23,070 | | 2,360,753 | |
| | 8,567,105 | |
| Israel — 1.1% | | |
Kornit Digital Ltd.(1) | 17,069 | | 2,598,755 | |
| Italy — 2.5% | | |
| Ferrari NV | 11,120 | | 2,862,354 | |
| Prysmian SpA | 30,930 | | 1,163,467 | |
| Stellantis NV | 81,826 | | 1,552,420 | |
| | 5,578,241 | |
| Japan — 13.3% | | |
| BayCurrent Consulting, Inc. | 4,500 | | 1,734,439 | |
| Food & Life Cos. Ltd. | 58,200 | | 2,197,554 | |
| Hoya Corp. | 19,500 | | 2,893,639 | |
| JSR Corp. | 39,700 | | 1,508,738 | |
| Keyence Corp. | 7,600 | | 4,778,561 | |
| Kobe Bussan Co. Ltd. | 56,000 | | 2,168,179 | |
| MonotaRO Co. Ltd. | 72,200 | | 1,298,589 | |
| Obic Co. Ltd. | 11,500 | | 2,152,215 | |
| Recruit Holdings Co. Ltd. | 64,700 | | 3,937,363 | |
| Sony Group Corp. | 40,400 | | 5,101,638 | |
| Terumo Corp. | 55,000 | | 2,323,233 | |
| | 30,094,148 | |
| Netherlands — 6.9% | | |
Adyen NV(1) | 1,438 | | 3,774,749 | |
| Akzo Nobel NV | 14,330 | | 1,574,364 | |
| ASML Holding NV | 7,500 | | 6,007,649 | |
| Koninklijke DSM NV | 9,525 | | 2,145,090 | |
| Universal Music Group NV | 72,230 | | 2,041,296 | |
| | 15,543,148 | |
| Norway — 0.4% | | |
AutoStore Holdings Ltd.(1) | 212,672 | | 840,033 | |
| Singapore — 0.4% | | |
Sea Ltd., ADR(1) | 4,500 | | 1,006,695 | |
| Spain — 2.7% | | |
| Cellnex Telecom SA | 54,496 | | 3,156,823 | |
| Iberdrola SA | 249,861 | | 2,958,348 | |
| | 6,115,171 | |
| | | | | | | | |
| Shares | Value |
| Sweden — 2.4% | | |
| Epiroc AB, A Shares | 91,900 | | $ | 2,323,764 | |
| Hexagon AB, B Shares | 195,160 | | 3,091,440 | |
| | 5,415,204 | |
| Switzerland — 7.7% | | |
| Lonza Group AG | 5,270 | | 4,387,738 | |
On Holding AG, Class A(1) | 35,700 | | 1,349,817 | |
| Partners Group Holding AG | 2,090 | | 3,450,192 | |
SIG Combibloc Group AG(1) | 80,230 | | 2,234,742 | |
| Sika AG | 9,371 | | 3,894,749 | |
| Zurich Insurance Group AG | 4,750 | | 2,080,875 | |
| | 17,398,113 | |
| Taiwan — 0.9% | | |
| Taiwan Semiconductor Manufacturing Co. Ltd. | 91,000 | | 2,013,010 | |
| Thailand — 0.4% | | |
| Kasikornbank PCL | 227,900 | | 964,913 | |
| United Kingdom — 11.1% | | |
| Ashtead Group plc | 57,260 | | 4,615,988 | |
| AstraZeneca plc | 47,060 | | 5,495,165 | |
| Burberry Group plc | 50,810 | | 1,254,105 | |
| HSBC Holdings plc | 676,800 | | 4,080,098 | |
| London Stock Exchange Group plc | 13,860 | | 1,303,812 | |
| Natwest Group plc | 791,190 | | 2,422,873 | |
| Reckitt Benckiser Group plc | 25,591 | | 2,202,966 | |
| Segro plc | 110,270 | | 2,146,045 | |
Whitbread plc(1) | 39,220 | | 1,595,376 | |
| | 25,116,428 | |
TOTAL COMMON STOCKS (Cost $149,667,473) | | 223,730,869 | |
| TEMPORARY CASH INVESTMENTS — 1.2% |
|
|
| Repurchase Agreement, BMO Capital Markets Corp., (collateralized by various U.S. Treasury obligations, 2.00% - 2.375%, 4/30/24 - 5/15/51, valued at $524,922), in a joint trading account at 0.01%, dated 12/31/21, due 1/3/22 (Delivery value $514,515) | | 514,515 | |
| Repurchase Agreement, Fixed Income Clearing Corp., (collateralized by various U.S. Treasury obligations, 3.125%, 8/15/44, valued at $1,749,316), at 0.01%, dated 12/31/21, due 1/3/22 (Delivery value $1,715,001) | | 1,715,000 | |
| State Street Institutional U.S. Government Money Market Fund, Premier Class | 445,259 | | 445,259 | |
TOTAL TEMPORARY CASH INVESTMENTS (Cost $2,674,774) | | 2,674,774 | |
TOTAL INVESTMENT SECURITIES — 100.1% (Cost $152,342,247) |
| 226,405,643 | |
| OTHER ASSETS AND LIABILITIES — (0.1)% |
| (217,674) | |
| TOTAL NET ASSETS — 100.0% |
| $ | 226,187,969 | |
| | | | | |
| MARKET SECTOR DIVERSIFICATION | |
| (as a % of net assets) | |
| Industrials | 18.7% |
| Information Technology | 17.9% |
| Consumer Discretionary | 14.2% |
| Financials | 13.4% |
| Health Care | 12.9% |
| Materials | 9.7% |
| Consumer Staples | 6.6% |
| Communication Services | 2.7% |
| Utilities | 1.3% |
| Real Estate | 0.9% |
| Energy | 0.6% |
| Temporary Cash Investments | 1.2% |
| Other Assets and Liabilities | (0.1)% |
| | | | | | | | |
| NOTES TO SCHEDULE OF INVESTMENTS |
| ADR | - | American Depositary Receipt |
(1)Non-income producing.
See Notes to Financial Statements.
| | |
| Statement of Assets and Liabilities |
| | | | | |
| DECEMBER 31, 2021 | |
| Assets | |
| Investment securities, at value (cost of $152,342,247) | $ | 226,405,643 | |
| Receivable for investments sold | 424,568 | |
| Receivable for capital shares sold | 39,897 | |
| Dividends and interest receivable | 430,373 | |
| Securities lending receivable | 639 | |
| Other assets | 10,862 | |
| 227,311,982 | |
| |
| Liabilities | |
| Payable for investments purchased | 663,897 | |
| Payable for capital shares redeemed | 137,932 | |
| Accrued management fees | 178,245 | |
| Distribution fees payable | 10,605 | |
| Accrued foreign taxes | 92,189 | |
| Accrued other expenses | 41,145 | |
| 1,124,013 | |
| |
| Net Assets | $ | 226,187,969 | |
| |
| Net Assets Consist of: | |
| Capital (par value and paid-in surplus) | $ | 123,342,886 | |
| Distributable earnings | 102,845,083 | |
| $ | 226,187,969 | |
| | | | | | | | | | | |
| Net Assets | Shares Outstanding | Net Asset Value Per Share |
| Class I, $0.01 Par Value | $175,755,734 | 11,828,839 | $14.86 |
| Class II, $0.01 Par Value | $50,432,235 | 3,399,956 | $14.83 |
See Notes to Financial Statements.
| | | | | |
| YEAR ENDED DECEMBER 31, 2021 |
| Investment Income (Loss) | |
| Income: | |
| Dividends (net of foreign taxes withheld of $466,450) | $ | 4,409,582 | |
| Securities lending, net | 103,595 | |
| Interest | 4,772 | |
| 4,517,949 | |
| |
| Expenses: | |
| Management fees | 2,850,750 | |
| Distribution fees - Class II | 126,349 | |
| Directors' fees and expenses | 5,672 | |
| Other expenses | 55,323 | |
| 3,038,094 | |
Fees waived(1) | (575,607) | |
| 2,462,487 | |
| |
| Net investment income (loss) | 2,055,462 | |
| |
| Realized and Unrealized Gain (Loss) | |
| Net realized gain (loss) on: | |
| Investment transactions (net of foreign tax expenses paid (refunded) of $5,389) | 27,415,656 | |
| Foreign currency translation transactions | (76,712) | |
| 27,338,944 | |
| |
| Change in net unrealized appreciation (depreciation) on: | |
| Investments (includes (increase) decrease in accrued foreign taxes of $18,445) | (10,103,184) |
| Translation of assets and liabilities in foreign currencies | (19,653) | |
| (10,122,837) | |
| |
| Net realized and unrealized gain (loss) | 17,216,107 | |
| |
| Net Increase (Decrease) in Net Assets Resulting from Operations | $ | 19,271,569 | |
(1)Amount consists of $449,785 and $125,822 for Class I and Class II, respectively.
See Notes to Financial Statements.
| | |
| Statement of Changes in Net Assets |
| | | | | | | | |
| YEARS ENDED DECEMBER 31, 2021 AND DECEMBER 31, 2020 |
| Increase (Decrease) in Net Assets | December 31, 2021 | December 31, 2020 |
| Operations | | |
| Net investment income (loss) | $ | 2,055,462 | | $ | 329,085 | |
| Net realized gain (loss) | 27,338,944 | | 6,052,265 | |
| Change in net unrealized appreciation (depreciation) | (10,122,837) | | 39,146,084 | |
| Net increase (decrease) in net assets resulting from operations | 19,271,569 | | 45,527,434 | |
| | |
| Distributions to Shareholders | | |
| From earnings: | | |
| Class I | (5,364,716) | | (2,664,308) | |
| Class II | (1,428,046) | | (743,306) | |
| Decrease in net assets from distributions | (6,792,762) | | (3,407,614) | |
| | |
| Capital Share Transactions | | |
| Net increase (decrease) in net assets from capital share transactions (Note 5) | (10,048,205) | | (2,683,549) | |
| | |
| Net increase (decrease) in net assets | 2,430,602 | | 39,436,271 | |
| | |
| Net Assets | | |
| Beginning of period | 223,757,367 | | 184,321,096 | |
| End of period | $ | 226,187,969 | | $ | 223,757,367 | |
See Notes to Financial Statements.
| | |
| Notes to Financial Statements |
DECEMBER 31, 2021
1. Organization
American Century Variable Portfolios, Inc. (the corporation) is registered under the Investment Company Act of 1940, as amended (the 1940 Act), as an open-end management investment company and is organized as a Maryland corporation. VP International Fund (the fund) is one fund in a series issued by the corporation. The fund’s investment objective is to seek capital growth. The fund offers Class I and Class II.
2. Significant Accounting Policies
The following is a summary of significant accounting policies consistently followed by the fund in preparation of its financial statements. The fund is an investment company and follows accounting and reporting guidance in accordance with accounting principles generally accepted in the United States of America. This may require management to make certain estimates and assumptions at the date of the financial statements. Actual results could differ from these estimates. Management evaluated the impact of events or transactions occurring through the date the financial statements were issued that would merit recognition or disclosure.
Investment Valuations — The fund determines the fair value of its investments and computes its net asset value (NAV) per share at the close of regular trading (usually 4 p.m. Eastern time) on the New York Stock Exchange (NYSE) on each day the NYSE is open. The Board of Directors has adopted valuation policies and procedures to guide the investment advisor in the fund’s investment valuation process and to provide methodologies for the oversight of the fund’s pricing function.
Equity securities that are listed or traded on a domestic securities exchange are valued at the last reported sales price or at the official closing price as provided by the exchange. Equity securities traded on foreign securities exchanges are generally valued at the closing price of such securities on the exchange where primarily traded or at the close of the NYSE, if that is earlier. If no last sales price is reported, or if local convention or regulation so provides, the mean of the latest bid and asked prices may be used. Securities traded over-the-counter are valued at the mean of the latest bid and asked prices, the last sales price, or the official closing price. Equity securities initially expressed in local currencies are translated into U.S. dollars at the mean of the appropriate currency exchange rate at the close of the NYSE as provided by an independent pricing service.
Open-end management investment companies are valued at the reported NAV per share. Repurchase agreements are valued at cost, which approximates fair value.
If the fund determines that the market price for an investment is not readily available or the valuation methods mentioned above do not reflect an investment’s fair value, such investment is valued as determined in good faith by the Board of Directors or its delegate, in accordance with policies and procedures adopted by the Board of Directors. In its determination of fair value, the fund may review several factors including, but not limited to, market information regarding the specific investment or comparable investments and correlation with other investment types, futures indices or general market indicators. Circumstances that may cause the fund to use these procedures to value an investment include, but are not limited to: an investment has been declared in default or is distressed; trading in a security has been suspended during the trading day or a security is not actively trading on its principal exchange; prices received from a regular pricing source are deemed unreliable; or there is a foreign market holiday and no trading occurred.
The fund monitors for significant events occurring after the close of an investment’s primary exchange but before the fund’s NAV per share is determined. Significant events may include, but are not limited to: corporate announcements and transactions; governmental action and political unrest that could impact a specific investment or an investment sector; or armed conflicts, natural disasters and similar events that could affect investments in a specific country or region. The fund also monitors for significant fluctuations between domestic and foreign markets, as evidenced by the U.S. market or such other indicators that the Board of Directors, or its delegate, deems appropriate. The fund may apply a model-derived factor to the closing price of equity securities traded on foreign securities exchanges. The factor is based on observable market data as provided by an independent pricing service.
Security Transactions — Security transactions are accounted for as of the trade date. Net realized gains and losses are determined on the identified cost basis, which is also used for federal income tax purposes. Certain countries impose taxes on realized gains on the sale of securities registered in their country. The fund records the foreign tax expense, if any, on an accrual basis. The foreign tax expense on realized gains and unrealized appreciation reduces the net realized gain (loss) on investment transactions and net unrealized appreciation (depreciation) on investments, respectively.
Investment Income — Dividend income less foreign taxes withheld, if any, is recorded as of the ex-dividend date. Distributions received on securities that represent a return of capital or long-term capital gain are recorded as a reduction of cost of investments and/or as a realized gain. The fund may estimate the components of distributions received that may be considered nontaxable distributions or long-term capital gain distributions for income tax purposes. Interest income is recorded on the accrual basis and includes accretion of discounts and amortization of premiums. Securities lending income is net of fees and rebates earned by the lending agent for its services.
Foreign Currency Translations — All assets and liabilities initially expressed in foreign currencies are translated into U.S. dollars at prevailing exchange rates at period end. The fund may enter into spot foreign currency exchange contracts to facilitate transactions denominated in a foreign currency. Purchases and sales of investment securities, dividend and interest income, spot foreign currency exchange contracts, and expenses are translated at the rates of exchange prevailing on the respective dates of such transactions. Net realized and unrealized foreign currency exchange gains or losses related to investment securities are a component of net realized gain (loss) on investment transactions and change in net unrealized appreciation (depreciation) on investments, respectively.
Repurchase Agreements — The fund may enter into repurchase agreements with institutions that American Century Investment Management, Inc. (ACIM) (the investment advisor) has determined are creditworthy pursuant to criteria adopted by the Board of Directors. The fund requires that the collateral, represented by securities, received in a repurchase transaction be transferred to the custodian in a manner sufficient to enable the fund to obtain those securities in the event of a default under the repurchase agreement. ACIM monitors, on a daily basis, the securities transferred to ensure the value, including accrued interest, of the securities under each repurchase agreement is equal to or greater than amounts owed to the fund under each repurchase agreement.
Joint Trading Account — Pursuant to an Exemptive Order issued by the Securities and Exchange Commission, the fund, along with certain other funds in the American Century Investments family of funds, may transfer uninvested cash balances into a joint trading account. These balances are invested in one or more repurchase agreements that are collateralized by U.S. Treasury or Agency obligations.
Segregated Assets — In accordance with the 1940 Act, the fund segregates assets on its books and records to cover certain types of investment securities and other financial instruments. ACIM monitors, on a daily basis, the securities segregated to ensure the fund designates a sufficient amount of liquid assets, marked-to-market daily. The fund may also receive assets or be required to pledge assets at the custodian bank or with a broker for collateral requirements.
Income Tax Status — It is the fund’s policy to distribute substantially all net investment income and net realized gains to shareholders and to otherwise qualify as a regulated investment company under provisions of the Internal Revenue Code. Accordingly, no provision has been made for income taxes. The fund files U.S. federal, state, local and non-U.S. tax returns as applicable. The fund's tax returns are subject to examination by the relevant taxing authority until expiration of the applicable statute of limitations, which is generally three years from the date of filing but can be longer in certain jurisdictions. At this time, management believes there are no uncertain tax positions which, based on their technical merit, would not be sustained upon examination and for which it is reasonably possible that the total amounts of unrecognized tax benefits will significantly change in the next twelve months.
Multiple Class — All shares of the fund represent an equal pro rata interest in the net assets of the class to which such shares belong, and have identical voting, dividend, liquidation and other rights and the same terms and conditions, except for class specific expenses and exclusive rights to vote on matters affecting only individual classes. Income, non-class specific expenses, and realized and unrealized capital gains and losses of the fund are allocated to each class of shares based on their relative net assets.
Distributions to Shareholders — Distributions from net investment income and net realized gains, if any, are generally declared and paid annually.
Indemnifications — Under the corporation’s organizational documents, its officers and directors are indemnified against certain liabilities arising out of the performance of their duties to the fund. In addition, in the normal course of business, the fund enters into contracts that provide general indemnifications. The maximum exposure under these arrangements is unknown as this would involve future claims that may be made against a fund. The risk of material loss from such claims is considered by management to be remote.
Securities Lending — Securities are lent to qualified financial institutions and brokers. State Street Bank & Trust Co. serves as securities lending agent to the fund pursuant to a Securities Lending Agreement. The lending of securities exposes the fund to risks such as: the borrowers may fail to return the loaned securities, the borrowers may not be able to provide additional collateral, the fund may experience delays in recovery of the loaned securities or delays in access to collateral, or the fund may experience losses related to the investment collateral. To minimize certain risks, loan counterparties pledge collateral in the form of cash and/or securities. The lending agent has agreed to indemnify the fund in the case of default of any securities borrowed. Cash collateral received is invested in the State Street Navigator Securities Lending Government Money Market Portfolio, a money market mutual fund registered under the 1940 Act. The loans may also be secured by U.S. government securities in an amount at least equal to the market value of the securities loaned, plus accrued interest and dividends, determined on a daily basis and adjusted accordingly. By lending securities, the fund seeks to increase its net investment income through the receipt of interest and fees. Such income is reflected separately within the Statement of Operations. The value of loaned securities and related collateral outstanding at period end, if any, are shown on a gross basis within the Schedule of Investments and Statement of Assets and Liabilities.
3. Fees and Transactions with Related Parties
Certain officers and directors of the corporation are also officers and/or directors of American Century Companies, Inc. (ACC). The corporation’s investment advisor, ACIM, the corporation's distributor, American Century Investment Services, Inc. (ACIS), and the corporation’s transfer agent, American Century Services, LLC, are wholly owned, directly or indirectly, by ACC.
Management Fees — The corporation has entered into a management agreement with ACIM, under which ACIM provides the fund with investment advisory and management services in exchange for a single, unified management fee (the fee) per class. The agreement provides that ACIM will pay all expenses of managing and operating the fund, except brokerage expenses, taxes, interest, fees and expenses of the independent directors (including legal counsel fees), extraordinary expenses, and expenses incurred in connection with the provision of shareholder services and distribution services under a plan adopted pursuant to Rule 12b-1 under the 1940 Act. The fee is computed and accrued daily based on each class's daily net assets and paid monthly in arrears. The difference in the fee among the classes is a result of their separate arrangements for non-Rule 12b-1 shareholder services. It is not the result of any difference in advisory or custodial fees or other expenses related to the management of the fund's assets, which do not vary by class. The rate of the fee is determined by applying a fee rate calculation formula. This formula takes into account the fund's assets as well as certain assets, if any, of other clients of the investment advisor outside the American Century Investments family of funds (such as subadvised funds and separate accounts) that use very similar investment teams and strategies (strategy assets). From January 1, 2021 through July 31, 2021, the investment advisor agreed to waive 0.36% of the fund’s management fee. Effective August 1, 2021, the investment advisor agreed to waive 0.10% of the fund's management fee. The investment advisor expects this waiver to continue until July 31, 2022 and cannot terminate it prior to such date without the approval of the Board of Directors.
The management fee schedule range and the effective annual management fee before and after waiver for each class for the period ended December 31, 2021 are as follows:
| | | | | | | | | | | |
| | Effective Annual Management Fee |
| Management Fee
Schedule Range* | Before Waiver | After Waiver |
| Class I | 1.00% to 1.06% | 1.26% | 1.01% |
| Class II | 0.90% to 0.96% | 1.16% | 0.91% |
*Prior to August 1, 2021, the management fee schedule range was 1.00% to 1.50% for Class I and 0.90% to 1.40% for Class II.
Distribution Fees — The Board of Directors has adopted the Master Distribution Plan (the plan) for Class II, pursuant to Rule 12b-1 of the 1940 Act. The plan provides that Class II will pay ACIS an annual distribution fee equal to 0.25%. The fee is computed and accrued daily based on the Class II daily net assets and paid monthly in arrears. The distribution fee provides compensation for expenses incurred in connection with distributing shares of Class II including, but not limited to, payments to brokers, dealers, and financial institutions that have entered into sales agreements with respect to shares of the fund. Fees incurred under the plan during the period ended December 31, 2021 are detailed in the Statement of Operations.
Directors' Fees and Expenses — The Board of Directors is responsible for overseeing the investment advisor’s management and operations of the fund. The directors receive detailed information about the fund and its investment advisor regularly throughout the year, and meet at least quarterly with management of the investment advisor to review reports about fund operations. The fund’s officers do not receive compensation from the fund.
Other Expenses — The fund’s other expenses may include interest charges, clearing exchange fees, proxy solicitation expenses, filing fees for foreign tax reclaims and other miscellaneous expenses. The impact of other expenses to the ratio of operating expenses to average net assets was 0.02% for the period ended December 31, 2021.
Interfund Transactions — The fund may enter into security transactions with other American Century Investments funds and other client accounts of the investment advisor, in accordance with the 1940 Act rules and procedures adopted by the Board of Directors. The rules and procedures require, among other things, that these transactions be effected at the independent current market price of the security. During the period, the interfund purchases and sales were $48,028 and $4,383, respectively. The effect of interfund transactions on the Statement of Operations was $(77) in net realized gain (loss) on investment transactions.
4. Investment Transactions
Purchases and sales of investment securities, excluding short-term investments, for the period ended December 31, 2021 were $106,579,269 and $123,000,620, respectively.
5. Capital Share Transactions
Transactions in shares of the fund were as follows:
| | | | | | | | | | | | | | |
| Year ended
December 31, 2021 | Year ended
December 31, 2020 |
| Shares | Amount | Shares | Amount |
| Class I/Shares Authorized | 200,000,000 | | | 200,000,000 | | |
| Sold | 755,750 | | $ | 11,017,680 | | 2,026,375 | | $ | 23,101,939 | |
| Issued in reinvestment of distributions | 390,729 | | 5,364,716 | | 316,051 | | 2,664,308 | |
| Redeemed | (1,774,403) | | (26,016,890) | | (2,327,313) | | (26,433,902) | |
| (627,924) | | (9,634,494) | | 15,113 | | (667,655) | |
| Class II/Shares Authorized | 100,000,000 | | | 100,000,000 | | |
| Sold | 293,665 | | 4,306,392 | | 319,855 | | 3,756,589 | |
| Issued in reinvestment of distributions | 104,085 | | 1,428,046 | | 88,174 | | 743,306 | |
| Redeemed | (419,140) | | (6,148,149) | | (576,948) | | (6,515,789) | |
| (21,390) | | (413,711) | | (168,919) | | (2,015,894) | |
| Net increase (decrease) | (649,314) | | $ | (10,048,205) | | (153,806) | | $ | (2,683,549) | |
6. Fair Value Measurements
The fund’s investments valuation process is based on several considerations and may use multiple inputs to determine the fair value of the investments held by the fund. In conformity with accounting principles generally accepted in the United States of America, the inputs used to determine a valuation are classified into three broad levels.
•Level 1 valuation inputs consist of unadjusted quoted prices in an active market for identical investments.
•Level 2 valuation inputs consist of direct or indirect observable market data (including quoted prices for comparable investments, evaluations of subsequent market events, interest rates, prepayment speeds, credit risk, etc.). These inputs also consist of quoted prices for identical investments initially expressed in local currencies that are adjusted through translation into U.S. dollars.
•Level 3 valuation inputs consist of unobservable data (including a fund’s own assumptions).
The level classification is based on the lowest level input that is significant to the fair valuation measurement. The valuation inputs are not necessarily an indication of the risks associated with investing in these securities or other financial instruments.
The following is a summary of the level classifications as of period end. The Schedule of Investments provides additional information on the fund’s portfolio holdings.
| | | | | | | | | | | |
| Level 1 | Level 2 | Level 3 |
| Assets | | | |
| Investment Securities | | | |
| Common Stocks | | | |
| Australia | $ | 2,710,972 | | $ | 6,411,080 | | — | |
| Canada | 2,444,050 | | 9,891,445 | | — | |
| Ireland | 5,244,060 | | 3,323,045 | | — | |
| Israel | 2,598,755 | | — | | — | |
| Singapore | 1,006,695 | | — | | — | |
| Switzerland | 1,349,817 | | 16,048,296 | | — | |
| Other Countries | — | | 172,702,654 | | — | |
| Temporary Cash Investments | 445,259 | | 2,229,515 | | — | |
| $ | 15,799,608 | | $ | 210,606,035 | | — | |
7. Risk Factors
The value of the fund’s shares will go up and down, sometimes rapidly or unpredictably, based on the performance of the securities owned by the fund and other factors generally affecting the securities market. Market risks, including political, regulatory, economic and social developments, can affect the value of the fund’s investments. Natural disasters, public health emergencies, terrorism and other unforeseeable events may lead to increased market volatility and may have adverse long-term effects on world economies and markets generally.
There are certain risks involved in investing in foreign securities. These risks include those resulting from political events (such as civil unrest, national elections and imposition of exchange controls), social and economic events (such as labor strikes and rising inflation), and natural disasters. Securities of foreign issuers may be less liquid and more volatile. Investing in emerging markets or a significant portion of assets in one country or region may accentuate these risks.
8. Federal Tax Information
The tax character of distributions paid during the years ended December 31, 2021 and December 31, 2020 were as follows:
| | | | | | | | |
| 2021 | 2020 |
| Distributions Paid From | | |
| Ordinary income | $ | 294,348 | | $ | 816,476 | |
| Long-term capital gains | $ | 6,498,414 | | $ | 2,591,138 | |
The book-basis character of distributions made during the year from net investment income or net realized gains may differ from their ultimate characterization for federal income tax purposes. These differences reflect the differing character of certain income items and net realized gains and losses for financial statement and tax purposes, and may result in reclassification among certain capital accounts on the financial statements.
As of period end, the federal tax cost of investments and the components of distributable earnings on a tax-basis were as follows:
| | | | | |
| Federal tax cost of investments | $ | 152,520,762 | |
| Gross tax appreciation of investments | $ | 76,085,594 | |
| Gross tax depreciation of investments | (2,200,713) | |
| Net tax appreciation (depreciation) of investments | 73,884,881 | |
| Net tax appreciation (depreciation) on translation of assets and liabilities in foreign currencies | (95,250) | |
| Net tax appreciation (depreciation) | $ | 73,789,631 | |
| Undistributed ordinary income | $ | 3,880,087 | |
| Accumulated long-term gains | $ | 25,175,365 | |
The difference between book-basis and tax-basis unrealized appreciation (depreciation) is attributable primarily to the tax deferral of losses on wash sales.
| | | | | | | | | | | | | | | | | | | | | | | | | | | | | | | | | | | | | | | | | | | | | | | |
| For a Share Outstanding Throughout the Years Ended December 31 (except as noted) |
| Per-Share Data | | | | | | Ratios and Supplemental Data | |
| | Income From Investment Operations: | Distributions From: | | | Ratio to Average Net Assets of: | |
| Net Asset
Value,
Beginning
of Period | Net Investment Income (Loss)(1) | Net
Realized
and
Unrealized
Gain (Loss) | Total From
Investment
Operations | Net
Investment
Income | Net
Realized
Gains | Total
Distributions | Net Asset
Value,
End
of Period | Total Return(2) | Operating
Expenses | Operating
Expenses
(before
expense
waiver) | Net
Investment
Income
(Loss) | Net
Investment
Income (Loss) (before expense waiver) | Portfolio
Turnover
Rate | Net
Assets,
End of
Period
(in thousands) |
| Class I | | | | | | | | | | | | | | | |
| 2021 | $14.10 | 0.14 | 1.05 | 1.19 | (0.02) | (0.41) | (0.43) | $14.86 | 8.75% | 1.04% | 1.29% | 0.92% | 0.67% | 47% | $175,756 | |
| 2020 | $11.50 | 0.02 | 2.81 | 2.83 | (0.06) | (0.17) | (0.23) | $14.10 | 25.88% | 1.00% | 1.36% | 0.21% | (0.15)% | 59% | $175,606 | |
| 2019 | $9.54 | 0.05 | 2.56 | 2.61 | (0.09) | (0.56) | (0.65) | $11.50 | 28.42% | 1.03% | 1.37% | 0.52% | 0.18% | 65% | $143,094 | |
| 2018 | $12.18 | 0.09 | (1.79) | (1.70) | (0.15) | (0.79) | (0.94) | $9.54 | (15.22)% | 1.04% | 1.37% | 0.78% | 0.45% | 66% | $117,384 | |
| 2017 | $9.37 | 0.09 | 2.81 | 2.90 | (0.09) | — | (0.09) | $12.18 | 31.21% | 1.09% | 1.35% | 0.81% | 0.55% | 58% | $153,123 | |
| Class II | | | | | | | | | | | | | | | |
| 2021 | $14.07 | 0.11 | 1.06 | 1.17 | —(3) | (0.41) | (0.41) | $14.83 | 8.60% | 1.19% | 1.44% | 0.77% | 0.52% | 47% | $50,432 | |
| 2020 | $11.48 | 0.01 | 2.79 | 2.80 | (0.04) | (0.17) | (0.21) | $14.07 | 25.65% | 1.15% | 1.51% | 0.06% | (0.30)% | 59% | $48,151 | |
| 2019 | $9.53 | 0.04 | 2.55 | 2.59 | (0.08) | (0.56) | (0.64) | $11.48 | 28.14% | 1.18% | 1.52% | 0.37% | 0.03% | 65% | $41,227 | |
| 2018 | $12.16 | 0.07 | (1.78) | (1.71) | (0.13) | (0.79) | (0.92) | $9.53 | (15.29)% | 1.19% | 1.52% | 0.63% | 0.30% | 66% | $36,919 | |
| 2017 | $9.36 | 0.06 | 2.82 | 2.88 | (0.08) | — | (0.08) | $12.16 | 30.93% | 1.24% | 1.50% | 0.66% | 0.40% | 58% | $46,223 | |
| | |
| Notes to Financial Highlights |
(1)Computed using average shares outstanding throughout the period.
(2)Total returns are calculated based on the net asset value of the last business day. Total returns for periods less than one year are not annualized. The total returns presented do not include the fees and charges assessed with investments in variable insurance products, those charges are disclosed in the separate account prospectus. The inclusion of such fees and charges would lower total return.
(3)Per-share amount was less than $0.005.
See Notes to Financial Statements.
| | |
| Report of Independent Registered Public Accounting Firm |
To the Shareholders and the Board of Directors of American Century Variable Portfolios, Inc.:
Opinion on the Financial Statements and Financial Highlights
We have audited the accompanying statement of assets and liabilities, including the schedule of investments, of VP International Fund (the “Fund”), one of the funds constituting the American Century Variable Portfolios, Inc., as of December 31, 2021, the related statement of operations for the year then ended, the statements of changes in net assets for each of the two years in the period then ended, the financial highlights for each of the five years in the period then ended, and the related notes. In our opinion, the financial statements and financial highlights present fairly, in all material respects, the financial position of VP International Fund of the American Century Variable Portfolios, Inc. as of December 31, 2021, and the results of its operations for the year then ended, the changes in its net assets for each of the two years in the period then ended, and the financial highlights for each of the five years in the period then ended, in conformity with accounting principles generally accepted in the United States of America.
Basis for Opinion
These financial statements and financial highlights are the responsibility of the Fund's management. Our responsibility is to express an opinion on the Fund’s financial statements and financial highlights based on our audits. We are a public accounting firm registered with the Public Company Accounting Oversight Board (United States) (PCAOB) and are required to be independent with respect to the Fund in accordance with the U.S. federal securities laws and the applicable rules and regulations of the Securities and Exchange Commission and the PCAOB.
We conducted our audits in accordance with the standards of the PCAOB. Those standards require that we plan and perform the audit to obtain reasonable assurance about whether the financial statements and financial highlights are free of material misstatement, whether due to error or fraud. The Fund is not required to have, nor were we engaged to perform, an audit of its internal control over financial reporting. As part of our audits, we are required to obtain an understanding of internal control over financial reporting but not for the purpose of expressing an opinion on the effectiveness of the Fund’s internal control over financial reporting. Accordingly, we express no such opinion.
Our audits included performing procedures to assess the risks of material misstatement of the financial statements and financial highlights, whether due to error or fraud, and performing procedures that respond to those risks. Such procedures included examining, on a test basis, evidence regarding the amounts and disclosures in the financial statements and financial highlights. Our audits also included evaluating the accounting principles used and significant estimates made by management, as well as evaluating the overall presentation of the financial statements and financial highlights. Our procedures included confirmation of securities owned as of December 31, 2021, by correspondence with the custodian and brokers; when replies were not received from brokers, we performed other auditing procedures. We believe that our audits provide a reasonable basis for our opinion.
/s/ Deloitte & Touche LLP
Kansas City, Missouri
February 10, 2022
We have served as the auditor of one or more American Century investment companies since 1997.
The Board of Directors
The individuals listed below serve as directors of the funds. Each director will continue to serve in this capacity until death, retirement, resignation or removal from office. The board has adopted a mandatory retirement age for directors who are not “interested persons,” as that term is defined in the Investment Company Act (independent directors). Independent directors shall retire on December 31 of the year in which they reach their 75th birthday.
Mr. Thomas is an “interested person” because he currently serves as President and Chief Executive Officer of American Century Companies, Inc. (ACC), the parent company of American Century Investment Management, Inc. (ACIM or the advisor). The other directors (more than three-fourths of the total number) are independent. They are not employees, directors or officers of, and have no financial interest in, ACC or any of its wholly owned, direct or indirect, subsidiaries, including ACIM, American Century Investment Services, Inc. (ACIS) and American Century Services, LLC (ACS), and they do not have any other affiliations, positions or relationships that would cause them to be considered “interested persons” under the Investment Company Act. The directors serve in this capacity for seven (in the case of Jonathan S. Thomas, 16; and Stephen E. Yates, 8) registered investment companies in the American Century Investments family of funds.
The following table presents additional information about the directors. The mailing address for each director is 4500 Main Street, Kansas City, Missouri 64111.
| | | | | | | | | | | | | | | | | |
Name
(Year of Birth) | Position(s) Held with Funds | Length of Time Served | Principal Occupation(s) During Past 5 Years | Number of American Century Portfolios Overseen by Director | Other Directorships Held During Past 5 Years |
| Independent Directors | | |
| Thomas W. Bunn (1953) | Director | Since 2017 | Retired | 72 | SquareTwo Financial |
Chris H. Cheesman
(1962)
| Director | Since 2019
| Retired. Senior Vice President & Chief Audit Executive, AllianceBernstein (1999 to 2018)
| 72 | Alleghany Corporation |
Barry Fink
(1955) | Director | Since 2012 (independent since 2016) | Retired | 72 | None |
Rajesh K. Gupta
(1960)
| Director | Since 2019
| Partner Emeritus, SeaCrest Investment Management and SeaCrest Wealth Management (2019 to Present); Chief Executive Officer and Chief Investment Officer, SeaCrest Investment Management (2006 to 2019); Chief Executive Officer and Chief Investment Officer, SeaCrest Wealth Management (2008 to 2019) | 72 | None |
| | | | | | | | | | | | | | | | | |
Name
(Year of Birth) | Position(s) Held with Funds | Length of Time Served | Principal Occupation(s) During Past 5 Years | Number of American Century Portfolios Overseen by Director | Other Directorships Held During Past 5 Years |
| Independent Directors | | |
Lynn Jenkins
(1963)
| Director | Since 2019
| Consultant, LJ Strategies (2019 to present); United States Representative, U.S. House of Representatives (2009 to 2018) | 72 | MGP Ingredients, Inc. (2019 to 2021) |
Jan M. Lewis
(1957) | Director | Since 2011 | Retired | 72 | None |
John R. Whitten(1) (1946) | Director | Since 2008 | Retired | 72 | Onto Innovation Inc. (2019 to 2020); Rudolph Technologies, Inc. (2006 to 2019) |
Stephen E. Yates
(1948) | Director and Chairman of the Board | Since 2012 (Chairman since 2018) | Retired | 108 | None |
| Interested Director | |
Jonathan S. Thomas
(1963) | Director | Since 2007 | President and Chief Executive Officer, ACC (2007 to present). Also serves as Chief Executive Officer, ACS; Director, ACC and other ACC subsidiaries | 146 | None |
(1) Effective December 31, 2021, John R. Whitten retired from the Board of Directors.
The Statement of Additional Information has additional information about the fund's directors and is available without charge, upon request, by calling 1-800-378-9878.
Officers
The following table presents certain information about the executive officers of the funds. Each officer serves as an officer for 16 (in the case of Robert J. Leach, 15) investment companies in the American Century family of funds. No officer is compensated for his or her service as an officer of the funds. The listed officers are interested persons of the funds and are appointed or re-appointed on an annual basis. The mailing address for each officer listed below is 4500 Main Street, Kansas City, Missouri 64111.
| | | | | | | | |
Name
(Year of Birth) | Offices with the Funds | Principal Occupation(s) During the Past Five Years |
Patrick Bannigan
(1965) | President since 2019 | Executive Vice President and Director, ACC (2012 to present); Chief Financial Officer, Chief Accounting Officer and Treasurer, ACC (2015 to present). Also serves as President, ACS; Vice President, ACIM; Chief Financial Officer, Chief Accounting Officer and/or Director, ACIM, ACS and other ACC subsidiaries |
R. Wes Campbell
(1974) | Chief Financial Officer and Treasurer since 2018 | Vice President, ACS, (2020 to present); Investment Operations and Investment Accounting, ACS (2000 to present) |
Amy D. Shelton
(1964) | Chief Compliance Officer and Vice President since 2014 | Chief Compliance Officer, American Century funds, (2014 to present); Chief Compliance Officer, ACIM (2014 to present); Chief Compliance Officer, ACIS (2009 to present). Also serves as Vice President, ACIS |
John Pak
(1968) | General Counsel and
Senior Vice President since 2021 | General Counsel and Senior Vice President, ACC (2021 to present); Also serves as General Counsel and Senior Vice President, ACIM, ACS and ACIS. Chief Legal Officer of Investment and Wealth Management, The Bank of New York Mellon (2014 to 2021) |
C. Jean Wade
(1964) | Vice President since 2012 | Senior Vice President, ACS (2017 to present); Vice President, ACS (2000 to 2017)
|
Robert J. Leach
(1966) | Vice President since 2006 | Vice President, ACS (2000 to present) |
David H. Reinmiller
(1963) | Vice President since 2000 | Attorney, ACC (1994 to present). Also serves as Vice President, ACIM and ACS |
Ward D. Stauffer
(1960) | Secretary since 2005 | Attorney, ACC (2003 to present) |
Proxy Voting Policies
A description of the policies that the fund's investment advisor uses in exercising the voting rights associated with the securities purchased and/or held by the fund is available without charge, upon request, by calling 1-800-378-9878. It is also available on American Century Investments’ website at americancentury.com/proxy and on the Securities and Exchange Commission’s website at sec.gov. Information regarding how the investment advisor voted proxies relating to portfolio securities during the most recent 12-month period ended June 30 is available on americancentury.com/proxy. It is also available at sec.gov.
Quarterly Portfolio Disclosure
The fund files its complete schedule of portfolio holdings with the Securities and Exchange Commission (SEC) for the first and third quarters of each fiscal year as an exhibit to its reports on Form N-PORT. These portfolio holdings are available on the fund's website at ipro.americancentury.com (for Investment Professionals) and, upon request, by calling 1-800-378-9878. The fund’s Form N-PORT reports are available on the SEC’s website at sec.gov.
Other Tax Information
The following information is provided pursuant to provisions of the Internal Revenue Code.
The fund hereby designates $6,498,414, or up to the maximum amount allowable, as long-term
capital gain distributions (20% rate gain distributions) for the fiscal year ended December 31, 2021.
For the fiscal year ended December 31, 2021, the fund intends to pass through to shareholders
foreign source income of $4,876,026 and foreign taxes paid of $466,409, or up to the maximum
amount allowable, as a foreign tax credit. Foreign source income and foreign tax expense per
outstanding share on December 31, 2021 are $0.3202 and $0.0306, respectively.
| | | | | | | | |
| |
| | |
| Contact Us | americancentury.com | |
| Automated Information Line | 1-800-345-8765 | |
| Investment Professional Service Representatives | 1-800-345-6488 | |
| Telecommunications Relay Service for the Deaf | 711 | |
| | |
| American Century Variable Portfolios, Inc. | |
| | |
Investment Advisor: American Century Investment Management, Inc. Kansas City, Missouri | |
| | |
| This report and the statements it contains are submitted for the general information of our shareholders. The report is not authorized for distribution to prospective investors unless preceded or accompanied by an effective prospectus. | |
| | |
©2022 American Century Proprietary Holdings, Inc. All rights reserved.
CL-ANN-91441 2202 | |
| | | | | |
| |
| Annual Report |
| |
| December 31, 2021 |
| |
| VP Large Company Value Fund |
| Class I (AVVIX) |
| Class II (AVVTX) |
| | | | | |
| Performance | |
| Portfolio Commentary | |
| Fund Characteristics | |
| Shareholder Fee Example | |
| Schedule of Investments | |
| Statement of Assets and Liabilities | |
| Statement of Operations | |
| Statement of Changes in Net Assets | |
| Notes to Financial Statements | |
| Financial Highlights | |
| Report of Independent Registered Public Accounting Firm | |
| Management | |
| |
| |
| |
| Additional Information | |
Any opinions expressed in this report reflect those of the author as of the date of the report, and do not necessarily represent the opinions of American Century Investments® or any other person in the American Century Investments organization. Any such opinions are subject to change at any time based upon market or other conditions and American Century Investments disclaims any responsibility to update such opinions. These opinions may not be relied upon as investment advice and, because investment decisions made by American Century Investments funds are based on numerous factors, may not be relied upon as an indication of trading intent on behalf of any American Century Investments fund. Security examples are used for representational purposes only and are not intended as recommendations to purchase or sell securities. Performance information for comparative indices and securities is provided to American Century Investments by third party vendors. To the best of American Century Investments’ knowledge, such information is accurate at the time of printing.
| | | | | | | | | | | | | | | | | | |
| Total Returns as of December 31, 2021 |
| | | | Average Annual Returns | |
| | Ticker
Symbol | 1 year | 5 years | 10 years | | Inception
Date |
| Class I | AVVIX | 21.71% | 10.21% | 12.00% | | 12/1/04 |
| Russell 1000 Value Index | — | 25.16% | 11.16% | 12.96% | | — |
| S&P 500 Index | — | 28.71% | 18.46% | 16.54% | | — |
| Class II | AVVTX | 21.53% | 10.06% | 11.84% | | 10/29/04 |
Fund returns would have been lower if a portion of the fees had not been waived.
The performance information presented does not include the fees and charges assessed with investments in variable insurance products, those charges are disclosed in the separate account prospectus. The inclusion of such fees and charges would lower performance.
Data presented reflect past performance. Past performance is no guarantee of future results. Current performance may be higher or lower than the performance shown. Total returns for periods less than one year are not annualized. Investment return and principal value will fluctuate, and redemption value may be more or less than original cost. Data assumes reinvestment of dividends and capital gains, and none of the charts reflect the deduction of taxes that a shareholder would pay on fund distributions or the redemption of fund shares. To obtain performance data current to the most recent month end, please call 1-800-345-6488 or visit ipro.americancentury.com (for Investment Professionals). For additional information about the fund, please consult the prospectus.
| | |
| Growth of $10,000 Over 10 Years |
| $10,000 investment made December 31, 2011 |
| Performance for other share classes will vary due to differences in fee structure. |
| | | | | |
| Value on December 31, 2021 |
| Class I — $31,079 |
|
| Russell 1000 Value Index — $33,846 |
|
| S&P 500 Index — $46,257 |
|
| |
|
Ending value of Class I would have been lower if a portion of the fees had not been waived.
| | | | | |
| Total Annual Fund Operating Expenses |
| Class I | Class II |
| 0.84% | 0.99% |
The total annual fund operating expenses shown is as stated in the fund’s prospectus current as of the date of this report. The prospectus may vary from the expense ratio shown elsewhere in this report because it is based on a different time period, includes acquired fund fees and expenses, and, if applicable, does not include fee waivers or expense reimbursements.
Data presented reflect past performance. Past performance is no guarantee of future results. Current performance may be higher or lower than the performance shown. Total returns for periods less than one year are not annualized. Investment return and principal value will fluctuate, and redemption value may be more or less than original cost. Data assumes reinvestment of dividends and capital gains, and none of the charts reflect the deduction of taxes that a shareholder would pay on fund distributions or the redemption of fund shares. To obtain performance data current to the most recent month end, please call 1-800-345-6488 or visit ipro.americancentury.com (for Investment Professionals). For additional information about the fund, please consult the prospectus.
Portfolio Managers: Brian Woglom, Phillip N. Davidson and Philip Sundell
Performance Summary
VP Large Company Value returned 21.53%* for the 12 months ended December 31, 2021. The fund’s benchmark, the Russell 1000 Value Index, returned 25.16% for the same time period. The fund’s return reflects operating expenses, while the index’s return does not.
Security selection in the health care, consumer staples and utilities sectors detracted from relative performance. The fund’s overweights in the health care and consumer staples sectors relative to the benchmark also weighed on returns. On the other hand, our choice of investments in the information technology and industrials sectors positively impacted results.
Health Care, Consumer Staples and Utilities Detracted
Several of the fund’s positions in the health care sector underperformed during the reporting period, including Medtronic and Zimmer Biomet Holdings. Both stocks were pressured by concerns about continued delays in elective procedures due to the ongoing pandemic. Merck & Co., a large pharmaceutical company, was another notable detractor. Its shares lagged the market as investors became concerned about possible drug pricing reform.
A number of our consumer staples holdings, coupled with the portfolio’s overweight in the sector relative to the benchmark, weighed on performance. Unilever, a U.K.-based consumer goods company, was a key detractor. The stock underperformed as the company’s profit margins were pressured by rising input costs. Several other consumer staples holdings lagged because they were not direct beneficiaries of economic reopening.
In the utilities sector, Arizona-based Pinnacle West Capital was a notable detractor. The stock underperformed due to regulatory overhangs surrounding a pending general rate case in Arizona. Later in the year, the Arizona Corporation Commission delivered a disappointing final determination on the case.
Verizon Communications, a telecommunications conglomerate, was another top detractor. The stock was pressured by investors’ increasing concerns regarding more competition in the wireless space from AT&T and T-Mobile US.
Information Technology and Industrials Contributed
Security selection in the information technology sector positively impacted relative performance. The portfolio’s lack of exposure to some of the benchmark’s names within the IT services industry was beneficial. Also, in the software industry, Oracle outperformed after the company reported earnings that showed momentum in cloud revenue and continued growth in enterprise resource planning. In addition, Oracle is increasing its investment in cloud infrastructure. We sold our position in Oracle on strength in its stock price. Another key contributor within the information technology sector was Cisco Systems. Its shares outperformed due to strong demand for security and networking products. Hybrid work environments, 5G-related upgrades, pent-up demand and competitive wins drove an increase in orders.
*All fund returns referenced in this commentary are for Class II shares. Returns would have been lower if a portion of the fees had not been waived. Performance for other share classes will vary due to differences in fee structure; when Class II performance exceeds that of the fund’s benchmark, other share classes may not. See page 2 for returns for all share classes.
In the industrials sector, Johnson Controls International was a notable contributor. The company raised its fiscal year 2021 guidance as well as its longer-term financial targets at its September investor day. Following the stock’s outperformance, we eliminated our position in this global supplier of building technology and heating, ventilation and air conditioning.
Top contributors from other areas of the portfolio included ConocoPhillips and The Bank of New York Mellon. ConocoPhillips, a holding in the energy sector, benefited from higher oil prices. In addition, the company announced an acquisition that the market viewed as attractively priced. The Bank of New York Mellon outperformed after providing strong financial results and better-than-expected guidance. Improved fee income offset a headwind from lower interest rates. Also, the company announced a dividend increase and a sizable share repurchase authorization that exceeded expectations.
Portfolio Positioning
The portfolio seeks to invest in companies where we believe the valuation does not reflect the quality and normal earnings power of the company. Our process is based on individual security selection, but broad themes have emerged.
We ended the reporting period with an overweight in the health care sector relative to the benchmark. We believe long-term demographic trends support demand for companies in the health care sector. Through our bottom-up process, we have found quality companies with attractive risk/reward profiles, particularly in the health care equipment and supplies and pharmaceuticals industries. We also ended the period with an overweight in consumer staples. Despite a challenging environment from a cost inflation perspective, many consumer staples companies are generating strong returns on capital, buying back stock and growing dividends. Moreover, industry consolidation over time has enabled companies to pass cost increases to consumers. We believe actions to offset inflation, including fewer promotions and price increases, should support earnings and margins.
Conversely, we maintained an underweight in real estate due to valuations that we believe are elevated throughout the sector. We also ended the period with an underweight in information technology, although we have found select stocks in the sector that meet our investment criteria.
| | | | | |
| DECEMBER 31, 2021 |
| Types of Investments in Portfolio | % of net assets |
| Common Stocks | 96.1% |
| Exchange-Traded Funds | 1.0% |
| Temporary Cash Investments | 2.9% |
| Other Assets and Liabilities | —* |
*Category is less than 0.05% of total net assets.
| | | | | |
| Top Five Industries* | % of net assets |
| Pharmaceuticals | 8.3% |
| Health Care Equipment and Supplies | 7.8% |
| Banks | 6.9% |
| Insurance | 6.0% |
| Health Care Providers and Services | 5.6% |
*Exposure indicated excludes Exchange-Traded Funds. The Schedule of Investments provides additional information on the fund's portfolio holdings.
Fund shareholders may incur two types of costs: (1) transaction costs, including sales charges (loads) on purchase payments and redemption/exchange fees; and (2) ongoing costs, including management fees; distribution and service (12b-1) fees; and other fund expenses. This example is intended to help you understand your ongoing costs (in dollars) of investing in your fund and to compare these costs with the ongoing cost of investing in other mutual funds.
The example is based on an investment of $1,000 made at the beginning of the period and held for the entire period from July 1, 2021 to December 31, 2021.
Actual Expenses
The table provides information about actual account values and actual expenses for each class. You may use the information, together with the amount you invested, to estimate the expenses that you paid over the period. First, identify the share class you own. Then simply divide your account value by $1,000 (for example, an $8,600 account value divided by $1,000 = 8.6), then multiply the result by the number under the heading “Expenses Paid During Period” to estimate the expenses you paid on your account during this period.
Hypothetical Example for Comparison Purposes
The table also provides information about hypothetical account values and hypothetical expenses based on the actual expense ratio of each class of your fund and an assumed rate of return of 5% per year before expenses, which is not the actual return of a fund’s share class. The hypothetical account values and expenses may not be used to estimate the actual ending account balance or expenses you paid for the period. You may use this information to compare the ongoing costs of investing in your fund and other funds. To do so, compare this 5% hypothetical example with the 5% hypothetical examples that appear in the shareholder reports of the other funds.
Please note that the expenses shown in the table are meant to highlight your ongoing costs only and do not reflect any transactional costs, such as sales charges (loads) or redemption/exchange fees. Therefore, the table is useful in comparing ongoing costs only, and will not help you determine the relative total costs of owning different funds. In addition, if these transactional costs were included, your costs would have been higher.
| | | | | | | | | | | | | | |
| Beginning
Account Value
7/1/21 | Ending
Account Value
12/31/21 | Expenses Paid During Period(1) 7/1/21 - 12/31/21 | Annualized Expense Ratio(1) |
| Actual | | | | |
| Class I | $1,000 | $1,070.30 | $3.70 | 0.71% |
| Class II | $1,000 | $1,069.40 | $4.49 | 0.86% |
| Hypothetical | | | | |
| Class I | $1,000 | $1,021.63 | $3.62 | 0.71% |
| Class II | $1,000 | $1,020.87 | $4.38 | 0.86% |
(1)Expenses are equal to the class's annualized expense ratio listed in the table above, multiplied by the average account value over the period, multiplied by 184, the number of days in the most recent fiscal half-year, divided by 365, to reflect the one-half year period. Annualized expense ratio reflects actual expenses, including any applicable fee waivers or expense reimbursements and excluding any acquired fund fees and expenses.
DECEMBER 31, 2021
| | | | | | | | |
| Shares | Value |
| COMMON STOCKS — 96.1% |
|
|
| Aerospace and Defense — 3.1% | | |
| General Dynamics Corp. | 5,828 | | $ | 1,214,964 | |
| Raytheon Technologies Corp. | 21,773 | | 1,873,784 | |
| | 3,088,748 | |
| Airlines — 1.1% | | |
Southwest Airlines Co.(1) | 26,982 | | 1,155,909 | |
| Automobiles — 0.6% | | |
| Volkswagen AG, Preference Shares | 3,191 | | 641,018 | |
| Banks — 6.9% | | |
| JPMorgan Chase & Co. | 19,323 | | 3,059,797 | |
| Truist Financial Corp. | 35,530 | | 2,080,281 | |
| U.S. Bancorp | 33,305 | | 1,870,742 | |
| | 7,010,820 | |
| Beverages — 1.2% | | |
| PepsiCo, Inc. | 7,107 | | 1,234,557 | |
| Capital Markets — 5.0% | | |
| Ameriprise Financial, Inc. | 3,856 | | 1,163,201 | |
| Bank of New York Mellon Corp. (The) | 48,306 | | 2,805,613 | |
| Northern Trust Corp. | 9,204 | | 1,100,890 | |
| | 5,069,704 | |
| Communications Equipment — 4.3% | | |
| Cisco Systems, Inc. | 52,359 | | 3,317,990 | |
F5, Inc.(1) | 4,168 | | 1,019,951 | |
| | 4,337,941 | |
| Containers and Packaging — 1.2% | | |
| Sonoco Products Co. | 20,833 | | 1,206,022 | |
| Diversified Financial Services — 3.8% | | |
Berkshire Hathaway, Inc., Class B(1) | 12,866 | | 3,846,934 | |
| Diversified Telecommunication Services — 3.6% | | |
| Verizon Communications, Inc. | 69,061 | | 3,588,410 | |
| Electric Utilities — 5.1% | | |
| Duke Energy Corp. | 11,053 | | 1,159,460 | |
| Eversource Energy | 9,877 | | 898,610 | |
| Pinnacle West Capital Corp. | 21,165 | | 1,494,037 | |
| Xcel Energy, Inc. | 23,796 | | 1,610,989 | |
| | 5,163,096 | |
| Electrical Equipment — 2.8% | | |
| Emerson Electric Co. | 19,928 | | 1,852,706 | |
| nVent Electric plc | 25,718 | | 977,284 | |
| | 2,829,990 | |
| Electronic Equipment, Instruments and Components — 0.5% | | |
| TE Connectivity Ltd. | 2,984 | | 481,439 | |
| Energy Equipment and Services — 1.0% | | |
| Baker Hughes Co. | 41,601 | | 1,000,920 | |
| Entertainment — 0.9% | | |
Walt Disney Co. (The)(1) | 6,197 | | 959,853 | |
| | | | | | | | |
| Shares | Value |
| Equity Real Estate Investment Trusts (REITs) — 1.1% | | |
| Healthpeak Properties, Inc. | 29,440 | | $ | 1,062,490 | |
| Food and Staples Retailing — 2.1% | | |
| Koninklijke Ahold Delhaize NV | 25,046 | | 859,487 | |
| Walmart, Inc. | 8,829 | | 1,277,468 | |
| | 2,136,955 | |
| Food Products — 3.5% | | |
| Conagra Brands, Inc. | 48,220 | | 1,646,713 | |
| Danone SA | 8,229 | | 511,510 | |
| Mondelez International, Inc., Class A | 20,063 | | 1,330,378 | |
| | 3,488,601 | |
| Health Care Equipment and Supplies — 7.8% | | |
| Becton Dickinson and Co. | 5,730 | | 1,440,980 | |
| Medtronic plc | 37,139 | | 3,842,030 | |
| Zimmer Biomet Holdings, Inc. | 20,133 | | 2,557,696 | |
| | 7,840,706 | |
| Health Care Providers and Services — 5.6% | | |
| Cigna Corp. | 5,111 | | 1,173,639 | |
| CVS Health Corp. | 13,172 | | 1,358,823 | |
| McKesson Corp. | 4,163 | | 1,034,797 | |
| Quest Diagnostics, Inc. | 5,797 | | 1,002,939 | |
| Universal Health Services, Inc., Class B | 8,298 | | 1,075,919 | |
| | 5,646,117 | |
| Health Care Technology — 2.0% | | |
| Cerner Corp. | 21,621 | | 2,007,942 | |
| Hotels, Restaurants and Leisure — 0.9% | | |
| Sodexo SA | 9,989 | | 875,715 | |
| Household Products — 3.3% | | |
| Colgate-Palmolive Co. | 11,344 | | 968,097 | |
| Kimberly-Clark Corp. | 9,161 | | 1,309,290 | |
| Procter & Gamble Co. (The) | 6,699 | | 1,095,822 | |
| | 3,373,209 | |
| Industrial Conglomerates — 1.2% | | |
| Siemens AG | 7,121 | | 1,233,377 | |
| Insurance — 6.0% | | |
| Aflac, Inc. | 26,725 | | 1,560,473 | |
| Allstate Corp. (The) | 15,301 | | 1,800,162 | |
| Chubb Ltd. | 8,400 | | 1,623,804 | |
| MetLife, Inc. | 16,534 | | 1,033,210 | |
| | 6,017,649 | |
| IT Services — 0.8% | | |
| Automatic Data Processing, Inc. | 3,337 | | 822,837 | |
| Machinery — 0.8% | | |
| Oshkosh Corp. | 7,269 | | 819,289 | |
| Multiline Retail — 1.1% | | |
Dollar Tree, Inc.(1) | 8,005 | | 1,124,863 | |
| Oil, Gas and Consumable Fuels — 4.7% | | |
| Chevron Corp. | 18,990 | | 2,228,476 | |
| ConocoPhillips | 15,515 | | 1,119,873 | |
| TotalEnergies SE, ADR | 27,633 | | 1,366,728 | |
| | 4,715,077 | |
| | | | | | | | |
| Shares | Value |
| Paper and Forest Products — 0.8% | | |
| Mondi plc | 31,410 | | $ | 779,091 | |
| Personal Products — 2.3% | | |
| Unilever plc, ADR | 42,764 | | 2,300,276 | |
| Pharmaceuticals — 8.3% | | |
| Johnson & Johnson | 26,448 | | 4,524,459 | |
| Merck & Co., Inc. | 27,778 | | 2,128,906 | |
| Pfizer, Inc. | 14,336 | | 846,541 | |
| Roche Holding AG | 2,034 | | 843,828 | |
| | 8,343,734 | |
| Road and Rail — 0.7% | | |
| Norfolk Southern Corp. | 2,540 | | 756,183 | |
| Semiconductors and Semiconductor Equipment — 0.9% | | |
| Texas Instruments, Inc. | 4,987 | | 939,900 | |
| Specialty Retail — 1.1% | | |
| Advance Auto Parts, Inc. | 4,550 | | 1,091,454 | |
TOTAL COMMON STOCKS (Cost $77,228,820) | | 96,990,826 | |
| EXCHANGE-TRADED FUNDS — 1.0% |
|
|
iShares Russell 1000 Value ETF (Cost $965,565) | 5,962 | | 1,001,199 | |
| TEMPORARY CASH INVESTMENTS — 2.9% |
|
|
| Repurchase Agreement, BMO Capital Markets Corp., (collateralized by various U.S. Treasury obligations, 2.00% - 2.375%, 4/30/24 - 5/15/51, valued at $577,650), in a joint trading account at 0.01%, dated 12/31/21, due 1/3/22 (Delivery value $566,198) | | 566,198 | |
| Repurchase Agreement, Fixed Income Clearing Corp., (collateralized by various U.S. Treasury obligations, 3.125%, 8/15/44, valued at $1,923,795), at 0.01%, dated 12/31/21, due 1/3/22 (Delivery value $1,886,002) | | 1,886,000 | |
| State Street Institutional U.S. Government Money Market Fund, Premier Class | 489,986 | | 489,985 | |
TOTAL TEMPORARY CASH INVESTMENTS (Cost $2,942,183) | | 2,942,183 | |
TOTAL INVESTMENT SECURITIES — 100.0% (Cost $81,136,568) |
| 100,934,208 | |
OTHER ASSETS AND LIABILITIES† |
| 33,283 | |
| TOTAL NET ASSETS — 100.0% |
| $ | 100,967,491 | |
| | | | | | | | | | | | | | | | | | | | |
| FORWARD FOREIGN CURRENCY EXCHANGE CONTRACTS |
| Currency Purchased | Currency Sold | Counterparty | Settlement Date | Unrealized Appreciation
(Depreciation) |
| USD | 711,081 | | CHF | 653,697 | | Morgan Stanley | 3/31/22 | $ | (7,969) | |
| USD | 4,618,265 | | EUR | 4,078,479 | | Credit Suisse AG | 3/31/22 | (33,562) | |
| USD | 2,556,115 | | GBP | 1,933,214 | | JPMorgan Chase Bank N.A. | 3/31/22 | (59,585) | |
| | | | | | $ | (101,116) | |
| | | | | | | | |
| NOTES TO SCHEDULE OF INVESTMENTS |
| ADR | - | American Depositary Receipt |
| CHF | - | Swiss Franc |
| EUR | - | Euro |
| GBP | - | British Pound |
| USD | - | United States Dollar |
†Category is less than 0.05% of total net assets.
(1)Non-income producing.
See Notes to Financial Statements.
| | |
| Statement of Assets and Liabilities |
| | | | | |
| DECEMBER 31, 2021 | |
| Assets | |
| Investment securities, at value (cost of $81,136,568) | $ | 100,934,208 | |
| Receivable for capital shares sold | 91,136 | |
| Dividends and interest receivable | 199,811 | |
| 101,225,155 | |
| |
| Liabilities | |
| Payable for capital shares redeemed | 86,698 | |
| Unrealized depreciation on forward foreign currency exchange contracts | 101,116 | |
| Accrued management fees | 52,565 | |
| Distribution fees payable | 17,285 | |
| 257,664 | |
| |
| Net Assets | $ | 100,967,491 | |
| |
| Net Assets Consist of: | |
| Capital (par value and paid-in surplus) | $ | 75,656,198 | |
| Distributable earnings | 25,311,293 | |
| $ | 100,967,491 | |
| | | | | | | | | | | |
| Net Assets | Shares Outstanding | Net Asset Value Per Share |
| Class I, $0.01 Par Value | $16,519,733 | 847,391 | $19.49 |
| Class II, $0.01 Par Value | $84,447,758 | 4,259,224 | $19.83 |
See Notes to Financial Statements.
| | | | | |
| YEAR ENDED DECEMBER 31, 2021 |
| Investment Income (Loss) | |
| Income: | |
| Dividends (net of foreign taxes withheld of $32,361) | $ | 2,067,623 | |
| Interest | 322 | |
| 2,067,945 | |
| |
| Expenses: | |
| Management fees | 654,443 | |
| Distribution fees - Class II | 180,485 | |
| Directors' fees and expenses | 2,088 | |
| 837,016 | |
Fees waived(1) | (118,986) | |
| 718,030 | |
| |
| Net investment income (loss) | 1,349,915 | |
| |
| Realized and Unrealized Gain (Loss) | |
| Net realized gain (loss) on: | |
| Investment transactions | 6,831,373 | |
| Forward foreign currency exchange contract transactions | 436,252 | |
| Foreign currency translation transactions | 1,362 | |
| 7,268,987 | |
| |
| Change in net unrealized appreciation (depreciation) on: | |
| Investments | 7,438,419 | |
| Forward foreign currency exchange contracts | (70,909) | |
| Translation of assets and liabilities in foreign currencies | (619) | |
| 7,366,891 | |
| |
| Net realized and unrealized gain (loss) | 14,635,878 | |
| |
| Net Increase (Decrease) in Net Assets Resulting from Operations | $ | 15,985,793 | |
(1)Amount consists of $19,363 and $99,623 for Class I and Class II, respectively.
See Notes to Financial Statements.
| | |
| Statement of Changes in Net Assets |
| | | | | | | | |
| YEARS ENDED DECEMBER 31, 2021 AND DECEMBER 31, 2020 |
| Increase (Decrease) in Net Assets | December 31, 2021 | December 31, 2020 |
| Operations | | |
| Net investment income (loss) | $ | 1,349,915 | | $ | 1,130,820 | |
| Net realized gain (loss) | 7,268,987 | | (1,214,152) | |
| Change in net unrealized appreciation (depreciation) | 7,366,891 | | 2,814,929 | |
| Net increase (decrease) in net assets resulting from operations | 15,985,793 | | 2,731,597 | |
| | |
| Distributions to Shareholders | | |
| From earnings: | | |
| Class I | (213,724) | | (274,197) | |
| Class II | (938,589) | | (1,145,260) | |
| Decrease in net assets from distributions | (1,152,313) | | (1,419,457) | |
| | |
| Capital Share Transactions | | |
| Net increase (decrease) in net assets from capital share transactions (Note 5) | 16,074,871 | | 8,353,706 | |
| | |
| Net increase (decrease) in net assets | 30,908,351 | | 9,665,846 | |
| | |
| Net Assets | | |
| Beginning of period | 70,059,140 | | 60,393,294 | |
| End of period | $ | 100,967,491 | | $ | 70,059,140 | |
See Notes to Financial Statements.
| | |
| Notes to Financial Statements |
DECEMBER 31, 2021
1. Organization
American Century Variable Portfolios, Inc. (the corporation) is registered under the Investment Company Act of 1940, as amended (the 1940 Act), as an open-end management investment company and is organized as a Maryland corporation. VP Large Company Value Fund (the fund) is one fund in a series issued by the corporation. The fund’s investment objective is to seek long-term capital growth. Income is a secondary objective. The fund offers Class I and Class II.
2. Significant Accounting Policies
The following is a summary of significant accounting policies consistently followed by the fund in preparation of its financial statements. The fund is an investment company and follows accounting and reporting guidance in accordance with accounting principles generally accepted in the United States of America. This may require management to make certain estimates and assumptions at the date of the financial statements. Actual results could differ from these estimates. Management evaluated the impact of events or transactions occurring through the date the financial statements were issued that would merit recognition or disclosure.
Investment Valuations — The fund determines the fair value of its investments and computes its net asset value (NAV) per share at the close of regular trading (usually 4 p.m. Eastern time) on the New York Stock Exchange (NYSE) on each day the NYSE is open. The Board of Directors has adopted valuation policies and procedures to guide the investment advisor in the fund’s investment valuation process and to provide methodologies for the oversight of the fund’s pricing function.
Equity securities that are listed or traded on a domestic securities exchange are valued at the last reported sales price or at the official closing price as provided by the exchange. Equity securities traded on foreign securities exchanges are generally valued at the closing price of such securities on the exchange where primarily traded or at the close of the NYSE, if that is earlier. If no last sales price is reported, or if local convention or regulation so provides, the mean of the latest bid and asked prices may be used. Securities traded over-the-counter are valued at the mean of the latest bid and asked prices, the last sales price, or the official closing price. Equity securities initially expressed in local currencies are translated into U.S. dollars at the mean of the appropriate currency exchange rate at the close of the NYSE as provided by an independent pricing service.
Open-end management investment companies are valued at the reported NAV per share. Repurchase agreements are valued at cost, which approximates fair value. Forward foreign currency exchange contracts are valued at the mean of the appropriate forward exchange rate at the close of the NYSE as provided by an independent pricing service.
If the fund determines that the market price for an investment is not readily available or the valuation methods mentioned above do not reflect an investment’s fair value, such investment is valued as determined in good faith by the Board of Directors or its delegate, in accordance with policies and procedures adopted by the Board of Directors. In its determination of fair value, the fund may review several factors including, but not limited to, market information regarding the specific investment or comparable investments and correlation with other investment types, futures indices or general market indicators. Circumstances that may cause the fund to use these procedures to value an investment include, but are not limited to: an investment has been declared in default or is distressed; trading in a security has been suspended during the trading day or a security is not actively trading on its principal exchange; prices received from a regular pricing source are deemed unreliable; or there is a foreign market holiday and no trading occurred.
The fund monitors for significant events occurring after the close of an investment’s primary exchange but before the fund’s NAV per share is determined. Significant events may include, but are not limited to: corporate announcements and transactions; governmental action and political unrest that could impact a specific investment or an investment sector; or armed conflicts, natural disasters and similar events that could affect investments in a specific country or region. The fund also monitors for significant fluctuations between domestic and foreign markets, as evidenced by the U.S. market or such other indicators that the Board of Directors, or its delegate, deems appropriate. The fund may apply a model-derived factor to the closing price of equity securities traded on foreign securities exchanges. The factor is based on observable market data as provided by an independent pricing service.
Security Transactions — Security transactions are accounted for as of the trade date. Net realized gains and losses are determined on the identified cost basis, which is also used for federal income tax purposes.
Investment Income — Dividend income less foreign taxes withheld, if any, is recorded as of the ex-dividend date. Distributions received on securities that represent a return of capital or long-term capital gain are recorded as a reduction of cost of investments and/or as a realized gain. The fund may estimate the components of distributions received that may be considered nontaxable distributions or long-term capital gain distributions for income tax purposes. Interest income is recorded on the accrual basis and includes accretion of discounts and amortization of premiums.
Foreign Currency Translations — All assets and liabilities initially expressed in foreign currencies are translated into U.S. dollars at prevailing exchange rates at period end. The fund may enter into spot foreign currency exchange contracts to facilitate transactions denominated in a foreign currency. Purchases and sales of investment securities, dividend and interest income, spot foreign currency exchange contracts, and expenses are translated at the rates of exchange prevailing on the respective dates of such transactions. Net realized and unrealized foreign currency exchange gains or losses related to investment securities are a component of net realized gain (loss) on investment transactions and change in net unrealized appreciation (depreciation) on investments, respectively.
Repurchase Agreements — The fund may enter into repurchase agreements with institutions that American Century Investment Management, Inc. (ACIM) (the investment advisor) has determined are creditworthy pursuant to criteria adopted by the Board of Directors. The fund requires that the collateral, represented by securities, received in a repurchase transaction be transferred to the custodian in a manner sufficient to enable the fund to obtain those securities in the event of a default under the repurchase agreement. ACIM monitors, on a daily basis, the securities transferred to ensure the value, including accrued interest, of the securities under each repurchase agreement is equal to or greater than amounts owed to the fund under each repurchase agreement.
Joint Trading Account — Pursuant to an Exemptive Order issued by the Securities and Exchange Commission, the fund, along with certain other funds in the American Century Investments family of funds, may transfer uninvested cash balances into a joint trading account. These balances are invested in one or more repurchase agreements that are collateralized by U.S. Treasury or Agency obligations.
Income Tax Status — It is the fund’s policy to distribute substantially all net investment income and net realized gains to shareholders and to otherwise qualify as a regulated investment company under provisions of the Internal Revenue Code. Accordingly, no provision has been made for income taxes. The fund files U.S. federal, state, local and non-U.S. tax returns as applicable. The fund's tax returns are subject to examination by the relevant taxing authority until expiration of the applicable statute of limitations, which is generally three years from the date of filing but can be longer in certain jurisdictions. At this time, management believes there are no uncertain tax positions which, based on their technical merit, would not be sustained upon examination and for which it is reasonably possible that the total amounts of unrecognized tax benefits will significantly change in the next twelve months.
Multiple Class — All shares of the fund represent an equal pro rata interest in the net assets of the class to which such shares belong, and have identical voting, dividend, liquidation and other rights and the same terms and conditions, except for class specific expenses and exclusive rights to vote on matters affecting only individual classes. Income, non-class specific expenses, and realized and unrealized capital gains and losses of the fund are allocated to each class of shares based on their relative net assets.
Distributions to Shareholders — Distributions from net investment income, if any, are generally declared and paid quarterly. Distributions from net realized gains, if any, are generally declared and paid annually.
Indemnifications — Under the corporation’s organizational documents, its officers and directors are indemnified against certain liabilities arising out of the performance of their duties to the fund. In addition, in the normal course of business, the fund enters into contracts that provide general indemnifications. The maximum exposure under these arrangements is unknown as this would involve future claims that may be made against a fund. The risk of material loss from such claims is considered by management to be remote.
3. Fees and Transactions with Related Parties
Certain officers and directors of the corporation are also officers and/or directors of American Century Companies, Inc. (ACC). The corporation’s investment advisor, ACIM, the corporation's distributor, American Century Investment Services, Inc. (ACIS), and the corporation’s transfer agent, American Century Services, LLC, are wholly owned, directly or indirectly, by ACC.
Management Fees — The corporation has entered into a management agreement with ACIM, under which ACIM provides the fund with investment advisory and management services in exchange for a single, unified management fee (the fee) per class. The agreement provides that ACIM will pay all expenses of managing and operating the fund, except brokerage expenses, taxes, interest, fees and expenses of the independent directors (including legal counsel fees), extraordinary expenses, and expenses incurred in connection with the provision of shareholder services and distribution services under a plan adopted pursuant to Rule 12b-1 under the 1940 Act. The fee is computed and accrued daily based on each class's daily net assets and paid monthly in arrears. The difference in the fee among the classes is a result of their separate arrangements for non-Rule 12b-1 shareholder services. It is not the result of any difference in advisory or custodial fees or other expenses related to the management of the fund's assets, which do not vary by class. The rate of the fee is determined by applying a fee rate calculation formula. This formula takes into account the fund's assets as well as certain assets, if any, of other clients of the investment advisor outside the American Century Investments family of funds (such as subadvised funds and separate accounts) that use very similar investment teams and strategies (strategy assets). From January 1, 2021 through July 31, 2021, the investment advisor agreed to waive 0.17% of the fund's management fee. Effective August 1, 2021, the investment advisor agreed to waive 0.10% of the fund's management fee. The investment advisor expects this waiver to continue until July 31, 2022 and cannot terminate it prior to such date without the approval of the Board of Directors.
The management fee schedule range and the effective annual management fee before and after waiver for each class for the period ended December 31, 2021 are as follows:
| | | | | | | | | | | |
| | Effective Annual Management Fee |
| Management Fee Schedule Range* | Before Waiver | After Waiver |
| Class I | 0.70% to 0.83% | 0.84% | 0.71% |
| Class II | 0.60% to 0.73% | 0.74% | 0.61% |
*Prior to August 1, 2021, the management fee schedule range was 0.70% to 0.90% for Class I and 0.60% to 0.80% for Class II.
Distribution Fees — The Board of Directors has adopted the Master Distribution Plan (the plan) for Class II, pursuant to Rule 12b-1 of the 1940 Act. The plan provides that Class II will pay ACIS an annual distribution fee equal to 0.25%. The fee is computed and accrued daily based on the Class II daily net assets and paid monthly in arrears. The distribution fee provides compensation for expenses incurred in connection with distributing shares of Class II including, but not limited to, payments to brokers, dealers, and financial institutions that have entered into sales agreements with respect to shares of the fund. Fees incurred under the plan during the period ended December 31, 2021 are detailed in the Statement of Operations.
Directors' Fees and Expenses — The Board of Directors is responsible for overseeing the investment advisor’s management and operations of the fund. The directors receive detailed information about the fund and its investment advisor regularly throughout the year, and meet at least quarterly with management of the investment advisor to review reports about fund operations. The fund’s officers do not receive compensation from the fund.
Interfund Transactions — The fund may enter into security transactions with other American Century Investments funds and other client accounts of the investment advisor, in accordance with the 1940 Act rules and procedures adopted by the Board of Directors. The rules and procedures require, among other things, that these transactions be effected at the independent current market price of the security. During the period, the interfund purchases were $103,741 and there were no interfund sales.
4. Investment Transactions
Purchases and sales of investment securities, excluding short-term investments, for the period ended December 31, 2021 were $47,903,402 and $33,265,293, respectively.
5. Capital Share Transactions
Transactions in shares of the fund were as follows:
| | | | | | | | | | | | | | |
| Year ended
December 31, 2021 | Year ended
December 31, 2020 |
| Shares | Amount | Shares | Amount |
| Class I/Shares Authorized | 50,000,000 | |
| 50,000,000 | | |
| Sold | 387,024 | | $ | 7,229,882 | | 255,420 | | $ | 3,708,366 | |
| Issued in reinvestment of distributions | 11,471 | | 213,724 | | 21,116 | | 274,197 | |
| Redeemed | (254,434) | | (4,616,622) | | (280,051) | | (4,009,123) | |
| 144,061 | | 2,826,984 | | (3,515) | | (26,560) | |
| Class II/Shares Authorized | 50,000,000 | |
| 50,000,000 | | |
| Sold | 1,102,712 | | 20,544,353 | | 897,950 | | 13,064,952 | |
| Issued in reinvestment of distributions | 49,538 | | 938,589 | | 86,784 | | 1,145,260 | |
| Redeemed | (443,102) | | (8,235,055) | | (386,595) | | (5,829,946) | |
| 709,148 | | 13,247,887 | | 598,139 | | 8,380,266 | |
| Net increase (decrease) | 853,209 | | $ | 16,074,871 | | 594,624 | | $ | 8,353,706 | |
6. Fair Value Measurements
The fund’s investments valuation process is based on several considerations and may use multiple inputs to determine the fair value of the investments held by the fund. In conformity with accounting principles generally accepted in the United States of America, the inputs used to determine a valuation are classified into three broad levels.
•Level 1 valuation inputs consist of unadjusted quoted prices in an active market for identical investments.
•Level 2 valuation inputs consist of direct or indirect observable market data (including quoted prices for comparable investments, evaluations of subsequent market events, interest rates, prepayment speeds, credit risk, etc.). These inputs also consist of quoted prices for identical investments initially expressed in local currencies that are adjusted through translation into U.S. dollars.
•Level 3 valuation inputs consist of unobservable data (including a fund’s own assumptions).
The level classification is based on the lowest level input that is significant to the fair valuation measurement. The valuation inputs are not necessarily an indication of the risks associated with investing in these securities or other financial instruments.
The following is a summary of the level classifications as of period end. The Schedule of Investments provides additional information on the fund’s portfolio holdings.
| | | | | | | | | | | |
| Level 1 | Level 2 | Level 3 |
| Assets | | | |
| Investment Securities | | | |
| Common Stocks | | | |
| Automobiles | — | | $ | 641,018 | | — | |
| Food and Staples Retailing | $ | 1,277,468 | | 859,487 | | — | |
| Food Products | 2,977,091 | | 511,510 | | — | |
| Hotels, Restaurants and Leisure | — | | 875,715 | | — | |
| Industrial Conglomerates | — | | 1,233,377 | | — | |
| Paper and Forest Products | — | | 779,091 | | — | |
| Pharmaceuticals | 7,499,906 | | 843,828 | | — | |
| Other Industries | 79,492,335 | | — | | — | |
| Exchange-Traded Funds | 1,001,199 | | — | | — | |
| Temporary Cash Investments | 489,985 | | 2,452,198 | | — | |
| $ | 92,737,984 | | $ | 8,196,224 | | — | |
| | | |
| Liabilities | | | |
| Other Financial Instruments | | | |
| Forward Foreign Currency Exchange Contracts | — | | $ | 101,116 | | — | |
7. Derivative Instruments
Foreign Currency Risk — The fund is subject to foreign currency exchange rate risk in the normal course of pursuing its investment objectives. The value of foreign investments held by a fund may be significantly affected by changes in foreign currency exchange rates. The dollar value of a foreign security generally decreases when the value of the dollar rises against the foreign currency in which the security is denominated and tends to increase when the value of the dollar declines against such foreign currency. A fund may enter into forward foreign currency exchange contracts to reduce a fund's exposure to foreign currency exchange rate fluctuations. The net U.S. dollar value of foreign currency underlying all contractual commitments held by a fund and the resulting unrealized appreciation or depreciation are determined daily. Realized gain or loss is recorded upon settlement of the contract. Net realized and unrealized gains or losses occurring during the holding period of forward foreign currency exchange contracts are a component of net realized gain (loss) on forward foreign currency exchange contract transactions and change in net unrealized appreciation (depreciation) on forward foreign currency exchange contracts, respectively. A fund bears the risk of an unfavorable change in the foreign currency exchange rate underlying the forward contract. Additionally, losses, up to the fair value, may arise if the counterparties do not perform under the contract terms. The fund's average U.S. dollar exposure to foreign currency risk derivative instruments held during the period was $7,651,882.
The value of foreign currency risk derivative instruments as of December 31, 2021, is disclosed on the Statement of Assets and Liabilities as a liability of $101,116 in unrealized depreciation on forward foreign currency exchange contracts. For the year ended December 31, 2021, the effect of foreign currency risk derivative instruments on the Statement of Operations was $436,252 in net realized gain (loss) on forward foreign currency exchange contract transactions and $(70,909) in change in net unrealized appreciation (depreciation) on forward foreign currency exchange contracts.
8. Risk Factors
The value of the fund’s shares will go up and down, sometimes rapidly or unpredictably, based on the performance of the securities owned by the fund and other factors generally affecting the securities market. Market risks, including political, regulatory, economic and social developments, can affect the value of the fund’s investments. Natural disasters, public health emergencies, terrorism and other unforeseeable events may lead to increased market volatility and may have adverse long-term effects on world economies and markets generally.
There are certain risks involved in investing in foreign securities. These risks include those resulting from political events (such as civil unrest, national elections and imposition of exchange controls), social and economic events (such as labor strikes and rising inflation), and natural disasters. Securities of foreign issuers may be less liquid and more volatile. Investing a significant portion of assets in one country or region may accentuate these risks.
9. Federal Tax Information
The tax character of distributions paid during the years ended December 31, 2021 and December 31, 2020 were as follows:
| | | | | | | | |
| 2021 | 2020 |
| Distributions Paid From | | |
| Ordinary income | $ | 1,152,313 | | $ | 961,844 | |
| Long-term capital gains | — | | $ | 457,613 | |
The book-basis character of distributions made during the year from net investment income or net realized gains may differ from their ultimate characterization for federal income tax purposes. These differences reflect the differing character of certain income items and net realized gains and losses for financial statement and tax purposes, and may result in reclassification among certain capital accounts on the financial statements.
As of period end, the federal tax cost of investments and the components of distributable earnings on a tax-basis were as follows:
| | | | | |
| Federal tax cost of investments | $ | 82,173,833 | |
| Gross tax appreciation of investments | $ | 19,671,324 | |
| Gross tax depreciation of investments | (910,949) | |
| Net tax appreciation (depreciation) of investments | 18,760,375 | |
| Net tax appreciation (depreciation) on derivatives and translation of assets and liabilities in foreign currencies | (5) | |
| Net tax appreciation (depreciation) | $ | 18,760,370 | |
| Undistributed ordinary income | $ | 2,206,773 | |
| Accumulated long-term gains | $ | 4,344,150 | |
The difference between book-basis and tax-basis unrealized appreciation (depreciation) is attributable primarily to the tax deferral of losses on wash sales.
| | | | | | | | | | | | | | | | | | | | | | | | | | | | | | | | | | | | | | | | | | | | | | | |
| For a Share Outstanding Throughout the Years Ended December 31 (except as noted) | |
| Per-Share Data | | | | | | Ratios and Supplemental Data | |
| | Income From Investment Operations: | Distributions From: | | | Ratio to Average Net Assets of: | |
| Net Asset
Value,
Beginning
of Period | Net Investment
Income (Loss)(1) | Net
Realized
and
Unrealized
Gain (Loss) | Total From
Investment
Operations | Net
Investment
Income | Net
Realized
Gains | Total
Distributions | Net Asset
Value,
End
of Period | Total Return(2) | Operating
Expenses | Operating
Expenses
(before
expense
waiver) | Net
Investment
Income
(Loss) | Net
Investment
Income (Loss)
(before expense waiver) | Portfolio
Turnover
Rate | Net
Assets,
End of
Period
(in thousands) |
| Class I | | | | | | | | | | | | | | |
| 2021 | $16.24 | 0.31 | 3.20 | 3.51 | (0.26) | — | (0.26) | $19.49 | 21.71% | 0.71% | 0.84% | 1.68% | 1.55% | 40% | $16,520 | |
| 2020 | $16.29 | 0.30 | 0.02 | 0.32 | (0.25) | (0.12) | (0.37) | $16.24 | 2.62% | 0.74% | 0.90% | 2.07% | 1.91% | 77% | $11,424 | |
| 2019 | $13.38 | 0.28 | 3.31 | 3.59 | (0.31) | (0.37) | (0.68) | $16.29 | 27.48% | 0.76% | 0.90% | 1.82% | 1.68% | 59% | $11,514 | |
| 2018 | $15.77 | 0.28 | (1.49) | (1.21) | (0.27) | (0.91) | (1.18) | $13.38 | (8.04)% | 0.78% | 0.90% | 1.86% | 1.74% | 51% | $6,644 | |
| 2017 | $15.25 | 0.31 | 1.31 | 1.62 | (0.27) | (0.83) | (1.10) | $15.77 | 11.07% | 0.80% | 0.91% | 2.02% | 1.91% | 64% | $8,083 | |
| Class II | | | | | | | | | | | | | | | |
| 2021 | $16.52 | 0.29 | 3.25 | 3.54 | (0.23) | — | (0.23) | $19.83 | 21.53% | 0.86% | 0.99% | 1.53% | 1.40% | 40% | $84,448 | |
| 2020 | $16.56 | 0.28 | 0.03 | 0.31 | (0.23) | (0.12) | (0.35) | $16.52 | 2.49% | 0.89% | 1.05% | 1.92% | 1.76% | 77% | $58,635 | |
| 2019 | $13.59 | 0.25 | 3.38 | 3.63 | (0.29) | (0.37) | (0.66) | $16.56 | 27.31% | 0.91% | 1.05% | 1.67% | 1.53% | 59% | $48,879 | |
| 2018 | $16.00 | 0.26 | (1.51) | (1.25) | (0.25) | (0.91) | (1.16) | $13.59 | (8.19)% | 0.93% | 1.05% | 1.71% | 1.59% | 51% | $24,144 | |
| 2017 | $15.45 | 0.29 | 1.33 | 1.62 | (0.24) | (0.83) | (1.07) | $16.00 | 10.96% | 0.95% | 1.06% | 1.87% | 1.76% | 64% | $13,971 | |
| | | | | | | | |
| Notes to Financial Highlights |
(1)Computed using average shares outstanding throughout the period.
(2)Total returns are calculated based on the net asset value of the last business day. Total returns for periods less than one year are not annualized. The total returns presented do not include the fees and charges assessed with investments in variable insurance products, those charges are disclosed in the separate account prospectus. The inclusion of such fees and charges would lower total return.
See Notes to Financial Statements.
| | |
| Report of Independent Registered Public Accounting Firm |
To the Shareholders and the Board of Directors of American Century Variable Portfolios, Inc.:
Opinion on the Financial Statements and Financial Highlights
We have audited the accompanying statement of assets and liabilities, including the schedule of investments, of VP Large Company Value Fund (the “Fund”), one of the funds constituting the American Century Variable Portfolios, Inc., as of December 31, 2021, the related statement of operations for the year then ended, the statements of changes in net assets for each of the two years in the period then ended, the financial highlights for each of the five years in the period then ended, and the related notes. In our opinion, the financial statements and financial highlights present fairly, in all material respects, the financial position of VP Large Company Value Fund of the American Century Variable Portfolios, Inc. as of December 31, 2021, and the results of its operations for the year then ended, the changes in its net assets for each of the two years in the period then ended, and the financial highlights for each of the five years in the period then ended, in conformity with accounting principles generally accepted in the United States of America.
Basis for Opinion
These financial statements and financial highlights are the responsibility of the Fund's management. Our responsibility is to express an opinion on the Fund’s financial statements and financial highlights based on our audits. We are a public accounting firm registered with the Public Company Accounting Oversight Board (United States) (PCAOB) and are required to be independent with respect to the Fund in accordance with the U.S. federal securities laws and the applicable rules and regulations of the Securities and Exchange Commission and the PCAOB.
We conducted our audits in accordance with the standards of the PCAOB. Those standards require that we plan and perform the audit to obtain reasonable assurance about whether the financial statements and financial highlights are free of material misstatement, whether due to error or fraud. The Fund is not required to have, nor were we engaged to perform, an audit of its internal control over financial reporting. As part of our audits, we are required to obtain an understanding of internal control over financial reporting but not for the purpose of expressing an opinion on the effectiveness of the Fund’s internal control over financial reporting. Accordingly, we express no such opinion.
Our audits included performing procedures to assess the risks of material misstatement of the financial statements and financial highlights, whether due to error or fraud, and performing procedures that respond to those risks. Such procedures included examining, on a test basis, evidence regarding the amounts and disclosures in the financial statements and financial highlights. Our audits also included evaluating the accounting principles used and significant estimates made by management, as well as evaluating the overall presentation of the financial statements and financial highlights. Our procedures included confirmation of securities owned as of December 31, 2021, by correspondence with the custodian and brokers; when replies were not received from brokers, we performed other auditing procedures. We believe that our audits provide a reasonable basis for our opinion.
/s/ Deloitte & Touche LLP
Kansas City, Missouri
February 10, 2022
We have served as the auditor of one or more American Century investment companies since 1997.
The Board of Directors
The individuals listed below serve as directors of the funds. Each director will continue to serve in this capacity until death, retirement, resignation or removal from office. The board has adopted a mandatory retirement age for directors who are not “interested persons,” as that term is defined in the Investment Company Act (independent directors). Independent directors shall retire on December 31 of the year in which they reach their 75th birthday.
Mr. Thomas is an “interested person” because he currently serves as President and Chief Executive Officer of American Century Companies, Inc. (ACC), the parent company of American Century Investment Management, Inc. (ACIM or the advisor). The other directors (more than three-fourths of the total number) are independent. They are not employees, directors or officers of, and have no financial interest in, ACC or any of its wholly owned, direct or indirect, subsidiaries, including ACIM, American Century Investment Services, Inc. (ACIS) and American Century Services, LLC (ACS), and they do not have any other affiliations, positions or relationships that would cause them to be considered “interested persons” under the Investment Company Act. The directors serve in this capacity for seven (in the case of Jonathan S. Thomas, 16; and Stephen E. Yates, 8) registered investment companies in the American Century Investments family of funds.
The following table presents additional information about the directors. The mailing address for each director is 4500 Main Street, Kansas City, Missouri 64111.
| | | | | | | | | | | | | | | | | |
Name
(Year of Birth) | Position(s) Held with Funds | Length of Time Served | Principal Occupation(s) During Past 5 Years | Number of American Century Portfolios Overseen by Director | Other Directorships Held During Past 5 Years |
| Independent Directors | | |
| Thomas W. Bunn (1953) | Director | Since 2017 | Retired | 72 | SquareTwo Financial |
Chris H. Cheesman
(1962)
| Director | Since 2019
| Retired. Senior Vice President & Chief Audit Executive, AllianceBernstein (1999 to 2018)
| 72 | Alleghany Corporation |
Barry Fink
(1955) | Director | Since 2012 (independent since 2016) | Retired | 72 | None |
Rajesh K. Gupta
(1960)
| Director | Since 2019
| Partner Emeritus, SeaCrest Investment Management and SeaCrest Wealth Management (2019 to Present); Chief Executive Officer and Chief Investment Officer, SeaCrest Investment Management (2006 to 2019); Chief Executive Officer and Chief Investment Officer, SeaCrest Wealth Management (2008 to 2019) | 72 | None |
| | | | | | | | | | | | | | | | | |
Name
(Year of Birth) | Position(s) Held with Funds | Length of Time Served | Principal Occupation(s) During Past 5 Years | Number of American Century Portfolios Overseen by Director | Other Directorships Held During Past 5 Years |
| Independent Directors | | |
Lynn Jenkins
(1963)
| Director | Since 2019
| Consultant, LJ Strategies (2019 to present); United States Representative, U.S. House of Representatives (2009 to 2018) | 72 | MGP Ingredients, Inc. (2019 to 2021) |
Jan M. Lewis
(1957) | Director | Since 2011 | Retired | 72 | None |
John R. Whitten(1) (1946) | Director | Since 2008 | Retired | 72 | Onto Innovation Inc. (2019 to 2020); Rudolph Technologies, Inc. (2006 to 2019) |
Stephen E. Yates
(1948) | Director and Chairman of the Board | Since 2012 (Chairman since 2018) | Retired | 108 | None |
| Interested Director | |
Jonathan S. Thomas
(1963) | Director | Since 2007 | President and Chief Executive Officer, ACC (2007 to present). Also serves as Chief Executive Officer, ACS; Director, ACC and other ACC subsidiaries | 146 | None |
(1) Effective December 31, 2021, John R. Whitten retired from the Board of Directors.
The Statement of Additional Information has additional information about the fund's directors and is available without charge, upon request, by calling 1-800-378-9878.
Officers
The following table presents certain information about the executive officers of the funds. Each officer serves as an officer for 16 (in the case of Robert J. Leach, 15) investment companies in the American Century family of funds. No officer is compensated for his or her service as an officer of the funds. The listed officers are interested persons of the funds and are appointed or re-appointed on an annual basis. The mailing address for each officer listed below is 4500 Main Street, Kansas City, Missouri 64111.
| | | | | | | | |
Name
(Year of Birth) | Offices with the Funds | Principal Occupation(s) During the Past Five Years |
Patrick Bannigan
(1965) | President since 2019 | Executive Vice President and Director, ACC (2012 to present); Chief Financial Officer, Chief Accounting Officer and Treasurer, ACC (2015 to present). Also serves as President, ACS; Vice President, ACIM; Chief Financial Officer, Chief Accounting Officer and/or Director, ACIM, ACS and other ACC subsidiaries |
R. Wes Campbell
(1974) | Chief Financial Officer and Treasurer since 2018 | Vice President, ACS, (2020 to present); Investment Operations and Investment Accounting, ACS (2000 to present) |
Amy D. Shelton
(1964) | Chief Compliance Officer and Vice President since 2014 | Chief Compliance Officer, American Century funds, (2014 to present); Chief Compliance Officer, ACIM (2014 to present); Chief Compliance Officer, ACIS (2009 to present). Also serves as Vice President, ACIS |
John Pak
(1968) | General Counsel and
Senior Vice President since 2021 | General Counsel and Senior Vice President, ACC (2021 to present); Also serves as General Counsel and Senior Vice President, ACIM, ACS and ACIS. Chief Legal Officer of Investment and Wealth Management, The Bank of New York Mellon (2014 to 2021) |
C. Jean Wade
(1964) | Vice President since 2012 | Senior Vice President, ACS (2017 to present); Vice President, ACS (2000 to 2017)
|
Robert J. Leach
(1966) | Vice President since 2006 | Vice President, ACS (2000 to present) |
David H. Reinmiller
(1963) | Vice President since 2000 | Attorney, ACC (1994 to present). Also serves as Vice President, ACIM and ACS |
Ward D. Stauffer
(1960) | Secretary since 2005 | Attorney, ACC (2003 to present) |
Proxy Voting Policies
A description of the policies that the fund's investment advisor uses in exercising the voting rights associated with the securities purchased and/or held by the fund is available without charge, upon request, by calling 1-800-378-9878. It is also available on American Century Investments’ website at americancentury.com/proxy and on the Securities and Exchange Commission’s website at sec.gov. Information regarding how the investment advisor voted proxies relating to portfolio securities during the most recent 12-month period ended June 30 is available on americancentury.com/proxy. It is also available at sec.gov.
Quarterly Portfolio Disclosure
The fund files its complete schedule of portfolio holdings with the Securities and Exchange Commission (SEC) for the first and third quarters of each fiscal year as an exhibit to its reports on Form N-PORT. These portfolio holdings are available on the fund's website at ipro.americancentury.com (for Investment Professionals) and, upon request, by calling 1-800-378-9878. The fund’s Form N-PORT reports are available on the SEC’s website at sec.gov.
Other Tax Information
The following information is provided pursuant to provisions of the Internal Revenue Code.
For corporate taxpayers, the fund hereby designates $1,152,313, or up to the maximum amount
allowable, of ordinary income distributions paid during the fiscal year ended December 31, 2021 as
qualified for the corporate dividends received deduction.
| | | | | | | | |
| |
| | |
| Contact Us | americancentury.com | |
| Automated Information Line | 1-800-345-8765 | |
| Investment Professional Service Representatives | 1-800-345-6488 | |
| Telecommunications Relay Service for the Deaf | 711 | |
| | |
| American Century Variable Portfolios, Inc. | |
| | |
Investment Advisor: American Century Investment Management, Inc. Kansas City, Missouri | |
| | |
| This report and the statements it contains are submitted for the general information of our shareholders. The report is not authorized for distribution to prospective investors unless preceded or accompanied by an effective prospectus. | |
| | |
©2022 American Century Proprietary Holdings, Inc. All rights reserved.
CL-ANN-91445 2202 | |
| | | | | |
| |
| Annual Report |
| |
| December 31, 2021 |
| |
| VP Mid Cap Value Fund |
| Class I (AVIPX) |
| Class II (AVMTX) |
| | | | | |
| Performance | |
| Portfolio Commentary | |
| Fund Characteristics | |
| Shareholder Fee Example | |
| Schedule of Investments | |
| Statement of Assets and Liabilities | |
| Statement of Operations | |
| Statement of Changes in Net Assets | |
| Notes to Financial Statements | |
| Financial Highlights | |
| Report of Independent Registered Public Accounting Firm | |
| Management | |
| |
| |
| Additional Information | |
Any opinions expressed in this report reflect those of the author as of the date of the report, and do not necessarily represent the opinions of American Century Investments® or any other person in the American Century Investments organization. Any such opinions are subject to change at any time based upon market or other conditions and American Century Investments disclaims any responsibility to update such opinions. These opinions may not be relied upon as investment advice and, because investment decisions made by American Century Investments funds are based on numerous factors, may not be relied upon as an indication of trading intent on behalf of any American Century Investments fund. Security examples are used for representational purposes only and are not intended as recommendations to purchase or sell securities. Performance information for comparative indices and securities is provided to American Century Investments by third party vendors. To the best of American Century Investments’ knowledge, such information is accurate at the time of printing.
| | | | | | | | | | | | | | | | | | |
| Total Returns as of December 31, 2021 |
| | | Average Annual Returns | |
| Ticker
Symbol | 1 year | 5 years | 10 years | | Inception
Date |
| Class I | AVIPX | 23.20% | 9.41% | 12.82% | | 12/1/04 |
| Russell Midcap Value Index | — | 28.34% | 11.21% | 13.43% | | — |
| Class II | AVMTX | 23.02% | 9.25% | 12.67% | | 10/29/04 |
Fund returns would have been lower if a portion of the fees had not been waived.
The performance information presented does not include the fees and charges assessed with investments in variable insurance products, those charges are disclosed in the separate account prospectus. The inclusion of such fees and charges would lower performance.
Data presented reflect past performance. Past performance is no guarantee of future results. Current performance may be higher or lower than the performance shown. Total returns for periods less than one year are not annualized. Investment return and principal value will fluctuate, and redemption value may be more or less than original cost. Data assumes reinvestment of dividends and capital gains, and none of the charts reflect the deduction of taxes that a shareholder would pay on fund distributions or the redemption of fund shares. To obtain performance data current to the most recent month end, please call 1-800-345-6488 or visit ipro.americancentury.com (for Investment Professionals). For additional information about the fund, please consult the prospectus.
| | |
| Growth of $10,000 Over 10 Years |
| $10,000 investment made December 31, 2011 |
| Performance for other share classes will vary due to differences in fee structure. |
| | | | | |
| Value on December 31, 2021 |
| Class I — $33,457 |
|
| Russell Midcap Value Index — $35,286 |
|
| |
|
| |
|
Ending value of Class I would have been lower if a portion of the fees had not been waived.
| | | | | |
| Total Annual Fund Operating Expenses |
| Class I | Class II |
| 0.86% | 1.01% |
The total annual fund operating expenses shown is as stated in the fund’s prospectus current as of the date of this report. The prospectus may vary from the expense ratio shown elsewhere in this report because it is based on a different time period, includes acquired fund fees and expenses, and, if applicable, does not include fee waivers or expense reimbursements.
Data presented reflect past performance. Past performance is no guarantee of future results. Current performance may be higher or lower than the performance shown. Total returns for periods less than one year are not annualized. Investment return and principal value will fluctuate, and redemption value may be more or less than original cost. Data assumes reinvestment of dividends and capital gains, and none of the charts reflect the deduction of taxes that a shareholder would pay on fund distributions or the redemption of fund shares. To obtain performance data current to the most recent month end, please call 1-800-345-6488 or visit ipro.americancentury.com (for Investment Professionals). For additional information about the fund, please consult the prospectus.
Portfolio Managers: Kevin Toney, Phillip N. Davidson, Michael Liss and Brian Woglom
Performance Summary
VP Mid Cap Value returned 23.02%* for the 12 months ended December 31, 2021. The fund’s benchmark, the Russell Midcap Value Index, returned 28.34%. The fund’s return reflects operating expenses, while the index’s return does not.
Security selection in the materials and financials sectors hindered relative performance. Lack of exposure to select benchmark names in both sectors also limited returns. On the other hand, our choice of stocks in the industrials and information technology sectors supported relative performance.
Materials, Financials and Health Care Detracted
Within the materials sector, some of our higher-quality holdings in the containers and packaging industry, including Sonoco Products, negatively impacted relative results. A lack of exposure to the cyclical metals and mining industry was also detrimental. Companies in that industry often do not meet our high-quality investment criteria due to the commodity nature of their businesses. Hopes for an economic reopening led investors away from defensive sectors and toward more cyclical areas of the market, including many materials stocks.
Security selection in the financials sector negatively impacted returns against a backdrop of strong equity markets and rising interest rates late in the period. Our exposure to the banking industry, including not owning several benchmark names, detracted. The stock of global life insurer Reinsurance Group of America was a notable detractor. The company reported earnings that were below expectations due to continued high levels of COVID-19-related deaths.
The portfolio’s health care holdings were an area of weakness. Medical device company Zimmer Biomet Holdings underperformed following strong performance in the second half of 2020, when elective surgeries began to be allowed during the pandemic. With additional waves of coronavirus variants in 2021, elective surgeries were again delayed by many providers.
Industrials, Information Technology and Energy Contributed
The portfolio’s relative performance was buoyed by stock selection in the industrials sector. Select holdings in the machinery and electrical equipment industries benefited performance in the period. nVent Electric, a provider of electrical products based in the U.K., recently delivered strong quarterly results. We believe nVent has growing earnings power, supported by an end-market recovery and stronger demand for its industrial products.
*All fund returns referenced in this commentary are for Class II shares. Returns would have been lower if a portion of the fees had not been waived. Performance for other share classes will vary due to differences in fee structure; when Class II performance exceeds that of the fund’s benchmark, other share classes may not. See page 2 for returns for all share classes.
Holdings in the information technology sector contributed positively to relative performance, including Applied Materials. The semiconductor equipment company continued to execute on its product road map, evidenced by a significant market share gain for the company’s etch business and strong growth for its inspection business. While we believe Applied Materials remains well positioned given its balanced product portfolio and strong services business, we exited our position as its risk/reward became less attractive.
The portfolio benefited from stock selection in the energy sector. Exploration and production company ConocoPhillips outperformed due in part to its continued strong execution. In addition, strength in commodity markets increased the free cash flow and return on invested capital generation potential of the business.
Portfolio Positioning
As of December 31, 2021, the portfolio’s largest sector overweight relative to the benchmark is health care. We believe long-term demographic trends support demand for companies in this sector. Through our bottom-up process, we are finding quality companies with attractive risk/reward profiles, particularly in the health care providers and services and health care equipment and supplies industries.
The portfolio also ended the year with notable allocations to the consumer staples and financials sectors. Despite a challenging environment from a cost inflation perspective, many consumer staples companies are generating strong returns on capital, buying back stock and growing dividends. Moreover, industry consolidation over time has enabled the companies to pass cost increases to consumers. We believe actions to offset inflation, including fewer promotions and price increases, should support earnings and margins. The sector has underperformed significantly since the market bottom in 2020. Some consumer staples companies were not direct beneficiaries of the reopening and are perceived relative losers in an inflationary environment. We think these conditions are temporary and can lead to outperformance. Within the financials sector, we have identified higher-quality companies selling at attractive valuations.
On the other hand, the portfolio is underweight in the real estate and information technology sectors. The extended valuation of real estate stocks has led to a continued underweight position in the sector. While we are underweight the information technology sector, we have found select stocks that meet our investment criteria.
| | | | | |
| DECEMBER 31, 2021 |
| Types of Investments in Portfolio | % of net assets |
| Common Stocks | 97.8% |
| Temporary Cash Investments | 2.1% |
| Other Assets and Liabilities | 0.1% |
| |
| Top Five Industries | % of net assets |
| Health Care Providers and Services | 8.9% |
| Capital Markets | 7.0% |
| Insurance | 6.8% |
| Equity Real Estate Investment Trusts (REITs) | 6.5% |
| Health Care Equipment and Supplies | 5.7% |
Fund shareholders may incur two types of costs: (1) transaction costs, including sales charges (loads) on purchase payments and redemption/exchange fees; and (2) ongoing costs, including management fees; distribution and service (12b-1) fees; and other fund expenses. This example is intended to help you understand your ongoing costs (in dollars) of investing in your fund and to compare these costs with the ongoing cost of investing in other mutual funds.
The example is based on an investment of $1,000 made at the beginning of the period and held for the entire period from July 1, 2021 to December 31, 2021.
Actual Expenses
The table provides information about actual account values and actual expenses for each class. You may use the information, together with the amount you invested, to estimate the expenses that you paid over the period. First, identify the share class you own. Then simply divide your account value by $1,000 (for example, an $8,600 account value divided by $1,000 = 8.6), then multiply the result by the number under the heading “Expenses Paid During Period” to estimate the expenses you paid on your account during this period.
Hypothetical Example for Comparison Purposes
The table also provides information about hypothetical account values and hypothetical expenses based on the actual expense ratio of each class of your fund and an assumed rate of return of 5% per year before expenses, which is not the actual return of a fund’s share class. The hypothetical account values and expenses may not be used to estimate the actual ending account balance or expenses you paid for the period. You may use this information to compare the ongoing costs of investing in your fund and other funds. To do so, compare this 5% hypothetical example with the 5% hypothetical examples that appear in the shareholder reports of the other funds.
Please note that the expenses shown in the table are meant to highlight your ongoing costs only and do not reflect any transactional costs, such as sales charges (loads) or redemption/exchange fees. Therefore, the table is useful in comparing ongoing costs only, and will not help you determine the relative total costs of owning different funds. In addition, if these transactional costs were included, your costs would have been higher.
| | | | | | | | | | | | | | |
| Beginning
Account Value
7/1/21 | Ending
Account Value
12/31/21 | Expenses Paid During Period(1) 7/1/21 - 12/31/21 | Annualized Expense Ratio(1) |
| Actual | | | | |
| Class I | $1,000 | $1,064.20 | $4.01 | 0.77% |
| Class II | $1,000 | $1,063.80 | $4.79 | 0.92% |
| Hypothetical | | | | |
| Class I | $1,000 | $1,021.32 | $3.92 | 0.77% |
| Class II | $1,000 | $1,020.57 | $4.69 | 0.92% |
(1)Expenses are equal to the class's annualized expense ratio listed in the table above, multiplied by the average account value over the period, multiplied by 184, the number of days in the most recent fiscal half-year, divided by 365, to reflect the one-half year period. Annualized expense ratio reflects actual expenses, including any applicable fee waivers or expense reimbursements and excluding any acquired fund fees and expenses.
DECEMBER 31, 2021
| | | | | | | | |
| Shares | Value |
| COMMON STOCKS — 97.8% |
|
|
| Aerospace and Defense — 2.4% | | |
| BAE Systems plc | 993,229 | | $ | 7,406,699 | |
| General Dynamics Corp. | 46,901 | | 9,777,451 | |
| | 17,184,150 | |
| Airlines — 1.8% | | |
Southwest Airlines Co.(1) | 309,574 | | 13,262,150 | |
| Auto Components — 1.9% | | |
| BorgWarner, Inc. | 232,079 | | 10,459,800 | |
| Bridgestone Corp. | 81,100 | | 3,481,838 | |
| | 13,941,638 | |
| Automobiles — 0.5% | | |
| Honda Motor Co. Ltd., ADR | 122,133 | | 3,474,684 | |
| Banks — 5.3% | | |
| Commerce Bancshares, Inc. | 18,106 | | 1,244,607 | |
| First Hawaiian, Inc. | 216,441 | | 5,915,333 | |
| M&T Bank Corp. | 54,428 | | 8,359,052 | |
| Prosperity Bancshares, Inc. | 99,760 | | 7,212,648 | |
| Truist Financial Corp. | 190,757 | | 11,168,822 | |
| Westamerica Bancorporation | 71,363 | | 4,119,786 | |
| | 38,020,248 | |
| Capital Markets — 7.0% | | |
| Ameriprise Financial, Inc. | 24,834 | | 7,491,424 | |
| Bank of New York Mellon Corp. (The) | 242,078 | | 14,059,890 | |
| Northern Trust Corp. | 144,083 | | 17,233,768 | |
| State Street Corp. | 40,434 | | 3,760,362 | |
| T. Rowe Price Group, Inc. | 42,050 | | 8,268,712 | |
| | 50,814,156 | |
| Chemicals — 0.9% | | |
Axalta Coating Systems Ltd.(1) | 197,857 | | 6,553,024 | |
| Commercial Services and Supplies — 0.5% | | |
| Republic Services, Inc. | 28,242 | | 3,938,347 | |
| Communications Equipment — 1.6% | | |
F5, Inc.(1) | 30,600 | | 7,488,126 | |
| Juniper Networks, Inc. | 116,941 | | 4,175,963 | |
| | 11,664,089 | |
| Containers and Packaging — 3.2% | | |
| Amcor plc | 230,521 | | 2,768,557 | |
| Packaging Corp. of America | 53,496 | | 7,283,481 | |
| Sonoco Products Co. | 219,627 | | 12,714,207 | |
| | 22,766,245 | |
| Electric Utilities — 4.7% | | |
| Edison International | 205,700 | | 14,039,025 | |
| Evergy, Inc. | 72,910 | | 5,002,355 | |
| Eversource Energy | 52,124 | | 4,742,242 | |
| Pinnacle West Capital Corp. | 94,578 | | 6,676,261 | |
| Xcel Energy, Inc. | 48,335 | | 3,272,279 | |
| | 33,732,162 | |
| | | | | | | | |
| Shares | Value |
| Electrical Equipment — 3.8% | | |
| Emerson Electric Co. | 137,116 | | $ | 12,747,675 | |
| Hubbell, Inc. | 19,564 | | 4,074,594 | |
| nVent Electric plc | 287,015 | | 10,906,570 | |
| | 27,728,839 | |
| Electronic Equipment, Instruments and Components — 0.3% | | |
| Corning, Inc. | 50,214 | | 1,869,467 | |
| Energy Equipment and Services — 1.0% | | |
| Baker Hughes Co. | 304,379 | | 7,323,359 | |
| Equity Real Estate Investment Trusts (REITs) — 6.5% | | |
| Equinix, Inc. | 7,448 | | 6,299,816 | |
| Essex Property Trust, Inc. | 19,435 | | 6,845,590 | |
| Healthcare Trust of America, Inc., Class A | 228,015 | | 7,613,421 | |
| Healthpeak Properties, Inc. | 269,594 | | 9,729,648 | |
| MGM Growth Properties LLC, Class A | 186,125 | | 7,603,206 | |
| Regency Centers Corp. | 89,252 | | 6,725,138 | |
| Weyerhaeuser Co. | 61,560 | | 2,535,041 | |
| | 47,351,860 | |
| Food and Staples Retailing — 2.2% | | |
| Koninklijke Ahold Delhaize NV | 300,818 | | 10,322,972 | |
| Sysco Corp. | 68,035 | | 5,344,149 | |
| | 15,667,121 | |
| Food Products — 5.0% | | |
| Conagra Brands, Inc. | 436,382 | | 14,902,445 | |
| General Mills, Inc. | 79,344 | | 5,346,199 | |
| J.M. Smucker Co. (The) | 41,927 | | 5,694,525 | |
| Kellogg Co. | 71,926 | | 4,633,473 | |
| Orkla ASA | 550,074 | | 5,513,699 | |
| | 36,090,341 | |
| Gas Utilities — 1.6% | | |
| Atmos Energy Corp. | 63,627 | | 6,666,201 | |
| Spire, Inc. | 75,860 | | 4,947,589 | |
| | 11,613,790 | |
| Health Care Equipment and Supplies — 5.7% | | |
| Becton Dickinson and Co. | 30,381 | | 7,640,214 | |
Envista Holdings Corp.(1) | 145,861 | | 6,572,497 | |
| Koninklijke Philips NV | 124,270 | | 4,579,349 | |
| Zimmer Biomet Holdings, Inc. | 175,126 | | 22,248,007 | |
| | 41,040,067 | |
| Health Care Providers and Services — 8.9% | | |
| AmerisourceBergen Corp. | 38,627 | | 5,133,142 | |
| Cardinal Health, Inc. | 154,952 | | 7,978,478 | |
Centene Corp.(1) | 62,689 | | 5,165,574 | |
Henry Schein, Inc.(1) | 148,326 | | 11,499,715 | |
| McKesson Corp. | 43,913 | | 10,915,454 | |
| Quest Diagnostics, Inc. | 64,526 | | 11,163,643 | |
| Universal Health Services, Inc., Class B | 96,666 | | 12,533,714 | |
| | 64,389,720 | |
| Health Care Technology — 2.3% | | |
| Cerner Corp. | 179,978 | | 16,714,557 | |
| Hotels, Restaurants and Leisure — 1.5% | | |
| Cracker Barrel Old Country Store, Inc. | 28,395 | | 3,652,733 | |
| | | | | | | | |
| Shares | Value |
| Sodexo SA | 79,922 | | $ | 7,006,597 | |
| | 10,659,330 | |
| Household Products — 1.1% | | |
| Kimberly-Clark Corp. | 55,957 | | 7,997,374 | |
| Insurance — 6.8% | | |
| Aflac, Inc. | 210,709 | | 12,303,299 | |
| Allstate Corp. (The) | 66,461 | | 7,819,137 | |
| Arthur J. Gallagher & Co. | 16,600 | | 2,816,522 | |
| Chubb Ltd. | 56,711 | | 10,962,803 | |
| Progressive Corp. (The) | 37,982 | | 3,898,852 | |
| Reinsurance Group of America, Inc. | 106,979 | | 11,713,131 | |
| | 49,513,744 | |
| IT Services — 1.2% | | |
| Amdocs Ltd. | 63,488 | | 4,751,442 | |
Euronet Worldwide, Inc.(1) | 32,266 | | 3,845,139 | |
| | 8,596,581 | |
| Leisure Products — 0.7% | | |
| Polaris, Inc. | 46,030 | | 5,059,157 | |
| Machinery — 2.4% | | |
| Cummins, Inc. | 14,733 | | 3,213,857 | |
| IMI plc | 20,783 | | 490,146 | |
| Oshkosh Corp. | 60,022 | | 6,765,079 | |
| PACCAR, Inc. | 75,757 | | 6,686,313 | |
| | 17,155,395 | |
| Media — 1.4% | | |
| Fox Corp., Class B | 287,661 | | 9,858,142 | |
| Multi-Utilities — 1.4% | | |
| NorthWestern Corp. | 180,012 | | 10,289,486 | |
| Multiline Retail — 1.3% | | |
Dollar Tree, Inc.(1) | 64,989 | | 9,132,254 | |
| Oil, Gas and Consumable Fuels — 3.5% | | |
| ConocoPhillips | 138,344 | | 9,985,670 | |
| Devon Energy Corp. | 207,264 | | 9,129,979 | |
| Pioneer Natural Resources Co. | 34,912 | | 6,349,795 | |
| | 25,465,444 | |
| Paper and Forest Products — 1.4% | | |
| Mondi plc | 412,993 | | 10,243,841 | |
| Road and Rail — 0.6% | | |
| Heartland Express, Inc. | 275,503 | | 4,633,960 | |
| Software — 1.7% | | |
| CDK Global, Inc. | 110,228 | | 4,600,917 | |
| Open Text Corp. | 157,537 | | 7,479,857 | |
| | 12,080,774 | |
| Specialty Retail — 1.9% | | |
| Advance Auto Parts, Inc. | 58,541 | | 14,042,815 | |
| Technology Hardware, Storage and Peripherals — 1.4% | | |
| HP, Inc. | 266,437 | | 10,036,682 | |
| Thrifts and Mortgage Finance — 0.4% | | |
| Capitol Federal Financial, Inc. | 257,944 | | 2,922,506 | |
| Trading Companies and Distributors — 2.0% | | |
Beacon Roofing Supply, Inc.(1) | 67,352 | | 3,862,637 | |
| | | | | | | | |
| Shares | Value |
| MSC Industrial Direct Co., Inc., Class A | 128,583 | | $ | 10,808,687 | |
| | 14,671,324 | |
TOTAL COMMON STOCKS (Cost $549,322,485) | | 707,498,823 | |
| TEMPORARY CASH INVESTMENTS — 2.1% |
|
|
| Repurchase Agreement, BMO Capital Markets Corp., (collateralized by various U.S. Treasury obligations, 2.00% - 2.375%, 4/30/24 - 5/15/51, valued at $3,002,974), in a joint trading account at 0.01%, dated 12/31/21, due 1/3/22 (Delivery value $2,943,440) | | 2,943,438 | |
| Repurchase Agreement, Fixed Income Clearing Corp., (collateralized by various U.S. Treasury obligations, 2.25%, 5/15/41, valued at $10,010,284), at 0.01%, dated 12/31/21, due 1/3/22 (Delivery value $9,814,008) | | 9,814,000 | |
| State Street Institutional U.S. Government Money Market Fund, Premier Class | 2,547,515 | | 2,547,515 | |
TOTAL TEMPORARY CASH INVESTMENTS (Cost $15,304,953) | | 15,304,953 | |
TOTAL INVESTMENT SECURITIES — 99.9% (Cost $564,627,438) |
| 722,803,776 | |
| OTHER ASSETS AND LIABILITIES — 0.1% |
| 1,025,504 | |
| TOTAL NET ASSETS — 100.0% |
| $ | 723,829,280 | |
| | | | | | | | | | | | | | | | | | | | |
| FORWARD FOREIGN CURRENCY EXCHANGE CONTRACTS |
| Currency Purchased | Currency Sold | Counterparty | Settlement Date | Unrealized Appreciation (Depreciation) |
| USD | 18,238,182 | | EUR | 16,106,488 | | Credit Suisse AG | 3/31/22 | $ | (132,541) | |
| USD | 477,156 | | EUR | 419,725 | | Credit Suisse AG | 3/31/22 | (1,574) | |
| USD | 14,710,153 | | GBP | 11,125,429 | | JPMorgan Chase Bank N.A. | 3/31/22 | (342,904) | |
| USD | 373,721 | | GBP | 277,226 | | JPMorgan Chase Bank N.A. | 3/31/22 | (1,374) | |
| JPY | 24,774,677 | | USD | 218,112 | | Bank of America N.A. | 3/31/22 | (2,571) | |
| USD | 5,948,417 | | JPY | 674,952,007 | | Bank of America N.A. | 3/31/22 | 76,291 | |
| USD | 138,103 | | JPY | 15,784,231 | | Bank of America N.A. | 3/31/22 | 779 | |
| USD | 150,276 | | JPY | 17,229,810 | | Bank of America N.A. | 3/31/22 | 376 | |
| USD | 4,429,629 | | NOK | 40,098,194 | | UBS AG | 3/31/22 | (116,212) | |
| USD | 133,499 | | NOK | 1,178,259 | | UBS AG | 3/31/22 | (78) | |
| | | | | | $ | (519,808) | |
| | | | | | | | |
| NOTES TO SCHEDULE OF INVESTMENTS |
| ADR | - | American Depositary Receipt |
| EUR | - | Euro |
| GBP | - | British Pound |
| JPY | - | Japanese Yen |
| NOK | - | Norwegian Krone |
| USD | - | United States Dollar |
(1)Non-income producing.
See Notes to Financial Statements.
| | |
| Statement of Assets and Liabilities |
| | | | | |
| DECEMBER 31, 2021 |
| Assets | |
| Investment securities, at value (cost of $564,627,438) | $ | 722,803,776 | |
| Receivable for investments sold | 1,142,144 | |
| Receivable for capital shares sold | 53,703 | |
| Unrealized appreciation on forward foreign currency exchange contracts | 77,446 | |
| Dividends and interest receivable | 1,379,116 | |
| Securities lending receivable | 3,063 | |
| 725,459,248 | |
| |
| Liabilities | |
| Payable for investments purchased | 159,630 | |
| Payable for capital shares redeemed | 354,985 | |
| Unrealized depreciation on forward foreign currency exchange contracts | 597,254 | |
| Accrued management fees | 406,096 | |
| Distribution fees payable | 112,003 | |
| 1,629,968 | |
| |
| Net Assets | $ | 723,829,280 | |
| |
| Net Assets Consist of: | |
| Capital (par value and paid-in surplus) | $ | 480,590,937 | |
| Distributable earnings | 243,238,343 | |
| $ | 723,829,280 | |
| | | | | | | | | | | |
| Net Assets | Shares Outstanding | Net Asset Value Per Share |
| Class I, $0.01 Par Value | $182,235,725 | 7,282,019 | $25.03 |
| Class II, $0.01 Par Value | $541,593,555 | 21,623,190 | $25.05 |
See Notes to Financial Statements.
| | | | | |
| YEAR ENDED DECEMBER 31, 2021 |
| Investment Income (Loss) | |
| Income: | |
| Dividends (net of foreign taxes withheld of $195,849) | $ | 15,796,889 | |
| Securities lending, net | 28,973 | |
| Interest | 2,423 | |
| 15,828,285 | |
| |
| Expenses: | |
| Management fees | 5,999,042 | |
| Distribution fees - Class II | 1,296,192 | |
| Directors' fees and expenses | 17,051 | |
| Other expenses | 44 | |
| 7,312,329 | |
Fees waived(1) | (935,540) | |
| 6,376,789 | |
| |
| Net investment income (loss) | 9,451,496 | |
| |
| Realized and Unrealized Gain (Loss) | |
| Net realized gain (loss) on: | |
| Investment transactions | 101,900,010 | |
| Forward foreign currency exchange contract transactions | 2,534,510 | |
| Foreign currency translation transactions | 6,620 | |
| 104,441,140 | |
| |
| Change in net unrealized appreciation (depreciation) on: | |
| Investments | 25,964,175 | |
| Forward foreign currency exchange contracts | (206,831) | |
| Translation of assets and liabilities in foreign currencies | (1,335) | |
| 25,756,009 | |
| |
| Net realized and unrealized gain (loss) | 130,197,149 | |
| |
| Net Increase (Decrease) in Net Assets Resulting from Operations | $ | 139,648,645 | |
(1)Amount consists of $239,004 and $696,536 for Class I and Class II, respectively.
See Notes to Financial Statements.
| | |
| Statement of Changes in Net Assets |
| | | | | | | | |
| YEARS ENDED DECEMBER 31, 2021 AND DECEMBER 31, 2020 |
| Increase (Decrease) in Net Assets | December 31, 2021 | December 31, 2020 |
| Operations | | |
| Net investment income (loss) | $ | 9,451,496 | | $ | 8,951,292 | |
| Net realized gain (loss) | 104,441,140 | | (5,022,995) | |
| Change in net unrealized appreciation (depreciation) | 25,756,009 | | 336,371 | |
| Net increase (decrease) in net assets resulting from operations | 139,648,645 | | 4,264,668 | |
| | |
| Distributions to Shareholders | | |
| From earnings: | | |
| Class I | (2,059,978) | | (2,633,517) | |
| Class II | (5,354,430) | | (7,121,162) | |
| Decrease in net assets from distributions | (7,414,408) | | (9,754,679) | |
| | |
| Capital Share Transactions | | |
| Net increase (decrease) in net assets from capital share transactions (Note 5) | (33,262,683) | | (40,681,619) | |
| | |
| Net increase (decrease) in net assets | 98,971,554 | | (46,171,630) | |
| | |
| Net Assets | | |
| Beginning of period | 624,857,726 | | 671,029,356 | |
| End of period | $ | 723,829,280 | | $ | 624,857,726 | |
See Notes to Financial Statements.
| | |
| Notes to Financial Statements |
DECEMBER 31, 2021
1. Organization
American Century Variable Portfolios, Inc. (the corporation) is registered under the Investment Company Act of 1940, as amended (the 1940 Act), as an open-end management investment company and is organized as a Maryland corporation. VP Mid Cap Value Fund (the fund) is one fund in a series issued by the corporation. The fund’s investment objective is to seek long-term capital growth. Income is a secondary objective. The fund offers Class I and Class II.
2. Significant Accounting Policies
The following is a summary of significant accounting policies consistently followed by the fund in preparation of its financial statements. The fund is an investment company and follows accounting and reporting guidance in accordance with accounting principles generally accepted in the United States of America. This may require management to make certain estimates and assumptions at the date of the financial statements. Actual results could differ from these estimates. Management evaluated the impact of events or transactions occurring through the date the financial statements were issued that would merit recognition or disclosure.
Investment Valuations — The fund determines the fair value of its investments and computes its net asset value (NAV) per share at the close of regular trading (usually 4 p.m. Eastern time) on the New York Stock Exchange (NYSE) on each day the NYSE is open. The Board of Directors has adopted valuation policies and procedures to guide the investment advisor in the fund’s investment valuation process and to provide methodologies for the oversight of the fund’s pricing function.
Equity securities that are listed or traded on a domestic securities exchange are valued at the last reported sales price or at the official closing price as provided by the exchange. Equity securities traded on foreign securities exchanges are generally valued at the closing price of such securities on the exchange where primarily traded or at the close of the NYSE, if that is earlier. If no last sales price is reported, or if local convention or regulation so provides, the mean of the latest bid and asked prices may be used. Securities traded over-the-counter are valued at the mean of the latest bid and asked prices, the last sales price, or the official closing price. Equity securities initially expressed in local currencies are translated into U.S. dollars at the mean of the appropriate currency exchange rate at the close of the NYSE as provided by an independent pricing service.
Open-end management investment companies are valued at the reported NAV per share. Repurchase agreements are valued at cost, which approximates fair value. Forward foreign currency exchange contracts are valued at the mean of the appropriate forward exchange rate at the close of the NYSE as provided by an independent pricing service.
If the fund determines that the market price for an investment is not readily available or the valuation methods mentioned above do not reflect an investment’s fair value, such investment is valued as determined in good faith by the Board of Directors or its delegate, in accordance with policies and procedures adopted by the Board of Directors. In its determination of fair value, the fund may review several factors including, but not limited to, market information regarding the specific investment or comparable investments and correlation with other investment types, futures indices or general market indicators. Circumstances that may cause the fund to use these procedures to value an investment include, but are not limited to: an investment has been declared in default or is distressed; trading in a security has been suspended during the trading day or a security is not actively trading on its principal exchange; prices received from a regular pricing source are deemed unreliable; or there is a foreign market holiday and no trading occurred.
The fund monitors for significant events occurring after the close of an investment’s primary exchange but before the fund’s NAV per share is determined. Significant events may include, but are not limited to: corporate announcements and transactions; governmental action and political unrest that could impact a specific investment or an investment sector; or armed conflicts, natural disasters and similar events that could affect investments in a specific country or region. The fund also monitors for significant fluctuations between domestic and foreign markets, as evidenced by the U.S. market or such other indicators that the Board of Directors, or its delegate, deems appropriate. The fund may apply a model-derived factor to the closing price of equity securities traded on foreign securities exchanges. The factor is based on observable market data as provided by an independent pricing service.
Security Transactions — Security transactions are accounted for as of the trade date. Net realized gains and losses are determined on the identified cost basis, which is also used for federal income tax purposes.
Investment Income — Dividend income less foreign taxes withheld, if any, is recorded as of the ex-dividend date. Distributions received on securities that represent a return of capital or long-term capital gain are recorded as a reduction of cost of investments and/or as a realized gain. The fund may estimate the components of distributions received that may be considered nontaxable distributions or long-term capital gain distributions for income tax purposes. Interest income is recorded on the accrual basis and includes accretion of discounts and amortization of premiums. Securities lending income is net of fees and rebates earned by the lending agent for its services.
Foreign Currency Translations — All assets and liabilities initially expressed in foreign currencies are translated into U.S. dollars at prevailing exchange rates at period end. The fund may enter into spot foreign currency exchange contracts to facilitate transactions denominated in a foreign currency. Purchases and sales of investment securities, dividend and interest income, spot foreign currency exchange contracts, and expenses are translated at the rates of exchange prevailing on the respective dates of such transactions. Net realized and unrealized foreign currency exchange gains or losses related to investment securities are a component of net realized gain (loss) on investment transactions and change in net unrealized appreciation (depreciation) on investments, respectively.
Repurchase Agreements — The fund may enter into repurchase agreements with institutions that American Century Investment Management, Inc. (ACIM) (the investment advisor) has determined are creditworthy pursuant to criteria adopted by the Board of Directors. The fund requires that the collateral, represented by securities, received in a repurchase transaction be transferred to the custodian in a manner sufficient to enable the fund to obtain those securities in the event of a default under the repurchase agreement. ACIM monitors, on a daily basis, the securities transferred to ensure the value, including accrued interest, of the securities under each repurchase agreement is equal to or greater than amounts owed to the fund under each repurchase agreement.
Joint Trading Account — Pursuant to an Exemptive Order issued by the Securities and Exchange Commission, the fund, along with certain other funds in the American Century Investments family of funds, may transfer uninvested cash balances into a joint trading account. These balances are invested in one or more repurchase agreements that are collateralized by U.S. Treasury or Agency obligations.
Segregated Assets — In accordance with the 1940 Act, the fund segregates assets on its books and records to cover certain types of investment securities and other financial instruments. ACIM monitors, on a daily basis, the securities segregated to ensure the fund designates a sufficient amount of liquid assets, marked-to-market daily. The fund may also receive assets or be required to pledge assets at the custodian bank or with a broker for collateral requirements.
Income Tax Status — It is the fund’s policy to distribute substantially all net investment income and net realized gains to shareholders and to otherwise qualify as a regulated investment company under provisions of the Internal Revenue Code. Accordingly, no provision has been made for income taxes. The fund files U.S. federal, state, local and non-U.S. tax returns as applicable. The fund's tax returns are subject to examination by the relevant taxing authority until expiration of the applicable statute of limitations, which is generally three years from the date of filing but can be longer in certain jurisdictions. At this time, management believes there are no uncertain tax positions which, based on their technical merit, would not be sustained upon examination and for which it is reasonably possible that the total amounts of unrecognized tax benefits will significantly change in the next twelve months.
Multiple Class — All shares of the fund represent an equal pro rata interest in the net assets of the class to which such shares belong, and have identical voting, dividend, liquidation and other rights and the same terms and conditions, except for class specific expenses and exclusive rights to vote on matters affecting only individual classes. Income, non-class specific expenses, and realized and unrealized capital gains and losses of the fund are allocated to each class of shares based on their relative net assets.
Distributions to Shareholders — Distributions from net investment income, if any, are generally declared and paid quarterly. Distributions from net realized gains, if any, are generally declared and paid annually.
Indemnifications — Under the corporation’s organizational documents, its officers and directors are indemnified against certain liabilities arising out of the performance of their duties to the fund. In addition, in the normal course of business, the fund enters into contracts that provide general indemnifications. The maximum exposure under these arrangements is unknown as this would involve future claims that may be made against a fund. The risk of material loss from such claims is considered by management to be remote.
Securities Lending — Securities are lent to qualified financial institutions and brokers. State Street Bank & Trust Co. serves as securities lending agent to the fund pursuant to a Securities Lending Agreement. The lending of securities exposes the fund to risks such as: the borrowers may fail to return the loaned securities, the borrowers may not be able to provide additional collateral, the fund may experience delays in recovery of the loaned securities or delays in access to collateral, or the fund may experience losses related to the investment collateral. To minimize certain risks, loan counterparties pledge collateral in the form of cash and/or securities. The lending agent has agreed to indemnify the fund in the case of default of any securities borrowed. Cash collateral received is invested in the State Street Navigator Securities Lending Government Money Market Portfolio, a money market mutual fund registered under the 1940 Act. The loans may also be secured by U.S. government securities in an amount at least equal to the market value of the securities loaned, plus accrued interest and dividends, determined on a daily basis and adjusted accordingly. By lending securities, the fund seeks to increase its net investment income through the receipt of interest and fees. Such income is reflected separately within the Statement of Operations. The value of loaned securities and related collateral outstanding at period end, if any, are shown on a gross basis within the Schedule of Investments and Statement of Assets and Liabilities.
3. Fees and Transactions with Related Parties
Certain officers and directors of the corporation are also officers and/or directors of American Century Companies, Inc. (ACC). The corporation’s investment advisor, ACIM, the corporation's distributor, American Century Investment Services, Inc. (ACIS), and the corporation’s transfer agent, American Century Services, LLC, are wholly owned, directly or indirectly, by ACC.
Management Fees — The corporation has entered into a management agreement with ACIM, under which ACIM provides the fund with investment advisory and management services in exchange for a single, unified management fee (the fee) per class. The agreement provides that ACIM will pay all expenses of managing and operating the fund, except brokerage expenses, taxes, interest, fees and expenses of the independent directors (including legal counsel fees), extraordinary expenses, and expenses incurred in connection with the provision of shareholder services and distribution services under a plan adopted pursuant to Rule 12b-1 under the 1940 Act. The fee is computed and accrued daily based on each class's daily net assets and paid monthly in arrears. The difference in the fee among the classes is a result of their separate arrangements for non-Rule 12b-1 shareholder services. It is not the result of any difference in advisory or custodial fees or other expenses related to the management of the fund’s assets, which do not vary by class. From January 1, 2021 through July 31, 2021, the investment advisor agreed to waive 0.16% of the fund's management fee. Effective August 1, 2021, the investment advisor agreed to waive 0.10% of the fund's management fee. The investment advisor expects this waiver to continue until July 31, 2022 and cannot terminate it prior to such date without the approval of the Board of Directors.
The annual management fee and the effective annual management fee before and after waiver for each class for the period ended December 31, 2021 are as follows:
| | | | | | | | | | | |
| | Effective Annual Management Fee |
| Annual Management Fee* | Before Waiver | After Waiver |
| Class I | 0.85% | 0.94% | 0.80% |
| Class II | 0.75% | 0.84% | 0.70% |
*Prior to August 1, 2021, the annual management fee was 1.00% for Class I and 0.90% for Class II.
Distribution Fees — The Board of Directors has adopted the Master Distribution Plan (the plan) for Class II, pursuant to Rule 12b-1 of the 1940 Act. The plan provides that Class II will pay ACIS an annual distribution fee equal to 0.25%. The fee is computed and accrued daily based on the Class II daily net assets and paid monthly in arrears. The distribution fee provides compensation for expenses incurred in connection with distributing shares of Class II including, but not limited to, payments to brokers, dealers, and financial institutions that have entered into sales agreements with respect to shares of the fund. Fees incurred under the plan during the period ended December 31, 2021 are detailed in the Statement of Operations.
Directors' Fees and Expenses — The Board of Directors is responsible for overseeing the investment advisor’s management and operations of the fund. The directors receive detailed information about the fund and its investment advisor regularly throughout the year, and meet at least quarterly with management of the investment advisor to review reports about fund operations. The fund’s officers do not receive compensation from the fund.
Interfund Transactions — The fund may enter into security transactions with other American Century Investments funds and other client accounts of the investment advisor, in accordance with the 1940 Act rules and procedures adopted by the Board of Directors. The rules and procedures require, among other things, that these transactions be effected at the independent current market price of the security. During the period, the interfund purchases and sales were $352 and $1,059,444, respectively. The effect of interfund transactions on the Statement of Operations was $185,061 in net realized gain (loss) on investment transactions.
4. Investment Transactions
Purchases and sales of investment securities, excluding short-term investments, for the period ended December 31, 2021 were $355,196,224 and $387,377,671, respectively.
5. Capital Share Transactions
Transactions in shares of the fund were as follows:
| | | | | | | | | | | | | | |
| Year ended December 31, 2021 | Year ended
December 31, 2020 |
| Shares | Amount | Shares | Amount |
| Class I/Shares Authorized | 130,000,000 | |
| 130,000,000 | | |
| Sold | 1,258,616 | | $ | 29,523,840 | | 1,747,991 | | $ | 30,163,897 | |
| Issued in reinvestment of distributions | 83,578 | | 2,013,237 | | 145,981 | | 2,560,459 | |
| Redeemed | (1,797,303) | | (42,297,390) | | (2,529,209) | | (45,495,197) | |
| (455,109) | | (10,760,313) | | (635,237) | | (12,770,841) | |
| Class II/Shares Authorized | 225,000,000 | |
| 225,000,000 | | |
| Sold | 2,765,425 | | 65,709,983 | | 2,587,598 | | 43,552,804 | |
| Issued in reinvestment of distributions | 222,015 | | 5,354,430 | | 405,401 | | 7,121,162 | |
| Redeemed | (4,014,944) | | (93,566,783) | | (4,398,140) | | (78,584,744) | |
| (1,027,504) | | (22,502,370) | | (1,405,141) | | (27,910,778) | |
| Net increase (decrease) | (1,482,613) | | $ | (33,262,683) | | (2,040,378) | | $ | (40,681,619) | |
6. Fair Value Measurements
The fund’s investments valuation process is based on several considerations and may use multiple inputs to determine the fair value of the investments held by the fund. In conformity with accounting principles generally accepted in the United States of America, the inputs used to determine a valuation are classified into three broad levels.
•Level 1 valuation inputs consist of unadjusted quoted prices in an active market for identical investments.
•Level 2 valuation inputs consist of direct or indirect observable market data (including quoted prices for comparable investments, evaluations of subsequent market events, interest rates, prepayment speeds, credit risk, etc.). These inputs also consist of quoted prices for identical investments initially expressed in local currencies that are adjusted through translation into U.S. dollars.
•Level 3 valuation inputs consist of unobservable data (including a fund’s own assumptions).
The level classification is based on the lowest level input that is significant to the fair valuation measurement. The valuation inputs are not necessarily an indication of the risks associated with investing in these securities or other financial instruments.
The following is a summary of the level classifications as of period end. The Schedule of Investments provides additional information on the fund’s portfolio holdings.
| | | | | | | | | | | |
| Level 1 | Level 2 | Level 3 |
| Assets | | | |
| Investment Securities | | | |
| Common Stocks | | | |
| Aerospace and Defense | $ | 9,777,451 | | $ | 7,406,699 | | — | |
| Auto Components | 10,459,800 | | 3,481,838 | | — | |
| Food and Staples Retailing | 5,344,149 | | 10,322,972 | | — | |
| Food Products | 30,576,642 | | 5,513,699 | | — | |
| Hotels, Restaurants and Leisure | 3,652,733 | | 7,006,597 | | — | |
| Machinery | 16,665,249 | | 490,146 | | — | |
| Paper and Forest Products | — | | 10,243,841 | | — | |
| Other Industries | 586,557,007 | | — | | — | |
| Temporary Cash Investments | 2,547,515 | | 12,757,438 | | — | |
| $ | 665,580,546 | | $ | 57,223,230 | | — | |
| Other Financial Instruments | | | |
| Forward Foreign Currency Exchange Contracts | — | | $ | 77,446 | | — | |
| | | |
| Liabilities | | | |
| Other Financial Instruments | | | |
| Forward Foreign Currency Exchange Contracts | — | | $ | 597,254 | | — | |
7. Derivative Instruments
Foreign Currency Risk — The fund is subject to foreign currency exchange rate risk in the normal course of pursuing its investment objectives. The value of foreign investments held by a fund may be significantly affected by changes in foreign currency exchange rates. The dollar value of a foreign security generally decreases when the value of the dollar rises against the foreign currency in which the security is denominated and tends to increase when the value of the dollar declines against such foreign currency. A fund may enter into forward foreign currency exchange contracts to reduce a fund's exposure to foreign currency exchange rate fluctuations. The net U.S. dollar value of foreign currency underlying all contractual commitments held by a fund and the resulting unrealized appreciation or depreciation are determined daily. Realized gain or loss is recorded upon settlement of the contract. Net realized and unrealized gains or losses occurring during the holding period of forward foreign currency exchange contracts are a component of net realized gain (loss) on forward foreign currency exchange contract transactions and change in net unrealized appreciation (depreciation) on forward foreign currency exchange contracts, respectively. A fund bears the risk of an unfavorable change in the foreign currency exchange rate underlying the forward contract. Additionally, losses, up to the fair value, may arise if the counterparties do not perform under the contract terms. The fund's average U.S. dollar exposure to foreign currency risk derivative instruments held during the period was $54,393,138.
The value of foreign currency risk derivative instruments as of December 31, 2021, is disclosed on the Statement of Assets and Liabilities as an asset of $77,446 in unrealized appreciation on forward foreign currency exchange contracts and a liability of $597,254 in unrealized depreciation on forward foreign currency exchange contracts. For the year ended December 31, 2021, the effect of foreign currency risk derivative instruments on the Statement of Operations was $2,534,510 in net realized gain (loss) on forward foreign currency exchange contract transactions and $(206,831) in change in net unrealized appreciation (depreciation) on forward foreign currency exchange contracts.
8. Risk Factors
The value of the fund’s shares will go up and down, sometimes rapidly or unpredictably, based on the performance of the securities owned by the fund and other factors generally affecting the securities market. Market risks, including political, regulatory, economic and social developments, can affect the value of the fund’s investments. Natural disasters, public health emergencies, terrorism and other unforeseeable events may lead to increased market volatility and may have adverse long-term effects on world economies and markets generally.
There are certain risks involved in investing in foreign securities. These risks include those resulting from political events (such as civil unrest, national elections and imposition of exchange controls), social and economic events (such as labor strikes and rising inflation), and natural disasters. Securities of foreign issuers may be less liquid and more volatile. Investing a significant portion of assets in one country or region may accentuate these risks.
9. Federal Tax Information
The tax character of distributions paid during the years ended December 31, 2021 and December 31, 2020 were as follows:
| | | | | | | | |
| 2021 | 2020 |
| Distributions Paid From | | |
| Ordinary income | $ | 7,414,408 | | $ | 9,754,679 | |
| Long-term capital gains | — | | — | |
The book-basis character of distributions made during the year from net investment income or net realized gains may differ from their ultimate characterization for federal income tax purposes. These differences reflect the differing character of certain income items and net realized gains and losses for financial statement and tax purposes, and may result in reclassification among certain capital accounts on the financial statements.
As of period end, the federal tax cost of investments and the components of distributable earnings on a tax-basis were as follows:
| | | | | |
| Federal tax cost of investments | $ | 573,806,571 | |
| Gross tax appreciation of investments | $ | 156,167,499 | |
| Gross tax depreciation of investments | (7,170,294) | |
| Net tax appreciation (depreciation) of investments | 148,997,205 | |
| Net tax appreciation (depreciation) on derivatives and translation of assets and liabilities in foreign currencies | 284 | |
| Net tax appreciation (depreciation) | $ | 148,997,489 | |
| Undistributed ordinary income | $ | 22,381,402 | |
| Accumulated long-term gains | $ | 71,859,452 | |
The difference between book-basis and tax-basis unrealized appreciation (depreciation) is attributable primarily to the tax deferral of losses on wash sales.
| | | | | | | | | | | | | | | | | | | | | | | | | | | | | | | | | | | | | | | | | | | | | | | |
| For a Share Outstanding Throughout the Years Ended December 31 (except as noted) | | | | | | | | |
| Per-Share Data | Ratios and Supplemental Data | | | |
| | Income From Investment Operations: | Distributions From: | | | Ratio to Average Net Assets of: | | |
| Net Asset
Value,
Beginning
of Period | Net Investment Income (Loss)(1) | Net Realized and
Unrealized Gain (Loss) | Total From Investment Operations | Net
Investment Income | Net
Realized
Gains | Total
Distributions | Net Asset
Value,
End of Period | Total Return(2) | Operating
Expenses | Operating
Expenses
(before
expense
waiver) | Net
Investment
Income
(Loss) | Net Investment Income (Loss) (before expense waiver) | Portfolio Turnover
Rate | Net
Assets,
End of
Period (in thousands) |
| Class I | | | | | | | | | | | | | | |
| 2021 | $20.55 | 0.34 | 4.41 | 4.75 | (0.27) | — | (0.27) | $25.03 | 23.20% | 0.80% | 0.94% | 1.47% | 1.33% | 53% | $182,236 | |
| 2020 | $20.68 | 0.30 | (0.10) | 0.20 | (0.33) | — | (0.33) | $20.55 | 1.21% | 0.85% | 1.00% | 1.69% | 1.54% | 72% | $158,968 | |
| 2019 | $18.31 | 0.35 | 4.62 | 4.97 | (0.41) | (2.19) | (2.60) | $20.68 | 29.15% | 0.85% | 1.00% | 1.66% | 1.51% | 41% | $173,105 | |
| 2018 | $22.75 | 0.29 | (3.04) | (2.75) | (0.31) | (1.38) | (1.69) | $18.31 | (12.84)% | 0.84% | 1.00% | 1.31% | 1.15% | 72% | $424,234 | |
| 2017 | $21.12 | 0.37 | 2.03 | 2.40 | (0.34) | (0.43) | (0.77) | $22.75 | 11.69% | 0.86% | 1.01% | 1.68% | 1.53% | 45% | $457,104 | |
| Class II | | | | | | | | | | | | | | |
| 2021 | $20.57 | 0.31 | 4.41 | 4.72 | (0.24) | — | (0.24) | $25.05 | 23.02% | 0.95% | 1.09% | 1.32% | 1.18% | 53% | $541,594 | |
| 2020 | $20.70 | 0.28 | (0.10) | 0.18 | (0.31) | — | (0.31) | $20.57 | 1.11% | 1.00% | 1.15% | 1.54% | 1.39% | 72% | $465,890 | |
| 2019 | $18.32 | 0.30 | 4.65 | 4.95 | (0.38) | (2.19) | (2.57) | $20.70 | 28.99% | 1.00% | 1.15% | 1.51% | 1.36% | 41% | $497,924 | |
| 2018 | $22.76 | 0.24 | (3.03) | (2.79) | (0.27) | (1.38) | (1.65) | $18.32 | (12.96)% | 0.99% | 1.15% | 1.16% | 1.00% | 72% | $424,219 | |
| 2017 | $21.13 | 0.33 | 2.03 | 2.36 | (0.30) | (0.43) | (0.73) | $22.76 | 11.47% | 1.01% | 1.16% | 1.53% | 1.38% | 45% | $922,737 | |
| | |
| Notes to Financial Highlights |
(1)Computed using average shares outstanding throughout the period.
(2)Total returns are calculated based on the net asset value of the last business day. Total returns for periods less than one year are not annualized. The total returns presented do not include the fees and charges assessed with investments in variable insurance products, those charges are disclosed in the separate account prospectus. The inclusion of such fees and charges would lower total return.
See Notes to Financial Statements.
| | |
| Report of Independent Registered Public Accounting Firm |
To the Shareholders and the Board of Directors of American Century Variable Portfolios, Inc.:
Opinion on the Financial Statements and Financial Highlights
We have audited the accompanying statement of assets and liabilities, including the schedule of investments, of VP Mid Cap Value Fund (the “Fund”), one of the funds constituting the American Century Variable Portfolios, Inc., as of December 31, 2021, the related statement of operations for the year then ended, the statements of changes in net assets for each of the two years in the period then ended, the financial highlights for each of the five years in the period then ended, and the related notes. In our opinion, the financial statements and financial highlights present fairly, in all material respects, the financial position of VP Mid Cap Value Fund of the American Century Variable Portfolios, Inc. as of December 31, 2021, and the results of its operations for the year then ended, the changes in its net assets for each of the two years in the period then ended, and the financial highlights for each of the five years in the period then ended, in conformity with accounting principles generally accepted in the United States of America.
Basis for Opinion
These financial statements and financial highlights are the responsibility of the Fund's management. Our responsibility is to express an opinion on the Fund’s financial statements and financial highlights based on our audits. We are a public accounting firm registered with the Public Company Accounting Oversight Board (United States) (PCAOB) and are required to be independent with respect to the Fund in accordance with the U.S. federal securities laws and the applicable rules and regulations of the Securities and Exchange Commission and the PCAOB.
We conducted our audits in accordance with the standards of the PCAOB. Those standards require that we plan and perform the audit to obtain reasonable assurance about whether the financial statements and financial highlights are free of material misstatement, whether due to error or fraud. The Fund is not required to have, nor were we engaged to perform, an audit of its internal control over financial reporting. As part of our audits, we are required to obtain an understanding of internal control over financial reporting but not for the purpose of expressing an opinion on the effectiveness of the Fund’s internal control over financial reporting. Accordingly, we express no such opinion.
Our audits included performing procedures to assess the risks of material misstatement of the financial statements and financial highlights, whether due to error or fraud, and performing procedures that respond to those risks. Such procedures included examining, on a test basis, evidence regarding the amounts and disclosures in the financial statements and financial highlights. Our audits also included evaluating the accounting principles used and significant estimates made by management, as well as evaluating the overall presentation of the financial statements and financial highlights. Our procedures included confirmation of securities owned as of December 31, 2021, by correspondence with the custodian and brokers; when replies were not received from brokers, we performed other auditing procedures. We believe that our audits provide a reasonable basis for our opinion.
/s/ Deloitte & Touche LLP
Kansas City, Missouri
February 10, 2022
We have served as the auditor of one or more American Century investment companies since 1997.
The Board of Directors
The individuals listed below serve as directors of the funds. Each director will continue to serve in this capacity until death, retirement, resignation or removal from office. The board has adopted a mandatory retirement age for directors who are not “interested persons,” as that term is defined in the Investment Company Act (independent directors). Independent directors shall retire on December 31 of the year in which they reach their 75th birthday.
Mr. Thomas is an “interested person” because he currently serves as President and Chief Executive Officer of American Century Companies, Inc. (ACC), the parent company of American Century Investment Management, Inc. (ACIM or the advisor). The other directors (more than three-fourths of the total number) are independent. They are not employees, directors or officers of, and have no financial interest in, ACC or any of its wholly owned, direct or indirect, subsidiaries, including ACIM, American Century Investment Services, Inc. (ACIS) and American Century Services, LLC (ACS), and they do not have any other affiliations, positions or relationships that would cause them to be considered “interested persons” under the Investment Company Act. The directors serve in this capacity for seven (in the case of Jonathan S. Thomas, 16; and Stephen E. Yates, 8) registered investment companies in the American Century Investments family of funds.
The following table presents additional information about the directors. The mailing address for each director is 4500 Main Street, Kansas City, Missouri 64111.
| | | | | | | | | | | | | | | | | |
Name
(Year of Birth) | Position(s) Held with Funds | Length of Time Served | Principal Occupation(s) During Past 5 Years | Number of American Century Portfolios Overseen by Director | Other Directorships Held During Past 5 Years |
| Independent Directors | | |
| Thomas W. Bunn (1953) | Director | Since 2017 | Retired | 72 | SquareTwo Financial |
Chris H. Cheesman
(1962)
| Director | Since 2019
| Retired. Senior Vice President & Chief Audit Executive, AllianceBernstein (1999 to 2018)
| 72 | Alleghany Corporation |
Barry Fink
(1955) | Director | Since 2012 (independent since 2016) | Retired | 72 | None |
Rajesh K. Gupta
(1960)
| Director | Since 2019
| Partner Emeritus, SeaCrest Investment Management and SeaCrest Wealth Management (2019 to Present); Chief Executive Officer and Chief Investment Officer, SeaCrest Investment Management (2006 to 2019); Chief Executive Officer and Chief Investment Officer, SeaCrest Wealth Management (2008 to 2019) | 72 | None |
| | | | | | | | | | | | | | | | | |
Name
(Year of Birth) | Position(s) Held with Funds | Length of Time Served | Principal Occupation(s) During Past 5 Years | Number of American Century Portfolios Overseen by Director | Other Directorships Held During Past 5 Years |
| Independent Directors | | |
Lynn Jenkins
(1963)
| Director | Since 2019
| Consultant, LJ Strategies (2019 to present); United States Representative, U.S. House of Representatives (2009 to 2018) | 72 | MGP Ingredients, Inc. (2019 to 2021) |
Jan M. Lewis
(1957) | Director | Since 2011 | Retired | 72 | None |
John R. Whitten(1) (1946) | Director | Since 2008 | Retired | 72 | Onto Innovation Inc. (2019 to 2020); Rudolph Technologies, Inc. (2006 to 2019) |
Stephen E. Yates
(1948) | Director and Chairman of the Board | Since 2012 (Chairman since 2018) | Retired | 108 | None |
| Interested Director | |
Jonathan S. Thomas
(1963) | Director | Since 2007 | President and Chief Executive Officer, ACC (2007 to present). Also serves as Chief Executive Officer, ACS; Director, ACC and other ACC subsidiaries | 146 | None |
(1) Effective December 31, 2021, John R. Whitten retired from the Board of Directors.
The Statement of Additional Information has additional information about the fund's directors and is available without charge, upon request, by calling 1-800-378-9878.
Officers
The following table presents certain information about the executive officers of the funds. Each officer serves as an officer for 16 (in the case of Robert J. Leach, 15) investment companies in the American Century family of funds. No officer is compensated for his or her service as an officer of the funds. The listed officers are interested persons of the funds and are appointed or re-appointed on an annual basis. The mailing address for each officer listed below is 4500 Main Street, Kansas City, Missouri 64111.
| | | | | | | | |
Name
(Year of Birth) | Offices with the Funds | Principal Occupation(s) During the Past Five Years |
Patrick Bannigan
(1965) | President since 2019 | Executive Vice President and Director, ACC (2012 to present); Chief Financial Officer, Chief Accounting Officer and Treasurer, ACC (2015 to present). Also serves as President, ACS; Vice President, ACIM; Chief Financial Officer, Chief Accounting Officer and/or Director, ACIM, ACS and other ACC subsidiaries |
R. Wes Campbell
(1974) | Chief Financial Officer and Treasurer since 2018 | Vice President, ACS, (2020 to present); Investment Operations and Investment Accounting, ACS (2000 to present) |
Amy D. Shelton
(1964) | Chief Compliance Officer and Vice President since 2014 | Chief Compliance Officer, American Century funds, (2014 to present); Chief Compliance Officer, ACIM (2014 to present); Chief Compliance Officer, ACIS (2009 to present). Also serves as Vice President, ACIS |
John Pak
(1968) | General Counsel and
Senior Vice President since 2021 | General Counsel and Senior Vice President, ACC (2021 to present); Also serves as General Counsel and Senior Vice President, ACIM, ACS and ACIS. Chief Legal Officer of Investment and Wealth Management, The Bank of New York Mellon (2014 to 2021) |
C. Jean Wade
(1964) | Vice President since 2012 | Senior Vice President, ACS (2017 to present); Vice President, ACS (2000 to 2017)
|
Robert J. Leach
(1966) | Vice President since 2006 | Vice President, ACS (2000 to present) |
David H. Reinmiller
(1963) | Vice President since 2000 | Attorney, ACC (1994 to present). Also serves as Vice President, ACIM and ACS |
Ward D. Stauffer
(1960) | Secretary since 2005 | Attorney, ACC (2003 to present) |
Proxy Voting Policies
A description of the policies that the fund's investment advisor uses in exercising the voting rights associated with the securities purchased and/or held by the fund is available without charge, upon request, by calling 1-800-378-9878. It is also available on American Century Investments’ website at americancentury.com/proxy and on the Securities and Exchange Commission’s website at sec.gov. Information regarding how the investment advisor voted proxies relating to portfolio securities during the most recent 12-month period ended June 30 is available on americancentury.com/proxy. It is also available at sec.gov.
Quarterly Portfolio Disclosure
The fund files its complete schedule of portfolio holdings with the Securities and Exchange Commission (SEC) for the first and third quarters of each fiscal year as an exhibit to its reports on Form N-PORT. These portfolio holdings are available on the fund's website at ipro.americancentury.com (for Investment Professionals) and, upon request, by calling 1-800-378-9878. The fund’s Form N-PORT reports are available on the SEC’s website at sec.gov.
Other Tax Information
The following information is provided pursuant to provisions of the Internal Revenue Code.
For corporate taxpayers, the fund hereby designates $7,414,408, or up to the maximum amount allowable, of ordinary income distributions paid during the fiscal year ended December 31, 2021 as qualified for the corporate dividends received deduction.
| | | | | | | | |
| |
| | |
| Contact Us | americancentury.com | |
| Automated Information Line | 1-800-345-8765 | |
| Investment Professional Service Representatives | 1-800-345-6488 | |
| Telecommunications Relay Service for the Deaf | 711 | |
| | |
| American Century Variable Portfolios, Inc. | |
| | |
Investment Advisor: American Century Investment Management, Inc. Kansas City, Missouri | |
| | |
| This report and the statements it contains are submitted for the general information of our shareholders. The report is not authorized for distribution to prospective investors unless preceded or accompanied by an effective prospectus. | |
| | |
©2022 American Century Proprietary Holdings, Inc. All rights reserved.
CL-ANN-91446 2202 | |
| | | | | |
| |
| Annual Report |
| |
| December 31, 2021 |
| |
| VP Ultra® Fund |
| Class I (AVPUX) |
| Class II (AVPSX) |
| | | | | |
| Performance | |
| Portfolio Commentary | |
| Fund Characteristics | |
| Shareholder Fee Example | |
| Schedule of Investments | |
| Statement of Assets and Liabilities | |
| Statement of Operations | |
| Statement of Changes in Net Assets | |
| Notes to Financial Statements | |
| Financial Highlights | |
| Report of Independent Registered Public Accounting Firm | |
| Management | |
| |
| |
| |
| Additional Information | |
Any opinions expressed in this report reflect those of the author as of the date of the report, and do not necessarily represent the opinions of American Century Investments® or any other person in the American Century Investments organization. Any such opinions are subject to change at any time based upon market or other conditions and American Century Investments disclaims any responsibility to update such opinions. These opinions may not be relied upon as investment advice and, because investment decisions made by American Century Investments funds are based on numerous factors, may not be relied upon as an indication of trading intent on behalf of any American Century Investments fund. Security examples are used for representational purposes only and are not intended as recommendations to purchase or sell securities. Performance information for comparative indices and securities is provided to American Century Investments by third party vendors. To the best of American Century Investments’ knowledge, such information is accurate at the time of printing.
| | | | | | | | | | | | | | | | | | |
| Total Returns as of December 31, 2021 | |
| | | | Average Annual Returns | |
| | Ticker
Symbol | 1 year | 5 years | 10 years | | Inception
Date |
| Class I | AVPUX | 23.16% | 27.02% | 20.21% | | 5/1/01 |
| Russell 1000 Growth Index | — | 27.60% | 25.30% | 19.77% | | — |
| S&P 500 Index | — | 28.71% | 18.46% | 16.54% | | — |
| Class II | AVPSX | 22.99% | 26.83% | 20.03% | | 5/1/02 |
Fund returns would have been lower if a portion of the fees had not been waived.
The performance information presented does not include the fees and charges assessed with investments in variable insurance products, those charges are disclosed in the separate account prospectus. The inclusion of such fees and charges would lower performance.
Data presented reflect past performance. Past performance is no guarantee of future results. Current performance may be higher or lower than the performance shown. Total returns for periods less than one year are not annualized. Investment return and principal value will fluctuate, and redemption value may be more or less than original cost. Data assumes reinvestment of dividends and capital gains, and none of the charts reflect the deduction of taxes that a shareholder would pay on fund distributions or the redemption of fund shares. To obtain performance data current to the most recent month end, please call 1-800-345-6488 or visit ipro.americancentury.com (for Investment Professionals). For additional information about the fund, please consult the prospectus.
| | |
| Growth of $10,000 Over 10 Years |
| $10,000 investment made December 31, 2011 |
| Performance for other share classes will vary due to differences in fee structure. |
| | | | | |
| Value on December 31, 2021 |
| Class I — $63,089 |
|
| Russell 1000 Growth Index — $60,825 |
|
| S&P 500 Index — $46,257 |
|
| |
|
Ending value of Class I would have been lower if a portion of the fees had not been waived.
| | | | | |
| Total Annual Fund Operating Expenses |
| Class I | Class II |
| 0.90% | 1.05% |
The total annual fund operating expenses shown is as stated in the fund’s prospectus current as of the date of this report. The prospectus may vary from the expense ratio shown elsewhere in this report because it is based on a different time period, includes acquired fund fees and expenses, and, if applicable, does not include fee waivers or expense reimbursements.
Data presented reflect past performance. Past performance is no guarantee of future results. Current performance may be higher or lower than the performance shown. Total returns for periods less than one year are not annualized. Investment return and principal value will fluctuate, and redemption value may be more or less than original cost. Data assumes reinvestment of dividends and capital gains, and none of the charts reflect the deduction of taxes that a shareholder would pay on fund distributions or the redemption of fund shares. To obtain performance data current to the most recent month end, please call 1-800-345-6488 or visit ipro.americancentury.com (for Investment Professionals). For additional information about the fund, please consult the prospectus.
Portfolio Managers: Keith Lee, Michael Li and Jeff Bourke
Performance Summary
VP Ultra returned 22.99%* for the 12 months ended December 31, 2021, lagging the 27.60% return of the fund’s benchmark, the Russell 1000 Growth Index.
U.S. stocks posted strong returns during the reporting period, supported by federal government stimulus and low interest rates. The rollout of COVID-19 vaccines allowed the economy to reopen, and despite concerns about the coronavirus variants, inflationary pressures and supply chain constraints, several market indices ended the 12-month period near record highs. Within the Russell 1000 Growth Index, all sectors posted double-digit gains, led by energy, which surged on demand and limited supply as the economy began to reopen. Utilities was the weakest sector.
Stock selection in the information technology sector detracted the most from performance relative to the benchmark. Stock decisions in the industrials sector were top contributors.
Information Technology Holdings Detracted
Stock selection in the IT services industry hampered relative performance in the information technology sector. Mastercard and Visa detracted. The credit card companies’ stocks lagged on concerns that the new variants of the coronavirus might lead to renewed lockdowns that would slow economic growth, impacting consumer spending and travel. Digital finance company PayPal Holdings provided guidance significantly below expectations because of declines in payment volumes from eBay and because e-commerce growth has returned to more normal levels after a pandemic-fueled surge. In addition, reports of a potential Pinterest acquisition were viewed unfavorably by investors.
Elsewhere in information technology, underweighting Microsoft relative to the benchmark detracted. The software giant reported better-than-expected revenue and earnings, aided by the strong performance of its Azure cloud segment. We did not own NVIDIA, a maker of graphics chips for gaming, for most of the year, and its strong performance detracted. However, the stock sold off as investors favored defensive stocks in December, and we used the weakness to build a position in NVIDIA, which is attractive because of expanding new use cases and growth opportunities presented by the metaverse. The stock price of DocuSign, a developer of software for online signatures and document management, fell sharply even though the company reported better-than-expected earnings. DocuSign was a beneficiary of the pandemic-driven work-from-home environment but offered disappointing guidance as that tailwind subsides.
Industrials Stocks Were Top Contributors
Stock choices in the road and rail industry led performance in industrials. J.B. Hunt Transport Services was a top industry contributor. The company is the dominant player in intermodal transportation, benefiting from scale and contractual cost advantages. Investors looked ahead to greater shipping volumes amid an anticipated economic rebound, while J.B. Hunt has produced rising revenues and profits even amid limited trucking capacity.
Other top contributors included Alphabet. Google’s parent company reported revenue and earnings well above expectations on a strong rebound in advertising spending. Revenue from its YouTube
business was especially strong. Xilinx, which makes programmable logic devices, outperformed
*All fund returns referenced in this commentary are for Class II shares. Fund returns would have been lower if a portion of the fees had not been waived. Performance for other share classes will vary due to differences in fee structure; when Class II performance exceeds that of the fund’s benchmark, other share classes may not. See page 2 for returns for all share classes.
amid strong business results. Xilinx is being acquired by Advanced Micro Devices in a deal that is expected to close early in 2022. UnitedHealth Group is the largest private health insurer in the world. Its Optum division is focused on delivering prevention-based care, compensating physicians based on the health of the patient, not for each service or treatment provided. UnitedHealth produced strong results and beat earnings expectations.
We think EOG Resources, a leading U.S. oil and gas exploration and production firm, has created a durable competitive advantage through the use of technology to develop production assets more efficiently. EOG reported strong revenue and earnings growth as rising demand for oil pushed prices higher and led to a rally in the energy sector. Underweighting Zoom Video Communications relative to the benchmark helped performance. After Zoom benefited from the pandemic in 2020, investors reallocated capital in 2021 to stocks that would likely benefit from the reopening of the economy. Zoom was a victim of the market’s swing. We did not own Zoom at the end of the period.
Outlook
We remain confident in our belief that high-quality companies with a capability for sustained long-term growth can outperform over time. Our portfolio positioning reflects where we are finding attractive, well-run companies as a result of the application of that philosophy and process.
As of December 31, 2021, communication services and health care were the portfolio’s largest overweight allocations relative to the benchmark. Industrials and real estate were the largest underweight sectors.
| | | | | |
| DECEMBER 31, 2021 |
| Types of Investments in Portfolio | % of net assets |
| Common Stocks | 100.0% |
| Temporary Cash Investments | 0.2% |
| Other Assets and Liabilities | (0.2)% |
| |
| Top Five Industries | % of net assets |
| Technology Hardware, Storage and Peripherals | 14.0% |
| IT Services | 13.7% |
| Interactive Media and Services | 12.0% |
| Software | 10.0% |
| Internet and Direct Marketing Retail | 6.6% |
Fund shareholders may incur two types of costs: (1) transaction costs, including sales charges (loads) on purchase payments and redemption/exchange fees; and (2) ongoing costs, including management fees; distribution and service (12b-1) fees; and other fund expenses. This example is intended to help you understand your ongoing costs (in dollars) of investing in your fund and to compare these costs with the ongoing cost of investing in other mutual funds.
The example is based on an investment of $1,000 made at the beginning of the period and held for the entire period from July 1, 2021 to December 31, 2021.
Actual Expenses
The table provides information about actual account values and actual expenses for each class. You may use the information, together with the amount you invested, to estimate the expenses that you paid over the period. First, identify the share class you own. Then simply divide your account value by $1,000 (for example, an $8,600 account value divided by $1,000 = 8.6), then multiply the result by the number under the heading “Expenses Paid During Period” to estimate the expenses you paid on your account during this period.
Hypothetical Example for Comparison Purposes
The table also provides information about hypothetical account values and hypothetical expenses based on the actual expense ratio of each class of your fund and an assumed rate of return of 5% per year before expenses, which is not the actual return of a fund’s share class. The hypothetical account values and expenses may not be used to estimate the actual ending account balance or expenses you paid for the period. You may use this information to compare the ongoing costs of investing in your fund and other funds. To do so, compare this 5% hypothetical example with the 5% hypothetical examples that appear in the shareholder reports of the other funds.
Please note that the expenses shown in the table are meant to highlight your ongoing costs only and do not reflect any transactional costs, such as sales charges (loads) or redemption/exchange fees. Therefore, the table is useful in comparing ongoing costs only, and will not help you determine the relative total costs of owning different funds. In addition, if these transactional costs were included, your costs would have been higher.
| | | | | | | | | | | | | | |
| Beginning
Account Value
7/1/21 | Ending
Account Value
12/31/21 | Expenses Paid During Period(1) 7/1/21 - 12/31/21 | Annualized Expense Ratio(1) |
| Actual | | | | |
| Class I | $1,000 | $1,095.30 | $4.17 | 0.79% |
| Class II | $1,000 | $1,094.60 | $4.96 | 0.94% |
| Hypothetical | | | | |
| Class I | $1,000 | $1,021.22 | $4.02 | 0.79% |
| Class II | $1,000 | $1,020.47 | $4.79 | 0.94% |
(1)Expenses are equal to the class's annualized expense ratio listed in the table above, multiplied by the average account value over the period, multiplied by 184, the number of days in the most recent fiscal half-year, divided by 365, to reflect the one-half year period. Annualized expense ratio reflects actual expenses, including any applicable fee waivers or expense reimbursements and excluding any acquired fund fees and expenses.
DECEMBER 31, 2021
| | | | | | | | |
| Shares | Value |
| COMMON STOCKS — 100.0% |
|
|
| Automobiles — 5.0% | | |
Tesla, Inc.(1) | 16,080 | | $ | 16,993,022 | |
| Banks — 0.8% | | |
| JPMorgan Chase & Co. | 16,150 | | 2,557,353 | |
| Beverages — 1.1% | | |
| Constellation Brands, Inc., Class A | 15,490 | | 3,887,525 | |
| Biotechnology — 2.2% | | |
Biogen, Inc.(1) | 6,270 | | 1,504,298 | |
Regeneron Pharmaceuticals, Inc.(1) | 9,250 | | 5,841,560 | |
| | 7,345,858 | |
| Capital Markets — 1.4% | | |
| MSCI, Inc. | 7,460 | | 4,570,667 | |
| Chemicals — 0.3% | | |
| Ecolab, Inc. | 3,710 | | 870,329 | |
| Commercial Services and Supplies — 0.5% | | |
Copart, Inc.(1) | 10,740 | | 1,628,399 | |
| Electrical Equipment — 1.1% | | |
| Acuity Brands, Inc. | 10,920 | | 2,311,982 | |
| Rockwell Automation, Inc. | 4,410 | | 1,538,429 | |
| | 3,850,411 | |
| Electronic Equipment, Instruments and Components — 0.6% | | |
| Cognex Corp. | 10,470 | | 814,147 | |
| Keyence Corp. | 2,000 | | 1,257,516 | |
| | 2,071,663 | |
| Entertainment — 2.6% | | |
Netflix, Inc.(1) | 8,870 | | 5,343,643 | |
Roku, Inc.(1) | 4,770 | | 1,088,514 | |
Walt Disney Co. (The)(1) | 14,870 | | 2,303,214 | |
| | 8,735,371 | |
| Food and Staples Retailing — 1.8% | | |
| Costco Wholesale Corp. | 10,480 | | 5,949,496 | |
| Health Care Equipment and Supplies — 6.1% | | |
ABIOMED, Inc.(1) | 1,400 | | 502,838 | |
DexCom, Inc.(1) | 3,360 | | 1,804,152 | |
Edwards Lifesciences Corp.(1) | 32,660 | | 4,231,103 | |
IDEXX Laboratories, Inc.(1) | 4,630 | | 3,048,670 | |
Insulet Corp.(1) | 3,690 | | 981,798 | |
Intuitive Surgical, Inc.(1) | 28,330 | | 10,178,969 | |
| | 20,747,530 | |
| Health Care Providers and Services — 3.3% | | |
Guardant Health, Inc.(1) | 8,540 | | 854,171 | |
| UnitedHealth Group, Inc. | 20,700 | | 10,394,298 | |
| | 11,248,469 | |
| Hotels, Restaurants and Leisure — 2.2% | | |
Chipotle Mexican Grill, Inc.(1) | 3,170 | | 5,541,953 | |
| Wingstop, Inc. | 10,200 | | 1,762,560 | |
| | 7,304,513 | |
| | | | | | | | |
| Shares | Value |
| Household Durables — 0.3% | | |
Sonos, Inc.(1) | 33,490 | | $ | 998,002 | |
| Household Products — 0.5% | | |
| Colgate-Palmolive Co. | 19,260 | | 1,643,648 | |
| Interactive Media and Services — 12.0% | | |
Alphabet, Inc., Class A(1) | 4,320 | | 12,515,213 | |
Alphabet, Inc., Class C(1) | 5,230 | | 15,133,476 | |
Meta Platforms, Inc., Class A(1) | 38,780 | | 13,043,653 | |
| | 40,692,342 | |
| Internet and Direct Marketing Retail — 6.6% | | |
Amazon.com, Inc.(1) | 6,640 | | 22,140,018 | |
| IT Services — 13.7% | | |
Adyen NV(1) | 1,930 | | 5,066,249 | |
Block, Inc.(1) | 22,510 | | 3,635,590 | |
| Mastercard, Inc., Class A | 34,870 | | 12,529,488 | |
Okta, Inc.(1) | 7,640 | | 1,712,659 | |
PayPal Holdings, Inc.(1) | 37,960 | | 7,158,497 | |
Shopify, Inc., Class A(1) | 3,350 | | 4,614,257 | |
| Visa, Inc., Class A | 53,250 | | 11,539,807 | |
| | 46,256,547 | |
| Machinery — 1.5% | | |
| Donaldson Co., Inc. | 11,040 | | 654,231 | |
| Nordson Corp. | 4,670 | | 1,192,111 | |
| Westinghouse Air Brake Technologies Corp. | 19,020 | | 1,751,932 | |
| Yaskawa Electric Corp. | 32,300 | | 1,584,820 | |
| | 5,183,094 | |
| Oil, Gas and Consumable Fuels — 0.6% | | |
| EOG Resources, Inc. | 24,090 | | 2,139,915 | |
| Personal Products — 1.6% | | |
| Estee Lauder Cos., Inc. (The), Class A | 14,510 | | 5,371,602 | |
| Road and Rail — 0.8% | | |
| J.B. Hunt Transport Services, Inc. | 13,630 | | 2,785,972 | |
| Semiconductors and Semiconductor Equipment — 6.2% | | |
| Analog Devices, Inc. | 18,820 | | 3,307,991 | |
| Applied Materials, Inc. | 43,500 | | 6,845,160 | |
| NVIDIA Corp. | 11,190 | | 3,291,091 | |
| Xilinx, Inc. | 35,260 | | 7,476,178 | |
| | 20,920,420 | |
| Software — 10.0% | | |
DocuSign, Inc.(1) | 21,940 | | 3,341,682 | |
| Microsoft Corp. | 68,500 | | 23,037,920 | |
Paycom Software, Inc.(1) | 4,820 | | 2,001,216 | |
salesforce.com, Inc.(1) | 11,000 | | 2,795,430 | |
Zscaler, Inc.(1) | 7,580 | | 2,435,681 | |
| | 33,611,929 | |
| Technology Hardware, Storage and Peripherals — 14.0% | | |
| Apple, Inc. | 265,800 | | 47,198,106 | |
| Textiles, Apparel and Luxury Goods — 3.2% | | |
lululemon athletica, Inc.(1) | 12,980 | | 5,081,021 | |
| NIKE, Inc., Class B | 35,120 | | 5,853,450 | |
| | 10,934,471 | |
TOTAL COMMON STOCKS (Cost $76,378,774) | | 337,636,672 | |
| | | | | | | | |
| Shares | Value |
| TEMPORARY CASH INVESTMENTS — 0.2% |
|
|
| Repurchase Agreement, BMO Capital Markets Corp., (collateralized by various U.S. Treasury obligations, 2.00% - 2.375%, 4/30/24 - 5/15/51, valued at $139,195), in a joint trading account at 0.01%, dated 12/31/21, due 1/3/22 (Delivery value $136,435) | | $ | 136,435 | |
| Repurchase Agreement, Fixed Income Clearing Corp., (collateralized by various U.S. Treasury obligations, 3.125%, 8/15/44, valued at $462,137), at 0.01%, dated 12/31/21, due 1/3/22 (Delivery value $453,000) | | 453,000 | |
| State Street Institutional U.S. Government Money Market Fund, Premier Class | 118,558 | | 118,558 | |
TOTAL TEMPORARY CASH INVESTMENTS (Cost $707,993) | | 707,993 | |
TOTAL INVESTMENT SECURITIES — 100.2% (Cost $77,086,767) |
| 338,344,665 | |
| OTHER ASSETS AND LIABILITIES — (0.2)% |
| (724,685) | |
| TOTAL NET ASSETS — 100.0% |
| $ | 337,619,980 | |
| | | | | | | | | | | | | | | | | | | | |
| FORWARD FOREIGN CURRENCY EXCHANGE CONTRACTS |
| Currency Purchased | Currency Sold | Counterparty | Settlement Date | Unrealized Appreciation
(Depreciation) |
| USD | 112,227 | | EUR | 99,106 | | UBS AG | 3/31/22 | $ | (811) | |
| USD | 107,559 | | EUR | 94,715 | | UBS AG | 3/31/22 | (471) | |
| USD | 3,089,482 | | EUR | 2,728,538 | | UBS AG | 3/31/22 | (22,630) | |
| USD | 1,042,602 | | JPY | 118,301,400 | | Bank of America N.A. | 3/31/22 | 13,372 | |
| | | | | | $ | (10,540) | |
| | | | | | | | |
| NOTES TO SCHEDULE OF INVESTMENTS |
| EUR | - | Euro |
| JPY | - | Japanese Yen |
| USD | - | United States Dollar |
(1)Non-income producing.
See Notes to Financial Statements.
| | |
| Statement of Assets and Liabilities |
| | | | | |
| DECEMBER 31, 2021 | |
| Assets | |
| Investment securities, at value (cost of $77,086,767) | $ | 338,344,665 | |
| Receivable for capital shares sold | 28,945 | |
| Unrealized appreciation on forward foreign currency exchange contracts | 13,372 | |
| Dividends and interest receivable | 5,479 | |
| Securities lending receivable | 82 | |
| 338,392,543 | |
| |
| Liabilities | |
| Payable for capital shares redeemed | 495,216 | |
| Unrealized depreciation on forward foreign currency exchange contracts | 23,912 | |
| Accrued management fees | 207,014 | |
| Distribution fees payable | 46,421 | |
| 772,563 | |
| |
| Net Assets | $ | 337,619,980 | |
| |
| Net Assets Consist of: | |
| Capital (par value and paid-in surplus) | $ | 48,447,587 | |
| Distributable earnings | 289,172,393 | |
| $ | 337,619,980 | |
| | | | | | | | | | | |
| | Net Assets | Shares Outstanding | Net Asset Value Per Share |
| Class I, $0.01 Par Value | $117,231,224 | 3,735,818 | $31.38 |
| Class II, $0.01 Par Value | $220,388,756 | 7,239,069 | $30.44 |
See Notes to Financial Statements.
| | | | | |
| YEAR ENDED DECEMBER 31, 2021 | |
| Investment Income (Loss) | |
| Income: | |
| Dividends (net of foreign taxes withheld of $1,089) | $ | 1,378,059 | |
| Interest | 258 | |
| Securities lending, net | 175 | |
| 1,378,492 | |
| |
| Expenses: | |
| Management fees | 2,792,964 | |
| Distribution fees - Class II | 531,409 | |
| Directors' fees and expenses | 7,738 | |
| Other expenses | 2,522 | |
| 3,334,633 | |
Fees waived(1) | (508,785) | |
| 2,825,848 | |
| |
| Net investment income (loss) | (1,447,356) | |
| |
| Realized and Unrealized Gain (Loss) | |
| Net realized gain (loss) on: | |
| Investment transactions | 29,621,744 | |
| Forward foreign currency exchange contract transactions | 356,878 | |
| Foreign currency translation transactions | 401 | |
| 29,979,023 | |
| |
| Change in net unrealized appreciation (depreciation) on: | |
| Investments | 36,113,359 | |
| Forward foreign currency exchange contracts | (9,862) | |
| Translation of assets and liabilities in foreign currencies | (41) | |
| 36,103,456 | |
| |
| Net realized and unrealized gain (loss) | 66,082,479 | |
| |
| Net Increase (Decrease) in Net Assets Resulting from Operations | $ | 64,635,123 | |
(1)Amount consists of $164,630 and $344,155 for Class I and Class II, respectively.
See Notes to Financial Statements.
| | |
| Statement of Changes in Net Assets |
| | | | | | | | |
| YEARS ENDED DECEMBER 31, 2021 AND DECEMBER 31, 2020 |
| Increase (Decrease) in Net Assets | December 31, 2021 | December 31, 2020 |
| Operations | | |
| Net investment income (loss) | $ | (1,447,356) | | $ | (681,942) | |
| Net realized gain (loss) | 29,979,023 | | 21,691,667 | |
| Change in net unrealized appreciation (depreciation) | 36,103,456 | | 80,057,806 | |
| Net increase (decrease) in net assets resulting from operations | 64,635,123 | | 101,067,531 | |
| | |
| Distributions to Shareholders | | |
| From earnings: | | |
| Class I | (6,448,663) | | (5,711,976) | |
| Class II | (14,540,645) | | (15,862,119) | |
| Decrease in net assets from distributions | (20,989,308) | | (21,574,095) | |
| | |
| Capital Share Transactions | | |
| Net increase (decrease) in net assets from capital share transactions (Note 5) | (3,801,857) | | 2,167,599 | |
| | |
| Net increase (decrease) in net assets | 39,843,958 | | 81,661,035 | |
| | |
| Net Assets | | |
| Beginning of period | 297,776,022 | | 216,114,987 | |
| End of period | $ | 337,619,980 | | $ | 297,776,022 | |
See Notes to Financial Statements.
| | |
| Notes to Financial Statements |
DECEMBER 31, 2021
1. Organization
American Century Variable Portfolios, Inc. (the corporation) is registered under the Investment Company Act of 1940, as amended (the 1940 Act), as an open-end management investment company and is organized as a Maryland corporation. VP Ultra Fund (the fund) is one fund in a series issued by the corporation. The fund’s investment objective is to seek long-term capital growth. The fund offers Class I and Class II.
2. Significant Accounting Policies
The following is a summary of significant accounting policies consistently followed by the fund in preparation of its financial statements. The fund is an investment company and follows accounting and reporting guidance in accordance with accounting principles generally accepted in the United States of America. This may require management to make certain estimates and assumptions at the date of the financial statements. Actual results could differ from these estimates. Management evaluated the impact of events or transactions occurring through the date the financial statements were issued that would merit recognition or disclosure.
Investment Valuations — The fund determines the fair value of its investments and computes its net asset value (NAV) per share at the close of regular trading (usually 4 p.m. Eastern time) on the New York Stock Exchange (NYSE) on each day the NYSE is open. The Board of Directors has adopted valuation policies and procedures to guide the investment advisor in the fund’s investment valuation process and to provide methodologies for the oversight of the fund’s pricing function.
Equity securities that are listed or traded on a domestic securities exchange are valued at the last reported sales price or at the official closing price as provided by the exchange. Equity securities traded on foreign securities exchanges are generally valued at the closing price of such securities on the exchange where primarily traded or at the close of the NYSE, if that is earlier. If no last sales price is reported, or if local convention or regulation so provides, the mean of the latest bid and asked prices may be used. Securities traded over-the-counter are valued at the mean of the latest bid and asked prices, the last sales price, or the official closing price. Equity securities initially expressed in local currencies are translated into U.S. dollars at the mean of the appropriate currency exchange rate at the close of the NYSE as provided by an independent pricing service.
Open-end management investment companies are valued at the reported NAV per share. Repurchase agreements are valued at cost, which approximates fair value. Forward foreign currency exchange contracts are valued at the mean of the appropriate forward exchange rate at the close of the NYSE as provided by an independent pricing service.
If the fund determines that the market price for an investment is not readily available or the valuation methods mentioned above do not reflect an investment’s fair value, such investment is valued as determined in good faith by the Board of Directors or its delegate, in accordance with policies and procedures adopted by the Board of Directors. In its determination of fair value, the fund may review several factors including, but not limited to, market information regarding the specific investment or comparable investments and correlation with other investment types, futures indices or general market indicators. Circumstances that may cause the fund to use these procedures to value an investment include, but are not limited to: an investment has been declared in default or is distressed; trading in a security has been suspended during the trading day or a security is not actively trading on its principal exchange; prices received from a regular pricing source are deemed unreliable; or there is a foreign market holiday and no trading occurred.
The fund monitors for significant events occurring after the close of an investment’s primary exchange but before the fund’s NAV per share is determined. Significant events may include, but are not limited to: corporate announcements and transactions; governmental action and political unrest that could impact a specific investment or an investment sector; or armed conflicts, natural disasters and similar events that could affect investments in a specific country or region. The fund also monitors for significant fluctuations between domestic and foreign markets, as evidenced by the U.S. market or such other indicators that the Board of Directors, or its delegate, deems appropriate. The fund may apply a model-derived factor to the closing price of equity securities traded on foreign securities exchanges. The factor is based on observable market data as provided by an independent pricing service.
Security Transactions — Security transactions are accounted for as of the trade date. Net realized gains and losses are determined on the identified cost basis, which is also used for federal income tax purposes.
Investment Income — Dividend income less foreign taxes withheld, if any, is recorded as of the ex-dividend date. Distributions received on securities that represent a return of capital or long-term capital gain are recorded as a reduction of cost of investments and/or as a realized gain. The fund may estimate the components of distributions received that may be considered nontaxable distributions or long-term capital gain distributions for income tax purposes. Interest income is recorded on the accrual basis and includes accretion of discounts and amortization of premiums. Securities lending income is net of fees and rebates earned by the lending agent for its services.
Foreign Currency Translations — All assets and liabilities initially expressed in foreign currencies are translated into U.S. dollars at prevailing exchange rates at period end. The fund may enter into spot foreign currency exchange contracts to facilitate transactions denominated in a foreign currency. Purchases and sales of investment securities, dividend and interest income, spot foreign currency exchange contracts, and expenses are translated at the rates of exchange prevailing on the respective dates of such transactions. Net realized and unrealized foreign currency exchange gains or losses related to investment securities are a component of net realized gain (loss) on investment transactions and change in net unrealized appreciation (depreciation) on investments, respectively.
Repurchase Agreements — The fund may enter into repurchase agreements with institutions that American Century Investment Management, Inc. (ACIM) (the investment advisor) has determined are creditworthy pursuant to criteria adopted by the Board of Directors. The fund requires that the collateral, represented by securities, received in a repurchase transaction be transferred to the custodian in a manner sufficient to enable the fund to obtain those securities in the event of a default under the repurchase agreement. ACIM monitors, on a daily basis, the securities transferred to ensure the value, including accrued interest, of the securities under each repurchase agreement is equal to or greater than amounts owed to the fund under each repurchase agreement.
Joint Trading Account — Pursuant to an Exemptive Order issued by the Securities and Exchange Commission, the fund, along with certain other funds in the American Century Investments family of funds, may transfer uninvested cash balances into a joint trading account. These balances are invested in one or more repurchase agreements that are collateralized by U.S. Treasury or Agency obligations.
Segregated Assets — In accordance with the 1940 Act, the fund segregates assets on its books and records to cover certain types of investment securities and other financial instruments. ACIM monitors, on a daily basis, the securities segregated to ensure the fund designates a sufficient amount of liquid assets, marked-to-market daily. The fund may also receive assets or be required to pledge assets at the custodian bank or with a broker for collateral requirements.
Income Tax Status — It is the fund’s policy to distribute substantially all net investment income and net realized gains to shareholders and to otherwise qualify as a regulated investment company under provisions of the Internal Revenue Code. Accordingly, no provision has been made for income taxes. The fund files U.S. federal, state, local and non-U.S. tax returns as applicable. The fund's tax returns are subject to examination by the relevant taxing authority until expiration of the applicable statute of limitations, which is generally three years from the date of filing but can be longer in certain jurisdictions. At this time, management believes there are no uncertain tax positions which, based on their technical merit, would not be sustained upon examination and for which it is reasonably possible that the total amounts of unrecognized tax benefits will significantly change in the next twelve months.
Multiple Class — All shares of the fund represent an equal pro rata interest in the net assets of the class to which such shares belong, and have identical voting, dividend, liquidation and other rights and the same terms and conditions, except for class specific expenses and exclusive rights to vote on matters affecting only individual classes. Income, non-class specific expenses, and realized and unrealized capital gains and losses of the fund are allocated to each class of shares based on their relative net assets.
Distributions to Shareholders — Distributions from net investment income and net realized gains, if any, are generally declared and paid annually.
Indemnifications — Under the corporation’s organizational documents, its officers and directors are indemnified against certain liabilities arising out of the performance of their duties to the fund. In addition, in the normal course of business, the fund enters into contracts that provide general indemnifications. The maximum exposure under these arrangements is unknown as this would involve future claims that may be made against a fund. The risk of material loss from such claims is considered by management to be remote.
Securities Lending — Securities are lent to qualified financial institutions and brokers. State Street Bank & Trust Co. serves as securities lending agent to the fund pursuant to a Securities Lending Agreement. The lending of securities exposes the fund to risks such as: the borrowers may fail to return the loaned securities, the borrowers may not be able to provide additional collateral, the fund may experience delays in recovery of the loaned securities or delays in access to collateral, or the fund may experience losses related to the investment collateral. To minimize certain risks, loan counterparties pledge collateral in the form of cash and/or securities. The lending agent has agreed to indemnify the fund in the case of default of any securities borrowed. Cash collateral received is invested in the State Street Navigator Securities Lending Government Money Market Portfolio, a money market mutual fund registered under the 1940 Act. The loans may also be secured by U.S. government securities in an amount at least equal to the market value of the securities loaned, plus accrued interest and dividends, determined on a daily basis and adjusted accordingly. By lending securities, the fund seeks to increase its net investment income through the receipt of interest and fees. Such income is reflected separately within the Statement of Operations. The value of loaned securities and related collateral outstanding at period end, if any, are shown on a gross basis within the Schedule of Investments and Statement of Assets and Liabilities.
3. Fees and Transactions with Related Parties
Certain officers and directors of the corporation are also officers and/or directors of American Century Companies, Inc. (ACC). The corporation’s investment advisor, ACIM, the corporation's distributor, American Century Investment Services, Inc. (ACIS), and the corporation’s transfer agent, American Century Services, LLC, are wholly owned, directly or indirectly, by ACC.
Management Fees — The corporation has entered into a management agreement with ACIM, under which ACIM provides the fund with investment advisory and management services in exchange for a single, unified management fee (the fee) per class. The agreement provides that ACIM will pay all expenses of managing and operating the fund, except brokerage expenses, taxes, interest, fees and expenses of the independent directors (including legal counsel fees), extraordinary expenses, and expenses incurred in connection with the provision of shareholder services and distribution services under a plan adopted pursuant to Rule 12b-1 under the 1940 Act. The fee is computed and accrued daily based on each class’s daily net assets and paid monthly in arrears. The difference in the fee among the classes is a result of their separate arrangements for non-Rule 12b-1 shareholder services. It is not the result of any difference in advisory or custodial fees or other expenses related to the management of the fund’s assets, which do not vary by class. From January 1, 2021 through July 31, 2021, the rate of the fee was determined by applying a fee rate calculation formula. This formula took into account the fund’s assets as well as certain assets, if any, of other clients of the investment advisor outside the American Century Investments family of funds (such as subadvised funds and separate accounts) that use very similar investment teams and strategies (strategy assets). Effective August 1, 2021, the stepped annual management fee schedule was terminated and an annual management fee was adopted. From January 1, 2021 through July 31, 2021, the investment advisor agreed to waive 0.21% of the fund's management fee. Effective August 1, 2021, the investment advisor agreed to waive 0.10% of the fund's management fee. The investment advisor expects this waiver to continue until July 31, 2022 and cannot terminate it prior to such date without the approval of the Board of Directors.
The annual management fee and the effective annual management fee before and after waiver for each class for the period ended December 31, 2021 are as follows:
| | | | | | | | | | | |
| | Effective Annual Management Fee |
| Annual Management Fee* | Before Waiver | After Waiver |
| Class I | 0.89% | 0.95% | 0.79% |
| Class II | 0.79% | 0.85% | 0.69% |
*Prior to August 1, 2021, the management fee schedule range was 0.90% to 1.00% for Class I and 0.80% to 0.90% for Class II.
Distribution Fees — The Board of Directors has adopted the Master Distribution Plan (the plan) for Class II, pursuant to Rule 12b-1 of the 1940 Act. The plan provides that Class II will pay ACIS an annual distribution fee equal to 0.25%. The fee is computed and accrued daily based on the Class II daily net assets and paid monthly in arrears. The distribution fee provides compensation for expenses incurred in connection with distributing shares of Class II including, but not limited to, payments to brokers, dealers, and financial institutions that have entered into sales agreements with respect to shares of the fund. Fees incurred under the plan during the period ended December 31, 2021 are detailed in the Statement of Operations.
Directors' Fees and Expenses — The Board of Directors is responsible for overseeing the investment advisor’s management and operations of the fund. The directors receive detailed information about the fund and its investment advisor regularly throughout the year, and meet at least quarterly with management of the investment advisor to review reports about fund operations. The fund’s officers do not receive compensation from the fund.
Interfund Transactions — The fund may enter into security transactions with other American Century Investments funds and other client accounts of the investment advisor, in accordance with the 1940 Act rules and procedures adopted by the Board of Directors. The rules and procedures require, among other things, that these transactions be effected at the independent current market price of the security. There were no interfund transactions during the period.
4. Investment Transactions
Purchases and sales of investment securities, excluding short-term investments, for the period ended December 31, 2021 were $59,347,286 and $84,338,767, respectively.
5. Capital Share Transactions
Transactions in shares of the fund were as follows:
| | | | | | | | | | | | | | |
| Year ended
December 31, 2021 | Year ended
December 31, 2020 |
| Shares | Amount | Shares | Amount |
| Class I/Shares Authorized | 100,000,000 | | | 100,000,000 | | |
| Sold | 1,175,353 | | $ | 34,640,641 | | 1,566,604 | | $ | 35,506,039 | |
| Issued in reinvestment of distributions | 256,204 | | 6,448,663 | | 374,065 | | 5,711,976 | |
| Redeemed | (1,198,635) | | (34,488,705) | | (1,276,486) | | (27,787,644) | |
| 232,922 | | 6,600,599 | | 664,183 | | 13,430,371 | |
| Class II/Shares Authorized | 120,000,000 | | | 120,000,000 | | |
| Sold | 710,933 | | 19,783,587 | | 1,221,694 | | 24,919,128 | |
| Issued in reinvestment of distributions | 594,709 | | 14,540,645 | | 1,065,287 | | 15,862,119 | |
| Redeemed | (1,598,856) | | (44,726,688) | | (2,405,689) | | (52,044,019) | |
| (293,214) | | (10,402,456) | | (118,708) | | (11,262,772) | |
| Net increase (decrease) | (60,292) | | $ | (3,801,857) | | 545,475 | | $ | 2,167,599 | |
6. Fair Value Measurements
The fund’s investments valuation process is based on several considerations and may use multiple inputs to determine the fair value of the investments held by the fund. In conformity with accounting principles generally accepted in the United States of America, the inputs used to determine a valuation are classified into three broad levels.
•Level 1 valuation inputs consist of unadjusted quoted prices in an active market for identical investments.
•Level 2 valuation inputs consist of direct or indirect observable market data (including quoted prices for comparable investments, evaluations of subsequent market events, interest rates, prepayment speeds, credit risk, etc.). These inputs also consist of quoted prices for identical investments initially expressed in local currencies that are adjusted through translation into U.S. dollars.
•Level 3 valuation inputs consist of unobservable data (including a fund’s own assumptions).
The level classification is based on the lowest level input that is significant to the fair valuation measurement. The valuation inputs are not necessarily an indication of the risks associated with investing in these securities or other financial instruments.
The following is a summary of the level classifications as of period end. The Schedule of Investments provides additional information on the fund’s portfolio holdings.
| | | | | | | | | | | |
| Level 1 | Level 2 | Level 3 |
| Assets | | | |
| Investment Securities | | | |
| Common Stocks | $ | 329,728,087 | | $ | 7,908,585 | | — | |
| Temporary Cash Investments | 118,558 | | 589,435 | | — | |
| $ | 329,846,645 | | $ | 8,498,020 | | — | |
| Other Financial Instruments | | | |
| Forward Foreign Currency Exchange Contracts | — | | $ | 13,372 | | — | |
| | | |
| Liabilities | | | |
| Other Financial Instruments | | | |
| Forward Foreign Currency Exchange Contracts | — | | $ | 23,912 | | — | |
7. Derivative Instruments
Foreign Currency Risk — The fund is subject to foreign currency exchange rate risk in the normal course of pursuing its investment objectives. The value of foreign investments held by a fund may be significantly affected by changes in foreign currency exchange rates. The dollar value of a foreign security generally decreases when the value of the dollar rises against the foreign currency in which the security is denominated and tends to increase when the value of the dollar declines against such foreign currency. A fund may enter into forward foreign currency exchange contracts to reduce a fund's exposure to foreign currency exchange rate fluctuations. The net U.S. dollar value of foreign currency underlying all contractual commitments held by a fund and the resulting unrealized appreciation or depreciation are determined daily. Realized gain or loss is recorded upon settlement of the contract. Net realized and unrealized gains or losses occurring during the holding period of forward foreign currency exchange contracts are a component of net realized gain (loss) on forward foreign currency exchange contract transactions and change in net unrealized appreciation (depreciation) on forward foreign currency exchange contracts, respectively. A fund bears the risk of an unfavorable change in the foreign currency exchange rate underlying the forward contract. Additionally, losses, up to the fair value, may arise if the counterparties do not perform under the contract terms. The fund's average U.S. dollar exposure to foreign currency risk derivative instruments held during the period was $4,385,897.
The value of foreign currency risk derivative instruments as of December 31, 2021, is disclosed on the Statement of Assets and Liabilities as an asset of $13,372 in unrealized appreciation on forward foreign currency exchange contracts and a liability of $23,912 in unrealized depreciation on forward foreign currency exchange contracts. For the year ended December 31, 2021, the effect of foreign currency risk derivative instruments on the Statement of Operations was $356,878 in net realized gain (loss) on forward foreign currency exchange contract transactions and $(9,862) in change in net unrealized appreciation (depreciation) on forward foreign currency exchange contracts.
8. Risk Factors
The value of the fund’s shares will go up and down, sometimes rapidly or unpredictably, based on the performance of the securities owned by the fund and other factors generally affecting the securities market. Market risks, including political, regulatory, economic and social developments, can affect the value of the fund’s investments. Natural disasters, public health emergencies, terrorism and other unforeseeable events may lead to increased market volatility and may have adverse long-term effects on world economies and markets generally.
9. Federal Tax Information
The tax character of distributions paid during the years ended December 31, 2021 and December 31, 2020 were as follows:
| | | | | | | | |
| 2021 | 2020 |
| Distributions Paid From | | |
| Ordinary income | $ | 1,165,955 | | — | |
| Long-term capital gains | $ | 19,823,353 | | $ | 21,574,095 | |
The book-basis character of distributions made during the year from net investment income or net realized gains may differ from their ultimate characterization for federal income tax purposes. These differences reflect the differing character of certain income items and net realized gains and losses for financial statement and tax purposes, and may result in reclassification among certain capital accounts on the financial statements.
As of period end, the federal tax cost of investments and the components of distributable earnings on a tax-basis were as follows:
| | | | | |
| Federal tax cost of investments | $ | 77,530,504 | |
| Gross tax appreciation of investments | $ | 261,374,991 | |
| Gross tax depreciation of investments | (560,830) | |
| Net tax appreciation (depreciation) of investments | 260,814,161 | |
| Net tax appreciation (depreciation) on derivatives and translation of assets and liabilities in foreign currencies | (41) | |
| Net tax appreciation (depreciation) | $ | 260,814,120 | |
| Undistributed ordinary income | $ | 28,679 | |
| Accumulated long-term gains | $ | 28,329,594 | |
The difference between book-basis and tax-basis unrealized appreciation (depreciation) is attributable primarily to the tax deferral of losses on wash sales.
| | | | | | | | | | | | | | | | | | | | | | | | | | | | | | | | | | | | | | | | | | | | | | | |
| For a Share Outstanding Throughout the Years Ended December 31 (except as noted) | |
| Per-Share Data | | | | | | Ratios and Supplemental Data | |
| | Income From Investment Operations: | Distributions From: | | | Ratio to Average Net Assets of: | |
| Net Asset
Value,
Beginning
of Period | Net Investment Income (Loss)(1) | Net
Realized
and
Unrealized
Gain (Loss) | Total From
Investment
Operations | Net
Investment
Income | Net
Realized
Gains | Total
Distributions | Net Asset
Value,
End
of Period | Total Return(2) | Operating
Expenses | Operating Expenses
(before
expense
waiver) | Net
Investment
Income
(Loss) | Net
Investment
Income
(Loss)
(before
expense
waiver) | Portfolio
Turnover
Rate | Net
Assets,
End of
Period
(in thousands) |
| Class I | | | | | | | | | | | | | | | |
| 2021 | $27.48 | (0.10) | 5.98 | 5.88 | — | (1.98) | (1.98) | $31.38 | 23.16% | 0.79% | 0.95% | (0.35)% | (0.51)% | 19% | $117,231 | |
| 2020 | $20.93 | (0.04) | 8.75 | 8.71 | — | (2.16) | (2.16) | $27.48 | 49.85% | 0.80% | 1.00% | (0.18)% | (0.38)% | 22% | $96,249 | |
| 2019 | $17.40 | —(3) | 5.67 | 5.67 | — | (2.14) | (2.14) | $20.93 | 34.58% | 0.82% | 1.00% | (0.01)% | (0.19)% | 23% | $59,427 | |
| 2018 | $19.34 | —(3) | 0.17 | 0.17 | (0.05) | (2.06) | (2.11) | $17.40 | 0.76% | 0.83% | 1.00% | 0.01% | (0.16)% | 29% | $42,081 | |
| 2017 | $15.46 | 0.05 | 4.73 | 4.78 | (0.07) | (0.83) | (0.90) | $19.34 | 32.22% | 0.84% | 1.00% | 0.26% | 0.10% | 22% | $44,607 | |
| Class II | | | | | | | | | | | | | | |
| 2021 | $26.76 | (0.14) | 5.80 | 5.66 | — | (1.98) | (1.98) | $30.44 | 22.99% | 0.94% | 1.10% | (0.50)% | (0.66)% | 19% | $220,389 | |
| 2020 | $20.48 | (0.07) | 8.51 | 8.44 | — | (2.16) | (2.16) | $26.76 | 49.55% | 0.95% | 1.15% | (0.33)% | (0.53)% | 22% | $201,527 | |
| 2019 | $17.08 | (0.03) | 5.57 | 5.54 | — | (2.14) | (2.14) | $20.48 | 34.46% | 0.97% | 1.15% | (0.16)% | (0.34)% | 23% | $156,688 | |
| 2018 | $19.02 | (0.03) | 0.17 | 0.14 | (0.02) | (2.06) | (2.08) | $17.08 | 0.60% | 0.98% | 1.15% | (0.14)% | (0.31)% | 29% | $143,249 | |
| 2017 | $15.22 | 0.02 | 4.65 | 4.67 | (0.04) | (0.83) | (0.87) | $19.02 | 32.00% | 0.99% | 1.15% | 0.11% | (0.05)% | 22% | $160,964 | |
| | |
| Notes to Financial Highlights |
(1)Computed using average shares outstanding throughout the period.
(2)Total returns are calculated based on the net asset value of the last business day. Total returns for periods less than one year are not annualized. The total returns presented do not include the fees and charges assessed with investments in variable insurance products, those charges are disclosed in the separate account prospectus. The inclusion of such fees and charges would lower total return.
(3)Per-share amount was less than $0.005.
See Notes to Financial Statements.
| | |
| Report of Independent Registered Public Accounting Firm |
To the Shareholders and the Board of Directors of American Century Variable Portfolios, Inc.:
Opinion on the Financial Statements and Financial Highlights
We have audited the accompanying statement of assets and liabilities, including the schedule of investments, of VP Ultra® Fund (the “Fund”), one of the funds constituting the American Century Variable Portfolios, Inc., as of December 31, 2021, the related statement of operations for the year then ended, the statements of changes in net assets for each of the two years in the period then ended, the financial highlights for each of the five years in the period then ended, and the related notes. In our opinion, the financial statements and financial highlights present fairly, in all material respects, the financial position of VP Ultra® Fund of the American Century Variable Portfolios, Inc. as of December 31, 2021, and the results of its operations for the year then ended, the changes in its net assets for each of the two years in the period then ended, and the financial highlights for each of the five years in the period then ended, in conformity with accounting principles generally accepted in the United States of America.
Basis for Opinion
These financial statements and financial highlights are the responsibility of the Fund's management. Our responsibility is to express an opinion on the Fund’s financial statements and financial highlights based on our audits. We are a public accounting firm registered with the Public Company Accounting Oversight Board (United States) (PCAOB) and are required to be independent with respect to the Fund in accordance with the U.S. federal securities laws and the applicable rules and regulations of the Securities and Exchange Commission and the PCAOB.
We conducted our audits in accordance with the standards of the PCAOB. Those standards require that we plan and perform the audit to obtain reasonable assurance about whether the financial statements and financial highlights are free of material misstatement, whether due to error or fraud. The Fund is not required to have, nor were we engaged to perform, an audit of its internal control over financial reporting. As part of our audits, we are required to obtain an understanding of internal control over financial reporting but not for the purpose of expressing an opinion on the effectiveness of the Fund’s internal control over financial reporting. Accordingly, we express no such opinion.
Our audits included performing procedures to assess the risks of material misstatement of the financial statements and financial highlights, whether due to error or fraud, and performing procedures that respond to those risks. Such procedures included examining, on a test basis, evidence regarding the amounts and disclosures in the financial statements and financial highlights. Our audits also included evaluating the accounting principles used and significant estimates made by management, as well as evaluating the overall presentation of the financial statements and financial highlights. Our procedures included confirmation of securities owned as of December 31, 2021, by correspondence with the custodian and brokers; when replies were not received from brokers, we performed other auditing procedures. We believe that our audits provide a reasonable basis for our opinion.
/s/ Deloitte & Touche LLP
Kansas City, Missouri
February 10, 2022
We have served as the auditor of one or more American Century investment companies since 1997.
The Board of Directors
The individuals listed below serve as directors of the funds. Each director will continue to serve in this capacity until death, retirement, resignation or removal from office. The board has adopted a mandatory retirement age for directors who are not “interested persons,” as that term is defined in the Investment Company Act (independent directors). Independent directors shall retire on December 31 of the year in which they reach their 75th birthday.
Mr. Thomas is an “interested person” because he currently serves as President and Chief Executive Officer of American Century Companies, Inc. (ACC), the parent company of American Century Investment Management, Inc. (ACIM or the advisor). The other directors (more than three-fourths of the total number) are independent. They are not employees, directors or officers of, and have no financial interest in, ACC or any of its wholly owned, direct or indirect, subsidiaries, including ACIM, American Century Investment Services, Inc. (ACIS) and American Century Services, LLC (ACS), and they do not have any other affiliations, positions or relationships that would cause them to be considered “interested persons” under the Investment Company Act. The directors serve in this capacity for seven (in the case of Jonathan S. Thomas, 16; and Stephen E. Yates, 8) registered investment companies in the American Century Investments family of funds.
The following table presents additional information about the directors. The mailing address for each director is 4500 Main Street, Kansas City, Missouri 64111.
| | | | | | | | | | | | | | | | | |
Name
(Year of Birth) | Position(s) Held with Funds | Length of Time Served | Principal Occupation(s) During Past 5 Years | Number of American Century Portfolios Overseen by Director | Other Directorships Held During Past 5 Years |
| Independent Directors | | |
| Thomas W. Bunn (1953) | Director | Since 2017 | Retired | 72 | SquareTwo Financial |
Chris H. Cheesman
(1962)
| Director | Since 2019
| Retired. Senior Vice President & Chief Audit Executive, AllianceBernstein (1999 to 2018)
| 72 | Alleghany Corporation |
Barry Fink
(1955) | Director | Since 2012 (independent since 2016) | Retired | 72 | None |
Rajesh K. Gupta
(1960)
| Director | Since 2019
| Partner Emeritus, SeaCrest Investment Management and SeaCrest Wealth Management (2019 to Present); Chief Executive Officer and Chief Investment Officer, SeaCrest Investment Management (2006 to 2019); Chief Executive Officer and Chief Investment Officer, SeaCrest Wealth Management (2008 to 2019) | 72 | None |
| | | | | | | | | | | | | | | | | |
Name
(Year of Birth) | Position(s) Held with Funds | Length of Time Served | Principal Occupation(s) During Past 5 Years | Number of American Century Portfolios Overseen by Director | Other Directorships Held During Past 5 Years |
| Independent Directors | | |
Lynn Jenkins
(1963)
| Director | Since 2019
| Consultant, LJ Strategies (2019 to present); United States Representative, U.S. House of Representatives (2009 to 2018) | 72 | MGP Ingredients, Inc. (2019 to 2021) |
Jan M. Lewis
(1957) | Director | Since 2011 | Retired | 72 | None |
John R. Whitten(1) (1946) | Director | Since 2008 | Retired | 72 | Onto Innovation Inc. (2019 to 2020); Rudolph Technologies, Inc. (2006 to 2019) |
Stephen E. Yates
(1948) | Director and Chairman of the Board | Since 2012 (Chairman since 2018) | Retired | 108 | None |
| Interested Director | |
Jonathan S. Thomas
(1963) | Director | Since 2007 | President and Chief Executive Officer, ACC (2007 to present). Also serves as Chief Executive Officer, ACS; Director, ACC and other ACC subsidiaries | 146 | None |
(1) Effective December 31, 2021, John R. Whitten retired from the Board of Directors.
The Statement of Additional Information has additional information about the fund's directors and is available without charge, upon request, by calling 1-800-378-9878.
Officers
The following table presents certain information about the executive officers of the funds. Each officer serves as an officer for 16 (in the case of Robert J. Leach, 15) investment companies in the American Century family of funds. No officer is compensated for his or her service as an officer of the funds. The listed officers are interested persons of the funds and are appointed or re-appointed on an annual basis. The mailing address for each officer listed below is 4500 Main Street, Kansas City, Missouri 64111.
| | | | | | | | |
Name
(Year of Birth) | Offices with the Funds | Principal Occupation(s) During the Past Five Years |
Patrick Bannigan
(1965) | President since 2019 | Executive Vice President and Director, ACC (2012 to present); Chief Financial Officer, Chief Accounting Officer and Treasurer, ACC (2015 to present). Also serves as President, ACS; Vice President, ACIM; Chief Financial Officer, Chief Accounting Officer and/or Director, ACIM, ACS and other ACC subsidiaries |
R. Wes Campbell
(1974) | Chief Financial Officer and Treasurer since 2018 | Vice President, ACS, (2020 to present); Investment Operations and Investment Accounting, ACS (2000 to present) |
Amy D. Shelton
(1964) | Chief Compliance Officer and Vice President since 2014 | Chief Compliance Officer, American Century funds, (2014 to present); Chief Compliance Officer, ACIM (2014 to present); Chief Compliance Officer, ACIS (2009 to present). Also serves as Vice President, ACIS |
John Pak
(1968) | General Counsel and
Senior Vice President since 2021 | General Counsel and Senior Vice President, ACC (2021 to present); Also serves as General Counsel and Senior Vice President, ACIM, ACS and ACIS. Chief Legal Officer of Investment and Wealth Management, The Bank of New York Mellon (2014 to 2021) |
C. Jean Wade
(1964) | Vice President since 2012 | Senior Vice President, ACS (2017 to present); Vice President, ACS (2000 to 2017)
|
Robert J. Leach
(1966) | Vice President since 2006 | Vice President, ACS (2000 to present) |
David H. Reinmiller
(1963) | Vice President since 2000 | Attorney, ACC (1994 to present). Also serves as Vice President, ACIM and ACS |
Ward D. Stauffer
(1960) | Secretary since 2005 | Attorney, ACC (2003 to present) |
Proxy Voting Policies
A description of the policies that the fund's investment advisor uses in exercising the voting rights associated with the securities purchased and/or held by the fund is available without charge, upon request, by calling 1-800-378-9878. It is also available on American Century Investments’ website at americancentury.com/proxy and on the Securities and Exchange Commission’s website at sec.gov. Information regarding how the investment advisor voted proxies relating to portfolio securities during the most recent 12-month period ended June 30 is available on americancentury.com/proxy. It is also available at sec.gov.
Quarterly Portfolio Disclosure
The fund files its complete schedule of portfolio holdings with the Securities and Exchange Commission (SEC) for the first and third quarters of each fiscal year as an exhibit to its reports on Form N-PORT. These portfolio holdings are available on the fund's website at ipro.americancentury.com (for Investment Professionals) and, upon request, by calling 1-800-378-9878. The fund’s Form N-PORT reports are available on the SEC’s website at sec.gov.
Other Tax Information
The following information is provided pursuant to provisions of the Internal Revenue Code.
For corporate taxpayers, the fund hereby designates $1,165,955, or up to the maximum amount allowable, of ordinary income distributions paid during the fiscal year ended December 31, 2021 as qualified for the corporate dividends received deduction.
The fund hereby designates $19,823,353, or up to the maximum amount allowable, as long-term capital gain distributions (20% rate gain distributions) for the fiscal year ended December 31, 2021.
The fund hereby designates $1,165,955 as qualified short-term capital gain distributions for purposes of Internal Revenue Code Section 871 for the fiscal year ended December 31, 2021.
| | | | | | | | |
| |
| | |
| Contact Us | americancentury.com | |
| Automated Information Line | 1-800-345-8765 | |
| Investment Professional Service Representatives | 1-800-345-6488 | |
| Telecommunications Relay Service for the Deaf | 711 | |
| | |
| American Century Variable Portfolios, Inc. | |
| | |
Investment Advisor: American Century Investment Management, Inc. Kansas City, Missouri | |
| | |
| This report and the statements it contains are submitted for the general information of our shareholders. The report is not authorized for distribution to prospective investors unless preceded or accompanied by an effective prospectus. | |
| | |
©2022 American Century Proprietary Holdings, Inc. All rights reserved.
CL-ANN-91443 2202 | |
| | | | | |
| |
| Annual Report |
| |
| December 31, 2021 |
| |
| VP Value Fund |
| Class I (AVPIX) |
| Class II (AVPVX) |
| | | | | |
| Performance | |
| Portfolio Commentary | |
| Fund Characteristics | |
| Shareholder Fee Example | |
| Schedule of Investments | |
| Statement of Assets and Liabilities | |
| Statement of Operations | |
| Statement of Changes in Net Assets | |
| Notes to Financial Statements | |
| Financial Highlights | |
| Report of Independent Registered Public Accounting Firm | |
| Management | |
| |
| |
| |
| Additional Information | |
Any opinions expressed in this report reflect those of the author as of the date of the report, and do not necessarily represent the opinions of American Century Investments® or any other person in the American Century Investments organization. Any such opinions are subject to change at any time based upon market or other conditions and American Century Investments disclaims any responsibility to update such opinions. These opinions may not be relied upon as investment advice and, because investment decisions made by American Century Investments funds are based on numerous factors, may not be relied upon as an indication of trading intent on behalf of any American Century Investments fund. Security examples are used for representational purposes only and are not intended as recommendations to purchase or sell securities. Performance information for comparative indices and securities is provided to American Century Investments by third party vendors. To the best of American Century Investments’ knowledge, such information is accurate at the time of printing.
| | | | | | | | | | | | | | | | | | | |
| Total Returns as of December 31, 2021 | | | | |
| | | | Average Annual Returns | |
| Ticker
Symbol | | 1 year | 5 years | 10 years | | Inception
Date |
| Class I | AVPIX | | 24.51% | 9.55% | 12.03% | | 5/1/96 |
| Russell 1000 Value Index | — | | 25.16% | 11.16% | 12.96% | | — |
| S&P 500 Index | — | | 28.71% | 18.46% | 16.54% | | — |
| Class II | AVPVX | | 24.28% | 9.39% | 11.88% | | 8/14/01 |
Fund returns would have been lower if a portion of the fees had not been waived.
The performance information presented does not include the fees and charges assessed with investments in variable insurance products, those charges are disclosed in the separate account prospectus. The inclusion of such fees and charges would lower performance.
Data presented reflect past performance. Past performance is no guarantee of future results. Current performance may be higher or lower than the performance shown. Total returns for periods less than one year are not annualized. Investment return and principal value will fluctuate, and redemption value may be more or less than original cost. Data assumes reinvestment of dividends and capital gains, and none of the charts reflect the deduction of taxes that a shareholder would pay on fund distributions or the redemption of fund shares. To obtain performance data current to the most recent month end, please call 1-800-345-6488 or visit ipro.americancentury.com (for Investment Professionals). For additional information about the fund, please consult the prospectus.
| | |
| Growth of $10,000 Over 10 Years |
| $10,000 investment made December 31, 2011 |
| Performance for other share classes will vary due to differences in fee structure. |
| | | | | |
| Value on December 31, 2021 |
| Class I — $31,185 |
|
| Russell 1000 Value Index — $33,846 |
|
| S&P 500 Index — $46,257 |
|
| |
|
Ending value of Class I would have been lower if a portion of the fees had not been waived.
| | | | | |
| Total Annual Fund Operating Expenses |
| Class I | Class II |
| 0.83% | 0.98% |
The total annual fund operating expenses shown is as stated in the fund’s prospectus current as of the date of this report. The prospectus may vary from the expense ratio shown elsewhere in this report because it is based on a different time period, includes acquired fund fees and expenses, and, if applicable, does not include fee waivers or expense reimbursements.
Data presented reflect past performance. Past performance is no guarantee of future results. Current performance may be higher or lower than the performance shown. Total returns for periods less than one year are not annualized. Investment return and principal value will fluctuate, and redemption value may be more or less than original cost. Data assumes reinvestment of dividends and capital gains, and none of the charts reflect the deduction of taxes that a shareholder would pay on fund distributions or the redemption of fund shares. To obtain performance data current to the most recent month end, please call 1-800-345-6488 or visit ipro.americancentury.com (for Investment Professionals). For additional information about the fund, please consult the prospectus.
Portfolio Managers: Michael Liss, Phillip N. Davidson, Kevin Toney, Brian Woglom and Philip Sundell
Performance Summary
VP Value returned 24.51%* for the 12 months ended December 31, 2021, compared with the 25.16% return of its benchmark, the Russell 1000 Value index. The fund’s return reflects operating expenses, while the index’s return does not.
Stock selection in the health care and consumer staples sectors detracted from performance relative to the benchmark. Lack of exposure to several of the benchmark’s real estate names also weighed on returns. On the other hand, several of our energy holdings positively impacted performance. The information technology and industrials sectors were other key areas of strength.
Health Care, Consumer Staples and Real Estate Detracted
Several of the fund’s positions in the health care sector underperformed during the period, including Zimmer Biomet Holdings and Medtronic. Both stocks were pressured by concerns about continued delays in elective procedures due to the ongoing pandemic. Cardinal Health was another notable detractor. The company reported earnings that were below expectations due to operating profit shortfalls in its pharmaceutical and medical segments. Cardinal also provided lower-than-expected fiscal 2022 guidance, driven by inflation in its medical segment and by incremental information technology investments.
A number of the portfolio’s consumer staples holdings weighed on performance, including Unilever, a U.K.-based consumer goods company. Unilever underperformed as the company’s profit margins were pressured by rising input costs. Several other consumer staples holdings lagged because they were not direct beneficiaries of economic reopening.
As the economy reopened, many of the benchmark’s real estate names outperformed during the reporting period. However, we held a limited number of real estate positions because our metrics showed most real estate stocks were unattractively priced. In turn, our underweight in the real estate sector relative to the benchmark as well as stock selection within the sector detracted from relative returns.
Energy, Information Technology and Industrials Contributed
Energy holdings Devon Energy and Chevron were top contributors over the trailing 12-month period. These stocks were buoyed by higher oil prices. In addition, Devon’s stock was supported by its financial results and plans to increase its return of capital to shareholders, and Chevron’s investors reacted positively to news that Warren Buffett built a $4 billion stake in the company.
Security selection in the information technology sector positively impacted relative performance. The portfolio’s lack of exposure to some of the benchmark’s names within the IT services industry was beneficial. Our position in Cisco Systems helped returns; its shares outperformed due to strong demand for security and networking products. Hybrid work environments, 5G-related upgrades, pent-up demand and competitive wins drove an increase in orders. Applied Materials, a semiconductor equipment company, was another notable contributor. The stock outperformed as the company continued to execute on its product road map. We exited the position on strength in the stock price.
*All fund returns referenced in this commentary are for Class I shares. Fund returns would have been lower if a portion of the fees had not been waived. Performance for other share classes will vary due to differences in fee structure; when Class I performance exceeds that of the fund’s benchmark, other share classes may not. See page 2 for returns for all share classes.
In the industrials sector, nVent Electric outperformed. This U.K.-based provider of electrical products delivered strong financial results, executing well on pricing and productivity. Furthermore, nVent’s thermal orders rose and experienced sequential backlog growth. We believe nVent offers growing earnings power, supported by an end-market recovery and stronger demand for its industrial products.
Wells Fargo & Co. was another key contributor. The stock outperformed on an improving economic outlook and expectations for higher interest rates. Also, Wells Fargo made progress on its governance and risk management reforms.
Portfolio Positioning
The portfolio seeks to invest in companies where we believe the valuation does not reflect the quality and normal earnings power of the company. Our process is based on individual security selection, but broad themes have emerged.
We ended the reporting period with a notable overweight in energy. Our research has led us to higher-quality energy companies with solid assets, strong balance sheets and management teams focused on returns on capital and return of capital to shareholders. From an overall energy perspective, we understand that government entities are increasingly supporting renewable energy, which may create investment opportunities. However, renewables will be brought online incrementally, and we believe carbon-based energy is necessary for the foreseeable future. The portfolio is also overweight in financials, and a large portion of that exposure is comprised of well capitalized banks. We also hold select positions in insurance, capital markets and diversified financial services companies.
On the other hand, we ended the year with underweights in the real estate and utilities sectors. We believe many stocks throughout both sectors are expensive, and therefore, they do not meet our investment criteria.
| | | | | |
| DECEMBER 31, 2021 |
| Types of Investments in Portfolio | % of net assets |
| Common Stocks | 97.7% |
| Temporary Cash Investments | 2.2% |
| Other Assets and Liabilities | 0.1% |
| |
| Top Five Industries | % of net assets |
| Banks | 12.1% |
| Pharmaceuticals | 8.5% |
| Oil, Gas and Consumable Fuels | 7.0% |
| Health Care Providers and Services | 5.5% |
| Diversified Telecommunication Services | 4.8% |
Fund shareholders may incur two types of costs: (1) transaction costs, including sales charges (loads) on purchase payments and redemption/exchange fees; and (2) ongoing costs, including management fees; distribution and service (12b-1) fees; and other fund expenses. This example is intended to help you understand your ongoing costs (in dollars) of investing in your fund and to compare these costs with the ongoing cost of investing in other mutual funds.
The example is based on an investment of $1,000 made at the beginning of the period and held for the entire period from July 1, 2021 to December 31, 2021.
Actual Expenses
The table provides information about actual account values and actual expenses for each class. You may use the information, together with the amount you invested, to estimate the expenses that you paid over the period. First, identify the share class you own. Then simply divide your account value by $1,000 (for example, an $8,600 account value divided by $1,000 = 8.6), then multiply the result by the number under the heading “Expenses Paid During Period” to estimate the expenses you paid on your account during this period.
Hypothetical Example for Comparison Purposes
The table also provides information about hypothetical account values and hypothetical expenses based on the actual expense ratio of each class of your fund and an assumed rate of return of 5% per year before expenses, which is not the actual return of a fund’s share class. The hypothetical account values and expenses may not be used to estimate the actual ending account balance or expenses you paid for the period. You may use this information to compare the ongoing costs of investing in your fund and other funds. To do so, compare this 5% hypothetical example with the 5% hypothetical examples that appear in the shareholder reports of the other funds.
Please note that the expenses shown in the table are meant to highlight your ongoing costs only and do not reflect any transactional costs, such as sales charges (loads) or redemption/exchange fees. Therefore, the table is useful in comparing ongoing costs only, and will not help you determine the relative total costs of owning different funds. In addition, if these transactional costs were included, your costs would have been higher.
| | | | | | | | | | | | | | |
| Beginning
Account Value
7/1/21 | Ending
Account Value
12/31/21 | Expenses Paid During Period(1) 7/1/21 - 12/31/21 | Annualized Expense Ratio(1) |
| Actual | | | | |
| Class I | $1,000 | $1,049.40 | $3.77 | 0.73% |
| Class II | $1,000 | $1,048.50 | $4.54 | 0.88% |
| Hypothetical | | | | |
| Class I | $1,000 | $1,021.53 | $3.72 | 0.73% |
| Class II | $1,000 | $1,020.77 | $4.48 | 0.88% |
(1)Expenses are equal to the class's annualized expense ratio listed in the table above, multiplied by the average account value over the period, multiplied by 184, the number of days in the most recent fiscal half-year, divided by 365, to reflect the one-half year period. Annualized expense ratio reflects actual expenses, including any applicable fee waivers or expense reimbursements and excluding any acquired fund fees and expenses.
DECEMBER 31, 2021
| | | | | | | | |
| Shares | Value |
| COMMON STOCKS — 97.7% | | |
| Aerospace and Defense — 1.9% | | |
| BAE Systems plc | 687,160 | | $ | 5,124,283 | |
| Raytheon Technologies Corp. | 92,620 | | 7,970,877 | |
| Thales SA | 61,690 | | 5,247,754 | |
| | 18,342,914 | |
| Airlines — 0.7% | | |
Southwest Airlines Co.(1) | 167,557 | | 7,178,142 | |
| Auto Components — 0.9% | | |
| BorgWarner, Inc. | 186,379 | | 8,400,102 | |
| Automobiles — 1.3% | | |
General Motors Co.(1) | 132,124 | | 7,746,430 | |
| Honda Motor Co. Ltd. | 174,500 | | 4,964,653 | |
| | 12,711,083 | |
| Banks — 12.1% | | |
| Bank of America Corp. | 432,250 | | 19,230,802 | |
| Comerica, Inc. | 40,892 | | 3,557,604 | |
| JPMorgan Chase & Co. | 163,859 | | 25,947,073 | |
| M&T Bank Corp. | 41,214 | | 6,329,646 | |
| Prosperity Bancshares, Inc. | 56,600 | | 4,092,180 | |
| Royal Bank of Canada | 66,220 | | 7,027,973 | |
| Truist Financial Corp. | 160,150 | | 9,376,783 | |
| U.S. Bancorp | 432,512 | | 24,294,199 | |
| Wells Fargo & Co. | 370,192 | | 17,761,812 | |
| | 117,618,072 | |
| Capital Markets — 3.7% | | |
| Bank of New York Mellon Corp. (The) | 271,090 | | 15,744,907 | |
| Invesco Ltd. | 320,106 | | 7,368,840 | |
| Northern Trust Corp. | 56,397 | | 6,745,645 | |
| State Street Corp. | 68,640 | | 6,383,520 | |
| | 36,242,912 | |
| Communications Equipment — 3.5% | | |
| Cisco Systems, Inc. | 443,603 | | 28,111,122 | |
F5, Inc.(1) | 24,266 | | 5,938,133 | |
| | 34,049,255 | |
| Containers and Packaging — 0.9% | | |
| Sonoco Products Co. | 153,041 | | 8,859,543 | |
| Diversified Financial Services — 3.9% | | |
Berkshire Hathaway, Inc., Class A(1) | 50 | | 22,533,100 | |
Berkshire Hathaway, Inc., Class B(1) | 50,934 | | 15,229,266 | |
| | 37,762,366 | |
| Diversified Telecommunication Services — 4.8% | | |
| AT&T, Inc. | 1,044,544 | | 25,695,782 | |
| Verizon Communications, Inc. | 415,101 | | 21,568,648 | |
| | 47,264,430 | |
| Electric Utilities — 1.3% | | |
| Edison International | 104,760 | | 7,149,870 | |
| | | | | | | | |
| Shares | Value |
| Pinnacle West Capital Corp. | 83,750 | | $ | 5,911,913 | |
| | 13,061,783 | |
| Electrical Equipment — 2.4% | | |
| Emerson Electric Co. | 92,559 | | 8,605,210 | |
| Hubbell, Inc. | 41,195 | | 8,579,683 | |
| nVent Electric plc | 169,508 | | 6,441,304 | |
| | 23,626,197 | |
| Electronic Equipment, Instruments and Components — 0.4% | | |
| Anritsu Corp. | 267,700 | | 4,134,352 | |
| Energy Equipment and Services — 2.7% | | |
| Baker Hughes Co. | 414,026 | | 9,961,466 | |
| Halliburton Co. | 197,200 | | 4,509,964 | |
| Schlumberger NV | 388,901 | | 11,647,585 | |
| | 26,119,015 | |
| Entertainment — 1.4% | | |
Walt Disney Co. (The)(1) | 88,140 | | 13,652,005 | |
| Equity Real Estate Investment Trusts (REITs) — 1.8% | | |
| Equinix, Inc. | 4,570 | | 3,865,489 | |
| Healthpeak Properties, Inc. | 175,810 | | 6,344,983 | |
| Weyerhaeuser Co. | 175,190 | | 7,214,324 | |
| | 17,424,796 | |
| Food and Staples Retailing — 1.9% | | |
| Koninklijke Ahold Delhaize NV | 275,340 | | 9,448,660 | |
| Walmart, Inc. | 60,578 | | 8,765,031 | |
| | 18,213,691 | |
| Food Products — 4.7% | | |
| Conagra Brands, Inc. | 413,260 | | 14,112,829 | |
| Danone SA | 137,120 | | 8,523,305 | |
| JDE Peet's NV | 45,637 | | 1,412,554 | |
| Kellogg Co. | 113,277 | | 7,297,304 | |
| Mondelez International, Inc., Class A | 140,236 | | 9,299,049 | |
| Orkla ASA | 488,290 | | 4,894,403 | |
| | 45,539,444 | |
| Gas Utilities — 0.5% | | |
| Atmos Energy Corp. | 48,674 | | 5,099,575 | |
| Health Care Equipment and Supplies — 4.1% | | |
| Medtronic plc | 202,887 | | 20,988,660 | |
| Zimmer Biomet Holdings, Inc. | 150,203 | | 19,081,789 | |
| | 40,070,449 | |
| Health Care Providers and Services — 5.5% | | |
| Cardinal Health, Inc. | 353,710 | | 18,212,528 | |
| Cigna Corp. | 37,800 | | 8,680,014 | |
| CVS Health Corp. | 95,790 | | 9,881,697 | |
| McKesson Corp. | 35,720 | | 8,878,920 | |
| Universal Health Services, Inc., Class B | 60,450 | | 7,837,947 | |
| | 53,491,106 | |
| Hotels, Restaurants and Leisure — 0.7% | | |
| Sodexo SA | 73,600 | | 6,452,361 | |
| Household Products — 0.9% | | |
| Procter & Gamble Co. (The) | 50,826 | | 8,314,117 | |
| Industrial Conglomerates — 3.4% | | |
| General Electric Co. | 246,188 | | 23,257,380 | |
| | | | | | | | |
| Shares | Value |
| Siemens AG | 59,330 | | $ | 10,276,121 | |
| | 33,533,501 | |
| Insurance — 3.5% | | |
| Aflac, Inc. | 89,130 | | 5,204,301 | |
| Allstate Corp. (The) | 32,920 | | 3,873,038 | |
| Chubb Ltd. | 63,009 | | 12,180,270 | |
| MetLife, Inc. | 77,289 | | 4,829,789 | |
| Reinsurance Group of America, Inc. | 74,661 | | 8,174,633 | |
| | 34,262,031 | |
| Leisure Products — 0.5% | | |
Mattel, Inc.(1) | 214,893 | | 4,633,093 | |
| Machinery — 0.4% | | |
| IMI plc | 176,996 | | 4,174,270 | |
| Metals and Mining — 0.7% | | |
| BHP Group Ltd. | 223,690 | | 6,753,587 | |
| Multi-Utilities — 0.6% | | |
| CMS Energy Corp. | 88,880 | | 5,781,644 | |
| Multiline Retail — 0.6% | | |
Dollar Tree, Inc.(1) | 43,290 | | 6,083,111 | |
| Oil, Gas and Consumable Fuels — 7.0% | | |
| Chevron Corp. | 212,367 | | 24,921,267 | |
| ConocoPhillips | 93,714 | | 6,764,277 | |
| Devon Energy Corp. | 171,187 | | 7,540,787 | |
EQT Corp.(1) | 242,181 | | 5,281,968 | |
| Exxon Mobil Corp. | 120,200 | | 7,355,038 | |
| Royal Dutch Shell plc, B Shares | 286,210 | | 6,284,190 | |
TotalEnergies SE(2) | 197,229 | | 10,038,997 | |
| | 68,186,524 | |
| Paper and Forest Products — 0.8% | | |
| Mondi plc | 308,300 | | 7,647,045 | |
| Personal Products — 1.3% | | |
| Unilever plc | 228,210 | | 12,233,477 | |
| Pharmaceuticals — 8.5% | | |
| Bristol-Myers Squibb Co. | 153,510 | | 9,571,349 | |
| Johnson & Johnson | 179,942 | | 30,782,678 | |
| Merck & Co., Inc. | 267,402 | | 20,493,689 | |
| Pfizer, Inc. | 217,189 | | 12,825,010 | |
| Roche Holding AG | 9,260 | | 3,841,614 | |
Teva Pharmaceutical Industries Ltd., ADR(1) | 621,616 | | 4,979,144 | |
| | 82,493,484 | |
| Road and Rail — 1.0% | | |
| Heartland Express, Inc. | 600,749 | | 10,104,598 | |
| Semiconductors and Semiconductor Equipment — 2.6% | | |
| Intel Corp. | 364,035 | | 18,747,802 | |
| QUALCOMM, Inc. | 34,170 | | 6,248,668 | |
| | 24,996,470 | |
| Software — 1.2% | | |
| Open Text Corp. | 146,410 | | 6,951,547 | |
| Oracle Corp. (New York) | 59,193 | | 5,162,221 | |
| | 12,113,768 | |
| Specialty Retail — 0.9% | | |
| Advance Auto Parts, Inc. | 35,541 | | 8,525,575 | |
| | | | | | | | |
| Shares | Value |
| Technology Hardware, Storage and Peripherals — 0.6% | | |
| HP, Inc. | 143,977 | | $ | 5,423,614 | |
| Textiles, Apparel and Luxury Goods — 1.1% | | |
| Ralph Lauren Corp. | 43,960 | | 5,225,086 | |
| Tapestry, Inc. | 145,334 | | 5,900,560 | |
| | 11,125,646 | |
| Trading Companies and Distributors — 1.0% | | |
| MSC Industrial Direct Co., Inc., Class A | 115,902 | | 9,742,722 | |
TOTAL COMMON STOCKS (Cost $676,616,732) | | 951,441,870 | |
| TEMPORARY CASH INVESTMENTS — 2.2% |
|
|
| Repurchase Agreement, BMO Capital Markets Corp., (collateralized by various U.S. Treasury obligations, 2.00% - 2.375%, 4/30/24 - 5/15/51, valued at $4,142,219), in a joint trading account at 0.01%, dated 12/31/21, due 1/3/22 (Delivery value $4,060,099) | | 4,060,096 | |
| Repurchase Agreement, Fixed Income Clearing Corp., (collateralized by various U.S. Treasury obligations, 3.125%, 8/15/44, valued at $13,809,895), at 0.01%, dated 12/31/21, due 1/3/22 (Delivery value $13,539,011) | | 13,539,000 | |
| State Street Institutional U.S. Government Money Market Fund, Premier Class | 3,517,995 | | 3,517,995 | |
TOTAL TEMPORARY CASH INVESTMENTS (Cost $21,117,091) | | 21,117,091 | |
TOTAL INVESTMENT SECURITIES — 99.9% (Cost $697,733,823) |
| 972,558,961 | |
| OTHER ASSETS AND LIABILITIES — 0.1% |
| 1,392,329 | |
| TOTAL NET ASSETS — 100.0% |
| $ | 973,951,290 | |
| | | | | | | | | | | | | | | | | | | | |
| FORWARD FOREIGN CURRENCY EXCHANGE CONTRACTS |
| Currency Purchased | Currency Sold | Counterparty | Settlement Date | Unrealized Appreciation
(Depreciation) |
| USD | 4,852,899 | | AUD | 6,821,427 | | Bank of America N.A. | 3/31/22 | $ | (111,186) | |
| USD | 5,047,197 | | CAD | 6,529,458 | | UBS AG | 3/31/22 | (113,533) | |
| CHF | 675,892 | | USD | 738,622 | | Morgan Stanley | 3/31/22 | 4,842 | |
| USD | 3,605,996 | | CHF | 3,314,992 | | Morgan Stanley | 3/31/22 | (40,413) | |
| USD | 46,201,808 | | EUR | 40,801,703 | | Credit Suisse AG | 3/31/22 | (335,758) | |
| USD | 1,341,326 | | EUR | 1,182,445 | | UBS AG | 3/31/22 | (7,347) | |
| USD | 16,901,102 | | GBP | 12,782,465 | | JPMorgan Chase Bank N.A. | 3/31/22 | (393,977) | |
| JPY | 25,953,450 | | USD | 228,490 | | Bank of America N.A. | 3/31/22 | (2,693) | |
| USD | 6,867,008 | | JPY | 779,182,200 | | Bank of America N.A. | 3/31/22 | 88,072 | |
| USD | 224,625 | | JPY | 25,828,500 | | Bank of America N.A. | 3/31/22 | (85) | |
| USD | 3,469,496 | | NOK | 31,406,813 | | UBS AG | 3/31/22 | (91,023) | |
| USD | 104,562 | | NOK | 922,868 | | UBS AG | 3/31/22 | (61) | |
| | | | | | $ | (1,003,162) | |
| | | | | | | | |
| NOTES TO SCHEDULE OF INVESTMENTS |
| ADR | - | American Depositary Receipt |
| AUD | - | Australian Dollar |
| CAD | - | Canadian Dollar |
| CHF | - | Swiss Franc |
| EUR | - | Euro |
| GBP | - | British Pound |
| JPY | - | Japanese Yen |
| NOK | - | Norwegian Krone |
| USD | - | United States Dollar |
(1)Non-income producing.
(2)Security, or a portion thereof, is on loan. At the period end, the aggregate value of securities on loan was $9,838,196. The amount of securities on loan indicated may not correspond with the securities on loan identified because securities with pending sales are in the process of recall from the brokers. At the period end, the aggregate value of the collateral held by the fund was $10,384,702, all of which is securities collateral.
See Notes to Financial Statements.
| | |
| Statement of Assets and Liabilities |
| | | | | |
| DECEMBER 31, 2021 | |
| Assets | |
| Investment securities, at value (cost of $697,733,823) — including $9,838,196 of securities on loan | $ | 972,558,961 | |
| Cash | 88,162 | |
| Receivable for capital shares sold | 2,954,170 | |
| Unrealized appreciation on forward foreign currency exchange contracts | 92,914 | |
| Dividends and interest receivable | 1,515,353 | |
| Securities lending receivable | 3,191 | |
| 977,212,751 | |
| |
| Liabilities | |
| Payable for capital shares redeemed | 1,507,790 | |
| Unrealized depreciation on forward foreign currency exchange contracts | 1,096,076 | |
| Accrued management fees | 545,123 | |
| Distribution fees payable | 112,472 | |
| 3,261,461 | |
| |
| Net Assets | $ | 973,951,290 | |
| |
| Net Assets Consist of: | |
| Capital (par value and paid-in surplus) | $ | 650,938,737 | |
| Distributable earnings | 323,012,553 | |
| $ | 973,951,290 | |
| | | | | | | | | | | |
| Net Assets | Shares Outstanding | Net Asset Value Per Share |
| Class I, $0.01 Par Value | $430,054,913 | 31,449,698 | $13.67 |
| Class II, $0.01 Par Value | $543,896,377 | 39,728,229 | $13.69 |
See Notes to Financial Statements.
| | | | | |
| YEAR ENDED DECEMBER 31, 2021 | |
| Investment Income (Loss) | |
| Income: | |
| Dividends (net of foreign taxes withheld of $387,653) | $ | 23,676,975 | |
| Securities lending, net | 32,474 | |
| Interest | 4,767 | |
| 23,714,216 | |
| |
| Expenses: | |
| Management fees | 8,079,626 | |
| Distribution fees - Class II | 1,305,456 | |
| Directors' fees and expenses | 23,037 | |
| Other expenses | 5,134 | |
| 9,413,253 | |
Fees waived(1) | (1,746,106) | |
| 7,667,147 | |
| |
| Net investment income (loss) | 16,047,069 | |
| |
| Realized and Unrealized Gain (Loss) | |
| Net realized gain (loss) on: | |
| Investment transactions | 106,876,651 | |
| Forward foreign currency exchange contract transactions | 5,469,067 | |
| Foreign currency translation transactions | (18,576) | |
| 112,327,142 | |
| |
| Change in net unrealized appreciation (depreciation) on: | |
| Investments | 69,454,904 | |
| Forward foreign currency exchange contracts | (730,780) | |
| Translation of assets and liabilities in foreign currencies | (10,462) | |
| 68,713,662 | |
| |
| Net realized and unrealized gain (loss) | 181,040,804 | |
| |
| Net Increase (Decrease) in Net Assets Resulting from Operations | $ | 197,087,873 | |
(1)Amount consists of $780,760 and $965,346 for Class I and Class II, respectively.
See Notes to Financial Statements.
| | |
| Statement of Changes in Net Assets |
| | | | | | | | |
| YEARS ENDED DECEMBER 31, 2021 AND DECEMBER 31, 2020 |
| Increase (Decrease) in Net Assets | December 31, 2021 | December 31, 2020 |
| Operations | | |
| Net investment income (loss) | $ | 16,047,069 | | $ | 16,693,354 | |
| Net realized gain (loss) | 112,327,142 | | (8,518,950) | |
| Change in net unrealized appreciation (depreciation) | 68,713,662 | | (6,256,984) | |
| Net increase (decrease) in net assets resulting from operations | 197,087,873 | | 1,917,420 | |
| | |
| Distributions to Shareholders | | |
| From earnings: | | |
| Class I | (7,286,263) | | (16,985,871) | |
| Class II | (8,356,267) | | (18,974,868) | |
| Decrease in net assets from distributions | (15,642,530) | | (35,960,739) | |
| | |
| Capital Share Transactions | | |
| Net increase (decrease) in net assets from capital share transactions (Note 5) | (26,279,332) | | (35,137,220) | |
| | |
| Net increase (decrease) in net assets | 155,166,011 | | (69,180,539) | |
| | |
| Net Assets | | |
| Beginning of period | 818,785,279 | | 887,965,818 | |
| End of period | $ | 973,951,290 | | $ | 818,785,279 | |
See Notes to Financial Statements.
| | |
| Notes to Financial Statements |
DECEMBER 31, 2021
1. Organization
American Century Variable Portfolios, Inc. (the corporation) is registered under the Investment Company Act of 1940, as amended (the 1940 Act), as an open-end management investment company and is organized as a Maryland corporation. VP Value Fund (the fund) is one fund in a series issued by the corporation. The fund's investment objective is to seek long-term capital growth. Income is a secondary objective. The fund offers Class I and Class II.
2. Significant Accounting Policies
The following is a summary of significant accounting policies consistently followed by the fund in preparation of its financial statements. The fund is an investment company and follows accounting and reporting guidance in accordance with accounting principles generally accepted in the United States of America. This may require management to make certain estimates and assumptions at the date of the financial statements. Actual results could differ from these estimates. Management evaluated the impact of events or transactions occurring through the date the financial statements were issued that would merit recognition or disclosure.
Investment Valuations — The fund determines the fair value of its investments and computes its net asset value (NAV) per share at the close of regular trading (usually 4 p.m. Eastern time) on the New York Stock Exchange (NYSE) on each day the NYSE is open. The Board of Directors has adopted valuation policies and procedures to guide the investment advisor in the fund’s investment valuation process and to provide methodologies for the oversight of the fund’s pricing function.
Equity securities that are listed or traded on a domestic securities exchange are valued at the last reported sales price or at the official closing price as provided by the exchange. Equity securities traded on foreign securities exchanges are generally valued at the closing price of such securities on the exchange where primarily traded or at the close of the NYSE, if that is earlier. If no last sales price is reported, or if local convention or regulation so provides, the mean of the latest bid and asked prices may be used. Securities traded over-the-counter are valued at the mean of the latest bid and asked prices, the last sales price, or the official closing price. Equity securities initially expressed in local currencies are translated into U.S. dollars at the mean of the appropriate currency exchange rate at the close of the NYSE as provided by an independent pricing service.
Open-end management investment companies are valued at the reported NAV per share. Repurchase agreements are valued at cost, which approximates fair value. Forward foreign currency exchange contracts are valued at the mean of the appropriate forward exchange rate at the close of the NYSE as provided by an independent pricing service.
If the fund determines that the market price for an investment is not readily available or the valuation methods mentioned above do not reflect an investment’s fair value, such investment is valued as determined in good faith by the Board of Directors or its delegate, in accordance with policies and procedures adopted by the Board of Directors. In its determination of fair value, the fund may review several factors including, but not limited to, market information regarding the specific investment or comparable investments and correlation with other investment types, futures indices or general market indicators. Circumstances that may cause the fund to use these procedures to value an investment include, but are not limited to: an investment has been declared in default or is distressed; trading in a security has been suspended during the trading day or a security is not actively trading on its principal exchange; prices received from a regular pricing source are deemed unreliable; or there is a foreign market holiday and no trading occurred.
The fund monitors for significant events occurring after the close of an investment’s primary exchange but before the fund’s NAV per share is determined. Significant events may include, but are not limited to: corporate announcements and transactions; governmental action and political unrest that could impact a specific investment or an investment sector; or armed conflicts, natural disasters and similar events that could affect investments in a specific country or region. The fund also monitors for significant fluctuations between domestic and foreign markets, as evidenced by the U.S. market or such other indicators that the Board of Directors, or its delegate, deems appropriate. The fund may apply a model-derived factor to the closing price of equity securities traded on foreign securities exchanges. The factor is based on observable market data as provided by an independent pricing service.
Security Transactions — Security transactions are accounted for as of the trade date. Net realized gains and losses are determined on the identified cost basis, which is also used for federal income tax purposes.
Investment Income — Dividend income less foreign taxes withheld, if any, is recorded as of the ex-dividend date. Distributions received on securities that represent a return of capital or long-term capital gain are recorded as a reduction of cost of investments and/or as a realized gain. The fund may estimate the components of distributions received that may be considered nontaxable distributions or long-term capital gain distributions for income tax purposes. Interest income is recorded on the accrual basis and includes accretion of discounts and amortization of premiums. Securities lending income is net of fees and rebates earned by the lending agent for its services.
Foreign Currency Translations — All assets and liabilities initially expressed in foreign currencies are translated into U.S. dollars at prevailing exchange rates at period end. The fund may enter into spot foreign currency exchange contracts to facilitate transactions denominated in a foreign currency. Purchases and sales of investment securities, dividend and interest income, spot foreign currency exchange contracts, and expenses are translated at the rates of exchange prevailing on the respective dates of such transactions. Net realized and unrealized foreign currency exchange gains or losses related to investment securities are a component of net realized gain (loss) on investment transactions and change in net unrealized appreciation (depreciation) on investments, respectively.
Repurchase Agreements — The fund may enter into repurchase agreements with institutions that American Century Investment Management, Inc. (ACIM) (the investment advisor) has determined are creditworthy pursuant to criteria adopted by the Board of Directors. The fund requires that the collateral, represented by securities, received in a repurchase transaction be transferred to the custodian in a manner sufficient to enable the fund to obtain those securities in the event of a default under the repurchase agreement. ACIM monitors, on a daily basis, the securities transferred to ensure the value, including accrued interest, of the securities under each repurchase agreement is equal to or greater than amounts owed to the fund under each repurchase agreement.
Joint Trading Account — Pursuant to an Exemptive Order issued by the Securities and Exchange Commission, the fund, along with certain other funds in the American Century Investments family of funds, may transfer uninvested cash balances into a joint trading account. These balances are invested in one or more repurchase agreements that are collateralized by U.S. Treasury or Agency obligations.
Segregated Assets — In accordance with the 1940 Act, the fund segregates assets on its books and records to cover certain types of investment securities and other financial instruments. ACIM monitors, on a daily basis, the securities segregated to ensure the fund designates a sufficient amount of liquid assets, marked-to-market daily. The fund may also receive assets or be required to pledge assets at the custodian bank or with a broker for collateral requirements.
Income Tax Status — It is the fund’s policy to distribute substantially all net investment income and net realized gains to shareholders and to otherwise qualify as a regulated investment company under provisions of the Internal Revenue Code. Accordingly, no provision has been made for income taxes. The fund files U.S. federal, state, local and non-U.S. tax returns as applicable. The fund's tax returns are subject to examination by the relevant taxing authority until expiration of the applicable statute of limitations, which is generally three years from the date of filing but can be longer in certain jurisdictions. At this time, management believes there are no uncertain tax positions which, based on their technical merit, would not be sustained upon examination and for which it is reasonably possible that the total amounts of unrecognized tax benefits will significantly change in the next twelve months.
Multiple Class — All shares of the fund represent an equal pro rata interest in the net assets of the class to which such shares belong, and have identical voting, dividend, liquidation and other rights and the same terms and conditions, except for class specific expenses and exclusive rights to vote on matters affecting only individual classes. Income, non-class specific expenses, and realized and unrealized capital gains and losses of the fund are allocated to each class of shares based on their relative net assets.
Distributions to Shareholders — Distributions from net investment income, if any, are generally declared and paid quarterly. Distributions from net realized gains, if any, are generally declared and paid annually.
Indemnifications — Under the corporation’s organizational documents, its officers and directors are indemnified against certain liabilities arising out of the performance of their duties to the fund. In addition, in the normal course of business, the fund enters into contracts that provide general indemnifications. The maximum exposure under these arrangements is unknown as this would involve future claims that may be made against a fund. The risk of material loss from such claims is considered by management to be remote.
Securities Lending — Securities are lent to qualified financial institutions and brokers. State Street Bank & Trust Co. serves as securities lending agent to the fund pursuant to a Securities Lending Agreement. The lending of securities exposes the fund to risks such as: the borrowers may fail to return the loaned securities, the borrowers may not be able to provide additional collateral, the fund may experience delays in recovery of the loaned securities or delays in access to collateral, or the fund may experience losses related to the investment collateral. To minimize certain risks, loan counterparties pledge collateral in the form of cash and/or securities. The lending agent has agreed to indemnify the fund in the case of default of any securities borrowed. Cash collateral received is invested in the State Street Navigator Securities Lending Government Money Market Portfolio, a money market mutual fund registered under the 1940 Act. The loans may also be secured by U.S. government securities in an amount at least equal to the market value of the securities loaned, plus accrued interest and dividends, determined on a daily basis and adjusted accordingly. By lending securities, the fund seeks to increase its net investment income through the receipt of interest and fees. Such income is reflected separately within the Statement of Operations. The value of loaned securities and related collateral outstanding at period end, if any, are shown on a gross basis within the Schedule of Investments and Statement of Assets and Liabilities.
3. Fees and Transactions with Related Parties
Certain officers and directors of the corporation are also officers and/or directors of American Century Companies, Inc. (ACC). The corporation’s investment advisor, ACIM, the corporation's distributor, American Century Investment Services, Inc. (ACIS), and the corporation’s transfer agent, American Century Services, LLC, are wholly owned, directly or indirectly, by ACC.
Management Fees — The corporation has entered into a management agreement with ACIM, under which ACIM provides the fund with investment advisory and management services in exchange for a single, unified management fee (the fee) per class. The agreement provides that ACIM will pay all expenses of managing and operating the fund, except brokerage expenses, taxes, interest, fees and expenses of the independent directors (including legal counsel fees), extraordinary expenses, and expenses incurred in connection with the provision of shareholder services and distribution services under a plan adopted pursuant to Rule 12b-1 under the 1940 Act. The fee is computed and accrued daily based on each class’s daily net assets and paid monthly in arrears. The difference in the fee among the classes is a result of their separate arrangements for non-Rule 12b-1 shareholder services. It is not the result of any difference in advisory or custodial fees or other expenses related to the management of the fund’s assets, which do not vary by class. From January 1, 2021 through July 31, 2021 the rate of the fee was determined by applying a fee rate calculation formula. This formula took into account the fund’s assets as well as certain assets, if any, of other clients of the investment advisor outside the American Century Investments family of funds (such as subadvised funds and separate accounts) that use very similar investment teams and strategies (strategy assets). Effective August 1, 2021, the stepped annual management fee schedule was terminated and an annual management fee was adopted. From January 1, 2021 through July 31, 2021, the investment advisor agreed to waive 0.25% of the fund's management fee. Effective August 1, 2021, the investment advisor agreed to waive 0.10% of the fund's management fee. The investment advisor expects this waiver to continue until July 31, 2022 and cannot terminate it prior to such date without the approval of the Board of Directors.
The annual management fee and the effective annual management fee before and after waiver for each class for the period ended December 31, 2021 are as follows:
| | | | | | | | | | | |
| | Effective Annual Management Fee |
| Annual Management Fee* | Before Waiver | After Waiver |
| Class I | 0.83% | 0.92% | 0.73% |
| Class II | 0.73% | 0.82% | 0.63% |
*Prior to August 1, 2021, the management fee schedule range was 0.90% to 1.00% for Class I and 0.80% to 0.90% for Class II.
Distribution Fees — The Board of Directors has adopted the Master Distribution Plan (the plan) for Class II, pursuant to Rule 12b-1 of the 1940 Act. The plan provides that Class II will pay ACIS an annual distribution fee equal to 0.25%. The fee is computed and accrued daily based on the Class II daily net assets and paid monthly in arrears. The distribution fee provides compensation for expenses incurred in connection with distributing shares of Class II including, but not limited to, payments to brokers, dealers, and financial institutions that have entered into sales agreements with respect to shares of the fund. Fees incurred under the plan during the period ended December 31, 2021 are detailed in the Statement of Operations.
Directors' Fees and Expenses — The Board of Directors is responsible for overseeing the investment advisor’s management and operations of the fund. The directors receive detailed information about the fund and its investment advisor regularly throughout the year, and meet at least quarterly with management of the investment advisor to review reports about fund operations. The fund’s officers do not receive compensation from the fund.
Interfund Transactions — The fund may enter into security transactions with other American Century Investments funds and other client accounts of the investment advisor, in accordance with the 1940 Act rules and procedures adopted by the Board of Directors. The rules and procedures require, among other things, that these transactions be effected at the independent current market price of the security. During the period, the interfund purchases and sales were $1,378,083 and $440,742, respectively. The effect of interfund transactions on the Statement of Operations was $(84,562) in net realized gain (loss) on investment transactions.
4. Investment Transactions
Purchases and sales of investment securities, excluding short-term investments, for the period ended December 31, 2021 were $439,868,533 and $461,935,852, respectively.
5. Capital Share Transactions
Transactions in shares of the fund were as follows:
| | | | | | | | | | | | | | |
| Year ended
December 31, 2021 | Year ended
December 31, 2020 |
| Shares | Amount | Shares | Amount |
| Class I/Shares Authorized | 600,000,000 | | | 600,000,000 | | |
| Sold | 3,024,457 | | $ | 39,211,704 | | 4,214,178 | | $ | 39,736,970 | |
| Issued in reinvestment of distributions | 540,169 | | 7,107,637 | | 1,966,537 | | 16,497,988 | |
| Redeemed | (5,794,184) | | (74,979,295) | | (9,405,931) | | (93,999,897) | |
| (2,229,558) | | (28,659,954) | | (3,225,216) | | (37,764,939) | |
| Class II/Shares Authorized | 350,000,000 | | | 350,000,000 | | |
| Sold | 6,460,146 | | 83,941,248 | | 6,169,177 | | 59,368,566 | |
| Issued in reinvestment of distributions | 634,285 | | 8,356,267 | | 2,260,685 | | 18,974,868 | |
| Redeemed | (6,912,649) | | (89,916,893) | | (7,679,501) | | (75,715,715) | |
| 181,782 | | 2,380,622 | | 750,361 | | 2,627,719 | |
| Net increase (decrease) | (2,047,776) | | $ | (26,279,332) | | (2,474,855) | | $ | (35,137,220) | |
6. Fair Value Measurements
The fund’s investments valuation process is based on several considerations and may use multiple inputs to determine the fair value of the investments held by the fund. In conformity with accounting principles generally accepted in the United States of America, the inputs used to determine a valuation are classified into three broad levels.
•Level 1 valuation inputs consist of unadjusted quoted prices in an active market for identical investments.
•Level 2 valuation inputs consist of direct or indirect observable market data (including quoted prices for comparable investments, evaluations of subsequent market events, interest rates, prepayment speeds, credit risk, etc.). These inputs also consist of quoted prices for identical investments initially expressed in local currencies that are adjusted through translation into U.S. dollars.
•Level 3 valuation inputs consist of unobservable data (including a fund’s own assumptions).
The level classification is based on the lowest level input that is significant to the fair valuation measurement. The valuation inputs are not necessarily an indication of the risks associated with investing in these securities or other financial instruments.
The following is a summary of the level classifications as of period end. The Schedule of Investments provides additional information on the fund’s portfolio holdings.
| | | | | | | | | | | |
| Level 1 | Level 2 | Level 3 |
| Assets | | | |
| Investment Securities | | | |
| Common Stocks | | | |
| Aerospace and Defense | $ | 7,970,877 | | $ | 10,372,037 | | — | |
| Automobiles | 7,746,430 | | 4,964,653 | | — | |
| Banks | 110,590,099 | | 7,027,973 | | — | |
| Electronic Equipment, Instruments and Components | — | | 4,134,352 | | — | |
| Food and Staples Retailing | 8,765,031 | | 9,448,660 | | — | |
| Food Products | 30,709,182 | | 14,830,262 | | — | |
| Hotels, Restaurants and Leisure | — | | 6,452,361 | | — | |
| Industrial Conglomerates | 23,257,380 | | 10,276,121 | | — | |
| Machinery | — | | 4,174,270 | | — | |
| Metals and Mining | — | | 6,753,587 | | — | |
| Oil, Gas and Consumable Fuels | 51,863,337 | | 16,323,187 | | — | |
| Paper and Forest Products | — | | 7,647,045 | | — | |
| Personal Products | — | | 12,233,477 | | — | |
| Pharmaceuticals | 78,651,870 | | 3,841,614 | | — | |
| Other Industries | 513,408,065 | | — | | — | |
| Temporary Cash Investments | 3,517,995 | | 17,599,096 | | — | |
| $ | 836,480,266 | | $ | 136,078,695 | | — | |
| Other Financial Instruments | | | |
| Forward Foreign Currency Exchange Contracts | — | | $ | 92,914 | | — | |
| | | |
| Liabilities | | | |
| Other Financial Instruments | | | |
| Forward Foreign Currency Exchange Contracts | — | | $ | 1,096,076 | | — | |
7. Derivative Instruments
Foreign Currency Risk — The fund is subject to foreign currency exchange rate risk in the normal course of pursuing its investment objectives. The value of foreign investments held by a fund may be significantly affected by changes in foreign currency exchange rates. The dollar value of a foreign security generally decreases when the value of the dollar rises against the foreign currency in which the security is denominated and tends to increase when the value of the dollar declines against such foreign currency. A fund may enter into forward foreign currency exchange contracts to reduce a fund's exposure to foreign currency exchange rate fluctuations. The net U.S. dollar value of foreign currency underlying all contractual commitments held by a fund and the resulting unrealized appreciation or depreciation are determined daily. Realized gain or loss is recorded upon settlement of the contract. Net realized and unrealized gains or losses occurring during the holding period of forward foreign currency exchange contracts are a component of net realized gain (loss) on forward foreign currency exchange contract transactions and change in net unrealized appreciation (depreciation) on forward foreign currency exchange contracts, respectively. A fund bears the risk of an unfavorable change in the foreign currency exchange rate underlying the forward contract. Additionally, losses, up to the fair value, may arise if the counterparties do not perform under the contract terms. The fund's average U.S. dollar exposure to foreign currency risk derivative instruments held during the period was $88,892,435.
The value of foreign currency risk derivative instruments as of December 31, 2021, is disclosed on the Statement of Assets and Liabilities as an asset of $92,914 in unrealized appreciation on forward foreign currency exchange contracts and a liability of $1,096,076 in unrealized depreciation on forward foreign currency exchange contracts. For the year ended December 31, 2021, the effect of foreign currency risk derivative instruments on the Statement of Operations was $5,469,067 in net realized gain (loss) on forward foreign currency exchange contract transactions and $(730,780) in change in net unrealized appreciation (depreciation) on forward foreign currency exchange contracts.
8. Risk Factors
The value of the fund’s shares will go up and down, sometimes rapidly or unpredictably, based on the performance of the securities owned by the fund and other factors generally affecting the securities market. Market risks, including political, regulatory, economic and social developments, can affect the value of the fund’s investments. Natural disasters, public health emergencies, terrorism and other unforeseeable events may lead to increased market volatility and may have adverse long-term effects on world economies and markets generally.
There are certain risks involved in investing in foreign securities. These risks include those resulting from political events (such as civil unrest, national elections and imposition of exchange controls), social and economic events (such as labor strikes and rising inflation), and natural disasters. Securities of foreign issuers may be less liquid and more volatile. Investing a significant portion of assets in one country or region may accentuate these risks.
9. Federal Tax Information
The tax character of distributions paid during the years ended December 31, 2021 and December 31, 2020 were as follows:
| | | | | | | | |
| 2021 | 2020 |
| Distributions Paid From | | |
| Ordinary income | $ | 15,642,530 | | $ | 23,145,003 | |
| Long-term capital gains | — | | $ | 12,815,736 | |
The book-basis character of distributions made during the year from net investment income or net realized gains may differ from their ultimate characterization for federal income tax purposes. These differences reflect the differing character of certain income items and net realized gains and losses for financial statement and tax purposes, and may result in reclassification among certain capital accounts on the financial statements.
As of period end, the federal tax cost of investments and the components of distributable earnings on a tax-basis were as follows:
| | | | | |
| Federal tax cost of investments | $ | 725,933,796 | |
| Gross tax appreciation of investments | $ | 261,582,730 | |
| Gross tax depreciation of investments | (14,957,565) | |
| Net tax appreciation (depreciation) of investments | 246,625,165 | |
| Net tax appreciation (depreciation) on derivatives and translation of assets and liabilities in foreign currencies | 1,149 | |
| Net tax appreciation (depreciation) | $ | 246,626,314 | |
| Undistributed ordinary income | $ | 31,626,902 | |
| Accumulated long-term gains | $ | 44,759,337 | |
The difference between book-basis and tax-basis unrealized appreciation (depreciation) is attributable primarily to the tax deferral of losses on wash sales.
| | | | | | | | | | | | | | | | | | | | | | | | | | | | | | | | | | | | | | | | | | | | | | | |
| For a Share Outstanding Throughout the Years Ended December 31 (except as noted) |
| Per-Share Data | | | | | Ratios and Supplemental Data |
| | Income From Investment Operations: | Distributions From: | | | Ratio to Average Net Assets of: | | |
| Net Asset
Value,
Beginning
of Period | Net Investment Income (Loss)(1) | Net
Realized
and
Unrealized
Gain (Loss) | Total From Investment Operations | Net
Investment
Income | Net
Realized
Gains | Total
Distributions | Net Asset
Value, End
of Period | Total Return(2) | Operating Expenses | Operating Expenses
(before
expense
waiver) | Net
Investment Income
(Loss) | Net
Investment Income (Loss)
(before expense waiver) | Portfolio Turnover
Rate | Net Assets,
End of
Period
(in thousands) |
| Class I | | | | | | | | | | | | | | | |
| 2021 | $11.17 | 0.23 | 2.50 | 2.73 | (0.23) | — | (0.23) | $13.67 | 24.51% | 0.73% | 0.92% | 1.79% | 1.60% | 49% | $430,055 | |
| 2020 | $11.72 | 0.23 | (0.29) | (0.06) | (0.23) | (0.26) | (0.49) | $11.17 | 0.98% | 0.75% | 0.98% | 2.34% | 2.11% | 57% | $376,355 | |
| 2019 | $10.01 | 0.23 | 2.36 | 2.59 | (0.23) | (0.65) | (0.88) | $11.72 | 27.03% | 0.77% | 0.98% | 2.11% | 1.90% | 45% | $432,639 | |
| 2018 | $11.21 | 0.19 | (1.20) | (1.01) | (0.19) | —(3) | (0.19) | $10.01 | (9.15)% | 0.78% | 0.97% | 1.70% | 1.51% | 51% | $374,518 | |
| 2017 | $10.48 | 0.18 | 0.73 | 0.91 | (0.18) | — | (0.18) | $11.21 | 8.75% | 0.80% | 0.97% | 1.71% | 1.54% | 30% | $462,812 | |
| Class II | | | | | | | | | | | | | | | |
| 2021 | $11.19 | 0.21 | 2.50 | 2.71 | (0.21) | — | (0.21) | $13.69 | 24.28% | 0.88% | 1.07% | 1.64% | 1.45% | 49% | $543,896 | |
| 2020 | $11.74 | 0.21 | (0.29) | (0.08) | (0.21) | (0.26) | (0.47) | $11.19 | 0.83% | 0.90% | 1.13% | 2.19% | 1.96% | 57% | $442,431 | |
| 2019 | $10.02 | 0.21 | 2.37 | 2.58 | (0.21) | (0.65) | (0.86) | $11.74 | 26.92% | 0.92% | 1.13% | 1.96% | 1.75% | 45% | $455,327 | |
| 2018 | $11.22 | 0.18 | (1.21) | (1.03) | (0.17) | —(3) | (0.17) | $10.02 | (9.28)% | 0.93% | 1.12% | 1.55% | 1.36% | 51% | $404,210 | |
| 2017 | $10.49 | 0.17 | 0.72 | 0.89 | (0.16) | — | (0.16) | $11.22 | 8.58% | 0.95% | 1.12% | 1.56% | 1.39% | 30% | $485,136 | |
| | |
| Notes to Financial Highlights |
(1)Computed using average shares outstanding throughout the period.
(2)Total returns are calculated based on the net asset value of the last business day. Total returns for periods less than one year are not annualized. The total returns presented do not include the fees and charges assessed with investments in variable insurance products, those charges are disclosed in the separate account prospectus. The inclusion of such fees and charges would lower total return.
(3)Per-share amount was less than $0.005.
See Notes to Financial Statements.
| | |
| Report of Independent Registered Public Accounting Firm |
To the Shareholders and the Board of Directors of American Century Variable Portfolios, Inc.:
Opinion on the Financial Statements and Financial Highlights
We have audited the accompanying statement of assets and liabilities, including the schedule of investments, of VP Value Fund (the “Fund”), one of the funds constituting the American Century Variable Portfolios, Inc., as of December 31, 2021, the related statement of operations for the year then ended, the statements of changes in net assets for each of the two years in the period then ended, the financial highlights for each of the five years in the period then ended, and the related notes. In our opinion, the financial statements and financial highlights present fairly, in all material respects, the financial position of VP Value Fund of the American Century Variable Portfolios, Inc. as of December 31, 2021, and the results of its operations for the year then ended, the changes in its net assets for each of the two years in the period then ended, and the financial highlights for each of the five years in the period then ended, in conformity with accounting principles generally accepted in the United States of America.
Basis for Opinion
These financial statements and financial highlights are the responsibility of the Fund's management. Our responsibility is to express an opinion on the Fund’s financial statements and financial highlights based on our audits. We are a public accounting firm registered with the Public Company Accounting Oversight Board (United States) (PCAOB) and are required to be independent with respect to the Fund in accordance with the U.S. federal securities laws and the applicable rules and regulations of the Securities and Exchange Commission and the PCAOB.
We conducted our audits in accordance with the standards of the PCAOB. Those standards require that we plan and perform the audit to obtain reasonable assurance about whether the financial statements and financial highlights are free of material misstatement, whether due to error or fraud. The Fund is not required to have, nor were we engaged to perform, an audit of its internal control over financial reporting. As part of our audits, we are required to obtain an understanding of internal control over financial reporting but not for the purpose of expressing an opinion on the effectiveness of the Fund’s internal control over financial reporting. Accordingly, we express no such opinion.
Our audits included performing procedures to assess the risks of material misstatement of the financial statements and financial highlights, whether due to error or fraud, and performing procedures that respond to those risks. Such procedures included examining, on a test basis, evidence regarding the amounts and disclosures in the financial statements and financial highlights. Our audits also included evaluating the accounting principles used and significant estimates made by management, as well as evaluating the overall presentation of the financial statements and financial highlights. Our procedures included confirmation of securities owned as of December 31, 2021, by correspondence with the custodian and brokers; when replies were not received from brokers, we performed other auditing procedures. We believe that our audits provide a reasonable basis for our opinion.
/s/ Deloitte & Touche LLP
Kansas City, Missouri
February 10, 2022
We have served as the auditor of one or more American Century investment companies since 1997.
The Board of Directors
The individuals listed below serve as directors of the funds. Each director will continue to serve in this capacity until death, retirement, resignation or removal from office. The board has adopted a mandatory retirement age for directors who are not “interested persons,” as that term is defined in the Investment Company Act (independent directors). Independent directors shall retire on December 31 of the year in which they reach their 75th birthday.
Mr. Thomas is an “interested person” because he currently serves as President and Chief Executive Officer of American Century Companies, Inc. (ACC), the parent company of American Century Investment Management, Inc. (ACIM or the advisor). The other directors (more than three-fourths of the total number) are independent. They are not employees, directors or officers of, and have no financial interest in, ACC or any of its wholly owned, direct or indirect, subsidiaries, including ACIM, American Century Investment Services, Inc. (ACIS) and American Century Services, LLC (ACS), and they do not have any other affiliations, positions or relationships that would cause them to be considered “interested persons” under the Investment Company Act. The directors serve in this capacity for seven (in the case of Jonathan S. Thomas, 16; and Stephen E. Yates, 8) registered investment companies in the American Century Investments family of funds.
The following table presents additional information about the directors. The mailing address for each director is 4500 Main Street, Kansas City, Missouri 64111.
| | | | | | | | | | | | | | | | | |
Name
(Year of Birth) | Position(s) Held with Funds | Length of Time Served | Principal Occupation(s) During Past 5 Years | Number of American Century Portfolios Overseen by Director | Other Directorships Held During Past 5 Years |
| Independent Directors | | |
| Thomas W. Bunn (1953) | Director | Since 2017 | Retired | 72 | SquareTwo Financial |
Chris H. Cheesman
(1962)
| Director | Since 2019
| Retired. Senior Vice President & Chief Audit Executive, AllianceBernstein (1999 to 2018)
| 72 | Alleghany Corporation |
Barry Fink
(1955) | Director | Since 2012 (independent since 2016) | Retired | 72 | None |
Rajesh K. Gupta
(1960)
| Director | Since 2019
| Partner Emeritus, SeaCrest Investment Management and SeaCrest Wealth Management (2019 to Present); Chief Executive Officer and Chief Investment Officer, SeaCrest Investment Management (2006 to 2019); Chief Executive Officer and Chief Investment Officer, SeaCrest Wealth Management (2008 to 2019) | 72 | None |
| | | | | | | | | | | | | | | | | |
Name
(Year of Birth) | Position(s) Held with Funds | Length of Time Served | Principal Occupation(s) During Past 5 Years | Number of American Century Portfolios Overseen by Director | Other Directorships Held During Past 5 Years |
| Independent Directors | | |
Lynn Jenkins
(1963)
| Director | Since 2019
| Consultant, LJ Strategies (2019 to present); United States Representative, U.S. House of Representatives (2009 to 2018) | 72 | MGP Ingredients, Inc. (2019 to 2021) |
Jan M. Lewis
(1957) | Director | Since 2011 | Retired | 72 | None |
John R. Whitten(1) (1946) | Director | Since 2008 | Retired | 72 | Onto Innovation Inc. (2019 to 2020); Rudolph Technologies, Inc. (2006 to 2019) |
Stephen E. Yates
(1948) | Director and Chairman of the Board | Since 2012 (Chairman since 2018) | Retired | 108 | None |
| Interested Director | |
Jonathan S. Thomas
(1963) | Director | Since 2007 | President and Chief Executive Officer, ACC (2007 to present). Also serves as Chief Executive Officer, ACS; Director, ACC and other ACC subsidiaries | 146 | None |
(1) Effective December 31, 2021, John R. Whitten retired from the Board of Directors.
The Statement of Additional Information has additional information about the fund's directors and is available without charge, upon request, by calling 1-800-378-9878.
Officers
The following table presents certain information about the executive officers of the funds. Each officer serves as an officer for 16 (in the case of Robert J. Leach, 15) investment companies in the American Century family of funds. No officer is compensated for his or her service as an officer of the funds. The listed officers are interested persons of the funds and are appointed or re-appointed on an annual basis. The mailing address for each officer listed below is 4500 Main Street, Kansas City, Missouri 64111.
| | | | | | | | |
Name
(Year of Birth) | Offices with the Funds | Principal Occupation(s) During the Past Five Years |
Patrick Bannigan
(1965) | President since 2019 | Executive Vice President and Director, ACC (2012 to present); Chief Financial Officer, Chief Accounting Officer and Treasurer, ACC (2015 to present). Also serves as President, ACS; Vice President, ACIM; Chief Financial Officer, Chief Accounting Officer and/or Director, ACIM, ACS and other ACC subsidiaries |
R. Wes Campbell
(1974) | Chief Financial Officer and Treasurer since 2018 | Vice President, ACS, (2020 to present); Investment Operations and Investment Accounting, ACS (2000 to present) |
Amy D. Shelton
(1964) | Chief Compliance Officer and Vice President since 2014 | Chief Compliance Officer, American Century funds, (2014 to present); Chief Compliance Officer, ACIM (2014 to present); Chief Compliance Officer, ACIS (2009 to present). Also serves as Vice President, ACIS |
John Pak
(1968) | General Counsel and
Senior Vice President since 2021 | General Counsel and Senior Vice President, ACC (2021 to present); Also serves as General Counsel and Senior Vice President, ACIM, ACS and ACIS. Chief Legal Officer of Investment and Wealth Management, The Bank of New York Mellon (2014 to 2021) |
C. Jean Wade
(1964) | Vice President since 2012 | Senior Vice President, ACS (2017 to present); Vice President, ACS (2000 to 2017)
|
Robert J. Leach
(1966) | Vice President since 2006 | Vice President, ACS (2000 to present) |
David H. Reinmiller
(1963) | Vice President since 2000 | Attorney, ACC (1994 to present). Also serves as Vice President, ACIM and ACS |
Ward D. Stauffer
(1960) | Secretary since 2005 | Attorney, ACC (2003 to present) |
Proxy Voting Policies
A description of the policies that the fund's investment advisor uses in exercising the voting rights associated with the securities purchased and/or held by the fund is available without charge, upon request, by calling 1-800-378-9878. It is also available on American Century Investments’ website at americancentury.com/proxy and on the Securities and Exchange Commission’s website at sec.gov. Information regarding how the investment advisor voted proxies relating to portfolio securities during the most recent 12-month period ended June 30 is available on americancentury.com/proxy. It is also available at sec.gov.
Quarterly Portfolio Disclosure
The fund files its complete schedule of portfolio holdings with the Securities and Exchange Commission (SEC) for the first and third quarters of each fiscal year as an exhibit to its reports on Form N-PORT. These portfolio holdings are available on the fund's website at ipro.americancentury.com (for Investment Professionals) and, upon request, by calling 1-800-378-9878. The fund’s Form N-PORT reports are available on the SEC’s website at sec.gov.
Other Tax Information
The following information is provided pursuant to provisions of the Internal Revenue Code.
For corporate taxpayers, the fund hereby designates $15,642,530, or up to the maximum amount allowable, of ordinary income distributions paid during the fiscal year ended December 31, 2021 as qualified for the corporate dividends received deduction.
| | | | | | | | |
| |
| | |
| Contact Us | americancentury.com | |
| Automated Information Line | 1-800-345-8765 | |
| Investment Professional Service Representatives | 1-800-345-6488 | |
| Telecommunications Relay Service for the Deaf | 711 | |
| | |
| American Century Variable Portfolios, Inc. | |
| | |
Investment Advisor: American Century Investment Management, Inc. Kansas City, Missouri | |
| | |
| This report and the statements it contains are submitted for the general information of our shareholders. The report is not authorized for distribution to prospective investors unless preceded or accompanied by an effective prospectus. | |
| | |
©2022 American Century Proprietary Holdings, Inc. All rights reserved.
CL-ANN-91440 2202 | |
(b) None.
ITEM 2. CODE OF ETHICS.
(a) The registrant has adopted a Code of Ethics for Senior Financial Officers that applies to the registrant’s principal executive officer, principal financial officer, principal accounting officer, and persons performing similar functions.
(b) No response required.
(c) None.
(d) None.
(e) Not applicable.
(f) The registrant’s Code of Ethics for Senior Financial Officers was filed as Exhibit 12 (a)(1) to American Century Asset Allocation Portfolios, Inc.’s Annual Certified Shareholder Report on Form N-CSR, File No. 811-21591, on September 29, 2005, and is incorporated herein by reference.
ITEM 3. AUDIT COMMITTEE FINANCIAL EXPERT.
(a)(1) The registrant’s board has determined that the registrant has at least one audit committee financial expert serving on its audit committee.
(a)(2) Chris H. Cheesman, Lynn M. Jenkins and Barry Fink are the registrant’s designated audit committee financial experts. They are “independent” as defined in Item 3 of Form N-CSR.
(a)(3) Not applicable.
(b) No response required.
(c) No response required.
(d) No response required.
ITEM 4. PRINCIPAL ACCOUNTANT FEES AND SERVICES.
(a) Audit Fees.
The aggregate fees billed for each of the last two fiscal years for professional services rendered by the principal accountant for the audit of the registrant’s annual financial statements or services that are normally provided by the accountant in connection with statutory and regulatory filings or engagements for those fiscal years were as follows:
FY 2020: $200,160
FY 2021: $165,250
(b) Audit-Related Fees.
The aggregate fees billed in each of the last two fiscal years for assurance and related services by the principal accountant that are reasonably related to the performance of the audit of the registrant’s financial statements and are not reported under paragraph (a) of this Item were as follows:
For services rendered to the registrant:
FY 2020: $0
FY 2021: $0
Fees required to be approved pursuant to paragraph (c)(7)(ii) of Rule 2-01 of Regulation S-X (relating to certain engagements for non-audit services with the registrant’s investment adviser and its affiliates):
FY 2020: $0
FY 2021: $0
(c) Tax Fees.
The aggregate fees billed in each of the last two fiscal years for professional services rendered by the principal accountant for tax compliance, tax advice, and tax planning were as follows:
For services rendered to the registrant:
FY 2020: $0
FY 2021: $0
Fees required to be approved pursuant to paragraph (c)(7)(ii) of Rule 2-01 of Regulation S-X (relating to certain engagements for non-audit services with the registrant’s investment adviser and its affiliates):
FY 2020: $0
FY 2021: $0
(d) All Other Fees.
The aggregate fees billed in each of the last two fiscal years for products and services provided by the principal accountant, other than the services reported in paragraphs (a) through (c) of this Item were as follows:
For services rendered to the registrant:
FY 2020: $0
FY 2021: $0
Fees required to be approved pursuant to paragraph (c)(7)(ii) of Rule 2-01 of Regulation S-X (relating to certain engagements for non-audit services with the registrant’s investment adviser and its affiliates):
FY 2020: $0
FY 2021: $0
(e)(1) In accordance with paragraph (c)(7)(i)(A) of Rule 2-01 of Regulation S-X, before the accountant is engaged by the registrant to render audit or non-audit services, the engagement is approved by the registrant’s audit committee. Pursuant to paragraph (c)(7)(ii) of Rule 2-01 of Regulation S-X, the registrant’s audit committee also pre-approves its accountant’s engagements for non-audit services with the registrant’s investment adviser, its parent company, and any entity controlled by, or under common control with the investment adviser that provides ongoing services to the registrant, if the engagement relates directly to the operations and financial reporting of the registrant.
(e)(2) All services described in each of paragraphs (b) through (d) of this Item were pre-approved before the engagement by the registrant’s audit committee pursuant to paragraph (c)(7)(i)(A) of Rule 2-01 of Regulation S-X. Consequently, none of such services were required to be approved by the audit committee pursuant to paragraph (c)(7)(i)(C).
(f) The percentage of hours expended on the principal accountant’s engagement to audit the registrant’s financial statements for the most recent fiscal year that were attributed to work performed by persons other than the principal accountant’s full-time, permanent employees was less than 50%.
(g) The aggregate non-audit fees billed by the registrant’s accountant for services rendered to the registrant, and rendered to the registrant’s investment adviser (not including any sub-adviser whose role is primarily portfolio management and is subcontracted with or overseen by another investment adviser), and any entity controlling, controlled by, or under common control with the adviser that provides ongoing services to the registrant for each of the last two fiscal years of the registrant were as follows:
FY 2020: $0
FY 2021: $2,832,126
(h) The registrant’s investment adviser and accountant have notified the registrant’s audit committee of all non-audit services that were rendered by the registrant’s accountant to the registrant’s investment adviser, its parent company, and any entity controlled by, or under common control with the investment adviser that provides services to the registrant, which services were not required to be pre-approved pursuant to paragraph (c)(7)(ii) of Rule 2-01 of Regulation S-X. The notification provided to the registrant’s audit committee included sufficient details regarding such services to allow the registrant’s audit committee to consider the continuing independence of its principal accountant.
ITEM 5. AUDIT COMMITTEE OF LISTED REGISTRANTS.
Not applicable.
ITEM 6. INVESTMENTS.
(a) The schedule of investments is included as part of the report to stockholders filed under Item 1 of this Form.
(b) Not applicable.
ITEM 7. DISCLOSURE OF PROXY VOTING POLICIES AND PROCEDURES FOR CLOSED-END MANAGEMENT INVESTMENT COMPANIES.
Not applicable.
ITEM 8. PORTFOLIO MANAGERS OF CLOSED-END MANAGEMENT INVESTMENT COMPANIES.
Not applicable.
ITEM 9. PURCHASES OF EQUITY SECURITIES BY CLOSED-END MANAGEMENT INVESTMENT COMPANY AND AFFILIATED PURCHASERS.
Not applicable.
ITEM 10. SUBMISSION OF MATTERS TO A VOTE OF SECURITY HOLDERS.
During the reporting period, there were no material changes to the procedures by which shareholders may recommend nominees to the registrant’s board.
ITEM 11. CONTROLS AND PROCEDURES.
(a) The registrant's principal executive officer and principal financial officer have concluded that the registrant's disclosure controls and procedures (as defined in Rule 30a-3(c) under the Investment Company Act of 1940) are effective based on their evaluation of these controls and procedures as of a date within 90 days of the filing date of this report.
(b) There were no changes in the registrant's internal control over financial reporting (as defined in Rule 30a-3(d) under the Investment Company Act of 1940) that occurred during the period covered by this report that have materially affected, or are reasonably likely to materially affect, the registrant's internal control over financial reporting.
ITEM 12. DISCLOSURE OF SECURITIES LENDING ACTIVITIES FOR CLOSED-END MANAGEMENT INVESTMENT COMPANIES.
Not applicable.
ITEM 13. EXHIBITS.
(a)(1) Registrant’s Code of Ethics for Senior Financial Officers, which is the subject of the disclosure required by Item 2 of Form N-CSR, was filed as Exhibit 12(a)(1) to American Century Asset Allocation Portfolios, Inc.’s Certified Shareholder Report on Form N-CSR, File No. 811-21591, on September 29, 2005.
(a)(3) Not applicable.
(a)(4) Not applicable.
SIGNATURES
Pursuant to the requirements of the Securities Exchange Act of 1934 and the Investment Company Act of 1940, the registrant has duly caused this report to be signed on its behalf by the undersigned, thereunto duly authorized.
| | | | | | | | | | | | | | |
| Registrant: | American Century Variable Portfolios, Inc. | |
| | | |
| By: | /s/ Patrick Bannigan | |
| Name: | Patrick Bannigan | |
| Title: | President | |
| | | |
| Date: | February 24, 2022 | |
Pursuant to the requirements of the Securities Exchange Act of 1934 and the Investment Company Act of 1940, this report has been signed below by the following persons on behalf of the registrant and in the capacities and on the dates indicated.
| | | | | | | | | | | |
| By: | /s/ Patrick Bannigan | |
| Name: | Patrick Bannigan | |
| Title: | President | |
| | (principal executive officer) | |
| | | |
| Date: | February 24, 2022 | |
| | | | | | | | | | | |
| By: | /s/ R. Wes Campbell | |
| Name: | R. Wes Campbell | |
| Title: | Treasurer and | |
| | Chief Financial Officer | |
| | (principal financial officer) | |
| | | |
| Date: | February 24, 2022 | |