UNITED STATES
SECURITIES AND EXCHANGE COMMISSION
Washington, D.C. 20549
FORM N-CSR
CERTIFIED SHAREHOLDER REPORT OF REGISTERED
MANAGEMENT INVESTMENT COMPANIES
| | | | | | | | | | | | | | | | | | | | |
| Investment Company Act file number | 811-05188 |
| |
| AMERICAN CENTURY VARIABLE PORTFOLIOS, INC. |
| (Exact name of registrant as specified in charter) |
| |
| 4500 MAIN STREET, KANSAS CITY, MISSOURI | 64111 |
| (Address of principal executive offices) | (Zip Code) |
| |
JOHN PAK
4500 MAIN STREET, KANSAS CITY, MISSOURI 64111 |
| (Name and address of agent for service) |
| |
| Registrant’s telephone number, including area code: | 816-531-5575 |
| |
| Date of fiscal year end: | 12-31 |
| |
| Date of reporting period: | 12-31-2022 |
ITEM 1. REPORTS TO STOCKHOLDERS.
(a) Provided under separate cover.
| | | | | |
| |
| Annual Report |
| |
| December 31, 2022 |
| |
| VP Balanced Fund |
| Class I (AVBIX) |
| Class II (AVBTX) |
| | | | | |
| Performance | |
| Portfolio Commentary | |
| Fund Characteristics | |
| Shareholder Fee Example | |
| Schedule of Investments | |
| Statement of Assets and Liabilities | |
| Statement of Operations | |
| Statement of Changes in Net Assets | |
| Notes to Financial Statements | |
| Financial Highlights | |
| Report of Independent Registered Public Accounting Firm | |
| Management | |
| |
| |
| Proxy Voting Results | |
| Additional Information | |
Any opinions expressed in this report reflect those of the author as of the date of the report, and do not necessarily represent the opinions of American Century Investments® or any other person in the American Century Investments organization. Any such opinions are subject to change at any time based upon market or other conditions and American Century Investments disclaims any responsibility to update such opinions. These opinions may not be relied upon as investment advice and, because investment decisions made by American Century Investments funds are based on numerous factors, may not be relied upon as an indication of trading intent on behalf of any American Century Investments fund. Security examples are used for representational purposes only and are not intended as recommendations to purchase or sell securities. Performance information for comparative indices and securities is provided to American Century Investments by third party vendors. To the best of American Century Investments’ knowledge, such information is accurate at the time of printing.
| | | | | | | | | | | | | | | | | | | | |
| Total Returns as of December 31, 2022 |
| | | Average Annual Returns | |
| Ticker
Symbol | 1 year | 5 years | 10 years | Since
Inception | Inception
Date |
| Class I | AVBIX | -17.27% | 4.43% | 6.64% | — | 5/1/91 |
| S&P 500 Index | — | -18.11% | 9.42% | 12.56% | — | — |
| Bloomberg U.S. Aggregate Bond Index | — | -13.01% | 0.02% | 1.06% | — | — |
| Blended Index | — | -15.79% | 5.96% | 8.08% | — | — |
| Class II | AVBTX | -17.47% | 4.18% | — | 5.83% | 5/2/16 |
Average annual returns since inception are presented when ten years of performance history is not available.
Fund returns would have been lower if a portion of the fees had not been waived. The blended index combines monthly returns of two widely known indices in proportion to the asset mix of the fund. The S&P 500 Index represents 60% of the index and the remaining 40% is represented by the Bloomberg U.S. Aggregate Bond Index.
The performance information presented does not include the fees and charges assessed with investments in variable insurance products, those charges are disclosed in the separate account prospectus. The inclusion of such fees and charges would lower performance.
Data presented reflect past performance. Past performance is no guarantee of future results. Current performance may be higher or lower than the performance shown. Total returns for periods less than one year are not annualized. Investment return and principal value will fluctuate, and redemption value may be more or less than original cost. Data assumes reinvestment of dividends and capital gains, and none of the charts reflect the deduction of taxes that a shareholder would pay on fund distributions or the redemption of fund shares. To obtain performance data current to the most recent month end, please call 1-800-345-6488 or visit americancentury.com. For additional information about the fund, please consult the prospectus.
| | |
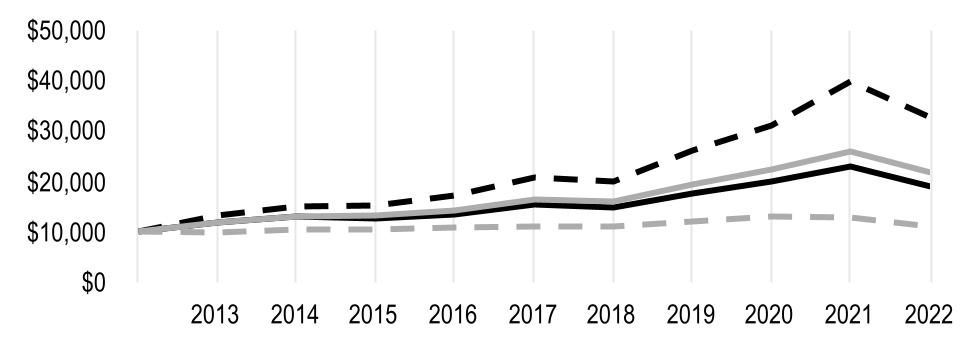
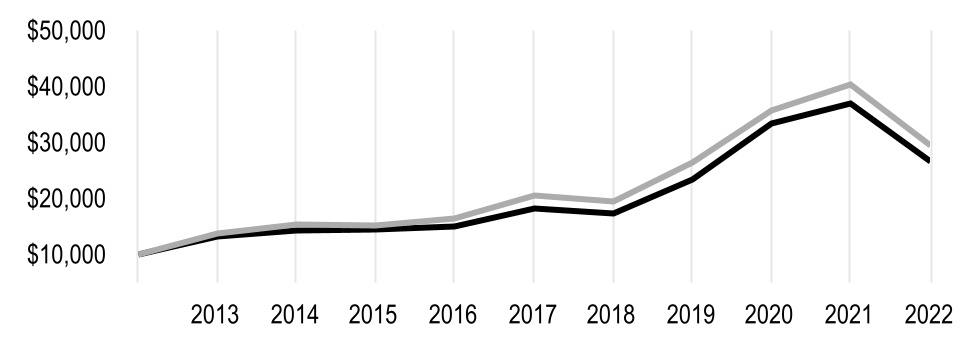
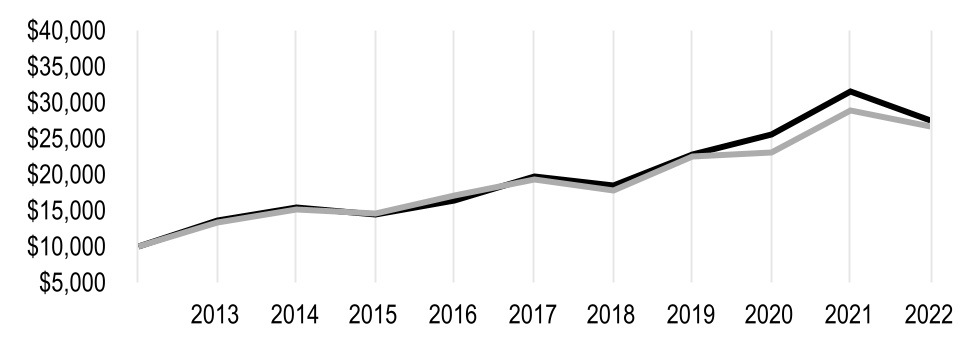
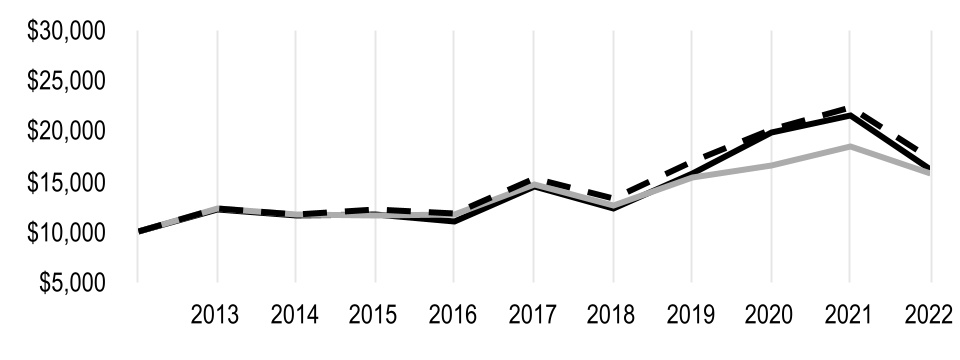
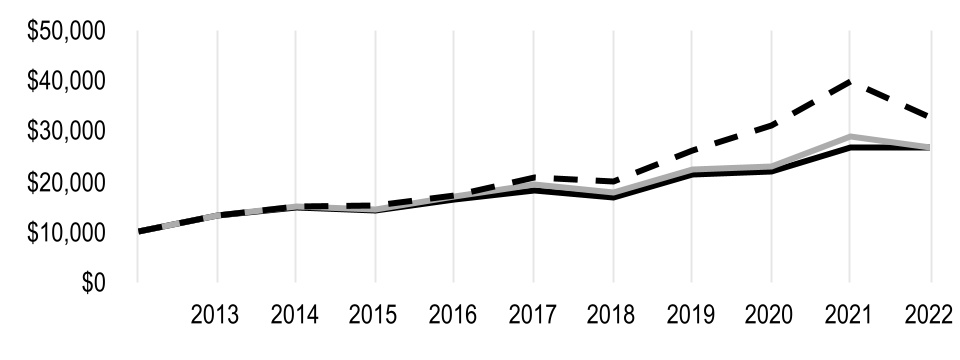
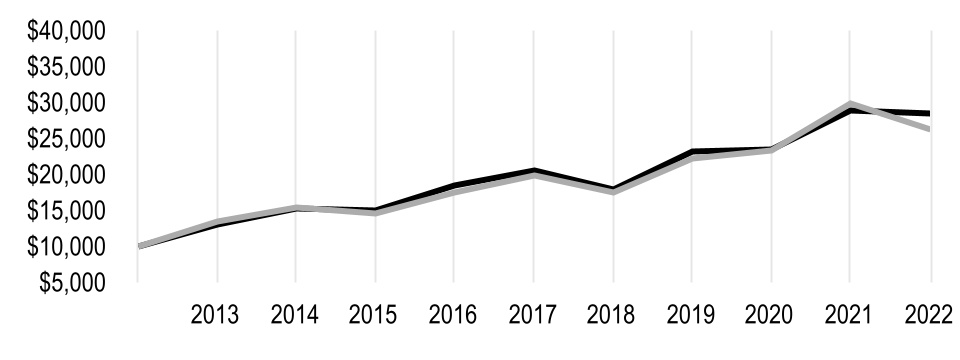
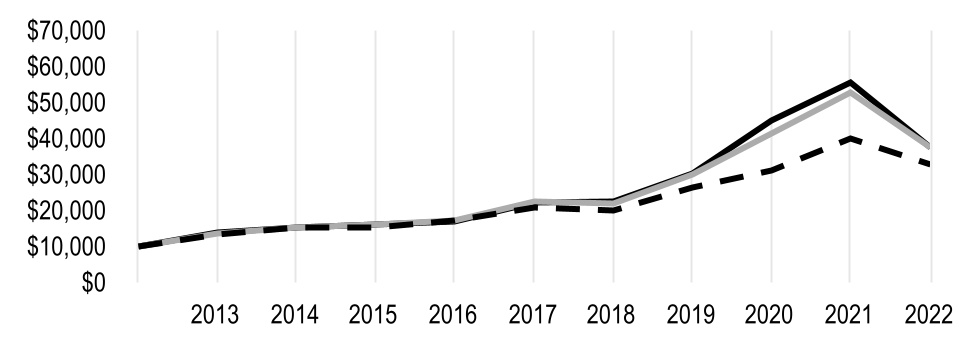
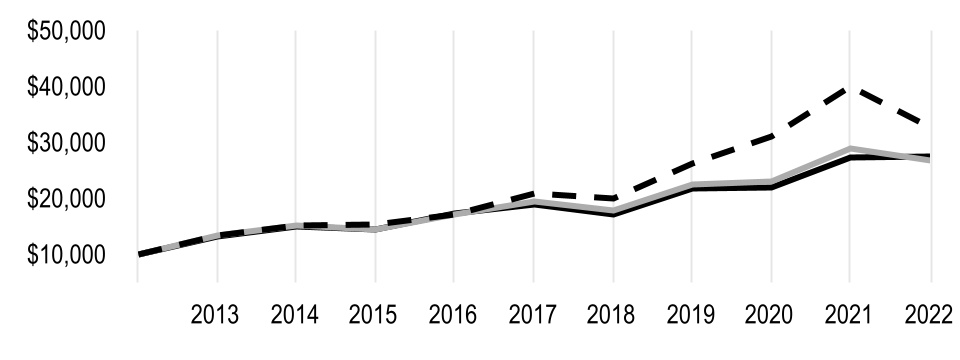
| Growth of $10,000 Over 10 Years |
| $10,000 investment made December 31, 2012 |
| Performance for other share classes will vary due to differences in fee structure. |
| | | | | |
| Value on December 31, 2022 |
| Class I — $19,028 |
|
| S&P 500 Index — $32,654 |
|
| Bloomberg U.S. Aggregate Bond Index — $11,108 |
|
| Blended Index — $21,759 |
|
Ending value of Class I would have been lower if a portion of the fees had not been waived.
| | | | | |
| Total Annual Fund Operating Expenses |
| Class I | Class II |
| 0.88% | 1.13% |
The total annual fund operating expenses shown is as stated in the fund’s prospectus current as of the date of this report. The prospectus may vary from the expense ratio shown elsewhere in this report because it is based on a different time period, includes acquired fund fees and expenses, and, if applicable, does not include fee waivers or expense reimbursements.
Data presented reflect past performance. Past performance is no guarantee of future results. Current performance may be higher or lower than the performance shown. Total returns for periods less than one year are not annualized. Investment return and principal value will fluctuate, and redemption value may be more or less than original cost. Data assumes reinvestment of dividends and capital gains, and none of the charts reflect the deduction of taxes that a shareholder would pay on fund distributions or the redemption of fund shares. To obtain performance data current to the most recent month end, please call 1-800-345-6488 or visit americancentury.com. For additional information about the fund, please consult the prospectus.
Equity Portfolio Managers: Joseph Reiland, Justin Brown and Robert Bove
Fixed-Income Portfolio Managers: Bob Gahagan, Charles Tan and Jason Greenblath
Performance Summary
VP Balanced returned -17.27%* for the 12 months ended December 31, 2022. By comparison, the fund’s benchmark (a blended index consisting of 60% S&P 500 Index and 40% Bloomberg U.S. Aggregate Bond Index) returned -15.79%.
VP Balanced seeks long-term capital growth and current income by investing approximately 60% of its assets in equity securities and the remainder in bonds and other fixed-income securities. The purpose of the broad bond market exposure is to reduce the volatility of the equity portfolio, providing a more attractive overall risk/return profile for investors. Unfortunately, fixed-income markets endured one of the worst stretches on record during the fiscal year due to concerns about surging inflation and aggressive tightening of Federal Reserve (Fed) policy. In that environment, both the equity and fixed-income portions of the portfolio declined in absolute terms and underperformed their benchmarks.
Information Technology Hampered Equity Performance
Stock selection in the information technology sector weighed on relative performance. Significant detractors in the sector included software giant Microsoft, which was hurt by foreign exchange headwinds, COVID-19-related shutdowns in China that limited personal computer (PC) inventory and a deterioration in PC demand.
Not owning Exxon Mobil and Chevron detracted from performance compared with the benchmark as their stocks rose on higher fossil fuel prices following Russia’s invasion of Ukraine. Google’s parent company Alphabet reported disappointing results, largely due to macroeconomic weakness, which is hurting advertising demand. Alphabet is also spending into the revenue slowdown. We expect a more aligned growth and spending profile in 2023. While we believe the industrial warehouse space offers attractive long-term growth potential, cutbacks by Amazon and FedEx are weighing on real estate investment trusts such as Prologis. Rising interest rates and a strong dollar also hurt cost of debt and asset valuations. Aptiv, an Ireland-based automotive technology supplier, underperformed following Russia’s invasion of Ukraine on concerns about production disruptions, higher commodity costs, continued supply chain constraints and negative impacts to European automobile demand.
Communication Services Stocks Benefited Equity Performance
During the period, we eliminated the stock of Facebook’s parent Meta Platforms, which has been hurt more than other digital advertising platforms by both Apple iOS platform changes and TikTok competition. The fund’s resulting underweight helped performance in the communication services sector as the stock fell sharply.
Elsewhere, our holding of ConocoPhillips was a top contributor. This is consistent with our process, which uses a proprietary multifactor model that considers a company’s financial metrics and environmental, social and governance (ESG) characteristics. Rather than exclude certain sectors entirely, our process seeks to identify the most attractive companies within their respective sectors. Our approach led us to overweight positions in select energy companies. The oil giant reported
solid quarterly earnings and increased its 2022 capital return guidance by 50%. The management
*All fund returns referenced in this commentary are for Class I shares. Fund returns would have been lower if a portion of the fees had not been waived. Performance for other share classes will vary due to differences in fee structure; when Class I performance exceeds that of the index, other share classes may not. See page 2 for returns for all share classes.
team continues to demonstrate strong execution and capital return discipline. Schlumberger, a
Netherlands-based oil field services company, benefited from the jump in fossil fuel prices stemming from Russia’s invasion in Ukraine, which disrupted energy markets by calling into question global supply chains, with an acute focus on Europe.
Managed care companies, including Cigna, benefited from what many investors perceive to be their defensive profile, meaning they are believed to be relatively insulated from both rising prices and recession risk. Our research also indicates that Cigna’s pharmacy benefit division may benefit from new biosimilar pharmaceutical launches in the coming years. Defense contractor Lockheed Martin was another solid contributor. The defense group experienced relative outperformance as investors rotated to lower growth and more defensive names. Russia’s invasion of Ukraine sparked additional outperformance for the stock on expectations that rising geopolitical tensions will lead to higher global defense spending.
Bonds Also Endured Difficult Performance
U.S. investment-grade bonds logged their only positive quarterly results for 2022 in the year’s final three months. Despite this rebound, the Bloomberg U.S. Aggregate Bond Index declined 13% for the year, its worst performance in index history. A tumultuous year of high inflation, aggressive Fed tightening and rising interest rates weighed on returns. Despite a slowdown in the annual inflation rate, the Fed continued to aggressively raise rates. The central bank lifted rates 75 bps in November and 50 bps in December. These actions brought the year-to-date rate hike total to 425 bps and the federal funds rate to a range of 4.25% to 4.5%. In that environment, the fixed-income portion of the portfolio declined in absolute terms and underperformed its benchmark. Underperformance relative to the benchmark was largely due to security selection. Duration had a modestly negative impact.
Outlook
War, inflation and recession risk all suggest difficult, volatile conditions ahead. Markets will continue to deal with the contrasting risks of rising inflation and interest rates, even as the global economy teeters on the verge of recession. The ongoing war in Ukraine also highlights political and economic risks at present. We will continue to monitor the situation and invest appropriately. We believe that the continued economic and market uncertainty highlights the benefits of a balanced approach involving exposure to both stocks and bonds, which is intended to reduce overall price fluctuations and improve risk-adjusted performance.
Of course, we understand it can be frustrating when stocks and bonds fall together, but investors should recall that these sorts of balanced portfolios have performed very well over time on both an absolute and risk-adjusted basis. We prefer to think this is a temporary speed bump and that diversification remains the best way to maximize risk-adjusted returns over time.
An investment strategy that focuses on ESG factors seeks to invest, under normal market conditions, in securities that meet certain ESG criteria or standards in an effort to promote sustainable characteristics, in addition to seeking superior, long-term, risk-adjusted returns. This investment focus may limit the investment opportunities available to a portfolio. Therefore, the portfolio may underperform or perform differently than other portfolios that do not have an ESG investment focus.
| | | | | |
| DECEMBER 31, 2022 |
| Types of Investments in Portfolio | % of net assets |
| Common Stocks | 59.5% |
| U.S. Treasury Securities | 12.1% |
| U.S. Government Agency Mortgage-Backed Securities | 9.6% |
| Corporate Bonds | 9.3% |
| Collateralized Loan Obligations | 2.8% |
| Asset-Backed Securities | 2.5% |
| Collateralized Mortgage Obligations | 1.2% |
| Commercial Mortgage-Backed Securities | 0.6% |
| Municipal Securities | 0.6% |
| Exchange-Traded Funds | 0.4% |
| Affiliated Funds | 0.2% |
| U.S. Government Agency Securities | 0.2% |
| Bank Loan Obligations | 0.1% |
| Sovereign Governments and Agencies | —* |
| Short-Term Investments | 0.7% |
| Other Assets and Liabilities | 0.2% |
| *Category is less than 0.05% of total net assets. |
| |
| Top Five Common Stocks Industries* | % of net assets |
| Software | 5.4% |
| Health Care Providers and Services | 3.4% |
| Semiconductors and Semiconductor Equipment | 3.1% |
| Capital Markets | 2.8% |
| Pharmaceuticals | 2.8% |
*Exposure indicated excludes Exchange-Traded Funds. The Schedule of Investments provides additional information on the fund's portfolio holdings.
Fund shareholders may incur two types of costs: (1) transaction costs, including sales charges (loads) on purchase payments and redemption/exchange fees; and (2) ongoing costs, including management fees; distribution and service (12b-1) fees; and other fund expenses. This example is intended to help you understand your ongoing costs (in dollars) of investing in your fund and to compare these costs with the ongoing cost of investing in other mutual funds.
The example is based on an investment of $1,000 made at the beginning of the period and held for the entire period from July 1, 2022 to December 31, 2022.
Actual Expenses
The table provides information about actual account values and actual expenses for each class. You may use the information, together with the amount you invested, to estimate the expenses that you paid over the period. First, identify the share class you own. Then simply divide your account value by $1,000 (for example, an $8,600 account value divided by $1,000 = 8.6), then multiply the result by the number under the heading “Expenses Paid During Period” to estimate the expenses you paid on your account during this period.
Hypothetical Example for Comparison Purposes
The table also provides information about hypothetical account values and hypothetical expenses based on the actual expense ratio of each class of your fund and an assumed rate of return of 5% per year before expenses, which is not the actual return of a fund’s share class. The hypothetical account values and expenses may not be used to estimate the actual ending account balance or expenses you paid for the period. You may use this information to compare the ongoing costs of investing in your fund and other funds. To do so, compare this 5% hypothetical example with the 5% hypothetical examples that appear in the shareholder reports of the other funds.
Please note that the expenses shown in the table are meant to highlight your ongoing costs only and do not reflect any transactional costs, such as sales charges (loads) or redemption/exchange fees. Therefore, the table is useful in comparing ongoing costs only, and will not help you determine the relative total costs of owning different funds. In addition, if these transactional costs were included, your costs would have been higher.
| | | | | | | | | | | | | | |
| Beginning Account Value 7/1/22 | Ending Account Value 12/31/22 | Expenses Paid During Period(1) 7/1/22 - 12/31/22 | Annualized Expense Ratio(1) |
| Actual | | | | |
| Class I | $1,000 | $1,009.00 | $4.20 | 0.83% |
| Class II | $1,000 | $1,007.80 | $5.47 | 1.08% |
| Hypothetical | | | | |
| Class I | $1,000 | $1,021.02 | $4.23 | 0.83% |
| Class II | $1,000 | $1,019.76 | $5.50 | 1.08% |
(1)Expenses are equal to the class's annualized expense ratio listed in the table above, multiplied by the average account value over the period, multiplied by 184, the number of days in the most recent fiscal half-year, divided by 365, to reflect the one-half year period. Annualized expense ratio reflects actual expenses, including any applicable fee waivers or expense reimbursements and excluding any acquired fund fees and expenses.
DECEMBER 31, 2022
| | | | | | | | |
| Shares/
Principal Amount | Value |
| COMMON STOCKS — 59.5% | | |
| Aerospace and Defense — 0.8% | | |
| Lockheed Martin Corp. | 5,373 | | $ | 2,613,911 | |
| Air Freight and Logistics — 0.4% | | |
| United Parcel Service, Inc., Class B | 7,800 | | 1,355,952 | |
| Auto Components — 0.4% | | |
Aptiv PLC(1) | 15,219 | | 1,417,346 | |
| Automobiles — 0.5% | | |
Tesla, Inc.(1) | 11,879 | | 1,463,255 | |
| Banks — 2.0% | | |
| Bank of America Corp. | 19,151 | | 634,281 | |
| JPMorgan Chase & Co. | 22,961 | | 3,079,070 | |
| Regions Financial Corp. | 125,196 | | 2,699,226 | |
| | 6,412,577 | |
| Beverages — 1.1% | | |
| PepsiCo, Inc. | 19,459 | | 3,515,463 | |
| Biotechnology — 1.6% | | |
| AbbVie, Inc. | 16,145 | | 2,609,194 | |
| Amgen, Inc. | 4,985 | | 1,309,260 | |
Vertex Pharmaceuticals, Inc.(1) | 3,567 | | 1,030,078 | |
| | 4,948,532 | |
| Building Products — 1.0% | | |
| Johnson Controls International PLC | 37,066 | | 2,372,224 | |
| Masco Corp. | 19,500 | | 910,065 | |
| | 3,282,289 | |
| Capital Markets — 2.8% | | |
| Ameriprise Financial, Inc. | 4,931 | | 1,535,366 | |
| BlackRock, Inc. | 2,753 | | 1,950,858 | |
| Intercontinental Exchange, Inc. | 10,099 | | 1,036,056 | |
| Morgan Stanley | 36,680 | | 3,118,534 | |
| S&P Global, Inc. | 3,463 | | 1,159,897 | |
| | 8,800,711 | |
| Chemicals — 1.5% | | |
| Air Products & Chemicals, Inc. | 4,218 | | 1,300,241 | |
| Ecolab, Inc. | 5,654 | | 822,996 | |
| Linde PLC | 8,525 | | 2,780,685 | |
| | 4,903,922 | |
| Communications Equipment — 1.2% | | |
| Cisco Systems, Inc. | 79,752 | | 3,799,385 | |
| Consumer Finance — 0.3% | | |
| American Express Co. | 6,920 | | 1,022,430 | |
| Containers and Packaging — 0.3% | | |
| Ball Corp. | 19,974 | | 1,021,470 | |
| Diversified Telecommunication Services — 0.6% | | |
| Verizon Communications, Inc. | 50,587 | | 1,993,128 | |
| Electric Utilities — 1.3% | | |
| NextEra Energy, Inc. | 49,564 | | 4,143,550 | |
| | | | | | | | |
| Shares/
Principal Amount | Value |
| Electrical Equipment — 0.6% | | |
| Eaton Corp. PLC | 10,051 | | $ | 1,577,504 | |
Generac Holdings, Inc.(1) | 2,401 | | 241,685 | |
| | 1,819,189 | |
| Electronic Equipment, Instruments and Components — 1.3% |
| CDW Corp. | 10,538 | | 1,881,876 | |
| Cognex Corp. | 8,292 | | 390,636 | |
Keysight Technologies, Inc.(1) | 11,412 | | 1,952,251 | |
| | 4,224,763 | |
| Energy Equipment and Services — 1.5% | | |
| Schlumberger Ltd. | 89,069 | | 4,761,629 | |
| Entertainment — 0.8% | | |
| Electronic Arts, Inc. | 6,828 | | 834,245 | |
Liberty Media Corp.-Liberty Formula One, Class C(1) | 7,569 | | 452,475 | |
Walt Disney Co.(1) | 15,422 | | 1,339,863 | |
| | 2,626,583 | |
| Equity Real Estate Investment Trusts (REITs) — 1.6% | | |
| Prologis, Inc. | 35,779 | | 4,033,366 | |
| SBA Communications Corp. | 3,899 | | 1,092,929 | |
| | 5,126,295 | |
| Food and Staples Retailing — 1.5% | | |
| Costco Wholesale Corp. | 2,602 | | 1,187,813 | |
| Kroger Co. | 30,240 | | 1,348,099 | |
| Sysco Corp. | 29,451 | | 2,251,529 | |
| | 4,787,441 | |
| Food Products — 0.6% | | |
| Mondelez International, Inc., Class A | 26,991 | | 1,798,950 | |
Vital Farms, Inc.(1) | 8,510 | | 126,969 | |
| | 1,925,919 | |
| Health Care Equipment and Supplies — 0.7% | | |
Edwards Lifesciences Corp.(1) | 20,741 | | 1,547,486 | |
| Medtronic PLC | 3,509 | | 272,719 | |
| ResMed, Inc. | 1,913 | | 398,153 | |
| | 2,218,358 | |
| Health Care Providers and Services — 3.4% | | |
| Cigna Corp. | 10,702 | | 3,546,001 | |
| CVS Health Corp. | 23,183 | | 2,160,424 | |
| Humana, Inc. | 2,207 | | 1,130,403 | |
| UnitedHealth Group, Inc. | 7,584 | | 4,020,885 | |
| | 10,857,713 | |
| Hotels, Restaurants and Leisure — 0.5% | | |
Airbnb, Inc., Class A(1) | 4,814 | | 411,597 | |
Booking Holdings, Inc.(1) | 441 | | 888,739 | |
Chipotle Mexican Grill, Inc.(1) | 305 | | 423,184 | |
| | 1,723,520 | |
| Household Products — 1.1% | | |
| Colgate-Palmolive Co. | 12,135 | | 956,117 | |
| Procter & Gamble Co. | 16,149 | | 2,447,542 | |
| | 3,403,659 | |
| Industrial Conglomerates — 0.6% | | |
| Honeywell International, Inc. | 9,186 | | 1,968,560 | |
| | | | | | | | |
| Shares/
Principal Amount | Value |
| Insurance — 1.5% | | |
| Marsh & McLennan Cos., Inc. | 10,070 | | $ | 1,666,384 | |
| Prudential Financial, Inc. | 15,020 | | 1,493,889 | |
| Travelers Cos., Inc. | 8,070 | | 1,513,044 | |
| | 4,673,317 | |
| Interactive Media and Services — 2.3% | | |
Alphabet, Inc., Class A(1) | 76,660 | | 6,763,712 | |
Alphabet, Inc., Class C(1) | 4,773 | | 423,508 | |
| | 7,187,220 | |
| Internet and Direct Marketing Retail — 1.3% | | |
Amazon.com, Inc.(1) | 49,033 | | 4,118,772 | |
| IT Services — 2.5% | | |
| Accenture PLC, Class A | 7,808 | | 2,083,487 | |
| Mastercard, Inc., Class A | 7,056 | | 2,453,583 | |
| Visa, Inc., Class A | 17,150 | | 3,563,084 | |
| | 8,100,154 | |
| Life Sciences Tools and Services — 1.4% | | |
| Agilent Technologies, Inc. | 14,954 | | 2,237,866 | |
| Thermo Fisher Scientific, Inc. | 3,851 | | 2,120,707 | |
| | 4,358,573 | |
| Machinery — 1.4% | | |
| Cummins, Inc. | 7,374 | | 1,786,646 | |
| Deere & Co. | 2,163 | | 927,408 | |
| Parker-Hannifin Corp. | 2,433 | | 708,003 | |
| Xylem, Inc. | 9,658 | | 1,067,885 | |
| | 4,489,942 | |
| Multiline Retail — 0.2% | | |
| Target Corp. | 5,040 | | 751,162 | |
| Oil, Gas and Consumable Fuels — 1.5% | | |
| ConocoPhillips | 41,507 | | 4,897,826 | |
| Personal Products — 0.2% | | |
| Estee Lauder Cos., Inc., Class A | 2,164 | | 536,910 | |
| Pharmaceuticals — 2.8% | | |
| Bristol-Myers Squibb Co. | 37,865 | | 2,724,387 | |
| Eli Lilly & Co. | 2,307 | | 843,993 | |
| Merck & Co., Inc. | 18,940 | | 2,101,393 | |
| Novo Nordisk A/S, B Shares | 11,717 | | 1,591,351 | |
| Zoetis, Inc. | 10,301 | | 1,509,611 | |
| | 8,770,735 | |
| Road and Rail — 0.7% | | |
| Norfolk Southern Corp. | 5,074 | | 1,250,335 | |
Uber Technologies, Inc.(1) | 15,543 | | 384,379 | |
| Union Pacific Corp. | 3,219 | | 666,558 | |
| | 2,301,272 | |
| Semiconductors and Semiconductor Equipment — 3.1% | | |
Advanced Micro Devices, Inc.(1) | 19,172 | | 1,241,771 | |
| Analog Devices, Inc. | 13,475 | | 2,210,304 | |
| Applied Materials, Inc. | 20,679 | | 2,013,721 | |
| ASML Holding NV | 2,330 | | 1,270,436 | |
GLOBALFOUNDRIES, Inc.(1) | 8,314 | | 448,042 | |
| NVIDIA Corp. | 18,166 | | 2,654,779 | |
| | 9,839,053 | |
| | | | | | | | |
| Shares/
Principal Amount | Value |
| Software — 5.4% | | |
Adobe, Inc.(1) | 1,427 | | $ | 480,228 | |
Cadence Design Systems, Inc.(1) | 5,397 | | 866,974 | |
| Microsoft Corp. | 58,311 | | 13,984,144 | |
Salesforce, Inc.(1) | 7,799 | | 1,034,069 | |
ServiceNow, Inc.(1) | 1,191 | | 462,430 | |
Workday, Inc., Class A(1) | 2,466 | | 412,636 | |
| | 17,240,481 | |
| Specialty Retail — 2.0% | | |
| Home Depot, Inc. | 11,150 | | 3,521,839 | |
| TJX Cos., Inc. | 26,125 | | 2,079,550 | |
| Tractor Supply Co. | 3,417 | | 768,723 | |
| | 6,370,112 | |
| Technology Hardware, Storage and Peripherals — 2.5% | | |
| Apple, Inc. | 60,396 | | 7,847,252 | |
| Textiles, Apparel and Luxury Goods — 0.7% | | |
Deckers Outdoor Corp.(1) | 2,347 | | 936,829 | |
| NIKE, Inc., Class B | 10,898 | | 1,275,175 | |
| | 2,212,004 | |
TOTAL COMMON STOCKS (Cost $176,667,501) | | 189,832,335 | |
| U.S. TREASURY SECURITIES — 12.1% | | |
| U.S. Treasury Bonds, 5.00%, 5/15/37 | $ | 100,000 | | 111,762 | |
| U.S. Treasury Bonds, 3.50%, 2/15/39 | 500,000 | | 470,039 | |
| U.S. Treasury Bonds, 4.625%, 2/15/40 | 600,000 | | 645,293 | |
| U.S. Treasury Bonds, 3.75%, 8/15/41 | 100,000 | | 94,912 | |
| U.S. Treasury Bonds, 2.00%, 11/15/41 | 800,000 | | 571,609 | |
| U.S. Treasury Bonds, 3.125%, 11/15/41 | 100,000 | | 86,480 | |
| U.S. Treasury Bonds, 2.375%, 2/15/42 | 300,000 | | 229,201 | |
| U.S. Treasury Bonds, 3.00%, 5/15/42 | 1,300,000 | | 1,094,260 | |
| U.S. Treasury Bonds, 3.25%, 5/15/42 | 1,500,000 | | 1,315,781 | |
| U.S. Treasury Bonds, 3.375%, 8/15/42 | 1,400,000 | | 1,251,687 | |
| U.S. Treasury Bonds, 2.75%, 11/15/42 | 450,000 | | 361,125 | |
| U.S. Treasury Bonds, 4.00%, 11/15/42 | 500,000 | | 489,688 | |
| U.S. Treasury Bonds, 2.875%, 5/15/43 | 300,000 | | 245,145 | |
| U.S. Treasury Bonds, 3.75%, 11/15/43 | 200,000 | | 187,641 | |
| U.S. Treasury Bonds, 2.50%, 2/15/45 | 600,000 | | 452,285 | |
| U.S. Treasury Bonds, 3.00%, 11/15/45 | 200,000 | | 164,711 | |
| U.S. Treasury Bonds, 3.375%, 11/15/48 | 600,000 | | 529,594 | |
| U.S. Treasury Bonds, 2.875%, 5/15/49 | 300,000 | | 241,559 | |
| U.S. Treasury Bonds, 2.25%, 8/15/49 | 500,000 | | 351,758 | |
| U.S. Treasury Bonds, 2.375%, 11/15/49 | 650,000 | | 470,196 | |
| U.S. Treasury Bonds, 2.375%, 5/15/51 | 800,000 | | 574,234 | |
| U.S. Treasury Bonds, 2.00%, 8/15/51 | 300,000 | | 196,535 | |
| U.S. Treasury Bonds, 2.25%, 2/15/52 | 100,000 | | 69,578 | |
| U.S. Treasury Bonds, 2.875%, 5/15/52 | 400,000 | | 320,625 | |
| U.S. Treasury Bonds, 3.00%, 8/15/52 | 200,000 | | 164,844 | |
| U.S. Treasury Bonds, 4.00%, 11/15/52 | 1,500,000 | | 1,502,578 | |
U.S. Treasury Notes, 1.00%, 12/15/24(2) | 1,000,000 | | 936,094 | |
| U.S. Treasury Notes, 1.50%, 2/15/25 | 1,000,000 | | 941,406 | |
| U.S. Treasury Notes, 2.875%, 6/15/25 | 2,000,000 | | 1,933,281 | |
| | | | | | | | |
| Shares/
Principal Amount | Value |
| U.S. Treasury Notes, 2.75%, 6/30/25 | $ | 1,200,000 | | $ | 1,156,312 | |
| U.S. Treasury Notes, 3.50%, 9/15/25 | 1,000,000 | | 980,156 | |
| U.S. Treasury Notes, 4.50%, 11/15/25 | 3,000,000 | | 3,018,516 | |
| U.S. Treasury Notes, 4.00%, 12/15/25 | 1,200,000 | | 1,192,705 | |
| U.S. Treasury Notes, 1.625%, 10/31/26 | 1,300,000 | | 1,186,910 | |
| U.S. Treasury Notes, 1.75%, 12/31/26 | 700,000 | | 641,020 | |
| U.S. Treasury Notes, 2.625%, 5/31/27 | 200,000 | | 188,555 | |
| U.S. Treasury Notes, 3.875%, 11/30/27 | 3,500,000 | | 3,481,406 | |
| U.S. Treasury Notes, 1.25%, 3/31/28 | 400,000 | | 347,750 | |
| U.S. Treasury Notes, 1.25%, 4/30/28 | 800,000 | | 694,250 | |
| U.S. Treasury Notes, 1.25%, 6/30/28 | 1,100,000 | | 951,371 | |
| U.S. Treasury Notes, 1.50%, 11/30/28 | 1,200,000 | | 1,042,219 | |
| U.S. Treasury Notes, 1.875%, 2/28/29 | 600,000 | | 531,445 | |
| U.S. Treasury Notes, 2.875%, 4/30/29 | 300,000 | | 281,010 | |
| U.S. Treasury Notes, 3.125%, 8/31/29 | 700,000 | | 664,631 | |
| U.S. Treasury Notes, 3.875%, 9/30/29 | 500,000 | | 496,523 | |
| U.S. Treasury Notes, 3.875%, 11/30/29 | 1,200,000 | | 1,192,219 | |
| U.S. Treasury Notes, 1.875%, 2/15/32 | 400,000 | | 339,453 | |
| U.S. Treasury Notes, 2.875%, 5/15/32 | 2,500,000 | | 2,304,687 | |
| U.S. Treasury Notes, 2.75%, 8/15/32 | 400,000 | | 364,313 | |
| U.S. Treasury Notes, 4.125%, 11/15/32 | 1,500,000 | | 1,531,055 | |
TOTAL U.S. TREASURY SECURITIES (Cost $41,607,206) | | 38,590,407 | |
| U.S. GOVERNMENT AGENCY MORTGAGE-BACKED SECURITIES — 9.6% |
Adjustable-Rate U.S. Government Agency Mortgage-Backed Securities† |
| FHLMC, VRN, 3.49%, (12-month LIBOR plus 1.87%), 7/1/36 | 3,068 | | 3,101 | |
| FHLMC, VRN, 4.20%, (1-year H15T1Y plus 2.14%), 10/1/36 | 8,541 | | 8,711 | |
| FHLMC, VRN, 3.30%, (1-year H15T1Y plus 2.26%), 4/1/37 | 10,866 | | 11,023 | |
| FHLMC, VRN, 3.77%, (12-month LIBOR plus 1.89%), 7/1/41 | 2,856 | | 2,856 | |
| FHLMC, VRN, 2.98%, (12-month LIBOR plus 1.63%), 1/1/44 | 9,977 | | 9,991 | |
| FHLMC, VRN, 3.54%, (12-month LIBOR plus 1.60%), 6/1/45 | 12,202 | | 12,309 | |
| FHLMC, VRN, 3.77%, (12-month LIBOR plus 1.63%), 8/1/46 | 35,650 | | 35,836 | |
| FHLMC, VRN, 3.09%, (12-month LIBOR plus 1.64%), 9/1/47 | 29,548 | | 28,693 | |
| FNMA, VRN, 3.97%, (6-month LIBOR plus 1.57%), 6/1/35 | 4,274 | | 4,288 | |
| FNMA, VRN, 4.61%, (6-month LIBOR plus 1.57%), 6/1/35 | 5,388 | | 5,417 | |
| FNMA, VRN, 3.66%, (1 year H15T1Y plus 2.15%), 3/1/38 | 10,485 | | 10,692 | |
| FNMA, VRN, 3.18%, (12-month LIBOR plus 1.61%), 3/1/47 | 21,817 | | 20,879 | |
| | 153,796 | |
| Fixed-Rate U.S. Government Agency Mortgage-Backed Securities — 9.6% |
| FHLMC, 2.50%, 3/1/42 | 559,209 | | 486,905 | |
| FHLMC, 3.00%, 1/1/50 | 624,771 | | 553,160 | |
| FHLMC, 3.50%, 5/1/50 | 122,384 | | 112,253 | |
| FHLMC, 2.50%, 5/1/51 | 768,905 | | 656,344 | |
| FHLMC, 3.50%, 5/1/51 | 791,249 | | 727,426 | |
| FHLMC, 3.00%, 7/1/51 | 505,973 | | 451,129 | |
| FHLMC, 3.00%, 7/1/51 | 370,020 | | 325,573 | |
| FHLMC, 2.00%, 8/1/51 | 917,577 | | 749,198 | |
| FHLMC, 2.00%, 8/1/51 | 645,094 | | 526,828 | |
| FHLMC, 2.50%, 8/1/51 | 997,478 | | 847,954 | |
| FHLMC, 4.00%, 8/1/51 | 288,654 | | 273,284 | |
| FHLMC, 2.50%, 10/1/51 | 341,451 | | 292,377 | |
| | | | | | | | |
| Shares/
Principal Amount | Value |
| FHLMC, 3.00%, 12/1/51 | $ | 524,053 | | $ | 460,808 | |
| FHLMC, 3.00%, 2/1/52 | 358,891 | | 317,008 | |
| FHLMC, 3.50%, 5/1/52 | 503,912 | | 462,195 | |
| FHLMC, 4.00%, 5/1/52 | 585,817 | | 550,251 | |
| FHLMC, 4.00%, 5/1/52 | 556,342 | | 524,110 | |
| FHLMC, 5.00%, 7/1/52 | 291,258 | | 288,775 | |
| FHLMC, 6.00%, 11/1/52 | 1,301,066 | | 1,328,102 | |
| FNMA, 3.50%, 3/1/34 | 13,049 | | 12,531 | |
| FNMA, 2.00%, 5/1/36 | 365,906 | | 326,845 | |
| FNMA, 2.00%, 6/1/36 | 1,194,222 | | 1,066,626 | |
| FNMA, 2.00%, 1/1/37 | 469,255 | | 419,137 | |
| FNMA, 2.00%, 1/1/37 | 183,684 | | 163,673 | |
| FNMA, 4.50%, 9/1/41 | 12,165 | | 12,036 | |
| FNMA, 2.50%, 3/1/42 | 525,599 | | 457,641 | |
| FNMA, 3.50%, 5/1/42 | 147,312 | | 138,038 | |
| FNMA, 2.50%, 6/1/42 | 444,761 | | 387,276 | |
| FNMA, 3.50%, 6/1/42 | 34,592 | | 32,413 | |
| FNMA, 3.00%, 6/1/50 | 753,761 | | 666,308 | |
| FNMA, 3.00%, 6/1/51 | 60,466 | | 54,079 | |
| FNMA, 2.50%, 12/1/51 | 724,692 | | 616,112 | |
| FNMA, 3.00%, 2/1/52 | 517,609 | | 457,197 | |
| FNMA, 2.00%, 3/1/52 | 1,159,452 | | 951,063 | |
| FNMA, 2.50%, 3/1/52 | 521,595 | | 445,252 | |
| FNMA, 3.00%, 3/1/52 | 823,263 | | 729,729 | |
| FNMA, 3.00%, 4/1/52 | 216,316 | | 191,072 | |
| FNMA, 3.50%, 4/1/52 | 273,802 | | 249,163 | |
| FNMA, 4.00%, 4/1/52 | 588,868 | | 556,761 | |
| FNMA, 4.00%, 4/1/52 | 320,175 | | 302,802 | |
| FNMA, 4.00%, 4/1/52 | 197,883 | | 186,135 | |
| FNMA, 3.00%, 5/1/52 | 428,476 | | 379,975 | |
| FNMA, 3.50%, 5/1/52 | 901,206 | | 822,312 | |
| FNMA, 3.50%, 5/1/52 | 860,968 | | 793,443 | |
| FNMA, 3.00%, 6/1/52 | 191,392 | | 169,727 | |
| FNMA, 4.50%, 7/1/52 | 573,195 | | 552,696 | |
| FNMA, 5.00%, 8/1/52 | 1,370,177 | | 1,352,884 | |
| FNMA, 5.00%, 9/1/52 | 402,188 | | 398,569 | |
| FNMA, 5.00%, 10/1/52 | 638,227 | | 630,621 | |
| FNMA, 5.50%, 10/1/52 | 678,544 | | 681,398 | |
| GNMA, 7.00%, 4/20/26 | 2,240 | | 2,262 | |
| GNMA, 7.50%, 8/15/26 | 1,640 | | 1,664 | |
| GNMA, 6.50%, 5/15/28 | 582 | | 599 | |
| GNMA, 6.50%, 5/15/28 | 160 | | 164 | |
| GNMA, 7.00%, 5/15/31 | 7,553 | | 7,861 | |
| GNMA, 5.50%, 11/15/32 | 13,707 | | 14,448 | |
| GNMA, 4.50%, 1/15/40 | 11,769 | | 11,694 | |
| GNMA, 4.50%, 6/15/41 | 21,107 | | 20,992 | |
| GNMA, 3.50%, 3/15/46 | 191,756 | | 180,660 | |
| GNMA, 3.00%, 4/20/50 | 223,838 | | 201,348 | |
| GNMA, 3.00%, 5/20/50 | 227,909 | | 204,893 | |
| GNMA, 3.00%, 6/20/50 | 341,801 | | 308,385 | |
| GNMA, 3.00%, 7/20/50 | 603,314 | | 542,069 | |
| | | | | | | | |
| Shares/
Principal Amount | Value |
| GNMA, 2.00%, 10/20/50 | $ | 1,813,753 | | $ | 1,533,068 | |
| GNMA, 2.50%, 11/20/50 | 752,235 | | 633,339 | |
| GNMA, 2.50%, 2/20/51 | 706,394 | | 615,766 | |
| GNMA, 3.50%, 6/20/51 | 560,231 | | 520,088 | |
| GNMA, 2.50%, 9/20/51 | 453,860 | | 394,451 | |
| GNMA, 5.50%, 9/20/52 | 501,365 | | 505,368 | |
| GNMA, 5.50%, 12/20/52 | 651,000 | | 655,655 | |
| | 30,491,968 | |
TOTAL U.S. GOVERNMENT AGENCY MORTGAGE-BACKED SECURITIES (Cost $32,202,893) | 30,645,764 | |
| CORPORATE BONDS — 9.3% | | |
| Aerospace and Defense — 0.1% | | |
| Lockheed Martin Corp., 5.25%, 1/15/33 | 75,000 | | 77,573 | |
| Raytheon Technologies Corp., 4.125%, 11/16/28 | 210,000 | | 201,424 | |
| Raytheon Technologies Corp., 3.125%, 7/1/50 | 100,000 | | 70,481 | |
| | 349,478 | |
Air Freight and Logistics† | | |
| GXO Logistics, Inc., 2.65%, 7/15/31 | 115,000 | | 85,176 | |
| Airlines — 0.1% | | |
British Airways Pass Through Trust, Series 2021-1, Class A, 2.90%, 9/15/36(3) | 28,537 | | 23,309 | |
Delta Air Lines, Inc. / SkyMiles IP Ltd., 4.75%, 10/20/28(3) | 101,000 | | 95,093 | |
Mileage Plus Holdings LLC / Mileage Plus Intellectual Property Assets Ltd., 6.50%, 6/20/27(3) | 107,466 | | 107,079 | |
| | 225,481 | |
Auto Components† | | |
| Aptiv PLC, 3.10%, 12/1/51 | 50,000 | | 29,742 | |
| Automobiles — 0.2% | | |
| General Motors Co., 5.15%, 4/1/38 | 71,000 | | 61,507 | |
| General Motors Financial Co., Inc., 2.75%, 6/20/25 | 274,000 | | 256,741 | |
| General Motors Financial Co., Inc., 2.40%, 10/15/28 | 108,000 | | 89,750 | |
| Toyota Motor Credit Corp., 1.90%, 4/6/28 | 140,000 | | 121,976 | |
| | 529,974 | |
| Banks — 1.5% | | |
| Banco Santander SA, VRN, 1.72%, 9/14/27 | 200,000 | | 171,082 | |
| Bank of America Corp., VRN, 3.38%, 4/2/26 | 145,000 | | 138,603 | |
| Bank of America Corp., VRN, 2.55%, 2/4/28 | 90,000 | | 80,063 | |
| Bank of America Corp., VRN, 6.20%, 11/10/28 | 127,000 | | 131,352 | |
| Bank of America Corp., VRN, 3.42%, 12/20/28 | 446,000 | | 404,619 | |
| Bank of America Corp., VRN, 2.88%, 10/22/30 | 241,000 | | 202,119 | |
| Bank of America Corp., VRN, 4.57%, 4/27/33 | 90,000 | | 82,578 | |
| Bank of America Corp., VRN, 5.02%, 7/22/33 | 93,000 | | 88,568 | |
| Bank of America Corp., VRN, 2.48%, 9/21/36 | 120,000 | | 88,447 | |
Bank of Ireland Group PLC, VRN, 2.03%, 9/30/27(3) | 200,000 | | 169,133 | |
| Bank of Nova Scotia, 5.25%, 12/6/24 | 110,000 | | 110,286 | |
| Citigroup, Inc., VRN, 3.07%, 2/24/28 | 169,000 | | 152,600 | |
| Citigroup, Inc., VRN, 3.67%, 7/24/28 | 60,000 | | 55,198 | |
| Citigroup, Inc., VRN, 3.52%, 10/27/28 | 179,000 | | 163,615 | |
| Citigroup, Inc., VRN, 3.79%, 3/17/33 | 60,000 | | 51,479 | |
| FNB Corp., 2.20%, 2/24/23 | 140,000 | | 139,305 | |
| HSBC Holdings PLC, VRN, 0.73%, 8/17/24 | 200,000 | | 192,772 | |
| HSBC Holdings PLC, VRN, 2.80%, 5/24/32 | 80,000 | | 62,079 | |
| | | | | | | | |
| Shares/
Principal Amount | Value |
| HSBC Holdings PLC, VRN, 5.40%, 8/11/33 | $ | 200,000 | | $ | 185,770 | |
| JPMorgan Chase & Co., VRN, 1.58%, 4/22/27 | 105,000 | | 92,381 | |
| JPMorgan Chase & Co., VRN, 2.95%, 2/24/28 | 272,000 | | 246,442 | |
| JPMorgan Chase & Co., VRN, 2.07%, 6/1/29 | 224,000 | | 187,471 | |
| JPMorgan Chase & Co., VRN, 2.52%, 4/22/31 | 624,000 | | 511,989 | |
National Australia Bank Ltd., 2.33%, 8/21/30(3) | 250,000 | | 190,854 | |
| Royal Bank of Canada, 6.00%, 11/1/27 | 175,000 | | 182,745 | |
| Toronto-Dominion Bank, 2.00%, 9/10/31 | 106,000 | | 83,732 | |
| Toronto-Dominion Bank, 2.45%, 1/12/32 | 110,000 | | 89,385 | |
| Toronto-Dominion Bank, 4.46%, 6/8/32 | 59,000 | | 56,415 | |
| Truist Financial Corp., VRN, 4.12%, 6/6/28 | 55,000 | | 52,727 | |
| US Bancorp, VRN, 5.85%, 10/21/33 | 60,000 | | 62,482 | |
| Wells Fargo & Co., VRN, 4.54%, 8/15/26 | 82,000 | | 80,438 | |
| Wells Fargo & Co., VRN, 3.35%, 3/2/33 | 81,000 | | 68,452 | |
| Wells Fargo & Co., VRN, 3.07%, 4/30/41 | 210,000 | | 150,567 | |
| Wells Fargo & Co., VRN, 4.61%, 4/25/53 | 61,000 | | 51,970 | |
| | 4,777,718 | |
| Beverages — 0.2% | | |
| Anheuser-Busch Cos. LLC / Anheuser-Busch InBev Worldwide, Inc., 4.90%, 2/1/46 | 165,000 | | 150,829 | |
| Anheuser-Busch InBev Finance, Inc., 4.90%, 2/1/46 | 35,000 | | 31,994 | |
| Anheuser-Busch InBev Worldwide, Inc., 4.75%, 1/23/29 | 240,000 | | 237,417 | |
| Keurig Dr Pepper, Inc., 4.05%, 4/15/32 | 60,000 | | 54,751 | |
| PepsiCo, Inc., 3.90%, 7/18/32 | 48,000 | | 45,407 | |
| | 520,398 | |
| Biotechnology — 0.2% | | |
| AbbVie, Inc., 3.20%, 11/21/29 | 290,000 | | 262,088 | |
| AbbVie, Inc., 4.40%, 11/6/42 | 200,000 | | 174,397 | |
| Amgen, Inc., 4.05%, 8/18/29 | 315,000 | | 295,076 | |
| | 731,561 | |
| Capital Markets — 1.0% | | |
| Deutsche Bank AG, 5.37%, 9/9/27 | 180,000 | | 180,710 | |
| Deutsche Bank AG, VRN, 4.30%, 5/24/28 | 200,000 | | 188,183 | |
| Goldman Sachs Group, Inc., VRN, 1.76%, 1/24/25 | 208,000 | | 199,173 | |
| Goldman Sachs Group, Inc., VRN, 1.95%, 10/21/27 | 252,000 | | 220,674 | |
| Goldman Sachs Group, Inc., VRN, 2.64%, 2/24/28 | 245,000 | | 218,494 | |
| Goldman Sachs Group, Inc., VRN, 3.81%, 4/23/29 | 36,000 | | 32,948 | |
| Goldman Sachs Group, Inc., VRN, 1.99%, 1/27/32 | 320,000 | | 244,513 | |
| Golub Capital BDC, Inc., 2.50%, 8/24/26 | 59,000 | | 50,161 | |
| Morgan Stanley, VRN, 0.53%, 1/25/24 | 410,000 | | 407,260 | |
| Morgan Stanley, VRN, 1.16%, 10/21/25 | 198,000 | | 182,393 | |
| Morgan Stanley, VRN, 2.63%, 2/18/26 | 402,000 | | 377,792 | |
| Morgan Stanley, VRN, 2.70%, 1/22/31 | 175,000 | | 144,987 | |
| Morgan Stanley, VRN, 2.51%, 10/20/32 | 105,000 | | 82,450 | |
| Morgan Stanley, VRN, 6.34%, 10/18/33 | 140,000 | | 147,140 | |
| Morgan Stanley, VRN, 2.48%, 9/16/36 | 54,000 | | 39,279 | |
| Owl Rock Capital Corp., 3.40%, 7/15/26 | 25,000 | | 21,858 | |
| Owl Rock Core Income Corp., 3.125%, 9/23/26 | 64,000 | | 54,547 | |
UBS Group AG, VRN, 1.49%, 8/10/27(3) | 420,000 | | 361,867 | |
| | 3,154,429 | |
| | | | | | | | |
| Shares/
Principal Amount | Value |
Chemicals† | | |
| CF Industries, Inc., 5.15%, 3/15/34 | $ | 64,000 | | $ | 60,786 | |
| CF Industries, Inc., 4.95%, 6/1/43 | 80,000 | | 68,788 | |
| | 129,574 | |
| Commercial Services and Supplies — 0.1% | | |
| Republic Services, Inc., 2.30%, 3/1/30 | 115,000 | | 96,505 | |
| Waste Connections, Inc., 3.20%, 6/1/32 | 142,000 | | 122,215 | |
| Waste Management, Inc., 2.50%, 11/15/50 | 100,000 | | 62,753 | |
| | 281,473 | |
Construction and Engineering† | | |
| Quanta Services, Inc., 2.35%, 1/15/32 | 165,000 | | 125,698 | |
Construction Materials† | | |
| Eagle Materials, Inc., 2.50%, 7/1/31 | 116,000 | | 91,276 | |
| Containers and Packaging — 0.1% | | |
| Sonoco Products Co., 2.25%, 2/1/27 | 157,000 | | 139,824 | |
| WRKCo, Inc., 3.00%, 9/15/24 | 72,000 | | 68,855 | |
| | 208,679 | |
| Diversified Consumer Services — 0.1% | | |
| Duke University, 3.30%, 10/1/46 | 110,000 | | 82,444 | |
| Novant Health, Inc., 3.17%, 11/1/51 | 85,000 | | 59,109 | |
| Pepperdine University, 3.30%, 12/1/59 | 105,000 | | 66,347 | |
| | 207,900 | |
Diversified Financial Services† | | |
| Block Financial LLC, 3.875%, 8/15/30 | 158,000 | | 138,604 | |
| Diversified Telecommunication Services — 0.4% | | |
| AT&T, Inc., 4.35%, 3/1/29 | 124,000 | | 118,182 | |
| AT&T, Inc., 4.50%, 5/15/35 | 142,000 | | 129,582 | |
| AT&T, Inc., 4.90%, 8/15/37 | 137,000 | | 126,450 | |
| AT&T, Inc., 4.55%, 3/9/49 | 80,000 | | 65,982 | |
Ooredoo International Finance Ltd., 2.625%, 4/8/31(3) | 200,000 | | 172,346 | |
| Telefonica Emisiones SA, 4.90%, 3/6/48 | 320,000 | | 247,249 | |
| Verizon Communications, Inc., 4.33%, 9/21/28 | 113,000 | | 108,874 | |
| Verizon Communications, Inc., 4.27%, 1/15/36 | 195,000 | | 174,288 | |
| | 1,142,953 | |
| Electric Utilities — 0.7% | | |
| AEP Texas, Inc., 2.10%, 7/1/30 | 130,000 | | 105,687 | |
| Baltimore Gas & Electric Co., 2.25%, 6/15/31 | 81,000 | | 65,821 | |
| Baltimore Gas & Electric Co., 4.55%, 6/1/52 | 58,000 | | 51,552 | |
| CenterPoint Energy Houston Electric LLC, 4.45%, 10/1/32 | 140,000 | | 135,404 | |
| Commonwealth Edison Co., 3.20%, 11/15/49 | 115,000 | | 82,345 | |
| Duke Energy Carolinas LLC, 2.55%, 4/15/31 | 54,000 | | 45,213 | |
| Duke Energy Corp., 2.55%, 6/15/31 | 60,000 | | 49,039 | |
| Duke Energy Corp., 5.00%, 8/15/52 | 80,000 | | 71,421 | |
| Duke Energy Florida LLC, 1.75%, 6/15/30 | 120,000 | | 95,664 | |
| Duke Energy Florida LLC, 3.85%, 11/15/42 | 30,000 | | 24,239 | |
| Duke Energy Florida LLC, 5.95%, 11/15/52 | 50,000 | | 53,533 | |
| Duke Energy Progress LLC, 2.00%, 8/15/31 | 160,000 | | 126,834 | |
| Duke Energy Progress LLC, 4.15%, 12/1/44 | 115,000 | | 96,350 | |
| Entergy Arkansas LLC, 2.65%, 6/15/51 | 60,000 | | 36,438 | |
| Exelon Corp., 4.45%, 4/15/46 | 60,000 | | 50,970 | |
Exelon Corp., 4.10%, 3/15/52(3) | 27,000 | | 21,718 | |
| | | | | | | | |
| Shares/
Principal Amount | Value |
| Florida Power & Light Co., 2.45%, 2/3/32 | $ | 84,000 | | $ | 70,213 | |
| Florida Power & Light Co., 4.125%, 2/1/42 | 69,000 | | 60,085 | |
| MidAmerican Energy Co., 4.40%, 10/15/44 | 110,000 | | 97,705 | |
| NextEra Energy Capital Holdings, Inc., 5.00%, 7/15/32 | 128,000 | | 125,928 | |
| Northern States Power Co., 3.20%, 4/1/52 | 90,000 | | 64,451 | |
| Pacific Gas & Electric Co., 4.20%, 6/1/41 | 55,000 | | 40,923 | |
| PacifiCorp, 3.30%, 3/15/51 | 100,000 | | 72,300 | |
| PECO Energy Co., 4.375%, 8/15/52 | 130,000 | | 115,097 | |
| Public Service Co. of Colorado, 1.875%, 6/15/31 | 108,000 | | 86,245 | |
| Public Service Electric & Gas Co., 3.10%, 3/15/32 | 102,000 | | 89,451 | |
| Southern Co. Gas Capital Corp., 1.75%, 1/15/31 | 140,000 | | 107,642 | |
| Union Electric Co., 3.90%, 4/1/52 | 84,000 | | 68,124 | |
| Xcel Energy, Inc., 3.40%, 6/1/30 | 120,000 | | 107,332 | |
| Xcel Energy, Inc., 4.60%, 6/1/32 | 48,000 | | 45,985 | |
| | 2,263,709 | |
Energy Equipment and Services† | | |
| Schlumberger Investment SA, 2.65%, 6/26/30 | 120,000 | | 103,222 | |
| Entertainment — 0.1% | | |
Warnermedia Holdings, Inc., 3.76%, 3/15/27(3) | 88,000 | | 79,372 | |
Warnermedia Holdings, Inc., 5.05%, 3/15/42(3) | 132,000 | | 101,458 | |
Warnermedia Holdings, Inc., 5.14%, 3/15/52(3) | 40,000 | | 29,233 | |
| | 210,063 | |
| Equity Real Estate Investment Trusts (REITs) — 0.2% | | |
| Alexandria Real Estate Equities, Inc., 4.50%, 7/30/29 | 13,000 | | 12,341 | |
| American Tower Corp., 3.95%, 3/15/29 | 140,000 | | 129,350 | |
| Broadstone Net Lease LLC, 2.60%, 9/15/31 | 63,000 | | 47,368 | |
| Corporate Office Properties LP, 2.00%, 1/15/29 | 74,000 | | 56,894 | |
| EPR Properties, 4.75%, 12/15/26 | 24,000 | | 21,596 | |
| Equinix, Inc., 2.90%, 11/18/26 | 205,000 | | 187,650 | |
| GLP Capital LP / GLP Financing II, Inc., 5.375%, 4/15/26 | 150,000 | | 147,405 | |
| National Retail Properties, Inc., 4.80%, 10/15/48 | 96,000 | | 80,120 | |
| Realty Income Corp., 3.25%, 1/15/31 | 110,000 | | 95,662 | |
| | 778,386 | |
| Food and Staples Retailing — 0.1% | | |
| Sysco Corp., 5.95%, 4/1/30 | 173,000 | | 179,474 | |
| Food Products — 0.2% | | |
JDE Peet's NV, 2.25%, 9/24/31(3) | 197,000 | | 149,387 | |
| Kraft Heinz Foods Co., 3.875%, 5/15/27 | 120,000 | | 114,837 | |
| Kraft Heinz Foods Co., 5.00%, 6/4/42 | 132,000 | | 119,993 | |
| Mondelez International, Inc., 2.625%, 3/17/27 | 120,000 | | 108,965 | |
| | 493,182 | |
Gas Utilities† | | |
| Southern California Gas Co., 6.35%, 11/15/52 | 62,000 | | 68,217 | |
| Health Care Equipment and Supplies — 0.3% | | |
| Baxter International, Inc., 1.92%, 2/1/27 | 173,000 | | 153,625 | |
| Baxter International, Inc., 2.54%, 2/1/32 | 250,000 | | 199,247 | |
GE HealthCare Technologies, Inc., 5.65%, 11/15/27(3) | 280,000 | | 283,768 | |
| Zimmer Biomet Holdings, Inc., 1.45%, 11/22/24 | 310,000 | | 288,419 | |
| | 925,059 | |
| Health Care Providers and Services — 0.6% | | |
| Centene Corp., 2.45%, 7/15/28 | 190,000 | | 160,734 | |
| | | | | | | | |
| Shares/
Principal Amount | Value |
| Centene Corp., 4.625%, 12/15/29 | $ | 85,000 | | $ | 77,868 | |
| Centene Corp., 3.375%, 2/15/30 | 136,000 | | 115,277 | |
| CVS Health Corp., 4.78%, 3/25/38 | 30,000 | | 27,448 | |
| CVS Health Corp., 5.05%, 3/25/48 | 85,000 | | 76,724 | |
| Duke University Health System, Inc., 3.92%, 6/1/47 | 30,000 | | 24,827 | |
| HCA, Inc., 2.375%, 7/15/31 | 80,000 | | 62,468 | |
| Humana, Inc., 2.15%, 2/3/32 | 398,000 | | 311,606 | |
| Kaiser Foundation Hospitals, 3.00%, 6/1/51 | 105,000 | | 72,011 | |
| UnitedHealth Group, Inc., 5.35%, 2/15/33 | 450,000 | | 465,743 | |
| UnitedHealth Group, Inc., 5.875%, 2/15/53 | 95,000 | | 103,203 | |
| Univision Communications, Inc., 1.65%, 9/1/26 | 147,000 | | 126,185 | |
| Univision Communications, Inc., 2.65%, 10/15/30 | 150,000 | | 119,728 | |
| | 1,743,822 | |
Hotels, Restaurants and Leisure† | | |
| Marriott International, Inc., 3.50%, 10/15/32 | 80,000 | | 66,771 | |
| Household Durables — 0.1% | | |
| D.R. Horton, Inc., 2.50%, 10/15/24 | 90,000 | | 85,761 | |
| Safehold Operating Partnership LP, 2.85%, 1/15/32 | 115,000 | | 87,594 | |
| | 173,355 | |
| Household Products — 0.1% | | |
| Clorox Co., 4.60%, 5/1/32 | 251,000 | | 242,207 | |
Insurance† | | |
Athene Global Funding, 1.99%, 8/19/28(3) | 67,000 | | 54,022 | |
Sammons Financial Group, Inc., 4.75%, 4/8/32(3) | 58,000 | | 48,594 | |
SBL Holdings, Inc., 5.125%, 11/13/26(3) | 32,000 | | 28,080 | |
| | 130,696 | |
| Internet and Direct Marketing Retail — 0.2% | | |
| Amazon.com, Inc., 4.70%, 11/29/24 | 125,000 | | 125,181 | |
| Amazon.com, Inc., 4.60%, 12/1/25 | 125,000 | | 124,833 | |
| Amazon.com, Inc., 4.55%, 12/1/27 | 60,000 | | 59,910 | |
| Amazon.com, Inc., 3.60%, 4/13/32 | 295,000 | | 270,833 | |
| | 580,757 | |
IT Services† | | |
| Fiserv, Inc., 2.65%, 6/1/30 | 130,000 | | 109,582 | |
Life Sciences Tools and Services† | | |
| Danaher Corp., 2.80%, 12/10/51 | 115,000 | | 76,537 | |
| Machinery — 0.1% | | |
| John Deere Capital Corp., 4.85%, 10/11/29 | 59,000 | | 59,199 | |
| John Deere Capital Corp., 4.35%, 9/15/32 | 200,000 | | 194,922 | |
| | 254,121 | |
| Media — 0.2% | | |
| Charter Communications Operating LLC / Charter Communications Operating Capital, 5.125%, 7/1/49 | 75,000 | | 57,011 | |
| Charter Communications Operating LLC / Charter Communications Operating Capital, 3.70%, 4/1/51 | 120,000 | | 73,399 | |
| Comcast Corp., 5.65%, 6/15/35 | 99,000 | | 104,116 | |
| Comcast Corp., 6.50%, 11/15/35 | 80,000 | | 89,321 | |
| Comcast Corp., 3.75%, 4/1/40 | 155,000 | | 128,475 | |
| Comcast Corp., 2.94%, 11/1/56 | 105,000 | | 65,414 | |
| Fox Corp., 5.48%, 1/25/39 | 52,000 | | 47,520 | |
| Paramount Global, 4.95%, 1/15/31 | 65,000 | | 57,922 | |
| Paramount Global, 4.375%, 3/15/43 | 50,000 | | 34,599 | |
| | | | | | | | |
| Shares/
Principal Amount | Value |
| Time Warner Cable LLC, 4.50%, 9/15/42 | $ | 170,000 | | $ | 125,065 | |
| | 782,842 | |
| Metals and Mining — 0.1% | | |
Glencore Funding LLC, 2.625%, 9/23/31(3) | 160,000 | | 127,858 | |
| Nucor Corp., 3.125%, 4/1/32 | 73,000 | | 62,078 | |
South32 Treasury Ltd., 4.35%, 4/14/32(3) | 120,000 | | 102,994 | |
| | 292,930 | |
| Multi-Utilities — 0.2% | | |
| Ameren Corp., 3.50%, 1/15/31 | 150,000 | | 133,040 | |
| Ameren Illinois Co., 3.85%, 9/1/32 | 70,000 | | 65,243 | |
| Ameren Illinois Co., 5.90%, 12/1/52 | 38,000 | | 41,515 | |
| CenterPoint Energy, Inc., 2.65%, 6/1/31 | 98,000 | | 81,162 | |
| Dominion Energy, Inc., 4.90%, 8/1/41 | 90,000 | | 79,898 | |
| Dominion Energy, Inc., 4.85%, 8/15/52 | 80,000 | | 69,514 | |
| Sempra Energy, 3.25%, 6/15/27 | 30,000 | | 27,798 | |
| WEC Energy Group, Inc., 1.375%, 10/15/27 | 170,000 | | 144,477 | |
| | 642,647 | |
| Oil, Gas and Consumable Fuels — 0.8% | | |
Aker BP ASA, 3.75%, 1/15/30(3) | 300,000 | | 264,571 | |
| BP Capital Markets America, Inc., 3.06%, 6/17/41 | 90,000 | | 66,985 | |
| Cenovus Energy, Inc., 2.65%, 1/15/32 | 100,000 | | 80,101 | |
Continental Resources, Inc., 2.27%, 11/15/26(3) | 107,000 | | 92,850 | |
| Diamondback Energy, Inc., 6.25%, 3/15/33 | 120,000 | | 122,171 | |
| Enbridge, Inc., 3.40%, 8/1/51 | 50,000 | | 34,167 | |
| Energy Transfer LP, 3.60%, 2/1/23 | 30,000 | | 29,943 | |
| Energy Transfer LP, 4.25%, 3/15/23 | 110,000 | | 109,740 | |
| Energy Transfer LP, 3.75%, 5/15/30 | 150,000 | | 132,599 | |
| Energy Transfer LP, 5.75%, 2/15/33 | 121,000 | | 118,614 | |
| Energy Transfer LP, 4.90%, 3/15/35 | 95,000 | | 84,938 | |
| Enterprise Products Operating LLC, 4.85%, 3/15/44 | 150,000 | | 132,942 | |
| Enterprise Products Operating LLC, 3.30%, 2/15/53 | 79,000 | | 52,906 | |
| Equinor ASA, 3.25%, 11/18/49 | 70,000 | | 51,188 | |
Galaxy Pipeline Assets Bidco Ltd., 2.94%, 9/30/40(3) | 314,122 | | 253,672 | |
| Kinder Morgan Energy Partners LP, 6.50%, 9/1/39 | 85,000 | | 86,048 | |
| MPLX LP, 2.65%, 8/15/30 | 110,000 | | 89,392 | |
| Petroleos Mexicanos, 3.50%, 1/30/23 | 80,000 | | 79,778 | |
SA Global Sukuk Ltd., 2.69%, 6/17/31(3) | 325,000 | | 278,394 | |
| Sabine Pass Liquefaction LLC, 5.625%, 3/1/25 | 190,000 | | 190,411 | |
| Shell International Finance BV, 2.375%, 11/7/29 | 120,000 | | 103,977 | |
| Shell International Finance BV, 4.375%, 5/11/45 | 70,000 | | 61,512 | |
| | 2,516,899 | |
Paper and Forest Products† | | |
Georgia-Pacific LLC, 2.10%, 4/30/27(3) | 130,000 | | 116,661 | |
| Pharmaceuticals — 0.2% | | |
| Bristol-Myers Squibb Co., 2.95%, 3/15/32 | 155,000 | | 135,288 | |
| Bristol-Myers Squibb Co., 2.55%, 11/13/50 | 113,000 | | 71,293 | |
| Merck & Co., Inc., 1.70%, 6/10/27 | 115,000 | | 102,128 | |
| Utah Acquisition Sub, Inc., 3.95%, 6/15/26 | 290,000 | | 271,468 | |
| Viatris, Inc., 4.00%, 6/22/50 | 28,000 | | 17,348 | |
| Zoetis, Inc., 5.60%, 11/16/32 | 149,000 | | 154,937 | |
| | 752,462 | |
| | | | | | | | |
| Shares/
Principal Amount | Value |
Real Estate Management and Development† | | |
| Essential Properties LP, 2.95%, 7/15/31 | $ | 110,000 | | $ | 80,241 | |
| Road and Rail — 0.2% | | |
Ashtead Capital, Inc., 5.50%, 8/11/32(3) | 150,000 | | 143,909 | |
| Burlington Northern Santa Fe LLC, 4.15%, 4/1/45 | 105,000 | | 90,175 | |
| Burlington Northern Santa Fe LLC, 3.30%, 9/15/51 | 70,000 | | 51,299 | |
| CSX Corp., 4.10%, 11/15/32 | 100,000 | | 94,061 | |
| Norfolk Southern Corp., 4.55%, 6/1/53 | 80,000 | | 69,982 | |
| Union Pacific Corp., 3.55%, 8/15/39 | 160,000 | | 132,782 | |
United Rentals North America, Inc., 6.00%, 12/15/29(3) | 65,000 | | 64,719 | |
| | 646,927 | |
| Semiconductors and Semiconductor Equipment — 0.1% | | |
Broadcom, Inc., 4.00%, 4/15/29(3) | 97,000 | | 88,319 | |
Broadcom, Inc., 4.93%, 5/15/37(3) | 103,000 | | 90,223 | |
| Intel Corp., 3.20%, 8/12/61 | 157,000 | | 99,049 | |
| Micron Technology, Inc., 6.75%, 11/1/29 | 95,000 | | 96,713 | |
| QUALCOMM, Inc., 5.40%, 5/20/33 | 40,000 | | 41,781 | |
| QUALCOMM, Inc., 6.00%, 5/20/53 | 35,000 | | 37,395 | |
| | 453,480 | |
| Software — 0.1% | | |
| Oracle Corp., 3.90%, 5/15/35 | 95,000 | | 79,757 | |
| Oracle Corp., 3.85%, 7/15/36 | 57,000 | | 46,805 | |
| Oracle Corp., 3.60%, 4/1/40 | 95,000 | | 70,037 | |
| | 196,599 | |
| Specialty Retail — 0.3% | | |
| Dick's Sporting Goods, Inc., 3.15%, 1/15/32 | 180,000 | | 140,929 | |
| Home Depot, Inc., 3.90%, 6/15/47 | 320,000 | | 264,698 | |
| Lowe's Cos., Inc., 2.625%, 4/1/31 | 225,000 | | 186,986 | |
| Lowe's Cos., Inc., 4.25%, 4/1/52 | 250,000 | | 199,450 | |
| O'Reilly Automotive, Inc., 4.70%, 6/15/32 | 93,000 | | 90,174 | |
| | 882,237 | |
| Technology Hardware, Storage and Peripherals — 0.1% | | |
| Apple, Inc., 3.25%, 8/8/29 | 230,000 | | 213,116 | |
| Apple, Inc., 3.95%, 8/8/52 | 125,000 | | 106,936 | |
| Dell International LLC / EMC Corp., 8.10%, 7/15/36 | 39,000 | | 43,855 | |
| | 363,907 | |
Trading Companies and Distributors† | | |
Aircastle Ltd., 5.25%, 8/11/25(3) | 78,000 | | 75,090 | |
| Water Utilities — 0.1% | | |
| American Water Capital Corp., 4.45%, 6/1/32 | 180,000 | | 172,752 | |
| Essential Utilities, Inc., 2.70%, 4/15/30 | 130,000 | | 109,328 | |
| | 282,080 | |
| Wireless Telecommunication Services — 0.2% | | |
| T-Mobile USA, Inc., 4.75%, 2/1/28 | 312,000 | | 304,042 | |
| T-Mobile USA, Inc., 3.375%, 4/15/29 | 230,000 | | 203,020 | |
| T-Mobile USA, Inc., 4.375%, 4/15/40 | 105,000 | | 90,038 | |
| | 597,100 | |
TOTAL CORPORATE BONDS (Cost $33,645,791) | | 29,811,376 | |
| COLLATERALIZED LOAN OBLIGATIONS — 2.8% | | |
ABPCI Direct Lending Fund CLO IV Ltd., Series 2017-2A, Class BR, VRN, 6.26%, (3-month LIBOR plus 1.90%), 10/27/33(3) | 200,000 | | 186,999 | |
| | | | | | | | |
| Shares/
Principal Amount | Value |
AIMCO CLO Ltd., Series 2019-10A, Class BR, VRN, 5.92%, (3-month LIBOR plus 1.60%), 7/22/32(3) | $ | 275,000 | | $ | 266,271 | |
Arbor Realty Collateralized Loan Obligation Ltd., Series 2020-FL1, Class AS, VRN, 5.85%, (1-month SOFR plus 1.51%), 2/15/35(3) | 218,000 | | 213,248 | |
Arbor Realty Commercial Real Estate Notes Ltd., Series 2019-FL2, Class A, VRN, 5.65%, (1-month SOFR plus 1.31%), 9/15/34(3) | 156,839 | | 156,595 | |
ARES LII CLO Ltd., Series 2019-52A, Class BR, VRN, 5.97%, (3-month LIBOR plus 1.65%), 4/22/31(3) | 200,000 | | 193,103 | |
Ares XL CLO Ltd., Series 2016-40A, Class BRR, VRN, 5.88%, (3-month LIBOR plus 1.80%), 1/15/29(3) | 250,000 | | 237,909 | |
BDS Ltd., Series 2021-FL7, Class C, VRN, 6.04%, (1-month LIBOR plus 1.70%), 6/16/36(3) | 400,000 | | 377,944 | |
BDS Ltd., Series 2021-FL8, Class C, VRN, 5.89%, (1-month LIBOR plus 1.55%), 1/18/36(3) | 200,000 | | 187,912 | |
BDS Ltd., Series 2021-FL8, Class D, VRN, 6.24%, (1-month LIBOR plus 1.90%), 1/18/36(3) | 150,000 | | 138,739 | |
Bean Creek CLO Ltd., Series 2015-1A, Class AR, VRN, 5.26%, (3-month LIBOR plus 1.02%), 4/20/31(3) | 200,000 | | 195,870 | |
BXMT Ltd., Series 2020-FL2, Class C, VRN, 6.09%, (1-month SOFR plus 1.76%), 2/15/38(3) | 386,000 | | 372,621 | |
Canyon Capital CLO Ltd., Series 2017-1A, Class BR, VRN, 5.68%, (3-month LIBOR plus 1.60%), 7/15/30(3) | 125,000 | | 121,081 | |
Carlyle Global Market Strategies CLO Ltd., Series 2013-1A, Class BRR, VRN, 6.85%, (3-month LIBOR plus 2.20%), 8/14/30(3) | 225,000 | | 215,657 | |
Carlyle Global Market Strategies CLO Ltd., Series 2019-2A, Class A2R, VRN, 5.73%, (3-month LIBOR plus 1.65%), 7/15/32(3) | 305,000 | | 294,506 | |
CarVal CLO III Ltd., Series 2019-2A, Class BR, VRN, 5.84%, (3-month LIBOR plus 1.60%), 7/20/32(3) | 250,000 | | 242,300 | |
Cedar Funding X CLO Ltd., Series 2019-10A, Class BR, VRN, 5.84%, (3-month LIBOR plus 1.60%), 10/20/32(3) | 175,000 | | 169,631 | |
Cerberus Loan Funding XXXIII LP, Series 2021-3A, Class A, VRN, 5.64%, (3-month LIBOR plus 1.56%), 7/23/33(3) | 275,000 | | 264,092 | |
Cerberus Loan Funding XXXIX LP, Series 2022-3A, Class A, VRN, 7.03%, (3-month SOFR plus 2.40%), 1/20/33(3)(4) | 250,000 | | 250,000 | |
Cerberus Loan Funding XXXVI LP, Series 2021-6A, Class A, VRN, 5.48%, (3-month LIBOR plus 1.40%), 11/22/33(3) | 103,194 | | 102,754 | |
CFIP CLO Ltd., Series 2014-1A, Class AR, VRN, 5.26%, (3-month LIBOR plus 1.32%), 7/13/29(3) | 219,152 | | 218,624 | |
FS Rialto Issuer LLC, Series 2021-AFC1, Class A, SEQ, VRN, 6.90%, (1-month SOFR plus 2.58%), 8/17/37(3) | 216,000 | | 213,567 | |
KKR CLO Ltd., Series 2018, Class BR, VRN, 5.79%, (3-month LIBOR plus 1.60%), 7/18/30(3) | 200,000 | | 194,945 | |
KKR CLO Ltd., Series 2022A, Class A, VRN, 5.39%, (3-month LIBOR plus 1.15%), 7/20/31(3) | 175,000 | | 172,168 | |
KKR CLO Ltd., Series 2030A, Class BR, VRN, 5.68%, (3-month LIBOR plus 1.60%), 10/17/31(3) | 275,000 | | 267,427 | |
KREF Ltd., Series 2021-FL2, Class B, VRN, 5.98%, (1-month LIBOR plus 1.65%), 2/15/39(3) | 300,000 | | 287,658 | |
Madison Park Funding XXXVII Ltd., Series 2019-37A, Class BR, VRN, 5.73%, (3-month LIBOR plus 1.65%), 7/15/33(3) | 375,000 | | 364,258 | |
MF1 Ltd., Series 2021-FL7, Class AS, VRN, 5.79%, (1-month LIBOR plus 1.45%), 10/16/36(3) | 350,000 | | 334,745 | |
| | | | | | | | |
| Shares/
Principal Amount | Value |
Octagon Investment Partners XV Ltd., Series 2013-1A, Class BRR, VRN, 5.73%, (3-month LIBOR plus 1.50%), 7/19/30(3) | $ | 275,000 | | $ | 265,365 | |
Palmer Square Loan Funding Ltd., Series 2021-3A, Class A2, VRN, 5.64%, (3-month LIBOR plus 1.40%), 7/20/29(3) | 150,000 | | 146,114 | |
Palmer Square Loan Funding Ltd., Series 2022-2A, Class A2, VRN, 5.76%, (3-month SOFR plus 1.90%), 10/15/30(3) | 250,000 | | 243,870 | |
Parallel Ltd., Series 2019-1A, Class BR, VRN, 6.04%, (3-month LIBOR plus 1.80%), 7/20/32(3) | 300,000 | | 284,627 | |
Park Avenue Institutional Advisers CLO Ltd., Series 2018-1A, Class BR, VRN, 6.34%, (3-month LIBOR plus 2.10%), 10/20/31(3) | 250,000 | | 232,844 | |
PFP Ltd., Series 2021-8, Class C, VRN, 6.13%, (1-month LIBOR plus 1.80%), 8/9/37(3) | 292,000 | | 273,833 | |
Sound Point CLO XXII Ltd., Series 2019-1A, Class BR, VRN, 5.94%, (3-month LIBOR plus 1.70%), 1/20/32(3) | 275,000 | | 265,159 | |
TCW CLO Ltd., Series 2018-1A, Class BR, VRN, 6.01%, (3-month LIBOR plus 1.65%), 4/25/31(3) | 275,000 | | 264,046 | |
THL Credit Wind River CLO Ltd., Series 2013-2A, Class BR2, VRN, 5.76%, (3-month LIBOR plus 1.57%), 10/18/30(3) | 200,000 | | 193,805 | |
TSTAT Ltd., Series 2022-1A, Class B, VRN, 5.82%, (3-month SOFR plus 3.27%), 7/20/31(3) | 200,000 | | 197,224 | |
Wellfleet CLO Ltd., Series 2022-1A, Class B1, VRN, 6.21%, (3-month SOFR plus 2.35%), 4/15/34(3) | 200,000 | | 190,592 | |
TOTAL COLLATERALIZED LOAN OBLIGATIONS (Cost $9,088,949) | | 8,798,103 | |
| ASSET-BACKED SECURITIES — 2.5% | | |
321 Henderson Receivables VI LLC, Series 2010-1A, Class B, SEQ, 9.31%, 7/15/61(3) | 163,229 | | 165,840 | |
Aaset Trust, Series 2021-2A, Class A, SEQ, 2.80%, 1/15/47(3) | 516,886 | | 417,302 | |
Aligned Data Centers Issuer LLC, Series 2021-1A, Class A2, SEQ, 1.94%, 8/15/46(3) | 310,000 | | 265,403 | |
Aligned Data Centers Issuer LLC, Series 2021-1A, Class B, 2.48%, 8/15/46(3) | 226,000 | | 185,545 | |
Applebee's Funding LLC / IHOP Funding LLC, Series 2019-1A, Class A2I, SEQ, 4.19%, 6/5/49(3) | 175,230 | | 172,730 | |
Applebee's Funding LLC / IHOP Funding LLC, Series 2019-1A, Class A2II, SEQ, 4.72%, 6/5/49(3) | 297,000 | | 271,572 | |
Blackbird Capital Aircraft, Series 2021-1A, Class A, SEQ, 2.44%, 7/15/46(3) | 255,527 | | 210,164 | |
Castlelake Aircraft Structured Trust, Series 2017-1R, Class A, SEQ, 2.74%, 8/15/41(3) | 180,930 | | 158,320 | |
Clsec Holdings 22t LLC, Series 2021-1, Class B, 3.46%, 5/11/37(3) | 521,591 | | 441,752 | |
Credit Acceptance Auto Loan Trust, Series 2022-3A, Class B, 7.52%, 12/15/32(3) | 250,000 | | 252,237 | |
DI Issuer LLC, Series 2021-1A, Class A2, SEQ, 3.72%, 9/15/51(3) | 644,554 | | 565,431 | |
Edgeconnex Data Centers Issuer LLC, Series 2022-1, Class A2, SEQ, 4.25%, 3/25/52(3) | 336,740 | | 304,040 | |
FirstKey Homes Trust, Series 2021-SFR1, Class D, 2.19%, 8/17/38(3) | 300,000 | | 252,487 | |
FirstKey Homes Trust, Series 2021-SFR1, Class E1, 2.39%, 8/17/38(3) | 400,000 | | 334,488 | |
Flexential Issuer, Series 2021-FL8, Class A2, SEQ, 3.25%, 11/27/51(3) | 414,000 | | 361,846 | |
| | | | | | | | |
| Shares/
Principal Amount | Value |
Goodgreen Trust, Series 2018-1A, Class A, VRN, 3.93%, 10/15/53(3) | $ | 76,896 | | $ | 70,860 | |
Goodgreen Trust, Series 2020-1A, Class A, SEQ, 2.63%, 4/15/55(3) | 188,106 | | 155,142 | |
Goodgreen Trust, Series 2021-1A, Class A, SEQ, 2.66%, 10/15/56(3) | 146,596 | | 119,151 | |
J.G. Wentworth XLII LLC, Series 2018-2A, Class B, 4.70%, 10/15/77(3) | 197,566 | | 172,033 | |
J.G. Wentworth XXXIX LLC, Series 2017-2A, Class B, 5.09%, 9/17/74(3) | 58,442 | | 52,685 | |
Lunar Structured Aircraft Portfolio Notes, Series 2021-1, Class A, SEQ, 2.64%, 10/15/46(3) | 393,402 | | 316,248 | |
MAPS Trust, Series 2021-1A, Class A, SEQ, 2.52%, 6/15/46(3) | 474,070 | | 394,268 | |
Navigator Aircraft ABS Ltd., Series 2021-1, Class A, SEQ, 2.77%, 11/15/46(3) | 393,378 | | 331,261 | |
New Economy Assets Phase 1 Sponsor LLC, Series 2021-1, Class A1, SEQ, 1.91%, 10/20/61(3) | 422,000 | | 357,349 | |
New Economy Assets Phase 1 Sponsor LLC, Series 2021-1, Class B1, 2.41%, 10/20/61(3) | 725,000 | | 597,530 | |
Progress Residential Trust, Series 2021-SFR3, Class C, 2.09%, 5/17/26(3) | 200,000 | | 171,034 | |
Progress Residential Trust, Series 2021-SFR8, Class E1, 2.38%, 10/17/38(3) | 150,000 | | 123,753 | |
Sierra Timeshare Receivables Funding LLC, Series 2021-1A, Class C, 1.79%, 11/20/37(3) | 76,566 | | 70,061 | |
Slam Ltd., Series 2021-1A, Class A, SEQ, 2.43%, 6/15/46(3) | 226,550 | | 187,926 | |
Stack Infrastructure Issuer LLC, Series 2019-1A, Class A2, SEQ, 4.54%, 2/25/44(3) | 293,308 | | 286,360 | |
Stack Infrastructure Issuer LLC, Series 2021-1A, Class A2, SEQ, 1.88%, 3/26/46(3) | 228,000 | | 197,280 | |
VSE VOI Mortgage LLC, Series 2018-A, Class B, 3.72%, 2/20/36(3) | 42,387 | | 40,966 | |
TOTAL ASSET-BACKED SECURITIES (Cost $9,240,947) | | 8,003,064 | |
| COLLATERALIZED MORTGAGE OBLIGATIONS — 1.2% | | |
| Private Sponsor Collateralized Mortgage Obligations — 1.1% |
| ABN Amro Mortgage Corp., Series 2003-4, Class A4, 5.50%, 3/25/33 | 804 | | 714 | |
| Adjustable Rate Mortgage Trust, Series 2004-4, Class 4A1, VRN, 3.97%, 3/25/35 | 11,754 | | 11,547 | |
| Banc of America Mortgage Trust, Series 2004-E, Class 2A6, SEQ, VRN, 3.59%, 6/25/34 | 9,068 | | 8,627 | |
Bellemeade Re Ltd., Series 2019-3A, Class B1, VRN, 6.89%, (1-month LIBOR plus 2.50%), 7/25/29(3) | 130,000 | | 128,363 | |
Bellemeade Re Ltd., Series 2019-3A, Class M1C, VRN, 6.34%, (1-month LIBOR plus 1.95%), 7/25/29(3) | 120,000 | | 118,969 | |
Bellemeade Re Ltd., Series 2020-2A, Class M1C, VRN, 8.39%, (1-month LIBOR plus 4.00%), 8/26/30(3) | 2,955 | | 2,957 | |
Chase Mortgage Finance Corp., Series 2021-CL1, Class M1, VRN, 5.13%, (30-day average SOFR plus 1.20%), 2/25/50(3) | 123,556 | | 108,330 | |
CHNGE Mortgage Trust, Series 2022-1, Class A1, SEQ, VRN, 3.01%, 1/25/67(3) | 241,469 | | 215,137 | |
| Citigroup Mortgage Loan Trust, Inc., Series 2004-UST1, Class A5, VRN, 4.09%, 8/25/34 | 8,433 | | 8,079 | |
| Countrywide Home Loan Mortgage Pass-Through Trust, Series 2005-17, Class 1A11, 5.50%, 9/25/35 | 287 | | 246 | |
| | | | | | | | |
| Shares/
Principal Amount | Value |
Credit Suisse Mortgage Trust, Series 2021-NQM2, Class A2, SEQ, VRN, 1.38%, 2/25/66(3) | $ | 96,678 | | $ | 78,665 | |
Credit Suisse Mortgage Trust, Series 2021-RPL3, Class A1, SEQ, VRN, 2.00%, 1/25/60(3) | 129,564 | | 111,304 | |
Credit Suisse Mortgage Trust, Series 2022-NQM2, Class A3, SEQ, VRN, 4.00%, 2/25/67(3) | 208,000 | | 147,454 | |
Deephaven Residential Mortgage Trust, Series 2020-2, Class M1, VRN, 4.11%, 5/25/65(3) | 200,000 | | 183,655 | |
Deephaven Residential Mortgage Trust, Series 2021-3, Class A3, VRN, 1.55%, 8/25/66(3) | 106,114 | | 85,468 | |
Eagle RE Ltd., Series 2021-1, Class M1C, VRN, 6.63%, (30-day average SOFR plus 2.70%), 10/25/33(3) | 175,000 | | 173,466 | |
| First Horizon Alternative Mortgage Securities Trust, Series 2004-AA4, Class A1, VRN, 4.01%, 10/25/34 | 2,122 | | 2,088 | |
GCAT Trust, Series 2021-CM2, Class A1, SEQ, VRN, 2.35%, 8/25/66(3) | 371,901 | | 336,794 | |
GCAT Trust, Series 2021-NQM1, Class A3, SEQ, VRN, 1.15%, 1/25/66(3) | 88,780 | | 73,142 | |
| GSR Mortgage Loan Trust, Series 2004-5, Class 3A3, VRN, 2.78%, 5/25/34 | 5,548 | | 5,131 | |
| GSR Mortgage Loan Trust, Series 2004-7, Class 3A1, VRN, 3.15%, 6/25/34 | 3,348 | | 2,980 | |
| GSR Mortgage Loan Trust, Series 2005-AR1, Class 3A1, VRN, 3.78%, 1/25/35 | 7,592 | | 7,144 | |
Home RE Ltd., Series 2021-1, Class M1B, VRN, 5.94%, (1-month LIBOR plus 1.55%), 7/25/33(3) | 91,850 | | 91,419 | |
Home RE Ltd., Series 2022-1, Class M1A, VRN, 6.78%, (30-day average SOFR plus 2.85%), 10/25/34(3) | 150,000 | | 148,575 | |
JP Morgan Mortgage Trust, Series 2017-1, Class A2, VRN, 3.45%, 1/25/47(3) | 30,126 | | 26,104 | |
JP Morgan Mortgage Trust, Series 2020-3, Class A15, VRN, 3.50%, 8/25/50(3) | 62,524 | | 53,022 | |
JP Morgan Mortgage Trust, Series 2022-4, Class A3, VRN, 3.00%, 10/25/52(3) | 143,441 | | 120,408 | |
JP Morgan Mortgage Trust, Series 2022-LTV1, Class A3, SEQ, VRN, 3.52%, 7/25/52(3) | 207,314 | | 170,651 | |
| MASTR Adjustable Rate Mortgages Trust, Series 2004-13, Class 3A7, VRN, 3.87%, 11/21/34 | 24,281 | | 21,898 | |
| Merrill Lynch Mortgage Investors Trust, Series 2005-3, Class 2A, VRN, 3.51%, 11/25/35 | 11,695 | | 11,042 | |
| Merrill Lynch Mortgage Investors Trust, Series 2005-A2, Class A1, VRN, 3.05%, 2/25/35 | 10,451 | | 9,774 | |
MFA Trust, Series 2021-INV2, Class A3, SEQ, VRN, 2.26%, 11/25/56(3) | 246,458 | | 203,030 | |
NewRez Warehouse Securitization Trust, Series 2021-1, Class A, VRN, 5.14%, (1-month LIBOR plus 0.75%), 5/25/55(3) | 250,000 | | 246,391 | |
PRMI Securitization Trust, Series 2021-1, Class A5, VRN, 2.50%, 4/25/51(3) | 305,295 | | 236,934 | |
Sofi Mortgage Trust, Series 2016-1A, Class 1A4, SEQ, VRN, 3.00%, 11/25/46(3) | 5,982 | | 5,437 | |
Starwood Mortgage Residential Trust, Series 2020-2, Class B1E, VRN, 3.00%, 4/25/60(3) | 156,000 | | 137,603 | |
| Structured Adjustable Rate Mortgage Loan Trust, Series 2004-8, Class 2A1, VRN, 4.34%, 7/25/34 | 12,555 | | 12,110 | |
Verus Securitization Trust, Series 2021-R2, Class A2, VRN, 1.12%, 2/25/64(3) | 81,131 | | 74,200 | |
| | | | | | | | |
| Shares/
Principal Amount | Value |
Verus Securitization Trust, Series 2021-R2, Class A3, VRN, 1.23%, 2/25/64(3) | $ | 97,357 | | $ | 89,202 | |
| | 3,468,060 | |
| U.S. Government Agency Collateralized Mortgage Obligations — 0.1% |
FHLMC, Series 2020-DNA5, Class M2, VRN, 6.73%, (30-day average SOFR plus 2.80%), 10/25/50(3) | 98,511 | | 99,320 | |
| FNMA, Series 2013-C01, Class M2, VRN, 9.64%, (1-month LIBOR plus 5.25%), 10/25/23 | 157,512 | | 160,181 | |
| FNMA, Series 2014-C02, Class 2M2, VRN, 6.99%, (1-month LIBOR plus 2.60%), 5/25/24 | 28,772 | | 28,754 | |
| FNMA, Series 2014-C04, Class 1M2, VRN, 9.29%, (1-month LIBOR plus 4.90%), 11/25/24 | 85,999 | | 88,292 | |
| FNMA, Series 2017-C03, Class 1M2C, VRN, 7.39%, (1-month LIBOR plus 3.00%), 10/25/29 | 40,000 | | 40,313 | |
| | 416,860 | |
TOTAL COLLATERALIZED MORTGAGE OBLIGATIONS (Cost $4,321,787) | | 3,884,920 | |
| COMMERCIAL MORTGAGE-BACKED SECURITIES — 0.6% | | |
BX Commercial Mortgage Trust, Series 2017-2A, Class C, VRN, 3.54%, 3/9/44(3) | 179,280 | | 140,875 | |
BX Commercial Mortgage Trust, Series 2019-2A, Class D, VRN, 3.55%, 3/11/44(3) | 282,000 | | 212,553 | |
BX Commercial Mortgage Trust, Series 2021-VOLT, Class F, VRN, 6.72%, (1-month LIBOR plus 2.40%), 9/15/36(3) | 400,000 | | 369,387 | |
ELP Commercial Mortgage Trust, Series 2021-ELP, Class E, VRN, 6.44%, (1-month LIBOR plus 2.12%), 11/15/38(3) | 513,000 | | 473,367 | |
MHP Trust, Series 2022-MHIL, Class D, VRN, 5.95%, (1-month SOFR plus 1.61%), 1/15/27(3) | 158,380 | | 147,721 | |
OPG Trust, Series 2021-PORT, Class E, VRN, 5.85%, (1-month LIBOR plus 1.53%), 10/15/36(3) | 345,429 | | 321,267 | |
WMRK Commercial Mortgage Trust, Series 2022-WMRK, Class A, VRN, 7.12%, (1-month SOFR plus 2.79%), 11/15/27(3) | 305,000 | | 304,731 | |
TOTAL COMMERCIAL MORTGAGE-BACKED SECURITIES (Cost $2,187,476) | | 1,969,901 | |
| MUNICIPAL SECURITIES — 0.6% | | |
| Bay Area Toll Authority Rev., 6.92%, 4/1/40 | 70,000 | | 81,938 | |
| California State University Rev., 2.98%, 11/1/51 | 200,000 | | 138,842 | |
| Dallas Area Rapid Transit Rev., 6.00%, 12/1/44 | 25,000 | | 27,408 | |
| Foothill-Eastern Transportation Corridor Agency Rev., 4.09%, 1/15/49 | 85,000 | | 64,456 | |
| Golden State Tobacco Securitization Corp. Rev., 2.75%, 6/1/34 | 225,000 | | 181,013 | |
| Houston GO, 3.96%, 3/1/47 | 25,000 | | 21,610 | |
| Los Angeles Department of Airports Rev., 6.58%, 5/15/39 | 25,000 | | 27,288 | |
| Metropolitan Transportation Authority Rev., 6.81%, 11/15/40 | 15,000 | | 15,716 | |
| Metropolitan Water Reclamation District of Greater Chicago GO, 5.72%, 12/1/38 | 200,000 | | 211,655 | |
| Michigan Strategic Fund Rev., (Flint Water Advocacy Fund), 3.23%, 9/1/47 | 200,000 | | 144,429 | |
| Missouri Highway & Transportation Commission Rev., 5.45%, 5/1/33 | 20,000 | | 20,652 | |
| New Jersey Turnpike Authority Rev., 7.41%, 1/1/40 | 65,000 | | 80,736 | |
| New Jersey Turnpike Authority Rev., 7.10%, 1/1/41 | 85,000 | | 102,699 | |
| New York City Municipal Water Finance Authority Rev. (New York City Water & Sewer System), 5.95%, 6/15/42 | 45,000 | | 49,753 | |
| | | | | | | | |
| Shares/
Principal Amount | Value |
| Ohio Turnpike & Infrastructure Commission Rev., 3.22%, 2/15/48 | $ | 100,000 | | $ | 71,492 | |
| Ohio Water Development Authority Water Pollution Control Loan Fund Rev., 4.88%, 12/1/34 | 30,000 | | 29,744 | |
| Port Authority of New York & New Jersey Rev., 4.93%, 10/1/51 | 40,000 | | 37,821 | |
| Regents of the University of California Medical Center Pooled Rev., 3.26%, 5/15/60 | 100,000 | | 65,033 | |
| Rutgers The State University of New Jersey Rev., 5.67%, 5/1/40 | 45,000 | | 46,391 | |
| Sacramento Municipal Utility District Rev., 6.16%, 5/15/36 | 25,000 | | 27,199 | |
| Santa Clara Valley Transportation Authority Rev., 5.88%, 4/1/32 | 30,000 | | 31,149 | |
| State of California GO, 4.60%, 4/1/38 | 120,000 | | 113,189 | |
| State of California GO, 7.55%, 4/1/39 | 70,000 | | 87,791 | |
| State of California GO, 7.30%, 10/1/39 | 15,000 | | 18,257 | |
| State of California GO, 7.60%, 11/1/40 | 20,000 | | 25,678 | |
| University of California Rev., 3.07%, 5/15/51 | 125,000 | | 83,906 | |
TOTAL MUNICIPAL SECURITIES (Cost $2,165,665) | | 1,805,845 | |
| EXCHANGE-TRADED FUNDS — 0.4% | | |
SPDR S&P 500 ETF Trust
(Cost $1,361,756) | 3,444 | | 1,317,089 | |
AFFILIATED FUNDS(5)— 0.2% | | |
American Century Emerging Markets Bond ETF
(Cost $780,675) | 21,000 | | 787,605 | |
| U.S. GOVERNMENT AGENCY SECURITIES — 0.2% | | |
| FNMA, 0.75%, 10/8/27 | $ | 600,000 | | 516,979 | |
| Tennessee Valley Authority, 1.50%, 9/15/31 | 100,000 | | 78,528 | |
TOTAL U.S. GOVERNMENT AGENCY SECURITIES (Cost $699,395) | | 595,507 | |
BANK LOAN OBLIGATIONS(6) — 0.1% | | |
| Pharmaceuticals — 0.1% | | |
Horizon Therapeutics USA Inc., 2021 Term Loan B2, 6.19%, (1-month LIBOR plus 1.75%), 3/15/28
(Cost $181,409) | 181,240 | | 181,289 | |
SOVEREIGN GOVERNMENTS AND AGENCIES† | | |
Peru† | | |
| Peruvian Government International Bond, 5.625%, 11/18/50 | 30,000 | | 29,773 | |
Poland† | | |
| Republic of Poland Government International Bond, 3.00%, 3/17/23 | 10,000 | | 9,967 | |
Uruguay† | | |
| Uruguay Government International Bond, 4.125%, 11/20/45 | 20,000 | | 18,567 | |
TOTAL SOVEREIGN GOVERNMENTS AND AGENCIES (Cost $61,326) | | 58,307 | |
| SHORT-TERM INVESTMENTS — 0.7% | | |
| Money Market Funds — 0.7% | | |
State Street Institutional U.S. Government Money Market Fund, Premier Class
(Cost $2,321,342) | 2,321,342 | | $ | 2,321,342 | |
TOTAL INVESTMENT SECURITIES—99.8% (Cost $316,534,118) | | 318,602,854 | |
| OTHER ASSETS AND LIABILITIES — 0.2% | | 538,836 | |
| TOTAL NET ASSETS — 100.0% | | $ | 319,141,690 | |
| | | | | | | | | | | | | | | | | | | | |
| FORWARD FOREIGN CURRENCY EXCHANGE CONTRACTS | | |
| Currency Purchased | Currency Sold | Counterparty | Settlement
Date | Unrealized
Appreciation
(Depreciation) |
| EUR | 35,055 | | USD | 37,498 | | JPMorgan Chase Bank N.A. | 3/31/23 | $ | 251 | |
| EUR | 24,756 | | USD | 26,492 | | JPMorgan Chase Bank N.A. | 3/31/23 | 166 | |
| USD | 1,146,232 | | EUR | 1,070,460 | | JPMorgan Chase Bank N.A. | 3/31/23 | (6,477) | |
| | | | | | $ | (6,060) | |
| | | | | | | | | | | | | | |
| FUTURES CONTRACTS PURCHASED |
| Reference Entity | Contracts | Expiration Date | Notional
Amount | Unrealized
Appreciation
(Depreciation)^ |
| U.S. Treasury 2-Year Notes | 28 | March 2023 | $ | 5,742,188 | | $ | (23,254) | |
| U.S. Treasury 5-Year Notes | 28 | March 2023 | 3,022,031 | | (20,367) | |
| U.S. Treasury 10-Year Notes | 47 | March 2023 | 5,277,953 | | (91,057) | |
| U.S. Treasury 10-Year Ultra Notes | 14 | March 2023 | 1,655,937 | | (24,169) | |
| U.S. Treasury Long Bonds | 2 | March 2023 | 250,688 | | (9,191) | |
| U.S. Treasury Ultra Bonds | 6 | March 2023 | 805,875 | | (41,668) | |
| | | $ | 16,754,672 | | $ | (209,706) | |
^Amount represents value and unrealized appreciation (depreciation).
| | | | | | | | | | | | | | | | | | | | | | | |
| CENTRALLY CLEARED CREDIT DEFAULT SWAP AGREEMENTS |
| Reference Entity | Type | Fixed Rate Received (Paid) Quarterly | Termination
Date | Notional
Amount | Premiums Paid (Received) | Unrealized
Appreciation
(Depreciation) | Value^ |
| Markit CDX North America High Yield Index Series 38 | Buy | (5.00)% | 6/20/27 | $ | 1,207,800 | | $ | (990) | | $ | (25,984) | | $ | (26,974) | |
| Markit CDX North America High Yield Index Series 39 | Buy | (5.00)% | 12/20/27 | $ | 1,240,000 | | 5,677 | | (14,986) | | (9,309) | |
| Markit CDX North America Investment Grade Index Series 39 | Buy | (1.00)% | 12/20/27 | $ | 5,170,000 | | (57,530) | | 14,593 | | (42,937) | |
| | | | | $ | (52,843) | | $ | (26,377) | | $ | (79,220) | |
^The value for credit default swap agreements serves as an indicator of the current status of the payment/performance risk and represent the likelihood of an expected liability or profit at the period end. Increasing values in absolute terms when compared to the notional amount of the credit default swap agreement represent a deterioration of the referenced entity's credit soundness and an increased likelihood or risk of a credit event occurring as defined in the agreement.
| | | | | | | | | | | | | | | | | | | | | | | |
| CENTRALLY CLEARED TOTAL RETURN SWAP AGREEMENTS |
Floating
Rate Index | Pay/Receive
Floating Rate
Index at
Termination | Fixed
Rate | Termination
Date | Notional
Amount | Premiums
Paid
(Received) | Unrealized
Appreciation
(Depreciation) | Value |
| CPURNSA | Receive | 2.90% | 10/11/23 | $ | 550,000 | | $ | 388 | | $ | (837) | | $ | (449) | |
| CPURNSA | Receive | 2.97% | 10/14/23 | $ | 800,000 | | 393 | | (1,527) | | (1,134) | |
| CPURNSA | Receive | 2.97% | 10/14/23 | $ | 800,000 | | 393 | | (1,527) | | (1,134) | |
| | | | | $ | 1,174 | | $ | (3,891) | | $ | (2,717) | |
| | | | | | | | |
| NOTES TO SCHEDULE OF INVESTMENTS |
| CDX | – | Credit Derivatives Indexes |
| CPURNSA | – | U.S. Consumer Price Index Urban Consumers Not Seasonally Adjusted Index |
| EUR | – | Euro |
| FHLMC | – | Federal Home Loan Mortgage Corporation |
| FNMA | – | Federal National Mortgage Association |
| GNMA | – | Government National Mortgage Association |
| GO | – | General Obligation |
| H15T1Y | – | Constant Maturity U.S. Treasury Note Yield Curve Rate Index |
| LIBOR | – | London Interbank Offered Rate |
| SEQ | – | Sequential Payer |
| SOFR | – | Secured Overnight Financing Rate |
| USD | – | United States Dollar |
| VRN | – | Variable Rate Note. The rate adjusts periodically based upon the terms set forth in the security’s offering documents. The rate shown is effective at the period end and the reference rate and spread, if any, is indicated. The security's effective maturity date may be shorter than the final maturity date shown. |
†Category is less than 0.05% of total net assets.
(1)Non-income producing.
(2)Security, or a portion thereof, has been pledged at the custodian bank or with a broker for collateral requirements on forward foreign currency exchange contracts, futures contracts and/or swap agreements. At the period end, the aggregate value of securities pledged was $730,153.
(3)Security was purchased pursuant to Rule 144A or Section 4(2) under the Securities Act of 1933 and may be sold in transactions exempt from registration, normally to qualified institutional investors. The aggregate value of these securities at the period end was $25,851,641, which represented 8.1% of total net assets.
(4)When-issued security. The issue price and yield are fixed on the date of the commitment, but payment and delivery are scheduled for a future date.
(5)Investments are funds within the American Century Investments family of funds and are considered affiliated funds.
(6)The interest rate on a bank loan obligation adjusts periodically based on a predetermined schedule. Rate or range of rates shown is effective at period end. The maturity date on a bank loan obligation may be less than indicated as a result of contractual or optional prepayments. These prepayments cannot be predicted with certainty.
See Notes to Financial Statements.
| | |
| Statement of Assets and Liabilities |
| | | | | |
| DECEMBER 31, 2022 | |
| Assets | |
| Investment securities - unaffiliated, at value (cost of $315,753,443) | $ | 317,815,249 | |
| Investment securities - affiliated, at value (cost of $780,675) | 787,605 | |
| Total investment securities, at value (cost of $316,534,118) | 318,602,854 | |
| Cash | 357 | |
| Receivable for investments sold | 61,618 | |
| Receivable for capital shares sold | 122,069 | |
| Receivable for variation margin on swap agreements | 1,746 | |
| Unrealized appreciation on forward foreign currency exchange contracts | 417 | |
| Interest and dividends receivable | 923,085 | |
| 319,712,146 | |
| |
| Liabilities | |
| Payable for investments purchased | 250,000 | |
| Payable for capital shares redeemed | 27,450 | |
| Payable for variation margin on futures contracts | 17,282 | |
| Unrealized depreciation on forward foreign currency exchange contracts | 6,477 | |
| Accrued management fees | 226,268 | |
| Distribution fees payable | 29,254 | |
| Accrued other expenses | 13,725 | |
| 570,456 | |
| |
| Net Assets | $ | 319,141,690 | |
| |
| Net Assets Consist of: | |
| Capital (par value and paid-in surplus) | $ | 336,731,348 | |
| Distributable earnings | (17,589,658) | |
| $ | 319,141,690 | |
| | | | | | | | | | | |
| Net Assets | Shares Outstanding | Net Asset Value Per Share |
| Class I, $0.01 Par Value | $184,540,752 | 27,527,622 | $6.70 |
| Class II, $0.01 Par Value | $134,600,938 | 20,078,570 | $6.70 |
See Notes to Financial Statements.
| | | | | |
| YEAR ENDED DECEMBER 31, 2022 | |
| Investment Income (Loss) | |
| Income: | |
| Interest (net of foreign taxes withheld of $61) | $ | 3,934,778 | |
| Dividends (including $9,939 from affiliated funds and net of foreign taxes withheld of $5,460) | 3,136,502 | |
| 7,071,280 | |
| |
| Expenses: | |
| Management fees | 3,033,985 | |
| Distribution fees - Class II | 360,661 | |
| Directors' fees and expenses | 9,503 | |
| Other expenses | 22,525 | |
| 3,426,674 | |
Fees waived(1) | (239,913) | |
| 3,186,761 | |
| |
| Net investment income (loss) | 3,884,519 | |
| |
| Realized and Unrealized Gain (Loss) | |
| Net realized gain (loss) on: | |
| Investment transactions | (19,128,903) | |
| Forward foreign currency exchange contract transactions | 127,952 | |
| Futures contract transactions | (661,556) | |
| Swap agreement transactions | 557,447 | |
| Foreign currency translation transactions | 319 | |
| (19,104,741) | |
| |
| Change in net unrealized appreciation (depreciation) on: | |
| Investments (including $6,930 from affiliated funds) | (52,910,387) | |
| Forward foreign currency exchange contracts | 8,326 | |
| Futures contracts | (219,126) | |
| Swap agreements | (479,077) | |
| (53,600,264) | |
| |
| Net realized and unrealized gain (loss) | (72,705,005) | |
| |
| Net Increase (Decrease) in Net Assets Resulting from Operations | $ | (68,820,486) | |
(1)Amount consists of $138,780 and $101,133 for Class I and Class II, respectively.
See Notes to Financial Statements.
| | |
| Statement of Changes in Net Assets |
| | | | | | | | |
| YEARS ENDED DECEMBER 31, 2022 AND DECEMBER 31, 2021 |
| Increase (Decrease) in Net Assets | December 31, 2022 | December 31, 2021 |
| Operations | | |
| Net investment income (loss) | $ | 3,884,519 | | $ | 1,948,419 | |
| Net realized gain (loss) | (19,104,741) | | 53,826,680 | |
| Change in net unrealized appreciation (depreciation) | (53,600,264) | | (1,934,762) | |
| Net increase (decrease) in net assets resulting from operations | (68,820,486) | | 53,840,337 | |
| | |
| Distributions to Shareholders | | |
| From earnings: | | |
| Class I | (33,151,886) | | (11,576,800) | |
| Class II | (23,855,577) | | (7,504,684) | |
| Decrease in net assets from distributions | (57,007,463) | | (19,081,484) | |
| | |
| Capital Share Transactions | | |
| Net increase (decrease) in net assets from capital share transactions (Note 5) | 48,324,101 | | 20,941,188 | |
| | |
| Net increase (decrease) in net assets | (77,503,848) | | 55,700,041 | |
| | |
| Net Assets | | |
| Beginning of period | 396,645,538 | | 340,945,497 | |
| End of period | $ | 319,141,690 | | $ | 396,645,538 | |
See Notes to Financial Statements.
| | |
| Notes to Financial Statements |
DECEMBER 31, 2022
1. Organization
American Century Variable Portfolios, Inc. (the corporation) is registered under the Investment Company Act of 1940, as amended (the 1940 Act), as an open-end management investment company and is organized as a Maryland corporation. VP Balanced Fund (the fund) is one fund in a series issued by the corporation. The fund’s investment objective is to seek long-term capital growth and current income by investing approximately 60% of its assets in equity securities and the remainder in bonds and other fixed-income securities. The fund offers Class I and Class II.
2. Significant Accounting Policies
The following is a summary of significant accounting policies consistently followed by the fund in preparation of its financial statements. The fund is an investment company and follows accounting and reporting guidance in accordance with accounting principles generally accepted in the United States of America. This may require management to make certain estimates and assumptions at the date of the financial statements. Actual results could differ from these estimates. Management evaluated the impact of events or transactions occurring through the date the financial statements were issued that would merit recognition or disclosure.
Investment Valuations — The fund determines the fair value of its investments and computes its net asset value (NAV) per share at the close of regular trading (usually 4 p.m. Eastern time) on the New York Stock Exchange (NYSE) on each day the NYSE is open. The value of investments of the fund is determined by American Century Investment Management, Inc. (ACIM) (the investment advisor), as the valuation designee, pursuant to its valuation policies and procedures. The Board of Directors oversees the valuation designee and reviews its valuation policies and procedures at least annually.
Equity securities that are listed or traded on a domestic securities exchange are valued at the last reported sales price or at the official closing price as provided by the exchange. Equity securities traded on foreign securities exchanges are generally valued at the closing price of such securities on the exchange where primarily traded or at the close of the NYSE, if that is earlier. If no last sales price is reported, or if local convention or regulation so provides, the mean of the latest bid and asked prices may be used. Securities traded over-the-counter are valued at the mean of the latest bid and asked prices, the last sales price, or the official closing price. Equity securities initially expressed in local currencies are translated into U.S. dollars at the mean of the appropriate currency exchange rate at the close of the NYSE as provided by an independent pricing service.
Fixed income securities are valued at the evaluated mean as provided by independent pricing services or at the mean of the most recent bid and asked prices as provided by investment dealers. Corporate bonds, U.S. Treasury and Government Agency securities, convertible bonds, bank loan obligations, municipal securities, and sovereign governments and agencies are valued using market models that consider trade data, quotations from dealers and active market makers, relevant yield curve and spread data, creditworthiness, trade data or market information on comparable securities, and other relevant security specific information. Mortgage-related and asset-backed securities are valued based on models that consider trade data, prepayment and default projections, benchmark yield and spread data and estimated cash flows of each tranche of the issuer. Collateralized loan obligations are valued based on discounted cash flow models that consider trade and economic data, prepayment assumptions and default projections.
Hybrid securities are valued at the evaluated mean as provided by independent pricing services or at the mean of the most recent bid and asked prices as provided by investment dealers. Preferred stocks and convertible preferred stocks with perpetual maturities are valued using market models that consider trade data, quotations from dealers and active market makers, relevant yield curve and spread data, creditworthiness, trade data or market information on comparable securities, and other relevant security specific information.
Open-end management investment companies are valued at the reported NAV per share. Exchange-traded futures contracts are valued at the settlement price as provided by the appropriate exchange. Swap agreements are valued at an evaluated mean as provided by independent pricing services or independent brokers. Forward foreign currency exchange contracts are valued at the mean of the appropriate forward exchange rate at the close of the NYSE as provided by an independent pricing service.
If the valuation designee determines that the market price for a portfolio security is not readily available or is believed by the valuation designee to be unreliable, such security is valued at fair value as determined in good faith by the valuation designee, in accordance with its policies and procedures. Circumstances that may cause the fund to determine that market quotations are not available or reliable include, but are not limited to: when there is a significant event subsequent to the market quotation; trading in a security has been halted during the trading day; or trading in a security is insufficient or did not take place due to a closure or holiday.
The valuation designee monitors for significant events occurring after the close of an investment’s primary exchange but before the fund’s NAV per share is determined. Significant events may include, but are not limited to: corporate announcements and transactions; regulatory news, governmental action and political unrest that could impact a specific investment or an investment sector; or armed conflicts, natural disasters and similar events that could affect investments in a specific country or region. The valuation designee also monitors for significant fluctuations between domestic and foreign markets, as evidenced by the U.S. market or such other indicators that it deems appropriate. The valuation designee may apply a model-derived factor to the closing price of equity securities traded on foreign securities exchanges. The factor is based on observable market data as provided by an independent pricing service.
Security Transactions — Security transactions are accounted for as of the trade date. Net realized gains and losses are determined on the identified cost basis, which is also used for federal income tax purposes.
Investment Income — Interest income less foreign taxes withheld, if any, is recorded on the accrual basis and includes paydown gain (loss) and accretion of discounts and amortization of premiums. Inflation adjustments related to inflation-linked debt securities are reflected as interest income. Dividend income less foreign taxes withheld, if any, is recorded as of the ex-dividend date. Distributions received on securities that represent a return of capital or long-term capital gain are recorded as a reduction of cost of investments and/or as a realized gain. The fund may estimate the components of distributions received that may be considered nontaxable distributions or long-term capital gain distributions for income tax purposes.
Foreign Currency Translations — All assets and liabilities initially expressed in foreign currencies are translated into U.S. dollars at prevailing exchange rates at period end. The fund may enter into spot foreign currency exchange contracts to facilitate transactions denominated in a foreign currency. Purchases and sales of investment securities, dividend and interest income, spot foreign currency exchange contracts, and expenses are translated at the rates of exchange prevailing on the respective dates of such transactions. Net realized and unrealized foreign currency exchange gains or losses related to investment securities are a component of net realized gain (loss) on investment transactions and change in net unrealized appreciation (depreciation) on investments, respectively.
Segregated Assets — In accordance with the 1940 Act, the fund segregates assets on its books and records to cover certain types of investment securities and other financial instruments. ACIM monitors, on a daily basis, the securities segregated to ensure the fund designates a sufficient amount of liquid assets, marked-to-market daily. The fund may also receive assets or be required to pledge assets at the custodian bank or with a broker for collateral requirements. The fund may incur charges or earn income on posted collateral balances, which are reflected in interest expenses or interest income, respectively.
Income Tax Status — It is the fund's policy to distribute substantially all net investment income and net realized gains to shareholders and to otherwise qualify as a regulated investment company under provisions of the Internal Revenue Code. Accordingly, no provision has been made for income taxes. The fund files U.S. federal, state, local and non-U.S. tax returns as applicable. The fund's tax returns are subject to examination by the relevant taxing authority until expiration of the applicable statute of limitations, which is generally three years from the date of filing but can be longer in certain jurisdictions. At this time, management believes there are no uncertain tax positions which, based on their technical merit, would not be sustained upon examination and for which it is reasonably possible that the total amounts of unrecognized tax benefits will significantly change in the next twelve months.
Multiple Class — All shares of the fund represent an equal pro rata interest in the net assets of the class to which such shares belong, and have identical voting, dividend, liquidation and other rights and the same terms and conditions, except for class specific expenses and exclusive rights to vote on matters affecting only individual classes. Income, non-class specific expenses, and realized and unrealized capital gains and losses of the fund are allocated to each class of shares based on their relative net assets.
Distributions to Shareholders — Distributions from net investment income, if any, are generally declared and paid quarterly. Distributions from net realized gains, if any, are generally declared and paid annually.
Indemnifications — Under the corporation’s organizational documents, its officers and directors are indemnified against certain liabilities arising out of the performance of their duties to the fund. In addition, in the normal course of business, the fund enters into contracts that provide general indemnifications. The maximum exposure under these arrangements is unknown as this would involve future claims that may be made against a fund. The risk of material loss from such claims is considered by management to be remote.
3. Fees and Transactions with Related Parties
Certain officers and directors of the corporation are also officers and/or directors of American Century Companies, Inc. (ACC). The corporation's investment advisor, ACIM, the corporation's distributor, American Century Investment Services, Inc. (ACIS), and the corporation's transfer agent, American Century Services, LLC, are wholly owned, directly or indirectly, by ACC.
Management Fees — The corporation has entered into a management agreement with ACIM, under which ACIM provides the fund with investment advisory and management services in exchange for a single, unified management fee (the fee) per class. The agreement provides that ACIM will pay all expenses of managing and operating the fund, except brokerage expenses, taxes, interest, fees and expenses of the independent directors (including legal counsel fees), extraordinary expenses, and expenses incurred in connection with the provision of shareholder services and distribution services under a plan adopted pursuant to Rule 12b-1 under the 1940 Act. The fee is computed and accrued daily based on each class's daily net assets and paid monthly in arrears. The rate of the fee is determined by applying a fee rate calculation formula. This formula takes into account the fund's assets as well as certain assets, if any, of other clients of the investment advisor outside the American Century Investments family of funds (such as subadvised funds and separate accounts), as well as exchange-traded funds managed by the investment advisor, that use very similar investment teams and strategies (strategy assets). The management fee schedule ranges from 0.80% to 0.90% for each class. During the period ended December 31, 2022, the investment advisor agreed to waive 0.07% of the fund's management fee. The investment advisor expects this waiver to continue until July 31, 2023 and cannot terminate it prior to such date without the approval of the Board of Directors. The effective annual management fee for each class for the period ended December 31, 2022 was 0.89% before waiver and 0.82% after waiver.
Distribution Fees — The Board of Directors has adopted the Master Distribution Plan (the plan) for Class II, pursuant to Rule 12b-1 of the 1940 Act. The plan provides that Class II will pay ACIS an annual distribution fee equal to 0.25%. The fee is computed and accrued daily based on the Class II daily net assets and paid monthly in arrears. The distribution fee provides compensation for expenses incurred in connection with distributing shares of Class II including, but not limited to, payments to brokers, dealers, and financial institutions that have entered into sales agreements with respect to shares of the fund. Fees incurred under the plan during the period ended December 31, 2022 are detailed in the Statement of Operations.
Directors' Fees and Expenses — The Board of Directors is responsible for overseeing the investment advisor’s management and operations of the fund. The directors receive detailed information about the fund and its investment advisor regularly throughout the year, and meet at least quarterly with management of the investment advisor to review reports about fund operations. The fund's officers do not receive compensation from the fund.
Interfund Transactions — The fund may enter into security transactions with other American Century Investments funds and other client accounts of the investment advisor, in accordance with the 1940 Act rules and procedures adopted by the Board of Directors. The rules and procedures require, among other things, that these transactions be effected at the independent current market price of the security. There were no interfund transactions during the period.
4. Investment Transactions
Purchases of investment securities, excluding short-term investments, for the period ended December 31, 2022 totaled $316,446,918, of which $230,281,328 represented U.S. Treasury and Government Agency obligations.
Sales of investment securities, excluding short-term investments, for the period ended December 31, 2022 totaled $325,975,693, of which $228,212,948 represented U.S. Treasury and Government Agency obligations.
5. Capital Share Transactions
Transactions in shares of the fund were as follows:
| | | | | | | | | | | | | | |
| Year ended December 31, 2022 | Year ended
December 31, 2021 |
| Shares | Amount | Shares | Amount |
| Class I/Shares Authorized | 150,000,000 | | | 150,000,000 | | |
| Sold | 1,570,561 | | $ | 11,794,505 | | 3,224,057 | | $ | 29,266,636 | |
| Issued in reinvestment of distributions | 4,315,806 | | 33,151,886 | | 1,339,166 | | 11,576,800 | |
| Redeemed | (2,596,921) | | (19,352,623) | | (3,395,173) | | (30,808,282) | |
| 3,289,446 | | 25,593,768 | | 1,168,050 | | 10,035,154 | |
| Class II/Shares Authorized | 75,000,000 | | | 75,000,000 | | |
| Sold | 1,944,115 | | 14,780,292 | | 1,940,892 | | 17,683,643 | |
| Issued in reinvestment of distributions | 3,100,203 | | 23,855,577 | | 869,949 | | 7,504,684 | |
| Redeemed | (2,196,424) | | (15,905,536) | | (1,579,626) | | (14,282,293) | |
| 2,847,894 | | 22,730,333 | | 1,231,215 | | 10,906,034 | |
| Net increase (decrease) | 6,137,340 | | $ | 48,324,101 | | 2,399,265 | | $ | 20,941,188 | |
6. Investments in Affiliated Funds
The fund does not invest in an affiliated fund for the purpose of exercising management or control; however, investments by the fund within its investment strategy may represent a significant portion of an affiliated fund's net assets.
7. Affiliated Fund Transactions
A summary of transactions for each affiliated fund for the period ended December 31, 2022 follows (amounts in thousands):
| | | | | | | | | | | | | | | | | | | | | | | | | | |
Affiliated Fund(1) | Beginning Value | Purchase
Cost | Sales
Cost | Change in Net Unrealized Appreciation (Depreciation) | Ending
Value | Ending
Shares | Net Realized
Gain (Loss) | Distributions
Received(2) |
| American Century Emerging Markets Bond ETF | — | | $ | 781 | | — | | $ | 7 | | $ | 788 | | 21 | | — | | $ | 10 | |
(1)Investments are funds within the American Century Investments family of funds and are considered affiliated funds. Additional information and attributes of each affiliated fund are available at americancentury.com.
(2)Distributions received includes distributions from net investment income and from capital gains, if any.
8. Fair Value Measurements
The fund's investments valuation process is based on several considerations and may use multiple inputs to determine the fair value of the investments held by the fund. In conformity with accounting principles generally accepted in the United States of America, the inputs used to determine a valuation are classified into three broad levels.
•Level 1 valuation inputs consist of unadjusted quoted prices in an active market for identical investments.
•Level 2 valuation inputs consist of direct or indirect observable market data (including quoted prices for comparable investments, evaluations of subsequent market events, interest rates, prepayment speeds, credit risk, etc.). These inputs also consist of quoted prices for identical investments initially expressed in local currencies that are adjusted through translation into U.S. dollars.
•Level 3 valuation inputs consist of unobservable data (including a fund’s own assumptions).
The level classification is based on the lowest level input that is significant to the fair valuation measurement. The valuation inputs are not necessarily an indication of the risks associated with investing in these securities or other financial instruments.
The following is a summary of the level classifications as of period end. The Schedule of Investments provides additional information on the fund's portfolio holdings.
| | | | | | | | | | | |
| Level 1 | Level 2 | Level 3 |
| Assets | | | |
| Investment Securities | | | |
| Common Stocks | $ | 186,970,548 | | $ | 2,861,787 | | — | |
| U.S. Treasury Securities | — | | 38,590,407 | | — | |
| U.S. Government Agency Mortgage-Backed Securities | — | | 30,645,764 | | — | |
| Corporate Bonds | — | | 29,811,376 | | — | |
| Collateralized Loan Obligations | — | | 8,798,103 | | — | |
| Asset-Backed Securities | — | | 8,003,064 | | — | |
| Collateralized Mortgage Obligations | — | | 3,884,920 | | — | |
| Commercial Mortgage-Backed Securities | — | | 1,969,901 | | — | |
| Municipal Securities | — | | 1,805,845 | | — | |
| Exchange-Traded Funds | 1,317,089 | | — | | — | |
| Affiliated Funds | 787,605 | | — | | — | |
| U.S. Government Agency Securities | — | | 595,507 | | — | |
| Bank Loan Obligations | — | | 181,289 | | — | |
| Sovereign Governments and Agencies | — | | 58,307 | | — | |
| Short-Term Investments | 2,321,342 | | — | | — | |
| $ | 191,396,584 | | $ | 127,206,270 | | — | |
| Other Financial Instruments | | | |
| Forward Foreign Currency Exchange Contracts | — | | $ | 417 | | — | |
| | | |
| Liabilities | | | |
| Other Financial Instruments | | | |
| Futures Contracts | $ | 209,706 | | — | | — | |
| Swap Agreements | — | | $ | 81,937 | | — | |
| Forward Foreign Currency Exchange Contracts | — | | 6,477 | | — | |
| $ | 209,706 | | $ | 88,414 | | — | |
9. Derivative Instruments
Credit Risk — The fund is subject to credit risk in the normal course of pursuing its investment objectives. The value of a bond generally declines as the credit quality of its issuer declines. Credit default swap agreements enable a fund to buy/sell protection against a credit event of a specific issuer or index. A fund may attempt to enhance returns by selling protection or attempt to mitigate credit risk by buying protection. The buyer/seller of credit protection against a security or basket of securities may pay/receive an up-front or periodic payment to compensate for/against potential default events. Changes in value, including the periodic amounts of interest to be paid or received on swap agreements, are recorded as unrealized appreciation (depreciation) on swap agreements. Upon entering into a centrally cleared swap, a fund is required to deposit cash or securities (initial margin) with a financial intermediary in an amount equal to a certain percentage of the notional amount. Subsequent payments (variation margin) are made or received daily, in cash, by a fund. The variation margin is equal to the daily change in the value and is a component of unrealized gains and losses. Realized gain or loss is recorded upon receipt or payment of a periodic settlement or termination of swap agreements. Net realized and unrealized gains or losses occurring during the holding period of swap agreements are a component of net realized gain (loss) on swap agreement transactions and change in net unrealized appreciation (depreciation) on swap agreements, respectively. The risks of entering into swap agreements include the possible lack of liquidity, failure of the counterparty to meet its obligations, and that there may be unfavorable changes in the underlying investments or instruments. The fund's average notional amount held during the period was $4,295,380.
Foreign Currency Risk — The fund is subject to foreign currency exchange rate risk in the normal course of pursuing its investment objectives. The value of foreign investments held by a fund may be significantly affected by changes in foreign currency exchange rates. The dollar value of a foreign security generally decreases when the value of the dollar rises against the foreign currency in which the security is denominated and tends to increase when the value of the dollar declines against such foreign currency. A fund may enter into forward foreign currency exchange contracts to reduce a fund's exposure to foreign currency exchange rate fluctuations. The net U.S. dollar value of foreign currency underlying all contractual commitments held by a fund and the resulting unrealized appreciation or depreciation are determined daily. Realized gain or loss is recorded upon settlement of the contract. Net realized and unrealized gains or losses occurring during the holding period of forward foreign currency exchange contracts are a component of net realized gain (loss) on forward foreign currency exchange contract transactions and change in net unrealized appreciation (depreciation) on forward foreign currency exchange contracts, respectively. A fund bears the risk of an unfavorable change in the foreign currency exchange rate underlying the forward contract. Additionally, losses, up to the fair value, may arise if the counterparties do not perform under the contract terms. The fund's average U.S. dollar exposure to foreign currency risk derivative instruments held during the period was $2,006,371.
Interest Rate Risk — The fund is subject to interest rate risk in the normal course of pursuing its investment objectives. The value of bonds generally declines as interest rates rise. A fund may enter into futures contracts based on a bond index or a specific underlying security. A fund may purchase futures contracts to gain exposure to increases in market value or sell futures contracts to protect against a decline in market value. Upon entering into a futures contract, a fund will segregate cash, cash equivalents or other appropriate liquid securities on its records in amounts sufficient to meet requirements. Subsequent payments (variation margin) are made or received daily, in cash, by a fund. The variation margin is equal to the daily change in the contract value and is recorded as unrealized gains and losses. A fund recognizes a realized gain or loss when the futures contract is closed or expires. Net realized and unrealized gains or losses occurring during the holding period of futures contracts are a component of net realized gain (loss) on futures contract transactions and change in net unrealized appreciation (depreciation) on futures contracts, respectively. One of the risks of entering into futures contracts is the possibility that the change in value of the contract may not correlate with the changes in value of the underlying securities. The fund's average notional exposure to interest rate risk derivative instruments held during the period was $7,796,857 futures contracts purchased and $3,419,813 futures contracts sold.
Other Contracts — A fund may enter into total return swap agreements in order to attempt to obtain or preserve a particular return or spread at a lower cost than obtaining a return or spread through purchases and/or sales of instruments in other markets or gain exposure to certain markets in the most economical way possible. A fund will segregate cash, cash equivalents or other appropriate liquid securities on its records in amounts sufficient to meet requirements. Changes in value, including the periodic amounts of interest to be paid or received on swap agreements, are recorded as unrealized appreciation (depreciation) on swap agreements. Upon entering into a centrally cleared swap, a fund is required to deposit cash or securities (initial margin) with a financial intermediary in an amount equal to a certain percentage of the notional amount. Subsequent payments (variation margin) are made or received daily, in cash, by a fund. The variation margin is equal to the daily change in the value and is a component of unrealized gains and losses. Realized gain or loss is recorded upon receipt or payment of a periodic settlement or termination of swap agreements. Net realized and unrealized gains or losses occurring during the holding period of swap agreements are a component of net realized gain (loss) on swap agreement transactions and change in net unrealized appreciation (depreciation) on swap agreements, respectively. The risks of entering into swap agreements include the possible lack of liquidity, failure of the counterparty to meet its obligations, and that there may be unfavorable changes in the underlying investments or instruments, including inflationary risk. The fund's average notional amount held during the period was $4,183,333.
Value of Derivative Instruments as of December 31, 2022
| | | | | | | | | | | | | | |
| Asset Derivatives | | Liability Derivatives |
| Type of Risk Exposure | Location on Statement of Assets and Liabilities | Value | Location on Statement of Assets and Liabilities | Value |
| Credit Risk | Receivable for variation margin on swap agreements* | $ | 878 | | Payable for variation margin on swap agreements* | — | |
| Foreign Currency Risk | Unrealized appreciation on forward foreign currency exchange contracts | 417 | | Unrealized depreciation on forward foreign currency exchange contracts | $ | 6,477 | |
| Interest Rate Risk | Receivable for variation margin on futures contracts* | — | | Payable for variation margin on futures contracts* | 17,282 | |
| Other Contracts | Receivable for variation margin on swap agreements* | 868 | | Payable for variation margin on swap agreements* | — | |
| | $ | 2,163 | | | $ | 23,759 | |
*Included in the unrealized appreciation (depreciation) on futures contracts or centrally cleared swap agreements, as applicable, as reported in the Schedule of Investments.
Effect of Derivative Instruments on the Statement of Operations for the Year Ended December 31, 2022
| | | | | | | | | | | | | | |
| Net Realized Gain (Loss) | Change in Net Unrealized
Appreciation (Depreciation) |
| Type of Risk Exposure | Location on Statement of Operations | Value | Location on Statement of Operations | Value |
| Credit Risk | Net realized gain (loss) on swap agreement transactions | $ | 28,692 | | Change in net unrealized appreciation (depreciation) on swap agreements | $ | (26,377) | |
| Foreign Currency Risk | Net realized gain (loss) on forward foreign currency exchange contract transactions | 127,952 | | Change in net unrealized appreciation (depreciation) on forward foreign currency exchange contracts | 8,326 | |
| Interest Rate Risk | Net realized gain (loss) on futures contract transactions | (661,556) | | Change in net unrealized appreciation (depreciation) on futures contracts | (219,126) | |
| Other Contracts | Net realized gain (loss) on swap agreement transactions | 528,755 | | Change in net unrealized appreciation (depreciation) on swap agreements | (452,700) | |
| | $ | 23,843 | | | $ | (689,877) | |
10. Risk Factors
The value of the fund’s shares will go up and down, sometimes rapidly or unpredictably, based on the performance of the securities owned by the fund and other factors generally affecting the securities market. Market risks, including political, regulatory, economic and social developments, can affect the value of the fund’s investments. Natural disasters, public health emergencies, war, terrorism and other unforeseeable events may lead to increased market volatility and may have adverse long-term effects on world economies and markets generally.
The fund may invest in instruments that have variable or floating coupon rates based on the London Interbank Offered Rate (LIBOR). LIBOR is a benchmark interest rate intended to be representative of the rate at which certain major international banks lend to one another over short-terms. Financial institutions have started the process of phasing out LIBOR and the transition process to a replacement rate may lead to increased volatility or illiquidity in markets for instruments that rely on LIBOR. This could result in a change to the value of such instruments or a change in the cost of temporary borrowing for the fund.
11. Federal Tax Information
The tax character of distributions paid during the years ended December 31, 2022 and December 31, 2021 were as follows:
| | | | | | | | |
| 2022 | 2021 |
| Distributions Paid From | | |
| Ordinary income | $ | 30,377,562 | | $ | 4,410,666 | |
| Long-term capital gains | $ | 26,629,901 | | $ | 14,670,818 | |
The book-basis character of distributions made during the year from net investment income or net realized gains may differ from their ultimate characterization for federal income tax purposes. These differences reflect the differing character of certain income items and net realized gains and losses for financial statement and tax purposes, and may result in reclassification among certain capital accounts on the financial statements.
As of period end, the federal tax cost of investments and the components of distributable earnings on a tax-basis were as follows:
| | | | | |
| Federal tax cost of investments | $ | 317,337,341 | |
| Gross tax appreciation of investments | $ | 31,313,361 | |
| Gross tax depreciation of investments | (30,047,848) | |
| Net tax appreciation (depreciation) of investments | 1,265,513 | |
| Net tax appreciation (depreciation) on derivatives and translation of assets and liabilities in foreign currencies | (24,465) | |
| Net tax appreciation (depreciation) | $ | 1,241,048 | |
| Undistributed ordinary income | $ | 234,150 | |
| Accumulated short-term capital losses | $ | (14,465,741) | |
| Accumulated long-term capital losses | $ | (4,599,115) | |
The difference between book-basis and tax-basis unrealized appreciation (depreciation) is attributable primarily to the tax deferral of losses on wash sales.
Accumulated capital losses represent net capital loss carryovers that may be used to offset future realized capital gains for federal income tax purposes. The capital loss carryovers may be carried forward for an unlimited period. Future capital loss carryover utilization in any given year may be subject to Internal Revenue Code limitations.
| | | | | | | | | | | | | | | | | | | | | | | | | | | | | | | | | | | | | | | | | | | | | | | |
| For a Share Outstanding Throughout the Years Ended December 31 (except as noted) |
| Per-Share Data | | | | | | Ratios and Supplemental Data | |
| | Income From Investment Operations: | Distributions From: | | | Ratio to Average Net Assets of: | | |
| Net Asset
Value,
Beginning
of Period | Net Investment
Income (Loss)(1) | Net
Realized
and
Unrealized
Gain (Loss) | Total From
Investment
Operations | Net
Investment
Income | Net
Realized
Gains | Total
Distributions | Net Asset
Value,
End
of Period | Total Return(2) | Operating
Expenses | Operating
Expenses
(before
expense
waiver) | Net
Investment
Income
(Loss) | Net
Investment
Income (Loss) (before expense waiver) | Portfolio
Turnover
Rate | Net
Assets,
End of
Period
(in thousands) |
| Class I | | | | | | | | | | | | | | |
| 2022 | $9.56 | 0.09 | (1.57) | (1.48) | (0.09) | (1.29) | (1.38) | $6.70 | (17.27)% | 0.83% | 0.90% | 1.24% | 1.17% | 92% | $184,541 | |
| 2021 | $8.73 | 0.06 | 1.27 | 1.33 | (0.07) | (0.43) | (0.50) | $9.56 | 15.77% | 0.83% | 0.88% | 0.63% | 0.58% | 195% | $231,837 | |
| 2020 | $8.18 | 0.08 | 0.84 | 0.92 | (0.09) | (0.28) | (0.37) | $8.73 | 12.53% | 0.85% | 0.89% | 1.03% | 0.99% | 189% | $201,325 | |
| 2019 | $7.09 | 0.11 | 1.27 | 1.38 | (0.12) | (0.17) | (0.29) | $8.18 | 19.85% | 0.79% | 0.90% | 1.48% | 1.37% | 115% | $177,510 | |
| 2018 | $7.53 | 0.12 | (0.40) | (0.28) | (0.11) | (0.05) | (0.16) | $7.09 | (3.83)% | 0.76% | 0.90% | 1.55% | 1.41% | 120% | $142,595 | |
| Class II | | | | | | | | | | | | | | |
| 2022 | $9.56 | 0.07 | (1.57) | (1.50) | (0.07) | (1.29) | (1.36) | $6.70 | (17.47)% | 1.08% | 1.15% | 0.99% | 0.92% | 92% | $134,601 | |
| 2021 | $8.73 | 0.03 | 1.27 | 1.30 | (0.04) | (0.43) | (0.47) | $9.56 | 15.48% | 1.08% | 1.13% | 0.38% | 0.33% | 195% | $164,809 | |
| 2020 | $8.18 | 0.06 | 0.85 | 0.91 | (0.08) | (0.28) | (0.36) | $8.73 | 12.27% | 1.10% | 1.14% | 0.78% | 0.74% | 189% | $139,620 | |
| 2019 | $7.10 | 0.09 | 1.26 | 1.35 | (0.10) | (0.17) | (0.27) | $8.18 | 19.39% | 1.04% | 1.15% | 1.23% | 1.12% | 115% | $109,422 | |
| 2018 | $7.53 | 0.10 | (0.39) | (0.29) | (0.09) | (0.05) | (0.14) | $7.10 | (3.93)% | 1.01% | 1.15% | 1.30% | 1.16% | 120% | $74,928 | |
| | |
| Notes to Financial Highlights |
(1)Computed using average shares outstanding throughout the period.
(2)Total returns are calculated based on the net asset value of the last business day. Total returns for periods less than one year are not annualized. The total returns presented do not include the fees and charges assessed with investments in variable insurance products, those charges are disclosed in the separate account prospectus. The inclusion of such fees and charges would lower total return.
See Notes to Financial Statements.
| | |
| Report of Independent Registered Public Accounting Firm |
To the Shareholders and the Board of Directors of American Century Variable Portfolios, Inc.:
Opinion on the Financial Statements and Financial Highlights
We have audited the accompanying statement of assets and liabilities, including the schedule of investments, of VP Balanced Fund (the “Fund”), one of the funds constituting the American Century Variable Portfolios, Inc., as of December 31, 2022, the related statement of operations for the year then ended, the statements of changes in net assets for each of the two years in the period then ended, the financial highlights for each of the five years in the period then ended, and the related notes. In our opinion, the financial statements and financial highlights present fairly, in all material respects, the financial position of VP Balanced Fund of the American Century Variable Portfolios, Inc. as of December 31, 2022, and the results of its operations for the year then ended, the changes in its net assets for each of the two years in the period then ended, and the financial highlights for each of the five years in the period then ended, in conformity with accounting principles generally accepted in the United States of America.
Basis for Opinion
These financial statements and financial highlights are the responsibility of the Fund's management. Our responsibility is to express an opinion on the Fund’s financial statements and financial highlights based on our audits. We are a public accounting firm registered with the Public Company Accounting Oversight Board (United States) (PCAOB) and are required to be independent with respect to the Fund in accordance with the U.S. federal securities laws and the applicable rules and regulations of the Securities and Exchange Commission and the PCAOB.
We conducted our audits in accordance with the standards of the PCAOB. Those standards require that we plan and perform the audit to obtain reasonable assurance about whether the financial statements and financial highlights are free of material misstatement, whether due to error or fraud. The Fund is not required to have, nor were we engaged to perform, an audit of its internal control over financial reporting. As part of our audits, we are required to obtain an understanding of internal control over financial reporting but not for the purpose of expressing an opinion on the effectiveness of the Fund’s internal control over financial reporting. Accordingly, we express no such opinion.
Our audits included performing procedures to assess the risks of material misstatement of the financial statements and financial highlights, whether due to error or fraud, and performing procedures that respond to those risks. Such procedures included examining, on a test basis, evidence regarding the amounts and disclosures in the financial statements and financial highlights. Our audits also included evaluating the accounting principles used and significant estimates made by management, as well as evaluating the overall presentation of the financial statements and financial highlights. Our procedures included confirmation of securities owned as of December 31, 2022, by correspondence with the custodian and brokers; when replies were not received from brokers, we performed other auditing procedures. We believe that our audits provide a reasonable basis for our opinion.
/s/ Deloitte & Touche LLP
Kansas City, Missouri
February 10, 2023
We have served as the auditor of one or more American Century investment companies since 1997.
The Board of Directors
The individuals listed below serve as directors of the funds. Each director will continue to serve in this capacity until death, retirement, resignation or removal from office. The board has adopted a mandatory retirement age for directors who are not “interested persons,” as that term is defined in the Investment Company Act (independent directors). Independent directors shall retire on December 31 of the year in which they reach their 75th birthday.
Jonathan S. Thomas is an “interested person” because he currently serves as President and Chief Executive Officer of American Century Companies, Inc. (ACC), the parent company of American Century Investment Management, Inc. (ACIM or the advisor). The other directors (more than three-fourths of the total number) are independent. They are not employees, directors or officers of, and have no financial interest in, ACC or any of its wholly owned, direct or indirect, subsidiaries, including ACIM, American Century Investment Services, Inc. (ACIS) and American Century Services, LLC (ACS), and they do not have any other affiliations, positions or relationships that would cause them to be considered “interested persons” under the Investment Company Act. The directors serve in this capacity for seven (in the case of Jonathan S. Thomas, 16; and Stephen E. Yates, 8) registered investment companies in the American Century Investments family of funds.
The following table presents additional information about the directors. The mailing address for each director is 4500 Main Street, Kansas City, Missouri 64111.
| | | | | | | | | | | | | | | | | |
Name
(Year of Birth) | Position(s) Held with Funds | Length of Time Served | Principal Occupation(s) During Past 5 Years | Number of American Century Portfolios Overseen by Director | Other Directorships Held During Past 5 Years |
| Independent Directors | | |
Brian Bulatao
(1964) | Director | Since 2022 | Chief Administrative Officer, Activision Blizzard, Inc. (2021 to present); Under Secretary of State for Management, U.S. Department of State (2018 to 2021); Chief Operating Officer, Central Intelligence Agency (2017 to 2018) | 64 | None |
| Thomas W. Bunn (1953) | Director | Since 2017 | Retired | 64 | None |
Chris H. Cheesman
(1962)
| Director | Since 2019
| Retired. Senior Vice President & Chief Audit Executive, AllianceBernstein (1999 to 2018)
| 64 | Alleghany Corporation (2021 to 2022) |
Barry Fink
(1955) | Director | Since 2012 (independent since 2016) | Retired | 64 | None |
Rajesh K. Gupta
(1960)
| Director | Since 2019
| Partner Emeritus, SeaCrest Investment Management and SeaCrest Wealth Management (2019 to Present); Chief Executive Officer and Chief Investment Officer, SeaCrest Investment Management (2006 to 2019); Chief Executive Officer and Chief Investment Officer, SeaCrest Wealth Management (2008 to 2019) | 64 | None |
| | | | | | | | | | | | | | | | | |
Name
(Year of Birth) | Position(s) Held with Funds | Length of Time Served | Principal Occupation(s) During Past 5 Years | Number of American Century Portfolios Overseen by Director | Other Directorships Held During Past 5 Years |
| Independent Directors | | |
Lynn Jenkins
(1963)
| Director | Since 2019
| Consultant, LJ Strategies (2019 to present); United States Representative, U.S. House of Representatives (2009 to 2018) | 64 | MGP Ingredients, Inc. (2019 to 2021) |
Jan M. Lewis
(1957) | Director and Board Chair | Since 2011 (Board Chair since 2022) | Retired | 64 | None |
Gary C. Meltzer
(1963) | Director | Since 2022 | Advisor, Pontoro (2021 to present); Executive Advisor, Consultant and Investor, Harris Ariel Advisory LLC (2020 to present); Managing Partner, PricewaterhouseCoopers LLP (1985 to 2020) | 64 | ExcelFin Acquisition Corp., Apollo Realty Income Solutions, Inc. |
Stephen E. Yates
(1948) | Director | Since 2012 | Retired | 108 | None |
| Interested Director | |
Jonathan S. Thomas
(1963) | Director | Since 2007 | President and Chief Executive Officer, ACC (2007 to present). Also serves as Chief Executive Officer, ACS; Director, ACC and other ACC subsidiaries | 140 | None |
The Statement of Additional Information has additional information about the fund's directors and is available without charge, upon request, by calling 1-800-378-9878.
Officers
The following table presents certain information about the executive officers of the funds. Each officer serves as an officer for 16 (in the case of Robert J. Leach, 15) investment companies in the American Century family of funds. No officer is compensated for his or her service as an officer of the funds. The listed officers are interested persons of the funds and are appointed or re-appointed on an annual basis. The mailing address for each officer listed below is 4500 Main Street, Kansas City, Missouri 64111.
| | | | | | | | |
Name
(Year of Birth) | Offices with the Funds | Principal Occupation(s) During the Past Five Years |
Patrick Bannigan
(1965) | President since 2019 | Executive Vice President and Director, ACC (2012 to present); Chief Financial Officer, Chief Accounting Officer and Treasurer, ACC (2015 to present). Also serves as President, ACS; Vice President, ACIM; Chief Financial Officer, Chief Accounting Officer and/or Director, ACIM, ACS and other ACC subsidiaries |
R. Wes Campbell
(1974) | Chief Financial Officer and Treasurer since 2018 | Vice President, ACS, (2020 to present); Investment Operations and Investment Accounting, ACS (2000 to present) |
Amy D. Shelton
(1964) | Chief Compliance Officer and Vice President since 2014 | Chief Compliance Officer, American Century funds, (2014 to present); Chief Compliance Officer, ACIM (2014 to present); Chief Compliance Officer, ACIS (2009 to present). Also serves as Vice President, ACIS |
John Pak
(1968) | General Counsel and
Senior Vice President since 2021 | General Counsel and Senior Vice President, ACC (2021 to present); Also serves as General Counsel and Senior Vice President, ACIM, ACS and ACIS. Chief Legal Officer of Investment and Wealth Management, The Bank of New York Mellon (2014 to 2021) |
C. Jean Wade
(1964) | Vice President since 2012 | Senior Vice President, ACS (2017 to present); Vice President, ACS (2000 to 2017)
|
Robert J. Leach
(1966) | Vice President since 2006 | Vice President, ACS (2000 to present) |
David H. Reinmiller
(1963) | Vice President since 2000 | Attorney, ACC (1994 to present). Also serves as Vice President, ACIM and ACS |
Ward D. Stauffer
(1960) | Secretary since 2005 | Attorney, ACC (2003 to present) |
A special meeting of shareholders was held on October 13, 2022, to vote on the following proposal. The proposal received the required votes and was adopted. A summary of voting results is listed below.
To elect five directors to the Board of Directors of American Century Variable Portfolios, Inc.:
| | | | | | | | | | | |
| Affirmative | | Withhold |
| Brian Bulatao | $ | 2,607,537,119 | | | $ | 88,836,350 | |
| Chris H. Cheesman | $ | 2,619,879,519 | | | $ | 76,493,950 | |
| Rajesh K. Gupta | $ | 2,616,882,375 | | | $ | 79,491,094 | |
| Lynn M. Jenkins | $ | 2,607,769,137 | | | $ | 88,604,332 | |
| Gary C. Meltzer | $ | 2,616,158,906 | | | $ | 80,214,563 | |
The other directors whose term of office continued after the meeting include Jonathan S. Thomas, Thomas W. Bunn, Barry Fink, Jan M. Lewis, and Stephen E. Yates.
Proxy Voting Policies
A description of the policies that the fund's investment advisor uses in exercising the voting rights associated with the securities purchased and/or held by the fund is available without charge, upon request, by calling 1-800-378-9878. It is also available on American Century Investments’ website at americancentury.com/proxy and on the Securities and Exchange Commission’s website at sec.gov. Information regarding how the investment advisor voted proxies relating to portfolio securities during the most recent 12-month period ended June 30 is available on americancentury.com/proxy. It is also available at sec.gov.
Quarterly Portfolio Disclosure
The fund files its complete schedule of portfolio holdings with the Securities and Exchange Commission (SEC) for the first and third quarters of each fiscal year as an exhibit to its reports on Form N-PORT. These portfolio holdings are available on the fund's website at americancentury.com and, upon request, by calling 1-800-378-9878. The fund’s Form N-PORT reports are available on the SEC’s website at sec.gov.
Other Tax Information
The following information is provided pursuant to provisions of the Internal Revenue Code.
For corporate taxpayers, the fund hereby designates $2,721,503, or up to the maximum amount
allowable, of ordinary income distributions paid during the fiscal year ended December 31, 2022 as
qualified for the corporate dividends received deduction.
The fund hereby designates $26,629,901, or up to the maximum amount allowable, as long-term capital gain distributions (20% rate gain distributions) for the fiscal year ended December 31, 2022.
The fund hereby designates $26,593,385 as qualified short-term capital gain distributions for purposes of Internal Revenue Code Section 871 for the fiscal year ended December 31, 2022.
| | | | | | | | |
| |
| | |
| Contact Us | americancentury.com | |
| Automated Information Line | 1-800-345-8765 | |
| Investment Professional Service Representatives | 1-800-345-6488 | |
| Telecommunications Relay Service for the Deaf | 711 | |
| | |
| American Century Variable Portfolios, Inc. | |
| | |
Investment Advisor: American Century Investment Management, Inc. Kansas City, Missouri | |
| | |
| This report and the statements it contains are submitted for the general information of our shareholders. The report is not authorized for distribution to prospective investors unless preceded or accompanied by an effective prospectus. | |
| | |
©2023 American Century Proprietary Holdings, Inc. All rights reserved.
CL-ANN-91439 2302 | |
| | | | | |
| |
| Annual Report |
| |
| December 31, 2022 |
| |
| VP Capital Appreciation Fund |
| Class I (AVCIX) |
| Class II (AVCWX) |
| Class Y (AVCYX) |
| | | | | |
| Performance | |
| Portfolio Commentary | |
| Fund Characteristics | |
| Shareholder Fee Example | |
| Schedule of Investments | |
| Statement of Assets and Liabilities | |
| Statement of Operations | |
| Statement of Changes in Net Assets | |
| Notes to Financial Statements | |
| Financial Highlights | |
| Report of Independent Registered Public Accounting Firm | |
| Management | |
| |
| |
| Proxy Voting Results | |
| Additional Information | |
Any opinions expressed in this report reflect those of the author as of the date of the report, and do not necessarily represent the opinions of American Century Investments® or any other person in the American Century Investments organization. Any such opinions are subject to change at any time based upon market or other conditions and American Century Investments disclaims any responsibility to update such opinions. These opinions may not be relied upon as investment advice and, because investment decisions made by American Century Investments funds are based on numerous factors, may not be relied upon as an indication of trading intent on behalf of any American Century Investments fund. Security examples are used for representational purposes only and are not intended as recommendations to purchase or sell securities. Performance information for comparative indices and securities is provided to American Century Investments by third party vendors. To the best of American Century Investments’ knowledge, such information is accurate at the time of printing.
| | | | | | | | | | | | | | | | | | | | |
| Total Returns as of December 31, 2022 |
| | | Average Annual Returns | |
| Ticker
Symbol | 1 year | 5 years | 10 years | Since
Inception | Inception
Date |
| Class I | AVCIX | -28.11% | 7.91% | 10.25% | — | 11/20/87 |
| Russell Midcap Growth Index | — | -26.72% | 7.64% | 11.40% | — | — |
| Class II | AVCWX | -28.25% | 7.74% | — | 8.63% | 4/25/14 |
| Class Y | AVCYX | -27.92% | 8.26% | — | 9.16% | 9/22/17 |
Average annual returns since inception are presented when ten years of performance history is not available. Fund returns would have been lower if a portion of the fees had not been waived.
The performance information presented does not include the fees and charges assessed with investments in variable insurance products, those charges are disclosed in the separate account prospectus. The inclusion of such fees and charges would lower performance.
Data presented reflect past performance. Past performance is no guarantee of future results. Current performance may be higher or lower than the performance shown. Total returns for periods less than one year are not annualized. Investment return and principal value will fluctuate, and redemption value may be more or less than original cost. Data assumes reinvestment of dividends and capital gains, and none of the charts reflect the deduction of taxes that a shareholder would pay on fund distributions or the redemption of fund shares. To obtain performance data current to the most recent month end, please call 1-800-345-6488 or visit americancentury.com. For additional information about the fund, please consult the prospectus.
| | |
| Growth of $10,000 Over 10 Years |
| $10,000 investment made December 31, 2012 |
| Performance for other share classes will vary due to differences in fee structure. |
| | | | | |
| Value on December 31, 2022 |
| Class I — $26,545 |
|
| Russell Midcap Growth Index — $29,456 |
|
| |
|
| |
|
Ending value of Class I would have been lower if a portion of the fees had not been waived.
| | | | | | | | |
| Total Annual Fund Operating Expenses | |
| Class I | Class II | Class Y |
| 0.99% | 1.14% | 0.64% |
The total annual fund operating expenses shown is as stated in the fund’s prospectus current as of the date of this report. The prospectus may vary from the expense ratio shown elsewhere in this report because it is based on a different time period, includes acquired fund fees and expenses, and, if applicable, does not include fee waivers or expense reimbursements.
Data presented reflect past performance. Past performance is no guarantee of future results. Current performance may be higher or lower than the performance shown. Total returns for periods less than one year are not annualized. Investment return and principal value will fluctuate, and redemption value may be more or less than original cost. Data assumes reinvestment of dividends and capital gains, and none of the charts reflect the deduction of taxes that a shareholder would pay on fund distributions or the redemption of fund shares. To obtain performance data current to the most recent month end, please call 1-800-345-6488 or visit americancentury.com. For additional information about the fund, please consult the prospectus.
Portfolio Managers: Rob Brookby and Nalin Yogasundram
Performance Summary
VP Capital Appreciation returned -28.11%* for the 12 months ended December 31, 2022, versus the -26.72% return of the fund’s benchmark, the Russell Midcap Growth Index.
U.S. stocks fell sharply over the past 12 months, with the heaviest losses during the first three quarters of 2022. The downturn began amid a combination of factors—the new omicron variant of coronavirus, rising inflation, the Federal Reserve signaling interest rate increases—that led to investors moving to more defensive positioning. The market action was marked by a rotation out of the highest-growth stocks and pandemic winners into either lower growth or more traditional cyclical value stocks. Market declines intensified after Russia invaded Ukraine, exacerbating already stretched supply chains and leading to soaring oil prices that helped drive inflation to four-decade highs. Within the Russell Midcap Growth Index, energy was by far the top-performing sector, benefiting from rising prices and increased demand amid limited supplies. Utilities held up better than other sectors, all of which posted losses.
The energy sector helped drive the fund’s underperformance relative to the benchmark, due to our underweight allocation. Stock selection in the information technology sector also detracted. Stock decisions in the health care and consumer staples sectors led contributors.
Energy Detracted From Performance
The energy sector was the top performer over the 12-month period, and our underweight hampered relative performance. For example, we did not own benchmark component Cheniere Energy, a liquefied natural gas producer that benefited from the crisis in European energy security as a consequence of the war in Ukraine.
In information technology, stock choices in IT services detracted, led by Cloudflare, which provides cloud infrastructure solutions to help companies handle internet traffic and security threats. The company reported strong results but lagged on concerns about cautious customer spending.
Elsewhere, the online dating company Match Group reported quarterly earnings and guidance that were below expectations, causing a sharp sell-off. The problem related primarily to Tinder, its biggest dating app. With a new CEO at Match and a recently replaced Tinder management team, investors wondered whether Tinder is fixable and whether the online dating category is more saturated than previously thought. Airbnb weighed on performance. The online rental site underperformed on concerns about deceleration in bookings growth in the face of a weakening macroeconomic environment. There was also concern around whether Airbnb can continue to drive active listings growth. We believe that the company will be a long-term market share gainer.
Seagen, a biotechnology company focused on monoclonal antibody treatments for cancer, detracted after a clinical data failure and intellectual property lawsuit loss. We exited the position to fund better opportunities. The ride-hailing company Lyft underperformed as management was doing a disappointing job executing in the U.S. market coming out of the pandemic.
Health Care Stocks Benefited Performance
In health care, Sarepta Therapeutics was a top contributor. The biotechnology company’s management announced its intent to file for accelerated approval for its gene therapy that treats a
rare neuromuscular disease. Investors had anticipated a regular approval, which would have a
*All fund returns referenced in this commentary are for Class I shares. Fund returns would have been lower if a portion of the fees had not been waived. Performance for other share classes will vary due to differences in fee structure; when Class I performance exceeds that of the fund’s benchmark, other share classes may not. See page 2 for returns for all share classes.
longer timeline. Neurocrine Biosciences outperformed, boosted by strong sales of its lead drug, Ingrezza. Neurocrine focuses on neurological, endocrine and psychiatric disorders and benefited from patients returning to doctor visits as the pandemic restrictions eased.
Rising interest rates were helpful for segments of the financials sector. LPL Financial Holdings is the largest broker-dealer in the country with more than 20,000 advisors. It benefited from the rise in short-term interest rates because its large cash sweep assets allow it to earn a spread on increases in rates.
Other significant contributors included Celsius Holdings, a beverage company that offers calorie-burning drinks. It reported strong quarterly results driven by distribution gains in mass retail, convenience stores and clubs. Celsius also announced a distribution partnership with PepsiCo that could substantially accelerate its distribution gains and also provide it with access to the food service channel. Candy company Hershey outperformed. The chocolate category has several attractive attributes, including consistent growth, low consumer elasticity and the lowest private-label penetration. Hershey’s growth is supported by its ability to pass on price increases to consumers. Enphase Energy, which sells smart, easy-to-use solutions that manage solar generation, storage and communication on a single platform, reported strong results and guidance and significant growth in its home battery energy storage business.
Outlook
Our process uses a combined top-down, bottom-up fundamental framework aimed at identifying mid-capitalization companies producing attractive, sustainable growth. We seek to reduce unintended, nonfundamental risks and align the portfolio with fundamental, company-specific risks that we believe will be rewarded over time. As a result of this approach, our sector and industry allocations reflect where we are finding opportunities at a given time.
The past year was difficult for growth equities, but we want to reassure you that we retain high conviction in our investment process and portfolio holdings. We acknowledge the challenging environment and are closely monitoring the fundamentals of our investments. But our long-term focus also leads us to look through the short-term noise.
Looking ahead, we continue to see opportunities in infrastructure build-out, e-commerce, entertainment and other industries. Our key themes cross sector boundaries. For example, cybersecurity issues can affect everything from supply chains to meatpacking. Data analytics is important for any enterprise to help control spending and better understand customers. Decarbonization, automation and advances in health care such as cell and gene therapy are accelerating their importance in the longer-term investment landscape.
| | | | | |
| DECEMBER 31, 2022 |
| Types of Investments in Portfolio | % of net assets |
| Common Stocks | 98.0% |
| Short-Term Investments | 2.8% |
| Other Assets and Liabilities | (0.8)% |
| |
| Top Five Industries | % of net assets |
| Software | 11.0% |
| Life Sciences Tools and Services | 7.6% |
| Hotels, Restaurants and Leisure | 7.0% |
| Biotechnology | 6.1% |
| Semiconductors and Semiconductor Equipment | 4.6% |
Fund shareholders may incur two types of costs: (1) transaction costs, including sales charges (loads) on purchase payments and redemption/exchange fees; and (2) ongoing costs, including management fees; distribution and service (12b-1) fees; and other fund expenses. This example is intended to help you understand your ongoing costs (in dollars) of investing in your fund and to compare these costs with the ongoing cost of investing in other mutual funds.
The example is based on an investment of $1,000 made at the beginning of the period and held for the entire period from July 1, 2022 to December 31, 2022.
Actual Expenses
The table provides information about actual account values and actual expenses for each class. You may use the information, together with the amount you invested, to estimate the expenses that you paid over the period. First, identify the share class you own. Then simply divide your account value by $1,000 (for example, an $8,600 account value divided by $1,000 = 8.6), then multiply the result by the number under the heading “Expenses Paid During Period” to estimate the expenses you paid on your account during this period.
Hypothetical Example for Comparison Purposes
The table also provides information about hypothetical account values and hypothetical expenses based on the actual expense ratio of each class of your fund and an assumed rate of return of 5% per year before expenses, which is not the actual return of a fund’s share class. The hypothetical account values and expenses may not be used to estimate the actual ending account balance or expenses you paid for the period. You may use this information to compare the ongoing costs of investing in your fund and other funds. To do so, compare this 5% hypothetical example with the 5% hypothetical examples that appear in the shareholder reports of the other funds.
Please note that the expenses shown in the table are meant to highlight your ongoing costs only and do not reflect any transactional costs, such as sales charges (loads) or redemption/exchange fees. Therefore, the table is useful in comparing ongoing costs only, and will not help you determine the relative total costs of owning different funds. In addition, if these transactional costs were included, your costs would have been higher.
| | | | | | | | | | | | | | |
| Beginning
Account Value
7/1/22 | Ending
Account Value
12/31/22 | Expenses Paid During Period(1) 7/1/22 - 12/31/22 | Annualized Expense Ratio(1) |
| Actual | | | | |
| Class I | $1,000 | $1,078.60 | $4.82 | 0.92% |
| Class II | $1,000 | $1,077.50 | $5.60 | 1.07% |
| Class Y | $1,000 | $1,079.60 | $2.99 | 0.57% |
| Hypothetical | | | | |
| Class I | $1,000 | $1,020.57 | $4.69 | 0.92% |
| Class II | $1,000 | $1,019.81 | $5.45 | 1.07% |
| Class Y | $1,000 | $1,022.33 | $2.91 | 0.57% |
(1)Expenses are equal to the class's annualized expense ratio listed in the table above, multiplied by the average account value over the period, multiplied by 184, the number of days in the most recent fiscal half-year, divided by 365, to reflect the one-half year period. Annualized expense ratio reflects actual expenses, including any applicable fee waivers or expense reimbursements and excluding any acquired fund fees and expenses.
DECEMBER 31, 2022
| | | | | | | | |
| Shares | Value |
| COMMON STOCKS — 98.0% | | |
| Aerospace and Defense — 3.6% | | |
CAE, Inc.(1) | 133,176 | | $ | 2,575,982 | |
| Curtiss-Wright Corp. | 43,819 | | 7,317,335 | |
| HEICO Corp. | 34,942 | | 5,368,489 | |
| | 15,261,806 | |
| Auto Components — 0.8% | | |
Aptiv PLC(1) | 36,958 | | 3,441,899 | |
| Banks — 1.0% | | |
SVB Financial Group(1) | 19,114 | | 4,398,896 | |
| Beverages — 1.8% | | |
Celsius Holdings, Inc.(1) | 75,241 | | 7,828,074 | |
| Biotechnology — 6.1% | | |
Alnylam Pharmaceuticals, Inc.(1) | 23,100 | | 5,489,715 | |
Cytokinetics, Inc.(1) | 54,337 | | 2,489,721 | |
Horizon Therapeutics PLC(1) | 26,703 | | 3,038,802 | |
IVERIC bio, Inc.(1) | 100,991 | | 2,162,217 | |
Neurocrine Biosciences, Inc.(1) | 51,241 | | 6,120,225 | |
Sarepta Therapeutics, Inc.(1) | 50,810 | | 6,583,960 | |
| | 25,884,640 | |
| Building Products — 1.8% | | |
| Trane Technologies PLC | 46,471 | | 7,811,310 | |
| Capital Markets — 4.5% | | |
| Ares Management Corp., Class A | 82,224 | | 5,627,411 | |
| LPL Financial Holdings, Inc. | 27,300 | | 5,901,441 | |
| MSCI, Inc. | 16,319 | | 7,591,109 | |
| | 19,119,961 | |
| Chemicals — 2.4% | | |
| Albemarle Corp. | 4,673 | | 1,013,387 | |
| Avient Corp. | 111,442 | | 3,762,282 | |
| Element Solutions, Inc. | 292,906 | | 5,327,960 | |
| | 10,103,629 | |
| Commercial Services and Supplies — 1.4% | | |
| Republic Services, Inc. | 45,345 | | 5,849,052 | |
| Communications Equipment — 3.0% | | |
Arista Networks, Inc.(1) | 106,140 | | 12,880,089 | |
| Containers and Packaging — 1.4% | | |
| Avery Dennison Corp. | 32,490 | | 5,880,690 | |
| Electrical Equipment — 4.3% | | |
| AMETEK, Inc. | 55,143 | | 7,704,580 | |
| Eaton Corp. PLC | 16,249 | | 2,550,281 | |
| nVent Electric PLC | 41,258 | | 1,587,195 | |
Plug Power, Inc.(1)(2) | 64,868 | | 802,417 | |
| Regal Rexnord Corp. | 46,385 | | 5,565,272 | |
| | 18,209,745 | |
| Electronic Equipment, Instruments and Components — 3.9% | | |
| Cognex Corp. | 109,561 | | 5,161,418 | |
Keysight Technologies, Inc.(1) | 67,396 | | 11,529,434 | |
| | 16,690,852 | |
| | | | | | | | |
| Shares | Value |
| Entertainment — 1.0% | | |
ROBLOX Corp., Class A(1) | 25,876 | | $ | 736,431 | |
Spotify Technology SA(1) | 44,144 | | 3,485,169 | |
| | 4,221,600 | |
| Equity Real Estate Investment Trusts (REITs) — 0.9% | | |
| Rexford Industrial Realty, Inc. | 70,968 | | 3,877,691 | |
| Food Products — 3.2% | | |
| Hershey Co. | 58,634 | | 13,577,875 | |
| Health Care Equipment and Supplies — 4.3% | | |
DexCom, Inc.(1) | 83,110 | | 9,411,377 | |
IDEXX Laboratories, Inc.(1) | 22,421 | | 9,146,871 | |
| | 18,558,248 | |
| Health Care Providers and Services — 0.4% | | |
R1 RCM, Inc.(1) | 171,743 | | 1,880,586 | |
| Health Care Technology — 1.4% | | |
Veeva Systems, Inc., Class A(1) | 36,963 | | 5,965,089 | |
| Hotels, Restaurants and Leisure — 7.0% | | |
Airbnb, Inc., Class A(1) | 70,578 | | 6,034,419 | |
Chipotle Mexican Grill, Inc.(1) | 7,798 | | 10,819,647 | |
| Hilton Worldwide Holdings, Inc. | 101,827 | | 12,866,860 | |
| | 29,720,926 | |
| Interactive Media and Services — 0.9% | | |
Match Group, Inc.(1) | 88,920 | | 3,689,291 | |
| Internet and Direct Marketing Retail — 1.0% | | |
Chewy, Inc., Class A(1)(2) | 64,760 | | 2,401,301 | |
Etsy, Inc.(1) | 15,729 | | 1,884,019 | |
| | 4,285,320 | |
| IT Services — 2.7% | | |
Cloudflare, Inc., Class A(1) | 106,536 | | 4,816,493 | |
EPAM Systems, Inc.(1) | 20,360 | | 6,672,786 | |
| | 11,489,279 | |
| Life Sciences Tools and Services — 7.6% | | |
| Agilent Technologies, Inc. | 49,919 | | 7,470,378 | |
Avantor, Inc.(1) | 181,436 | | 3,826,485 | |
| Bio-Techne Corp. | 64,330 | | 5,331,671 | |
IQVIA Holdings, Inc.(1) | 42,524 | | 8,712,743 | |
Mettler-Toledo International, Inc.(1) | 4,805 | | 6,945,387 | |
| | 32,286,664 | |
| Machinery — 2.1% | | |
| Graco, Inc. | 61,764 | | 4,154,247 | |
| Parker-Hannifin Corp. | 16,495 | | 4,800,045 | |
| | 8,954,292 | |
| Media — 1.2% | | |
Trade Desk, Inc., Class A(1) | 112,313 | | 5,034,992 | |
| Oil, Gas and Consumable Fuels — 3.6% | | |
| Excelerate Energy, Inc., Class A | 79,179 | | 1,983,434 | |
| Hess Corp. | 93,105 | | 13,204,151 | |
| | 15,187,585 | |
| Pharmaceuticals — 0.6% | | |
Catalent, Inc.(1) | 53,722 | | 2,418,027 | |
| Professional Services — 3.0% | | |
| Jacobs Solutions, Inc. | 61,716 | | 7,410,240 | |
| | | | | | | | |
| Shares | Value |
| Verisk Analytics, Inc. | 30,339 | | $ | 5,352,406 | |
| | 12,762,646 | |
| Road and Rail — 2.1% | | |
Lyft, Inc., Class A(1) | 129,961 | | 1,432,170 | |
| Norfolk Southern Corp. | 31,464 | | 7,753,359 | |
| | 9,185,529 | |
| Semiconductors and Semiconductor Equipment — 4.6% | | |
Enphase Energy, Inc.(1) | 23,477 | | 6,220,466 | |
| Marvell Technology, Inc. | 65,395 | | 2,422,231 | |
| Monolithic Power Systems, Inc. | 13,820 | | 4,886,890 | |
| Teradyne, Inc. | 69,924 | | 6,107,861 | |
| | 19,637,448 | |
| Software — 11.0% | | |
Cadence Design Systems, Inc.(1) | 100,835 | | 16,198,134 | |
Datadog, Inc., Class A(1) | 80,478 | | 5,915,133 | |
DocuSign, Inc.(1) | 23,272 | | 1,289,734 | |
HubSpot, Inc.(1) | 20,936 | | 6,053,226 | |
Manhattan Associates, Inc.(1) | 69,412 | | 8,426,617 | |
Palo Alto Networks, Inc.(1) | 63,321 | | 8,835,812 | |
| | 46,718,656 | |
| Specialty Retail — 1.3% | | |
Burlington Stores, Inc.(1) | 14,961 | | 3,033,492 | |
Five Below, Inc.(1) | 14,047 | | 2,484,493 | |
| | 5,517,985 | |
| Textiles, Apparel and Luxury Goods — 2.1% | | |
lululemon athletica, Inc.(1) | 28,287 | | 9,062,589 | |
TOTAL COMMON STOCKS (Cost $368,722,183) | | 417,392,961 | |
| SHORT-TERM INVESTMENTS — 2.8% | | |
| Money Market Funds — 0.8% | | |
| State Street Institutional U.S. Government Money Market Fund, Premier Class | 115,091 | | 115,091 | |
State Street Navigator Securities Lending Government Money Market Portfolio(3) | 3,287,947 | | 3,287,947 | |
| | 3,403,038 | |
| Repurchase Agreements — 2.0% | | |
| BMO Capital Markets Corp., (collateralized by various U.S. Treasury obligations, 0.375% - 0.50%, 9/15/24 - 5/31/27, valued at $1,249,201), in a joint trading account at 4.20%, dated 12/30/22, due 1/3/23 (Delivery value $1,226,633) | | 1,226,061 | |
| Fixed Income Clearing Corp., (collateralized by various U.S. Treasury obligations, 1.375%, 11/15/31, valued at $7,683,664), at 4.26%, dated 12/30/22, due 1/3/23 (Delivery value $7,536,566) | | 7,533,000 | |
| | 8,759,061 | |
TOTAL SHORT-TERM INVESTMENTS (Cost $12,162,099) | | 12,162,099 | |
TOTAL INVESTMENT SECURITIES—100.8% (Cost $380,884,282) | | 429,555,060 | |
| OTHER ASSETS AND LIABILITIES — (0.8)% | | (3,476,396) | |
| TOTAL NET ASSETS — 100.0% | | $ | 426,078,664 | |
| | | | | | | | | | | | | | | | | | | | |
| FORWARD FOREIGN CURRENCY EXCHANGE CONTRACTS | | |
| Currency Purchased | Currency Sold | Counterparty | Settlement
Date | Unrealized
Appreciation
(Depreciation) |
| CAD | 77,908 | | USD | 57,564 | | Goldman Sachs & Co. | 3/31/23 | $ | 17 | |
| CAD | 88,740 | | USD | 65,266 | | Goldman Sachs & Co. | 3/31/23 | 321 | |
| USD | 2,363,537 | | CAD | 3,231,428 | | Goldman Sachs & Co. | 3/31/23 | (24,773) | |
| USD | 57,596 | | CAD | 77,908 | | Goldman Sachs & Co. | 3/31/23 | 15 | |
| | | | | | $ | (24,420) | |
| | | | | | | | |
| NOTES TO SCHEDULE OF INVESTMENTS |
| CAD | – | Canadian Dollar |
| USD | – | United States Dollar |
(1)Non-income producing.
(2)Security, or a portion thereof, is on loan. At the period end, the aggregate value of securities on loan was $3,203,718. The amount of securities on loan indicated may not correspond with the securities on loan identified because securities with pending sales are in the process of recall from the brokers.
(3)Investment of cash collateral from securities on loan. At the period end, the aggregate value of the collateral held by the fund was $3,287,947.
See Notes to Financial Statements.
| | |
| Statement of Assets and Liabilities |
| | | | | |
| DECEMBER 31, 2022 | |
| Assets |
| Investment securities, at value (cost of $377,596,335) — including $3,203,718 of securities on loan | $ | 426,267,113 | |
Investment made with cash collateral received for securities on loan, at value
(cost of $3,287,947) | 3,287,947 | |
| Total investment securities, at value (cost of $380,884,282) | 429,555,060 | |
| Cash | 33,958 | |
| Receivable for capital shares sold | 33,598 | |
| Unrealized appreciation on forward foreign currency exchange contracts | 353 | |
| Dividends and interest receivable | 115,102 | |
| Securities lending receivable | 1,025 | |
| 429,739,096 | |
| |
| Liabilities | |
| Payable for collateral received for securities on loan | 3,287,947 | |
| Payable for capital shares redeemed | 108,141 | |
| Unrealized depreciation on forward foreign currency exchange contracts | 24,773 | |
| Accrued management fees | 237,879 | |
| Distribution fees payable | 779 | |
| Accrued other expenses | 913 | |
| 3,660,432 | |
| |
| Net Assets | $ | 426,078,664 | |
| |
| Net Assets Consist of: | |
| Capital (par value and paid-in surplus) | $ | 379,626,644 | |
| Distributable earnings | 46,452,020 | |
| $ | 426,078,664 | |
| | | | | | | | | | | |
| Net Assets | Shares Outstanding | Net Asset Value Per Share |
| Class I, $0.01 Par Value | $79,646,486 | 6,751,842 | $11.80 |
| Class II, $0.01 Par Value | $3,568,679 | 309,290 | $11.54 |
| Class Y, $0.01 Par Value | $342,863,499 | 28,396,325 | $12.07 |
See Notes to Financial Statements.
| | | | | |
| YEAR ENDED DECEMBER 31, 2022 |
| Investment Income (Loss) |
| Income: | |
| Dividends | $ | 2,052,099 | |
| Interest | 93,068 | |
| Securities lending, net | 10,310 | |
| 2,155,477 | |
| |
| Expenses: | |
| Management fees | 3,408,176 | |
| Distribution fees - Class II | 9,675 | |
| Directors' fees and expenses | 13,310 | |
| Other expenses | 8,660 | |
| 3,439,821 | |
Fees waived(1) | (380,800) | |
| 3,059,021 | |
| |
| Net investment income (loss) | (903,544) | |
| |
| Realized and Unrealized Gain (Loss) | |
| Net realized gain (loss) on: | |
| Investment transactions | (187,289) | |
| Forward foreign currency exchange contract transactions | 125,397 | |
| Foreign currency translation transactions | (435) | |
| (62,327) | |
| |
| Change in net unrealized appreciation (depreciation) on: | |
| Investments | (179,183,848) | |
| Forward foreign currency exchange contracts | (24,420) | |
| Translation of assets and liabilities in foreign currencies | (89) | |
| (179,208,357) | |
| |
| Net realized and unrealized gain (loss) | (179,270,684) | |
| |
| Net Increase (Decrease) in Net Assets Resulting from Operations | $ | (180,174,228) | |
(1)Amount consists of $71,558, $3,096 and $306,146 for Class I, Class II and Class Y, respectively.
See Notes to Financial Statements.
| | |
| Statement of Changes in Net Assets |
| | | | | | | | |
| YEARS ENDED DECEMBER 31, 2022 AND DECEMBER 31, 2021 |
| Increase (Decrease) in Net Assets | December 31, 2022 | December 31, 2021 |
| Operations | | |
| Net investment income (loss) | $ | (903,544) | | $ | (2,529,181) | |
| Net realized gain (loss) | (62,327) | | 69,578,648 | |
| Change in net unrealized appreciation (depreciation) | (179,208,357) | | 6,879,433 | |
| Net increase (decrease) in net assets resulting from operations | (180,174,228) | | 73,928,900 | |
| | |
| Distributions to Shareholders | | |
| From earnings: | | |
| Class I | (12,876,968) | | (14,793,552) | |
| Class II | (578,124) | | (282,053) | |
| Class Y | (54,098,814) | | (66,710,745) | |
| Decrease in net assets from distributions | (67,553,906) | | (81,786,350) | |
| | |
| Capital Share Transactions | | |
| Net increase (decrease) in net assets from capital share transactions (Note 5) | 19,348,259 | | (10,387,527) | |
| | |
| Net increase (decrease) in net assets | (228,379,875) | | (18,244,977) | |
| | |
| Net Assets | | |
| Beginning of period | 654,458,539 | | 672,703,516 | |
| End of period | $ | 426,078,664 | | $ | 654,458,539 | |
See Notes to Financial Statements.
| | |
| Notes to Financial Statements |
DECEMBER 31, 2022
1. Organization
American Century Variable Portfolios, Inc. (the corporation) is registered under the Investment Company Act of 1940, as amended (the 1940 Act), as an open-end management investment company and is organized as a Maryland corporation. VP Capital Appreciation Fund (the fund) is one fund in a series issued by the corporation. The fund’s investment objective is to seek capital growth. The fund offers Class I, Class II and Class Y.
2. Significant Accounting Policies
The following is a summary of significant accounting policies consistently followed by the fund in preparation of its financial statements. The fund is an investment company and follows accounting and reporting guidance in accordance with accounting principles generally accepted in the United States of America. This may require management to make certain estimates and assumptions at the date of the financial statements. Actual results could differ from these estimates. Management evaluated the impact of events or transactions occurring through the date the financial statements were issued that would merit recognition or disclosure.
Investment Valuations — The fund determines the fair value of its investments and computes its net asset value (NAV) per share at the close of regular trading (usually 4 p.m. Eastern time) on the New York Stock Exchange (NYSE) on each day the NYSE is open. The value of investments of the fund is determined by American Century Investment Management, Inc. (ACIM) (the investment advisor), as the valuation designee, pursuant to its valuation policies and procedures. The Board of Directors oversees the valuation designee and reviews its valuation policies and procedures at least annually.
Equity securities that are listed or traded on a domestic securities exchange are valued at the last reported sales price or at the official closing price as provided by the exchange. Equity securities traded on foreign securities exchanges are generally valued at the closing price of such securities on the exchange where primarily traded or at the close of the NYSE, if that is earlier. If no last sales price is reported, or if local convention or regulation so provides, the mean of the latest bid and asked prices may be used. Securities traded over-the-counter are valued at the mean of the latest bid and asked prices, the last sales price, or the official closing price. Equity securities initially expressed in local currencies are translated into U.S. dollars at the mean of the appropriate currency exchange rate at the close of the NYSE as provided by an independent pricing service.
Open-end management investment companies are valued at the reported NAV per share. Repurchase agreements are valued at cost, which approximates fair value. Forward foreign currency exchange contracts are valued at the mean of the appropriate forward exchange rate at the close of the NYSE as provided by an independent pricing service.
If the valuation designee determines that the market price for a portfolio security is not readily available or is believed by the valuation designee to be unreliable, such security is valued at fair value as determined in good faith by the valuation designee, in accordance with its policies and procedures. Circumstances that may cause the fund to determine that market quotations are not available or reliable include, but are not limited to: when there is a significant event subsequent to the market quotation; trading in a security has been halted during the trading day; or trading in a security is insufficient or did not take place due to a closure or holiday.
The valuation designee monitors for significant events occurring after the close of an investment’s primary exchange but before the fund’s NAV per share is determined. Significant events may include, but are not limited to: corporate announcements and transactions; regulatory news, governmental action and political unrest that could impact a specific investment or an investment sector; or armed conflicts, natural disasters and similar events that could affect investments in a specific country or region. The valuation designee also monitors for significant fluctuations between domestic and foreign markets, as evidenced by the U.S. market or such other indicators that it deems appropriate. The valuation designee may apply a model-derived factor to the closing price of equity securities traded on foreign securities exchanges. The factor is based on observable market data as provided by an independent pricing service.
Security Transactions — Security transactions are accounted for as of the trade date. Net realized gains and losses are determined on the identified cost basis, which is also used for federal income tax purposes.
Investment Income — Dividend income less foreign taxes withheld, if any, is recorded as of the ex-dividend date. Distributions received on securities that represent a return of capital or long-term capital gain are recorded as a reduction of cost of investments and/or as a realized gain. The fund may estimate the components of distributions received that may be considered nontaxable distributions or long-term capital gain distributions for income tax purposes. Interest income is recorded on the accrual basis and includes accretion of discounts and amortization of premiums. Securities lending income is net of fees and rebates earned by the lending agent for its services.
Foreign Currency Translations — All assets and liabilities initially expressed in foreign currencies are translated into U.S. dollars at prevailing exchange rates at period end. The fund may enter into spot foreign currency exchange contracts to facilitate transactions denominated in a foreign currency. Purchases and sales of investment securities, dividend and interest income, spot foreign currency exchange contracts, and expenses are translated at the rates of exchange prevailing on the respective dates of such transactions. Net realized and unrealized foreign currency exchange gains or losses related to investment securities are a component of net realized gain (loss) on investment transactions and change in net unrealized appreciation (depreciation) on investments, respectively.
Repurchase Agreements — The fund may enter into repurchase agreements with institutions that ACIM has determined are creditworthy pursuant to criteria adopted by the Board of Directors. The fund requires that the collateral, represented by securities, received in a repurchase transaction be transferred to the custodian in a manner sufficient to enable the fund to obtain those securities in the event of a default under the repurchase agreement. ACIM monitors, on a daily basis, the securities transferred to ensure the value, including accrued interest, of the securities under each repurchase agreement is equal to or greater than amounts owed to the fund under each repurchase agreement.
Joint Trading Account — Pursuant to an Exemptive Order issued by the Securities and Exchange Commission, the fund, along with certain other funds in the American Century Investments family of funds, may transfer uninvested cash balances into a joint trading account. These balances are invested in one or more repurchase agreements that are collateralized by U.S. Treasury or Agency obligations.
Segregated Assets — In accordance with the 1940 Act, the fund segregates assets on its books and records to cover certain types of investment securities and other financial instruments. ACIM monitors, on a daily basis, the securities segregated to ensure the fund designates a sufficient amount of liquid assets, marked-to-market daily. The fund may also receive assets or be required to pledge assets at the custodian bank or with a broker for collateral requirements. The fund may incur charges or earn income on posted collateral balances, which are reflected in interest expenses or interest income, respectively.
Income Tax Status — It is the fund's policy to distribute substantially all net investment income and net realized gains to shareholders and to otherwise qualify as a regulated investment company under provisions of the Internal Revenue Code. Accordingly, no provision has been made for income taxes. The fund files U.S. federal, state, local and non-U.S. tax returns as applicable. The fund's tax returns are subject to examination by the relevant taxing authority until expiration of the applicable statute of limitations, which is generally three years from the date of filing but can be longer in certain jurisdictions. At this time, management believes there are no uncertain tax positions which, based on their technical merit, would not be sustained upon examination and for which it is reasonably possible that the total amounts of unrecognized tax benefits will significantly change in the next twelve months.
Multiple Class — All shares of the fund represent an equal pro rata interest in the net assets of the class to which such shares belong, and have identical voting, dividend, liquidation and other rights and the same terms and conditions, except for class specific expenses and exclusive rights to vote on matters affecting only individual classes. Income, non-class specific expenses, and realized and unrealized capital gains and losses of the fund are allocated to each class of shares based on their relative net assets.
Distributions to Shareholders — Distributions from net investment income and net realized gains, if any, are generally declared and paid annually.
Indemnifications — Under the corporation’s organizational documents, its officers and directors are indemnified against certain liabilities arising out of the performance of their duties to the fund. In addition, in the normal course of business, the fund enters into contracts that provide general indemnifications. The maximum exposure under these arrangements is unknown as this would involve future claims that may be made against a fund. The risk of material loss from such claims is considered by management to be remote.
Securities Lending — Securities are lent to qualified financial institutions and brokers. State Street Bank & Trust Co. serves as securities lending agent to the fund pursuant to a Securities Lending Agreement. The lending of securities exposes the fund to risks such as: the borrowers may fail to return the loaned securities, the borrowers may not be able to provide additional collateral, the fund may experience delays in recovery of the loaned securities or delays in access to collateral, or the fund may experience losses related to the investment collateral. To minimize certain risks, loan counterparties pledge collateral in the form of cash and/or securities. The lending agent has agreed to indemnify the fund in the case of default of any securities borrowed. Cash collateral received is invested in the State Street Navigator Securities Lending Government Money Market Portfolio, a money market mutual fund registered under the 1940 Act. The loans may also be secured by U.S. government securities in an amount at least equal to the market value of the securities loaned, plus accrued interest and dividends, determined on a daily basis and adjusted accordingly. By lending securities, the fund seeks to increase its net investment income through the receipt of interest and fees. Such income is reflected separately within the Statement of Operations. The value of loaned securities and related collateral outstanding at period end, if any, are shown on a gross basis within the Schedule of Investments and Statement of Assets and Liabilities.
The following table reflects a breakdown of transactions accounted for as secured borrowings, the gross obligation by the type of collateral pledged, and the remaining contractual maturity of those transactions as of December 31, 2022.
| | | | | | | | | | | | | | | | | |
| Remaining Contractual Maturity of Agreements |
| Overnight and
Continuous | <30 days | Between
30 & 90 days | >90 days | Total |
Securities Lending Transactions(1) | | | | |
| Common Stocks | $ | 3,287,947 | | — | | — | | — | | $ | 3,287,947 | |
| Gross amount of recognized liabilities for securities lending transactions | $ | 3,287,947 | |
(1)Amount represents the payable for cash collateral received for securities on loan. This will generally be in the Overnight and Continuous column as the securities are typically callable on demand.
3. Fees and Transactions with Related Parties
Certain officers and directors of the corporation are also officers and/or directors of American Century Companies, Inc. (ACC). The corporation's investment advisor, ACIM, the corporation's distributor, American Century Investment Services, Inc. (ACIS), and the corporation's transfer agent, American Century Services, LLC, are wholly owned, directly or indirectly, by ACC.
Management Fees — The corporation has entered into a management agreement with ACIM, under which ACIM provides the fund with investment advisory and management services in exchange for a single, unified management fee (the fee) per class. The agreement provides that ACIM will pay all expenses of managing and operating the fund, except brokerage expenses, taxes, interest, fees and expenses of the independent directors (including legal counsel fees), extraordinary expenses, and expenses incurred in connection with the provision of shareholder services and distribution services under a plan adopted pursuant to Rule 12b-1 under the 1940 Act. The fee is computed and accrued daily based on each class's daily net assets and paid monthly in arrears. The difference in the fee among the classes is a result of their separate arrangements for non-Rule 12b-1 shareholder services. It is not the result of any difference in advisory or custodial fees or other expenses related to the management of the fund’s assets, which do not vary by class. The rate of the fee is determined by applying a fee rate calculation formula. This formula takes into account the fund’s assets as well as certain assets, if any, of other clients of the investment advisor outside the American Century Investments family of funds (such as subadvised funds and separate accounts), as well as exchange-traded funds managed by the investment advisor, that use very similar investment teams and strategies (strategy assets). During the period ended December 31, 2022, the investment advisor agreed to waive 0.08% of the fund's management fee. The investment advisor expects this waiver to continue until July 31, 2023 and cannot terminate it prior to such date without the approval of the Board of Directors.
The management fee schedule range and the effective annual management fee before and after waiver for each class for the period ended December 31, 2022 are as follows:
| | | | | | | | | | | |
| | Effective Annual Management Fee |
| Management Fee Schedule Range | Before Waiver | After Waiver |
| Class I | 0.90% to 1.00% | 1.00% | 0.92% |
| Class II | 0.80% to 0.90% | 0.90% | 0.82% |
| Class Y | 0.55% to 0.65% | 0.65% | 0.57% |
Distribution Fees — The Board of Directors has adopted the Master Distribution Plan (the plan) for Class II, pursuant to Rule 12b-1 of the 1940 Act. The plan provides that Class II will pay ACIS an annual distribution fee equal to 0.25%. The fee is computed and accrued daily based on the Class II daily net assets and paid monthly in arrears. The distribution fee provides compensation for expenses incurred in connection with distributing shares of Class II including, but not limited to, payments to brokers, dealers, and financial institutions that have entered into sales agreements with respect to shares of the fund. Fees incurred under the plan during the period ended December 31, 2022 are detailed in the Statement of Operations.
Directors' Fees and Expenses — The Board of Directors is responsible for overseeing the investment advisor’s management and operations of the fund. The directors receive detailed information about the fund and its investment advisor regularly throughout the year, and meet at least quarterly with management of the investment advisor to review reports about fund operations. The fund's officers do not receive compensation from the fund.
Interfund Transactions — The fund may enter into security transactions with other American Century Investments funds and other client accounts of the investment advisor, in accordance with the 1940 Act rules and procedures adopted by the Board of Directors. The rules and procedures require, among other things, that these transactions be effected at the independent current market price of the security. There were no interfund transactions during the period.
4. Investment Transactions
Purchases and sales of investment securities, excluding short-term investments, for the period ended December 31, 2022 were $249,400,929 and $301,748,562, respectively.
5. Capital Share Transactions
Transactions in shares of the fund were as follows:
| | | | | | | | | | | | | | |
| Year ended
December 31, 2022 | Year ended
December 31, 2021 |
| Shares | Amount | Shares | Amount |
| Class I/Shares Authorized | 195,000,000 | | | 195,000,000 | | |
| Sold | 455,200 | | $ | 6,010,537 | | 471,668 | | $ | 8,836,272 | |
| Issued in reinvestment of distributions | 889,908 | | 12,876,968 | | 891,178 | | 14,793,552 | |
| Redeemed | (1,064,655) | | (13,553,429) | | (1,094,548) | | (20,783,291) | |
| 280,453 | | 5,334,076 | | 268,298 | | 2,846,533 | |
| Class II/Shares Authorized | 25,000,000 | | | 25,000,000 | | |
| Sold | 82,620 | | 1,039,983 | | 306,608 | | 5,434,526 | |
| Issued in reinvestment of distributions | 40,799 | | 578,124 | | 17,283 | | 282,053 | |
| Redeemed | (112,685) | | (1,427,526) | | (143,030) | | (2,480,089) | |
| 10,734 | | 190,581 | | 180,861 | | 3,236,490 | |
| Class Y/Shares Authorized | 180,000,000 | | | 180,000,000 | | |
| Sold | 475,060 | | 6,084,883 | | 473,418 | | 9,202,938 | |
| Issued in reinvestment of distributions | 3,662,750 | | 54,098,814 | | 3,959,095 | | 66,710,745 | |
| Redeemed | (3,480,760) | | (46,360,095) | | (4,940,342) | | (92,384,233) | |
| 657,050 | | 13,823,602 | | (507,829) | | (16,470,550) | |
| Net increase (decrease) | 948,237 | | $ | 19,348,259 | | (58,670) | | $ | (10,387,527) | |
6. Fair Value Measurements
The fund's investments valuation process is based on several considerations and may use multiple inputs to determine the fair value of the investments held by the fund. In conformity with accounting principles generally accepted in the United States of America, the inputs used to determine a valuation are classified into three broad levels.
•Level 1 valuation inputs consist of unadjusted quoted prices in an active market for identical investments.
•Level 2 valuation inputs consist of direct or indirect observable market data (including quoted prices for comparable investments, evaluations of subsequent market events, interest rates, prepayment speeds, credit risk, etc.). These inputs also consist of quoted prices for identical investments initially expressed in local currencies that are adjusted through translation into U.S. dollars.
•Level 3 valuation inputs consist of unobservable data (including a fund’s own assumptions).
The level classification is based on the lowest level input that is significant to the fair valuation measurement. The valuation inputs are not necessarily an indication of the risks associated with investing in these securities or other financial instruments.
The following is a summary of the level classifications as of period end. The Schedule of Investments provides additional information on the fund's portfolio holdings.
| | | | | | | | | | | |
| Level 1 | Level 2 | Level 3 |
| Assets | | | |
| Investment Securities | | | |
| Common Stocks | $ | 414,816,979 | | $ | 2,575,982 | | — | |
| Short-Term Investments | 3,403,038 | | 8,759,061 | | — | |
| $ | 418,220,017 | | $ | 11,335,043 | | — | |
| Other Financial Instruments | | | |
| Forward Foreign Currency Exchange Contracts | — | | $ | 353 | | — | |
| | | |
| Liabilities | | | |
| Other Financial Instruments | | | |
| Forward Foreign Currency Exchange Contracts | — | | $ | 24,773 | | — | |
7. Derivative Instruments
Foreign Currency Risk — The fund is subject to foreign currency exchange rate risk in the normal course of pursuing its investment objectives. The value of foreign investments held by a fund may be significantly affected by changes in foreign currency exchange rates. The dollar value of a foreign security generally decreases when the value of the dollar rises against the foreign currency in which the security is denominated and tends to increase when the value of the dollar declines against such foreign currency. A fund may enter into forward foreign currency exchange contracts to reduce a fund's exposure to foreign currency exchange rate fluctuations. The net U.S. dollar value of foreign currency underlying all contractual commitments held by a fund and the resulting unrealized appreciation or depreciation are determined daily. Realized gain or loss is recorded upon settlement of the contract. Net realized and unrealized gains or losses occurring during the holding period of forward foreign currency exchange contracts are a component of net realized gain (loss) on forward foreign currency exchange contract transactions and change in net unrealized appreciation (depreciation) on forward foreign currency exchange contracts, respectively. A fund bears the risk of an unfavorable change in the foreign currency exchange rate underlying the forward contract. Additionally, losses, up to the fair value, may arise if the counterparties do not perform under the contract terms. The fund's average U.S. dollar exposure to foreign currency risk derivative instruments held during the period was $2,647,032.
The value of foreign currency risk derivative instruments as of December 31, 2022, is disclosed on the Statement of Assets and Liabilities as an asset of $353 in unrealized appreciation on forward foreign currency exchange contracts and a liability of $24,773 in unrealized depreciation on forward foreign currency exchange contracts. For the year ended December 31, 2022, the effect of foreign currency risk derivative instruments on the Statement of Operations was $125,397 in net realized gain (loss) on forward foreign currency exchange contract transactions and $(24,420) in change in net unrealized appreciation (depreciation) on forward foreign currency exchange contracts.
8. Risk Factors
The value of the fund’s shares will go up and down, sometimes rapidly or unpredictably, based on the performance of the securities owned by the fund and other factors generally affecting the securities market. Market risks, including political, regulatory, economic and social developments, can affect the value of the fund’s investments. Natural disasters, public health emergencies, war, terrorism and other unforeseeable events may lead to increased market volatility and may have adverse long-term effects on world economies and markets generally.
The fund invests in common stocks of small companies. Because of this, the fund may be subject to greater risk and market fluctuations than a fund investing in larger, more established companies.
9. Federal Tax Information
The tax character of distributions paid during the years ended December 31, 2022 and December 31, 2021 were as follows:
| | | | | | | | |
| 2022 | 2021 |
| Distributions Paid From | | |
| Ordinary income | $ | 10,990,040 | | $ | 5,203,323 | |
| Long-term capital gains | $ | 56,563,866 | | $ | 76,583,027 | |
The book-basis character of distributions made during the year from net investment income or net realized gains may differ from their ultimate characterization for federal income tax purposes. These differences reflect the differing character of certain income items and net realized gains and losses for financial statement and tax purposes, and may result in reclassification among certain capital accounts on the financial statements.
As of period end, the federal tax cost of investments and the components of distributable earnings on a tax-basis were as follows:
| | | | | |
| Federal tax cost of investments | $ | 383,740,241 | |
| Gross tax appreciation of investments | $ | 99,750,892 | |
| Gross tax depreciation of investments | (53,936,073) | |
| Net tax appreciation (depreciation) of investments | 45,814,819 | |
| Net tax appreciation (depreciation) on derivatives and translation of assets and liabilities in foreign currencies | (139) | |
| Net tax appreciation (depreciation) | $ | 45,814,680 | |
| Undistributed ordinary income | — | |
| Accumulated long-term gains | $ | 638,952 | |
| Late-year ordinary loss deferral | $ | (1,612) | |
The difference between book-basis and tax-basis unrealized appreciation (depreciation) is attributable primarily to the tax deferral of losses on wash sales.
Loss deferrals represent certain qualified losses that the fund has elected to treat as having been incurred in the following fiscal year for federal income tax purposes.
| | | | | | | | | | | | | | | | | | | | | | | | | | | | | | | | | | | | | | | | | | | | | | | |
| For a Share Outstanding Throughout the Years Ended December 31 (except as noted) | | | | | | | |
| Per-Share Data | | | | | | | Ratios and Supplemental Data |
| | Income From Investment Operations: | Distributions From: | | | Ratio to Average Net Assets of: | | |
| Net Asset
Value,
Beginning
of Period | Net Investment Income (Loss)(1) | Net
Realized and Unrealized
Gain (Loss) | Total From
Investment Operations | Net
Investment
Income | Net
Realized
Gains | Total
Distributions | Net Asset
Value,
End of Period | Total Return(2) | Operating
Expenses | Operating
Expenses
(before
expense
waiver) | Net
Investment
Income
(Loss) | Net
Investment
Income
(Loss) (before
expense waiver) | Portfolio
Turnover
Rate | Net
Assets,
End of Period
(in
thousands) |
| Class I |
| 2022 | $18.71 | (0.06) | (4.83) | (4.89) | — | (2.02) | (2.02) | $11.80 | (28.11)% | 0.92% | 1.00% | (0.47)% | (0.55)% | 52% | $79,646 | |
| 2021 | $19.27 | (0.12) | 1.97 | 1.85 | — | (2.41) | (2.41) | $18.71 | 11.16% | 0.91% | 0.99% | (0.65)% | (0.73)% | 41% | $121,050 | |
| 2020 | $15.96 | (0.06) | 5.21 | 5.15 | — | (1.84) | (1.84) | $19.27 | 42.46% | 0.90% | 1.00% | (0.41)% | (0.51)% | 83% | $119,549 | |
| 2019 | $14.17 | (0.03) | 4.65 | 4.62 | — | (2.83) | (2.83) | $15.96 | 35.56% | 0.88% | 1.00% | (0.18)% | (0.30)% | 94% | $90,134 | |
| 2018 | $15.03 | (0.05) | (0.73) | (0.78) | — | (0.08) | (0.08) | $14.17 | (5.20)% | 0.93% | 1.00% | (0.29)% | (0.36)% | 103% | $145,373 | |
| Class II |
| 2022 | $18.37 | (0.08) | (4.73) | (4.81) | — | (2.02) | (2.02) | $11.54 | (28.25)% | 1.07% | 1.15% | (0.62)% | (0.70)% | 52% | $3,569 | |
| 2021 | $18.99 | (0.14) | 1.93 | 1.79 | — | (2.41) | (2.41) | $18.37 | 11.05% | 1.06% | 1.14% | (0.80)% | (0.88)% | 41% | $5,485 | |
| 2020 | $15.78 | (0.08) | 5.13 | 5.05 | — | (1.84) | (1.84) | $18.99 | 42.29% | 1.05% | 1.15% | (0.56)% | (0.66)% | 83% | $2,235 | |
| 2019 | $14.06 | (0.05) | 4.60 | 4.55 | — | (2.83) | (2.83) | $15.78 | 35.32% | 1.03% | 1.15% | (0.33)% | (0.45)% | 94% | $1,411 | |
| 2018 | $14.94 | (0.07) | (0.73) | (0.80) | — | (0.08) | (0.08) | $14.06 | (5.36)% | 1.08% | 1.15% | (0.44)% | (0.51)% | 103% | $1,053 | |
| | | | | | | | | | | | | | | | | | | | | | | | | | | | | | | | | | | | | | | | | | | | | | | |
| For a Share Outstanding Throughout the Years Ended December 31 (except as noted) | | | | | | | |
| Per-Share Data | | | | | | | Ratios and Supplemental Data |
| | Income From Investment Operations: | Distributions From: | | | Ratio to Average Net Assets of: | | |
| Net Asset
Value,
Beginning
of Period | Net Investment Income (Loss)(1) | Net
Realized and Unrealized
Gain (Loss) | Total From
Investment Operations | Net
Investment
Income | Net
Realized
Gains | Total
Distributions | Net Asset
Value,
End of Period | Total Return(2) | Operating
Expenses | Operating
Expenses
(before
expense
waiver) | Net
Investment
Income
(Loss) | Net
Investment
Income
(Loss) (before
expense waiver) | Portfolio
Turnover
Rate | Net
Assets,
End of Period
(in
thousands) |
| Class Y |
| 2022 | $19.03 | (0.02) | (4.92) | (4.94) | — | (2.02) | (2.02) | $12.07 | (27.92)% | 0.57% | 0.65% | (0.12)% | (0.20)% | 52% | $342,863 | |
| 2021 | $19.50 | (0.06) | 2.00 | 1.94 | — | (2.41) | (2.41) | $19.03 | 11.57% | 0.56% | 0.64% | (0.30)% | (0.38)% | 41% | $527,924 | |
| 2020 | $16.09 | (0.01) | 5.28 | 5.27 | (0.02) | (1.84) | (1.86) | $19.50 | 43.00% | 0.55% | 0.65% | (0.06)% | (0.16)% | 83% | $550,919 | |
| 2019 | $14.23 | 0.03 | 4.67 | 4.70 | (0.01) | (2.83) | (2.84) | $16.09 | 36.02% | 0.53% | 0.65% | 0.17% | 0.05% | 94% | $427,083 | |
| 2018 | $15.05 | 0.01 | (0.75) | (0.74) | — | (0.08) | (0.08) | $14.23 | (4.92)% | 0.58% | 0.65% | 0.06% | (0.01)% | 103% | $318,830 | |
| | |
| Notes to Financial Highlights |
(1)Computed using average shares outstanding throughout the period.
(2)Total returns are calculated based on the net asset value of the last business day. Total returns for periods less than one year are not annualized. The total returns presented do not include the fees and charges assessed with investments in variable insurance products, those charges are disclosed in the separate account prospectus. The inclusion of such fees and charges would lower total return.
See Notes to Financial Statements.
| | |
| Report of Independent Registered Public Accounting Firm |
To the Shareholders and the Board of Directors of American Century Variable Portfolios, Inc.:
Opinion on the Financial Statements and Financial Highlights
We have audited the accompanying statement of assets and liabilities, including the schedule of investments, of VP Capital Appreciation Fund (the “Fund”), one of the funds constituting the American Century Variable Portfolios, Inc., as of December 31, 2022, the related statement of operations for the year then ended, the statements of changes in net assets for each of the two years in the period then ended, the financial highlights for each of the five years in the period then ended, and the related notes. In our opinion, the financial statements and financial highlights present fairly, in all material respects, the financial position of VP Capital Appreciation Fund of the American Century Variable Portfolios, Inc. as of December 31, 2022, and the results of its operations for the year then ended, the changes in its net assets for each of the two years in the period then ended, and the financial highlights for each of the five years in the period then ended, in conformity with accounting principles generally accepted in the United States of America.
Basis for Opinion
These financial statements and financial highlights are the responsibility of the Fund's management. Our responsibility is to express an opinion on the Fund’s financial statements and financial highlights based on our audits. We are a public accounting firm registered with the Public Company Accounting Oversight Board (United States) (PCAOB) and are required to be independent with respect to the Fund in accordance with the U.S. federal securities laws and the applicable rules and regulations of the Securities and Exchange Commission and the PCAOB.
We conducted our audits in accordance with the standards of the PCAOB. Those standards require that we plan and perform the audit to obtain reasonable assurance about whether the financial statements and financial highlights are free of material misstatement, whether due to error or fraud. The Fund is not required to have, nor were we engaged to perform, an audit of its internal control over financial reporting. As part of our audits, we are required to obtain an understanding of internal control over financial reporting but not for the purpose of expressing an opinion on the effectiveness of the Fund’s internal control over financial reporting. Accordingly, we express no such opinion.
Our audits included performing procedures to assess the risks of material misstatement of the financial statements and financial highlights, whether due to error or fraud, and performing procedures that respond to those risks. Such procedures included examining, on a test basis, evidence regarding the amounts and disclosures in the financial statements and financial highlights. Our audits also included evaluating the accounting principles used and significant estimates made by management, as well as evaluating the overall presentation of the financial statements and financial highlights. Our procedures included confirmation of securities owned as of December 31, 2022, by correspondence with the custodian and brokers; when replies were not received from brokers, we performed other auditing procedures. We believe that our audits provide a reasonable basis for our opinion.
/s/ Deloitte & Touche LLP
Kansas City, Missouri
February 10, 2023
We have served as the auditor of one or more American Century investment companies since 1997.
The Board of Directors
The individuals listed below serve as directors of the funds. Each director will continue to serve in this capacity until death, retirement, resignation or removal from office. The board has adopted a mandatory retirement age for directors who are not “interested persons,” as that term is defined in the Investment Company Act (independent directors). Independent directors shall retire on December 31 of the year in which they reach their 75th birthday.
Jonathan S. Thomas is an “interested person” because he currently serves as President and Chief Executive Officer of American Century Companies, Inc. (ACC), the parent company of American Century Investment Management, Inc. (ACIM or the advisor). The other directors (more than three-fourths of the total number) are independent. They are not employees, directors or officers of, and have no financial interest in, ACC or any of its wholly owned, direct or indirect, subsidiaries, including ACIM, American Century Investment Services, Inc. (ACIS) and American Century Services, LLC (ACS), and they do not have any other affiliations, positions or relationships that would cause them to be considered “interested persons” under the Investment Company Act. The directors serve in this capacity for seven (in the case of Jonathan S. Thomas, 16; and Stephen E. Yates, 8) registered investment companies in the American Century Investments family of funds.
The following table presents additional information about the directors. The mailing address for each director is 4500 Main Street, Kansas City, Missouri 64111.
| | | | | | | | | | | | | | | | | |
Name
(Year of Birth) | Position(s) Held with Funds | Length of Time Served | Principal Occupation(s) During Past 5 Years | Number of American Century Portfolios Overseen by Director | Other Directorships Held During Past 5 Years |
| Independent Directors | | |
Brian Bulatao
(1964) | Director | Since 2022 | Chief Administrative Officer, Activision Blizzard, Inc. (2021 to present); Under Secretary of State for Management, U.S. Department of State (2018 to 2021); Chief Operating Officer, Central Intelligence Agency (2017 to 2018) | 64 | None |
| Thomas W. Bunn (1953) | Director | Since 2017 | Retired | 64 | None |
Chris H. Cheesman
(1962)
| Director | Since 2019
| Retired. Senior Vice President & Chief Audit Executive, AllianceBernstein (1999 to 2018)
| 64 | Alleghany Corporation (2021 to 2022) |
Barry Fink
(1955) | Director | Since 2012 (independent since 2016) | Retired | 64 | None |
Rajesh K. Gupta
(1960)
| Director | Since 2019
| Partner Emeritus, SeaCrest Investment Management and SeaCrest Wealth Management (2019 to Present); Chief Executive Officer and Chief Investment Officer, SeaCrest Investment Management (2006 to 2019); Chief Executive Officer and Chief Investment Officer, SeaCrest Wealth Management (2008 to 2019) | 64 | None |
| | | | | | | | | | | | | | | | | |
Name
(Year of Birth) | Position(s) Held with Funds | Length of Time Served | Principal Occupation(s) During Past 5 Years | Number of American Century Portfolios Overseen by Director | Other Directorships Held During Past 5 Years |
| Independent Directors | | |
Lynn Jenkins
(1963)
| Director | Since 2019
| Consultant, LJ Strategies (2019 to present); United States Representative, U.S. House of Representatives (2009 to 2018) | 64 | MGP Ingredients, Inc. (2019 to 2021) |
Jan M. Lewis
(1957) | Director and Board Chair | Since 2011 (Board Chair since 2022) | Retired | 64 | None |
Gary C. Meltzer
(1963) | Director | Since 2022 | Advisor, Pontoro (2021 to present); Executive Advisor, Consultant and Investor, Harris Ariel Advisory LLC (2020 to present); Managing Partner, PricewaterhouseCoopers LLP (1985 to 2020) | 64 | ExcelFin Acquisition Corp., Apollo Realty Income Solutions, Inc. |
Stephen E. Yates
(1948) | Director | Since 2012 | Retired | 108 | None |
| Interested Director | |
Jonathan S. Thomas
(1963) | Director | Since 2007 | President and Chief Executive Officer, ACC (2007 to present). Also serves as Chief Executive Officer, ACS; Director, ACC and other ACC subsidiaries | 140 | None |
The Statement of Additional Information has additional information about the fund's directors and is available without charge, upon request, by calling 1-800-378-9878.
Officers
The following table presents certain information about the executive officers of the funds. Each officer serves as an officer for 16 (in the case of Robert J. Leach, 15) investment companies in the American Century family of funds. No officer is compensated for his or her service as an officer of the funds. The listed officers are interested persons of the funds and are appointed or re-appointed on an annual basis. The mailing address for each officer listed below is 4500 Main Street, Kansas City, Missouri 64111.
| | | | | | | | |
Name
(Year of Birth) | Offices with the Funds | Principal Occupation(s) During the Past Five Years |
Patrick Bannigan
(1965) | President since 2019 | Executive Vice President and Director, ACC (2012 to present); Chief Financial Officer, Chief Accounting Officer and Treasurer, ACC (2015 to present). Also serves as President, ACS; Vice President, ACIM; Chief Financial Officer, Chief Accounting Officer and/or Director, ACIM, ACS and other ACC subsidiaries |
R. Wes Campbell
(1974) | Chief Financial Officer and Treasurer since 2018 | Vice President, ACS, (2020 to present); Investment Operations and Investment Accounting, ACS (2000 to present) |
Amy D. Shelton
(1964) | Chief Compliance Officer and Vice President since 2014 | Chief Compliance Officer, American Century funds, (2014 to present); Chief Compliance Officer, ACIM (2014 to present); Chief Compliance Officer, ACIS (2009 to present). Also serves as Vice President, ACIS |
John Pak
(1968) | General Counsel and
Senior Vice President since 2021 | General Counsel and Senior Vice President, ACC (2021 to present); Also serves as General Counsel and Senior Vice President, ACIM, ACS and ACIS. Chief Legal Officer of Investment and Wealth Management, The Bank of New York Mellon (2014 to 2021) |
C. Jean Wade
(1964) | Vice President since 2012 | Senior Vice President, ACS (2017 to present); Vice President, ACS (2000 to 2017)
|
Robert J. Leach
(1966) | Vice President since 2006 | Vice President, ACS (2000 to present) |
David H. Reinmiller
(1963) | Vice President since 2000 | Attorney, ACC (1994 to present). Also serves as Vice President, ACIM and ACS |
Ward D. Stauffer
(1960) | Secretary since 2005 | Attorney, ACC (2003 to present) |
A special meeting of shareholders was held on October 13, 2022, to vote on the following proposal. The proposal received the required votes and was adopted. A summary of voting results is listed below.
To elect five directors to the Board of Directors of American Century Variable Portfolios, Inc.:
| | | | | | | | | | | |
| Affirmative | | Withhold |
| Brian Bulatao | $ | 2,607,537,119 | | | $ | 88,836,350 | |
| Chris H. Cheesman | $ | 2,619,879,519 | | | $ | 76,493,950 | |
| Rajesh K. Gupta | $ | 2,616,882,375 | | | $ | 79,491,094 | |
| Lynn M. Jenkins | $ | 2,607,769,137 | | | $ | 88,604,332 | |
| Gary C. Meltzer | $ | 2,616,158,906 | | | $ | 80,214,563 | |
The other directors whose term of office continued after the meeting include Jonathan S. Thomas, Thomas W. Bunn, Barry Fink, Jan M. Lewis, and Stephen E. Yates.
Proxy Voting Policies
A description of the policies that the fund's investment advisor uses in exercising the voting rights associated with the securities purchased and/or held by the fund is available without charge, upon request, by calling 1-800-378-9878. It is also available on American Century Investments’ website at americancentury.com/proxy and on the Securities and Exchange Commission’s website at sec.gov. Information regarding how the investment advisor voted proxies relating to portfolio securities during the most recent 12-month period ended June 30 is available on americancentury.com/proxy. It is also available at sec.gov.
Quarterly Portfolio Disclosure
The fund files its complete schedule of portfolio holdings with the Securities and Exchange Commission (SEC) for the first and third quarters of each fiscal year as an exhibit to its reports on Form N-PORT. These portfolio holdings are available on the fund's website at americancentury.com and, upon request, by calling 1-800-378-9878. The fund’s Form N-PORT reports are available on the SEC’s website at sec.gov.
Other Tax Information
The following information is provided pursuant to provisions of the Internal Revenue Code.
For corporate taxpayers, the fund hereby designates $1,491,307, or up to the maximum amount allowable, of ordinary income distributions paid during the fiscal year ended December 31, 2022 as qualified for the corporate dividends received deduction.
The fund hereby designates $56,563,866, or up to the maximum amount allowable, as long-term capital gain distributions (20% rate gain distributions) for the fiscal year ended December 31, 2022.
The fund hereby designates $10,990,040 as qualified short-term capital gain distributions for purposes of Internal Revenue Code Section 871 for the fiscal year ended December 31, 2022.
| | | | | | | | |
| |
| | |
| Contact Us | americancentury.com | |
| Automated Information Line | 1-800-345-8765 | |
| Investment Professional Service Representatives | 1-800-345-6488 | |
| Telecommunications Relay Service for the Deaf | 711 | |
| | |
| American Century Variable Portfolios, Inc. | |
| | |
Investment Advisor: American Century Investment Management, Inc. Kansas City, Missouri | |
| | |
| This report and the statements it contains are submitted for the general information of our shareholders. The report is not authorized for distribution to prospective investors unless preceded or accompanied by an effective prospectus. | |
| | |
©2023 American Century Proprietary Holdings, Inc. All rights reserved.
CL-ANN-91442 2302 | |
| | | | | |
| |
| Annual Report |
| |
| December 31, 2022 |
| |
| VP Disciplined Core Value Fund |
| Class I (AVGIX) |
| Class II (AVPGX) |
| | | | | |
| Performance | |
| Portfolio Commentary | |
| Fund Characteristics | |
| Shareholder Fee Example | |
| Schedule of Investments | |
| Statement of Assets and Liabilities | |
| Statement of Operations | |
| Statement of Changes in Net Assets | |
| Notes to Financial Statements | |
| Financial Highlights | |
| Report of Independent Registered Public Accounting Firm | |
| Management | |
| |
| |
| Proxy Voting Results | |
| Additional Information | |
Any opinions expressed in this report reflect those of the author as of the date of the report, and do not necessarily represent the opinions of American Century Investments® or any other person in the American Century Investments organization. Any such opinions are subject to change at any time based upon market or other conditions and American Century Investments disclaims any responsibility to update such opinions. These opinions may not be relied upon as investment advice and, because investment decisions made by American Century Investments funds are based on numerous factors, may not be relied upon as an indication of trading intent on behalf of any American Century Investments fund. Security examples are used for representational purposes only and are not intended as recommendations to purchase or sell securities. Performance information for comparative indices and securities is provided to American Century Investments by third party vendors. To the best of American Century Investments’ knowledge, such information is accurate at the time of printing.
| | | | | | | | | | | | | | | | | | |
| Total Returns as of December 31, 2022 |
| | | Average Annual Returns | |
| Ticker
Symbol | 1 year | 5 years | 10 years | | Inception
Date |
| Class I | AVGIX | -12.74% | 6.85% | 10.63% | | 10/30/97 |
| Russell 1000 Value Index | — | -7.54% | 6.66% | 10.29% | | — |
| Class II | AVPGX | -12.83% | 6.59% | 10.37% | | 5/1/02 |
The performance information presented does not include the fees and charges assessed with investments in variable insurance products, those charges are disclosed in the separate account prospectus. The inclusion of such fees and charges would lower performance.
| | |
| Growth of $10,000 Over 10 Years |
| $10,000 investment made December 31, 2012 |
| Performance for other share classes will vary due to differences in fee structure. |
| | | | | |
| Value on December 31, 2022 |
| Class I — $27,462 |
|
| Russell 1000 Value Index — $26,632 |
|
| | | | | |
| Total Annual Fund Operating Expenses |
| Class I | Class II |
| 0.70% | 0.95% |
The total annual fund operating expenses shown is as stated in the fund’s prospectus current as of the date of this report. The prospectus may vary from the expense ratio shown elsewhere in this report because it is based on a different time period, includes acquired fund fees and expenses, and, if applicable, does not include fee waivers or expense reimbursements.
Data presented reflect past performance. Past performance is no guarantee of future results. Current performance may be higher or lower than the performance shown. Total returns for periods less than one year are not annualized. Investment return and principal value will fluctuate, and redemption value may be more or less than original cost. Data assumes reinvestment of dividends and capital gains, and none of the charts reflect the deduction of taxes that a shareholder would pay on fund distributions or the redemption of fund shares. To obtain performance data current to the most recent month end, please call 1-800-345-6488 or visit americancentury.com. For additional information about the fund, please consult the prospectus.
Portfolio Managers: Steven Rossi, Yulin Long and Arun Daniel
Arun Daniel joined the portfolio management team in 2022.
Performance Summary
VP Disciplined Core Value returned -12.74%* for the year ended December 31, 2022, compared with the -7.54% return of its benchmark, the Russell 1000 Value Index.
VP Disciplined Core Value’s stock selection process incorporates factors of valuation, quality, growth and sentiment, while striving to minimize unintended risks along industries and other risk characteristics. The fund’s returns were primarily driven by stock selection decisions in the materials and consumer staples sectors. Positioning in the consumer discretionary sector also hindered relative performance. Stock selections and an overweight position in the health care sector added to relative results, as did an underweight to the communication services sector.
Derivatives didn’t have a material impact on performance during the reporting period.
Materials Detracted Most from Performance
Selection decisions in the materials sector detracted most from the fund’s relative performance. In the chemicals industry, shares of LyondellBasell Industries weighed most on returns. The company missed earnings expectations due to higher energy costs and weakening demand. In the containers and packaging industry, the fund’s position in WestRock was the primary detractor. Shares of WestRock and other packaging firms fell in response to a report from FedEx indicating that global shipping volumes were weakening. In the consumer staples sector, grocery chain Albertsons Cos. hindered returns most in the food and staples retailing industry. Shares declined along with the broader market, and concerns about a potential merger also hindered performance. We exited our position during the period. In the food products industry, shares of Tyson Foods detracted most. Although the company’s revenues have grown, sales volumes have declined and margins have deteriorated due to higher input costs. So, we exited our position.
The consumer discretionary sector also detracted from results, with stock choices being the primary hindrance. In the specialty retail industry, shares of AutoNation hampered returns when earnings failed to meet consensus estimates. The company cited constrained inventories and sales that were below historical levels. In the hotels, restaurants and lodging industry, shares of Boyd Gaming faced headwinds, declining along with much of the sector amid rising interest rates and economic uncertainty. Weakness in the company’s Las Vegas Locals segment also weighed on shares. Among notable individual detractors, it hurt performance compared with the benchmark to have no exposure to oil, gas and consumable fuels company ConocoPhillips. Surging oil prices meant earnings nearly doubled year over year through the third quarter, which the company returned to shareholders through significant dividend payouts and share buybacks.
*All fund returns referenced in this commentary are for Class I shares. Performance for other share classes will vary due to differences in fee structure; when Class I performance exceeds that of the fund’s benchmark, other share classes may not. See page 2 for returns for all share classes.
Health Care Added to Relative Performance
The health care sector was the primary area of strength during the reporting period, driven by an overweight to the sector as well as favorable stock selections. An overweight to the health care providers and services industry accounted for much of the outperformance, with a large position in McKesson, a pharmaceuticals distributor, the leading contributor across the entire portfolio. Overweight positioning in the biotechnology industry also added to performance. AbbVie, which is not in the benchmark, was the primary contributor. Horizon Therapeutics also added to returns. Shares of this U.K.-based company outperformed after Amgen said it would acquire Horizon at a considerable premium. We sold our position for a notable gain.
Underweighting in the communication services sector also improved performance. In the entertainment industry, the fund’s decision to avoid exposure to The Walt Disney Co. was the primary contributor. The company’s stock declined as earnings were hurt by rising costs in the company’s streaming division. In the interactive media and services industry, an underweight position in Meta Platforms was the primary driver of performance compared with the benchmark. The fund’s underweight position was beneficial because shares declined throughout the period as the company has continued to struggle with competitive headwinds and a difficult advertising environment.
A Look Ahead
As we start 2023, inflation, interest rates and the prospect of a possible economic slowdown continue to weigh on markets. Given those conditions, we think it’s reasonable to expect continued volatility ahead. It’s important to note that we adhere to our process regardless of the market environment. Our systematic investment strategy is designed to take advantage of opportunities at the individual company level. We believe this approach is the most powerful way to capitalize over time on market inefficiencies that lead to the mispricing of individual stocks. Our strategy is designed to provide broad U.S. equity market exposure with strong current income and risk management.
As of December 31, 2022, our largest relative exposure is in the health care sector, where we are finding opportunities in the health care providers and services and biotechnology industries. We also see compelling opportunities in the energy and materials sectors. In energy, we are overweight the oil, gas and consumable fuels industry, while in materials we are overweight the metals and mining, chemicals and containers and packaging industries. In contrast, we are notably underweight in the utilities and communication services sectors. We are also finding limited opportunities in the financials sector, especially in the capital markets and diversified financial services industries.
| | | | | |
| DECEMBER 31, 2022 |
| Types of Investments in Portfolio | % of net assets |
| Common Stocks | 98.7% |
| Short-Term Investments | 0.8% |
| Other Assets and Liabilities | 0.5% |
| |
| Top Five Industries | % of net assets |
| Oil, Gas and Consumable Fuels | 11.5% |
| Health Care Providers and Services | 9.9% |
| Banks | 7.2% |
| Pharmaceuticals | 5.9% |
| Insurance | 4.9% |
Fund shareholders may incur two types of costs: (1) transaction costs, including sales charges (loads) on purchase payments and redemption/exchange fees; and (2) ongoing costs, including management fees; distribution and service (12b-1) fees; and other fund expenses. This example is intended to help you understand your ongoing costs (in dollars) of investing in your fund and to compare these costs with the ongoing cost of investing in other mutual funds.
The example is based on an investment of $1,000 made at the beginning of the period and held for the entire period from July 1, 2022 to December 31, 2022.
Actual Expenses
The table provides information about actual account values and actual expenses for each class. You may use the information, together with the amount you invested, to estimate the expenses that you paid over the period. First, identify the share class you own. Then simply divide your account value by $1,000 (for example, an $8,600 account value divided by $1,000 = 8.6), then multiply the result by the number under the heading “Expenses Paid During Period” to estimate the expenses you paid on your account during this period.
Hypothetical Example for Comparison Purposes
The table also provides information about hypothetical account values and hypothetical expenses based on the actual expense ratio of each class of your fund and an assumed rate of return of 5% per year before expenses, which is not the actual return of a fund’s share class. The hypothetical account values and expenses may not be used to estimate the actual ending account balance or expenses you paid for the period. You may use this information to compare the ongoing costs of investing in your fund and other funds. To do so, compare this 5% hypothetical example with the 5% hypothetical examples that appear in the shareholder reports of the other funds.
Please note that the expenses shown in the table are meant to highlight your ongoing costs only and do not reflect any transactional costs, such as sales charges (loads) or redemption/exchange fees. Therefore, the table is useful in comparing ongoing costs only, and will not help you determine the relative total costs of owning different funds. In addition, if these transactional costs were included, your costs would have been higher.
| | | | | | | | | | | | | | |
| Beginning
Account Value
7/1/22 | Ending
Account Value
12/31/22 | Expenses Paid During Period(1) 7/1/22 - 12/31/22 | Annualized Expense Ratio(1) |
| Actual |
| Class I | $1,000 | $1,029.60 | $3.68 | 0.72% |
| Class II | $1,000 | $1,028.30 | $4.96 | 0.97% |
| Hypothetical |
| Class I | $1,000 | $1,021.58 | $3.67 | 0.72% |
| Class II | $1,000 | $1,020.32 | $4.94 | 0.97% |
(1)Expenses are equal to the class's annualized expense ratio listed in the table above, multiplied by the average account value over the period, multiplied by 184, the number of days in the most recent fiscal half-year, divided by 365, to reflect the one-half year period. Annualized expense ratio reflects actual expenses, including any applicable fee waivers or expense reimbursements and excluding any acquired fund fees and expenses.
DECEMBER 31, 2022
| | | | | | | | |
| Shares | Value |
| COMMON STOCKS — 98.7% | | |
| Aerospace and Defense — 1.3% | | |
| Lockheed Martin Corp. | 9,456 | | $ | 4,600,249 | |
| Air Freight and Logistics — 0.8% | | |
| FedEx Corp. | 16,342 | | 2,830,434 | |
| Airlines — 0.2% | | |
Alaska Air Group, Inc.(1) | 16,241 | | 697,389 | |
| Auto Components — 0.7% | | |
| BorgWarner, Inc. | 60,475 | | 2,434,119 | |
| Banks — 7.2% | | |
| East West Bancorp, Inc. | 49,320 | | 3,250,188 | |
| First Citizens BancShares, Inc., Class A | 1,686 | | 1,278,595 | |
| JPMorgan Chase & Co. | 31,460 | | 4,218,786 | |
| KeyCorp | 183,491 | | 3,196,413 | |
| Popular, Inc. | 53,364 | | 3,539,101 | |
| Regions Financial Corp. | 215,859 | | 4,653,920 | |
SVB Financial Group(1) | 5,857 | | 1,347,930 | |
| Wells Fargo & Co. | 40,644 | | 1,678,191 | |
| Western Alliance Bancorp | 50,352 | | 2,998,965 | |
| | 26,162,089 | |
| Biotechnology — 4.4% | | |
| AbbVie, Inc. | 29,293 | | 4,734,042 | |
| Amgen, Inc. | 16,790 | | 4,409,726 | |
Exelixis, Inc.(1) | 70,335 | | 1,128,173 | |
| Gilead Sciences, Inc. | 38,965 | | 3,345,145 | |
Regeneron Pharmaceuticals, Inc.(1) | 3,073 | | 2,217,139 | |
| | 15,834,225 | |
| Building Products — 2.2% | | |
Builders FirstSource, Inc.(1) | 26,156 | | 1,697,001 | |
| Masco Corp. | 60,715 | | 2,833,569 | |
| Owens Corning | 39,518 | | 3,370,886 | |
| | 7,901,456 | |
| Capital Markets — 2.9% | | |
| Affiliated Managers Group, Inc. | 6,155 | | 975,137 | |
| Morgan Stanley | 16,899 | | 1,436,753 | |
| Raymond James Financial, Inc. | 36,799 | | 3,931,973 | |
| SEI Investments Co. | 69,270 | | 4,038,441 | |
| | 10,382,304 | |
| Chemicals — 3.6% | | |
| CF Industries Holdings, Inc. | 31,509 | | 2,684,567 | |
| Dow, Inc. | 48,430 | | 2,440,388 | |
| Huntsman Corp. | 19,708 | | 541,576 | |
| LyondellBasell Industries NV, Class A | 57,503 | | 4,774,474 | |
| Olin Corp. | 51,225 | | 2,711,851 | |
| | 13,152,856 | |
| Communications Equipment — 0.6% | | |
| Juniper Networks, Inc. | 73,267 | | 2,341,613 | |
| | | | | | | | |
| Shares | Value |
| Consumer Finance — 0.2% | | |
| OneMain Holdings, Inc. | 25,379 | | $ | 845,374 | |
| Containers and Packaging — 1.5% | | |
| WestRock Co. | 155,627 | | 5,471,845 | |
| Distributors — 0.9% | | |
| LKQ Corp. | 57,633 | | 3,078,179 | |
| Diversified Consumer Services — 0.7% | | |
| H&R Block, Inc. | 72,701 | | 2,654,313 | |
| Diversified Financial Services — 1.6% | | |
Berkshire Hathaway, Inc., Class B(1) | 18,751 | | 5,792,184 | |
| Electronic Equipment, Instruments and Components — 0.8% | | |
Sanmina Corp.(1) | 23,001 | | 1,317,727 | |
| Vishay Intertechnology, Inc. | 76,908 | | 1,658,906 | |
| | 2,976,633 | |
| Entertainment — 1.5% | | |
| Electronic Arts, Inc. | 37,675 | | 4,603,131 | |
Live Nation Entertainment, Inc.(1) | 10,371 | | 723,274 | |
| | 5,326,405 | |
| Food and Staples Retailing — 2.5% | | |
| Costco Wholesale Corp. | 5,615 | | 2,563,247 | |
Sprouts Farmers Market, Inc.(1) | 51,459 | | 1,665,728 | |
| Walmart, Inc. | 32,714 | | 4,638,518 | |
| | 8,867,493 | |
| Food Products — 2.6% | | |
| Archer-Daniels-Midland Co. | 88,275 | | 8,196,334 | |
| Cal-Maine Foods, Inc. | 10,501 | | 571,779 | |
| Hormel Foods Corp. | 15,501 | | 706,071 | |
| | 9,474,184 | |
| Gas Utilities — 0.9% | | |
| Atmos Energy Corp. | 11,407 | | 1,278,382 | |
| ONE Gas, Inc. | 6,598 | | 499,601 | |
| UGI Corp. | 41,182 | | 1,526,617 | |
| | 3,304,600 | |
| Health Care Equipment and Supplies — 0.9% | | |
Hologic, Inc.(1) | 39,082 | | 2,923,724 | |
QuidelOrtho Corp.(1) | 5,933 | | 508,280 | |
| | 3,432,004 | |
| Health Care Providers and Services — 9.9% | | |
Centene Corp.(1) | 38,640 | | 3,168,866 | |
| Cigna Corp. | 12,626 | | 4,183,499 | |
| CVS Health Corp. | 116,774 | | 10,882,169 | |
| Elevance Health, Inc. | 7,852 | | 4,027,841 | |
Henry Schein, Inc.(1) | 40,520 | | 3,236,332 | |
| McKesson Corp. | 20,811 | | 7,806,622 | |
| UnitedHealth Group, Inc. | 4,403 | | 2,334,383 | |
| | 35,639,712 | |
| Health Care Technology — 0.2% | | |
Teladoc Health, Inc.(1) | 37,306 | | 882,287 | |
| Hotels, Restaurants and Leisure — 0.8% | | |
| Boyd Gaming Corp. | 50,401 | | 2,748,367 | |
| Household Durables — 0.3% | | |
| Toll Brothers, Inc. | 20,724 | | 1,034,542 | |
| | | | | | | | |
| Shares | Value |
| Independent Power and Renewable Electricity Producers — 0.9% |
| AES Corp. | 43,329 | | $ | 1,246,142 | |
| Vistra Corp. | 80,467 | | 1,866,834 | |
| | 3,112,976 | |
| Insurance — 4.9% | | |
| Allstate Corp. | 20,812 | | 2,822,107 | |
| Everest Re Group Ltd. | 15,393 | | 5,099,239 | |
| Marsh & McLennan Cos., Inc. | 15,223 | | 2,519,102 | |
| Progressive Corp. | 24,369 | | 3,160,903 | |
| Reinsurance Group of America, Inc. | 6,802 | | 966,496 | |
| W R Berkley Corp. | 40,928 | | 2,970,145 | |
| | 17,537,992 | |
| Interactive Media and Services — 0.7% | | |
Alphabet, Inc., Class A(1) | 10,907 | | 962,325 | |
Meta Platforms, Inc., Class A(1) | 11,986 | | 1,442,395 | |
| | 2,404,720 | |
| IT Services — 3.1% | | |
| Amdocs Ltd. | 17,084 | | 1,552,936 | |
Block, Inc.(1) | 27,601 | | 1,734,447 | |
| Cognizant Technology Solutions Corp., Class A | 63,507 | | 3,631,965 | |
DXC Technology Co.(1) | 13,831 | | 366,521 | |
| International Business Machines Corp. | 15,412 | | 2,171,397 | |
| MAXIMUS, Inc. | 24,666 | | 1,808,758 | |
| | 11,266,024 | |
| Life Sciences Tools and Services — 0.4% | | |
Bio-Rad Laboratories, Inc., Class A(1) | 1,336 | | 561,775 | |
| Thermo Fisher Scientific, Inc. | 1,458 | | 802,906 | |
| | 1,364,681 | |
| Machinery — 3.5% | | |
| AGCO Corp. | 18,239 | | 2,529,567 | |
| Cummins, Inc. | 16,041 | | 3,886,574 | |
| Oshkosh Corp. | 25,044 | | 2,208,630 | |
| Snap-on, Inc. | 17,398 | | 3,975,269 | |
| | 12,600,040 | |
| Media — 0.9% | | |
| Comcast Corp., Class A | 54,373 | | 1,901,424 | |
| Fox Corp., Class A | 43,810 | | 1,330,509 | |
| | 3,231,933 | |
| Metals and Mining — 2.1% | | |
| Nucor Corp. | 41,225 | | 5,433,867 | |
| Steel Dynamics, Inc. | 21,532 | | 2,103,677 | |
| | 7,537,544 | |
| Multiline Retail — 0.7% | | |
| Dillard's, Inc., Class A | 3,074 | | 993,517 | |
| Kohl's Corp. | 20,115 | | 507,903 | |
| Target Corp. | 5,773 | | 860,408 | |
| | 2,361,828 | |
| Oil, Gas and Consumable Fuels — 11.5% | | |
| APA Corp. | 45,191 | | 2,109,516 | |
| Cheniere Energy, Inc. | 26,596 | | 3,988,336 | |
CNX Resources Corp.(1) | 30,471 | | 513,132 | |
| Exxon Mobil Corp. | 161,119 | | 17,771,426 | |
| | | | | | | | |
| Shares | Value |
| Marathon Petroleum Corp. | 44,143 | | $ | 5,137,804 | |
| Ovintiv, Inc. | 27,374 | | 1,388,135 | |
| PBF Energy, Inc., Class A | 32,021 | | 1,305,816 | |
| Phillips 66 | 25,220 | | 2,624,898 | |
| Valero Energy Corp. | 52,325 | | 6,637,949 | |
| | 41,477,012 | |
| Pharmaceuticals — 5.9% | | |
| Bristol-Myers Squibb Co. | 82,064 | | 5,904,505 | |
| Johnson & Johnson | 13,182 | | 2,328,600 | |
| Merck & Co., Inc. | 12,662 | | 1,404,849 | |
| Pfizer, Inc. | 229,995 | | 11,784,944 | |
| | 21,422,898 | |
| Professional Services — 4.0% | | |
CACI International, Inc., Class A(1) | 17,364 | | 5,219,445 | |
FTI Consulting, Inc.(1) | 6,987 | | 1,109,536 | |
| Leidos Holdings, Inc. | 39,363 | | 4,140,594 | |
| ManpowerGroup, Inc. | 22,280 | | 1,853,919 | |
| Science Applications International Corp. | 18,536 | | 2,056,198 | |
| | 14,379,692 | |
| Real Estate Management and Development — 1.7% | | |
CBRE Group, Inc., Class A(1) | 56,279 | | 4,331,232 | |
Jones Lang LaSalle, Inc.(1) | 11,977 | | 1,908,774 | |
| | 6,240,006 | |
| Road and Rail — 1.2% | | |
| Knight-Swift Transportation Holdings, Inc. | 19,037 | | 997,729 | |
| Schneider National, Inc., Class B | 141,845 | | 3,319,173 | |
| | 4,316,902 | |
| Semiconductors and Semiconductor Equipment — 2.0% | | |
| Broadcom, Inc. | 7,382 | | 4,127,498 | |
MaxLinear, Inc.(1) | 42,277 | | 1,435,304 | |
| Micron Technology, Inc. | 10,025 | | 501,049 | |
| NXP Semiconductors NV | 8,135 | | 1,285,574 | |
| | 7,349,425 | |
| Software — 1.8% | | |
Dropbox, Inc., Class A(1) | 153,377 | | 3,432,577 | |
Synopsys, Inc.(1) | 5,830 | | 1,861,461 | |
Zoom Video Communications, Inc., Class A(1) | 18,720 | | 1,268,093 | |
| | 6,562,131 | |
| Specialty Retail — 2.1% | | |
Asbury Automotive Group, Inc.(1) | 6,230 | | 1,116,727 | |
AutoNation, Inc.(1) | 32,350 | | 3,471,155 | |
| Lithia Motors, Inc. | 3,969 | | 812,613 | |
| Penske Automotive Group, Inc. | 8,711 | | 1,001,155 | |
| Williams-Sonoma, Inc. | 11,767 | | 1,352,264 | |
| | 7,753,914 | |
| Technology Hardware, Storage and Peripherals — 1.1% | | |
| Dell Technologies, Inc., Class C | 44,418 | | 1,786,492 | |
| Hewlett Packard Enterprise Co. | 144,860 | | 2,311,966 | |
| | 4,098,458 | |
| Textiles, Apparel and Luxury Goods — 0.7% | | |
| PVH Corp. | 7,407 | | 522,860 | |
| Tapestry, Inc. | 49,693 | | 1,892,310 | |
| | 2,415,170 | |
| | | | | | | | |
| Shares | Value |
| Wireless Telecommunication Services — 0.3% | | |
T-Mobile US, Inc.(1) | 8,952 | | $ | 1,253,280 | |
TOTAL COMMON STOCKS (Cost $333,164,561) | | 356,551,482 | |
| SHORT-TERM INVESTMENTS — 0.8% | | |
Money Market Funds† | | |
| State Street Institutional U.S. Government Money Market Fund, Premier Class | 104,796 | | 104,796 | |
| Repurchase Agreements — 0.8% | | |
| BMO Capital Markets Corp., (collateralized by various U.S. Treasury obligations, 0.375% - 0.50%, 9/15/24 - 5/31/27, valued at $383,592), in a joint trading account at 4.20%, dated 12/30/22, due 1/3/23 (Delivery value $376,662) | | 376,486 | |
| Fixed Income Clearing Corp., (collateralized by various U.S. Treasury obligations, 1.375%, 11/15/31, valued at $2,359,334), at 4.26%, dated 12/30/22, due 1/3/23 (Delivery value $2,314,095) | | 2,313,000 | |
| | 2,689,486 | |
TOTAL SHORT-TERM INVESTMENTS (Cost $2,794,282) | | 2,794,282 | |
TOTAL INVESTMENT SECURITIES—99.5% (Cost $335,958,843) | | 359,345,764 | |
| OTHER ASSETS AND LIABILITIES — 0.5% | | 1,697,298 | |
| TOTAL NET ASSETS — 100.0% | | $ | 361,043,062 | |
| | | | | | | | |
| NOTES TO SCHEDULE OF INVESTMENTS |
†Category is less than 0.05% of total net assets.
(1)Non-income producing.
See Notes to Financial Statements.
| | |
| Statement of Assets and Liabilities |
| | | | | |
| DECEMBER 31, 2022 | |
| Assets |
| Investment securities, at value (cost of $335,958,843) | $ | 359,345,764 | |
| Receivable for capital shares sold | 363,007 | |
| Dividends and interest receivable | 1,688,493 | |
| 361,397,264 | |
| |
| Liabilities |
| Payable for capital shares redeemed | 101,620 | |
| Accrued management fees | 218,715 | |
| Distribution fees payable | 7,451 | |
| Accrued other expenses | 26,416 | |
| 354,202 | |
| |
| Net Assets | $ | 361,043,062 | |
| |
| Net Assets Consist of: |
| Capital (par value and paid-in surplus) | $ | 373,086,388 | |
| Distributable earnings | (12,043,326) | |
| $ | 361,043,062 | |
| | | | | | | | | | | |
| Net Assets | Shares Outstanding | Net Asset Value Per Share |
| Class I, $0.01 Par Value | $326,453,025 | 45,499,170 | $7.17 |
| Class II, $0.01 Par Value | $34,590,037 | 4,819,709 | $7.18 |
See Notes to Financial Statements.
| | | | | |
| YEAR ENDED DECEMBER 31, 2022 | |
| Investment Income (Loss) | |
| Income: | |
| Dividends (net of foreign taxes withheld of $120,711) | $ | 9,656,973 | |
| Interest | 63,045 | |
| 9,720,018 | |
| |
| Expenses: | |
| Management fees | 2,746,933 | |
| Distribution fees - Class II | 92,407 | |
| Directors' fees and expenses | 10,859 | |
| Other expenses | 26,565 | |
| 2,876,764 | |
| |
| Net investment income (loss) | 6,843,254 | |
| |
| Realized and Unrealized Gain (Loss) | |
| Net realized gain (loss) on: | |
| Investment transactions | (34,940,283) | |
| Futures contract transactions | 71,484 | |
| Foreign currency translation transactions | (31,164) | |
| (34,899,963) | |
| |
| Change in net unrealized appreciation (depreciation) on: | |
| Investments | (27,575,952) | |
| Translation of assets and liabilities in foreign currencies | 809 | |
| (27,575,143) | |
| |
| Net realized and unrealized gain (loss) | (62,475,106) | |
| |
| Net Increase (Decrease) in Net Assets Resulting from Operations | $ | (55,631,852) | |
See Notes to Financial Statements.
| | |
| Statement of Changes in Net Assets |
| | | | | | | | |
| YEARS ENDED DECEMBER 31, 2022 AND DECEMBER 31, 2021 |
| Increase (Decrease) in Net Assets | December 31, 2022 | December 31, 2021 |
| Operations | | |
| Net investment income (loss) | $ | 6,843,254 | | $ | 4,656,960 | |
| Net realized gain (loss) | (34,899,963) | | 98,325,897 | |
| Change in net unrealized appreciation (depreciation) | (27,575,143) | | (11,820,635) | |
| Net increase (decrease) in net assets resulting from operations | (55,631,852) | | 91,162,222 | |
| | |
| Distributions to Shareholders | | |
| From earnings: | | |
| Class I | (94,396,749) | | (63,373,538) | |
| Class II | (9,535,320) | | (5,351,050) | |
| Decrease in net assets from distributions | (103,932,069) | | (68,724,588) | |
| | |
| Capital Share Transactions | | |
| Net increase (decrease) in net assets from capital share transactions (Note 5) | 69,557,843 | | 36,571,754 | |
| | |
| Net increase (decrease) in net assets | (90,006,078) | | 59,009,388 | |
| | |
| Net Assets | | |
| Beginning of period | 451,049,140 | | 392,039,752 | |
| End of period | $ | 361,043,062 | | $ | 451,049,140 | |
See Notes to Financial Statements.
| | |
| Notes to Financial Statements |
DECEMBER 31, 2022
1. Organization
American Century Variable Portfolios, Inc. (the corporation) is registered under the Investment Company Act of 1940, as amended (the 1940 Act), as an open-end management investment company and is organized as a Maryland corporation. VP Disciplined Core Value Fund (the fund) is one fund in a series issued by the corporation. The fund’s investment objective is to seek capital growth by investing in common stocks. Income is a secondary objective. The fund offers Class I and Class II.
2. Significant Accounting Policies
The following is a summary of significant accounting policies consistently followed by the fund in preparation of its financial statements. The fund is an investment company and follows accounting and reporting guidance in accordance with accounting principles generally accepted in the United States of America. This may require management to make certain estimates and assumptions at the date of the financial statements. Actual results could differ from these estimates. Management evaluated the impact of events or transactions occurring through the date the financial statements were issued that would merit recognition or disclosure.
Investment Valuations — The fund determines the fair value of its investments and computes its net asset value (NAV) per share at the close of regular trading (usually 4 p.m. Eastern time) on the New York Stock Exchange (NYSE) on each day the NYSE is open. The value of investments of the fund is determined by American Century Investment Management, Inc. (ACIM) (the investment advisor), as the valuation designee, pursuant to its valuation policies and procedures. The Board of Directors oversees the valuation designee and reviews its valuation policies and procedures at least annually.
Equity securities that are listed or traded on a domestic securities exchange are valued at the last reported sales price or at the official closing price as provided by the exchange. Equity securities traded on foreign securities exchanges are generally valued at the closing price of such securities on the exchange where primarily traded or at the close of the NYSE, if that is earlier. If no last sales price is reported, or if local convention or regulation so provides, the mean of the latest bid and asked prices may be used. Securities traded over-the-counter are valued at the mean of the latest bid and asked prices, the last sales price, or the official closing price. Equity securities initially expressed in local currencies are translated into U.S. dollars at the mean of the appropriate currency exchange rate at the close of the NYSE as provided by an independent pricing service.
Open-end management investment companies are valued at the reported NAV per share. Repurchase agreements are valued at cost, which approximates fair value. Exchange-traded futures contracts are valued at the settlement price as provided by the appropriate exchange.
If the valuation designee determines that the market price for a portfolio security is not readily available or is believed by the valuation designee to be unreliable, such security is valued at fair value as determined in good faith by the valuation designee, in accordance with its policies and procedures. Circumstances that may cause the fund to determine that market quotations are not available or reliable include, but are not limited to: when there is a significant event subsequent to the market quotation; trading in a security has been halted during the trading day; or trading in a security is insufficient or did not take place due to a closure or holiday.
The valuation designee monitors for significant events occurring after the close of an investment’s primary exchange but before the fund’s NAV per share is determined. Significant events may include, but are not limited to: corporate announcements and transactions; regulatory news, governmental action and political unrest that could impact a specific investment or an investment sector; or armed conflicts, natural disasters and similar events that could affect investments in a specific country or region. The valuation designee also monitors for significant fluctuations between domestic and foreign markets, as evidenced by the U.S. market or such other indicators that it deems appropriate. The valuation designee may apply a model-derived factor to the closing price of equity securities traded on foreign securities exchanges. The factor is based on observable market data as provided by an independent pricing service.
Security Transactions — Security transactions are accounted for as of the trade date. Net realized gains and losses are determined on the identified cost basis, which is also used for federal income tax purposes.
Investment Income — Dividend income less foreign taxes withheld, if any, is recorded as of the ex-dividend date. Distributions received on securities that represent a return of capital or long-term capital gain are recorded as a reduction of cost of investments and/or as a realized gain. The fund may estimate the components of distributions received that may be considered nontaxable distributions or long-term capital gain distributions for income tax purposes. Interest income is recorded on the accrual basis and includes accretion of discounts and amortization of premiums.
Foreign Currency Translations — All assets and liabilities initially expressed in foreign currencies are translated into U.S. dollars at prevailing exchange rates at period end. The fund may enter into spot foreign currency exchange contracts to facilitate transactions denominated in a foreign currency. Purchases and sales of investment securities, dividend and interest income, spot foreign currency exchange contracts, and expenses are translated at the rates of exchange prevailing on the respective dates of such transactions. Net realized and unrealized foreign currency exchange gains or losses related to investment securities are a component of net realized gain (loss) on investment transactions and change in net unrealized appreciation (depreciation) on investments, respectively.
Repurchase Agreements — The fund may enter into repurchase agreements with institutions that ACIM has determined are creditworthy pursuant to criteria adopted by the Board of Directors. The fund requires that the collateral, represented by securities, received in a repurchase transaction be transferred to the custodian in a manner sufficient to enable the fund to obtain those securities in the event of a default under the repurchase agreement. ACIM monitors, on a daily basis, the securities transferred to ensure the value, including accrued interest, of the securities under each repurchase agreement is equal to or greater than amounts owed to the fund under each repurchase agreement.
Joint Trading Account — Pursuant to an Exemptive Order issued by the Securities and Exchange Commission, the fund, along with certain other funds in the American Century Investments family of funds, may transfer uninvested cash balances into a joint trading account. These balances are invested in one or more repurchase agreements that are collateralized by U.S. Treasury or Agency obligations.
Segregated Assets — In accordance with the 1940 Act, the fund segregates assets on its books and records to cover certain types of investment securities and other financial instruments. ACIM monitors, on a daily basis, the securities segregated to ensure the fund designates a sufficient amount of liquid assets, marked-to market daily. The fund may also receive assets or be required to pledge assets at the custodian bank or with a broker for collateral requirements. The fund may incur charges or earn income on posted collateral balances, which are reflected in interest expenses or interest income, respectively.
Income Tax Status — It is the fund's policy to distribute substantially all net investment income and net realized gains to shareholders and to otherwise qualify as a regulated investment company under provisions of the Internal Revenue Code. Accordingly, no provision has been made for income taxes. The fund files U.S. federal, state, local and non-U.S. tax returns as applicable. The fund's tax returns are subject to examination by the relevant taxing authority until expiration of the applicable statute of limitations, which is generally three years from the date of filing but can be longer in certain jurisdictions. At this time, management believes there are no uncertain tax positions which, based on their technical merit, would not be sustained upon examination and for which it is reasonably possible that the total amounts of unrecognized tax benefits will significantly change in the next twelve months.
Multiple Class — All shares of the fund represent an equal pro rata interest in the net assets of the class to which such shares belong, and have identical voting, dividend, liquidation and other rights and the same terms and conditions, except for class specific expenses and exclusive rights to vote on matters affecting only individual classes. Income, non-class specific expenses, and realized and unrealized capital gains and losses of the fund are allocated to each class of shares based on their relative net assets.
Distributions to Shareholders — Distributions from net investment income, if any, are generally declared and paid quarterly. Distributions from net realized gains, if any, are generally declared and paid annually.
Indemnifications — Under the corporation’s organizational documents, its officers and directors are indemnified against certain liabilities arising out of the performance of their duties to the fund. In addition, in the normal course of business, the fund enters into contracts that provide general indemnifications. The maximum exposure under these arrangements is unknown as this would involve future claims that may be made against a fund. The risk of material loss from such claims is considered by management to be remote.
3. Fees and Transactions with Related Parties
Certain officers and directors of the corporation are also officers and/or directors of American Century Companies, Inc. (ACC). The corporation's investment advisor, ACIM, the corporation's distributor, American Century Investment Services, Inc. (ACIS), and the corporation's transfer agent, American Century Services, LLC, are wholly owned, directly or indirectly, by ACC.
Management Fees — The corporation has entered into a management agreement with ACIM, under which ACIM provides the fund with investment advisory and management services in exchange for a single, unified management fee (the fee) per class. The agreement provides that ACIM will pay all expenses of managing and operating the fund, except brokerage expenses, taxes, interest, fees and expenses of the independent directors (including legal counsel fees), extraordinary expenses, and expenses incurred in connection with the provision of shareholder services and distribution services under a plan adopted pursuant to Rule 12b-1 under the 1940 Act. The fee is computed and accrued daily based on each class's daily net assets and paid monthly in arrears. The rate of the fee is determined by applying a fee rate calculation formula. This formula takes into account the fund's assets as well as certain assets, if any, of other clients of the investment advisor outside the American Century Investments family of funds (such as subadvised funds and separate accounts), as well as exchange-traded funds managed by the investment advisor, that use very similar investment teams and strategies (strategy assets). The management fee schedule ranges from 0.65% to 0.70% for each class. The effective annual management fee for each class for the period ended December 31, 2022 was 0.70%.
Distribution Fees — The Board of Directors has adopted the Master Distribution Plan (the plan) for Class II, pursuant to Rule 12b-1 of the 1940 Act. The plan provides that Class II will pay ACIS an annual distribution fee equal to 0.25%. The fee is computed and accrued daily based on the Class II daily net assets and paid monthly in arrears. The distribution fee provides compensation for expenses incurred in connection with distributing shares of Class II including, but not limited to, payments to brokers, dealers, and financial institutions that have entered into sales agreements with respect to shares of the fund. Fees incurred under the plan during the period ended December 31, 2022 are detailed in the Statement of Operations.
Directors' Fees and Expenses — The Board of Directors is responsible for overseeing the investment advisor’s management and operations of the fund. The directors receive detailed information about the fund and its investment advisor regularly throughout the year, and meet at least quarterly with management of the investment advisor to review reports about fund operations. The fund's officers do not receive compensation from the fund.
Interfund Transactions — The fund may enter into security transactions with other American Century Investments funds and other client accounts of the investment advisor, in accordance with the 1940 Act rules and procedures adopted by the Board of Directors. The rules and procedures require, among other things, that these transactions be effected at the independent current market price of the security. During the period, the interfund purchases and sales were $1,969,796 and $4,233,919, respectively. The effect of interfund transactions on the Statement of Operations was $(349,325) in net realized gain (loss) on investment transactions.
4. Investment Transactions
Purchases and sales of investment securities, excluding short-term investments, for the period ended December 31, 2022 were $843,107,678 and $870,123,690, respectively.
5. Capital Share Transactions
Transactions in shares of the fund were as follows:
| | | | | | | | | | | | | | |
| Year ended
December 31, 2022 | Year ended
December 31, 2021 |
| Shares | Amount | Shares | Amount |
| Class I/Shares Authorized | 300,000,000 | | | 300,000,000 | | |
| Sold | 2,763,256 | | $ | 22,679,432 | | 3,634,562 | | $ | 37,826,575 | |
| Issued in reinvestment of distributions | 11,384,713 | | 94,396,749 | | 6,487,592 | | 63,373,538 | |
| Redeemed | (6,932,099) | | (56,205,407) | | (7,057,131) | | (73,434,628) | |
| 7,215,870 | | 60,870,774 | | 3,065,023 | | 27,765,485 | |
| Class II/Shares Authorized | 50,000,000 | | | 50,000,000 | | |
| Sold | 710,986 | | 6,030,610 | | 1,038,975 | | 10,836,300 | |
| Issued in reinvestment of distributions | 1,148,939 | | 9,535,320 | | 547,975 | | 5,351,050 | |
| Redeemed | (842,757) | | (6,878,861) | | (704,601) | | (7,381,081) | |
| 1,017,168 | | 8,687,069 | | 882,349 | | 8,806,269 | |
| Net increase (decrease) | 8,233,038 | | $ | 69,557,843 | | 3,947,372 | | $ | 36,571,754 | |
6. Fair Value Measurements
The fund's investments valuation process is based on several considerations and may use multiple inputs to determine the fair value of the investments held by the fund. In conformity with accounting principles generally accepted in the United States of America, the inputs used to determine a valuation are classified into three broad levels.
•Level 1 valuation inputs consist of unadjusted quoted prices in an active market for identical investments.
•Level 2 valuation inputs consist of direct or indirect observable market data (including quoted prices for comparable investments, evaluations of subsequent market events, interest rates, prepayment speeds, credit risk, etc.). These inputs also consist of quoted prices for identical investments initially expressed in local currencies that are adjusted through translation into U.S. dollars.
•Level 3 valuation inputs consist of unobservable data (including a fund’s own assumptions).
The level classification is based on the lowest level input that is significant to the fair valuation measurement. The valuation inputs are not necessarily an indication of the risks associated with investing in these securities or other financial instruments.
The following is a summary of the level classifications as of period end. The Schedule of Investments provides additional information on the fund's portfolio holdings.
| | | | | | | | | | | |
| Level 1 | Level 2 | Level 3 |
| Assets | | | |
| Investment Securities | | | |
| Common Stocks | $ | 356,551,482 | | — | | — | |
| Short-Term Investments | 104,796 | | $ | 2,689,486 | | — | |
| $ | 356,656,278 | | $ | 2,689,486 | | — | |
7. Derivative Instruments
Equity Price Risk — The fund is subject to equity price risk in the normal course of pursuing its investment objectives. A fund may enter into futures contracts based on an equity index in order to manage its exposure to changes in market conditions. A fund may purchase futures contracts to gain exposure to increases in market value or sell futures contracts to protect against a decline in market value. Upon entering into a futures contract, a fund is required to deposit either cash or securities in an amount equal to a certain percentage of the contract value (initial margin). Subsequent payments (variation margin) are made or received daily, in cash, by a fund. The variation margin is equal to the daily change in the contract value and is recorded as unrealized gains and losses. A fund recognizes a realized gain or loss when the contract is closed or expires.
Net realized and unrealized gains or losses occurring during the holding period of futures contracts are a component of net realized gain (loss) on futures contract transactions and change in net unrealized appreciation (depreciation) on futures contracts, respectively. One of the risks of entering into futures contracts is the possibility that the change in value of the contract may not correlate with the changes in value of the underlying securities. The fund's average notional exposure to equity price risk derivative instruments held during the period was $4,976,625 futures contracts sold.
At period end, the fund did not have any derivative instruments disclosed on the Statement of Assets and Liabilities. For the year ended December 31, 2022, the effect of equity price risk derivative instruments on the Statement of Operations was $71,484 in net realized gain (loss) on futures contract transactions.
8. Risk Factors
The value of the fund’s shares will go up and down, sometimes rapidly or unpredictably, based on the performance of the securities owned by the fund and other factors generally affecting the securities market. Market risks, including political, regulatory, economic and social developments, can affect the value of the fund’s investments. Natural disasters, public health emergencies, war, terrorism and other unforeseeable events may lead to increased market volatility and may have adverse long-term effects on world economies and markets generally.
The fund's investment process may result in high portfolio turnover, which could mean high transaction costs, affecting both performance and capital gains tax liabilities to investors.
9. Federal Tax Information
The tax character of distributions paid during the years ended December 31, 2022 and December 31, 2021 were as follows:
| | | | | | | | |
| 2022 | 2021 |
| Distributions Paid From | | |
| Ordinary income | $ | 61,685,160 | | $ | 4,602,670 | |
| Long-term capital gains | $ | 42,246,909 | | $ | 64,121,918 | |
The book-basis character of distributions made during the year from net investment income or net realized gains may differ from their ultimate characterization for federal income tax purposes. These differences reflect the differing character of certain income items and net realized gains and losses for financial statement and tax purposes, and may result in reclassification among certain capital accounts on the financial statements.
As of period end, the federal tax cost of investments and the components of distributable earnings on a tax-basis were as follows:
| | | | | |
| Federal tax cost of investments | $ | 336,708,881 | |
| Gross tax appreciation of investments | $ | 32,321,176 | |
| Gross tax depreciation of investments | (9,684,293) | |
| Net tax appreciation (depreciation) of investments | 22,636,883 | |
| Net tax appreciation (depreciation) on derivatives and translation of assets and liabilities in foreign currencies | 809 | |
| Net tax appreciation (depreciation) | $ | 22,637,692 | |
| Undistributed ordinary income | — | |
| Accumulated short-term capital losses | $ | (34,681,018) | |
The difference between book-basis and tax-basis unrealized appreciation (depreciation) is attributable primarily to the tax deferral of losses on wash sales.
Accumulated capital losses represent net capital loss carryovers that may be used to offset future realized capital gains for federal income tax purposes. The capital loss carryovers may be carried forward for an unlimited period. Future capital loss carryover utilization in any given year may be subject to Internal Revenue Code limitations.
| | | | | | | | | | | | | | | | | | | | | | | | | | | | | | | | | | | | | | | | | |
| For a Share Outstanding Throughout the Years Ended December 31 (except as noted) |
| Per-Share Data | Ratios and Supplemental Data |
| | Income From Investment Operations: | Distributions From: | | | Ratio to Average Net Assets of: | | |
| Net Asset
Value,
Beginning
of Period | Net Investment Income (Loss)(1) | Net
Realized and Unrealized
Gain (Loss) | Total From
Investment
Operations | Net
Investment
Income | Net
Realized
Gains | Total
Distributions | Net
Asset Value,
End of Period | Total Return(2) | Operating
Expenses | Net
Investment
Income
(Loss) | Portfolio
Turnover
Rate | Net Assets,
End of
Period
(in thousands) |
| Class I | | | | | | | | | | | | | |
| 2022 | $10.72 | 0.14 | (1.20) | (1.06) | (0.14) | (2.35) | (2.49) | $7.17 | (12.74)% | 0.71% | 1.77% | 217% | $326,453 | |
| 2021 | $10.28 | 0.11 | 2.13 | 2.24 | (0.11) | (1.69) | (1.80) | $10.72 | 23.65% | 0.70% | 1.09% | 248% | $410,287 | |
| 2020 | $10.02 | 0.19 | 0.73 | 0.92 | (0.18) | (0.48) | (0.66) | $10.28 | 11.81% | 0.70% | 2.03% | 163% | $362,015 | |
| 2019 | $9.02 | 0.20 | 1.85 | 2.05 | (0.20) | (0.85) | (1.05) | $10.02 | 23.95% | 0.70% | 2.07% | 83% | $351,774 | |
| 2018 | $10.71 | 0.22 | (0.90) | (0.68) | (0.20) | (0.81) | (1.01) | $9.02 | (6.87)% | 0.70% | 2.11% | 70% | $315,041 | |
| Class II | | | | | | | | | | | | | |
| 2022 | $10.72 | 0.12 | (1.19) | (1.07) | (0.12) | (2.35) | (2.47) | $7.18 | (12.83)% | 0.96% | 1.52% | 217% | $34,590 | |
| 2021 | $10.28 | 0.09 | 2.13 | 2.22 | (0.09) | (1.69) | (1.78) | $10.72 | 23.34% | 0.95% | 0.84% | 248% | $40,762 | |
| 2020 | $10.03 | 0.16 | 0.73 | 0.89 | (0.16) | (0.48) | (0.64) | $10.28 | 11.45% | 0.95% | 1.78% | 163% | $30,024 | |
| 2019 | $9.02 | 0.17 | 1.87 | 2.04 | (0.18) | (0.85) | (1.03) | $10.03 | 23.75% | 0.95% | 1.82% | 83% | $31,632 | |
| 2018 | $10.72 | 0.19 | (0.91) | (0.72) | (0.17) | (0.81) | (0.98) | $9.02 | (7.19)% | 0.95% | 1.86% | 70% | $26,938 | |
| | |
| Notes to Financial Highlights |
(1)Computed using average shares outstanding throughout the period.
(2)Total returns are calculated based on the net asset value of the last business day. Total returns for periods less than one year are not annualized. The total returns presented do not include the fees and charges assessed with investments in variable insurance products, those charges are disclosed in the separate account prospectus. The inclusion of such fees and charges would lower total return.
See Notes to Financial Statements.
| | |
| Report of Independent Registered Public Accounting Firm |
To the Shareholders and the Board of Directors of American Century Variable Portfolios, Inc.:
Opinion on the Financial Statements and Financial Highlights
We have audited the accompanying statement of assets and liabilities, including the schedule of investments, of VP Disciplined Core Value Fund (the “Fund”), one of the funds constituting the American Century Variable Portfolios, Inc., as of December 31, 2022, the related statement of operations for the year then ended, the statements of changes in net assets for each of the two years in the period then ended, the financial highlights for each of the five years in the period then ended, and the related notes. In our opinion, the financial statements and financial highlights present fairly, in all material respects, the financial position of VP Disciplined Core Value Fund of the American Century Variable Portfolios, Inc. as of December 31, 2022, and the results of its operations for the year then ended, the changes in its net assets for each of the two years in the period then ended, and the financial highlights for each of the five years in the period then ended, in conformity with accounting principles generally accepted in the United States of America.
Basis for Opinion
These financial statements and financial highlights are the responsibility of the Fund's management. Our responsibility is to express an opinion on the Fund’s financial statements and financial highlights based on our audits. We are a public accounting firm registered with the Public Company Accounting Oversight Board (United States) (PCAOB) and are required to be independent with respect to the Fund in accordance with the U.S. federal securities laws and the applicable rules and regulations of the Securities and Exchange Commission and the PCAOB.
We conducted our audits in accordance with the standards of the PCAOB. Those standards require that we plan and perform the audit to obtain reasonable assurance about whether the financial statements and financial highlights are free of material misstatement, whether due to error or fraud. The Fund is not required to have, nor were we engaged to perform, an audit of its internal control over financial reporting. As part of our audits, we are required to obtain an understanding of internal control over financial reporting but not for the purpose of expressing an opinion on the effectiveness of the Fund’s internal control over financial reporting. Accordingly, we express no such opinion.
Our audits included performing procedures to assess the risks of material misstatement of the financial statements and financial highlights, whether due to error or fraud, and performing procedures that respond to those risks. Such procedures included examining, on a test basis, evidence regarding the amounts and disclosures in the financial statements and financial highlights. Our audits also included evaluating the accounting principles used and significant estimates made by management, as well as evaluating the overall presentation of the financial statements and financial highlights. Our procedures included confirmation of securities owned as of December 31, 2022, by correspondence with the custodian and brokers; when replies were not received from brokers, we performed other auditing procedures. We believe that our audits provide a reasonable basis for our opinion.
/s/ Deloitte & Touche LLP
Kansas City, Missouri
February 10, 2023
We have served as the auditor of one or more American Century investment companies since 1997.
The Board of Directors
The individuals listed below serve as directors of the funds. Each director will continue to serve in this capacity until death, retirement, resignation or removal from office. The board has adopted a mandatory retirement age for directors who are not “interested persons,” as that term is defined in the Investment Company Act (independent directors). Independent directors shall retire on December 31 of the year in which they reach their 75th birthday.
Jonathan S. Thomas is an “interested person” because he currently serves as President and Chief Executive Officer of American Century Companies, Inc. (ACC), the parent company of American Century Investment Management, Inc. (ACIM or the advisor). The other directors (more than three-fourths of the total number) are independent. They are not employees, directors or officers of, and have no financial interest in, ACC or any of its wholly owned, direct or indirect, subsidiaries, including ACIM, American Century Investment Services, Inc. (ACIS) and American Century Services, LLC (ACS), and they do not have any other affiliations, positions or relationships that would cause them to be considered “interested persons” under the Investment Company Act. The directors serve in this capacity for seven (in the case of Jonathan S. Thomas, 16; and Stephen E. Yates, 8) registered investment companies in the American Century Investments family of funds.
The following table presents additional information about the directors. The mailing address for each director is 4500 Main Street, Kansas City, Missouri 64111.
| | | | | | | | | | | | | | | | | |
Name
(Year of Birth) | Position(s) Held with Funds | Length of Time Served | Principal Occupation(s) During Past 5 Years | Number of American Century Portfolios Overseen by Director | Other Directorships Held During Past 5 Years |
| Independent Directors | | |
Brian Bulatao
(1964) | Director | Since 2022 | Chief Administrative Officer, Activision Blizzard, Inc. (2021 to present); Under Secretary of State for Management, U.S. Department of State (2018 to 2021); Chief Operating Officer, Central Intelligence Agency (2017 to 2018) | 64 | None |
| Thomas W. Bunn (1953) | Director | Since 2017 | Retired | 64 | None |
Chris H. Cheesman
(1962)
| Director | Since 2019
| Retired. Senior Vice President & Chief Audit Executive, AllianceBernstein (1999 to 2018)
| 64 | Alleghany Corporation (2021 to 2022) |
Barry Fink
(1955) | Director | Since 2012 (independent since 2016) | Retired | 64 | None |
Rajesh K. Gupta
(1960)
| Director | Since 2019
| Partner Emeritus, SeaCrest Investment Management and SeaCrest Wealth Management (2019 to Present); Chief Executive Officer and Chief Investment Officer, SeaCrest Investment Management (2006 to 2019); Chief Executive Officer and Chief Investment Officer, SeaCrest Wealth Management (2008 to 2019) | 64 | None |
| | | | | | | | | | | | | | | | | |
Name
(Year of Birth) | Position(s) Held with Funds | Length of Time Served | Principal Occupation(s) During Past 5 Years | Number of American Century Portfolios Overseen by Director | Other Directorships Held During Past 5 Years |
| Independent Directors | | |
Lynn Jenkins
(1963)
| Director | Since 2019
| Consultant, LJ Strategies (2019 to present); United States Representative, U.S. House of Representatives (2009 to 2018) | 64 | MGP Ingredients, Inc. (2019 to 2021) |
Jan M. Lewis
(1957) | Director and Board Chair | Since 2011 (Board Chair since 2022) | Retired | 64 | None |
Gary C. Meltzer
(1963) | Director | Since 2022 | Advisor, Pontoro (2021 to present); Executive Advisor, Consultant and Investor, Harris Ariel Advisory LLC (2020 to present); Managing Partner, PricewaterhouseCoopers LLP (1985 to 2020) | 64 | ExcelFin Acquisition Corp., Apollo Realty Income Solutions, Inc. |
Stephen E. Yates
(1948) | Director | Since 2012 | Retired | 108 | None |
| Interested Director | |
Jonathan S. Thomas
(1963) | Director | Since 2007 | President and Chief Executive Officer, ACC (2007 to present). Also serves as Chief Executive Officer, ACS; Director, ACC and other ACC subsidiaries | 140 | None |
The Statement of Additional Information has additional information about the fund's directors and is available without charge, upon request, by calling 1-800-378-9878.
Officers
The following table presents certain information about the executive officers of the funds. Each officer serves as an officer for 16 (in the case of Robert J. Leach, 15) investment companies in the American Century family of funds. No officer is compensated for his or her service as an officer of the funds. The listed officers are interested persons of the funds and are appointed or re-appointed on an annual basis. The mailing address for each officer listed below is 4500 Main Street, Kansas City, Missouri 64111.
| | | | | | | | |
Name
(Year of Birth) | Offices with the Funds | Principal Occupation(s) During the Past Five Years |
Patrick Bannigan
(1965) | President since 2019 | Executive Vice President and Director, ACC (2012 to present); Chief Financial Officer, Chief Accounting Officer and Treasurer, ACC (2015 to present). Also serves as President, ACS; Vice President, ACIM; Chief Financial Officer, Chief Accounting Officer and/or Director, ACIM, ACS and other ACC subsidiaries |
R. Wes Campbell
(1974) | Chief Financial Officer and Treasurer since 2018 | Vice President, ACS, (2020 to present); Investment Operations and Investment Accounting, ACS (2000 to present) |
Amy D. Shelton
(1964) | Chief Compliance Officer and Vice President since 2014 | Chief Compliance Officer, American Century funds, (2014 to present); Chief Compliance Officer, ACIM (2014 to present); Chief Compliance Officer, ACIS (2009 to present). Also serves as Vice President, ACIS |
John Pak
(1968) | General Counsel and
Senior Vice President since 2021 | General Counsel and Senior Vice President, ACC (2021 to present); Also serves as General Counsel and Senior Vice President, ACIM, ACS and ACIS. Chief Legal Officer of Investment and Wealth Management, The Bank of New York Mellon (2014 to 2021) |
C. Jean Wade
(1964) | Vice President since 2012 | Senior Vice President, ACS (2017 to present); Vice President, ACS (2000 to 2017)
|
Robert J. Leach
(1966) | Vice President since 2006 | Vice President, ACS (2000 to present) |
David H. Reinmiller
(1963) | Vice President since 2000 | Attorney, ACC (1994 to present). Also serves as Vice President, ACIM and ACS |
Ward D. Stauffer
(1960) | Secretary since 2005 | Attorney, ACC (2003 to present) |
A special meeting of shareholders was held on October 13, 2022, to vote on the following proposal. The proposal received the required votes and was adopted. A summary of voting results is listed below.
To elect five directors to the Board of Directors of American Century Variable Portfolios, Inc.:
| | | | | | | | | | | |
| Affirmative | | Withhold |
| Brian Bulatao | $ | 2,607,537,119 | | | $ | 88,836,350 | |
| Chris H. Cheesman | $ | 2,619,879,519 | | | $ | 76,493,950 | |
| Rajesh K. Gupta | $ | 2,616,882,375 | | | $ | 79,491,094 | |
| Lynn M. Jenkins | $ | 2,607,769,137 | | | $ | 88,604,332 | |
| Gary C. Meltzer | $ | 2,616,158,906 | | | $ | 80,214,563 | |
The other directors whose term of office continued after the meeting include Jonathan S. Thomas, Thomas W. Bunn, Barry Fink, Jan M. Lewis, and Stephen E. Yates.
Proxy Voting Policies
A description of the policies that the fund's investment advisor uses in exercising the voting rights associated with the securities purchased and/or held by the fund is available without charge, upon request, by calling 1-800-378-9878. It is also available on American Century Investments’ website at americancentury.com/proxy and on the Securities and Exchange Commission’s website at sec.gov. Information regarding how the investment advisor voted proxies relating to portfolio securities during the most recent 12-month period ended June 30 is available on americancentury.com/proxy. It is also available at sec.gov.
Quarterly Portfolio Disclosure
The fund files its complete schedule of portfolio holdings with the Securities and Exchange Commission (SEC) for the first and third quarters of each fiscal year as an exhibit to its reports on Form N-PORT. These portfolio holdings are available on the fund's website at americancentury.com and, upon request, by calling 1-800-378-9878. The fund’s Form N-PORT reports are available on the SEC’s website at sec.gov.
Other Tax Information
The following information is provided pursuant to provisions of the Internal Revenue Code.
For corporate taxpayers, the fund hereby designates $9,019,662, or up to the maximum amount
allowable, of ordinary income distributions paid during the fiscal year ended December 31, 2022 as
qualified for the corporate dividends received deduction.
The fund hereby designates $42,246,909, or up to the maximum amount allowable, as long-term
capital gain distributions (20% rate gain distributions) for the fiscal year ended December 31, 2022.
The fund hereby designates $54,902,807 as qualified short-term capital gain distributions for
purposes of Internal Revenue Code Section 871 for the fiscal year ended December 31, 2022.
| | | | | | | | |
| |
| | |
| Contact Us | americancentury.com | |
| Automated Information Line | 1-800-345-8765 | |
| Investment Professional Service Representatives | 1-800-345-6488 | |
| Telecommunications Relay Service for the Deaf | 711 | |
| | |
| American Century Variable Portfolios, Inc. | |
| | |
Investment Advisor: American Century Investment Management, Inc. Kansas City, Missouri | |
| | |
| This report and the statements it contains are submitted for the general information of our shareholders. The report is not authorized for distribution to prospective investors unless preceded or accompanied by an effective prospectus. | |
| | |
©2023 American Century Proprietary Holdings, Inc. All rights reserved.
CL-ANN-91438 2302 | |
| | | | | |
| |
| Annual Report |
| |
| December 31, 2022 |
| |
| VP Growth Fund |
| Class I (AWRIX) |
| Class II (AWREX) |
| | | | | |
| Performance | |
| Portfolio Commentary | |
| Fund Characteristics | |
| Shareholder Fee Example | |
| Schedule of Investments | |
| Statement of Assets and Liabilities | |
| Statement of Operations | |
| Statement of Changes in Net Assets | |
| Notes to Financial Statements | |
| Financial Highlights | |
| Report of Independent Registered Public Accounting Firm | |
| Management | |
| Proxy Voting Results | |
| Additional Information | |
Any opinions expressed in this report reflect those of the author as of the date of the report, and do not necessarily represent the opinions of American Century Investments® or any other person in the American Century Investments organization. Any such opinions are subject to change at any time based upon market or other conditions and American Century Investments disclaims any responsibility to update such opinions. These opinions may not be relied upon as investment advice and, because investment decisions made by American Century Investments funds are based on numerous factors, may not be relied upon as an indication of trading intent on behalf of any American Century Investments fund. Security examples are used for representational purposes only and are not intended as recommendations to purchase or sell securities. Performance information for comparative indices and securities is provided to American Century Investments by third party vendors. To the best of American Century Investments’ knowledge, such information is accurate at the time of printing.
| | | | | | | | | | | | | | | | | |
| Total Returns as of December 31, 2022 |
| | | | Average Annual
Returns | |
| | Ticker Symbol | 1 year | 5 years | 10 years | Inception Date |
| Class I | AWRIX | -31.28% | 9.55% | 12.43% | 5/2/11 |
| Russell 1000 Growth Index | — | -29.14% | 10.95% | 14.09% | — |
| Class II | AWREX | -31.34% | 9.38% | 12.27% | 5/2/11 |
Fund returns would have been lower if a portion of the fees had not been waived.
The performance information presented does not include the fees and charges assessed with investments in variable insurance products, those charges are disclosed in the separate account prospectus. The inclusion of such fees and charges would lower performance.
Data presented reflect past performance. Past performance is no guarantee of future results. Current performance may be higher or lower than the performance shown. Total returns for periods less than one year are not annualized. Investment return and principal value will fluctuate, and redemption value may be more or less than original cost. Data assumes reinvestment of dividends and capital gains, and none of the charts reflect the deduction of taxes that a shareholder would pay on fund distributions or the redemption of fund shares. To obtain performance data current to the most recent month end, please call 1-800-345-6488 or visit americancentury.com. For additional information about the fund, please consult the prospectus.
| | |
| Growth of $10,000 Over 10 Years |
| $10,000 investment made December 31, 2012 |
| Performance for other share classes will vary due to differences in fee structure. |
| | | | | |
| Value on December 31, 2022 |
| Class I — $32,283 |
|
| Russell 1000 Growth Index — $37,397 |
|
| |
|
| |
|
Ending value of Class I would have been lower if a portion of the fees had not been waived.
| | | | | |
| Total Annual Fund Operating Expenses |
| Class I | Class II |
| 0.91% | 1.06% |
The total annual fund operating expenses shown is as stated in the fund’s prospectus current as of the date of this report. The prospectus may vary from the expense ratio shown elsewhere in this report because it is based on a different time period, includes acquired fund fees and expenses, and, if applicable, does not include fee waivers or expense reimbursements.
Data presented reflect past performance. Past performance is no guarantee of future results. Current performance may be higher or lower than the performance shown. Total returns for periods less than one year are not annualized. Investment return and principal value will fluctuate, and redemption value may be more or less than original cost. Data assumes reinvestment of dividends and capital gains, and none of the charts reflect the deduction of taxes that a shareholder would pay on fund distributions or the redemption of fund shares. To obtain performance data current to the most recent month end, please call 1-800-345-6488 or visit americancentury.com. For additional information about the fund, please consult the prospectus.
Portfolio Managers: Joe Reiland, Justin Brown and Scott Marolf
Performance Summary
VP Growth returned -31.34%* for the 12 months ended December 31, 2022, versus the -29.14% return of the fund’s benchmark, the Russell 1000 Growth Index.
U.S. stocks fell sharply over the past 12 months, with the heaviest losses during the first three quarters of 2022. The downturn began amid a combination of factors—the new omicron variant of the coronavirus, rising inflation, the Federal Reserve signaling interest rate increases—that led to investors moving to more defensive positioning. The market action was marked by a rotation out of the highest-growth stocks and pandemic winners into either lower growth or more traditional cyclical value stocks. Market declines intensified after Russia invaded Ukraine, exacerbating already stretched supply chains and leading to soaring oil prices that helped drive inflation to four-decade highs. Within the Russell 1000 Growth Index, energy was by far the top-performing sector, benefiting from rising prices and increased demand amid limited supplies. Utilities posted a modest gain, while all other sectors recorded losses.
Stock selection in the industrials and information technology sectors helped drive underperformance relative to the benchmark. Stock decisions in the communication services and materials sectors led positive contributors.
Industrials Hampered Performance
Holdings in the industrials sector detracted. Generac Holdings fell sharply after management reduced its guidance for revenue and earnings. The maker of generators and other power products cited the bankruptcy of a major client and warranty issues as reasons for the disappointing guidance. Significant detractors in the information technology sector included PayPal Holdings. The digital payments company delivered quarterly results and forward guidance below expectations, with deceleration in key metrics. We eliminated our position due to lower engagement trends following the pandemic, as well as management’s poor execution on margins and several growth initiatives. Underweighting Mastercard relative to the benchmark hampered performance. The digital payments processor benefited from improving cross-border transactions and resilient consumer spending. Advanced Micro Devices detracted as the semiconductor chipmaker fell along with its industry as investors worried that the weakening global economy would continue to limit demand for semiconductors.
Other detractors included an underweight allocation to Eli Lilly & Co. Although we initiated a position in the company during the period, we were underweight overall, which hampered relative performance. Eli Lilly’s strength came from strong data for the pharmaceutical company’s drug Tirzepatide for obesity. Our holding of Aptiv, a Dublin-based automobile technology solutions provider, underperformed following Russia’s invasion of Ukraine on concerns about production disruptions, higher commodity costs, continued supply chain constraints and negative impacts to European automobile demand.
Communication Services Stocks Were Top Contributors
Not owning Netflix benefited relative performance in the communication services sector. The streaming video service announced another round of layoffs amid weak subscriber growth. An expected renormalization of subscriber growth following the early gains of the pandemic has not
*All fund returns referenced in this commentary are for Class II shares. Fund returns would have been lower if a portion of the fees had not been waived. Performance for other share classes will vary due to differences in fee structure; when Class II performance exceeds that of the fund’s benchmark, other share classes may not. See page 2 for returns for all share classes.
materialized. During the period, we eliminated the stock of Facebook’s parent Meta Platforms, which has been hurt more by both Apple iOS platform changes and TikTok competition than other digital advertising platforms. The fund’s resulting underweight allocation helped performance as the stock fell sharply.
In the health care sector, UnitedHealth Group recorded solid quarterly results and modestly increased its earnings guidance. However, the health insurer’s stock’s outperformance was driven more by its defensive profile and being more insulated from the impact of inflation and stronger U.S. dollar. Novo Nordisk was a top contributor. The Denmark-based pharmaceutical company is focused on diabetes treatments. The company reported strong revenues and earnings based on its current products, and it has a new once-a-week insulin drug in the pipeline that would simplify diabetic treatment.
Elsewhere, Visa was a top contributor. The digital payments company delivered solid results as cross-border travel improved significantly. In addition, the stock is viewed as defensive, particularly in an inflationary environment. The stock of Air Products & Chemicals responded positively to better-than-expected earnings and 2023 guidance, while the company’s defensive core industrial gas business and clean energy growth drivers were viewed as increasingly attractive given global macro concerns.
Outlook
We believe stock selection—rather than sector allocation or market timing via the use of cash—is the most efficient means of generating superior risk-adjusted returns. As a result of this approach, the portfolio’s sector and industry selection, as well as capitalization range allocations, are primarily due to identifying what we believe to be superior individual securities.
War, inflation and recession risk all suggest difficult, volatile conditions ahead. Markets will continue to deal with the contrasting risks of rising inflation and interest rates, even as the global economy teeters on the verge of recession. The ongoing war in Ukraine also highlights political and economic risks at present. COVID-19, war and tariffs all are disrupting global supply chains, putting further upward pressure on prices. Nevertheless, we continue to believe that well-run businesses in strong positions with respect to their competition are best able to navigate current conditions.
At period-end, our largest sector allocations relative to the benchmark were in health care and information technology. The largest underweights were industrials and financials.
| | | | | |
| DECEMBER 31, 2022 |
| Types of Investments in Portfolio | % of net assets |
| Common Stocks | 95.9% |
| Exchange-Traded Funds | 3.8% |
| Short-Term Investments | 1.0% |
| Other Assets and Liabilities | (0.7)% |
| |
| Top Five Industries* | % of net assets |
| Software | 16.1% |
| Technology Hardware, Storage and Peripherals | 8.8% |
| IT Services | 7.6% |
| Semiconductors and Semiconductor Equipment | 7.6% |
| Interactive Media and Services | 5.9% |
*Exposure indicated excludes Exchange-Traded Funds. The Schedule of Investments provides additional information on the fund's portfolio holdings.
Fund shareholders may incur two types of costs: (1) transaction costs, including sales charges (loads) on purchase payments and redemption/exchange fees; and (2) ongoing costs, including management fees; distribution and service (12b-1) fees; and other fund expenses. This example is intended to help you understand your ongoing costs (in dollars) of investing in your fund and to compare these costs with the ongoing cost of investing in other mutual funds.
The example is based on an investment of $1,000 made at the beginning of the period and held for the entire period from July 1, 2022 to December 31, 2022.
Actual Expenses
The table provides information about actual account values and actual expenses for each class. You may use the information, together with the amount you invested, to estimate the expenses that you paid over the period. First, identify the share class you own. Then simply divide your account value by $1,000 (for example, an $8,600 account value divided by $1,000 = 8.6), then multiply the result by the number under the heading “Expenses Paid During Period” to estimate the expenses you paid on your account during this period.
Hypothetical Example for Comparison Purposes
The table also provides information about hypothetical account values and hypothetical expenses based on the actual expense ratio of each class of your fund and an assumed rate of return of 5% per year before expenses, which is not the actual return of a fund’s share class. The hypothetical account values and expenses may not be used to estimate the actual ending account balance or expenses you paid for the period. You may use this information to compare the ongoing costs of investing in your fund and other funds. To do so, compare this 5% hypothetical example with the 5% hypothetical examples that appear in the shareholder reports of the other funds.
Please note that the expenses shown in the table are meant to highlight your ongoing costs only and do not reflect any transactional costs, such as sales charges (loads) or redemption/exchange fees. Therefore, the table is useful in comparing ongoing costs only, and will not help you determine the relative total costs of owning different funds. In addition, if these transactional costs were included, your costs would have been higher.
| | | | | | | | | | | | | | |
| Beginning Account Value 7/1/22 | Ending Account Value 12/31/22 | Expenses Paid During Period(1) 7/1/22 - 12/31/22 | Annualized Expense Ratio(1) |
| Actual | | | | |
| Class I | $1,000 | $978.80 | $3.94 | 0.79% |
| Class II | $1,000 | $978.60 | $4.69 | 0.94% |
| Hypothetical | | | | |
| Class I | $1,000 | $1,021.22 | $4.02 | 0.79% |
| Class II | $1,000 | $1,020.47 | $4.79 | 0.94% |
(1)Expenses are equal to the class's annualized expense ratio listed in the table above, multiplied by the average account value over the period, multiplied by 184, the number of days in the most recent fiscal half-year, divided by 365, to reflect the one-half year period. Annualized expense ratio reflects actual expenses, including any applicable fee waivers or expense reimbursements and excluding any acquired fund fees and expenses.
DECEMBER 31, 2022
| | | | | | | | |
| Shares | Value |
| COMMON STOCKS — 95.9% | | |
| Aerospace and Defense — 1.9% | | |
| Lockheed Martin Corp. | 190 | | $ | 92,433 | |
| Air Freight and Logistics — 1.2% | | |
| United Parcel Service, Inc., Class B | 325 | | 56,498 | |
| Auto Components — 0.6% | | |
Aptiv PLC(1) | 323 | | 30,081 | |
| Automobiles — 1.5% | | |
Tesla, Inc.(1) | 615 | | 75,756 | |
| Beverages — 1.8% | | |
| PepsiCo, Inc. | 486 | | 87,801 | |
| Biotechnology — 4.0% | | |
| AbbVie, Inc. | 876 | | 141,570 | |
Vertex Pharmaceuticals, Inc.(1) | 184 | | 53,136 | |
| | 194,706 | |
| Building Products — 0.5% | | |
| Masco Corp. | 223 | | 10,408 | |
Trex Co., Inc.(1) | 313 | | 13,249 | |
| | 23,657 | |
| Capital Markets — 0.9% | | |
| S&P Global, Inc. | 124 | | 41,533 | |
| Chemicals — 1.4% | | |
| Air Products & Chemicals, Inc. | 218 | | 67,201 | |
| Electrical Equipment — 0.7% | | |
| Eaton Corp. PLC | 78 | | 12,242 | |
Generac Holdings, Inc.(1) | 228 | | 22,951 | |
| | 35,193 | |
| Electronic Equipment, Instruments and Components — 2.3% | | |
| CDW Corp. | 252 | | 45,002 | |
| Cognex Corp. | 358 | | 16,865 | |
Keysight Technologies, Inc.(1) | 297 | | 50,808 | |
| | 112,675 | |
| Energy Equipment and Services — 1.0% | | |
| Schlumberger Ltd. | 922 | | 49,290 | |
| Entertainment — 1.3% | | |
Liberty Media Corp.-Liberty Formula One, Class C(1) | 345 | | 20,624 | |
Take-Two Interactive Software, Inc.(1) | 165 | | 17,181 | |
Walt Disney Co.(1) | 302 | | 26,238 | |
| | 64,043 | |
| Equity Real Estate Investment Trusts (REITs) — 0.9% | | |
| Prologis, Inc. | 134 | | 15,106 | |
| SBA Communications Corp. | 105 | | 29,432 | |
| | 44,538 | |
| Food and Staples Retailing — 0.7% | | |
| Sysco Corp. | 421 | | 32,185 | |
| Food Products — 1.1% | | |
| Mondelez International, Inc., Class A | 713 | | 47,521 | |
Vital Farms, Inc.(1) | 390 | | 5,819 | |
| | 53,340 | |
| | | | | | | | |
| Shares | Value |
| Health Care Equipment and Supplies — 2.4% | | |
DexCom, Inc.(1) | 257 | | $ | 29,103 | |
Edwards Lifesciences Corp.(1) | 362 | | 27,009 | |
IDEXX Laboratories, Inc.(1) | 59 | | 24,070 | |
Intuitive Surgical, Inc.(1) | 136 | | 36,087 | |
| | 116,269 | |
| Health Care Providers and Services — 4.4% | | |
| Cigna Corp. | 162 | | 53,677 | |
| UnitedHealth Group, Inc. | 304 | | 161,175 | |
| | 214,852 | |
| Hotels, Restaurants and Leisure — 1.8% | | |
Airbnb, Inc., Class A(1) | 399 | | 34,114 | |
Chipotle Mexican Grill, Inc.(1) | 26 | | 36,075 | |
Dutch Bros, Inc., Class A(1)(2) | 182 | | 5,131 | |
Expedia Group, Inc.(1) | 164 | | 14,366 | |
| | 89,686 | |
| Household Products — 1.5% | | |
| Procter & Gamble Co. | 497 | | 75,325 | |
| Insurance — 0.7% | | |
| Progressive Corp. | 274 | | 35,540 | |
| Interactive Media and Services — 5.9% | | |
Alphabet, Inc., Class A(1) | 3,280 | | 289,394 | |
| Internet and Direct Marketing Retail — 4.6% | | |
Amazon.com, Inc.(1) | 2,670 | | 224,280 | |
| IT Services — 7.6% | | |
| Accenture PLC, Class A | 248 | | 66,176 | |
| Mastercard, Inc., Class A | 101 | | 35,121 | |
Okta, Inc.(1) | 273 | | 18,654 | |
Twilio, Inc., Class A(1) | 247 | | 12,093 | |
| Visa, Inc., Class A | 1,164 | | 241,833 | |
| | 373,877 | |
| Life Sciences Tools and Services — 1.0% | | |
| Agilent Technologies, Inc. | 269 | | 40,256 | |
Repligen Corp.(1) | 52 | | 8,804 | |
| | 49,060 | |
| Oil, Gas and Consumable Fuels — 0.7% | | |
| ConocoPhillips | 300 | | 35,400 | |
| Personal Products — 0.7% | | |
| Estee Lauder Cos., Inc., Class A | 142 | | 35,232 | |
| Pharmaceuticals — 3.7% | | |
| Eli Lilly & Co. | 212 | | 77,558 | |
| Novo Nordisk A/S, B Shares | 406 | | 55,141 | |
| Zoetis, Inc. | 313 | | 45,870 | |
| | 178,569 | |
| Road and Rail — 2.0% | | |
Uber Technologies, Inc.(1) | 1,351 | | 33,410 | |
| Union Pacific Corp. | 312 | | 64,606 | |
| | 98,016 | |
| Semiconductors and Semiconductor Equipment — 7.6% | | |
Advanced Micro Devices, Inc.(1) | 1,252 | | 81,092 | |
| Analog Devices, Inc. | 299 | | 49,045 | |
| Applied Materials, Inc. | 542 | | 52,780 | |
| | | | | | | | |
| Shares | Value |
| ASML Holding NV | 117 | | $ | 63,795 | |
GLOBALFOUNDRIES, Inc.(1)(2) | 208 | | 11,209 | |
| NVIDIA Corp. | 781 | | 114,135 | |
| | 372,056 | |
| Software — 16.1% | | |
Cadence Design Systems, Inc.(1) | 225 | | 36,144 | |
Crowdstrike Holdings, Inc., Class A(1) | 246 | | 25,901 | |
Datadog, Inc., Class A(1) | 225 | | 16,538 | |
| Microsoft Corp. | 2,481 | | 594,993 | |
PagerDuty, Inc.(1) | 732 | | 19,442 | |
Paycor HCM, Inc.(1) | 196 | | 4,796 | |
Salesforce, Inc.(1) | 216 | | 28,639 | |
Splunk, Inc.(1) | 261 | | 22,470 | |
Workday, Inc., Class A(1) | 223 | | 37,315 | |
| | 786,238 | |
| Specialty Retail — 2.8% | | |
| Home Depot, Inc. | 207 | | 65,383 | |
| Ross Stores, Inc. | 173 | | 20,080 | |
| TJX Cos., Inc. | 657 | | 52,297 | |
| | 137,760 | |
| Technology Hardware, Storage and Peripherals — 8.8% | | |
| Apple, Inc. | 3,329 | | 432,537 | |
| Textiles, Apparel and Luxury Goods — 1.8% | | |
Deckers Outdoor Corp.(1) | 62 | | 24,748 | |
| NIKE, Inc., Class B | 520 | | 60,845 | |
| | 85,593 | |
TOTAL COMMON STOCKS (Cost $2,934,651) | | 4,690,614 | |
| EXCHANGE-TRADED FUNDS — 3.8% | | |
| iShares Russell 1000 Growth ETF | 513 | | 109,905 | |
| Technology Select Sector SPDR Fund | 609 | | 75,784 | |
TOTAL EXCHANGE-TRADED FUNDS (Cost $189,184) | | 185,689 | |
| SHORT-TERM INVESTMENTS — 1.0% | | |
| Money Market Funds — 0.9% | | |
| State Street Institutional U.S. Government Money Market Fund, Premier Class | 28,778 | | 28,778 | |
State Street Navigator Securities Lending Government Money Market Portfolio(3) | 16,718 | | 16,718 | |
| | 45,496 | |
| Repurchase Agreements — 0.1% | | |
BMO Capital Markets Corp., (collateralized by various U.S. Treasury obligations, 0.375% - 0.50%, 9/15/24 - 5/31/27, valued at $4,766), in a joint trading account at 4.20%, dated 12/30/22, due
1/3/23 (Delivery value $4,680) | | 4,678 | |
TOTAL SHORT-TERM INVESTMENTS (Cost $50,174) | | 50,174 | |
TOTAL INVESTMENT SECURITIES—100.7% (Cost $3,174,009) | | 4,926,477 | |
| OTHER ASSETS AND LIABILITIES — (0.7)% | | (32,551) | |
| TOTAL NET ASSETS — 100.0% | | $ | 4,893,926 | |
| | | | | | | | | | | | | | | | | | | | |
| FORWARD FOREIGN CURRENCY EXCHANGE CONTRACTS |
| Currency Purchased | Currency Sold | Counterparty | Settlement
Date | Unrealized
Appreciation
(Depreciation) |
| EUR | 1,760 | | USD | 1,883 | | JPMorgan Chase Bank N.A. | 3/31/23 | $ | 13 | |
| EUR | 1,243 | | USD | 1,330 | | JPMorgan Chase Bank N.A. | 3/31/23 | 8 | |
| USD | 57,558 | | EUR | 53,753 | | JPMorgan Chase Bank N.A. | 3/31/23 | (325) | |
| | | | | | $ | (304) | |
| | | | | | | | |
| NOTES TO SCHEDULE OF INVESTMENTS |
| EUR | – | Euro |
| USD | – | United States Dollar |
(1)Non-income producing.
(2)Security, or a portion thereof, is on loan. At the period end, the aggregate value of securities on loan was $16,340. The amount of securities on loan indicated may not correspond with the securities on loan identified because securities with pending sales are in the process of recall from the brokers.
(3)Investment of cash collateral from securities on loan. At the period end, the aggregate value of the collateral held by the fund was $16,718.
See Notes to Financial Statements.
| | |
| Statement of Assets and Liabilities |
| | | | | |
| DECEMBER 31, 2022 | |
| Assets | |
Investment securities, at value (cost of $3,157,291) — including $16,340 of
securities on loan | $ | 4,909,759 | |
Investment made with cash collateral received for securities on loan, at value
(cost of $16,718) | 16,718 | |
| Total investment securities, at value (cost of $3,174,009) | 4,926,477 | |
| Cash | 19 | |
| Receivable for capital shares sold | 844 | |
| Unrealized appreciation on forward foreign currency exchange contracts | 21 | |
| Dividends and interest receivable | 1,680 | |
| Securities lending receivable | 76 | |
| 4,929,117 | |
| |
| Liabilities | |
| Payable for collateral received for securities on loan | 16,718 | |
| Payable for capital shares redeemed | 14,108 | |
| Unrealized depreciation on forward foreign currency exchange contracts | 325 | |
| Accrued management fees | 2,887 | |
| Distribution fees payable | 823 | |
| Accrued other expenses | 330 | |
| 35,191 | |
| |
| Net Assets | $ | 4,893,926 | |
| |
| Net Assets Consist of: | |
| Capital (par value and paid-in surplus) | $ | 3,383,946 | |
| Distributable earnings | 1,509,980 | |
| $ | 4,893,926 | |
| | | | | | | | | | | |
| Net Assets | Shares Outstanding | Net Asset Value Per Share |
| Class I, $0.01 Par Value | $1,073,752 | 77,631 | $13.83 |
| Class II, $0.01 Par Value | $3,820,174 | 277,864 | $13.75 |
See Notes to Financial Statements.
| | | | | |
| YEAR ENDED DECEMBER 31, 2022 |
| Investment Income (Loss) | |
| Income: | |
| Dividends (net of foreign taxes withheld of $301) | $ | 45,948 | |
| Securities lending, net | 2,037 | |
| Interest | 360 | |
| 48,345 | |
| |
| Expenses: | |
| Management fees | 47,136 | |
| Distribution fees - Class II | 11,102 | |
| Directors' fees and expenses | 161 | |
| Other expenses | 551 | |
| 58,950 | |
Fees waived(1) | (6,599) | |
| 52,351 | |
| |
| Net investment income (loss) | (4,006) | |
| |
| Realized and Unrealized Gain (Loss) | |
| Net realized gain (loss) on: | |
| Investment transactions | (225,969) | |
| Forward foreign currency exchange contract transactions | 6,259 | |
| Foreign currency translation transactions | (20) | |
| (219,730) | |
| |
| Change in net unrealized appreciation (depreciation) on: | |
| Investments | (2,097,618) | |
| Forward foreign currency exchange contracts | 385 | |
| (2,097,233) | |
| |
| Net realized and unrealized gain (loss) | (2,316,963) | |
| |
| Net Increase (Decrease) in Net Assets Resulting from Operations | $ | (2,320,969) | |
(1)Amount consists of $1,482 and $5,117 for Class I and Class II, respectively.
See Notes to Financial Statements.
| | |
| Statement of Changes in Net Assets |
| | | | | | | | |
| YEARS ENDED DECEMBER 31, 2022 AND DECEMBER 31, 2021 |
| Increase (Decrease) in Net Assets | December 31, 2022 | December 31, 2021 |
| Operations | | |
| Net investment income (loss) | $ | (4,006) | | $ | (20,964) | |
| Net realized gain (loss) | (219,730) | | 551,595 | |
| Change in net unrealized appreciation (depreciation) | (2,097,233) | | 916,331 | |
| Net increase (decrease) in net assets resulting from operations | (2,320,969) | | 1,446,962 | |
| | |
| Distributions to Shareholders |
| From earnings: | | |
| Class I | (124,364) | | (2,122) | |
| Class II | (407,697) | | (934,935) | |
| Decrease in net assets from distributions | (532,061) | | (937,057) | |
| | |
| Capital Share Transactions |
| Net increase (decrease) in net assets from capital share transactions (Note 5) | 457,297 | | 1,524,253 | |
| | |
| Net increase (decrease) in net assets | (2,395,733) | | 2,034,158 | |
| | |
| Net Assets |
| Beginning of period | 7,289,659 | | 5,255,501 | |
| End of period | $ | 4,893,926 | | $ | 7,289,659 | |
See Notes to Financial Statements.
| | |
| Notes to Financial Statements |
DECEMBER 31, 2022
1. Organization
American Century Variable Portfolios, Inc. (the corporation) is registered under the Investment Company Act of 1940, as amended (the 1940 Act), as an open-end management investment company and is organized as a Maryland corporation. VP Growth Fund (the fund) is one fund in a series issued by the corporation. The fund’s investment objective is to seek long-term capital growth. The fund offers Class I and Class II.
2. Significant Accounting Policies
The following is a summary of significant accounting policies consistently followed by the fund in preparation of its financial statements. The fund is an investment company and follows accounting and reporting guidance in accordance with accounting principles generally accepted in the United States of America. This may require management to make certain estimates and assumptions at the date of the financial statements. Actual results could differ from these estimates. Management evaluated the impact of events or transactions occurring through the date the financial statements were issued that would merit recognition or disclosure.
Investment Valuations — The fund determines the fair value of its investments and computes its net asset value (NAV) per share at the close of regular trading (usually 4 p.m. Eastern time) on the New York Stock Exchange (NYSE) on each day the NYSE is open. The value of investments of the fund is determined by American Century Investment Management, Inc. (ACIM) (the investment advisor), as the valuation designee, pursuant to its valuation policies and procedures. The Board of Directors oversees the valuation designee and reviews its valuation policies and procedures at least annually.
Equity securities that are listed or traded on a domestic securities exchange are valued at the last reported sales price or at the official closing price as provided by the exchange. Equity securities traded on foreign securities exchanges are generally valued at the closing price of such securities on the exchange where primarily traded or at the close of the NYSE, if that is earlier. If no last sales price is reported, or if local convention or regulation so provides, the mean of the latest bid and asked prices may be used. Securities traded over-the-counter are valued at the mean of the latest bid and asked prices, the last sales price, or the official closing price. Equity securities initially expressed in local currencies are translated into U.S. dollars at the mean of the appropriate currency exchange rate at the close of the NYSE as provided by an independent pricing service.
Open-end management investment companies are valued at the reported NAV per share. Repurchase agreements are valued at cost, which approximates fair value. Forward foreign currency exchange contracts are valued at the mean of the appropriate forward exchange rate at the close of the NYSE as provided by an independent pricing service.
If the valuation designee determines that the market price for a portfolio security is not readily available or is believed by the valuation designee to be unreliable, such security is valued at fair value as determined in good faith by the valuation designee, in accordance with its policies and procedures. Circumstances that may cause the fund to determine that market quotations are not available or reliable include, but are not limited to: when there is a significant event subsequent to the market quotation; trading in a security has been halted during the trading day; or trading in a security is insufficient or did not take place due to a closure or holiday.
The valuation designee monitors for significant events occurring after the close of an investment’s primary exchange but before the fund’s NAV per share is determined. Significant events may include, but are not limited to: corporate announcements and transactions; regulatory news, governmental action and political unrest that could impact a specific investment or an investment sector; or armed conflicts, natural disasters and similar events that could affect investments in a specific country or region. The valuation designee also monitors for significant fluctuations between domestic and foreign markets, as evidenced by the U.S. market or such other indicators that it deems appropriate. The valuation designee may apply a model-derived factor to the closing price of equity securities traded on foreign securities exchanges. The factor is based on observable market data as provided by an independent pricing service.
Security Transactions — Security transactions are accounted for as of the trade date. Net realized gains and losses are determined on the identified cost basis, which is also used for federal income tax purposes.
Investment Income — Dividend income less foreign taxes withheld, if any, is recorded as of the ex-dividend date. Distributions received on securities that represent a return of capital or long-term capital gain are recorded as a reduction of cost of investments and/or as a realized gain. The fund may estimate the components of distributions received that may be considered nontaxable distributions or long-term capital gain distributions for income tax purposes. Interest income is recorded on the accrual basis and includes accretion of discounts and amortization of premiums. Securities lending income is net of fees and rebates earned by the lending agent for its services.
Foreign Currency Translations — All assets and liabilities initially expressed in foreign currencies are translated into U.S. dollars at prevailing exchange rates at period end. The fund may enter into spot foreign currency exchange contracts to facilitate transactions denominated in a foreign currency. Purchases and sales of investment securities, dividend and interest income, spot foreign currency exchange contracts, and expenses are translated at the rates of exchange prevailing on the respective dates of such transactions. Net realized and unrealized foreign currency exchange gains or losses related to investment securities are a component of net realized gain (loss) on investment transactions and change in net unrealized appreciation (depreciation) on investments, respectively.
Repurchase Agreements — The fund may enter into repurchase agreements with institutions that ACIM has determined are creditworthy pursuant to criteria adopted by the Board of Directors. The fund requires that the collateral, represented by securities, received in a repurchase transaction be transferred to the custodian in a manner sufficient to enable the fund to obtain those securities in the event of a default under the repurchase agreement. ACIM monitors, on a daily basis, the securities transferred to ensure the value, including accrued interest, of the securities under each repurchase agreement is equal to or greater than amounts owed to the fund under each repurchase agreement.
Joint Trading Account — Pursuant to an Exemptive Order issued by the Securities and Exchange Commission, the fund, along with certain other funds in the American Century Investments family of funds, may transfer uninvested cash balances into a joint trading account. These balances are invested in one or more repurchase agreements that are collateralized by U.S. Treasury or Agency obligations.
Segregated Assets — In accordance with the 1940 Act, the fund segregates assets on its books and records to cover certain types of investment securities and other financial instruments. ACIM monitors, on a daily basis, the securities segregated to ensure the fund designates a sufficient amount of liquid assets, marked-to-market daily. The fund may also receive assets or be required to pledge assets at the custodian bank or with a broker for collateral requirements. The fund may incur charges or earn income on posted collateral balances,
which are reflected in interest expenses or interest income, respectively.
Income Tax Status — It is the fund's policy to distribute substantially all net investment income and net realized gains to shareholders and to otherwise qualify as a regulated investment company under provisions of the Internal Revenue Code. Accordingly, no provision has been made for income taxes. The fund files U.S. federal, state, local and non-U.S. tax returns as applicable. The fund's tax returns are subject to examination by the relevant taxing authority until expiration of the applicable statute of limitations, which is generally three years from the date of filing but can be longer in certain jurisdictions. At this time, management believes there are no uncertain tax positions which, based on their technical merit, would not be sustained upon examination and for which it is reasonably possible that the total amounts of unrecognized tax benefits will significantly change in the next twelve months.
Multiple Class — All shares of the fund represent an equal pro rata interest in the net assets of the class to which such shares belong, and have identical voting, dividend, liquidation and other rights and the same terms and conditions, except for class specific expenses and exclusive rights to vote on matters affecting only individual classes. Income, non-class specific expenses, and realized and unrealized capital gains and losses of the fund are allocated to each class of shares based on their relative net assets.
Distributions to Shareholders — Distributions from net investment income and net realized gains, if any, are generally declared and paid annually.
Indemnifications — Under the corporation’s organizational documents, its officers and directors are indemnified against certain liabilities arising out of the performance of their duties to the fund. In addition, in the normal course of business, the fund enters into contracts that provide general indemnifications. The maximum exposure under these arrangements is unknown as this would involve future claims that may be made against a fund. The risk of material loss from such claims is considered by management to be remote.
Securities Lending — Securities are lent to qualified financial institutions and brokers. State Street Bank & Trust Co. serves as securities lending agent to the fund pursuant to a Securities Lending Agreement. The lending of securities exposes the fund to risks such as: the borrowers may fail to return the loaned securities, the borrowers may not be able to provide additional collateral, the fund may experience delays in recovery of the loaned securities or delays in access to collateral, or the fund may experience losses related to the investment collateral. To minimize certain risks, loan counterparties pledge collateral in the form of cash and/or securities. The lending agent has agreed to indemnify the fund in the case of default of any securities borrowed. Cash collateral received is invested in the State Street Navigator Securities Lending Government Money Market Portfolio, a money market mutual fund registered under the 1940 Act. The loans may also be secured by U.S. government securities in an amount at least equal to the market value of the securities loaned, plus accrued interest and dividends, determined on a daily basis and adjusted accordingly. By lending securities, the fund seeks to increase its net investment income through the receipt of interest and fees. Such income is reflected separately within the Statement of Operations. The value of loaned securities and related collateral outstanding at period end, if any, are shown on a gross basis within the Schedule of Investments and Statement of Assets and Liabilities.
The following table reflects a breakdown of transactions accounted for as secured borrowings, the gross obligation by the type of collateral pledged, and the remaining contractual maturity of those transactions as of December 31, 2022.
| | | | | | | | | | | | | | | | | |
| Remaining Contractual Maturity of Agreements |
| Overnight and Continuous | <30 days | Between 30 & 90 days | >90 days | Total |
Securities Lending Transactions(1) | | | | |
| Common Stocks | $ | 16,718 | | — | | — | | — | | $ | 16,718 | |
| Gross amount of recognized liabilities for securities lending transactions | $ | 16,718 | |
(1)Amount represents the payable for cash collateral received for securities on loan. This will generally be in the Overnight and Continuous column as the securities are typically callable on demand.
3. Fees and Transactions with Related Parties
Certain officers and directors of the corporation are also officers and/or directors of American Century Companies, Inc. (ACC). The corporation's investment advisor, ACIM, the corporation's distributor, American Century Investment Services, Inc. (ACIS), and the corporation's transfer agent, American Century Services, LLC, are wholly owned, directly or indirectly, by ACC.
Management Fees — The corporation has entered into a management agreement with ACIM, under which ACIM provides the fund with investment advisory and management services in exchange for a single, unified management fee (the fee) per class. The agreement provides that ACIM will pay all expenses of managing and operating the fund, except brokerage expenses, taxes, interest, fees and expenses of the independent directors (including legal counsel fees), extraordinary expenses, and expenses incurred in connection with the provision of shareholder services and distribution services under a plan adopted pursuant to Rule 12b-1 under the 1940 Act. The fee is computed and accrued daily based on each class's daily net assets and paid monthly in arrears. The difference in the fee among the classes is a result of their separate arrangements for non-Rule 12b-1 shareholder services. It is not the result of any difference in advisory or custodial fees or other expenses related to the management of the fund’s assets, which do not vary by class. From January 1, 2022 through July 31, 2022, the investment advisor agreed to waive 0.10% of the fund's management fee. Effective August 1, 2022, the investment advisor agreed to waive 0.14% of the fund's management fee. The investment advisor expects this waiver to continue until July 31, 2023 and cannot terminate it prior to such date without the approval of the Board of Directors.
The annual management fee and the effective annual management fee after waiver for each class for the period ended December 31, 2022 are as follows:
| | | | | | | | |
| Annual Management Fee | Effective Annual Management Fee After Waiver |
| Class I | 0.90% | 0.79% |
| Class II | 0.80% | 0.69% |
Distribution Fees — The Board of Directors has adopted the Master Distribution Plan (the plan) for Class II, pursuant to Rule 12b-1 of the 1940 Act. The plan provides that Class II will pay ACIS an annual distribution fee equal to 0.25%. The fee is computed and accrued daily based on the Class II daily net assets and paid monthly in arrears. The distribution fee provides compensation for expenses incurred in connection with distributing shares of Class II including, but not limited to, payments to brokers, dealers, and financial institutions that have entered into sales agreements with respect to shares of the fund. Fees incurred under the plan during the period ended December 31, 2022 are detailed in the Statement of Operations.
Directors' Fees and Expenses — The Board of Directors is responsible for overseeing the investment advisor’s management and operations of the fund. The directors receive detailed information about the fund and its investment advisor regularly throughout the year, and meet at least quarterly with management of the investment advisor to review reports about fund operations. The fund's officers do not receive compensation from the fund.
Interfund Transactions — The fund may enter into security transactions with other American Century Investments funds and other client accounts of the investment advisor, in accordance with the 1940 Act rules and procedures adopted by the Board of Directors. The rules and procedures require, among other things, that these transactions be effected at the independent current market price of the security. There were no interfund transactions during the period.
4. Investment Transactions
Purchases and sales of investment securities, excluding short-term investments, for the period ended December 31, 2022 were $2,775,201 and $2,851,983, respectively.
5. Capital Share Transactions
Transactions in shares of the fund were as follows:
| | | | | | | | | | | | | | |
| Year ended
December 31, 2022 | Year ended
December 31, 2021 |
| Shares | Amount | Shares | Amount |
| Class I/Shares Authorized | 50,000,000 | | | 50,000,000 | | |
| Sold | 20,015 | | $ | 345,191 | | 74,297 | | $ | 1,510,062 | |
| Issued in reinvestment of distributions | 6,683 | | 124,364 | | 124 | | 2,122 | |
| Redeemed | (22,823) | | (345,117) | | (1,224) | | (26,345) | |
| 3,875 | | 124,438 | | 73,197 | | 1,485,839 | |
| Class II/Shares Authorized | 50,000,000 | | | 50,000,000 | | |
| Sold | 52,195 | | 815,830 | | 14,810 | | 294,899 | |
| Issued in reinvestment of distributions | 22,014 | | 407,697 | | 54,707 | | 934,935 | |
| Redeemed | (57,968) | | (890,668) | | (59,160) | | (1,191,420) | |
| 16,241 | | 332,859 | | 10,357 | | 38,414 | |
| Net increase (decrease) | 20,116 | | $ | 457,297 | | 83,554 | | $ | 1,524,253 | |
6. Fair Value Measurements
The fund's investments valuation process is based on several considerations and may use multiple inputs to determine the fair value of the investments held by the fund. In conformity with accounting principles generally accepted in the United States of America, the inputs used to determine a valuation are classified into three broad levels.
•Level 1 valuation inputs consist of unadjusted quoted prices in an active market for identical investments.
•Level 2 valuation inputs consist of direct or indirect observable market data (including quoted prices for comparable investments, evaluations of subsequent market events, interest rates, prepayment speeds, credit risk, etc.). These inputs also consist of quoted prices for identical investments initially expressed in local currencies that are adjusted through translation into U.S. dollars.
•Level 3 valuation inputs consist of unobservable data (including a fund’s own assumptions).
The level classification is based on the lowest level input that is significant to the fair valuation measurement. The valuation inputs are not necessarily an indication of the risks associated with investing in these securities or other financial instruments.
The following is a summary of the level classifications as of period end. The Schedule of Investments provides additional information on the fund's portfolio holdings.
| | | | | | | | | | | |
| Level 1 | Level 2 | Level 3 |
| Assets | | | |
| Investment Securities | | | |
| Common Stocks | $ | 4,571,678 | | $ | 118,936 | | — | |
| Exchange-Traded Funds | 185,689 | | — | | — | |
| Short-Term Investments | 45,496 | | 4,678 | | — | |
| $ | 4,802,863 | | $ | 123,614 | | — | |
| Other Financial Instruments | | | |
| Forward Foreign Currency Exchange Contracts | — | | $ | 21 | | — | |
| | | |
| Liabilities | | | |
| Other Financial Instruments | | | |
| Forward Foreign Currency Exchange Contracts | — | | $ | 325 | | — | |
7. Derivative Instruments
Foreign Currency Risk — The fund is subject to foreign currency exchange rate risk in the normal course of pursuing its investment objectives. The value of foreign investments held by a fund may be significantly affected by changes in foreign currency exchange rates. The dollar value of a foreign security generally decreases when the value of the dollar rises against the foreign currency in which the security is denominated and tends to increase when the value of the dollar declines against such foreign currency. A fund may enter into forward foreign currency exchange contracts to reduce a fund's exposure to foreign currency exchange rate fluctuations. The net U.S. dollar value of foreign currency underlying all contractual commitments held by a fund and the resulting unrealized appreciation or depreciation are determined daily. Realized gain or loss is recorded upon settlement of the contract. Net realized and unrealized gains or losses occurring during the holding period of forward foreign currency exchange contracts are a component of net realized gain (loss) on forward foreign currency exchange contract transactions and change in net unrealized appreciation (depreciation) on forward foreign currency exchange contracts, respectively. A fund bears the risk of an unfavorable change in the foreign currency exchange rate underlying the forward contract. Additionally, losses, up to the fair value, may arise if the counterparties do not perform under the contract terms. The fund's average U.S. dollar exposure to foreign currency risk derivative instruments held during the period was $91,898.
The value of foreign currency risk derivative instruments as of December 31, 2022, is disclosed on the Statement of Assets and Liabilities as an asset of $21 in unrealized appreciation on forward foreign currency exchange contracts and a liability of $325 in unrealized depreciation on forward foreign currency exchange contracts. For the year ended December 31, 2022, the effect of foreign currency risk derivative instruments on the Statement of Operations was $6,259 in net realized gain (loss) on forward foreign currency exchange contract transactions and $385 in change in net unrealized appreciation (depreciation) on forward foreign currency exchange contracts.
8. Risk Factors
The value of the fund’s shares will go up and down, sometimes rapidly or unpredictably, based on the performance of the securities owned by the fund and other factors generally affecting the securities market. Market risks, including political, regulatory, economic and social developments, can affect the value of the fund’s investments. Natural disasters, public health emergencies, war, terrorism and other unforeseeable events may lead to increased market volatility and may have adverse long-term effects on world economies and markets generally.
9. Federal Tax Information
The tax character of distributions paid during the years ended December 31, 2022 and December 31, 2021 were as follows:
| | | | | | | | |
| 2022 | 2021 |
| Distributions Paid From | | |
| Ordinary income | $ | 48,955 | | $ | 37,465 | |
| Long-term capital gains | $ | 483,106 | | $ | 899,592 | |
The book-basis character of distributions made during the year from net investment income or net realized gains may differ from their ultimate characterization for federal income tax purposes. These differences reflect the differing character of certain income items and net realized gains and losses for financial statement and tax purposes, and may result in reclassification among certain capital accounts on the financial statements.
As of period end, the federal tax cost of investments and the components of distributable earnings on a tax-basis were as follows:
| | | | | |
| Federal tax cost of investments | $ | 3,209,639 | |
| Gross tax appreciation of investments | $ | 1,986,115 | |
| Gross tax depreciation of investments | (269,277) | |
| Net tax appreciation (depreciation) of investments | $ | 1,716,838 | |
| Undistributed ordinary income | $ | 1,375 | |
| Accumulated short-term capital losses | $ | (208,233) | |
The difference between book-basis and tax-basis unrealized appreciation (depreciation) is attributable primarily to the tax deferral of losses on wash sales.
Accumulated capital losses represent net capital loss carryovers that may be used to offset future realized capital gains for federal income tax purposes. The capital loss carryovers may be carried forward for an unlimited period. Future capital loss carryover utilization in any given year may be subject to Internal Revenue Code limitations.
| | | | | | | | | | | | | | | | | | | | | | | | | | | | | | | | | | | | | | | | | | | | | | | |
| For a Share Outstanding Throughout the Years Ended December 31 (except as noted) | | | |
| Per-Share Data | | | Ratios and Supplemental Data |
| | Income From Investment Operations: | Distributions From: | | | Ratio to Average Net Assets of: | | |
| Net Asset
Value,
Beginning
of Period | Net Investment Income (Loss)(1) | Net
Realized
and
Unrealized
Gain (Loss) | Total From
Investment
Operations | Net
Investment
Income | Net
Realized
Gains | Total
Distributions | Net Asset
Value,
End
of Period | Total Return(2) | Operating
Expenses | Operating
Expenses
(before
expense
waiver) | Net
Investment
Income
(Loss) | Net
Investment
Income
(Loss)
(before
expense
waiver) | Portfolio
Turnover
Rate | Net
Assets,
End of
Period
(in thousands) |
| Class I |
| 2022 | $21.81 | 0.01 | (6.43) | (6.42) | — | (1.56) | (1.56) | $13.83 | (31.28)% | 0.80% | 0.91% | 0.04% | (0.07)% | 48% | $1,074 | |
| 2021 | $20.91 | (0.05) | 4.75 | 4.70 | — | (3.80) | (3.80) | $21.81 | 27.40% | 0.80% | 0.96% | (0.21)% | (0.37)% | 41% | $1,608 | |
| 2020 | $17.05 | 0.01 | 5.11 | 5.12 | (0.07) | (1.19) | (1.26) | $20.91 | 34.87% | 0.81% | 1.01% | 0.04% | (0.16)% | 48% | $12 | |
| 2019 | $14.34 | 0.07 | 4.66 | 4.73 | (0.06) | (1.96) | (2.02) | $17.05 | 35.48% | 0.81% | 1.00% | 0.43% | 0.24% | 52% | $8 | |
| 2018 | $14.87 | 0.05 | (0.24) | (0.19) | (0.04) | (0.30) | (0.34) | $14.34 | (1.36)% | 0.82% | 1.00% | 0.28% | 0.10% | 63% | $6 | |
| Class II |
| 2022 | $21.72 | (0.02) | (6.39) | (6.41) | — | (1.56) | (1.56) | $13.75 | (31.34)% | 0.95% | 1.06% | (0.11)% | (0.22)% | 48% | $3,820 | |
| 2021 | $20.87 | (0.07) | 4.72 | 4.65 | — | (3.80) | (3.80) | $21.72 | 27.14% | 0.95% | 1.11% | (0.36)% | (0.52)% | 41% | $5,681 | |
| 2020 | $17.02 | (0.02) | 5.12 | 5.10 | (0.06) | (1.19) | (1.25) | $20.87 | 34.67% | 0.96% | 1.16% | (0.11)% | (0.31)% | 48% | $5,244 | |
| 2019 | $14.31 | 0.04 | 4.67 | 4.71 | (0.04) | (1.96) | (2.00) | $17.02 | 35.33% | 0.96% | 1.15% | 0.28% | 0.09% | 52% | $5,580 | |
| 2018 | $14.85 | 0.02 | (0.24) | (0.22) | (0.02) | (0.30) | (0.32) | $14.31 | (1.59)% | 0.97% | 1.15% | 0.13% | (0.05)% | 63% | $4,688 | |
| | |
| Notes to Financial Highlights |
(1)Computed using average shares outstanding throughout the period.
(2)Total returns are calculated based on the net asset value of the last business day. Total returns for periods less than one year are not annualized. The total returns presented do not include the fees and charges assessed with investments in variable insurance products, those charges are disclosed in the separate account prospectus. The inclusion of such fees and charges would lower total return.
See Notes to Financial Statements.
| | |
| Report of Independent Registered Public Accounting Firm |
To the Shareholders and the Board of Directors of American Century Variable Portfolios, Inc.:
Opinion on the Financial Statements and Financial Highlights
We have audited the accompanying statement of assets and liabilities, including the schedule of investments, of VP Growth Fund (the “Fund”), one of the funds constituting the American Century Variable Portfolios, Inc., as of December 31, 2022, the related statement of operations for the year then ended, the statements of changes in net assets for each of the two years in the period then ended, the financial highlights for each of the five years in the period then ended, and the related notes. In our opinion, the financial statements and financial highlights present fairly, in all material respects, the financial position of VP Growth Fund of the American Century Variable Portfolios, Inc. as of December 31, 2022, and the results of its operations for the year then ended, the changes in its net assets for each of the two years in the period then ended, and the financial highlights for each of the five years in the period then ended, in conformity with accounting principles generally accepted in the United States of America.
Basis for Opinion
These financial statements and financial highlights are the responsibility of the Fund's management. Our responsibility is to express an opinion on the Fund’s financial statements and financial highlights based on our audits. We are a public accounting firm registered with the Public Company Accounting Oversight Board (United States) (PCAOB) and are required to be independent with respect to the Fund in accordance with the U.S. federal securities laws and the applicable rules and regulations of the Securities and Exchange Commission and the PCAOB.
We conducted our audits in accordance with the standards of the PCAOB. Those standards require that we plan and perform the audit to obtain reasonable assurance about whether the financial statements and financial highlights are free of material misstatement, whether due to error or fraud. The Fund is not required to have, nor were we engaged to perform, an audit of its internal control over financial reporting. As part of our audits, we are required to obtain an understanding of internal control over financial reporting but not for the purpose of expressing an opinion on the effectiveness of the Fund’s internal control over financial reporting. Accordingly, we express no such opinion.
Our audits included performing procedures to assess the risks of material misstatement of the financial statements and financial highlights, whether due to error or fraud, and performing procedures that respond to those risks. Such procedures included examining, on a test basis, evidence regarding the amounts and disclosures in the financial statements and financial highlights. Our audits also included evaluating the accounting principles used and significant estimates made by management, as well as evaluating the overall presentation of the financial statements and financial highlights. Our procedures included confirmation of securities owned as of December 31, 2022, by correspondence with the custodian and brokers; when replies were not received from brokers, we performed other auditing procedures. We believe that our audits provide a reasonable basis for our opinion.
/s/ Deloitte & Touche LLP
Kansas City, Missouri
February 10, 2023
We have served as the auditor of one or more American Century investment companies since 1997.
The Board of Directors
The individuals listed below serve as directors of the funds. Each director will continue to serve in this capacity until death, retirement, resignation or removal from office. The board has adopted a mandatory retirement age for directors who are not “interested persons,” as that term is defined in the Investment Company Act (independent directors). Independent directors shall retire on December 31 of the year in which they reach their 75th birthday.
Jonathan S. Thomas is an “interested person” because he currently serves as President and Chief Executive Officer of American Century Companies, Inc. (ACC), the parent company of American Century Investment Management, Inc. (ACIM or the advisor). The other directors (more than three-fourths of the total number) are independent. They are not employees, directors or officers of, and have no financial interest in, ACC or any of its wholly owned, direct or indirect, subsidiaries, including ACIM, American Century Investment Services, Inc. (ACIS) and American Century Services, LLC (ACS), and they do not have any other affiliations, positions or relationships that would cause them to be considered “interested persons” under the Investment Company Act. The directors serve in this capacity for seven (in the case of Jonathan S. Thomas, 16; and Stephen E. Yates, 8) registered investment companies in the American Century Investments family of funds.
The following table presents additional information about the directors. The mailing address for each director is 4500 Main Street, Kansas City, Missouri 64111.
| | | | | | | | | | | | | | | | | |
Name
(Year of Birth) | Position(s) Held with Funds | Length of Time Served | Principal Occupation(s) During Past 5 Years | Number of American Century Portfolios Overseen by Director | Other Directorships Held During Past 5 Years |
| Independent Directors | | |
Brian Bulatao
(1964) | Director | Since 2022 | Chief Administrative Officer, Activision Blizzard, Inc. (2021 to present); Under Secretary of State for Management, U.S. Department of State (2018 to 2021); Chief Operating Officer, Central Intelligence Agency (2017 to 2018) | 64 | None |
| Thomas W. Bunn (1953) | Director | Since 2017 | Retired | 64 | None |
Chris H. Cheesman
(1962)
| Director | Since 2019
| Retired. Senior Vice President & Chief Audit Executive, AllianceBernstein (1999 to 2018)
| 64 | Alleghany Corporation (2021 to 2022) |
Barry Fink
(1955) | Director | Since 2012 (independent since 2016) | Retired | 64 | None |
Rajesh K. Gupta
(1960)
| Director | Since 2019
| Partner Emeritus, SeaCrest Investment Management and SeaCrest Wealth Management (2019 to Present); Chief Executive Officer and Chief Investment Officer, SeaCrest Investment Management (2006 to 2019); Chief Executive Officer and Chief Investment Officer, SeaCrest Wealth Management (2008 to 2019) | 64 | None |
| | | | | | | | | | | | | | | | | |
Name
(Year of Birth) | Position(s) Held with Funds | Length of Time Served | Principal Occupation(s) During Past 5 Years | Number of American Century Portfolios Overseen by Director | Other Directorships Held During Past 5 Years |
| Independent Directors | | |
Lynn Jenkins
(1963)
| Director | Since 2019
| Consultant, LJ Strategies (2019 to present); United States Representative, U.S. House of Representatives (2009 to 2018) | 64 | MGP Ingredients, Inc. (2019 to 2021) |
Jan M. Lewis
(1957) | Director and Board Chair | Since 2011 (Board Chair since 2022) | Retired | 64 | None |
Gary C. Meltzer
(1963) | Director | Since 2022 | Advisor, Pontoro (2021 to present); Executive Advisor, Consultant and Investor, Harris Ariel Advisory LLC (2020 to present); Managing Partner, PricewaterhouseCoopers LLP (1985 to 2020) | 64 | ExcelFin Acquisition Corp., Apollo Realty Income Solutions, Inc. |
Stephen E. Yates
(1948) | Director | Since 2012 | Retired | 108 | None |
| Interested Director | |
Jonathan S. Thomas
(1963) | Director | Since 2007 | President and Chief Executive Officer, ACC (2007 to present). Also serves as Chief Executive Officer, ACS; Director, ACC and other ACC subsidiaries | 140 | None |
The Statement of Additional Information has additional information about the fund's directors and is available without charge, upon request, by calling 1-800-378-9878.
Officers
The following table presents certain information about the executive officers of the funds. Each officer serves as an officer for 16 (in the case of Robert J. Leach, 15) investment companies in the American Century family of funds. No officer is compensated for his or her service as an officer of the funds. The listed officers are interested persons of the funds and are appointed or re-appointed on an annual basis. The mailing address for each officer listed below is 4500 Main Street, Kansas City, Missouri 64111.
| | | | | | | | |
Name
(Year of Birth) | Offices with the Funds | Principal Occupation(s) During the Past Five Years |
Patrick Bannigan
(1965) | President since 2019 | Executive Vice President and Director, ACC (2012 to present); Chief Financial Officer, Chief Accounting Officer and Treasurer, ACC (2015 to present). Also serves as President, ACS; Vice President, ACIM; Chief Financial Officer, Chief Accounting Officer and/or Director, ACIM, ACS and other ACC subsidiaries |
R. Wes Campbell
(1974) | Chief Financial Officer and Treasurer since 2018 | Vice President, ACS, (2020 to present); Investment Operations and Investment Accounting, ACS (2000 to present) |
Amy D. Shelton
(1964) | Chief Compliance Officer and Vice President since 2014 | Chief Compliance Officer, American Century funds, (2014 to present); Chief Compliance Officer, ACIM (2014 to present); Chief Compliance Officer, ACIS (2009 to present). Also serves as Vice President, ACIS |
John Pak
(1968) | General Counsel and
Senior Vice President since 2021 | General Counsel and Senior Vice President, ACC (2021 to present); Also serves as General Counsel and Senior Vice President, ACIM, ACS and ACIS. Chief Legal Officer of Investment and Wealth Management, The Bank of New York Mellon (2014 to 2021) |
C. Jean Wade
(1964) | Vice President since 2012 | Senior Vice President, ACS (2017 to present); Vice President, ACS (2000 to 2017)
|
Robert J. Leach
(1966) | Vice President since 2006 | Vice President, ACS (2000 to present) |
David H. Reinmiller
(1963) | Vice President since 2000 | Attorney, ACC (1994 to present). Also serves as Vice President, ACIM and ACS |
Ward D. Stauffer
(1960) | Secretary since 2005 | Attorney, ACC (2003 to present) |
A special meeting of shareholders was held on October 13, 2022, to vote on the following proposal. The proposal received the required votes and was adopted. A summary of voting results is listed below.
To elect five directors to the Board of Directors of American Century Variable Portfolios, Inc.:
| | | | | | | | | | | |
| Affirmative | | Withhold |
| Brian Bulatao | $ | 2,607,537,119 | | | $ | 88,836,350 | |
| Chris H. Cheesman | $ | 2,619,879,519 | | | $ | 76,493,950 | |
| Rajesh K. Gupta | $ | 2,616,882,375 | | | $ | 79,491,094 | |
| Lynn M. Jenkins | $ | 2,607,769,137 | | | $ | 88,604,332 | |
| Gary C. Meltzer | $ | 2,616,158,906 | | | $ | 80,214,563 | |
The other directors whose term of office continued after the meeting include Jonathan S. Thomas, Thomas W. Bunn, Barry Fink, Jan M. Lewis, and Stephen E. Yates.
Proxy Voting Policies
A description of the policies that the fund's investment advisor uses in exercising the voting rights associated with the securities purchased and/or held by the fund is available without charge, upon request, by calling 1-800-378-9878. It is also available on American Century Investments’ website at americancentury.com/proxy and on the Securities and Exchange Commission’s website at sec.gov. Information regarding how the investment advisor voted proxies relating to portfolio securities during the most recent 12-month period ended June 30 is available on americancentury.com/proxy. It is also available at sec.gov.
Quarterly Portfolio Disclosure
The fund files its complete schedule of portfolio holdings with the Securities and Exchange Commission (SEC) for the first and third quarters of each fiscal year as an exhibit to its reports on Form N-PORT. These portfolio holdings are available on the fund's website at americancentury.com and, upon request, by calling 1-800-378-9878. The fund’s Form N-PORT reports are available on the SEC’s website at sec.gov.
Other Tax Information
The following information is provided pursuant to provisions of the Internal Revenue Code.
For corporate taxpayers, the fund hereby designates $30,100, or up to the maximum amount allowable, of ordinary income distributions paid during the fiscal year ended December 31, 2022 as qualified for the corporate dividends received deduction.
The fund hereby designates $483,106, or up to the maximum amount allowable, as long-term capital gain distributions (20% rate gain distributions) for the fiscal year ended December 31, 2022.
The fund hereby designates $48,928 as qualified short-term capital gain distributions for purposes of Internal Revenue Code Section 871 for the fiscal year ended December 31, 2022.
| | | | | | | | |
| |
| | |
| Contact Us | americancentury.com | |
| Automated Information Line | 1-800-345-8765 | |
| Investment Professional Service Representatives | 1-800-345-6488 | |
| Telecommunications Relay Service for the Deaf | 711 | |
| | |
| American Century Variable Portfolios, Inc. | |
| | |
Investment Advisor: American Century Investment Management, Inc. Kansas City, Missouri | |
| | |
| This report and the statements it contains are submitted for the general information of our shareholders. The report is not authorized for distribution to prospective investors unless preceded or accompanied by an effective prospectus. | |
| | |
©2023 American Century Proprietary Holdings, Inc. All rights reserved.
CL-ANN-91447 2302 | |
| | | | | |
| |
| Annual Report |
| |
| December 31, 2022 |
| |
| VP International Fund |
| Class I (AVIIX) |
| Class II (ANVPX) |
| | | | | |
| Performance | |
| Portfolio Commentary | |
| Fund Characteristics | |
| Shareholder Fee Example | |
| Schedule of Investments | |
| Statement of Assets and Liabilities | |
| Statement of Operations | |
| Statement of Changes in Net Assets | |
| Notes to Financial Statements | |
| Financial Highlights | |
| Report of Independent Registered Public Accounting Firm | |
| Management | |
| |
| |
| Proxy Voting Results | |
| Additional Information | |
Any opinions expressed in this report reflect those of the author as of the date of the report, and do not necessarily represent the opinions of American Century Investments® or any other person in the American Century Investments organization. Any such opinions are subject to change at any time based upon market or other conditions and American Century Investments disclaims any responsibility to update such opinions. These opinions may not be relied upon as investment advice and, because investment decisions made by American Century Investments funds are based on numerous factors, may not be relied upon as an indication of trading intent on behalf of any American Century Investments fund. Security examples are used for representational purposes only and are not intended as recommendations to purchase or sell securities. Performance information for comparative indices and securities is provided to American Century Investments by third party vendors. To the best of American Century Investments’ knowledge, such information is accurate at the time of printing.
| | | | | | | | | | | | | | | | | | |
| Total Returns as of December 31, 2022 | |
| | | Average Annual Returns | |
| Ticker
Symbol | 1 year | 5 years | 10 years | | Inception
Date |
| Class I | AVIIX | -24.75% | 2.32% | 4.95% | | 5/1/94 |
| MSCI EAFE Index | — | -14.45% | 1.54% | 4.67% | | — |
| MSCI EAFE Growth Index | — | -22.95% | 2.48% | 5.58% | | — |
| Class II | ANVPX | -24.86% | 2.16% | 4.78% | | 8/15/01 |
Fund returns would have been lower if a portion of the fees had not been waived.
The performance information presented does not include the fees and charges assessed with investments in variable insurance products, those charges are disclosed in the separate account prospectus. The inclusion of such fees and charges would lower performance.
Data presented reflect past performance. Past performance is no guarantee of future results. Current performance may be higher or lower than the performance shown. Total returns for periods less than one year are not annualized. Investment return and principal value will fluctuate, and redemption value may be more or less than original cost. Data assumes reinvestment of dividends and capital gains, and none of the charts reflect the deduction of taxes that a shareholder would pay on fund distributions or the redemption of fund shares. To obtain performance data current to the most recent month end, please call 1-800-345-6488 or visit americancentury.com. For additional information about the fund, please consult the prospectus.
| | |
| Growth of $10,000 Over 10 Years |
| $10,000 investment made December 31, 2012 |
| Performance for other share classes will vary due to differences in fee structure. |
| | | | | |
| Value on December 31, 2022 |
| Class I — $16,206 |
|
| MSCI EAFE Index —$15,787 |
|
| MSCI EAFE Growth Index — $17,221 |
|
| |
|
Ending value of Class I would have been lower if a portion of the fees had not been waived.
| | | | | |
| Total Annual Fund Operating Expenses |
| Class I | Class II |
| 1.09% | 1.24% |
The total annual fund operating expenses shown is as stated in the fund’s prospectus current as of the date of this report. The prospectus may vary from the expense ratio shown elsewhere in this report because it is based on a different time period, includes acquired fund fees and expenses, and, if applicable, does not include fee waivers or expense reimbursements.
Data presented reflect past performance. Past performance is no guarantee of future results. Current performance may be higher or lower than the performance shown. Total returns for periods less than one year are not annualized. Investment return and principal value will fluctuate, and redemption value may be more or less than original cost. Data assumes reinvestment of dividends and capital gains, and none of the charts reflect the deduction of taxes that a shareholder would pay on fund distributions or the redemption of fund shares. To obtain performance data current to the most recent month end, please call 1-800-345-6488 or visit americancentury.com. For additional information about the fund, please consult the prospectus.
Portfolio Managers: Raj Gandhi and Jim Zhao
Performance Summary
VP International returned -24.75%* for the fiscal year ended December 31, 2022. The fund underperformed its benchmark, the MSCI EAFE Index, which returned -14.45% for the same period.
Rising inflation and aggressive central bank policy responses led investors to turn away from higher-multiple growth stocks early in 2022, which created a considerable headwind for the portfolio. Volatility across markets was further exacerbated by Russia’s invasion of Ukraine, which disrupted fragile supply chains, drove commodity prices significantly higher and raised geopolitical tensions—all of which weighed heavily on non-U.S. equities. In the second half of the period, supply chain issues and energy prices moderated somewhat, cooling inflation, which led investors to hope for less aggressive actions by central banks late in the period, and China’s reopening also gave some cause for optimism. However, signs of slowing economic growth, elevated inflation levels and further interest rate hikes accompanied by hawkish central bank language, presented a more difficult environment for earnings growth.
Stock selection across a variety of sectors drove the fund’s underperformance. Most notable was positioning among information technology companies and the portfolio’s overweight to the sector, which was hit particularly hard by investor sentiment and slowing economies. Selection within the materials sector also weighed on returns, where positions in some chemicals companies and not owning key outperforming metals and mining firms hurt relative performance. Positions in industrials and energy also hurt. Utilities was the only sector to meaningfully add to returns with stock selection driving contribution. From a geographic perspective, stock selection in Japan, France and Switzerland most notably detracted, whereas positioning in Denmark and Italy aided returns.
Higher Interest Rates and Muted Growth
Among information technology holdings, Shopify detracted from performance despite the company’s strong market position as it sold off on concerns about the sustainability of its growth. We exited the position. Adyen also lagged as the Dutch payment company faced pressure from economic developments, which weighed on near-term estimates, and investors became concerned about a softening consumer backdrop. Shares of Keyence also struggled. As one of Japan’s largest manufacturers of sensors and vision systems used to improve factory productivity, the macroeconomic headwinds and lockdowns in Shanghai challenged the company.
Within materials, stock selection weighed on returns. Our bottom-up process led to overweight positions among chemicals companies, Sika most notably detracted, and an underweighting of metals and mining firms, where a lack of exposure to some outperforming names, including BHP Group, also hindered relative performance.
In the industrials sector, stock selection hampered performance as inkjet printer supplier Kornit Digital sold off amid a broad investor rotation away from growth. We sold the stock. Additionally, Teleperformance’s shares fell after a November article stated Colombia’s Ministry of Labor had launched an investigation into alleged union-busting, poor working conditions and low pay in its content moderation business, accusations which management strongly refuted.
*All fund returns referenced in this commentary are for Class I shares. Fund returns would have been lower if a portion of the fees had not been waived. Performance for other share classes will vary due to differences in fee structure; when Class I performance exceeds that of the fund’s benchmark, other share classes may not. See page 2 for returns for all share classes.
Among individual detractors, Cellnex Telecom weakened due to a combination of elevated leverage and significant longer-term interest rate exposure, which, despite its large deleveraging capacity, led to investor concerns around the company’s ability to grow in a rising rate environment.
Utilities holdings overall, however, contributed to relative performance. Iberdrola performed well, benefiting from a strong position in energy transition-related infrastructure, supported by strong investment plans in green energy infrastructure, capital spending underpinned by the European climate plan and potential acceleration in the U.S.
Notable individual contributors included pharmaceuticals companies Novo Nordisk and AstraZeneca, multinational universal bank and financial services firm HSBC Holdings, Canadian Pacific Railway and French payments company Edenred.
Portfolio Positioning
We remain committed to our disciplined, bottom-up process of identifying companies exhibiting accelerating, sustainable growth. The team continues to see opportunities in companies positioned to benefit from secular growth trends such as healthy lifestyle choices, premium brands, automation, energy transition, health care innovation and digitalization. Demand for premium brands remains strong despite higher inflation, supporting names in apparel, spirits and automobiles. Digitalization benefits technology holdings exposed to IT services growth, artificial intelligence, cloud computing, automation, digital payments and software. Health care holdings include innovative companies using technology, equipment and outsourcing to provide improved cost and delivery efficiencies.
As a result of our bottom-up stock selection process, we remain notably overweight to information technology and underweight to financials. Geographically, we retain a large exposure to European stocks, France in particular. We continue to be underweighted to Japan.
| | | | | |
| DECEMBER 31, 2022 |
| Types of Investments in Portfolio | % of net assets |
| Common Stocks | 99.8% |
| Short-Term Investments | 2.9% |
| Other Assets and Liabilities | (2.7)% |
| |
| Top Five Countries | % of net assets |
| France | 20.6% |
| United Kingdom | 13.3% |
| Japan | 11.0% |
| Switzerland | 6.9% |
| Netherlands | 6.7% |
Fund shareholders may incur two types of costs: (1) transaction costs, including sales charges (loads) on purchase payments and redemption/exchange fees; and (2) ongoing costs, including management fees; distribution and service (12b-1) fees; and other fund expenses. This example is intended to help you understand your ongoing costs (in dollars) of investing in your fund and to compare these costs with the ongoing cost of investing in other mutual funds.
The example is based on an investment of $1,000 made at the beginning of the period and held for the entire period from July 1, 2022 to December 31, 2022.
Actual Expenses
The table provides information about actual account values and actual expenses for each class. You may use the information, together with the amount you invested, to estimate the expenses that you paid over the period. First, identify the share class you own. Then simply divide your account value by $1,000 (for example, an $8,600 account value divided by $1,000 = 8.6), then multiply the result by the number under the heading “Expenses Paid During Period” to estimate the expenses you paid on your account during this period.
Hypothetical Example for Comparison Purposes
The table also provides information about hypothetical account values and hypothetical expenses based on the actual expense ratio of each class of your fund and an assumed rate of return of 5% per year before expenses, which is not the actual return of a fund’s share class. The hypothetical account values and expenses may not be used to estimate the actual ending account balance or expenses you paid for the period. You may use this information to compare the ongoing costs of investing in your fund and other funds. To do so, compare this 5% hypothetical example with the 5% hypothetical examples that appear in the shareholder reports of the other funds.
Please note that the expenses shown in the table are meant to highlight your ongoing costs only and do not reflect any transactional costs, such as sales charges (loads) or redemption/exchange fees. Therefore, the table is useful in comparing ongoing costs only, and will not help you determine the relative total costs of owning different funds. In addition, if these transactional costs were included, your costs would have been higher.
| | | | | | | | | | | | | | |
| Beginning
Account Value
7/1/22 | Ending
Account Value
12/31/22 | Expenses Paid During Period(1) 7/1/22 - 12/31/22 | Annualized Expense Ratio(1) |
| Actual | | | | |
| Class I | $1,000 | $1,045.00 | $5.10 | 0.99% |
| Class II | $1,000 | $1,043.90 | $5.87 | 1.14% |
| Hypothetical | | | | |
| Class I | $1,000 | $1,020.22 | $5.04 | 0.99% |
| Class II | $1,000 | $1,019.46 | $5.80 | 1.14% |
(1)Expenses are equal to the class's annualized expense ratio listed in the table above, multiplied by the average account value over the period, multiplied by 184, the number of days in the most recent fiscal half-year, divided by 365, to reflect the one-half year period. Annualized expense ratio reflects actual expenses, including any applicable fee waivers or expense reimbursements and excluding any acquired fund fees and expenses.
DECEMBER 31, 2022
| | | | | | | | |
| Shares | Value |
| COMMON STOCKS — 99.8% | | |
| Australia — 3.2% | | |
| CSL Ltd. | 21,470 | | $ | 4,186,524 | |
NEXTDC Ltd.(1) | 169,930 | | 1,048,571 | |
| | 5,235,095 | |
| Belgium — 1.1% | | |
| KBC Group NV | 27,280 | | 1,756,430 | |
| Brazil — 0.4% | | |
| Sendas Distribuidora SA | 191,700 | | 708,402 | |
| Canada — 4.8% | | |
Canadian Pacific Railway Ltd.(2) | 37,440 | | 2,791,409 | |
Element Fleet Management Corp.(2) | 104,830 | | 1,428,444 | |
| First Quantum Minerals Ltd. | 52,340 | | 1,093,573 | |
| GFL Environmental, Inc. | 52,512 | | 1,534,926 | |
| Toronto-Dominion Bank | 12,530 | | 811,304 | |
| | 7,659,656 | |
| China — 1.7% | | |
| H World Group Ltd., ADR | 24,760 | | 1,050,319 | |
| Li Ning Co. Ltd. | 206,000 | | 1,771,394 | |
| | 2,821,713 | |
| Denmark — 4.7% | | |
| Novo Nordisk A/S, B Shares | 55,336 | | 7,515,490 | |
| Finland — 0.2% | | |
| Neste Oyj | 6,820 | | 314,518 | |
| France — 20.6% | | |
| Air Liquide SA | 20,959 | | 2,974,822 | |
| Airbus SE | 14,830 | | 1,763,322 | |
| Arkema SA | 7,780 | | 699,771 | |
| Bureau Veritas SA | 47,806 | | 1,259,878 | |
| Capgemini SE | 11,900 | | 1,989,394 | |
| Dassault Systemes SE | 41,810 | | 1,503,473 | |
| Edenred | 36,357 | | 1,978,743 | |
| EssilorLuxottica SA | 9,210 | | 1,666,393 | |
| Hermes International | 670 | | 1,037,060 | |
| L'Oreal SA | 5,430 | | 1,944,470 | |
| LVMH Moet Hennessy Louis Vuitton SE | 7,240 | | 5,268,493 | |
| Pernod Ricard SA | 11,200 | | 2,203,291 | |
| Safran SA | 9,480 | | 1,187,406 | |
| Sartorius Stedim Biotech | 3,660 | | 1,189,383 | |
| Schneider Electric SE | 23,580 | | 3,311,447 | |
| Teleperformance | 2,130 | | 509,209 | |
| Thales SA | 15,650 | | 1,999,581 | |
| Valeo | 43,290 | | 773,498 | |
| | 33,259,634 | |
| Germany — 5.5% | | |
| Brenntag SE | 13,870 | | 884,557 | |
| Infineon Technologies AG | 59,823 | | 1,818,134 | |
| Mercedes-Benz Group AG | 23,830 | | 1,558,360 | |
| | | | | | | | |
| Shares | Value |
| Puma SE | 28,880 | | $ | 1,745,601 | |
| Symrise AG | 26,860 | | 2,917,130 | |
| | 8,923,782 | |
| Hong Kong — 3.7% | | |
| AIA Group Ltd. | 381,600 | | 4,214,155 | |
| Hong Kong Exchanges & Clearing Ltd. | 20,800 | | 893,781 | |
| Techtronic Industries Co. Ltd. | 84,000 | | 932,974 | |
| | 6,040,910 | |
| India — 0.8% | | |
| HDFC Bank Ltd. | 62,120 | | 1,218,394 | |
| Indonesia — 0.8% | | |
| Bank Central Asia Tbk PT | 2,218,800 | | 1,216,652 | |
| Ireland — 3.0% | | |
| CRH PLC | 33,170 | | 1,319,175 | |
ICON PLC(1) | 8,040 | | 1,561,770 | |
| Kerry Group PLC, A Shares | 21,970 | | 1,984,555 | |
| | 4,865,500 | |
| Italy — 4.6% | | |
| Ferrari NV | 15,600 | | 3,345,238 | |
| Prysmian SpA | 46,640 | | 1,732,933 | |
| Tenaris SA | 129,770 | | 2,275,867 | |
| | 7,354,038 | |
| Japan — 11.0% | | |
| BayCurrent Consulting, Inc. | 52,400 | | 1,631,211 | |
| Hoya Corp. | 18,400 | | 1,762,325 | |
| JMDC, Inc. | 27,200 | | 780,242 | |
| Keyence Corp. | 7,800 | | 3,028,307 | |
| Kobe Bussan Co. Ltd. | 75,700 | | 2,181,763 | |
Kose Corp.(2) | 13,000 | | 1,412,492 | |
MonotaRO Co. Ltd.(2) | 132,500 | | 1,866,379 | |
| Nintendo Co. Ltd. | 55,400 | | 2,329,380 | |
| Obic Co. Ltd. | 10,900 | | 1,600,219 | |
| Recruit Holdings Co. Ltd. | 37,600 | | 1,176,954 | |
| | 17,769,272 | |
| Netherlands — 6.7% | | |
Adyen NV(1) | 1,458 | | 2,024,067 | |
| ASML Holding NV | 8,500 | | 4,634,639 | |
| Koninklijke DSM NV | 11,155 | | 1,369,773 | |
| Universal Music Group NV | 113,420 | | 2,742,797 | |
| | 10,771,276 | |
| Spain — 4.1% | | |
Amadeus IT Group SA(1) | 17,700 | | 918,236 | |
| Cellnex Telecom SA | 66,316 | | 2,199,782 | |
| Iberdrola SA | 300,161 | | 3,503,926 | |
| | 6,621,944 | |
| Sweden — 1.5% | | |
| Epiroc AB, A Shares | 62,750 | | 1,142,622 | |
| Hexagon AB, B Shares | 120,860 | | 1,267,227 | |
| | 2,409,849 | |
| Switzerland — 6.9% | | |
| Alcon, Inc. | 33,852 | | 2,322,889 | |
| Lonza Group AG | 5,620 | | 2,758,720 | |
| | | | | | | | |
| Shares | Value |
On Holding AG, Class A(1) | 35,700 | | $ | 612,612 | |
| Partners Group Holding AG | 540 | | 478,161 | |
| Sika AG | 8,741 | | 2,101,364 | |
| Zurich Insurance Group AG | 5,800 | | 2,772,848 | |
| | 11,046,594 | |
| Taiwan — 0.5% | | |
| Taiwan Semiconductor Manufacturing Co. Ltd. | 58,000 | | 842,361 | |
| Thailand — 0.7% | | |
| Kasikornbank PCL | 257,000 | | 1,092,571 | |
| United Kingdom — 13.3% | | |
| Ashtead Group PLC | 20,730 | | 1,177,563 | |
| AstraZeneca PLC | 39,870 | | 5,395,183 | |
| Compass Group PLC | 116,570 | | 2,691,837 | |
| Halma PLC | 39,710 | | 945,691 | |
HSBC Holdings PLC(2) | 497,600 | | 3,092,225 | |
| London Stock Exchange Group PLC | 25,341 | | 2,177,329 | |
| NatWest Group PLC | 474,278 | | 1,512,582 | |
| Reckitt Benckiser Group PLC | 29,731 | | 2,060,843 | |
| Segro PLC | 138,380 | | 1,274,792 | |
| Whitbread PLC | 36,276 | | 1,121,601 | |
| | 21,449,646 | |
TOTAL COMMON STOCKS (Cost $138,275,460) | | 160,893,727 | |
| SHORT-TERM INVESTMENTS — 2.9% | | |
| Money Market Funds — 2.8% | | |
| State Street Institutional U.S. Government Money Market Fund, Premier Class | 100,528 | | 100,528 | |
State Street Navigator Securities Lending Government Money Market Portfolio(3) | 4,348,959 | | 4,348,959 | |
| | 4,449,487 | |
| Repurchase Agreements — 0.1% | | |
| BMO Capital Markets Corp., (collateralized by various U.S. Treasury obligations, 0.375% - 0.50%, 9/15/24 - 5/31/27, valued at $35,670), in a joint trading account at 4.20%, dated 12/30/22, due 1/3/23 (Delivery value $35,025) | | 35,009 | |
| Fixed Income Clearing Corp., (collateralized by various U.S. Treasury obligations, 2.75%, 11/15/47, valued at $219,300), at 4.26%, dated 12/30/22, due 1/3/23 (Delivery value $215,102) | | 215,000 | |
| | 250,009 | |
TOTAL SHORT-TERM INVESTMENTS (Cost $4,699,496) | | 4,699,496 | |
TOTAL INVESTMENT SECURITIES—102.7% (Cost $142,974,956) | | 165,593,223 | |
| OTHER ASSETS AND LIABILITIES — (2.7)% | | (4,401,911) | |
| TOTAL NET ASSETS — 100.0% | | $ | 161,191,312 | |
| | | | | |
| MARKET SECTOR DIVERSIFICATION | |
| (as a % of net assets) | |
| Health Care | 18.1% |
| Industrials | 15.4% |
| Information Technology | 14.6% |
| Financials | 14.1% |
| Consumer Discretionary | 13.2% |
| Consumer Staples | 7.7% |
| Materials | 7.7% |
| Communication Services | 4.4% |
| Utilities | 2.2% |
| Energy | 1.6% |
| Real Estate | 0.8% |
| Short-Term Investments | 2.9% |
| Other Assets and Liabilities | (2.7)% |
| | | | | | | | |
| NOTES TO SCHEDULE OF INVESTMENTS |
| ADR | – | American Depositary Receipt |
(1)Non-income producing.
(2)Security, or a portion thereof, is on loan. At the period end, the aggregate value of securities on loan was $9,444,667. The amount of securities on loan indicated may not correspond with the securities on loan identified because securities with pending sales are in the process of recall from the brokers.
(3)Investment of cash collateral from securities on loan. At the period end, the aggregate value of the collateral held by the fund was $9,965,255, which includes securities collateral of $5,616,296.
See Notes to Financial Statements.
| | |
| Statement of Assets and Liabilities |
| | | | | |
| DECEMBER 31, 2022 | |
| Assets | |
| Investment securities, at value (cost of $138,625,997) — including $9,444,667 of securities on loan | $ | 161,244,264 | |
| Investment made with cash collateral received for securities on loan, at value (cost of $4,348,959) | 4,348,959 | |
| Total investment securities, at value (cost of $142,974,956) | 165,593,223 | |
| Foreign currency holdings, at value (cost of $107,614) | 107,938 | |
| Receivable for capital shares sold | 3,977 | |
| Dividends and interest receivable | 356,959 | |
| Securities lending receivable | 797 | |
| Other assets | 12,296 | |
| 166,075,190 | |
| |
| Liabilities | |
| Payable for collateral received for securities on loan | 4,348,959 | |
| Payable for investments purchased | 157,631 | |
| Payable for capital shares redeemed | 162,809 | |
| Accrued management fees | 131,326 | |
| Distribution fees payable | 7,591 | |
| Accrued foreign taxes | 55,880 | |
| Accrued foreign withholding tax reclaim expenses | 13,673 | |
| Accrued other expenses | 6,009 | |
| 4,883,878 | |
| |
| Net Assets | $ | 161,191,312 | |
| |
| Net Assets Consist of: | |
| Capital (par value and paid-in surplus) | $ | 143,002,902 | |
| Distributable earnings | 18,188,410 | |
| $ | 161,191,312 | |
| | | | | | | | | | | |
| Net Assets | Shares Outstanding | Net Asset Value Per Share |
| Class I, $0.01 Par Value | $126,116,935 | 13,239,899 | $9.53 |
| Class II, $0.01 Par Value | $35,074,377 | 3,689,021 | $9.51 |
See Notes to Financial Statements.
| | | | | |
| YEAR ENDED DECEMBER 31, 2022 | |
| Investment Income (Loss) | |
| Income: | |
| Dividends (net of foreign taxes withheld of $316,517) | $ | 3,112,239 | |
| Foreign withholding tax recoveries | 782,940 | |
| Interest | 226,991 | |
| Securities lending, net | 16,302 | |
| 4,138,472 | |
| |
| Expenses: | |
| Management fees | 1,794,940 | |
| Distribution fees - Class II | 95,389 | |
| Directors' fees and expenses | 4,800 | |
| Foreign withholding tax reclaim expenses | 224,695 | |
| Other expenses | 8,325 | |
| 2,128,149 | |
Fees waived(1) | (172,933) | |
| 1,955,216 | |
| |
| Net investment income (loss) | 2,183,256 | |
| |
| Realized and Unrealized Gain (Loss) | |
| Net realized gain (loss) on: | |
| Investment transactions (net of foreign tax expenses paid (refunded) of $26,938) | (6,232,453) | |
| Foreign currency translation transactions | (122,212) | |
| (6,354,665) | |
| |
| Change in net unrealized appreciation (depreciation) on: | |
| Investments (includes (increase) decrease in accrued foreign taxes of $36,309) | (51,408,820) |
| Translation of assets and liabilities in foreign currencies | (19,300) | |
| (51,428,120) | |
| |
| Net realized and unrealized gain (loss) | (57,782,785) | |
| |
| Net Increase (Decrease) in Net Assets Resulting from Operations | $ | (55,599,529) | |
(1)Amount consists of $134,778 and $38,155 for Class I and Class II, respectively.
See Notes to Financial Statements.
| | |
| Statement of Changes in Net Assets |
| | | | | | | | |
| YEARS ENDED DECEMBER 31, 2022 AND DECEMBER 31, 2021 |
| Increase (Decrease) in Net Assets | December 31, 2022 | December 31, 2021 |
| Operations | | |
| Net investment income (loss) | $ | 2,183,256 | | $ | 2,055,462 | |
| Net realized gain (loss) | (6,354,665) | | 27,338,944 | |
| Change in net unrealized appreciation (depreciation) | (51,428,120) | | (10,122,837) | |
| Net increase (decrease) in net assets resulting from operations | (55,599,529) | | 19,271,569 | |
| | |
| Distributions to Shareholders | | |
| From earnings: | | |
| Class I | (22,559,900) | | (5,364,716) | |
| Class II | (6,497,244) | | (1,428,046) | |
| Decrease in net assets from distributions | (29,057,144) | | (6,792,762) | |
| | |
| Capital Share Transactions | | |
| Net increase (decrease) in net assets from capital share transactions (Note 5) | 19,660,016 | | (10,048,205) | |
| | |
| Net increase (decrease) in net assets | (64,996,657) | | 2,430,602 | |
| | |
| Net Assets | | |
| Beginning of period | 226,187,969 | | 223,757,367 | |
| End of period | $ | 161,191,312 | | $ | 226,187,969 | |
See Notes to Financial Statements.
| | |
| Notes to Financial Statements |
DECEMBER 31, 2022
1. Organization
American Century Variable Portfolios, Inc. (the corporation) is registered under the Investment Company Act of 1940, as amended (the 1940 Act), as an open-end management investment company and is organized as a Maryland corporation. VP International Fund (the fund) is one fund in a series issued by the corporation. The fund’s investment objective is to seek capital growth. The fund offers Class I and Class II.
2. Significant Accounting Policies
The following is a summary of significant accounting policies consistently followed by the fund in preparation of its financial statements. The fund is an investment company and follows accounting and reporting guidance in accordance with accounting principles generally accepted in the United States of America. This may require management to make certain estimates and assumptions at the date of the financial statements. Actual results could differ from these estimates. Management evaluated the impact of events or transactions occurring through the date the financial statements were issued that would merit recognition or disclosure.
Investment Valuations — The fund determines the fair value of its investments and computes its net asset value (NAV) per share at the close of regular trading (usually 4 p.m. Eastern time) on the New York Stock Exchange (NYSE) on each day the NYSE is open. The value of investments of the fund is determined by American Century Investment Management, Inc. (ACIM) (the investment advisor), as the valuation designee, pursuant to its valuation policies and procedures. The Board of Directors oversees the valuation designee and reviews its valuation policies and procedures at least annually.
Equity securities that are listed or traded on a domestic securities exchange are valued at the last reported sales price or at the official closing price as provided by the exchange. Equity securities traded on foreign securities exchanges are generally valued at the closing price of such securities on the exchange where primarily traded or at the close of the NYSE, if that is earlier. If no last sales price is reported, or if local convention or regulation so provides, the mean of the latest bid and asked prices may be used. Securities traded over-the-counter are valued at the mean of the latest bid and asked prices, the last sales price, or the official closing price. Equity securities initially expressed in local currencies are translated into U.S. dollars at the mean of the appropriate currency exchange rate at the close of the NYSE as provided by an independent pricing service.
Open-end management investment companies are valued at the reported NAV per share. Repurchase agreements are valued at cost, which approximates fair value.
If the valuation designee determines that the market price for a portfolio security is not readily available or is believed by the valuation designee to be unreliable, such security is valued at fair value as determined in good faith by the valuation designee, in accordance with its policies and procedures. Circumstances that may cause the fund to determine that market quotations are not available or reliable include, but are not limited to: when there is a significant event subsequent to the market quotation; trading in a security has been halted during the trading day; or trading in a security is insufficient or did not take place due to a closure or holiday.
The valuation designee monitors for significant events occurring after the close of an investment’s primary exchange but before the fund’s NAV per share is determined. Significant events may include, but are not limited to: corporate announcements and transactions; regulatory news, governmental action and political unrest that could impact a specific investment or an investment sector; or armed conflicts, natural disasters and similar events that could affect investments in a specific country or region. The valuation designee also monitors for significant fluctuations between domestic and foreign markets, as evidenced by the U.S. market or such other indicators that it deems appropriate. The valuation designee may apply a model-derived factor to the closing price of equity securities traded on foreign securities exchanges. The factor is based on observable market data as provided by an independent pricing service.
Security Transactions — Security transactions are accounted for as of the trade date. Net realized gains and losses are determined on the identified cost basis, which is also used for federal income tax purposes. Certain countries impose taxes on realized gains on the sale of securities registered in their country. The fund records the foreign tax expense, if any, on an accrual basis. The foreign tax expense on realized gains and unrealized appreciation reduces the net realized gain (loss) on investment transactions and net unrealized appreciation (depreciation) on investments, respectively.
Investment Income — Dividend income less foreign taxes withheld, if any, is recorded as of the ex-dividend date. Distributions received on securities that represent a return of capital or long-term capital gain are recorded as a reduction of cost of investments and/or as a realized gain. The fund may estimate the components of distributions received that may be considered nontaxable distributions or long-term capital gain distributions for income tax purposes. Interest income is recorded on the accrual basis and includes accretion of discounts and amortization of premiums. Securities lending income is net of fees and rebates earned by the lending agent for its services. Foreign withholding tax recoveries represent the receipt of certain European Union (EU) withholding taxes previously withheld. The fund will record any EU reclaims only when certainty exists as to the likelihood of receipt.
Foreign Currency Translations — All assets and liabilities initially expressed in foreign currencies are translated into U.S. dollars at prevailing exchange rates at period end. The fund may enter into spot foreign currency exchange contracts to facilitate transactions denominated in a foreign currency. Purchases and sales of investment securities, dividend and interest income, spot foreign currency exchange contracts, and expenses are translated at the rates of exchange prevailing on the respective dates of such transactions. Net realized and unrealized foreign currency exchange gains or losses related to investment securities are a component of net realized gain (loss) on investment transactions and change in net unrealized appreciation (depreciation) on investments, respectively.
Repurchase Agreements — The fund may enter into repurchase agreements with institutions that ACIM has determined are creditworthy pursuant to criteria adopted by the Board of Directors. The fund requires that the collateral, represented by securities, received in a repurchase transaction be transferred to the custodian in a manner sufficient to enable the fund to obtain those securities in the event of a default under the repurchase agreement. ACIM monitors, on a daily basis, the securities transferred to ensure the value, including accrued interest, of the securities under each repurchase agreement is equal to or greater than amounts owed to the fund under each repurchase agreement.
Joint Trading Account — Pursuant to an Exemptive Order issued by the Securities and Exchange Commission, the fund, along with certain other funds in the American Century Investments family of funds, may transfer uninvested cash balances into a joint trading account. These balances are invested in one or more repurchase agreements that are collateralized by U.S. Treasury or Agency obligations.
Segregated Assets — In accordance with the 1940 Act, the fund segregates assets on its books and records to cover certain types of investment securities and other financial instruments. ACIM monitors, on a daily basis, the securities segregated to ensure the fund designates a sufficient amount of liquid assets, marked-to-market daily. The fund may also receive assets or be required to pledge assets at the custodian bank or with a broker for collateral requirements. The fund may incur charges or earn income on posted collateral balances, which are reflected in interest expenses or interest income, respectively.
Income Tax Status — It is the fund's policy to distribute substantially all net investment income and net realized gains to shareholders and to otherwise qualify as a regulated investment company under provisions of the Internal Revenue Code. Accordingly, no provision has been made for income taxes. The fund files U.S. federal, state, local and non-U.S. tax returns as applicable. The fund's tax returns are subject to examination by the relevant taxing authority until expiration of the applicable statute of limitations, which is generally three years from the date of filing but can be longer in certain jurisdictions. At this time, management believes there are no uncertain tax positions which, based on their technical merit, would not be sustained upon examination and for which it is reasonably possible that the total amounts of unrecognized tax benefits will significantly change in the next twelve months.
Multiple Class — All shares of the fund represent an equal pro rata interest in the net assets of the class to which such shares belong, and have identical voting, dividend, liquidation and other rights and the same terms and conditions, except for class specific expenses and exclusive rights to vote on matters affecting only individual classes. Income, non-class specific expenses, and realized and unrealized capital gains and losses of the fund are allocated to each class of shares based on their relative net assets.
Distributions to Shareholders — Distributions from net investment income and net realized gains, if any, are generally declared and paid annually.
Indemnifications — Under the corporation’s organizational documents, its officers and directors are indemnified against certain liabilities arising out of the performance of their duties to the fund. In addition, in the normal course of business, the fund enters into contracts that provide general indemnifications. The maximum exposure under these arrangements is unknown as this would involve future claims that may be made against a fund. The risk of material loss from such claims is considered by management to be remote.
Securities Lending — Securities are lent to qualified financial institutions and brokers. State Street Bank & Trust Co. serves as securities lending agent to the fund pursuant to a Securities Lending Agreement. The lending of securities exposes the fund to risks such as: the borrowers may fail to return the loaned securities, the borrowers may not be able to provide additional collateral, the fund may experience delays in recovery of the loaned securities or delays in access to collateral, or the fund may experience losses related to the investment collateral. To minimize certain risks, loan counterparties pledge collateral in the form of cash and/or securities. The lending agent has agreed to indemnify the fund in the case of default of any securities borrowed. Cash collateral received is invested in the State Street Navigator Securities Lending Government Money Market Portfolio, a money market mutual fund registered under the 1940 Act. The loans may also be secured by U.S. government securities in an amount at least equal to the market value of the securities loaned, plus accrued interest and dividends, determined on a daily basis and adjusted accordingly. By lending securities, the fund seeks to increase its net investment income through the receipt of interest and fees. Such income is reflected separately within the Statement of Operations. The value of loaned securities and related collateral outstanding at period end, if any, are shown on a gross basis within the Schedule of Investments and Statement of Assets and Liabilities.
The following table reflects a breakdown of transactions accounted for as secured borrowings, the gross obligation by the type of collateral pledged, and the remaining contractual maturity of those transactions as of December 31, 2022.
| | | | | | | | | | | | | | | | | |
| Remaining Contractual Maturity of Agreements |
| Overnight and Continuous | <30 days | Between 30 & 90 days | >90 days | Total |
Securities Lending Transactions(1) | | | | |
| Common Stocks | $ | 4,348,959 | | — | | — | | — | | $ | 4,348,959 | |
| Gross amount of recognized liabilities for securities lending transactions | $ | 4,348,959 | |
(1)Amount represents the payable for cash collateral received for securities on loan. This will generally be in the Overnight and Continuous column as the securities are typically callable on demand.
3. Fees and Transactions with Related Parties
Certain officers and directors of the corporation are also officers and/or directors of American Century Companies, Inc. (ACC). The corporation's investment advisor, ACIM, the corporation's distributor, American Century Investment Services, Inc. (ACIS), and the corporation's transfer agent, American Century Services, LLC, are wholly owned, directly or indirectly, by ACC.
Management Fees — The corporation has entered into a management agreement with ACIM, under which ACIM provides the fund with investment advisory and management services in exchange for a single, unified management fee (the fee) per class. The agreement provides that ACIM will pay all expenses of managing and operating the fund, except brokerage expenses, taxes, interest, fees and expenses of the independent directors (including legal counsel fees), extraordinary expenses, and expenses incurred in connection with the provision of shareholder services and distribution services under a plan adopted pursuant to Rule 12b-1 under the 1940 Act. The fee is computed and accrued daily based on each class's daily net assets and paid monthly in arrears. The difference in the fee among the classes is a result of their separate arrangements for non-Rule 12b-1 shareholder services. It is not the result of any difference in advisory or custodial fees or other expenses related to the management of the fund’s assets, which do not vary by class. The rate of the fee is determined by applying a fee rate calculation formula. This formula takes into account the fund’s assets as well as certain assets, if any, of other clients of the investment advisor outside the American Century Investments family of funds (such as subadvised funds and separate accounts), as well as exchange-traded funds managed by the investment advisor, that use very similar investment teams and strategies (strategy assets). During the period ended December 31, 2022, the investment advisor agreed to waive 0.10% of the fund's management fee. The investment advisor expects this waiver to continue until July 31, 2023 and cannot terminate it prior to such date without the approval of the Board of Directors.
The management fee schedule range and the effective annual management fee before and after waiver for each class for the period ended December 31, 2022 are as follows:
| | | | | | | | | | | |
| Management Fee
Schedule Range | Effective Annual Management Fee |
| Before Waiver | After Waiver |
| Class I | 1.00% to 1.06% | 1.06% | 0.96% |
| Class II | 0.90% to 0.96% | 0.96% | 0.86% |
Distribution Fees — The Board of Directors has adopted the Master Distribution Plan (the plan) for Class II, pursuant to Rule 12b-1 of the 1940 Act. The plan provides that Class II will pay ACIS an annual distribution fee equal to 0.25%. The fee is computed and accrued daily based on the Class II daily net assets and paid monthly in arrears. The distribution fee provides compensation for expenses incurred in connection with distributing shares of Class II including, but not limited to, payments to brokers, dealers, and financial institutions that have entered into sales agreements with respect to shares of the fund. Fees incurred under the plan during the period ended December 31, 2022 are detailed in the Statement of Operations.
Directors' Fees and Expenses — The Board of Directors is responsible for overseeing the investment advisor’s management and operations of the fund. The directors receive detailed information about the fund and its investment advisor regularly throughout the year, and meet at least quarterly with management of the investment advisor to review reports about fund operations. The fund's officers do not receive compensation from the fund.
Foreign Withholding Tax Reclaim Expenses — The fund may file withholding tax reclaims in certain jurisdictions to recover a portion of amounts previously withheld. The fund may incur expenses in association with recovery of such taxes. The impact of foreign withholding tax reclaim expenses to the ratio of operating expenses to average net assets was 0.13% for the period ended December 31, 2022.
Interfund Transactions — The fund may enter into security transactions with other American Century Investments funds and other client accounts of the investment advisor, in accordance with the 1940 Act rules and procedures adopted by the Board of Directors. The rules and procedures require, among other things, that these transactions be effected at the independent current market price of the security. During the period, the interfund purchases and sales were $148,844 and $729,957, respectively. The effect of interfund transactions on the Statement of Operations was $(382,427) in net realized gain (loss) on investment transactions.
4. Investment Transactions
Purchases and sales of investment securities, excluding short-term investments, for the period ended December 31, 2022 were $68,846,463 and $74,018,319, respectively.
5. Capital Share Transactions
Transactions in shares of the fund were as follows:
| | | | | | | | | | | | | | |
| Year ended
December 31, 2022 | Year ended
December 31, 2021 |
| Shares | Amount | Shares | Amount |
| Class I/Shares Authorized | 200,000,000 | | | 200,000,000 | | |
| Sold | 1,091,781 | | $ | 11,182,450 | | 755,750 | | $ | 11,017,680 | |
| Issued in reinvestment of distributions | 2,010,686 | | 22,559,900 | | 390,729 | | 5,364,716 | |
| Redeemed | (1,691,407) | | (17,745,429) | | (1,774,403) | | (26,016,890) | |
| 1,411,060 | | 15,996,921 | | (627,924) | | (9,634,494) | |
| Class II/Shares Authorized | 100,000,000 | | | 100,000,000 | | |
| Sold | 201,701 | | 2,111,733 | | 293,665 | | 4,306,392 | |
| Issued in reinvestment of distributions | 579,594 | | 6,497,244 | | 104,085 | | 1,428,046 | |
| Redeemed | (492,230) | | (4,945,882) | | (419,140) | | (6,148,149) | |
| 289,065 | | 3,663,095 | | (21,390) | | (413,711) | |
| Net increase (decrease) | 1,700,125 | | $ | 19,660,016 | | (649,314) | | $ | (10,048,205) | |
6. Fair Value Measurements
The fund's investments valuation process is based on several considerations and may use multiple inputs to determine the fair value of the investments held by the fund. In conformity with accounting principles generally accepted in the United States of America, the inputs used to determine a valuation are classified into three broad levels.
•Level 1 valuation inputs consist of unadjusted quoted prices in an active market for identical investments.
•Level 2 valuation inputs consist of direct or indirect observable market data (including quoted prices for comparable investments, evaluations of subsequent market events, interest rates, prepayment speeds, credit risk, etc.). These inputs also consist of quoted prices for identical investments initially expressed in local currencies that are adjusted through translation into U.S. dollars.
•Level 3 valuation inputs consist of unobservable data (including a fund’s own assumptions).
The level classification is based on the lowest level input that is significant to the fair valuation measurement. The valuation inputs are not necessarily an indication of the risks associated with investing in these securities or other financial instruments.
The following is a summary of the level classifications as of period end. The Schedule of Investments provides additional information on the fund's portfolio holdings.
| | | | | | | | | | | |
| Level 1 | Level 2 | Level 3 |
| Assets | | | |
| Investment Securities | | | |
| Common Stocks | $ | 4,759,627 | | $ | 156,134,100 | | — | |
| Short-Term Investments | 4,449,487 | | 250,009 | | — | |
| $ | 9,209,114 | | $ | 156,384,109 | | — | |
7. Risk Factors
The value of the fund’s shares will go up and down, sometimes rapidly or unpredictably, based on the performance of the securities owned by the fund and other factors generally affecting the securities market. Market risks, including political, regulatory, economic and social developments, can affect the value of the fund’s investments. Natural disasters, public health emergencies, war, terrorism and other unforeseeable events may lead to increased market volatility and may have adverse long-term effects on world economies and markets generally.
There are certain risks involved in investing in foreign securities. These risks include those resulting from political events (such as civil unrest, national elections and imposition of exchange controls), social and economic events (such as labor strikes and rising inflation), and natural disasters. Securities of foreign issuers may be less liquid and more volatile. Investing in emerging markets or a significant portion of assets in one country or region may accentuate these risks.
8. Federal Tax Information
The tax character of distributions paid during the years ended December 31, 2022 and December 31, 2021 were as follows:
| | | | | | | | |
| 2022 | 2021 |
| Distributions Paid From | | |
| Ordinary income | $ | 3,881,779 | | $ | 294,348 | |
| Long-term capital gains | $ | 25,175,365 | | $ | 6,498,414 | |
The book-basis character of distributions made during the year from net investment income or net realized gains may differ from their ultimate characterization for federal income tax purposes. These differences reflect the differing character of certain income items and net realized gains and losses for financial statement and tax purposes, and may result in reclassification among certain capital accounts on the financial statements.
As of period end, the federal tax cost of investments and the components of distributable earnings on a tax-basis were as follows:
| | | | | |
| Federal tax cost of investments | $ | 143,411,128 | |
| Gross tax appreciation of investments | $ | 34,139,437 | |
| Gross tax depreciation of investments | (11,957,342) | |
| Net tax appreciation (depreciation) of investments | 22,182,095 | |
| Net tax appreciation (depreciation) on translation of assets and liabilities in foreign currencies | (78,604) | |
| Net tax appreciation (depreciation) | $ | 22,103,491 | |
| Undistributed ordinary income | $ | 2,264,832 | |
| Accumulated short-term capital losses | $ | (6,179,913) | |
The difference between book-basis and tax-basis unrealized appreciation (depreciation) is attributable primarily to the realization to ordinary income for tax purposes of unrealized gains on investments in passive foreign investment companies.
Accumulated capital losses represent net capital loss carryovers that may be used to offset future realized capital gains for federal income tax purposes. The capital loss carryovers may be carried forward for an unlimited period. Future capital loss carryover utilization in any given year may be subject to Internal Revenue Code limitations.
| | | | | | | | | | | | | | | | | | | | | | | | | | | | | | | | | | | | | | | | | | | | | | | |
| For a Share Outstanding Throughout the Years Ended December 31 (except as noted) |
| Per-Share Data | | | | | | Ratios and Supplemental Data | |
| | Income From Investment Operations: | Distributions From: | | | Ratio to Average Net Assets of: | |
| Net Asset
Value,
Beginning
of Period | Net Investment Income (Loss)(1) | Net
Realized
and
Unrealized
Gain (Loss) | Total From
Investment
Operations | Net
Investment
Income | Net
Realized
Gains | Total
Distributions | Net Asset
Value,
End
of Period | Total Return(2) | Operating
Expenses | Operating
Expenses
(before
expense
waiver) | Net
Investment
Income
(Loss) | Net
Investment
Income (Loss) (before expense waiver) | Portfolio
Turnover
Rate | Net
Assets,
End of
Period
(in thousands) |
| Class I | | | | | | | | | | | | | | | |
| 2022 | $14.86 | 0.13 | (3.51) | (3.38) | (0.17) | (1.78) | (1.95) | $9.53 | (24.75)% | 1.10% | 1.20% | 1.29% | 1.19% | 40% | $126,117 | |
| 2021 | $14.10 | 0.14 | 1.05 | 1.19 | (0.02) | (0.41) | (0.43) | $14.86 | 8.75% | 1.04% | 1.29% | 0.92% | 0.67% | 47% | $175,756 | |
| 2020 | $11.50 | 0.02 | 2.81 | 2.83 | (0.06) | (0.17) | (0.23) | $14.10 | 25.88% | 1.00% | 1.36% | 0.21% | (0.15)% | 59% | $175,606 | |
| 2019 | $9.54 | 0.05 | 2.56 | 2.61 | (0.09) | (0.56) | (0.65) | $11.50 | 28.42% | 1.03% | 1.37% | 0.52% | 0.18% | 65% | $143,094 | |
| 2018 | $12.18 | 0.09 | (1.79) | (1.70) | (0.15) | (0.79) | (0.94) | $9.54 | (15.22)% | 1.04% | 1.37% | 0.78% | 0.45% | 66% | $117,384 | |
| Class II | | | | | | | | | | | | | | | |
| 2022 | $14.83 | 0.12 | (3.51) | (3.39) | (0.15) | (1.78) | (1.93) | $9.51 | (24.86)% | 1.25% | 1.35% | 1.14% | 1.04% | 40% | $35,074 | |
| 2021 | $14.07 | 0.11 | 1.06 | 1.17 | —(3) | (0.41) | (0.41) | $14.83 | 8.60% | 1.19% | 1.44% | 0.77% | 0.52% | 47% | $50,432 | |
| 2020 | $11.48 | 0.01 | 2.79 | 2.80 | (0.04) | (0.17) | (0.21) | $14.07 | 25.65% | 1.15% | 1.51% | 0.06% | (0.30)% | 59% | $48,151 | |
| 2019 | $9.53 | 0.04 | 2.55 | 2.59 | (0.08) | (0.56) | (0.64) | $11.48 | 28.14% | 1.18% | 1.52% | 0.37% | 0.03% | 65% | $41,227 | |
| 2018 | $12.16 | 0.07 | (1.78) | (1.71) | (0.13) | (0.79) | (0.92) | $9.53 | (15.29)% | 1.19% | 1.52% | 0.63% | 0.30% | 66% | $36,919 | |
| | |
| Notes to Financial Highlights |
(1)Computed using average shares outstanding throughout the period.
(2)Total returns are calculated based on the net asset value of the last business day. Total returns for periods less than one year are not annualized. The total returns presented do not include the fees and charges assessed with investments in variable insurance products, those charges are disclosed in the separate account prospectus. The inclusion of such fees and charges would lower total return.
(3)Per-share amount was less than $0.005.
See Notes to Financial Statements.
| | |
| Report of Independent Registered Public Accounting Firm |
To the Shareholders and the Board of Directors of American Century Variable Portfolios, Inc.:
Opinion on the Financial Statements and Financial Highlights
We have audited the accompanying statement of assets and liabilities, including the schedule of investments, of VP International Fund (the “Fund”), one of the funds constituting the American Century American Century Variable Portfolios, Inc., as of December 31, 2022, the related statement of operations for the year then ended, the statements of changes in net assets for each of the two years in the period then ended, the financial highlights for each of the five years in the period then ended, and the related notes. In our opinion, the financial statements and financial highlights present fairly, in all material respects, the financial position of VP International Fund of the American Century Variable Portfolios, Inc. as of December 31, 2022, and the results of its operations for the year then ended, the changes in its net assets for each of the two years in the period then ended, and the financial highlights for each of the five years in the period then ended, in conformity with accounting principles generally accepted in the United States of America.
Basis for Opinion
These financial statements and financial highlights are the responsibility of the Fund's management. Our responsibility is to express an opinion on the Fund’s financial statements and financial highlights based on our audits. We are a public accounting firm registered with the Public Company Accounting Oversight Board (United States) (PCAOB) and are required to be independent with respect to the Fund in accordance with the U.S. federal securities laws and the applicable rules and regulations of the Securities and Exchange Commission and the PCAOB.
We conducted our audits in accordance with the standards of the PCAOB. Those standards require that we plan and perform the audit to obtain reasonable assurance about whether the financial statements and financial highlights are free of material misstatement, whether due to error or fraud. The Fund is not required to have, nor were we engaged to perform, an audit of its internal control over financial reporting. As part of our audits, we are required to obtain an understanding of internal control over financial reporting but not for the purpose of expressing an opinion on the effectiveness of the Fund’s internal control over financial reporting. Accordingly, we express no such opinion.
Our audits included performing procedures to assess the risks of material misstatement of the financial statements and financial highlights, whether due to error or fraud, and performing procedures that respond to those risks. Such procedures included examining, on a test basis, evidence regarding the amounts and disclosures in the financial statements and financial highlights. Our audits also included evaluating the accounting principles used and significant estimates made by management, as well as evaluating the overall presentation of the financial statements and financial highlights. Our procedures included confirmation of securities owned as of December 31, 2022, by correspondence with the custodian and brokers; when replies were not received from brokers, we performed other auditing procedures. We believe that our audits provide a reasonable basis for our opinion.
/s/ Deloitte & Touche LLP
Kansas City, Missouri
February 10, 2023
We have served as the auditor of one or more American Century investment companies since 1997.
The Board of Directors
The individuals listed below serve as directors of the funds. Each director will continue to serve in this capacity until death, retirement, resignation or removal from office. The board has adopted a mandatory retirement age for directors who are not “interested persons,” as that term is defined in the Investment Company Act (independent directors). Independent directors shall retire on December 31 of the year in which they reach their 75th birthday.
Jonathan S. Thomas is an “interested person” because he currently serves as President and Chief Executive Officer of American Century Companies, Inc. (ACC), the parent company of American Century Investment Management, Inc. (ACIM or the advisor). The other directors (more than three-fourths of the total number) are independent. They are not employees, directors or officers of, and have no financial interest in, ACC or any of its wholly owned, direct or indirect, subsidiaries, including ACIM, American Century Investment Services, Inc. (ACIS) and American Century Services, LLC (ACS), and they do not have any other affiliations, positions or relationships that would cause them to be considered “interested persons” under the Investment Company Act. The directors serve in this capacity for seven (in the case of Jonathan S. Thomas, 16; and Stephen E. Yates, 8) registered investment companies in the American Century Investments family of funds.
The following table presents additional information about the directors. The mailing address for each director is 4500 Main Street, Kansas City, Missouri 64111.
| | | | | | | | | | | | | | | | | |
Name
(Year of Birth) | Position(s) Held with Funds | Length of Time Served | Principal Occupation(s) During Past 5 Years | Number of American Century Portfolios Overseen by Director | Other Directorships Held During Past 5 Years |
| Independent Directors | | |
Brian Bulatao
(1964) | Director | Since 2022 | Chief Administrative Officer, Activision Blizzard, Inc. (2021 to present); Under Secretary of State for Management, U.S. Department of State (2018 to 2021); Chief Operating Officer, Central Intelligence Agency (2017 to 2018) | 64 | None |
| Thomas W. Bunn (1953) | Director | Since 2017 | Retired | 64 | None |
Chris H. Cheesman
(1962)
| Director | Since 2019
| Retired. Senior Vice President & Chief Audit Executive, AllianceBernstein (1999 to 2018)
| 64 | Alleghany Corporation (2021 to 2022) |
Barry Fink
(1955) | Director | Since 2012 (independent since 2016) | Retired | 64 | None |
Rajesh K. Gupta
(1960)
| Director | Since 2019
| Partner Emeritus, SeaCrest Investment Management and SeaCrest Wealth Management (2019 to Present); Chief Executive Officer and Chief Investment Officer, SeaCrest Investment Management (2006 to 2019); Chief Executive Officer and Chief Investment Officer, SeaCrest Wealth Management (2008 to 2019) | 64 | None |
| | | | | | | | | | | | | | | | | |
Name
(Year of Birth) | Position(s) Held with Funds | Length of Time Served | Principal Occupation(s) During Past 5 Years | Number of American Century Portfolios Overseen by Director | Other Directorships Held During Past 5 Years |
| Independent Directors | | |
Lynn Jenkins
(1963)
| Director | Since 2019
| Consultant, LJ Strategies (2019 to present); United States Representative, U.S. House of Representatives (2009 to 2018) | 64 | MGP Ingredients, Inc. (2019 to 2021) |
Jan M. Lewis
(1957) | Director and Board Chair | Since 2011 (Board Chair since 2022) | Retired | 64 | None |
Gary C. Meltzer
(1963) | Director | Since 2022 | Advisor, Pontoro (2021 to present); Executive Advisor, Consultant and Investor, Harris Ariel Advisory LLC (2020 to present); Managing Partner, PricewaterhouseCoopers LLP (1985 to 2020) | 64 | ExcelFin Acquisition Corp., Apollo Realty Income Solutions, Inc. |
Stephen E. Yates
(1948) | Director | Since 2012 | Retired | 108 | None |
| Interested Director | |
Jonathan S. Thomas
(1963) | Director | Since 2007 | President and Chief Executive Officer, ACC (2007 to present). Also serves as Chief Executive Officer, ACS; Director, ACC and other ACC subsidiaries | 140 | None |
The Statement of Additional Information has additional information about the fund's directors and is available without charge, upon request, by calling 1-800-378-9878.
Officers
The following table presents certain information about the executive officers of the funds. Each officer serves as an officer for 16 (in the case of Robert J. Leach, 15) investment companies in the American Century family of funds. No officer is compensated for his or her service as an officer of the funds. The listed officers are interested persons of the funds and are appointed or re-appointed on an annual basis. The mailing address for each officer listed below is 4500 Main Street, Kansas City, Missouri 64111.
| | | | | | | | |
Name
(Year of Birth) | Offices with the Funds | Principal Occupation(s) During the Past Five Years |
Patrick Bannigan
(1965) | President since 2019 | Executive Vice President and Director, ACC (2012 to present); Chief Financial Officer, Chief Accounting Officer and Treasurer, ACC (2015 to present). Also serves as President, ACS; Vice President, ACIM; Chief Financial Officer, Chief Accounting Officer and/or Director, ACIM, ACS and other ACC subsidiaries |
R. Wes Campbell
(1974) | Chief Financial Officer and Treasurer since 2018 | Vice President, ACS, (2020 to present); Investment Operations and Investment Accounting, ACS (2000 to present) |
Amy D. Shelton
(1964) | Chief Compliance Officer and Vice President since 2014 | Chief Compliance Officer, American Century funds, (2014 to present); Chief Compliance Officer, ACIM (2014 to present); Chief Compliance Officer, ACIS (2009 to present). Also serves as Vice President, ACIS |
John Pak
(1968) | General Counsel and
Senior Vice President since 2021 | General Counsel and Senior Vice President, ACC (2021 to present); Also serves as General Counsel and Senior Vice President, ACIM, ACS and ACIS. Chief Legal Officer of Investment and Wealth Management, The Bank of New York Mellon (2014 to 2021) |
C. Jean Wade
(1964) | Vice President since 2012 | Senior Vice President, ACS (2017 to present); Vice President, ACS (2000 to 2017)
|
Robert J. Leach
(1966) | Vice President since 2006 | Vice President, ACS (2000 to present) |
David H. Reinmiller
(1963) | Vice President since 2000 | Attorney, ACC (1994 to present). Also serves as Vice President, ACIM and ACS |
Ward D. Stauffer
(1960) | Secretary since 2005 | Attorney, ACC (2003 to present) |
A special meeting of shareholders was held on October 13, 2022, to vote on the following proposal. The proposal received the required votes and was adopted. A summary of voting results is listed below.
To elect five directors to the Board of Directors of American Century Variable Portfolios, Inc.:
| | | | | | | | | | | |
| Affirmative | | Withhold |
| Brian Bulatao | $ | 2,607,537,119 | | | $ | 88,836,350 | |
| Chris H. Cheesman | $ | 2,619,879,519 | | | $ | 76,493,950 | |
| Rajesh K. Gupta | $ | 2,616,882,375 | | | $ | 79,491,094 | |
| Lynn M. Jenkins | $ | 2,607,769,137 | | | $ | 88,604,332 | |
| Gary C. Meltzer | $ | 2,616,158,906 | | | $ | 80,214,563 | |
The other directors whose term of office continued after the meeting include Jonathan S. Thomas, Thomas W. Bunn, Barry Fink, Jan M. Lewis, and Stephen E. Yates.
Proxy Voting Policies
A description of the policies that the fund's investment advisor uses in exercising the voting rights associated with the securities purchased and/or held by the fund is available without charge, upon request, by calling 1-800-378-9878. It is also available on American Century Investments’ website at americancentury.com/proxy and on the Securities and Exchange Commission’s website at sec.gov. Information regarding how the investment advisor voted proxies relating to portfolio securities during the most recent 12-month period ended June 30 is available on americancentury.com/proxy. It is also available at sec.gov.
Quarterly Portfolio Disclosure
The fund files its complete schedule of portfolio holdings with the Securities and Exchange Commission (SEC) for the first and third quarters of each fiscal year as an exhibit to its reports on Form N-PORT. These portfolio holdings are available on the fund's website at americancentury.com and, upon request, by calling 1-800-378-9878. The fund’s Form N-PORT reports are available on the SEC’s website at sec.gov.
Other Tax Information
The following information is provided pursuant to provisions of the Internal Revenue Code.
The fund hereby designates $1,419,350, as qualified short-term capital gain distributions for purposes of Internal Revenue Code Section 871 for the fiscal year ended December 31, 2022.
The fund hereby designates $25,175,365, or up to the maximum amount allowable, as long-term capital gain distributions (20% rate gain distributions) for the fiscal year ended December 31, 2022.
For the fiscal year ended December 31, 2022, the fund intends to pass through to shareholders foreign source income of $3,057,798 and foreign taxes paid of $258,136, or up to the maximum amount allowable, as a foreign tax credit. Foreign source income and foreign tax expense per outstanding share on December 31, 2022 are $0.1806 and $0.0152, respectively.
| | | | | | | | |
| |
| | |
| Contact Us | americancentury.com | |
| Automated Information Line | 1-800-345-8765 | |
| Investment Professional Service Representatives | 1-800-345-6488 | |
| Telecommunications Relay Service for the Deaf | 711 | |
| | |
| American Century Variable Portfolios, Inc. | |
| | |
Investment Advisor: American Century Investment Management, Inc. Kansas City, Missouri | |
| | |
| This report and the statements it contains are submitted for the general information of our shareholders. The report is not authorized for distribution to prospective investors unless preceded or accompanied by an effective prospectus. | |
| | |
©2023 American Century Proprietary Holdings, Inc. All rights reserved.
CL-ANN-91441 2302 | |
| | | | | |
| |
| Annual Report |
| |
| December 31, 2022 |
| |
| VP Large Company Value Fund |
| Class I (AVVIX) |
| Class II (AVVTX) |
| | | | | |
| Performance | |
| Portfolio Commentary | |
| Fund Characteristics | |
| Shareholder Fee Example | |
| Schedule of Investments | |
| Statement of Assets and Liabilities | |
| Statement of Operations | |
| Statement of Changes in Net Assets | |
| Notes to Financial Statements | |
| Financial Highlights | |
| Report of Independent Registered Public Accounting Firm | |
| Management | |
| |
| |
| Proxy Voting Results | |
| Additional Information | |
Any opinions expressed in this report reflect those of the author as of the date of the report, and do not necessarily represent the opinions of American Century Investments® or any other person in the American Century Investments organization. Any such opinions are subject to change at any time based upon market or other conditions and American Century Investments disclaims any responsibility to update such opinions. These opinions may not be relied upon as investment advice and, because investment decisions made by American Century Investments funds are based on numerous factors, may not be relied upon as an indication of trading intent on behalf of any American Century Investments fund. Security examples are used for representational purposes only and are not intended as recommendations to purchase or sell securities. Performance information for comparative indices and securities is provided to American Century Investments by third party vendors. To the best of American Century Investments’ knowledge, such information is accurate at the time of printing.
| | | | | | | | | | | | | | | | | | |
| Total Returns as of December 31, 2022 |
| | | | Average Annual Returns | |
| | Ticker
Symbol | 1 year | 5 years | 10 years | | Inception
Date |
| Class I | AVVIX | -0.26% | 7.87% | 10.29% | | 12/1/04 |
| Russell 1000 Value Index | — | -7.54% | 6.66% | 10.29% | | — |
| S&P 500 Index | — | -18.11% | 9.42% | 12.56% | | — |
| Class II | AVVTX | -0.46% | 7.70% | 10.12% | | 10/29/04 |
Fund returns would have been lower if a portion of the fees had not been waived.
The performance information presented does not include the fees and charges assessed with investments in variable insurance products, those charges are disclosed in the separate account prospectus. The inclusion of such fees and charges would lower performance.
Data presented reflect past performance. Past performance is no guarantee of future results. Current performance may be higher or lower than the performance shown. Total returns for periods less than one year are not annualized. Investment return and principal value will fluctuate, and redemption value may be more or less than original cost. Data assumes reinvestment of dividends and capital gains, and none of the charts reflect the deduction of taxes that a shareholder would pay on fund distributions or the redemption of fund shares. To obtain performance data current to the most recent month end, please call 1-800-345-6488 or visit americancentury.com. For additional information about the fund, please consult the prospectus.
| | |
| Growth of $10,000 Over 10 Years |
| $10,000 investment made December 31, 2012 |
| Performance for other share classes will vary due to differences in fee structure. |
| | | | | |
| Value on December 31, 2022 |
| Class I — $26,631 |
|
| Russell 1000 Value Index — $26,632 |
|
| S&P 500 Index — $32,654 |
|
| |
|
Ending value of Class I would have been lower if a portion of the fees had not been waived.
| | | | | |
| Total Annual Fund Operating Expenses |
| Class I | Class II |
| 0.82% | 0.97% |
The total annual fund operating expenses shown is as stated in the fund’s prospectus current as of the date of this report. The prospectus may vary from the expense ratio shown elsewhere in this report because it is based on a different time period, includes acquired fund fees and expenses, and, if applicable, does not include fee waivers or expense reimbursements.
Data presented reflect past performance. Past performance is no guarantee of future results. Current performance may be higher or lower than the performance shown. Total returns for periods less than one year are not annualized. Investment return and principal value will fluctuate, and redemption value may be more or less than original cost. Data assumes reinvestment of dividends and capital gains, and none of the charts reflect the deduction of taxes that a shareholder would pay on fund distributions or the redemption of fund shares. To obtain performance data current to the most recent month end, please call 1-800-345-6488 or visit americancentury.com. For additional information about the fund, please consult the prospectus.
Portfolio Managers: Brian Woglom, Philip Sundell and Adam Krenn
On December 31, 2022, Phillip Davidson retired from American Century Investments and left VP Large Company Value’s management team. In February 2022, Adam Krenn became a named portfolio manager on the fund.
Performance Summary
VP Large Company Value returned -0.46%* for the 12 months ended December 31, 2022. The fund’s benchmark, the Russell 1000 Value Index, returned -7.54% for the same time period. The fund’s return reflects operating expenses, while the index’s return does not.
Security selection in the financials, information technology and health care sectors positively impacted relative performance. The fund’s underweights to the information technology and real estate sectors relative to the benchmark, along with its overweights to financials and health care, also aided results. On the other hand, the fund’s underweight in the energy sector detracted from relative returns.
Financials, Information Technology and Health Care Contributed
Several of the fund’s holdings in the financials sector positively impacted performance, particularly in the insurance and capital markets industries. The Allstate Corp. was one of the fund’s top contributors. This insurance company announced accelerating price increases on its automobile policies, and some of Allstate’s costs continued to moderate. In turn, investors priced in higher levels of profitability. Aflac, a life insurance company, was another notable contributor. In general, life insurance stocks performed well due to higher interest rates and lower COVID-19 disruption.
Our choice of investments and the fund’s underweight in the information technology sector also helped returns. Lack of exposure to Intel was particularly beneficial. Intel’s shares were pressured by the company’s deteriorating operational performance, driven by weakening personal computer demand and competitive pressures. Intel has refocused on its margins and appears disciplined on capital expenditures, but we think it will take some time for these actions to positively impact its financials.
In the health care sector, several of the fund’s positions in the health care providers and services, pharmaceuticals and health care equipment and supplies industries contributed to performance. Zimmer Biomet Holdings was a top contributor. This medical device maker outperformed on higher procedure volumes and on investors’ expectations for easing supply chain-related pressures. In the pharmaceuticals industry, Johnson & Johnson outperformed due to the flight to safety that occurred as the market sold off.
France-based TotalEnergies was another key contributor. Shares of this integrated energy company outperformed as the markets welcomed the company’s strategic update presented at its analyst day. In addition, commodity prices remained supportive, boosting the company’s free cash flow generation.
Energy Underweight Detracted
Our bottom-up investment approach resulted in an underweight in the energy sector. Many energy
stocks delivered strong performance over the trailing 12-month period due to higher commodity
*All fund returns referenced in this commentary are for Class II shares. Fund returns would have been lower if a portion of the fees had not been waived. Performance for other share classes will vary due to differences in fee structure; when Class II performance exceeds that of the fund’s benchmark, other share classes may not. See page 2 for returns for all share classes.
prices, so the fund’s modest underweight in the sector detracted from relative results. As of the end of the reporting period, we own select energy stocks that we believe offer solid assets, strong balance sheets and management teams focused on delivering strong returns on capital.
While overall security selection in the health care sector aided the fund’s performance, Medtronic, a medical device company, was a key detractor. Its shares were pressured by disappointing results for its renal denervation trial. Renal denervation is a blood pressure treatment. Medtronic also announced weak earnings, driven by supply chain pressures and a slower-than-expected return in procedure volumes. However, elective procedure volumes are now at pre-COVID-19 levels, and we think the company can work through its supply chain challenges.
Other notable detractors included F5 and Advance Auto Parts. F5, an application services company, underperformed due to initial signs of an information technology spending slowdown in Europe. F5’s fiscal year 2023 guidance beat expectations, but the company predicted lower software growth than it originally expected. Advance Auto Parts, an automotive replacement parts retailer, underperformed after announcing weaker-than-expected earnings and a reduced cash flow outlook for fiscal year 2023. These results were impacted by higher-than-expected inventory needs to serve its commercial automotive repair customers.
Portfolio Positioning
The portfolio seeks to invest in companies where we believe the valuation does not reflect the quality and normal earnings power of the company. Our process is based on individual security selection, but broad themes have emerged.
We ended the reporting period with an overweight in the consumer staples sector relative to the benchmark. We hold select companies in the sector that we believe are trading at a discount to their intrinsic value. While input costs have risen in this inflationary environment, many consumer staples companies have been able to improve efficiencies and pass along rising costs through pricing without significantly impacting demand. We think these steps may lead to a positive inflection for select companies in 2023.
Our research has also led us to several health care stocks that we think offer compelling risk/reward profiles. We consider health care noncyclical because demand is less impacted by the economy’s performance. Therefore, in a slowing economy, we think patients seeking elective procedures after the COVID-19 disruption should provide support to medical device companies and service providers that are working through patient backlogs. Additionally, in a slowing economy, we expect the relatively inelastic demand for drugs to bolster the performance of pharmaceutical companies.
Conversely, we ended the period with underweights in real estate and communication services. Our metrics show that many real estate equities remain overvalued despite the market’s decline in 2022. Furthermore, rising interest rates tend to decrease the value of properties and increase borrowing costs. It has also been difficult for us to find communication services stocks that meet our investment criteria. According to our analysis, many companies in the communication services sector have volatile business models and higher levels of leverage.
| | | | | |
| DECEMBER 31, 2022 |
| Types of Investments in Portfolio | % of net assets |
| Common Stocks | 96.8% |
| Exchange-Traded Funds | 1.0% |
| Short-Term Investments | 1.8% |
| Other Assets and Liabilities | 0.4% |
| | | | | |
| Top Five Industries* | % of net assets |
| Health Care Equipment and Supplies | 8.4% |
| Pharmaceuticals | 7.1% |
| Banks | 7.1% |
| Oil, Gas and Consumable Fuels | 6.6% |
| Electric Utilities | 6.1% |
*Exposure indicated excludes Exchange-Traded Funds. The Schedule of Investments provides additional information on the fund's portfolio holdings.
Fund shareholders may incur two types of costs: (1) transaction costs, including sales charges (loads) on purchase payments and redemption/exchange fees; and (2) ongoing costs, including management fees; distribution and service (12b-1) fees; and other fund expenses. This example is intended to help you understand your ongoing costs (in dollars) of investing in your fund and to compare these costs with the ongoing cost of investing in other mutual funds.
The example is based on an investment of $1,000 made at the beginning of the period and held for the entire period from July 1, 2022 to December 31, 2022.
Actual Expenses
The table provides information about actual account values and actual expenses for each class. You may use the information, together with the amount you invested, to estimate the expenses that you paid over the period. First, identify the share class you own. Then simply divide your account value by $1,000 (for example, an $8,600 account value divided by $1,000 = 8.6), then multiply the result by the number under the heading “Expenses Paid During Period” to estimate the expenses you paid on your account during this period.
Hypothetical Example for Comparison Purposes
The table also provides information about hypothetical account values and hypothetical expenses based on the actual expense ratio of each class of your fund and an assumed rate of return of 5% per year before expenses, which is not the actual return of a fund’s share class. The hypothetical account values and expenses may not be used to estimate the actual ending account balance or expenses you paid for the period. You may use this information to compare the ongoing costs of investing in your fund and other funds. To do so, compare this 5% hypothetical example with the 5% hypothetical examples that appear in the shareholder reports of the other funds.
Please note that the expenses shown in the table are meant to highlight your ongoing costs only and do not reflect any transactional costs, such as sales charges (loads) or redemption/exchange fees. Therefore, the table is useful in comparing ongoing costs only, and will not help you determine the relative total costs of owning different funds. In addition, if these transactional costs were included, your costs would have been higher.
| | | | | | | | | | | | | | |
| Beginning Account Value 7/1/22 | Ending Account Value 12/31/22 | Expenses Paid During Period(1) 7/1/22 - 12/31/22 | Annualized Expense Ratio(1) |
| Actual | | | | |
| Class I | $1,000 | $1,076.20 | $3.77 | 0.72% |
| Class II | $1,000 | $1,075.20 | $4.55 | 0.87% |
| Hypothetical | | | | |
| Class I | $1,000 | $1,021.58 | $3.67 | 0.72% |
| Class II | $1,000 | $1,020.82 | $4.43 | 0.87% |
(1)Expenses are equal to the class's annualized expense ratio listed in the table above, multiplied by the average account value over the period, multiplied by 184, the number of days in the most recent fiscal half-year, divided by 365, to reflect the one-half year period. Annualized expense ratio reflects actual expenses, including any applicable fee waivers or expense reimbursements and excluding any acquired fund fees and expenses.
DECEMBER 31, 2022
| | | | | | | | |
| Shares | Value |
| COMMON STOCKS — 96.8% | | |
| Aerospace and Defense — 3.0% | | |
| Raytheon Technologies Corp. | 45,441 | | $ | 4,585,906 | |
| Airlines — 1.0% | | |
Southwest Airlines Co.(1) | 43,583 | | 1,467,440 | |
| Automobiles — 0.6% | | |
| General Motors Co. | 27,640 | | 929,810 | |
| Banks — 7.1% | | |
| JPMorgan Chase & Co. | 35,674 | | 4,783,883 | |
| Truist Financial Corp. | 74,836 | | 3,220,193 | |
| U.S. Bancorp | 68,028 | | 2,966,701 | |
| | 10,970,777 | |
| Beverages — 0.6% | | |
| PepsiCo, Inc. | 5,531 | | 999,230 | |
| Capital Markets — 5.9% | | |
| Ameriprise Financial, Inc. | 5,436 | | 1,692,607 | |
| Bank of New York Mellon Corp. | 90,202 | | 4,105,995 | |
| BlackRock, Inc. | 2,344 | | 1,661,029 | |
| Northern Trust Corp. | 19,032 | | 1,684,142 | |
| | 9,143,773 | |
| Chemicals — 0.9% | | |
| Akzo Nobel NV | 21,487 | | 1,441,832 | |
| Communications Equipment — 4.2% | | |
| Cisco Systems, Inc. | 78,476 | | 3,738,597 | |
F5, Inc.(1) | 12,395 | | 1,778,806 | |
| Juniper Networks, Inc. | 29,730 | | 950,171 | |
| | 6,467,574 | |
| Containers and Packaging — 2.0% | | |
| Packaging Corp. of America | 13,503 | | 1,727,169 | |
| Sonoco Products Co. | 22,851 | | 1,387,284 | |
| | 3,114,453 | |
| Diversified Financial Services — 3.1% | | |
Berkshire Hathaway, Inc., Class B(1) | 15,717 | | 4,854,981 | |
| Diversified Telecommunication Services — 2.5% | | |
| Verizon Communications, Inc. | 98,985 | | 3,900,009 | |
| Electric Utilities — 6.1% | | |
| Duke Energy Corp. | 21,532 | | 2,217,581 | |
| Edison International | 21,623 | | 1,375,655 | |
| Eversource Energy | 14,437 | | 1,210,398 | |
| Pinnacle West Capital Corp. | 27,613 | | 2,099,692 | |
| Xcel Energy, Inc. | 35,982 | | 2,522,698 | |
| | 9,426,024 | |
| Electrical Equipment — 2.8% | | |
| Emerson Electric Co. | 23,447 | | 2,252,319 | |
| nVent Electric PLC | 52,647 | | 2,025,330 | |
| | 4,277,649 | |
| Electronic Equipment, Instruments and Components — 1.0% | | |
| TE Connectivity Ltd. | 12,933 | | 1,484,708 | |
| | | | | | | | |
| Shares | Value |
| Energy Equipment and Services — 1.0% | | |
| Baker Hughes Co. | 54,800 | | $ | 1,618,244 | |
| Entertainment — 1.3% | | |
Walt Disney Co.(1) | 23,019 | | 1,999,891 | |
| Equity Real Estate Investment Trusts (REITs) — 0.9% | | |
| Healthpeak Properties, Inc. | 52,484 | | 1,315,774 | |
| Food and Staples Retailing — 2.4% | | |
| Koninklijke Ahold Delhaize NV | 68,154 | | 1,959,514 | |
| Walmart, Inc. | 12,019 | | 1,704,174 | |
| | 3,663,688 | |
| Food Products — 3.0% | | |
| Conagra Brands, Inc. | 66,613 | | 2,577,923 | |
| Mondelez International, Inc., Class A | 31,776 | | 2,117,870 | |
| | 4,695,793 | |
| Health Care Equipment and Supplies — 8.4% | | |
| Becton Dickinson and Co. | 6,379 | | 1,622,180 | |
| Medtronic PLC | 81,764 | | 6,354,698 | |
| Zimmer Biomet Holdings, Inc. | 39,202 | | 4,998,255 | |
| | 12,975,133 | |
| Health Care Providers and Services — 5.8% | | |
| Cigna Corp. | 3,705 | | 1,227,615 | |
| CVS Health Corp. | 15,239 | | 1,420,122 | |
Henry Schein, Inc.(1) | 26,064 | | 2,081,732 | |
| Quest Diagnostics, Inc. | 13,004 | | 2,034,346 | |
| Universal Health Services, Inc., Class B | 15,042 | | 2,119,267 | |
| | 8,883,082 | |
| Hotels, Restaurants and Leisure — 0.7% | | |
| Sodexo SA | 11,840 | | 1,132,832 | |
| Household Products — 5.0% | | |
| Colgate-Palmolive Co. | 25,185 | | 1,984,326 | |
| Henkel AG & Co. KGaA, Preference Shares | 21,736 | | 1,506,581 | |
| Kimberly-Clark Corp. | 22,129 | | 3,004,012 | |
| Procter & Gamble Co. | 7,993 | | 1,211,419 | |
| | 7,706,338 | |
| Industrial Conglomerates — 0.8% | | |
| Siemens AG | 8,483 | | 1,169,392 | |
| Insurance — 4.2% | | |
| Aflac, Inc. | 10,423 | | 749,831 | |
| Allstate Corp. | 26,866 | | 3,643,029 | |
| Chubb Ltd. | 3,594 | | 792,836 | |
| MetLife, Inc. | 18,245 | | 1,320,391 | |
| | 6,506,087 | |
| IT Services — 0.9% | | |
| Automatic Data Processing, Inc. | 5,521 | | 1,318,746 | |
| Machinery — 1.3% | | |
| Oshkosh Corp. | 22,732 | | 2,004,735 | |
| Multiline Retail — 1.5% | | |
Dollar Tree, Inc.(1) | 16,085 | | 2,275,062 | |
| Oil, Gas and Consumable Fuels — 6.6% | | |
| Chevron Corp. | 8,524 | | 1,529,973 | |
| ConocoPhillips | 13,598 | | 1,604,564 | |
| Exxon Mobil Corp. | 40,159 | | 4,429,537 | |
| | | | | | | | |
| Shares | Value |
| TotalEnergies SE, ADR | 42,288 | | $ | 2,625,239 | |
| | 10,189,313 | |
| Personal Products — 1.9% | | |
| Unilever PLC, ADR | 59,231 | | 2,982,281 | |
| Pharmaceuticals — 7.1% | | |
| Johnson & Johnson | 39,562 | | 6,988,627 | |
| Merck & Co., Inc. | 10,478 | | 1,162,534 | |
| Pfizer, Inc. | 30,499 | | 1,562,769 | |
| Roche Holding AG | 4,069 | | 1,278,632 | |
| | 10,992,562 | |
| Road and Rail — 0.8% | | |
| Norfolk Southern Corp. | 5,233 | | 1,289,516 | |
| Semiconductors and Semiconductor Equipment — 1.6% | | |
| Applied Materials, Inc. | 12,934 | | 1,259,513 | |
| Texas Instruments, Inc. | 7,537 | | 1,245,263 | |
| | 2,504,776 | |
| Specialty Retail — 0.8% | | |
| Advance Auto Parts, Inc. | 8,545 | | 1,256,371 | |
TOTAL COMMON STOCKS (Cost $136,180,202) | | 149,543,782 | |
| EXCHANGE-TRADED FUNDS — 1.0% | | |
iShares Russell 1000 Value ETF
(Cost $1,616,958) | 10,411 | | 1,578,828 | |
| SHORT-TERM INVESTMENTS — 1.8% | | |
| Money Market Funds — 0.1% | | |
| State Street Institutional U.S. Government Money Market Fund, Premier Class | 66,269 | | 66,269 | |
| Repurchase Agreements — 1.7% | | |
| BMO Capital Markets Corp., (collateralized by various U.S. Treasury obligations, 0.375% - 0.50%, 9/15/24 - 5/31/27, valued at $381,095), in a joint trading account at 4.20%, dated 12/30/22, due 1/3/23 (Delivery value $374,211) | | 374,036 | |
| Fixed Income Clearing Corp., (collateralized by various U.S. Treasury obligations, 2.75%, 11/15/47, valued at $2,343,992), at 4.26%, dated 12/30/22, due 1/3/23 (Delivery value $2,299,088) | | 2,298,000 | |
| | 2,672,036 | |
TOTAL SHORT-TERM INVESTMENTS (Cost $2,738,305) | | 2,738,305 | |
TOTAL INVESTMENT SECURITIES—99.6% (Cost $140,535,465) | | 153,860,915 | |
| OTHER ASSETS AND LIABILITIES — 0.4% | | 581,678 | |
| TOTAL NET ASSETS — 100.0% | | $ | 154,442,593 | |
| | | | | | | | | | | | | | | | | | | | |
| FORWARD FOREIGN CURRENCY EXCHANGE CONTRACTS |
| Currency Purchased | Currency Sold | Counterparty | Settlement Date | Unrealized Appreciation
(Depreciation) |
| CHF | 25,075 | | USD | 27,311 | | Morgan Stanley | 3/31/23 | $ | 63 | |
| USD | 1,132,262 | | CHF | 1,042,264 | | Morgan Stanley | 3/31/23 | (5,550) | |
| USD | 8,311,062 | | EUR | 7,761,661 | | JPMorgan Chase Bank N.A. | 3/31/23 | (46,961) | |
| USD | 207,879 | | EUR | 193,948 | | JPMorgan Chase Bank N.A. | 3/31/23 | (972) | |
| USD | 2,562,714 | | GBP | 2,102,093 | | Bank of America N.A. | 3/31/23 | 15,971 | |
| | | | | | $ | (37,449) | |
| | | | | | | | |
| NOTES TO SCHEDULE OF INVESTMENTS |
| ADR | – | American Depositary Receipt |
| CHF | – | Swiss Franc |
| EUR | – | Euro |
| GBP | – | British Pound |
| USD | – | United States Dollar |
(1)Non-income producing.
See Notes to Financial Statements.
| | |
| Statement of Assets and Liabilities |
| | | | | |
| DECEMBER 31, 2022 | |
| Assets | |
| Investment securities, at value (cost of $140,535,465) | $ | 153,860,915 | |
| Cash | 38,437 | |
| Foreign currency holdings, at value (cost of $90) | 91 | |
| Receivable for investments sold | 261,323 | |
| Receivable for capital shares sold | 109,122 | |
| Unrealized appreciation on forward foreign currency exchange contracts | 16,034 | |
| Dividends and interest receivable | 351,152 | |
| 154,637,074 | |
| |
| Liabilities | |
| Payable for capital shares redeemed | 27,837 | |
| Unrealized depreciation on forward foreign currency exchange contracts | 53,483 | |
| Accrued management fees | 81,487 | |
| Distribution fees payable | 27,456 | |
| Accrued other expenses | 4,218 | |
| 194,481 | |
| |
| Net Assets | $ | 154,442,593 | |
| |
| Net Assets Consist of: | |
| Capital (par value and paid-in surplus) | $ | 137,874,983 | |
| Distributable earnings | 16,567,610 | |
| $ | 154,442,593 | |
| | | | | | | | | | | |
| Net Assets | Shares Outstanding | Net Asset Value Per Share |
| Class I, $0.01 Par Value | $23,857,726 | 1,319,640 | $18.08 |
| Class II, $0.01 Par Value | $130,584,867 | 7,092,889 | $18.41 |
See Notes to Financial Statements.
| | | | | |
| YEAR ENDED DECEMBER 31, 2022 |
| Investment Income (Loss) | |
| Income: | |
| Dividends (net of foreign taxes withheld of $66,833) | $ | 3,411,754 | |
| Interest | 55,886 | |
| 3,467,640 | |
| |
| Expenses: | |
| Management fees | 959,531 | |
| Distribution fees - Class II | 278,935 | |
| Directors' fees and expenses | 3,601 | |
| Other expenses | 4,548 | |
| 1,246,615 | |
Fees waived(1) | (136,662) | |
| 1,109,953 | |
| |
| Net investment income (loss) | 2,357,687 | |
| |
| Realized and Unrealized Gain (Loss) | |
| Net realized gain (loss) on: | |
| Investment transactions | 3,426,512 | |
| Forward foreign currency exchange contract transactions | 710,000 | |
| Foreign currency translation transactions | (1,593) | |
| 4,134,919 | |
| |
| Change in net unrealized appreciation (depreciation) on: | |
| Investments | (6,472,190) | |
| Forward foreign currency exchange contracts | 63,667 | |
| Translation of assets and liabilities in foreign currencies | (898) | |
| (6,409,421) | |
| |
| Net realized and unrealized gain (loss) | (2,274,502) | |
| |
| Net Increase (Decrease) in Net Assets Resulting from Operations | $ | 83,185 | |
(1)Amount consists of $19,987 and $116,675 for Class I and Class II, respectively.
See Notes to Financial Statements.
| | |
| Statement of Changes in Net Assets |
| | | | | | | | |
| YEARS ENDED DECEMBER 31, 2022 AND DECEMBER 31, 2021 |
| Increase (Decrease) in Net Assets | December 31, 2022 | December 31, 2021 |
| Operations | | |
| Net investment income (loss) | $ | 2,357,687 | | $ | 1,349,915 | |
| Net realized gain (loss) | 4,134,919 | | 7,268,987 | |
| Change in net unrealized appreciation (depreciation) | (6,409,421) | | 7,366,891 | |
| Net increase (decrease) in net assets resulting from operations | 83,185 | | 15,985,793 | |
| | |
| Distributions to Shareholders | | |
| From earnings: | | |
| Class I | (1,313,393) | | (213,724) | |
| Class II | (7,513,475) | | (938,589) | |
| Decrease in net assets from distributions | (8,826,868) | | (1,152,313) | |
| | |
| Capital Share Transactions | | |
| Net increase (decrease) in net assets from capital share transactions (Note 5) | 62,218,785 | | 16,074,871 | |
| | |
| Net increase (decrease) in net assets | 53,475,102 | | 30,908,351 | |
| | |
| Net Assets | | |
| Beginning of period | 100,967,491 | | 70,059,140 | |
| End of period | $ | 154,442,593 | | $ | 100,967,491 | |
See Notes to Financial Statements.
| | |
| Notes to Financial Statements |
DECEMBER 31, 2022
1. Organization
American Century Variable Portfolios, Inc. (the corporation) is registered under the Investment Company Act of 1940, as amended (the 1940 Act), as an open-end management investment company and is organized as a Maryland corporation. VP Large Company Value Fund (the fund) is one fund in a series issued by the corporation. The fund’s investment objective is to seek long-term capital growth. Income is a secondary objective. The fund offers Class I and Class II.
2. Significant Accounting Policies
The following is a summary of significant accounting policies consistently followed by the fund in preparation of its financial statements. The fund is an investment company and follows accounting and reporting guidance in accordance with accounting principles generally accepted in the United States of America. This may require management to make certain estimates and assumptions at the date of the financial statements. Actual results could differ from these estimates. Management evaluated the impact of events or transactions occurring through the date the financial statements were issued that would merit recognition or disclosure.
Investment Valuations — The fund determines the fair value of its investments and computes its net asset value (NAV) per share at the close of regular trading (usually 4 p.m. Eastern time) on the New York Stock Exchange (NYSE) on each day the NYSE is open. The value of investments of the fund is determined by American Century Investment Management, Inc. (ACIM) (the investment advisor), as the valuation designee, pursuant to its valuation policies and procedures. The Board of Directors oversees the valuation designee and reviews its valuation policies and procedures at least annually.
Equity securities that are listed or traded on a domestic securities exchange are valued at the last reported sales price or at the official closing price as provided by the exchange. Equity securities traded on foreign securities exchanges are generally valued at the closing price of such securities on the exchange where primarily traded or at the close of the NYSE, if that is earlier. If no last sales price is reported, or if local convention or regulation so provides, the mean of the latest bid and asked prices may be used. Securities traded over-the-counter are valued at the mean of the latest bid and asked prices, the last sales price, or the official closing price. Equity securities initially expressed in local currencies are translated into U.S. dollars at the mean of the appropriate currency exchange rate at the close of the NYSE as provided by an independent pricing service.
Open-end management investment companies are valued at the reported NAV per share. Repurchase agreements are valued at cost, which approximates fair value. Forward foreign currency exchange contracts are valued at the mean of the appropriate forward exchange rate at the close of the NYSE as provided by an independent pricing service.
If the valuation designee determines that the market price for a portfolio security is not readily available or is believed by the valuation designee to be unreliable, such security is valued at fair value as determined in good faith by the valuation designee, in accordance with its policies and procedures. Circumstances that may cause the fund to determine that market quotations are not available or reliable include, but are not limited to: when there is a significant event subsequent to the market quotation; trading in a security has been halted during the trading day; or trading in a security is insufficient or did not take place due to a closure or holiday.
The valuation designee monitors for significant events occurring after the close of an investment’s primary exchange but before the fund’s NAV per share is determined. Significant events may include, but are not limited to: corporate announcements and transactions; regulatory news, governmental action and political unrest that could impact a specific investment or an investment sector; or armed conflicts, natural disasters and similar events that could affect investments in a specific country or region. The valuation designee also monitors for significant fluctuations between domestic and foreign markets, as evidenced by the U.S. market or such other indicators that it deems appropriate. The valuation designee may apply a model-derived factor to the closing price of equity securities traded on foreign securities exchanges. The factor is based on observable market data as provided by an independent pricing service.
Security Transactions — Security transactions are accounted for as of the trade date. Net realized gains and losses are determined on the identified cost basis, which is also used for federal income tax purposes.
Investment Income — Dividend income less foreign taxes withheld, if any, is recorded as of the ex-dividend date. Distributions received on securities that represent a return of capital or long-term capital gain are recorded as a reduction of cost of investments and/or as a realized gain. The fund may estimate the components of distributions received that may be considered nontaxable distributions or long-term capital gain distributions for income tax purposes. Interest income is recorded on the accrual basis and includes accretion of discounts and amortization of premiums.
Foreign Currency Translations — All assets and liabilities initially expressed in foreign currencies are translated into U.S. dollars at prevailing exchange rates at period end. The fund may enter into spot foreign currency exchange contracts to facilitate transactions denominated in a foreign currency. Purchases and sales of investment securities, dividend and interest income, spot foreign currency exchange contracts, and expenses are translated at the rates of exchange prevailing on the respective dates of such transactions. Net realized and unrealized foreign currency exchange gains or losses related to investment securities are a component of net realized gain (loss) on investment transactions and change in net unrealized appreciation (depreciation) on investments, respectively.
Repurchase Agreements — The fund may enter into repurchase agreements with institutions that ACIM has determined are creditworthy pursuant to criteria adopted by the Board of Directors. The fund requires that the collateral, represented by securities, received in a repurchase transaction be transferred to the custodian in a manner sufficient to enable the fund to obtain those securities in the event of a default under the repurchase agreement. ACIM monitors, on a daily basis, the securities transferred to ensure the value, including accrued interest, of the securities under each repurchase agreement is equal to or greater than amounts owed to the fund under each repurchase agreement.
Joint Trading Account — Pursuant to an Exemptive Order issued by the Securities and Exchange Commission, the fund, along with certain other funds in the American Century Investments family of funds, may transfer uninvested cash balances into a joint trading account. These balances are invested in one or more repurchase agreements that are collateralized by U.S. Treasury or Agency obligations.
Income Tax Status — It is the fund's policy to distribute substantially all net investment income and net realized gains to shareholders and to otherwise qualify as a regulated investment company under provisions of the Internal Revenue Code. Accordingly, no provision has been made for income taxes. The fund files U.S. federal, state, local and non-U.S. tax returns as applicable. The fund's tax returns are subject to examination by the relevant taxing authority until expiration of the applicable statute of limitations, which is generally three years from the date of filing but can be longer in certain jurisdictions. At this time, management believes there are no uncertain tax positions which, based on their technical merit, would not be sustained upon examination and for which it is reasonably possible that the total amounts of unrecognized tax benefits will significantly change in the next twelve months.
Multiple Class — All shares of the fund represent an equal pro rata interest in the net assets of the class to which such shares belong, and have identical voting, dividend, liquidation and other rights and the same terms and conditions, except for class specific expenses and exclusive rights to vote on matters affecting only individual classes. Income, non-class specific expenses, and realized and unrealized capital gains and losses of the fund are allocated to each class of shares based on their relative net assets.
Distributions to Shareholders — Distributions from net investment income, if any, are generally declared and paid quarterly. Distributions from net realized gains, if any, are generally declared and paid annually.
Indemnifications — Under the corporation’s organizational documents, its officers and directors are indemnified against certain liabilities arising out of the performance of their duties to the fund. In addition, in the normal course of business, the fund enters into contracts that provide general indemnifications. The maximum exposure under these arrangements is unknown as this would involve future claims that may be made against a fund. The risk of material loss from such claims is considered by management to be remote.
3. Fees and Transactions with Related Parties
Certain officers and directors of the corporation are also officers and/or directors of American Century Companies, Inc. (ACC). The corporation's investment advisor, ACIM, the corporation's distributor, American Century Investment Services, Inc. (ACIS), and the corporation's transfer agent, American Century Services, LLC, are wholly owned, directly or indirectly, by ACC.
Management Fees — The corporation has entered into a management agreement with ACIM, under which ACIM provides the fund with investment advisory and management services in exchange for a single, unified management fee (the fee) per class. The agreement provides that ACIM will pay all expenses of managing and operating the fund, except brokerage expenses, taxes, interest, fees and expenses of the independent directors (including legal counsel fees), extraordinary expenses, and expenses incurred in connection with the provision of shareholder services and distribution services under a plan adopted pursuant to Rule 12b-1 under the 1940 Act. The fee is computed and accrued daily based on each class's daily net assets and paid monthly in arrears. The difference in the fee among the classes is a result of their separate arrangements for non-Rule 12b-1 shareholder services. It is not the result of any difference in advisory or custodial fees or other expenses related to the management of the fund's assets, which do not vary by class. The rate of the fee is determined by applying a fee rate calculation formula. This formula takes into account the fund's assets as well as certain assets, if any, of other clients of the investment advisor outside the American Century Investments family of funds (such as subadvised funds and separate accounts), as well as exchange-traded funds managed by the investment advisor, that use very similar investment teams and strategies (strategy assets). From January 1, 2022 through July 31, 2022, the investment advisor agreed to waive 0.10% of the fund's management fee. Effective August 1, 2022, the investment advisor agreed to waive 0.11% of the fund's management fee. The investment advisor expects this waiver to continue until July 31, 2023 and cannot terminate it prior to such date without the approval of the Board of Directors.
The management fee schedule range and the effective annual management fee before and after waiver for each class for the period ended December 31, 2022 are as follows:
| | | | | | | | | | | |
| Management Fee Schedule Range | Effective Annual Management Fee |
| Before Waiver | After Waiver |
| Class I | 0.70% to 0.83% | 0.82% | 0.71% |
| Class II | 0.60% to 0.73% | 0.72% | 0.61% |
Distribution Fees — The Board of Directors has adopted the Master Distribution Plan (the plan) for Class II, pursuant to Rule 12b-1 of the 1940 Act. The plan provides that Class II will pay ACIS an annual distribution fee equal to 0.25%. The fee is computed and accrued daily based on the Class II daily net assets and paid monthly in arrears. The distribution fee provides compensation for expenses incurred in connection with distributing shares of Class II including, but not limited to, payments to brokers, dealers, and financial institutions that have entered into sales agreements with respect to shares of the fund. Fees incurred under the plan during the period ended December 31, 2022 are detailed in the Statement of Operations.
Directors' Fees and Expenses — The Board of Directors is responsible for overseeing the investment advisor’s management and operations of the fund. The directors receive detailed information about the fund and its investment advisor regularly throughout the year, and meet at least quarterly with management of the investment advisor to review reports about fund operations. The fund's officers do not receive compensation from the fund.
Interfund Transactions — The fund may enter into security transactions with other American Century Investments funds and other client accounts of the investment advisor, in accordance with the 1940 Act rules and procedures adopted by the Board of Directors. The rules and procedures require, among other things, that these transactions be effected at the independent current market price of the security. During the period, the interfund sales were $82,168 and there were no interfund purchases. The effect of interfund transactions on the Statement of Operations was $(28,637) in net realized gain (loss) on investment transactions.
4. Investment Transactions
Purchases and sales of investment securities, excluding short-term investments, for the period ended December 31, 2022 were $94,129,204 and $37,951,339, respectively.
5. Capital Share Transactions
Transactions in shares of the fund were as follows:
| | | | | | | | | | | | | | |
| Year ended
December 31, 2022 | Year ended
December 31, 2021 |
| Shares | Amount | Shares | Amount |
| Class I/Shares Authorized | 50,000,000 | | | 50,000,000 | | |
| Sold | 640,852 | | $ | 11,489,078 | | 387,024 | | $ | 7,229,882 | |
| Issued in reinvestment of distributions | 70,607 | | 1,313,393 | | 11,471 | | 213,724 | |
| Redeemed | (239,210) | | (4,364,550) | | (254,434) | | (4,616,622) | |
| 472,249 | | 8,437,921 | | 144,061 | | 2,826,984 | |
| Class II/Shares Authorized | 50,000,000 | | | 50,000,000 | | |
| Sold | 3,270,484 | | 61,345,874 | | 1,102,712 | | 20,544,353 | |
| Issued in reinvestment of distributions | 396,220 | | 7,513,475 | | 49,538 | | 938,589 | |
| Redeemed | (833,039) | | (15,078,485) | | (443,102) | | (8,235,055) | |
| 2,833,665 | | 53,780,864 | | 709,148 | | 13,247,887 | |
| Net increase (decrease) | 3,305,914 | | $ | 62,218,785 | | 853,209 | | $ | 16,074,871 | |
6. Fair Value Measurements
The fund's investments valuation process is based on several considerations and may use multiple inputs to determine the fair value of the investments held by the fund. In conformity with accounting principles generally accepted in the United States of America, the inputs used to determine a valuation are classified into three broad levels.
•Level 1 valuation inputs consist of unadjusted quoted prices in an active market for identical investments.
•Level 2 valuation inputs consist of direct or indirect observable market data (including quoted prices for comparable investments, evaluations of subsequent market events, interest rates, prepayment speeds, credit risk, etc.). These inputs also consist of quoted prices for identical investments initially expressed in local currencies that are adjusted through translation into U.S. dollars.
•Level 3 valuation inputs consist of unobservable data (including a fund’s own assumptions).
The level classification is based on the lowest level input that is significant to the fair valuation measurement. The valuation inputs are not necessarily an indication of the risks associated with investing in these securities or other financial instruments.
The following is a summary of the level classifications as of period end. The Schedule of Investments provides additional information on the fund's portfolio holdings.
| | | | | | | | | | | |
| Level 1 | Level 2 | Level 3 |
| Assets | | | |
| Investment Securities | | | |
| Common Stocks | | | |
| Chemicals | — | | $ | 1,441,832 | | — | |
| Food and Staples Retailing | $ | 1,704,174 | | 1,959,514 | | — | |
| Hotels, Restaurants and Leisure | — | | 1,132,832 | | — | |
| Household Products | 6,199,757 | | 1,506,581 | | — | |
| Industrial Conglomerates | — | | 1,169,392 | | — | |
| Pharmaceuticals | 9,713,930 | | 1,278,632 | | — | |
| Other Industries | 123,437,138 | | — | | — | |
| Exchange-Traded Funds | 1,578,828 | | — | | — | |
| Short-Term Investments | 66,269 | | 2,672,036 | | — | |
| $ | 142,700,096 | | $ | 11,160,819 | | — | |
| Other Financial Instruments | | | |
| Forward Foreign Currency Exchange Contracts | — | | $ | 16,034 | | — | |
| | | |
| Liabilities | | | |
| Other Financial Instruments | | | |
| Forward Foreign Currency Exchange Contracts | — | | $ | 53,483 | | — | |
7. Derivative Instruments
Foreign Currency Risk — The fund is subject to foreign currency exchange rate risk in the normal course of pursuing its investment objectives. The value of foreign investments held by a fund may be significantly affected by changes in foreign currency exchange rates. The dollar value of a foreign security generally decreases when the value of the dollar rises against the foreign currency in which the security is denominated and tends to increase when the value of the dollar declines against such foreign currency. A fund may enter into forward foreign currency exchange contracts to reduce a fund's exposure to foreign currency exchange rate fluctuations. The net U.S. dollar value of foreign currency underlying all contractual commitments held by a fund and the resulting unrealized appreciation or depreciation are determined daily. Realized gain or loss is recorded upon settlement of the contract. Net realized and unrealized gains or losses occurring during the holding period of forward foreign currency exchange contracts are a component of net realized gain (loss) on forward foreign currency exchange contract transactions and change in net unrealized appreciation (depreciation) on forward foreign currency exchange contracts, respectively. A fund bears the risk of an unfavorable change in the foreign currency exchange rate underlying the forward contract. Additionally, losses, up to the fair value, may arise if the counterparties do not perform under the contract terms. The fund's average U.S. dollar exposure to foreign currency risk derivative instruments held during the period was $11,598,221.
The value of foreign currency risk derivative instruments as of December 31, 2022, is disclosed on the Statement of Assets and Liabilities as an asset of $16,034 in unrealized appreciation on forward foreign currency exchange contracts and a liability of $53,483 in unrealized depreciation on forward foreign currency exchange contracts. For the year ended December 31, 2022, the effect of foreign currency risk derivative instruments on the Statement of Operations was $710,000 in net realized gain (loss) on forward foreign currency exchange contract transactions and $63,667 in change in net unrealized appreciation (depreciation) on forward foreign currency exchange contracts.
8. Risk Factors
The value of the fund’s shares will go up and down, sometimes rapidly or unpredictably, based on the performance of the securities owned by the fund and other factors generally affecting the securities market. Market risks, including political, regulatory, economic and social developments, can affect the value of the fund’s investments. Natural disasters, public health emergencies, war, terrorism and other unforeseeable events may lead to increased market volatility and may have adverse long-term effects on world economies and markets generally.
There are certain risks involved in investing in foreign securities. These risks include those resulting from political events (such as civil unrest, national elections and imposition of exchange controls), social and economic events (such as labor strikes and rising inflation), and natural disasters. Securities of foreign issuers may be less liquid and more volatile. Investing a significant portion of assets in one country or region may accentuate these risks.
9. Federal Tax Information
The tax character of distributions paid during the years ended December 31, 2022 and December 31, 2021 were as follows:
| | | | | | | | |
| 2022 | 2021 |
| Distributions Paid From | | |
| Ordinary income | $ | 4,483,834 | | $ | 1,152,313 | |
| Long-term capital gains | $ | 4,343,034 | | — | |
The book-basis character of distributions made during the year from net investment income or net realized gains may differ from their ultimate characterization for federal income tax purposes. These differences reflect the differing character of certain income items and net realized gains and losses for financial statement and tax purposes, and may result in reclassification among certain capital accounts on the financial statements.
As of period end, the federal tax cost of investments and the components of distributable earnings on a tax-basis were as follows:
| | | | | |
| Federal tax cost of investments | $ | 142,224,482 | |
| Gross tax appreciation of investments | $ | 17,565,703 | |
| Gross tax depreciation of investments | (5,929,270) | |
| Net tax appreciation (depreciation) of investments | 11,636,433 | |
| Net tax appreciation (depreciation) on derivatives and translation of assets and liabilities in foreign currencies | (903) | |
| Net tax appreciation (depreciation) | $ | 11,635,530 | |
| Undistributed ordinary income | $ | 799,430 | |
| Accumulated long-term gains | $ | 4,132,650 | |
The difference between book-basis and tax-basis unrealized appreciation (depreciation) is attributable primarily to the tax deferral of losses on wash sales.
| | | | | | | | | | | | | | | | | | | | | | | | | | | | | | | | | | | | | | | | | | | | | | | |
| For a Share Outstanding Throughout the Years Ended December 31 (except as noted) | |
| Per-Share Data | | | | | | Ratios and Supplemental Data | |
| | Income From Investment Operations: | Distributions From: | | | Ratio to Average Net Assets of: | |
| Net Asset
Value,
Beginning
of Period | Net Investment
Income (Loss)(1) | Net
Realized
and
Unrealized
Gain (Loss) | Total From
Investment
Operations | Net
Investment
Income | Net
Realized
Gains | Total
Distributions | Net Asset
Value,
End
of Period | Total Return(2) | Operating
Expenses | Operating
Expenses
(before
expense
waiver) | Net
Investment
Income
(Loss) | Net
Investment
Income (Loss)
(before expense waiver) | Portfolio
Turnover
Rate | Net
Assets,
End of
Period
(in thousands) |
| Class I | | | | | | | | | | | | | | |
| 2022 | $19.49 | 0.35 | (0.37) | (0.02) | (0.39) | (1.00) | (1.39) | $18.08 | (0.26)% | 0.72% | 0.83% | 1.93% | 1.82% | 30% | $23,858 | |
| 2021 | $16.24 | 0.31 | 3.20 | 3.51 | (0.26) | — | (0.26) | $19.49 | 21.71% | 0.71% | 0.84% | 1.68% | 1.55% | 40% | $16,520 | |
| 2020 | $16.29 | 0.30 | 0.02 | 0.32 | (0.25) | (0.12) | (0.37) | $16.24 | 2.62% | 0.74% | 0.90% | 2.07% | 1.91% | 77% | $11,424 | |
| 2019 | $13.38 | 0.28 | 3.31 | 3.59 | (0.31) | (0.37) | (0.68) | $16.29 | 27.48% | 0.76% | 0.90% | 1.82% | 1.68% | 59% | $11,514 | |
| 2018 | $15.77 | 0.28 | (1.49) | (1.21) | (0.27) | (0.91) | (1.18) | $13.38 | (8.04)% | 0.78% | 0.90% | 1.86% | 1.74% | 51% | $6,644 | |
| Class II | | | | | | | | | | | | | | | |
| 2022 | $19.83 | 0.33 | (0.39) | (0.06) | (0.36) | (1.00) | (1.36) | $18.41 | (0.46)% | 0.87% | 0.98% | 1.78% | 1.67% | 30% | $130,585 | |
| 2021 | $16.52 | 0.29 | 3.25 | 3.54 | (0.23) | — | (0.23) | $19.83 | 21.53% | 0.86% | 0.99% | 1.53% | 1.40% | 40% | $84,448 | |
| 2020 | $16.56 | 0.28 | 0.03 | 0.31 | (0.23) | (0.12) | (0.35) | $16.52 | 2.49% | 0.89% | 1.05% | 1.92% | 1.76% | 77% | $58,635 | |
| 2019 | $13.59 | 0.25 | 3.38 | 3.63 | (0.29) | (0.37) | (0.66) | $16.56 | 27.31% | 0.91% | 1.05% | 1.67% | 1.53% | 59% | $48,879 | |
| 2018 | $16.00 | 0.26 | (1.51) | (1.25) | (0.25) | (0.91) | (1.16) | $13.59 | (8.19)% | 0.93% | 1.05% | 1.71% | 1.59% | 51% | $24,144 | |
| | | | | | | | |
| Notes to Financial Highlights |
(1)Computed using average shares outstanding throughout the period.
(2)Total returns are calculated based on the net asset value of the last business day. Total returns for periods less than one year are not annualized. The total returns presented do not include the fees and charges assessed with investments in variable insurance products, those charges are disclosed in the separate account prospectus. The inclusion of such fees and charges would lower total return.
See Notes to Financial Statements.
| | |
| Report of Independent Registered Public Accounting Firm |
To the Shareholders and the Board of Directors of American Century Variable Portfolios, Inc.:
Opinion on the Financial Statements and Financial Highlights
We have audited the accompanying statement of assets and liabilities, including the schedule of investments, of VP Large Company Value Fund (the “Fund”), one of the funds constituting the American Century Variable Portfolios, Inc., as of December 31, 2022, the related statement of operations for the year then ended, the statements of changes in net assets for each of the two years in the period then ended, the financial highlights for each of the five years in the period then ended, and the related notes. In our opinion, the financial statements and financial highlights present fairly, in all material respects, the financial position of VP Large Company Value Fund of the American Century Variable Portfolios, Inc. as of December 31, 2022, and the results of its operations for the year then ended, the changes in its net assets for each of the two years in the period then ended, and the financial highlights for each of the five years in the period then ended, in conformity with accounting principles generally accepted in the United States of America.
Basis for Opinion
These financial statements and financial highlights are the responsibility of the Fund's management. Our responsibility is to express an opinion on the Fund’s financial statements and financial highlights based on our audits. We are a public accounting firm registered with the Public Company Accounting Oversight Board (United States) (PCAOB) and are required to be independent with respect to the Fund in accordance with the U.S. federal securities laws and the applicable rules and regulations of the Securities and Exchange Commission and the PCAOB.
We conducted our audits in accordance with the standards of the PCAOB. Those standards require that we plan and perform the audit to obtain reasonable assurance about whether the financial statements and financial highlights are free of material misstatement, whether due to error or fraud. The Fund is not required to have, nor were we engaged to perform, an audit of its internal control over financial reporting. As part of our audits, we are required to obtain an understanding of internal control over financial reporting but not for the purpose of expressing an opinion on the effectiveness of the Fund’s internal control over financial reporting. Accordingly, we express no such opinion.
Our audits included performing procedures to assess the risks of material misstatement of the financial statements and financial highlights, whether due to error or fraud, and performing procedures that respond to those risks. Such procedures included examining, on a test basis, evidence regarding the amounts and disclosures in the financial statements and financial highlights. Our audits also included evaluating the accounting principles used and significant estimates made by management, as well as evaluating the overall presentation of the financial statements and financial highlights. Our procedures included confirmation of securities owned as of December 31, 2022, by correspondence with the custodian and brokers; when replies were not received from brokers, we performed other auditing procedures. We believe that our audits provide a reasonable basis for our opinion.
/s/ Deloitte & Touche LLP
Kansas City, Missouri
February 10, 2023
We have served as the auditor of one or more American Century investment companies since 1997.
The Board of Directors
The individuals listed below serve as directors of the funds. Each director will continue to serve in this capacity until death, retirement, resignation or removal from office. The board has adopted a mandatory retirement age for directors who are not “interested persons,” as that term is defined in the Investment Company Act (independent directors). Independent directors shall retire on December 31 of the year in which they reach their 75th birthday.
Jonathan S. Thomas is an “interested person” because he currently serves as President and Chief Executive Officer of American Century Companies, Inc. (ACC), the parent company of American Century Investment Management, Inc. (ACIM or the advisor). The other directors (more than three-fourths of the total number) are independent. They are not employees, directors or officers of, and have no financial interest in, ACC or any of its wholly owned, direct or indirect, subsidiaries, including ACIM, American Century Investment Services, Inc. (ACIS) and American Century Services, LLC (ACS), and they do not have any other affiliations, positions or relationships that would cause them to be considered “interested persons” under the Investment Company Act. The directors serve in this capacity for seven (in the case of Jonathan S. Thomas, 16; and Stephen E. Yates, 8) registered investment companies in the American Century Investments family of funds.
The following table presents additional information about the directors. The mailing address for each director is 4500 Main Street, Kansas City, Missouri 64111.
| | | | | | | | | | | | | | | | | |
Name
(Year of Birth) | Position(s) Held with Funds | Length of Time Served | Principal Occupation(s) During Past 5 Years | Number of American Century Portfolios Overseen by Director | Other Directorships Held During Past 5 Years |
| Independent Directors | | |
Brian Bulatao
(1964) | Director | Since 2022 | Chief Administrative Officer, Activision Blizzard, Inc. (2021 to present); Under Secretary of State for Management, U.S. Department of State (2018 to 2021); Chief Operating Officer, Central Intelligence Agency (2017 to 2018) | 64 | None |
| Thomas W. Bunn (1953) | Director | Since 2017 | Retired | 64 | None |
Chris H. Cheesman
(1962)
| Director | Since 2019
| Retired. Senior Vice President & Chief Audit Executive, AllianceBernstein (1999 to 2018)
| 64 | Alleghany Corporation (2021 to 2022) |
Barry Fink
(1955) | Director | Since 2012 (independent since 2016) | Retired | 64 | None |
Rajesh K. Gupta
(1960)
| Director | Since 2019
| Partner Emeritus, SeaCrest Investment Management and SeaCrest Wealth Management (2019 to Present); Chief Executive Officer and Chief Investment Officer, SeaCrest Investment Management (2006 to 2019); Chief Executive Officer and Chief Investment Officer, SeaCrest Wealth Management (2008 to 2019) | 64 | None |
| | | | | | | | | | | | | | | | | |
Name
(Year of Birth) | Position(s) Held with Funds | Length of Time Served | Principal Occupation(s) During Past 5 Years | Number of American Century Portfolios Overseen by Director | Other Directorships Held During Past 5 Years |
| Independent Directors | | |
Lynn Jenkins
(1963)
| Director | Since 2019
| Consultant, LJ Strategies (2019 to present); United States Representative, U.S. House of Representatives (2009 to 2018) | 64 | MGP Ingredients, Inc. (2019 to 2021) |
Jan M. Lewis
(1957) | Director and Board Chair | Since 2011 (Board Chair since 2022) | Retired | 64 | None |
Gary C. Meltzer
(1963) | Director | Since 2022 | Advisor, Pontoro (2021 to present); Executive Advisor, Consultant and Investor, Harris Ariel Advisory LLC (2020 to present); Managing Partner, PricewaterhouseCoopers LLP (1985 to 2020) | 64 | ExcelFin Acquisition Corp., Apollo Realty Income Solutions, Inc. |
Stephen E. Yates
(1948) | Director | Since 2012 | Retired | 108 | None |
| Interested Director | |
Jonathan S. Thomas
(1963) | Director | Since 2007 | President and Chief Executive Officer, ACC (2007 to present). Also serves as Chief Executive Officer, ACS; Director, ACC and other ACC subsidiaries | 140 | None |
The Statement of Additional Information has additional information about the fund's directors and is available without charge, upon request, by calling 1-800-378-9878.
Officers
The following table presents certain information about the executive officers of the funds. Each officer serves as an officer for 16 (in the case of Robert J. Leach, 15) investment companies in the American Century family of funds. No officer is compensated for his or her service as an officer of the funds. The listed officers are interested persons of the funds and are appointed or re-appointed on an annual basis. The mailing address for each officer listed below is 4500 Main Street, Kansas City, Missouri 64111.
| | | | | | | | |
Name
(Year of Birth) | Offices with the Funds | Principal Occupation(s) During the Past Five Years |
Patrick Bannigan
(1965) | President since 2019 | Executive Vice President and Director, ACC (2012 to present); Chief Financial Officer, Chief Accounting Officer and Treasurer, ACC (2015 to present). Also serves as President, ACS; Vice President, ACIM; Chief Financial Officer, Chief Accounting Officer and/or Director, ACIM, ACS and other ACC subsidiaries |
R. Wes Campbell
(1974) | Chief Financial Officer and Treasurer since 2018 | Vice President, ACS, (2020 to present); Investment Operations and Investment Accounting, ACS (2000 to present) |
Amy D. Shelton
(1964) | Chief Compliance Officer and Vice President since 2014 | Chief Compliance Officer, American Century funds, (2014 to present); Chief Compliance Officer, ACIM (2014 to present); Chief Compliance Officer, ACIS (2009 to present). Also serves as Vice President, ACIS |
John Pak
(1968) | General Counsel and
Senior Vice President since 2021 | General Counsel and Senior Vice President, ACC (2021 to present); Also serves as General Counsel and Senior Vice President, ACIM, ACS and ACIS. Chief Legal Officer of Investment and Wealth Management, The Bank of New York Mellon (2014 to 2021) |
C. Jean Wade
(1964) | Vice President since 2012 | Senior Vice President, ACS (2017 to present); Vice President, ACS (2000 to 2017)
|
Robert J. Leach
(1966) | Vice President since 2006 | Vice President, ACS (2000 to present) |
David H. Reinmiller
(1963) | Vice President since 2000 | Attorney, ACC (1994 to present). Also serves as Vice President, ACIM and ACS |
Ward D. Stauffer
(1960) | Secretary since 2005 | Attorney, ACC (2003 to present) |
A special meeting of shareholders was held on October 13, 2022, to vote on the following proposal. The proposal received the required votes and was adopted. A summary of voting results is listed below.
To elect five directors to the Board of Directors of American Century Variable Portfolios, Inc.:
| | | | | | | | | | | |
| Affirmative | | Withhold |
| Brian Bulatao | $ | 2,607,537,119 | | | $ | 88,836,350 | |
| Chris H. Cheesman | $ | 2,619,879,519 | | | $ | 76,493,950 | |
| Rajesh K. Gupta | $ | 2,616,882,375 | | | $ | 79,491,094 | |
| Lynn M. Jenkins | $ | 2,607,769,137 | | | $ | 88,604,332 | |
| Gary C. Meltzer | $ | 2,616,158,906 | | | $ | 80,214,563 | |
The other directors whose term of office continued after the meeting include Jonathan S. Thomas, Thomas W. Bunn, Barry Fink, Jan M. Lewis, and Stephen E. Yates.
Proxy Voting Policies
A description of the policies that the fund's investment advisor uses in exercising the voting rights associated with the securities purchased and/or held by the fund is available without charge, upon request, by calling 1-800-378-9878. It is also available on American Century Investments’ website at americancentury.com/proxy and on the Securities and Exchange Commission’s website at sec.gov. Information regarding how the investment advisor voted proxies relating to portfolio securities during the most recent 12-month period ended June 30 is available on americancentury.com/proxy. It is also available at sec.gov.
Quarterly Portfolio Disclosure
The fund files its complete schedule of portfolio holdings with the Securities and Exchange Commission (SEC) for the first and third quarters of each fiscal year as an exhibit to its reports on Form N-PORT. These portfolio holdings are available on the fund's website at americancentury.com and, upon request, by calling 1-800-378-9878. The fund’s Form N-PORT reports are available on the SEC’s website at sec.gov.
Other Tax Information
The following information is provided pursuant to provisions of the Internal Revenue Code.
For corporate taxpayers, the fund hereby designates $2,734,807, or up to the maximum amount
allowable, of ordinary income distributions paid during the fiscal year ended December 31, 2022 as
qualified for the corporate dividends received deduction.
The fund hereby designates $4,343,034,or up to the maximum amount allowable, as long-term capital gain distributions (20% rate gain distributions) for the fiscal year ended December 31, 2022.
The fund hereby designates $1,840,479 as qualified short-term capital gain distributions for purposes of Internal Revenue Code Section 871 for the fiscal year ended December 31, 2022.
| | | | | | | | |
| |
| | |
| Contact Us | americancentury.com | |
| Automated Information Line | 1-800-345-8765 | |
| Investment Professional Service Representatives | 1-800-345-6488 | |
| Telecommunications Relay Service for the Deaf | 711 | |
| | |
| American Century Variable Portfolios, Inc. | |
| | |
Investment Advisor: American Century Investment Management, Inc. Kansas City, Missouri | |
| | |
| This report and the statements it contains are submitted for the general information of our shareholders. The report is not authorized for distribution to prospective investors unless preceded or accompanied by an effective prospectus. | |
| | |
©2023 American Century Proprietary Holdings, Inc. All rights reserved.
CL-ANN-91445 2302 | |
| | | | | |
| |
| Annual Report |
| |
| December 31, 2022 |
| |
| VP Mid Cap Value Fund |
| Class I (AVIPX) |
| Class II (AVMTX) |
| | | | | |
| Performance | |
| Portfolio Commentary | |
| Fund Characteristics | |
| Shareholder Fee Example | |
| Schedule of Investments | |
| Statement of Assets and Liabilities | |
| Statement of Operations | |
| Statement of Changes in Net Assets | |
| Notes to Financial Statements | |
| Financial Highlights | |
| Report of Independent Registered Public Accounting Firm | |
| Management | |
| |
| |
| Proxy Voting Results | 29 |
| Additional Information | |
Any opinions expressed in this report reflect those of the author as of the date of the report, and do not necessarily represent the opinions of American Century Investments® or any other person in the American Century Investments organization. Any such opinions are subject to change at any time based upon market or other conditions and American Century Investments disclaims any responsibility to update such opinions. These opinions may not be relied upon as investment advice and, because investment decisions made by American Century Investments funds are based on numerous factors, may not be relied upon as an indication of trading intent on behalf of any American Century Investments fund. Security examples are used for representational purposes only and are not intended as recommendations to purchase or sell securities. Performance information for comparative indices and securities is provided to American Century Investments by third party vendors. To the best of American Century Investments’ knowledge, such information is accurate at the time of printing.
| | | | | | | | | | | | | | | | | | |
| Total Returns as of December 31, 2022 |
| | | Average Annual Returns | |
| Ticker
Symbol | 1 year | 5 years | 10 years | | Inception
Date |
| Class I | AVIPX | -1.19% | 6.76% | 11.01% | | 12/1/04 |
| Russell Midcap Value Index | — | -12.03% | 5.72% | 10.10% | | — |
| Class II | AVMTX | -1.38% | 6.61% | 10.84% | | 10/29/04 |
Fund returns would have been lower if a portion of the fees had not been waived.
The performance information presented does not include the fees and charges assessed with investments in variable insurance products, those charges are disclosed in the separate account prospectus. The inclusion of such fees and charges would lower performance.
Data presented reflect past performance. Past performance is no guarantee of future results. Current performance may be higher or lower than the performance shown. Total returns for periods less than one year are not annualized. Investment return and principal value will fluctuate, and redemption value may be more or less than original cost. Data assumes reinvestment of dividends and capital gains, and none of the charts reflect the deduction of taxes that a shareholder would pay on fund distributions or the redemption of fund shares. To obtain performance data current to the most recent month end, please call 1-800-345-6488 or visit americancentury.com. For additional information about the fund, please consult the prospectus.
| | |
| Growth of $10,000 Over 10 Years |
| $10,000 investment made December 31, 2012 |
| Performance for other share classes will vary due to differences in fee structure. |
| | | | | |
| Value on December 31, 2022 |
| Class I — $28,418 |
|
| Russell Midcap Value Index — $26,193 |
|
| |
|
| |
|
Ending value of Class I would have been lower if a portion of the fees had not been waived.
| | | | | |
| Total Annual Fund Operating Expenses |
| Class I | Class II |
| 0.85% | 1.00% |
The total annual fund operating expenses shown is as stated in the fund’s prospectus current as of the date of this report. The prospectus may vary from the expense ratio shown elsewhere in this report because it is based on a different time period, includes acquired fund fees and expenses, and, if applicable, does not include fee waivers or expense reimbursements.
Data presented reflect past performance. Past performance is no guarantee of future results. Current performance may be higher or lower than the performance shown. Total returns for periods less than one year are not annualized. Investment return and principal value will fluctuate, and redemption value may be more or less than original cost. Data assumes reinvestment of dividends and capital gains, and none of the charts reflect the deduction of taxes that a shareholder would pay on fund distributions or the redemption of fund shares. To obtain performance data current to the most recent month end, please call 1-800-345-6488 or visit americancentury.com. For additional information about the fund, please consult the prospectus.
Portfolio Managers: Kevin Toney, Brian Woglom, Michael Liss and Nathan Rawlins
On December 31, 2022, Phillip Davidson retired from American Century Investments and left VP Mid Cap Value’s management team. In February 2022, Nathan Rawlins became a portfolio manager on the fund.
Performance Summary
VP Mid Cap Value returned -1.38%* for the 12 months ended December 31, 2022. The fund’s benchmark, the Russell Midcap Value Index, returned -12.03%. The fund’s return reflects operating expenses, while the index’s return does not.
Security selection in the health care and information technology sectors supported relative performance. An underweight in the information technology sector also benefited returns. On the other hand, our choice of stocks in the energy and materials sectors hindered relative performance. An underweight in energy also had a negative impact on results.
The portfolio buys forward foreign currency contracts for hedging purposes to help protect the fund against adverse currency movements due to holding foreign securities and to isolate stock selection as the primary driver of performance. The fund benefited from the currency hedges due to the strength of the U.S. dollar.
Health Care, Information Technology and Financials Contributed
The portfolio’s relative performance was buoyed by health care. Our choice of investments in the health care sector positively impacted relative performance, as did an overweight allocation in the health care providers and services industry. Zimmer Biomet Holdings was a top contributor. This medical device maker outperformed on continued strong orthopedics volume trends. Also, investors expect continued procedure normalization and easing supply chain-related pressures in the upcoming year.
Security selection and an underweight in the information technology sector also supported relative returns. Choices within the IT services industry contributed along with a lack of exposure to select benchmark names, including semiconductor company Marvell Technology.
The portfolio benefited from stock selection in the financials sector, and Reinsurance Group of America was a notable contributor. This global life and health reinsurance company reported strong core earnings as headwinds related to COVID-19 abated throughout the period. Shares of The Allstate Corp. advanced as the insurance company announced accelerating price increases on its automobile policies.
Energy and Materials Detracted
Security selection and an underweight in the strong performing energy sector hindered performance. A lack of exposure to select benchmark names, including Occidental Petroleum, was a main detractor. Occidental’s shares benefited from a constructive market environment for the energy sector. We hold a limited number of stocks in the sector and remain focused on companies that we view as attractively priced with solid balance sheets and strong management teams. Our positions in oil and gas exploration and production companies Devon Energy and ConocoPhillips were top contributors to overall performance for the period. We exited our position in ConocoPhillips after its shares appreciated.
*All fund returns referenced in this commentary are for Class II shares. Fund returns would have been lower if a portion of the fees had not been waived. Performance for other share classes will vary due to differences in fee structure; when Class II performance exceeds that of the fund’s benchmark, other share classes may not. See page 2 for returns for all share classes.
Within the materials sector, security selection negatively impacted relative results. Limited exposures to the cyclical chemicals and metals and mining industries were also detrimental. Few companies in these industries meet our high-quality investment criteria due to the commodity nature of their businesses.
Elsewhere, a position in Canada-based Open Text detracted. We eliminated our position in this information technology company due to its planned acquisition of Micro Focus International. We became concerned about rising leverage and operational risks stemming from the acquisition. In our view, this significantly increased the range of outcomes for this investment.
Portfolio Positioning
As of December 31, 2022, the portfolio’s largest sector overweight relative to the benchmark is health care. Our research has led us to several health care stocks that we think offer compelling risk/reward profiles. We consider health care noncyclical because demand is less impacted by the economy’s performance. Therefore, in a slowing economy, we think patients seeking elective procedures after the COVID-19 disruption should provide support to medical device companies and service providers that are working through patient backlogs.
The portfolio also ended the year with notable allocations to the consumer staples and financials sectors. We hold select companies in the consumer staples sector that we believe are trading at a discount to their intrinsic value. While input costs have risen in this inflationary environment, many consumer staples companies have been able to improve efficiencies and pass along rising costs through pricing without significantly impacting demand. We have also identified many companies in the financials sector that meet our investment criteria, particularly in the capital markets, banking and insurance industries. We remain focused on companies that, in our view, offer higher relative returns on assets, stronger capital levels, lower credit risk and management teams focused on returns and building competitive advantages.
On the other hand, we have found fewer opportunities in consumer discretionary and information technology. Our portfolio is underweight in the consumer discretionary sector because it has been difficult for us to find higher-quality consumer discretionary companies with durable business models. We also remain underweight in the information technology sector relative to the benchmark, largely due to valuations that we view as elevated.
| | | | | |
| DECEMBER 31, 2022 |
| Types of Investments in Portfolio | % of net assets |
| Common Stocks | 96.4% |
| Exchange-Traded Funds | 1.2% |
| Short-Term Investments | 2.0% |
| Other Assets and Liabilities | 0.4% |
| |
| Top Five Industries* | % of net assets |
| Equity Real Estate Investment Trusts (REITs) | 8.2% |
| Health Care Providers and Services | 7.5% |
| Capital Markets | 7.1% |
| Health Care Equipment and Supplies | 6.3% |
| Banks | 6.0% |
*Exposure indicated excludes Exchange-Traded Funds. The Schedule of Investments provides additional information on the fund’s portfolio holdings.
Fund shareholders may incur two types of costs: (1) transaction costs, including sales charges (loads) on purchase payments and redemption/exchange fees; and (2) ongoing costs, including management fees; distribution and service (12b-1) fees; and other fund expenses. This example is intended to help you understand your ongoing costs (in dollars) of investing in your fund and to compare these costs with the ongoing cost of investing in other mutual funds.
The example is based on an investment of $1,000 made at the beginning of the period and held for the entire period from July 1, 2022 to December 31, 2022.
Actual Expenses
The table provides information about actual account values and actual expenses for each class. You may use the information, together with the amount you invested, to estimate the expenses that you paid over the period. First, identify the share class you own. Then simply divide your account value by $1,000 (for example, an $8,600 account value divided by $1,000 = 8.6), then multiply the result by the number under the heading “Expenses Paid During Period” to estimate the expenses you paid on your account during this period.
Hypothetical Example for Comparison Purposes
The table also provides information about hypothetical account values and hypothetical expenses based on the actual expense ratio of each class of your fund and an assumed rate of return of 5% per year before expenses, which is not the actual return of a fund’s share class. The hypothetical account values and expenses may not be used to estimate the actual ending account balance or expenses you paid for the period. You may use this information to compare the ongoing costs of investing in your fund and other funds. To do so, compare this 5% hypothetical example with the 5% hypothetical examples that appear in the shareholder reports of the other funds.
Please note that the expenses shown in the table are meant to highlight your ongoing costs only and do not reflect any transactional costs, such as sales charges (loads) or redemption/exchange fees. Therefore, the table is useful in comparing ongoing costs only, and will not help you determine the relative total costs of owning different funds. In addition, if these transactional costs were included, your costs would have been higher.
| | | | | | | | | | | | | | |
| Beginning
Account Value
7/1/22 | Ending
Account Value
12/31/22 | Expenses Paid During Period(1) 7/1/22 - 12/31/22 | Annualized Expense Ratio(1) |
| Actual | | | | |
| Class I | $1,000 | $1,073.20 | $4.39 | 0.84% |
| Class II | $1,000 | $1,072.30 | $5.17 | 0.99% |
| Hypothetical | | | | |
| Class I | $1,000 | $1,020.97 | $4.28 | 0.84% |
| Class II | $1,000 | $1,020.22 | $5.04 | 0.99% |
(1)Expenses are equal to the class's annualized expense ratio listed in the table above, multiplied by the average account value over the period, multiplied by 184, the number of days in the most recent fiscal half-year, divided by 365, to reflect the one-half year period. Annualized expense ratio reflects actual expenses, including any applicable fee waivers or expense reimbursements and excluding any acquired fund fees and expenses.
DECEMBER 31, 2022
| | | | | | | | |
| Shares | Value |
| COMMON STOCKS — 96.4% | | |
| Aerospace and Defense — 1.2% | | |
| Huntington Ingalls Industries, Inc. | 36,361 | | $ | 8,387,755 | |
| Airlines — 1.7% | | |
Southwest Airlines Co.(1) | 336,494 | | 11,329,753 | |
| Auto Components — 2.5% | | |
Aptiv PLC(1) | 31,146 | | 2,900,627 | |
| BorgWarner, Inc. | 256,268 | | 10,314,787 | |
| Cie Generale des Etablissements Michelin SCA | 136,376 | | 3,799,063 | |
| | 17,014,477 | |
| Banks — 6.0% | | |
| First Hawaiian, Inc. | 399,793 | | 10,410,610 | |
| Prosperity Bancshares, Inc. | 121,172 | | 8,806,781 | |
| Truist Financial Corp. | 265,013 | | 11,403,509 | |
| U.S. Bancorp | 162,263 | | 7,076,289 | |
| Westamerica Bancorporation | 50,492 | | 2,979,533 | |
| | 40,676,722 | |
| Building Products — 1.0% | | |
| Cie de Saint-Gobain | 142,565 | | 6,974,393 | |
| Capital Markets — 7.1% | | |
| Ameriprise Financial, Inc. | 8,437 | | 2,627,029 | |
| Bank of New York Mellon Corp. | 372,412 | | 16,952,194 | |
| Northern Trust Corp. | 209,918 | | 18,575,644 | |
| T. Rowe Price Group, Inc. | 90,729 | | 9,894,905 | |
| | 48,049,772 | |
| Chemicals — 2.0% | | |
| Akzo Nobel NV | 107,084 | | 7,185,607 | |
Axalta Coating Systems Ltd.(1) | 245,837 | | 6,261,468 | |
| | 13,447,075 | |
| Commercial Services and Supplies — 0.4% | | |
| Republic Services, Inc. | 22,546 | | 2,908,209 | |
| Communications Equipment — 1.9% | | |
F5, Inc.(1) | 52,215 | | 7,493,375 | |
| Juniper Networks, Inc. | 172,621 | | 5,516,967 | |
| | 13,010,342 | |
| Construction and Engineering — 1.1% | | |
| Vinci SA | 72,081 | | 7,185,530 | |
| Containers and Packaging — 3.0% | | |
| Amcor PLC | 529,159 | | 6,302,284 | |
| Packaging Corp. of America | 83,791 | | 10,717,707 | |
| Sonoco Products Co. | 60,855 | | 3,694,507 | |
| | 20,714,498 | |
| Electric Utilities — 5.0% | | |
| Duke Energy Corp. | 71,801 | | 7,394,785 | |
| Edison International | 228,839 | | 14,558,737 | |
| Evergy, Inc. | 50,371 | | 3,169,847 | |
| Eversource Energy | 38,992 | | 3,269,089 | |
| Pinnacle West Capital Corp. | 72,789 | | 5,534,876 | |
| | 33,927,334 | |
| | | | | | | | |
| Shares | Value |
| Electrical Equipment — 3.8% | | |
Atkore, Inc.(1) | 26,182 | | $ | 2,969,562 | |
| Emerson Electric Co. | 102,115 | | 9,809,167 | |
| Legrand SA | 67,547 | | 5,416,033 | |
| nVent Electric PLC | 201,765 | | 7,761,900 | |
| | 25,956,662 | |
| Electronic Equipment, Instruments and Components — 1.4% | | |
| Corning, Inc. | 78,879 | | 2,519,395 | |
| TE Connectivity Ltd. | 62,587 | | 7,184,988 | |
| | 9,704,383 | |
| Energy Equipment and Services — 1.0% | | |
| Baker Hughes Co. | 224,146 | | 6,619,031 | |
| Entertainment — 0.5% | | |
| Electronic Arts, Inc. | 28,227 | | 3,448,775 | |
| Equity Real Estate Investment Trusts (REITs) — 8.2% | | |
| Equinix, Inc. | 12,390 | | 8,115,822 | |
| Essex Property Trust, Inc. | 33,985 | | 7,202,101 | |
| Healthpeak Properties, Inc. | 388,390 | | 9,736,937 | |
| Public Storage | 20,560 | | 5,760,706 | |
| Realty Income Corp. | 147,013 | | 9,325,035 | |
| Regency Centers Corp. | 134,689 | | 8,418,062 | |
| VICI Properties, Inc. | 59,747 | | 1,935,803 | |
| Weyerhaeuser Co. | 57,664 | | 1,787,584 | |
| WP Carey, Inc. | 47,771 | | 3,733,304 | |
| | 56,015,354 | |
| Food and Staples Retailing — 1.9% | | |
| Koninklijke Ahold Delhaize NV | 438,198 | | 12,598,746 | |
| Food Products — 2.9% | | |
| Conagra Brands, Inc. | 321,644 | | 12,447,623 | |
| J.M. Smucker Co. | 45,179 | | 7,159,064 | |
| | 19,606,687 | |
| Gas Utilities — 2.2% | | |
| Atmos Energy Corp. | 15,531 | | 1,740,559 | |
| Spire, Inc. | 194,766 | | 13,411,587 | |
| | 15,152,146 | |
| Health Care Equipment and Supplies — 6.3% | | |
| Baxter International, Inc. | 64,971 | | 3,311,572 | |
| Becton Dickinson and Co. | 11,505 | | 2,925,722 | |
| DENTSPLY SIRONA, Inc. | 143,166 | | 4,558,405 | |
| Embecta Corp. | 187,789 | | 4,749,184 | |
Envista Holdings Corp.(1) | 94,465 | | 3,180,637 | |
Hologic, Inc.(1) | 46,827 | | 3,503,128 | |
| Zimmer Biomet Holdings, Inc. | 161,179 | | 20,550,322 | |
| | 42,778,970 | |
| Health Care Providers and Services — 7.5% | | |
| AmerisourceBergen Corp. | 52,040 | | 8,623,548 | |
| Cardinal Health, Inc. | 41,122 | | 3,161,048 | |
| HCA Healthcare, Inc. | 7,764 | | 1,863,050 | |
Henry Schein, Inc.(1) | 138,083 | | 11,028,689 | |
| Laboratory Corp. of America Holdings | 31,885 | | 7,508,280 | |
| Quest Diagnostics, Inc. | 54,060 | | 8,457,146 | |
| Universal Health Services, Inc., Class B | 73,128 | | 10,303,004 | |
| | 50,944,765 | |
| | | | | | | | |
| Shares | Value |
| Hotels, Restaurants and Leisure — 0.9% | | |
| Sodexo SA | 66,333 | | $ | 6,346,633 | |
| Household Products — 2.5% | | |
| Henkel AG & Co. KGaA, Preference Shares | 98,558 | | 6,831,320 | |
| Kimberly-Clark Corp. | 73,821 | | 10,021,201 | |
| | 16,852,521 | |
| Insurance — 5.9% | | |
| Aflac, Inc. | 63,022 | | 4,533,803 | |
| Allstate Corp. | 106,857 | | 14,489,809 | |
| Chubb Ltd. | 8,405 | | 1,854,143 | |
| Hanover Insurance Group, Inc. | 39,477 | | 5,334,527 | |
| Reinsurance Group of America, Inc. | 53,826 | | 7,648,136 | |
| Willis Towers Watson PLC | 25,722 | | 6,291,087 | |
| | 40,151,505 | |
| IT Services — 1.1% | | |
| Amdocs Ltd. | 81,499 | | 7,408,259 | |
| Machinery — 3.2% | | |
| Cummins, Inc. | 15,787 | | 3,825,032 | |
| IMI PLC | 325,787 | | 5,088,088 | |
| Oshkosh Corp. | 142,887 | | 12,601,204 | |
| | 21,514,324 | |
| Media — 1.9% | | |
| Fox Corp., Class B | 263,166 | | 7,487,073 | |
| Omnicom Group, Inc. | 69,894 | | 5,701,253 | |
| | 13,188,326 | |
| Multiline Retail — 1.6% | | |
Dollar Tree, Inc.(1) | 75,974 | | 10,745,763 | |
| Multi-Utilities — 1.6% | | |
| NorthWestern Corp. | 180,721 | | 10,723,984 | |
| Oil, Gas and Consumable Fuels — 3.1% | | |
| Devon Energy Corp. | 38,994 | | 2,398,521 | |
| Diamondback Energy, Inc. | 32,032 | | 4,381,337 | |
| Enterprise Products Partners LP | 347,445 | | 8,380,373 | |
| EQT Corp. | 99,985 | | 3,382,493 | |
| Phillips 66 | 24,578 | | 2,558,078 | |
| | 21,100,802 | |
| Paper and Forest Products — 0.1% | | |
| Mondi PLC | 46,721 | | 790,094 | |
| Road and Rail — 0.7% | | |
| Heartland Express, Inc. | 295,442 | | 4,532,080 | |
| Semiconductors and Semiconductor Equipment — 0.9% | | |
| Applied Materials, Inc. | 31,204 | | 3,038,645 | |
| Teradyne, Inc. | 38,505 | | 3,363,412 | |
| | 6,402,057 | |
| Specialty Retail — 1.2% | | |
| Advance Auto Parts, Inc. | 55,974 | | 8,229,857 | |
| Technology Hardware, Storage and Peripherals — 0.8% | | |
| HP, Inc. | 203,624 | | 5,471,377 | |
| Thrifts and Mortgage Finance — 0.4% | | |
| Capitol Federal Financial, Inc. | 301,989 | | 2,612,205 | |
| Trading Companies and Distributors — 1.9% | | |
Beacon Roofing Supply, Inc.(1) | 69,485 | | 3,668,113 | |
| | | | | | | | |
| Shares | Value |
| MSC Industrial Direct Co., Inc., Class A | 113,871 | | $ | 9,303,261 | |
| | 12,971,374 | |
TOTAL COMMON STOCKS (Cost $596,252,013) | | 655,492,540 | |
| EXCHANGE-TRADED FUNDS — 1.2% | | |
iShares Russell Mid-Cap Value ETF(2) (Cost $7,468,631) | 75,752 | | 7,979,715 | |
| SHORT-TERM INVESTMENTS — 2.0% | | |
| Money Market Funds — 0.2% | | |
| State Street Institutional U.S. Government Money Market Fund, Premier Class | 114,604 | | 114,604 | |
State Street Navigator Securities Lending Government Money Market Portfolio(3) | 1,283,013 | | 1,283,013 | |
| | 1,397,617 | |
| Repurchase Agreements — 1.8% | | |
| BMO Capital Markets Corp., (collateralized by various U.S. Treasury obligations, 0.375% - 0.50%, 9/15/24 - 5/31/27, valued at $1,723,118), in a joint trading account at 4.20%, dated 12/30/22, due 1/3/23 (Delivery value $1,691,988) | | 1,691,199 | |
| Fixed Income Clearing Corp., (collateralized by various U.S. Treasury obligations, 1.375%, 11/15/31, valued at $10,597,881), at 4.26%, dated 12/30/22, due 1/3/23 (Delivery value $10,394,918) | | 10,390,000 | |
| | 12,081,199 | |
TOTAL SHORT-TERM INVESTMENTS (Cost $13,478,816) | | 13,478,816 | |
TOTAL INVESTMENT SECURITIES—99.6% (Cost $617,199,460) | | 676,951,071 | |
| OTHER ASSETS AND LIABILITIES — 0.4% | | 2,973,784 | |
| TOTAL NET ASSETS — 100.0% | | $ | 679,924,855 | |
| | | | | | | | | | | | | | | | | | | | |
| FORWARD FOREIGN CURRENCY EXCHANGE CONTRACTS |
| Currency Purchased | Currency Sold | Counterparty | Settlement
Date | Unrealized Appreciation (Depreciation) |
| USD | 47,205,527 | | EUR | 44,085,013 | | JPMorgan Chase Bank N.A. | 3/31/23 | $ | (266,731) | |
| USD | 1,150,671 | | EUR | 1,080,122 | | JPMorgan Chase Bank N.A. | 3/31/23 | (12,441) | |
| GBP | 137,647 | | USD | 167,714 | | Bank of America N.A. | 3/31/23 | (950) | |
| GBP | 133,209 | | USD | 161,049 | | Bank of America N.A. | 3/31/23 | 337 | |
| GBP | 147,534 | | USD | 178,006 | | Bank of America N.A. | 3/31/23 | 736 | |
| GBP | 168,262 | | USD | 203,450 | | Bank of America N.A. | 3/31/23 | 403 | |
| USD | 5,858,192 | | GBP | 4,805,243 | | Bank of America N.A. | 3/31/23 | 36,508 | |
| NOK | 634,186 | | USD | 64,447 | | UBS AG | 3/31/23 | 533 | |
| NOK | 882,537 | | USD | 89,563 | | UBS AG | 3/31/23 | 864 | |
| NOK | 469,820 | | USD | 47,787 | | UBS AG | 3/31/23 | 353 | |
| NOK | 665,352 | | USD | 67,715 | | UBS AG | 3/31/23 | 459 | |
| NOK | 1,195,614 | | USD | 122,323 | | UBS AG | 3/31/23 | 183 | |
| USD | 389,979 | | NOK | 3,847,509 | | UBS AG | 3/31/23 | (4,248) | |
| | | | | | $ | (243,994) | |
| | | | | | | | |
| NOTES TO SCHEDULE OF INVESTMENTS |
| EUR | – | Euro |
| GBP | – | British Pound |
| NOK | – | Norwegian Krone |
| USD | – | United States Dollar |
(1)Non-income producing.
(2)Security, or a portion thereof, is on loan. At the period end, the aggregate value of securities on loan was $1,263,869. The amount of securities on loan indicated may not correspond with the securities on loan identified because securities with pending sales are in the process of recall from the brokers.
(3)Investment of cash collateral from securities on loan. At the period end, the aggregate value of the collateral held by the fund was $1,289,847, which includes securities collateral of $6,834.
See Notes to Financial Statements.
| | |
| Statement of Assets and Liabilities |
| | | | | |
| DECEMBER 31, 2022 |
| Assets | |
| Investment securities, at value (cost of $615,916,447) — including $1,263,869 of securities on loan | $ | 675,668,058 | |
| Investment made with cash collateral received for securities on loan, at value (cost of $1,283,013) | 1,283,013 | |
| Total investment securities, at value (cost of $617,199,460) | 676,951,071 | |
| Receivable for investments sold | 2,570,756 | |
| Receivable for capital shares sold | 1,261,746 | |
| Unrealized appreciation on forward foreign currency exchange contracts | 40,376 | |
| Dividends and interest receivable | 1,549,245 | |
| Securities lending receivable | 5,828 | |
| 682,379,022 | |
| |
| Liabilities | |
| Payable for collateral received for securities on loan | 1,283,013 | |
| Payable for investments purchased | 66,853 | |
| Payable for capital shares redeemed | 237,225 | |
| Unrealized depreciation on forward foreign currency exchange contracts | 284,370 | |
| Accrued management fees | 451,557 | |
| Distribution fees payable | 108,449 | |
| Accrued other expenses | 22,700 | |
| 2,454,167 | |
| |
| Net Assets | $ | 679,924,855 | |
| |
| Net Assets Consist of: | |
| Capital (par value and paid-in surplus) | $ | 553,653,801 | |
| Distributable earnings | 126,271,054 | |
| $ | 679,924,855 | |
| | | | | | | | | | | |
| Net Assets | Shares Outstanding | Net Asset Value Per Share |
| Class I, $0.01 Par Value | $172,439,642 | 8,153,847 | $21.15 |
| Class II, $0.01 Par Value | $507,485,213 | 23,971,499 | $21.17 |
See Notes to Financial Statements.
| | | | | |
| YEAR ENDED DECEMBER 31, 2022 |
| Investment Income (Loss) | |
| Income: | |
| Dividends (net of foreign taxes withheld of $215,695) | $ | 18,245,005 | |
| Interest | 249,192 | |
| Securities lending, net | 27,546 | |
| 18,521,743 | |
| |
| Expenses: | |
| Management fees | 5,288,249 | |
| Distribution fees - Class II | 1,270,558 | |
| Directors' fees and expenses | 18,853 | |
| Other expenses | 22,937 | |
| 6,600,597 | |
Fees waived(1) | (404,398) | |
| 6,196,199 | |
| |
| Net investment income (loss) | 12,325,544 | |
| |
| Realized and Unrealized Gain (Loss) | |
| Net realized gain (loss) on: | |
| Investment transactions | 72,076,934 | |
| Forward foreign currency exchange contract transactions | 3,231,421 | |
| Foreign currency translation transactions | (34,293) | |
| 75,274,062 | |
| |
| Change in net unrealized appreciation (depreciation) on: | |
| Investments | (98,424,727) | |
| Forward foreign currency exchange contracts | 275,814 | |
| Translation of assets and liabilities in foreign currencies | (905) | |
| (98,149,818) | |
| |
| Net realized and unrealized gain (loss) | (22,875,756) | |
| |
| Net Increase (Decrease) in Net Assets Resulting from Operations | $ | (10,550,212) | |
(1)Amount consists of $102,479 and $301,919 for Class I and Class II, respectively.
See Notes to Financial Statements.
| | |
| Statement of Changes in Net Assets |
| | | | | | | | |
| YEARS ENDED DECEMBER 31, 2022 AND DECEMBER 31, 2021 |
| Increase (Decrease) in Net Assets | December 31, 2022 | December 31, 2021 |
| Operations | | |
| Net investment income (loss) | $ | 12,325,544 | | $ | 9,451,496 | |
| Net realized gain (loss) | 75,274,062 | | 104,441,140 | |
| Change in net unrealized appreciation (depreciation) | (98,149,818) | | 25,756,009 | |
| Net increase (decrease) in net assets resulting from operations | (10,550,212) | | 139,648,645 | |
| | |
| Distributions to Shareholders | | |
| From earnings: | | |
| Class I | (26,913,122) | | (2,059,978) | |
| Class II | (79,503,955) | | (5,354,430) | |
| Decrease in net assets from distributions | (106,417,077) | | (7,414,408) | |
| | |
| Capital Share Transactions | | |
| Net increase (decrease) in net assets from capital share transactions (Note 5) | 73,062,864 | | (33,262,683) | |
| | |
| Net increase (decrease) in net assets | (43,904,425) | | 98,971,554 | |
| | |
| Net Assets | | |
| Beginning of period | 723,829,280 | | 624,857,726 | |
| End of period | $ | 679,924,855 | | $ | 723,829,280 | |
See Notes to Financial Statements.
| | |
| Notes to Financial Statements |
DECEMBER 31, 2022
1. Organization
American Century Variable Portfolios, Inc. (the corporation) is registered under the Investment Company Act of 1940, as amended (the 1940 Act), as an open-end management investment company and is organized as a Maryland corporation. VP Mid Cap Value Fund (the fund) is one fund in a series issued by the corporation. The fund’s investment objective is to seek long-term capital growth. Income is a secondary objective. The fund offers Class I and Class II.
2. Significant Accounting Policies
The following is a summary of significant accounting policies consistently followed by the fund in preparation of its financial statements. The fund is an investment company and follows accounting and reporting guidance in accordance with accounting principles generally accepted in the United States of America. This may require management to make certain estimates and assumptions at the date of the financial statements. Actual results could differ from these estimates. Management evaluated the impact of events or transactions occurring through the date the financial statements were issued that would merit recognition or disclosure.
Investment Valuations — The fund determines the fair value of its investments and computes its net asset value (NAV) per share at the close of regular trading (usually 4 p.m. Eastern time) on the New York Stock Exchange (NYSE) on each day the NYSE is open. The value of investments of the fund is determined by American Century Investment Management, Inc. (ACIM) (the investment advisor), as the valuation designee, pursuant to its valuation policies and procedures. The Board of Directors oversees the valuation designee and reviews its valuation policies and procedures at least annually.
Equity securities that are listed or traded on a domestic securities exchange are valued at the last reported sales price or at the official closing price as provided by the exchange. Equity securities traded on foreign securities exchanges are generally valued at the closing price of such securities on the exchange where primarily traded or at the close of the NYSE, if that is earlier. If no last sales price is reported, or if local convention or regulation so provides, the mean of the latest bid and asked prices may be used. Securities traded over-the-counter are valued at the mean of the latest bid and asked prices, the last sales price, or the official closing price. Equity securities initially expressed in local currencies are translated into U.S. dollars at the mean of the appropriate currency exchange rate at the close of the NYSE as provided by an independent pricing service.
Open-end management investment companies are valued at the reported NAV per share. Repurchase agreements are valued at cost, which approximates fair value. Forward foreign currency exchange contracts are valued at the mean of the appropriate forward exchange rate at the close of the NYSE as provided by an independent pricing service.
If the valuation designee determines that the market price for a portfolio security is not readily available or is believed by the valuation designee to be unreliable, such security is valued at fair value as determined in good faith by the valuation designee, in accordance with its policies and procedures. Circumstances that may cause the fund to determine that market quotations are not available or reliable include, but are not limited to: when there is a significant event subsequent to the market quotation; trading in a security has been halted during the trading day; or trading in a security is insufficient or did not take place due to a closure or holiday.
The valuation designee monitors for significant events occurring after the close of an investment’s primary exchange but before the fund’s NAV per share is determined. Significant events may include, but are not limited to: corporate announcements and transactions; regulatory news, governmental action and political unrest that could impact a specific investment or an investment sector; or armed conflicts, natural disasters and similar events that could affect investments in a specific country or region. The valuation designee also monitors for significant fluctuations between domestic and foreign markets, as evidenced by the U.S. market or such other indicators that it deems appropriate. The valuation designee may apply a model-derived factor to the closing price of equity securities traded on foreign securities exchanges. The factor is based on observable market data as provided by an independent pricing service.
Security Transactions — Security transactions are accounted for as of the trade date. Net realized gains and losses are determined on the identified cost basis, which is also used for federal income tax purposes.
Investment Income — Dividend income less foreign taxes withheld, if any, is recorded as of the ex-dividend date. Distributions received on securities that represent a return of capital or long-term capital gain are recorded as a reduction of cost of investments and/or as a realized gain. The fund may estimate the components of distributions received that may be considered nontaxable distributions or long-term capital gain distributions for income tax purposes. Interest income is recorded on the accrual basis and includes accretion of discounts and amortization of premiums. Securities lending income is net of fees and rebates earned by the lending agent for its services.
Foreign Currency Translations — All assets and liabilities initially expressed in foreign currencies are translated into U.S. dollars at prevailing exchange rates at period end. The fund may enter into spot foreign currency exchange contracts to facilitate transactions denominated in a foreign currency. Purchases and sales of investment securities, dividend and interest income, spot foreign currency exchange contracts, and expenses are translated at the rates of exchange prevailing on the respective dates of such transactions. Net realized and unrealized foreign currency exchange gains or losses related to investment securities are a component of net realized gain (loss) on investment transactions and change in net unrealized appreciation (depreciation) on investments, respectively.
Repurchase Agreements — The fund may enter into repurchase agreements with institutions that ACIM has determined are creditworthy pursuant to criteria adopted by the Board of Directors. The fund requires that the collateral, represented by securities, received in a repurchase transaction be transferred to the custodian in a manner sufficient to enable the fund to obtain those securities in the event of a default under the repurchase agreement. ACIM monitors, on a daily basis, the securities transferred to ensure the value, including accrued interest, of the securities under each repurchase agreement is equal to or greater than amounts owed to the fund under each repurchase agreement.
Joint Trading Account — Pursuant to an Exemptive Order issued by the Securities and Exchange Commission, the fund, along with certain other funds in the American Century Investments family of funds, may transfer uninvested cash balances into a joint trading account. These balances are invested in one or more repurchase agreements that are collateralized by U.S. Treasury or Agency obligations.
Segregated Assets — In accordance with the 1940 Act, the fund segregates assets on its books and records to cover certain types of investment securities and other financial instruments. ACIM monitors, on a daily basis, the securities segregated to ensure the fund designates a sufficient amount of liquid assets, marked-to-market daily. The fund may also receive assets or be required to pledge assets at the custodian bank or with a broker for collateral requirements. The fund may incur charges or earn income on posted collateral balances, which are reflected in interest expenses or interest income, respectively.
Income Tax Status — It is the fund's policy to distribute substantially all net investment income and net realized gains to shareholders and to otherwise qualify as a regulated investment company under provisions of the Internal Revenue Code. Accordingly, no provision has been made for income taxes. The fund files U.S. federal, state, local and non-U.S. tax returns as applicable. The fund's tax returns are subject to examination by the relevant taxing authority until expiration of the applicable statute of limitations, which is generally three years from the date of filing but can be longer in certain jurisdictions. At this time, management believes there are no uncertain tax positions which, based on their technical merit, would not be sustained upon examination and for which it is reasonably possible that the total amounts of unrecognized tax benefits will significantly change in the next twelve months.
Multiple Class — All shares of the fund represent an equal pro rata interest in the net assets of the class to which such shares belong, and have identical voting, dividend, liquidation and other rights and the same terms and conditions, except for class specific expenses and exclusive rights to vote on matters affecting only individual classes. Income, non-class specific expenses, and realized and unrealized capital gains and losses of the fund are allocated to each class of shares based on their relative net assets.
Distributions to Shareholders — Distributions from net investment income, if any, are generally declared and paid quarterly. Distributions from net realized gains, if any, are generally declared and paid annually.
Indemnifications — Under the corporation’s organizational documents, its officers and directors are indemnified against certain liabilities arising out of the performance of their duties to the fund. In addition, in the normal course of business, the fund enters into contracts that provide general indemnifications. The maximum exposure under these arrangements is unknown as this would involve future claims that may be made against a fund. The risk of material loss from such claims is considered by management to be remote.
Securities Lending — Securities are lent to qualified financial institutions and brokers. State Street Bank & Trust Co. serves as securities lending agent to the fund pursuant to a Securities Lending Agreement. The lending of securities exposes the fund to risks such as: the borrowers may fail to return the loaned securities, the borrowers may not be able to provide additional collateral, the fund may experience delays in recovery of the loaned securities or delays in access to collateral, or the fund may experience losses related to the investment collateral. To minimize certain risks, loan counterparties pledge collateral in the form of cash and/or securities. The lending agent has agreed to indemnify the fund in the case of default of any securities borrowed. Cash collateral received is invested in the State Street Navigator Securities Lending Government Money Market Portfolio, a money market mutual fund registered under the 1940 Act. The loans may also be secured by U.S. government securities in an amount at least equal to the market value of the securities loaned, plus accrued interest and dividends, determined on a daily basis and adjusted accordingly. By lending securities, the fund seeks to increase its net investment income through the receipt of interest and fees. Such income is reflected separately within the Statement of Operations. The value of loaned securities and related collateral outstanding at period end, if any, are shown on a gross basis within the Schedule of Investments and Statement of Assets and Liabilities.
The following table reflects a breakdown of transactions accounted for as secured borrowings, the gross obligation by the type of collateral pledged, and the remaining contractual maturity of those transactions as of December 31, 2022.
| | | | | | | | | | | | | | | | | |
| Remaining Contractual Maturity of Agreements |
| Overnight and Continuous | <30 days | Between 30 & 90 days | >90 days | Total |
Securities Lending Transactions(1) | | | | |
| Exchange-Traded Funds | $ | 1,283,013 | | — | | — | | — | | $ | 1,283,013 | |
| Gross amount of recognized liabilities for securities lending transactions | $ | 1,283,013 | |
(1)Amount represents the payable for cash collateral received for securities on loan. This will generally be in the Overnight and Continuous column as the securities are typically callable on demand.
3. Fees and Transactions with Related Parties
Certain officers and directors of the corporation are also officers and/or directors of American Century Companies, Inc. (ACC). The corporation's investment advisor, ACIM, the corporation's distributor, American Century Investment Services, Inc. (ACIS), and the corporation's transfer agent, American Century Services, LLC, are wholly owned, directly or indirectly, by ACC.
Management Fees — The corporation has entered into a management agreement with ACIM, under which ACIM provides the fund with investment advisory and management services in exchange for a single, unified management fee (the fee) per class. The agreement provides that ACIM will pay all expenses of managing and operating the fund, except brokerage expenses, taxes, interest, fees and expenses of the independent directors (including legal counsel fees), extraordinary expenses, and expenses incurred in connection with the provision of shareholder services and distribution services under a plan adopted pursuant to Rule 12b-1 under the 1940 Act. The fee is computed and accrued daily based on each class's daily net assets and paid monthly in arrears. The difference in the fee among the classes is a result of their separate arrangements for non-Rule 12b-1 shareholder services. It is not the result of any difference in advisory or custodial fees or other expenses related to the management of the fund’s assets, which do not vary by class. From January 1, 2022 through July 31, 2022, the investment advisor agreed to waive 0.10% of the fund's management fee. Effective August 1, 2022, the investment advisor terminated the waiver.
The annual management fee and the effective annual management fee after waiver for each class for the period ended December 31, 2022 are as follows:
| | | | | | | | |
| Annual Management Fee | Effective Annual Management Fee After Waiver |
| Class I | 0.85% | 0.79% |
| Class II | 0.75% | 0.69% |
Distribution Fees — The Board of Directors has adopted the Master Distribution Plan (the plan) for Class II, pursuant to Rule 12b-1 of the 1940 Act. The plan provides that Class II will pay ACIS an annual distribution fee equal to 0.25%. The fee is computed and accrued daily based on the Class II daily net assets and paid monthly in arrears. The distribution fee provides compensation for expenses incurred in connection with distributing shares of Class II including, but not limited to, payments to brokers, dealers, and financial institutions that have entered into sales agreements with respect to shares of the fund. Fees incurred under the plan during the period ended December 31, 2022 are detailed in the Statement of Operations.
Directors' Fees and Expenses — The Board of Directors is responsible for overseeing the investment advisor’s management and operations of the fund. The directors receive detailed information about the fund and its investment advisor regularly throughout the year, and meet at least quarterly with management of the investment advisor to review reports about fund operations. The fund's officers do not receive compensation from the fund.
Interfund Transactions — The fund may enter into security transactions with other American Century Investments funds and other client accounts of the investment advisor, in accordance with the 1940 Act rules and procedures adopted by the Board of Directors. The rules and procedures require, among other things, that these transactions be effected at the independent current market price of the security. During the period, the interfund purchases were $1,005,385 and there were no interfund sales.
4. Investment Transactions
Purchases and sales of investment securities, excluding short-term investments, for the period ended December 31, 2022 were $496,082,170 and $512,547,286, respectively.
5. Capital Share Transactions
Transactions in shares of the fund were as follows:
| | | | | | | | | | | | | | |
| Year ended December 31, 2022 | Year ended December 31, 2021 |
| Shares | Amount | Shares | Amount |
| Class I/Shares Authorized | 130,000,000 | | | 130,000,000 | | |
| Sold | 1,257,328 | | $ | 27,956,845 | | 1,258,616 | | $ | 29,523,840 | |
| Issued in reinvestment of distributions | 1,177,699 | | 26,382,341 | | 83,578 | | 2,013,237 | |
| Redeemed | (1,563,199) | | (34,882,182) | | (1,797,303) | | (42,297,390) | |
| 871,828 | | 19,457,004 | | (455,109) | | (10,760,313) | |
| Class II/Shares Authorized | 225,000,000 | | | 225,000,000 | | |
| Sold | 3,607,445 | | 79,496,406 | | 2,765,425 | | 65,709,983 | |
| Issued in reinvestment of distributions | 3,539,686 | | 79,503,955 | | 222,015 | | 5,354,430 | |
| Redeemed | (4,798,822) | | (105,394,501) | | (4,014,944) | | (93,566,783) | |
| 2,348,309 | | 53,605,860 | | (1,027,504) | | (22,502,370) | |
| Net increase (decrease) | 3,220,137 | | $ | 73,062,864 | | (1,482,613) | | $ | (33,262,683) | |
6. Fair Value Measurements
The fund's investments valuation process is based on several considerations and may use multiple inputs to determine the fair value of the investments held by the fund. In conformity with accounting principles generally accepted in the United States of America, the inputs used to determine a valuation are classified into three broad levels.
•Level 1 valuation inputs consist of unadjusted quoted prices in an active market for identical investments.
•Level 2 valuation inputs consist of direct or indirect observable market data (including quoted prices for comparable investments, evaluations of subsequent market events, interest rates, prepayment speeds, credit risk, etc.). These inputs also consist of quoted prices for identical investments initially expressed in local currencies that are adjusted through translation into U.S. dollars.
•Level 3 valuation inputs consist of unobservable data (including a fund’s own assumptions).
The level classification is based on the lowest level input that is significant to the fair valuation measurement. The valuation inputs are not necessarily an indication of the risks associated with investing in these securities or other financial instruments.
The following is a summary of the level classifications as of period end. The Schedule of Investments provides additional information on the fund's portfolio holdings.
| | | | | | | | | | | |
| Level 1 | Level 2 | Level 3 |
| Assets | | | |
| Investment Securities | | | |
| Common Stocks | | | |
| Auto Components | $ | 13,215,414 | | $ | 3,799,063 | | — | |
| Building Products | — | | 6,974,393 | | — | |
| Chemicals | 6,261,468 | | 7,185,607 | | — | |
| Construction and Engineering | — | | 7,185,530 | | — | |
| Electrical Equipment | 20,540,629 | | 5,416,033 | | — | |
| Food and Staples Retailing | — | | 12,598,746 | | — | |
| Hotels, Restaurants and Leisure | — | | 6,346,633 | | — | |
| Household Products | 10,021,201 | | 6,831,320 | | — | |
| Machinery | 16,426,236 | | 5,088,088 | | — | |
| Paper and Forest Products | — | | 790,094 | | — | |
| Other Industries | 526,812,085 | | — | | — | |
| Exchange-Traded Funds | 7,979,715 | | — | | — | |
| Short-Term Investments | 1,397,617 | | 12,081,199 | | — | |
| $ | 602,654,365 | | $ | 74,296,706 | | — | |
| Other Financial Instruments | | | |
| Forward Foreign Currency Exchange Contracts | — | | $ | 40,376 | | — | |
| | | |
| Liabilities | | | |
| Other Financial Instruments | | | |
| Forward Foreign Currency Exchange Contracts | — | | $ | 284,370 | | — | |
7. Derivative Instruments
Foreign Currency Risk — The fund is subject to foreign currency exchange rate risk in the normal course of pursuing its investment objectives. The value of foreign investments held by a fund may be significantly affected by changes in foreign currency exchange rates. The dollar value of a foreign security generally decreases when the value of the dollar rises against the foreign currency in which the security is denominated and tends to increase when the value of the dollar declines against such foreign currency. A fund may enter into forward foreign currency exchange contracts to reduce a fund's exposure to foreign currency exchange rate fluctuations. The net U.S. dollar value of foreign currency underlying all contractual commitments held by a fund and the resulting unrealized appreciation or depreciation are determined daily. Realized gain or loss is recorded upon settlement of the contract. Net realized and unrealized gains or losses occurring during the holding period of forward foreign currency exchange contracts are a component of net realized gain (loss) on forward foreign currency exchange contract transactions and change in net unrealized appreciation (depreciation) on forward foreign currency exchange contracts, respectively. A fund bears the risk of an unfavorable change in the foreign currency exchange rate underlying the forward contract. Additionally, losses, up to the fair value, may arise if the counterparties do not perform under the contract terms. The fund's average U.S. dollar exposure to foreign currency risk derivative instruments held during the period was $54,062,123.
The value of foreign currency risk derivative instruments as of December 31, 2022, is disclosed on the Statement of Assets and Liabilities as an asset of $40,376 in unrealized appreciation on forward foreign currency exchange contracts and a liability of $284,370 in unrealized depreciation on forward foreign currency exchange contracts. For the year ended December 31, 2022, the effect of foreign currency risk derivative instruments on the Statement of Operations was $3,231,421 in net realized gain (loss) on forward foreign currency exchange contract transactions and $275,814 in change in net unrealized appreciation (depreciation) on forward foreign currency exchange contracts.
8. Risk Factors
The value of the fund’s shares will go up and down, sometimes rapidly or unpredictably, based on the performance of the securities owned by the fund and other factors generally affecting the securities market. Market risks, including political, regulatory, economic and social developments, can affect the value of the fund’s investments. Natural disasters, public health emergencies, war, terrorism and other unforeseeable events may lead to increased market volatility and may have adverse long-term effects on world economies and markets generally.
There are certain risks involved in investing in foreign securities. These risks include those resulting from political events (such as civil unrest, national elections and imposition of exchange controls), social and economic events (such as labor strikes and rising inflation), and natural disasters. Securities of foreign issuers may be less liquid and more volatile. Investing a significant portion of assets in one country or region may accentuate these risks.
9. Federal Tax Information
The tax character of distributions paid during the years ended December 31, 2022 and December 31, 2021 were as follows:
| | | | | | | | |
| 2022 | 2021 |
| Distributions Paid From | | |
| Ordinary income | $ | 34,551,189 | | $ | 7,414,408 | |
| Long-term capital gains | $ | 71,865,888 | | — | |
The book-basis character of distributions made during the year from net investment income or net realized gains may differ from their ultimate characterization for federal income tax purposes. These differences reflect the differing character of certain income items and net realized gains and losses for financial statement and tax purposes, and may result in reclassification among certain capital accounts on the financial statements.
As of period end, the federal tax cost of investments and the components of distributable earnings on a tax-basis were as follows:
| | | | | |
| Federal tax cost of investments | $ | 627,140,408 | |
| Gross tax appreciation of investments | $ | 75,724,708 | |
| Gross tax depreciation of investments | (25,914,045) | |
| Net tax appreciation (depreciation) of investments | 49,810,663 | |
| Net tax appreciation (depreciation) on derivatives and translation of assets and liabilities in foreign currencies | (621) | |
| Net tax appreciation (depreciation) | $ | 49,810,042 | |
| Undistributed ordinary income | $ | 9,588,777 | |
| Accumulated long-term gains | $ | 66,872,235 | |
The difference between book-basis and tax-basis unrealized appreciation (depreciation) is attributable primarily to the tax deferral of losses on wash sales.
| | | | | | | | | | | | | | | | | | | | | | | | | | | | | | | | | | | | | | | | | | | | | | | |
| For a Share Outstanding Throughout the Years Ended December 31 (except as noted) | | | | | | | | |
| Per-Share Data | Ratios and Supplemental Data | | | |
| | Income From Investment Operations: | Distributions From: | | | Ratio to Average Net Assets of: | | |
| Net Asset
Value,
Beginning
of Period | Net Investment Income (Loss)(1) | Net Realized and
Unrealized Gain (Loss) | Total From Investment Operations | Net
Investment Income | Net
Realized
Gains | Total
Distributions | Net Asset
Value,
End of Period | Total Return(2) | Operating
Expenses | Operating
Expenses
(before
expense
waiver) | Net
Investment
Income
(Loss) | Net Investment Income (Loss) (before expense waiver) | Portfolio Turnover
Rate | Net
Assets,
End of
Period (in thousands) |
| Class I | | | | | | | | | | | | | | |
| 2022 | $25.03 | 0.42 | (0.57) | (0.15) | (0.50) | (3.23) | (3.73) | $21.15 | (1.19)% | 0.80% | 0.86% | 1.92% | 1.86% | 74% | $172,440 | |
| 2021 | $20.55 | 0.34 | 4.41 | 4.75 | (0.27) | — | (0.27) | $25.03 | 23.20% | 0.80% | 0.94% | 1.47% | 1.33% | 53% | $182,236 | |
| 2020 | $20.68 | 0.30 | (0.10) | 0.20 | (0.33) | — | (0.33) | $20.55 | 1.21% | 0.85% | 1.00% | 1.69% | 1.54% | 72% | $158,968 | |
| 2019 | $18.31 | 0.35 | 4.62 | 4.97 | (0.41) | (2.19) | (2.60) | $20.68 | 29.15% | 0.85% | 1.00% | 1.66% | 1.51% | 41% | $173,105 | |
| 2018 | $22.75 | 0.29 | (3.04) | (2.75) | (0.31) | (1.38) | (1.69) | $18.31 | (12.84)% | 0.84% | 1.00% | 1.31% | 1.15% | 72% | $424,234 | |
| Class II | | | | | | | | | | | | | | |
| 2022 | $25.05 | 0.39 | (0.57) | (0.18) | (0.47) | (3.23) | (3.70) | $21.17 | (1.38)% | 0.95% | 1.01% | 1.77% | 1.71% | 74% | $507,485 | |
| 2021 | $20.57 | 0.31 | 4.41 | 4.72 | (0.24) | — | (0.24) | $25.05 | 23.02% | 0.95% | 1.09% | 1.32% | 1.18% | 53% | $541,594 | |
| 2020 | $20.70 | 0.28 | (0.10) | 0.18 | (0.31) | — | (0.31) | $20.57 | 1.11% | 1.00% | 1.15% | 1.54% | 1.39% | 72% | $465,890 | |
| 2019 | $18.32 | 0.30 | 4.65 | 4.95 | (0.38) | (2.19) | (2.57) | $20.70 | 28.99% | 1.00% | 1.15% | 1.51% | 1.36% | 41% | $497,924 | |
| 2018 | $22.76 | 0.24 | (3.03) | (2.79) | (0.27) | (1.38) | (1.65) | $18.32 | (12.96)% | 0.99% | 1.15% | 1.16% | 1.00% | 72% | $424,219 | |
| | |
| Notes to Financial Highlights |
(1)Computed using average shares outstanding throughout the period.
(2)Total returns are calculated based on the net asset value of the last business day. Total returns for periods less than one year are not annualized. The total returns presented do not include the fees and charges assessed with investments in variable insurance products, those charges are disclosed in the separate account prospectus. The inclusion of such fees and charges would lower total return.
See Notes to Financial Statements.
| | |
| Report of Independent Registered Public Accounting Firm |
To the Shareholders and the Board of Directors of American Century Variable Portfolios, Inc.:
Opinion on the Financial Statements and Financial Highlights
We have audited the accompanying statement of assets and liabilities, including the schedule of investments, of VP Mid Cap Value Fund (the “Fund”), one of the funds constituting the American Century Variable Portfolios, Inc., as of December 31, 2022, the related statement of operations for the year then ended, the statements of changes in net assets for each of the two years in the period then ended, the financial highlights for each of the five years in the period then ended, and the related notes. In our opinion, the financial statements and financial highlights present fairly, in all material respects, the financial position of VP Mid Cap Value Fund of the American Century Variable Portfolios, Inc. as of December 31, 2022, and the results of its operations for the year then ended, the changes in its net assets for each of the two years in the period then ended, and the financial highlights for each of the five years in the period then ended, in conformity with accounting principles generally accepted in the United States of America.
Basis for Opinion
These financial statements and financial highlights are the responsibility of the Fund's management. Our responsibility is to express an opinion on the Fund’s financial statements and financial highlights based on our audits. We are a public accounting firm registered with the Public Company Accounting Oversight Board (United States) (PCAOB) and are required to be independent with respect to the Fund in accordance with the U.S. federal securities laws and the applicable rules and regulations of the Securities and Exchange Commission and the PCAOB.
We conducted our audits in accordance with the standards of the PCAOB. Those standards require that we plan and perform the audit to obtain reasonable assurance about whether the financial statements and financial highlights are free of material misstatement, whether due to error or fraud. The Fund is not required to have, nor were we engaged to perform, an audit of its internal control over financial reporting. As part of our audits, we are required to obtain an understanding of internal control over financial reporting but not for the purpose of expressing an opinion on the effectiveness of the Fund’s internal control over financial reporting. Accordingly, we express no such opinion.
Our audits included performing procedures to assess the risks of material misstatement of the financial statements and financial highlights, whether due to error or fraud, and performing procedures that respond to those risks. Such procedures included examining, on a test basis, evidence regarding the amounts and disclosures in the financial statements and financial highlights. Our audits also included evaluating the accounting principles used and significant estimates made by management, as well as evaluating the overall presentation of the financial statements and financial highlights. Our procedures included confirmation of securities owned as of December 31, 2022, by correspondence with the custodian and brokers; when replies were not received from brokers, we performed other auditing procedures. We believe that our audits provide a reasonable basis for our opinion.
/s/ Deloitte & Touche LLP
Kansas City, Missouri
February 10, 2023
We have served as the auditor of one or more American Century investment companies since 1997.
The Board of Directors
The individuals listed below serve as directors of the funds. Each director will continue to serve in this capacity until death, retirement, resignation or removal from office. The board has adopted a mandatory retirement age for directors who are not “interested persons,” as that term is defined in the Investment Company Act (independent directors). Independent directors shall retire on December 31 of the year in which they reach their 75th birthday.
Jonathan S. Thomas is an “interested person” because he currently serves as President and Chief Executive Officer of American Century Companies, Inc. (ACC), the parent company of American Century Investment Management, Inc. (ACIM or the advisor). The other directors (more than three-fourths of the total number) are independent. They are not employees, directors or officers of, and have no financial interest in, ACC or any of its wholly owned, direct or indirect, subsidiaries, including ACIM, American Century Investment Services, Inc. (ACIS) and American Century Services, LLC (ACS), and they do not have any other affiliations, positions or relationships that would cause them to be considered “interested persons” under the Investment Company Act. The directors serve in this capacity for seven (in the case of Jonathan S. Thomas, 16; and Stephen E. Yates, 8) registered investment companies in the American Century Investments family of funds.
The following table presents additional information about the directors. The mailing address for each director is 4500 Main Street, Kansas City, Missouri 64111.
| | | | | | | | | | | | | | | | | |
Name
(Year of Birth) | Position(s) Held with Funds | Length of Time Served | Principal Occupation(s) During Past 5 Years | Number of American Century Portfolios Overseen by Director | Other Directorships Held During Past 5 Years |
| Independent Directors | | |
Brian Bulatao
(1964) | Director | Since 2022 | Chief Administrative Officer, Activision Blizzard, Inc. (2021 to present); Under Secretary of State for Management, U.S. Department of State (2018 to 2021); Chief Operating Officer, Central Intelligence Agency (2017 to 2018) | 64 | None |
| Thomas W. Bunn (1953) | Director | Since 2017 | Retired | 64 | None |
Chris H. Cheesman
(1962)
| Director | Since 2019
| Retired. Senior Vice President & Chief Audit Executive, AllianceBernstein (1999 to 2018)
| 64 | Alleghany Corporation (2021 to 2022) |
Barry Fink
(1955) | Director | Since 2012 (independent since 2016) | Retired | 64 | None |
Rajesh K. Gupta
(1960)
| Director | Since 2019
| Partner Emeritus, SeaCrest Investment Management and SeaCrest Wealth Management (2019 to Present); Chief Executive Officer and Chief Investment Officer, SeaCrest Investment Management (2006 to 2019); Chief Executive Officer and Chief Investment Officer, SeaCrest Wealth Management (2008 to 2019) | 64 | None |
| | | | | | | | | | | | | | | | | |
Name
(Year of Birth) | Position(s) Held with Funds | Length of Time Served | Principal Occupation(s) During Past 5 Years | Number of American Century Portfolios Overseen by Director | Other Directorships Held During Past 5 Years |
| Independent Directors | | |
Lynn Jenkins
(1963)
| Director | Since 2019
| Consultant, LJ Strategies (2019 to present); United States Representative, U.S. House of Representatives (2009 to 2018) | 64 | MGP Ingredients, Inc. (2019 to 2021) |
Jan M. Lewis
(1957) | Director and Board Chair | Since 2011 (Board Chair since 2022) | Retired | 64 | None |
Gary C. Meltzer
(1963) | Director | Since 2022 | Advisor, Pontoro (2021 to present); Executive Advisor, Consultant and Investor, Harris Ariel Advisory LLC (2020 to present); Managing Partner, PricewaterhouseCoopers LLP (1985 to 2020) | 64 | ExcelFin Acquisition Corp., Apollo Realty Income Solutions, Inc. |
Stephen E. Yates
(1948) | Director | Since 2012 | Retired | 108 | None |
| Interested Director | |
Jonathan S. Thomas
(1963) | Director | Since 2007 | President and Chief Executive Officer, ACC (2007 to present). Also serves as Chief Executive Officer, ACS; Director, ACC and other ACC subsidiaries | 140 | None |
The Statement of Additional Information has additional information about the fund's directors and is available without charge, upon request, by calling 1-800-378-9878.
Officers
The following table presents certain information about the executive officers of the funds. Each officer serves as an officer for 16 (in the case of Robert J. Leach, 15) investment companies in the American Century family of funds. No officer is compensated for his or her service as an officer of the funds. The listed officers are interested persons of the funds and are appointed or re-appointed on an annual basis. The mailing address for each officer listed below is 4500 Main Street, Kansas City, Missouri 64111.
| | | | | | | | |
Name
(Year of Birth) | Offices with the Funds | Principal Occupation(s) During the Past Five Years |
Patrick Bannigan
(1965) | President since 2019 | Executive Vice President and Director, ACC (2012 to present); Chief Financial Officer, Chief Accounting Officer and Treasurer, ACC (2015 to present). Also serves as President, ACS; Vice President, ACIM; Chief Financial Officer, Chief Accounting Officer and/or Director, ACIM, ACS and other ACC subsidiaries |
R. Wes Campbell
(1974) | Chief Financial Officer and Treasurer since 2018 | Vice President, ACS, (2020 to present); Investment Operations and Investment Accounting, ACS (2000 to present) |
Amy D. Shelton
(1964) | Chief Compliance Officer and Vice President since 2014 | Chief Compliance Officer, American Century funds, (2014 to present); Chief Compliance Officer, ACIM (2014 to present); Chief Compliance Officer, ACIS (2009 to present). Also serves as Vice President, ACIS |
John Pak
(1968) | General Counsel and
Senior Vice President since 2021 | General Counsel and Senior Vice President, ACC (2021 to present); Also serves as General Counsel and Senior Vice President, ACIM, ACS and ACIS. Chief Legal Officer of Investment and Wealth Management, The Bank of New York Mellon (2014 to 2021) |
C. Jean Wade
(1964) | Vice President since 2012 | Senior Vice President, ACS (2017 to present); Vice President, ACS (2000 to 2017)
|
Robert J. Leach
(1966) | Vice President since 2006 | Vice President, ACS (2000 to present) |
David H. Reinmiller
(1963) | Vice President since 2000 | Attorney, ACC (1994 to present). Also serves as Vice President, ACIM and ACS |
Ward D. Stauffer
(1960) | Secretary since 2005 | Attorney, ACC (2003 to present) |
A special meeting of shareholders was held on October 13, 2022, to vote on the following proposal. The proposal received the required votes and was adopted. A summary of voting results is listed below.
To elect five directors to the Board of Directors of American Century Variable Portfolios, Inc.:
| | | | | | | | | | | |
| Affirmative | | Withhold |
| Brian Bulatao | $ | 2,607,537,119 | | | $ | 88,836,350 | |
| Chris H. Cheesman | $ | 2,619,879,519 | | | $ | 76,493,950 | |
| Rajesh K. Gupta | $ | 2,616,882,375 | | | $ | 79,491,094 | |
| Lynn M. Jenkins | $ | 2,607,769,137 | | | $ | 88,604,332 | |
| Gary C. Meltzer | $ | 2,616,158,906 | | | $ | 80,214,563 | |
The other directors whose term of office continued after the meeting include Jonathan S. Thomas, Thomas W. Bunn, Barry Fink, Jan M. Lewis, and Stephen E. Yates.
Proxy Voting Policies
A description of the policies that the fund's investment advisor uses in exercising the voting rights associated with the securities purchased and/or held by the fund is available without charge, upon request, by calling 1-800-378-9878. It is also available on American Century Investments’ website at americancentury.com/proxy and on the Securities and Exchange Commission’s website at sec.gov. Information regarding how the investment advisor voted proxies relating to portfolio securities during the most recent 12-month period ended June 30 is available on americancentury.com/proxy. It is also available at sec.gov.
Quarterly Portfolio Disclosure
The fund files its complete schedule of portfolio holdings with the Securities and Exchange Commission (SEC) for the first and third quarters of each fiscal year as an exhibit to its reports on Form N-PORT. These portfolio holdings are available on the fund's website at americancentury.com and, upon request, by calling 1-800-378-9878. The fund’s Form N-PORT reports are available on the SEC’s website at sec.gov.
Other Tax Information
The following information is provided pursuant to provisions of the Internal Revenue Code.
For corporate taxpayers, the fund hereby designates $17,165,892, or up to the maximum amount allowable, of ordinary income distributions paid during the fiscal year ended December 31, 2022 as qualified for the corporate dividends received deduction.
The fund hereby designates $19,944,119, as qualified short-term capital gain distributions for purposes of Internal Revenue Code Section 871 for the fiscal year ended December 31, 2022.
The fund hereby designates $71,865,888, or up to the maximum amount allowable, as long-term capital gain distributions (20% rate gain distributions) for the fiscal year ended December 31, 2022.
| | | | | | | | |
| |
| | |
| Contact Us | americancentury.com | |
| Automated Information Line | 1-800-345-8765 | |
| Investment Professional Service Representatives | 1-800-345-6488 | |
| Telecommunications Relay Service for the Deaf | 711 | |
| | |
| American Century Variable Portfolios, Inc. | |
| | |
Investment Advisor: American Century Investment Management, Inc. Kansas City, Missouri | |
| | |
| This report and the statements it contains are submitted for the general information of our shareholders. The report is not authorized for distribution to prospective investors unless preceded or accompanied by an effective prospectus. | |
| | |
©2023 American Century Proprietary Holdings, Inc. All rights reserved.
CL-ANN-91446 2302 | |
| | | | | |
| |
| Annual Report |
| |
| December 31, 2022 |
| |
| VP Ultra® Fund |
| Class I (AVPUX) |
| Class II (AVPSX) |
| | | | | |
| Performance | |
| Portfolio Commentary | |
| Fund Characteristics | |
| Shareholder Fee Example | |
| Schedule of Investments | |
| Statement of Assets and Liabilities | |
| Statement of Operations | |
| Statement of Changes in Net Assets | |
| Notes to Financial Statements | |
| Financial Highlights | |
| Report of Independent Registered Public Accounting Firm | |
| Management | |
| |
| |
| Proxy Voting Results | |
| Additional Information | |
Any opinions expressed in this report reflect those of the author as of the date of the report, and do not necessarily represent the opinions of American Century Investments® or any other person in the American Century Investments organization. Any such opinions are subject to change at any time based upon market or other conditions and American Century Investments disclaims any responsibility to update such opinions. These opinions may not be relied upon as investment advice and, because investment decisions made by American Century Investments funds are based on numerous factors, may not be relied upon as an indication of trading intent on behalf of any American Century Investments fund. Security examples are used for representational purposes only and are not intended as recommendations to purchase or sell securities. Performance information for comparative indices and securities is provided to American Century Investments by third party vendors. To the best of American Century Investments’ knowledge, such information is accurate at the time of printing.
| | | | | | | | | | | | | | | | | | |
| Total Returns as of December 31, 2022 | |
| | | | Average Annual Returns | |
| | Ticker
Symbol | 1 year | 5 years | 10 years | | Inception
Date |
| Class I | AVPUX | -32.38% | 11.10% | 14.12% | | 5/1/01 |
| Russell 1000 Growth Index | — | -29.14% | 10.95% | 14.09% | | — |
| S&P 500 Index | — | -18.11% | 9.42% | 12.56% | | — |
| Class II | AVPSX | -32.46% | 10.94% | 13.95% | | 5/1/02 |
Fund returns would have been lower if a portion of the fees had not been waived.
The performance information presented does not include the fees and charges assessed with investments in variable insurance products, those charges are disclosed in the separate account prospectus. The inclusion of such fees and charges would lower performance.
Data presented reflect past performance. Past performance is no guarantee of future results. Current performance may be higher or lower than the performance shown. Total returns for periods less than one year are not annualized. Investment return and principal value will fluctuate, and redemption value may be more or less than original cost. Data assumes reinvestment of dividends and capital gains, and none of the charts reflect the deduction of taxes that a shareholder would pay on fund distributions or the redemption of fund shares. To obtain performance data current to the most recent month end, please call 1-800-345-6488 or visit americancentury.com. For additional information about the fund, please consult the prospectus.
| | |
| Growth of $10,000 Over 10 Years |
| $10,000 investment made December 31, 2012 |
| Performance for other share classes will vary due to differences in fee structure. |
| | | | | |
| Value on December 31, 2022 |
| Class I — $37,449 |
|
| Russell 1000 Growth Index — $37,397 |
|
| S&P 500 Index — $32,654 |
|
| |
|
Ending value of Class I would have been lower if a portion of the fees had not been waived.
| | | | | |
| Total Annual Fund Operating Expenses |
| Class I | Class II |
| 0.89% | 1.04% |
The total annual fund operating expenses shown is as stated in the fund’s prospectus current as of the date of this report. The prospectus may vary from the expense ratio shown elsewhere in this report because it is based on a different time period, includes acquired fund fees and expenses, and, if applicable, does not include fee waivers or expense reimbursements.
Data presented reflect past performance. Past performance is no guarantee of future results. Current performance may be higher or lower than the performance shown. Total returns for periods less than one year are not annualized. Investment return and principal value will fluctuate, and redemption value may be more or less than original cost. Data assumes reinvestment of dividends and capital gains, and none of the charts reflect the deduction of taxes that a shareholder would pay on fund distributions or the redemption of fund shares. To obtain performance data current to the most recent month end, please call 1-800-345-6488 or visit americancentury.com. For additional information about the fund, please consult the prospectus.
Portfolio Managers: Keith Lee, Michael Li and Jeff Bourke
Performance Summary
VP Ultra returned -32.46%* for the 12 months ended December 31, 2022, trailing the -29.14% return of the fund’s benchmark, the Russell 1000 Growth Index.
U.S. stocks fell sharply over the past 12 months, with the heaviest losses during the first three quarters of 2022. The downturn began amid a combination of factors—the new omicron variant of the coronavirus, rising inflation, the Federal Reserve signaling interest rate increases—that led to investors moving to more defensive positioning. The market action was marked by a rotation out of the highest-growth stocks and pandemic winners into either lower growth or more traditional value stocks. Market declines intensified after Russia invaded Ukraine, exacerbating already stretched supply chains and leading to soaring oil prices that helped drive inflation to four-decade highs. Within the Russell 1000 Growth Index, energy was by far the top-performing sector, benefiting from rising prices and increased demand amid limited supplies. Utilities posted a modest gain, while all other sectors recorded losses.
Stock selection in the information technology sector detracted from performance relative to the benchmark. Positioning in the health care and energy sectors benefited relative performance.
Information Technology Hampered Performance
IT services holdings were key detractors. The stock price of Shopify, a Canada-based e-commerce platform, fell sharply after the company warned of slowing revenues. The stock initially suffered amid the transition away from pandemic-era high-growth stocks. More recently, worries that inflation and recession will hurt consumer spending weighed further on the stock. PayPal Holdings lagged after offering disappointing guidance for three consecutive quarters. We eliminated the digital payments company because we were concerned about management’s ability to communicate forward guidance and business prospects. DocuSign’s stock soared during the height of the pandemic but fell sharply as the work-from-home environment waned and investors shifted away from high-growth stocks. We continue to view the digital signature company as a key part of the ongoing enterprise digital transformation.
Two pharmaceuticals stocks weighed on performance. AbbVie’s stock price benefited from investors looking for relatively safer havens. Not owning AbbVie detracted from performance compared with the benchmark. Eli Lilly & Co. benefited from positive clinical trial data and Food and Drug Administration approval for a key new diabetes drug. Eli Lilly’s new diabetes treatment also showed tremendous efficacy in addressing obesity and is being validated in a separate clinical trial as a stand-alone obesity treatment. In addition, the stock rose following positive clinical trial data for a competitor’s Alzheimer’s drug, which is supportive of Eli Lilly’s own approach. We initiated a position in the stock during the period but were underweight for the 12 months overall, which hurt relative performance. We think Eli Lilly is an innovative company with a broad pipeline of potential blockbuster drugs, reflecting the company’s strong history of research and development and commercial execution. Recent launches position the company to have among the strongest growth profiles of large pharmaceutical companies.
Elsewhere, Tesla hurt performance. The electric vehicle maker’s stock fell on concerns about softening demand. In addition, investors want to see a resolution to Elon Musk’s management of
*All fund returns referenced in this commentary are for Class II shares. Fund returns would have been lower if a portion of the fees had not been waived. Performance for other share classes will vary due to differences in fee structure; when Class II performance exceeds that of the fund’s benchmark, other share classes may not. See page 2 for returns for all share classes.
Twitter and a focus on Tesla’s business. We continue to believe the company has a deep management bench and are optimistic about Tesla’s long-term fundamentals.
Health Care Holdings Benefited Performance
A pair of health care stocks were top contributors. UnitedHealth Group, the world’s largest health insurer, reported better-than-expected earnings, largely driven by its Optum division, which is focused on delivering prevention-based care and compensating physicians based on the health of the patient rather than for each service or treatment provided. Regeneron Pharmaceuticals reported better-than-expected revenue and earnings, and it announced strong trial results for Eylea, its drug for wet age-related macular degeneration. In addition, Regeneron recently released positive clinical trial data for particularly hard-to-treat prostate cancer.
Other significant contributors included EOG Resources, an innovative low-cost oil and gas exploration and production firm benefiting from rising oil prices. EOG reported strong free cash flows and announced that it would be returning profits to shareholders through its already robust dividend payouts.
The digital payments companies Visa and Mastercard were other sources of strength. Both companies have established strong competitive moats and are positioned for long runways of growth powered by the secular shift to digital payments around the globe. Visa and Mastercard both reported solid financial results bolstered by a recovery in retail spending and cross-border transactions. Constellation Brands, an innovative beer, wine and spirits beverage company, outperformed, aided by investors’ shift to stocks likely to hold up better in a slowing economy. Constellation reported quarterly revenue and earnings that beat expectations, driven by strength in its portfolio of beer brands.
Outlook
While this is a difficult period for growth equities, we retain high conviction in our investment process and portfolio holdings. We acknowledge the challenging environment and are closely monitoring the fundamentals of our investments, but our long-term focus also leads us to look through the short-term noise. Indeed, we believe many enduring secular growth trends will persist. These include a shift to electric vehicles, aging global demographics intersecting with advancements in health care, companies shifting more of their expenditures to technology to drive productivity gains and increased digitization of transactions, among many others. As such, we think this period can create attractive opportunities for long-term investors willing to be patient with companies that we believe are poised to grow over time.
We remain confident in our belief that high-quality companies with a capability for sustained long-term growth can outperform over time. Our portfolio positioning reflects where we are finding attractive, well-run companies as a result of the application of that philosophy and process.
As of December 31, 2022, health care, communication services and consumer discretionary were the portfolio’s largest overweight allocations relative to the benchmark. Industrials, real estate and consumer staples were the largest underweight sectors.
| | | | | |
| DECEMBER 31, 2022 |
| Types of Investments in Portfolio | % of net assets |
| Common Stocks | 99.0% |
| Exchange-Traded Funds | 0.2% |
| Short-Term Investments | 1.0% |
| Other Assets and Liabilities | (0.2)% |
| |
| Top Five Industries* | % of net assets |
| Technology Hardware, Storage and Peripherals | 13.8% |
| IT Services | 12.0% |
| Software | 9.0% |
| Interactive Media and Services | 7.6% |
| Semiconductors and Semiconductor Equipment | 6.7% |
*Exposure indicated excludes Exchange-Traded Funds. The Schedule of Investments provides additional information on the fund's portfolio holdings.
Fund shareholders may incur two types of costs: (1) transaction costs, including sales charges (loads) on purchase payments and redemption/exchange fees; and (2) ongoing costs, including management fees; distribution and service (12b-1) fees; and other fund expenses. This example is intended to help you understand your ongoing costs (in dollars) of investing in your fund and to compare these costs with the ongoing cost of investing in other mutual funds.
The example is based on an investment of $1,000 made at the beginning of the period and held for the entire period from July 1, 2022 to December 31, 2022.
Actual Expenses
The table provides information about actual account values and actual expenses for each class. You may use the information, together with the amount you invested, to estimate the expenses that you paid over the period. First, identify the share class you own. Then simply divide your account value by $1,000 (for example, an $8,600 account value divided by $1,000 = 8.6), then multiply the result by the number under the heading “Expenses Paid During Period” to estimate the expenses you paid on your account during this period.
Hypothetical Example for Comparison Purposes
The table also provides information about hypothetical account values and hypothetical expenses based on the actual expense ratio of each class of your fund and an assumed rate of return of 5% per year before expenses, which is not the actual return of a fund’s share class. The hypothetical account values and expenses may not be used to estimate the actual ending account balance or expenses you paid for the period. You may use this information to compare the ongoing costs of investing in your fund and other funds. To do so, compare this 5% hypothetical example with the 5% hypothetical examples that appear in the shareholder reports of the other funds.
Please note that the expenses shown in the table are meant to highlight your ongoing costs only and do not reflect any transactional costs, such as sales charges (loads) or redemption/exchange fees. Therefore, the table is useful in comparing ongoing costs only, and will not help you determine the relative total costs of owning different funds. In addition, if these transactional costs were included, your costs would have been higher.
| | | | | | | | | | | | | | |
| Beginning Account Value 7/1/22 | Ending Account Value 12/31/22 | Expenses Paid During Period(1) 7/1/22 - 12/31/22 | Annualized Expense Ratio(1) |
| Actual | | | | |
| Class I | $1,000 | $979.20 | $3.84 | 0.77% |
| Class II | $1,000 | $978.50 | $4.59 | 0.92% |
| Hypothetical | | | | |
| Class I | $1,000 | $1,021.32 | $3.92 | 0.77% |
| Class II | $1,000 | $1,020.57 | $4.69 | 0.92% |
(1)Expenses are equal to the class's annualized expense ratio listed in the table above, multiplied by the average account value over the period, multiplied by 184, the number of days in the most recent fiscal half-year, divided by 365, to reflect the one-half year period. Annualized expense ratio reflects actual expenses, including any applicable fee waivers or expense reimbursements and excluding any acquired fund fees and expenses.
DECEMBER 31, 2022
| | | | | | | | |
| Shares | Value |
| COMMON STOCKS — 99.0% | | |
| Automobiles — 2.6% | | |
Tesla, Inc.(1) | 45,950 | | $ | 5,660,121 | |
| Banks — 0.4% | | |
| JPMorgan Chase & Co. | 6,620 | | 887,742 | |
| Beverages — 2.0% | | |
| Constellation Brands, Inc., Class A | 18,460 | | 4,278,105 | |
| Biotechnology — 3.9% | | |
Genmab A/S(1) | 4,920 | | 2,080,150 | |
Regeneron Pharmaceuticals, Inc.(1) | 8,710 | | 6,284,178 | |
| | 8,364,328 | |
| Building Products — 0.8% | | |
| Advanced Drainage Systems, Inc. | 20,190 | | 1,654,974 | |
| Capital Markets — 1.4% | | |
| MSCI, Inc. | 6,310 | | 2,935,223 | |
| Chemicals — 0.5% | | |
| Ecolab, Inc. | 6,880 | | 1,001,453 | |
| Commercial Services and Supplies — 0.5% | | |
Copart, Inc.(1) | 19,690 | | 1,198,924 | |
| Distributors — 0.6% | | |
| Pool Corp. | 4,270 | | 1,290,949 | |
| Electrical Equipment — 0.8% | | |
| Acuity Brands, Inc. | 10,990 | | 1,820,054 | |
| Electronic Equipment, Instruments and Components — 1.2% | | |
| Cognex Corp. | 10,470 | | 493,242 | |
| Fortive Corp. | 21,020 | | 1,350,535 | |
| Keyence Corp. | 2,000 | | 776,489 | |
| | 2,620,266 | |
| Entertainment — 1.6% | | |
Netflix, Inc.(1) | 7,400 | | 2,182,112 | |
Walt Disney Co.(1) | 13,650 | | 1,185,912 | |
| | 3,368,024 | |
| Food and Staples Retailing — 2.2% | | |
| Costco Wholesale Corp. | 10,340 | | 4,720,210 | |
| Health Care Equipment and Supplies — 6.5% | | |
Contra Abiomed, Inc.(1) | 4,290 | | 4,376 | |
DexCom, Inc.(1) | 21,940 | | 2,484,486 | |
Edwards Lifesciences Corp.(1) | 29,350 | | 2,189,803 | |
IDEXX Laboratories, Inc.(1) | 5,160 | | 2,105,074 | |
Insulet Corp.(1) | 6,250 | | 1,839,937 | |
Intuitive Surgical, Inc.(1) | 20,610 | | 5,468,863 | |
| | 14,092,539 | |
| Health Care Providers and Services — 4.8% | | |
| UnitedHealth Group, Inc. | 19,550 | | 10,365,019 | |
| Hotels, Restaurants and Leisure — 3.0% | | |
Chipotle Mexican Grill, Inc.(1) | 3,230 | | 4,481,592 | |
| Wingstop, Inc. | 14,090 | | 1,939,066 | |
| | 6,420,658 | |
| | | | | | | | |
| Shares | Value |
| Household Durables — 0.1% | | |
Sonos, Inc.(1) | 14,720 | | $ | 248,768 | |
| Interactive Media and Services — 7.6% | | |
Alphabet, Inc., Class A(1) | 84,640 | | 7,467,787 | |
Alphabet, Inc., Class C(1) | 92,730 | | 8,227,933 | |
Meta Platforms, Inc., Class A(1) | 7,230 | | 870,058 | |
| | 16,565,778 | |
| Internet and Direct Marketing Retail — 5.0% | | |
Amazon.com, Inc.(1) | 127,980 | | 10,750,320 | |
| IT Services — 12.0% | | |
Adyen NV(1) | 1,790 | | 2,484,966 | |
Block, Inc.(1) | 17,360 | | 1,090,902 | |
| Mastercard, Inc., Class A | 33,020 | | 11,482,045 | |
Okta, Inc.(1) | 4,420 | | 302,019 | |
Shopify, Inc., Class A(1) | 8,140 | | 282,539 | |
| Visa, Inc., Class A | 50,290 | | 10,448,250 | |
| | 26,090,721 | |
| Life Sciences Tools and Services — 1.2% | | |
Maravai LifeSciences Holdings, Inc., Class A(1) | 28,510 | | 407,978 | |
Waters Corp.(1) | 6,580 | | 2,254,177 | |
| | 2,662,155 | |
| Machinery — 2.5% | | |
| Donaldson Co., Inc. | 14,490 | | 853,026 | |
| Nordson Corp. | 7,940 | | 1,887,497 | |
| Westinghouse Air Brake Technologies Corp. | 17,710 | | 1,767,635 | |
Yaskawa Electric Corp.(2) | 28,700 | | 915,686 | |
| | 5,423,844 | |
| Oil, Gas and Consumable Fuels — 1.8% | | |
| EOG Resources, Inc. | 30,830 | | 3,993,102 | |
| Personal Products — 0.4% | | |
| Estee Lauder Cos., Inc., Class A | 3,420 | | 848,536 | |
| Pharmaceuticals — 0.9% | | |
| Eli Lilly & Co. | 5,440 | | 1,990,170 | |
| Road and Rail — 1.1% | | |
| J.B. Hunt Transport Services, Inc. | 13,950 | | 2,432,322 | |
| Semiconductors and Semiconductor Equipment — 6.7% | | |
Advanced Micro Devices, Inc.(1) | 35,030 | | 2,268,893 | |
| Analog Devices, Inc. | 18,110 | | 2,970,583 | |
| Applied Materials, Inc. | 31,230 | | 3,041,177 | |
| ASML Holding NV | 3,190 | | 1,739,353 | |
| NVIDIA Corp. | 30,770 | | 4,496,728 | |
| | 14,516,734 | |
| Software — 9.0% | | |
DocuSign, Inc.(1) | 21,940 | | 1,215,915 | |
| Microsoft Corp. | 59,600 | | 14,293,272 | |
Paycom Software, Inc.(1) | 6,740 | | 2,091,489 | |
Salesforce, Inc.(1) | 6,840 | | 906,916 | |
Zscaler, Inc.(1) | 8,350 | | 934,365 | |
| | 19,441,957 | |
| Technology Hardware, Storage and Peripherals — 13.8% | | |
| Apple, Inc. | 230,510 | | 29,950,164 | |
| | | | | | | | |
| Shares | Value |
| Textiles, Apparel and Luxury Goods — 4.1% | | |
lululemon athletica, Inc.(1) | 15,450 | | $ | 4,949,871 | |
| NIKE, Inc., Class B | 33,080 | | 3,870,691 | |
| | 8,820,562 | |
TOTAL COMMON STOCKS (Cost $79,340,074) | | 214,413,722 | |
| EXCHANGE-TRADED FUNDS — 0.2% | | |
iShares Russell 1000 Growth ETF(2) (Cost $443,628) | 1,980 | | 424,195 | |
| SHORT-TERM INVESTMENTS — 1.0% | | |
| Money Market Funds — 0.2% | | |
| State Street Institutional U.S. Government Money Market Fund, Premier Class | 104,905 | | 104,905 | |
State Street Navigator Securities Lending Government Money Market Portfolio(3) | 262,500 | | 262,500 | |
| | 367,405 | |
| Repurchase Agreements — 0.8% | | |
| BMO Capital Markets Corp., (collateralized by various U.S. Treasury obligations, 0.375% - 0.50%, 9/15/24 - 5/31/27, valued at $244,491), in a joint trading account at 4.20%, dated 12/30/22, due 1/3/23 (Delivery value $240,074) | | 239,962 | |
| Fixed Income Clearing Corp., (collateralized by various U.S. Treasury obligations, 2.875%, 5/15/32, valued at $1,503,564), at 4.26%, dated 12/30/22, due 1/3/23 (Delivery value $1,474,698) | | 1,474,000 | |
| | 1,713,962 | |
TOTAL SHORT-TERM INVESTMENTS (Cost $2,081,367) | | 2,081,367 | |
TOTAL INVESTMENT SECURITIES—100.2% (Cost $81,865,069) | | 216,919,284 | |
| OTHER ASSETS AND LIABILITIES — (0.2)% | | (361,746) | |
| TOTAL NET ASSETS — 100.0% | | $ | 216,557,538 | |
| | | | | | | | | | | | | | | | | | | | |
| FORWARD FOREIGN CURRENCY EXCHANGE CONTRACTS |
| Currency Purchased | Currency Sold | Counterparty | Settlement
Date | Unrealized
Appreciation
(Depreciation) |
| EUR | 63,527 | | USD | 67,926 | | JPMorgan Chase Bank N.A. | 3/31/23 | $ | 482 | |
| USD | 1,709,067 | | EUR | 1,596,089 | | JPMorgan Chase Bank N.A. | 3/31/23 | (9,657) | |
| JPY | 4,971,225 | | USD | 37,747 | | Bank of America N.A. | 3/31/23 | 575 | |
| USD | 617,631 | | JPY | 83,564,250 | | Bank of America N.A. | 3/31/23 | (26,539) | |
| | | | | | $ | (35,139) | |
| | | | | | | | |
| NOTES TO SCHEDULE OF INVESTMENTS |
| EUR | – | Euro |
| JPY | – | Japanese Yen |
| USD | – | United States Dollar |
(1)Non-income producing.
(2)Security, or a portion thereof, is on loan. At the period end, the aggregate value of securities on loan was $1,153,630. The amount of securities on loan indicated may not correspond with the securities on loan identified because securities with pending sales are in the process of recall from the brokers.
(3)Investment of cash collateral from securities on loan. At the period end, the aggregate value of the collateral held by the fund was $1,203,199, which includes securities collateral of $940,699.
See Notes to Financial Statements.
| | |
| Statement of Assets and Liabilities |
| | | | | |
| DECEMBER 31, 2022 | |
| Assets | |
| Investment securities, at value (cost of $81,602,569) — including $1,153,630 of securities on loan | $ | 216,656,784 | |
Investment made with cash collateral received for securities on loan, at value
(cost of $262,500) | 262,500 | |
| Total investment securities, at value (cost of $81,865,069) | 216,919,284 | |
| Receivable for capital shares sold | 132,077 | |
| Unrealized appreciation on forward foreign currency exchange contracts | 1,057 | |
| Dividends and interest receivable | 10,483 | |
| Securities lending receivable | 84 | |
| 217,062,985 | |
| |
| Liabilities | |
| Payable for collateral received for securities on loan | 262,500 | |
| Payable for capital shares redeemed | 39,993 | |
| Unrealized depreciation on forward foreign currency exchange contracts | 36,196 | |
| Accrued management fees | 132,941 | |
| Distribution fees payable | 32,877 | |
| Accrued other expenses | 940 | |
| 505,447 | |
| |
| Net Assets | $ | 216,557,538 | |
| |
| Net Assets Consist of: | |
| Capital (par value and paid-in surplus) | $ | 63,398,194 | |
| Distributable earnings | 153,159,344 | |
| $ | 216,557,538 | |
| | | | | | | | | | | |
| Net Assets | Shares Outstanding | Net Asset Value Per Share |
| Class I, $0.01 Par Value | $68,354,139 | 3,534,575 | $19.34 |
| Class II, $0.01 Par Value | $148,203,399 | 7,935,219 | $18.68 |
See Notes to Financial Statements.
| | | | | |
| YEAR ENDED DECEMBER 31, 2022 | |
| Investment Income (Loss) | |
| Income: | |
| Dividends (net of foreign taxes withheld of $4,538) | $ | 1,450,802 | |
| Interest | 43,499 | |
| Securities lending, net | 1,272 | |
| 1,495,573 | |
| |
| Expenses: | |
| Management fees | 2,139,956 | |
| Distribution fees - Class II | 439,421 | |
| Directors' fees and expenses | 7,283 | |
| Other expenses | 3,660 | |
| 2,590,320 | |
Fees waived(1) | (290,405) | |
| 2,299,915 | |
| |
| Net investment income (loss) | (804,342) | |
| |
| Realized and Unrealized Gain (Loss) | |
| Net realized gain (loss) on: | |
| Investment transactions | 18,550,327 | |
| Forward foreign currency exchange contract transactions | 359,180 | |
| Foreign currency translation transactions | (4,774) | |
| 18,904,733 | |
| |
| Change in net unrealized appreciation (depreciation) on: | |
| Investments | (126,203,683) | |
| Forward foreign currency exchange contracts | (24,599) | |
| Translation of assets and liabilities in foreign currencies | (138) | |
| (126,228,420) | |
| |
| Net realized and unrealized gain (loss) | (107,323,687) | |
| |
| Net Increase (Decrease) in Net Assets Resulting from Operations | $ | (108,128,029) | |
(1)Amount consists of $94,211 and $196,194 for Class I and Class II, respectively.
See Notes to Financial Statements.
| | |
| Statement of Changes in Net Assets |
| | | | | | | | |
| YEARS ENDED DECEMBER 31, 2022 AND DECEMBER 31, 2021 |
| Increase (Decrease) in Net Assets | December 31, 2022 | December 31, 2021 |
| Operations | | |
| Net investment income (loss) | $ | (804,342) | | $ | (1,447,356) | |
| Net realized gain (loss) | 18,904,733 | | 29,979,023 | |
| Change in net unrealized appreciation (depreciation) | (126,228,420) | | 36,103,456 | |
| Net increase (decrease) in net assets resulting from operations | (108,128,029) | | 64,635,123 | |
| | |
| Distributions to Shareholders | | |
| From earnings: | | |
| Class I | (8,905,603) | | (6,448,663) | |
| Class II | (19,453,951) | | (14,540,645) | |
| Decrease in net assets from distributions | (28,359,554) | | (20,989,308) | |
| | |
| Capital Share Transactions | | |
| Net increase (decrease) in net assets from capital share transactions (Note 5) | 15,425,141 | | (3,801,857) | |
| | |
| Net increase (decrease) in net assets | (121,062,442) | | 39,843,958 | |
| | |
| Net Assets | | |
| Beginning of period | 337,619,980 | | 297,776,022 | |
| End of period | $ | 216,557,538 | | $ | 337,619,980 | |
See Notes to Financial Statements.
| | |
| Notes to Financial Statements |
DECEMBER 31, 2022
1. Organization
American Century Variable Portfolios, Inc. (the corporation) is registered under the Investment Company Act of 1940, as amended (the 1940 Act), as an open-end management investment company and is organized as a Maryland corporation. VP Ultra Fund (the fund) is one fund in a series issued by the corporation. The fund’s investment objective is to seek long-term capital growth. The fund offers Class I and Class II.
2. Significant Accounting Policies
The following is a summary of significant accounting policies consistently followed by the fund in preparation of its financial statements. The fund is an investment company and follows accounting and reporting guidance in accordance with accounting principles generally accepted in the United States of America. This may require management to make certain estimates and assumptions at the date of the financial statements. Actual results could differ from these estimates. Management evaluated the impact of events or transactions occurring through the date the financial statements were issued that would merit recognition or disclosure.
Investment Valuations — The fund determines the fair value of its investments and computes its net asset value (NAV) per share at the close of regular trading (usually 4 p.m. Eastern time) on the New York Stock Exchange (NYSE) on each day the NYSE is open. The value of investments of the fund is determined by American Century Investment Management, Inc. (ACIM) (the investment advisor), as the valuation designee, pursuant to its valuation policies and procedures. The Board of Directors oversees the valuation designee and reviews its valuation policies and procedures at least annually.
Equity securities that are listed or traded on a domestic securities exchange are valued at the last reported sales price or at the official closing price as provided by the exchange. Equity securities traded on foreign securities exchanges are generally valued at the closing price of such securities on the exchange where primarily traded or at the close of the NYSE, if that is earlier. If no last sales price is reported, or if local convention or regulation so provides, the mean of the latest bid and asked prices may be used. Securities traded over-the-counter are valued at the mean of the latest bid and asked prices, the last sales price, or the official closing price. Equity securities initially expressed in local currencies are translated into U.S. dollars at the mean of the appropriate currency exchange rate at the close of the NYSE as provided by an independent pricing service.
Open-end management investment companies are valued at the reported NAV per share. Repurchase agreements are valued at cost, which approximates fair value. Forward foreign currency exchange contracts are valued at the mean of the appropriate forward exchange rate at the close of the NYSE as provided by an independent pricing service.
If the valuation designee determines that the market price for a portfolio security is not readily available or is believed by the valuation designee to be unreliable, such security is valued at fair value as determined in good faith by the valuation designee, in accordance with its policies and procedures. Circumstances that may cause the fund to determine that market quotations are not available or reliable include, but are not limited to: when there is a significant event subsequent to the market quotation; trading in a security has been halted during the trading day; or trading in a security is insufficient or did not take place due to a closure or holiday.
The valuation designee monitors for significant events occurring after the close of an investment’s primary exchange but before the fund’s NAV per share is determined. Significant events may include, but are not limited to: corporate announcements and transactions; regulatory news, governmental action and political unrest that could impact a specific investment or an investment sector; or armed conflicts, natural disasters and similar events that could affect investments in a specific country or region. The valuation designee also monitors for significant fluctuations between domestic and foreign markets, as evidenced by the U.S. market or such other indicators that it deems appropriate. The valuation designee may apply a model-derived factor to the closing price of equity securities traded on foreign securities exchanges. The factor is based on observable market data as provided by an independent pricing service.
Security Transactions — Security transactions are accounted for as of the trade date. Net realized gains and losses are determined on the identified cost basis, which is also used for federal income tax purposes.
Investment Income — Dividend income less foreign taxes withheld, if any, is recorded as of the ex-dividend date. Distributions received on securities that represent a return of capital or long-term capital gain are recorded as a reduction of cost of investments and/or as a realized gain. The fund may estimate the components of distributions received that may be considered nontaxable distributions or long-term capital gain distributions for income tax purposes. Interest income is recorded on the accrual basis and includes accretion of discounts and amortization of premiums. Securities lending income is net of fees and rebates earned by the lending agent for its services.
Foreign Currency Translations — All assets and liabilities initially expressed in foreign currencies are translated into U.S. dollars at prevailing exchange rates at period end. The fund may enter into spot foreign currency exchange contracts to facilitate transactions denominated in a foreign currency. Purchases and sales of investment securities, dividend and interest income, spot foreign currency exchange contracts, and expenses are translated at the rates of exchange prevailing on the respective dates of such transactions. Net realized and unrealized foreign currency exchange gains or losses related to investment securities are a component of net realized gain (loss) on investment transactions and change in net unrealized appreciation (depreciation) on investments, respectively.
Repurchase Agreements — The fund may enter into repurchase agreements with institutions that ACIM has determined are creditworthy pursuant to criteria adopted by the Board of Directors. The fund requires that the collateral, represented by securities, received in a repurchase transaction be transferred to the custodian in a manner sufficient to enable the fund to obtain those securities in the event of a default under the repurchase agreement. ACIM monitors, on a daily basis, the securities transferred to ensure the value, including accrued interest, of the securities under each repurchase agreement is equal to or greater than amounts owed to the fund under each repurchase agreement.
Joint Trading Account — Pursuant to an Exemptive Order issued by the Securities and Exchange Commission, the fund, along with certain other funds in the American Century Investments family of funds, may transfer uninvested cash balances into a joint trading account. These balances are invested in one or more repurchase agreements that are collateralized by U.S. Treasury or Agency obligations.
Segregated Assets — In accordance with the 1940 Act, the fund segregates assets on its books and records to cover certain types of investment securities and other financial instruments. ACIM monitors, on a daily basis, the securities segregated to ensure the fund designates a sufficient amount of liquid assets, marked-to-market daily. The fund may also receive assets or be required to pledge assets at the custodian bank or with a broker for collateral requirements. The fund may incur charges or earn income on posted collateral balances,
which are reflected in interest expenses or interest income, respectively.
Income Tax Status — It is the fund's policy to distribute substantially all net investment income and net realized gains to shareholders and to otherwise qualify as a regulated investment company under provisions of the Internal Revenue Code. Accordingly, no provision has been made for income taxes. The fund files U.S. federal, state, local and non-U.S. tax returns as applicable. The fund's tax returns are subject to examination by the relevant taxing authority until expiration of the applicable statute of limitations, which is generally three years from the date of filing but can be longer in certain jurisdictions. At this time, management believes there are no uncertain tax positions which, based on their technical merit, would not be sustained upon examination and for which it is reasonably possible that the total amounts of unrecognized tax benefits will significantly change in the next twelve months.
Multiple Class — All shares of the fund represent an equal pro rata interest in the net assets of the class to which such shares belong, and have identical voting, dividend, liquidation and other rights and the same terms and conditions, except for class specific expenses and exclusive rights to vote on matters affecting only individual classes. Income, non-class specific expenses, and realized and unrealized capital gains and losses of the fund are allocated to each class of shares based on their relative net assets.
Distributions to Shareholders — Distributions from net investment income and net realized gains, if any, are generally declared and paid annually.
Indemnifications — Under the corporation’s organizational documents, its officers and directors are indemnified against certain liabilities arising out of the performance of their duties to the fund. In addition, in the normal course of business, the fund enters into contracts that provide general indemnifications. The maximum exposure under these arrangements is unknown as this would involve future claims that may be made against a fund. The risk of material loss from such claims is considered by management to be remote.
Securities Lending — Securities are lent to qualified financial institutions and brokers. State Street Bank & Trust Co. serves as securities lending agent to the fund pursuant to a Securities Lending Agreement. The lending of securities exposes the fund to risks such as: the borrowers may fail to return the loaned securities, the borrowers may not be able to provide additional collateral, the fund may experience delays in recovery of the loaned securities or delays in access to collateral, or the fund may experience losses related to the investment collateral. To minimize certain risks, loan counterparties pledge collateral in the form of cash and/or securities. The lending agent has agreed to indemnify the fund in the case of default of any securities borrowed. Cash collateral received is invested in the State Street Navigator Securities Lending Government Money Market Portfolio, a money market mutual fund registered under the 1940 Act. The loans may also be secured by U.S. government securities in an amount at least equal to the market value of the securities loaned, plus accrued interest and dividends, determined on a daily basis and adjusted accordingly. By lending securities, the fund seeks to increase its net investment income through the receipt of interest and fees. Such income is reflected separately within the Statement of Operations. The value of loaned securities and related collateral outstanding at period end, if any, are shown on a gross basis within the Schedule of Investments and Statement of Assets and Liabilities.
The following table reflects a breakdown of transactions accounted for as secured borrowings, the gross obligation by the type of collateral pledged, and the remaining contractual maturity of those transactions as of December 31, 2022.
| | | | | | | | | | | | | | | | | |
| Remaining Contractual Maturity of Agreements |
| Overnight and Continuous | <30 days | Between 30 & 90 days | >90 days | Total |
Securities Lending Transactions(1) | | | | |
| Exchange-Traded Funds | $ | 262,500 | | — | | — | | — | | $ | 262,500 | |
| Gross amount of recognized liabilities for securities lending transactions | $ | 262,500 | |
(1)Amount represents the payable for cash collateral received for securities on loan. This will generally be in the Overnight and Continuous column as the securities are typically callable on demand.
3. Fees and Transactions with Related Parties
Certain officers and directors of the corporation are also officers and/or directors of American Century Companies, Inc. (ACC). The corporation's investment advisor, ACIM, the corporation's distributor, American Century Investment Services, Inc. (ACIS), and the corporation's transfer agent, American Century Services, LLC, are wholly owned, directly or indirectly, by ACC.
Management Fees — The corporation has entered into a management agreement with ACIM, under which ACIM provides the fund with investment advisory and management services in exchange for a single, unified management fee (the fee) per class. The agreement provides that ACIM will pay all expenses of managing and operating the fund, except brokerage expenses, taxes, interest, fees and expenses of the independent directors (including legal counsel fees), extraordinary expenses, and expenses incurred in connection with the provision of shareholder services and distribution services under a plan adopted pursuant to Rule 12b-1 under the 1940 Act. The fee is computed and accrued daily based on each class's daily net assets and paid monthly in arrears. The difference in the fee among the classes is a result of their separate arrangements for non-Rule 12b-1 shareholder services. It is not the result of any difference in advisory or custodial fees or other expenses related to the management of the fund’s assets, which do not vary by class. From January 1, 2022 through July 31, 2022, the investment advisor agreed to waive 0.10% of the fund's management fee. Effective August 1, 2022, the investment advisor agreed to waive 0.13% of the fund's management fee. The investment advisor expects this waiver to continue until July 31, 2023 and cannot terminate it prior to such date without the approval of the Board of Directors.
The annual management fee and the effective annual management fee after waiver for each class for the period ended December 31, 2022 are as follows:
| | | | | | | | |
| Annual Management Fee | Effective Annual Management Fee After Waiver |
| Class I | 0.89% | 0.78% |
| Class II | 0.79% | 0.68% |
Distribution Fees — The Board of Directors has adopted the Master Distribution Plan (the plan) for Class II, pursuant to Rule 12b-1 of the 1940 Act. The plan provides that Class II will pay ACIS an annual distribution fee equal to 0.25%. The fee is computed and accrued daily based on the Class II daily net assets and paid monthly in arrears. The distribution fee provides compensation for expenses incurred in connection with distributing shares of Class II including, but not limited to, payments to brokers, dealers, and financial institutions that have entered into sales agreements with respect to shares of the fund. Fees incurred under the plan during the period ended December 31, 2022 are detailed in the Statement of Operations.
Directors' Fees and Expenses — The Board of Directors is responsible for overseeing the investment advisor’s management and operations of the fund. The directors receive detailed information about the fund and its investment advisor regularly throughout the year, and meet at least quarterly with management of the investment advisor to review reports about fund operations. The fund's officers do not receive compensation from the fund.
Interfund Transactions — The fund may enter into security transactions with other American Century Investments funds and other client accounts of the investment advisor, in accordance with the 1940 Act rules and procedures adopted by the Board of Directors. The rules and procedures require, among other things, that these transactions be effected at the independent current market price of the security. During the period, the interfund sales were $38,359 and there were no interfund purchases. The effect of interfund transactions on the Statement of Operations was $15,083 in net realized gain (loss) on investment transactions.
4. Investment Transactions
Purchases and sales of investment securities, excluding short-term investments, for the period ended December 31, 2022 were $63,304,065 and $78,435,820, respectively.
5. Capital Share Transactions
Transactions in shares of the fund were as follows:
| | | | | | | | | | | | | | |
| Year ended December 31, 2022 | Year ended December 31, 2021 |
| Shares | Amount | Shares | Amount |
| Class I/Shares Authorized | 100,000,000 | | | 100,000,000 | | |
| Sold | 585,066 | | $ | 13,140,109 | | 1,175,353 | | $ | 34,640,641 | |
| Issued in reinvestment of distributions | 335,049 | | 8,905,603 | | 256,204 | | 6,448,663 | |
| Redeemed | (1,121,358) | | (25,931,948) | | (1,198,635) | | (34,488,705) | |
| (201,243) | | (3,886,236) | | 232,922 | | 6,600,599 | |
| Class II/Shares Authorized | 120,000,000 | | | 120,000,000 | | |
| Sold | 1,167,292 | | 27,633,817 | | 710,933 | | 19,783,587 | |
| Issued in reinvestment of distributions | 756,963 | | 19,453,951 | | 594,709 | | 14,540,645 | |
| Redeemed | (1,228,105) | | (27,776,391) | | (1,598,856) | | (44,726,688) | |
| 696,150 | | 19,311,377 | | (293,214) | | (10,402,456) | |
| Net increase (decrease) | 494,907 | | $ | 15,425,141 | | (60,292) | | $ | (3,801,857) | |
6. Fair Value Measurements
The fund's investments valuation process is based on several considerations and may use multiple inputs to determine the fair value of the investments held by the fund. In conformity with accounting principles generally accepted in the United States of America, the inputs used to determine a valuation are classified into three broad levels.
•Level 1 valuation inputs consist of unadjusted quoted prices in an active market for identical investments.
•Level 2 valuation inputs consist of direct or indirect observable market data (including quoted prices for comparable investments, evaluations of subsequent market events, interest rates, prepayment speeds, credit risk, etc.). These inputs also consist of quoted prices for identical investments initially expressed in local currencies that are adjusted through translation into U.S. dollars.
•Level 3 valuation inputs consist of unobservable data (including a fund’s own assumptions).
The level classification is based on the lowest level input that is significant to the fair valuation measurement. The valuation inputs are not necessarily an indication of the risks associated with investing in these securities or other financial instruments.
The following is a summary of the level classifications as of period end. The Schedule of Investments provides additional information on the fund's portfolio holdings.
| | | | | | | | | | | |
| Level 1 | Level 2 | Level 3 |
| Assets | | | |
| Investment Securities | | | |
| Common Stocks | $ | 206,417,078 | | $ | 7,996,644 | | — | |
| Exchange-Traded Funds | 424,195 | | — | | — | |
| Short-Term Investments | 367,405 | | 1,713,962 | | — | |
| $ | 207,208,678 | | $ | 9,710,606 | | — | |
| Other Financial Instruments | | | |
| Forward Foreign Currency Exchange Contracts | — | | $ | 1,057 | | — | |
| | | |
| Liabilities | | | |
| Other Financial Instruments | | | |
| Forward Foreign Currency Exchange Contracts | — | | $ | 36,196 | | — | |
7. Derivative Instruments
Foreign Currency Risk — The fund is subject to foreign currency exchange rate risk in the normal course of pursuing its investment objectives. The value of foreign investments held by a fund may be significantly affected by changes in foreign currency exchange rates. The dollar value of a foreign security generally decreases when the value of the dollar rises against the foreign currency in which the security is denominated and tends to increase when the value of the dollar declines against such foreign currency. A fund may enter into forward foreign currency exchange contracts to reduce a fund's exposure to foreign currency exchange rate fluctuations. The net U.S. dollar value of foreign currency underlying all contractual commitments held by a fund and the resulting unrealized appreciation or depreciation are determined daily. Realized gain or loss is recorded upon settlement of the contract. Net realized and unrealized gains or losses occurring during the holding period of forward foreign currency exchange contracts are a component of net realized gain (loss) on forward foreign currency exchange contract transactions and change in net unrealized appreciation (depreciation) on forward foreign currency exchange contracts, respectively. A fund bears the risk of an unfavorable change in the foreign currency exchange rate underlying the forward contract. Additionally, losses, up to the fair value, may arise if the counterparties do not perform under the contract terms. The fund's average U.S. dollar exposure to foreign currency risk derivative instruments held during the period was $3,859,551.
The value of foreign currency risk derivative instruments as of December 31, 2022, is disclosed on the Statement of Assets and Liabilities as an asset of $1,057 in unrealized appreciation on forward foreign currency exchange contracts and a liability of $36,196 in unrealized depreciation on forward foreign currency exchange contracts. For the year ended December 31, 2022, the effect of foreign currency risk derivative instruments on the Statement of Operations was $359,180 in net realized gain (loss) on forward foreign currency exchange contract transactions and $(24,599) in change in net unrealized appreciation (depreciation) on forward foreign currency exchange contracts.
8. Risk Factors
The value of the fund’s shares will go up and down, sometimes rapidly or unpredictably, based on the performance of the securities owned by the fund and other factors generally affecting the securities market. Market risks, including political, regulatory, economic and social developments, can affect the value of the fund’s investments. Natural disasters, public health emergencies, war, terrorism and other unforeseeable events may lead to increased market volatility and may have adverse long-term effects on world economies and markets generally.
9. Federal Tax Information
The tax character of distributions paid during the years ended December 31, 2022 and December 31, 2021 were as follows:
| | | | | | | | |
| 2022 | 2021 |
| Distributions Paid From | | |
| Ordinary income | $ | 28,679 | | $ | 1,165,955 | |
| Long-term capital gains | $ | 28,330,875 | | $ | 19,823,353 | |
The book-basis character of distributions made during the year from net investment income or net realized gains may differ from their ultimate characterization for federal income tax purposes. These differences reflect the differing character of certain income items and net realized gains and losses for financial statement and tax purposes, and may result in reclassification among certain capital accounts on the financial statements.
As of period end, the federal tax cost of investments and the components of distributable earnings on a tax-basis were as follows:
| | | | | |
| Federal tax cost of investments | $ | 82,475,482 | |
| Gross tax appreciation of investments | $ | 140,714,272 | |
| Gross tax depreciation of investments | (6,270,470) | |
| Net tax appreciation (depreciation) of investments | 134,443,802 | |
| Net tax appreciation (depreciation) on derivatives and translation of assets and liabilities in foreign currencies | (179) | |
| Net tax appreciation (depreciation) | $ | 134,443,623 | |
| Undistributed ordinary income | — | |
| Accumulated long-term gains | $ | 18,715,721 | |
The difference between book-basis and tax-basis unrealized appreciation (depreciation) is attributable primarily to the tax deferral of losses on wash sales.
| | | | | | | | | | | | | | | | | | | | | | | | | | | | | | | | | | | | | | | | | | | | | | | |
| For a Share Outstanding Throughout the Years Ended December 31 (except as noted) | |
| Per-Share Data | | | | | | Ratios and Supplemental Data | |
| | Income From Investment Operations: | Distributions From: | | | Ratio to Average Net Assets of: | |
| Net Asset
Value,
Beginning
of Period | Net Investment Income (Loss)(1) | Net
Realized
and
Unrealized
Gain (Loss) | Total From
Investment
Operations | Net
Investment
Income | Net
Realized
Gains | Total
Distributions | Net Asset
Value,
End
of Period | Total Return(2) | Operating
Expenses | Operating Expenses
(before
expense
waiver) | Net
Investment
Income
(Loss) | Net
Investment
Income
(Loss)
(before
expense
waiver) | Portfolio
Turnover
Rate | Net
Assets,
End of
Period
(in thousands) |
| Class I | | | | | | | | | | | | | | | |
| 2022 | $31.38 | (0.05) | (9.41) | (9.46) | — | (2.58) | (2.58) | $19.34 | (32.38)% | 0.78% | 0.89% | (0.21)% | (0.32)% | 24% | $68,354 | |
| 2021 | $27.48 | (0.10) | 5.98 | 5.88 | — | (1.98) | (1.98) | $31.38 | 23.16% | 0.79% | 0.95% | (0.35)% | (0.51)% | 19% | $117,231 | |
| 2020 | $20.93 | (0.04) | 8.75 | 8.71 | — | (2.16) | (2.16) | $27.48 | 49.85% | 0.80% | 1.00% | (0.18)% | (0.38)% | 22% | $96,249 | |
| 2019 | $17.40 | —(3) | 5.67 | 5.67 | — | (2.14) | (2.14) | $20.93 | 34.58% | 0.82% | 1.00% | (0.01)% | (0.19)% | 23% | $59,427 | |
| 2018 | $19.34 | —(3) | 0.17 | 0.17 | (0.05) | (2.06) | (2.11) | $17.40 | 0.76% | 0.83% | 1.00% | 0.01% | (0.16)% | 29% | $42,081 | |
| Class II | | | | | | | | | | | | | | |
| 2022 | $30.44 | (0.08) | (9.10) | (9.18) | — | (2.58) | (2.58) | $18.68 | (32.46)% | 0.93% | 1.04% | (0.36)% | (0.47)% | 24% | $148,203 | |
| 2021 | $26.76 | (0.14) | 5.80 | 5.66 | — | (1.98) | (1.98) | $30.44 | 22.99% | 0.94% | 1.10% | (0.50)% | (0.66)% | 19% | $220,389 | |
| 2020 | $20.48 | (0.07) | 8.51 | 8.44 | — | (2.16) | (2.16) | $26.76 | 49.55% | 0.95% | 1.15% | (0.33)% | (0.53)% | 22% | $201,527 | |
| 2019 | $17.08 | (0.03) | 5.57 | 5.54 | — | (2.14) | (2.14) | $20.48 | 34.46% | 0.97% | 1.15% | (0.16)% | (0.34)% | 23% | $156,688 | |
| 2018 | $19.02 | (0.03) | 0.17 | 0.14 | (0.02) | (2.06) | (2.08) | $17.08 | 0.60% | 0.98% | 1.15% | (0.14)% | (0.31)% | 29% | $143,249 | |
| | |
| Notes to Financial Highlights |
(1)Computed using average shares outstanding throughout the period.
(2)Total returns are calculated based on the net asset value of the last business day. Total returns for periods less than one year are not annualized. The total returns presented do not include the fees and charges assessed with investments in variable insurance products, those charges are disclosed in the separate account prospectus. The inclusion of such fees and charges would lower total return.
(3)Per-share amount was less than $0.005.
See Notes to Financial Statements.
| | |
| Report of Independent Registered Public Accounting Firm |
To the Shareholders and the Board of Directors of American Century Variable Portfolios, Inc.:
Opinion on the Financial Statements and Financial Highlights
We have audited the accompanying statement of assets and liabilities, including the schedule of investments, of VP Ultra® Fund (the “Fund”), one of the funds constituting the American Century Variable Portfolios, Inc., as of December 31, 2022, the related statement of operations for the year then ended, the statements of changes in net assets for each of the two years in the period then ended, the financial highlights for each of the five years in the period then ended, and the related notes. In our opinion, the financial statements and financial highlights present fairly, in all material respects, the financial position of VP Ultra® Fund of the American Century Variable Portfolios, Inc. as of December 31, 2022, and the results of its operations for the year then ended, the changes in its net assets for each of the two years in the period then ended, and the financial highlights for each of the five years in the period then ended, in conformity with accounting principles generally accepted in the United States of America.
Basis for Opinion
These financial statements and financial highlights are the responsibility of the Fund's management. Our responsibility is to express an opinion on the Fund’s financial statements and financial highlights based on our audits. We are a public accounting firm registered with the Public Company Accounting Oversight Board (United States) (PCAOB) and are required to be independent with respect to the Fund in accordance with the U.S. federal securities laws and the applicable rules and regulations of the Securities and Exchange Commission and the PCAOB.
We conducted our audits in accordance with the standards of the PCAOB. Those standards require that we plan and perform the audit to obtain reasonable assurance about whether the financial statements and financial highlights are free of material misstatement, whether due to error or fraud. The Fund is not required to have, nor were we engaged to perform, an audit of its internal control over financial reporting. As part of our audits, we are required to obtain an understanding of internal control over financial reporting but not for the purpose of expressing an opinion on the effectiveness of the Fund’s internal control over financial reporting. Accordingly, we express no such opinion.
Our audits included performing procedures to assess the risks of material misstatement of the financial statements and financial highlights, whether due to error or fraud, and performing procedures that respond to those risks. Such procedures included examining, on a test basis, evidence regarding the amounts and disclosures in the financial statements and financial highlights. Our audits also included evaluating the accounting principles used and significant estimates made by management, as well as evaluating the overall presentation of the financial statements and financial highlights. Our procedures included confirmation of securities owned as of December 31, 2022, by correspondence with the custodian and brokers; when replies were not received from brokers, we performed other auditing procedures. We believe that our audits provide a reasonable basis for our opinion.
/s/ Deloitte & Touche LLP
Kansas City, Missouri
February 10, 2023
We have served as the auditor of one or more American Century investment companies since 1997.
The Board of Directors
The individuals listed below serve as directors of the funds. Each director will continue to serve in this capacity until death, retirement, resignation or removal from office. The board has adopted a mandatory retirement age for directors who are not “interested persons,” as that term is defined in the Investment Company Act (independent directors). Independent directors shall retire on December 31 of the year in which they reach their 75th birthday.
Jonathan S. Thomas is an “interested person” because he currently serves as President and Chief Executive Officer of American Century Companies, Inc. (ACC), the parent company of American Century Investment Management, Inc. (ACIM or the advisor). The other directors (more than three-fourths of the total number) are independent. They are not employees, directors or officers of, and have no financial interest in, ACC or any of its wholly owned, direct or indirect, subsidiaries, including ACIM, American Century Investment Services, Inc. (ACIS) and American Century Services, LLC (ACS), and they do not have any other affiliations, positions or relationships that would cause them to be considered “interested persons” under the Investment Company Act. The directors serve in this capacity for seven (in the case of Jonathan S. Thomas, 16; and Stephen E. Yates, 8) registered investment companies in the American Century Investments family of funds.
The following table presents additional information about the directors. The mailing address for each director is 4500 Main Street, Kansas City, Missouri 64111.
| | | | | | | | | | | | | | | | | |
Name
(Year of Birth) | Position(s) Held with Funds | Length of Time Served | Principal Occupation(s) During Past 5 Years | Number of American Century Portfolios Overseen by Director | Other Directorships Held During Past 5 Years |
| Independent Directors | | |
Brian Bulatao
(1964) | Director | Since 2022 | Chief Administrative Officer, Activision Blizzard, Inc. (2021 to present); Under Secretary of State for Management, U.S. Department of State (2018 to 2021); Chief Operating Officer, Central Intelligence Agency (2017 to 2018) | 64 | None |
| Thomas W. Bunn (1953) | Director | Since 2017 | Retired | 64 | None |
Chris H. Cheesman
(1962)
| Director | Since 2019
| Retired. Senior Vice President & Chief Audit Executive, AllianceBernstein (1999 to 2018)
| 64 | Alleghany Corporation (2021 to 2022) |
Barry Fink
(1955) | Director | Since 2012 (independent since 2016) | Retired | 64 | None |
Rajesh K. Gupta
(1960)
| Director | Since 2019
| Partner Emeritus, SeaCrest Investment Management and SeaCrest Wealth Management (2019 to Present); Chief Executive Officer and Chief Investment Officer, SeaCrest Investment Management (2006 to 2019); Chief Executive Officer and Chief Investment Officer, SeaCrest Wealth Management (2008 to 2019) | 64 | None |
| | | | | | | | | | | | | | | | | |
Name
(Year of Birth) | Position(s) Held with Funds | Length of Time Served | Principal Occupation(s) During Past 5 Years | Number of American Century Portfolios Overseen by Director | Other Directorships Held During Past 5 Years |
| Independent Directors | | |
Lynn Jenkins
(1963)
| Director | Since 2019
| Consultant, LJ Strategies (2019 to present); United States Representative, U.S. House of Representatives (2009 to 2018) | 64 | MGP Ingredients, Inc. (2019 to 2021) |
Jan M. Lewis
(1957) | Director and Board Chair | Since 2011 (Board Chair since 2022) | Retired | 64 | None |
Gary C. Meltzer
(1963) | Director | Since 2022 | Advisor, Pontoro (2021 to present); Executive Advisor, Consultant and Investor, Harris Ariel Advisory LLC (2020 to present); Managing Partner, PricewaterhouseCoopers LLP (1985 to 2020) | 64 | ExcelFin Acquisition Corp., Apollo Realty Income Solutions, Inc. |
Stephen E. Yates
(1948) | Director | Since 2012 | Retired | 108 | None |
| Interested Director | |
Jonathan S. Thomas
(1963) | Director | Since 2007 | President and Chief Executive Officer, ACC (2007 to present). Also serves as Chief Executive Officer, ACS; Director, ACC and other ACC subsidiaries | 140 | None |
The Statement of Additional Information has additional information about the fund's directors and is available without charge, upon request, by calling 1-800-378-9878.
Officers
The following table presents certain information about the executive officers of the funds. Each officer serves as an officer for 16 (in the case of Robert J. Leach, 15) investment companies in the American Century family of funds. No officer is compensated for his or her service as an officer of the funds. The listed officers are interested persons of the funds and are appointed or re-appointed on an annual basis. The mailing address for each officer listed below is 4500 Main Street, Kansas City, Missouri 64111.
| | | | | | | | |
Name
(Year of Birth) | Offices with the Funds | Principal Occupation(s) During the Past Five Years |
Patrick Bannigan
(1965) | President since 2019 | Executive Vice President and Director, ACC (2012 to present); Chief Financial Officer, Chief Accounting Officer and Treasurer, ACC (2015 to present). Also serves as President, ACS; Vice President, ACIM; Chief Financial Officer, Chief Accounting Officer and/or Director, ACIM, ACS and other ACC subsidiaries |
R. Wes Campbell
(1974) | Chief Financial Officer and Treasurer since 2018 | Vice President, ACS, (2020 to present); Investment Operations and Investment Accounting, ACS (2000 to present) |
Amy D. Shelton
(1964) | Chief Compliance Officer and Vice President since 2014 | Chief Compliance Officer, American Century funds, (2014 to present); Chief Compliance Officer, ACIM (2014 to present); Chief Compliance Officer, ACIS (2009 to present). Also serves as Vice President, ACIS |
John Pak
(1968) | General Counsel and
Senior Vice President since 2021 | General Counsel and Senior Vice President, ACC (2021 to present); Also serves as General Counsel and Senior Vice President, ACIM, ACS and ACIS. Chief Legal Officer of Investment and Wealth Management, The Bank of New York Mellon (2014 to 2021) |
C. Jean Wade
(1964) | Vice President since 2012 | Senior Vice President, ACS (2017 to present); Vice President, ACS (2000 to 2017)
|
Robert J. Leach
(1966) | Vice President since 2006 | Vice President, ACS (2000 to present) |
David H. Reinmiller
(1963) | Vice President since 2000 | Attorney, ACC (1994 to present). Also serves as Vice President, ACIM and ACS |
Ward D. Stauffer
(1960) | Secretary since 2005 | Attorney, ACC (2003 to present) |
A special meeting of shareholders was held on October 13, 2022, to vote on the following proposal. The proposal received the required votes and was adopted. A summary of voting results is listed below.
To elect five directors to the Board of Directors of American Century Variable Portfolios, Inc.:
| | | | | | | | | | | |
| Affirmative | | Withhold |
| Brian Bulatao | $ | 2,607,537,119 | | | $ | 88,836,350 | |
| Chris H. Cheesman | $ | 2,619,879,519 | | | $ | 76,493,950 | |
| Rajesh K. Gupta | $ | 2,616,882,375 | | | $ | 79,491,094 | |
| Lynn M. Jenkins | $ | 2,607,769,137 | | | $ | 88,604,332 | |
| Gary C. Meltzer | $ | 2,616,158,906 | | | $ | 80,214,563 | |
The other directors whose term of office continued after the meeting include Jonathan S. Thomas, Thomas W. Bunn, Barry Fink, Jan M. Lewis, and Stephen E. Yates.
Proxy Voting Policies
A description of the policies that the fund's investment advisor uses in exercising the voting rights associated with the securities purchased and/or held by the fund is available without charge, upon request, by calling 1-800-378-9878. It is also available on American Century Investments’ website at americancentury.com/proxy and on the Securities and Exchange Commission’s website at sec.gov. Information regarding how the investment advisor voted proxies relating to portfolio securities during the most recent 12-month period ended June 30 is available on americancentury.com/proxy. It is also available at sec.gov.
Quarterly Portfolio Disclosure
The fund files its complete schedule of portfolio holdings with the Securities and Exchange Commission (SEC) for the first and third quarters of each fiscal year as an exhibit to its reports on Form N-PORT. These portfolio holdings are available on the fund's website at americancentury.com and, upon request, by calling 1-800-378-9878. The fund’s Form N-PORT reports are available on the SEC’s website at sec.gov.
Other Tax Information
The following information is provided pursuant to provisions of the Internal Revenue Code.
For corporate taxpayers, the fund hereby designates $28,679, or up to the maximum amount allowable, of ordinary income distributions paid during the fiscal year ended December 31, 2022 as qualified for the corporate dividends received deduction.
The fund hereby designates $28,330,875, or up to the maximum amount allowable, as long-term capital gain distributions (20% rate gain distributions) for the fiscal year ended December 31, 2022.
The fund hereby designates $28,679 as qualified short-term capital gain distributions for purposes of Internal Revenue Code Section 871 for the fiscal year ended December 31, 2022.
| | | | | | | | |
| |
| | |
| Contact Us | americancentury.com | |
| Automated Information Line | 1-800-345-8765 | |
| Investment Professional Service Representatives | 1-800-345-6488 | |
| Telecommunications Relay Service for the Deaf | 711 | |
| | |
| American Century Variable Portfolios, Inc. | |
| | |
Investment Advisor: American Century Investment Management, Inc. Kansas City, Missouri | |
| | |
| This report and the statements it contains are submitted for the general information of our shareholders. The report is not authorized for distribution to prospective investors unless preceded or accompanied by an effective prospectus. | |
| | |
©2023 American Century Proprietary Holdings, Inc. All rights reserved.
CL-ANN-91443 2302 | |
| | | | | |
| |
| Annual Report |
| |
| December 31, 2022 |
| |
| VP Value Fund |
| Class I (AVPIX) |
| Class II (AVPVX) |
| | | | | |
| Performance | |
| Portfolio Commentary | |
| Fund Characteristics | |
| Shareholder Fee Example | |
| Schedule of Investments | |
| Statement of Assets and Liabilities | |
| Statement of Operations | |
| Statement of Changes in Net Assets | |
| Notes to Financial Statements | |
| Financial Highlights | |
| Report of Independent Registered Public Accounting Firm | |
| Management | |
| |
| |
| Proxy Voting Results | |
| Additional Information | |
Any opinions expressed in this report reflect those of the author as of the date of the report, and do not necessarily represent the opinions of American Century Investments® or any other person in the American Century Investments organization. Any such opinions are subject to change at any time based upon market or other conditions and American Century Investments disclaims any responsibility to update such opinions. These opinions may not be relied upon as investment advice and, because investment decisions made by American Century Investments funds are based on numerous factors, may not be relied upon as an indication of trading intent on behalf of any American Century Investments fund. Security examples are used for representational purposes only and are not intended as recommendations to purchase or sell securities. Performance information for comparative indices and securities is provided to American Century Investments by third party vendors. To the best of American Century Investments’ knowledge, such information is accurate at the time of printing.
| | | | | | | | | | | | | | | | | | | |
| Total Returns as of December 31, 2022 | | | | |
| | | | Average Annual Returns | |
| Ticker
Symbol | | 1 year | 5 years | 10 years | | Inception
Date |
| Class I | AVPIX | | 0.54% | 7.85% | 10.59% | | 5/1/96 |
| Russell 1000 Value Index | — | | -7.54% | 6.66% | 10.29% | | — |
| S&P 500 Index | — | | -18.11% | 9.42% | 12.56% | | — |
| Class II | AVPVX | | 0.31% | 7.68% | 10.41% | | 8/14/01 |
Fund returns would have been lower if a portion of the fees had not been waived.
The performance information presented does not include the fees and charges assessed with investments in variable insurance products, those charges are disclosed in the separate account prospectus. The inclusion of such fees and charges would lower performance.
Data presented reflect past performance. Past performance is no guarantee of future results. Current performance may be higher or lower than the performance shown. Total returns for periods less than one year are not annualized. Investment return and principal value will fluctuate, and redemption value may be more or less than original cost. Data assumes reinvestment of dividends and capital gains, and none of the charts reflect the deduction of taxes that a shareholder would pay on fund distributions or the redemption of fund shares. To obtain performance data current to the most recent month end, please call 1-800-345-6488 or visit americancentury.com. For additional information about the fund, please consult the prospectus.
| | |
| Growth of $10,000 Over 10 Years |
| $10,000 investment made December 31, 2012 |
| Performance for other share classes will vary due to differences in fee structure. |
| | | | | |
| Value on December 31, 2022 |
| Class I — $27,365 |
|
| Russell 1000 Value Index — $26,632 |
|
| S&P 500 Index — $32,654 |
|
| |
|
Ending value of Class I would have been lower if a portion of the fees had not been waived.
| | | | | |
| Total Annual Fund Operating Expenses |
| Class I | Class II |
| 0.83% | 0.98% |
The total annual fund operating expenses shown is as stated in the fund’s prospectus current as of the date of this report. The prospectus may vary from the expense ratio shown elsewhere in this report because it is based on a different time period, includes acquired fund fees and expenses, and, if applicable, does not include fee waivers or expense reimbursements.
Data presented reflect past performance. Past performance is no guarantee of future results. Current performance may be higher or lower than the performance shown. Total returns for periods less than one year are not annualized. Investment return and principal value will fluctuate, and redemption value may be more or less than original cost. Data assumes reinvestment of dividends and capital gains, and none of the charts reflect the deduction of taxes that a shareholder would pay on fund distributions or the redemption of fund shares. To obtain performance data current to the most recent month end, please call 1-800-345-6488 or visit americancentury.com. For additional information about the fund, please consult the prospectus.
Portfolio Managers: Kevin Toney, Michael Liss, Brian Woglom, Philip Sundell and David Byrns
On December 31, 2022, Phillip Davidson retired from American Century Investments and left VP Value’s management team. In February 2022, David Byrns became a named portfolio manager for the fund.
Performance Summary
VP Value returned 0.54%* for the 12 months ended December 31, 2022, compared with the -7.54% return of its benchmark, the Russell 1000 Value Index. The fund’s return reflects operating expenses, while the index’s return does not.
The fund’s overweight in the energy sector relative to the benchmark, along with stock selection in the health care and communication services sectors, positively impacted relative performance. The fund’s underweight position in communication services also aided results. On the other hand, our underweight in the utilities sector detracted from returns.
Energy, Health Care and Communication Services Contributed
Our research has led us to several energy stocks that meet our investment criteria, resulting in an overweight to the energy sector relative to the benchmark. This overweight was beneficial to performance as the energy sector soared over the trailing 12-month period. Several of the fund’s top individual contributors were energy companies, including Schlumberger, Chevron and France-based TotalEnergies. Like many of their peers, these companies benefited from higher commodity prices. In addition, TotalEnergies outperformed as the markets welcomed the company’s strategic update presented at its analyst day.
Health care was another area of strength, as several positions in the pharmaceuticals and health care providers and services industries outperformed. Shares of Cardinal Health jumped following involvement by an activist investor and on news that it would increase its share buyback authorization. Merck & Co., a pharmaceutical company, was another notable contributor as investors flocked to more defensive areas of the market amid volatility. The company also reported solid financial results on strength in its flagship drug, Keytruda, as well as in its vaccines division.
Our bottom-up approach resulted in an underweight in the communication services sector relative to the benchmark. We benefited from not owning several of the benchmark’s names, including Meta Platforms. Its shares underperformed, driven by disappointing quarterly results. Shares were also pressured by concerns regarding TikTok competition and Meta’s heavy investment in a metaverse business. Lack of exposure to Alphabet, Google’s parent company, also helped performance. Its shares underperformed on concerns that its core advertising business may be negatively impacted by a recession.
Utilities Underweight Detracted
Defensive sectors of the market generally outperformed cyclical sectors over the trailing 12-month period, so our underweight in the utilities sector detracted from the fund’s relative performance.
Our position in Intel also weighed on the fund’s results. Intel’s shares fell due to competitive pressures, the company’s large revenue exposure to China and weakening personal computer demand.
*All fund returns referenced in this commentary are for Class I shares. Fund returns would have been lower if a portion of the fees had not been waived. Performance for other share classes will vary due to differences in fee structure; when Class I performance exceeds that of the fund’s benchmark, other share classes may not. See page 2 for returns for all share classes.
Medtronic was another key detractor. Shares of this medical device company were hurt by disappointing results for its renal denervation trial. Renal denervation is a blood pressure treatment. Medtronic also announced weak earnings, driven by supply chain pressures and a slower-than-expected return in procedure volumes. However, elective procedure volumes are now at pre-COVID-19 levels, and we think the company can work through its supply chain challenges.
Portfolio Positioning
The portfolio seeks to invest in companies where we believe the valuation does not reflect the quality and normal earnings power of the company. Our process is based on individual security selection, but broad themes have emerged.
We ended the period with a notable overweight in energy relative to the benchmark. Our research has led us to energy companies with solid assets, strong balance sheets and management teams focused on returns on capital. The portfolio is also overweight in financials. We expect the Federal Reserve to maintain higher interest rates as it continues its inflation fight in 2023, which could act as a tailwind for interest rate-sensitive financials that underearned when rates were unusually low. At the same time, however, we are aware that credit risk is rising as the economy slows. Therefore, we remain focused on companies that, in our view, offer higher relative returns on assets, stronger capital levels, lower credit risk and management teams focused on returns and building competitive advantages.
On the other hand, we ended the year with limited exposure to the utilities sector. Due in part to the relative outperformance of defensive sectors, including utilities, we have not identified many stocks in the utilities sector with valuations that we view as attractive. The fund’s exposure to materials also remains limited because it has been difficult to find stocks in the sector that meet our investment criteria.
| | | | | |
| DECEMBER 31, 2022 |
| Types of Investments in Portfolio | % of net assets |
| Common Stocks | 98.0% |
| Short-Term Investments | 2.2% |
| Other Assets and Liabilities | (0.2)% |
| |
| Top Five Industries | % of net assets |
| Banks | 11.4% |
| Pharmaceuticals | 9.0% |
| Oil, Gas and Consumable Fuels | 7.8% |
| Capital Markets | 4.9% |
| Health Care Equipment and Supplies | 4.8% |
Fund shareholders may incur two types of costs: (1) transaction costs, including sales charges (loads) on purchase payments and redemption/exchange fees; and (2) ongoing costs, including management fees; distribution and service (12b-1) fees; and other fund expenses. This example is intended to help you understand your ongoing costs (in dollars) of investing in your fund and to compare these costs with the ongoing cost of investing in other mutual funds.
The example is based on an investment of $1,000 made at the beginning of the period and held for the entire period from July 1, 2022 to December 31, 2022.
Actual Expenses
The table provides information about actual account values and actual expenses for each class. You may use the information, together with the amount you invested, to estimate the expenses that you paid over the period. First, identify the share class you own. Then simply divide your account value by $1,000 (for example, an $8,600 account value divided by $1,000 = 8.6), then multiply the result by the number under the heading “Expenses Paid During Period” to estimate the expenses you paid on your account during this period.
Hypothetical Example for Comparison Purposes
The table also provides information about hypothetical account values and hypothetical expenses based on the actual expense ratio of each class of your fund and an assumed rate of return of 5% per year before expenses, which is not the actual return of a fund’s share class. The hypothetical account values and expenses may not be used to estimate the actual ending account balance or expenses you paid for the period. You may use this information to compare the ongoing costs of investing in your fund and other funds. To do so, compare this 5% hypothetical example with the 5% hypothetical examples that appear in the shareholder reports of the other funds.
Please note that the expenses shown in the table are meant to highlight your ongoing costs only and do not reflect any transactional costs, such as sales charges (loads) or redemption/exchange fees. Therefore, the table is useful in comparing ongoing costs only, and will not help you determine the relative total costs of owning different funds. In addition, if these transactional costs were included, your costs would have been higher.
| | | | | | | | | | | | | | |
| Beginning
Account Value
7/1/22 | Ending Account Value 12/31/22 | Expenses Paid During Period(1) 7/1/22 - 12/31/22 | Annualized Expense Ratio(1) |
| Actual | | | | |
| Class I | $1,000 | $1,085.90 | $3.79 | 0.72% |
| Class II | $1,000 | $1,084.10 | $4.57 | 0.87% |
| Hypothetical | | | | |
| Class I | $1,000 | $1,021.58 | $3.67 | 0.72% |
| Class II | $1,000 | $1,020.82 | $4.43 | 0.87% |
(1)Expenses are equal to the class's annualized expense ratio listed in the table above, multiplied by the average account value over the period, multiplied by 184, the number of days in the most recent fiscal half-year, divided by 365, to reflect the one-half year period. Annualized expense ratio reflects actual expenses, including any applicable fee waivers or expense reimbursements and excluding any acquired fund fees and expenses.
DECEMBER 31, 2022
| | | | | | | | |
| Shares | Value |
| COMMON STOCKS — 98.0% | | |
| Aerospace and Defense — 2.1% | | |
| BAE Systems PLC | 394,408 | | $ | 4,073,604 | |
| L3Harris Technologies, Inc. | 19,940 | | 4,151,708 | |
| Raytheon Technologies Corp. | 109,460 | | 11,046,703 | |
| | 19,272,015 | |
| Airlines — 0.8% | | |
Southwest Airlines Co.(1) | 224,157 | | 7,547,366 | |
| Auto Components — 1.5% | | |
| BorgWarner, Inc. | 219,969 | | 8,853,752 | |
| Cie Generale des Etablissements Michelin SCA | 178,360 | | 4,968,623 | |
| | 13,822,375 | |
| Automobiles — 0.8% | | |
| General Motors Co. | 226,914 | | 7,633,387 | |
| Banks — 11.4% | | |
| Bank of America Corp. | 542,240 | | 17,958,989 | |
| Comerica, Inc. | 64,552 | | 4,315,301 | |
| JPMorgan Chase & Co. | 200,709 | | 26,915,077 | |
| Prosperity Bancshares, Inc. | 64,399 | | 4,680,520 | |
| Truist Financial Corp. | 242,070 | | 10,416,272 | |
| U.S. Bancorp | 572,602 | | 24,971,173 | |
| Wells Fargo & Co. | 394,052 | | 16,270,407 | |
| | 105,527,739 | |
| Beverages — 0.4% | | |
| Heineken NV | 37,880 | | 3,567,999 | |
| Capital Markets — 4.9% | | |
| Bank of New York Mellon Corp. | 351,170 | | 15,985,258 | |
| BlackRock, Inc. | 8,200 | | 5,810,766 | |
| Invesco Ltd. | 388,496 | | 6,989,043 | |
| Northern Trust Corp. | 92,897 | | 8,220,456 | |
| State Street Corp. | 103,730 | | 8,046,336 | |
| | 45,051,859 | |
| Chemicals — 0.5% | | |
| Akzo Nobel NV | 65,490 | | 4,394,544 | |
| Communications Equipment — 3.5% | | |
| Cisco Systems, Inc. | 529,073 | | 25,205,038 | |
F5, Inc.(1) | 51,966 | | 7,457,640 | |
| | 32,662,678 | |
| Containers and Packaging — 0.7% | | |
| Packaging Corp. of America | 49,740 | | 6,362,243 | |
| Diversified Financial Services — 4.2% | | |
Berkshire Hathaway, Inc., Class A(1) | 50 | | 23,435,548 | |
Berkshire Hathaway, Inc., Class B(1) | 50,934 | | 15,733,513 | |
| | 39,169,061 | |
| Diversified Telecommunication Services — 4.1% | | |
| AT&T, Inc. | 910,758 | | 16,767,055 | |
| Verizon Communications, Inc. | 531,091 | | 20,924,985 | |
| | 37,692,040 | |
| | | | | | | | |
| Shares | Value |
| Electric Utilities — 1.8% | | |
| Duke Energy Corp. | 82,510 | | $ | 8,497,705 | |
| Edison International | 123,850 | | 7,879,337 | |
| | 16,377,042 | |
| Electrical Equipment — 2.2% | | |
| Emerson Electric Co. | 87,729 | | 8,427,248 | |
| nVent Electric PLC | 166,758 | | 6,415,180 | |
| Signify NV | 166,110 | | 5,591,681 | |
| | 20,434,109 | |
| Electronic Equipment, Instruments and Components — 0.3% | | |
| Anritsu Corp. | 283,800 | | 2,763,529 | |
| Energy Equipment and Services — 2.4% | | |
| Baker Hughes Co. | 365,966 | | 10,806,976 | |
| Halliburton Co. | 129,208 | | 5,084,335 | |
| Schlumberger Ltd. | 121,629 | | 6,502,286 | |
| | 22,393,597 | |
| Entertainment — 1.3% | | |
Walt Disney Co.(1) | 136,420 | | 11,852,170 | |
| Equity Real Estate Investment Trusts (REITs) — 3.0% | | |
| Agree Realty Corp. | 66,890 | | 4,744,508 | |
| Equinix, Inc. | 7,500 | | 4,912,725 | |
| Healthpeak Properties, Inc. | 278,920 | | 6,992,524 | |
| Realty Income Corp. | 82,570 | | 5,237,415 | |
| Regency Centers Corp. | 99,390 | | 6,211,875 | |
| | 28,099,047 | |
| Food and Staples Retailing — 1.3% | | |
| Koninklijke Ahold Delhaize NV | 429,650 | | 12,352,980 | |
| Food Products — 3.5% | | |
| Conagra Brands, Inc. | 271,610 | | 10,511,307 | |
| Danone SA | 148,690 | | 7,836,805 | |
| JDE Peet's NV | 127,897 | | 3,699,397 | |
| Mondelez International, Inc., Class A | 150,106 | | 10,004,565 | |
| | 32,052,074 | |
| Gas Utilities — 0.6% | | |
| Atmos Energy Corp. | 47,144 | | 5,283,428 | |
| Health Care Equipment and Supplies — 4.8% | | |
| Medtronic PLC | 359,777 | | 27,961,868 | |
| Zimmer Biomet Holdings, Inc. | 130,883 | | 16,687,583 | |
| | 44,649,451 | |
| Health Care Providers and Services — 3.7% | | |
| Cardinal Health, Inc. | 118,000 | | 9,070,660 | |
| CVS Health Corp. | 125,870 | | 11,729,825 | |
| Laboratory Corp. of America Holdings | 20,530 | | 4,834,405 | |
| McKesson Corp. | 4,920 | | 1,845,590 | |
| Universal Health Services, Inc., Class B | 47,700 | | 6,720,453 | |
| | 34,200,933 | |
| Hotels, Restaurants and Leisure — 0.6% | | |
| Sodexo SA | 55,420 | | 5,302,495 | |
| Household Products — 1.5% | | |
| Henkel AG & Co. KGaA | 76,090 | | 4,889,898 | |
| Kimberly-Clark Corp. | 44,670 | | 6,063,952 | |
| Procter & Gamble Co. | 20,366 | | 3,086,671 | |
| | 14,040,521 | |
| | | | | | | | |
| Shares | Value |
| Industrial Conglomerates — 3.3% | | |
| General Electric Co. | 253,918 | | $ | 21,275,789 | |
| Siemens AG | 64,460 | | 8,885,889 | |
| | 30,161,678 | |
| Insurance — 1.1% | | |
| Allstate Corp. | 49,020 | | 6,647,112 | |
| Reinsurance Group of America, Inc. | 27,191 | | 3,863,569 | |
| | 10,510,681 | |
| Leisure Products — 0.6% | | |
Mattel, Inc.(1) | 318,903 | | 5,689,230 | |
| Machinery — 1.2% | | |
| IMI PLC | 410,446 | | 6,410,278 | |
| Oshkosh Corp. | 56,050 | | 4,943,049 | |
| | 11,353,327 | |
| Media — 0.4% | | |
| Interpublic Group of Cos., Inc. | 116,150 | | 3,868,957 | |
| Metals and Mining — 0.8% | | |
| BHP Group Ltd. | 227,200 | | 7,037,961 | |
| Multiline Retail — 1.0% | | |
Dollar Tree, Inc.(1) | 65,830 | | 9,310,995 | |
| Multi-Utilities — 0.5% | | |
| Engie SA | 304,430 | | 4,355,197 | |
| Oil, Gas and Consumable Fuels — 7.8% | | |
| Chevron Corp. | 86,937 | | 15,604,322 | |
| ConocoPhillips | 68,524 | | 8,085,832 | |
| Devon Energy Corp. | 87,827 | | 5,402,239 | |
| EQT Corp. | 118,861 | | 4,021,068 | |
| Exxon Mobil Corp. | 212,000 | | 23,383,600 | |
| Shell PLC | 274,840 | | 7,747,964 | |
TotalEnergies SE(2) | 130,569 | | 8,196,225 | |
| | 72,441,250 | |
| Paper and Forest Products — 0.7% | | |
| Mondi PLC | 376,810 | | 6,372,197 | |
| Personal Products — 1.3% | | |
| Unilever PLC | 243,190 | | 12,202,480 | |
| Pharmaceuticals — 9.0% | | |
| Bristol-Myers Squibb Co. | 135,830 | | 9,772,969 | |
| Johnson & Johnson | 158,919 | | 28,073,041 | |
| Merck & Co., Inc. | 106,272 | | 11,790,878 | |
| Pfizer, Inc. | 323,619 | | 16,582,238 | |
| Roche Holding AG | 24,390 | | 7,664,249 | |
| Sanofi | 45,230 | | 4,361,372 | |
Teva Pharmaceutical Industries Ltd., ADR(1) | 557,826 | | 5,087,373 | |
| | 83,332,120 | |
| Road and Rail — 1.0% | | |
| Heartland Express, Inc. | 584,356 | | 8,964,021 | |
| Semiconductors and Semiconductor Equipment — 2.2% | | |
| Intel Corp. | 506,185 | | 13,378,469 | |
| QUALCOMM, Inc. | 67,890 | | 7,463,827 | |
| | 20,842,296 | |
| Software — 1.5% | | |
| Open Text Corp. | 154,470 | | 4,578,491 | |
| | | | | | | | |
| Shares | Value |
| Oracle Corp. (New York) | 118,123 | | $ | 9,655,374 | |
| | 14,233,865 | |
| Specialty Retail — 1.0% | | |
| Advance Auto Parts, Inc. | 65,881 | | 9,686,483 | |
| Technology Hardware, Storage and Peripherals — 0.4% | | |
| HP, Inc. | 141,287 | | 3,796,382 | |
| Textiles, Apparel and Luxury Goods — 1.3% | | |
| Ralph Lauren Corp. | 49,310 | | 5,210,588 | |
| Tapestry, Inc. | 186,564 | | 7,104,357 | |
| | 12,314,945 | |
| Trading Companies and Distributors — 1.0% | | |
| MSC Industrial Direct Co., Inc., Class A | 113,672 | | 9,287,002 | |
TOTAL COMMON STOCKS (Cost $723,672,552) | | 908,265,749 | |
| SHORT-TERM INVESTMENTS — 2.2% | | |
| Money Market Funds — 0.9% | | |
| State Street Institutional U.S. Government Money Market Fund, Premier Class | 121,759 | | 121,759 | |
State Street Navigator Securities Lending Government Money Market Portfolio(3) | 8,604,497 | | 8,604,497 | |
| | 8,726,256 | |
| Repurchase Agreements — 1.3% | | |
| BMO Capital Markets Corp., (collateralized by various U.S. Treasury obligations, 0.375% - 0.50%, 9/15/24 - 5/31/27, valued at $1,725,216), in a joint trading account at 4.20%, dated 12/30/22, due 1/3/23 (Delivery value $1,694,047) | | 1,693,257 | |
| Fixed Income Clearing Corp., (collateralized by various U.S. Treasury obligations, 1.375%, 11/15/31, valued at $10,611,067), at 4.26%, dated 12/30/22, due 1/3/23 (Delivery value $10,407,924) | | 10,403,000 | |
| | 12,096,257 | |
TOTAL SHORT-TERM INVESTMENTS (Cost $20,822,513) | | 20,822,513 | |
TOTAL INVESTMENT SECURITIES—100.2% (Cost $744,495,065) | | 929,088,262 | |
| OTHER ASSETS AND LIABILITIES — (0.2)% | | (2,140,839) | |
| TOTAL NET ASSETS — 100.0% | | $ | 926,947,423 | |
| | | | | | | | | | | | | | | | | | | | |
| FORWARD FOREIGN CURRENCY EXCHANGE CONTRACTS |
| Currency Purchased | Currency Sold | Counterparty | Settlement Date | Unrealized Appreciation (Depreciation) |
| USD | 5,229,461 | | AUD | 7,782,168 | | Bank of America N.A. | 3/31/23 | $ | (87,615) | |
| CHF | 160,974 | | USD | 175,985 | | Morgan Stanley | 3/31/23 | (254) | |
| USD | 5,988,436 | | CHF | 5,512,445 | | Morgan Stanley | 3/31/23 | (29,356) | |
| USD | 68,428,280 | | EUR | 63,904,840 | | JPMorgan Chase Bank N.A. | 3/31/23 | (386,648) | |
| USD | 18,908,127 | | GBP | 15,509,588 | | Bank of America N.A. | 3/31/23 | 117,836 | |
| JPY | 11,493,900 | | USD | 88,353 | | Bank of America N.A. | 3/31/23 | 249 | |
| JPY | 8,514,000 | | USD | 65,272 | | Bank of America N.A. | 3/31/23 | 360 | |
| JPY | 9,365,400 | | USD | 70,947 | | Bank of America N.A. | 3/31/23 | 1,248 | |
| USD | 2,210,338 | | JPY | 299,054,250 | | Bank of America N.A. | 3/31/23 | (94,975) | |
| | | | | | $ | (479,155) | |
| | | | | | | | |
| NOTES TO SCHEDULE OF INVESTMENTS |
| ADR | – | American Depositary Receipt |
| AUD | – | Australian Dollar |
| CHF | – | Swiss Franc |
| EUR | – | Euro |
| GBP | – | British Pound |
| JPY | – | Japanese Yen |
| USD | – | United States Dollar |
(1)Non-income producing.
(2)Security, or a portion thereof, is on loan. At the period end, the aggregate value of securities on loan was $8,196,225. The amount of securities on loan indicated may not correspond with the securities on loan identified because securities with pending sales are in the process of recall from the brokers.
(3)Investment of cash collateral from securities on loan. At the period end, the aggregate value of the collateral held by the fund was $8,604,497.
See Notes to Financial Statements.
| | |
| Statement of Assets and Liabilities |
| | | | | |
| DECEMBER 31, 2022 | |
| Assets | |
| Investment securities, at value (cost of $735,890,568) — including $8,196,225 of securities on loan | $ | 920,483,765 | |
| Investment made with cash collateral received for securities on loan, at value (cost of $8,604,497) | 8,604,497 | |
| Total investment securities, at value (cost of $744,495,065) | 929,088,262 | |
| Receivable for investments sold | 3,969,672 | |
| Receivable for capital shares sold | 3,513,296 | |
| Unrealized appreciation on forward foreign currency exchange contracts | 119,693 | |
| Dividends and interest receivable | 1,777,919 | |
| Securities lending receivable | 12,332 | |
| 938,481,174 | |
| |
| Liabilities | |
| Payable for collateral received for securities on loan | 8,604,497 | |
| Payable for investments purchased | 681,849 | |
| Payable for capital shares redeemed | 1,004,665 | |
| Unrealized depreciation on forward foreign currency exchange contracts | 598,848 | |
| Accrued management fees | 516,348 | |
| Distribution fees payable | 114,612 | |
| Accrued other expenses | 12,932 | |
| 11,533,751 | |
| |
| Net Assets | $ | 926,947,423 | |
| |
| Net Assets Consist of: | |
| Capital (par value and paid-in surplus) | $ | 698,427,612 | |
| Distributable earnings | 228,519,811 | |
| $ | 926,947,423 | |
| | | | | | | | | | | |
| Net Assets | Shares Outstanding | Net Asset Value Per Share |
| Class I, $0.01 Par Value | $387,023,891 | 31,094,080 | $12.45 |
| Class II, $0.01 Par Value | $539,923,532 | 43,321,216 | $12.46 |
See Notes to Financial Statements.
| | | | | |
| YEAR ENDED DECEMBER 31, 2022 | |
| Investment Income (Loss) | |
| Income: | |
| Dividends (net of foreign taxes withheld of $525,233) | $ | 26,472,444 | |
| Interest | 406,468 | |
| Securities lending, net | 47,356 | |
| 26,926,268 | |
| |
| Expenses: | |
| Management fees | 7,280,631 | |
| Distribution fees - Class II | 1,349,391 | |
| Directors' fees and expenses | 26,009 | |
| Other expenses | 138,067 | |
| 8,794,098 | |
Fees waived(1) | (1,018,157) | |
| 7,775,941 | |
| |
| Net investment income (loss) | 19,150,327 | |
| |
| Realized and Unrealized Gain (Loss) | |
| Net realized gain (loss) on: | |
| Investment transactions | 63,511,384 | |
| Forward foreign currency exchange contract transactions | 7,417,244 | |
| Foreign currency translation transactions | (129,785) | |
| 70,798,843 | |
| |
| Change in net unrealized appreciation (depreciation) on: | |
| Investments | (90,231,941) | |
| Forward foreign currency exchange contracts | 524,007 | |
| Translation of assets and liabilities in foreign currencies | (12,399) | |
| (89,720,333) | |
| |
| Net realized and unrealized gain (loss) | (18,921,490) | |
| |
| Net Increase (Decrease) in Net Assets Resulting from Operations | $ | 228,837 | |
(1)Amount consists of $434,490 and $583,667 for Class I and Class II, respectively.
See Notes to Financial Statements.
| | |
| Statement of Changes in Net Assets |
| | | | | | | | |
| YEARS ENDED DECEMBER 31, 2022 AND DECEMBER 31, 2021 |
| Increase (Decrease) in Net Assets | December 31, 2022 | December 31, 2021 |
| Operations | | |
| Net investment income (loss) | $ | 19,150,327 | | $ | 16,047,069 | |
| Net realized gain (loss) | 70,798,843 | | 112,327,142 | |
| Change in net unrealized appreciation (depreciation) | (89,720,333) | | 68,713,662 | |
| Net increase (decrease) in net assets resulting from operations | 228,837 | | 197,087,873 | |
| | |
| Distributions to Shareholders | | |
| From earnings: | | |
| Class I | (41,089,306) | | (7,286,263) | |
| Class II | (53,632,273) | | (8,356,267) | |
| Decrease in net assets from distributions | (94,721,579) | | (15,642,530) | |
| | |
| Capital Share Transactions | | |
| Net increase (decrease) in net assets from capital share transactions (Note 5) | 47,488,875 | | (26,279,332) | |
| | |
| Net increase (decrease) in net assets | (47,003,867) | | 155,166,011 | |
| | |
| Net Assets | | |
| Beginning of period | 973,951,290 | | 818,785,279 | |
| End of period | $ | 926,947,423 | | $ | 973,951,290 | |
See Notes to Financial Statements.
| | |
| Notes to Financial Statements |
DECEMBER 31, 2022
1. Organization
American Century Variable Portfolios, Inc. (the corporation) is registered under the Investment Company Act of 1940, as amended (the 1940 Act), as an open-end management investment company and is organized as a Maryland corporation. VP Value Fund (the fund) is one fund in a series issued by the corporation. The fund's investment objective is to seek long-term capital growth. Income is a secondary objective. The fund offers Class I and Class II.
2. Significant Accounting Policies
The following is a summary of significant accounting policies consistently followed by the fund in preparation of its financial statements. The fund is an investment company and follows accounting and reporting guidance in accordance with accounting principles generally accepted in the United States of America. This may require management to make certain estimates and assumptions at the date of the financial statements. Actual results could differ from these estimates. Management evaluated the impact of events or transactions occurring through the date the financial statements were issued that would merit recognition or disclosure.
Investment Valuations — The fund determines the fair value of its investments and computes its net asset value (NAV) per share at the close of regular trading (usually 4 p.m. Eastern time) on the New York Stock Exchange (NYSE) on each day the NYSE is open. The value of investments of the fund is determined by American Century Investment Management, Inc. (ACIM) (the investment advisor), as the valuation designee, pursuant to its valuation policies and procedures. The Board of Directors oversees the valuation designee and reviews its valuation policies and procedures at least annually.
Equity securities that are listed or traded on a domestic securities exchange are valued at the last reported sales price or at the official closing price as provided by the exchange. Equity securities traded on foreign securities exchanges are generally valued at the closing price of such securities on the exchange where primarily traded or at the close of the NYSE, if that is earlier. If no last sales price is reported, or if local convention or regulation so provides, the mean of the latest bid and asked prices may be used. Securities traded over-the-counter are valued at the mean of the latest bid and asked prices, the last sales price, or the official closing price. Equity securities initially expressed in local currencies are translated into U.S. dollars at the mean of the appropriate currency exchange rate at the close of the NYSE as provided by an independent pricing service.
Open-end management investment companies are valued at the reported NAV per share. Repurchase agreements are valued at cost, which approximates fair value. Forward foreign currency exchange contracts are valued at the mean of the appropriate forward exchange rate at the close of the NYSE as provided by an independent pricing service.
If the valuation designee determines that the market price for a portfolio security is not readily available or is believed by the valuation designee to be unreliable, such security is valued at fair value as determined in good faith by the valuation designee, in accordance with its policies and procedures. Circumstances that may cause the fund to determine that market quotations are not available or reliable include, but are not limited to: when there is a significant event subsequent to the market quotation; trading in a security has been halted during the trading day; or trading in a security is insufficient or did not take place due to a closure or holiday.
The valuation designee monitors for significant events occurring after the close of an investment’s primary exchange but before the fund’s NAV per share is determined. Significant events may include, but are not limited to: corporate announcements and transactions; regulatory news, governmental action and political unrest that could impact a specific investment or an investment sector; or armed conflicts, natural disasters and similar events that could affect investments in a specific country or region. The valuation designee also monitors for significant fluctuations between domestic and foreign markets, as evidenced by the U.S. market or such other indicators that it deems appropriate. The valuation designee may apply a model-derived factor to the closing price of equity securities traded on foreign securities exchanges. The factor is based on observable market data as provided by an independent pricing service.
Security Transactions — Security transactions are accounted for as of the trade date. Net realized gains and losses are determined on the identified cost basis, which is also used for federal income tax purposes.
Investment Income — Dividend income less foreign taxes withheld, if any, is recorded as of the ex-dividend date. Distributions received on securities that represent a return of capital or long-term capital gain are recorded as a reduction of cost of investments and/or as a realized gain. The fund may estimate the components of distributions received that may be considered nontaxable distributions or long-term capital gain distributions for income tax purposes. Interest income is recorded on the accrual basis and includes accretion of discounts and amortization of premiums. Securities lending income is net of fees and rebates earned by the lending agent for its services.
Foreign Currency Translations — All assets and liabilities initially expressed in foreign currencies are translated into U.S. dollars at prevailing exchange rates at period end. The fund may enter into spot foreign currency exchange contracts to facilitate transactions denominated in a foreign currency. Purchases and sales of investment securities, dividend and interest income, spot foreign currency exchange contracts, and expenses are translated at the rates of exchange prevailing on the respective dates of such transactions. Net realized and unrealized foreign currency exchange gains or losses related to investment securities are a component of net realized gain (loss) on investment transactions and change in net unrealized appreciation (depreciation) on investments, respectively.
Repurchase Agreements — The fund may enter into repurchase agreements with institutions that ACIM has determined are creditworthy pursuant to criteria adopted by the Board of Directors. The fund requires that the collateral, represented by securities, received in a repurchase transaction be transferred to the custodian in a manner sufficient to enable the fund to obtain those securities in the event of a default under the repurchase agreement. ACIM monitors, on a daily basis, the securities transferred to ensure the value, including accrued interest, of the securities under each repurchase agreement is equal to or greater than amounts owed to the fund under each repurchase agreement.
Joint Trading Account — Pursuant to an Exemptive Order issued by the Securities and Exchange Commission, the fund, along with certain other funds in the American Century Investments family of funds, may transfer uninvested cash balances into a joint trading account. These balances are invested in one or more repurchase agreements that are collateralized by U.S. Treasury or Agency obligations.
Segregated Assets — In accordance with the 1940 Act, the fund segregates assets on its books and records to cover certain types of investment securities and other financial instruments. ACIM monitors, on a daily basis, the securities segregated to ensure the fund designates a sufficient amount of liquid assets, marked-to-market daily. The fund may also receive assets or be required to pledge assets at the custodian bank or with a broker for collateral requirements. The fund may incur charges or earn income on posted collateral balances, which are reflected in interest expenses or interest income, respectively.
Income Tax Status — It is the fund's policy to distribute substantially all net investment income and net realized gains to shareholders and to otherwise qualify as a regulated investment company under provisions of the Internal Revenue Code. Accordingly, no provision has been made for income taxes. The fund files U.S. federal, state, local and non-U.S. tax returns as applicable. The fund's tax returns are subject to examination by the relevant taxing authority until expiration of the applicable statute of limitations, which is generally three years from the date of filing but can be longer in certain jurisdictions. At this time, management believes there are no uncertain tax positions which, based on their technical merit, would not be sustained upon examination and for which it is reasonably possible that the total amounts of unrecognized tax benefits will significantly change in the next twelve months.
Multiple Class — All shares of the fund represent an equal pro rata interest in the net assets of the class to which such shares belong, and have identical voting, dividend, liquidation and other rights and the same terms and conditions, except for class specific expenses and exclusive rights to vote on matters affecting only individual classes. Income, non-class specific expenses, and realized and unrealized capital gains and losses of the fund are allocated to each class of shares based on their relative net assets.
Distributions to Shareholders — Distributions from net investment income, if any, are generally declared and paid quarterly. Distributions from net realized gains, if any, are generally declared and paid annually.
Indemnifications — Under the corporation’s organizational documents, its officers and directors are indemnified against certain liabilities arising out of the performance of their duties to the fund. In addition, in the normal course of business, the fund enters into contracts that provide general indemnifications. The maximum exposure under these arrangements is unknown as this would involve future claims that may be made against a fund. The risk of material loss from such claims is considered by management to be remote.
Securities Lending — Securities are lent to qualified financial institutions and brokers. State Street Bank & Trust Co. serves as securities lending agent to the fund pursuant to a Securities Lending Agreement. The lending of securities exposes the fund to risks such as: the borrowers may fail to return the loaned securities, the borrowers may not be able to provide additional collateral, the fund may experience delays in recovery of the loaned securities or delays in access to collateral, or the fund may experience losses related to the investment collateral. To minimize certain risks, loan counterparties pledge collateral in the form of cash and/or securities. The lending agent has agreed to indemnify the fund in the case of default of any securities borrowed. Cash collateral received is invested in the State Street Navigator Securities Lending Government Money Market Portfolio, a money market mutual fund registered under the 1940 Act. The loans may also be secured by U.S. government securities in an amount at least equal to the market value of the securities loaned, plus accrued interest and dividends, determined on a daily basis and adjusted accordingly. By lending
securities, the fund seeks to increase its net investment income through the receipt of interest and fees. Such income is reflected separately within the Statement of Operations. The value of loaned securities and related collateral outstanding at period end, if any, are shown on a gross basis within the Schedule of Investments and Statement of Assets and Liabilities.
The following table reflects a breakdown of transactions accounted for as secured borrowings, the gross obligation by the type of collateral pledged, and the remaining contractual maturity of those transactions as of December 31, 2022.
| | | | | | | | | | | | | | | | | |
| Remaining Contractual Maturity of Agreements |
| Overnight and
Continuous | <30 days | Between
30 & 90 days | >90 days | Total |
Securities Lending Transactions(1) | | | | |
| Common Stocks | $ | 8,604,497 | | — | | — | | — | | $ | 8,604,497 | |
| Gross amount of recognized liabilities for securities lending transactions | $ | 8,604,497 | |
(1)Amount represents the payable for cash collateral received for securities on loan. This will generally be in the Overnight and Continuous column as the securities are typically callable on demand.
3. Fees and Transactions with Related Parties
Certain officers and directors of the corporation are also officers and/or directors of American Century Companies, Inc. (ACC). The corporation's investment advisor, ACIM, the corporation's distributor, American Century Investment Services, Inc. (ACIS), and the corporation's transfer agent, American Century Services, LLC, are wholly owned, directly or indirectly, by ACC.
Management Fees — The corporation has entered into a management agreement with ACIM, under which ACIM provides the fund with investment advisory and management services in exchange for a single, unified management fee (the fee) per class. The agreement provides that ACIM will pay all expenses of managing and operating the fund, except brokerage expenses, taxes, interest, fees and expenses of the independent directors (including legal counsel fees), extraordinary expenses, and expenses incurred in connection with the provision of shareholder services and distribution services under a plan adopted pursuant to Rule 12b-1 under the 1940 Act. The fee is computed and accrued daily based on each class's daily net assets and paid monthly in arrears. The difference in the fee among the classes is a result of their separate arrangements for non-Rule 12b-1 shareholder services. It is not the result of any difference in advisory or custodial fees or other expenses related to the management of the fund’s assets, which do not vary by class. From January 1, 2022 through July 31, 2022, the investment advisor agreed to waive 0.10% of the fund's management fee. Effective August 1, 2022, the investment advisor agreed to waive 0.12% of the fund's management fee. The investment advisor expects this waiver to continue until July 31, 2023 and cannot terminate it prior to such date without the approval of the Board of Directors.
The annual management fee and the effective annual management fee after waiver for each class for the period ended December 31, 2022 are as follows:
| | | | | | | | |
| Annual Management Fee | Effective Annual Management Fee After Waiver |
| Class I | 0.83% | 0.72% |
| Class II | 0.73% | 0.62% |
Distribution Fees — The Board of Directors has adopted the Master Distribution Plan (the plan) for Class II, pursuant to Rule 12b-1 of the 1940 Act. The plan provides that Class II will pay ACIS an annual distribution fee equal to 0.25%. The fee is computed and accrued daily based on the Class II daily net assets and paid monthly in arrears. The distribution fee provides compensation for expenses incurred in connection with distributing shares of Class II including, but not limited to, payments to brokers, dealers, and financial institutions that have entered into sales agreements with respect to shares of the fund. Fees incurred under the plan during the period ended December 31, 2022 are detailed in the Statement of Operations.
Directors' Fees and Expenses — The Board of Directors is responsible for overseeing the investment advisor’s management and operations of the fund. The directors receive detailed information about the fund and its investment advisor regularly throughout the year, and meet at least quarterly with management of the investment advisor to review reports about fund operations. The fund's officers do not receive compensation from the fund.
Interfund Transactions — The fund may enter into security transactions with other American Century Investments funds and other client accounts of the investment advisor, in accordance with the 1940 Act rules and procedures adopted by the Board of Directors. The rules and procedures require, among other things, that these transactions be effected at the independent current market price of the security. During the period, the interfund purchases and sales were $832,655 and $657,369, respectively. The effect of interfund transactions on the Statement of Operations was $(76,453) in net realized gain (loss) on investment transactions.
4. Investment Transactions
Purchases and sales of investment securities, excluding short-term investments, for the period ended December 31, 2022 were $446,827,515 and $462,327,818, respectively.
5. Capital Share Transactions
Transactions in shares of the fund were as follows:
| | | | | | | | | | | | | | |
| Year ended December 31, 2022 | Year ended December 31, 2021 |
| Shares | Amount | Shares | Amount |
| Class I/Shares Authorized | 600,000,000 | | | 600,000,000 | | |
| Sold | 3,729,916 | | $ | 48,064,435 | | 3,024,457 | | $ | 39,211,704 | |
| Issued in reinvestment of distributions | 3,104,863 | | 40,310,032 | | 540,169 | | 7,107,637 | |
| Redeemed | (7,190,397) | | (91,015,389) | | (5,794,184) | | (74,979,295) | |
| (355,618) | | (2,640,922) | | (2,229,558) | | (28,659,954) | |
| Class II/Shares Authorized | 350,000,000 | | | 350,000,000 | | |
| Sold | 7,536,319 | | 96,458,990 | | 6,460,146 | | 83,941,248 | |
| Issued in reinvestment of distributions | 4,121,920 | | 53,632,273 | | 634,285 | | 8,356,267 | |
| Redeemed | (8,065,252) | | (99,961,466) | | (6,912,649) | | (89,916,893) | |
| 3,592,987 | | 50,129,797 | | 181,782 | | 2,380,622 | |
| Net increase (decrease) | 3,237,369 | | $ | 47,488,875 | | (2,047,776) | | $ | (26,279,332) | |
6. Fair Value Measurements
The fund's investments valuation process is based on several considerations and may use multiple inputs to determine the fair value of the investments held by the fund. In conformity with accounting principles generally accepted in the United States of America, the inputs used to determine a valuation are classified into three broad levels.
•Level 1 valuation inputs consist of unadjusted quoted prices in an active market for identical investments.
•Level 2 valuation inputs consist of direct or indirect observable market data (including quoted prices for comparable investments, evaluations of subsequent market events, interest rates, prepayment speeds, credit risk, etc.). These inputs also consist of quoted prices for identical investments initially expressed in local currencies that are adjusted through translation into U.S. dollars.
•Level 3 valuation inputs consist of unobservable data (including a fund’s own assumptions).
The level classification is based on the lowest level input that is significant to the fair valuation measurement. The valuation inputs are not necessarily an indication of the risks associated with investing in these securities or other financial instruments.
The following is a summary of the level classifications as of period end. The Schedule of Investments provides additional information on the fund's portfolio holdings.
| | | | | | | | | | | |
| Level 1 | Level 2 | Level 3 |
| Assets | | | |
| Investment Securities | | | |
| Common Stocks | | | |
| Aerospace and Defense | $ | 15,198,411 | | $ | 4,073,604 | | — | |
| Auto Components | 8,853,752 | | 4,968,623 | | — | |
| Beverages | — | | 3,567,999 | | — | |
| Chemicals | — | | 4,394,544 | | — | |
| Electrical Equipment | 14,842,428 | | 5,591,681 | | — | |
| Electronic Equipment, Instruments and Components | — | | 2,763,529 | | — | |
| Food and Staples Retailing | — | | 12,352,980 | | — | |
| Food Products | 20,515,872 | | 11,536,202 | | — | |
| Hotels, Restaurants and Leisure | — | | 5,302,495 | | — | |
| Household Products | 9,150,623 | | 4,889,898 | | — | |
| Industrial Conglomerates | 21,275,789 | | 8,885,889 | | — | |
| Machinery | 4,943,049 | | 6,410,278 | | — | |
| Metals and Mining | — | | 7,037,961 | | — | |
| Multi-Utilities | — | | 4,355,197 | | — | |
| Oil, Gas and Consumable Fuels | 56,497,061 | | 15,944,189 | | — | |
| Paper and Forest Products | — | | 6,372,197 | | — | |
| Personal Products | — | | 12,202,480 | | — | |
| Pharmaceuticals | 71,306,499 | | 12,025,621 | | — | |
| Other Industries | 553,006,898 | | — | | — | |
| Short-Term Investments | 8,726,256 | | 12,096,257 | | — | |
| $ | 784,316,638 | | $ | 144,771,624 | | — | |
| Other Financial Instruments | | | |
| Forward Foreign Currency Exchange Contracts | — | | $ | 119,693 | | — | |
| | | |
| Liabilities | | | |
| Other Financial Instruments | | | |
| Forward Foreign Currency Exchange Contracts | — | | $ | 598,848 | | — | |
7. Derivative Instruments
Foreign Currency Risk — The fund is subject to foreign currency exchange rate risk in the normal course of pursuing its investment objectives. The value of foreign investments held by a fund may be significantly affected by changes in foreign currency exchange rates. The dollar value of a foreign security generally decreases when the value of the dollar rises against the foreign currency in which the security is denominated and tends to increase when the value of the dollar declines against such foreign currency. A fund may enter into forward foreign currency exchange contracts to reduce a fund's exposure to foreign currency exchange rate fluctuations. The net U.S. dollar value of foreign currency underlying all contractual commitments held by a fund and the resulting unrealized appreciation or depreciation are determined daily. Realized gain or loss is recorded upon settlement of the contract. Net realized and unrealized gains or losses occurring during the holding period of forward foreign currency exchange contracts are a component of net realized gain (loss) on forward foreign currency exchange contract transactions and change in net unrealized appreciation (depreciation) on forward foreign currency exchange contracts, respectively. A fund bears the risk of an unfavorable change in the foreign currency exchange rate underlying the forward contract. Additionally, losses, up to the fair value, may arise if the counterparties do not perform under the contract terms. The fund's average U.S. dollar exposure to foreign currency risk derivative instruments held during the period was $106,655,538.
The value of foreign currency risk derivative instruments as of December 31, 2022, is disclosed on the Statement of Assets and Liabilities as an asset of $119,693 in unrealized appreciation on forward foreign currency exchange contracts and a liability of $598,848 in unrealized depreciation on forward foreign currency exchange contracts. For the year ended December 31, 2022, the effect of foreign currency risk derivative instruments on the Statement of Operations was $7,417,244 in net realized gain (loss) on forward foreign currency exchange contract transactions and $524,007 in change in net unrealized appreciation (depreciation) on forward foreign currency exchange contracts.
8. Risk Factors
The value of the fund’s shares will go up and down, sometimes rapidly or unpredictably, based on the performance of the securities owned by the fund and other factors generally affecting the securities market. Market risks, including political, regulatory, economic and social developments, can affect the value of the fund’s investments. Natural disasters, public health emergencies, war, terrorism and other unforeseeable events may lead to increased market volatility and may have adverse long-term effects on world economies and markets generally.
There are certain risks involved in investing in foreign securities. These risks include those resulting from political events (such as civil unrest, national elections and imposition of exchange controls), social and economic events (such as labor strikes and rising inflation), and natural disasters. Securities of foreign issuers may be less liquid and more volatile. Investing a significant portion of assets in one country or region may accentuate these risks.
9. Federal Tax Information
The tax character of distributions paid during the years ended December 31, 2022 and December 31, 2021 were as follows:
| | | | | | | | |
| 2022 | 2021 |
| Distributions Paid From | | |
| Ordinary income | $ | 49,969,922 | | $ | 15,642,530 | |
| Long-term capital gains | $ | 44,751,657 | | — | |
The book-basis character of distributions made during the year from net investment income or net realized gains may differ from their ultimate characterization for federal income tax purposes. These differences reflect the differing character of certain income items and net realized gains and losses for financial statement and tax purposes, and may result in reclassification among certain capital accounts on the financial statements.
As of period end, the federal tax cost of investments and the components of distributable earnings on a tax-basis were as follows:
| | | | | |
| Federal tax cost of investments | $ | 772,686,479 | |
| Gross tax appreciation of investments | $ | 190,909,583 | |
| Gross tax depreciation of investments | (34,507,800) | |
| Net tax appreciation (depreciation) of investments | 156,401,783 | |
| Net tax appreciation (depreciation) on derivatives and translation of assets and liabilities in foreign currencies | (11,250) | |
| Net tax appreciation (depreciation) | $ | 156,390,533 | |
| Undistributed ordinary income | $ | 9,846,664 | |
| Accumulated long-term gains | $ | 62,282,614 | |
The difference between book-basis and tax-basis unrealized appreciation (depreciation) is attributable primarily to the tax deferral of losses on wash sales.
| | | | | | | | | | | | | | | | | | | | | | | | | | | | | | | | | | | | | | | | | | | | | | | |
| For a Share Outstanding Throughout the Years Ended December 31 (except as noted) |
| Per-Share Data | | | | | Ratios and Supplemental Data |
| | Income From Investment Operations: | Distributions From: | | | Ratio to Average Net Assets of: | | |
| Net Asset
Value,
Beginning
of Period | Net Investment Income (Loss)(1) | Net
Realized
and
Unrealized
Gain (Loss) | Total From Investment Operations | Net
Investment
Income | Net
Realized
Gains | Total
Distributions | Net Asset
Value, End
of Period | Total Return(2) | Operating Expenses | Operating Expenses
(before
expense
waiver) | Net
Investment Income
(Loss) | Net
Investment Income (Loss)
(before expense waiver) | Portfolio Turnover
Rate | Net Assets,
End of
Period
(in thousands) |
| Class I | | | | | | | | | | | | | | | |
| 2022 | $13.67 | 0.27 | (0.16) | 0.11 | (0.26) | (1.07) | (1.33) | $12.45 | 0.54% | 0.74% | 0.85% | 2.12% | 2.01% | 49% | $387,024 | |
| 2021 | $11.17 | 0.23 | 2.50 | 2.73 | (0.23) | — | (0.23) | $13.67 | 24.51% | 0.73% | 0.92% | 1.79% | 1.60% | 49% | $430,055 | |
| 2020 | $11.72 | 0.23 | (0.29) | (0.06) | (0.23) | (0.26) | (0.49) | $11.17 | 0.98% | 0.75% | 0.98% | 2.34% | 2.11% | 57% | $376,355 | |
| 2019 | $10.01 | 0.23 | 2.36 | 2.59 | (0.23) | (0.65) | (0.88) | $11.72 | 27.03% | 0.77% | 0.98% | 2.11% | 1.90% | 45% | $432,639 | |
| 2018 | $11.21 | 0.19 | (1.20) | (1.01) | (0.19) | —(3) | (0.19) | $10.01 | (9.15)% | 0.78% | 0.97% | 1.70% | 1.51% | 51% | $374,518 | |
| Class II | | | | | | | | | | | | | | | |
| 2022 | $13.69 | 0.25 | (0.16) | 0.09 | (0.25) | (1.07) | (1.32) | $12.46 | 0.31% | 0.89% | 1.00% | 1.97% | 1.86% | 49% | $539,924 | |
| 2021 | $11.19 | 0.21 | 2.50 | 2.71 | (0.21) | — | (0.21) | $13.69 | 24.28% | 0.88% | 1.07% | 1.64% | 1.45% | 49% | $543,896 | |
| 2020 | $11.74 | 0.21 | (0.29) | (0.08) | (0.21) | (0.26) | (0.47) | $ 11.19 | 0.83% | 0.90% | 1.13% | 2.19% | 1.96% | 57% | $442,431 | |
| 2019 | $10.02 | 0.21 | 2.37 | 2.58 | (0.21) | (0.65) | (0.86) | $ 11.74 | 26.92% | 0.92% | 1.13% | 1.96% | 1.75% | 45% | $455,327 | |
| 2018 | $11.22 | 0.18 | (1.21) | (1.03) | (0.17) | —(3) | (0.17) | $10.02 | (9.28)% | 0.93% | 1.12% | 1.55% | 1.36% | 51% | $404,210 | |
| | |
| Notes to Financial Highlights |
(1)Computed using average shares outstanding throughout the period.
(2)Total returns are calculated based on the net asset value of the last business day. Total returns for periods less than one year are not annualized. The total returns presented do not include the fees and charges assessed with investments in variable insurance products, those charges are disclosed in the separate account prospectus. The inclusion of such fees and charges would lower total return.
(3)Per-share amount was less than $0.005.
See Notes to Financial Statements.
| | |
| Report of Independent Registered Public Accounting Firm |
To the Shareholders and the Board of Directors of American Century Variable Portfolios, Inc.:
Opinion on the Financial Statements and Financial Highlights
We have audited the accompanying statement of assets and liabilities, including the schedule of investments, of VP Value Fund (the “Fund”), one of the funds constituting the American Century Variable Portfolios, Inc., as of December 31, 2022, the related statement of operations for the year then ended, the statements of changes in net assets for each of the two years in the period then ended, the financial highlights for each of the five years in the period then ended, and the related notes. In our opinion, the financial statements and financial highlights present fairly, in all material respects, the financial position of VP Value Fund of the American Century Variable Portfolios, Inc. as of December 31, 2022, and the results of its operations for the year then ended, the changes in its net assets for each of the two years in the period then ended, and the financial highlights for each of the five years in the period then ended, in conformity with accounting principles generally accepted in the United States of America.
Basis for Opinion
These financial statements and financial highlights are the responsibility of the Fund's management. Our responsibility is to express an opinion on the Fund’s financial statements and financial highlights based on our audits. We are a public accounting firm registered with the Public Company Accounting Oversight Board (United States) (PCAOB) and are required to be independent with respect to the Fund in accordance with the U.S. federal securities laws and the applicable rules and regulations of the Securities and Exchange Commission and the PCAOB.
We conducted our audits in accordance with the standards of the PCAOB. Those standards require that we plan and perform the audit to obtain reasonable assurance about whether the financial statements and financial highlights are free of material misstatement, whether due to error or fraud. The Fund is not required to have, nor were we engaged to perform, an audit of its internal control over financial reporting. As part of our audits, we are required to obtain an understanding of internal control over financial reporting but not for the purpose of expressing an opinion on the effectiveness of the Fund’s internal control over financial reporting. Accordingly, we express no such opinion.
Our audits included performing procedures to assess the risks of material misstatement of the financial statements and financial highlights, whether due to error or fraud, and performing procedures that respond to those risks. Such procedures included examining, on a test basis, evidence regarding the amounts and disclosures in the financial statements and financial highlights. Our audits also included evaluating the accounting principles used and significant estimates made by management, as well as evaluating the overall presentation of the financial statements and financial highlights. Our procedures included confirmation of securities owned as of December 31, 2022, by correspondence with the custodian and brokers; when replies were not received from brokers, we performed other auditing procedures. We believe that our audits provide a reasonable basis for our opinion.
/s/ Deloitte & Touche LLP
Kansas City, Missouri
February 10, 2023
We have served as the auditor of one or more American Century investment companies since 1997.
The Board of Directors
The individuals listed below serve as directors of the funds. Each director will continue to serve in this capacity until death, retirement, resignation or removal from office. The board has adopted a mandatory retirement age for directors who are not “interested persons,” as that term is defined in the Investment Company Act (independent directors). Independent directors shall retire on December 31 of the year in which they reach their 75th birthday.
Jonathan S. Thomas is an “interested person” because he currently serves as President and Chief Executive Officer of American Century Companies, Inc. (ACC), the parent company of American Century Investment Management, Inc. (ACIM or the advisor). The other directors (more than three-fourths of the total number) are independent. They are not employees, directors or officers of, and have no financial interest in, ACC or any of its wholly owned, direct or indirect, subsidiaries, including ACIM, American Century Investment Services, Inc. (ACIS) and American Century Services, LLC (ACS), and they do not have any other affiliations, positions or relationships that would cause them to be considered “interested persons” under the Investment Company Act. The directors serve in this capacity for seven (in the case of Jonathan S. Thomas, 16; and Stephen E. Yates, 8) registered investment companies in the American Century Investments family of funds.
The following table presents additional information about the directors. The mailing address for each director is 4500 Main Street, Kansas City, Missouri 64111.
| | | | | | | | | | | | | | | | | |
Name
(Year of Birth) | Position(s) Held with Funds | Length of Time Served | Principal Occupation(s) During Past 5 Years | Number of American Century Portfolios Overseen by Director | Other Directorships Held During Past 5 Years |
| Independent Directors | | |
Brian Bulatao
(1964) | Director | Since 2022 | Chief Administrative Officer, Activision Blizzard, Inc. (2021 to present); Under Secretary of State for Management, U.S. Department of State (2018 to 2021); Chief Operating Officer, Central Intelligence Agency (2017 to 2018) | 64 | None |
| Thomas W. Bunn (1953) | Director | Since 2017 | Retired | 64 | None |
Chris H. Cheesman
(1962)
| Director | Since 2019
| Retired. Senior Vice President & Chief Audit Executive, AllianceBernstein (1999 to 2018)
| 64 | Alleghany Corporation (2021 to 2022) |
Barry Fink
(1955) | Director | Since 2012 (independent since 2016) | Retired | 64 | None |
Rajesh K. Gupta
(1960)
| Director | Since 2019
| Partner Emeritus, SeaCrest Investment Management and SeaCrest Wealth Management (2019 to Present); Chief Executive Officer and Chief Investment Officer, SeaCrest Investment Management (2006 to 2019); Chief Executive Officer and Chief Investment Officer, SeaCrest Wealth Management (2008 to 2019) | 64 | None |
| | | | | | | | | | | | | | | | | |
Name
(Year of Birth) | Position(s) Held with Funds | Length of Time Served | Principal Occupation(s) During Past 5 Years | Number of American Century Portfolios Overseen by Director | Other Directorships Held During Past 5 Years |
| Independent Directors | | |
Lynn Jenkins
(1963)
| Director | Since 2019
| Consultant, LJ Strategies (2019 to present); United States Representative, U.S. House of Representatives (2009 to 2018) | 64 | MGP Ingredients, Inc. (2019 to 2021) |
Jan M. Lewis
(1957) | Director and Board Chair | Since 2011 (Board Chair since 2022) | Retired | 64 | None |
Gary C. Meltzer
(1963) | Director | Since 2022 | Advisor, Pontoro (2021 to present); Executive Advisor, Consultant and Investor, Harris Ariel Advisory LLC (2020 to present); Managing Partner, PricewaterhouseCoopers LLP (1985 to 2020) | 64 | ExcelFin Acquisition Corp., Apollo Realty Income Solutions, Inc. |
Stephen E. Yates
(1948) | Director | Since 2012 | Retired | 108 | None |
| Interested Director | |
Jonathan S. Thomas
(1963) | Director | Since 2007 | President and Chief Executive Officer, ACC (2007 to present). Also serves as Chief Executive Officer, ACS; Director, ACC and other ACC subsidiaries | 140 | None |
The Statement of Additional Information has additional information about the fund's directors and is available without charge, upon request, by calling 1-800-378-9878.
Officers
The following table presents certain information about the executive officers of the funds. Each officer serves as an officer for 16 (in the case of Robert J. Leach, 15) investment companies in the American Century family of funds. No officer is compensated for his or her service as an officer of the funds. The listed officers are interested persons of the funds and are appointed or re-appointed on an annual basis. The mailing address for each officer listed below is 4500 Main Street, Kansas City, Missouri 64111.
| | | | | | | | |
Name
(Year of Birth) | Offices with the Funds | Principal Occupation(s) During the Past Five Years |
Patrick Bannigan
(1965) | President since 2019 | Executive Vice President and Director, ACC (2012 to present); Chief Financial Officer, Chief Accounting Officer and Treasurer, ACC (2015 to present). Also serves as President, ACS; Vice President, ACIM; Chief Financial Officer, Chief Accounting Officer and/or Director, ACIM, ACS and other ACC subsidiaries |
R. Wes Campbell
(1974) | Chief Financial Officer and Treasurer since 2018 | Vice President, ACS, (2020 to present); Investment Operations and Investment Accounting, ACS (2000 to present) |
Amy D. Shelton
(1964) | Chief Compliance Officer and Vice President since 2014 | Chief Compliance Officer, American Century funds, (2014 to present); Chief Compliance Officer, ACIM (2014 to present); Chief Compliance Officer, ACIS (2009 to present). Also serves as Vice President, ACIS |
John Pak
(1968) | General Counsel and
Senior Vice President since 2021 | General Counsel and Senior Vice President, ACC (2021 to present); Also serves as General Counsel and Senior Vice President, ACIM, ACS and ACIS. Chief Legal Officer of Investment and Wealth Management, The Bank of New York Mellon (2014 to 2021) |
C. Jean Wade
(1964) | Vice President since 2012 | Senior Vice President, ACS (2017 to present); Vice President, ACS (2000 to 2017)
|
Robert J. Leach
(1966) | Vice President since 2006 | Vice President, ACS (2000 to present) |
David H. Reinmiller
(1963) | Vice President since 2000 | Attorney, ACC (1994 to present). Also serves as Vice President, ACIM and ACS |
Ward D. Stauffer
(1960) | Secretary since 2005 | Attorney, ACC (2003 to present) |
A special meeting of shareholders was held on October 13, 2022, to vote on the following proposal. The proposal received the required votes and was adopted. A summary of voting results is listed below.
To elect five directors to the Board of Directors of American Century Variable Portfolios, Inc.:
| | | | | | | | | | | |
| Affirmative | | Withhold |
| Brian Bulatao | $ | 2,607,537,119 | | | $ | 88,836,350 | |
| Chris H. Cheesman | $ | 2,619,879,519 | | | $ | 76,493,950 | |
| Rajesh K. Gupta | $ | 2,616,882,375 | | | $ | 79,491,094 | |
| Lynn M. Jenkins | $ | 2,607,769,137 | | | $ | 88,604,332 | |
| Gary C. Meltzer | $ | 2,616,158,906 | | | $ | 80,214,563 | |
The other directors whose term of office continued after the meeting include Jonathan S. Thomas, Thomas W. Bunn, Barry Fink, Jan M. Lewis, and Stephen E. Yates.
Proxy Voting Policies
A description of the policies that the fund's investment advisor uses in exercising the voting rights associated with the securities purchased and/or held by the fund is available without charge, upon request, by calling 1-800-378-9878. It is also available on American Century Investments’ website at americancentury.com/proxy and on the Securities and Exchange Commission’s website at sec.gov. Information regarding how the investment advisor voted proxies relating to portfolio securities during the most recent 12-month period ended June 30 is available on americancentury.com/proxy. It is also available at sec.gov.
Quarterly Portfolio Disclosure
The fund files its complete schedule of portfolio holdings with the Securities and Exchange Commission (SEC) for the first and third quarters of each fiscal year as an exhibit to its reports on Form N-PORT. These portfolio holdings are available on the fund's website at americancentury.com and, upon request, by calling 1-800-378-9878. The fund’s Form N-PORT reports are available on the SEC’s website at sec.gov.
Other Tax Information
The following information is provided pursuant to provisions of the Internal Revenue Code.
For corporate taxpayers, the fund hereby designates $21,236,126, or up to the maximum amount allowable, of ordinary income distributions paid during the fiscal year ended December 31, 2022 as qualified for the corporate dividends received deduction.
The fund hereby designates $31,195,732, as qualified short-term capital gain distributions for purposes of Internal Revenue Code Section 871 for the fiscal year ended December 31, 2022.
The fund hereby designates $44,751,657, or up to the maximum amount allowable, as long-term capital gain distributions (20% rate gain distributions) for the fiscal year ended December 31, 2022.
| | | | | | | | |
| |
| | |
| Contact Us | americancentury.com | |
| Automated Information Line | 1-800-345-8765 | |
| Investment Professional Service Representatives | 1-800-345-6488 | |
| Telecommunications Relay Service for the Deaf | 711 | |
| | |
| American Century Variable Portfolios, Inc. | |
| | |
Investment Advisor: American Century Investment Management, Inc. Kansas City, Missouri | |
| | |
| This report and the statements it contains are submitted for the general information of our shareholders. The report is not authorized for distribution to prospective investors unless preceded or accompanied by an effective prospectus. | |
| | |
©2023 American Century Proprietary Holdings, Inc. All rights reserved.
CL-ANN-91440 2302 | |
(b) None.
ITEM 2. CODE OF ETHICS.
(a) The registrant has adopted a Code of Ethics for Senior Financial Officers that applies to the registrant’s principal executive officer, principal financial officer, principal accounting officer, and persons performing similar functions.
(b) No response required.
(c) None.
(d) None.
(e) Not applicable.
(f) The registrant’s Code of Ethics for Senior Financial Officers was filed as Exhibit 12 (a)(1) to American Century Asset Allocation Portfolios, Inc.’s Annual Certified Shareholder Report on Form N-CSR, File No. 811-21591, on September 29, 2005, and is incorporated herein by reference.
ITEM 3. AUDIT COMMITTEE FINANCIAL EXPERT.
(a)(1) The registrant’s board has determined that the registrant has at least one audit committee financial expert serving on its audit committee.
(a)(2) Chris H. Cheesman, Lynn M. Jenkins and Barry Fink are the registrant’s designated audit committee financial experts. They are “independent” as defined in Item 3 of Form N-CSR.
(a)(3) Not applicable.
(b) No response required.
(c) No response required.
(d) No response required.
ITEM 4. PRINCIPAL ACCOUNTANT FEES AND SERVICES.
(a) Audit Fees.
The aggregate fees billed for each of the last two fiscal years for professional services rendered by the principal accountant for the audit of the registrant’s annual financial statements or services that are normally provided by the accountant in connection with statutory and regulatory filings or engagements for those fiscal years were as follows:
FY 2021: $165,250
FY 2022: $164,040
(b) Audit-Related Fees.
The aggregate fees billed in each of the last two fiscal years for assurance and related services by the principal accountant that are reasonably related to the performance of the audit of the registrant’s financial statements and are not reported under paragraph (a) of this Item were as follows:
For services rendered to the registrant:
FY 2021: $0
FY 2022: $0
Fees required to be approved pursuant to paragraph (c)(7)(ii) of Rule 2-01 of Regulation S-X (relating to certain engagements for non-audit services with the registrant’s investment adviser and its affiliates):
FY 2021: $0
FY 2022: $0
(c) Tax Fees.
The aggregate fees billed in each of the last two fiscal years for professional services rendered by the principal accountant for tax compliance, tax advice, and tax planning were as follows:
For services rendered to the registrant:
FY 2021: $0
FY 2022: $0
Fees required to be approved pursuant to paragraph (c)(7)(ii) of Rule 2-01 of Regulation S-X (relating to certain engagements for non-audit services with the registrant’s investment adviser and its affiliates):
FY 2021: $0
FY 2022: $0
(d) All Other Fees.
The aggregate fees billed in each of the last two fiscal years for products and services provided by the principal accountant, other than the services reported in paragraphs (a) through (c) of this Item were as follows:
For services rendered to the registrant:
FY 2021: $0
FY 2022: $0
Fees required to be approved pursuant to paragraph (c)(7)(ii) of Rule 2-01 of Regulation S-X (relating to certain engagements for non-audit services with the registrant’s investment adviser and its affiliates):
FY 2021: $0
FY 2022: $0
(e)(1) In accordance with paragraph (c)(7)(i)(A) of Rule 2-01 of Regulation S-X, before the accountant is engaged by the registrant to render audit or non-audit services, the engagement is approved by the registrant’s audit committee. Pursuant to paragraph (c)(7)(ii) of Rule 2-01 of Regulation S-X, the registrant’s audit committee also pre-approves its accountant’s engagements for non-audit services with the registrant’s investment adviser, its parent company, and any entity controlled by, or under common control with the investment adviser that provides ongoing services to the registrant, if the engagement relates directly to the operations and financial reporting of the registrant.
(e)(2) All services described in each of paragraphs (b) through (d) of this Item were pre-approved before the engagement by the registrant’s audit committee pursuant to paragraph (c)(7)(i)(A) of Rule 2-01 of Regulation S-X. Consequently, none of such services were required to be approved by the audit committee pursuant to paragraph (c)(7)(i)(C).
(f) The percentage of hours expended on the principal accountant’s engagement to audit the registrant’s financial statements for the most recent fiscal year that were attributed to work performed by persons other than the principal accountant’s full-time, permanent employees was less than 50%.
(g) The aggregate non-audit fees billed by the registrant’s accountant for services rendered to the registrant, and rendered to the registrant’s investment adviser (not including any sub-adviser whose role is primarily portfolio management and is subcontracted with or overseen by another investment adviser), and any entity controlling, controlled by, or under common control with the adviser that provides ongoing services to the registrant for each of the last two fiscal years of the registrant were as follows:
FY 2021: $2,832,126
FY 2022: $50,000
(h) The registrant’s investment adviser and accountant have notified the registrant’s audit committee of all non-audit services that were rendered by the registrant’s accountant to the registrant’s investment adviser, its parent company, and any entity controlled by, or under common control with the investment adviser that provides services to the registrant, which services were not required to be pre-approved pursuant to paragraph (c)(7)(ii) of Rule 2-01 of Regulation S-X. The notification provided to the registrant’s audit committee included sufficient details regarding such services to allow the registrant’s audit committee to consider the continuing independence of its principal accountant.
(i) Not applicable.
(j) Not applicable.
ITEM 5. AUDIT COMMITTEE OF LISTED REGISTRANTS.
Not applicable.
ITEM 6. INVESTMENTS.
(a) The schedule of investments is included as part of the report to stockholders filed under Item 1 of this Form.
(b) Not applicable.
ITEM 7. DISCLOSURE OF PROXY VOTING POLICIES AND PROCEDURES FOR CLOSED-END MANAGEMENT INVESTMENT COMPANIES.
Not applicable.
ITEM 8. PORTFOLIO MANAGERS OF CLOSED-END MANAGEMENT INVESTMENT COMPANIES.
Not applicable.
ITEM 9. PURCHASES OF EQUITY SECURITIES BY CLOSED-END MANAGEMENT INVESTMENT COMPANY AND AFFILIATED PURCHASERS.
Not applicable.
ITEM 10. SUBMISSION OF MATTERS TO A VOTE OF SECURITY HOLDERS.
During the reporting period, there were no material changes to the procedures by which shareholders may recommend nominees to the registrant’s board.
ITEM 11. CONTROLS AND PROCEDURES.
(a) The registrant's principal executive officer and principal financial officer have concluded that the registrant's disclosure controls and procedures (as defined in Rule 30a-3(c) under the Investment Company Act of 1940) are effective based on their evaluation of these controls and procedures as of a date within 90 days of the filing date of this report.
(b) There were no changes in the registrant's internal control over financial reporting (as defined in Rule 30a-3(d) under the Investment Company Act of 1940) that occurred during the period covered by this report that have materially affected, or are reasonably likely to materially affect, the registrant's internal control over financial reporting.
ITEM 12. DISCLOSURE OF SECURITIES LENDING ACTIVITIES FOR CLOSED-END MANAGEMENT INVESTMENT COMPANIES.
Not applicable.
M 13. EXHIBITS.
(a)(1) Registrant’s Code of Ethics for Senior Financial Officers, which is the subject of the disclosure required by Item 2 of Form N-CSR, was filed as Exhibit 12(a)(1) to American Century Asset Allocation Portfolios, Inc.’s Certified Shareholder Report on Form N-CSR, File No. 811-21591, on September 29, 2005.
(a)(3) Not applicable.
(a)(4) Not applicable.
SIGNATURES
Pursuant to the requirements of the Securities Exchange Act of 1934 and the Investment Company Act of 1940, the registrant has duly caused this report to be signed on its behalf by the undersigned, thereunto duly authorized.
| | | | | | | | | | | | | | |
| Registrant: | American Century Variable Portfolios, Inc. | |
| | | |
| By: | /s/ Patrick Bannigan | |
| Name: | Patrick Bannigan | |
| Title: | President | |
| | | |
| Date: | February 23, 2023 | |
Pursuant to the requirements of the Securities Exchange Act of 1934 and the Investment Company Act of 1940, this report has been signed below by the following persons on behalf of the registrant and in the capacities and on the dates indicated.
| | | | | | | | | | | |
| By: | /s/ Patrick Bannigan | |
| Name: | Patrick Bannigan | |
| Title: | President | |
| | (principal executive officer) | |
| | | |
| Date: | February 23, 2023 | |
| | | | | | | | | | | |
| By: | /s/ R. Wes Campbell | |
| Name: | R. Wes Campbell | |
| Title: | Treasurer and | |
| | Chief Financial Officer | |
| | (principal financial officer) | |
| | | |
| Date: | February 23, 2023 | |