UNITED STATES
SECURITIES AND EXCHANGE COMMISSION
Washington, D.C. 20549
FORM N-CSR
CERTIFIED SHAREHOLDER REPORT OF REGISTERED MANAGEMENT INVESTMENT COMPANIES
Investment Company Act file number 811-05201
Thornburg Investment Trust
(Exact name of registrant as specified in charter)
119 East Marcy Street, Santa Fe, New Mexico 87501
(Address of principal executive offices) (Zip code)
Garrett Thornburg, 119 East Marcy Street, Santa Fe, New Mexico 87501
(Name and address of agent for service)
Registrant’s telephone number, including area code: 505-984-0200
Date of fiscal year end: September 30, 2004
Date of reporting period: March 31, 2004
Item 1. Reports to Stockholders
The following semi-annual reports are attached hereto, in order:
| Thornburg Limited Term Income Funds | |||
| Thornburg Limited Term Income Funds Class I | |||
| Thornburg New Mexico Intermediate Municipal Fund | |||
| Thornburg Intermediate Municipal Fund | |||
| Thornburg Intermediate Municipal Fund Class I | |||
| Thornburg Value Fund Correction Slip | |||
| Thornburg Value Fund Class I | |||
| Thornburg Value Fund Class I (as Revised on May 27, 2004) | |||
| Thornburg Florida Intermediate Municipal Fund | |||
| Thornburg International Value Fund | |||
| Thornburg International Value Fund Class I | |||
| Thornburg Core Growth Fund | |||
| Thornburg Core Growth Fund Class I | |||
| Thornburg Investment Income Builder Fund | |||
| Thornburg Investment Income Builder Fund Class I | |||
Investment Manager
Thornburg Investment Management, Inc.
119 East Marcy Street
Santa Fe, New Mexico 87501
800.847.0200
Principal Underwriter
Thornburg Securities Corporation
119 East Marcy Street
Santa Fe, New Mexico 87501
800.847.0200
This report is submitted for the general information of shareholders of the Fund. It is not authorized for distribution to prospective investors in the Fund unless preceded or accompanied by an effective prospectus. Carefully consider information in the prospectus regarding the Fund’s investment objectives and policies, risks, sales charges, expenses, experience of its management, marketability of shares, and other information. Performance data quoted represent past performance and do not guarantee future results.
www.thornburg.com
Thornburg Limited Term Income Funds
Semi-Annual Report
March 31, 2004
| Thornburg Limited Term Income Funds ALL DATA AS OF 3/31/04. | ||||
|---|---|---|---|---|
| FUND FACTS: Thornburg Limited Term U.S. Government Fund* | ||||
| A Shares | B Shares | C Shares | R-1 Shares | |
| Annualized Dist Rate (at NAV) | 2.89% | 1.25% | 2.52% | 2.88% |
| SEC Yield | 2.43% | 0.86% | 2.07% | 2.44% |
| NAV | $ 13.27 | $ 13.26 | $ 13.35 | $ 13.28 |
| Maximum Offering Price | $ 13.47 | $ 13.26 | $ 13.35 | $ 13.28 |
| TOTAL RETURNS: Annual Average - (After Subtracting Maximum Sales Charge) | ||||
| One Year | 1.58% | (2.71)% | 2.24% | N/A |
| Three Years | 5.74% | N/A | 5.91% | N/A |
| Five Years | 5.97% | N/A | 5.91% | N/A |
| Ten Years | 5.97% | N/A | N/A | N/A |
| Since Inception | 6.72% | (0.01)% | 5.95% | 2.12% |
| Inception Date | 11/16/1987 | 11/1/2002 | 9/1/1994 | 7/1/2003 |
| FUND FACTS: Thornburg Limited Term Income Fund | ||||
|---|---|---|---|---|
| A Shares | C Shares | R-1 Shares | ||
| Annualized Distribution Rate (at NAV) | 3.14% | 2.89% | 3.15% | |
| SEC Yield | 2.16% | 1.95% | 2.20% | |
| NAV | $ 13.04 | $ 13.02 | $ 13.05 | |
| Maximum Offering Price | $ 13.24 | $ 13.02 | $ 13.05 | |
| TOTAL RETURNS: Annual Average - (After Subtracting Maximum Sales Charge) | ||||
| One Year | 3.20% | 3.97% | N/A | |
| Three Years | 6.07% | 6.25% | N/A | |
| Five Years | 6.29% | 6.22% | N/A | |
| Ten Years | 6.42% | N/A | N/A | |
| Since Inception | 6.28% | 6.30% | 2.82% | |
| Inception Date | 10/1/1992 | 9/1/1994 | 7/1/2003 | |
| Maximum sales charge of the Funds’ Class A Shares is 1.50%. B shares carry a contingent deferred sales charge (CDSC), if redeemed within a year, of 5.00%; within two years, 4.25%; within three years, 3.50%; within four years, 2.75%; within five years, 2.00%; within six years, 1.25%; within seven years, 0.50%. There is no charge for redemption within the eighth year. C shares include a 0.50% CDSC for the first year only. There is no up front sales charge for R shares. |
| Past performance is no guarantee of future results. Current returns may be either lower or higher than those shown. Share prices and returns will fluctuate and investors may experience a loss upon redemption. There is no guarantee that the Funds will meet their objectives. Shares in the Funds carry risks, including possible loss of principal. |
| Carefully consider the Funds’ investment objectives, risks, sales charges, and expenses; this is found in the prospectus, which is available from your financial advisor or from www.thornburg.com. Read it carefully before you invest or send money. For month-end performance information, visit www.thornburg.com. |
| The SEC Yield is computed in accordance with SEC standards measuring the net investment income per share over a specified 30-day period expressed as a percentage of the maximum offering price of the Funds’ shares at the end of the period. |
| The distribution rate is calculated by taking the sum of the month’s total distribution factors and dividing this sum by a 30-day period and annualizing to 360-day year. The value is then divided by the ending NAV to arrive at the annualized distribution yield. The yield is calculated on a periodic basis and is subject to change depending on the Funds’ NAV and current distributions. * Shares are not guaranteed by the U.S. Government. |
1
Thornburg Limited Term Income Funds
Letter to shareholders
April 12, 2004
Dear Fellow Shareholder,
I am pleased to present your Semi-annual Report for the Thornburg Limited Term Income Fund and the Thornburg Limited Term U.S. Government Fund for the 6 months ended March 31, 2004. The net asset value of an “A” share of the Thornburg Limited Term Income Fund increased 5 cents in the period to $13.04. If you were invested for the entire period, you received dividends of 21.6 cents per share. If you reinvested your dividends, you received 21.7 cents per share. Investors who owned “C” shares received 19.9 and 20.0 cents per share, respectively. The net asset value of an “A” share of the Thornburg Limited Term U.S. Government Fund increased 4 cents in the period to $13.27. If you were invested for the entire period, you received dividends of 18.7 cents per share. If you reinvested your dividends, you received 18.8 cents per share. Investors who owned “C” shares received 16.4 and 16.5 cents per share, respectively. Please read the accompanying exhibits for more detailed information and history.
Interest rates on U.S. Treasuries were largely unchanged on the dates of September 30, 2003 and March 31, 2004. However, the market fluctuated widely in the interim. For example, the yield on a 5-year U.S. Treasury ranged between a high of 3.45% and a low of 2.65% over the period. Interest rates mostly rose through November before starting a downward trend through March. Quality spreads (the additional yield on a corporate bond) contracted through December before starting to rise in the first quarter of this year.
Putting income and the change in price together, the “A” shares of the Thornburg Limited Term Income Fund produced a total return of 2.15% over the six-month period, assuming a beginning-of-the-period investment at the net asset value. The Lehman Brothers Intermediate Government/Credit Index produced a 2.75% total return over the same time period. The “A” shares of the Thornburg Limited Term U.S. Government Fund produced a total return of 1.74% over the six-month period, assuming a beginning-of-the-period investment at the net asset value. The Lehman Intermediate Government Index produced a 2.18% total return over the same time period. The Funds kept their duration shorter than the indices during the first quarter of 2004, during which time interest rates fell and longer duration bonds tended to outperform. Because the Funds kept their durations shorter and allocated a larger portion of their portfolios to short-term bonds, their returns fell short of the indices. The Thornburg Limited Term Income Fund also did not own some of the lower rated credits represented in the Index. Some of these bonds benefited from the significant contraction in spreads to Treasuries on lower rated credits during the period. We have kept our durations shorter than the indices thus far in 2004, because we believe doing so will improve the Funds’ return relative to the indices if interest rates rise.
Interest rates have risen since the release of the March payroll numbers. The U.S. Treasury market now has yields equivalent to the levels seen in December of 2003. After months of waiting for the expected employment growth to show up, the market had become complacent with a “No Jobs Recovery” after the February payroll release. The gain of 308,000 jobs documented in the March payroll number seems to have caught the bond market by surprise. It is interesting to note that the increase in employment has averaged 126,000 per month since September. The U.S. still has 1 million fewer jobs now than at the peak employment in 2001. Most economists believe that employment has to grow by at least 125,000 per month just to keep up with population growth. 200,000 to 300,000 per month employment growth is necessary to regain those lost jobs.
Aside from the employment growth, other aspects of the U.S. economy have continued their increases as the U.S. moves away from the last recession. The GDP growth has been relatively robust. An increase in household wealth appears to be sustaining spending in this cycle, something that was not evident in earlier cycles. That may be due to the ease of taking money out of assets, especially houses through mortgage refinancing. The huge influx of foreign investments has helped, pushing down interest rates and boosting asset values. Over the past three years, foreigners have purchased over $500 billion in corporate bonds, over $400 billion of Treasuries and $225 billion in mortgage-backed securities. This foreign investment has helped corporate spreads as well. There has been a large improvement in credit spreads on corporate bonds over the last few years, but that improvement has moderated over the last six months as quality spreads are now at levels last seen in 1998.
If the March payroll report is not an aberration, but the start of robust employment growth, then the outlook for the raising of the Fed Funds Rate may now change its focus from payrolls to inflation. If strong GDP growth continues and employment is rising, the last ingredient for the Fed staying accommodative is low inflation. The members of the Federal Open Market
2
Thornburg Limited Term Income Funds
Letter to shareholders, CONTINUED
Committee have stated that they do not believe that inflation is much of a problem right now. The bond market, however, is starting to worry that inflation has reached its nadir and will start to move up from here. The large increases in prices for energy and commodities have helped fuel speculation that inflation is on the rise.
It appears evident that the Fed will hold short rates steady for a while; the lost jobs need to be replaced and that will take six months of 300,000-employment growth; the economy needs to keep growing at a steady pace; and, inflation needs to accelerate from here. All of these are within reach, but not in the next few months. The bond market tries to be proactive, however. If it is believed that the Fed will have to start raising rates, the bond market may start increasing yields before the Fed has changed their stance. We are cognizant of this as we manage the portfolios for the future.
Regardless of the direction of interest rates, we believe your funds are well positioned. The Thornburg Limited Term Income Fund and the Thornburg Limited Term U.S. Government Fund are laddered portfolios of short-to-intermediate bonds. We keep the portfolios laddered over a time period ranging from one day to approximately ten years, with the average maturity of the portfolios always no more than five years. Some of the bonds are always coming close to maturity, but never too many at one time. We believe a laddered maturity portfolio of short-to-intermediate bonds is a sensible strategy over time. Intermediate bonds have proven to be a sensible part of a portfolio. They can provide stability to the underlying principal, they can provide income for the portfolio, and, over the years, they have provided an attractive return versus money market instruments. Please review the charts at the back of the report, which show the return on an investment in the Thornburg Limited Term Income Fund and the Thornburg Limited Term U.S. Government Fund versus the money market funds average.
Thank you for investing in our funds. We believe the Thornburg Limited Term U.S. Government Fund and the Thornburg Limited Term Income Fund are appropriate investments for investors who want a short-to-intermediate bond portfolio. While future performance cannot be guaranteed, we believe that we are well positioned and we will maintain a steady course.

Steven J. Bohlin
Portfolio Manager
The Lehman Brothers Intermediate Government/Credit Bond Index is an unmanaged, market-weighted index generally representative of intermediate government and investment grade corporate debt securities having maturities of up to ten years.
The Lehman Brothers Intermediate Government Bond Index is an unmanaged market-weighted index generally representative of all public obligations of the U.S. Government, its agencies and instrumentalities having maturities of up to ten years.
3
Statements of assets and liabilities
Thornburg Limited Term Income Funds
March 31, 2004
(Unaudited)
| Limited Term U.S. Government Fund | Limited Term Income Fund | |||||||
|---|---|---|---|---|---|---|---|---|
| ASSETS | ||||||||
| Investments at value (cost $224,817,842 and $367,358,479 respectively) | $ | 232,248,587 | $ | 382,172,551 | ||||
| Cash | 692,932 | 1,838,451 | ||||||
| Cash denominated in foreign currency (cost $66,710) | 0 | 68,694 | ||||||
| Receivable for investments sold | 568 | 2,481,005 | ||||||
| Principal receivable | 14,759 | 0 | ||||||
| Receivable for fund shares sold | 386,508 | 1,767,919 | ||||||
| Interest receivable | 2,242,690 | 3,988,997 | ||||||
| Prepaid expenses and other assets | 51,545 | 47,892 | ||||||
| Total Assets | 235,637,589 | 392,365,509 | ||||||
| LIABILITIES | ||||||||
| Payable for securities purchased | 0 | 15,415,287 | ||||||
| Payable for fund shares redeemed | 794,501 | 220,028 | ||||||
| Accounts payable and accrued expenses | 124,993 | 110,984 | ||||||
| Payable to investment advisor (Note 3) | 93,454 | 163,611 | ||||||
| Dividends payable | 534,507 | 981,029 | ||||||
| Total Liabilities | 1,547,455 | 16,890,939 | ||||||
| NET ASSETS | $ | 234,090,134 | $ | 375,474,570 | ||||
| NET ASSETS CONSIST OF: | ||||||||
| Undistributed (distribution in excess of) net investment income | $ | 83,335 | $ | 5,946 | ||||
| Net unrealized appreciation (depreciation) on investments | 7,430,745 | 14,816,802 | ||||||
| Accumulated net realized (gain) loss | (3,080,188 | ) | (2,667,468 | ) | ||||
| Net capital paid in on shares of beneficial interest | 229,656,242 | 363,319,290 | ||||||
| $ | 234,090,134 | $ | 375,474,570 | |||||
| NET ASSET VALUE: | ||||||||
| Class A Shares: | ||||||||
| Net asset value and redemption price per share ($168,411,245 and $219,355,942 | ||||||||
| applicable to 12,693,592 and 16,815,610 shares of beneficial interest | ||||||||
| outstanding - Note 4) | $ | 13.27 | $ | 13.04 | ||||
| Maximum sales charge, 1.50% of offering price | 0.20 | 0.20 | ||||||
| Maximum Offering Price Per Share | $ | 13.47 | $ | 13.24 | ||||
| Class B Shares: | ||||||||
| Net asset value and offering price per share* ($2,563,517 | ||||||||
| applicable to 193,299 shares of beneficial | ||||||||
| interest outstanding - Note 4) | $ | 13.26 | $ | 0 | ||||
| Class C Shares: | ||||||||
| Net asset value and offering price per share* ($50,782,122 and | ||||||||
| $64,660,170 applicable to 3,804,234 and 4,964,653 shares of | ||||||||
| beneficial interest outstanding - Note 4) | $ | 13.35 | $ | 13.02 | ||||
| Class I Shares: | ||||||||
| Net asset value, offering and redemption price per share ($12,291,953 | ||||||||
| and $91,400,039 applicable to 926,663 and 7,006,356 shares | ||||||||
| of beneficial interest outstanding - Note 4) | $ | 13.26 | $ | 13.05 | ||||
| Class R-1 Shares: | ||||||||
| Net asset value, offering and redemption price per share ($41,297 | ||||||||
| and $58,419 applicable to 3,111 and 4,477 shares | ||||||||
| of beneficial interest outstanding - Note 4) | $ | 13.28 | $ | 13.05 | ||||
| * Redemption price per share is equal to net asset value less any applicable contingent deferred sales charges See notes to financial statements. | ||||||||
4
| STATEMENTS OF OPERATIONS | ||||||||
|---|---|---|---|---|---|---|---|---|
| Thornburg Limited Term Income Funds | Six Months Ended March 31, 2004 | |||||||
| (Unaudited) | ||||||||
| INVESTMENT INCOME: | Limited Term U.S. Government Fund | Limited Term Income Fund | ||||||
| Interest income (net of premium amortized | ||||||||
| of $1,157,485 and $692,130 respectively) | $ | 4,407,948 | $ | 7,205,589 | ||||
| EXPENSES: | ||||||||
| Investment advisory fees (Note 3) | 443,989 | 834,653 | ||||||
| Administration fees (Note 3) | ||||||||
| Class A Shares | 105,591 | 125,814 | ||||||
| Class B Shares | 1,707 | 0 | ||||||
| Class C Shares | 33,022 | 36,712 | ||||||
| Class I Shares | 3,116 | 18,449 | ||||||
| Class R-1 Shares | 5 | 15 | ||||||
| Distribution and service fees (Note 3) | ||||||||
| Class A Shares | 142,939 | 201,905 | ||||||
| Class B Shares | 14,410 | 0 | ||||||
| Class C Shares | 269,193 | 301,423 | ||||||
| Class R-1 Shares | 39 | 125 | ||||||
| Transfer agent fees | ||||||||
| Class A Shares | 74,740 | 103,350 | ||||||
| Class B Shares | 8,271 | |||||||
| Class C Shares | 31,725 | 36,630 | ||||||
| Class I Shares | 8,995 | 18,140 | ||||||
| Class R-1 Shares | 992 | 900 | ||||||
| Registration and filing fees | ||||||||
| Class A Shares | 7,611 | 5,843 | ||||||
| Class B Shares | 7,320 | |||||||
| Class C Shares | 4,526 | 4,452 | ||||||
| Class I Shares | 4,979 | 4,824 | ||||||
| Class R-1 Shares | 7,794 | 7,794 | ||||||
| Custodian fees (Note 3) | 64,863 | 82,008 | ||||||
| Professional fees | 19,840 | 30,935 | ||||||
| Accounting fees | 10,210 | 10,515 | ||||||
| Trustee fees | 3,406 | 3,714 | ||||||
| Other expenses | 32,401 | 34,729 | ||||||
| Total Expenses | 1,301,684 | 1,862,930 | ||||||
| Less: | ||||||||
| Expenses reimbursed by investment advisor (Note 3) | (35,222 | ) | (102,652 | ) | ||||
| Distribution and service fees waived (Note 3) | (134,616 | ) | (150,774 | ) | ||||
| Fees paid indirectly (Note 3) | (2,663 | ) | (4,538 | ) | ||||
| Net Expenses | 1,129,183 | 1,604,966 | ||||||
| Net Investment Income | $ | 3,278,765 | $ | 5,600,623 | ||||
5
Six Months Ended March 31, 2004
(Unaudited)
| Limited Term U.S. Government Fund | Limited Term Income Fund | |||||||
|---|---|---|---|---|---|---|---|---|
| REALIZED AND UNREALIZED GAIN (LOSS) | ||||||||
| Net Realized Gain Loss) on: | ||||||||
| Investments | $ | 137,645 | $ | (984,392 | ) | |||
| Net change in unrealized appreciation (depreciation) on: | ||||||||
| Investments | 403,287 | 2,980,352 | ||||||
| Foreign currency translation | 000 | (525 | ) | |||||
| 403,287 | 2,979,827 | |||||||
| Net Realized and Unrealized | ||||||||
| Gain (Loss) on Investments | 540,932 | 1,995,435 | ||||||
| Net Increase (Decrease) in Net Assets Resulting | ||||||||
| From Operations | $ | 3,819,697 | $ | 7,596,058 | ||||
| See notes to financial statements | ||||||||
6
| Statements of changes in net assets Thornburg Limited Term U.S. Government Fund | ||||||||
|---|---|---|---|---|---|---|---|---|
| Six Months Ended March 31, 2004 | Year Ended September 30, 2003 | |||||||
| INCREASE (DECREASE) IN NET ASSETS FROM: | ||||||||
| OPERATIONS: | ||||||||
| Net investment income | $ | 3,278,765 | $ | 7,983,017 | ||||
| Net realized gain (loss) on investments sold | 137,645 | 4,695,491 | ||||||
| Increase (Decrease) in unrealized appreciation | 403,287 | (5,709,054 | ) | |||||
| Net Increase (Decrease) in Net Assets | ||||||||
| Resulting from Operations | 3,819,697 | 6,969,454 | ||||||
| DIVIDENDS TO SHAREHOLDERS: | ||||||||
| From net investment income | ||||||||
| Class A Shares | (2,404,539 | ) | (6,174,157 | ) | ||||
| Class B Shares | (28,815 | ) | (50,597 | ) | ||||
| Class C Shares | (655,987 | ) | (1,378,892 | ) | ||||
| Class I Shares | (189,311 | ) | (379,370 | ) | ||||
| Class R-1 Shares | (113 | ) | (1 | ) | ||||
| FUND SHARE TRANSACTIONS (Note 4): | ||||||||
| Class A Shares | (8,864,749 | ) | 21,836,105 | |||||
| Class B Shares | (510,422 | ) | 3,080,205 | |||||
| Class C Shares | (5,494,408 | ) | 25,756,540 | |||||
| Class I Shares | (822,238 | ) | 6,129,775 | |||||
| Class R-1 Shares | 41,046 | 76 | ||||||
| Net Increase (Decrease) in Net Assets | (15,109,839 | ) | 55,789,138 | |||||
| NET ASSETS: | ||||||||
| Beginning of period | 249,199,973 | 193,410,835 | ||||||
| End of period | $ | 234,090,134 | $ | 249,199,973 | ||||
| See notes to financial statements | ||||||||
7
| Statements of Changes in Net Assets Thornburg Limited Term Income Fund | ||||||||
|---|---|---|---|---|---|---|---|---|
| Six Months Ended March 31, 2004 | Year Ended September 30, 2003 | |||||||
| INCREASE (DECREASE) IN NET ASSETS FROM: | ||||||||
| OPERATIONS: | ||||||||
| Net investment income | $ | 5,600,623 | $ | 9,222,797 | ||||
| Net realized gain (loss) on investments sold | (984,392 | ) | 1,075,205 | |||||
| Increase (Decrease) in unrealized appreciation | 2,979,827 | 2,954,124 | ||||||
| Net Increase (Decrease) in Net Assets | ||||||||
| Resulting from Operations | 7,596,058 | 13,252,126 | ||||||
| DIVIDENDS TO SHAREHOLDERS: | ||||||||
| From net investment income | ||||||||
| Class A Shares | (3,355,045 | ) | (5,571,809 | ) | ||||
| Class C Shares | (900,913 | ) | (1,505,535 | ) | ||||
| Class I Shares | (1,344,277 | ) | (2,145,452 | ) | ||||
| Class R-1 Shares | (388 | ) | (1 | ) | ||||
| FUND SHARE TRANSACTIONS (Note 4): | ||||||||
| Class A Shares | 33,748,674 | 77,437,936 | ||||||
| Class C Shares | 9,417,731 | 23,908,108 | ||||||
| Class I Shares | 31,358,671 | 19,271,605 | ||||||
| Class R-1 Shares | 57,483 | 76 | ||||||
| Net Increase (Decrease) in Net Assets | 76,577,994 | 124,647,054 | ||||||
| NET ASSETS: | ||||||||
| Beginning of period | 298,896,576 | 174,249,522 | ||||||
| End of period | $ | 375,474,570 | $ | 298,896,576 | ||||
See notes to financial statements.
8
Notes to financial statements
Thornburg Limited Term Income Funds
March 31, 2004
NOTE 1 – ORGANIZATION Thornburg Limited Term U.S. Government Fund (the “Government Fund”) and Thornburg Limited Term Income Fund (the “Income Fund”), hereafter referred to collectively as the “Funds”, are diversified series of Thornburg Investment Trust (the “Trust”). The Trust is organized as a Massachusetts business trust under a Declaration of Trust dated June 3, 1987 and is registered as a diversified, open-end management investment company under the Investment Company Act of 1940, as amended. The Trust is currently issuing eight series of shares of beneficial interest in addition to those of the Funds: Thornburg Florida Intermediate Municipal Fund, Thornburg New York Intermediate Municipal Fund, Thornburg New Mexico Intermediate Municipal Fund, Thornburg Intermediate Municipal Fund, Thornburg Value Fund, Thornburg International Value Fund, Thornburg Core Growth Fund, and Thornburg Investment Income Builder Fund. Each series is considered to be a separate entity for financial reporting and tax purposes and bears expenses directly attributable to it. The Funds’ objectives are to obtain as high a level of current income as is consistent with the preservation of capital.
The Government Fund currently offers five classes of shares of beneficial interest, Class A, Class B, Class C, Institutional Class (Class I), and Retirement Class (Class R-1) shares. The Income Fund currently offers four classes of shares of beneficial interest, Class A, Class C, Institutional Class (Class I), and Retirement Class (Class R-1) shares. Each class of shares of a fund represents an interest in the same portfolio of investments of that fund, except that (i) Class A shares are sold subject to a front-end sales charge collected at the time the shares are purchased and bear a service fee, (ii) Class B shares are sold at net asset value without a sales charge at the time of purchase, but are subject to a contingent deferred sales charge upon redemption and bear both a service fee and distribution fee, (iii) Class C shares are sold at net asset value without a sales charge at the time of purchase, but are subject to a contingent deferred sales charge upon redemption and bear both a service fee and a distribution fee, (iv) Class I shares are sold at net asset value without a sales charge at the time of purchase, (v) Class R-1 shares are sold at net asset value without a sales charge, but bear both a service fee and a distribution fee, and (vi) the respective classes have different reinvestment privileges. Additionally, each fund may allocate among its classes certain expenses, to the extent allowable to specific classes, including transfer agent fees, government registration fees, certain printing and postage costs, and administrative and legal expenses. Currently, class specific expenses of the Funds are limited to service and distribution fees, administrative fees and certain registration and transfer agent expenses.
NOTE 2 – SIGNIFICANT ACCOUNTING POLICIES
Significant accounting policies of the Fund are as follows:
Valuation of Investments: In determining net asset value, the Funds utilize an independent pricing service approved by the Trustees. Debt investment securities have a primary market over the counter and are valued on the basis of valuations furnished by the pricing service. The pricing service values portfolio securities at quoted bid prices, normally at 4:00 pm EST or the yield equivalents when quotations are not readily available. Securities for which quotations are not readily available are valued at fair value as determined by the pricing service using methods which include consideration of yields or prices of obligations of comparable quality, type of issue, coupon, maturity, and rating; indications as to value from dealers and general market conditions. The valuation procedures used by the pricing service and the portfolio valuations received by the Funds are reviewed by the officers of the Trust under the general supervision of the Trustees. Short-term instruments having a maturity of 60 days or less are valued at amortized cost, which approximates market value.
Federal Income Taxes: It is the policy of the Funds to comply with the provisions of the Internal Revenue code applicable to “regulated investment companies” and to distribute all of their taxable income, including any net realized gain on investments to its shareholders. Therefore, no provision for Federal income taxes is required.
When-Issued and Delayed Delivery Transactions: The Funds may engage in when-issued or delayed delivery transactions. To the extent the Funds engage in such transactions, they will do so for the purpose of acquiring portfolio securities consistent with their investment objectives and not for the purpose of investment leverage or to speculate on interest rate changes. At the time the Funds make a commitment to purchase a security on a when-issued basis, they will record the transaction and reflect the value in determining each fund’s net asset value. When effecting such transactions, assets of the Funds of an amount sufficient to make payment for the portfolio securities to be purchased will be segregated on the Funds’ records at the trade date. Securities purchased on a when-issued or delayed delivery basis do not earn interest until the settlement date.
Dividends: Net investment income of the Funds are declared daily as a dividend on shares for which the Funds have received payment. Dividends are paid monthly and are
9
Thornburg Limited Term Income Funds
Notes to financial statements, continued
March 31, 2004
reinvested in additional shares of the Funds at net asset value per share at the close of business on the dividend payment date, or at the shareholder’s option, paid in cash. Net capital gains, to the extent available, will be distributed at least annually.
General: Securities transactions are accounted for on a trade date basis. Interest income is accrued as earned. Premiums and discounts on securities purchased are amortized over the life of the respective securities. Realized gains and losses from the sale of securities are recorded on an identified cost basis. The Funds invest in various mortgage-backed securities. Such securities pay interest and a portion of principal each month, which is then available for investment in securities at prevailing prices. Net investment income, other than class specific expenses, and realized and unrealized gains and losses, are allocated daily to each class of shares based upon the relative net asset value of outstanding shares (or the value of the dividend-eligible shares, as appropriate) of each class of shares at the beginning of the day (after adjusting for the current share activity of the respective class). Expenses common to all funds are allocated among the funds comprising the Trust based upon their relative net asset values or other appropriate allocation methods.
Foreign Currency Transactions: With respect to the Income Fund, portfolio securities and other assets and liabilities denominated in foreign currencies are translated into U.S. dollars based on the rate of exchange of such currencies against U.S. dollars on the date of valuation. Purchases and sales of portfolio securities and interest denominated in foreign currencies are translated into U.S. dollar amounts on the respective dates of such transactions.
The Income Fund does not isolate that portion of the results of operations resulting from changes in foreign exchange rates on investments from the fluctuations arising from changes in market prices of securities held. Such fluctuations are included with the net realized and unrealized gain or loss from investments.
Reported net realized foreign exchange gains or losses arise from sales of foreign currencies, currency gains or losses realized between the trade and settlement dates on securities transactions and the difference between the amount of interest recorded on the Income Fund’s books and the U.S. dollar equivalent of the amounts actually received or paid.
Guarantees and Indemnifications: Under the Trust’s organizational documents, its officers and trustees are indemnified against certain liability arising out of the performance of their duties to the Funds. Additionally, in the normal course of business, the Trust enters into contracts with service providers that contain general indemnification clauses. The Trust’s maximum exposure under these arrangements is unknown. However, based on experience, the Trust expects the risk of loss to be remote.
Use of Estimates: The preparation of financial statements, in conformity with generally accepted accounting principles, requires management to make estimates and assumptions that affect the reported amounts of assets and liabilities and the disclosure of contingent assets and liabilities at the date of the financial statements and the reported amounts of increases and decreases in net assets from operations during the reporting period. Actual results could differ from those estimates.
NOTE 3 — INVESTMENT ADVISORY FEE AND OTHER TRANSACTIONS WITH AFFILIATES
Pursuant to an investment advisory agreement, Thornburg Investment Management, Inc. (the “Advisor”) serves as the investment advisor and performs services to the Funds for which the fees are payable at the end of each month. For the period ended March 31, 2004, these fees were payable at annual rates ranging from .375 of 1% to .275 of 1% of the average daily net assets of the Government Fund and .50 of 1% to .275 of 1% of the average daily net assets of the Income Fund depending on each fund’s asset size. The Funds also have an administrative services agreement with the Advisor, whereby the Advisor will perform certain administrative services for the shareholders of each class of each fund’s shares, and for which fees will be payable at an annual rate of up to .125 of 1% of the average daily net assets attributable to Class A, Class B, Class C, and Class R-1 shares, and up to .05 of 1% of the average daily net assets attributable to Class I shares. For the period ended March 31, 2004, the Advisor voluntarily reimbursed certain class specific expenses and administrative fees of $16,365, $4,658, $5,405, and $8,794 for the Class B, C, I, and R-1 shares, respectively, of the Government Fund and $42,694, $37,426, $13,818, and $8,714 for the Class A, C, I, and R-1 shares, respectively, of the Income Fund.
The Funds have underwriting agreements with Thornburg Securities Corporation (the “Distributor”), which acts as the distributor of each fund’s shares. For the period ended March 31, 2004, the Distributor has advised the Funds that it earned net commissions aggregating $1,321 and $1,159 from the sales of Class A shares of the Government Fund and Income Fund, respectively, and collected contingent deferred sales charges aggregating $11,053 and $7,656 from redemptions of Class C shares of the Government Fund and Income Fund, respectively.
10
Notes to financial statements, continued
Thornburg Limited Term Income Funds
Pursuant to a service plan under Rule 12b-1 of the Investment Company Act of 1940, the Funds may reimburse to the Advisor an amount not to exceed .25 of 1% per annum of its average daily net assets attributable to the Class A, Class B, Class C, and Class R-1 shares of the Funds for payments made by the Advisor to securities dealers and other financial institutions to obtain various shareholder related services. The Advisor may pay out of its own resources additional expenses for distribution of each fund’s shares. The Funds have also adopted distribution plans pursuant to Rule 12b-1, applicable to each fund’s Class B, Class C, and Class R-1 shares under which the Funds compensate the Distributor for services in promoting the sale of Class B, C, and R-1 shares of the Funds at an annual rate of up to ..75 of 1% of the average daily net assets attributable to these classes. Total fees incurred by each class of shares of the Funds under their respective service and distribution plans for the period ended March 31, 2004 are set forth in the Statements of Operations. Distribution fees of $134,616 and $150,774 respectively for Class C shares of the Government Fund and Income Fund were waived.
The Funds have an agreement with the custodian bank to indirectly pay a portion of the custodian’s fees through credits earned by each fund’s cash on deposit with the bank. This deposit agreement is an alternative to overnight investments. Custodial fees have been adjusted to reflect amounts that would have been paid without this agreement, with a corresponding adjustment reflected as fees paid indirectly in the Statements of Operations. For the period ended March 31, 2004, the fees paid indirectly were $2,663 and $4,538 for the Government Fund and Income Fund respectively.
Certain officers and trustees of the Trust are also officers and/or directors of the Advisor and Distributor. The compensation of unaffiliated trustees is borne by the Trust.
NOTE 4 — SHARES OF BENEFICIAL INTEREST
At March 31, 2004 there were an unlimited number of shares of beneficial interest authorized. Sales of Class R-1 Shares commenced July 1, 2003. Transactions in shares of beneficial interest were as follows:
| GOVERNMENT FUND | Period Ended March 31, 2004 | Year Ended September 30, 2003 | ||||||||||||
|---|---|---|---|---|---|---|---|---|---|---|---|---|---|---|
| Shares | Amount | Shares | Amount | |||||||||||
| Class A Shares | ||||||||||||||
| Shares sold | 1,749,617 | $ | 23,007,642 | 7,033,728 | $ | 93,088,730 | ||||||||
| Shares issued to shareholders in | 114,379 | 1,499,320 | 352,071 | 4,651,838 | ||||||||||
| reinvestment of dividends | ||||||||||||||
| Shares repurchased | (2,543,701 | ) | (33,371,711 | ) | (5,757,412 | ) | (75,904,463 | ) | ||||||
| Net Increase (Decrease) | (679,705 | ) | $ | (8,864,749 | ) | 1,628,387 | $ | 21,836,105 | ||||||
| Class B Shares | ||||||||||||||
| Shares sold | 41,064 | $ | 541,568 | 265,526 | $ | 3,519,557 | ||||||||
| Shares issued to shareholders in | 1,199 | 15,690 | 2,704 | 35,753 | ||||||||||
| reinvestment of dividends | ||||||||||||||
| Shares repurchased | (81,301 | ) | (1,067,680 | ) | (35,893 | ) | (475,105 | ) | ||||||
| Net Increase (Decrease) | (39,038 | ) | $ | (510,422 | ) | 232,337 | $ | 3,080,205 | ||||||
| Class C Shares | ||||||||||||||
| Shares sold | 459,976 | $ | 6,081,199 | 2,733,738 | $ | 36,415,998 | ||||||||
| Shares issued to shareholders in | 30,870 | 407,054 | 83,795 | 1,113,966 | ||||||||||
| reinvestment of dividends | ||||||||||||||
| Shares repurchased | (907,277 | ) | (11,982,661 | ) | (887,516 | ) | (11,773,424 | ) | ||||||
| Net Increase (Decrease) | (416,431 | ) | $ | (5,494,408 | ) | 1,930,017 | $ | 25,756,540 | ||||||
11
Thornburg Limited Term Income Funds
Notes to financial statements, continued
March 31, 2004
| Period Ended March 31, 2004 | Year Ended September 30, 2003 | |||||||||||||
|---|---|---|---|---|---|---|---|---|---|---|---|---|---|---|
| Shares | Amount | Shares | Amount | |||||||||||
| Class I Shares | ||||||||||||||
| Shares sold | 245,315 | $ | 3,210,274 | 808,309 | $ | 10,671,009 | ||||||||
| Shares issued to shareholders in | 10,057 | 131,822 | 24,410 | 322,502 | ||||||||||
| reinvestment of dividends | ||||||||||||||
| Shares repurchased | (318,194 | ) | (4,164,334 | ) | (367,766 | ) | (4,863,736 | ) | ||||||
| Net Increase (Decrease) | (62,822 | ) | $ | (822,238 | ) | 464,953 | $ | 6,129,775 | ||||||
| Class R-1 Shares | ||||||||||||||
| Shares sold | 3,399 | $ | 44,964 | 6 | $ | 75 | ||||||||
| Shares issued to shareholders in | 1 | 8 | -- | 1 | ||||||||||
| reinvestment of dividends | ||||||||||||||
| Shares repurchased | (295 | ) | (3,926 | ) | -- | -- | ||||||||
| Net Increase (Decrease) | 3,105 | $ | 41,046 | 6 | $ | 76 | ||||||||
| INCOME FUND | Period Ended March 31, 2004 | Year Ended September 30, 2003 | ||||||||||||
|---|---|---|---|---|---|---|---|---|---|---|---|---|---|---|
| Shares | Amount | Shares | Amount | |||||||||||
| Class A Shares | ||||||||||||||
| Shares sold | 4,541,406 | $ | 58,626,933 | 8,212,612 | $ | 105,632,467 | ||||||||
| Shares issued to shareholders in | 157,855 | 2,033,515 | 317,279 | 4,076,963 | ||||||||||
| reinvestment of dividends | ||||||||||||||
| Shares repurchased | (2,084,354 | ) | (26,911,774 | ) | (2,518,725 | ) | (32,271,494 | ) | ||||||
| Net Increase (Decrease) | 2,614,907 | $ | 33,748,674 | 6,011,166 | $ | 77,437,936 | ||||||||
| Class C Shares | ||||||||||||||
| Shares sold | 1,313,066 | $ | 16,929,965 | 2,753,770 | $ | 35,318,563 | ||||||||
| Shares issued to shareholders in | 38,708 | 497,854 | 83,893 | 1,076,023 | ||||||||||
| reinvestment of dividends | ||||||||||||||
| Shares repurchased | (621,459 | ) | (8,010,088 | ) | (973,489 | ) | (12,486,478 | ) | ||||||
| Net Increase (Decrease) | 730,315 | $ | 9,417,731 | 1,864,174 | $ | 23,908,108 | ||||||||
| Class I Shares | ||||||||||||||
| Shares sold | 2,932,414 | $ | 37,863,589 | 2,435,755 | $ | 31,247,349 | ||||||||
| Shares issued to shareholders in | 77,080 | 993,296 | 150,329 | 1,931,913 | ||||||||||
| reinvestment of dividends | ||||||||||||||
| Shares repurchased | (580,634 | ) | (7,498,214 | ) | (1,080,571 | ) | (13,907,657 | ) | ||||||
| Net Increase (Decrease) | 2,428,860 | $ | 31,358,671 | 1,505,513 | $ | 19,271,605 | ||||||||
| Class R-1 Shares | ||||||||||||||
| Shares sold | 4,453 | $ | 57,245 | 6 | $ | 75 | ||||||||
| Shares issued to shareholders in | 18 | 238 | -- | 1 | ||||||||||
| reinvestment of dividends | ||||||||||||||
| Shares repurchased | -- | -- | -- | -- | ||||||||||
| Net Increase (Decrease) | 4,471 | $ | 57,483 | 6 | $ | 76 | ||||||||
12
Notes to financial statements, continued
Thornburg Limited Term Income Funds
NOTE 5 – SECURITIES TRANSACTIONS
For the period ended March 31, 2004, portfolio purchase and sale transactions (excluding short-term securities) were $3,935,000 and $13,385,186 for the Government Fund and $115,828,820 and $44,374,733 for the Income Fund, respectively.
NOTE 6 – INCOME TAXES
At March 31, 2004, information on the tax components of capital is as follows:
| Government Fund | Income Fund | |||||||
|---|---|---|---|---|---|---|---|---|
| Cost of investments | ||||||||
| for tax purpose | $ | 224,817,842 | $ | 367,531,570 | ||||
| Gross unrealized | ||||||||
| appreciation on a tax basis | $ | 8,158,030 | $ | 15,227,827 | ||||
| Gross unrealized | ||||||||
| depreciation on a tax basis | (727,285 | ) | (413,755 | ) | ||||
| Net unrealized | ||||||||
| appreciation (depreciation) | ||||||||
| on investments (tax basis) | $ | 7,430,745 | $ | 14,814,072 | ||||
| Distributable earnings- | ||||||||
| ordinary income | $ | 83,335 | $ | 5,946 | ||||
At March 31, 2004, the Government Fund had tax basis capital losses, which may be carried over to offset future capital gains. Such losses expire as follows: Capital loss carryovers expiring in:
| 2004 | $ | 2,026,055 | |||
| 2008 | 17,646 | ||||
| 2009 | 1,160,521 | ||||
| 2010 | 13,611 | ||||
| $ | 3,217,833 | ||||
At March 31, 2004, the Income Fund had tax basis capital losses, which may be carried over to offset future capital gains. Such losses expire as follows: Capital loss carryovers expiring in:
| 2004 | $ | 225,978 | |||
| 2008 | 497,824 | ||||
| 2009 | 650,941 | ||||
| 2010 | 308,333 | ||||
| $ | 1,683,076 | ||||
Unutilized tax basis capital losses may be carried forward to offset realized gains in future years. To the extent such carry forwards are used, capital gains distributions may be reduced to the extent provided by regulations.
13
| Financial highlights | ||||||
|---|---|---|---|---|---|---|
| Thornburg Limited Term U.S. Government Fund | ||||||
| Six Months Ended | Year Ended September 30, | |||||
| March 31, 2004 | 2003 | 2002 | 2001 | 2000 | 1999 | |
| Class A Shares: | ||||||
| Per Share Performance | ||||||
| (for a share outstanding throughout the period) | ||||||
| Net asset value, beginning of period | $ 13.23 | $ 13.27 | $ 12.77 | $ 12.03 | $ 12.06 | $ 12.66 |
| Income from investment operations: | ||||||
| Net investment income | 0.19 | 0.47 | 0.58 | 0.67 | 0.68 | 0.66 |
| Net realized and unrealized | ||||||
| gain (loss) on investments | 0.04 | (0.04) | 0.50 | 0.74 | (0.03) | (0.60) |
| Total from investment operations | 0.23 | 0.43 | 1.08 | 1.41 | 0.65 | 0.06 |
| Less dividends from: | ||||||
| Net investment income | (0.19) | (0.47) | (0.58) | (0.67) | (0.68) | (0.66) |
| Change in net asset value | 0.04 | (0.04) | 0.50 | 0.74 | (0.03) | (0.60) |
| Net asset value, end of period | $ 13.27 | $ 13.23 | $ 13.27 | $ 12.77 | $ 12.03 | $ 12.06 |
| Total return (a) | 1.74% | 3.29% | 8.75% | 12.02% | 5.58% | 0.48% |
| Ratios/Supplemental Data | ||||||
| Ratios to average net assets: | ||||||
| Net investment income | 2.85% (b) | 3.53% | 4.53% | 5.39% | 5.69% | 5.33% |
| Expenses, after expense reductions | 0.88% (b) | 0.92% | 0.93% | 0.99% | 0.98% | 0.95% |
| Expenses, after expense reductions | ||||||
| and net of custody credits | 0.87% (b) | 0.90% | 0.92% | -- | -- | -- |
| Expenses, before expense reductions | 0.88% (b) | 0.92% | 0.93% | 0.99% | 0.99% | 0.95% |
| Portfolio turnover rate | 1.74% | 35.06% | 4.34% | 15.23% | 19.66% | 19.39% |
| Net assets at end of period (000) | $ 168,411 | $ 176,876 | $ 155,864 | $ 105,348 | $ 87,616 | $ 113,215 |
(a) Sales loads are not reflected in computing total return, which is not annualized for periods less than one year.
(b) Annualized.
14
| Financial highlights, continued | ||
|---|---|---|
| Thornburg Limited Term U.S. Government Fund | ||
| Six Months Ended March 31, 2004 | Period Ended September 30, 2003(c) | |
| Class B Shares: | ||
| Per Share Performance | ||
| (for a share outstanding throughout the period) | ||
| Net asset value, beginning of period | $ 13.22 | $ 13.12 |
| Income from investment operations: | ||
| Net investment income | 0.14 | 0.37 |
| Net realized and unrealized | ||
| gain (loss) on investments | 0.04 | 0.10 |
| Total from investment operations | 0.18 | 0.47 |
| Less dividends from: | ||
| Net investment income | (0.14) | (0.37) |
| Change in net asset value | 0.04 | 0.10 |
| Net asset value, end of period | $ 13.26 | $ 13.22 |
| Total return (a) | 1.34% | 3.60% |
| Ratios/Supplemental Data | ||
| Ratios to average net assets: | ||
| Net investment income | 2.11%(b) | 2.93%(b) |
| Expenses, after expense reductions | 1.61%(b) | 1.35%(b) |
| Expenses, after expense reductions | ||
| and net of custody credits | 1.61%(b) | 1.33%(b) |
| Expenses, before expense reductions | 2.81%(b) | 3.32%(b) |
| Portfolio turnover rate | 1.74% | 35.06% |
| Net assets at end of period (000) | $ 2,564 | $ 3,073 |
(a) Not annualized for periods less than one year
(b) Annualized.
(c) Effective date of Class B Shares was November 1, 2002.
15
| Financial highlights, continued | ||||||
|---|---|---|---|---|---|---|
| Thornburg Limited Term U.S. Government Fund | ||||||
| Six Months Ended | Year Ended September 30, | |||||
| March 31, 2004 | 2003 | 2002 | 2001 | 2000 | 1999 | |
| Class C Shares: | ||||||
| Per Share Performance | ||||||
| (for a share outstanding throughout the period) | ||||||
| Net asset value, beginning of period | $ 13.31 | $ 13.35 | $ 12.85 | $ 12.10 | $ 12.12 | $ 12.71 |
| Income from investment operations: | ||||||
| Net investment income | 0.16 | 0.43 | 0.54 | 0.62 | 0.63 | 0.60 |
| Net realized and unrealized | ||||||
| gain (loss) on investments | 0.04 | (0.04) | 0.50 | 0.75 | (0.02) | (0.59) |
| Total from investment operations | 0.20 | 0.39 | 1.04 | 1.37 | 0.61 | 0.01 |
| Less dividends from: | ||||||
| Net investment income | (0.16) | (0.43) | (0.54) | (0.62) | (0.63) | (0.60) |
| Change in net asset value | 0.04 | (0.04) | 0.50 | 0.75 | (0.02) | (0.59) |
| Net asset value, end of period | $ 13.35 | $ 13.31 | $ 13.35 | $ 12.85 | $ 12.10 | $ 12.12 |
| Total return (a) | 1.55% | 2.96% | 8.33% | 11.60% | 5.23% | 0.13% |
| Ratios/Supplemental Data | ||||||
| Ratios to average net assets: | ||||||
| Net investment income | 2.48% (b) | 3.14% | 4.13% | 4.89% | 5.26% | 4.88% |
| Expenses, after expense reductions | 1.24% (b) | 1.24% | 1.28% | 1.41% | 1.40% | 1.40% |
| Expenses, after expense reductions | ||||||
| and net of custody credits | 1.24% (b) | 1.22% | 1.27% | -- | -- | -- |
| Expenses, before expense reductions | 1.77% (b) | 1.76% | 1.78% | 2.01% | 2.11% | 1.98% |
| Portfolio turnover rate | 1.74% | 35.06% | 4.34% | 15.23% | 19.66% | 19.39% |
| Net assets at end of period (000) | $ 50,782 | $ 56,166 | $ 30,587 | $ 12,704 | $ 5,098 | $ 7,516 |
(a) Not annualized for periods less than one year.
(b) Annualized.
16
| Financial highlights, continued | ||||||
|---|---|---|---|---|---|---|
| Thornburg Limited Term U.S. Government Fund | ||||||
| Six Months Ended | Year Ended September 30, | |||||
| March 31, 2004 | 2003 | 2002 | 2001 | 2000 | 1999 | |
| Class I Shares: | ||||||
| Per Share Performance | ||||||
| (for a share outstanding throughout the period) | ||||||
| Net asset value, beginning of period | $ 13.22 | $ 13.27 | $ 12.77 | $ 12.03 | $ 12.05 | $ 12.65 |
| Income from investment operations: | ||||||
| Net investment income | 0.20 | 0.51 | 0.62 | 0.72 | 0.72 | 0.70 |
| Net realized and unrealized | ||||||
| gain (loss) on investments | 0.04 | (0.05) | 0.50 | 0.74 | (0.02) | (0.60) |
| Total from investment operations | 0.24 | 0.46 | 1.12 | 1.46 | 0.70 | 0.10 |
| Less dividends from: | ||||||
| Net investment income | (0.20) | (0.51) | (0.62) | (0.72) | (0.72) | (0.70) |
| Change in net asset value | 0.04 | (0.05) | 0.50 | 0.74 | (0.02) | (0.60) |
| Net asset value, end of period | $ 13.26 | $ 13.22 | $ 13.27 | $ 12.77 | $ 12.03 | $ 12.05 |
| Total return (a) | 1.84% | 3.51% | 9.11% | 12.45% | 6.07% | 0.82% |
| Ratios/Supplemental Data | ||||||
| Ratios to average net assets: | ||||||
| Net investment income | 3.04% (b) | 3.77% | 4.86% | 5.79% | 6.06% | 5.69% |
| Expenses, after expense reductions | 0.67% (b) | 0.64% | 0.61% | 0.61% | 0.60% | 0.60% |
| Expenses, after expense reductions | ||||||
| and net of custody credits | 0.67% (b) | 0.62% | 0.60% | -- | -- | -- |
| Expenses, before expense reductions | 0.76% (b) | 0.82% | 1.04% | 1.21% | 1.08% | 1.06% |
| Portfolio turnover rate | 1.74% | 35.06% | 4.34% | 15.23% | 19.66% | 19.39% |
| Net assets at end of period (000) | $ 12,292 | $ 13,085 | $ 6,960 | $ 3,992 | $ 3,819 | $ 5,612 |
(a) Not annualized for periods less than one year.
(b) Annualized.
17
| Financial highlights, continued | ||
|---|---|---|
| Thornburg Limited Term U.S. Government Fund | ||
| Six Months Ended March 31, 2004 | Period Ended September 30, 2003(c) | |
| Class R-1 Shares: | ||
| Per Share Performance | ||
| (for a share outstanding throughout the period) | ||
| Net asset value, beginning of period | $ 13.23 | $ 13.38 |
| Income from investment operations: | ||
| Net investment income | 0.20 | 0.17 |
| Net realized and unrealized | ||
| gain (loss) on investments | 0.05 | (0.15) |
| Total from investment operations | 0.25 | 0.02 |
| Less dividends from: | ||
| Net investment income | (0.20) | (0.17) |
| Change in net asset value | 0.05 | (0.15) |
| Net asset value, end of period | $ 13.28 | $ 13.23 |
| Total return (a) | 1.93% | 0.19% |
| Ratios/Supplemental Data | ||
| Ratios to average net assets: | ||
| Net investment income | 2.93%(b) | 5.07%(b) |
| Expenses, after expense reductions | 0.91%(b) | 1.15%(b) |
| Expenses, after expense reductions | ||
| and net of custody credits | 0.91%(b) | 1.15%(b) |
| Expenses, before expense reductions | 228.61%(b) | 41,652.81%(b)* |
| Portfolio turnover rate | 1.74% | 35.06% |
| Net assets at end of period (000) | $ 41 | - (d) |
(a) Not annualized for periods less than one year.
(b) Annualized.
(c) Effective date of Class R-1 Shares was July 1, 2003.
(d) Net assets at end of year were less than $1,000.
* Due to the size of net assets and fixed expenses, ratios may appear disproportionate.
18
| Financial highlights, continued | ||||||
|---|---|---|---|---|---|---|
| Thornburg Limited Term Income Fund | ||||||
| Six Months Ended | Year Ended September 30, | |||||
| March 31, 2004 | 2003 | 2002 | 2001 | 2000 | 1999 | |
| Class A Shares: | ||||||
| Per Share Performance | ||||||
| (for a share outstanding throughout the period) | ||||||
| Net asset value, beginning of period | $ 12.99 | $ 12.79 | $ 12.55 | $ 11.89 | $ 11.93 | $ 12.50 |
| Income from investment operations: | ||||||
| Net investment income | 0.22 | 0.51 | 0.61 | 0.73 | 0.73 | 0.69 |
| Net realized and unrealized | ||||||
| gain (loss) on investments | 0.05 | 0.20 | 0.24 | 0.66 | (0.04) | (0.57) |
| Total from investment operations | 0.27 | 0.71 | 0.85 | 1.39 | 0.69 | 0.12 |
| Less dividends from: | ||||||
| Net investment income | (0.22) | (0.51) | (0.61) | (0.73) | (0.73) | (0.64) |
| Return of Capital | -- | -- | -- | -- | -- | (0.05) |
| Change in net asset value | 0.05 | 0.20 | 0.24 | 0.66 | (0.04) | (0.57) |
| Net asset value, end of period | $ 13.04 | $ 12.99 | $ 12.79 | $ 12.55 | $ 11.89 | $ 11.93 |
| Total return (a) | 2.15% | 5.56% | 7.05% | 12.05% | 6.05% | 1.02% |
| Ratios/Supplemental Data | ||||||
| Ratios to average net assets: | ||||||
| Net investment income | 3.33% (b) | 3.91% | 4.88% | 5.94% | 6.21% | 5.68% |
| Expenses, after expense reductions | 0.99% (b) | 0.99% | 0.99% | 1.00% | 0.99% | 0.99% |
| Expenses, after expense reductions | ||||||
| and net of custody credits | 0.99% (b) | 0.99% | 0.99% | -- | -- | -- |
| Expenses, before expense reductions | 1.03% (b) | 1.04% | 1.10% | 1.16% | 1.21% | 1.19% |
| Portfolio turnover rate | 14.04% | 18.86% | 21.63% | 20.54% | 59.46% | 48.50% |
| Net assets at end of period (000) | $ 219,356 | $ 184,497 | $ 104,710 | $ 56,036 | $ 31,520 | $ 41,050 |
(a) Sales loads are not reflected in computing total return, which is not annualized for periods less than one year.
(b) Annualized.
19
| Financial highlights, continued | ||||||
|---|---|---|---|---|---|---|
| Thornburg Limited Term Income Fund | ||||||
| Six Months Ended | Year Ended September 30, | |||||
| March 31, 2004 | 2003 | 2002 | 2001 | 2000 | 1999 | |
| Class C Shares: | ||||||
| Per Share Performance | ||||||
| (for a share outstanding throughout the period) | ||||||
| Net asset value, beginning of period | $ 12.97 | $ 12.77 | $ 12.53 | $ 11.87 | $ 11.91 | $ 12.47 |
| Income from investment operations: | ||||||
| Net investment income | 0.20 | 0.46 | 0.56 | 0.68 | 0.68 | 0.64 |
| Net realized and unrealized | ||||||
| gain (loss) on investments | 0.05 | 0.20 | 0.24 | 0.66 | (0.04) | (0.56) |
| Total from investment operations | 0.25 | 0.66 | 0.80 | 1.34 | 0.64 | 0.08 |
| Less dividends from: | ||||||
| Net investment income | (0.20) | (0.46) | (0.56) | (0.68) | (0.68) | (0.59) |
| Return of Capital | -- | -- | -- | -- | -- | (0.05) |
| Change in net asset value | 0.05 | 0.20 | 0.24 | 0.66 | (0.04) | (0.56) |
| Net asset value, end of period | $ 13.02 | $ 12.97 | $ 12.77 | $ 12.53 | $ 11.87 | $ 11.91 |
| Total return (a) | 2.02% | 5.20% | 6.63% | 11.61% | 5.62% | 0.68% |
| Ratios/Supplemental Data | ||||||
| Ratios to average net assets: | ||||||
| Net investment income | 3.07% (b) | 3.56% | 4.45% | 5.52% | 5.81% | 5.28% |
| Expenses, after expense reductions | 1.25% (b) | 1.33% | 1.39% | 1.41% | 1.40% | 1.40% |
| Expenses, after expense reductions | ||||||
| and net of custody credits | 1.24% (b) | 1.33% | 1.39% | -- | -- | -- |
| Expenses, before expense reductions | 1.89% (b) | 1.92% | 1.93% | 2.13% | 2.26% | 2.22% |
| Portfolio turnover rate | 14.04% | 18.86% | 21.63% | 20.54% | 59.46% | 48.50% |
| Net assets at end of period (000) | $ 64,660 | $ 54,926 | $ 30,258 | $ 15,219 | $ 7,272 | $ 7,528 |
(a) Not annualized for periods less than one year.
(b) Annualized.
20
| Financial highlights, continued | ||||||
|---|---|---|---|---|---|---|
| Thornburg Limited Term Income Fund | ||||||
| Six Months Ended | Year Ended September 30, | |||||
| March 31, 2004 | 2003 | 2002 | 2001 | 2000 | 1999 | |
| Class I Shares: | ||||||
| Per Share Performance | ||||||
| (for a share outstanding throughout the period) | ||||||
| Net asset value, beginning of period | $ 12.99 | $ 12.79 | $ 12.55 | $ 11.90 | $ 11.93 | $ 12.50 |
| Income from investment operations: | ||||||
| Net investment income | 0.24 | 0.55 | 0.65 | 0.77 | 0.77 | 0.73 |
| Net realized and unrealized | ||||||
| gain (loss) on investments | 0.06 | 0.20 | 0.24 | 0.65 | (0.03) | (0.57) |
| Total from investment operations | 0.30 | 0.75 | 0.89 | 1.42 | 0.74 | 0.16 |
| Less dividends from: | ||||||
| Net investment income | (0.24) | (0.55) | (0.65) | (0.77) | (0.77) | (0.68) |
| Return of Capital | -- | -- | -- | -- | -- | (0.05) |
| Change in net asset value | 0.06 | 0.20 | 0.24 | 0.65 | (0.03) | (0.57) |
| Net asset value, end of period | $ 13.05 | $ 12.99 | $ 12.79 | $ 12.55 | $ 11.90 | $ 11.93 |
| Total return (a) | 2.39% | 5.89% | 7.38% | 12.29% | 6.46% | 1.32% |
| Ratios/Supplemental Data | ||||||
| Ratios to average net assets: | ||||||
| Net investment income | 3.17% (b) | 4.23% | 5.19% | 6.24% | 6.54% | 5.99% |
| Expenses, after expense reductions | 0.67% (b) | 0.69% | 0.69% | 0.70% | 0.69% | 0.69% |
| Expenses, after expense reductions | ||||||
| and net of custody credits | 0.67% (b) | 0.69% | 0.69% | -- | -- | -- |
| Expenses, before expense reductions | 0.71% (b) | 0.76% | 0.78% | 0.89% | 1.00% | 1.01% |
| Portfolio turnover rate | 14.04% | 18.86% | 21.63% | 20.54% | 59.46% | 48.50% |
| Net assets at end of period (000) | $ 91,400 | $ 59,473 | $ 39,281 | $ 24,298 | $ 12,094 | $ 9,928 |
(a) Not annualized for periods less than one year.
(b) Annualized.
21
| Financial Hightlights, Continued | ||
|---|---|---|
| Thornburg Limited Term Income Fund | ||
| Six Months Ended March 31, 2004 | Period Ended September 30, 2003(c) | |
| Class R-1 Shares: | ||
| Per Share Performance | ||
| (for a share outstanding throughout the period) | ||
| Net asset value, beginning of period | $ 12.99 | $ 13.10 |
| Income from investment operations: | ||
| Net investment income | 0.24 | 0.17 |
| Net realized and unrealized | ||
| gain (loss) on investments | 0.06 | (0.11) |
| Total from investment operations | 0.30 | 0.06 |
| Less dividends from: | ||
| Net investment income | (0.24) | (0.17) |
| Change in net asset value | 0.06 | (0.11) |
| Net asset value, end of period | $ 13.05 | $ 12.99 |
| Total return (a) | 2.33% | 0.48% |
| Ratios/Supplemental Data | ||
| Ratios to average net assets: | ||
| Net investment income | 3.17%(b) | 5.19%(b) |
| Expenses, after expense reductions | 1.05%(b) | 1.25%(b) |
| Expenses, after expense reductions | ||
| and net of custody credits | 1.05%(b) | 1.25%(b) |
| Expenses, before expense reductions | 72.88%(b)* | 41,534.94%(b)* |
| Portfolio turnover rate | 14.04% | 18.86% |
| Net assets at end of year (000) | $ 58 | - (d) |
(a) Not annualized for periods less than one year.
(b) Annualized.
(c) Effective date of Class R-1 Shares was July 1, 2003.
(d) Net assets at end of year were less than $1,000.
* Due to the size of net assets and fixed expenses, ratios may appear disproportionate.
22
| SCHEDULE OF INVESTMENTS | ||||||||
|---|---|---|---|---|---|---|---|---|
| Thornburg Limited Term U.S. Governemnt Fund | March 31, 2004 | |||||||
| CUSIPS: CLASS A - 885-215-103, CLASS B - 885-215-848, CLASS C - 885-215-830, CLASS I - 885-215-699, CLASS R-1 - 885-215-491 NASDAQ SYMBOLS: CLASS A - LTUSX, CLASS B - LTUBX, CLASS C - LTUCX, CLASS I - LTUIX, CLASS R-1 - LTURX | ||||||||
| Security Name | Principal Amount | Value | ||||||
| U.S. Government Agencies (41.20%) | ||||||||
| Federal Agricultural Mortgage Corp., 5.86% due 3/3/2006 | 900,000 | $ | 970,318 | |||||
| Federal Agricultural Mortgage Corp., 8.07% due 7/17/2006 | 1,000,000 | 1,139,308 | ||||||
| Federal Agricultural Mortgage Corp., 6.71% due 7/28/2014 | 200,000 | 238,709 | ||||||
| Federal Farm Credit Bank, 1.875% due 1/16/2007 | 4,650,000 | 4,617,258 | ||||||
| Federal Farm Credit Bank, 6.75% due 7/7/2009 | 350,000 | 410,216 | ||||||
| Federal Farm Credit Bank Consolidated MTN, 5.875% due 7/28/2008 | 1,900,000 | 2,139,419 | ||||||
| Federal Farm Credit Bank Consolidated MTN, 5.87% due 9/2/2008 | 1,300,000 | 1,464,011 | ||||||
| Federal Farm Credit Bank Consolidated MTN, 5.35% due 12/11/2008 | 200,000 | 220,875 | ||||||
| Federal Farm Credit Bank Consolidated MTN, 5.80% due 3/19/2009 | 300,000 | 337,471 | ||||||
| Federal Farm Credit Bank Consolidated MTN, 6.06% due 5/28/2013 | 240,000 | 274,735 | ||||||
| Federal Home Loan Bank, 6.55% due 3/7/2005 | 265,000 | 277,997 | ||||||
| Federal Home Loan Bank, 6.345% due 11/1/2005 | 100,000 | 107,478 | ||||||
| Federal Home Loan Bank, 5.24% due 12/7/2005 | 225,000 | 238,524 | ||||||
| Federal Home Loan Bank, 5.37% due 1/20/2006 | 100,000 | 106,542 | ||||||
| Federal Home Loan Bank, 2.25% due 5/15/2006 | 3,000,000 | 3,025,783 | ||||||
| Federal Home Loan Bank, 6.09% due 6/2/2006 | 100,000 | 108,981 | ||||||
| Federal Home Loan Bank, 7.76% due 11/21/2006 | 200,000 | 229,385 | ||||||
| Federal Home Loan Bank, 6.37% due 9/26/2007 | 1,000,000 | 1,132,900 | ||||||
| Federal Home Loan Bank, 6.075% due 1/2/2008 | 475,000 | 535,472 | ||||||
| Federal Home Loan Bank, 7.00% due 2/15/2008 | 150,000 | 174,437 | ||||||
| Federal Home Loan Bank, 5.98% due 6/18/2008 | 2,050,000 | 2,313,695 | ||||||
| Federal Home Loan Bank, 5.015% due 10/8/2008 | 570,000 | 620,946 | ||||||
| Federal Home Loan Bank, 5.53% due 11/24/2008 | 225,000 | 250,053 | ||||||
| Federal Home Loan Bank, 5.48% due 1/8/2009 | 1,250,000 | 1,386,320 | ||||||
| Federal Home Loan Bank, 5.67% due 2/26/2009 | 1,465,000 | 1,637,218 | ||||||
| Federal Home Loan Bank, 5.70% due 3/3/2009 | 3,000,000 | 3,357,679 | ||||||
| Federal Home Loan Bank, 5.985% due 4/9/2009 | 3,000,000 | 3,397,657 | ||||||
| Federal Home Loan Bank, 5.79% due 4/27/2009 | 200,000 | 224,702 | ||||||
| Federal Home Loan Mortgage Corp., 5.98% due 12/8/2005 | 75,000 | 80,462 | ||||||
| Federal Home Loan Mortgage Corp., 6.80% due 3/19/2007 | 300,000 | 340,231 | ||||||
| Federal Home Loan Mortgage Corp., 3.80% due 10/15/2008 | 500,000 | 503,968 | ||||||
| Federal Home Loan Mortgage Corp., Pool # 141016, 9.25% due 11/1/2016 | 103,904 | 117,131 | ||||||
| Federal Home Loan Mortgage Corp., Pool # 141412, 8.50% due 4/1/2017 | 283,347 | 313,079 | ||||||
| Federal Home Loan Mortgage Corp., Pool # 160043, 8.75% due 4/1/2008 | 27,811 | 29,700 | ||||||
| Federal Home Loan Mortgage Corp., Pool # 181730, 8.50% due 5/1/2008 | 35,554 | 37,523 | ||||||
| Federal Home Loan Mortgage Corp., Pool # 200075, 9.00% due 9/1/2004 | 245 | 249 | ||||||
| Federal Home Loan Mortgage Corp., Pool # 252986, 10.75% due 4/1/2010 | 47,116 | 53,502 | ||||||
| Federal Home Loan Mortgage Corp., Pool # 256764, 8.75% due 10/1/2014 | 25,715 | 27,490 | ||||||
| Federal Home Loan Mortgage Corp., Pool # 260486, 9.00% due 1/1/2010 | 18,575 | 19,867 | ||||||
| Federal Home Loan Mortgage Corp., Pool # 273822, 8.50% due 4/1/2009 | 136,105 | 143,821 | ||||||
| Federal Home Loan Mortgage Corp., Pool # 291880, 8.25% due 5/1/2017 | 6,663 | 7,000 | ||||||
| Federal Home Loan Mortgage Corp., Pool # 294817, 9.75% due 1/1/2017 | 68,506 | 77,158 | ||||||
| Federal Home Loan Mortgage Corp., Pool # 298107, 10.25% due 8/1/2017 | 29,371 | 34,494 | ||||||
| Federal Home Loan Mortgage Corp., Pool # 770297, 3.75% due 6/1/2018 | 135,364 | 136,578 | ||||||
| Federal Home Loan Mortgage Corp., Pool # C90041, 6.50% due 11/1/2013 | 91,271 | 96,458 | ||||||
| Federal Home Loan Mortgage Corp., Pool # D06907, 9.00% due 4/1/2017 | 10,632 | 11,543 | ||||||
| Federal Home Loan Mortgage Corp., Pool # D06908, 9.50% due 9/1/2017 | 30,345 | 33,015 | ||||||
23
| SCHEDULE OF INVESTMENTS, CONTINUED Thornburg Limited Term U.S. Governemnt Fund | March 31, 2004 | |||||||
|---|---|---|---|---|---|---|---|---|
| Federal Home Loan Mortgage Corp., Pool # D37120, 7.00% due 7/1/2023 | $ | 113,717 | $ | 121,299 | ||||
| Federal Home Loan Mortgage Corp., Pool # E00170, 8.00% due 7/1/2007 | 103,617 | 109,565 | ||||||
| Federal Home Loan Mortgage Corp., Pool # E49074, 6.50% due 7/1/2008 | 74,118 | 78,916 | ||||||
| Federal Home Loan Mortgage Corp., Pool # E61778, 6.50% due 4/1/2008 | 100,684 | 107,201 | ||||||
| Federal Home Loan Mortgage Corp., Pool # E65962, 7.00% due 5/1/2008 | 9,699 | 10,382 | ||||||
| Federal Home Loan Mortgage Corp. CMO Series 2137 Class TM, 6.50% due 1/15/2028 | 272,792 | 278,171 | ||||||
| Federal Home Loan Mortgage Corp. CMO Series 2603 Class TN, 4.00% due | 4,500,000 | 4,537,658 | ||||||
| 10/15/2011 | ||||||||
| Federal National Mortgage Association, Pool # 008307, 8.00% due 5/1/2008 | 141,274 | 150,365 | ||||||
| Federal National Mortgage Association, Pool # 019535, 10.25% due 7/1/2008 | 12,826 | 14,101 | ||||||
| Federal National Mortgage Association, Pool # 033356, 9.25% due 8/1/2016 | 104,170 | 115,739 | ||||||
| Federal National Mortgage Association, Pool # 040526, 9.25% due 1/1/2017 | 8,165 | 8,715 | ||||||
| Federal National Mortgage Association, Pool # 044003, 8.00% due 6/1/2017 | 114,806 | 124,739 | ||||||
| Federal National Mortgage Association, Pool # 050811, 7.50% due 12/1/2012 | 97,877 | 104,376 | ||||||
| Federal National Mortgage Association, Pool # 050832, 7.50% due 6/1/2013 | 147,520 | 157,361 | ||||||
| Federal National Mortgage Association, Pool # 076388, 9.25% due 9/1/2018 | 136,831 | 153,442 | ||||||
| Federal National Mortgage Association, Pool # 077725, 9.75% due 10/1/2018 | 53,827 | 58,916 | ||||||
| Federal National Mortgage Association, Pool # 100286, 7.50% due 8/1/2009 | 343,887 | 366,197 | ||||||
| Federal National Mortgage Association, Pool # 112067, 9.50% due 10/1/2016 | 75,619 | 84,578 | ||||||
| Federal National Mortgage Association, Pool # 156156, 8.50% due 4/1/2021 | 98,189 | 106,340 | ||||||
| Federal National Mortgage Association, Pool # 190555, 7.00% due 1/1/2014 | 85,415 | 90,710 | ||||||
| Federal National Mortgage Association, Pool # 190703, 7.00% due 3/1/2009 | 82,588 | 88,585 | ||||||
| Federal National Mortgage Association, Pool # 190836, 7.00% due 6/1/2009 | 190,968 | 204,836 | ||||||
| Federal National Mortgage Association, Pool # 250387, 7.00% due 11/1/2010 | 134,795 | 144,668 | ||||||
| Federal National Mortgage Association, Pool # 250481, 6.50% due 11/1/2015 | 86,111 | 91,046 | ||||||
| Federal National Mortgage Association, Pool # 251258, 7.00% due 9/1/2007 | 88,772 | 94,686 | ||||||
| Federal National Mortgage Association, Pool # 251759, 6.00% due 5/1/2013 | 193,332 | 204,524 | ||||||
| Federal National Mortgage Association, Pool # 252648, 6.50% due 5/1/2022 | 537,772 | 567,223 | ||||||
| Federal National Mortgage Association, Pool # 252787, 7.00% due 8/1/2006 | 55,898 | 57,879 | ||||||
| Federal National Mortgage Association, Pool # 303383, 7.00% due 12/1/2009 | 141,475 | 151,749 | ||||||
| Federal National Mortgage Association, Pool # 312663, 7.50% due 6/1/2010 | 153,101 | 164,451 | ||||||
| Federal National Mortgage Association, Pool # 323706, 7.00% due 2/1/2009 | 245,498 | 263,326 | ||||||
| Federal National Mortgage Association, Pool # 334996, 7.00% due 2/1/2011 | 122,448 | 131,417 | ||||||
| Federal National Mortgage Association, Pool # 342947, 7.25% due 4/1/2024 | 698,503 | 749,554 | ||||||
| Federal National Mortgage Association, Pool # 345775, 8.50% due 12/1/2024 | 64,959 | 70,478 | ||||||
| Federal National Mortgage Association, Pool # 373942, 6.50% due 12/1/2008 | 105,016 | 111,945 | ||||||
| Federal National Mortgage Association, Pool # 380488, 6.10% due 7/1/2008 | 1,850,610 | 2,057,371 | ||||||
| Federal National Mortgage Association, Pool # 380633, 6.18% due 9/1/2008 | 2,793,576 | 3,117,641 | ||||||
| Federal National Mortgage Association, Pool # 381146, 6.04% due 1/1/2009 | 1,724,884 | 1,919,040 | ||||||
| Federal National Mortgage Association, Pool # 382450, 7.86% due 6/1/2010 | 899,187 | 1,093,920 | ||||||
| Federal National Mortgage Association, Pool # 382616, 7.40% due 8/1/2010 | 1,287,268 | 1,536,569 | ||||||
| Federal National Mortgage Association, Pool # 382709, 7.40% due 8/1/2008 | 1,067,187 | 1,233,851 | ||||||
| Federal National Mortgage Association, Pool # 382889, 7.595% due 12/1/2010 | 307,015 | 351,720 | ||||||
| Federal National Mortgage Association, Pool # 382926, 7.615% due 12/1/2010 | 341,381 | 391,367 | ||||||
| Federal National Mortgage Association, Pool # 383849, 6.871% due 8/1/2011 | 1,805,429 | 2,092,193 | ||||||
| Federal National Mortgage Association, Pool # 384193, 6.375% due 9/1/2011 | 1,052,547 | 1,191,148 | ||||||
| Federal National Mortgage Association, Pool # 384243, 6.303% due 10/1/2011 | 627,367 | 695,295 | ||||||
| Federal National Mortgage Association, Pool # 384746, 5.86% due 2/1/2009 | 1,075,425 | 1,193,184 | ||||||
| Federal National Mortgage Association, Pool # 385263, 5.41% due 11/1/2006 | 1,469,079 | 1,569,007 | ||||||
| Federal National Mortgage Association, Pool # 385714, 4.70% due 1/1/2010 | 3,235,215 | 3,413,728 | ||||||
| Federal National Mortgage Association, Pool # 406384, 8.25% due 12/1/2024 | 372,905 | 405,634 | ||||||
| Federal National Mortgage Association, Pool # 443909, 6.50% due 9/1/2018 | 451,119 | 477,688 | ||||||
24
| SCHEDULE OF INVESTMENTS, CONTINUED Thornburg Limited Term U.S. Governemnt Fund | March 31, 2004 | |||||||
|---|---|---|---|---|---|---|---|---|
| Federal National Mortgage Association, Pool # 460568, 5.20% due 12/1/2006 | $ | 3,500,000 | $ | 3,735,927 | ||||
| Federal National Mortgage Association, Pool # 516363, 5.00% due 3/1/2014 | 727,160 | 750,594 | ||||||
| Federal National Mortgage Association, Pool # 555207, 7.00% due 11/1/2017 | 454,521 | 487,527 | ||||||
| Federal National Mortgage Association CMO Series 1992-22 Class HC, 7.00% due | 313,261 | 323,755 | ||||||
| 3/25/2007 | ||||||||
| Federal National Mortgage Association CMO Series 1993-101 Class PJ, 7.00% due | 750,000 | 797,732 | ||||||
| 6/25/2008 | ||||||||
| Federal National Mortgage Association CMO Series 1993-122 Class D, 6.50% due | 250,000 | 260,067 | ||||||
| 6/25/2023 | ||||||||
| Federal National Mortgage Association CMO Series 1993-32 Class H, 6.00% due | 330,193 | 343,317 | ||||||
| 3/25/2023 | ||||||||
| Federal National Mortgage Association CMO Series G1993-35 Class JD, 6.50% due | 981,706 | 1,016,480 | ||||||
| 11/25/2006 | ||||||||
| Federal National Mortgage Association CPI Floating Rate, 3.00% due 2/17/2009 | 3,000,000 | 3,049,050 | ||||||
| Government National Mortgage Association, Pool # 000623, 8.00% due 9/20/2016 | 100,798 | 109,606 | ||||||
| Government National Mortgage Association, Pool # 016944, 7.50% due 5/15/2007 | 130,659 | 140,964 | ||||||
| Government National Mortgage Association, Pool # 296697, 9.50% due 10/15/2005 | 35,868 | 37,234 | ||||||
| Government National Mortgage Association, Pool # 306636, 8.25% due 12/15/2006 | 66,852 | 70,893 | ||||||
| Government National Mortgage Association, Pool # 357090, 6.80% due 4/20/2025 | 108,726 | 115,867 | ||||||
| Government National Mortgage Association, Pool # 369693, 7.00% due 1/15/2009 | 194,835 | 210,445 | ||||||
| Government National Mortgage Association, Pool # 409921, 7.50% due 8/15/2010 | 128,108 | 138,407 | ||||||
| Government National Mortgage Association, Pool # 410240, 7.00% due 12/15/2010 | 82,838 | 89,422 | ||||||
| Government National Mortgage Association, Pool # 410271, 7.50% due 8/15/2010 | 85,138 | 91,982 | ||||||
| Government National Mortgage Association, Pool # 410846, 7.00% due 12/15/2010 | 125,707 | 135,700 | ||||||
| Government National Mortgage Association, Pool # 430150, 7.25% due 12/15/2026 | 158,653 | 170,933 | ||||||
| Government National Mortgage Association, Pool # 447040, 7.75% due 5/15/2027 | 173,955 | 189,751 | ||||||
| Government National Mortgage Association, Pool # 453928, 7.00% due 7/15/2017 | 174,379 | 186,967 | ||||||
| Government National Mortgage Association, Pool # 780063, 7.00% due 9/15/2008 | 59,822 | 64,615 | ||||||
| Government National Mortgage Association, Pool # 780448, 6.50% due 8/15/2011 | 264,772 | 284,640 | ||||||
| Government National Mortgage Association CMO Series 2002-67 Class VA, 6.00% | 267,775 | 280,072 | ||||||
| due 3/20/2013 | ||||||||
| Government National Mortgage Association CMO Series 2003-31 Class YA, 4.00% | 1,409,342 | 1,426,029 | ||||||
| due 5/16/2021 | ||||||||
| Government National Mortgage Association CMO Series 2003-67 Class PN, 4.00% | 3,196,066 | 3,242,175 | ||||||
| due 11/20/2020 | ||||||||
| Guaranteed Export Trust 1995-A Certificate, 6.28% due 6/15/2004 | 51,765 | 52,330 | ||||||
| Overseas Private Investment Corp., 4.10% due 11/15/2014 | 2,750,400 | 2,801,255 | ||||||
| Private Export Funding Corp., 4.974% due 8/15/2013 | 1,000,000 | 1,055,750 | ||||||
| Private Export Funding Corp. Secured Note Series M, 5.34% due 3/15/2006 | 2,000,000 | 2,137,384 | ||||||
| Private Export Funding Corp. Secured Note Series P, 5.685% due 5/15/2012 | 1,000,000 | 1,110,986 | ||||||
| Tennessee Valley Authority, 4.75% due 8/1/2013 | 3,000,000 | 3,121,566 | ||||||
| United States Government General Services, 7.62% due 9/15/2010 | 1,790,817 | 2,086,302 | ||||||
| Total U.S. Government Agencies (Cost $89,840,887) | 95,731,576 | |||||||
| United States Treasury-- 54.10% | ||||||||
| United States Treasury Notes, 7.25% due 5/15/2004 | 7,750,000 | 7,808,125 | ||||||
| United States Treasury Notes, 7.25% due 8/15/2004 | 3,700,000 | 3,786,140 | ||||||
| United States Treasury Notes, 1.50% due 2/28/2005 | 10,000,000 | 10,034,375 | ||||||
| United States Treasury Notes, 6.50% due 5/15/2005 | 4,900,000 | 5,187,875 | ||||||
| United States Treasury Notes, 6.50% due 8/15/2005 | 4,500,000 | 4,819,922 | ||||||
| United States Treasury Notes, 5.75% due 11/15/2005 | 7,000,000 | 7,486,718 | ||||||
| United States Treasury Notes, 5.625% due 2/15/2006 | 3,000,000 | 3,228,750 | ||||||
| United States Treasury Notes, 4.625% due 5/15/2006 | 5,500,000 | 5,842,891 | ||||||
| United States Treasury Notes, 7.00% due 7/15/2006 | 2,000,000 | 2,237,188 | ||||||
| United States Treasury Notes, 4.375% due 5/15/2007 | 9,000,000 | 9,627,188 | ||||||
| United States Treasury Notes, 6.125% due 8/15/2007 | 4,000,000 | 4,515,000 | ||||||
| United States Treasury Notes, 2.625% due 5/15/2008 | 10,000,000 | 10,062,500 | ||||||
| United States Treasury Notes, 5.50% due 5/15/2009 | 10,000,000 | 11,298,438 | ||||||
25
| SCHEDULE OF INVESTMENTS, CONTINUED Thornburg Limited Term U.S. Governemnt Fund | March 31, 2004 | |||||||
|---|---|---|---|---|---|---|---|---|
| United States Treasury Notes, 6.50% due 2/15/2010 | 15,000,000 | $ | 17,786,718 | |||||
| United States Treasury Notes, 5.75% due 8/15/2010 | 6,000,000 | 6,889,687 | ||||||
| United States Treasury Notes, 3.625% due 5/15/2013 | 15,000,000 | 14,906,250 | ||||||
| Total United States Treasury (Cost $123,977,709) | 125,517,765 | |||||||
| Short Term Investments-- 4.70% | ||||||||
| Federal Home Loan Mortgage Discount Notes, 0.97% due 4/1/2004 | 7,000,000 | 7,000,000 | ||||||
| Inter-American Development Bank Discount Notes, 0.97% due 4/8/2004 | 4,000,000 | 3,999,246 | ||||||
| Total Short Term Investments (Cost $10,999,246) | 10,999,246 | |||||||
| TOTAL INVESTMENTS (100%) (Cost $224,817,842) | $ | 232,248,587 | ||||||
| See notes to financial statements | ||||||||
26
| SCHEDULE OF INVESTMENTS, CONTINUED | |||||||||||
|---|---|---|---|---|---|---|---|---|---|---|---|
| Thornburg Limited Term Income Fund | March 31, 2004 | ||||||||||
| CUSIPS: CLASS A - 885-215-509, CLASS C - 885-215-764, CLASS I - 885-215-681, CLASS R-1 - 885-215-483 NASDAQ SYMBOLS: CLASS A - THIFX, CLASS C - THICX, CLASS I - THIIX, CLASS R-1 - THIRX | |||||||||||
| Security Name | Credit Rating† Moody’s/S&P | Principal Amount | Value | ||||||||
| U.S. TREASURY SECURITIES - 4.00% | |||||||||||
| United States Treasury Notes, 6.50% due 5/15/2005 | Aaa/AAA | $ | 1,100,000 | $ | 1,164,625 | ||||||
| United States Treasury Notes, 4.625% due 5/15/2006 | Aaa/AAA | 4,500,000 | 4,780,547 | ||||||||
| United States Treasury Notes, 4.75% due 11/15/2008 | Aaa/AAA | 1,500,000 | 1,636,406 | ||||||||
| United States Treasury Notes, 5.75% due 8/15/2010 | Aaa/AAA | 2,500,000 | 2,870,703 | ||||||||
| United States Treasury Notes, 3.625% due 5/15/2013 | Aaa/AAA | 5,000,000 | 4,968,750 | ||||||||
| Total U.S. Treasury Securities (Cost $14,705,729) | -- | -- | 15,421,031 | ||||||||
| �� U. S. GOVERNMENT AGENCIES - 8.60% | |||||||||||
| Export Funding Trust Series 1994-A Pass Through Certificate, 7.89% due 2/15/2005 | Aaa/AAA | 140,000 | 146,037 | ||||||||
| Federal Farm Credit Bank, 5.96% due 6/16/2008 | Aaa/AAA | 710,000 | 801,337 | ||||||||
| Federal Home Loan Bank, 6.00% due 8/25/2005 | Aaa/AAA | 50,000 | 53,145 | ||||||||
| Federal Home Loan Bank, 2.25% due 5/15/2006 | Aaa/AAA | 2,000,000 | 2,017,189 | ||||||||
| Federal Home Loan Bank, 4.875% due 5/15/2007 | Aaa/AAA | 150,000 | 161,960 | ||||||||
| Federal Home Loan Bank, 5.833% due 1/23/2008 | Aaa/AAA | 500,000 | 559,641 | ||||||||
| Federal Home Loan Bank, 5.785% due 4/14/2008 | Aaa/AAA | 75,000 | 83,959 | ||||||||
| Federal Home Loan Bank, 5.835% due 7/15/2008 | Aaa/AAA | 300,000 | 336,953 | ||||||||
| Federal Home Loan Bank, 5.48% due 9/22/2008 | Aaa/AAA | 480,000 | 532,372 | ||||||||
| Federal Home Loan Bank, 5.085% due 10/7/2008 | Aaa/AAA | 250,000 | 273,086 | ||||||||
| Federal Home Loan Bank, 5.038% due 10/14/2008 | Aaa/AAA | 200,000 | 218,060 | ||||||||
| Federal Home Loan Bank, 5.365% due 12/11/2008 | Aaa/AAA | 75,000 | 82,808 | ||||||||
| Federal Home Loan Bank, 5.985% due 4/9/2009 | Aaa/AAA | 85,000 | 96,267 | ||||||||
| Federal Home Loan Bank, 3.00% due 10/21/2009 | Aaa/AAA | 1,650,000 | 1,661,944 | ||||||||
| Federal Home Loan Mortgage Corp., 4.30% due 9/3/2008 | Aaa/AAA | 2,000,000 | 2,027,232 | ||||||||
| Federal Home Loan Mortgage Corp., Pool # 850082, 9.00% due 10/1/2005 | Aaa/AAA | 8,670 | 9,000 | ||||||||
| Federal National Mortgage Association, 2.00% due 12/15/2006 | Aaa/AAA | 6,495,000 | 6,512,157 | ||||||||
| Federal National Mortgage Association, 2.50% due 1/24/2008 | Aaa/AAA | 3,500,000 | 3,518,769 | ||||||||
| Federal National Mortgage Association, 3.50% due 12/25/2008 | Aaa/AAA | 189,507 | 189,585 | ||||||||
| Federal National Mortgage Association, Pool # 020155, 7.491% due 8/1/2014 | Aaa/AAA | 40,984 | 42,271 | ||||||||
| Federal National Mortgage Association, Pool # 190534, 6.00% due 12/1/2008 | Aaa/AAA | 175,005 | 184,917 | ||||||||
| Federal National Mortgage Association, Pool # 297033, 8.00% due 12/1/2009 | Aaa/AAA | 47,336 | 50,992 | ||||||||
| Federal National Mortgage Association, Pool # 303777, 7.00% due 3/1/2011 | Aaa/AAA | 91,072 | 97,743 | ||||||||
| Federal National Mortgage Association, Pool # 382398, 8.00% due 5/1/2011 | Aaa/AAA | 584,537 | 686,497 | ||||||||
| Federal National Mortgage Association, Pool # 383398, 6.42% due 4/1/2011 | Aaa/AAA | 2,425,318 | 2,717,716 | ||||||||
| Federal National Mortgage Association, Pool # 384471, 5.185% due 11/1/2008 | Aaa/AAA | 478,081 | 515,616 | ||||||||
| Federal National Mortgage Association, Pool # 384521, 5.095% due 12/1/2011 | Aaa/AAA | 129,472 | 138,449 | ||||||||
| Federal National Mortgage Association, Pool # 460568, 5.20% due 12/1/2006 | Aaa/AAA | 800,000 | 853,926 | ||||||||
| Federal National Mortgage Association CPI Floating Rate, 3.00% due 2/17/2009 | Aaa/AAA | 5,000,000 | 5,081,750 | ||||||||
| Government National Mortgage Association, Pool # 003007, 8.50% due 11/20/2015 | Aaa/AAA | 63,036 | 69,482 | ||||||||
| Government National Mortgage Association, Pool # 827148, 4.375% due 2/20/2024 | Aaa/AAA | 42,559 | 43,327 | ||||||||
| Government National Mortgage Association CMO Series 2003-67 Class PN, 4.00% due 11/20/2020 | Aaa/AAA | 3,247,209 | 3,294,056 | ||||||||
| Total U. S. Government Agencies (Cost $32,357,864) | -- | -- | 33,058,243 | ||||||||
| ASSET BACKED SECURITIES - 0.50% | |||||||||||
| Associates Manufactured Housing Trust 1996-1 A5, 7.60% due 3/15/2027 | Aaa/AAA | 726,338 | 768,454 | ||||||||
| Bank of America Mortgage Secs Inc. Series 02-7, Class-2 A4, 5.75% due 8/25/2032 | Aa2/NA | 84,835 | 86,685 | ||||||||
27
| SCHEDULE OF INVESTMENTS, CONTINUED Thornburg Limited Term Income Fund | March 31, 2004 | ||||||||||
|---|---|---|---|---|---|---|---|---|---|---|---|
| Chase Credit Card Owner Trust 2001-5 A, 1.194% due 2/15/2007 | Aaa/AAA | $ | 250,000 | $ | 250,137 | ||||||
| Chase Mortgage Finance Trust 1999-S9 A3, 6.25% due 7/25/2014 | NA/AAA | 128,213 | 131,641 | ||||||||
| CNH Equipment Trust, 1.344% due 7/17/2006 | Aaa/AAA | 498,492 | 499,028 | ||||||||
| Green Tree Financial Corp. 93-2 Mfd Housing Sr/Sub Certificate Class-A4, 6.90% due 7/15/2018 | Aaa/NR | 28,919 | 29,192 | ||||||||
| Washington Mutual Series 02-AR10, Class-A6, 4.816% due 10/25/2032 | Aaa/AAA | 141,667 | 143,690 | ||||||||
| Total Asset Backed Securities (Cost $1,882,581) | -- | -- | 1,908,827 | ||||||||
| CORPORATE BONDS - 63.70% | |||||||||||
| BANKS | |||||||||||
| Bank of America Corp., 4.375% due 12/1/2010 | Aa2/A+ | 1,675,000 | 1,726,010 | ||||||||
| Capital One Bank, 6.70% due 5/15/2008 | Baa2/BBB- | 1,665,000 | 1,865,273 | ||||||||
| Fifth Third Bank, Cincinnati Ohio, 3.375% due 8/15/2008 | Aa1/AA- | 2,500,000 | 2,534,795 | ||||||||
| HSBC USA Inc., 8.375% due 2/15/2007 | A1/A+ | 700,000 | 816,293 | ||||||||
| KeyCorp, 8.00% due 7/1/2004 | A3/BBB+ | 500,000 | 507,810 | ||||||||
| Marshall & Ilsley Corp., 2.625% due 2/9/2007 | Aa3/A+ | 2,500,000 | 2,525,358 | ||||||||
| Mercantile Bancorp, 7.30% due 6/15/2007 | A1/A | 1,000,000 | 1,152,898 | ||||||||
| National City Bank, 2.70% due 8/24/2009 | Aa3/A+ | 1,195,000 | 1,195,311 | ||||||||
| Nations Bank Corp. Medium Term Note, 7.23% due 8/15/2012 | Aa2/A+ | 250,000 | 295,954 | ||||||||
| Northern Trust Co. Medium Term Note, 6.25% due 6/2/2008 | A1/A+ | 500,000 | 558,077 | ||||||||
| PNC Funding Corp., 6.875% due 7/15/2007 | A3/BBB+ | 95,000 | 107,572 | ||||||||
| Suntrust Bank Atlanta Georgia Medium Term Note, 2.50% due 5/4/2006 | Aa2/AA- | 2,200,000 | 2,231,277 | ||||||||
| Union Planters Corp., 6.75% due 11/1/2005 | A3/BBB- | 120,000 | 129,418 | ||||||||
| United States Central Credit Union, 2.75% due 5/30/2008 | Aa1/AAA | 2,900,000 | 2,861,966 | ||||||||
| US Bank, 5.625% due 11/30/2005 | Aa2/AA- | 385,000 | 412,481 | ||||||||
| US Bank, 6.30% due 7/15/2008 | Aa3/A+ | 400,000 | 452,818 | ||||||||
| -- | -- | -- | 19,373,311 | ||||||||
| CAPITAL GOODS | |||||||||||
| Caterpillar Financial Services Corp., 6.40% due 2/15/2008 | A2/A | 250,000 | 276,543 | ||||||||
| Caterpillar Financial Services Corp., 3.45% due 1/15/2009 | A2/A | 2,400,000 | 2,426,532 | ||||||||
| Emerson Electric Co., 5.75% due 11/1/2011 | A2/A | 800,000 | 888,631 | ||||||||
| Gatx Capital Corp., 6.875% due 11/1/2004 | Baa3/BBB- | 600,000 | 616,439 | ||||||||
| General American Railcar Corp., 6.69% due 9/20/2016 | A3/AA- | 235,846 | 243,756 | ||||||||
| Hubbell Inc., 6.375% due 5/15/2012 | A3/A+ | 1,000,000 | 1,108,979 | ||||||||
| Illinois Tool Works Inc., 5.75% due 3/1/2009 | Aa3/AA- | 765,000 | 853,992 | ||||||||
| John Deere Capital Corp., 5.125% due 10/19/2006 | A3/A- | 450,000 | 482,524 | ||||||||
| John Deere Capital Corp. Medium Term Note, 3.75% due 1/13/2009 | A3/A- | 500,000 | 510,899 | ||||||||
| Johnson Controls Inc., 5.00% due 11/15/2006 | A2/A | 1,000,000 | 1,071,171 | ||||||||
| Pentair Inc., 7.85% due 10/15/2009 | Baa3/BBB | 1,000,000 | 1,160,975 | ||||||||
| Pitney Bowes Inc., 5.875% due 5/1/2006 | Aa3/AA | 900,000 | 970,271 | ||||||||
| Pitney Bowes Inc., 4.625% due 10/1/2012 | Aa3/NA | 900,000 | 925,776 | ||||||||
| Pitney Bowes Inc., 3.875% due 6/15/2013 | Aa3/AA | 2,000,000 | 1,931,482 | ||||||||
| -- | -- | -- | 13,467,970 | ||||||||
| COMMERCIAL SERVICES & SUPPLIES | |||||||||||
| Aramark Services Inc., 7.00% due 7/15/2006 | Baa3/BBB- | 250,000 | 274,406 | ||||||||
| Science Applications International Corp., 6.75% due 2/1/2008 | A3/A- | 250,000 | 282,834 | ||||||||
| Science Applications International Corp., 6.25% due 7/1/2012 | A3/A- | 1,000,000 | 1,119,831 | ||||||||
| Valassis Communications, 6.625% due 1/15/2009 | Baa3/BBB- | 1,700,000 | 1,878,194 | ||||||||
| Waste Management Inc., 6.50% due 11/15/2008 | Baa3/BBB | 1,000,000 | 1,126,680 | ||||||||
28
| SCHEDULE OF INVESTMENTS, CONTINUED Thornburg Limited Term Income Fund | March 31, 2004 | ||||||||||
|---|---|---|---|---|---|---|---|---|---|---|---|
| Waste Management Inc., 6.875% due 5/15/2009 | Baa3/BBB | 725,000 | $ | 828,342 | |||||||
| Waste Management Inc., 7.375% due 8/1/2010 | Baa3/BBB | 500,000 | 589,109 | ||||||||
| WMX Technologies Inc., 7.00% due 5/15/2005 | Baa3/BBB | 1,010,000 | 1,056,644 | ||||||||
| WMX Technologies Inc., 7.00% due 10/15/2006 | Baa3/BBB | 550,000 | 610,309 | ||||||||
| -- | -- | -- | 7,766,349 | ||||||||
| DIVERSIFIED FINANCIALS | |||||||||||
| American General Finance Corp. Medium Term Note, 4.625% due 9/1/2010 | A1/A+ | 200,000 | 208,383 | ||||||||
| American General Finance Corp. Medium Term Note, 4.00% due 3/15/2011 | A1/A+ | 1,500,000 | 1,493,734 | ||||||||
| Bear Stearns Cos Inc., 4.50% due 10/28/2010 | A1/A | 1,500,000 | 1,548,903 | ||||||||
| Beneficial Corp., 6.80% due 7/22/2005 | A1/A | 1,000,000 | 1,060,651 | ||||||||
| Berkshire Hathaway Finance Corp., 4.625% due 10/15/2013 | Aaa/AAA | 1,000,000 | 1,016,435 | ||||||||
| Dun & Bradstreet Corp., 6.625% due 3/15/2006 | NR/BBB+ | 75,000 | 80,305 | ||||||||
| Ford Motor Credit, 6.24% due 12/15/2004 | A3/BBB- | 150,000 | 153,329 | ||||||||
| General Electric Capital Corp., 5.00% due 2/15/2007 | Aaa/AAA | 2,900,000 | 3,112,097 | ||||||||
| General Electric Capital Corp., 1.547% due 5/30/2008 | Aaa/AAA | 494,000 | 493,292 | ||||||||
| General Electric Capital Corp., 7.75% due 6/9/2009 | Aaa/AAA | 200,000 | 240,456 | ||||||||
| General Electric Capital Corp., 7.375% due 1/19/2010 | Aaa/AAA | 400,000 | 479,690 | ||||||||
| General Electric Capital Corp., 4.25% due 12/1/2010 | Aaa/AAA | 2,000,000 | 2,046,736 | ||||||||
| Hartford Financial Services Group Inc. Senior Notes, 4.625% due 7/15/2013 | A3/A- | 1,000,000 | 1,002,910 | ||||||||
| Household Finance Corp., 5.20% due 8/15/2005 | A1/A | 400,000 | 415,253 | ||||||||
| Household Finance Corp., 5.90% due 5/15/2006 | A1/A | 100,000 | 105,797 | ||||||||
| Household Finance Corp., 7.20% due 7/15/2006 | A1/A | 550,000 | 610,628 | ||||||||
| Household Finance Corp., 5.75% due 1/30/2007 | A1/A | 400,000 | 435,654 | ||||||||
| Household Finance Corp., 6.40% due 9/15/2009 | A1/A | 400,000 | 434,622 | ||||||||
| International Lease Finance Corp., 4.55% due 10/15/2009 | A1/AA- | 2,500,000 | 2,608,413 | ||||||||
| International Lease Finance Corp. Medium Term Note, 5.95% due 6/6/2005 | A1/AA- | 950,000 | 998,083 | ||||||||
| Jefferies Group Inc. Senior Note Series B, 7.50% due 8/15/2007 | Baa2/BBB | 2,600,000 | 2,995,889 | ||||||||
| JP Morgan Chase Co., 4.50% due 11/15/2010 | A1/A+ | 1,465,000 | 1,511,162 | ||||||||
| Lehman Brothers Holdings Inc., 3.50% due 8/7/2008 | A1/A | 700,000 | 709,306 | ||||||||
| Merrill Lynch & Co. CPI Floating Rate, 3.04% due 3/2/2009 | Aa3/A+ | 3,000,000 | 3,034,200 | ||||||||
| Schwab Charles Corp. Medium Term Note, 6.30% due 4/28/2006 | A2/A- | 800,000 | 867,320 | ||||||||
| SLM Corp. Floating Rate, 1.561% due 9/15/2008 | A2/A | 1,675,000 | 1,674,568 | ||||||||
| SLM Corp. Medium Term Note CPI Floating Rate, 3.08% due 3/2/2009 | A2/A | 3,000,000 | 3,025,920 | ||||||||
| SLM Corp. Medium Term Note CPI Floating Rate, 4.00% due 1/31/2014 | A2/A | 9,500,000 | 9,717,550 | ||||||||
| Toyota Motor Credit Corp., 2.875% due 8/1/2008 | Aaa/AAA | 800,000 | 797,828 | ||||||||
| Toyota Motor Credit Corp., 4.35% due 12/15/2010 | Aaa/AAA | 800,000 | 830,854 | ||||||||
| Toyota Motor Credit Corp. Medium Term Note, 2.70% due 1/30/2007 | Aaa/AAA | 3,300,000 | 3,349,094 | ||||||||
| Wells Fargo & Co. Subordinated Note, 4.625% due 4/15/2014 | Aa2/A+ | 2,000,000 | 2,007,842 | ||||||||
| -- | -- | -- | 49,066,904 | ||||||||
| ENERGY | |||||||||||
| Allete Inc., 7.80% due 2/15/2008 | Baa2/BBB | 575,000 | 658,618 | ||||||||
| Amerenenergy Generating Co., 7.75% due 11/1/2005 | A3/A- | 850,000 | 926,228 | ||||||||
| Ashland Inc., 7.83% due 8/15/2005 | Baa2/BBB | 1,150,000 | 1,234,004 | ||||||||
| BJ Services Co. Note Series B, 7.00% due 2/1/2006 | Baa2/BBB+ | 75,000 | 80,038 | ||||||||
| Commonwealth Edison Co., 4.74% due 8/15/2010 | A3/A- | 975,000 | 1,028,288 | ||||||||
| El Paso Corp., 7.00% due 5/15/2011 | Caa1/CCC+ | 700,000 | 600,250 | ||||||||
| Enterprise Products Participating LP, 7.50% due 2/1/2011 | Baa2/BBB- | 250,000 | 291,118 | ||||||||
| EOG Resources Inc., 6.50% due 9/15/2004 | Baa1/BBB+ | 350,000 | 357,954 | ||||||||
| EOG Resources Inc., 6.00% due 12/15/2008 | Baa1/BBB+ | 450,000 | 502,810 | ||||||||
29
| SCHEDULE OF INVESTMENTS, CONTINUED Thornburg Limited Term Income Fund | March 31, 2004 | ||||||||||
|---|---|---|---|---|---|---|---|---|---|---|---|
| Kinder Morgan Energy Partners, 8.00% due 3/15/2005 | Baa1/BBB+ | 1,250,000 | $ | 1,320,357 | |||||||
| Louis Dreyfus Natural Gas Corp., 6.875% due 12/1/2007 | A3/BBB+ | 290,000 | 323,494 | ||||||||
| Murphy Oil Corp., 6.375% due 5/1/2012 | Baa1/A- | 750,000 | 847,523 | ||||||||
| Northern Border Pipeline Co., 6.25% due 5/1/2007 | A3/A- | 120,000 | 131,974 | ||||||||
| Occidental Petroleum Corp., 5.875% due 1/15/2007 | Baa1/BBB+ | 800,000 | 873,855 | ||||||||
| Occidental Petroleum Corp., 7.375% due 11/15/2008 | Baa1/BBB+ | 300,000 | 351,392 | ||||||||
| Occidental Petroleum Corp., 10.125% due 9/15/2009 | Baa1/BBB+ | 315,000 | 410,837 | ||||||||
| Oneok Inc., 7.75% due 3/1/2005 (Insured: MBIA) | Aaa/AAA | 250,000 | 265,406 | ||||||||
| Panenergy Corp., 7.00% due 10/15/2006 | Baa3/BBB- | 1,100,000 | 1,193,842 | ||||||||
| Phillips Petroleum Co., 8.75% due 5/25/2010 | A3/A- | 250,000 | 317,954 | ||||||||
| Phillips Petroleum Co., 9.375% due 2/15/2011 | A3/A- | 900,000 | 1,143,212 | ||||||||
| Questar Pipeline Co., 6.05% due 12/1/2008 | A2/A+ | 425,000 | 467,392 | ||||||||
| Rio Tinto Finance, 5.75% due 7/3/2006 | Aa3/A+ | 925,000 | 999,584 | ||||||||
| Smith International Inc. Senior Note, 7.00% due 9/15/2007 | Baa1/BBB+ | 600,000 | 682,135 | ||||||||
| Sonat Inc., 7.625% due 7/15/2011 | Caa1/CCC+ | 500,000 | 433,750 | ||||||||
| Texas Eastern Transmission Corp. Senior Note, 5.25% due 7/15/2007 | Baa2/BBB | 525,000 | 562,081 | ||||||||
| Transocean SedCo. Forex Inc., 6.75% due 4/15/2005 | Baa2/A- | 190,000 | 198,808 | ||||||||
| Transocean SedCo. Forex Inc., 6.95% due 4/15/2008 | Baa2/A- | 515,000 | 587,382 | ||||||||
| Transocean SedCo. Forex Inc., 6.625% due 4/15/2011 | Baa2/A- | 85,000 | 97,189 | ||||||||
| Union Oil Co. California, 7.90% due 4/18/2008 | Baa2/BBB+ | 200,000 | 229,818 | ||||||||
| -- | -- | -- | 17,117,293 | ||||||||
| FOOD BEVERAGE & TOBACCO | |||||||||||
| Anheuser Busch Co. Inc., 5.625% due 10/1/2010 | A1/A+ | 1,150,000 | 1,273,802 | ||||||||
| Anheuser Busch Co. Inc., 4.375% due 1/15/2013 | A1/A+ | 2,000,000 | 2,012,212 | ||||||||
| Coca Cola Co., 4.00% due 6/1/2005 | Aa3/A+ | 515,000 | 529,347 | ||||||||
| Coca Cola Co., 5.75% due 3/15/2011 | Aa3/A+ | 200,000 | 223,247 | ||||||||
| Conagra Inc., 7.50% due 9/15/2005 | Baa1/BBB+ | 325,000 | 350,704 | ||||||||
| Conagra Inc., 7.875% due 9/15/2010 | Baa1/BBB+ | 150,000 | 182,217 | ||||||||
| Diageo Capital PLC, 3.375% due 3/20/2008 | A2/A | 4,000,000 | 4,060,384 | ||||||||
| Diageo Finance BV, 3.00% due 12/15/2006 | A2/A | 925,000 | 941,845 | ||||||||
| Diageo Finance Bv, 3.875% due 4/1/2011 | A2/A | 2,500,000 | 2,488,580 | ||||||||
| General Mills, 5.50% due 1/12/2009 | Baa2/BBB+ | 300,000 | 327,746 | ||||||||
| Kellogg Co., 4.875% due 10/15/2005 | Baa2/BBB | 186,000 | 194,926 | ||||||||
| Sara Lee Corp. Medium Term Note, 6.00% due 1/15/2008 | A3/A+ | 900,000 | 995,679 | ||||||||
| Sysco International Co., 6.10% due 6/1/2012 | A1/A+ | 1,000,000 | 1,132,821 | ||||||||
| -- | -- | -- | 14,713,510 | ||||||||
| HEALTHCARE EQUIPMENT & SERVICES | |||||||||||
| Baxter International Inc., 5.25% due 5/1/2007 | A3/A- | 500,000 | 537,571 | ||||||||
| Boston Scientific Corp., 6.625% due 3/15/2005 | Baa1/A- | 250,000 | 261,571 | ||||||||
| -- | -- | -- | 799,142 | ||||||||
| HOUSEHOLD & PERSONAL PRODUCTS | |||||||||||
| Gillette Co., 4.00% due 6/30/2005 | Aa3/AA- | 2,000,000 | 2,060,846 | ||||||||
| Gillette Co., 2.875% due 3/15/2008 | Aa3/AA- | 2,000,000 | 1,999,930 | ||||||||
| Nike Inc., 5.50% due 8/15/2006 | A2/A | 900,000 | 967,583 | ||||||||
| Procter & Gamble Co., 4.75% due 6/15/2007 | Aa3/AA- | 350,000 | 375,194 | ||||||||
| Procter & Gamble Co., 4.30% due 8/15/2008 | Aa3/AA- | 2,000,000 | 2,113,552 | ||||||||
| -- | -- | -- | 7,517,105 | ||||||||
30
| SCHEDULE OF INVESTMENTS, CONTINUED Thornburg Limited Term Income Fund | March 31, 2004 | ||||||||||
|---|---|---|---|---|---|---|---|---|---|---|---|
| HOTELS RESTAURANTS & LEISURE | |||||||||||
| Hyatt Equities LLC, 9.25% due 5/15/2005 | Baa3/BBB | 225,000 | $ | 238,057 | |||||||
| Wendy's International Inc., 6.35% due 12/15/2005 | Baa1/BBB+ | 500,000 | 536,562 | ||||||||
| -- | -- | -- | 774,619 | ||||||||
| INSURANCE | |||||||||||
| AIG Sunamerica Global Financing, 5.10% due 1/17/2007 | Aaa/AAA | 800,000 | 856,919 | ||||||||
| Allstate Corp., 5.375% due 12/1/2006 | A1/A+ | 900,000 | 975,301 | ||||||||
| AON Corp., 6.90% due 7/1/2004 | Baa2/A- | 200,000 | 202,538 | ||||||||
| Equitable Iowa Cos., 8.50% due 2/15/2005 | A1/A+ | 170,000 | 177,944 | ||||||||
| Hartford Life Inc., 7.10% due 6/15/2007 | A3/A- | 300,000 | 340,064 | ||||||||
| Liberty Mutual Group Inc. Guaranteed Senior Notes, 5.75% due 3/15/2014 | Baa3/BBB | 1,000,000 | 996,658 | ||||||||
| Liberty Mutual Insurance Co., 8.20% due 5/4/2007 | Baa2/BBB+ | 1,000,000 | 1,155,268 | ||||||||
| Lincoln National Corp., 4.75% due 2/15/2014 | A3/A- | 1,000,000 | 1,010,486 | ||||||||
| Manufacturers Life Insurance Co., 7.875% due 4/15/2005 | A1/AA- | 855,000 | 900,913 | ||||||||
| Marsh & Mclennan Cos. Inc., 4.85% due 2/15/2013 | A2/AA- | 550,000 | 561,490 | ||||||||
| Metlife Inc., 5.25% due 12/1/2006 | A2/A | 450,000 | 482,574 | ||||||||
| Old Republic International Corp., 7.00% due 6/15/2007 | Aa3/A+ | 1,800,000 | 2,043,164 | ||||||||
| Pacific Life Global Funding CPI Floating Rate, 4.106% due 2/6/2016 | Aa3/AA | 8,000,000 | 8,090,160 | ||||||||
| Principal Financial Group Australia, 8.20% due 8/15/2009 | A3/A | 700,000 | 846,238 | ||||||||
| Principal Life Global Funding, 4.40% due 10/1/2010 | Aa3/AA | 4,000,000 | 4,120,300 | ||||||||
| Unitedhealth Group Inc., 3.30% due 1/30/2008 | A3/A | 1,300,000 | 1,321,268 | ||||||||
| Unumprovident Corp., 7.625% due 3/1/2011 | Baa3/BBB- | 2,450,000 | 2,569,437 | ||||||||
| USF&G Corp., 7.125% due 6/1/2005 | A3/BBB+ | 900,000 | 950,878 | ||||||||
| -- | -- | -- | 27,601,600 | ||||||||
| MATERIALS | |||||||||||
| Chevron Phillips Chemical, 5.375% due 6/15/2007 | Baa1/BBB+ | 75,000 | 81,490 | ||||||||
| Chevron Phillips Chemical, 7.00% due 3/15/2011 | Baa1/BBB+ | 500,000 | 575,834 | ||||||||
| Chevrontexaco Capital Co., 3.50% due 9/17/2007 | Aa2/AA | 1,400,000 | 1,445,875 | ||||||||
| Dow Chemical Co., 5.75% due 12/15/2008 | A3/A- | 350,000 | 384,594 | ||||||||
| E.I. du Pont de Nemours & Co., 8.25% due 9/15/2006 | Aa3/AA- | 200,000 | 229,073 | ||||||||
| E.I. du Pont de Nemours & Co., 4.75% due 11/15/2012 | Aa3/AA- | 1,000,000 | 1,043,030 | ||||||||
| E.I. du Pont de Nemours & Co., 4.125% due 3/6/2013 | Aa3/AA- | 325,000 | 323,020 | ||||||||
| Hoechst Celanese Corp., 7.125% due 3/15/2009 | Baa2/A+ | 200,000 | 218,989 | ||||||||
| Lafarge Corp., 6.375% due 7/15/2005 | Baa1/BBB | 75,000 | 78,925 | ||||||||
| Lubrizol Corp. Senior Note, 5.875% due 12/1/2008 | A2/A+ | 635,000 | 707,901 | ||||||||
| Minnesota Mining & Manufacturing Co., 4.15% due 6/30/2005 | Aa1/AA | 2,000,000 | 2,066,530 | ||||||||
| -- | -- | -- | 7,155,261 | ||||||||
| MEDIA | |||||||||||
| AOL Time Warner Inc., 6.75% due 4/15/2011 | Baa1/BBB+ | 750,000 | 850,263 | ||||||||
| E W Scripps Co. Ohio, 5.75% due 7/15/2012 | A2/A | 80,000 | 87,477 | ||||||||
| New York Times Co., 4.625% due 6/25/2007 | A1/A+ | 300,000 | 320,668 | ||||||||
| Scholastic Corp., 5.75% due 1/15/2007 | Baa2/BBB | 255,000 | 275,475 | ||||||||
| Thomson Corp., 4.25% due 8/15/2009 | A3/A- | 2,900,000 | 3,015,304 | ||||||||
| Time Warner Inc., 8.05% due 1/15/2016 | Baa1/BBB+ | 200,000 | 245,150 | ||||||||
| Tribune Co., 6.875% due 11/1/2006 | A3/NR | 125,000 | 138,787 | ||||||||
| -- | -- | -- | 4,933,124 | ||||||||
31
| SCHEDULE OF INVESTMENTS, CONTINUED Thornburg Limited Term Income Fund | March 31, 2004 | ||||||||||
|---|---|---|---|---|---|---|---|---|---|---|---|
| PHARMACEUTICALS & BIOTECHNOLOGY | |||||||||||
| Abbott Labs, 6.40% due 12/1/2006 | A1/AA | 1,000,000 | $ | 1,111,349 | |||||||
| Abbott Labs, 3.75% due 3/15/2011 | A1/AA | 500,000 | 497,044 | ||||||||
| Bristol Myers Squibb Co., 4.75% due 10/1/2006 | A1/AA- | 500,000 | 529,455 | ||||||||
| Eli Lilly & Co., 5.50% due 7/15/2006 | Aa3/AA | 1,850,000 | 1,996,437 | ||||||||
| Glaxosmithkline Capital Inc. Guaranteed Notes, 4.375% due 4/15/2014 | Aa2/AA | 1,250,000 | 1,240,475 | ||||||||
| Pfizer Inc., 3.30% due 3/2/2009 | Aaa/AAA | 1,825,000 | 1,848,947 | ||||||||
| Pfizer Inc., 4.50% due 2/15/2014 | Aaa/AAA | 2,000,000 | 2,028,518 | ||||||||
| Pharmacia Corp., 5.75% due 12/1/2005 | A1/AAA | 2,000,000 | 2,132,930 | ||||||||
| Tiers Inflation Linked Trust Series Wye 2004 21 Trust Certificate, 4.00% due 2/1/2014 | Baa1/A | 5,000,000 | 5,000,000 | ||||||||
| -- | -- | -- | 16,385,155 | ||||||||
| REAL ESTATE MANAGEMENT & DEVELOPMENT | |||||||||||
| Prime Property Funding II Inc., 7.00% due 8/15/2004 | A2/A | 715,000 | 728,968 | ||||||||
| RETAILING | |||||||||||
| Costco Wholesale Corp., 5.50% due 3/15/2007 | A2/A | 500,000 | 543,777 | ||||||||
| Dayton Hudson Corp., 9.625% due 2/1/2008 | A2/A+ | 100,000 | 122,309 | ||||||||
| Dillard's Inc., 7.375% due 6/1/2006 | B2/BB | 150,000 | 155,625 | ||||||||
| Target Corp., 3.375% due 3/1/2008 | A2/A+ | 1,000,000 | 1,020,328 | ||||||||
| Target Corp., 5.875% due 3/1/2012 | A2/A+ | 800,000 | 888,288 | ||||||||
| Wal Mart Stores Inc., 4.125% due 2/15/2011 | Aa2/AA | 3,735,000 | 3,792,474 | ||||||||
| Wal-Mart Stores Inc., 6.875% due 8/10/2009 | Aa2/AA | 900,000 | 1,056,221 | ||||||||
| Wal-Mart Stores Inc., 8.57% due 1/2/2010 | Aa2/AA | 452,476 | 525,017 | ||||||||
| Wal-Mart Stores Inc., 1992-A1 Pass Through Certificate, 7.49% due 6/21/2007 | Aa2/AA | 290,449 | 315,878 | ||||||||
| -- | -- | -- | 8,419,917 | ||||||||
| SOFTWARE & SERVICES | |||||||||||
| Electronic Data Systems Corp., 6.85% due 10/15/2004 | Baa3/BBB | 250,000 | 255,791 | ||||||||
| Electronic Data Systems Corp., 7.125% due 10/15/2009 | Baa3/BBB | 2,500,000 | 2,669,155 | ||||||||
| Electronic Data Systems Corp., 6.00% due 8/1/2013 | Baa3/BBB | 1,000,000 | 970,156 | ||||||||
| TECHNOLOGY - HARDWARE & EQUIPMENT | |||||||||||
| Computer Sciences Corp., 7.50% due 8/8/2005 | A3/A | 158,000 | 169,632 | ||||||||
| Computer Sciences Corp., 6.75% due 6/15/2006 | A3/A | 350,000 | 383,601 | ||||||||
| Computer Sciences Corp., 3.50% due 4/15/2008 | A3/A | 2,000,000 | 2,023,246 | ||||||||
| Computer Sciences Corp., 6.25% due 3/15/2009 | A3/A | 300,000 | 340,064 | ||||||||
| Computer Sciences Corp., 7.375% due 6/15/2011 | A3/A | 1,317,000 | 1,575,902 | ||||||||
| First Data Corp., 6.375% due 12/15/2007 | A1/A+ | 110,000 | 124,238 | ||||||||
| First Data Corp., 5.625% due 11/1/2011 | A1/A+ | 900,000 | 991,610 | ||||||||
| International Business Machines, 4.875% due 10/1/2006 | A1/A+ | 500,000 | 534,216 | ||||||||
| International Business Machines, 2.375% due 11/1/2006 | A1/A+ | 2,825,000 | 2,850,569 | ||||||||
| International Business Machines, 4.25% due 9/15/2009 | A1/A+ | 1,000,000 | 1,047,235 | ||||||||
| Jabil Circuit Inc., 5.875% due 7/15/2010 | Baa3/BB+ | 500,000 | 536,407 | ||||||||
| Oracle Corp., 6.91% due 2/15/2007 | A3/A- | 1,200,000 | 1,341,281 | ||||||||
| -- | -- | -- | 11,918,001 | ||||||||
| TELECOMMUNICATION SERVICES | |||||||||||
| Cingular Wireless, 5.625% due 12/15/2006 | A3/A+ | 900,000 | 971,510 | ||||||||
| TCI Communications Inc., 8.00% due 8/1/2005 | Baa3/BBB | 50,000 | 53,891 | ||||||||
| Verizon Wireless Capital LLC, 5.375% due 12/15/2006 | A3/A+ | 1,500,000 | 1,615,625 | ||||||||
| -- | -- | -- | 2,641,026 | ||||||||
32
| SCHEDULE OF INVESTMENTS, CONTINUED Thornburg Limited Term Income Fund | March 31, 2004 | ||||||||||
|---|---|---|---|---|---|---|---|---|---|---|---|
| TRANSPORTATION | |||||||||||
| Continental Airlines Pass Through Certificate Series 1997 4 Class-4A, 6.90% due 1/2/2018 | Baa3/A- | 208,215 | $ | 207,620 | |||||||
| CSX Corp., 7.45% due 5/1/2007 | Baa2/BBB | 225,000 | 256,695 | ||||||||
| Delta Air Lines Inc. EETC Series 2001-1 Class-A, 6.619% due 3/18/2011 | Baa3/BBB- | 342,026 | 338,090 | ||||||||
| Northwest Airlines 1999-2 Class-A, 7.575% due 3/1/2019 | Baa2/A+ | 129,899 | 134,604 | ||||||||
| Southwest Airlines Co., 5.10% due 5/1/2006 | Aa2/AA+ | 444,139 | 462,744 | ||||||||
| Southwest Airlines Co., 7.875% due 9/1/2007 | Baa1/A | 1,012,000 | 1,167,552 | ||||||||
| -- | -- | -- | 2,567,305 | ||||||||
| UTILITIES | |||||||||||
| Appalachian Power Co., 6.60% due 5/1/2009 (Insured: MBIA) | Aaa/AAA | 175,000 | 200,209 | ||||||||
| Duke Capital Corp. Senior Note, 7.25% due 10/1/2004 | Baa3/BBB- | 1,245,000 | 1,277,970 | ||||||||
| Entergy Mississippi Inc., 6.45% due 4/1/2008 (Insured: AMBAC) | Aaa/AAA | 200,000 | 203,180 | ||||||||
| Gulf Power Co., 4.35% due 7/15/2013 | A2/A | 925,000 | 913,204 | ||||||||
| Madison Gas & Electric Co., 6.02% due 9/15/2008 | Aa3/AA- | 950,000 | 1,047,603 | ||||||||
| Minnesota Power & Light Co., 7.00% due 2/15/2007 | Baa1/A | 900,000 | 1,006,459 | ||||||||
| Northern States Power Co., 4.75% due 8/1/2010 | A3/BBB+ | 2,825,000 | 2,982,875 | ||||||||
| Pacificorp, 6.75% due 4/1/2005 | A3/A | 250,000 | 262,047 | ||||||||
| Pennsylvania Power & Light Co., 6.55% due 3/1/2006 (Insured: MBIA) | Aaa/AAA | 210,000 | 226,828 | ||||||||
| PSI Energy Inc., 6.65% due 6/15/2006 | A3/A- | 245,000 | 268,504 | ||||||||
| PSI Energy Inc., 7.85% due 10/15/2007 | Baa1/BBB | 500,000 | 583,642 | ||||||||
| Public Service Co. Colorado, 4.875% due 3/1/2013 | Baa1/BBB+ | 1,000,000 | 1,031,311 | ||||||||
| Public Service Electric & Gas Co., 6.75% due 3/1/2006 (Insured: MBIA) | Aaa/AAA | 275,000 | 300,153 | ||||||||
| Southern California Gas Co., 4.375% due 1/15/2011 | A1/A+ | 225,000 | 233,364 | ||||||||
| Texas Municipal Gas Corp., 2.60% due 7/1/2007 | Aaa/AAA | 4,430,000 | 4,478,597 | ||||||||
| Wisconsin Electric Power Co., 7.25% due 8/1/2004 | Aa3/A- | 80,000 | 81,538 | ||||||||
| Wisconsin Energy Corp., 5.50% due 12/1/2008 | A3/BBB+ | 350,000 | 380,897 | ||||||||
| Wisconsin Public Service Corp., 6.125% due 8/1/2011 | Aa2/AA- | 1,150,000 | 1,302,877 | ||||||||
| -- | -- | -- | 16,781,258 | ||||||||
| MISCELLANEOUS | |||||||||||
| Stanford University, 5.85% due 3/15/2009 | Aaa/NA | 500,000 | 556,731 | ||||||||
| YANKEE | |||||||||||
| Kreditanstalt Fur Wiederaufbau, 3.25% due 3/30/2009 | Aaa/AAA | 2,475,000 | 2,508,054 | ||||||||
| National Westminster Bank, 7.375% due 10/1/2009 | Aa2/AA- | 715,000 | 856,155 | ||||||||
| Nova Scotia Province Canada, 5.75% due 2/27/2012 | A3/A- | 500,000 | 559,824 | ||||||||
| Ontario Province Canada, 3.282% due 3/28/2008 | Aa2/AA | 335,000 | 340,269 | ||||||||
| Ontario Province Canada, 3.125% due 5/2/2008 | Aa2/AA | 5,000,000 | 5,068,270 | ||||||||
| -- | -- | -- | 9,332,572 | ||||||||
| Total Corporate Bonds (Cost $233,419,232) | -- | -- | 243,512,223 | ||||||||
| TAXABLE MUNICIPAL BONDS - 16.30% | |||||||||||
| Allentown Pennsylvania Taxable Refunding, 4.21% due 10/1/2012 | Aaa/AAA | 2,215,000 | 2,204,058 | ||||||||
| American Campus Properties Student Housing, 7.38% due 9/1/2012 (Insured: MBIA) | Aaa/AAA | 4,250,000 | 5,019,335 | ||||||||
| American Fork City Utah Sales, 2.40% due 3/1/2005 (Insured: FSA) | Aaa/AAA | 150,000 | 151,201 | ||||||||
| American Fork City Utah Sales, 4.89% due 3/1/2012 (Insured: FSA) | Aaa/AAA | 300,000 | 312,579 | ||||||||
| American Fork City Utah Sales, 5.07% due 3/1/2013 (Insured: FSA) | Aaa/AAA | 120,000 | 125,423 | ||||||||
| Arkansas Electric Coop Corp., 7.33% due 6/30/2008 | A2/AA- | 169,000 | 183,592 | ||||||||
33
| SCHEDULE OF INVESTMENTS, CONTINUED Thornburg Limited Term Income Fund | March 31, 2004 | ||||||||||
|---|---|---|---|---|---|---|---|---|---|---|---|
| Arkansas State Taxable Water Waste Disposal Series A, 5.50% due 7/1/2005 | Aa2/AA | 300,000 | $ | 314,709 | |||||||
| Ashaubenon Wisconsin, 3.00% due 6/1/2008 | Aa2/NR | 1,000,000 | 996,290 | ||||||||
| Aurora Indiana School Building Corp. Taxable Refunding 1st Mortgage, 2.50% due 8/10/2004 | NR/AA- | 235,000 | 235,743 | ||||||||
| Baton Rouge Louisiana Taxable Series B, 2.60% due 1/15/2005 (Insured: AMBAC) | Aaa/AAA | 860,000 | 868,136 | ||||||||
| Bessemer Alabama Water Revenue Taxable Warrants Series B, 7.375% due 7/1/2008 (Insured: FSA) | Aaa/AAA | 1,115,000 | 1,213,900 | ||||||||
| Brockton MA Taxable Economic Development Series A, 6.45% due 5/1/2017 (Insured: FGIC) | Aaa/AAA | 150,000 | 170,256 | ||||||||
| Burbank California Waste Disposal Revenue, 5.29% due 5/1/2007 (Insured: FSA) | Aaa/AAA | 370,000 | 398,842 | ||||||||
| Burbank California Waste Disposal Revenue, 5.48% due 5/1/2008 (Insured: FSA) | Aaa/AAA | 310,000 | 339,205 | ||||||||
| Chicago Illinois Taxable Neighborhoods Alive Series B, 5.20% due 9/1/2006 (Insured: FGIC) | Aaa/AAA | 200,000 | 214,756 | ||||||||
| Cleveland Cuyahoga County Ohio, 6.10% due 5/15/2013 | NR/NR | 2,125,000 | 2,178,720 | ||||||||
| Connecticut State Development Authority, 8.55% due 8/15/2005 | NR/NR | 1,025,000 | 1,069,946 | ||||||||
| Connecticut State Housing Finance Authority, 3.10% due 6/15/2032 put 12/1/2005 (Insured: AMBAC) | Aaa/AAA | 1,870,000 | 1,900,444 | ||||||||
| Cook County Illinois Community College District 508, 6.90% due 5/1/2010 (Insured: AMBAC) | Aaa/AAA | 600,000 | 660,882 | ||||||||
| Cook County Illinois School District 083, 4.625% due 12/1/2010 (Insured: FSA) | Aaa/NR | 250,000 | 260,567 | ||||||||
| Cook County Illinois School District 083, 4.875% due 12/1/2011 (Insured: FSA) | Aaa/NR | 150,000 | 156,680 | ||||||||
| Coos County Oregon, 3.04% due 6/1/2009 (Insured: FGIC) | Aaa/NR | 465,000 | 458,918 | ||||||||
| Coos County Oregon, 3.47% due 6/1/2010 (Insured: FGIC) | Aaa/NR | 635,000 | 629,475 | ||||||||
| Denver City & County Special Facilities Taxable Refunding & Improvement Series B, 7.15% due 1/1/2008 | Aaa/AAA | 900,000 | 1,035,279 | ||||||||
| (Insured: MBIA) | |||||||||||
| Duke University Revenue, 6.19% due 6/1/2004 (Duke University Hospital Project A) | Aa3/NR | 500,000 | 504,100 | ||||||||
| Elkhart Indiana Redevelopment District Revenue, 4.80% due 6/15/2011 | NR/NR | 240,000 | 238,843 | ||||||||
| Elkhart Indiana Redevelopment District Revenue, 4.80% due 12/15/2011 | NR/NR | 245,000 | 242,744 | ||||||||
| Elkhart Indiana Redevelopment District Revenue, 5.05% due 12/15/2012 | NR/NR | 515,000 | 509,428 | ||||||||
| Elkhart Indiana Redevelopment District Revenue, 5.25% due 12/15/2013 | NR/NR | 540,000 | 529,270 | ||||||||
| Green Bay Wisconsin Series B, 4.875% due 4/1/2011 (Insured: MBIA) | Aaa/NR | 365,000 | 383,151 | ||||||||
| Hancock County Mississippi, 4.20% due 8/1/2008 (Insured: MBIA) | Aaa/NR | 305,000 | 315,388 | ||||||||
| Hancock County Mississippi, 4.80% due 8/1/2010 (Insured: MBIA) | Aaa/NR | 245,000 | 252,576 | ||||||||
| Hancock County Mississippi, 4.90% due 8/1/2011 (Insured: MBIA) | Aaa/NR | 315,000 | 323,294 | ||||||||
| Idaho Housing Multi Family Housing Revenue Series 94-B, 8.15% due 7/1/2004 | A2/NR | 845,000 | 859,221 | ||||||||
| Illinois Housing Development Authority Taxable Multi Family Program, 7.85% due 3/1/2005 | A1/A+ | 30,000 | 31,167 | ||||||||
| Indiana Bond Bank Taxable School Severance, 2.54% due 7/15/2004 (Insured: FGIC) | Aaa/AAA | 440,000 | 441,650 | ||||||||
| Indiana Bond Bank Taxable School Severance, 2.74% due 1/15/2005 (Insured: FGIC) | Aaa/AAA | 450,000 | 454,748 | ||||||||
| Jefferson County Texas Navigation Taxable Refunding, 5.50% due 5/1/2010 (Insured: FSA) | Aaa/NR | 500,000 | 534,465 | ||||||||
| Jefferson Franklin, Etc. Counties Illinois Community College District 521, 3.00% due 1/1/2006 (Insured: Aaa/NR | 200,000 | 204,182 | |||||||||
| FSA) | |||||||||||
| Jefferson Franklin, Etc. Counties Illinois Community College District 521, 3.625% due 1/1/2007 | Aaa/NR | 300,000 | 310,689 | ||||||||
| (Insured: FSA) | |||||||||||
| Jersey City New Jersey Municipal Utilities Authority, 3.72% due 5/15/2009 (Insured: MBIA) | Aaa/AAA | 575,000 | 583,430 | ||||||||
| Kendall Kane County Illinois School 308, 5.50% due 10/1/2011 (Insured: FGIC) | Aaa/NR | 365,000 | 398,496 | ||||||||
| King County Washington General Obligation, 7.55% due 12/1/2005 | Aa1/AA+ | 405,000 | 443,264 | ||||||||
| Los Angeles County California Metropolitan Transport, 4.56% due 7/1/2010 | Aaa/AAA | 2,775,000 | 2,900,624 | ||||||||
| Maryland State Economic Development Corp., 7.25% due 6/1/2008 (Maryland Tech. Development Center | NR/NR | 440,000 | 483,556 | ||||||||
| Project) | |||||||||||
| McKeesport Pennsylvania Taxable Series B, 6.60% due 3/1/2006 (Insured: MBIA) | Aaa/AAA | 240,000 | 261,403 | ||||||||
| Mississippi State Taxable Business Series V, 7.125% due 9/1/2006 | NR/AA | 140,000 | 156,299 | ||||||||
| Montgomery County Maryland Revenue Authority, 5.00% due 2/15/2012 | Aa2/AA+ | 100,000 | 104,594 | ||||||||
| New Jersey Health Care Facilities Financing, 10.75% due 7/1/2010 (escrowed to maturity) | NR/NR | 435,000 | 555,334 | ||||||||
| New Jersey Health Care Facilities Financing, 7.70% due 7/1/2011 (Insured: Connie Lee) | NR/AAA | 165,000 | 193,934 | ||||||||
| New Rochelle New York Industrial Development Agency, 7.15% due 10/1/2014 | Aa3/A+ | 150,000 | 165,108 | ||||||||
| New York Environmental Facilities, 5.85% due 3/15/2011 | NR/AA- | 3,500,000 | 3,901,835 | ||||||||
| New York State Thruway Authority Service Contract, 2.59% due 3/15/2006 | A3/AA- | 1,000,000 | 1,011,200 | ||||||||
| New York State Urban Development Corp., 4.75% due 12/15/2011 | NR/AA | 1,400,000 | 1,469,524 | ||||||||
| Newark New Jersey, 4.70% due 4/1/2011 (Insured: MBIA) | Aaa/NR | 845,000 | 878,082 | ||||||||
34
| SCHEDULE OF INVESTMENTS, CONTINUED Thornburg Limited Term Income Fund | March 31, 2004 | ||||||||||
|---|---|---|---|---|---|---|---|---|---|---|---|
| Newark New Jersey, 4.90% due 4/1/2012 (Insured: MBIA) | Aaa/NR | 1,225,000 | $ | 1,272,628 | |||||||
| Niagara Falls New York Public Water, 4.30% due 7/15/2010 (Insured: MBIA) | Aaa/AAA | 360,000 | 372,107 | ||||||||
| North Carolina Municipal Power Agency Taxable Series B, 3.26% due 1/1/2005 | Baa1/BBB+ | 1,000,000 | 1,007,600 | ||||||||
| Northwest Open Access Network Washington Revenue, 6.18% due 12/1/2008 (Insured: AMBAC) | Aaa/AAA | 1,600,000 | 1,799,184 | ||||||||
| Ohio State Petroleum Underground Storage, 6.75% due 8/15/2008 (Insured: MBIA) | Aaa/AAA | 985,000 | 1,008,778 | ||||||||
| Oregon State Department Administrative Lottery Revenue Taxable B, 4.90% due 4/1/2005 (Insured: FSA) | Aaa/AAA | 205,000 | 211,824 | ||||||||
| Passaic County New Jersey Multi Modal Taxable Refunding Series B, 6.23% due 9/1/2005 (Insured: FSA) | Aaa/AAA | 250,000 | 266,130 | ||||||||
| Pima County Arizona Industrial Development Authority Series E, 9.05% due 7/1/2008 | Baa3/NR | 455,000 | 523,236 | ||||||||
| Providence Rhode Island, 5.59% due 1/15/2008 | Aaa/AAA | 340,000 | 374,517 | ||||||||
| Sam Rayburn Texas Municipal Power Agency, 5.05% due 10/1/2004 | Baa2/BBB- | 775,000 | 784,168 | ||||||||
| San Francisco California City & County Redevelopment Project Series B, 7.80% due 8/1/2004 | A2/A | 540,000 | 551,529 | ||||||||
| Short Pump Town Center Community Development, 6.26% due 2/1/2009 | NR/NR | 1,000,000 | 1,015,600 | ||||||||
| Sisters Providence Obligation Group Direct Obligation Notes Series 1997, 7.47% due 10/1/2007 | A1/AA- | 2,190,000 | 2,504,944 | ||||||||
| South Dakota State Building Authority Revenue, 7.00% due 9/1/2005 (escrowed to maturity) | Aaa/AAA | 400,000 | 429,520 | ||||||||
| St. Louis Missouri Municipal Finance Corp. Firemans Retirement System, 6.35% due 8/1/2005 (Insured: | Aaa/AAA | 2,240,000 | 2,318,400 | ||||||||
| MBIA) | |||||||||||
| Tennessee State Taxable Series B, 6.00% due 2/1/2013 | Aa2/AA | 500,000 | 549,190 | ||||||||
| Texas State Public Finance Authority Revenue, 3.125% due 6/15/2007 | Aa2/AA | 400,000 | 406,544 | ||||||||
| Texas Tech University Revenue, 6.00% due 8/15/2011 (Insured: MBIA) | Aaa/AAA | 245,000 | 275,157 | ||||||||
| University Illinois Revenue, 6.35% due 4/1/2011 (Insured: FGIC) | Aaa/AAA | 1,000,000 | 1,142,120 | ||||||||
| University of New Mexico Revenue, 3.90% due 6/1/2010 (Insured: AMBAC) | Aaa/AAA | 90,000 | 91,338 | ||||||||
| University of New Mexico Revenue, 4.15% due 6/1/2011 (Insured: AMBAC) | Aaa/AAA | 250,000 | 253,490 | ||||||||
| University of New Mexico Revenue, 4.375% due 6/1/2012 (Insured: AMBAC) | Aaa/AAA | 180,000 | 182,274 | ||||||||
| University of New Mexico Revenue, 4.50% due 6/1/2013 (Insured: AMBAC) | Aaa/AAA | 270,000 | 272,330 | ||||||||
| Victor New York Taxable-Tax Increment, 9.20% due 5/1/2014 | NR/NR | 1,000,000 | 1,076,840 | ||||||||
| Virginia Housing Development Authority Taxable Rental Housing Series I, 7.30% due 2/1/2008 | Aa1/AA+ | 505,000 | 578,912 | ||||||||
| Washington Pennsylvania, 4.30% due 9/1/2005 (Insured: FGIC) | Aaa/AAA | 285,000 | 295,308 | ||||||||
| West Valley City Utah Municipal Building Lease Refunding Taxable, 7.67% due 5/1/2006 | Aa2/NR | 1,500,000 | 1,656,750 | ||||||||
| Wisconsin State General Revenue, 4.80% due 5/1/2013 | Aaa/AAA | 200,000 | 206,536 | ||||||||
| Total Taxable Municipal Bonds (Cost $59,663,050) | -- | -- | 62,167,489 | ||||||||
| FOREIGN SECURITIES - 1.10% | |||||||||||
| British Columbia Province, 9.00% due 6/21/2004 (Canadian Dollars) | Aa2/AA- | 2,000,000 | 1,548,571 | ||||||||
| Federal Republic of Germany, 5.00% due 8/19/2005 (EURO) | Aaa/AAA | 2,000,000 | 2,556,838 | ||||||||
| Total Foreign Securities (Cost $3,330,694) | -- | -- | 4,105,409 | ||||||||
| SHORT TERM - 5.80% | |||||||||||
| American General Finance Corp., 1.07% due 4/2/2004 | A1/P1 | 3,000,000 | 2,999,911 | ||||||||
| American General Finance Corp., 1.07% due 4/5/2004 | A1/P1 | 4,000,000 | 3,999,524 | ||||||||
| International Business Machines, 0.95% due 4/1/2004 | A1/P1 | 11,000,000 | 11,000,000 | ||||||||
| Nestle Capital Corp., 0.96% due 4/2/2004 | A1/P1 | 4,000,000 | 3,999,894 | ||||||||
| Total Short Term (Cost $21,999,329) | -- | -- | 21,999,329 | ||||||||
| TOTAL INVESTMENTS (100%) (Cost $367,358,479) | -- | -- | $ | 382,172,551 | |||||||
| Principal amount in U.S. Dollars unless otherwise indicated, value is in U.S. Dollar | |||||||||||
| †Credit ratings are unaudited | |||||||||||
| See notes to financial statements | |||||||||||
35
GOVERNMENT FUND
Index Comparisons
The charts below compare performance of the Thornburg Limited Term U.S. Government Fund Class A shares and Class C shares to the Lehman Brothers Intermediate Government Bond Index and the Consumer Price Index for the periods ended March 31, 2004. On March 31, 2004, the weighted average securities ratings of the Index and the Fund were AAA and AAA, respectively, and the weighted average portfolio maturities of the Index and the Fund were 4.5 years and 3.8 years, respectively. Class A shares became available on November 16, 1987, and Class C shares became available on September 1, 1994. Past performance of the Index and the Fund may not be indicative of future performance. The performance data and graph do not reflect the deduction of taxes that a shareholder would pay on distributions or the redemption of fund shares.
Thornburg Limited Term U.S.Government Fund Class A Total Returns,
Since November 30, 1987, versus Lehman Brothers Intermediate
Government Bond Index and Consumer Price Index (CPI)
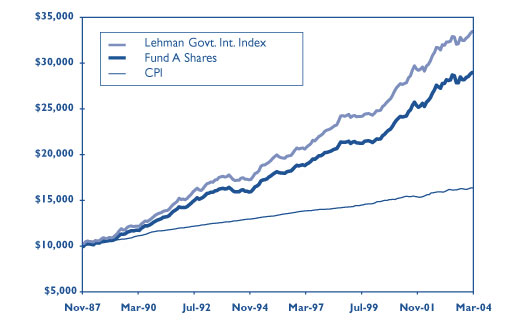
Average Annual Total Returns
(periods ending 3/31/04) (at max. offering price)
| A Shares | |||||
|---|---|---|---|---|---|
| One Year: | 1 | .58% | |||
| Five Years: | 5 | .97% | |||
| Ten Years: | 5 | .97% | |||
| From Inception (11/16/87): | 6 | .72% | |||
Thornburg Limited Term U.S.Government Fund Class C Total Returns, Since Inception, versus Lehman Brothers Intermediate Government Bond Index and Consumer Price Index (CPI)
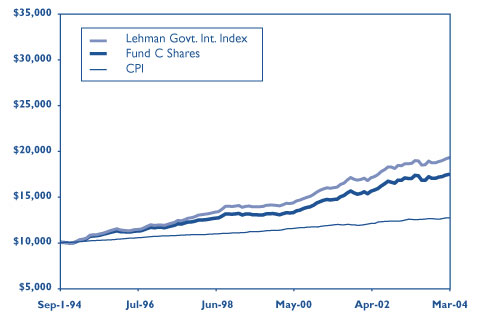
Average Annual Total Returns
(periods ending 3/31/04)
| C Shares | |||||
|---|---|---|---|---|---|
| One Year: | 2 | .24% | |||
| Five Years: | 5 | .91% | |||
| From Inception (9/1/94): | 5 | .95% | |||
Maximum sales charge of the Funds’ Class A Shares is 1.50%. B shares carry a contingent deferred sales charge (CDSC), if redeemed within a year, of 5.00%; within two years, 4.25%; within three years, 3.50%; within four years, 2.75%; within five years, 2.00%; within six years, 1.25%; within seven years, 0.50%. There is no charge for redemption within the eighth year. C shares include a 0.50% CDSC for the first year only. There is no up front sales charge for R shares.
Past performance is no guarantee of future results. Current returns may be either lower or higher than those shown. Share prices and returns will fluctuate and investors may experience a loss upon redemption. There is no guarantee that the fund will meet its objectives. Shares in the Fund carry risks, including possible loss of principal.
Carefully consider the Fund’s investment objectives, risks, sales charges, and expenses; this is found in the prospectus, which is available from your financial advisor or from www.thornburg.com. Read it carefully before you invest or send money.
For month end performance information, visit www.thornburg.com.
The Lehman Brothers Intermediate Government Bond Index is an unmanaged market-weighted index generally representative of all public obligations of the U.S. Government, its agencies and instrumentalities having maturities of up to ten years.
The Consumer Price Index (“CPI”) measures prices of a fixed basket of goods bought by a typical consumer, including food, transportation, shelter, utilities, clothing, medical care, entertainment and other items. The CPI, published by the Bureau of Labor Statistics in the Department of Labor, is based at 100 in 1982 and is released monthly. It is widely used as a cost-of-living benchmark to adjust Social Security payments and other payment schedules, union contracts and tax brackets. Also known as the cost-of-living index.
Unless otherwise noted, index returns reflect the reinvestment of income dividends and capital gains, if any, but do not reflect fees, brokerage commissions or other expenses of investing. Investors may not make direct investments into any index.
36
INCOME FUND
Index Comparisons
The charts below compare performance of the Thornburg Limited Term Income Fund Class A shares and Class C shares to the Lehman Brothers Intermediate Government/Credit Index and the Consumer Price Index for the periods ended March 31, 2004. On March 31, 2004, the weighted average securities ratings of the Index and the Fund were A and AA, respectively, and the weighted average portfolio maturities of the Index and the Fund were 4.7 years and 4.4 years, respectively. Class A shares became available on October 1, 1992 and Class C shares became available on September 1, 1994. Past performance of the Index and the Fund may not be indicative of future performance. The performance data and graph do not reflect the deduction of taxes that a shareholder would pay on distributions or the redemption of fund shares.
Thornburg Limited Term Income Fund Class A Total Returns,
Since Inception, versus Lehman Brothers Intermediate
Government/Credit Index and Consumer Price Index (CPI)
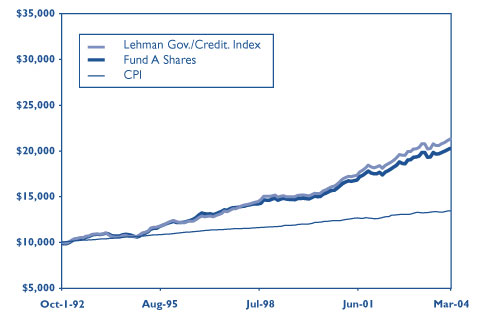
Average Annual Total Returns
(periods ending 3/31/04) (at max. offering price)
| A Shares | |||||
|---|---|---|---|---|---|
| One Year: | 3 | .20% | |||
| Five Years: | 6 | .29% | |||
| Ten Years: | 6 | .42% | |||
| From Inception (10/1/92): | 6 | .28% | |||
Thornburg Limited Term Income Fund Class C Total Returns, Since Inception, versus Lehman Brothers Intermediate Government/Credit Index and Consumer Price Index (CPI)
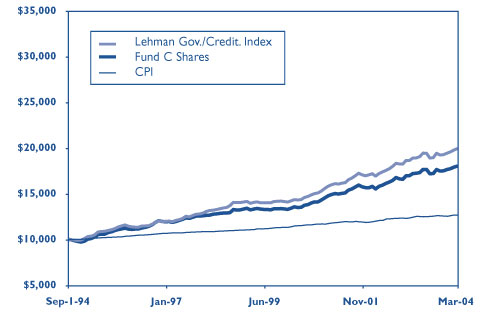
Average Annual Total Returns(periods
ending 3/31/04)
| C Shares | |||||
|---|---|---|---|---|---|
| One Year: | 3 | .97% | |||
| Five Years: | 6 | .22% | |||
| From Inception (9/1/94): | 6 | .30% | |||
Maximum sales charge of the Funds’ Class A Shares is 1.50%. B shares carry a contingent deferred sales charge (CDSC), if redeemed within a year, of 5.00%; within two years, 4.25%; within three years, 3.50%; within four years, 2.75%; within five years, 2.00%; within six years, 1.25%; within seven years, 0.50%. There is no charge for redemption within the eighth year. C shares include a 0.50% CDSC for the first year only. There is no up front sales charge for R shares.
Past performance is no guarantee of future results. Current returns may be either lower or higher than those shown. Share prices and returns will fluctuate and investors may experience a loss upon redemption. There is no guarantee that the fund will meet its objectives. Shares in the Fund carry risks, including possible loss of principal.
For month end performance information, visit www.thornburg.com.
Carefully consider the Fund’s investment objectives, risks, sales charges, and expenses; this is found in the prospectus, which is available from your financial advisor or from www.thornburg.com. Read it carefully before you invest or send money.
The Lehman Brothers Intermediate Government/Credit Bond Index is an unmanaged, market-weighted index generally representative of intermediate government and investment grade corporate debt securities having maturities of up to ten years.
The Consumer Price Index (“CPI”) measures prices of a fixed basket of goods bought by a typical consumer, including food, transportation, shelter, utilities, clothing, medical care, entertainment and other items. The CPI, published by the Bureau of Labor Statistics in the Department of Labor, is based at 100 in 1982 and is released monthly. It is widely used as a cost-of-living benchmark to adjust Social Security payments and other payment schedules, union contracts and tax brackets. Also known as the cost-of-living index.
Unless otherwise noted, index returns reflect the reinvestment of income dividends and capital gains, if any, but do not reflect fees, brokerage commissions or other expenses of investing. Investors may not make direct investments into any index.
37
Thornburg Limited Term U.S. Government Fund
A Shares
Outperformed U.S. Government Money Market Index
(Unaudited)
Investors sometimes ask us to compare the returns of the Limited Term U.S. Government Fund to money market fund returns. These investments have certain differences, and investors in the Limited Term U.S. Government Fund took more risk than money market fund investors to earn their higher returns.
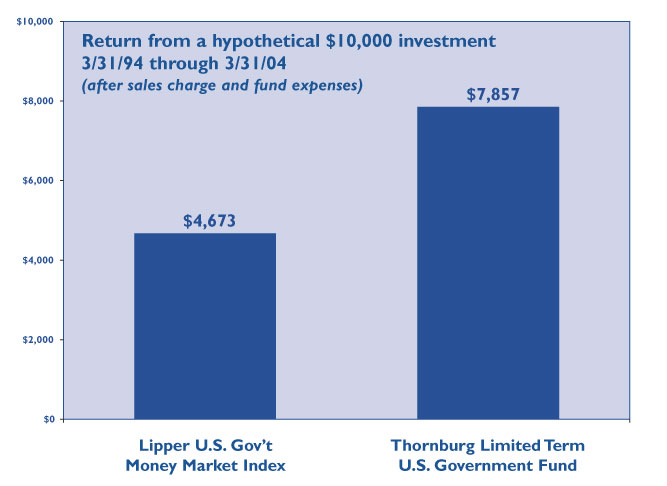
The chart above is for the Fund’s Class A Shares only. Class B, Class C, Class I and Class R-1 Shares have different sales charges and expenses. See the inside front cover page for the 30-day SEC yield and the total returns at the maximum offering prices for one year, three years, five years, ten years, and since inception for the Class A, B, C, I and R-1 shares of the Fund. Return for the money fund average is based upon 30-day yield quotations for taxable money funds as quoted in “Lipper U.S. Government Money Market Index” for the months covered by this analysis. The return for Limited Term U.S. Government Fund is based upon the dividends paid for the months covered by this analysis, the beginning offering price of $12.59 per share and the ending NAV of $13.27 per share. These investments returned the $10,000 initial investment in addition to the amounts shown above.
Note 1: Future performance of any of these investments may bear no relationship to prior performance.
Note 2: This analysis does not take into account the effect, if any, caused by taxes. The average money market fund increases shown above may differ from the return of a particular money market fund. It is not possible to invest in this money fund average.
Note 3: Generally, money market funds seek to maintain an investment portfolio with an average maturity of 90 days or less. Limited Term U.S. Government Fund invests in short-to-intermediate maturity U.S. Government and agency obligations. The net asset value of the money funds did not fluctuate. The net asset value of the Class A Shares of LTUSX did vary from time to time, and will continue to vary in the future due to the effect of changes in interest rates on the value of the investments the Fund holds. The analysis assumes that the investor received the net asset value of the shares owned, plus accrued income, at time of sale. Redemptions are made at the then current net asset value, which may give you a gain or loss when you sell your shares.
Note 4: This analysis assumes that the dividends from each of these investment vehicles were reinvested and compounded monthly. Most money funds declare dividends daily and pay them monthly. LTUSX also declares dividends daily and pays them monthly.
38
Thornburg Limited Term Income Fund
A shares
Outperformed Lipper Money Market Index
(Unaudited)
Investors sometimes ask us to compare the returns of the Limited Term Income Fund to money market fund returns. These investments have certain differences, and investors in the Limited Term Income Fund took more risk than money market fund investors to earn their higher returns.
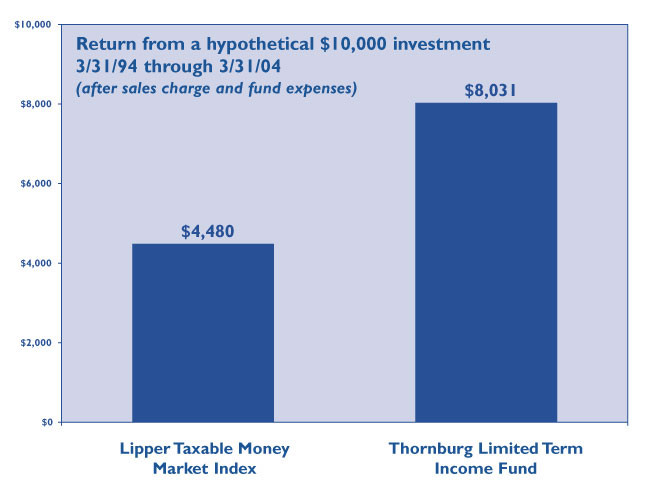
The chart above is for the Fund’s Class A Shares only. Class C, Class I and Class R-1 Shares have different sales charges and expenses. See the inside front cover page for the 30-day SEC yield and the total returns at the maximum offering prices for one year, three years, five years, ten years, and since inception for the Class A, C, I and R-1 shares of the Fund. Return for the money fund average is based upon 30-day yield quotations for taxable money funds as quoted in “Lipper Money Market Index” for the months covered by this analysis. The return for Limited Term Income Fund is based upon the dividends paid for the months covered by this analysis, the beginning offering price of $12.25 per share and the ending NAV of $13.04 per share. These investments returned the $10,000 initial investment in addition to the amounts shown above.
Note 1: Future performance of any of these investments may bear no relationship to prior performance.
Note 2: This analysis does not take into account the effect, if any, caused by taxes. The average money market fund increases shown above may differ from the return of a particular money market fund. It is not possible to invest in this money fund average.
Note 3: Generally, money market funds seek to maintain an investment portfolio with an average maturity of 90 days or less. Limited Term Income Fund invests in short-to-intermediate maturity fixed income obligations. The net asset value of the money funds did not fluctuate. The net asset value of the Class A Shares of THIFX did vary from time to time, and will continue to vary in the future due to the effect of changes in interest rates on the value of the investments the Fund holds. The analysis assumes that the investor received the net asset value of the shares owned, plus accrued income, at time of sale. Redemptions are made at the then current net asset value, which may give you a gain or loss when you sell your shares.
Note 4: This analysis assumes that the dividends from each of these investment vehicles were reinvested and compounded monthly. Most money funds declare dividends daily and pay them monthly. THIFX also declares dividends daily and pays them monthly.
39
Investment Manager
Thornburg Investment Management, Inc.
119 East Marcy Street
Santa Fe, New Mexico 87501
800.847.0200
Principal Underwriter
Thornburg Securities Corporation
119 East Marcy Street
Santa Fe, New Mexico 87501
800.847.0200
This report is submitted for the general information of shareholders of the Fund. It is not authorized for distribution to prospective investors in the Fund unless preceded or accompanied by an effective prospectus. Carefully consider information in the prospectus regarding the Fund’s investment objectives and policies, risks, sales charges, expenses, experience of its management, marketability of shares, and other information. Performance data quoted represent past performance and do not guarantee future results.
www.thornburg.com
Thornburg Limited Term Income Funds - I Shares
Semi-Annual Report
March 31,2004
| Thornburg Limited Term Income Funds ALL DATA AS OF 3/31/04. |
| FUND FACTS: Thornburg Limited Term U.S. Government Fund* | |
| -- | I Shares |
| Annualized Distribution Rate (at NAV) | 3.10% |
| SEC Yield | 2.67% |
| NAV | $ 13.26 |
| Maximum Offering Price | $ 13.26 |
| TOTAL RETURNS: Annual Average - (After Subtracting Maximum Sales Charge) | |
| One Year | 3.27% |
| Three Years | 6.59% |
| Five Years | 6.65% |
| Ten Years | N/A |
| Since Inception | 6.74% |
| Inception Date | 7/5/1996 |
| FUND FACTS: Thornburg Limited Term Income Fund | |
| -- | I Shares |
| Annualized Distribution Rate (at NAV) | 3.47% |
| SEC Yield | 2.52% |
| NAV | $ 13.05 |
| Maximum Offering Price | $ 13.05 |
| TOTAL RETURNS: Annual Average - (After Subtracting Maximum Sales Charge) | |
| One Year | 5.19% |
| Three Years | 7.23% |
| Five Years | 6.95% |
| Ten Years | N/A |
| Since Inception | 7.08% |
| Inception Date | 7/5/1996 |
| There is no up front sales charge for I shares. Past performance is no guarantee of future results. Current returns may be either lower or higher than those shown. Share prices and returns will fluctuate and investors may experience a loss upon redemption. There is no guarantee that the Funds will meet their objectives. Shares in the Funds carry risks, including possible loss of principal. |
| Carefully consider the Funds’ investment objectives, risks, sales charges, and expenses; this is found in the prospectus, which is available from your financial advisor or from www.thornburg.com. Read it carefully before you invest or send money. For month-end performance information, visit www.thornburg.com. |
| The SEC Yield is computed in accordance with SEC standards measuring the net investment income per share over a specified 30-day period expressed as a percentage of the maximum offering price of the Funds’ shares at the end of the period. |
| The distribution rate is calculated by taking the sum of the month’s total distribution factors and dividing this sum by a 30-day period and annualizing to 360-day year. The value is then divided by the ending NAV to arrive at the annualized distribution yield. The yield is calculated on a periodic basis and is subject to change depending on the Funds’ NAV and current distributions. * Shares are not guaranteed by the U.S. Government. |
1
Thornburg Limited Term Income Funds
Letter to shareholders
April 12, 2004
Dear Fellow Shareholder,
I am pleased to present your Semi-annual Report for the Thornburg Limited Term Income Fund and the Thornburg Limited Term U.S. Government Fund for the 6 months ended March 31, 2004. The net asset value of an “I” share of the Thornburg Limited Term Income Fund increased 6 cents in the period to $13.05. If you were invested for the entire period, you received dividends of 23.6 cents per share. If you reinvested your dividends, you received 23.8 cents per share. U.S. Government Fund increased 4 cents in the period to $13.26. If you were invested for the entire period, you received dividends of 20.0 cents per share. If you reinvested your dividends, you received 20.2 cents per share. Please read the accompanying exhibits for more detailed information and history.
Interest rates on U.S. Treasuries were largely unchanged on the dates of September 30, 2003 and March 31, 2004. However, the market fluctuated widely in the interim. For example, the yield on a 5-year U.S. Treasury ranged between a high of 3.45% and a low of 2.65% over the period. Interest rates mostly rose through November before starting a downward trend through March. Quality spreads (the additional yield on a corporate bond) contracted through December before starting to rise in the first quarter of this year.
Putting income and the change in price together, the “I” shares of the Thornburg Limited Term Income Fund produced a total return of 2.39% over the six-month period, assuming a beginning-of-the-period investment at the net asset value. The Lehman Brothers Intermediate Government/Credit Index produced a 2.75% total return over the same time period. The “I” shares of the Thornburg Limited Term U.S. Government Fund produced a total return of 1.84% over the six-month period, assuming a beginning-of-the-period investment at the net asset value. The Lehman Intermediate Government Index produced a 2.18% total return over the same time period. The Funds kept their duration shorter than the indices during the first quarter of 2004, during which time interest rates fell and longer duration bonds tended to outperform. Because the Funds kept their durations shorter and allocated a larger portion of their portfolios to short-term bonds, their returns fell short of the indices. The Thornburg Limited Term Income Fund also did not own some of the lower rated credits represented in the Index. Some of these bonds benefited from the significant contraction in spreads to Treasuries on lower rated credits during the period. We have kept our durations shorter than the indices thus far in 2004, because we believe doing so will improve the Funds’ return relative to the indices if interest rates rise.
Interest rates have risen since the release of the March payroll numbers. The U.S. Treasury market now has yields equivalent to the levels seen in December of 2003. After months of waiting for the expected employment growth to show up, the market had become complacent with a “No Jobs Recovery” after the February payroll release. The gain of 308,000 jobs documented in the March payroll number seems to have caught the bond market by surprise. It is interesting to note that the increase in employment has averaged 126,000 per month since September. The U.S. still has 1 million fewer jobs now than at the peak employment in 2001. Most economists believe that employment has to grow by at least 125,000 per month just to keep up with population growth. 200,000 to 300,000 per month employment growth is necessary to regain those lost jobs.
Aside from the employment growth, other aspects of the U.S. economy have continued their increases as the U.S. moves away from the last recession. The GDP growth has been relatively robust. An increase in household wealth appears to be sustaining spending in this cycle, something that was not evident in earlier cycles. That may be due to the ease of taking money out of assets, especially houses through mortgage refinancing. The huge influx of foreign investments has helped, pushing down interest rates and boosting asset values. Over the past three years, foreigners have purchased over $500 billion in corporate bonds, over $400 billion of Treasuries and $225 billion in mortgage-backed securities. This foreign investment has helped corporate spreads as well. There has been a large improvement in credit spreads on corporate bonds over the last few years, but that improvement has moderated over the last six months as quality spreads are now at levels last seen in 1998.
If the March payroll report is not an aberration, but the start of robust employment growth, then the outlook for the raising of the Fed Funds Rate may now change its focus from payrolls to inflation. If strong GDP growth continues and employment is rising, the last ingredient for the Fed staying accommodative is low inflation. The members of the Federal Open Market Committee have stated that they do not believe that inflation is much of a problem right now. The bond market, however, is starting to worry that inflation has reached its nadir and will start to move up from here. The large increases in prices for energy and commodities have helped fuel speculation that inflation is on the rise.
2
Thornburg Limited Term Income Funds
Letter to shareholders, CONTINUED
It appears evident that the Fed will hold short rates steady for a while; the lost jobs need to be replaced and that will take six months of 300,000-employment growth; the economy needs to keep growing at a steady pace; and, inflation needs to accelerate from here. All of these are within reach, but not in the next few months. The bond market tries to be proactive, however. If it is believed that the Fed will have to start raising rates, the bond market may start increasing yields before the Fed has changed their stance. We are cognizant of this as we manage the portfolios for the future.
Regardless of the direction of interest rates, we believe your funds are well positioned. The Thornburg Limited Term Income Fund and the Thornburg Limited Term U.S. Government Fund are laddered portfolios of short-to-intermediate bonds. We keep the portfolios laddered over a time period ranging from one day to approximately ten years, with the average maturity of the portfolios always no more than five years. Some of the bonds are always coming close to maturity, but never too many at one time. We believe a laddered maturity portfolio of short-to-intermediate bonds is a sensible strategy over time. Intermediate bonds have proven to be a sensible part of a portfolio. They can provide stability to the underlying principal, they can provide income for the portfolio, and, over the years, they have provided an attractive return versus money market instruments. Please review the charts at the back of the report, which show the return on an investment in the Thornburg Limited Term Income Fund and the Thornburg Limited Term U.S. Government Fund versus the money market funds average.
Thank you for investing in our Funds. We believe the Thornburg Limited Term U.S. Government Fund and the Thornburg Limited Term Income Fund are appropriate investments for investors who want a short-to-intermediate bond portfolio. While future performance cannot be guaranteed, we believe that we are well positioned and we will maintain a steady course.
Steven J. Bohlin
Portfolio Manager
The Lehman Brothers Intermediate Government/Credit Bond Index is an unmanaged, market-weighted index generally representative of intermediate government and investment grade corporate debt securities having maturities of up to ten years.
The Lehman Brothers Intermediate Government Bond Index is an unmanaged market-weighted index generally representative of all public obligations of the U.S. Government, its agencies and instrumentalities having maturities of up to ten years.
3
Statements of assets and liabilities
Thornburg Limited Term Income Funds
March 31, 2004
(Unaudited)
| Limited Term U.S. Government Fund | Limited Term Income Fund | |||||||
|---|---|---|---|---|---|---|---|---|
| ASSETS | ||||||||
| Investments at value (cost $224,817,842 and $367,358,479 respectively) | $ | 232,248,587 | $ | 382,172,551 | ||||
| Cash | 692,932 | 1,838,451 | ||||||
| Cash denominated in foreign currency (cost $66,710) | 0 | 68,694 | ||||||
| Receivable for investments sold | 568 | 2,481,005 | ||||||
| Principal receivable | 14,759 | 0 | ||||||
| Receivable for fund shares sold | 386,508 | 1,767,919 | ||||||
| Interest receivable | 2,242,690 | 3,988,997 | ||||||
| Prepaid expenses and other assets | 51,545 | 47,892 | ||||||
| Total Assets | 235,637,589 | 392,365,509 | ||||||
| LIABILITIES | ||||||||
| Payable for securities purchased | 0 | 15,415,287 | ||||||
| Payable for fund shares redeemed | 794,501 | 220,028 | ||||||
| Accounts payable and accrued expenses | 124,993 | 110,984 | ||||||
| Payable to investment advisor (Note 3) | 93,454 | 163,611 | ||||||
| Dividends payable | 534,507 | 981,029 | ||||||
| Total Liabilities | 1,547,455 | 16,890,939 | ||||||
| NET ASSETS | $ | 234,090,134 | $ | 375,474,570 | ||||
| NET ASSETS CONSIST OF: | ||||||||
| Undistributed (distribution in excess of) net investment income | $ | 83,335 | $ | 5,946 | ||||
| Net unrealized appreciation (depreciation) on investments | 7,430,745 | 14,816,802 | ||||||
| Accumulated net realized (gain) loss | (3,080,188 | ) | (2,667,468 | ) | ||||
| Net capital paid in on shares of beneficial interest | 229,656,242 | 363,319,290 | ||||||
| $ | 234,090,134 | $ | 375,474,570 | |||||
| NET ASSET VALUE: | ||||||||
| Class A Shares: | ||||||||
| Net asset value and redemption price per share ($168,411,245 and $219,355,942 | ||||||||
| applicable to 12,693,592 and 16,815,610 shares of beneficial interest | ||||||||
| outstanding - Note 4) | $ | 13.27 | $ | 13.04 | ||||
| Maximum sales charge, 1.50% of offering price | 0.20 | 0.20 | ||||||
| Maximum Offering Price Per Share | $ | 13.47 | $ | 13.24 | ||||
| Class B Shares: | ||||||||
| Net asset value and offering price per share* ($2,563,517 | ||||||||
| applicable to 193,299 shares of beneficial | ||||||||
| interest outstanding - Note 4) | $ | 13.26 | $ | 0 | ||||
| Class C Shares: | ||||||||
| Net asset value and offering price per share* ($50,782,122 and | ||||||||
| $64,660,170 applicable to 3,804,234 and 4,964,653 shares of | ||||||||
| beneficial interest outstanding - Note 4) | $ | 13.35 | $ | 13.02 | ||||
| Class I Shares: | ||||||||
| Net asset value, offering and redemption price per share ($12,291,953 | ||||||||
| and $91,400,039 applicable to 926,663 and 7,006,356 shares | ||||||||
| of beneficial interest outstanding - Note 4) | $ | 13.26 | $ | 13.05 | ||||
| Class R-1 Shares: | ||||||||
| Net asset value, offering and redemption price per share ($41,297 | ||||||||
| and $58,419 applicable to 3,111 and 4,477 shares | ||||||||
| of beneficial interest outstanding - Note 4) | $ | 13.28 | $ | 13.05 | ||||
| * Redemption price per share is equal to net asset value less any applicable contingent deferred sales charges See notes to financial statements. | ||||||||
4
| STATEMENTS OF OPERATIONS | ||||||||
|---|---|---|---|---|---|---|---|---|
| Thornburg Limited Term Income Funds | Six Months Ended March 31, 2004 | |||||||
| (Unaudited) | ||||||||
| INVESTMENT INCOME: | Limited Term U.S. Government Fund | Limited Term Income Fund | ||||||
| Interest income (net of premium amortized | ||||||||
| of $1,157,485 and $692,130 respectively) | $ | 4,407,948 | $ | 7,205,589 | ||||
| EXPENSES: | ||||||||
| Investment advisory fees (Note 3) | 443,989 | 834,653 | ||||||
| Administration fees (Note 3) | ||||||||
| Class A Shares | 105,591 | 125,814 | ||||||
| Class B Shares | 1,707 | 0 | ||||||
| Class C Shares | 33,022 | 36,712 | ||||||
| Class I Shares | 3,116 | 18,449 | ||||||
| Class R-1 Shares | 5 | 15 | ||||||
| Distribution and service fees (Note 3) | ||||||||
| Class A Shares | 142,939 | 201,905 | ||||||
| Class B Shares | 14,410 | 0 | ||||||
| Class C Shares | 269,193 | 301,423 | ||||||
| Class R-1 Shares | 39 | 125 | ||||||
| Transfer agent fees | ||||||||
| Class A Shares | 74,740 | 103,350 | ||||||
| Class B Shares | 8,271 | |||||||
| Class C Shares | 31,725 | 36,630 | ||||||
| Class I Shares | 8,995 | 18,140 | ||||||
| Class R-1 Shares | 992 | 900 | ||||||
| Registration and filing fees | ||||||||
| Class A Shares | 7,611 | 5,843 | ||||||
| Class B Shares | 7,320 | |||||||
| Class C Shares | 4,526 | 4,452 | ||||||
| Class I Shares | 4,979 | 4,824 | ||||||
| Class R-1 Shares | 7,794 | 7,794 | ||||||
| Custodian fees (Note 3) | 64,863 | 82,008 | ||||||
| Professional fees | 19,840 | 30,935 | ||||||
| Accounting fees | 10,210 | 10,515 | ||||||
| Trustee fees | 3,406 | 3,714 | ||||||
| Other expenses | 32,401 | 34,729 | ||||||
| Total Expenses | 1,301,684 | 1,862,930 | ||||||
| Less: | ||||||||
| Expenses reimbursed by investment advisor (Note 3) | (35,222 | ) | (102,652 | ) | ||||
| Distribution and service fees waived (Note 3) | (134,616 | ) | (150,774 | ) | ||||
| Fees paid indirectly (Note 3) | (2,663 | ) | (4,538 | ) | ||||
| Net Expenses | 1,129,183 | 1,604,966 | ||||||
| Net Investment Income | $ | 3,278,765 | $ | 5,600,623 | ||||
5
Six Months Ended March 31, 2004
(Unaudited)
| Limited Term U.S. Government Fund | Limited Term Income Fund | |||||||
|---|---|---|---|---|---|---|---|---|
| REALIZED AND UNREALIZED GAIN (LOSS) | ||||||||
| Net Realized Gain Loss) on: | ||||||||
| Investments | $ | 137,645 | $ | (984,392 | ) | |||
| Net change in unrealized appreciation (depreciation) on: | ||||||||
| Investments | 403,287 | 2,980,352 | ||||||
| Foreign currency translation | 000 | (525 | ) | |||||
| 403,287 | 2,979,827 | |||||||
| Net Realized and Unrealized | ||||||||
| Gain (Loss) on Investments | 540,932 | 1,995,435 | ||||||
| Net Increase (Decrease) in Net Assets Resulting | ||||||||
| From Operations | $ | 3,819,697 | $ | 7,596,058 | ||||
| See notes to financial statements | ||||||||
6
| Statements of changes in net assets Thornburg Limited Term U.S. Government Fund | ||||||||
|---|---|---|---|---|---|---|---|---|
| Six Months Ended March 31, 2004 | Year Ended September 30, 2003 | |||||||
| INCREASE (DECREASE) IN NET ASSETS FROM: | ||||||||
| OPERATIONS: | ||||||||
| Net investment income | $ | 3,278,765 | $ | 7,983,017 | ||||
| Net realized gain (loss) on investments sold | 137,645 | 4,695,491 | ||||||
| Increase (Decrease) in unrealized appreciation | 403,287 | (5,709,054 | ) | |||||
| Net Increase (Decrease) in Net Assets | ||||||||
| Resulting from Operations | 3,819,697 | 6,969,454 | ||||||
| DIVIDENDS TO SHAREHOLDERS: | ||||||||
| From net investment income | ||||||||
| Class A Shares | (2,404,539 | ) | (6,174,157 | ) | ||||
| Class B Shares | (28,815 | ) | (50,597 | ) | ||||
| Class C Shares | (655,987 | ) | (1,378,892 | ) | ||||
| Class I Shares | (189,311 | ) | (379,370 | ) | ||||
| Class R-1 Shares | (113 | ) | (1 | ) | ||||
| FUND SHARE TRANSACTIONS (Note 4): | ||||||||
| Class A Shares | (8,864,749 | ) | 21,836,105 | |||||
| Class B Shares | (510,422 | ) | 3,080,205 | |||||
| Class C Shares | (5,494,408 | ) | 25,756,540 | |||||
| �� Class I Shares | (822,238 | ) | 6,129,775 | |||||
| Class R-1 Shares | 41,046 | 76 | ||||||
| Net Increase (Decrease) in Net Assets | (15,109,839 | ) | 55,789,138 | |||||
| NET ASSETS: | ||||||||
| Beginning of period | 249,199,973 | 193,410,835 | ||||||
| End of period | $ | 234,090,134 | $ | 249,199,973 | ||||
| See notes to financial statements | ||||||||
7
| Statements of Changes in Net Assets Thornburg Limited Term Income Fund | ||||||||
|---|---|---|---|---|---|---|---|---|
| Six Months Ended March 31, 2004 | Year Ended September 30, 2003 | |||||||
| INCREASE (DECREASE) IN NET ASSETS FROM: | ||||||||
| OPERATIONS: | ||||||||
| Net investment income | $ | 5,600,623 | $ | 9,222,797 | ||||
| Net realized gain (loss) on investments sold | (984,392 | ) | 1,075,205 | |||||
| Increase (Decrease) in unrealized appreciation | 2,979,827 | 2,954,124 | ||||||
| Net Increase (Decrease) in Net Assets | ||||||||
| Resulting from Operations | 7,596,058 | 13,252,126 | ||||||
| DIVIDENDS TO SHAREHOLDERS: | ||||||||
| From net investment income | ||||||||
| Class A Shares | (3,355,045 | ) | (5,571,809 | ) | ||||
| Class C Shares | (900,913 | ) | (1,505,535 | ) | ||||
| Class I Shares | (1,344,277 | ) | (2,145,452 | ) | ||||
| Class R-1 Shares | (388 | ) | (1 | ) | ||||
| FUND SHARE TRANSACTIONS (Note 4): | ||||||||
| Class A Shares | 33,748,674 | 77,437,936 | ||||||
| Class C Shares | 9,417,731 | 23,908,108 | ||||||
| Class I Shares | 31,358,671 | 19,271,605 | ||||||
| Class R-1 Shares | 57,483 | 76 | ||||||
| Net Increase (Decrease) in Net Assets | 76,577,994 | 124,647,054 | ||||||
| NET ASSETS: | ||||||||
| Beginning of period | 298,896,576 | 174,249,522 | ||||||
| End of period | $ | 375,474,570 | $ | 298,896,576 | ||||
See notes to financial statements.
8
Notes to financial statements
Thornburg Limited Term Income Funds
March 31, 2004
NOTE 1 – ORGANIZATION Thornburg Limited Term U.S. Government Fund (the “Government Fund”) and Thornburg Limited Term Income Fund (the “Income Fund”), hereafter referred to collectively as the “Funds”, are diversified series of Thornburg Investment Trust (the “Trust”). The Trust is organized as a Massachusetts business trust under a Declaration of Trust dated June 3, 1987 and is registered as a diversified, open-end management investment company under the Investment Company Act of 1940, as amended. The Trust is currently issuing eight series of shares of beneficial interest in addition to those of the Funds: Thornburg Florida Intermediate Municipal Fund, Thornburg New York Intermediate Municipal Fund, Thornburg New Mexico Intermediate Municipal Fund, Thornburg Intermediate Municipal Fund, Thornburg Value Fund, Thornburg International Value Fund, Thornburg Core Growth Fund, and Thornburg Investment Income Builder Fund. Each series is considered to be a separate entity for financial reporting and tax purposes and bears expenses directly attributable to it. The Funds’ objectives are to obtain as high a level of current income as is consistent with the preservation of capital.
The Government Fund currently offers five classes of shares of beneficial interest, Class A, Class B, Class C, Institutional Class (Class I), and Retirement Class (Class R-1) shares. The Income Fund currently offers four classes of shares of beneficial interest, Class A, Class C, Institutional Class (Class I), and Retirement Class (Class R-1) shares. Each class of shares of a fund represents an interest in the same portfolio of investments of that fund, except that (i) Class A shares are sold subject to a front-end sales charge collected at the time the shares are purchased and bear a service fee, (ii) Class B shares are sold at net asset value without a sales charge at the time of purchase, but are subject to a contingent deferred sales charge upon redemption and bear both a service fee and distribution fee, (iii) Class C shares are sold at net asset value without a sales charge at the time of purchase, but are subject to a contingent deferred sales charge upon redemption and bear both a service fee and a distribution fee, (iv) Class I shares are sold at net asset value without a sales charge at the time of purchase, (v) Class R-1 shares are sold at net asset value without a sales charge, but bear both a service fee and a distribution fee, and (vi) the respective classes have different reinvestment privileges. Additionally, each fund may allocate among its classes certain expenses, to the extent allowable to specific classes, including transfer agent fees, government registration fees, certain printing and postage costs, and administrative and legal expenses. Currently, class specific expenses of the Funds are limited to service and distribution fees, administrative fees and certain registration and transfer agent expenses.
NOTE 2 – SIGNIFICANT ACCOUNTING POLICIES
Significant accounting policies of the Fund are as follows:
Valuation of Investments: In determining net asset value, the Funds utilize an independent pricing service approved by the Trustees. Debt investment securities have a primary market over the counter and are valued on the basis of valuations furnished by the pricing service. The pricing service values portfolio securities at quoted bid prices, normally at 4:00 pm EST or the yield equivalents when quotations are not readily available. Securities for which quotations are not readily available are valued at fair value as determined by the pricing service using methods which include consideration of yields or prices of obligations of comparable quality, type of issue, coupon, maturity, and rating; indications as to value from dealers and general market conditions. The valuation procedures used by the pricing service and the portfolio valuations received by the Funds are reviewed by the officers of the Trust under the general supervision of the Trustees. Short-term instruments having a maturity of 60 days or less are valued at amortized cost, which approximates market value.
Federal Income Taxes: It is the policy of the Funds to comply with the provisions of the Internal Revenue code applicable to “regulated investment companies” and to distribute all of their taxable income, including any net realized gain on investments to its shareholders. Therefore, no provision for Federal income taxes is required.
When-Issued and Delayed Delivery Transactions: The Funds may engage in when-issued or delayed delivery transactions. To the extent the Funds engage in such transactions, they will do so for the purpose of acquiring portfolio securities consistent with their investment objectives and not for the purpose of investment leverage or to speculate on interest rate changes. At the time the Funds make a commitment to purchase a security on a when-issued basis, they will record the transaction and reflect the value in determining each fund’s net asset value. When effecting such transactions, assets of the Funds of an amount sufficient to make payment for the portfolio securities to be purchased will be segregated on the Funds’ records at the trade date. Securities purchased on a when-issued or delayed delivery basis do not earn interest until the settlement date.
Dividends: Net investment income of the Funds are declared daily as a dividend on shares for which the Funds have received payment. Dividends are paid monthly and are
9
Notes to financial statements, continued
Thornburg Limited Term Income Funds
March 31, 2004
reinvested in additional shares of the Funds at net asset value per share at the close of business on the dividend payment date, or at the shareholder’s option, paid in cash. Net capital gains, to the extent available, will be distributed at least annually.
General: Securities transactions are accounted for on a trade date basis. Interest income is accrued as earned. Premiums and discounts on securities purchased are amortized over the life of the respective securities. Realized gains and losses from the sale of securities are recorded on an identified cost basis. The Funds invest in various mortgage-backed securities. Such securities pay interest and a portion of principal each month, which is then available for investment in securities at prevailing prices. Net investment income, other than class specific expenses, and realized and unrealized gains and losses, are allocated daily to each class of shares based upon the relative net asset value of outstanding shares (or the value of the dividend-eligible shares, as appropriate) of each class of shares at the beginning of the day (after adjusting for the current share activity of the respective class). Expenses common to all funds are allocated among the funds comprising the Trust based upon their relative net asset values or other appropriate allocation methods.
Foreign Currency Transactions: With respect to the Income Fund, portfolio securities and other assets and liabilities denominated in foreign currencies are translated into U.S. dollars based on the rate of exchange of such currencies against U.S. dollars on the date of valuation. Purchases and sales of portfolio securities and interest denominated in foreign currencies are translated into U.S. dollar amounts on the respective dates of such transactions.
The Income Fund does not isolate that portion of the results of operations resulting from changes in foreign exchange rates on investments from the fluctuations arising from changes in market prices of securities held. Such fluctuations are included with the net realized and unrealized gain or loss from investments.
Reported net realized foreign exchange gains or losses arise from sales of foreign currencies, currency gains or losses realized between the trade and settlement dates on securities transactions and the difference between the amount of interest recorded on the Income Fund’s books and the U.S. dollar equivalent of the amounts actually received or paid.
Guarantees and Indemnifications: Under the Trust’s organizational documents, its officers and trustees are indemnified against certain liability arising out of the performance of their duties to the Funds. Additionally, in the normal course of business, the Trust enters into contracts with service providers that contain general indemnification clauses. The Trust’s maximum exposure under these arrangements is unknown. However, based on experience, the Trust expects the risk of loss to be remote.
Use of Estimates: The preparation of financial statements, in conformity with generally accepted accounting principles, requires management to make estimates and assumptions that affect the reported amounts of assets and liabilities and the disclosure of contingent assets and liabilities at the date of the financial statements and the reported amounts of increases and decreases in net assets from operations during the reporting period. Actual results could differ from those estimates.
NOTE 3 — INVESTMENT ADVISORY FEE AND OTHER TRANSACTIONS WITH AFFILIATES
Pursuant to an investment advisory agreement, Thornburg Investment Management, Inc. (the “Advisor”) serves as the investment advisor and performs services to the Funds for which the fees are payable at the end of each month. For the period ended March 31, 2004, these fees were payable at annual rates ranging from .375 of 1% to .275 of 1% of the average daily net assets of the Government Fund and .50 of 1% to .275 of 1% of the average daily net assets of the Income Fund depending on each fund’s asset size. The Funds also have an administrative services agreement with the Advisor, whereby the Advisor will perform certain administrative services for the shareholders of each class of each fund’s shares, and for which fees will be payable at an annual rate of up to .125 of 1% of the average daily net assets attributable to Class A, Class B, Class C, and Class R-1 shares, and up to .05 of 1% of the average daily net assets attributable to Class I shares. For the period ended March 31, 2004, the Advisor voluntarily reimbursed certain class specific expenses and administrative fees of $16,365, $4,658, $5,405, and $8,794 for the Class B, C, I, and R-1 shares, respectively, of the Government Fund and $42,694, $37,426, $13,818, and $8,714 for the Class A, C, I, and R-1 shares, respectively, of the Income Fund.
The Funds have underwriting agreements with Thornburg Securities Corporation (the “Distributor”), which acts as the distributor of each fund’s shares. For the period ended March 31, 2004, the Distributor has advised the Funds that it earned net commissions aggregating $1,321 and $1,159 from the sales of Class A shares of the Government Fund and Income Fund, respectively, and collected contingent deferred sales charges aggregating $11,053 and $7,656 from redemptions of Class C shares of the Government Fund and Income Fund, respectively.
10
Thornburg Limited Term Income Funds
Notes to financial statements, continued
Pursuant to a service plan under Rule 12b-1 of the Investment Company Act of 1940, the Funds may reimburse to the Advisor an amount not to exceed .25 of 1% per annum of its average daily net assets attributable to the Class A, Class B, Class C, and Class R-1 shares of the Funds for payments made by the Advisor to securities dealers and other financial institutions to obtain various shareholder related services. The Advisor may pay out of its own resources additional expenses for distribution of each fund’s shares. The Funds have also adopted distribution plans pursuant to Rule 12b-1, applicable to each fund’s Class B, Class C, and Class R-1 shares under which the Funds compensate the Distributor for services in promoting the sale of Class B, C, and R-1 shares of the Funds at an annual rate of up to ..75 of 1% of the average daily net assets attributable to these classes. Total fees incurred by each class of shares of the Funds under their respective service and distribution plans for the period ended March 31, 2004 are set forth in the Statements of Operations. Distribution fees of $134,616 and $150,774 respectively for Class C shares of the Government Fund and Income Fund were waived.
The Funds have an agreement with the custodian bank to indirectly pay a portion of the custodian’s fees through credits earned by each fund’s cash on deposit with the bank. This deposit agreement is an alternative to overnight investments. Custodial fees have been adjusted to reflect amounts that would have been paid without this agreement, with a corresponding adjustment reflected as fees paid indirectly in the Statements of Operations. For the period ended March 31, 2004, the fees paid indirectly were $2,663 and $4,538 for the Government Fund and Income Fund respectively.
Certain officers and trustees of the Trust are also officers and/or directors of the Advisor and Distributor. The compensation of unaffiliated trustees is borne by the Trust.
NOTE 4 — SHARES OF BENEFICIAL INTEREST
At March 31, 2004 there were an unlimited number of shares of beneficial interest authorized. Sales of Class R-1 Shares commenced July 1, 2003. Transactions in shares of beneficial interest were as follows:
| GOVERNMENT FUND | Period Ended March 31, 2004 | Year Ended September 30, 2003 | ||||||||||||
|---|---|---|---|---|---|---|---|---|---|---|---|---|---|---|
| Shares | Amount | Shares | Amount | |||||||||||
| Class A Shares | ||||||||||||||
| Shares sold | 1,749,617 | $ | 23,007,642 | 7,033,728 | $ | 93,088,730 | ||||||||
| Shares issued to shareholders in | 114,379 | 1,499,320 | 352,071 | 4,651,838 | ||||||||||
| reinvestment of dividends | ||||||||||||||
| Shares repurchased | (2,543,701 | ) | (33,371,711 | ) | (5,757,412 | ) | (75,904,463 | ) | ||||||
| Net Increase (Decrease) | (679,705 | ) | $ | (8,864,749 | ) | 1,628,387 | $ | 21,836,105 | ||||||
| Class B Shares | ||||||||||||||
| Shares sold | 41,064 | $ | 541,568 | 265,526 | $ | 3,519,557 | ||||||||
| Shares issued to shareholders in | 1,199 | 15,690 | 2,704 | 35,753 | ||||||||||
| reinvestment of dividends | ||||||||||||||
| Shares repurchased | (81,301 | ) | (1,067,680 | ) | (35,893 | ) | (475,105 | ) | ||||||
| Net Increase (Decrease) | (39,038 | ) | $ | (510,422 | ) | 232,337 | $ | 3,080,205 | ||||||
| Class C Shares | ||||||||||||||
| Shares sold | 459,976 | $ | 6,081,199 | 2,733,738 | $ | 36,415,998 | ||||||||
| Shares issued to shareholders in | 30,870 | 407,054 | 83,795 | 1,113,966 | ||||||||||
| reinvestment of dividends | ||||||||||||||
| Shares repurchased | (907,277 | ) | (11,982,661 | ) | (887,516 | ) | (11,773,424 | ) | ||||||
| Net Increase (Decrease) | (416,431 | ) | $ | (5,494,408 | ) | 1,930,017 | $ | 25,756,540 | ||||||
11
Thornburg Limited Term Income Funds
Notes to financial statements, continued
March 31, 2004
| Period Ended March 31, 2004 | Year Ended September 30, 2003 | |||||||||||||
|---|---|---|---|---|---|---|---|---|---|---|---|---|---|---|
| Shares | Amount | Shares | Amount | |||||||||||
| Class I Shares | ||||||||||||||
| Shares sold | 245,315 | $ | 3,210,274 | 808,309 | $ | 10,671,009 | ||||||||
| Shares issued to shareholders in | 10,057 | 131,822 | 24,410 | 322,502 | ||||||||||
| reinvestment of dividends | ||||||||||||||
| Shares repurchased | (318,194 | ) | (4,164,334 | ) | (367,766 | ) | (4,863,736 | ) | ||||||
| Net Increase (Decrease) | (62,822 | ) | $ | (822,238 | ) | 464,953 | $ | 6,129,775 | ||||||
| Class R-1 Shares | ||||||||||||||
| Shares sold | 3,399 | $ | 44,964 | 6 | $ | 75 | ||||||||
| Shares issued to shareholders in | 1 | 8 | -- | 1 | ||||||||||
| reinvestment of dividends | ||||||||||||||
| Shares repurchased | (295 | ) | (3,926 | ) | -- | -- | ||||||||
| Net Increase (Decrease) | 3,105 | $ | 41,046 | 6 | $ | 76 | ||||||||
| INCOME FUND | Period Ended March 31, 2004 | Year Ended September 30, 2003 | ||||||||||||
|---|---|---|---|---|---|---|---|---|---|---|---|---|---|---|
| Shares | Amount | Shares | Amount | |||||||||||
| Class A Shares | ||||||||||||||
| Shares sold | 4,541,406 | $ | 58,626,933 | 8,212,612 | $ | 105,632,467 | ||||||||
| Shares issued to shareholders in | 157,855 | 2,033,515 | 317,279 | 4,076,963 | ||||||||||
| reinvestment of dividends | ||||||||||||||
| Shares repurchased | (2,084,354 | ) | (26,911,774 | ) | (2,518,725 | ) | (32,271,494 | ) | ||||||
| Net Increase (Decrease) | 2,614,907 | $ | 33,748,674 | 6,011,166 | $ | 77,437,936 | ||||||||
| Class C Shares | ||||||||||||||
| Shares sold | 1,313,066 | $ | 16,929,965 | 2,753,770 | $ | 35,318,563 | ||||||||
| Shares issued to shareholders in | 38,708 | 497,854 | 83,893 | 1,076,023 | ||||||||||
| reinvestment of dividends | ||||||||||||||
| Shares repurchased | (621,459 | ) | (8,010,088 | ) | (973,489 | ) | (12,486,478 | ) | ||||||
| Net Increase (Decrease) | 730,315 | $ | 9,417,731 | 1,864,174 | $ | 23,908,108 | ||||||||
| Class I Shares | ||||||||||||||
| Shares sold | 2,932,414 | $ | 37,863,589 | 2,435,755 | $ | 31,247,349 | ||||||||
| Shares issued to shareholders in | 77,080 | 993,296 | 150,329 | 1,931,913 | ||||||||||
| reinvestment of dividends | ||||||||||||||
| Shares repurchased | (580,634 | ) | (7,498,214 | ) | (1,080,571 | ) | (13,907,657 | ) | ||||||
| Net Increase (Decrease) | 2,428,860 | $ | 31,358,671 | 1,505,513 | $ | 19,271,605 | ||||||||
| Class R-1 Shares | ||||||||||||||
| Shares sold | 4,453 | $ | 57,245 | 6 | $ | 75 | ||||||||
| Shares issued to shareholders in | 18 | 238 | -- | 1 | ||||||||||
| reinvestment of dividends | ||||||||||||||
| Shares repurchased | -- | -- | -- | -- | ||||||||||
| Net Increase (Decrease) | 4,471 | $ | 57,483 | 6 | $ | 76 | ||||||||
12
Notes to financial statements, continued
Thornburg Limited Term Income Funds
NOTE 5 – SECURITIES TRANSACTIONS
For the period ended March 31, 2004, portfolio purchase and sale transactions (excluding short-term securities) were $3,935,000 and $13,385,186 for the Government Fund and $115,828,820 and $44,374,733 for the Income Fund, respectively.
NOTE 6 – INCOME TAXES
At March 31, 2004, information on the tax components of capital is as follows:
| Government Fund | Income Fund | |||||||
|---|---|---|---|---|---|---|---|---|
| Cost of investments | ||||||||
| for tax purpose | $ | 224,817,842 | $ | 367,531,570 | ||||
| Gross unrealized | ||||||||
| appreciation on a tax basis | $ | 8,158,030 | $ | 15,227,827 | ||||
| Gross unrealized | ||||||||
| depreciation on a tax basis | (727,285 | ) | (413,755 | ) | ||||
| Net unrealized | ||||||||
| appreciation (depreciation) | ||||||||
| on investments (tax basis) | $ | 7,430,745 | $ | 14,814,072 | ||||
| Distributable earnings- | ||||||||
| ordinary income | $ | 83,335 | $ | 5,946 | ||||
At March 31, 2004, the Government Fund had tax basis capital losses, which may be carried over to offset future capital gains. Such losses expire as follows: Capital loss carryovers expiring in:
| 2004 | $ | 2,026,055 | |||
| 2008 | 17,646 | ||||
| 2009 | 1,160,521 | ||||
| 2010 | 13,611 | ||||
| $ | 3,217,833 | ||||
At March 31, 2004, the Income Fund had tax basis capital losses, which may be carried over to offset future capital gains. Such losses expire as follows: Capital loss carryovers expiring in:
| 2004 | $ | 225,978 | |||
| 2008 | 497,824 | ||||
| 2009 | 650,941 | ||||
| 2010 | 308,333 | ||||
| $ | 1,683,076 | ||||
Unutilized tax basis capital losses may be carried forward to offset realized gains in future years. To the extent such carry forwards are used, capital gains distributions may be reduced to the extent provided by regulations.
13
| Financial highlights | ||||||
|---|---|---|---|---|---|---|
| Thornburg Limited Term U.S. Government Fund | ||||||
| Six Months Ended | Year Ended September 30, | |||||
| March 31, 2004 | 2003 | 2002 | 2001 | 2000 | 1999 | |
| Class I Shares: | ||||||
| Per Share Performance | ||||||
| (for a share outstanding throughout the period) | ||||||
| Net asset value, beginning of period | $ 13.22 | $ 13.27 | $ 12.77 | $ 12.03 | $ 12.05 | $ 12.65 |
| Income from investment operations: | ||||||
| Net investment income | 0.20 | 0.51 | 0.62 | 0.72 | 0.72 | 0.70 |
| Net realized and unrealized | ||||||
| gain (loss) on investments | 0.04 | (0.05) | 0.50 | 0.74 | (0.02) | (0.60) |
| Total from investment operations | 0.24 | 0.46 | 1.12 | 1.46 | 0.70 | 0.10 |
| Less dividends from: | ||||||
| Net investment income | (0.20) | (0.51) | (0.62) | (0.72) | (0.72) | (0.70) |
| Change in net asset value | 0.04 | (0.05) | 0.50 | 0.74 | (0.02) | (0.60) |
| Net asset value, end of period | $ 13.26 | $ 13.22 | $ 13.27 | $ 12.77 | $ 12.03 | $ 12.05 |
| Total return (a) | 1.84% | 3.51% | 9.11% | 12.45% | 6.07% | 0.82% |
| Ratios/Supplemental Data | ||||||
| Ratios to average net assets: | ||||||
| Net investment income | 3.04% (b) | 3.77% | 4.86% | 5.79% | 6.06% | 5.69% |
| Expenses, after expense reductions | 0.67% (b) | 0.64% | 0.61% | 0.61% | 0.60% | 0.60% |
| Expenses, after expense reductions | ||||||
| and net of custody credits | 0.67% (b) | 0.62% | 0.60% | -- | -- | -- |
| Expenses, before expense reductions | 0.76% (b) | 0.82% | 1.04% | 1.21% | 1.08% | 1.06% |
| Portfolio turnover rate | 1.74% | 35.06% | 4.34% | 15.23% | 19.66% | 19.39% |
| Net assets at end of period (000) | $ 12,292 | $ 13,085 | $ 6,960 | $ 3,992 | $ 3,819 | $ 5,612 |
(a) Not annualized for periods less than one year.
(b) Annualized.
14
| Financial highlights, continued | ||||||
|---|---|---|---|---|---|---|
| Thornburg Limited Term Income Fund | ||||||
| Six Months Ended | Year Ended September 30, | |||||
| March 31, 2004 | 2003 | 2002 | 2001 | 2000 | 1999 | |
| Class I Shares: | ||||||
| Per Share Performance | ||||||
| (for a share outstanding throughout the period) | ||||||
| Net asset value, beginning of period | $ 12.99 | $ 12.79 | $ 12.55 | $ 11.90 | $ 11.93 | $ 12.50 |
| Income from investment operations: | ||||||
| Net investment income | 0.24 | 0.55 | 0.65 | 0.77 | 0.77 | 0.73 |
| Net realized and unrealized | ||||||
| gain (loss) on investments | 0.06 | 0.20 | 0.24 | 0.65 | (0.03) | (0.57) |
| Total from investment operations | 0.30 | 0.75 | 0.89 | 1.42 | 0.74 | 0.16 |
| Less dividends from: | ||||||
| Net investment income | (0.24) | (0.55) | (0.65) | (0.77) | (0.77) | (0.68) |
| Return of Capital | -- | -- | -- | -- | -- | (0.05) |
| Change in net asset value | 0.06 | 0.20 | 0.24 | 0.65 | (0.03) | (0.57) |
| Net asset value, end of period | $ 13.05 | $ 12.99 | $ 12.79 | $ 12.55 | $ 11.90 | $ 11.93 |
| Total return (a) | 2.39% | 5.89% | 7.38% | 12.29% | 6.46% | 1.32% |
| Ratios/Supplemental Data | ||||||
| Ratios to average net assets: | ||||||
| Net investment income | 3.17% (b) | 4.23% | 5.19% | 6.24% | 6.54% | 5.99% |
| Expenses, after expense reductions | 0.67% (b) | 0.69% | 0.69% | 0.70% | 0.69% | 0.69% |
| Expenses, after expense reductions | ||||||
| and net of custody credits | 0.67% (b) | 0.69% | 0.69% | -- | -- | -- |
| Expenses, before expense reductions | 0.71% (b) | 0.76% | 0.78% | 0.89% | 1.00% | 1.01% |
| Portfolio turnover rate | 14.04% | 18.86% | 21.63% | 20.54% | 59.46% | 48.50% |
| Net assets at end of period (000) | $ 91,400 | $ 59,473 | $ 39,281 | $ 24,298 | $ 12,094 | $ 9,928 |
(a) Not annualized for periods less than one year.
(b) Annualized.
15
| SCHEDULE OF INVESTMENTS | ||||||||
|---|---|---|---|---|---|---|---|---|
| Thornburg Limited Term U.S. Governemnt Fund | March 31, 2004 | |||||||
| CUSIPS: CLASS A - 885-215-103, CLASS B - 885-215-848, CLASS C - 885-215-830, CLASS I - 885-215-699, CLASS R-1 - 885-215-491 NASDAQ SYMBOLS: CLASS A - LTUSX, CLASS B - LTUBX, CLASS C - LTUCX, CLASS I - LTUIX, CLASS R-1 - LTURX | ||||||||
| Security Name | Principal Amount | Value | ||||||
| U.S. Government Agencies (41.20%) | ||||||||
| Federal Agricultural Mortgage Corp., 5.86% due 3/3/2006 | 900,000 | $ | 970,318 | |||||
| Federal Agricultural Mortgage Corp., 8.07% due 7/17/2006 | 1,000,000 | 1,139,308 | ||||||
| Federal Agricultural Mortgage Corp., 6.71% due 7/28/2014 | 200,000 | 238,709 | ||||||
| Federal Farm Credit Bank, 1.875% due 1/16/2007 | 4,650,000 | 4,617,258 | ||||||
| Federal Farm Credit Bank, 6.75% due 7/7/2009 | 350,000 | 410,216 | ||||||
| Federal Farm Credit Bank Consolidated MTN, 5.875% due 7/28/2008 | 1,900,000 | 2,139,419 | ||||||
| Federal Farm Credit Bank Consolidated MTN, 5.87% due 9/2/2008 | 1,300,000 | 1,464,011 | ||||||
| Federal Farm Credit Bank Consolidated MTN, 5.35% due 12/11/2008 | 200,000 | 220,875 | ||||||
| Federal Farm Credit Bank Consolidated MTN, 5.80% due 3/19/2009 | 300,000 | 337,471 | ||||||
| Federal Farm Credit Bank Consolidated MTN, 6.06% due 5/28/2013 | 240,000 | 274,735 | ||||||
| Federal Home Loan Bank, 6.55% due 3/7/2005 | 265,000 | 277,997 | ||||||
| Federal Home Loan Bank, 6.345% due 11/1/2005 | 100,000 | 107,478 | ||||||
| Federal Home Loan Bank, 5.24% due 12/7/2005 | 225,000 | 238,524 | ||||||
| Federal Home Loan Bank, 5.37% due 1/20/2006 | 100,000 | 106,542 | ||||||
| Federal Home Loan Bank, 2.25% due 5/15/2006 | 3,000,000 | 3,025,783 | ||||||
| Federal Home Loan Bank, 6.09% due 6/2/2006 | 100,000 | 108,981 | ||||||
| Federal Home Loan Bank, 7.76% due 11/21/2006 | 200,000 | 229,385 | ||||||
| Federal Home Loan Bank, 6.37% due 9/26/2007 | 1,000,000 | 1,132,900 | ||||||
| Federal Home Loan Bank, 6.075% due 1/2/2008 | 475,000 | 535,472 | ||||||
| Federal Home Loan Bank, 7.00% due 2/15/2008 | 150,000 | 174,437 | ||||||
| Federal Home Loan Bank, 5.98% due 6/18/2008 | 2,050,000 | 2,313,695 | ||||||
| Federal Home Loan Bank, 5.015% due 10/8/2008 | 570,000 | 620,946 | ||||||
| Federal Home Loan Bank, 5.53% due 11/24/2008 | 225,000 | 250,053 | ||||||
| Federal Home Loan Bank, 5.48% due 1/8/2009 | 1,250,000 | 1,386,320 | ||||||
| Federal Home Loan Bank, 5.67% due 2/26/2009 | 1,465,000 | 1,637,218 | ||||||
| Federal Home Loan Bank, 5.70% due 3/3/2009 | 3,000,000 | 3,357,679 | ||||||
| Federal Home Loan Bank, 5.985% due 4/9/2009 | 3,000,000 | 3,397,657 | ||||||
| Federal Home Loan Bank, 5.79% due 4/27/2009 | 200,000 | 224,702 | ||||||
| Federal Home Loan Mortgage Corp., 5.98% due 12/8/2005 | 75,000 | 80,462 | ||||||
| Federal Home Loan Mortgage Corp., 6.80% due 3/19/2007 | 300,000 | 340,231 | ||||||
| Federal Home Loan Mortgage Corp., 3.80% due 10/15/2008 | 500,000 | 503,968 | ||||||
| Federal Home Loan Mortgage Corp., Pool # 141016, 9.25% due 11/1/2016 | 103,904 | 117,131 | ||||||
| Federal Home Loan Mortgage Corp., Pool # 141412, 8.50% due 4/1/2017 | 283,347 | 313,079 | ||||||
| Federal Home Loan Mortgage Corp., Pool # 160043, 8.75% due 4/1/2008 | 27,811 | 29,700 | ||||||
| Federal Home Loan Mortgage Corp., Pool # 181730, 8.50% due 5/1/2008 | 35,554 | 37,523 | ||||||
| Federal Home Loan Mortgage Corp., Pool # 200075, 9.00% due 9/1/2004 | 245 | 249 | ||||||
| Federal Home Loan Mortgage Corp., Pool # 252986, 10.75% due 4/1/2010 | 47,116 | 53,502 | ||||||
| Federal Home Loan Mortgage Corp., Pool # 256764, 8.75% due 10/1/2014 | 25,715 | 27,490 | ||||||
| Federal Home Loan Mortgage Corp., Pool # 260486, 9.00% due 1/1/2010 | 18,575 | 19,867 | ||||||
| Federal Home Loan Mortgage Corp., Pool # 273822, 8.50% due 4/1/2009 | 136,105 | 143,821 | ||||||
| Federal Home Loan Mortgage Corp., Pool # 291880, 8.25% due 5/1/2017 | 6,663 | 7,000 | ||||||
| Federal Home Loan Mortgage Corp., Pool # 294817, 9.75% due 1/1/2017 | 68,506 | 77,158 | ||||||
| Federal Home Loan Mortgage Corp., Pool # 298107, 10.25% due 8/1/2017 | 29,371 | 34,494 | ||||||
| Federal Home Loan Mortgage Corp., Pool # 770297, 3.75% due 6/1/2018 | 135,364 | 136,578 | ||||||
| Federal Home Loan Mortgage Corp., Pool # C90041, 6.50% due 11/1/2013 | 91,271 | 96,458 | ||||||
| Federal Home Loan Mortgage Corp., Pool # D06907, 9.00% due 4/1/2017 | 10,632 | 11,543 | ||||||
| Federal Home Loan Mortgage Corp., Pool # D06908, 9.50% due 9/1/2017 | 30,345 | 33,015 | ||||||
16
| SCHEDULE OF INVESTMENTS, CONTINUED Thornburg Limited Term U.S. Governemnt Fund | March 31, 2004 | |||||||
|---|---|---|---|---|---|---|---|---|
| Federal Home Loan Mortgage Corp., Pool # D37120, 7.00% due 7/1/2023 | $ | 113,717 | $ | 121,299 | ||||
| Federal Home Loan Mortgage Corp., Pool # E00170, 8.00% due 7/1/2007 | 103,617 | 109,565 | ||||||
| Federal Home Loan Mortgage Corp., Pool # E49074, 6.50% due 7/1/2008 | 74,118 | 78,916 | ||||||
| Federal Home Loan Mortgage Corp., Pool # E61778, 6.50% due 4/1/2008 | 100,684 | 107,201 | ||||||
| Federal Home Loan Mortgage Corp., Pool # E65962, 7.00% due 5/1/2008 | 9,699 | 10,382 | ||||||
| Federal Home Loan Mortgage Corp. CMO Series 2137 Class TM, 6.50% due 1/15/2028 | 272,792 | 278,171 | ||||||
| Federal Home Loan Mortgage Corp. CMO Series 2603 Class TN, 4.00% due | 4,500,000 | 4,537,658 | ||||||
| 10/15/2011 | ||||||||
| Federal National Mortgage Association, Pool # 008307, 8.00% due 5/1/2008 | 141,274 | 150,365 | ||||||
| Federal National Mortgage Association, Pool # 019535, 10.25% due 7/1/2008 | 12,826 | 14,101 | ||||||
| Federal National Mortgage Association, Pool # 033356, 9.25% due 8/1/2016 | 104,170 | 115,739 | ||||||
| Federal National Mortgage Association, Pool # 040526, 9.25% due 1/1/2017 | 8,165 | 8,715 | ||||||
| Federal National Mortgage Association, Pool # 044003, 8.00% due 6/1/2017 | 114,806 | 124,739 | ||||||
| Federal National Mortgage Association, Pool # 050811, 7.50% due 12/1/2012 | 97,877 | 104,376 | ||||||
| Federal National Mortgage Association, Pool # 050832, 7.50% due 6/1/2013 | 147,520 | 157,361 | ||||||
| Federal National Mortgage Association, Pool # 076388, 9.25% due 9/1/2018 | 136,831 | 153,442 | ||||||
| Federal National Mortgage Association, Pool # 077725, 9.75% due 10/1/2018 | 53,827 | 58,916 | ||||||
| Federal National Mortgage Association, Pool # 100286, 7.50% due 8/1/2009 | 343,887 | 366,197 | ||||||
| Federal National Mortgage Association, Pool # 112067, 9.50% due 10/1/2016 | 75,619 | 84,578 | ||||||
| Federal National Mortgage Association, Pool # 156156, 8.50% due 4/1/2021 | 98,189 | 106,340 | ||||||
| Federal National Mortgage Association, Pool # 190555, 7.00% due 1/1/2014 | 85,415 | 90,710 | ||||||
| Federal National Mortgage Association, Pool # 190703, 7.00% due 3/1/2009 | 82,588 | 88,585 | ||||||
| Federal National Mortgage Association, Pool # 190836, 7.00% due 6/1/2009 | 190,968 | 204,836 | ||||||
| Federal National Mortgage Association, Pool # 250387, 7.00% due 11/1/2010 | 134,795 | 144,668 | ||||||
| Federal National Mortgage Association, Pool # 250481, 6.50% due 11/1/2015 | 86,111 | 91,046 | ||||||
| Federal National Mortgage Association, Pool # 251258, 7.00% due 9/1/2007 | 88,772 | 94,686 | ||||||
| Federal National Mortgage Association, Pool # 251759, 6.00% due 5/1/2013 | 193,332 | 204,524 | ||||||
| Federal National Mortgage Association, Pool # 252648, 6.50% due 5/1/2022 | 537,772 | 567,223 | ||||||
| Federal National Mortgage Association, Pool # 252787, 7.00% due 8/1/2006 | 55,898 | 57,879 | ||||||
| Federal National Mortgage Association, Pool # 303383, 7.00% due 12/1/2009 | 141,475 | 151,749 | ||||||
| Federal National Mortgage Association, Pool # 312663, 7.50% due 6/1/2010 | 153,101 | 164,451 | ||||||
| Federal National Mortgage Association, Pool # 323706, 7.00% due 2/1/2009 | 245,498 | 263,326 | ||||||
| Federal National Mortgage Association, Pool # 334996, 7.00% due 2/1/2011 | 122,448 | 131,417 | ||||||
| Federal National Mortgage Association, Pool # 342947, 7.25% due 4/1/2024 | 698,503 | 749,554 | ||||||
| Federal National Mortgage Association, Pool # 345775, 8.50% due 12/1/2024 | 64,959 | 70,478 | ||||||
| Federal National Mortgage Association, Pool # 373942, 6.50% due 12/1/2008 | 105,016 | 111,945 | ||||||
| Federal National Mortgage Association, Pool # 380488, 6.10% due 7/1/2008 | 1,850,610 | 2,057,371 | ||||||
| Federal National Mortgage Association, Pool # 380633, 6.18% due 9/1/2008 | 2,793,576 | 3,117,641 | ||||||
| Federal National Mortgage Association, Pool # 381146, 6.04% due 1/1/2009 | 1,724,884 | 1,919,040 | ||||||
| Federal National Mortgage Association, Pool # 382450, 7.86% due 6/1/2010 | 899,187 | 1,093,920 | ||||||
| Federal National Mortgage Association, Pool # 382616, 7.40% due 8/1/2010 | 1,287,268 | 1,536,569 | ||||||
| Federal National Mortgage Association, Pool # 382709, 7.40% due 8/1/2008 | 1,067,187 | 1,233,851 | ||||||
| Federal National Mortgage Association, Pool # 382889, 7.595% due 12/1/2010 | 307,015 | 351,720 | ||||||
| Federal National Mortgage Association, Pool # 382926, 7.615% due 12/1/2010 | 341,381 | 391,367 | ||||||
| Federal National Mortgage Association, Pool # 383849, 6.871% due 8/1/2011 | 1,805,429 | 2,092,193 | ||||||
| Federal National Mortgage Association, Pool # 384193, 6.375% due 9/1/2011 | 1,052,547 | 1,191,148 | ||||||
| Federal National Mortgage Association, Pool # 384243, 6.303% due 10/1/2011 | 627,367 | 695,295 | ||||||
| Federal National Mortgage Association, Pool # 384746, 5.86% due 2/1/2009 | 1,075,425 | 1,193,184 | ||||||
| Federal National Mortgage Association, Pool # 385263, 5.41% due 11/1/2006 | 1,469,079 | 1,569,007 | ||||||
| Federal National Mortgage Association, Pool # 385714, 4.70% due 1/1/2010 | 3,235,215 | 3,413,728 | ||||||
| Federal National Mortgage Association, Pool # 406384, 8.25% due 12/1/2024 | 372,905 | 405,634 | ||||||
| Federal National Mortgage Association, Pool # 443909, 6.50% due 9/1/2018 | 451,119 | 477,688 | ||||||
17
| SCHEDULE OF INVESTMENTS, CONTINUED Thornburg Limited Term U.S. Governemnt Fund | March 31, 2004 | |||||||
|---|---|---|---|---|---|---|---|---|
| Federal National Mortgage Association, Pool # 460568, 5.20% due 12/1/2006 | $ | 3,500,000 | $ | 3,735,927 | ||||
| Federal National Mortgage Association, Pool # 516363, 5.00% due 3/1/2014 | 727,160 | 750,594 | ||||||
| Federal National Mortgage Association, Pool # 555207, 7.00% due 11/1/2017 | 454,521 | 487,527 | ||||||
| Federal National Mortgage Association CMO Series 1992-22 Class HC, 7.00% due | 313,261 | 323,755 | ||||||
| 3/25/2007 | ||||||||
| Federal National Mortgage Association CMO Series 1993-101 Class PJ, 7.00% due | 750,000 | 797,732 | ||||||
| 6/25/2008 | ||||||||
| Federal National Mortgage Association CMO Series 1993-122 Class D, 6.50% due | 250,000 | 260,067 | ||||||
| 6/25/2023 | ||||||||
| Federal National Mortgage Association CMO Series 1993-32 Class H, 6.00% due | 330,193 | 343,317 | ||||||
| 3/25/2023 | ||||||||
| Federal National Mortgage Association CMO Series G1993-35 Class JD, 6.50% due | 981,706 | 1,016,480 | ||||||
| 11/25/2006 | ||||||||
| Federal National Mortgage Association CPI Floating Rate, 3.00% due 2/17/2009 | 3,000,000 | 3,049,050 | ||||||
| Government National Mortgage Association, Pool # 000623, 8.00% due 9/20/2016 | 100,798 | 109,606 | ||||||
| Government National Mortgage Association, Pool # 016944, 7.50% due 5/15/2007 | 130,659 | 140,964 | ||||||
| Government National Mortgage Association, Pool # 296697, 9.50% due 10/15/2005 | 35,868 | 37,234 | ||||||
| Government National Mortgage Association, Pool # 306636, 8.25% due 12/15/2006 | 66,852 | 70,893 | ||||||
| Government National Mortgage Association, Pool # 357090, 6.80% due 4/20/2025 | 108,726 | 115,867 | ||||||
| Government National Mortgage Association, Pool # 369693, 7.00% due 1/15/2009 | 194,835 | 210,445 | ||||||
| Government National Mortgage Association, Pool # 409921, 7.50% due 8/15/2010 | 128,108 | 138,407 | ||||||
| Government National Mortgage Association, Pool # 410240, 7.00% due 12/15/2010 | 82,838 | 89,422 | ||||||
| Government National Mortgage Association, Pool # 410271, 7.50% due 8/15/2010 | 85,138 | 91,982 | ||||||
| Government National Mortgage Association, Pool # 410846, 7.00% due 12/15/2010 | 125,707 | 135,700 | ||||||
| Government National Mortgage Association, Pool # 430150, 7.25% due 12/15/2026 | 158,653 | 170,933 | ||||||
| Government National Mortgage Association, Pool # 447040, 7.75% due 5/15/2027 | 173,955 | 189,751 | ||||||
| Government National Mortgage Association, Pool # 453928, 7.00% due 7/15/2017 | 174,379 | 186,967 | ||||||
| Government National Mortgage Association, Pool # 780063, 7.00% due 9/15/2008 | 59,822 | 64,615 | ||||||
| Government National Mortgage Association, Pool # 780448, 6.50% due 8/15/2011 | 264,772 | 284,640 | ||||||
| Government National Mortgage Association CMO Series 2002-67 Class VA, 6.00% | 267,775 | 280,072 | ||||||
| due 3/20/2013 | ||||||||
| Government National Mortgage Association CMO Series 2003-31 Class YA, 4.00% | 1,409,342 | 1,426,029 | ||||||
| due 5/16/2021 | ||||||||
| Government National Mortgage Association CMO Series 2003-67 Class PN, 4.00% | 3,196,066 | 3,242,175 | ||||||
| due 11/20/2020 | ||||||||
| Guaranteed Export Trust 1995-A Certificate, 6.28% due 6/15/2004 | 51,765 | 52,330 | ||||||
| Overseas Private Investment Corp., 4.10% due 11/15/2014 | 2,750,400 | 2,801,255 | ||||||
| Private Export Funding Corp., 4.974% due 8/15/2013 | 1,000,000 | 1,055,750 | ||||||
| Private Export Funding Corp. Secured Note Series M, 5.34% due 3/15/2006 | 2,000,000 | 2,137,384 | ||||||
| Private Export Funding Corp. Secured Note Series P, 5.685% due 5/15/2012 | 1,000,000 | 1,110,986 | ||||||
| Tennessee Valley Authority, 4.75% due 8/1/2013 | 3,000,000 | 3,121,566 | ||||||
| United States Government General Services, 7.62% due 9/15/2010 | 1,790,817 | 2,086,302 | ||||||
| Total U.S. Government Agencies (Cost $89,840,887) | 95,731,576 | |||||||
| United States Treasury-- 54.10% | ||||||||
| United States Treasury Notes, 7.25% due 5/15/2004 | 7,750,000 | 7,808,125 | ||||||
| United States Treasury Notes, 7.25% due 8/15/2004 | 3,700,000 | 3,786,140 | ||||||
| United States Treasury Notes, 1.50% due 2/28/2005 | 10,000,000 | 10,034,375 | ||||||
| United States Treasury Notes, 6.50% due 5/15/2005 | 4,900,000 | 5,187,875 | ||||||
| United States Treasury Notes, 6.50% due 8/15/2005 | 4,500,000 | 4,819,922 | ||||||
| United States Treasury Notes, 5.75% due 11/15/2005 | 7,000,000 | 7,486,718 | ||||||
| United States Treasury Notes, 5.625% due 2/15/2006 | 3,000,000 | 3,228,750 | ||||||
| United States Treasury Notes, 4.625% due 5/15/2006 | 5,500,000 | 5,842,891 | ||||||
| United States Treasury Notes, 7.00% due 7/15/2006 | 2,000,000 | 2,237,188 | ||||||
| United States Treasury Notes, 4.375% due 5/15/2007 | 9,000,000 | 9,627,188 | ||||||
| United States Treasury Notes, 6.125% due 8/15/2007 | 4,000,000 | 4,515,000 | ||||||
| United States Treasury Notes, 2.625% due 5/15/2008 | 10,000,000 | 10,062,500 | ||||||
| United States Treasury Notes, 5.50% due 5/15/2009 | 10,000,000 | 11,298,438 | ||||||
18
| SCHEDULE OF INVESTMENTS, CONTINUED Thornburg Limited Term U.S. Governemnt Fund | March 31, 2004 | |||||||
|---|---|---|---|---|---|---|---|---|
| United States Treasury Notes, 6.50% due 2/15/2010 | 15,000,000 | $ | 17,786,718 | |||||
| United States Treasury Notes, 5.75% due 8/15/2010 | 6,000,000 | 6,889,687 | ||||||
| United States Treasury Notes, 3.625% due 5/15/2013 | 15,000,000 | 14,906,250 | ||||||
| Total United States Treasury (Cost $123,977,709) | 125,517,765 | |||||||
| Short Term Investments-- 4.70% | ||||||||
| Federal Home Loan Mortgage Discount Notes, 0.97% due 4/1/2004 | 7,000,000 | 7,000,000 | ||||||
| Inter-American Development Bank Discount Notes, 0.97% due 4/8/2004 | 4,000,000 | 3,999,246 | ||||||
| Total Short Term Investments (Cost $10,999,246) | 10,999,246 | |||||||
| TOTAL INVESTMENTS (100%) (Cost $224,817,842) | $ | 232,248,587 | ||||||
| See notes to financial statements | ||||||||
19
| SCHEDULE OF INVESTMENTS, CONTINUED | |||||||||||
|---|---|---|---|---|---|---|---|---|---|---|---|
| Thornburg Limited Term Income Fund | March 31, 2004 | ||||||||||
| CUSIPS: CLASS A - 885-215-509, CLASS C - 885-215-764, CLASS I - 885-215-681, CLASS R-1 - 885-215-483 NASDAQ SYMBOLS: CLASS A - THIFX, CLASS C - THICX, CLASS I - THIIX, CLASS R-1 - THIRX | |||||||||||
| Security Name | Credit Rating Moody’s/S&P | Principal Amount | Value | ||||||||
| U.S. TREASURY SECURITIES - 4.00% | |||||||||||
| United States Treasury Notes, 6.50% due 5/15/2005 | Aaa/AAA | $ | 1,100,000 | $ | 1,164,625 | ||||||
| United States Treasury Notes, 4.625% due 5/15/2006 | Aaa/AAA | 4,500,000 | 4,780,547 | ||||||||
| United States Treasury Notes, 4.75% due 11/15/2008 | Aaa/AAA | 1,500,000 | 1,636,406 | ||||||||
| United States Treasury Notes, 5.75% due 8/15/2010 | Aaa/AAA | 2,500,000 | 2,870,703 | ||||||||
| United States Treasury Notes, 3.625% due 5/15/2013 | Aaa/AAA | 5,000,000 | 4,968,750 | ||||||||
| Total U.S. Treasury Securities (Cost $14,705,729) | -- | -- | 15,421,031 | ||||||||
| U. S. GOVERNMENT AGENCIES - 8.60% | |||||||||||
| Export Funding Trust Series 1994-A Pass Through Certificate, 7.89% due 2/15/2005 | Aaa/AAA | 140,000 | 146,037 | ||||||||
| Federal Farm Credit Bank, 5.96% due 6/16/2008 | Aaa/AAA | 710,000 | 801,337 | ||||||||
| Federal Home Loan Bank, 6.00% due 8/25/2005 | Aaa/AAA | 50,000 | 53,145 | ||||||||
| Federal Home Loan Bank, 2.25% due 5/15/2006 | Aaa/AAA | 2,000,000 | 2,017,189 | ||||||||
| Federal Home Loan Bank, 4.875% due 5/15/2007 | Aaa/AAA | 150,000 | 161,960 | ||||||||
| Federal Home Loan Bank, 5.833% due 1/23/2008 | Aaa/AAA | 500,000 | 559,641 | ||||||||
| Federal Home Loan Bank, 5.785% due 4/14/2008 | Aaa/AAA | 75,000 | 83,959 | ||||||||
| Federal Home Loan Bank, 5.835% due 7/15/2008 | Aaa/AAA | 300,000 | 336,953 | ||||||||
| Federal Home Loan Bank, 5.48% due 9/22/2008 | Aaa/AAA | 480,000 | 532,372 | ||||||||
| Federal Home Loan Bank, 5.085% due 10/7/2008 | Aaa/AAA | 250,000 | 273,086 | ||||||||
| Federal Home Loan Bank, 5.038% due 10/14/2008 | Aaa/AAA | 200,000 | 218,060 | ||||||||
| Federal Home Loan Bank, 5.365% due 12/11/2008 | Aaa/AAA | 75,000 | 82,808 | ||||||||
| Federal Home Loan Bank, 5.985% due 4/9/2009 | Aaa/AAA | 85,000 | 96,267 | ||||||||
| Federal Home Loan Bank, 3.00% due 10/21/2009 | Aaa/AAA | 1,650,000 | 1,661,944 | ||||||||
| Federal Home Loan Mortgage Corp., 4.30% due 9/3/2008 | Aaa/AAA | 2,000,000 | 2,027,232 | ||||||||
| Federal Home Loan Mortgage Corp., Pool # 850082, 9.00% due 10/1/2005 | Aaa/AAA | 8,670 | 9,000 | ||||||||
| Federal National Mortgage Association, 2.00% due 12/15/2006 | Aaa/AAA | 6,495,000 | 6,512,157 | ||||||||
| Federal National Mortgage Association, 2.50% due 1/24/2008 | Aaa/AAA | 3,500,000 | 3,518,769 | ||||||||
| Federal National Mortgage Association, 3.50% due 12/25/2008 | Aaa/AAA | 189,507 | 189,585 | ||||||||
| Federal National Mortgage Association, Pool # 020155, 7.491% due 8/1/2014 | Aaa/AAA | 40,984 | 42,271 | ||||||||
| Federal National Mortgage Association, Pool # 190534, 6.00% due 12/1/2008 | Aaa/AAA | 175,005 | 184,917 | ||||||||
| Federal National Mortgage Association, Pool # 297033, 8.00% due 12/1/2009 | Aaa/AAA | 47,336 | 50,992 | ||||||||
| Federal National Mortgage Association, Pool # 303777, 7.00% due 3/1/2011 | Aaa/AAA | 91,072 | 97,743 | ||||||||
| Federal National Mortgage Association, Pool # 382398, 8.00% due 5/1/2011 | Aaa/AAA | 584,537 | 686,497 | ||||||||
| Federal National Mortgage Association, Pool # 383398, 6.42% due 4/1/2011 | Aaa/AAA | 2,425,318 | 2,717,716 | ||||||||
| Federal National Mortgage Association, Pool # 384471, 5.185% due 11/1/2008 | Aaa/AAA | 478,081 | 515,616 | ||||||||
| Federal National Mortgage Association, Pool # 384521, 5.095% due 12/1/2011 | Aaa/AAA | 129,472 | 138,449 | ||||||||
| Federal National Mortgage Association, Pool # 460568, 5.20% due 12/1/2006 | Aaa/AAA | 800,000 | 853,926 | ||||||||
| Federal National Mortgage Association CPI Floating Rate, 3.00% due 2/17/2009 | Aaa/AAA | 5,000,000 | 5,081,750 | ||||||||
| Government National Mortgage Association, Pool # 003007, 8.50% due 11/20/2015 | Aaa/AAA | 63,036 | 69,482 | ||||||||
| Government National Mortgage Association, Pool # 827148, 4.375% due 2/20/2024 | Aaa/AAA | 42,559 | 43,327 | ||||||||
| Government National Mortgage Association CMO Series 2003-67 Class PN, 4.00% due 11/20/2020 | Aaa/AAA | 3,247,209 | 3,294,056 | ||||||||
| Total U. S. Government Agencies (Cost $32,357,864) | -- | -- | 33,058,243 | ||||||||
| ASSET BACKED SECURITIES - 0.50% | |||||||||||
| Associates Manufactured Housing Trust 1996-1 A5, 7.60% due 3/15/2027 | Aaa/AAA | 726,338 | 768,454 | ||||||||
| Bank of America Mortgage Secs Inc. Series 02-7, Class-2 A4, 5.75% due 8/25/2032 | Aa2/NA | 84,835 | 86,685 | ||||||||
20
| SCHEDULE OF INVESTMENTS, CONTINUED Thornburg Limited Term Income Fund | March 31, 2004 | ||||||||||
|---|---|---|---|---|---|---|---|---|---|---|---|
| Chase Credit Card Owner Trust 2001-5 A, 1.194% due 2/15/2007 | Aaa/AAA | $ | 250,000 | $ | 250,137 | ||||||
| Chase Mortgage Finance Trust 1999-S9 A3, 6.25% due 7/25/2014 | NA/AAA | 128,213 | 131,641 | ||||||||
| CNH Equipment Trust, 1.344% due 7/17/2006 | Aaa/AAA | 498,492 | 499,028 | ||||||||
| Green Tree Financial Corp. 93-2 Mfd Housing Sr/Sub Certificate Class-A4, 6.90% due 7/15/2018 | Aaa/NR | 28,919 | 29,192 | ||||||||
| Washington Mutual Series 02-AR10, Class-A6, 4.816% due 10/25/2032 | Aaa/AAA | 141,667 | 143,690 | ||||||||
| Total Asset Backed Securities (Cost $1,882,581) | -- | -- | 1,908,827 | ||||||||
| CORPORATE BONDS - 63.70% | |||||||||||
| BANKS | |||||||||||
| Bank of America Corp., 4.375% due 12/1/2010 | Aa2/A+ | 1,675,000 | 1,726,010 | ||||||||
| Capital One Bank, 6.70% due 5/15/2008 | Baa2/BBB- | 1,665,000 | 1,865,273 | ||||||||
| Fifth Third Bank, Cincinnati Ohio, 3.375% due 8/15/2008 | Aa1/AA- | 2,500,000 | 2,534,795 | ||||||||
| HSBC USA Inc., 8.375% due 2/15/2007 | A1/A+ | 700,000 | 816,293 | ||||||||
| KeyCorp, 8.00% due 7/1/2004 | A3/BBB+ | 500,000 | 507,810 | ||||||||
| Marshall & Ilsley Corp., 2.625% due 2/9/2007 | Aa3/A+ | 2,500,000 | 2,525,358 | ||||||||
| Mercantile Bancorp, 7.30% due 6/15/2007 | A1/A | 1,000,000 | 1,152,898 | ||||||||
| National City Bank, 2.70% due 8/24/2009 | Aa3/A+ | 1,195,000 | 1,195,311 | ||||||||
| Nations Bank Corp. Medium Term Note, 7.23% due 8/15/2012 | Aa2/A+ | 250,000 | 295,954 | ||||||||
| Northern Trust Co. Medium Term Note, 6.25% due 6/2/2008 | A1/A+ | 500,000 | 558,077 | ||||||||
| PNC Funding Corp., 6.875% due 7/15/2007 | A3/BBB+ | 95,000 | 107,572 | ||||||||
| Suntrust Bank Atlanta Georgia Medium Term Note, 2.50% due 5/4/2006 | Aa2/AA- | 2,200,000 | 2,231,277 | ||||||||
| Union Planters Corp., 6.75% due 11/1/2005 | A3/BBB- | 120,000 | 129,418 | ||||||||
| United States Central Credit Union, 2.75% due 5/30/2008 | Aa1/AAA | 2,900,000 | 2,861,966 | ||||||||
| US Bank, 5.625% due 11/30/2005 | Aa2/AA- | 385,000 | 412,481 | ||||||||
| US Bank, 6.30% due 7/15/2008 | Aa3/A+ | 400,000 | 452,818 | ||||||||
| -- | -- | -- | 19,373,311 | ||||||||
| CAPITAL GOODS | |||||||||||
| Caterpillar Financial Services Corp., 6.40% due 2/15/2008 | A2/A | 250,000 | 276,543 | ||||||||
| Caterpillar Financial Services Corp., 3.45% due 1/15/2009 | A2/A | 2,400,000 | 2,426,532 | ||||||||
| Emerson Electric Co., 5.75% due 11/1/2011 | A2/A | 800,000 | 888,631 | ||||||||
| Gatx Capital Corp., 6.875% due 11/1/2004 | Baa3/BBB- | 600,000 | 616,439 | ||||||||
| General American Railcar Corp., 6.69% due 9/20/2016 | A3/AA- | 235,846 | 243,756 | ||||||||
| Hubbell Inc., 6.375% due 5/15/2012 | A3/A+ | 1,000,000 | 1,108,979 | ||||||||
| Illinois Tool Works Inc., 5.75% due 3/1/2009 | Aa3/AA- | 765,000 | 853,992 | ||||||||
| John Deere Capital Corp., 5.125% due 10/19/2006 | A3/A- | 450,000 | 482,524 | ||||||||
| John Deere Capital Corp. Medium Term Note, 3.75% due 1/13/2009 | A3/A- | 500,000 | 510,899 | ||||||||
| Johnson Controls Inc., 5.00% due 11/15/2006 | A2/A | 1,000,000 | 1,071,171 | ||||||||
| Pentair Inc., 7.85% due 10/15/2009 | Baa3/BBB | 1,000,000 | 1,160,975 | ||||||||
| Pitney Bowes Inc., 5.875% due 5/1/2006 | Aa3/AA | 900,000 | 970,271 | ||||||||
| Pitney Bowes Inc., 4.625% due 10/1/2012 | Aa3/NA | 900,000 | 925,776 | ||||||||
| Pitney Bowes Inc., 3.875% due 6/15/2013 | Aa3/AA | 2,000,000 | 1,931,482 | ||||||||
| -- | -- | -- | 13,467,970 | ||||||||
| COMMERCIAL SERVICES & SUPPLIES | |||||||||||
| Aramark Services Inc., 7.00% due 7/15/2006 | Baa3/BBB- | 250,000 | 274,406 | ||||||||
| Science Applications International Corp., 6.75% due 2/1/2008 | A3/A- | 250,000 | 282,834 | ||||||||
| Science Applications International Corp., 6.25% due 7/1/2012 | A3/A- | 1,000,000 | 1,119,831 | ||||||||
| Valassis Communications, 6.625% due 1/15/2009 | Baa3/BBB- | 1,700,000 | 1,878,194 | ||||||||
| Waste Management Inc., 6.50% due 11/15/2008 | Baa3/BBB | 1,000,000 | 1,126,680 | ||||||||
21
| SCHEDULE OF INVESTMENTS, CONTINUED Thornburg Limited Term Income Fund | March 31, 2004 | ||||||||||
|---|---|---|---|---|---|---|---|---|---|---|---|
| Waste Management Inc., 6.875% due 5/15/2009 | Baa3/BBB | 725,000 | $ | 828,342 | |||||||
| Waste Management Inc., 7.375% due 8/1/2010 | Baa3/BBB | 500,000 | 589,109 | ||||||||
| WMX Technologies Inc., 7.00% due 5/15/2005 | Baa3/BBB | 1,010,000 | 1,056,644 | ||||||||
| WMX Technologies Inc., 7.00% due 10/15/2006 | Baa3/BBB | 550,000 | 610,309 | ||||||||
| -- | -- | -- | 7,766,349 | ||||||||
| DIVERSIFIED FINANCIALS | |||||||||||
| American General Finance Corp. Medium Term Note, 4.625% due 9/1/2010 | A1/A+ | 200,000 | 208,383 | ||||||||
| American General Finance Corp. Medium Term Note, 4.00% due 3/15/2011 | A1/A+ | 1,500,000 | 1,493,734 | ||||||||
| Bear Stearns Cos Inc., 4.50% due 10/28/2010 | A1/A | 1,500,000 | 1,548,903 | ||||||||
| Beneficial Corp., 6.80% due 7/22/2005 | A1/A | 1,000,000 | 1,060,651 | ||||||||
| Berkshire Hathaway Finance Corp., 4.625% due 10/15/2013 | Aaa/AAA | 1,000,000 | 1,016,435 | ||||||||
| Dun & Bradstreet Corp., 6.625% due 3/15/2006 | NR/BBB+ | 75,000 | 80,305 | ||||||||
| Ford Motor Credit, 6.24% due 12/15/2004 | A3/BBB- | 150,000 | 153,329 | ||||||||
| General Electric Capital Corp., 5.00% due 2/15/2007 | Aaa/AAA | 2,900,000 | 3,112,097 | ||||||||
| General Electric Capital Corp., 1.547% due 5/30/2008 | Aaa/AAA | 494,000 | 493,292 | ||||||||
| General Electric Capital Corp., 7.75% due 6/9/2009 | Aaa/AAA | 200,000 | 240,456 | ||||||||
| General Electric Capital Corp., 7.375% due 1/19/2010 | Aaa/AAA | 400,000 | 479,690 | ||||||||
| General Electric Capital Corp., 4.25% due 12/1/2010 | Aaa/AAA | 2,000,000 | 2,046,736 | ||||||||
| Hartford Financial Services Group Inc. Senior Notes, 4.625% due 7/15/2013 | A3/A- | 1,000,000 | 1,002,910 | ||||||||
| Household Finance Corp., 5.20% due 8/15/2005 | A1/A | 400,000 | 415,253 | ||||||||
| Household Finance Corp., 5.90% due 5/15/2006 | A1/A | 100,000 | 105,797 | ||||||||
| Household Finance Corp., 7.20% due 7/15/2006 | A1/A | 550,000 | 610,628 | ||||||||
| Household Finance Corp., 5.75% due 1/30/2007 | A1/A | 400,000 | 435,654 | ||||||||
| Household Finance Corp., 6.40% due 9/15/2009 | A1/A | 400,000 | 434,622 | ||||||||
| International Lease Finance Corp., 4.55% due 10/15/2009 | A1/AA- | 2,500,000 | 2,608,413 | ||||||||
| International Lease Finance Corp. Medium Term Note, 5.95% due 6/6/2005 | A1/AA- | 950,000 | 998,083 | ||||||||
| Jefferies Group Inc. Senior Note Series B, 7.50% due 8/15/2007 | Baa2/BBB | 2,600,000 | 2,995,889 | ||||||||
| JP Morgan Chase Co., 4.50% due 11/15/2010 | A1/A+ | 1,465,000 | 1,511,162 | ||||||||
| Lehman Brothers Holdings Inc., 3.50% due 8/7/2008 | A1/A | 700,000 | 709,306 | ||||||||
| Merrill Lynch & Co. CPI Floating Rate, 3.04% due 3/2/2009 | Aa3/A+ | 3,000,000 | 3,034,200 | ||||||||
| Schwab Charles Corp. Medium Term Note, 6.30% due 4/28/2006 | A2/A- | 800,000 | 867,320 | ||||||||
| SLM Corp. Floating Rate, 1.561% due 9/15/2008 | A2/A | 1,675,000 | 1,674,568 | ||||||||
| SLM Corp. Medium Term Note CPI Floating Rate, 3.08% due 3/2/2009 | A2/A | 3,000,000 | 3,025,920 | ||||||||
| SLM Corp. Medium Term Note CPI Floating Rate, 4.00% due 1/31/2014 | A2/A | 9,500,000 | 9,717,550 | ||||||||
| Toyota Motor Credit Corp., 2.875% due 8/1/2008 | Aaa/AAA | 800,000 | 797,828 | ||||||||
| Toyota Motor Credit Corp., 4.35% due 12/15/2010 | Aaa/AAA | 800,000 | 830,854 | ||||||||
| Toyota Motor Credit Corp. Medium Term Note, 2.70% due 1/30/2007 | Aaa/AAA | 3,300,000 | 3,349,094 | ||||||||
| Wells Fargo & Co. Subordinated Note, 4.625% due 4/15/2014 | Aa2/A+ | 2,000,000 | 2,007,842 | ||||||||
| -- | -- | -- | 49,066,904 | ||||||||
| ENERGY | |||||||||||
| Allete Inc., 7.80% due 2/15/2008 | Baa2/BBB | 575,000 | 658,618 | ||||||||
| Amerenenergy Generating Co., 7.75% due 11/1/2005 | A3/A- | 850,000 | 926,228 | ||||||||
| Ashland Inc., 7.83% due 8/15/2005 | Baa2/BBB | 1,150,000 | 1,234,004 | ||||||||
| BJ Services Co. Note Series B, 7.00% due 2/1/2006 | Baa2/BBB+ | 75,000 | 80,038 | ||||||||
| Commonwealth Edison Co., 4.74% due 8/15/2010 | A3/A- | 975,000 | 1,028,288 | ||||||||
| El Paso Corp., 7.00% due 5/15/2011 | Caa1/CCC+ | 700,000 | 600,250 | ||||||||
| Enterprise Products Participating LP, 7.50% due 2/1/2011 | Baa2/BBB- | 250,000 | 291,118 | ||||||||
| EOG Resources Inc., 6.50% due 9/15/2004 | Baa1/BBB+ | 350,000 | 357,954 | ||||||||
| EOG Resources Inc., 6.00% due 12/15/2008 | Baa1/BBB+ | 450,000 | 502,810 | ||||||||
22
| SCHEDULE OF INVESTMENTS, CONTINUED Thornburg Limited Term Income Fund | March 31, 2004 | ||||||||||
|---|---|---|---|---|---|---|---|---|---|---|---|
| Kinder Morgan Energy Partners, 8.00% due 3/15/2005 | Baa1/BBB+ | 1,250,000 | $ | 1,320,357 | |||||||
| Louis Dreyfus Natural Gas Corp., 6.875% due 12/1/2007 | A3/BBB+ | 290,000 | 323,494 | ||||||||
| Murphy Oil Corp., 6.375% due 5/1/2012 | Baa1/A- | 750,000 | 847,523 | ||||||||
| Northern Border Pipeline Co., 6.25% due 5/1/2007 | A3/A- | 120,000 | 131,974 | ||||||||
| Occidental Petroleum Corp., 5.875% due 1/15/2007 | Baa1/BBB+ | 800,000 | 873,855 | ||||||||
| Occidental Petroleum Corp., 7.375% due 11/15/2008 | Baa1/BBB+ | 300,000 | 351,392 | ||||||||
| Occidental Petroleum Corp., 10.125% due 9/15/2009 | Baa1/BBB+ | 315,000 | 410,837 | ||||||||
| Oneok Inc., 7.75% due 3/1/2005 (Insured: MBIA) | Aaa/AAA | 250,000 | 265,406 | ||||||||
| Panenergy Corp., 7.00% due 10/15/2006 | Baa3/BBB- | 1,100,000 | 1,193,842 | ||||||||
| Phillips Petroleum Co., 8.75% due 5/25/2010 | A3/A- | 250,000 | 317,954 | ||||||||
| Phillips Petroleum Co., 9.375% due 2/15/2011 | A3/A- | 900,000 | 1,143,212 | ||||||||
| Questar Pipeline Co., 6.05% due 12/1/2008 | A2/A+ | 425,000 | 467,392 | ||||||||
| Rio Tinto Finance, 5.75% due 7/3/2006 | Aa3/A+ | 925,000 | 999,584 | ||||||||
| Smith International Inc. Senior Note, 7.00% due 9/15/2007 | Baa1/BBB+ | 600,000 | 682,135 | ||||||||
| Sonat Inc., 7.625% due 7/15/2011 | Caa1/CCC+ | 500,000 | 433,750 | ||||||||
| Texas Eastern Transmission Corp. Senior Note, 5.25% due 7/15/2007 | Baa2/BBB | 525,000 | 562,081 | ||||||||
| Transocean SedCo. Forex Inc., 6.75% due 4/15/2005 | Baa2/A- | 190,000 | 198,808 | ||||||||
| Transocean SedCo. Forex Inc., 6.95% due 4/15/2008 | Baa2/A- | 515,000 | 587,382 | ||||||||
| Transocean SedCo. Forex Inc., 6.625% due 4/15/2011 | Baa2/A- | 85,000 | 97,189 | ||||||||
| Union Oil Co. California, 7.90% due 4/18/2008 | Baa2/BBB+ | 200,000 | 229,818 | ||||||||
| -- | -- | -- | 17,117,293 | ||||||||
| FOOD BEVERAGE & TOBACCO | |||||||||||
| Anheuser Busch Co. Inc., 5.625% due 10/1/2010 | A1/A+ | 1,150,000 | 1,273,802 | ||||||||
| Anheuser Busch Co. Inc., 4.375% due 1/15/2013 | A1/A+ | 2,000,000 | 2,012,212 | ||||||||
| Coca Cola Co., 4.00% due 6/1/2005 | Aa3/A+ | 515,000 | 529,347 | ||||||||
| Coca Cola Co., 5.75% due 3/15/2011 | Aa3/A+ | 200,000 | 223,247 | ||||||||
| Conagra Inc., 7.50% due 9/15/2005 | Baa1/BBB+ | 325,000 | 350,704 | ||||||||
| Conagra Inc., 7.875% due 9/15/2010 | Baa1/BBB+ | 150,000 | 182,217 | ||||||||
| Diageo Capital PLC, 3.375% due 3/20/2008 | A2/A | 4,000,000 | 4,060,384 | ||||||||
| Diageo Finance BV, 3.00% due 12/15/2006 | A2/A | 925,000 | 941,845 | ||||||||
| Diageo Finance Bv, 3.875% due 4/1/2011 | A2/A | 2,500,000 | 2,488,580 | ||||||||
| General Mills, 5.50% due 1/12/2009 | Baa2/BBB+ | 300,000 | 327,746 | ||||||||
| Kellogg Co., 4.875% due 10/15/2005 | Baa2/BBB | 186,000 | 194,926 | ||||||||
| Sara Lee Corp. Medium Term Note, 6.00% due 1/15/2008 | A3/A+ | 900,000 | 995,679 | ||||||||
| Sysco International Co., 6.10% due 6/1/2012 | A1/A+ | 1,000,000 | 1,132,821 | ||||||||
| -- | -- | -- | 14,713,510 | ||||||||
| HEALTHCARE EQUIPMENT & SERVICES | |||||||||||
| Baxter International Inc., 5.25% due 5/1/2007 | A3/A- | 500,000 | 537,571 | ||||||||
| Boston Scientific Corp., 6.625% due 3/15/2005 | Baa1/A- | 250,000 | 261,571 | ||||||||
| -- | -- | -- | 799,142 | ||||||||
| HOUSEHOLD & PERSONAL PRODUCTS | |||||||||||
| Gillette Co., 4.00% due 6/30/2005 | Aa3/AA- | 2,000,000 | 2,060,846 | ||||||||
| Gillette Co., 2.875% due 3/15/2008 | Aa3/AA- | 2,000,000 | 1,999,930 | ||||||||
| Nike Inc., 5.50% due 8/15/2006 | A2/A | 900,000 | 967,583 | ||||||||
| Procter & Gamble Co., 4.75% due 6/15/2007 | Aa3/AA- | 350,000 | 375,194 | ||||||||
| Procter & Gamble Co., 4.30% due 8/15/2008 | Aa3/AA- | 2,000,000 | 2,113,552 | ||||||||
| -- | -- | -- | 7,517,105 | ||||||||
23
| SCHEDULE OF INVESTMENTS, CONTINUED Thornburg Limited Term Income Fund | March 31, 2004 | ||||||||||
|---|---|---|---|---|---|---|---|---|---|---|---|
| HOTELS RESTAURANTS & LEISURE | |||||||||||
| Hyatt Equities LLC, 9.25% due 5/15/2005 | Baa3/BBB | 225,000 | $ | 238,057 | |||||||
| Wendy's International Inc., 6.35% due 12/15/2005 | Baa1/BBB+ | 500,000 | 536,562 | ||||||||
| -- | -- | -- | 774,619 | ||||||||
| INSURANCE | |||||||||||
| AIG Sunamerica Global Financing, 5.10% due 1/17/2007 | Aaa/AAA | 800,000 | 856,919 | ||||||||
| Allstate Corp., 5.375% due 12/1/2006 | A1/A+ | 900,000 | 975,301 | ||||||||
| AON Corp., 6.90% due 7/1/2004 | Baa2/A- | 200,000 | 202,538 | ||||||||
| Equitable Iowa Cos., 8.50% due 2/15/2005 | A1/A+ | 170,000 | 177,944 | ||||||||
| Hartford Life Inc., 7.10% due 6/15/2007 | A3/A- | 300,000 | 340,064 | ||||||||
| Liberty Mutual Group Inc. Guaranteed Senior Notes, 5.75% due 3/15/2014 | Baa3/BBB | 1,000,000 | 996,658 | ||||||||
| Liberty Mutual Insurance Co., 8.20% due 5/4/2007 | Baa2/BBB+ | 1,000,000 | 1,155,268 | ||||||||
| Lincoln National Corp., 4.75% due 2/15/2014 | A3/A- | 1,000,000 | 1,010,486 | ||||||||
| Manufacturers Life Insurance Co., 7.875% due 4/15/2005 | A1/AA- | 855,000 | 900,913 | ||||||||
| Marsh & Mclennan Cos. Inc., 4.85% due 2/15/2013 | A2/AA- | 550,000 | 561,490 | ||||||||
| Metlife Inc., 5.25% due 12/1/2006 | A2/A | 450,000 | 482,574 | ||||||||
| Old Republic International Corp., 7.00% due 6/15/2007 | Aa3/A+ | 1,800,000 | 2,043,164 | ||||||||
| Pacific Life Global Funding CPI Floating Rate, 4.106% due 2/6/2016 | Aa3/AA | 8,000,000 | 8,090,160 | ||||||||
| Principal Financial Group Australia, 8.20% due 8/15/2009 | A3/A | 700,000 | 846,238 | ||||||||
| Principal Life Global Funding, 4.40% due 10/1/2010 | Aa3/AA | 4,000,000 | 4,120,300 | ||||||||
| Unitedhealth Group Inc., 3.30% due 1/30/2008 | A3/A | 1,300,000 | 1,321,268 | ||||||||
| Unumprovident Corp., 7.625% due 3/1/2011 | Baa3/BBB- | 2,450,000 | 2,569,437 | ||||||||
| USF&G Corp., 7.125% due 6/1/2005 | A3/BBB+ | 900,000 | 950,878 | ||||||||
| -- | -- | -- | 27,601,600 | ||||||||
| MATERIALS | |||||||||||
| Chevron Phillips Chemical, 5.375% due 6/15/2007 | Baa1/BBB+ | 75,000 | 81,490 | ||||||||
| Chevron Phillips Chemical, 7.00% due 3/15/2011 | Baa1/BBB+ | 500,000 | 575,834 | ||||||||
| Chevrontexaco Capital Co., 3.50% due 9/17/2007 | Aa2/AA | 1,400,000 | 1,445,875 | ||||||||
| Dow Chemical Co., 5.75% due 12/15/2008 | A3/A- | 350,000 | 384,594 | ||||||||
| E.I. du Pont de Nemours & Co., 8.25% due 9/15/2006 | Aa3/AA- | 200,000 | 229,073 | ||||||||
| E.I. du Pont de Nemours & Co., 4.75% due 11/15/2012 | Aa3/AA- | 1,000,000 | 1,043,030 | ||||||||
| E.I. du Pont de Nemours & Co., 4.125% due 3/6/2013 | Aa3/AA- | 325,000 | 323,020 | ||||||||
| Hoechst Celanese Corp., 7.125% due 3/15/2009 | Baa2/A+ | 200,000 | 218,989 | ||||||||
| Lafarge Corp., 6.375% due 7/15/2005 | Baa1/BBB | 75,000 | 78,925 | ||||||||
| Lubrizol Corp. Senior Note, 5.875% due 12/1/2008 | A2/A+ | 635,000 | 707,901 | ||||||||
| Minnesota Mining & Manufacturing Co., 4.15% due 6/30/2005 | Aa1/AA | 2,000,000 | 2,066,530 | ||||||||
| -- | -- | -- | 7,155,261 | ||||||||
| MEDIA | |||||||||||
| AOL Time Warner Inc., 6.75% due 4/15/2011 | Baa1/BBB+ | 750,000 | 850,263 | ||||||||
| E W Scripps Co. Ohio, 5.75% due 7/15/2012 | A2/A | 80,000 | 87,477 | ||||||||
| New York Times Co., 4.625% due 6/25/2007 | A1/A+ | 300,000 | 320,668 | ||||||||
| Scholastic Corp., 5.75% due 1/15/2007 | Baa2/BBB | 255,000 | 275,475 | ||||||||
| Thomson Corp., 4.25% due 8/15/2009 | A3/A- | 2,900,000 | 3,015,304 | ||||||||
| Time Warner Inc., 8.05% due 1/15/2016 | Baa1/BBB+ | 200,000 | 245,150 | ||||||||
| Tribune Co., 6.875% due 11/1/2006 | A3/NR | 125,000 | 138,787 | ||||||||
| -- | -- | -- | 4,933,124 | ||||||||
24
| SCHEDULE OF INVESTMENTS, CONTINUED Thornburg Limited Term Income Fund | March 31, 2004 | ||||||||||
|---|---|---|---|---|---|---|---|---|---|---|---|
| PHARMACEUTICALS & BIOTECHNOLOGY | |||||||||||
| Abbott Labs, 6.40% due 12/1/2006 | A1/AA | 1,000,000 | $ | 1,111,349 | |||||||
| Abbott Labs, 3.75% due 3/15/2011 | A1/AA | 500,000 | 497,044 | ||||||||
| Bristol Myers Squibb Co., 4.75% due 10/1/2006 | A1/AA- | 500,000 | 529,455 | ||||||||
| Eli Lilly & Co., 5.50% due 7/15/2006 | Aa3/AA | 1,850,000 | 1,996,437 | ||||||||
| Glaxosmithkline Capital Inc. Guaranteed Notes, 4.375% due 4/15/2014 | Aa2/AA | 1,250,000 | 1,240,475 | ||||||||
| Pfizer Inc., 3.30% due 3/2/2009 | Aaa/AAA | 1,825,000 | 1,848,947 | ||||||||
| Pfizer Inc., 4.50% due 2/15/2014 | Aaa/AAA | 2,000,000 | 2,028,518 | ||||||||
| Pharmacia Corp., 5.75% due 12/1/2005 | A1/AAA | 2,000,000 | 2,132,930 | ||||||||
| Tiers Inflation Linked Trust Series Wye 2004 21 Trust Certificate, 4.00% due 2/1/2014 | Baa1/A | 5,000,000 | 5,000,000 | ||||||||
| -- | -- | -- | 16,385,155 | ||||||||
| REAL ESTATE MANAGEMENT & DEVELOPMENT | |||||||||||
| Prime Property Funding II Inc., 7.00% due 8/15/2004 | A2/A | 715,000 | 728,968 | ||||||||
| RETAILING | |||||||||||
| Costco Wholesale Corp., 5.50% due 3/15/2007 | A2/A | 500,000 | 543,777 | ||||||||
| Dayton Hudson Corp., 9.625% due 2/1/2008 | A2/A+ | 100,000 | 122,309 | ||||||||
| Dillard's Inc., 7.375% due 6/1/2006 | B2/BB | 150,000 | 155,625 | ||||||||
| Target Corp., 3.375% due 3/1/2008 | A2/A+ | 1,000,000 | 1,020,328 | ||||||||
| Target Corp., 5.875% due 3/1/2012 | A2/A+ | 800,000 | 888,288 | ||||||||
| Wal Mart Stores Inc., 4.125% due 2/15/2011 | Aa2/AA | 3,735,000 | 3,792,474 | ||||||||
| Wal-Mart Stores Inc., 6.875% due 8/10/2009 | Aa2/AA | 900,000 | 1,056,221 | ||||||||
| Wal-Mart Stores Inc., 8.57% due 1/2/2010 | Aa2/AA | 452,476 | 525,017 | ||||||||
| Wal-Mart Stores Inc., 1992-A1 Pass Through Certificate, 7.49% due 6/21/2007 | Aa2/AA | 290,449 | 315,878 | ||||||||
| -- | -- | -- | 8,419,917 | ||||||||
| SOFTWARE & SERVICES | |||||||||||
| Electronic Data Systems Corp., 6.85% due 10/15/2004 | Baa3/BBB | 250,000 | 255,791 | ||||||||
| Electronic Data Systems Corp., 7.125% due 10/15/2009 | Baa3/BBB | 2,500,000 | 2,669,155 | ||||||||
| Electronic Data Systems Corp., 6.00% due 8/1/2013 | Baa3/BBB | 1,000,000 | 970,156 | ||||||||
| TECHNOLOGY - HARDWARE & EQUIPMENT | |||||||||||
| Computer Sciences Corp., 7.50% due 8/8/2005 | A3/A | 158,000 | 169,632 | ||||||||
| Computer Sciences Corp., 6.75% due 6/15/2006 | A3/A | 350,000 | 383,601 | ||||||||
| Computer Sciences Corp., 3.50% due 4/15/2008 | A3/A | 2,000,000 | 2,023,246 | ||||||||
| Computer Sciences Corp., 6.25% due 3/15/2009 | A3/A | 300,000 | 340,064 | ||||||||
| Computer Sciences Corp., 7.375% due 6/15/2011 | A3/A | 1,317,000 | 1,575,902 | ||||||||
| First Data Corp., 6.375% due 12/15/2007 | A1/A+ | 110,000 | 124,238 | ||||||||
| First Data Corp., 5.625% due 11/1/2011 | A1/A+ | 900,000 | 991,610 | ||||||||
| International Business Machines, 4.875% due 10/1/2006 | A1/A+ | 500,000 | 534,216 | ||||||||
| International Business Machines, 2.375% due 11/1/2006 | A1/A+ | 2,825,000 | 2,850,569 | ||||||||
| International Business Machines, 4.25% due 9/15/2009 | A1/A+ | 1,000,000 | 1,047,235 | ||||||||
| Jabil Circuit Inc., 5.875% due 7/15/2010 | Baa3/BB+ | 500,000 | 536,407 | ||||||||
| Oracle Corp., 6.91% due 2/15/2007 | A3/A- | 1,200,000 | 1,341,281 | ||||||||
| -- | -- | -- | 11,918,001 | ||||||||
| TELECOMMUNICATION SERVICES | |||||||||||
| Cingular Wireless, 5.625% due 12/15/2006 | A3/A+ | 900,000 | 971,510 | ||||||||
| TCI Communications Inc., 8.00% due 8/1/2005 | Baa3/BBB | 50,000 | 53,891 | ||||||||
| Verizon Wireless Capital LLC, 5.375% due 12/15/2006 | A3/A+ | 1,500,000 | 1,615,625 | ||||||||
| -- | -- | -- | 2,641,026 | ||||||||
25
| SCHEDULE OF INVESTMENTS, CONTINUED Thornburg Limited Term Income Fund | March 31, 2004 | ||||||||||
|---|---|---|---|---|---|---|---|---|---|---|---|
| TRANSPORTATION | |||||||||||
| Continental Airlines Pass Through Certificate Series 1997 4 Class-4A, 6.90% due 1/2/2018 | Baa3/A- | 208,215 | $ | 207,620 | |||||||
| CSX Corp., 7.45% due 5/1/2007 | Baa2/BBB | 225,000 | 256,695 | ||||||||
| Delta Air Lines Inc. EETC Series 2001-1 Class-A, 6.619% due 3/18/2011 | Baa3/BBB- | 342,026 | 338,090 | ||||||||
| Northwest Airlines 1999-2 Class-A, 7.575% due 3/1/2019 | Baa2/A+ | 129,899 | 134,604 | ||||||||
| Southwest Airlines Co., 5.10% due 5/1/2006 | Aa2/AA+ | 444,139 | 462,744 | ||||||||
| Southwest Airlines Co., 7.875% due 9/1/2007 | Baa1/A | 1,012,000 | 1,167,552 | ||||||||
| -- | -- | -- | 2,567,305 | ||||||||
| UTILITIES | |||||||||||
| Appalachian Power Co., 6.60% due 5/1/2009 (Insured: MBIA) | Aaa/AAA | 175,000 | 200,209 | ||||||||
| Duke Capital Corp. Senior Note, 7.25% due 10/1/2004 | Baa3/BBB- | 1,245,000 | 1,277,970 | ||||||||
| Entergy Mississippi Inc., 6.45% due 4/1/2008 (Insured: AMBAC) | Aaa/AAA | 200,000 | 203,180 | ||||||||
| Gulf Power Co., 4.35% due 7/15/2013 | A2/A | 925,000 | 913,204 | ||||||||
| Madison Gas & Electric Co., 6.02% due 9/15/2008 | Aa3/AA- | 950,000 | 1,047,603 | ||||||||
| Minnesota Power & Light Co., 7.00% due 2/15/2007 | Baa1/A | 900,000 | 1,006,459 | ||||||||
| Northern States Power Co., 4.75% due 8/1/2010 | A3/BBB+ | 2,825,000 | 2,982,875 | ||||||||
| Pacificorp, 6.75% due 4/1/2005 | A3/A | 250,000 | 262,047 | ||||||||
| Pennsylvania Power & Light Co., 6.55% due 3/1/2006 (Insured: MBIA) | Aaa/AAA | 210,000 | 226,828 | ||||||||
| PSI Energy Inc., 6.65% due 6/15/2006 | A3/A- | 245,000 | 268,504 | ||||||||
| PSI Energy Inc., 7.85% due 10/15/2007 | Baa1/BBB | 500,000 | 583,642 | ||||||||
| Public Service Co. Colorado, 4.875% due 3/1/2013 | Baa1/BBB+ | 1,000,000 | 1,031,311 | ||||||||
| Public Service Electric & Gas Co., 6.75% due 3/1/2006 (Insured: MBIA) | Aaa/AAA | 275,000 | 300,153 | ||||||||
| Southern California Gas Co., 4.375% due 1/15/2011 | A1/A+ | 225,000 | 233,364 | ||||||||
| Texas Municipal Gas Corp., 2.60% due 7/1/2007 | Aaa/AAA | 4,430,000 | 4,478,597 | ||||||||
| Wisconsin Electric Power Co., 7.25% due 8/1/2004 | Aa3/A- | 80,000 | 81,538 | ||||||||
| Wisconsin Energy Corp., 5.50% due 12/1/2008 | A3/BBB+ | 350,000 | 380,897 | ||||||||
| Wisconsin Public Service Corp., 6.125% due 8/1/2011 | Aa2/AA- | 1,150,000 | 1,302,877 | ||||||||
| -- | -- | -- | 16,781,258 | ||||||||
| MISCELLANEOUS | |||||||||||
| Stanford University, 5.85% due 3/15/2009 | Aaa/NA | 500,000 | 556,731 | ||||||||
| YANKEE | |||||||||||
| Kreditanstalt Fur Wiederaufbau, 3.25% due 3/30/2009 | Aaa/AAA | 2,475,000 | 2,508,054 | ||||||||
| National Westminster Bank, 7.375% due 10/1/2009 | Aa2/AA- | 715,000 | 856,155 | ||||||||
| Nova Scotia Province Canada, 5.75% due 2/27/2012 | A3/A- | 500,000 | 559,824 | ||||||||
| Ontario Province Canada, 3.282% due 3/28/2008 | Aa2/AA | 335,000 | 340,269 | ||||||||
| Ontario Province Canada, 3.125% due 5/2/2008 | Aa2/AA | 5,000,000 | 5,068,270 | ||||||||
| -- | -- | -- | 9,332,572 | ||||||||
| Total Corporate Bonds (Cost $233,419,232) | -- | -- | 243,512,223 | ||||||||
| TAXABLE MUNICIPAL BONDS - 16.30% | |||||||||||
| Allentown Pennsylvania Taxable Refunding, 4.21% due 10/1/2012 | Aaa/AAA | 2,215,000 | 2,204,058 | ||||||||
| American Campus Properties Student Housing, 7.38% due 9/1/2012 (Insured: MBIA) | Aaa/AAA | 4,250,000 | 5,019,335 | ||||||||
| American Fork City Utah Sales, 2.40% due 3/1/2005 (Insured: FSA) | Aaa/AAA | 150,000 | 151,201 | ||||||||
| American Fork City Utah Sales, 4.89% due 3/1/2012 (Insured: FSA) | Aaa/AAA | 300,000 | 312,579 | ||||||||
| American Fork City Utah Sales, 5.07% due 3/1/2013 (Insured: FSA) | Aaa/AAA | 120,000 | 125,423 | ||||||||
| Arkansas Electric Coop Corp., 7.33% due 6/30/2008 | A2/AA- | 169,000 | 183,592 | ||||||||
26
| SCHEDULE OF INVESTMENTS, CONTINUED Thornburg Limited Term Income Fund | March 31, 2004 | ||||||||||
|---|---|---|---|---|---|---|---|---|---|---|---|
| Arkansas State Taxable Water Waste Disposal Series A, 5.50% due 7/1/2005 | Aa2/AA | 300,000 | $ | 314,709 | |||||||
| Ashaubenon Wisconsin, 3.00% due 6/1/2008 | Aa2/NR | 1,000,000 | 996,290 | ||||||||
| Aurora Indiana School Building Corp. Taxable Refunding 1st Mortgage, 2.50% due 8/10/2004 | NR/AA- | 235,000 | 235,743 | ||||||||
| Baton Rouge Louisiana Taxable Series B, 2.60% due 1/15/2005 (Insured: AMBAC) | Aaa/AAA | 860,000 | 868,136 | ||||||||
| Bessemer Alabama Water Revenue Taxable Warrants Series B, 7.375% due 7/1/2008 (Insured: FSA) | Aaa/AAA | 1,115,000 | 1,213,900 | ||||||||
| Brockton MA Taxable Economic Development Series A, 6.45% due 5/1/2017 (Insured: FGIC) | Aaa/AAA | 150,000 | 170,256 | ||||||||
| Burbank California Waste Disposal Revenue, 5.29% due 5/1/2007 (Insured: FSA) | Aaa/AAA | 370,000 | 398,842 | ||||||||
| Burbank California Waste Disposal Revenue, 5.48% due 5/1/2008 (Insured: FSA) | Aaa/AAA | 310,000 | 339,205 | ||||||||
| Chicago Illinois Taxable Neighborhoods Alive Series B, 5.20% due 9/1/2006 (Insured: FGIC) | Aaa/AAA | 200,000 | 214,756 | ||||||||
| Cleveland Cuyahoga County Ohio, 6.10% due 5/15/2013 | NR/NR | 2,125,000 | 2,178,720 | ||||||||
| Connecticut State Development Authority, 8.55% due 8/15/2005 | NR/NR | 1,025,000 | 1,069,946 | ||||||||
| Connecticut State Housing Finance Authority, 3.10% due 6/15/2032 put 12/1/2005 (Insured: AMBAC) | Aaa/AAA | 1,870,000 | 1,900,444 | ||||||||
| Cook County Illinois Community College District 508, 6.90% due 5/1/2010 (Insured: AMBAC) | Aaa/AAA | 600,000 | 660,882 | ||||||||
| Cook County Illinois School District 083, 4.625% due 12/1/2010 (Insured: FSA) | Aaa/NR | 250,000 | 260,567 | ||||||||
| Cook County Illinois School District 083, 4.875% due 12/1/2011 (Insured: FSA) | Aaa/NR | 150,000 | 156,680 | ||||||||
| Coos County Oregon, 3.04% due 6/1/2009 (Insured: FGIC) | Aaa/NR | 465,000 | 458,918 | ||||||||
| Coos County Oregon, 3.47% due 6/1/2010 (Insured: FGIC) | Aaa/NR | 635,000 | 629,475 | ||||||||
| Denver City & County Special Facilities Taxable Refunding & Improvement Series B, 7.15% due 1/1/2008 | Aaa/AAA | 900,000 | 1,035,279 | ||||||||
| (Insured: MBIA) | |||||||||||
| Duke University Revenue, 6.19% due 6/1/2004 (Duke University Hospital Project A) | Aa3/NR | 500,000 | 504,100 | ||||||||
| Elkhart Indiana Redevelopment District Revenue, 4.80% due 6/15/2011 | NR/NR | 240,000 | 238,843 | ||||||||
| Elkhart Indiana Redevelopment District Revenue, 4.80% due 12/15/2011 | NR/NR | 245,000 | 242,744 | ||||||||
| Elkhart Indiana Redevelopment District Revenue, 5.05% due 12/15/2012 | NR/NR | 515,000 | 509,428 | ||||||||
| Elkhart Indiana Redevelopment District Revenue, 5.25% due 12/15/2013 | NR/NR | 540,000 | 529,270 | ||||||||
| Green Bay Wisconsin Series B, 4.875% due 4/1/2011 (Insured: MBIA) | Aaa/NR | 365,000 | 383,151 | ||||||||
| Hancock County Mississippi, 4.20% due 8/1/2008 (Insured: MBIA) | Aaa/NR | 305,000 | 315,388 | ||||||||
| Hancock County Mississippi, 4.80% due 8/1/2010 (Insured: MBIA) | Aaa/NR | 245,000 | 252,576 | ||||||||
| Hancock County Mississippi, 4.90% due 8/1/2011 (Insured: MBIA) | Aaa/NR | 315,000 | 323,294 | ||||||||
| Idaho Housing Multi Family Housing Revenue Series 94-B, 8.15% due 7/1/2004 | A2/NR | 845,000 | 859,221 | ||||||||
| Illinois Housing Development Authority Taxable Multi Family Program, 7.85% due 3/1/2005 | A1/A+ | 30,000 | 31,167 | ||||||||
| Indiana Bond Bank Taxable School Severance, 2.54% due 7/15/2004 (Insured: FGIC) | Aaa/AAA | 440,000 | 441,650 | ||||||||
| Indiana Bond Bank Taxable School Severance, 2.74% due 1/15/2005 (Insured: FGIC) | Aaa/AAA | 450,000 | 454,748 | ||||||||
| Jefferson County Texas Navigation Taxable Refunding, 5.50% due 5/1/2010 (Insured: FSA) | Aaa/NR | 500,000 | 534,465 | ||||||||
| Jefferson Franklin, Etc. Counties Illinois Community College District 521, 3.00% due 1/1/2006 (Insured: Aaa/NR | 200,000 | 204,182 | |||||||||
| FSA) | |||||||||||
| Jefferson Franklin, Etc. Counties Illinois Community College District 521, 3.625% due 1/1/2007 | Aaa/NR | 300,000 | 310,689 | ||||||||
| (Insured: FSA) | |||||||||||
| Jersey City New Jersey Municipal Utilities Authority, 3.72% due 5/15/2009 (Insured: MBIA) | Aaa/AAA | 575,000 | 583,430 | ||||||||
| Kendall Kane County Illinois School 308, 5.50% due 10/1/2011 (Insured: FGIC) | Aaa/NR | 365,000 | 398,496 | ||||||||
| King County Washington General Obligation, 7.55% due 12/1/2005 | Aa1/AA+ | 405,000 | 443,264 | ||||||||
| Los Angeles County California Metropolitan Transport, 4.56% due 7/1/2010 | Aaa/AAA | 2,775,000 | 2,900,624 | ||||||||
| Maryland State Economic Development Corp., 7.25% due 6/1/2008 (Maryland Tech. Development Center | NR/NR | 440,000 | 483,556 | ||||||||
| Project) | |||||||||||
| McKeesport Pennsylvania Taxable Series B, 6.60% due 3/1/2006 (Insured: MBIA) | Aaa/AAA | 240,000 | 261,403 | ||||||||
| Mississippi State Taxable Business Series V, 7.125% due 9/1/2006 | NR/AA | 140,000 | 156,299 | ||||||||
| Montgomery County Maryland Revenue Authority, 5.00% due 2/15/2012 | Aa2/AA+ | 100,000 | 104,594 | ||||||||
| New Jersey Health Care Facilities Financing, 10.75% due 7/1/2010 (escrowed to maturity) | NR/NR | 435,000 | 555,334 | ||||||||
| New Jersey Health Care Facilities Financing, 7.70% due 7/1/2011 (Insured: Connie Lee) | NR/AAA | 165,000 | 193,934 | ||||||||
| New Rochelle New York Industrial Development Agency, 7.15% due 10/1/2014 | Aa3/A+ | 150,000 | 165,108 | ||||||||
| New York Environmental Facilities, 5.85% due 3/15/2011 | NR/AA- | 3,500,000 | 3,901,835 | ||||||||
| New York State Thruway Authority Service Contract, 2.59% due 3/15/2006 | A3/AA- | 1,000,000 | 1,011,200 | ||||||||
| New York State Urban Development Corp., 4.75% due 12/15/2011 | NR/AA | 1,400,000 | 1,469,524 | ||||||||
| Newark New Jersey, 4.70% due 4/1/2011 (Insured: MBIA) | Aaa/NR | 845,000 | 878,082 | ||||||||
27
| SCHEDULE OF INVESTMENTS, CONTINUED Thornburg Limited Term Income Fund | March 31, 2004 | ||||||||||
|---|---|---|---|---|---|---|---|---|---|---|---|
| Newark New Jersey, 4.90% due 4/1/2012 (Insured: MBIA) | Aaa/NR | 1,225,000 | $ | 1,272,628 | |||||||
| Niagara Falls New York Public Water, 4.30% due 7/15/2010 (Insured: MBIA) | Aaa/AAA | 360,000 | 372,107 | ||||||||
| North Carolina Municipal Power Agency Taxable Series B, 3.26% due 1/1/2005 | Baa1/BBB+ | 1,000,000 | 1,007,600 | ||||||||
| Northwest Open Access Network Washington Revenue, 6.18% due 12/1/2008 (Insured: AMBAC) | Aaa/AAA | 1,600,000 | 1,799,184 | ||||||||
| Ohio State Petroleum Underground Storage, 6.75% due 8/15/2008 (Insured: MBIA) | Aaa/AAA | 985,000 | 1,008,778 | ||||||||
| Oregon State Department Administrative Lottery Revenue Taxable B, 4.90% due 4/1/2005 (Insured: FSA) | Aaa/AAA | 205,000 | 211,824 | ||||||||
| Passaic County New Jersey Multi Modal Taxable Refunding Series B, 6.23% due 9/1/2005 (Insured: FSA) | Aaa/AAA | 250,000 | 266,130 | ||||||||
| Pima County Arizona Industrial Development Authority Series E, 9.05% due 7/1/2008 | Baa3/NR | 455,000 | 523,236 | ||||||||
| Providence Rhode Island, 5.59% due 1/15/2008 | Aaa/AAA | 340,000 | 374,517 | ||||||||
| Sam Rayburn Texas Municipal Power Agency, 5.05% due 10/1/2004 | Baa2/BBB- | 775,000 | 784,168 | ||||||||
| San Francisco California City & County Redevelopment Project Series B, 7.80% due 8/1/2004 | A2/A | 540,000 | 551,529 | ||||||||
| Short Pump Town Center Community Development, 6.26% due 2/1/2009 | NR/NR | 1,000,000 | 1,015,600 | ||||||||
| Sisters Providence Obligation Group Direct Obligation Notes Series 1997, 7.47% due 10/1/2007 | A1/AA- | 2,190,000 | 2,504,944 | ||||||||
| South Dakota State Building Authority Revenue, 7.00% due 9/1/2005 (escrowed to maturity) | Aaa/AAA | 400,000 | 429,520 | ||||||||
| St. Louis Missouri Municipal Finance Corp. Firemans Retirement System, 6.35% due 8/1/2005 (Insured: | Aaa/AAA | 2,240,000 | 2,318,400 | ||||||||
| MBIA) | |||||||||||
| Tennessee State Taxable Series B, 6.00% due 2/1/2013 | Aa2/AA | 500,000 | 549,190 | ||||||||
| Texas State Public Finance Authority Revenue, 3.125% due 6/15/2007 | Aa2/AA | 400,000 | 406,544 | ||||||||
| Texas Tech University Revenue, 6.00% due 8/15/2011 (Insured: MBIA) | Aaa/AAA | 245,000 | 275,157 | ||||||||
| University Illinois Revenue, 6.35% due 4/1/2011 (Insured: FGIC) | Aaa/AAA | 1,000,000 | 1,142,120 | ||||||||
| University of New Mexico Revenue, 3.90% due 6/1/2010 (Insured: AMBAC) | Aaa/AAA | 90,000 | 91,338 | ||||||||
| University of New Mexico Revenue, 4.15% due 6/1/2011 (Insured: AMBAC) | Aaa/AAA | 250,000 | 253,490 | ||||||||
| University of New Mexico Revenue, 4.375% due 6/1/2012 (Insured: AMBAC) | Aaa/AAA | 180,000 | 182,274 | ||||||||
| University of New Mexico Revenue, 4.50% due 6/1/2013 (Insured: AMBAC) | Aaa/AAA | 270,000 | 272,330 | ||||||||
| Victor New York Taxable-Tax Increment, 9.20% due 5/1/2014 | NR/NR | 1,000,000 | 1,076,840 | ||||||||
| Virginia Housing Development Authority Taxable Rental Housing Series I, 7.30% due 2/1/2008 | Aa1/AA+ | 505,000 | 578,912 | ||||||||
| Washington Pennsylvania, 4.30% due 9/1/2005 (Insured: FGIC) | Aaa/AAA | 285,000 | 295,308 | ||||||||
| West Valley City Utah Municipal Building Lease Refunding Taxable, 7.67% due 5/1/2006 | Aa2/NR | 1,500,000 | 1,656,750 | ||||||||
| Wisconsin State General Revenue, 4.80% due 5/1/2013 | Aaa/AAA | 200,000 | 206,536 | ||||||||
| Total Taxable Municipal Bonds (Cost $59,663,050) | -- | -- | 62,167,489 | ||||||||
| FOREIGN SECURITIES - 1.10% | |||||||||||
| British Columbia Province, 9.00% due 6/21/2004 (Canadian Dollars) | Aa2/AA- | 2,000,000 | 1,548,571 | ||||||||
| Federal Republic of Germany, 5.00% due 8/19/2005 (EURO) | Aaa/AAA | 2,000,000 | 2,556,838 | ||||||||
| Total Foreign Securities (Cost $3,330,694) | -- | -- | 4,105,409 | ||||||||
| SHORT TERM - 5.80% | |||||||||||
| American General Finance Corp., 1.07% due 4/2/2004 | A1/P1 | 3,000,000 | 2,999,911 | ||||||||
| American General Finance Corp., 1.07% due 4/5/2004 | A1/P1 | 4,000,000 | 3,999,524 | ||||||||
| International Business Machines, 0.95% due 4/1/2004 | A1/P1 | 11,000,000 | 11,000,000 | ||||||||
| Nestle Capital Corp., 0.96% due 4/2/2004 | A1/P1 | 4,000,000 | 3,999,894 | ||||||||
| Total Short Term (Cost $21,999,329) | -- | -- | 21,999,329 | ||||||||
| TOTAL INVESTMENTS (100%) (Cost $367,358,479) | -- | -- | $ | 382,172,551 | |||||||
| Principal amount in U.S. Dollars unless otherwise indicated, value is in U.S. Dollar | |||||||||||
| †Credit ratings are unaudited | |||||||||||
| See notes to financial statements | |||||||||||
28
Index Comparisons
March 31, 2004
GOVERNMENT FUND
The chart below compares performance of the Thornburg Limited Term U.S. Government Fund Class I shares to the Lehman Brothers Intermediate Government Bond Index and the Consumer Price Index for the periods ended March 31, 2004. On March 31, 2004, the weighted average securities ratings of the Index and the Fund were AAA and AAA, respectively, and the weighted average portfolio maturities of the Index and the Fund were 4.5 years and 3.8 years, respectively. Class I shares became available on July 5, 1996. Past performance of the Index and the Fund may not be indicative of future performance. The performance data and graph do not reflect the deduction of taxes that a shareholder would pay on distributions or the redemption of fund shares.
Thornburg Limited Term U.S.Government Fund Class I Total Returns, Since July 5, 1996, versus Lehman Brothers Intermediate Government Bond Index and Consumer Price Index (CPI)
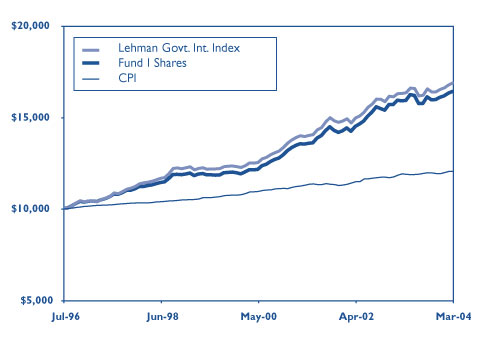
Average Annual Total Returns(periods
ending 3/31/04)
| I Shares | |||
|---|---|---|---|
| One Year: | 3 | .27% | |
| Five Years: | 6 | .65% | |
| From Inception (7/5/96): | 6 | .74% | |
There is no up front sales charge for I shares.
Past performance is no guarantee of future results. Current returns may be either lower or higher than those shown. Share prices and returns will fluctuate and investors may experience a loss upon redemption. There is no guarantee that the Fund will meet its objectives. Shares in the Fund carry risks, including possible loss of principal.
For month end performance information, visit www.thornburg.com.
Carefully consider the Fund’s investment objectives, risks, sales charges, and expenses; this is found in the prospectus, which is available from your financial advisor or from www.thornburg.com. Read it carefully before you invest or send money.
The Lehman Brothers Intermediate Government Bond Index is an unmanaged market-weighted index generally representative of all public obligations of the U.S. Government, its agencies and instrumentalities having maturities of up to ten years.
The Consumer Price Index (“CPI”) measures prices of a fixed basket of goods bought by a typical consumer, including food, transportation, shelter, utilities, clothing, medical care, entertainment and other items. The CPI, published by the Bureau of Labor Statistics in the Department of Labor, is based at 100 in 1982 and is released monthly. It is widely used as a cost-of-living benchmark to adjust Social Security payments and other payment schedules, union contracts and tax brackets. Also known as the cost-of-living index.
Unless otherwise noted, index returns reflect the reinvestment of income dividends and capital gains, if any, but do not reflect fees, brokerage commissions or other expenses of investing. Investors may not make direct investments into any index.
29
INCOME FUND
Index Comparisons
The chart below compares performance of the Thornburg Limited Term Income Fund Class I shares to the Lehman Brothers Intermediate Government/Credit Index and the Consumer Price Index for the periods ended March 31, 2004. On March 31, 2004, the weighted average securities ratings of the Index and the Fund were A and AA, respectively, and the weighted average portfolio maturities of the Index and the Fund were 4.7 years and 4.4 years, respectively. Class I shares became available on July5, 1996. Past performance of the Index and the Fund may not be indicative of future performance. The performance data and graph do not reflect the deduction of taxes that a shareholder would pay on distributions or the redemption of fund shares.
Thornburg Limited Term Income Fund Class I Total Returns, Since Inception, versus Lehman Brothers Intermediate Government/Credit Index and Consumer Price Index (CPI)

Average Annual Total Returns(periods
ending 3/31/04)
| I Shares | |||
|---|---|---|---|
| One Year: | 5 | .19% | |
| Five Years: | 6 | .95% | |
| From Inception (7/5/96): | 7 | .08% | |
There is no up front sales charge for I shares.
Past performance is no guarantee of future results. Current returns may be either lower or higher than those shown. Share prices and returns will fluctuate and investors may experience a loss upon redemption. There is no guarantee that the Fund will meet its objectives. Shares in the Fund carry risks, including possible loss of principal.
Carefully consider the Fund’s investment objectives, risks, sales charges, and expenses; this is found in the prospectus, which is available from your financial advisor or from www.thornburg.com. Read it carefully before you invest or send money.
For month end performance information, visit www.thornburg.com.
The Lehman Brothers Intermediate Government/Credit Bond Index is an unmanaged, market-weighted index generally representative of intermediate government and investment grade corporate debt securities having maturities of up to ten years.
The Consumer Price Index (“CPI”) measures prices of a fixed basket of goods bought by a typical consumer, including food, transportation, shelter, utilities, clothing, medical care, entertainment and other items. The CPI, published by the Bureau of Labor Statistics in the Department of Labor, is based at 100 in 1982 and is released monthly. It is widely used as a cost-of-living benchmark to adjust Social Security payments and other payment schedules, union contracts and tax brackets. Also known as the cost-of-living index.
Unless otherwise noted, index returns reflect the reinvestment of income dividends and capital gains, if any, but do not reflect fees, brokerage commissions or other expenses of investing. Investors may not make direct investments into any index.
30
Thornburg Limited Term U.S. Government Fund
I Shares
Outperformed U.S. Government Money Market Index
(Unaudited)
Investors sometimes ask us to compare the returns of the Thornburg Limited Term U.S. Government Fund to money market fund returns. These investments have certain differences, and investors in the Thornburg Limited Term U.S. Government Fund took more risk than money market fund investors to earn their higher returns.
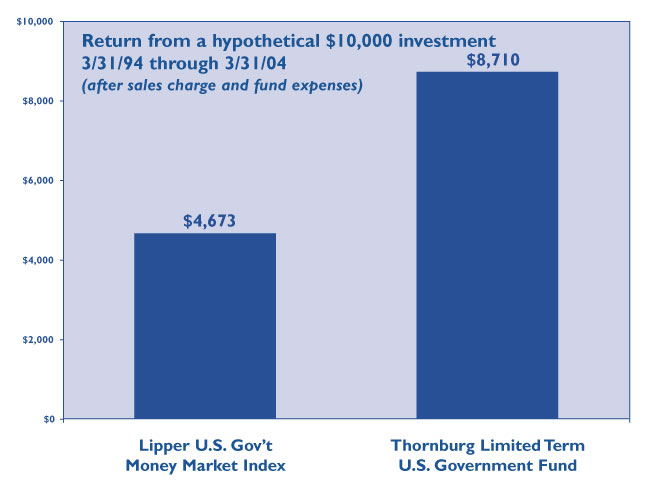
The chart above is for the Fund’s Class I Shares only. Class A, Class B, Class C and Class R-1 Shares have different sales charges and expenses. See the inside front cover page for the 30-day SEC yield and the total returns at the maximum offering prices for one year, three years, five years, and since inception for the Class I shares of the Fund.
*Prior to 7/5/96 the illustration includes actual returns of the Class A shares adjusted for the lower Institutional expenses. Return for the money fund average is based upon 30-day yield quotations for taxable money funds as quoted in “Lipper U.S. Government Money Market Index” for the months covered by this analysis. The return for Limited Term U.S. Government Fund is based upon the dividends paid for the months covered by this analysis, the beginning offering price of $12.40 per share and the ending NAV of $13.26 per share. These investments returned the $10,000 initial investment in addition to the amounts shown above.
Note 1: Future performance of any of these investments may bear no relationship to prior performance.
Note 2: This analysis does not take into account the effect, if any, caused by taxes. The average money market fund increases shown above may differ from the return of a particular money market fund. It is not possible to invest in this money fund average.
Note 3: Generally, money market funds seek to maintain an investment portfolio with an average maturity of 90 days or less. Thornburg Limited Term U.S. Government Fund invests in short-to-intermediate maturity U.S. Government and agency obligations. The net asset value of the money funds did not fluctuate. The net asset value of the Class I Shares of LTUIX did vary from time to time, and will continue to vary in the future due to the effect of changes in interest rates on the value of the investments the Fund holds. The analysis assumes that the investor received the net asset value of the shares owned, plus accrued income, at time of sale. Redemptions are made at the then current net asset value, which may give you a gain or loss when you sell your shares.
Note 4: This analysis assumes that the dividends from each of these investment vehicles were reinvested and compounded monthly. Most money funds declare dividends daily and pay them monthly. LTUIX also declares dividends daily and pays them monthly.
31
Thornburg Limited Term Income Fund
I shares
Outperformed Lipper Money Market Index
(Unaudited)
Investors sometimes ask us to compare the returns of the Thornburg Limited Term Income Fund to money market fund returns. These investments have certain differences, and investors in the Thornburg Limited Term Income Fund took more risk than money market fund investors to earn their higher returns.
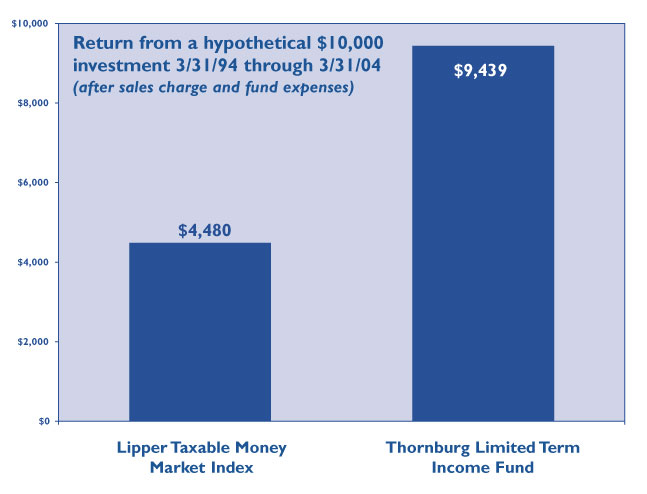
The chart above is for the Fund’s Class I Shares only. Class A, Class B, Class C and Class R-1 Shares have different sales charges and expenses. See the inside front cover page for the 30-day SEC yield and the total returns at the maximum offering prices for one year, three years, five years, and since inception for the Class I shares of the Fund.
*Prior to 7/5/96 the illustration includes actual returns of the Class A shares adjusted for the lower Institutional expenses. Return for the money fund average is based upon 30-day yield quotations for taxable money funds as quoted in “Lipper Money Market Index” for the months covered by this analysis. The return for Thornburg Limited Term Income Fund is based upon the dividends paid for the months covered by this analysis, the beginning offering price of $12.07 per share and the ending NAV of $13.05 per share. These investments returned the $10,000 initial investment in addition to the amounts shown above.
Note 1: Future performance of any of these investments may bear no relationship to prior performance.
Note 2: This analysis does not take into account the effect, if any, caused by taxes. The average money market fund increases shown above may differ from the return of a particular money market fund. It is not possible to invest in this money fund average.
Note 3: Generally, money market funds seek to maintain an investment portfolio with an average maturity of 90 days or less. Thornburg Limited Term Income Fund invests in short-to-intermediate maturity fixed income obligations. The net asset value of the money funds did not fluctuate. The net asset value of the Class I Shares of THIIX did vary from time to time, and will continue to vary in the future due to the effect of changes in interest rates on the value of the investments the Fund holds. The analysis assumes that the investor received the net asset value of the shares owned, plus accrued income, at time of sale. Redemptions are made at the then current net asset value, which may give you a gain or loss when you sell your shares.
Note 4: This analysis assumes that the dividends from each of these investment vehicles were reinvested and compounded monthly. Most money funds declare dividends daily and pay them monthly. THIIX also declares dividends daily and pays them monthly.
32
Investment Manager Thornburg
Investment Management, Inc.119
East Marcy Street Santa Fe, New Mexico 87501
800.847.0200
Principal Underwriter Thornburg
Securities Corporation
119 East Marcy StreetSanta Fe, New Mexico 87501
800.847.0200
This report is submitted for the general information of shareholders of the Fund. It is not authorized for distribution to prospective investors in the Fund unless preceded or accompanied by an effective prospectus. Carefully consider information in the prospectus regarding the Fund’s investment objectives and policies, risks, sales charges, expenses, experience of its management, marketability of shares, and other information. Performance data quoted represent past performance and do not guarantee future results.
www.thornburg.com
Thornburg New Mexico Intermediate Municipal Fund
Semi-Annual Report
March 31, 21004
Thornburg New Mexico Intermediate Municipal Fund
ALL DATA AS OF 3/31/04.
| FUND FACTS: Thornburg New Mexico Intermediate Municipal Fund | ||
| -- | A Shares | D Shares |
| Annualized Distribution Rate (at NAV) | 3.27% | 2.94% |
| SEC Yield | 2.08% | 1.81% |
| NAV | $ 13.48 | $ 13.49 |
| Maximum Offering Price | $ 13.76 | $ 13.49 |
| TOTAL RETURNS: Annual Average - (After Subtracting Maximum Sales Charge) | ||
| One Year | 2.04% | 3.86% |
| Three Years | 4.24% | 4.66% |
| Five Years | 4.09% | N/A |
| Ten Years | 4.86% | N/A |
| Since Inception | 5.52% | 4.43% |
| Inception Date | 6/18/1991 | 6/1/1999 |
| | Maximum sales charge of the Fund’s Class A Shares is 2.00%. There is no up front sales charge for Class D Shares and no contingent deferred sales charge. |
| Past performance is no guarantee of future results. Current returns may be either lower or higher than those shown. Share prices and returns will fluctuate and investors may experience a loss upon redemption. There is no guarantee that the Fund will meet its objectives. Shares in the Fund carry risks, including possible loss of principal. |
| Carefully consider the Fund’s investment objectives, risks, sales charges, and expenses; this information is found in the prospectus, which is available from your financial advisor or from www.thornburg.com. Read it carefully before you invest or send money. month-end performance information, visit www.thornburg.com. |
| The SEC Yield is computed in accordance with SEC standards measuring the net investment income per share over a specified 30-day period expressed as a percentage of the maximum offering price of the Fund’s shares at the end of the period. |
| The distribution rate is calculated by taking the sum of the month’s total distribution factors and dividing this sum by a 30-day period and annualizing to 360-day year. The value is then divided by the ending NAV to arrive at the annualized distribution yield. The yield is calculated on a periodic basis and is subject to change depending on the Fund’s NAV and current distributions. |
1
Letter to shareholders
Thornburg New Mexico Intermediate Municipal Fund
April 15, 2004
Dear Fellow Shareholder:
I am pleased to present the semi-annual report for your Thornburg New Mexico Intermediate Fund. The net asset value of the A shares increased by 2 cents to $13.48 during the six-month period ending March 31, 2004. If you were with us for the entire period, you received dividends of 22.8 cents per share. If you reinvested dividends, you received 23.0 cents per share. Investors who owned D shares received dividends of 20.7 and 20.9 cents per share respectively.
Interest rates on intermediate municipal bonds fell slightly over the six-month period ending March 31, 2004. For example, the interest rate on a ten-year AAA rated municipal bond dropped from 3.67% to 3.49% from the end of September to the end of March. Lower interest rates helped the fund’s net asset value appreciate somewhat to produce a total return of 1.86% over the six-month period. The Merrill Lynch 7-12 Year Municipal Bond Index had a total return of 3.33% over the same time period. The index has a significantly longer duration than the fund (7.3 versus 4.1 years), causing it to perform better than the fund in falling interest rate environments such as the 6 months ending March 31, 2004.
Municipal bond yields reached a low point on March 9th and have been trending upwards since then. For example, the yield on a high quality 7-year municipal bond is up 0.58% to 3.25% as of April 13, 2004. Yields are up because economic growth has finally led to employment growth. That point was made abundantly clear with the announcement of 308,000 new jobs on April 2nd. Whether interest rates will keep climbing depends largely upon what happens to inflation.
We believe that consumer price inflation has probably bottomed around the 1.2% level. Many commodity prices have doubled over the last year. Price pressures abound in metals, petroleum products, chemicals, paper, and even in soybeans! Transportation costs are going up rapidly. Unit labor costs have been subdued because of productivity gains, but past productivity gains may prove very hard to replicate. All these factors should lead to somewhat higher inflation over the next few years.
Higher inflation, coupled with rising bond issuance will likely give rise to higher interest rates on bonds. For now, a 1% Fed Funds target seems to be keeping a cap on how high bond yields can go, but the Federal Reserve will probably have to start moving to a less accommodative policy before the end of this year. If that happens, we would expect bond yields to rise above current trading ranges.
We have prepared for this environment by keeping the duration of your portfolio to the short end of its typical range. We have also generally favored bonds that we believe will be less price sensitive to interest rate changes. We have not deviated from our long-held strategy of laddering short and intermediate bonds because we believe that laddering is the most effective way to deal with changing interest rates in an uncertain world.
Your Thornburg New Mexico Intermediate Municipal Fund is a laddered portfolio of over 175 municipal obligations from all over New Mexico. Today, your fund’s weighted average maturity is 7.5 years. We always keep it below 10 years. We ladder the maturity dates of the bonds in your portfolio so that some of the bonds are scheduled to mature during each of the coming years. Laddering intermediate bonds accomplishes two goals. First, the diverse bond maturities contained in a ladder defuse interest-rate risk and dampen the fund’s price volatility.
2
Letter to shareholders, Continued
Thornburg New Mexico Intermediate Municipal Fund
Second, laddering gives the fund a steady cash flow stream from maturing bonds to reinvest toward the top of the ladder where yields are typically higher. The chart at right portrays the percentages of your fund’s bond portfolio maturing in each of the coming years.
New Mexico’s diverse mix of revenues, including gross receipts, severance, income taxes, and investment income has enabled the state to maintain a strong credit profile throughout a national downturn. The state is expecting robust revenue growth in 2004 and maintains a healthy reserve balance projected to be over $300 million by June 30, 2004. Currently, 94% of the portfolio is rated A or above and 47% is rated AAA by Moody’s or Standard and Poor’s.
Over the years, our practice of laddering a diversified portfolio of short and intermediate maturity municipal bonds has allowed your fund to perform consistently well in varying interest rate environments. Thank you for investing in Thornburg New Mexico Intermediate Fund.
Sincerely,

George Strickland
Portfolio Manager
| % of portfolio maturing within | Cumulative% maturing by end of | ||||
|---|---|---|---|---|---|
| 2 years = 14% | Year 2 = 14% | ||||
| 2 to 4 years = 14% | Year 4 = 28% | ||||
| 4 to 6 years = 10% | Year 6 = 38% | ||||
| 6 to 8 years = 16% | Year 8 = 54% | ||||
| 8 to 10 years = 12% | Year 10 = 66% | ||||
| 10 to 12 years = 8% | Year 12 = 74% | ||||
| 12 to 14 years = 12% | Year 14 = 86% | ||||
| 14 to 16 years = 4% | Year 16 = 90% | ||||
| 16 to 18 years = 5% | Year 18 = 95% | ||||
| Over 18 years = 5% | Over 18 years = 100% | ||||
Percentages can and do vary. Data as of 3/31/04.
The Merrill Lynch 7-12 Year Municipal Bond Index represents a broad measure of market performance. It is a model portfolio of municipal obligations throughout the U.S., with an average maturity which ranges from seven to twelve years.
Unless otherwise noted, index returns reflect the reinvestment of income dividends and capital gains, if any, but do not reflect fees, brokerage commissions or other expenses of investing. Investors may not make direct investments into any index.
3
| Statement of assets and liabilities | |||||
|---|---|---|---|---|---|
| Thornburg New Mexico Intermediate Municipal Fund | March 31, 2004 | ||||
| ASSETS | (Unaudited) | ||||
| Investments at value (cost $224,307,322) | $ | 235,195,696 | |||
| Cash | 54,054 | ||||
| Receivable for investments sold | 332,115 | ||||
| Receivable for fund shares sold | 97,487 | ||||
| Interest receivable | 3,007,422 | ||||
| Prepaid expenses and other assets | 2,676 | ||||
| Total Assets | 238,689,450 | ||||
| LIABILITIES | |||||
| Payable for securities purchased | 2,484,437 | ||||
| Payable for fund shares redeemed | 186,890 | ||||
| Accounts payable and accrued expenses | 88,043 | ||||
| Payable to investment advisor (Note 3) | 118,679 | ||||
| Dividends payable | 629,135 | ||||
| Total Liabilities | 3,507,184 | ||||
| NET ASSETS | $ | 235,182,266 | |||
| NET ASSETS CONSIST OF: | |||||
| Net unrealized appreciation (depreciation) on investments | $ | 10,888,374 | |||
| Accumulated net realized gain (loss) | (1,655,445 | ) | |||
| Net capital paid in on shares of beneficial interest | 225,949,337 | ||||
| $ | 235,182,266 | ||||
| NET ASSET VALUE: | |||||
| Class A Shares: | |||||
| Net asset value and redemption price per share | |||||
| ($220,309,283 applicable to 16,344,713 shares of beneficial | |||||
| interest outstanding - Note 4) | $ | 13.48 | |||
| Maximum sales charge, 2.00% of offering price | 0.28 | ||||
| Maximum Offering Price Per Share | $ | 13.76 | |||
| Class D Shares: | |||||
| Net asset value, offering and redemption price per share | |||||
| ($14,872,983 applicable to 1,102,871 shares of beneficial | |||||
| interest outstanding - Note 4) | $ | 13.49 | |||
| See notes to financial statements | |||||
4
| Statement of operations | |||||
|---|---|---|---|---|---|
| Thornburg New Mexico Intermediate Municipal Fund | March 31, 2004 | ||||
| INVESTMENT INCOME: | (Unaudited) | ||||
| Interest income (net of premium amortized of $772,092) | $ | 5,011,524 | |||
| EXPENSES: | |||||
| Investment advisory fees (Note 3) | 574,249 | ||||
| Administration fees (Note 3) | |||||
| Class A Shares | 135,942 | ||||
| Class D Shares | 9,038 | ||||
| Distribution and service fees (Note 3) | |||||
| Class A Shares | 212,873 | ||||
| Class D Shares | 74,339 | ||||
| Transfer agent fees | |||||
| Class A Shares | 38,165 | ||||
| Class D Shares | 8,574 | ||||
| Registration and filing fees | |||||
| Class A Shares | 260 | ||||
| Class D Shares | 260 | ||||
| Custodian fees (Note 3) | 56,476 | ||||
| Professional fees | 13,255 | ||||
| Accounting fees | 9,605 | ||||
| Trustee fees | 2,952 | ||||
| Other expenses | 13,335 | ||||
| Total Expenses | 1,149,323 | ||||
| Less: | |||||
| Expenses reimbursed by investment advisor (Note 3) | (7,137 | ) | |||
| Distribution and service fees waived (Note 3) | (37,170 | ) | |||
| Fees paid indirectly (Note 3) | (646 | ) | |||
| Net Expenses | 1,104,370 | ||||
| Net Investment Income | 3,907,154 | ||||
| REALIZED AND UNREALIZED GAIN (LOSS) | |||||
| Net realized gain (loss) on investments | 3,563 | ||||
| Increase (Decrease) in unrealized appreciation of investments | 297,497 | ||||
| Net Realized and Unrealized | |||||
| Gain (Loss) on Investments | 301,060 | ||||
| Net Increase (Decrease) in Net Assets Resulting | |||||
| From Operations | $ | 4,208,214 | |||
| See notes to financial statements | |||||
5
| Statements of changes in net assets | ||||||||
|---|---|---|---|---|---|---|---|---|
| Thornburg New Mexico Intermediate Municipal Fund | ||||||||
| Six Months Ended March 31, 2004 | Year Ended September 30, 2003 | |||||||
| INCREASE (DECREASE) IN NET ASSETS FROM: | ||||||||
| OPERATIONS: | ||||||||
| Net investment income | $ | 3,907,154 | $ | 7,940,266 | ||||
| Net realized gain (loss) on investments | 3,563 | 35,461 | ||||||
| Increase (Decrease) in unrealized appreciation of investments | 297,497 | 519,875 | ||||||
| Net Increase (Decrease) in Net Assets | ||||||||
| Resulting from Operations | 4,208,214 | 8,495,602 | ||||||
| DIVIDENDS TO SHAREHOLDERS: | ||||||||
| From net investment income | ||||||||
| Class A Shares | (3,684,920 | ) | (7,548,644 | ) | ||||
| Class D Shares | (222,234 | ) | (391,622 | ) | ||||
| FUND SHARE TRANSACTIONS (Note 4): | ||||||||
| Class A Shares | 3,256,149 | 23,500,283 | ||||||
| Class D Shares | 200,895 | 4,900,950 | ||||||
| Net Increase (Decrease) in Net Assets | 3,758,104 | 28,956,569 | ||||||
| NET ASSETS: | ||||||||
| Beginning of period | 231,424,162 | 202,467,593 | ||||||
| End of period | $ | 235,182,266 | $ | 231,424,162 | ||||
See notes to financial statements.
6
Notes to financial statements
Thornburg New Mexico Intermediate Municipal Fund
March 31, 2004
NOTE 1 – ORGANIZATION Thornburg New Mexico Intermediate Municipal Fund (the “Fund”) is a non-diversified series of Thornburg Investment Trust (the “Trust”). The Trust is organized as a Massachusetts business trust under a Declaration of Trust dated June 3, 1987 and is registered as a diversified, open-end management investment company under the Investment Company Act of 1940, as amended. The Trust is currently issuing nine series of shares of beneficial interest in addition to those of the Fund: Thornburg Florida Intermediate Municipal Fund, Thornburg New York Intermediate Municipal Fund, Thornburg Intermediate Municipal Fund, Thornburg Limited Term U.S. Government Fund, Thornburg Limited Term Income Fund, Thornburg Value Fund, Thornburg International Value Fund, Thornburg Core Growth Fund, and Thornburg Investment Income Builder Fund. Each series is considered to be a separate entity for financial reporting and tax purposes and bears expenses directly attributable to it. The Fund’s investment objective is to obtain as high a level of current income exempt from Federal income tax as is consistent with the preservation of capital.
The Fund currently offers two classes of shares of beneficial interest, Class A and Class D shares. Each class of shares of the Fund represents an interest in the same portfolio of investments of the Fund, except that (i) Class A shares are sold subject to a front-end sales charge collected at the time the shares are purchased and bear a service fee, (ii) Class D shares are sold at net asset value without a sales charge at the time of purchase or redemption and bear both a service fee and a distribution fee, and (iii) the respective classes have different reinvestment privileges. Additionally, the Fund may allocate among its classes certain expenses, to the extent allowable to specific classes, including transfer agent fees, government registration fees, certain printing and postage costs, and administrative and legal expenses. Currently, class specific expenses of the Fund are limited to service and distribution fees, administration fees and certain registration and transfer agent expenses.
NOTE 2 – SIGNIFICANT ACCOUNTING POLICIES Significant accounting policies of the Fund are as follows:
Valuation of Investments: In determining net asset value, the Fund utilizes an independent pricing service approved by the Trustees. Debt investment securities have a primary market over the counter and are valued on the basis of valuations furnished by the pricing service. The pricing service
Thornburg New Mexico Intermediate Municipal Fund
values portfolio securities at quoted bid prices, normally at 4:00 pm EST or the yield equivalents when quotations are not readily available. Securities for which quotations are not readily available are valued at fair value as determined by the pricing service using methods which include consideration of yields or prices of municipal obligations of comparable quality, type of issue, coupon, maturity, and rating; indications as to value from dealers and general market conditions. The valuation procedures used by the pricing service and the portfolio valuations received by the Fund are reviewed by the officers of the Trust under the general supervision of the Trustees. Short-term obligations having remaining maturities of 60 days or less are valued at amortized cost, which approximates market value.
Federal Income Taxes: It is the policy of the Fund to comply with the provisions of the Internal Revenue Code applicable to “regulated investment companies” and to distribute all of its taxable (if any) and tax exempt income to its shareholders. Therefore, no provision for Federal income tax is required.
When-Issued and Delayed Delivery Transactions: The Fund may engage in when-issued or delayed delivery transactions. To the extent the Fund engages in such transactions, it will do so for the purpose of acquiring portfolio securities consistent with its investment objectives and not for the purpose of investment leverage or to speculate on interest rate changes. At the time the Fund makes a commitment to purchase a security on a when-issued basis, it will record the transaction and reflect the value in determining the Fund’s net asset value. When effecting such transactions, assets of the Fund of an amount sufficient to make payment for the portfolio securities to be purchased will be segregated on the Fund’s records on the trade date. Securities purchased on a when-issued or delayed delivery basis do not earn interest until the settlement date.
Dividends: Net investment income of the Fund is declared daily as a dividend on shares for which the Fund has received payment. Dividends are paid monthly and are reinvested in additional shares of the Fund at net asset value per share at the close of business on the dividend payment date, or at the shareholder’s option, paid in cash. Net capital gains, to the extent available, will be distributed at least annually.
General: Securities transactions are accounted for on a trade date basis. Interest income is accrued as earned. Premiums
7
Notes to financial statements, Continued
Thornburg New Mexico Intermediate Municipal Fund
March 31, 2004
and discounts on securities purchased are amortized to call dates or maturity dates of the respective securities. Realized gains and losses from the sale of securities are recorded on an identified cost basis. Net investment income, other than class specific expenses, and realized and unrealized gains and losses, are allocated daily to each class of shares based upon the relative net asset value of shares outstanding (or the value of the dividend-eligible shares, as appropriate) of each class of shares at the beginning of the day (after adjusting for the current share activity of the respective class). Expenses common to all funds are allocated among the funds comprising the Trust based upon their relative net asset values or other appropriate allocation methods.
Guarantees and Indemnifications: Under the Trust’s organizational documents, its officers and trustees are indemnified against certain liability arising out of the performance of their duties to the Fund. Additionally, in the normal course of business the Trust enters into contracts with service providers that contain general indemnification clauses. The Trust’s maximum exposure under these arrangements is unknown. However, based on experience, the Trust expects the risk of loss to be remote.
Use of Estimates: The preparation of financial statements, in conformity with generally accepted accounting principles, requires management to make estimates and assumptions that affect the reported amounts of assets and liabilities and the disclosure of contingent assets and liabilities at the date of the financial statements and the reported amounts of increases and decreases in net assets from operations during the reporting period. Actual results could differ from those estimates.
NOTE 3 — INVESTMENT ADVISORY FEE AND OTHER TRANSACTIONS WITH AFFILIATES
Pursuant to an investment advisory agreement, Thornburg Investment Management, Inc. (the “Advisor”) serves as the investment advisor and performs services for which the fees are payable at the end of each month. For the period ended March 31, 2004, these fees were payable at annual rates ranging from .50 of 1% to .275 of 1% of the average daily net assets of the Fund. The Fund also has an administrative services agreement with the Advisor, whereby the Advisor will perform certain administrative services for the shareholders of each class of the Fund’s shares, and for which fees will be payable at an annual rate of up to .125 of 1% of the average daily net assets attributable to each class of shares. For the period ended March 31, 2004, the Advisor
voluntarily reimbursed certain class specific expenses and administrative fees of $7,137 for Class D shares.
The Fund has an underwriting agreement with Thornburg Securities Corporation (the “Distributor”), which acts as the Distributor of Fund shares. For the period ended March 31, 2004, the Distributor has advised the Fund that it earned net commissions aggregating $0 from the sale of Class A shares.
Pursuant to a service plan, under Rule 12b-1 of the Investment Company Act of 1940, the Fund may reimburse to the Advisor an amount not to exceed .25 of 1% per annum of the average daily net assets attributable to each class of shares of the Fund for payments made by the Advisor to securities dealers and other financial institutions to obtain various shareholder related services. The Advisor may pay out of its own resources additional expenses for distribution of the Fund’s shares.
The Fund has also adopted a distribution plan pursuant to Rule 12b-1, applicable only to the Fund’s Class D shares under which the Fund compensates the Distributor for services in promoting the sale of Class D shares of the Fund at an annual rate of up to .75% of the average daily net assets attributable to Class D shares. Total fees incurred by each class of shares of the Fund under their respective Service and Distribution Plans for the period ended March 31, 2004, are set forth in the statement of operations. Distribution fees in the amount of $37,170 were waived for Class D shares.
The Fund has an agreement with the custodian bank to indirectly pay a portion of the custodian’s fees through credits earned by the Fund’s cash on deposit with the bank. This deposit agreement is an alternative to overnight investments. Custodial fees have been adjusted to reflect amounts that would have been paid without this agreement, with a corresponding adjustment reflected as fees paid indirectly in the statements of operations. For the period ended March 31, 2004, the fees paid indirectly were $646.
Certain officers and trustees of the Trust are also officers and/or directors of the Advisor and Distributor. The compensation of unaffiliated trustees is borne by the Trust.
8
Notes to financial statements, Continued
Thornburg New Mexico Intermediate Municipal Fund
March 31, 2004
NOTE 4 — SHARES OF BENEFICIAL INTEREST
At March 31, 2004 there were an unlimited number of shares of beneficial interest authorized. Transactions in shares of beneficial interest were as follows:
| Period Ended March 31, 2004 | Year Ended September 30, 2003 | |||||||||||||
|---|---|---|---|---|---|---|---|---|---|---|---|---|---|---|
| Shares | Amount | Shares | Amount | |||||||||||
| Class A Shares | ||||||||||||||
| Shares sold | 2,023,602 | $ | 27,205,028 | 5,821,374 | $ | 77,915,699 | ||||||||
| Shares issued to shareholders in | 137,540 | 1,849,088 | 347,915 | 4,650,412 | ||||||||||
| reinvestment of dividends | ||||||||||||||
| Shares repurchased | (1,920,703 | ) | (25,797,967 | ) | (4,424,642 | ) | (59,065,828 | ) | ||||||
| Net Increase (Decrease) | 240,439 | $ | 3,256,149 | 1,744,647 | $ | 23,500,283 | ||||||||
| Class D Shares | ||||||||||||||
| Shares sold | 253,367 | $ | 3,414,409 | 766,729 | $ | 10,266,219 | ||||||||
| Shares issued to shareholders in | 10,926 | 146,994 | 23,004 | 307,781 | ||||||||||
| reinvestment of dividends | ||||||||||||||
| Shares repurchased | (249,902 | ) | (3,360,508 | ) | (424,944 | ) | (5,673,050 | ) | ||||||
| Net Increase (Decrease) | 14,391 | $ | 200,895 | 364,789 | $ | 4,900,950 | ||||||||
NOTE 5 – SECURITIES TRANSACTIONS
For the period ended March 31, 2004, the Fund had purchase and sale transactions (excluding short-term securities) of $9,473,157 and $6,917,920, respectively.
NOTE 6 – INCOME TAXES
At March 31, 2004, information on the tax components of capital is as follows:
| Cost of investments for tax purpose | $ | 224,308,835 | |||
| Gross unrealized appreciation on a tax basis | $ | 10,948,583 | |||
| Gross unrealized depreciation on a tax basis | (61,722 | ) | |||
| Net unrealized appreciation | |||||
| (depreciation) on investments (tax basis) | $ | 10,886,861 | |||
At March 31, 2004, the Fund had tax basis capital losses, which may be carried over to offset future capital gains. Such losses expire as follows:
Capital loss carryovers expiring in:
| 2004 | $ | 554,899 | |||
| 2006 | 7,178 | ||||
| 2007 | 33,677 | ||||
| 2008 | 595,638 | ||||
| 2009 | 320,666 | ||||
| 2011 | 145,437 | ||||
| -- | $ | 1,657,495 | |||
Unutilized tax basis capital losses may be carried forward to offset realized gains in future years. To the extent such carry forwards are used, capital gain distributions may be reduced to the extent provided by regulations.
9
| Financial highlights | ||||||
|---|---|---|---|---|---|---|
| Thornburg New Mexico Intermediate Municipal Fund | ||||||
| Six Months Ended | Year Ended September 30, | |||||
| March 31, 2004 | 2003 | 2002 | 2001 | 2000 | 1999 | |
| Class A Shares: | ||||||
| Per Share Performance | ||||||
| (for a share outstanding throughout the period) | ||||||
| Net asset value, beginning of period | $ 13.46 | $ 13.42 | $ 13.16 | $ 12.85 | $ 12.92 | $ 13.45 |
| Income from investment operations: | ||||||
| Net investment income | 0.23 | 0.48 | 0.53 | 0.59 | 0.62 | 0.61 |
| Net realized and unrealized | ||||||
| gain (loss) on investments | 0.02 | 0.04 | 0.26 | 0.31 | (0.07) | (0.53) |
| Total from investment operations | 0.25 | 0.52 | 0.79 | 0.90 | 0.55 | 0.08 |
| Less dividends from: | ||||||
| Net investment income | (0.23) | (0.48) | (0.53) | (0.59) | (0.62) | (0.61) |
| Change in net asset value | 0.02 | 0.04 | 0.26 | 0.31 | (0.07) | (0.53) |
| Net asset value, end of period | $ 13.48 | $ 13.46 | $ 13.42 | $ 13.16 | $ 12.85 | $ 12.92 |
| Total return (a) | 1.86% | 3.93% | 6.16% | 7.12% | 4.36% | 0.55% |
| Ratios/Supplemental Data | ||||||
| Ratios to average net assets: | ||||||
| Net investment income | 3.39%(b) | 3.55% | 4.01% | 4.49% | 4.81% | 4.57% |
| Expenses, after expense reductions | 0.93%(b) | 0.97% | 0.98% | 1.01% | 0.99% | 0.99% |
| Expenses, after expense reductions | ||||||
| and net of custody credits | 0.93%(b) | 0.97% | 0.98% | -- | -- | -- |
| Expenses, before expense reductions | 0.94%(b) | 0.97% | 1.00% | 1.01% | 1.03% | 1.01% |
| Portfolio turnover rate | 3.06% | 16.53% | 21.35% | 18.77% | 30.23% | 15.93% |
| Net assets at end of period (000) | $ 220,309 | $ 216,766 | $ 192,749 | $ 158,645 | $ 147,279 | $ 155,540 |
(a) Sales loads are not reflected in computing total return, which is not annualized for periods less than one year.
(b) Annualized.
10
| Financial Highlights, Continued | ||||||
|---|---|---|---|---|---|---|
| Thornburg New Mexico Intermediate Municipal Fund | ||||||
| Six Months Ended | Year Ended September 30, | Period Ended | ||||
| March 31, 2004 | 2003 | 2002 | 2001 | 2000 | September 30, 1999(c) | |
| Class D Shares: | ||||||
| Per Share Performance | ||||||
| (for a share outstanding throughout the period) | ||||||
| Net asset value, beginning of period | $ 13.47 | $ 13.43 | $ 13.16 | $ 12.85 | $ 12.93 | $ 13.20 |
| Income from investment operations: | ||||||
| Net investment income | 0.21 | 0.44 | 0.49 | 0.55 | 0.58 | 0.19 |
| Net realized and unrealized | ||||||
| gain (loss) on investments | 0.02 | 0.04 | 0.27 | 0.31 | (0.08) | (0.27) |
| Total from investment operations | 0.23 | 0.48 | 0.76 | 0.86 | 0.50 | (0.08) |
| Less dividends from: | ||||||
| Net investment income | (0.21) | (0.44) | (0.49) | (0.55) | (0.58) | (0.19) |
| Change in net asset value | 0.02 | 0.04 | 0.27 | 0.31 | (0.08) | (0.27) |
| Net asset value, end of period | $ 13.49 | $ 13.47 | $ 13.43 | $ 13.16 | $ 12.85 | $ 12.93 |
| Total return (a) | 1.70% | 3.63% | 5.94% | 6.84% | 4.00% | (0.61)% |
| Ratios/Supplemental Data | ||||||
| Ratios to average net assets: | ||||||
| Net investment income | 3.07%(b) | 3.24% | 3.64% | 4.23% | 4.55% | 4.20%(b) |
| Expenses, after expense reductions | 1.24%(b) | 1.25% | 1.25% | 1.27% | 1.25% | 1.27%(b) |
| Expenses, after expense reductions | ||||||
| and net of custody credits | 1.24%(b) | 1.25% | 1.25% | -- | -- | -- |
| Expenses, before expense reductions | 1.86%(b) | 1.88% | 2.00% | 2.40% | 2.73% | 3.70%(b) |
| Portfolio turnover rate | 3.06% | 16.53% | 21.35% | 18.77% | 30.23% | 15.93% |
| Net assets at end of period (000) | $ 14,873 | $ 14,658 | $ 9,719 | $ 2,831 | $ 2,151 | $ 1,122 |
(a) Not annualized for periods less than one year.
(b) Annualized.
(c) Sale of Class D shares commenced on June 1, 1999
11
| Schedule of investments | |||||||||||
|---|---|---|---|---|---|---|---|---|---|---|---|
| Thornburg New Mexico Intermediate Municipal Fund | March 31,2004 | ||||||||||
| CUSIPS: CLASS A - 885-215-301, CLASS D - 885-215-624 NASDAQ SYMBOLS: CLASS A - THNMX, CLASS D - THNDX | |||||||||||
| Issuer-Description | Credit Rating† Moody’s/S&P | Principal Amount | Value | ||||||||
| Alamogordo Hospital Revenue, 5.30% due 1/1/2013 (Insured: Radian) | NR/AA | 3,000,000 | $ | 3,161,070 | |||||||
| Albuquerque Airport Revenue, 5.00% due 7/1/2007 (Insured: AMBAC) | Aaa/AAA | 1,000,000 | 1,086,340 | ||||||||
| Albuquerque Airport Revenue Adjustment Refunding Subordinated, 1.00% due 7/1/2014 put 4/8/2004 | VMIG1/A-2 | 4,800,000 | 4,800,000 | ||||||||
| (Insured: AMBAC) (weekly demand notes) | |||||||||||
| Albuquerque Collateralized Mortgage Municipal Class B-2, 0% due 5/15/2011 (Insured: FGIC) | Aaa/AAA | 258,000 | 146,916 | ||||||||
| Albuquerque General Purpose Series A, 5.00% due 7/1/2005 | Aa3/AA | 2,835,000 | 2,970,031 | ||||||||
| Albuquerque Gross Receipts Series B, 0% due 7/1/2005 (ETM)* | Aaa/AAA | 840,000 | 827,123 | ||||||||
| Albuquerque Gross Receipts Series B, 0% due 7/1/2012 pre-refunded 7/1/2011 | Aaa/AAA | 820,000 | 613,524 | ||||||||
| Albuquerque Gross Receipts Tax Revenue, 6.20% due 7/1/2005 | A1/AA | 50,000 | 50,616 | ||||||||
| Albuquerque Gross Receipts Unrefunded Balance Series B, 0% due 7/1/2005 (Insured: FSA) | Aaa/AAA | 1,195,000 | 1,176,382 | ||||||||
| Albuquerque Gross Receipts Unrefunded Balance Series B, 0% due 7/1/2012 (Insured: FSA) | Aaa/AAA | 1,180,000 | 867,288 | ||||||||
| Albuquerque Hospital Revenue Series A, 6.375% due 8/1/2007 (Insured: MBIA) | Aaa/AAA | 3,735,000 | 3,792,482 | ||||||||
| Albuquerque Industrial Revenue Refunding, 5.15% due 4/1/2016 (MCT Industries Inc. Project; LOC: | Aa3/NR | 1,170,000 | 1,231,343 | ||||||||
| Bank of the West) | |||||||||||
| Albuquerque Industrial Revenue Refunding, 5.10% due 4/1/2017 (MCT Industries Inc. Project; LOC: | Aa3/NR | 2,140,000 | 2,257,700 | ||||||||
| Bank of the West) | |||||||||||
| Albuquerque Joint Water & Sewage Revenue Series A, 0% due 7/1/2008 (Insured: FGIC) | Aaa/AAA | 1,600,000 | 1,434,240 | ||||||||
| Albuquerque Joint Water & Sewage Systems Refunding Series A, 4.50% due 7/1/2004 | Aa3/AA | 1,685,000 | 1,699,356 | ||||||||
| Albuquerque Joint Water & Sewage Systems Revenue, 6.00% due 7/1/2005 | Aa3/AA | 1,000,000 | 1,059,480 | ||||||||
| Albuquerque Joint Water & Sewage Systems Revenue, 6.00% due 7/1/2006 | Aa3/AA | 1,000,000 | 1,098,230 | ||||||||
| Albuquerque Joint Water & Sewage Systems Revenue Refunding & Improvement Series A, 5.25% due | Aa3/AA | 1,135,000 | 1,299,439 | ||||||||
| 7/1/2011 | |||||||||||
| Albuquerque Municipal School District 12 Refunding, 5.00% due 8/1/2009 | Aa2/AA | 2,240,000 | 2,517,559 | ||||||||
| Albuquerque Municipal School District 12 Refunding, 5.10% due 8/1/2014 | Aa2/AA | 760,000 | 838,120 | ||||||||
| Albuquerque Municipal School District 12 Refunding, 5.00% due 8/1/2015 | Aa2/AA | 1,175,000 | 1,280,045 | ||||||||
| Albuquerque New Mexico Airport Revenue Senior Lien Improvement Series B, 5.00% due 7/1/2012 | Aaa/AAA | 1,670,000 | 1,807,608 | ||||||||
| (Insured: MBIA) | |||||||||||
| Albuquerque New Mexico Joint Water & Sewage Systems Revenue, 4.75% due 7/1/2006 | Aa3/AA | 100,000 | 103,957 | ||||||||
| Albuquerque New Mexico Joint Water & Sewage Systems Revenue, 4.75% due 7/1/2008 | Aa3/AA | 100,000 | 103,957 | ||||||||
| Albuquerque Refuse Removal & Disposal Revenue Refunding Series B, 5.00% due 7/1/2010 (Insured: FSA) | Aaa/AAA | 415,000 | 466,746 | ||||||||
| Albuquerque Refuse Removal & Disposal Revenue Refunding Series B, 5.00% due 7/1/2011 (Insured: FSA) | Aaa/AAA | 1,000,000 | 1,126,620 | ||||||||
| Albuquerque Series B, 5.00% due 7/1/2006 | Aa3/AA | 2,200,000 | 2,369,686 | ||||||||
| Albuquerque Special Assessment District Series A, 6.45% due 1/1/2015 (Cottonwood Mall Project; LOC: | NR/AA- | 175,000 | 176,087 | ||||||||
| Bank of America) | |||||||||||
| Belen Gasoline Tax Revenue Refunding & Improvement, 5.40% due 1/1/2011 | NR/NR | 585,000 | 611,331 | ||||||||
| Bernalillo County General Obligation, 7.00% due 2/1/2006 | Aa1/AA+ | 400,000 | 439,572 | ||||||||
| Bernalillo County General Obligation, 7.00% due 2/1/2007 | Aa1/AA+ | 410,000 | 467,765 | ||||||||
| Bernalillo County Gross Receipts, 5.10% due 10/1/2010 | Aa3/AA | 525,000 | 585,590 | ||||||||
| Bernalillo County Gross Receipts Series B, 5.00% due 4/1/2021 (Insured: MBIA) | Aaa/AAA | 3,000,000 | 3,324,330 | ||||||||
| Bernalillo County Gross Receipts Tax Revenue, 5.50% due 10/1/2011 | Aa3/AA | 495,000 | 562,959 | ||||||||
| Bernalillo County Gross Receipts Tax Revenue, 5.25% due 10/1/2012 | Aa3/AA | 1,000,000 | 1,144,710 | ||||||||
| Bernalillo County Gross Receipts Tax Revenue, 5.75% due 10/1/2015 | Aa3/AA | 2,000,000 | 2,275,320 | ||||||||
| Bernalillo County Multi Family Housing Revenue Series 1988, 4.60% due 11/1/2025 put 11/1/2006 | NR/AA | 2,300,000 | 2,327,968 | ||||||||
| (Sunchase Apartments Project; Insured: AXA Reinsurance Co.) | |||||||||||
| Bernalillo County Multi Family Housing Revenue Series 1994-A, 6.50% due 10/1/2019 put 10/1/2005 | NR/AA | 4,500,000 | 4,612,365 | ||||||||
| (Village Apartments Project; Insured: AXA Reinsurance Co.) | |||||||||||
| Chaves County Gross Receipts Tax Revenue, 5.00% due 7/1/2017 (Insured: FGIC) | Aaa/NR | 1,000,000 | 1,075,320 | ||||||||
| Chaves County Gross Receipts Tax Revenue, 5.05% due 7/1/2019 (Insured: FGIC) | Aaa/NR | 1,030,000 | 1,097,825 | ||||||||
| Cibola County Gross Receipts Tax Revenue, 5.875% due 11/1/2008 (Insured: AMBAC) | Aaa/AAA | 495,000 | 570,458 | ||||||||
| Cibola County Gross Receipts Tax Revenue, 6.00% due 11/1/2010 (Insured: AMBAC) | Aaa/AAA | 555,000 | 657,419 | ||||||||
| Eastern New Mexico University Revenues Refunding & Improvement, 4.95% due 4/1/2006 (Insured: AMBAC) | Aaa/AAA | 500,000 | 501,420 | ||||||||
| Farmington Municipal School District 5 Refunding, 5.00% due 9/1/2011 (Insured: FSA) | Aaa/NR | 1,000,000 | 1,098,890 | ||||||||
| Farmington New Mexico Hospital Revenue Series A, 5.125% due 6/1/2018 (San Juan Regional Med Center | A3/NR | 570,000 | 599,725 | ||||||||
| Project) | |||||||||||
| Farmington New Mexico Hospital Revenue Series A, 5.125% due 6/1/2019 (San Juan Regional Med Center | A3/NR | 645,000 | 673,277 | ||||||||
| Project) | |||||||||||
| Farmington Pollution Control Revenue, 5.875% due 6/1/2023 (Insured: MBIA) | Aaa/AAA | 1,710,000 | 1,749,415 | ||||||||
| Farmington Utility Systems Revenue Refunding Series A, 5.00% due 5/15/2011 (Insured: FSA) | Aaa/AAA | 3,000,000 | 3,380,670 | ||||||||
| Farmington Utility Systems Revenue Refunding Series A, 5.00% due 5/15/2012 (Insured: FSA) | Aaa/AAA | 6,095,000 | 6,769,290 | ||||||||
| Gallup Mc Kinley County, 4.60% due 8/1/2007 (Insured: MBIA) | Aaa/NR | 100,000 | 103,881 | ||||||||
| Gallup Pollution Control Revenue Refunding, 6.65% due 8/15/2017 (Plains Electric Generation | Aaa/AAA | 7,975,000 | 8,089,282 | ||||||||
| Project; Insured: MBIA) | |||||||||||
| Gallup Pollution Control Revenue Refunding Series 1992, 6.45% due 8/15/2006 (Insured: MBIA) | Aaa/AAA | 1,500,000 | 1,520,790 | ||||||||
| Grant County Hospital Facility Revenue, 5.50% due 8/1/2009 (Gila Regional Medical Center Project; | NR/AA | 1,310,000 | 1,471,824 | ||||||||
| Insured: Radian) | |||||||||||
| Grant County Hospital Facility Revenue, 5.50% due 8/1/2010 (Gila Regional Medical Center Project; | NR/AA | 1,385,000 | 1,562,017 | ||||||||
| Insured: Radian) | |||||||||||
| Las Cruces Gross Receipts Tax Revenue Refunding & Improvement, 5.00% due 6/1/2009 (Insured: MBIA) | Aaa/NR | 1,115,000 | 1,249,681 | ||||||||
| Las Cruces Health Facilities Revenue, 6.45% due 12/1/2017 (Evangelical Lutheran Project; Insured: | Aaa/AAA | 1,020,000 | 1,034,239 | ||||||||
| FSA) | |||||||||||
| Las Cruces Joint Utility Refunding & Improvement Revenue, 6.50% due 7/1/2007 (ETM)* | A1/NR | 420,000 | 425,237 | ||||||||
| Las Cruces School District 2, 5.50% due 8/1/2010 | Aa3/NR | 1,000,000 | 1,136,740 | ||||||||
| Las Cruces School District 2 Refunding, 4.00% due 8/1/2007 | Aa3/NR | 2,600,000 | 2,777,840 | ||||||||
| Lordsburg Pollution Control Revenue, 6.50% due 4/1/2013 (Phelps Dodge Project) | Baa3/BBB- | 2,625,000 | 2,670,150 | ||||||||
| Los Alamos County Utility Series A, 5.80% due 7/1/2006 (Insured: FSA) | Aaa/AAA | 1,300,000 | 1,339,923 | ||||||||
| Los Alamos County Utility Series A, 6.00% due 7/1/2008 (Insured: FSA) | Aaa/AAA | 3,445,000 | 3,552,863 | ||||||||
| Milan General Obligation Sanitary Sewer Series 1994, 7.00% due 9/1/2013 | NR/NR | 350,000 | 358,029 | ||||||||
| New Mexico Educational Assistance Foundation Revenue, 6.65% due 3/1/2007 | Aaa/NR | 975,000 | 1,008,316 | ||||||||
| New Mexico Educational Assistance Foundation Series A 3, 4.95% due 3/1/2009 | Aaa/NR | 2,000,000 | 2,148,500 | ||||||||
| New Mexico Educational Assistance Foundation Student Loan Revenue, 5.40% due 8/1/2004 | Aa/NR | 10,000 | 10,000 | ||||||||
| New Mexico Educational Assistance Student Loan Series 2-B, 5.75% due 12/1/2008 | NR/NR | 170,000 | 172,055 | ||||||||
| New Mexico Finance Authority Revenue Court Facilities Fee Bifercated, 5.00% due 6/15/2014 (Insured: | Aaa/AAA | 1,295,000 | 1,420,783 | ||||||||
| MBIA) | |||||||||||
| New Mexico Finance Authority Revenue Court Facilities Fee Revenue Series A, 5.50% due 6/15/2020 | Aaa/AAA | 2,000,000 | 2,213,580 | ||||||||
| (Insured: MBIA) | |||||||||||
| New Mexico Finance Authority Revenue Federal Highway Grant Anticipation Series A, 4.10% due | Aaa/AAA | 425,000 | 442,094 | ||||||||
| 9/1/2005 (Insured: AMBAC) | |||||||||||
| New Mexico Finance Authority Revenue Refunding, 5.00% due 6/1/2014 (Public Project Revolving Fund | Aaa/AAA | 2,660,000 | 2,948,450 | ||||||||
| B; Insured: MBIA) | |||||||||||
| New Mexico Finance Authority Revenue Series A, 4.00% due 4/1/2010 (Cigarette Tax UNM Health | Aaa/AAA | 2,300,000 | 2,450,167 | ||||||||
| Project; Insured: MBIA) | |||||||||||
| New Mexico Finance Authority Revenue Series C, 5.15% due 6/1/2012 (Insured: MBIA) | Aaa/AAA | 915,000 | 1,017,316 | ||||||||
| New Mexico Finance Authority Revenue Series C, 5.25% due 6/1/2013 (Insured: MBIA) | Aaa/AAA | 130,000 | 145,263 | ||||||||
| New Mexico Finance Authority Revenue Series C, 5.35% due 6/1/2014 (Insured: MBIA) | Aaa/AAA | 130,000 | 145,938 | ||||||||
| New Mexico Finance Authority Revenue Series C, 5.45% due 6/1/2015 (Insured: MBIA) | Aaa/AAA | 145,000 | 161,769 | ||||||||
| New Mexico Finance Authority Revenue State Office Building Tax Series A, 5.00% due 6/1/2012 | Aa1/AAA | 1,725,000 | 1,917,476 | ||||||||
| New Mexico Finance Authority Revenue State Office Building Tax Series A, 5.00% due 6/1/2013 | Aa1/AAA | 1,325,000 | 1,465,728 | ||||||||
| New Mexico Finance Authority Revenue State Office Building Tax Series A, 5.00% due 6/1/2014 | Aa1/AAA | 1,875,000 | 2,056,556 | ||||||||
| New Mexico Highway Commission Revenue Senior Subordinated Lien Tax Series A, 5.50% due 6/15/2013 | Aa2/AA+ | 2,000,000 | 2,285,620 | ||||||||
| New Mexico Highway Commission Revenue Senior Subordinated Lien Tax Series A, 5.50% due 6/15/2014 | Aa2/AA+ | 2,000,000 | 2,283,460 | ||||||||
| New Mexico Highway Commission Tax Revenue, 5.125% due 6/15/2010 | Aa2/AA+ | 4,355,000 | 4,798,252 | ||||||||
| New Mexico Highway Commission Tax Revenue Senior Subordinated Lien Series A, 5.00% due 6/15/2010 | Aa2/AA+ | 500,000 | 563,150 | ||||||||
| New Mexico Highway Commission Tax Senior Subordinated Lien, 6.00% due 6/15/2011 | Aa2/AA+ | 5,000,000 | 5,778,700 | ||||||||
| New Mexico Hospital Equipment Loan, 5.20% due 12/1/2010 pre-refunded 12/1/2007 @ 101 (Catholic | Aa2/AA | 1,140,000 | 1,281,508 | ||||||||
| Health Initiatives Project) | |||||||||||
| New Mexico Hospital Equipment Loan Series A, 5.75% due 8/1/2016 (Presbyterian Healthcare Project) | A1/A+ | 5,205,000 | 5,726,957 | ||||||||
| New Mexico Housing Authority Region III Multi Family Housing Revenue Series A, 5.30% due 12/1/2022 | Aaa/AAA | 1,160,000 | 1,227,964 | ||||||||
| (Senior El Paseo Apartments Project; Insured: AMBAC) | |||||||||||
| New Mexico Housing Authority, Multi Family Housing Revenue, 1.02% due 1/15/2033 put 4/8/2004 | NR/A1+ | 450,000 | 450,000 | ||||||||
| (Arbors/Courtyard Apartments Project) (weekly demand notes) | |||||||||||
| New Mexico MFA Forward Mortgage Series C, 6.50% due 7/1/2025 (Collateralized: FNMA/GNMA) | NR/AAA | 500,000 | 515,350 | ||||||||
| New Mexico MFA General, 5.80% due 9/1/2019 | NR/A+ | 775,000 | 826,142 | ||||||||
| New Mexico MFA SFMR, 5.70% due 9/1/2014 (Collateralized: FNMA/GNMA) | NR/AAA | 185,000 | 197,389 | ||||||||
| New Mexico MFA SFMR, 5.75% due 3/1/2017 (Collateralized: FNMA/GNMA) | NR/AAA | 505,000 | 540,784 | ||||||||
| New Mexico MFA SFMR, 0% due 9/1/2019 | NR/AAA | 670,000 | 490,179 | ||||||||
| New Mexico MFA SFMR Series 1992 A1, 6.90% due 7/1/2008 (Collateralized: FNMA/GNMA) | NR/AAA | 280,000 | 287,879 | ||||||||
| New Mexico MFA SFMR Series A3, 6.15% due 9/1/2017 (Collateralized: FNMA/GNMA) | NR/AAA | 205,000 | 216,870 | ||||||||
| New Mexico MFA SFMR Series B2, 5.80% due 1/1/2009 (Collateralized: FNMA/GNMA) | NR/AAA | 55,000 | 55,805 | ||||||||
| New Mexico MFA SFMR Series B2, 5.80% due 7/1/2009 (Collateralized: FNMA/GNMA) | NR/AAA | 40,000 | 40,631 | ||||||||
| New Mexico MFA SFMR Series B3, 5.80% due 9/1/2016 (Collateralized: FNMA/GNMA) | NR/AAA | 440,000 | 476,652 | ||||||||
| New Mexico MFA SFMR Series C2, 6.05% due 9/1/2021 (Collateralized: FNMA/GNMA) | NR/AAA | 790,000 | 844,194 | ||||||||
| New Mexico MFA SFMR Series D2, 5.875% due 9/1/2021 (Collateralized: FNMA/GNMA) | NR/AAA | 1,125,000 | 1,190,160 | ||||||||
| New Mexico MFA SFMR Series H, 5.45% due 1/1/2006 (Collateralized: FNMA/GNMA) | NR/AAA | 170,000 | 179,265 | ||||||||
| New Mexico MFA SFMR Series H, 5.45% due 7/1/2006 (Collateralized: FNMA/GNMA) | NR/AAA | 175,000 | 187,038 | ||||||||
| New Mexico MFA Single Family Series E2, 5.875% due 9/1/2020 | NR/AAA | 560,000 | 612,674 | ||||||||
| New Mexico Mortgage Finance Multi Family Refunding Series B, 5.00% due 7/1/2031 put 7/1/2011 | Aaa/NR | 1,000,000 | 1,075,370 | ||||||||
| (Sombra Del Oso Apartments Project; Collateralized: FNMA) | |||||||||||
| New Mexico Mortgage Finance Multi Family Refunding Series C, 5.00% due 7/1/2031 put 7/1/2011 | Aaa/NR | 1,910,000 | 2,053,957 | ||||||||
| (Riverwalk Apartments Project; Collateralized: FNMA) | |||||||||||
| New Mexico Mortgage Finance Multi Family Refunding Series D, 5.00% due 7/1/2031 put 7/1/2011 | Aaa/NR | 2,785,000 | 2,994,905 | ||||||||
| (Tierra Pointe I Apartments Project; Collateralized: FNMA) | |||||||||||
| New Mexico Mortgage Finance Multi Family Series A, 6.05% due 7/1/2028 (Sandpiper Apartments | NR/AAA | 2,335,000 | 2,549,376 | ||||||||
| Project; Insured: FHA) | |||||||||||
| New Mexico State, 4.00% due 9/1/2005 | Aa1/AA+ | 5,000,000 | 5,196,250 | ||||||||
| New Mexico State Highway Commission Revenue Infrastructure Senior Subordinated Lien C, 5.00% due | Aa2/AA+ | 1,000,000 | 1,123,200 | ||||||||
| 6/15/2012 | |||||||||||
| New Mexico State Highway Commission Tax Revenue Senior Subordinated Lien, 5.75% due 6/15/2009 | Aa2/AA+ | 750,000 | 868,410 | ||||||||
| New Mexico State Hospital Equipment Loan Council Hospital Revenue Series A, 4.80% due 8/1/2010 | A1/A+ | 500,000 | 542,615 | ||||||||
| (Presbyterian Healthcare Project) | |||||||||||
| New Mexico State Refunding Series B, 5.00% due 9/1/2005 | Aa1/AA+ | 1,000,000 | 1,053,250 | ||||||||
| New Mexico State Refunding Series B, 5.00% due 9/1/2006 | Aa1/AA+ | 650,000 | 703,241 | ||||||||
| New Mexico State Severance Tax, 5.00% due 7/1/2005 | Aa2/AA | 2,650,000 | 2,775,530 | ||||||||
| New Mexico State Severance Tax, 5.00% due 7/1/2006 | Aa2/AA | 1,350,000 | 1,408,091 | ||||||||
| New Mexico State Severance Tax, 5.00% due 7/1/2007 | Aa2/AA | 1,475,000 | 1,620,863 | ||||||||
| New Mexico State Severance Tax Refunding Series A, 5.00% due 7/1/2007 | Aa2/AA | 1,645,000 | 1,806,572 | ||||||||
| New Mexico State Severance Tax Refunding Series A, 5.00% due 7/1/2008 | Aa2/AA | 550,000 | 597,850 | ||||||||
| New Mexico State Supplemental Severance Series A, 5.00% due 7/1/2011 | Aa3/A+ | 1,000,000 | 1,084,700 | ||||||||
| New Mexico State University Revenues Refunding & Improvement, 4.00% due 4/1/2006 (Insured: FSA) | Aaa/AAA | 1,260,000 | 1,322,345 | ||||||||
| New Mexico State University Revenues Refunding & Improvement, 5.00% due 4/1/2013 (Insured: FSA) | Aaa/AAA | 1,000,000 | 1,125,470 | ||||||||
| New Mexico Supplemental Severance Series A, 5.00% due 7/1/2008 | Aa3/A+ | 5,000,000 | 5,438,250 | ||||||||
| Otero County Refunding, 4.00% due 8/1/2005 (Insured: MBIA) | Aaa/NR | 570,000 | 590,292 | ||||||||
| Puerto Rico Public Buildings Authority Revenue Guaranteed Government Facilities Series G, 5.00% due | Aaa/AAA | 550,000 | 611,325 | ||||||||
| 7/1/2011 (Insured: XLCA) | |||||||||||
| Puerto Rico Public Buildings Authority Revenue Refunding Government Facilities Series F, 5.25% due | Aaa/AAA | 1,000,000 | 1,139,150 | ||||||||
| 7/1/2019 (Insured: XLCA) | |||||||||||
| Rio Rancho Water & Wastewater System, 6.50% due 5/15/2006 (Insured: FSA) | Aaa/AAA | 1,000,000 | 1,102,820 | ||||||||
| Rio Rancho Water & Wastewater System, 5.25% due 5/15/2007 (Insured: AMBAC) | Aaa/AAA | 1,695,000 | 1,867,924 | ||||||||
| Ruidoso Municipal School District 3, 6.35% due 8/1/2006 (Insured: FSA) | Aaa/AAA | 250,000 | 277,468 | ||||||||
| San Juan County Gasoline Tax/Motor Vehicle Revenue Refunding & Improvement, 5.25% due 5/15/2014 | A1/NR | 400,000 | 444,024 | ||||||||
| San Juan County Gasoline Tax/Motor Vehicle Revenue Refunding & Improvement, 5.25% due 5/15/2022 | A1/NR | 1,725,000 | 1,828,776 | ||||||||
| San Juan County Gross Receipts, 5.30% due 9/15/2009 | A1/NR | 500,000 | 550,420 | ||||||||
| San Juan County Gross Receipts Gas Tax Refunding Revenue Series B, 7.00% due 9/15/2009 pre-refunded | A1/NR | 1,000,000 | 1,036,990 | ||||||||
| 9/15/2004 @ 101 | |||||||||||
| San Juan County Gross Receipts Tax Revenue Senior Series B, 5.50% due 9/15/2016 (Insured: AMBAC) | Aaa/AAA | 1,180,000 | 1,336,138 | ||||||||
| San Juan County Gross Receipts Tax Revenue Subordinated Series A, 5.75% due 9/15/2021 (Insured: | Aaa/AAA | 1,000,000 | 1,134,360 | ||||||||
| AMBAC) | |||||||||||
| San Juan County New Mexico Central Consolidated Independent School District Number 022, 4.60% due | Aaa/AAA | 100,000 | 104,050 | ||||||||
| 8/15/2009 (Insured: FSA) | |||||||||||
| Sandoval County Landfill Revenue, 5.70% due 7/15/2013 | NR/NR | 400,000 | 407,976 | ||||||||
| Sandoval County Landfill Revenue Refunding & Improvement, 5.50% due 8/15/2015 | Baa2/NR | 1,420,000 | 1,495,629 | ||||||||
| Sandoval County Landfill Revenue Refunding & Improvement, 5.75% due 8/15/2018 | Baa2/NR | 1,335,000 | 1,398,653 | ||||||||
| Sandoval County Revenue Refunding Series B, 5.75% due 2/1/2010 (Intel Project) | NR/NR | 840,000 | 885,469 | ||||||||
| Santa Fe County, 5.00% due 7/1/2007 (Insured: MBIA) | Aaa/NR | 640,000 | 684,359 | ||||||||
| Santa Fe County, 5.00% due 7/1/2008 (Insured: MBIA) | Aaa/NR | 785,000 | 839,047 | ||||||||
| Santa Fe County, 7.25% due 7/1/2029 (Rancho Viejo Improvement District Project) | NR/NR | 1,900,000 | 2,014,798 | ||||||||
| Santa Fe County Correctional Systems Revenue, 5.20% due 2/1/2012 (Insured: FSA) | Aaa/AAA | 515,000 | 582,872 | ||||||||
| Santa Fe County Correctional Systems Revenue, 5.00% due 2/1/2018 (Insured: FSA) | Aaa/AAA | 1,000,000 | 1,097,580 | ||||||||
| Santa Fe County Revenue Series 1990, 9.00% due 7/1/2004 (Office & Training Facilities Project) | Aaa/NR | 443,000 | 451,745 | ||||||||
| (ETM)* | |||||||||||
| Santa Fe County Revenue Series 1990, 9.00% due 1/1/2008 (Office & Training Facilities Project) | Aaa/NR | 626,000 | 778,637 | ||||||||
| (ETM)* | |||||||||||
| Santa Fe County Revenue Series A, 5.50% due 5/15/2015 (El Castillo Retirement Project) | NR/NR | 1,250,000 | 1,205,113 | ||||||||
| Santa Fe Educational Facilities Revenue, 5.00% due 3/1/2007 (St. John+s College Project) | NR/BBB | 200,000 | 211,086 | ||||||||
| Santa Fe Educational Facilities Revenue, 5.10% due 3/1/2008 (St. John+s College Project) | NR/BBB | 210,000 | 222,682 | ||||||||
| Santa Fe Educational Facilities Revenue, 5.40% due 3/1/2017 (St. John+s College Project) | NR/BBB | 1,215,000 | 1,224,562 | ||||||||
| Santa Fe Educational Facilities Revenue Improvement, 6.25% due 10/1/2026 (College of Santa Fe | NR/BBB- | 1,000,000 | 1,028,110 | ||||||||
| Project) | |||||||||||
| Santa Fe Refuse Disposal Systems Improvement Net Revenue Series 1996-B, 5.50% due 6/1/2004 | A3/NR | 370,000 | 372,438 | ||||||||
| Santa Fe Revenue Series A, 5.95% due 6/1/2009 pre-refunded 6/1/2004 @100 (Insured: AMBAC) | Aaa/AAA | 600,000 | 604,896 | ||||||||
| Santa Fe SFMR, 5.25% due 11/1/2005 (Collateralized: FNMA/GNMA) | Aaa/NR | 195,000 | 205,304 | ||||||||
| Santa Fe SFMR, 5.60% due 11/1/2010 (Collateralized: FNMA/GNMA) | Aaa/NR | 120,000 | 127,144 | ||||||||
| Santa Fe SFMR, 6.10% due 11/1/2011 (Collateralized: FNMA/GNMA) | Aaa/NR | 175,000 | 183,433 | ||||||||
| Santa Fe SFMR, 6.20% due 11/1/2016 (Collateralized: FNMA/GNMA) | Aaa/NR | 200,000 | 200,578 | ||||||||
| Santa Fe Solid Waste Management Agency Facility Revenue, 5.75% due 6/1/2004 | NR/NR | 745,000 | 749,939 | ||||||||
| Santa Fe Solid Waste Management Agency Facility Revenue, 5.90% due 6/1/2005 | NR/NR | 760,000 | 795,705 | ||||||||
| Santa Fe Solid Waste Management Agency Facility Revenue, 6.00% due 6/1/2006 | NR/NR | 775,000 | 836,713 | ||||||||
| Santa Fe Solid Waste Management Agency Facility Revenue, 6.10% due 6/1/2007 | NR/NR | 875,000 | 967,645 | ||||||||
| Santa Fe Utility Revenue Refunding Series A, 5.35% due 6/1/2011 (Insured: AMBAC) | Aaa/AAA | 500,000 | 541,535 | ||||||||
| Santa Rosa Consolidated School District 8 Guadalupe & San Miguel Counties GO Series 1991, 7.00% due | Baa3/NR | 210,000 | 210,901 | ||||||||
| 8/1/2004 | |||||||||||
| Socorro Health Facility Refunding Revenue, 6.00% due 5/1/2008 (Evangelical Lutheran Good Samaritan | Aaa/AAA | 190,000 | 194,467 | ||||||||
| Project; Insured: AMBAC) | |||||||||||
| Taos County Gross Receipts Tax Revenue Refunding & Improvement, 4.00% due 10/1/2006 (County | Aaa/NR | 1,000,000 | 1,059,600 | ||||||||
| Education Project; Insured: MBIA) | |||||||||||
| Taos Municipal School District 1 Refunding, 5.00% due 9/1/2008 (Insured: FSA) | Aaa/NR | 450,000 | 503,271 | ||||||||
| University of New Mexico Revenue Refunding & Improvement Subordinated Lien Systems Series A, 5.25% | Aa3/AA | 1,730,000 | 1,912,186 | ||||||||
| due 6/1/2017 | |||||||||||
| University of New Mexico Revenue Refunding & Improvement Subordinated Lien Systems Series A, 5.25% | Aa3/AA | 1,000,000 | 1,075,480 | ||||||||
| due 6/1/2021 | |||||||||||
| University of New Mexico Revenue Refunding Subordinated Lien, 5.25% due 6/1/2016 | Aa3/AA | 645,000 | 716,769 | ||||||||
| University of New Mexico Revenue Refunding Subordinated Lien A, 5.25% due 6/1/2018 | Aa3/AA | 1,825,000 | 2,003,321 | ||||||||
| University of New Mexico Revenue Series A, 6.00% due 6/1/2021 | Aa3/AA | 600,000 | 722,880 | ||||||||
| University of New Mexico Revenues Refunding Subordinated Lien Systems Series A, 5.25% due 6/1/2015 | Aa3/AA | 1,195,000 | 1,335,855 | ||||||||
| University of New Mexico Revenues Refunding Subordinated Lien Systems Series A, 5.25% due 6/1/2018 | Aa3/AA | 1,200,000 | 1,320,876 | ||||||||
| University of New Mexico University Revenues Series A, 5.25% due 6/1/2013 | Aa3/AA | 665,000 | 747,666 | ||||||||
| University of New Mexico University Revenues Series A, 5.25% due 6/1/2014 | Aa3/AA | 335,000 | 375,331 | ||||||||
| Villa Hermosa Multi Family Housing Revenue, 5.85% due 11/20/2016 (Collateralized: GNMA) | NR/AAA | 1,105,000 | 1,174,759 | ||||||||
| Western New Mexico University System Revenue Series 1995, 7.75% due 6/15/2019 pre-refunded 6/15/2004 | Baa1/NR | 1,385,000 | 1,404,030 | ||||||||
| TOTAL INVESTMENTS (Cost $224,307,322) | -- | -- | $ | 235,195,696 | |||||||
| †Credit ratings are unaudited. | |||||||||||
| *Escrowed to maturity | |||||||||||
| See notes to financial statements. | |||||||||||
16
Index Comparisons
Thornburg New Mexico Intermediate Municipal Fund
March 31, 2004
Compares performance of the Thornburg New Mexico Intermediate Municipal Fund, the 7-12 Year Merrill Lynch Municipal Bond Index and the Consumer Price Index, June 30, 1991 to March 31, 2004. On March 31, 2004, the weighted average securities ratings of the Index and the Fund were AA and AA, respectively, and the weighted average portfolio maturities of the Index and the Fund were 9.5 years and 7.5 years, respectively. Past performance of the Index and the Fund may not be indicative of future performance. The performance data and graph do not reflect the deduction of taxes that a shareholder would pay on distributions or the redemption of fund shares.
Thornburg New Mexico Intermediate Municipal Fund Class A Total Returns, Since June 30, 1991, versus Merrill Lynch 7-12 Year Municipal Index and Consumer Price Index (CPI)
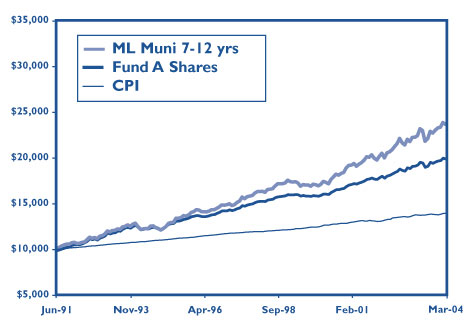
Class A Shares Average
Annual Total Returns
(periods ending 3/31/04, at max. offering price)
| One year: | 2 | .04% | |
| Three years: | 4 | .24% | |
| Five years: | 4 | .09% | |
| Ten years: | 4 | .86% | |
| Since inception (6/18/91): | 5 | .52% | |
Thornburg New Mexico Intermediate Municipal Fund Class D Total Returns, Since Inception, versus Merrill Lynch 7-12 Year Municipal Index and Consumer Price Index (CPI)
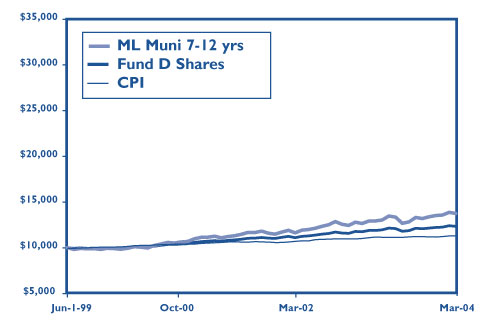
Class D Shares Average
Annual Total Returns(periods
ending 3/31/04)
| One year: | 3 | .86% | |
| Three years: | 4 | .66% | |
| Since inception (6/1/99): | 4 | .43% | |
Maximum sales charge of the Fund’s Class A Shares is 2.00%. There is no up front sales charge for Class D Shares and no contingent deferred sales charge. Past performance is no guarantee of future results. Current returns may be either lower or higher than those shown. Share prices and returns will fluctuate and investors may experience a loss upon redemption. There is no guarantee that the fund will meet its objectives. Shares in the Fund carry risks, including possible loss of principal. Carefully consider the Fund’s investment objectives, risks, sales charges, and expenses; this is found in the prospectus, which is available from your financial advisor or from www.thornburg.com. Read it carefully before you invest or send money. For month-end performance information, visit www.thornburg.com.
The Merrill Lynch 7-12 Year Municipal Bond Index represents a broad measure of market performance. It is a model portfolio of municipal obligations throughout the U.S., with an average maturity which ranges from seven to twelve years. The Consumer Price Index (“CPI”) measures prices of a fixed basket of goods bought by a typical consumer, including food, transportation, shelter, utilities, clothing, medical care, entertainment and other items. The CPI, published by the Bureau of Labor Statistics in the Department of Labor, is based at 100 in 1982 and is released monthly. It is widely used as a cost-of-living benchmark to adjust Social Security payments and other payment schedules, union contracts and tax brackets. Also known as the cost-of-living index. Unless otherwise noted, index returns reflect the reinvestment of income dividends and capital gains, if any, but do not reflect fees, brokerage commissions or other expenses of investing. Investors may not make direct investments into any index.
17
March 31, 2004
Thornburg New Mexico Intermediate Municipal Fund
A shares
Outperformed Tax-Free Money Market Funds
(Unaudited)
Investors sometimes ask us to compare Thornburg New Mexico Intermediate Municipal Fund to money market fund returns. These investments have certain differences, and investors in Thornburg New Mexico Intermediate Municipal Fund took more risk than money market fund investors to earn their higher returns.

The chart above is for the Fund���s Class A Shares only. See the inside front cover page for the 30-day SEC yield and the total returns at the maximum offering prices for one year, three years, five years and since inception for each class of shares of the Fund.
Note 1: Future increases, if any, of any of these investments may bear no relationship to prior increases. Quotations for the money fund averages are based upon 30-day yield quotations for tax-exempt money funds as sourced from the “Lipper Tax-free Money Market Average” for the months covered by this analysis. The increase for the Class A Shares of New Mexico Intermediate Municipal Fund is based upon the dividends paid for the months covered by this analysis, the beginning offering price at $13.08 per share and the ending NAV at $13.48 per share. These investments returned the $10,000 initial investment in addition to the amounts shown above.
Note 2: This analysis does not take into account the effect, if any, caused by state and local income taxes. The portion of the increase, if any, of Thornburg New Mexico Intermediate Municipal Fund representing appreciation of the share price is assumed to be taxed at a 15% Federal tax rate. The average money market fund increases shown above may differ from the return of a particular money market fund. It is not possible to invest in this money fund average.
Note 3: Generally, money market funds seek to maintain an investment portfolio with an average maturity of 90 days or less. Thornburg New Mexico Intermediate Municipal Fund invests in short-to-intermediate maturity municipal obligations. The net asset value of the money funds did not fluctuate. The net asset value of the Class A Shares of THNMX did vary from time to time, and will continue to vary in the future due to the effect of changes in interest rates on the value of the investments the Fund holds. The analysis assumes that the investor received the net asset value of the shares owned, plus accrued income, at time of sale. Redemptions are made at the then current net asset value, which may give you a gain or loss when you sell your shares.
Note 4: This analysis assumes that the dividends from each of these investment vehicles were reinvested and compounded monthly. Most money funds declare dividends daily and pay them monthly. Thornburg New Mexico Intermediate Municipal Fund also declares dividends daily and pays them monthly.
18
Investment Manager Thornburg Investment Management, Inc.
119 East Marcy Street
Santa Fe, New Mexico 87501
800.847.0200
Principal Underwriter Thornburg Securities Corporation
119 East Marcy Street
Santa Fe, New Mexico 87501
800.847.0200
This report is submitted for the general information of shareholders of the Fund. It is not authorized for distribution to prospective investors in the Fund unless preceded or accompanied by an effective prospectus. Carefully consider information in the prospectus regarding the Fund’s investment objectives and policies, risks, sales charges, expenses, experience of its management, marketability of shares, and other information. Performance data quoted represent past performance and do not guarantee future results.
www.thornburg.com
Thornburg Intermediate Municipal Fund
Semi-Annual Report
March 31, 2004
Thornburg Intermediate Municipal Fund
ALL DATA AS OF 3/31/04
| FUND FACTS: Thornburg Intermediate Municipal Fund | ||
| -- | A Shares | C Shares |
| Annualized Distribution Rate (at NAV) | 3.76% | 3.46% |
| SEC Yield | 2.57% | 2.32% |
| NAV | $ 13.60 | $ 13.62 |
| Maximum Offering Price | $ 13.88 | $ 13.62 |
| TOTAL RETURNS: Annual Average - (After Subtracting Maximum Sales Charge) | ||
| One Year | 2.24% | 3.51% |
| Three Years | 4.74% | 5.07% |
| Five Years | 4.07% | 4.09% |
| Ten Years | 5.18% | N/A |
| Since Inception | 5.88% | 4.91% |
| Inception Date | 7/22/1991 | 9/1/1994 |
| Maximum sales charge of the Fund’s Class A Shares is 2.00%. C shares include a 0.60% CDSC for the first year only. Past performance is no guarantee of future results. Current returns may be either lower or higher than those shown. Share prices and returns will fluctuate and investors may experience a loss upon redemption. There is no guarantee that the Fund will meet its objectives. Shares in the Fund carry risks, including possible loss of principal. |
| Carefully consider the Fund’s investment objectives, risks, sales charges, and expenses; this information is found in the prospectus, which is available from your financial advisor or from www.thornburg.com. Read it carefully before you invest or send money. For month-end performance information, visit www.thornburg.com. |
| The SEC Yield is computed in accordance with SEC standards measuring the net investment income per share over a specified 30-day period, expressed as a percentage of the maximum offering price of the Fund’s shares at the end of the period. |
| The distribution rate is calculated by taking the sum of the month’s total distribution factors and dividing this sum by a 30-day period and annualizing to a 360-day year. The value is then divided by the ending NAV to arrive at the annualized distribution yield. The yield is calculated on a periodic basis and is subject to change depending on the Fund’s NAV and current distributions. |
1
Thornburg Intermediate Municipal Fund
Letter to shareholders
Dear Fellow Shareholder:
I am pleased to present the semi-annual report for your Thornburg Intermediate Municipal Fund. The net asset value of the A shares increased by 4 cents to $13.60 during the six month period ending March 31, 2004. If you were with us for the entire period, you received dividends of 25.9 cents per share. If you reinvested dividends, you received 26.1 cents per share. Investors who owned C shares received dividends of 24.0 and 24.2 cents per share respectively.
Interest rates on intermediate municipal bonds fell slightly over the six-month period ending March 31, 2004. For example, the interest rate on a ten-year AAA rated municipal bond dropped from 3.67% to 3.49% from the end of September to the end of March. Lower interest rates helped the Fund’s net asset value appreciate somewhat to produce a total return of 2.22% over the six-month period. The Merrill Lynch 7-12 Year Municipal Bond Index had a total return of 3.33%, and the average intermediate municipal bond fund tracked by Lipper returned 2.08% over the same time period. The Index has a significantly longer duration than the Fund (7.3 versus 4.5), causing it to perform better than the Fund in falling interest rate environments such as the 6 months ending March 31, 2004.
Municipal bond yields reached a low point on March 9th and have been trending upwards since then. For example, the yield on a high quality 7-year municipal bond is up 0.58% to 3.25% as of April 13, 2004. Yields are up because economic growth has finally led to employment growth. That point was made abundantly clear with the announcement of 308,000 new jobs on April 2nd. Whether interest rates will keep climbing depends largely upon what happens to inflation.
We believe that consumer price inflation has probably bottomed around the 1.2% level. Many commodity prices have doubled over the last year. Price pressures abound in metals, petroleum products, chemicals, paper, and even in soybeans! Transportation costs are going up rapidly. Unit labor costs have been subdued because of productivity gains, but past productivity gains may prove very hard to replicate. All these factors should lead to somewhat higher inflation over the next few years.
Higher inflation, coupled with rising bond issuance will likely give rise to higher interest rates on bonds. For now, a 1% Fed Funds target seems to be keeping a cap on how high bond yields can go, but the Federal Reserve will probably have to start moving to a less accommodative policy before the end of this year. If that happens, we would expect bond yields to rise above current trading ranges.
We have prepared for this environment by keeping the duration of your portfolio to the short end of its typical range. We have also generally favored bonds that we believe will be less price sensitive to interest rate changes. We have not deviated from our long-held strategy of laddering short and intermediate bonds because we believe that laddering is the most effective way to deal with changing interest rates in an uncertain world.
Your Thornburg Intermediate Municipal Fund is a laddered portfolio of over 330 municipal obligations from 45 states. Today, your Fund’s weighted average maturity is 8.3 years. We always keep it below 10 years. We ladder the maturity dates of the bonds in your portfolio so that some of the bonds are scheduled to mature during each of the coming years. Laddering intermediate bonds accomplishes two goals. First, the diverse bond maturities contained in a ladder defuse interest-rate risk and dampen the fund’s price volatility. Second, laddering gives your Fund a steady cash flow stream from maturing bonds to reinvest toward the top of the ladder where yields are
2
Letter to shareholders, Continued
Thornburg Intermediate Municipal Fund
April 16, 2004
typically higher. The chart at right describes the percentages of your Fund’s bond portfolio maturing in each of the coming years.
| % of portfolio | Cumulative % |
| maturing within | maturing by end of |
| 2 years = 12% | year 2 = 12% |
| 2 to 4 years = 8% | year 6 = 32% |
| 6 to 8 years = 13% | year 8 = 45% |
| 8 to 10 years = 14% | year 10 = 59% |
| 10 to 12 years = 15% | year 12 = 74% |
| 12 to 14 years = 12% | year 14 = 86% |
| 14 to 16 years = 5% | year 16 = 91% |
| 16 to 18 years = 6% | year 18 = 97% |
| Over 18 years = 3% | Over 18 years = 100% |
Percentages can and do vary. Data as of 3/31/04
Local issuers dependent upon property taxes have benefited from a strong real estate market. They make up a large percentage of your Fund, and have generally been stable to improving credits. State credit quality has begun to stabilize after two very difficult years. We have kept your Fund’s exposure to the states relatively low, but are beginning to see signs of improvement in certain states that have controlled spending and are now experiencing a revenue rebound. Your Fund has also found attractive opportunities in selected utility, health care, and housing bonds. Currently, 89% of the portfolio is rated A or above and 53% is rated AAA by Moody’s or Standard and Poor’s.
Over the years, our practice of laddering a diversified portfolio of short and intermediate maturity municipal bonds has allowed your Fund to perform consistently well in varying interest rate environments. Thank you for investing in Thornburg Intermediate Municipal Fund.
Sincerely,
George Strickland
Portfolio Manager
The Merrill Lynch 7-12 Year Municipal Bond Index represents a broad measure of market performance. It is a model portfolio of municipal obligations throughout the U.S., with an average maturity which ranges from seven to twelve years.
Unless otherwise noted, index returns reflect the reinvestment of income dividends and capital gains, if any, but do not reflect fees, brokerage commissions or other expenses of investing. Investors may not make direct investments into any index.
3
| Statement of assets and liabilities | |||||
|---|---|---|---|---|---|
| Thornburg Intermediate Municipal Fund | March 31, 2004 | ||||
| (Unaudited) | |||||
| ASSETS | |||||
| Investments at value (cost $428,467,089) | $ | 459,421,367 | |||
| Cash | 103,942 | ||||
| Receivable for investments sold | 728,095 | ||||
| Receivable for fund shares sold | 832,946 | ||||
| Interest receivable | 6,265,661 | ||||
| Prepaid expenses and other assets | 47,972 | ||||
| Total Assets | 467,399,983 | ||||
| LIABILITIES | |||||
| Payable for fund shares redeemed | 1,369,768 | ||||
| Accounts payable and accrued expenses | 184,856 | ||||
| Payable to investment advisor (Note 3) | 226,259 | ||||
| Dividends payable | 1,411,577 | ||||
| Total Liabilities | 3,192,460 | ||||
| NET ASSETS | $ | 464,207,523 | |||
| NET ASSETS CONSIST OF: | |||||
| Net unrealized appreciation (depreciation) on investments | $ | 30,954,278 | |||
| Accumulated net realized gain (loss) | (13,087,263 | ) | |||
| Net capital paid in on shares of beneficial interest | 446,340,508 | ||||
| $ | 464,207,523 | ||||
| NET ASSET VALUE: | |||||
| Class A Shares: | |||||
| Net asset value and redemption price per share | |||||
| ($380,305,167 applicable to 27,962,562 shares of beneficial | |||||
| interest outstanding - Note 4) | $ | 13.60 | |||
| Maximum sales charge, 2.00% of offering price | 0.28 | ||||
| Maximum Offering Price Per Share | $ | 13.88 | |||
| Class C Shares: | |||||
| Net asset value and offering price per share * | |||||
| ($62,890,320 applicable to 4,618,379 shares of beneficial | |||||
| interest outstanding - Note 4) | $ | 13.62 | |||
| Class I Shares: | |||||
| Net asset value, offering and redemption price per share | |||||
| ($21,012,036 applicable to 1,547,207 shares of beneficial | |||||
| interest outstanding - Note 4) | $ | 13.58 | |||
| *Redemption price per share is equal to net asset value less any applicable contingent deferred sales charge | |||||
| See notes to financial statements | |||||
4
| Statement of operations | |||||
|---|---|---|---|---|---|
| Thornburg Intermediate Municipal Fund | Six Months Ended March 31, 2004 | ||||
| (Unaudited) | |||||
| INVESTMENT INCOME: | |||||
| Interest income (net of premium amortized of $1,080,999) | $ | 11,062,846 | |||
| EXPENSES: | |||||
| Investment advisory fees (Note 3) | 1,152,594 | ||||
| Administration fees (Note 3) | |||||
| Class A Shares | 239,249 | ||||
| Class C Shares | 37,948 | ||||
| Class I Shares | 4,942 | ||||
| Distribution and service fees (Note 3) | |||||
| Class A Shares | 409,649 | ||||
| Class C Shares | 313,288 | ||||
| Transfer agent fees | |||||
| Class A Shares | 79,010 | ||||
| Class C Shares | 18,305 | ||||
| Class I Shares | 8,844 | ||||
| Registration and filing fees | |||||
| Class A Shares | 6,833 | ||||
| Class C Shares | 4,776 | ||||
| Class I Shares | 5,404 | ||||
| Custodian fees (Note 3) | 104,882 | ||||
| Professional fees | 25,175 | ||||
| Accounting fees | 19,965 | ||||
| Trustee fees | 5,480 | ||||
| Other expenses | 40,841 | ||||
| Total Expenses | 2,477,185 | ||||
| Less: | |||||
| Expenses reimbursed by investment advisor (Note 3) | (59,383 | ) | |||
| Distribution and service fees waived (Note 3) | (125,315 | ) | |||
| Fees paid indirectly (Note 3) | (1,007 | ) | |||
| Net Expenses | 2,291,480 | ||||
| Net Investment Income | 8,771,366 | ||||
| REALIZED AND UNREALIZED GAIN (LOSS) | |||||
| Net realized gain (loss) on investments | (1,115,492 | ) | |||
| Increase (Decrease) in unrealized appreciation of investments | 2,330,507 | ||||
| Net Realized and Unrealized | |||||
| Gain (Loss) on Investments | 1,215,015 | ||||
| Net Increase (Decrease) in Net Assets Resulting | |||||
| From Operations | $ | 9,986,381 | |||
| See notes to financial statements | |||||
5
| Statements of changes in net assets | ||||||||
|---|---|---|---|---|---|---|---|---|
| Thornburg Intermediate Municipal Fund | ||||||||
| Six Months Ended March 31, 2004 | Year Ended September 30, 2003 | |||||||
| INCREASE (DECREASE) IN NET ASSETS FROM: | ||||||||
| OPERATIONS: | ||||||||
| Net investment income | $ | 8,771,366 | $ | 18,090,689 | ||||
| Net realized gain (loss) on investments sold | (1,115,492 | ) | (4,597,883 | ) | ||||
| Increase (Decrease) in unrealized appreciation of investments | 2,330,507 | 581,701 | ||||||
| Net Increase (Decrease) in Net Assets | ||||||||
| Resulting from Operations | 9,986,381 | 14,074,507 | ||||||
| DIVIDENDS TO SHAREHOLDERS: | ||||||||
| From net investment income | ||||||||
| Class A Shares | (7,294,669 | ) | (15,480,099 | ) | ||||
| Class C Shares | (1,071,274 | ) | (1,849,255 | ) | ||||
| Class I Shares | (405,423 | ) | (761,335 | ) | ||||
| FUND SHARE TRANSACTIONS (Note 4): | ||||||||
| Class A Shares | (10,786,581 | ) | (20,552,567 | ) | ||||
| Class C Shares | 2,037,279 | 13,877,646 | ||||||
| Class I Shares | 1,622,874 | 1,174,895 | ||||||
| Net Increase (Decrease) in Net Assets | (5,911,413 | ) | (9,516,208 | ) | ||||
| NET ASSETS: | ||||||||
| Beginning period | 470,118,936 | 479,635,144 | ||||||
| End of period | $ | 464,207,523 | $ | 470,118,936 | ||||
| See notes to financial statements | ||||||||
6
Notes to financial statements
Thornburg Intermediate Municipal Fund
NOTE 1 – ORGANIZATION Thornburg Intermediate Municipal Fund (the “Fund”) is a diversified series of Thornburg Investment Trust (the “Trust”). The Trust is organized as a Massachusetts business trust under a Declaration of Trust dated June 3, 1987 and is registered as a diversified, open-end management investment company under the Investment Company Act of 1940, as amended. The Trust is currently issuing nine series of shares of beneficial interest in addition to those of the Fund: Thornburg Florida Intermediate Municipal Fund, Thornburg New York Intermediate Fund, Thornburg New Mexico Intermediate Municipal Fund, Thornburg Limited Term U.S. Government Fund, Thornburg Limited Term Income Fund, Thornburg Value Fund, Thornburg International Value Fund, Thornburg Core Growth Fund, and Thornburg Investment Income Builder Fund. Each series is considered to be a separate entity for financial reporting and tax purposes and bears expenses directly attributable to it. The Fund’s investment objective is to obtain as high a level of current income exempt from Federal income taxes as is consistent with the preservation of capital.
The Fund currently offers three classes of shares of beneficial interest, Class A, Class C and Institutional Class (Class I) shares. Each class of shares of the Fund represents an interest in the same portfolio of investments of the Fund, except that (i) Class A shares are sold subject to a front-end sales charge collected at the time the shares are purchased and bear a service fee, (ii) Class C shares are sold at net asset value without a sales charge at the time of purchase, but are subject to a contingent deferred sales charge upon redemption within one year, and bear a service fee and a distribution fee, (iii) Class I shares are sold at net asset value without a sales charge at the time of purchase, and (iv) the respective classes have different reinvestment privileges. Additionally, the Fund may allocate among its classes certain expenses, to the extent allowable to specific classes, including transfer agent fees, government registration fees, certain printing and postage costs, and administrative and legal expenses. Currently, class specific expenses of the Fund are limited to service and distribution fees, administration fees, and certain registration and transfer agent expenses.
NOTE 2 – SIGNIFICANT ACCOUNTING POLICIES Significant accounting policies of the Fund are as follows:
Valuation of Investments: In determining net asset value, the Fund utilizes an independent pricing service approved by the Trustees. Debt investment securities have a primary market over the counter and are valued on the basis of valuations furnished by the pricing service. The pricing service values portfolio securities at quoted bid prices, normally at 4:00 pm EST or the yield equivalents when quotations are not readily available. Securities for which quotations are not readily available are valued at fair value as determined by the pricing service using methods which include consideration of yields or prices of municipal obligations of comparable quality, type of issue, coupon, maturity, and rating; indications as to value from dealers and general market conditions. The valuation procedures used by the pricing service and the portfolio valuations received by the Fund are reviewed by the officers of the Trust under the general supervision of the Trustees. Short-term obligations having remaining maturities of 60 days or less are valued at amortized cost, which approximates market value.
Federal Income Taxes: It is the policy of the Fund to comply with the provisions of the Internal Revenue Code applicable to “regulated investment companies” and to distribute all of its taxable (if any) and tax exempt income to its shareholders. Therefore, no provision for Federal income tax is required.
When-Issued and Delayed Delivery Transactions: The Fund may engage in when-issued or delayed delivery transactions. To the extent the Fund engages in such transactions, it will do so for the purpose of acquiring portfolio securities consistent with its investment objectives and not for the purpose of investment leverage or to speculate on interest rate changes. At the time the Fund makes a commitment to purchase a security on a when-issued basis, it will record the transaction and reflect the value in determining its net asset value. When effecting such transactions, assets of the Fund of an amount sufficient to make payment for the portfolio securities to be purchased will be segregated on the Fund’s records at the trade date. Securities purchased on a when-issued or delayed delivery basis do not earn interest until the settlement date.
Dividends: Net investment income of the Fund is declared daily as a dividend on shares for which the Fund has received payment. Dividends are paid monthly and are reinvested in additional shares of the Fund at net asset value per share at the close of business on the dividend payment date, or at the shareholder’s option, paid in cash. Net capital gains, to the extent available, will be distributed at least annually.
General: Securities transactions are accounted for on a trade date basis. Interest income is accrued as earned. Premiums and discounts on securities purchased are amortized to call
7
Notes to financial statements, continued
Thornburg Intermediate Municipal Fund
March 31, 2004
dates or maturity dates of the respective securities. Realized gains and losses from the sale of securities are recorded on an identified cost basis. Net investment income, other than class specific expenses, and realized and unrealized gains and losses, are allocated daily to each class of shares based upon the relative net asset value of outstanding shares (or the value of the dividend-eligible shares, as appropriate) of each class of shares at the beginning of the day (after adjusting for the current share activity of the respective class). Expenses common to all funds are allocated among the funds comprising the Trust based upon their relative net asset values or other appropriate allocation methods.
Guarantees and Indemnifications: Under the Trust’s organizational documents, its officers and trustees are indemnified against certain liability arising out of the performance of their duties to the Fund. Additionally, in the normal course of business the Trust enters into contracts with service providers that contain general indemnification clauses. The Trust’s maximum exposure under these arrangements is unknown. However, based on experience, the Trust expects the risk of loss to be remote.
Use of Estimates: The preparation of financial statements, in conformity with generally accepted accounting principles, requires management to make estimates and assumptions that affect the reported amounts of assets and liabilities and the disclosure of contingent assets and liabilities at the date of the financial statements and the reported amounts of increases and decreases in net assets from operations during the reporting period. Actual results could differ from those estimates.
NOTE 3 — INVESTMENT ADVISORY FEE AND OTHER TRANSACTIONS WITH AFFILIATES
Pursuant to an investment advisory agreement, Thornburg Investment Management, Inc. (the “Advisor”) serves as the investment advisor and performs services for which the fees are payable at the end of each month. For the period ended March 31, 2004, these fees were payable at annual rates ranging from .50 of 1% to .275 of 1% of the average daily net assets of the Fund. The Fund also has an administrative services agreement with the Advisor, whereby the Advisor will perform certain administrative services for the shareholders of each class of the Fund’s shares, and for which fees will be payable at an annual rate of up to .125 of 1% of the average daily net assets attributable to each class of shares. For the period ended March 31, 2004, the Advisor voluntarily reimbursed certain class specific expenses and administrative fees of $48,634 for Class C shares, and $10,749 for Class I shares.
The Fund has an underwriting agreement with Thornburg Securities Corporation (the “Distributor”), which acts as the Distributor of the Fund shares. For the period ended March 31, 2004, the Distributor has advised the Fund that it earned net commissions aggregating $1,856 from the sale of Class A shares and collected contingent deferred sales charges aggregating $3,935 from redemptions of Class C shares of the Fund.
Pursuant to a service plan, under Rule 12b-1 of the Investment Company Act of 1940, the Fund may reimburse to the Advisor an amount not to exceed .25 of 1% per annum of the average daily net assets attributable to each class of shares of the Fund for payments made by the Advisor to securities dealers and other financial institutions to obtain various shareholder related services. The Advisor may pay out of its own resources additional expenses for distribution of the Fund’s shares.
The Fund has also adopted a distribution plan pursuant to Rule 12b-1, applicable only to the Fund’s Class C shares under which the Fund compensates the Distributor for services in promoting the sale of Class C shares of the Fund at an annual rate of up to .75% of the average daily net assets attributable to Class C shares. Total fees incurred by each class of shares of the Fund under their respective Service and Distribution Plans for the period ended March 31, 2004, are set forth in the statement of operations. Distribution fees in the amount of $125,315 were waived for Class C shares.
The Fund has an agreement with the custodian bank to indirectly pay a portion of the custodian’s fees through credits earned by the Fund’s cash on deposit with the bank. This deposit agreement is an alternative to overnight investments. Custodial fees have been adjusted to reflect amounts that would have been paid without this agreement, with a corresponding adjustment reflected as fees paid indirectly in the statement of operations. For the period ended March 31, 2004 fees paid indirectly were $1,007.
Certain officers and trustees of the Trust are also officers and/or directors of the Advisor and Distributor. The compensation of unaffiliated trustees is borne by the Trust.
8
Notes to financial statements, Continued
Thornburg Intermediate Municipal Fund
March 31, 2004
NOTE 4 — SHARES OF BENEFICIAL INTEREST
At March 31, 2004, there were an unlimited number of shares of beneficial interest authorized. Transactions in shares of beneficial interest were as follows:
| Period Ended March 31, 2004 | Year Ended September 30, 2003 | |||||||||||||
|---|---|---|---|---|---|---|---|---|---|---|---|---|---|---|
| Shares | Amount | Shares | Amount | |||||||||||
| Class A Shares | ||||||||||||||
| Shares sold | 2,460,994 | $ | 33,366,406 | 6,705,141 | $ | 90,330,472 | ||||||||
| Shares issued to shareholders in | ||||||||||||||
| reinvestment of dividends | 263,211 | 3,566,220 | 649,800 | 8,760,445 | ||||||||||
| Shares repurchased | (3,520,201 | ) | (47,719,207 | ) | (8,890,248 | ) | (119,643,484 | ) | ||||||
| Net Increase (Decrease) | (795,996 | ) | $ | (10,786,581 | ) | (1,535,307 | ) | $ | (20,552,567 | ) | ||||
| Class C Shares | ||||||||||||||
| Shares sold | 513,092 | $ | 6,989,703 | 1,632,604 | $ | 22,060,706 | ||||||||
| Shares issued to shareholders in | ||||||||||||||
| reinvestment of dividends | 46,841 | 635,492 | 102,429 | 1,382,647 | ||||||||||
| Shares repurchased | (411,637 | ) | (5,587,916 | ) | (709,799 | ) | (9,565,707 | ) | ||||||
| Net Increase (Decrease) | 148,296 | $ | 2,037,279 | 1,025,234 | $ | 13,877,646 | ||||||||
| Class I Shares | ||||||||||||||
| Shares sold | 404,619 | $ | 5,474,854 | 807,931 | $ | 10,899,236 | ||||||||
| Shares issued to shareholders in | ||||||||||||||
| reinvestment of dividends | 18,133 | 245,413 | 39,457 | 531,139 | ||||||||||
| Shares repurchased | (302,977 | ) | (4,097,393 | ) | (762,688 | ) | (10,255,480 | ) | ||||||
| Net Increase (Decrease) | 119,775 | $ | 1,622,874 | 84,700 | $ | 1,174,895 | ||||||||
NOTE 5 – SECURITIES TRANSACTIONS
For the period ended March 31, 2004, the Fund had purchase and sale transactions (excluding short-term securities) of $30,219,309 and $31,994,650, respectively.
NOTE 6 – INCOME TAXES
At March 31, 2004, information on the tax components of capital is as follows:
| Cost of investments for tax purpose | $ | 428,467,089 | |||
| Gross unrealized appreciation on a tax basis | $ | 31,213,349 | |||
| Gross unrealized depreciation on a tax basis | (259,071 | ) | |||
| Net unrealized appreciation | |||||
| (depreciation) on investments (tax basis) | $ | 30,954,278 | |||
At March 31, 2004, the Fund had tax basis capital losses, which may be carried over to offset future capital gains. Such losses expire as follows:
Capital loss carryovers expiring in:
| 2004 | $ | 2,201,912 | |||
| 2005 | 200,249 | ||||
| 2006 | 27,737 | ||||
| 2007 | 6,140 | ||||
| 2008 | 2,563,342 | ||||
| 2009 | 2,374,508 | ||||
| 2011 | 11,597 | ||||
| -- | $ | 7,385,485 | |||
Unutilized tax basis capital losses may be carried forward to offset realized gains in future years. To the extent such carry forwards are used, capital gain distributions may be reduced to the extent provided by regulations.
9
March 31, 2004
| Financial highlights | ||||||
|---|---|---|---|---|---|---|
| Thornburg Intermediate Municipal Fund | ||||||
| Six Months | Year Ended September 30, | |||||
| Ended March 31, | 2003 | 2002 | 2001 | 2000 | 1999 | |
| Class A Shares: | ||||||
| Per Share Performance | ||||||
| (for a share outstanding throughout the period) | ||||||
| Net asset value, beginning of period | $ 13.56 | $ 13.67 | $ 13.28 | $ 12.78 | $ 13.00 | $ 13.76 |
| Income from investment operations: | ||||||
| Net investment income | 0.26 | 0.52 | 0.56 | 0.62 | 0.63 | 0.62 |
| Net realized and unrealized | ||||||
| gain (loss) on investments | 0.04 | (0.11) | 0.39 | 0.50 | (0.22) | (0.76) |
| Total from investment operations | 0.30 | 0.41 | 0.95 | 1.12 | 0.41 | (0.14) |
| Less dividends from: | ||||||
| Net investment income | (0.26) | (0.52) | (0.56) | (0.62) | (0.63) | (0.62) |
| Change in net asset value | 0.04 | (0.11) | 0.39 | 0.50 | (0.22) | (0.76) |
| Net asset value, end of period | $ 13.60 | $ 13.56 | $ 13.67 | $ 13.28 | $ 12.78 | $ 13.00 |
| Total return (a) | 2.22% | 3.11% | 7.39% | 8.94% | 3.23% | (1.09)% |
| Ratios/Supplemental Data | ||||||
| Ratios to average net assets: | ||||||
| Net investment income | 3.81% (b) | 3.87% | 4.23% | 4.73% | 4.89% | 4.59% |
| Expenses, after expense reductions | 0.97% (b) | 0.99% | 0.92% | 0.82% | 0.89% | 0.99% |
| Expenses, after expense reductions | ||||||
| and net of custody credits | 0.97% (b) | 0.99% | 0.92% | -- | -- | -- |
| Expenses, before expense reductions | 0.97% (b) | 1.00% | 1.00% | 1.02% | 1.02% | 1.02% |
| Portfolio turnover rate | 6.72% | 15.13% | 16.36% | 18.24% | 21.97% | 23.17% |
| Net assets at end of period (000) | $ 380,305 | $ 390,080 | $ 414,150 | $ 338,931 | $ 322,942 | $ 363,908 |
(a) Sales loads are not reflected in computing total return, which is not annualized for periods less than one year.
(b) Annualized.
10
| Financial highlights, Continued | ||||||
|---|---|---|---|---|---|---|
| Thornburg Intermediate Municipal Fund | ||||||
| Six Months Ended | Year Ended September 30, | |||||
| March 31, 2004 | 2003 | 2002 | 2001 | 2000 | 1999 | |
| Class C Shares: | ||||||
| Per Share Performance | ||||||
| (for a share outstanding throughout the period) | ||||||
| Net asset value, beginning of period | $ 13.58 | $ 13.69 | $ 13.30 | $ 12.79 | $ 13.02 | $ 13.77 |
| Income from investment operations: | ||||||
| Net investment income | 0.24 | 0.47 | 0.51 | 0.57 | 0.57 | 0.56 |
| Net realized and unrealized | ||||||
| gain (loss) on investments | 0.04 | (0.11) | 0.39 | 0.51 | (0.23) | (0.75) |
| Total from investment operations | 0.28 | 0.36 | 0.90 | 1.08 | 0.34 | (0.19) |
| Less dividends from: | ||||||
| Net investment income | (0.24) | (0.47) | (0.51) | (0.57) | (0.57) | (0.56) |
| Change in net asset value | 0.04 | (0.11) | 0.39 | 0.51 | (0.23) | (0.75) |
| Net asset value, end of period | $ 13.62 | $ 13.58 | $ 13.69 | $ 13.30 | $ 12.79 | $ 13.02 |
| Total return (a) | 2.08% | 2.73% | 6.97% | 8.59% | 2.70% | (1.48)% |
| Ratios/Supplemental Data | ||||||
| Ratios to average net assets: | ||||||
| Net investment income | 3.53%(b) | 3.50% | 3.84% | 4.33% | 4.44% | 4.19% |
| Expenses, after expense reductions | 1.24%(b) | 1.35% | 1.30% | 1.21% | 1.34% | 1.40% |
| Expenses, after expense reductions | ||||||
| and net of custody credits | 1.24%(b) | 1.35% | 1.30% | -- | -- | -- |
| Expenses, before expense reductions | 1.82%(b) | 1.80% | 1.80% | 1.83% | 1.83% | 1.85% |
| Portfolio turnover rate | 6.72% | 15.13% | 16.36% | 18.24% | 21.97% | 23.17% |
| Net assets at end of period (000) | $ 62,890 | $ 60,707 | $ 47,155 | $ 40,002 | $ 33,353 | $ 32,477 |
(a) Not annualized for periods less than one year.
(b) Annualized.
11
| Financial highlights, Continued | ||||||
|---|---|---|---|---|---|---|
| Thornburg Intermediate Municipal Fund | ||||||
| Six Months Ended | Year Ended September 30, | |||||
| March 31, 2004 | 2003 | 2002 | 2001 | 2000 | 1999 | |
| Class I Shares: | ||||||
| Per Share Performance | ||||||
| (for a share outstanding throughout the period) | ||||||
| Net asset value, beginning of period | $ 13.54 | $ 13.65 | $ 13.26 | $ 12.76 | $ 12.98 | $ 13.74 |
| Income from investment operations: | ||||||
| Net investment income | 0.28 | 0.57 | 0.61 | 0.65 | 0.65 | 0.66 |
| Net realized and unrealized | ||||||
| gain (loss) on investments | 0.04 | (0.11) | 0.39 | 0.50 | (0.22) | (0.76) |
| Total from investment operations | 0.32 | 0.46 | 1.00 | 1.15 | 0.43 | (0.10) |
| Less dividends from: | ||||||
| Net investment income | (0.28) | (0.57) | (0.61) | (0.65) | (0.65) | (0.66) |
| Change in net asset value | 0.04 | (0.11) | 0.39 | 0.50 | (0.22) | (0.76) |
| Net asset value, end of period | $ 13.58 | $ 13.54 | $ 13.65 | $ 13.26 | $ 12.76 | $ 12.98 |
| Total return (a) | 2.37% | 3.49% | 7.75% | 9.23% | 3.45% | (0.79)% |
| Ratios/Supplemental Data | ||||||
| Ratios to average net assets: | ||||||
| Net investment income | 4.10% (b) | 4.23% | 4.57% | 4.99% | 5.10% | 4.89% |
| Expenses, after expense reductions | 0.67% (b) | 0.62% | 0.58% | 0.55% | 0.68% | 0.69% |
| Expenses, after expense reductions | ||||||
| and net of custody credits | 0.67% (b) | 0.62% | 0.58% | -- | -- | -- |
| Expenses, before expense reductions | 0.78% (b) | 0.80% | 0.79% | 0.79% | 0.80% | 0.79% |
| Portfolio turnover rate | 6.72% | 15.13% | 16.36% | 18.24% | 21.97% | 23.17% |
| Net assets at end of period (000) | $ 21,012 | $ 19,333 | $ 18,330 | $ 17,258 | $ 17,563 | $ 18,772 |
(a) Not annualized for periods less than one year.
(b) Annualized.
12
| Schedule of Investments | ||||
|---|---|---|---|---|
| Thornburg Intermediate Municipal Fund | March 31, 2004 | |||
| CUSIPS: CLASS A - 885-215-202, CLASS C - 885-215-780, CLASS I - 885-215-673 NASDAQ SYMBOLS: CLASS A - THIMX, CLASS C - THMCX, CLASS I - THMIX | ||||
| Issuer-Description | Credit Rating† Moody’s/S&P | Principal Amount | Value | |
| Alabama | -1.10% | |||
| Alabama Docks Revenue, 6.00% due 10/1/2008 (Insured: MBIA) | Aaa/AAA | 800,000 | $ 926,592 | |
| East Alabama Health Care Authority Tax Anticipation Series A, 4.00% due 9/1/2006 (Insured: MBIA) | Aaa/AAA | 1,515,000 | 1,600,689 | |
| Huntsville Series A, 6.25% due 2/1/2006 | Aa2/AA | 505,000 | 529,866 | |
| Lauderdale County & Florence Health Group Series A, 5.75% due 7/1/2013 (Insured: MBIA) | Aaa/AAA | 1,600,000 | 1,818,576 | |
| Alaska | -0.40% | |||
| Anchorage Alaska, 5.25% due 10/1/2008 pre-refunded 10/1/2005 (Insured: FGIC) | Aaa/AAA | 515,000 | 545,679 | |
| Anchorage Alaska, 5.25% due 10/1/2008 (Insured: FGIC) | Aaa/AAA | 485,000 | 511,505 | |
| Anchorage School Refunding, 6.00% due 10/1/2012 (Insured: FGIC) | Aaa/AAA | 500,000 | 599,560 | |
| Arizona | -1.90% | |||
| Maricopa County Industrial Development Capital Appreciation Series B, 4.80% due 12/1/2031 put 12/1/2004 (Waste | NR/BBB | 4,580,000 | 4,665,921 | |
| Management Inc. Project) | ||||
| Pima County Industrial Development Authority Series C, 6.70% due 7/1/2021 (Arizona Charter Schools Project) | Baa3/NR | 2,715,000 | 2,804,160 | |
| Tucson General Obligation Series D, 9.75% due 7/1/2012 (ETM)* | Aa2/AA | 400,000 | 581,244 | |
| Tucson General Obligation Series D, 9.75% due 7/1/2013 (ETM)* | Aa2/AA | 500,000 | 743,160 | |
| Arkansas | -0.90% | |||
| Conway Electric Revenue Refunding, 2.00% due 8/1/2004 | A2/NR | 500,000 | 501,255 | |
| Jefferson County Hospital Revenue Refunding & Improvement, 5.75% due 6/1/2012 (Regional Medical Center Project) | NR/A | 1,135,000 | 1,279,701 | |
| Jefferson County Hospital Revenue Refunding & Improvement, 5.75% due 6/1/2013 (Regional Medical Center Project) | NR/A | 1,200,000 | 1,342,260 | |
| Little Rock Arkansas Capital Improvement, 4.00% due 4/1/2005 (Insured: FSA) | Aaa/AAA | 1,000,000 | 1,028,560 | |
| California | -5.40% | |||
| California Department of Water Resources Power Series A, 5.75% due 5/1/2017 | A3/BBB+ | 3,000,000 | 3,354,750 | |
| California HFA Revenue Series 1985-B, 9.875% due 2/1/2017 | Aa2/AA- | 675,000 | 730,181 | |
| California Housing Finance Agency Revenue Multi Family Housing Series D, 1.15% due 2/1/2031 put 4/1/2004 (daily | VMIG1/A1+ | 1,000,000 | 1,000,000 | |
| demand notes) | ||||
| California State Department of Water Resources Series B 2, 1.15% due 5/1/2022 put 4/1/2004 (daily demand notes) | VMIG1/A1+ | 900,000 | 900,000 | |
| California State Series A-3, 1.10% due 5/1/2033 put 4/1/2004 (daily demand notes) | VMIG1/A1+ | 500,000 | 500,000 | |
| California Statewide Community Development Authority Certificate of Participation, 5.50% due 10/1/2007 | Aaa/AAA | 4,500,000 | 5,075,370 | |
| (Unihealth America Project; Insured: AMBAC) (ETM)* | ||||
| Camino Hospital District Revenue Series A, 6.25% due 8/15/2017 (ETM)* | Aaa/AAA | 1,000,000 | 1,178,440 | |
| Escondido Joint Powers Financing Authority Lease Revenue, 0% due 9/1/2007 (Center for the Arts Project; | Aaa/AAA | 1,740,000 | 1,540,161 | |
| Insured: AMBAC) | ||||
| Golden West Schools Financing Authority Capital Appreciation, 0% due 8/1/2018 (Insured: MBIA) | Aaa/AAA | 2,140,000 | 1,004,837 | |
| Irwindale Community Redevelopment Agency, 6.60% due 8/1/2018 pre-refunded 8/1/2005 | Baa3/NR | 500,000 | 544,060 | |
| Los Angeles Regional Airport Lease Refunding, 5.25% due 1/1/2009 (Facilities Laxfuel Corp. LA International | Aaa/AAA | 1,590,000 | 1,736,169 | |
| Project) | ||||
| Orange County Apartment Development Revenue, 1.06% due 11/1/2009 put 4/8/2004 (Laguna Summit Apartments | VMIG1/NR | 300,000 | 300,000 | |
| Project; LOC: Bank of America) (weekly demand notes) | ||||
| Orange County Refunding Recovery, 6.50% due 6/1/2005 (Insured: MBIA) | Aaa/AAA | 2,280,000 | 2,421,177 | |
| San Diego County Water Authority Revenue & Refunding Series 1993-A, 10.123% due 4/25/2007 (Insured: FGIC) | Aaa/AAA | 500,000 | 611,130 | |
| San Marcos Certificate of Participation Series C, 0% due 8/15/2005 (ETM)* | NR/AAA | 145,000 | 142,435 | |
| San Marcos Certificate of Participation Series D, 0% due 9/2/2005 (ETM)* | NR/AAA | 740,000 | 726,399 | |
| Stanton Multi Family Housing Revenue Bond Series 1997, 5.625% due 8/1/2029 put 8/1/2009 (Continental Gardens | NR/AAA | 1,490,000 | 1,628,183 | |
| Project; Collateralized: FNMA) | ||||
| Sulphur Springs School District General Obligation Series B, 5.70% due 3/1/2005 | NR/A | 800,000 | 832,960 | |
| Sunline Transit Agency Certificate of Participation Series A, 5.625% due 7/1/2004 | A2/NR | 450,000 | 455,162 | |
| Sunline Transit Agency Certificate of Participation Series A, 5.75% due 7/1/2005 | A2/NR | 215,000 | 219,534 | |
| Colorado | -5.20% | |||
| Adams County Communication Center Series A, 5.75% due 12/1/2016 | Baa1/NR | 1,265,000 | 1,352,993 | |
| Arvada Industrial Development Revenue, 5.25% due 12/1/2007 (Wanco Inc. Project; LOC: US Bank, N.A.) | NR/NR | 80,000 | 82,243 | |
| Arvada Industrial Development Revenue, 5.60% due 12/1/2012 (Wanco Inc. Project; LOC: US Bank, N.A.) | NR/NR | 450,000 | 464,535 | |
| Central Platte Valley Metropolitan District, 5.15% due 12/1/2013 pre-refunded 12/1/2009 | NR/AAA | 1,000,000 | 1,143,640 | |
| Central Platte Valley Metropolitan District Refunding Series A, 5.00% due 12/1/2031 put 12/1/2009 (LOC: US | NR/A1+ | 2,000,000 | 2,165,300 | |
| Bank) | ||||
| Colorado Educational & Cultural Facilities Refunding, 6.00% due 4/1/2021 (Charter School Cherry Creek Project) | Baa2/NR | 500,000 | 512,615 | |
| Colorado Housing Finance Authority Single Family Program Subordinated Series C, 5.75% due 10/1/2007 | A1/A+ | 60,000 | 60,000 | |
| Colorado Springs Company Hospital Revenue Refunding, 5.60% due 12/15/2007 (Insured: MBIA) | Aaa/AAA | 500,000 | 541,005 | |
| Colorado Student Obligation Bond Student Loan Senior Subordinated Series B, 6.20% due 12/1/2008 | A2/NR | 1,545,000 | 1,618,758 | |
| Denver City & County Certificates of Participation Series B, 5.00% due 12/1/2009 | Aa2/AA | 2,070,000 | 2,321,547 | |
| Denver City & County Certificates of Participation Series B, 5.00% due 12/1/2011 | Aa2/AA | 2,465,000 | 2,771,202 | |
| El Paso County School District 11, 7.10% due 12/1/2013 | Aa3/AA- | 500,000 | 646,180 | |
| Glendale Certificates of Participation, 5.40% due 8/15/2008 (Education Center Project) | NR/BBB+ | 675,000 | 698,814 | |
| Interstate South Metropolitan District Refunding, 6.00% due 12/1/2020 (LOC: BNP Paribas) | NR/AA- | 2,395,000 | 2,462,755 | |
| Larimer County General Obligation, 8.45% due 12/15/2005 (Poudre School District Project) | Aa3/NR | 2,830,000 | 3,166,742 | |
| Northwest Parkway Public Highway Authority Capital Appreciation Senior Convertible C,0% due 6/15/2014 (Insured: | Aaa/AAA | 1,005,000 | 793,267 | |
| FSA) | ||||
| Plaza Metropolitan District 1 Colorado Revenue Public Improvement Fee/Tax Increment, 7.70% due 12/1/2017 | NR/NR | 2,500,000 | 2,529,450 | |
| Superior Metropolitan District 1 Water Refunding & Improvement Series B, 5.45% due 12/1/2020 put 12/1/2004 @ | NR/A | 350,000 | 358,358 | |
| 100 (LOC: Allied Irish) | ||||
| Thornton County Single Family Mortgage Revenue Series 1992-A, 8.05% due 8/1/2009 | A3/NR | 55,000 | 55,224 | |
| Connecticut | -0.10% | |||
| Connecticut State Health & Educational Facilities Authority Revenue Yale University Series V-2, 1.10% due | VMIG1/A1+ | 600,000 | 600,000 | |
| 7/1/2036 put 4/1/2004 (daily demand notes) | ||||
| Delaware | -0.30% | |||
| Delaware State Health Facilities Authority Revenue Series A, 5.25% due 5/1/2016 (Nanticoke Memorial Hospital | NR/AA | 1,500,000 | 1,598,490 | |
| Project; Insured: Radian) | ||||
| District of Columbia | -1.10% | |||
| District of Columbia Hospital Revenue, 5.375% due 8/15/2015 (ETM)* | Aaa/AAA | 600,000 | 676,290 | |
| District of Columbia Refunding Series B, 6.00% due 6/1/2015 (Insured: MBIA) | Aaa/AAA | 3,000,000 | 3,598,890 | |
| District of Columbia Tax Increment Capital Appreciation, 0% due 7/1/2019 (Mandarin Oriental Project; Insured: | Aaa/AAA | 1,500,000 | 720,780 | |
| FSA) | ||||
| Florida | -2.80% | |||
| Broward County Resource Recovery Revenue, 5.00% due 12/1/2007 | A3/AA- | 1,000,000 | 1,094,130 | |
| Deltona Utility Systems Revenue, 5.25% due 10/1/2015 (Insured: MBIA) | Aaa/AAA | 1,000,000 | 1,130,050 | |
| Duval County HFA Single Family Housing Revenue Series 94, 6.10% due 4/1/2006 (Collateralized: GNMA) | Aaa/NR | 35,000 | 36,315 | |
| Duval County HFA Single Family Housing Revenue Series 94, 6.10% due 10/1/2006 (Collateralized: GNMA) | Aaa/NR | 30,000 | 31,117 | |
| Duval County Multi Family Housing Revenue Refunding, 5.90% due 9/1/2016 (St. Augustine Apartments Project) | NR/A+ | 1,000,000 | 1,043,530 | |
| Enterprise Community Development District Assessment Bonds, 6.00% due 5/1/2010 (Insured: MBIA) | Aaa/AAA | 1,605,000 | 1,627,053 | |
| Escambia County Health Facility Revenue, 5.95% due 7/1/2020 (Florida Health Care Facility Loan Project; | Aaa/NR | 3,000,000 | 3,150,420 | |
| Insured: AMBAC) | ||||
| Florida Board of Education Capital Outlay Refunding Public Education Series D, 5.75% due 6/1/2018 | Aa2/AA+ | 1,200,000 | 1,370,724 | |
| Osceola County Health Facilities Revenue Series 1994, 5.75% due 5/1/2004 (Evangelical Lutheran Good Samaritan | Aaa/AAA | 150,000 | 150,567 | |
| Project; Insured: AMBAC) | ||||
| Pasco County Housing Finance Authority MFHR, 5.50% due 6/1/2027 put 6/1/2008 (Cypress Trail Apartments Project; | NR/AA- | 1,200,000 | 1,266,432 | |
| Guaranty: Axa Reinsurance) | ||||
| Pensacola Apartment Revenue Series A, 6.25% due 10/1/2004 (Insured: MBIA) | Aaa/AAA | 650,000 | 665,951 | |
| Turtle Run Community Development District Refunding Water Management Benefit Special Assessment, 5.00% due | Aaa/AAA | 1,000,000 | 1,115,530 | |
| 5/1/2011 (Insured: MBIA) | ||||
| Georgia | -0.10% | |||
| Georgia Municipal Electric Authority Power Revenue Unrefunded Series Y, 10.00% due 1/1/2010 | A2/NR | 235,000 | 319,628 | |
| Hawaii | -0.70% | |||
| Hawaii Department of Budget & Finance, 6.40% due 7/1/2013 (Insured: MBIA) | Aaa/AAA | 2,000,000 | 2,462,820 | |
| Hawaii Housing Finance Development Corp. Series B, 5.85% due 7/1/2017 (Collateralized: FNMA) | Aaa/AAA | 970,000 | 999,857 | |
| Idaho | -0.20% | |||
| Boise City Industrial Development Corp., 5.40% due 12/15/2009 (Western Trailer Co. Project; LOC: First | Aaa/NR | 985,000 | 998,879 | |
| Security) | ||||
| Illinois | -13.60% | |||
| Bedford Park Tax Increment Revenue Refunding Series 1993, 8.00% due 12/1/2010 pre-refunded 12/1/2004 | NR/BBB- | 1,930,000 | 2,018,066 | |
| Central Lake County Joint Action Water Agency Series 1991, 0% due 5/1/2005 (Insured: MBIA) | Aaa/AAA | 300,000 | 296,160 | |
| Champaign County Community Unit Series C, 0% due 1/1/2011 pre-refunded 1/1/2010 @ 94.672 (Insured: FGIC) | Aaa/AAA | 800,000 | 631,720 | |
| Chicago Housing Authority Capital, 5.00% due 7/1/2008 | Aa3/AA | 3,020,000 | 3,312,276 | |
| Chicago Park District Harbor, 5.75% due 1/1/2011 | A2/NR | 600,000 | 698,916 | |
| Chicago Tax Increment Allocation Lincoln Belmont A, 5.30% due 1/1/2014 (Insured: ACA) | NR/A | 2,285,000 | 2,411,955 | |
| Chicago Wastewater Transmission Revenue Refunding Second Lien, 5.50% due 1/1/2013 (Insured: MBIA) | Aaa/AAA | 650,000 | 749,866 | |
| Cook County Capital Improvement, 5.50% due 11/15/2008 (Insured: FGIC) | Aaa/AAA | 500,000 | 550,105 | |
| Cook County School District Class A, 0% due 12/1/2022 | NR/NR | 4,200,000 | 1,426,362 | |
| Du Page County School District Capital Appreciation, 0% due 2/1/2010 (Insured: FGIC) | Aaa/NR | 655,000 | 543,676 | |
| Freeport Illinois, 5.375% due 1/1/2018 | Aaa/AAA | 1,500,000 | 1,663,770 | |
| Hoffman Estates Tax Increment Revenue, 0% due 5/15/2004 | Baa1/NR | 1,385,000 | 1,380,734 | |
| Illinois Development Finance Authority Revenue, 6.00% due 11/15/2012 (Insured: MBIA) | Aaa/AAA | 2,860,000 | 3,331,128 | |
| Illinois Development Finance Authority Revenue Refunding Community Rehab Providers A, 5.90% due 7/1/2009 | NR/BBB | 720,000 | 763,826 | |
| Illinois Development Financing Authority, 7.125% due 3/15/2007 (Children’s Home & Aid Society Project; LOC: | NR/A-1 | 500,000 | 502,190 | |
| Bank One) | ||||
| Illinois Development Financing Authority Debt Restructuring Revenue Series 1994, 7.25% due 11/15/2009 (East St | NR/A | 2,400,000 | 2,528,640 | |
| Louis Project) | ||||
| Illinois Educational Facilities Authority Revenues Adjusted Medium Term, 4.75% due 11/1/2036 put 11/1/2016 @ | A2/A | 1,160,000 | 1,202,282 | |
| 100 (Field Museum Project) | ||||
| Illinois Educational Facilities Authority Revenues Capital Appreciation, 0% due 7/1/2014 pre-refunded 7/1/2009 | Aaa/AAA | 475,000 | 231,002 | |
| @ 57.17 (Insured: MBIA) | ||||
| Illinois Educational Facilities Authority Revenues Loyola University A, 6.00% due 7/1/2012 (Insured: MBIA) | Aaa/AAA | 230,000 | 274,977 | |
| (ETM)* | ||||
| Illinois Educational Facilities Authority Revenues Midwestern University B, 5.50% due 5/15/2018 (Insured: ACA) | NR/A | 1,500,000 | 1,563,660 | |
| Illinois Educational Facilities Authority Revenues Series B, 4.40% due 7/1/2025 put 7/1/2004 (University of | Aa1/AA | 2,000,000 | 2,016,480 | |
| Chicago Project) | ||||
| Illinois Educational Facilities Authority Revenues Unrefunded Balance Loyola A, 5.00% due 7/1/2006 (Insured: | Aaa/AAA | 1,540,000 | 1,652,035 | |
| MBIA) | ||||
| Illinois Educational Facilities Authority Revenues Unrefunded Balance Loyola A, 6.00% due 7/1/2011 (ETM)* | Aaa/AAA | 770,000 | 912,304 | |
| Illinois Educational Facilities Authority Revenues Unrefunded Balance Loyola A, 6.00% due 7/1/2012 (ETM)* | Aaa/AAA | 970,000 | 1,146,220 | |
| Illinois Health Facilities Authority Revenue, 5.50% due 10/1/2009 (Decatur Memorial Hospital Project) | A2/A | 1,055,000 | 1,180,999 | |
| Illinois Health Facilities Authority Revenue, 7.60% due 8/15/2010 (Insured: FSA) | Aaa/AAA | 214,000 | 221,019 | |
| Illinois Health Facilities Authority Revenue, 5.75% due 8/15/2013 (Children’s Memorial Hospital Series A | Aaa/AAA | 1,900,000 | 2,161,630 | |
| Project; Insured: AMBAC) | ||||
| Illinois Health Facilities Authority Revenue, 5.70% due 2/20/2021 (Midwest Care Center Project; Collateralized: | Aaa/NR | 990,000 | 1,066,002 | |
| GNMA) | ||||
| Illinois Health Facilities Authority Revenue Healthcare Systems, 6.25% due 11/15/2019 (OSF Healthcare Project) | A2/A | 1,250,000 | 1,361,412 | |
| Illinois Health Facilities Authority Revenue Series A, 7.60% due 8/15/2010 (Insured: FSA) | Aaa/AAA | 37,000 | 37,182 | |
| Illinois Health Facilities Authority Revenue Series A, 6.10% due 8/15/2014 (Northwestern Memorial Hospital | Aa2/AA+ | 870,000 | 901,233 | |
| Project) | ||||
| Illinois University Revenues, 5.25% due 1/15/2018 (UIC South Campus Development Project) | Aaa/AAA | 1,205,000 | 1,333,140 | |
| Jackson & Williamson Countys, Illinois, 7.50% due 12/1/2009 (Insured: AMBAC) | Aaa/AAA | 680,000 | 850,850 | |
| Lake County Community Consolidated School District 73, 9.00% due 1/1/2006 (Insured: FSA) | Aaa/NR | 1,000,000 | 1,126,040 | |
| Lake County Community High School Capital Appreciation Series B, 0% due 12/1/2012 (Insured: FGIC) | Aaa/NR | 5,550,000 | 4,000,939 | |
| Marion Refunding, 5.00% due 9/15/2012 (Insured: FGIC) | Aaa/AAA | 755,000 | 845,064 | |
| McHenry County School District Woodstock General Obligation, 6.80% due 1/1/2006 (Insured: FSA) | Aaa/AAA | 710,000 | 773,829 | |
| Melrose Park Tax Increment Series B, 6.50% due 12/15/2015 (Insured: FSA) | Aaa/AAA | 1,015,000 | 1,224,618 | |
| Sangamon County Property Tax Lease Receipts, 7.45% due 11/15/2006 | Aa3/NR | 800,000 | 877,296 | |
| Sangamon County School District Series A, 5.875% due 8/15/2018 (Hay Edwards Project) | NR/A | 2,400,000 | 2,545,440 | |
| Sherman Revenue Refunding Mortgage, 6.10% due 10/1/2014 (Collateralized: GNMA) | Aaa/AAA | 1,170,000 | 1,293,739 | |
| Sherman Revenue Refunding Mortgage, 6.20% due 10/1/2019 (Collateralized: GNMA) | Aaa/AAA | 1,600,000 | 1,738,784 | |
| Southern Illinois University Revenues, 0% due 4/1/2014 (Insured: MBIA) | Aaa/AAA | 1,425,000 | 943,136 | |
| Southwestern Illinois Development Authority Revenue, 5.375% due 8/15/2015 | Baa2/BBB+ | 500,000 | 515,765 | |
| University of Illinois Revenue Capital Appreciation, 0% due 4/1/2014 (Insured: MBIA) | Aaa/AAA | 1,590,000 | 1,052,342 | |
| West Chicago Industrial Development Revenue, 6.90% due 9/1/2024 (Leggett & Platt Inc. Project) | NR/A+ | 1,000,000 | 1,040,610 | |
| Will & Kendall Counties Community Series B, 5.125% due 1/1/2014 (Insured: FSA) | Aaa/AAA | 1,000,000 | 1,104,480 | |
| Will County Community School 365-U Capital Appreciation, 0% due 11/1/2011 (Insured: FSA) | Aaa/AAA | 3,000,000 | 2,296,170 | |
| Indiana | -6.70% | |||
| Allen County Economic Development, 5.80% due 12/30/2012 (Indiana Institute of Technology Project) | NR/NR | 895,000 | 964,040 | |
| Allen County Economic Development, 5.75% due 12/30/2015 (Indiana Institute of Technology Project) | NR/NR | 1,355,000 | 1,496,855 | |
| Allen County War Memorial Series A, 5.25% due 11/1/2013 (Insured: AMBAC) | Aaa/NR | 1,000,000 | 1,121,770 | |
| Boone County Hospital Association, 5.625% due 1/15/2015 (Insured: FGIC) | Aaa/AAA | 1,000,000 | 1,116,530 | |
| Carmel Economic Development Revenue Refunding FHA Loan, 5.875% due 9/1/2005 (Insured: FHA) | Aa2/NR | 35,000 | 35,490 | |
| Dyer Redevelopment Authority, 6.40% due 7/15/2015 | NR/BBB+ | 1,515,000 | 1,670,606 | |
| Dyer Redevelopment Authority, 6.50% due 7/15/2016 | NR/BBB+ | 1,910,000 | 2,106,749 | |
| East Chicago Elementary School Building First Mortgage Series A, 6.25% due 7/5/2008 | NR/A | 350,000 | 399,042 | |
| Gary Building Corp. - Lake County First Mortgage Series 1994-B, 8.25% due 7/1/2010 (Sears Building Project) | NR/NR | 1,000,000 | 1,029,100 | |
| Goshen Chandler School Building Capital Appreciation Refunding, 0% due 1/15/2011 (Insured: MBIA) | Aaa/AAA | 1,020,000 | 806,851 | |
| Hamilton Southeastern Indiana, 6.25% due 7/15/2006 (North Delaware School Building Project; Insured: AMBAC) | Aaa/AAA | 2,600,000 | 2,868,840 | |
| Huntington Economic Development Revenue, 6.40% due 5/1/2015 (United Methodist Memorial Project) | NR/NR | 1,000,000 | 1,058,620 | |
| Indiana Bond Bank Common School Fund Advanced Purchase Funding, 5.00% due 2/1/2009 (Insured: AMBAC) | Aaa/AAA | 700,000 | 778,169 | |
| Indiana Bond Bank Special Program Hendrick’s Redevelopment Series B, 6.20% due 2/1/2023 (LOC: Canadian Imperial | NR/A+ | 1,500,000 | 1,709,670 | |
| Bank) | ||||
| Indiana Health Facility Hospital Revenue, 5.75% due 9/1/2015 (ETM)* | NR/AA- | 575,000 | 581,469 | |
| Indiana Health Facility Hospital Revenue, 5.40% due 2/15/2016 (Clarian Health Obligation Group Project; | Aaa/AAA | 800,000 | 881,896 | |
| Insured: MBIA) | ||||
| Indiana Public School Building Corp. First Mortgage, 6.00% due 7/5/2007 (Insured: State Aid Witholding) | NR/AA | 910,000 | 1,024,269 | |
| Indiana State Educational Facilities Authority Revenue, 5.65% due 10/1/2015 (University of Indianapolis | NR/A- | 1,065,000 | 1,180,286 | |
| Project) | ||||
| Indiana State Educational Facilities Authority Revenue, 5.70% due 10/1/2016 (University of Indianapolis | NR/A- | 1,025,000 | 1,134,368 | |
| Project) | ||||
| Indianapolis Airport Authority Revenue Refunding Series A, 5.75% due 7/1/2005 (Insured: FGIC) | Aaa/AAA | 1,000,000 | 1,056,130 | |
| Indianapolis Economic Development Revenue, 5.50% due 6/1/2014 | Aa3/NR | 500,000 | 559,455 | |
| Indianapolis Local Public Improvement Bond Bank, 0% due 7/1/2009 (ETM)* | Aa2/AA- | 740,000 | 636,518 | |
| Portage Township Multi School Bldg., 5.50% due 7/15/2015 (Insured: FGIC) | Aaa/AAA | 500,000 | 568,540 | |
| Rockport Pollution Control Revenue Series A, 4.90% due 6/1/2025 put 6/1/2007 (Indiana Michigan Power Co. | Baa2/BBB | 2,500,000 | 2,607,375 | |
| Project) | ||||
| Wawasee Community School Corp. First Mortgage, 5.50% due 7/15/2012 | NR/AA- | 1,200,000 | 1,371,876 | |
| West Clark School Building Corp. First Mortgage, 5.75% due 7/15/2017 (Insured: FGIC and State Aid Withholding) | Aaa/AAA | 1,685,000 | 1,938,946 | |
| Iowa | -2.10% | |||
| Iowa Department of General Services Certificate of Participation Series 1992, 6.50% due 7/1/2006 (Insured: | Aaa/AAA | 2,590,000 | 2,622,427 | |
| AMBAC) (ETM)* | ||||
| Iowa Finance Authority Health Care Facilities, 6.00% due 7/1/2013 (Genesis Medical Center Project) | A1/NR | 1,000,000 | 1,108,110 | |
| Iowa Finance Authority Hospital Facility Revenue, 6.00% due 7/1/2012 (Trinity Regional Hospital Project; | Aaa/AAA | 1,000,000 | 1,183,250 | |
| Insured: FSA) | ||||
| Iowa Finance Authority Hospital Facility Revenue, 6.75% due 2/15/2016 | A1/NR | 1,000,000 | 1,128,130 | |
| Iowa Finance Authority Revenue, 6.00% due 12/1/2018 (Catholic Health Initiatives Project) | Aa2/AA | 2,000,000 | 2,224,120 | |
| Iowa Finance Authority Revenue Refunding Trinity Health Series B, 5.75% due 12/1/2015 | Aa3/AA- | 1,250,000 | 1,381,012 | |
| Kansas | -1.00% | |||
| Wichita Hospital Revenue Refunding Improvement Series XI, 6.75% due 11/15/2019 (Christi Health System Project) | NR/A+ | 4,200,000 | 4,717,272 | |
| Kentucky | -1.40% | |||
| Kentucky Economic Development Finance Authority Series C, 0% due 10/1/2015 (Norton Healthcare Project; Insured: | Aaa/AAA | 4,000,000 | 4,265,040 | |
| MBIA) | ||||
| Paintsville First Mortgage Revenue Refunding Series 1991, 8.65% due 9/1/2005 (Paul B. Hall Medical Center | NR/NR | 1,120,000 | 1,127,022 | |
| Project) | ||||
| Wilmore Housing Facilities Revenue, 5.55% due 7/1/2013 (LOC: Allied Irish Bank PLC) | NR/NR | 785,000 | 840,712 | |
| Louisiana | -2.00% | |||
| East Baton Rouge Mortgage Financing Authority Purchase Revenue, 8.25% due 2/25/2011 (Collateralized: GNMA) | Aaa/AAA | 1,738 | 1,774 | |
| Jefferson Sales Tax District Revenue Series B, 5.50% due 12/1/2008 (Insured: AMBAC) | Aaa/AAA | 1,595,000 | 1,820,023 | |
| Louisiana Local Govt. Environment Series A, 4.10% due 9/1/2007 (Housing Bellemont Apts. Project) | Baa1/NR | 390,000 | 390,975 | |
| Louisiana Public Facilities Authority Revenue Refinancing, 8.00% due 10/1/2009 (Schwegman Westside Expressway | NR/NR | 1,709,550 | 288,487 | |
| Project A) (a) | ||||
| Louisiana State Offshore Term Refunding Series D, 4.00% due 9/1/2023 put 9/1/2008 (Loop LLC Project) | A3/A-1 | 3,250,000 | 3,393,032 | |
| Morehouse Parish Pollution Revenue Refunding Series A, 5.25% due 11/15/2013 (International Paper Co. Project) | Baa2/BBB | 3,000,000 | 3,329,820 | |
| Massachusetts | -1.20% | |||
| Massachusetts Development Finance Agency Refunding, 6.25% due 1/1/2015 (Odd Fellows Home Project) | NR/NR | 1,205,000 | 1,121,867 | |
| Massachusetts Housing Finance Authority Insured Rental Housing Series 1994-A, 6.20% due 1/1/2006 (Insured: | Aaa/AAA | 2,510,000 | 2,580,606 | |
| AMBAC) | ||||
| Massachusetts Industrial Financing Agency Revenue Series A, 6.125% due 12/1/2011 (Insured: MBIA) | Aaa/AAA | 1,905,000 | 2,004,632 | |
| Michigan | -1.60% | |||
| Kalamazoo Hospital Finance Authority Revenue Series 1994-A, 6.25% due 6/1/2014 (Borgess Medical Center Project) | Aaa/AAA | 650,000 | 797,394 | |
| (ETM)* | ||||
| Kent Hospital Finance Authority Michigan Hospital, 7.25% due 1/15/2013 (Insured: MBIA) | Aaa/AAA | 1,000,000 | 1,241,030 | |
| Livonia Public School District, 5.50% due 5/1/2014 | Aaa/AAA | 750,000 | 760,260 | |
| Michigan Housing Redevelopment Authority Ltd. Obligation, 6.50% due 9/15/2007 (Greenwood Villa Project; | Aaa/AAA | 415,000 | 425,641 | |
| Insured: FSA) | ||||
| Michigan State Building Authority Revenue Refunding Facilities Program Series I, 5.25% due 10/15/2017 | Aaa/AAA | 2,450,000 | 2,723,689 | |
| Southfield Economic Development Corp. Refunding Revenue N.W. 12 Limited Partnership, 7.25% due 12/1/2010 | NR/NR | 1,530,000 | 1,531,836 | |
| Minnesota | -0.40% | |||
| Minneapolis St. Paul Health, 6.00% due 12/1/2018 (Healthpartners Obligation Group Project) | Baa1/BBB+ | 1,000,000 | 1,083,010 | |
| Southern Minnesota Municipal Power Agency Supply, pre-refunded to various dates, Series A, 5.75% due 1/1/2018 | Aaa/AAA | 700,000 | 716,121 | |
| (Insured: MBIA) | ||||
| Mississippi | -0.50% | |||
| Mississippi Higher Educational Authority Series C, 7.50% due 9/1/2009 | A2/NR | 1,500,000 | 1,515,810 | |
| Mississippi Hospital Equipment Revenue, 6.40% due 1/1/2007 (Rush Foundation Project; Guaranty: Connie Lee) | Baa3/AAA | 635,000 | 658,050 | |
| Missouri | -1.20% | |||
| Missouri Development Finance Board Healthcare Series A, 5.40% due 11/1/2018 (Lutheran Home Aged Project; LOC: | A2/NR | 2,025,000 | 2,111,832 | |
| Commerce Bank) | ||||
| Missouri Environment Improvement Energy Refunding, 3.90% due 1/2/2012 put 9/1/2004 (Kansas City Power & Light | VMIG1/A-2 | 2,000,000 | 2,018,480 | |
| Project) | ||||
| St. Louis Municipal Finance Corp. Leasehold Revenue, 6.25% due 2/15/2012 pre-refunded 2/1/2005 | Aaa/AAA | 1,175,000 | 1,227,687 | |
| Nebraska | -0.20% | |||
| Madison County Hospital Authority 1 Hospital Revenue, 5.50% due 7/1/2014 (Faith Regional Health Services | NR/AA | 845,000 | 929,880 | |
| Project; Insured: Radian) | ||||
| Nevada | -1.90% | |||
| Clark County Pollution Control Revenue Series B, 6.60% due 6/1/2019 (Nevada Power Company Project; Insured: | Aaa/AAA | 640,000 | 662,528 | |
| FGIC) | ||||
| Las Vegas Special Improvement District Refunding Senior Local Improvement Series A, 5.375% due 6/1/2013 | Aaa/AAA | 1,235,000 | 1,379,544 | |
| (Insured: FSA) | ||||
| Washoe County Capital Appreciation Reno Sparks Series B, 0% due 7/1/2011 (Insured: FSA) | Aaa/AAA | 2,600,000 | 2,010,242 | |
| Washoe County Hospital Facility Revenue Series 1993 A, 6.00% due 6/1/2015 (Washoe Medical Center Project) | A2/A+ | 2,250,000 | 2,292,030 | |
| Washoe County School District Refunding Series B, 5.00% due 6/1/2010 (Insured: FGIC) | Aaa/AAA | 2,350,000 | 2,636,606 | |
| New Hampshire | -1.90% | |||
| Manchester Housing & Redevelopment Authority, 0% due 1/1/2017 | NR/AA | 5,140,000 | 2,628,390 | |
| Manchester Housing & Redevelopment Authority Capital Appreciation Series B, 0% due 1/1/2016 (Insured: Radian) | NR/AA | 4,990,000 | 2,680,279 | |
| New Hampshire Pollution Refunding Central Maine Power Co., 5.375% due 5/1/2014 | A3/BBB+ | 3,000,000 | 3,253,830 | |
| New Jersey | -1.30% | |||
| New Jersey EDA Refunding Revenue, 7.50% due 12/1/2019 (Spectrum for Living Development Project; LOC: PNC Bank) | A3/A | 265,000 | 266,312 | |
| New Jersey State Transport Trust Fund Authority Series C, 5.50% due 6/15/2017 (Transportation Systems Project) | Aa3/AA- | 5,000,000 | 5,642,350 | |
| New Mexico | -0.60% | |||
| New Mexico Housing Authority, Multi Family Housing Revenue, 1.02% due 1/15/2033 put 4/8/2004 (Arbors/Courtyard | NR/A1+ | 3,000,000 | 3,000,000 | |
| Apartments Project) (weekly demand notes) | ||||
| New York | -3.00% | |||
| Long Island Power Authority General Series B, 5.00% due 12/1/2006 | Baa1/A- | 2,000,000 | 2,159,340 | |
| Metro Transportation Authority New York Service Control Series B, 5.25% due 7/1/2006 | A3/AA- | 1,080,000 | 1,165,504 | |
| Nassau Health Care Corp., 6.00% due 8/1/2011 (Insured: FSA) | Aaa/AAA | 1,000,000 | 1,159,010 | |
| New York City General Obligation Series E, 6.00% due 8/1/2008 (Insured: FGIC) | Aaa/AAA | 1,935,000 | 2,133,879 | |
| New York City Industrial Development Agency Series A, 5.00% due 6/1/2010 (Lycee Francais De New York Project; | NR/A | 1,175,000 | 1,282,630 | |
| Insured: ACA) | ||||
| New York City Transitional Finance Authority, 1.15% due 11/1/2022 put 4/1/2004 (LOC: Bank of New York) (daily | VMIG1/A1+ | 400,000 | 400,000 | |
| demand notes) | ||||
| New York City Trust Cultural Resources, 5.75% due 7/1/2015 (Museum of American Folk Art Project; Insured: ACA) | NR/A | 875,000 | 962,649 | |
| New York Housing Finance Service Series A, 6.375% due 9/15/2015 pre-refunded 9/15/2007 @ 100 | A3/AAA | 220,000 | 252,606 | |
| New York Series B-2, Subseries B-4, 1.10% due 8/15/2023 put 4/1/2004 (daily demand notes) | VMIG1/A1+ | 500,000 | 500,000 | |
| New York State Dormitory Authority Revenues, 5.75% due 7/1/2022 | NR/AAA | 1,290,000 | 1,305,196 | |
| Port Authority New York & New Jersey Special Obligation, 6.25% due 12/1/2011 (JFK International Air Terminal 6 | Aaa/AAA | 2,200,000 | 2,545,620 | |
| Project) | ||||
| North Carolina | -0.40% | |||
| Craven County Industrial Facilities Pollution Control Financing Authority Solid Waste Revenue, 7.875% due | Baa2/NR | 650,000 | 658,931 | |
| 6/1/2005 (Weyerhaeuser Co. Project) | ||||
| North Carolina Eastern Municipal Power Refunding Series A, 5.70% due 1/1/2013 (Insured: MBIA) | Aaa/AAA | 1,200,000 | 1,335,408 | |
| North Dakota | -0.10% | |||
| Grand Forks Health Care System Revenue Bonds Series 1997, 6.25% due 8/15/2006 (Altra Health Systems Obligated | Aaa/AAA | 365,000 | 403,091 | |
| Group Project; Insured: MBIA) | ||||
| Ohio | -2.20% | |||
| Butler County Transportation Improvement, 6.00% due 4/1/2010 (Insured: FSA) | Aaa/AAA | 1,000,000 | 1,151,790 | |
| Cleveland Cuyahoga County Development Bond Fund A, 6.25% due 5/15/2016 (LOC: FifthThird Bank) | NR/NR | 1,530,000 | 1,571,570 | |
| Franklin County Health Care Revenue Series 1995-A, 6.00% due 11/1/2010 (Heinzerling Foundation Project; LOC: | Aa2/NR | 1,100,000 | 1,164,240 | |
| Banc One) | ||||
| Franklin County Hospital, 5.80% due 12/1/2005 (Doctors Project) (ETM)* | A3/NR | 500,000 | 511,835 | |
| Middleburg Heights Ohio Refunding, 6.75% due 8/15/2005 (Southwest General Health Center Project; Insured: FSA) | Aaa/AAA | 500,000 | 537,260 | |
| North Ridgeville Economic Development, 0% due 2/1/2015 | NR/A | 630,000 | 261,866 | |
| Ohio Pollution Control Revenue Refunding, 5.625% due 3/1/2015 (General Motors Corp. Project) | Baa1/BBB | 2,000,000 | 2,177,900 | |
| Ohio State Higher Educational Facility Revenue, 5.05% due 7/1/2037 put 7/1/16 (Kenyon College Project) | A2/A | 1,600,000 | 1,702,736 | |
| Reynoldsburg Health Care Facilities Revenue Bonds Series 1997, 5.70% due 10/20/2012 (Collateralized: GNMA) | Aaa/NR | 760,000 | 825,253 | |
| Oklahoma | -2.40% | |||
| Grady County Industrial Authority Correctional Facilities, 5.00% due 11/1/2004 (Insured: MBIA) | Aaa/AAA | 175,000 | 178,346 | |
| Oklahoma City Municipal Improvement Authority, 0% due 7/1/2008 (Insured: AMBAC) | Aaa/AAA | 1,020,000 | 916,245 | |
| Oklahoma City Municipal Water & Sewer Capital Appreciation Series C, 0% due 7/1/2006 (Insured: AMBAC) | Aaa/AAA | 500,000 | 481,205 | |
| Oklahoma City Municipal Water & Sewer Series C, 0% due 7/1/2011 (Insured: AMBAC) | Aaa/AAA | 1,125,000 | 875,408 | |
| Oklahoma City Municipal Water & Sewer Series C, 0% due 7/1/2013 (Insured: AMBAC) | Aaa/AAA | 1,485,000 | 1,038,876 | |
| Oklahoma Development Finance Authority Hospital Association Pooled Hospital A, 5.40% due 6/1/2013 (Insured: | Aaa/AAA | 825,000 | 923,002 | |
| AMBAC) | ||||
| Oklahoma Industrial Authority Revenue Refunding, 6.00% due 8/15/2010 (Integris Baptist Project; Insured: AMBAC) | Aaa/AAA | 750,000 | 876,510 | |
| Tulsa County Independent School District Combined Purpose, 4.50% due 8/1/2007 | Aa3/A+ | 2,800,000 | 3,032,764 | |
| Tulsa Industrial Development Authority Hospital Revenue, 6.10% due 2/15/2009 pre-refunded 2/15/2006 @ 100 (St | Aa3/AA | 1,485,000 | 1,607,735 | |
| John’s Medical Center Project) | ||||
| Tulsa Public Facilities Authority Solid Waste Revenue, 5.65% due 11/1/2006 (Ogden Martin Project; Insured: | Aaa/AAA | 500,000 | 547,345 | |
| AMBAC) | ||||
| Woodward Municipal Hospital Authority Revenue Series 1994, 8.25% due 11/1/2009 | NR/NR | 500,000 | 513,400 | |
| Oregon | -0.60% | |||
| Albany Hospital Facility Authority Gross Revenue & Refunding Series 1994, 7.00% due 10/1/2005 (Mennonite Home | NR/NR | 705,000 | 724,366 | |
| Project) | ||||
| Forest Grove Campus Improvement & Refunding Pacific University, 6.00% due 5/1/2015 (Insured: Radian) | NR/AA | 800,000 | 900,960 | |
| Oregon Economic Development Department of Revenue Series CLII, 7.70% due 12/1/2014 (Smokecraft Project; LOC: | Aa2/NR | 1,070,000 | 1,110,521 | |
| Seafirst Bank) | ||||
| Pennsylvania | -2.10% | |||
| Admiral Peary Area Vocational School, 5.25% due 2/1/2005 | NR/A | 380,000 | 381,269 | |
| Allegheny County Hospital Development, 7.00% due 8/1/2015 (ETM)* | NR/AAA | 500,000 | 637,555 | |
| Allegheny County Hospital Development Health Series B, 6.50% due 5/1/2012 (South Hills Health Systems Project) | Baa1/NR | 1,400,000 | 1,472,212 | |
| Carbon County Industrial Development Authority Refunding, 6.65% due 5/1/2010 (Panther Creek Partners Project) | NR/BBB- | 1,750,000 | 1,912,977 | |
| Lancaster County Capital Appreciation Series B, 0% due 5/1/2014 (Insured: FGIC) | Aaa/NR | 795,000 | 521,782 | |
| Lancaster County Capital Appreciation Series B, 0% due 11/1/2014 (Insured: FGIC) | Aaa/NR | 795,000 | 508,554 | |
| Lancaster County Capital Appreciation Series B, 0% due 5/1/2015 (Insured: FGIC) | Aaa/NR | 800,000 | 490,008 | |
| Lehigh County General Purpose Shepard Rehab. Hospital, 6.00% due 11/15/2007 (Insured: AMBAC) | Aaa/AAA | 785,000 | 893,134 | |
| McKeesport Area School District Series B, 0% due 10/1/2004 | NR/A | 800,000 | 794,048 | |
| Pennsylvania Higher Education University Series 14, 0% due 7/1/2020 (Insured: AMBAC) | Aaa/AAA | 2,032,839 | 615,015 | |
| Pennsylvania State Higher Educational Facility Allegheny Delaware Valley Obligation A, 5.60% due 11/15/2009 | Aaa/AAA | 500,000 | 553,820 | |
| (Insured: MBIA) | ||||
| Pennsylvania State Higher Educational Facility Allegheny Delaware Valley Obligation A, 5.60% due 11/15/2010 | Aaa/AAA | 480,000 | 530,290 | |
| (Insured: MBIA) | ||||
| Philadelphia Water & Sewer Revenue 10th Series, 7.35% due 9/1/2004 (ETM)* | Aaa/AAA | 365,000 | 374,589 | |
| Rhode Island | -1.30% | |||
| Providence Series C, 5.50% due 1/15/2011 (Insured: FGIC) | Aaa/AAA | 1,840,000 | 2,123,728 | |
| Rhode Island Health & Education Building Hospital Financing, 5.25% due 7/1/2015 (Memorial Hospital Project; | NR/A+ | 1,325,000 | 1,420,148 | |
| LOC: Fleet Bank) | ||||
| Rhode Island Health & Education Building Refunding, 6.00% due 8/1/2014 (Credit Support: FHA) | NR/AAA | 1,000,000 | 1,115,940 | |
| Rhode Island Health & Education Building Refunding Higher Education State University, 5.00% due 3/15/2014 | NR/AA | 1,065,000 | 1,145,461 | |
| (Insured: Radian) | ||||
| South Carolina | -0.70% | |||
| Darlington County Industrial Development, 6.00% due 4/1/2026 (Sonoco Products Co. Project) | A2/A- | 3,100,000 | 3,285,194 | |
| South Dakota | -0.20% | |||
| South Dakota Housing Development Authority Homeownership Series B, 4.85% due 5/1/2009 | Aa1/AAA | 1,000,000 | 1,083,210 | |
| Tennessee | -0.50% | |||
| Knox County Health, 4.90% due 6/1/2031 put 6/1/2011 (Collateralized: FNMA) | NR/AAA | 2,000,000 | 2,111,740 | |
| Texas | -16.80% | |||
| Austin Utility Systems Revenue Refunding Comb Series A, 5.75% due 11/15/2013 (Insured: MBIA) | Aaa/AAA | 500,000 | 509,240 | |
| Bexar County Health Facilities Development Corp., 6.125% due 7/1/2022 (Army Retirement Residence Project) | NR/BBB- | 1,250,000 | 1,332,988 | |
| Bexar County Housing Finance Corp., 5.50% due 1/1/2016 (Insured: MBIA) | Aaa/NR | 600,000 | 651,126 | |
| Bexar County Housing Finance Corp., 5.70% due 1/1/2021 (Insured: MBIA) | Aaa/NR | 1,035,000 | 1,110,928 | |
| Bexar County Housing Finance Corp., 6.50% due 12/1/2021 | A3/NR | 2,000,000 | 1,981,140 | |
| Bexar County Housing Finance Corp. Multi Family Housing, 5.40% due 8/1/2012(Dymaxion & Marrach Park Apts. A | Aaa/NR | 1,200,000 | 1,285,656 | |
| Project; Insured: MBIA) | ||||
| Bexar County Housing Finance Corp. Multi Family Housing, 5.95% due 8/1/2020(Dymaxion & Marrach Park Apts. A | Aaa/NR | 1,270,000 | 1,385,748 | |
| Project; Insured: MBIA) | ||||
| Bexar County Housing Finance Corp. Series A, 5.875% due 4/1/2014 (Honey Creek Apartments Project; Insured: | Aaa/NR | 975,000 | 1,046,662 | |
| MBIA) | ||||
| Bexar County Housing Finance Corp. Series A, 6.125% due 4/1/2020 (Honey Creek Apartments Project; Insured: | Aaa/NR | 800,000 | 847,392 | |
| MBIA) | ||||
| Birdville Independent School District Refunding, 0% due 2/15/2012 (Guaranty: PSF) | Aaa/AAA | 2,800,000 | 2,088,828 | |
| Carroll Independent School District Capital Appreciation Refunding, 0% due 2/15/2011 (Guaranty: PSF) | Aaa/AAA | 1,130,000 | 854,529 | |
| Coppell Independent School District Capital Appreciation Refunding, 0% due 8/15/2013 (Guaranty: PSF) | NR/AAA | 5,000,000 | 3,214,750 | |
| De Soto Independent School District Refunding, 5.125% due 8/15/2017 (Guaranty: PSF) | NR/AAA | 1,100,000 | 1,102,816 | |
| Duncanville Independent School District Capital Appreciation Refunding Series B, 0% due 2/15/2016 (Guaranty: | Aaa/AAA | 3,000,000 | 1,652,460 | |
| PSF) | ||||
| El Paso Independent School District Capital Appreciation Refunding, 0% due 8/15/2010 (Guaranty: PSF) | Aaa/AAA | 3,750,000 | 2,913,412 | |
| El Paso Independent School District Capital Appreciation Refunding, 0% due 8/15/2011 (Guaranty: PSF) | Aaa/AAA | 2,500,000 | 1,815,650 | |
| Ennis Independent School District Refunding, 0% due 8/15/2012 (Guaranty: PSF) | Aaa/NR | 2,460,000 | 1,753,144 | |
| Ennis Independent School District Refunding, 0% due 8/15/2013 (Guaranty: PSF) | Aaa/NR | 2,490,000 | 1,695,889 | |
| Ennis Independent School District Refunding, 0% due 8/15/2014 (Guaranty: PSF) | Aaa/NR | 2,525,000 | 1,602,819 | |
| Fort Worth Water & Sewer Revenue, 5.25% due 2/15/2009 | Aa2/AA | 1,000,000 | 1,124,160 | |
| Gulf Coast Center Revenue, 6.75% due 9/1/2020 (Mental Health Retardation Center Project) | NR/BBB+ | 1,375,000 | 1,486,760 | |
| Hays Consolidated Independent School District Capital Appreciation, 0% due 8/15/2013 (Guaranty: PSF) | Aaa/AAA | 6,245,000 | 4,179,341 | |
| Houston Water Conveyance System Contract Certificate of Participation Series F, 7.20% due 12/15/2004 (Insured: | Aaa/AAA | 880,000 | 916,678 | |
| AMBAC) | ||||
| Irving Hospital Authority Series B, 5.80% due 7/1/2009 (Irving Healthcare Systems Project; Insured: FSA) | Aaa/AAA | 470,000 | 493,002 | |
| Irving Waterworks & Sewer Revenue Refunding & Improvement, 5.375% due 8/15/2014 | Aa2/AA | 1,500,000 | 1,700,895 | |
| Leander Independent School District Unlimited Tax School Building & Refunding Series 1992, 0% due 8/15/2005 | Aaa/NR | 2,000,000 | 1,956,380 | |
| (Guaranty: PSF) | ||||
| Mesquite Independent School District Refunding, 0% due 8/15/2012 (Guaranty: PSF) | NR/AAA | 1,420,000 | 1,005,104 | |
| Midlothian Independent School District Capital Appreciation Refunding, 0% due 2/15/2012 (Guaranty: PSF) | Aaa/NR | 1,000,000 | 746,010 | |
| Midtown Redevelopment Authority Tax, 6.00% due 1/1/2012 (Insured: Radian) | Baa2/AA | 735,000 | 833,233 | |
| Midtown Redevelopment Authority Tax, 6.00% due 1/1/2013 (Insured: Radian) | Baa2/AA | 500,000 | 562,700 | |
| North Central Texas Health Facility Development, 5.50% due 4/1/2005 (Zale Lipshy University Hospital Project; | Aaa/AAA | 500,000 | 520,900 | |
| Insured: FSA) | ||||
| North Central Texas Health Facility Development Refunding, 5.50% due 5/15/2013 (Hospital Baylor Health Care | Aa3/AA- | 500,000 | 525,625 | |
| Systems Project) | ||||
| North Central Texas Health Facility Development Series B, 5.75% due 2/15/2015 (Insured: MBIA) | Aaa/AAA | 2,400,000 | 2,755,824 | |
| Pharr San Juan Alamo Independent Building, 5.75% due 2/1/2013 (Guaranty: PSF) | Aaa/AAA | 1,000,000 | 1,145,250 | |
| Sabine River Authority Texas Pollution Refunding Series A, 5.80% due 7/1/2022 (TXU Energy Co. Project) | Baa2/BBB | 1,000,000 | 1,032,670 | |
| Sam Rayburn Municipal Power Agency Refunding, 6.00% due 10/1/2016 | Baa2/BBB- | 3,000,000 | 3,264,120 | |
| Stafford Economic Development, 6.00% due 9/1/2017 (Insured: FGIC) | Aaa/AAA | 1,775,000 | 2,092,388 | |
| Tarrant County Health Facilities, 6.00% due 9/1/2004 (Harris Methodist Health Systems Project; Insured: AMBAC) | Aaa/AAA | 715,000 | 729,765 | |
| (ETM)* | ||||
| Tarrant County Health Facilities, 6.625% due 11/15/2020 (Adventist/Sunbelt) | A3/A | 3,500,000 | 3,915,695 | |
| Texarkana Health Facilities Hospital Refunding Series A, 5.75% due 10/1/2009 (Wadley Regional Medical Center | Aaa/AAA | 500,000 | 574,430 | |
| Project; Insured: MBIA) | ||||
| Texarkana Health Facilities Hospital Refunding Series A, 5.75% due 10/1/2011 (Insured: MBIA) | Aaa/AAA | 2,500,000 | 2,914,850 | |
| Texas State Capital Appreciation Refunding Superconducting Series C, 0% due 4/1/2004 (ETM)* | Aaa/AAA | 1,000,000 | 1,000,000 | |
| Texas State Turnpike Authority Central Turnpike Systems Bond Anticipation Notes Second Tier, 5.00% due 6/1/2007 | Aa3/AA | 1,000,000 | 1,093,420 | |
| Texas State Unrefunded Balance, 7.00% due 8/1/2020 (Water Development Board Project) | Aa1/AA | 2,420,000 | 2,464,746 | |
| Travis County Health Facilities Development Series A, 5.75% due 11/15/2010 (Ascension Health Project; Insured: | Aaa/AAA | 2,000,000 | 2,298,880 | |
| MBIA) | ||||
| Travis County Health Facilities Development Series A, 6.25% due 11/15/2014(Ascension Health Project; Insured: | Aaa/AAA | 3,000,000 | 3,594,270 | |
| MBIA) | ||||
| Upper Trinity Regional Water District Regional Treated Water Supply Systems Series A, 7.125% due 8/1/2008 | Aaa/AAA | 600,000 | 717,246 | |
| (Insured: FGIC) | ||||
| Waco Health Facilities Development Corp. Series A, 6.00% due 11/15/2015 pre-refunded 11/15/2009 (Ascension | Aa2/AAA | 870,000 | 1,033,047 | |
| Health) | ||||
| Waco Health Facilities Development Corp. Series A, 6.00% due 11/15/2016 pre-refunded 11/15/2009 (Ascension | Aa2/AAA | 1,050,000 | 1,246,780 | |
| Health) | ||||
| West Harris County Municipal Utility Refunding, 6.00% due 3/1/2017 (Insured: Radian) | NR/AA | 500,000 | 558,830 | |
| Utah | -1.10% | |||
| Salt Lake City Municipal Building Series B, 5.30% due 10/15/2012 (Insured: AMBAC) | Aaa/AAA | 1,085,000 | 1,221,157 | |
| Utah Board Regents Auxiliary Refunding Series A, 5.25% due 5/1/2013 | NR/AA | 595,000 | 668,363 | |
| Utah County Municipal Building Authority, 5.50% due 11/1/2016 (Insured: AMBAC) | Aaa/NR | 1,000,000 | 1,125,080 | |
| Utah Housing Finance Agency, 6.05% due 7/1/2016 (Credit Support: FHA) | NR/AAA | 585,000 | 620,393 | |
| Utah Housing Finance Agency Single Family Mortgage D-2 Class I, 5.85% due 7/1/2015 | Aa2/AA | 180,000 | 184,228 | |
| Utah Water Finance Agency Revenue Pooled Loan Financing Program Series A, 5.00% due 10/1/2012 (Insured: AMBAC) | Aaa/NR | 940,000 | 1,052,800 | |
| Virginia | -3.70% | |||
| Alexandria Industrial Development Authority, 5.90% due 10/1/2020 (Insured: AMBAC) | Aaa/AAA | 2,000,000 | 2,318,560 | |
| Alexandria Industrial Development Authority Institute For Defense Analyses Series A, 6.00% due 10/1/2014 | Aaa/AAA | 1,500,000 | 1,776,690 | |
| (Insured: AMBAC) | ||||
| Alexandria Industrial Development Authority Institute For Defense Analyses Series A, 6.00% due 10/1/2015 | Aaa/AAA | 1,590,000 | 1,881,367 | |
| (Insured: AMBAC) | ||||
| Arlington County Industrial Development, 6.30% due 7/1/2016 | NR/A | 500,000 | 541,315 | |
| Capital Region Airport Commission Refunding Series B, 8.125% due 7/1/2014 (Insured: AMBAC) | Aaa/AAA | 2,000,000 | 2,071,500 | |
| Fauquier County Industrial Development Authority, 5.50% due 10/1/2016 (Insured: Radian) | NR/AA | 1,000,000 | 1,111,500 | |
| Hampton Redevelopment Housing Authority Multi Family Housing Refunding Series 1994, 7.00% due 7/1/2024 put | Baa1/A-1 | 2,000,000 | 2,026,500 | |
| 7/1/2004 (Chase Hampton Apartments Project; LOC: Credit Suisse) | ||||
| Hanover County Industrial Development Authority Medical Facilities Revenue, 6.00% due 10/1/2021 (Insured: MBIA) | Aaa/AAA | 795,000 | 813,198 | |
| (ETM)* | ||||
| Norton Industrial Development Authority Hospital Refunding, 6.00% due 12/1/2014 (Norton Community Hospital | NR/A | 1,635,000 | 1,844,869 | |
| Project; Insured: ACA) | ||||
| Spotsylvania County Industrial Development, 6.00% due 9/1/2019 put 9/1/2008 (Walter Grinders Project; LOC: | NR/NR | 2,095,000 | 2,208,151 | |
| Deutsche Bank) | ||||
| Virginia College Building Authority, 5.55% due 11/1/2019 put 11/1/2004 @ 100 (University of Richmond Project) | Aa1/AA | 500,000 | 512,240 | |
| Washington | -6.20% | |||
| Benton County Public Utility District Refunding Series A, 5.625% due 11/1/2012 (Insured: FSA) | Aaa/AAA | 1,500,000 | 1,724,445 | |
| Energy Northwest Washington Series A, 5.60% due 7/1/2015 (Wind Project) | A3/A- | 1,000,000 | 1,060,620 | |
| Energy Northwest Washington Series B, 5.10% due 7/1/2009 (Wind Project) | A3/A- | 745,000 | 793,820 | |
| Grant County Public Utility District-2 Wanapum Hydro Electric Revenue Series C, 6.00% due 1/1/2006 (Insured: | Aaa/AAA | 285,000 | 306,959 | |
| AMBAC) | ||||
| Snohomish County Public Utility 001 Systems Notes, 5.00% due 12/1/2005 | A1/SP1+ | 500,000 | 530,225 | |
| Tacoma Electric Systems Revenue Series A, 5.50% due 1/1/2012 (Insured: FSA) | Aaa/AAA | 750,000 | 853,620 | |
| University of Washington Revenue Refunding, 5.25% due 8/15/2009 (University of Washington Medical Center | Aaa/AAA | 1,350,000 | 1,523,623 | |
| Project; Insured: MBIA) | ||||
| Vancouver Downtown Redevelopment Senior Series A, 5.50% due 1/1/2018 (Conference Center Project; Insured: ACA) | NR/A | 3,500,000 | 3,753,505 | |
| Washington Health Care Facilities, 5.50% due 12/1/2010 (Insured: MBIA) | Aaa/AAA | 2,690,000 | 3,062,162 | |
| Washington Health Care Facilities, 6.00% due 12/1/2014 (Insured: MBIA) | Aaa/AAA | 1,735,000 | 2,022,090 | |
| Washington Health Care Facilities, 6.00% due 12/1/2015 (Insured: MBIA) | Aaa/AAA | 1,945,000 | 2,249,412 | |
| Washington Health Care Facilities Refunding, 6.375% due 10/1/2010 (Insured: FGIC) | Aaa/AAA | 1,500,000 | 1,795,980 | |
| Washington Health Care Facilities Sea Mar Community Health Center, 5.60% due 1/1/2018 (LOC: U.S. Bancorp) | Aa3/NR | 1,025,000 | 1,103,115 | |
| Washington Nonprofit Housing, 5.60% due 7/1/2011 (Kline Galland Center Project; Insured: Radian) | NR/AA | 500,000 | 555,115 | |
| Washington Nonprofit Housing, 5.875% due 7/1/2019 (Kline Galland Center Project; Insured: Radian) | NR/AA | 1,000,000 | 1,102,650 | |
| Washington Public Power Supply Capital Appreciation Refunding Series B, 0% due 7/1/2011 | Aaa/AA- | 1,000,000 | 761,700 | |
| Washington Public Power Supply Refunding Series A, 5.00% due 7/1/2011 (Insured: FSA) | Aaa/AAA | 3,030,000 | 3,332,909 | |
| Washington Public Power Supply System, 0% due 7/1/2010 (Project 3) | Aaa/AA- | 960,000 | 771,898 | |
| Washington State Multi Family Mortgage Revenue, 6.30% due 1/1/2021 put 1/1/2011 @100 (LOC: US Bank N.A.) | NR/AA- | 1,000,000 | 1,122,240 | |
| West Virginia | -0.20% | |||
| Marshall County West Virginia Pollution Control, 5.90% due 4/1/2022 (Insured: MBIA) | Aaa/AAA | 1,000,000 | 1,015,260 | |
| Wisconsin | -0.70% | |||
| Bass Lake PCRB, 6.50% due 4/1/2005 (Johnson Timber Corp. Project; Guaranty: SBA) | NR/NR | 60,000 | 60,133 | |
| Wisconsin Health & Educational Facilities, 5.75% due 8/15/2020 (Eagle River Memorial Hospital Inc. Project; Insured: Radian) | NR/AA | 1,000,000 | 1,086,620 | |
| Wisconsin Housing & Economic Development Housing Series A, 5.875% due 11/1/2016 (Insured: AMBAC) | Aaa/AAA | 2,000,000 | 2,155,080 | |
| TOTAL INVESTMENTS (100%) (Cost $428,467,089) | $459,421,367 | |||
†Credit ratings are unaudited. Escrowed to maturity
(a) Bond in default, non income-producing security.
See notes to financial statements.
23
Index Comparisons
Thornburg Intermediate Municipal Fund
March 31, 2004
Compares performance of Thornburg Intermediate Municipal Fund, the Merrill Lynch Municipal Bond (7-12 year) Index, and the Consumer Price Index, for periods ending March 31, 2004. On March 31, 2004, the weighted average securities ratings of the Index and the Fund were AA and AA, respectively, and the weighted average portfolio maturities of the Index and the Fund were 9.5 years and 8.3 years, respectively. Class C shares became available on September 1, 1994. Past performance of the Index and the Fund may not be indicative of future performance. The performance data and graph do not reflect the deduction of taxes that a shareholder would pay on distributions or the redemption of fund shares.
Thornburg Intermediate Municipal Fund Class A Total Returns, Since July 31, 1991, versus Merrill Lynch 7-12 Year Municipal Index and Consumer Price Index (CPI)
Class A Shares
Average Annual Total Returns
(periods ending 3/31/04, at max. offering price)
| One year: | 2 | .24% | |||
| Five years: | 4 | .07% | |||
| Ten years: | 5 | .18% | |||
| Since inception (7/22/91): | 5 | .88% | |||
Thornburg Intermediate Municipal Fund Class C Total Returns, Since Inception, versus Merrill Lynch 7-12 Year Municipal Index and Consumer Price Index (CPI)
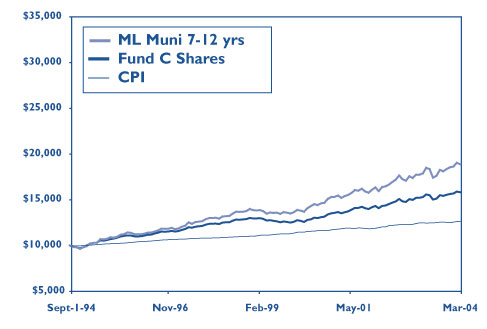
Class C Shares Average Annual Total Returns(periods ending 3/31/04)
| One year: | 3 | .51% | |||
| Five years: | 4 | .09% | |||
| Since inception (9/1/94): | 4 | .91% | |||
Maximum sales charge of the Fund’s Class A Shares is 2.00%. C shares include a 0.60% CDSC for the first year only.
Past performance is no guarantee of future results. Current returns may be either lower or higher than those shown. Share prices and returns will fluctuate and investors may experience a loss upon redemption. There is no guarantee that the Fund will meet its objectives. Shares in the Fund carry risks, including possible loss of principal. Carefully consider the Fund’s investment objectives, risks, sales charges, and expenses; this is found in the prospectus, which is available from your financial advisor or from www.thornburg.com. Read it carefully before you invest or send money. For month-end performance information, visit www.thornburg.com.
The Merrill Lynch 7-12 Year Municipal Bond Index represents a broad measure of market performance. It is a model portfolio of municipal obligations throughout the U.S., with an average maturity which ranges from seven to twelve years. The Consumer Price Index (“CPI”) measures prices of a fixed basket of goods bought by a typical consumer, including food, transportation, shelter, utilities, clothing, medical care, entertainment and other items. The CPI, published by the Bureau of Labor Statistics in the Department of Labor, is based at 100 in 1982 and is released monthly. It is widely used as a cost-of-living benchmark to adjust Social Security payments and other payment schedules, union contracts and tax brackets. Also known as the cost-of-living index. Unless otherwise noted, index returns reflect the reinvestment of income dividends and capital gains, if any, but do not reflect fees, brokerage commissions or other expenses of investing. Investors may not make direct investments into any index.
24
Thornburg Intermediate Municipal Fund
A shares
Outperformed Tax-Free Money Market Funds
(Unaudited)
Investors sometimes ask us to compare Thornburg Intermediate Municipal Fund to money market fund returns. These investments have certain differences, and investors in Thornburg Intermediate Municipal Fund took more risk than money market fund investors to earn their higher returns.
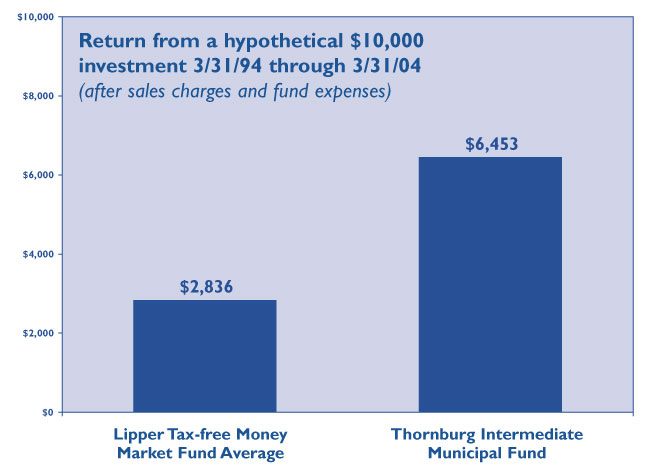
The chart above is for the Fund’s Class A Shares only. Class C and Class I Shares have different sales charges and expenses. See the inside front cover page for the 30-day SEC yield and the total returns at the maximum offering prices for one year, three years, five years, ten years, and since inception for each class of shares of the Fund.
Note 1: Future increases, if any, of any of these investments may bear no relationship to prior increases. Quotations for the money fund averages are based upon 30-day yield quotations for tax-exempt money funds as sourced from the “Lipper Tax-free Money Market Average” for the months covered by this analysis. The increase for the Class A Shares of Thornburg Intermediate Municipal Fund is based upon the dividends paid for the months covered by this analysis, the beginning offering price at $13.11 per share and the ending NAV at $13.60 per share. These investments returned the $10,000 initial investment in addition to the amounts shown above.
Note 2: This analysis does not take into account the effect, if any, caused by state and local income taxes. The portion of the increase, if any, of Thornburg Intermediate Municipal Fund representing appreciation of the share price is assumed to be taxed at a 15% federal tax rate. The average money market fund increases shown above may differ from the return of a particular money market fund. It is not possible to invest in this money fund average.
Note 3: Generally, money market funds seek to maintain an investment portfolio with an average maturity of 90 days or less. Thornburg Intermediate Municipal Fund invests in short-to-intermediate maturity municipal obligations. The net asset value of the money funds did not fluctuate. The net asset value of the Class A Shares of THIMX did vary from time to time, and will continue to vary in the future due to the effect of changes in interest rates on the value of the investments the Fund holds. The analysis assumes that the investor received the net asset value of the shares owned, plus accrued income, at time of sale. Redemptions are made at the then current net asset value, which may give you a gain or loss when you sell your shares.
Note 4: This analysis assumes that the dividends from each of these investment vehicles were reinvested and compounded monthly. Most money funds declare dividends daily and pay them monthly. Thornburg Intermediate Municipal Fund also declares dividends daily and pays them monthly.
25
Thornburg Intermediate Municipal Fund - I Shares
Investment Manager Thornburg Investment Management, Inc.
119 East Marcy Street
Santa Fe, New Mexico 87501
800.847.0200
Principal Underwriter Thornburg Securities Corporation
119 East Marcy Street
Santa Fe, New Mexico 87501
800.847.0200
This report is submitted for the general information of shareholders of the Fund. It is not authorized for distribution to prospective investors in the Fund unless preceded or accompanied by an effective prospectus. Carefully consider information in the prospectus regarding the Fund’s investment objectives and policies, risks, sales charges, expenses, experience of its management, marketability of shares, and other information. Performance data quoted represent past performance and do not guarantee future results.
www.thornburg.com
Thornburg Intermediate Municipal Fund - I Shares
Semi-Annual Report March 31, 2004
Thornburg Intermediate Municipal Fund ALL DATA AS OF 3/31/04
| FUND FACTS: Thornburg Intermediate Municipal Fund | |
| -- | I Shares |
| Annualized Distribution Rate (at NAV) | 4.05% |
| SEC Yield | 2.91% |
| NAV | $ 13.58 |
| Maximum Offering Price | $ 13.58 |
| TOTAL RETURNS: Annual Average | |
| One Year | 4.69% |
| Three Years | 5.79% |
| Five Years | 4.81% |
| Since Inception | 5.53% |
| Inception Date | 7/5/1996 |
| There is no up front sales charge for this class of shares. Past performance is no guarantee of future results. Current returns may be either lower or higher than those shown. Share prices and returns will fluctuate and investors may experience a loss upon redemption. There is no guarantee that the Fund will meet its objectives. Shares in the Fund carry risks, including possible loss of principal. |
| Carefully consider the Fund’s investment objectives, risks, sales charges, and expenses; this information is found in the prospectus, which is available from your financial advisor or from www.thornburg.com. Read it carefully before you invest or send money. For month-end performance information, visit www.thornburg.com. |
| The SEC Yield is computed in accordance with SEC standards measuring the net investment income per share over a specified 30-day period, expressed as a percentage of the maximum offering price of the Fund’s shares at the end of the period. |
| The distribution rate is calculated by taking the sum of the month’s total distribution factors and dividing this sum by a 30-day period and annualizing to a 360-day year. The value is then divided by the ending NAV to arrive at the annualized distribution yield. The yield is calculated on a periodic basis and is subject to change depending on the Fund’s NAV and current distributions. |
1
Thornburg Intermediate Municipal Fund
Letter to shareholders
April 16, 2004
Dear Fellow Shareholder:
I am pleased to present the semi-annual report for your Thornburg Intermediate Municipal Fund. The net asset value of the I shares increased by 4 cents to $13.58 during the six month period ending March 31, 2004. If you were with us for the entire period, you received dividends of 27.8 cents per share. If you reinvested dividends, you received 28.1 cents per share.
Interest rates on intermediate municipal bonds fell slightly over the six-month period ending March 31, 2004. For example, the interest rate on a ten-year AAA rated municipal bond dropped from 3.67% to 3.49% from the end of September to the end of March. Lower interest rates helped the Fund’s net asset value appreciate somewhat to produce a total return of 2.37% over the six-month period. The Merrill Lynch 7-12 Year Municipal Bond Index had a total return of 3.33%, and the average intermediate municipal bond fund tracked by Lipper returned 2.08% over the same time period. The Index has a significantly longer duration than the Fund (7.3 versus 4.5), causing it to perform better than the Fund in falling interest rate environments such as the 6 months ending March 31, 2004.
Municipal bond yields reached a low point on March 9th and have been trending upwards since then. For example, the yield on a high quality 7-year municipal bond is up 0.58% to 3.25% as of April 13, 2004. Yields are up because economic growth has finally led to employment growth. That point was made abundantly clear with the announcement of 308,000 new jobs on April 2nd. Whether interest rates will keep climbing depends largely upon what happens to inflation.
We believe that consumer price inflation has probably bottomed around the 1.2% level. Many commodity prices have doubled over the last year. Price pressures abound in metals, petroleum products, chemicals, paper, and even in soybeans! Transportation costs are going up rapidly. Unit labor costs have been subdued because of productivity gains, but past productivity gains may prove very hard to replicate. All these factors should lead to somewhat higher inflation over the next few years.
Higher inflation, coupled with rising bond issuance will likely give rise to higher interest rates on bonds. For now, a 1% Fed Funds target seems to be keeping a cap on how high bond yields can go, but the Federal Reserve will probably have to start moving to a less accommodative policy before the end of this year. If that happens, we would expect bond yields to rise above current trading ranges.
We have prepared for this environment by keeping the duration of your portfolio to the short end of its typical range. We have also generally favored bonds that we believe will be less price sensitive to interest rate changes. We have not deviated from our long-held strategy of laddering short and intermediate bonds because we believe that laddering is the most effective way to deal with changing interest rates in an uncertain world.
Your Thornburg Intermediate Municipal Fund is a laddered portfolio of over 330 municipal obligations from 45 states. Today, your Fund’s weighted average maturity is 8.3 years. We always keep it below 10 years. We ladder the maturity dates of the bonds in your portfolio so that some of the bonds are scheduled to mature during each of the coming years. Laddering intermediate bonds accomplishes two goals. First, the diverse bond maturities contained in a ladder defuse interest-rate risk and dampen the fund’s price volatility. Second, laddering gives your Fund a steady cash flow stream from maturing bonds to reinvest toward the top of the ladder where yields are
2
Thornburg Intermediate Municipal Fund
Letter to shareholders, Continued
typically higher. The chart at right describes the percentages of your Fund’s bond portfolio maturing in each of the coming years.
| % of portfolio | Cumulative % |
| maturing within | maturing by end of |
| 2 years = 12% | year 2 = 12% |
| 2 to 4 years = 8% | year 6 = 32% |
| 6 to 8 years = 13% | year 8 = 45% |
| 8 to 10 years = 14% | year 10 = 59% |
| 10 to 12 years = 15% | year 12 = 74% |
| 12 to 14 years = 12% | year 14 = 86% |
| 14 to 16 years = 5% | year 16 = 91% |
| 16 to 18 years = 6% | year 18 = 97% |
| Over 18 years = 3% | Over 18 years = 100% |
Percentages can and do vary. Data as of 3/31/04
Local issuers dependent upon property taxes have benefited from a strong real estate market. They make up a large percentage of your Fund, and have generally been stable to improving credits. State credit quality has begun to stabilize after two very difficult years. We have kept your Fund’s exposure to the states relatively low, but are beginning to see signs of improvement in certain states that have controlled spending and are now experiencing a revenue rebound. Your Fund has also found attractive opportunities in selected utility, health care, and housing bonds. Currently, 89% of the portfolio is rated A or above and 53% is rated AAA by Moody’s or Standard and Poor’s.
Over the years, our practice of laddering a diversified portfolio of short and intermediate maturity municipal bonds has allowed your Fund to perform consistently well in varying interest rate environments. Thank you for investing in Thornburg Intermediate Municipal Fund.
Sincerely,
George Strickland
Portfolio Manager
The Merrill Lynch 7-12 Year Municipal Bond Index represents a broad measure of market performance. It is a model portfolio of municipal obligations throughout the U.S., with an average maturity which ranges from seven to twelve years.
Unless otherwise noted, index returns reflect the reinvestment of income dividends and capital gains, if any, but do not reflect fees, brokerage commissions or other expenses of investing. Investors may not make direct investments into any index.
3
| Statement of assets and liabilities | |||||
|---|---|---|---|---|---|
| Thornburg Intermediate Municipal Fund | March 31, 2004 | ||||
| (Unaudited) | |||||
| ASSETS | |||||
| Investments at value (cost $428,467,089) | $ | 459,421,367 | |||
| Cash | 103,942 | ||||
| Receivable for investments sold | 728,095 | ||||
| Receivable for fund shares sold | 832,946 | ||||
| Interest receivable | 6,265,661 | ||||
| Prepaid expenses and other assets | 47,972 | ||||
| Total Assets | 467,399,983 | ||||
| LIABILITIES | |||||
| Payable for fund shares redeemed | 1,369,768 | ||||
| Accounts payable and accrued expenses | 184,856 | ||||
| Payable to investment advisor (Note 3) | 226,259 | ||||
| Dividends payable | 1,411,577 | ||||
| Total Liabilities | 3,192,460 | ||||
| NET ASSETS | $ | 464,207,523 | |||
| NET ASSETS CONSIST OF: | |||||
| Net unrealized appreciation (depreciation) on investments | $ | 30,954,278 | |||
| Accumulated net realized gain (loss) | (13,087,263 | ) | |||
| Net capital paid in on shares of beneficial interest | 446,340,508 | ||||
| $ | 464,207,523 | ||||
| NET ASSET VALUE: | |||||
| Class A Shares: | |||||
| Net asset value and redemption price per share | |||||
| ($380,305,167 applicable to 27,962,562 shares of beneficial | |||||
| interest outstanding - Note 4) | $ | 13.60 | |||
| Maximum sales charge, 2.00% of offering price | 0.28 | ||||
| Maximum Offering Price Per Share | $ | 13.88 | |||
| Class C Shares: | |||||
| Net asset value and offering price per share * | |||||
| ($62,890,320 applicable to 4,618,379 shares of beneficial | |||||
| interest outstanding - Note 4) | $ | 13.62 | |||
| Class I Shares: | |||||
| Net asset value, offering and redemption price per share | |||||
| ($21,012,036 applicable to 1,547,207 shares of beneficial | |||||
| interest outstanding - Note 4) | $ | 13.58 | |||
| *Redemption price per share is equal to net asset value less any applicable contingent deferred sales charge | |||||
| See notes to financial statements | |||||
4
| Statement of operations | |||||
|---|---|---|---|---|---|
| Thornburg Intermediate Municipal Fund | Six Months Ended March 31, 2004 | ||||
| (Unaudited) | |||||
| INVESTMENT INCOME: | |||||
| Interest income (net of premium amortized of $1,080,999) | $ | 11,062,846 | |||
| EXPENSES: | |||||
| Investment advisory fees (Note 3) | 1,152,594 | ||||
| Administration fees (Note 3) | |||||
| Class A Shares | 239,249 | ||||
| Class C Shares | 37,948 | ||||
| Class I Shares | 4,942 | ||||
| Distribution and service fees (Note 3) | |||||
| Class A Shares | 409,649 | ||||
| Class C Shares | 313,288 | ||||
| Transfer agent fees | |||||
| Class A Shares | 79,010 | ||||
| Class C Shares | 18,305 | ||||
| Class I Shares | 8,844 | ||||
| Registration and filing fees | |||||
| Class A Shares | 6,833 | ||||
| Class C Shares | 4,776 | ||||
| Class I Shares | 5,404 | ||||
| Custodian fees (Note 3) | 104,882 | ||||
| Professional fees | 25,175 | ||||
| Accounting fees | 19,965 | ||||
| Trustee fees | 5,480 | ||||
| Other expenses | 40,841 | ||||
| Total Expenses | 2,477,185 | ||||
| Less: | |||||
| Expenses reimbursed by investment advisor (Note 3) | (59,383 | ) | |||
| Distribution and service fees waived (Note 3) | (125,315 | ) | |||
| Fees paid indirectly (Note 3) | (1,007 | ) | |||
| Net Expenses | 2,291,480 | ||||
| Net Investment Income | 8,771,366 | ||||
| REALIZED AND UNREALIZED GAIN (LOSS) | |||||
| Net realized gain (loss) on investments | (1,115,492 | ) | |||
| Increase (Decrease) in unrealized appreciation of investments | 2,330,507 | ||||
| Net Realized and Unrealized | |||||
| Gain (Loss) on Investments | 1,215,015 | ||||
| Net Increase (Decrease) in Net Assets Resulting | |||||
| From Operations | $ | 9,986,381 | |||
| See notes to financial statements | |||||
5
| Statements of changes in net assets | ||||||||
|---|---|---|---|---|---|---|---|---|
| Thornburg Intermediate Municipal Fund | ||||||||
| Six Months Ended March 31, 2004 | Year Ended September 30, 2003 | |||||||
| INCREASE (DECREASE) IN NET ASSETS FROM: | ||||||||
| OPERATIONS: | ||||||||
| Net investment income | $ | 8,771,366 | $ | 18,090,689 | ||||
| Net realized gain (loss) on investments sold | (1,115,492 | ) | (4,597,883 | ) | ||||
| Increase (Decrease) in unrealized appreciation of investments | 2,330,507 | 581,701 | ||||||
| Net Increase (Decrease) in Net Assets | ||||||||
| Resulting from Operations | 9,986,381 | 14,074,507 | ||||||
| DIVIDENDS TO SHAREHOLDERS: | ||||||||
| From net investment income | ||||||||
| Class A Shares | (7,294,669 | ) | (15,480,099 | ) | ||||
| Class C Shares | (1,071,274 | ) | (1,849,255 | ) | ||||
| Class I Shares | (405,423 | ) | (761,335 | ) | ||||
| FUND SHARE TRANSACTIONS (Note 4): | ||||||||
| Class A Shares | (10,786,581 | ) | (20,552,567 | ) | ||||
| Class C Shares | 2,037,279 | 13,877,646 | ||||||
| Class I Shares | 1,622,874 | 1,174,895 | ||||||
| Net Increase (Decrease) in Net Assets | (5,911,413 | ) | (9,516,208 | ) | ||||
| NET ASSETS: | ||||||||
| Beginning period | 470,118,936 | 479,635,144 | ||||||
| End of period | $ | 464,207,523 | $ | 470,118,936 | ||||
| See notes to financial statements | ||||||||
6
Thornburg Intermediate Municipal Fund
Notes to financial statements
NOTE 1 – ORGANIZATION Thornburg Intermediate Municipal Fund (the “Fund”) is a diversified series of Thornburg Investment Trust (the “Trust”). The Trust is organized as a Massachusetts business trust under a Declaration of Trust dated June 3, 1987 and is registered as a diversified, open-end management investment company under the Investment Company Act of 1940, as amended. The Trust is currently issuing nine series of shares of beneficial interest in addition to those of the Fund: Thornburg Florida Intermediate Municipal Fund, Thornburg New York Intermediate Fund, Thornburg New Mexico Intermediate Municipal Fund, Thornburg Limited Term U.S. Government Fund, Thornburg Limited Term Income Fund, Thornburg Value Fund, Thornburg International Value Fund, Thornburg Core Growth Fund, and Thornburg Investment Income Builder Fund. Each series is considered to be a separate entity for financial reporting and tax purposes and bears expenses directly attributable to it. The Fund’s investment objective is to obtain as high a level of current income exempt from Federal income taxes as is consistent with the preservation of capital.
The Fund currently offers three classes of shares of beneficial interest, Class A, Class C and Institutional Class (Class I) shares. Each class of shares of the Fund represents an interest in the same portfolio of investments of the Fund, except that (i) Class A shares are sold subject to a front-end sales charge collected at the time the shares are purchased and bear a service fee, (ii) Class C shares are sold at net asset value without a sales charge at the time of purchase, but are subject to a contingent deferred sales charge upon redemption within one year, and bear a service fee and a distribution fee, (iii) Class I shares are sold at net asset value without a sales charge at the time of purchase, and (iv) the respective classes have different reinvestment privileges. Additionally, the Fund may allocate among its classes certain expenses, to the extent allowable to specific classes, including transfer agent fees, government registration fees, certain printing and postage costs, and administrative and legal expenses. Currently, class specific expenses of the Fund are limited to service and distribution fees, administration fees, and certain registration and transfer agent expenses.
NOTE 2 – SIGNIFICANT ACCOUNTING POLICIES Significant accounting policies of the Fund are as follows:
Valuation of Investments: In determining net asset value, the Fund utilizes an independent pricing service approved by the Trustees. Debt investment securities have a primary market over the counter and are valued on the basis of valu
ations furnished by the pricing service. The pricing service values portfolio securities at quoted bid prices, normally at 4:00 pm EST or the yield equivalents when quotations are not readily available. Securities for which quotations are not readily available are valued at fair value as determined by the pricing service using methods which include consideration of yields or prices of municipal obligations of comparable quality, type of issue, coupon, maturity, and rating; indications as to value from dealers and general market conditions. The valuation procedures used by the pricing service and the portfolio valuations received by the Fund are reviewed by the officers of the Trust under the general supervision of the Trustees. Short-term obligations having remaining maturities of 60 days or less are valued at amortized cost, which approximates market value.
Federal Income Taxes: It is the policy of the Fund to comply with the provisions of the Internal Revenue Code applicable to “regulated investment companies” and to distribute all of its taxable (if any) and tax exempt income to its shareholders. Therefore, no provision for Federal income tax is required.
When-Issued and Delayed Delivery Transactions: The Fund may engage in when-issued or delayed delivery transactions. To the extent the Fund engages in such transactions, it will do so for the purpose of acquiring portfolio securities consistent with its investment objectives and not for the purpose of investment leverage or to speculate on interest rate changes. At the time the Fund makes a commitment to purchase a security on a when-issued basis, it will record the transaction and reflect the value in determining its net asset value. When effecting such transactions, assets of the Fund of an amount sufficient to make payment for the portfolio securities to be purchased will be segregated on the Fund’s records at the trade date. Securities purchased on a when-issued or delayed delivery basis do not earn interest until the settlement date.
Dividends: Net investment income of the Fund is declared daily as a dividend on shares for which the Fund has received payment. Dividends are paid monthly and are reinvested in additional shares of the Fund at net asset value per share at the close of business on the dividend payment date, or at the shareholder’s option, paid in cash. Net capital gains, to the extent available, will be distributed at least annually.
General: Securities transactions are accounted for on a trade date basis. Interest income is accrued as earned. Premiums and discounts on securities purchased are amortized to call
7
Thornburg Intermediate Municipal Fund
Notes to financial statements, continued
March 31, 2004
dates or maturity dates of the respective securities. Realized gains and losses from the sale of securities are recorded on an identified cost basis. Net investment income, other than class specific expenses, and realized and unrealized gains and losses, are allocated daily to each class of shares based upon the relative net asset value of outstanding shares (or the value of the dividend-eligible shares, as appropriate) of each class of shares at the beginning of the day (after adjusting for the current share activity of the respective class). Expenses common to all funds are allocated among the funds comprising the Trust based upon their relative net asset values or other appropriate allocation methods.
Guarantees and Indemnifications: Under the Trust’s organizational documents, its officers and trustees are indemnified against certain liability arising out of the performance of their duties to the Fund. Additionally, in the normal course of business the Trust enters into contracts with service providers that contain general indemnification clauses. The Trust’s maximum exposure under these arrangements is unknown. However, based on experience, the Trust expects the risk of loss to be remote.
Use of Estimates: The preparation of financial statements, in conformity with generally accepted accounting principles, requires management to make estimates and assumptions that affect the reported amounts of assets and liabilities and the disclosure of contingent assets and liabilities at the date of the financial statements and the reported amounts of increases and decreases in net assets from operations during the reporting period. Actual results could differ from those estimates.
NOTE 3 — INVESTMENT ADVISORY FEE AND OTHER TRANSACTIONS WITH AFFILIATES
Pursuant to an investment advisory agreement, Thornburg Investment Management, Inc. (the “Advisor”) serves as the investment advisor and performs services for which the fees are payable at the end of each month. For the period ended March 31, 2004, these fees were payable at annual rates ranging from .50 of 1% to .275 of 1% of the average daily net assets of the Fund. The Fund also has an administrative services agreement with the Advisor, whereby the Advisor will perform certain administrative services for the shareholders of each class of the Fund’s shares, and for which fees will be payable at an annual rate of up to .125 of 1% of the average daily net assets attributable to each class of shares. For the period ended March 31, 2004, the Advisor voluntarily reimbursed certain class specific expenses and administrative fees of $48,634 for Class C shares, and $10,749 for Class I shares.
The Fund has an underwriting agreement with Thornburg Securities Corporation (the “Distributor”), which acts as the Distributor of the Fund shares. For the period ended March 31, 2004, the Distributor has advised the Fund that it earned net commissions aggregating $1,856 from the sale of Class A shares and collected contingent deferred sales charges aggregating $3,935 from redemptions of Class C shares of the Fund.
Pursuant to a service plan, under Rule 12b-1 of the Investment Company Act of 1940, the Fund may reimburse to the Advisor an amount not to exceed .25 of 1% per annum of the average daily net assets attributable to each class of shares of the Fund for payments made by the Advisor to securities dealers and other financial institutions to obtain various shareholder related services. The Advisor may pay out of its own resources additional expenses for distribution of the Fund’s shares.
The Fund has also adopted a distribution plan pursuant to Rule 12b-1, applicable only to the Fund’s Class C shares under which the Fund compensates the Distributor for services in promoting the sale of Class C shares of the Fund at an annual rate of up to .75% of the average daily net assets attributable to Class C shares. Total fees incurred by each class of shares of the Fund under their respective Service and Distribution Plans for the period ended March 31, 2004, are set forth in the statement of operations. Distribution fees in the amount of $125,315 were waived for Class C shares.
The Fund has an agreement with the custodian bank to indirectly pay a portion of the custodian’s fees through credits earned by the Fund’s cash on deposit with the bank. This deposit agreement is an alternative to overnight investments. Custodial fees have been adjusted to reflect amounts that would have been paid without this agreement, with a corresponding adjustment reflected as fees paid indirectly in the statement of operations. For the period ended March 31, 2004 fees paid indirectly were $1,007.
Certain officers and trustees of the Trust are also officers and/or directors of the Advisor and Distributor. The compensation of unaffiliated trustees is borne by the Trust.
8
Thornburg Intermediate Municipal Fund
Notes to financial statements, continued
March 31, 2004
NOTE 4 — SHARES OF BENEFICIAL INTEREST
At March 31, 2004, there were an unlimited number of shares of beneficial interest authorized. Transactions in shares of beneficial interest were as follows:
| Period Ended March 31, 2004 | Year Ended September 30, 2003 | |||||||||||||
|---|---|---|---|---|---|---|---|---|---|---|---|---|---|---|
| Shares | Amount | Shares | Amount | |||||||||||
| Class A Shares | ||||||||||||||
| Shares sold | 2,460,994 | $ | 33,366,406 | 6,705,141 | $ | 90,330,472 | ||||||||
| Shares issued to shareholders in | ||||||||||||||
| reinvestment of dividends | 263,211 | 3,566,220 | 649,800 | 8,760,445 | ||||||||||
| Shares repurchased | (3,520,201 | ) | (47,719,207 | ) | (8,890,248 | ) | (119,643,484 | ) | ||||||
| Net Increase (Decrease) | (795,996 | ) | $ | (10,786,581 | ) | (1,535,307 | ) | $ | (20,552,567 | ) | ||||
| Class C Shares | ||||||||||||||
| Shares sold | 513,092 | $ | 6,989,703 | 1,632,604 | $ | 22,060,706 | ||||||||
| Shares issued to shareholders in | ||||||||||||||
| reinvestment of dividends | 46,841 | 635,492 | 102,429 | 1,382,647 | ||||||||||
| Shares repurchased | (411,637 | ) | (5,587,916 | ) | (709,799 | ) | (9,565,707 | ) | ||||||
| Net Increase (Decrease) | 148,296 | $ | 2,037,279 | 1,025,234 | $ | 13,877,646 | ||||||||
| Class I Shares | ||||||||||||||
| Shares sold | 404,619 | $ | 5,474,854 | 807,931 | $ | 10,899,236 | ||||||||
| Shares issued to shareholders in | ||||||||||||||
| reinvestment of dividends | 18,133 | 245,413 | 39,457 | 531,139 | ||||||||||
| Shares repurchased | (302,977 | ) | (4,097,393 | ) | (762,688 | ) | (10,255,480 | ) | ||||||
| Net Increase (Decrease) | 119,775 | $ | 1,622,874 | 84,700 | $ | 1,174,895 | ||||||||
NOTE 5 – SECURITIES TRANSACTIONS
For the period ended March 31, 2004, the Fund had purchase and sale transactions (excluding short-term securities) of $30,219,309 and $31,994,650, respectively.
NOTE 6 – INCOME TAXES
At March 31, 2004, information on the tax components of capital is as follows:
| Cost of investments for tax purpose | $ | 428,467,089 | |||
| Gross unrealized appreciation on a tax basis | $ | 31,213,349 | |||
| Gross unrealized depreciation on a tax basis | (259,071 | ) | |||
| Net unrealized appreciation | |||||
| (depreciation) on investments (tax basis) | $ | 30,954,278 | |||
At March 31, 2004, the Fund had tax basis capital losses, which may be carried over to offset future capital gains. Such losses expire as follows:
Capital loss carryovers expiring in:
| 2004 | $ | 2,201,912 | |||
| 2005 | 200,249 | ||||
| 2006 | 27,737 | ||||
| 2007 | 6,140 | ||||
| 2008 | 2,563,342 | ||||
| 2009 | 2,374,508 | ||||
| 2011 | 11,597 | ||||
| -- | $ | 7,385,485 | |||
Unutilized tax basis capital losses may be carried forward to offset realized gains in future years. To the extent such carry forwards are used, capital gain distributions may be reduced to the extent provided by regulations.
9
March 31, 2004
| Financial highlights | ||||||
|---|---|---|---|---|---|---|
| Thornburg Intermediate Municipal Fund | ||||||
| Six Months Ended | Year Ended September 30, | |||||
| March 31, 2004 | 2003 | 2002 | 2001 | 2000 | 1999 | |
| Class I Shares: | ||||||
| Per Share Performance | ||||||
| (for a share outstanding throughout the period) | ||||||
| Net asset value, beginning of period | $ 13.54 | $ 13.65 | $ 13.26 | $ 12.76 | $ 12.98 | $ 13.74 |
| Income from investment operations: | ||||||
| Net investment income | 0.28 | 0.57 | 0.61 | 0.65 | 0.65 | 0.66 |
| Net realized and unrealized | ||||||
| gain (loss) on investments | 0.04 | (0.11) | 0.39 | 0.50 | (0.22) | (0.76) |
| Total from investment operations | 0.32 | 0.46 | 1.00 | 1.15 | 0.43 | (0.10) |
| Less dividends from: | ||||||
| Net investment income | (0.28) | (0.57) | (0.61) | (0.65) | (0.65) | (0.66) |
| Change in net asset value | 0.04 | (0.11) | 0.39 | 0.50 | (0.22) | (0.76) |
| Net asset value, end of period | $ 13.58 | $ 13.54 | $ 13.65 | $ 13.26 | $ 12.76 | $ 12.98 |
| Total return (a) | 2.37% | 3.49% | 7.75% | 9.23% | 3.45% | (0.79)% |
| Ratios/Supplemental Data | ||||||
| Ratios to average net assets: | ||||||
| Net investment income | 4.10% (b) | 4.23% | 4.57% | 4.99% | 5.10% | 4.89% |
| Expenses, after expense reductions | 0.67% (b) | 0.62% | 0.58% | 0.55% | 0.68% | 0.69% |
| Expenses, after expense reductions | ||||||
| and net of custody credits | 0.67% (b) | 0.62% | 0.58% | -- | -- | -- |
| Expenses, before expense reductions | 0.78% (b) | 0.80% | 0.79% | 0.79% | 0.80% | 0.79% |
| Portfolio turnover rate | 6.72% | 15.13% | 16.36% | 18.24% | 21.97% | 23.17% |
| Net assets at end of period (000) | $ 21,012 | $ 19,333 | $ 18,330 | $ 17,258 | $ 17,563 | $ 18,772 |
(a) Not annualized for periods less than one year.
(b) Annualized.
10
| Schedule of Investments | ||||
|---|---|---|---|---|
| Thornburg Intermediate Municipal Fund | March 31, 2004 | |||
| CUSIPS: CLASS A - 885-215-202, CLASS C - 885-215-780, CLASS I - 885-215-673 NASDAQ SYMBOLS: CLASS A - THIMX, CLASS C - THMCX, CLASS I - THMIX | ||||
| Issuer-Description | Credit Rating† Moody’s/S&P | Principal Amount | Value | |
| Alabama | -1.10% | |||
| Alabama Docks Revenue, 6.00% due 10/1/2008 (Insured: MBIA) | Aaa/AAA | 800,000 | $ 926,592 | |
| East Alabama Health Care Authority Tax Anticipation Series A, 4.00% due 9/1/2006 (Insured: MBIA) | Aaa/AAA | 1,515,000 | 1,600,689 | |
| Huntsville Series A, 6.25% due 2/1/2006 | Aa2/AA | 505,000 | 529,866 | |
| Lauderdale County & Florence Health Group Series A, 5.75% due 7/1/2013 (Insured: MBIA) | Aaa/AAA | 1,600,000 | 1,818,576 | |
| Alaska | -0.40% | |||
| Anchorage Alaska, 5.25% due 10/1/2008 pre-refunded 10/1/2005 (Insured: FGIC) | Aaa/AAA | 515,000 | 545,679 | |
| Anchorage Alaska, 5.25% due 10/1/2008 (Insured: FGIC) | Aaa/AAA | 485,000 | 511,505 | |
| Anchorage School Refunding, 6.00% due 10/1/2012 (Insured: FGIC) | Aaa/AAA | 500,000 | 599,560 | |
| Arizona | -1.90% | |||
| Maricopa County Industrial Development Capital Appreciation Series B, 4.80% due 12/1/2031 put 12/1/2004 (Waste | NR/BBB | 4,580,000 | 4,665,921 | |
| Management Inc. Project) | ||||
| Pima County Industrial Development Authority Series C, 6.70% due 7/1/2021 (Arizona Charter Schools Project) | Baa3/NR | 2,715,000 | 2,804,160 | |
| Tucson General Obligation Series D, 9.75% due 7/1/2012 (ETM)* | Aa2/AA | 400,000 | 581,244 | |
| Tucson General Obligation Series D, 9.75% due 7/1/2013 (ETM)* | Aa2/AA | 500,000 | 743,160 | |
| Arkansas | -0.90% | |||
| Conway Electric Revenue Refunding, 2.00% due 8/1/2004 | A2/NR | 500,000 | 501,255 | |
| Jefferson County Hospital Revenue Refunding & Improvement, 5.75% due 6/1/2012 (Regional Medical Center Project) | NR/A | 1,135,000 | 1,279,701 | |
| Jefferson County Hospital Revenue Refunding & Improvement, 5.75% due 6/1/2013 (Regional Medical Center Project) | NR/A | 1,200,000 | 1,342,260 | |
| Little Rock Arkansas Capital Improvement, 4.00% due 4/1/2005 (Insured: FSA) | Aaa/AAA | 1,000,000 | 1,028,560 | |
| California | -5.40% | |||
| California Department of Water Resources Power Series A, 5.75% due 5/1/2017 | A3/BBB+ | 3,000,000 | 3,354,750 | |
| California HFA Revenue Series 1985-B, 9.875% due 2/1/2017 | Aa2/AA- | 675,000 | 730,181 | |
| California Housing Finance Agency Revenue Multi Family Housing Series D, 1.15% due 2/1/2031 put 4/1/2004 (daily | VMIG1/A1+ | 1,000,000 | 1,000,000 | |
| demand notes) | ||||
| California State Department of Water Resources Series B 2, 1.15% due 5/1/2022 put 4/1/2004 (daily demand notes) | VMIG1/A1+ | 900,000 | 900,000 | |
| California State Series A-3, 1.10% due 5/1/2033 put 4/1/2004 (daily demand notes) | VMIG1/A1+ | 500,000 | 500,000 | |
| California Statewide Community Development Authority Certificate of Participation, 5.50% due 10/1/2007 | Aaa/AAA | 4,500,000 | 5,075,370 | |
| (Unihealth America Project; Insured: AMBAC) (ETM)* | ||||
| Camino Hospital District Revenue Series A, 6.25% due 8/15/2017 (ETM)* | Aaa/AAA | 1,000,000 | 1,178,440 | |
| Escondido Joint Powers Financing Authority Lease Revenue, 0% due 9/1/2007 (Center for the Arts Project; | Aaa/AAA | 1,740,000 | 1,540,161 | |
| Insured: AMBAC) | ||||
| Golden West Schools Financing Authority Capital Appreciation, 0% due 8/1/2018 (Insured: MBIA) | Aaa/AAA | 2,140,000 | 1,004,837 | |
| Irwindale Community Redevelopment Agency, 6.60% due 8/1/2018 pre-refunded 8/1/2005 | Baa3/NR | 500,000 | 544,060 | |
| Los Angeles Regional Airport Lease Refunding, 5.25% due 1/1/2009 (Facilities Laxfuel Corp. LA International | Aaa/AAA | 1,590,000 | 1,736,169 | |
| Project) | ||||
| Orange County Apartment Development Revenue, 1.06% due 11/1/2009 put 4/8/2004 (Laguna Summit Apartments | VMIG1/NR | 300,000 | 300,000 | |
| Project; LOC: Bank of America) (weekly demand notes) | ||||
| Orange County Refunding Recovery, 6.50% due 6/1/2005 (Insured: MBIA) | Aaa/AAA | 2,280,000 | 2,421,177 | |
| San Diego County Water Authority Revenue & Refunding Series 1993-A, 10.123% due 4/25/2007 (Insured: FGIC) | Aaa/AAA | 500,000 | 611,130 | |
| San Marcos Certificate of Participation Series C, 0% due 8/15/2005 (ETM)* | NR/AAA | 145,000 | 142,435 | |
| San Marcos Certificate of Participation Series D, 0% due 9/2/2005 (ETM)* | NR/AAA | 740,000 | $ 726,399 | |
| Stanton Multi Family Housing Revenue Bond Series 1997, 5.625% due 8/1/2029 put 8/1/2009 (Continental Gardens | NR/AAA | 1,490,000 | 1,628,183 | |
| Project; Collateralized: FNMA) | ||||
| Sulphur Springs School District General Obligation Series B, 5.70% due 3/1/2005 | NR/A | 800,000 | 832,960 | |
| Sunline Transit Agency Certificate of Participation Series A, 5.625% due 7/1/2004 | A2/NR | 450,000 | 455,162 | |
| Sunline Transit Agency Certificate of Participation Series A, 5.75% due 7/1/2005 | A2/NR | 215,000 | 219,534 | |
| Colorado | -5.20% | |||
| Adams County Communication Center Series A, 5.75% due 12/1/2016 | Baa1/NR | 1,265,000 | 1,352,993 | |
| Arvada Industrial Development Revenue, 5.25% due 12/1/2007 (Wanco Inc. Project; LOC: US Bank, N.A.) | NR/NR | 80,000 | 82,243 | |
| Arvada Industrial Development Revenue, 5.60% due 12/1/2012 (Wanco Inc. Project; LOC: US Bank, N.A.) | NR/NR | 450,000 | 464,535 | |
| Central Platte Valley Metropolitan District, 5.15% due 12/1/2013 pre-refunded 12/1/2009 | NR/AAA | 1,000,000 | 1,143,640 | |
| Central Platte Valley Metropolitan District Refunding Series A, 5.00% due 12/1/2031 put 12/1/2009 (LOC: US | NR/A1+ | 2,000,000 | 2,165,300 | |
| Bank) | ||||
| Colorado Educational & Cultural Facilities Refunding, 6.00% due 4/1/2021 (Charter School Cherry Creek Project) | Baa2/NR | 500,000 | 512,615 | |
| Colorado Housing Finance Authority Single Family Program Subordinated Series C, 5.75% due 10/1/2007 | A1/A+ | 60,000 | 60,000 | |
| Colorado Springs Company Hospital Revenue Refunding, 5.60% due 12/15/2007 (Insured: MBIA) | Aaa/AAA | 500,000 | 541,005 | |
| Colorado Student Obligation Bond Student Loan Senior Subordinated Series B, 6.20% due 12/1/2008 | A2/NR | 1,545,000 | 1,618,758 | |
| Denver City & County Certificates of Participation Series B, 5.00% due 12/1/2009 | Aa2/AA | 2,070,000 | 2,321,547 | |
| Denver City & County Certificates of Participation Series B, 5.00% due 12/1/2011 | Aa2/AA | 2,465,000 | 2,771,202 | |
| El Paso County School District 11, 7.10% due 12/1/2013 | Aa3/AA- | 500,000 | 646,180 | |
| Glendale Certificates of Participation, 5.40% due 8/15/2008 (Education Center Project) | NR/BBB+ | 675,000 | 698,814 | |
| Interstate South Metropolitan District Refunding, 6.00% due 12/1/2020 (LOC: BNP Paribas) | NR/AA- | 2,395,000 | 2,462,755 | |
| Larimer County General Obligation, 8.45% due 12/15/2005 (Poudre School District Project) | Aa3/NR | 2,830,000 | 3,166,742 | |
| Northwest Parkway Public Highway Authority Capital Appreciation Senior Convertible C,0% due 6/15/2014 (Insured: | Aaa/AAA | 1,005,000 | 793,267 | |
| FSA) | ||||
| Plaza Metropolitan District 1 Colorado Revenue Public Improvement Fee/Tax Increment, 7.70% due 12/1/2017 | NR/NR | 2,500,000 | 2,529,450 | |
| Superior Metropolitan District 1 Water Refunding & Improvement Series B, 5.45% due 12/1/2020 put 12/1/2004 @ | NR/A | 350,000 | 358,358 | |
| 100 (LOC: Allied Irish) | ||||
| Thornton County Single Family Mortgage Revenue Series 1992-A, 8.05% due 8/1/2009 | A3/NR | 55,000 | 55,224 | |
| Connecticut | -0.10% | |||
| Connecticut State Health & Educational Facilities Authority Revenue Yale University Series V-2, 1.10% due | VMIG1/A1+ | 600,000 | 600,000 | |
| 7/1/2036 put 4/1/2004 (daily demand notes) | ||||
| Delaware | -0.30% | |||
| Delaware State Health Facilities Authority Revenue Series A, 5.25% due 5/1/2016 (Nanticoke Memorial Hospital | NR/AA | 1,500,000 | 1,598,490 | |
| Project; Insured: Radian) | ||||
| District of Columbia | -1.10% | |||
| District of Columbia Hospital Revenue, 5.375% due 8/15/2015 (ETM)* | Aaa/AAA | 600,000 | 676,290 | |
| District of Columbia Refunding Series B, 6.00% due 6/1/2015 (Insured: MBIA) | Aaa/AAA | 3,000,000 | 3,598,890 | |
| District of Columbia Tax Increment Capital Appreciation, 0% due 7/1/2019 (Mandarin Oriental Project; Insured: | Aaa/AAA | 1,500,000 | 720,780 | |
| FSA) | ||||
| Florida | -2.80% | |||
| Broward County Resource Recovery Revenue, 5.00% due 12/1/2007 | A3/AA- | 1,000,000 | 1,094,130 | |
| Deltona Utility Systems Revenue, 5.25% due 10/1/2015 (Insured: MBIA) | Aaa/AAA | 1,000,000 | 1,130,050 | |
| Duval County HFA Single Family Housing Revenue Series 94, 6.10% due 4/1/2006 (Collateralized: GNMA) | Aaa/NR | 35,000 | 36,315 | |
| Duval County HFA Single Family Housing Revenue Series 94, 6.10% due 10/1/2006 (Collateralized: GNMA) | Aaa/NR | 30,000 | 31,117 | |
| Duval County Multi Family Housing Revenue Refunding, 5.90% due 9/1/2016 (St. Augustine Apartments Project) | NR/A+ | 1,000,000 | 1,043,530 | |
| Enterprise Community Development District Assessment Bonds, 6.00% due 5/1/2010 (Insured: MBIA) | Aaa/AAA | 1,605,000 | 1,627,053 | |
| Escambia County Health Facility Revenue, 5.95% due 7/1/2020 (Florida Health Care Facility Loan Project; | Aaa/NR | 3,000,000 | $3,150,420 | |
| Insured: AMBAC) | ||||
| Florida Board of Education Capital Outlay Refunding Public Education Series D, 5.75% due 6/1/2018 | Aa2/AA+ | 1,200,000 | 1,370,724 | |
| Osceola County Health Facilities Revenue Series 1994, 5.75% due 5/1/2004 (Evangelical Lutheran Good Samaritan | Aaa/AAA | 150,000 | 150,567 | |
| Project; Insured: AMBAC) | ||||
| Pasco County Housing Finance Authority MFHR, 5.50% due 6/1/2027 put 6/1/2008 (Cypress Trail Apartments Project; | NR/AA- | 1,200,000 | 1,266,432 | |
| Guaranty: Axa Reinsurance) | ||||
| Pensacola Apartment Revenue Series A, 6.25% due 10/1/2004 (Insured: MBIA) | Aaa/AAA | 650,000 | 665,951 | |
| Turtle Run Community Development District Refunding Water Management Benefit Special Assessment, 5.00% due | Aaa/AAA | 1,000,000 | 1,115,530 | |
| 5/1/2011 (Insured: MBIA) | ||||
| Georgia | -0.10% | |||
| Georgia Municipal Electric Authority Power Revenue Unrefunded Series Y, 10.00% due 1/1/2010 | A2/NR | 235,000 | 319,628 | |
| Hawaii | -0.70% | |||
| Hawaii Department of Budget & Finance, 6.40% due 7/1/2013 (Insured: MBIA) | Aaa/AAA | 2,000,000 | 2,462,820 | |
| Hawaii Housing Finance Development Corp. Series B, 5.85% due 7/1/2017 (Collateralized: FNMA) | Aaa/AAA | 970,000 | 999,857 | |
| Idaho | -0.20% | |||
| Boise City Industrial Development Corp., 5.40% due 12/15/2009 (Western Trailer Co. Project; LOC: First | Aaa/NR | 985,000 | 998,879 | |
| Security) | ||||
| Illinois | -13.60% | |||
| Bedford Park Tax Increment Revenue Refunding Series 1993, 8.00% due 12/1/2010 pre-refunded 12/1/2004 | NR/BBB- | 1,930,000 | 2,018,066 | |
| Central Lake County Joint Action Water Agency Series 1991, 0% due 5/1/2005 (Insured: MBIA) | Aaa/AAA | 300,000 | 296,160 | |
| Champaign County Community Unit Series C, 0% due 1/1/2011 pre-refunded 1/1/2010 @ 94.672 (Insured: FGIC) | Aaa/AAA | 800,000 | 631,720 | |
| Chicago Housing Authority Capital, 5.00% due 7/1/2008 | Aa3/AA | 3,020,000 | 3,312,276 | |
| Chicago Park District Harbor, 5.75% due 1/1/2011 | A2/NR | 600,000 | 698,916 | |
| Chicago Tax Increment Allocation Lincoln Belmont A, 5.30% due 1/1/2014 (Insured: ACA) | NR/A | 2,285,000 | 2,411,955 | |
| Chicago Wastewater Transmission Revenue Refunding Second Lien, 5.50% due 1/1/2013 (Insured: MBIA) | Aaa/AAA | 650,000 | 749,866 | |
| Cook County Capital Improvement, 5.50% due 11/15/2008 (Insured: FGIC) | Aaa/AAA | 500,000 | 550,105 | |
| Cook County School District Class A, 0% due 12/1/2022 | NR/NR | 4,200,000 | 1,426,362 | |
| Du Page County School District Capital Appreciation, 0% due 2/1/2010 (Insured: FGIC) | Aaa/NR | 655,000 | 543,676 | |
| Freeport Illinois, 5.375% due 1/1/2018 | Aaa/AAA | 1,500,000 | 1,663,770 | |
| Hoffman Estates Tax Increment Revenue, 0% due 5/15/2004 | Baa1/NR | 1,385,000 | 1,380,734 | |
| Illinois Development Finance Authority Revenue, 6.00% due 11/15/2012 (Insured: MBIA) | Aaa/AAA | 2,860,000 | 3,331,128 | |
| Illinois Development Finance Authority Revenue Refunding Community Rehab Providers A, 5.90% due 7/1/2009 | NR/BBB | 720,000 | 763,826 | |
| Illinois Development Financing Authority, 7.125% due 3/15/2007 (Children’s Home & Aid Society Project; LOC: | NR/A-1 | 500,000 | 502,190 | |
| Bank One) | ||||
| Illinois Development Financing Authority Debt Restructuring Revenue Series 1994, 7.25% due 11/15/2009 (East St | NR/A | 2,400,000 | 2,528,640 | |
| Louis Project) | ||||
| Illinois Educational Facilities Authority Revenues Adjusted Medium Term, 4.75% due 11/1/2036 put 11/1/2016 @ | A2/A | 1,160,000 | 1,202,282 | |
| 100 (Field Museum Project) | ||||
| Illinois Educational Facilities Authority Revenues Capital Appreciation, 0% due 7/1/2014 pre-refunded 7/1/2009 | Aaa/AAA | 475,000 | 231,002 | |
| @ 57.17 (Insured: MBIA) | ||||
| Illinois Educational Facilities Authority Revenues Loyola University A, 6.00% due 7/1/2012 (Insured: MBIA) | Aaa/AAA | 230,000 | 274,977 | |
| (ETM)* | ||||
| Illinois Educational Facilities Authority Revenues Midwestern University B, 5.50% due 5/15/2018 (Insured: ACA) | NR/A | 1,500,000 | 1,563,660 | |
| Illinois Educational Facilities Authority Revenues Series B, 4.40% due 7/1/2025 put 7/1/2004 (University of | Aa1/AA | 2,000,000 | 2,016,480 | |
| Chicago Project) | ||||
| Illinois Educational Facilities Authority Revenues Unrefunded Balance Loyola A, 5.00% due 7/1/2006 (Insured: | Aaa/AAA | 1,540,000 | $1,652,035 | |
| MBIA) | ||||
| Illinois Educational Facilities Authority Revenues Unrefunded Balance Loyola A, 6.00% due 7/1/2011 (ETM)* | Aaa/AAA | 770,000 | 912,304 | |
| Illinois Educational Facilities Authority Revenues Unrefunded Balance Loyola A, 6.00% due 7/1/2012 (ETM)* | Aaa/AAA | 970,000 | 1,146,220 | |
| Illinois Health Facilities Authority Revenue, 5.50% due 10/1/2009 (Decatur Memorial Hospital Project) | A2/A | 1,055,000 | 1,180,999 | |
| Illinois Health Facilities Authority Revenue, 7.60% due 8/15/2010 (Insured: FSA) | Aaa/AAA | 214,000 | 221,019 | |
| Illinois Health Facilities Authority Revenue, 5.75% due 8/15/2013 (Children’s Memorial Hospital Series A | Aaa/AAA | 1,900,000 | 2,161,630 | |
| Project; Insured: AMBAC) | ||||
| Illinois Health Facilities Authority Revenue, 5.70% due 2/20/2021 (Midwest Care Center Project; Collateralized: | Aaa/NR | 990,000 | 1,066,002 | |
| GNMA) | ||||
| Illinois Health Facilities Authority Revenue Healthcare Systems, 6.25% due 11/15/2019 (OSF Healthcare Project) | A2/A | 1,250,000 | 1,361,412 | |
| Illinois Health Facilities Authority Revenue Series A, 7.60% due 8/15/2010 (Insured: FSA) | Aaa/AAA | 37,000 | 37,182 | |
| Illinois Health Facilities Authority Revenue Series A, 6.10% due 8/15/2014 (Northwestern Memorial Hospital | Aa2/AA+ | 870,000 | 901,233 | |
| Project) | ||||
| Illinois University Revenues, 5.25% due 1/15/2018 (UIC South Campus Development Project) | Aaa/AAA | 1,205,000 | 1,333,140 | |
| Jackson & Williamson Countys, Illinois, 7.50% due 12/1/2009 (Insured: AMBAC) | Aaa/AAA | 680,000 | 850,850 | |
| Lake County Community Consolidated School District 73, 9.00% due 1/1/2006 (Insured: FSA) | Aaa/NR | 1,000,000 | 1,126,040 | |
| Lake County Community High School Capital Appreciation Series B, 0% due 12/1/2012 (Insured: FGIC) | Aaa/NR | 5,550,000 | 4,000,939 | |
| Marion Refunding, 5.00% due 9/15/2012 (Insured: FGIC) | Aaa/AAA | 755,000 | 845,064 | |
| McHenry County School District Woodstock General Obligation, 6.80% due 1/1/2006 (Insured: FSA) | Aaa/AAA | 710,000 | 773,829 | |
| Melrose Park Tax Increment Series B, 6.50% due 12/15/2015 (Insured: FSA) | Aaa/AAA | 1,015,000 | 1,224,618 | |
| Sangamon County Property Tax Lease Receipts, 7.45% due 11/15/2006 | Aa3/NR | 800,000 | 877,296 | |
| Sangamon County School District Series A, 5.875% due 8/15/2018 (Hay Edwards Project) | NR/A | 2,400,000 | 2,545,440 | |
| Sherman Revenue Refunding Mortgage, 6.10% due 10/1/2014 (Collateralized: GNMA) | Aaa/AAA | 1,170,000 | 1,293,739 | |
| Sherman Revenue Refunding Mortgage, 6.20% due 10/1/2019 (Collateralized: GNMA) | Aaa/AAA | 1,600,000 | 1,738,784 | |
| Southern Illinois University Revenues, 0% due 4/1/2014 (Insured: MBIA) | Aaa/AAA | 1,425,000 | 943,136 | |
| Southwestern Illinois Development Authority Revenue, 5.375% due 8/15/2015 | Baa2/BBB+ | 500,000 | 515,765 | |
| University of Illinois Revenue Capital Appreciation, 0% due 4/1/2014 (Insured: MBIA) | Aaa/AAA | 1,590,000 | 1,052,342 | |
| West Chicago Industrial Development Revenue, 6.90% due 9/1/2024 (Leggett & Platt Inc. Project) | NR/A+ | 1,000,000 | 1,040,610 | |
| Will & Kendall Counties Community Series B, 5.125% due 1/1/2014 (Insured: FSA) | Aaa/AAA | 1,000,000 | 1,104,480 | |
| Will County Community School 365-U Capital Appreciation, 0% due 11/1/2011 (Insured: FSA) | Aaa/AAA | 3,000,000 | 2,296,170 | |
| Indiana | -6.70% | |||
| Allen County Economic Development, 5.80% due 12/30/2012 (Indiana Institute of Technology Project) | NR/NR | 895,000 | 964,040 | |
| Allen County Economic Development, 5.75% due 12/30/2015 (Indiana Institute of Technology Project) | NR/NR | 1,355,000 | 1,496,855 | |
| Allen County War Memorial Series A, 5.25% due 11/1/2013 (Insured: AMBAC) | Aaa/NR | 1,000,000 | 1,121,770 | |
| Boone County Hospital Association, 5.625% due 1/15/2015 (Insured: FGIC) | Aaa/AAA | 1,000,000 | 1,116,530 | |
| Carmel Economic Development Revenue Refunding FHA Loan, 5.875% due 9/1/2005 (Insured: FHA) | Aa2/NR | 35,000 | 35,490 | |
| Dyer Redevelopment Authority, 6.40% due 7/15/2015 | NR/BBB+ | 1,515,000 | 1,670,606 | |
| Dyer Redevelopment Authority, 6.50% due 7/15/2016 | NR/BBB+ | 1,910,000 | 2,106,749 | |
| East Chicago Elementary School Building First Mortgage Series A, 6.25% due 7/5/2008 | NR/A | 350,000 | 399,042 | |
| Gary Building Corp. - Lake County First Mortgage Series 1994-B, 8.25% due 7/1/2010 (Sears Building Project) | NR/NR | 1,000,000 | 1,029,100 | |
| Goshen Chandler School Building Capital Appreciation Refunding, 0% due 1/15/2011 (Insured: MBIA) | Aaa/AAA | 1,020,000 | 806,851 | |
| Hamilton Southeastern Indiana, 6.25% due 7/15/2006 (North Delaware School Building Project; Insured: AMBAC) | Aaa/AAA | 2,600,000 | 2,868,840 | |
| Huntington Economic Development Revenue, 6.40% due 5/1/2015 (United Methodist Memorial Project) | NR/NR | 1,000,000 | 1,058,620 | |
| Indiana Bond Bank Common School Fund Advanced Purchase Funding, 5.00% due 2/1/2009 (Insured: AMBAC) | Aaa/AAA | 700,000 | 778,169 | |
| Indiana Bond Bank Special Program Hendrick’s Redevelopment Series B, 6.20% due 2/1/2023 (LOC: Canadian Imperial | NR/A+ | 1,500,000 | $1,709,670 | |
| Bank) | ||||
| Indiana Health Facility Hospital Revenue, 5.75% due 9/1/2015 (ETM)* | NR/AA- | 575,000 | 581,469 | |
| Indiana Health Facility Hospital Revenue, 5.40% due 2/15/2016 (Clarian Health Obligation Group Project; | Aaa/AAA | 800,000 | 881,896 | |
| Insured: MBIA) | ||||
| Indiana Public School Building Corp. First Mortgage, 6.00% due 7/5/2007 (Insured: State Aid Witholding) | NR/AA | 910,000 | 1,024,269 | |
| Indiana State Educational Facilities Authority Revenue, 5.65% due 10/1/2015 (University of Indianapolis | NR/A- | 1,065,000 | 1,180,286 | |
| Project) | ||||
| Indiana State Educational Facilities Authority Revenue, 5.70% due 10/1/2016 (University of Indianapolis | NR/A- | 1,025,000 | 1,134,368 | |
| Project) | ||||
| Indianapolis Airport Authority Revenue Refunding Series A, 5.75% due 7/1/2005 (Insured: FGIC) | Aaa/AAA | 1,000,000 | 1,056,130 | |
| Indianapolis Economic Development Revenue, 5.50% due 6/1/2014 | Aa3/NR | 500,000 | 559,455 | |
| Indianapolis Local Public Improvement Bond Bank, 0% due 7/1/2009 (ETM)* | Aa2/AA- | 740,000 | 636,518 | |
| Portage Township Multi School Bldg., 5.50% due 7/15/2015 (Insured: FGIC) | Aaa/AAA | 500,000 | 568,540 | |
| Rockport Pollution Control Revenue Series A, 4.90% due 6/1/2025 put 6/1/2007 (Indiana Michigan Power Co. | Baa2/BBB | 2,500,000 | 2,607,375 | |
| Project) | ||||
| Wawasee Community School Corp. First Mortgage, 5.50% due 7/15/2012 | NR/AA- | 1,200,000 | 1,371,876 | |
| West Clark School Building Corp. First Mortgage, 5.75% due 7/15/2017 (Insured: FGIC and State Aid Withholding) | Aaa/AAA | 1,685,000 | 1,938,946 | |
| Iowa | -2.10% | |||
| Iowa Department of General Services Certificate of Participation Series 1992, 6.50% due 7/1/2006 (Insured: | Aaa/AAA | 2,590,000 | 2,622,427 | |
| AMBAC) (ETM)* | ||||
| Iowa Finance Authority Health Care Facilities, 6.00% due 7/1/2013 (Genesis Medical Center Project) | A1/NR | 1,000,000 | 1,108,110 | |
| Iowa Finance Authority Hospital Facility Revenue, 6.00% due 7/1/2012 (Trinity Regional Hospital Project; | Aaa/AAA | 1,000,000 | 1,183,250 | |
| Insured: FSA) | ||||
| Iowa Finance Authority Hospital Facility Revenue, 6.75% due 2/15/2016 | A1/NR | 1,000,000 | 1,128,130 | |
| Iowa Finance Authority Revenue, 6.00% due 12/1/2018 (Catholic Health Initiatives Project) | Aa2/AA | 2,000,000 | 2,224,120 | |
| Iowa Finance Authority Revenue Refunding Trinity Health Series B, 5.75% due 12/1/2015 | Aa3/AA- | 1,250,000 | 1,381,012 | |
| Kansas | -1.00% | |||
| Wichita Hospital Revenue Refunding Improvement Series XI, 6.75% due 11/15/2019 (Christi Health System Project) | NR/A+ | 4,200,000 | 4,717,272 | |
| Kentucky | -1.40% | |||
| Kentucky Economic Development Finance Authority Series C, 0% due 10/1/2015 (Norton Healthcare Project; Insured: | Aaa/AAA | 4,000,000 | 4,265,040 | |
| MBIA) | ||||
| Paintsville First Mortgage Revenue Refunding Series 1991, 8.65% due 9/1/2005 (Paul B. Hall Medical Center | NR/NR | 1,120,000 | 1,127,022 | |
| Project) | ||||
| Wilmore Housing Facilities Revenue, 5.55% due 7/1/2013 (LOC: Allied Irish Bank PLC) | NR/NR | 785,000 | 840,712 | |
| Louisiana | -2.00% | |||
| East Baton Rouge Mortgage Financing Authority Purchase Revenue, 8.25% due 2/25/2011 (Collateralized: GNMA) | Aaa/AAA | 1,738 | 1,774 | |
| Jefferson Sales Tax District Revenue Series B, 5.50% due 12/1/2008 (Insured: AMBAC) | Aaa/AAA | 1,595,000 | 1,820,023 | |
| Louisiana Local Govt. Environment Series A, 4.10% due 9/1/2007 (Housing Bellemont Apts. Project) | Baa1/NR | 390,000 | 390,975 | |
| Louisiana Public Facilities Authority Revenue Refinancing, 8.00% due 10/1/2009 (Schwegman Westside Expressway | NR/NR | 1,709,550 | 288,487 | |
| Project A) (a) | ||||
| Louisiana State Offshore Term Refunding Series D, 4.00% due 9/1/2023 put 9/1/2008 (Loop LLC Project) | A3/A-1 | 3,250,000 | 3,393,032 | |
| Morehouse Parish Pollution Revenue Refunding Series A, 5.25% due 11/15/2013 (International Paper Co. Project) | Baa2/BBB | 3,000,000 | 3,329,820 | |
| Massachusetts | -1.20% | |||
| Massachusetts Development Finance Agency Refunding, 6.25% due 1/1/2015 (Odd Fellows Home Project) | NR/NR | 1,205,000 | 1,121,867 | |
| Massachusetts Housing Finance Authority Insured Rental Housing Series 1994-A, 6.20% due 1/1/2006 (Insured: | Aaa/AAA | 2,510,000 | $2,580,606 | |
| AMBAC) | ||||
| Massachusetts Industrial Financing Agency Revenue Series A, 6.125% due 12/1/2011 (Insured: MBIA) | Aaa/AAA | 1,905,000 | 2,004,632 | |
| Michigan | -1.60% | |||
| Kalamazoo Hospital Finance Authority Revenue Series 1994-A, 6.25% due 6/1/2014 (Borgess Medical Center Project) | Aaa/AAA | 650,000 | 797,394 | |
| (ETM)* | ||||
| Kent Hospital Finance Authority Michigan Hospital, 7.25% due 1/15/2013 (Insured: MBIA) | Aaa/AAA | 1,000,000 | 1,241,030 | |
| Livonia Public School District, 5.50% due 5/1/2014 | Aaa/AAA | 750,000 | 760,260 | |
| Michigan Housing Redevelopment Authority Ltd. Obligation, 6.50% due 9/15/2007 (Greenwood Villa Project; | Aaa/AAA | 415,000 | 425,641 | |
| Insured: FSA) | ||||
| Michigan State Building Authority Revenue Refunding Facilities Program Series I, 5.25% due 10/15/2017 | Aaa/AAA | 2,450,000 | 2,723,689 | |
| Southfield Economic Development Corp. Refunding Revenue N.W. 12 Limited Partnership, 7.25% due 12/1/2010 | NR/NR | 1,530,000 | 1,531,836 | |
| Minnesota | -0.40% | |||
| Minneapolis St. Paul Health, 6.00% due 12/1/2018 (Healthpartners Obligation Group Project) | Baa1/BBB+ | 1,000,000 | 1,083,010 | |
| Southern Minnesota Municipal Power Agency Supply, pre-refunded to various dates, Series A, 5.75% due 1/1/2018 | Aaa/AAA | 700,000 | 716,121 | |
| (Insured: MBIA) | ||||
| Mississippi | -0.50% | |||
| Mississippi Higher Educational Authority Series C, 7.50% due 9/1/2009 | A2/NR | 1,500,000 | 1,515,810 | |
| Mississippi Hospital Equipment Revenue, 6.40% due 1/1/2007 (Rush Foundation Project; Guaranty: Connie Lee) | Baa3/AAA | 635,000 | 658,050 | |
| Missouri | -1.20% | |||
| Missouri Development Finance Board Healthcare Series A, 5.40% due 11/1/2018 (Lutheran Home Aged Project; LOC: | A2/NR | 2,025,000 | 2,111,832 | |
| Commerce Bank) | ||||
| Missouri Environment Improvement Energy Refunding, 3.90% due 1/2/2012 put 9/1/2004 (Kansas City Power & Light | VMIG1/A-2 | 2,000,000 | 2,018,480 | |
| Project) | ||||
| St. Louis Municipal Finance Corp. Leasehold Revenue, 6.25% due 2/15/2012 pre-refunded 2/1/2005 | Aaa/AAA | 1,175,000 | 1,227,687 | |
| Nebraska | -0.20% | |||
| Madison County Hospital Authority 1 Hospital Revenue, 5.50% due 7/1/2014 (Faith Regional Health Services | NR/AA | 845,000 | 929,880 | |
| Project; Insured: Radian) | ||||
| Nevada | -1.90% | |||
| Clark County Pollution Control Revenue Series B, 6.60% due 6/1/2019 (Nevada Power Company Project; Insured: | Aaa/AAA | 640,000 | 662,528 | |
| FGIC) | ||||
| Las Vegas Special Improvement District Refunding Senior Local Improvement Series A, 5.375% due 6/1/2013 | Aaa/AAA | 1,235,000 | 1,379,544 | |
| (Insured: FSA) | ||||
| Washoe County Capital Appreciation Reno Sparks Series B, 0% due 7/1/2011 (Insured: FSA) | Aaa/AAA | 2,600,000 | 2,010,242 | |
| Washoe County Hospital Facility Revenue Series 1993 A, 6.00% due 6/1/2015 (Washoe Medical Center Project) | A2/A+ | 2,250,000 | 2,292,030 | |
| Washoe County School District Refunding Series B, 5.00% due 6/1/2010 (Insured: FGIC) | Aaa/AAA | 2,350,000 | 2,636,606 | |
| New Hampshire | -1.90% | |||
| Manchester Housing & Redevelopment Authority, 0% due 1/1/2017 | NR/AA | 5,140,000 | 2,628,390 | |
| Manchester Housing & Redevelopment Authority Capital Appreciation Series B, 0% due 1/1/2016 (Insured: Radian) | NR/AA | 4,990,000 | 2,680,279 | |
| New Hampshire Pollution Refunding Central Maine Power Co., 5.375% due 5/1/2014 | A3/BBB+ | 3,000,000 | 3,253,830 | |
| New Jersey | -1.30% | |||
| New Jersey EDA Refunding Revenue, 7.50% due 12/1/2019 (Spectrum for Living Development Project; LOC: PNC Bank) | A3/A | 265,000 | 266,312 | |
| New Jersey State Transport Trust Fund Authority Series C, 5.50% due 6/15/2017 (Transportation Systems Project) | Aa3/AA- | 5,000,000 | 5,642,350 | |
| New Mexico | -0.60% | |||
| New Mexico Housing Authority, Multi Family Housing Revenue, 1.02% due 1/15/2033 put 4/8/2004 (Arbors/Courtyard | NR/A1+ | 3,000,000 | $3,000,000 | |
| Apartments Project) (weekly demand notes) | ||||
| New York | -3.00% | |||
| Long Island Power Authority General Series B, 5.00% due 12/1/2006 | Baa1/A- | 2,000,000 | 2,159,340 | |
| Metro Transportation Authority New York Service Control Series B, 5.25% due 7/1/2006 | A3/AA- | 1,080,000 | 1,165,504 | |
| Nassau Health Care Corp., 6.00% due 8/1/2011 (Insured: FSA) | Aaa/AAA | 1,000,000 | 1,159,010 | |
| New York City General Obligation Series E, 6.00% due 8/1/2008 (Insured: FGIC) | Aaa/AAA | 1,935,000 | 2,133,879 | |
| New York City Industrial Development Agency Series A, 5.00% due 6/1/2010 (Lycee Francais De New York Project; | NR/A | 1,175,000 | 1,282,630 | |
| Insured: ACA) | ||||
| New York City Transitional Finance Authority, 1.15% due 11/1/2022 put 4/1/2004 (LOC: Bank of New York) (daily | VMIG1/A1+ | 400,000 | 400,000 | |
| demand notes) | ||||
| New York City Trust Cultural Resources, 5.75% due 7/1/2015 (Museum of American Folk Art Project; Insured: ACA) | NR/A | 875,000 | 962,649 | |
| New York Housing Finance Service Series A, 6.375% due 9/15/2015 pre-refunded 9/15/2007 @ 100 | A3/AAA | 220,000 | 252,606 | |
| New York Series B-2, Subseries B-4, 1.10% due 8/15/2023 put 4/1/2004 (daily demand notes) | VMIG1/A1+ | 500,000 | 500,000 | |
| New York State Dormitory Authority Revenues, 5.75% due 7/1/2022 | NR/AAA | 1,290,000 | 1,305,196 | |
| Port Authority New York & New Jersey Special Obligation, 6.25% due 12/1/2011 (JFK International Air Terminal 6 | Aaa/AAA | 2,200,000 | 2,545,620 | |
| Project) | ||||
| North Carolina | -0.40% | |||
| Craven County Industrial Facilities Pollution Control Financing Authority Solid Waste Revenue, 7.875% due | Baa2/NR | 650,000 | 658,931 | |
| 6/1/2005 (Weyerhaeuser Co. Project) | ||||
| North Carolina Eastern Municipal Power Refunding Series A, 5.70% due 1/1/2013 (Insured: MBIA) | Aaa/AAA | 1,200,000 | 1,335,408 | |
| North Dakota | -0.10% | |||
| Grand Forks Health Care System Revenue Bonds Series 1997, 6.25% due 8/15/2006 (Altra Health Systems Obligated | Aaa/AAA | 365,000 | 403,091 | |
| Group Project; Insured: MBIA) | ||||
| Ohio | -2.20% | |||
| Butler County Transportation Improvement, 6.00% due 4/1/2010 (Insured: FSA) | Aaa/AAA | 1,000,000 | 1,151,790 | |
| Cleveland Cuyahoga County Development Bond Fund A, 6.25% due 5/15/2016 (LOC: FifthThird Bank) | NR/NR | 1,530,000 | 1,571,570 | |
| Franklin County Health Care Revenue Series 1995-A, 6.00% due 11/1/2010 (Heinzerling Foundation Project; LOC: | Aa2/NR | 1,100,000 | 1,164,240 | |
| Banc One) | ||||
| Franklin County Hospital, 5.80% due 12/1/2005 (Doctors Project) (ETM)* | A3/NR | 500,000 | 511,835 | |
| Middleburg Heights Ohio Refunding, 6.75% due 8/15/2005 (Southwest General Health Center Project; Insured: FSA) | Aaa/AAA | 500,000 | 537,260 | |
| North Ridgeville Economic Development, 0% due 2/1/2015 | NR/A | 630,000 | 261,866 | |
| Ohio Pollution Control Revenue Refunding, 5.625% due 3/1/2015 (General Motors Corp. Project) | Baa1/BBB | 2,000,000 | 2,177,900 | |
| Ohio State Higher Educational Facility Revenue, 5.05% due 7/1/2037 put 7/1/16 (Kenyon College Project) | A2/A | 1,600,000 | 1,702,736 | |
| Reynoldsburg Health Care Facilities Revenue Bonds Series 1997, 5.70% due 10/20/2012 (Collateralized: GNMA) | Aaa/NR | 760,000 | 825,253 | |
| Oklahoma | -2.40% | |||
| Grady County Industrial Authority Correctional Facilities, 5.00% due 11/1/2004 (Insured: MBIA) | Aaa/AAA | 175,000 | 178,346 | |
| Oklahoma City Municipal Improvement Authority, 0% due 7/1/2008 (Insured: AMBAC) | Aaa/AAA | 1,020,000 | 916,245 | |
| Oklahoma City Municipal Water & Sewer Capital Appreciation Series C, 0% due 7/1/2006 (Insured: AMBAC) | Aaa/AAA | 500,000 | 481,205 | |
| Oklahoma City Municipal Water & Sewer Series C, 0% due 7/1/2011 (Insured: AMBAC) | Aaa/AAA | 1,125,000 | 875,408 | |
| Oklahoma City Municipal Water & Sewer Series C, 0% due 7/1/2013 (Insured: AMBAC) | Aaa/AAA | 1,485,000 | 1,038,876 | |
| Oklahoma Development Finance Authority Hospital Association Pooled Hospital A, 5.40% due 6/1/2013 (Insured: | Aaa/AAA | 825,000 | 923,002 | |
| AMBAC) | ||||
| Oklahoma Industrial Authority Revenue Refunding, 6.00% due 8/15/2010 (Integris Baptist Project; Insured: AMBAC) | Aaa/AAA | 750,000 | 876,510 | |
| Tulsa County Independent School District Combined Purpose, 4.50% due 8/1/2007 | Aa3/A+ | 2,800,000 | 3,032,764 | |
| Tulsa Industrial Development Authority Hospital Revenue, 6.10% due 2/15/2009 pre-refunded 2/15/2006 @ 100 (St | Aa3/AA | 1,485,000 | $1,607,735 | |
| John’s Medical Center Project) | ||||
| Tulsa Public Facilities Authority Solid Waste Revenue, 5.65% due 11/1/2006 (Ogden Martin Project; Insured: | Aaa/AAA | 500,000 | 547,345 | |
| AMBAC) | ||||
| Woodward Municipal Hospital Authority Revenue Series 1994, 8.25% due 11/1/2009 | NR/NR | 500,000 | 513,400 | |
| Oregon | -0.60% | |||
| Albany Hospital Facility Authority Gross Revenue & Refunding Series 1994, 7.00% due 10/1/2005 (Mennonite Home | NR/NR | 705,000 | 724,366 | |
| Project) | ||||
| Forest Grove Campus Improvement & Refunding Pacific University, 6.00% due 5/1/2015 (Insured: Radian) | NR/AA | 800,000 | 900,960 | |
| Oregon Economic Development Department of Revenue Series CLII, 7.70% due 12/1/2014 (Smokecraft Project; LOC: | Aa2/NR | 1,070,000 | 1,110,521 | |
| Seafirst Bank) | ||||
| Pennsylvania | -2.10% | |||
| Admiral Peary Area Vocational School, 5.25% due 2/1/2005 | NR/A | 380,000 | 381,269 | |
| Allegheny County Hospital Development, 7.00% due 8/1/2015 (ETM)* | NR/AAA | 500,000 | 637,555 | |
| Allegheny County Hospital Development Health Series B, 6.50% due 5/1/2012 (South Hills Health Systems Project) | Baa1/NR | 1,400,000 | 1,472,212 | |
| Carbon County Industrial Development Authority Refunding, 6.65% due 5/1/2010 (Panther Creek Partners Project) | NR/BBB- | 1,750,000 | 1,912,977 | |
| Lancaster County Capital Appreciation Series B, 0% due 5/1/2014 (Insured: FGIC) | Aaa/NR | 795,000 | 521,782 | |
| Lancaster County Capital Appreciation Series B, 0% due 11/1/2014 (Insured: FGIC) | Aaa/NR | 795,000 | 508,554 | |
| Lancaster County Capital Appreciation Series B, 0% due 5/1/2015 (Insured: FGIC) | Aaa/NR | 800,000 | 490,008 | |
| Lehigh County General Purpose Shepard Rehab. Hospital, 6.00% due 11/15/2007 (Insured: AMBAC) | Aaa/AAA | 785,000 | 893,134 | |
| McKeesport Area School District Series B, 0% due 10/1/2004 | NR/A | 800,000 | 794,048 | |
| Pennsylvania Higher Education University Series 14, 0% due 7/1/2020 (Insured: AMBAC) | Aaa/AAA | 2,032,839 | 615,015 | |
| Pennsylvania State Higher Educational Facility Allegheny Delaware Valley Obligation A, 5.60% due 11/15/2009 | Aaa/AAA | 500,000 | 553,820 | |
| (Insured: MBIA) | ||||
| Pennsylvania State Higher Educational Facility Allegheny Delaware Valley Obligation A, 5.60% due 11/15/2010 | Aaa/AAA | 480,000 | 530,290 | |
| (Insured: MBIA) | ||||
| Philadelphia Water & Sewer Revenue 10th Series, 7.35% due 9/1/2004 (ETM)* | Aaa/AAA | 365,000 | 374,589 | |
| Rhode Island | -1.30% | |||
| Providence Series C, 5.50% due 1/15/2011 (Insured: FGIC) | Aaa/AAA | 1,840,000 | 2,123,728 | |
| Rhode Island Health & Education Building Hospital Financing, 5.25% due 7/1/2015 (Memorial Hospital Project; | NR/A+ | 1,325,000 | 1,420,148 | |
| LOC: Fleet Bank) | ||||
| Rhode Island Health & Education Building Refunding, 6.00% due 8/1/2014 (Credit Support: FHA) | NR/AAA | 1,000,000 | 1,115,940 | |
| Rhode Island Health & Education Building Refunding Higher Education State University, 5.00% due 3/15/2014 | NR/AA | 1,065,000 | 1,145,461 | |
| (Insured: Radian) | ||||
| South Carolina | -0.70% | |||
| Darlington County Industrial Development, 6.00% due 4/1/2026 (Sonoco Products Co. Project) | A2/A- | 3,100,000 | 3,285,194 | |
| South Dakota | -0.20% | |||
| South Dakota Housing Development Authority Homeownership Series B, 4.85% due 5/1/2009 | Aa1/AAA | 1,000,000 | 1,083,210 | |
| Tennessee | -0.50% | |||
| Knox County Health, 4.90% due 6/1/2031 put 6/1/2011 (Collateralized: FNMA) | NR/AAA | 2,000,000 | 2,111,740 | |
| Texas | -16.80% | |||
| Austin Utility Systems Revenue Refunding Comb Series A, 5.75% due 11/15/2013 (Insured: MBIA) | Aaa/AAA | 500,000 | 509,240 | |
| Bexar County Health Facilities Development Corp., 6.125% due 7/1/2022 (Army Retirement Residence Project) | NR/BBB- | 1,250,000 | 1,332,988 | |
| Bexar County Housing Finance Corp., 5.50% due 1/1/2016 (Insured: MBIA) | Aaa/NR | 600,000 | 651,126 | |
| Bexar County Housing Finance Corp., 5.70% due 1/1/2021 (Insured: MBIA) | Aaa/NR | 1,035,000 | 1,110,928 | |
| Bexar County Housing Finance Corp., 6.50% due 12/1/2021 | A3/NR | 2,000,000 | 1,981,140 | |
| Bexar County Housing Finance Corp. Multi Family Housing, 5.40% due 8/1/2012(Dymaxion & Marrach Park Apts. A | Aaa/NR | 1,200,000 | $1,285,656 | |
| Project; Insured: MBIA) | ||||
| Bexar County Housing Finance Corp. Multi Family Housing, 5.95% due 8/1/2020(Dymaxion & Marrach Park Apts. A | Aaa/NR | 1,270,000 | 1,385,748 | |
| Project; Insured: MBIA) | ||||
| Bexar County Housing Finance Corp. Series A, 5.875% due 4/1/2014 (Honey Creek Apartments Project; Insured: | Aaa/NR | 975,000 | 1,046,662 | |
| MBIA) | ||||
| Bexar County Housing Finance Corp. Series A, 6.125% due 4/1/2020 (Honey Creek Apartments Project; Insured: | Aaa/NR | 800,000 | 847,392 | |
| MBIA) | ||||
| Birdville Independent School District Refunding, 0% due 2/15/2012 (Guaranty: PSF) | Aaa/AAA | 2,800,000 | 2,088,828 | |
| Carroll Independent School District Capital Appreciation Refunding, 0% due 2/15/2011 (Guaranty: PSF) | Aaa/AAA | 1,130,000 | 854,529 | |
| Coppell Independent School District Capital Appreciation Refunding, 0% due 8/15/2013 (Guaranty: PSF) | NR/AAA | 5,000,000 | 3,214,750 | |
| De Soto Independent School District Refunding, 5.125% due 8/15/2017 (Guaranty: PSF) | NR/AAA | 1,100,000 | 1,102,816 | |
| Duncanville Independent School District Capital Appreciation Refunding Series B, 0% due 2/15/2016 (Guaranty: | Aaa/AAA | 3,000,000 | 1,652,460 | |
| PSF) | ||||
| El Paso Independent School District Capital Appreciation Refunding, 0% due 8/15/2010 (Guaranty: PSF) | Aaa/AAA | 3,750,000 | 2,913,412 | |
| El Paso Independent School District Capital Appreciation Refunding, 0% due 8/15/2011 (Guaranty: PSF) | Aaa/AAA | 2,500,000 | 1,815,650 | |
| Ennis Independent School District Refunding, 0% due 8/15/2012 (Guaranty: PSF) | Aaa/NR | 2,460,000 | 1,753,144 | |
| Ennis Independent School District Refunding, 0% due 8/15/2013 (Guaranty: PSF) | Aaa/NR | 2,490,000 | 1,695,889 | |
| Ennis Independent School District Refunding, 0% due 8/15/2014 (Guaranty: PSF) | Aaa/NR | 2,525,000 | 1,602,819 | |
| Fort Worth Water & Sewer Revenue, 5.25% due 2/15/2009 | Aa2/AA | 1,000,000 | 1,124,160 | |
| Gulf Coast Center Revenue, 6.75% due 9/1/2020 (Mental Health Retardation Center Project) | NR/BBB+ | 1,375,000 | 1,486,760 | |
| Hays Consolidated Independent School District Capital Appreciation, 0% due 8/15/2013 (Guaranty: PSF) | Aaa/AAA | 6,245,000 | 4,179,341 | |
| Houston Water Conveyance System Contract Certificate of Participation Series F, 7.20% due 12/15/2004 (Insured: | Aaa/AAA | 880,000 | 916,678 | |
| AMBAC) | ||||
| Irving Hospital Authority Series B, 5.80% due 7/1/2009 (Irving Healthcare Systems Project; Insured: FSA) | Aaa/AAA | 470,000 | 493,002 | |
| Irving Waterworks & Sewer Revenue Refunding & Improvement, 5.375% due 8/15/2014 | Aa2/AA | 1,500,000 | 1,700,895 | |
| Leander Independent School District Unlimited Tax School Building & Refunding Series 1992, 0% due 8/15/2005 | Aaa/NR | 2,000,000 | 1,956,380 | |
| (Guaranty: PSF) | ||||
| Mesquite Independent School District Refunding, 0% due 8/15/2012 (Guaranty: PSF) | NR/AAA | 1,420,000 | 1,005,104 | |
| Midlothian Independent School District Capital Appreciation Refunding, 0% due 2/15/2012 (Guaranty: PSF) | Aaa/NR | 1,000,000 | 746,010 | |
| Midtown Redevelopment Authority Tax, 6.00% due 1/1/2012 (Insured: Radian) | Baa2/AA | 735,000 | 833,233 | |
| Midtown Redevelopment Authority Tax, 6.00% due 1/1/2013 (Insured: Radian) | Baa2/AA | 500,000 | 562,700 | |
| North Central Texas Health Facility Development, 5.50% due 4/1/2005 (Zale Lipshy University Hospital Project; | Aaa/AAA | 500,000 | 520,900 | |
| Insured: FSA) | ||||
| North Central Texas Health Facility Development Refunding, 5.50% due 5/15/2013 (Hospital Baylor Health Care | Aa3/AA- | 500,000 | 525,625 | |
| Systems Project) | ||||
| North Central Texas Health Facility Development Series B, 5.75% due 2/15/2015 (Insured: MBIA) | Aaa/AAA | 2,400,000 | 2,755,824 | |
| Pharr San Juan Alamo Independent Building, 5.75% due 2/1/2013 (Guaranty: PSF) | Aaa/AAA | 1,000,000 | 1,145,250 | |
| Sabine River Authority Texas Pollution Refunding Series A, 5.80% due 7/1/2022 (TXU Energy Co. Project) | Baa2/BBB | 1,000,000 | 1,032,670 | |
| Sam Rayburn Municipal Power Agency Refunding, 6.00% due 10/1/2016 | Baa2/BBB- | 3,000,000 | 3,264,120 | |
| Stafford Economic Development, 6.00% due 9/1/2017 (Insured: FGIC) | Aaa/AAA | 1,775,000 | 2,092,388 | |
| Tarrant County Health Facilities, 6.00% due 9/1/2004 (Harris Methodist Health Systems Project; Insured: AMBAC) | Aaa/AAA | 715,000 | 729,765 | |
| (ETM)* | ||||
| Tarrant County Health Facilities, 6.625% due 11/15/2020 (Adventist/Sunbelt) | A3/A | 3,500,000 | 3,915,695 | |
| Texarkana Health Facilities Hospital Refunding Series A, 5.75% due 10/1/2009 (Wadley Regional Medical Center | Aaa/AAA | 500,000 | 574,430 | |
| Project; Insured: MBIA) | ||||
| Texarkana Health Facilities Hospital Refunding Series A, 5.75% due 10/1/2011 (Insured: MBIA) | Aaa/AAA | 2,500,000 | 2,914,850 | |
| Texas State Capital Appreciation Refunding Superconducting Series C, 0% due 4/1/2004 (ETM)* | Aaa/AAA | 1,000,000 | 1,000,000 | |
| Texas State Turnpike Authority Central Turnpike Systems Bond Anticipation Notes Second Tier, 5.00% due 6/1/2007 | Aa3/AA | 1,000,000 | $1,093,420 | |
| Texas State Unrefunded Balance, 7.00% due 8/1/2020 (Water Development Board Project) | Aa1/AA | 2,420,000 | 2,464,746 | |
| Travis County Health Facilities Development Series A, 5.75% due 11/15/2010 (Ascension Health Project; Insured: | Aaa/AAA | 2,000,000 | 2,298,880 | |
| MBIA) | ||||
| Travis County Health Facilities Development Series A, 6.25% due 11/15/2014(Ascension Health Project; Insured: | Aaa/AAA | 3,000,000 | 3,594,270 | |
| MBIA) | ||||
| Upper Trinity Regional Water District Regional Treated Water Supply Systems Series A, 7.125% due 8/1/2008 | Aaa/AAA | 600,000 | 717,246 | |
| (Insured: FGIC) | ||||
| Waco Health Facilities Development Corp. Series A, 6.00% due 11/15/2015 pre-refunded 11/15/2009 (Ascension | Aa2/AAA | 870,000 | 1,033,047 | |
| Health) | ||||
| Waco Health Facilities Development Corp. Series A, 6.00% due 11/15/2016 pre-refunded 11/15/2009 (Ascension | Aa2/AAA | 1,050,000 | 1,246,780 | |
| Health) | ||||
| West Harris County Municipal Utility Refunding, 6.00% due 3/1/2017 (Insured: Radian) | NR/AA | 500,000 | 558,830 | |
| Utah | -1.10% | |||
| Salt Lake City Municipal Building Series B, 5.30% due 10/15/2012 (Insured: AMBAC) | Aaa/AAA | 1,085,000 | 1,221,157 | |
| Utah Board Regents Auxiliary Refunding Series A, 5.25% due 5/1/2013 | NR/AA | 595,000 | 668,363 | |
| Utah County Municipal Building Authority, 5.50% due 11/1/2016 (Insured: AMBAC) | Aaa/NR | 1,000,000 | 1,125,080 | |
| Utah Housing Finance Agency, 6.05% due 7/1/2016 (Credit Support: FHA) | NR/AAA | 585,000 | 620,393 | |
| Utah Housing Finance Agency Single Family Mortgage D-2 Class I, 5.85% due 7/1/2015 | Aa2/AA | 180,000 | 184,228 | |
| Utah Water Finance Agency Revenue Pooled Loan Financing Program Series A, 5.00% due 10/1/2012 (Insured: AMBAC) | Aaa/NR | 940,000 | 1,052,800 | |
| Virginia | -3.70% | |||
| Alexandria Industrial Development Authority, 5.90% due 10/1/2020 (Insured: AMBAC) | Aaa/AAA | 2,000,000 | 2,318,560 | |
| Alexandria Industrial Development Authority Institute For Defense Analyses Series A, 6.00% due 10/1/2014 | Aaa/AAA | 1,500,000 | 1,776,690 | |
| (Insured: AMBAC) | ||||
| Alexandria Industrial Development Authority Institute For Defense Analyses Series A, 6.00% due 10/1/2015 | Aaa/AAA | 1,590,000 | 1,881,367 | |
| (Insured: AMBAC) | ||||
| Arlington County Industrial Development, 6.30% due 7/1/2016 | NR/A | 500,000 | 541,315 | |
| Capital Region Airport Commission Refunding Series B, 8.125% due 7/1/2014 (Insured: AMBAC) | Aaa/AAA | 2,000,000 | 2,071,500 | |
| Fauquier County Industrial Development Authority, 5.50% due 10/1/2016 (Insured: Radian) | NR/AA | 1,000,000 | 1,111,500 | |
| Hampton Redevelopment Housing Authority Multi Family Housing Refunding Series 1994, 7.00% due 7/1/2024 put | Baa1/A-1 | 2,000,000 | 2,026,500 | |
| 7/1/2004 (Chase Hampton Apartments Project; LOC: Credit Suisse) | ||||
| Hanover County Industrial Development Authority Medical Facilities Revenue, 6.00% due 10/1/2021 (Insured: MBIA) | Aaa/AAA | 795,000 | 813,198 | |
| (ETM)* | ||||
| Norton Industrial Development Authority Hospital Refunding, 6.00% due 12/1/2014 (Norton Community Hospital | NR/A | 1,635,000 | 1,844,869 | |
| Project; Insured: ACA) | ||||
| Spotsylvania County Industrial Development, 6.00% due 9/1/2019 put 9/1/2008 (Walter Grinders Project; LOC: | NR/NR | 2,095,000 | 2,208,151 | |
| Deutsche Bank) | ||||
| Virginia College Building Authority, 5.55% due 11/1/2019 put 11/1/2004 @ 100 (University of Richmond Project) | Aa1/AA | 500,000 | 512,240 | |
| Washington | -6.20% | |||
| Benton County Public Utility District Refunding Series A, 5.625% due 11/1/2012 (Insured: FSA) | Aaa/AAA | 1,500,000 | 1,724,445 | |
| Energy Northwest Washington Series A, 5.60% due 7/1/2015 (Wind Project) | A3/A- | 1,000,000 | 1,060,620 | |
| Energy Northwest Washington Series B, 5.10% due 7/1/2009 (Wind Project) | A3/A- | 745,000 | 793,820 | |
| Grant County Public Utility District-2 Wanapum Hydro Electric Revenue Series C, 6.00% due 1/1/2006 (Insured: | Aaa/AAA | 285,000 | 306,959 | |
| AMBAC) | ||||
| Snohomish County Public Utility 001 Systems Notes, 5.00% due 12/1/2005 | A1/SP1+ | 500,000 | 530,225 | |
| Tacoma Electric Systems Revenue Series A, 5.50% due 1/1/2012 (Insured: FSA) | Aaa/AAA | 750,000 | 853,620 | |
| University of Washington Revenue Refunding, 5.25% due 8/15/2009 (University of Washington Medical Center | Aaa/AAA | 1,350,000 | $1,523,623 | |
| Project; Insured: MBIA) | ||||
| Vancouver Downtown Redevelopment Senior Series A, 5.50% due 1/1/2018 (Conference Center Project; Insured: ACA) | NR/A | 3,500,000 | 3,753,505 | |
| Washington Health Care Facilities, 5.50% due 12/1/2010 (Insured: MBIA) | Aaa/AAA | 2,690,000 | 3,062,162 | |
| Washington Health Care Facilities, 6.00% due 12/1/2014 (Insured: MBIA) | Aaa/AAA | 1,735,000 | 2,022,090 | |
| Washington Health Care Facilities, 6.00% due 12/1/2015 (Insured: MBIA) | Aaa/AAA | 1,945,000 | 2,249,412 | |
| Washington Health Care Facilities Refunding, 6.375% due 10/1/2010 (Insured: FGIC) | Aaa/AAA | 1,500,000 | 1,795,980 | |
| Washington Health Care Facilities Sea Mar Community Health Center, 5.60% due 1/1/2018 (LOC: U.S. Bancorp) | Aa3/NR | 1,025,000 | 1,103,115 | |
| Washington Nonprofit Housing, 5.60% due 7/1/2011 (Kline Galland Center Project; Insured: Radian) | NR/AA | 500,000 | 555,115 | |
| Washington Nonprofit Housing, 5.875% due 7/1/2019 (Kline Galland Center Project; Insured: Radian) | NR/AA | 1,000,000 | 1,102,650 | |
| Washington Public Power Supply Capital Appreciation Refunding Series B, 0% due 7/1/2011 | Aaa/AA- | 1,000,000 | 761,700 | |
| Washington Public Power Supply Refunding Series A, 5.00% due 7/1/2011 (Insured: FSA) | Aaa/AAA | 3,030,000 | 3,332,909 | |
| Washington Public Power Supply System, 0% due 7/1/2010 (Project 3) | Aaa/AA- | 960,000 | 771,898 | |
| Washington State Multi Family Mortgage Revenue, 6.30% due 1/1/2021 put 1/1/2011 @100 (LOC: US Bank N.A.) | NR/AA- | 1,000,000 | 1,122,240 | |
| West Virginia | -0.20% | |||
| Marshall County West Virginia Pollution Control, 5.90% due 4/1/2022 (Insured: MBIA) | Aaa/AAA | 1,000,000 | 1,015,260 | |
| Wisconsin | -0.70% | |||
| Bass Lake PCRB, 6.50% due 4/1/2005 (Johnson Timber Corp. Project; Guaranty: SBA) | NR/NR | 60,000 | 60,133 | |
| Wisconsin Health & Educational Facilities, 5.75% due 8/15/2020 (Eagle River Memorial Hospital Inc. Project; Insured: Radian) | NR/AA | 1,000,000 | 1,086,620 | |
| Wisconsin Housing & Economic Development Housing Series A, 5.875% due 11/1/2016 (Insured: AMBAC) | Aaa/AAA | 2,000,000 | 2,155,080 | |
| TOTAL INVESTMENTS (100%) (Cost $428,467,089) | $459,421,367 | |||
†Credit ratings are unaudited.
Escrowed to maturity
(a) Bond in default, non income-producing security.
See notes to financial statements.
21
Thornburg Intermediate Municipal Fund
March 31, 2004
Index Comparison
Compares performance of Thornburg Intermediate Municipal Fund, the Merrill Lynch Municipal Bond (7-12 year) Index, and the Consumer Price Index, for periods ending March 31, 2004. On March 31, 2004, the weighted average securities ratings of the Index and the Fund were AA and AA, respectively, and the weighted average portfolio maturities of the Index and the Fund were 9.4 years and 8.3 years, respectively. Past performance of the Index and the Fund may not be indicative of future performance. The performance data and graph do not reflect the deduction of taxes that a shareholder would pay on distributions or the redemption of fund shares.
Thornburg Intermediate Municipal Fund Class I Total Returns, Since July 5, 1996, versus Merrill Lynch 7-12 Year Municipal Index and Consumer Price Index (CPI)
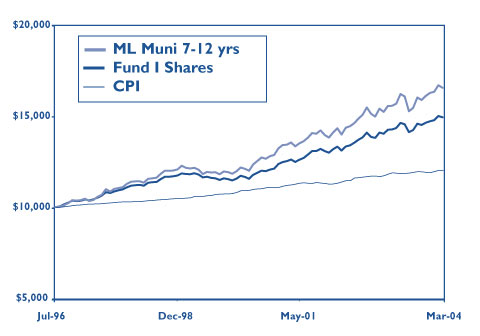
Class I Shares
Average Annual Total Returns
(periods ending 3/31/04)
| One year: | 4 | .69% | |||
| Five years: | 4 | .81% | |||
| Since inception (7/5/96): | 5 | .53% | |||
There is no up front sales charge for this class of shares.
Past performance is no guarantee of future results. Current returns may be either lower or higher than those shown. Share prices and returns will fluctuate and investors may experience a loss upon redemption. There is no guarantee that the Fund will meet its objectives. Shares in the Fund carry risks, including possible loss of principal.
Carefully consider the Fund’s investment objectives, risks, sales charges, and expenses; this is found in the prospectus, which is available from your financial advisor or from www.thornburg.com. Read it carefully before you invest or send money.
For month-end performance information, visit www.thornburg.com.
The Merrill Lynch 7-12 Year Municipal Bond Index represents a broad measure of market performance. It is a model portfolio of municipal obligations throughout the U.S., with an average maturity which ranges from seven to twelve years. The Consumer Price Index (“CPI”) measures prices of a fixed basket of goods bought by a typical consumer, including food, transportation, shelter, utilities, clothing, medical care, entertainment and other items. The CPI, published by the Bureau of Labor Statistics in the Department of Labor, is based at 100 in 1982 and is released monthly. It is widely used as a cost-of-living benchmark to adjust Social Security payments and other payment schedules, union contracts and tax brackets. Also known as the cost-of-living index. Unless otherwise noted, index returns reflect the reinvestment of income dividends and capital gains, if any, but do not reflect fees, brokerage commissions or other expenses of investing. Investors may not make direct investments into any index.
22
March 31, 2004
Thornburg Intermediate municipal fund
I shares
Outperformed Tax-Free Money Market Funds
(Unaudited)
Investors sometimes ask us to compare Thornburg Intermediate Municipal Fund to money market fund returns. These investments have certain differences, and investors in Thornburg Intermediate Municipal Fund took more risk than money market fund investors to earn their higher returns.
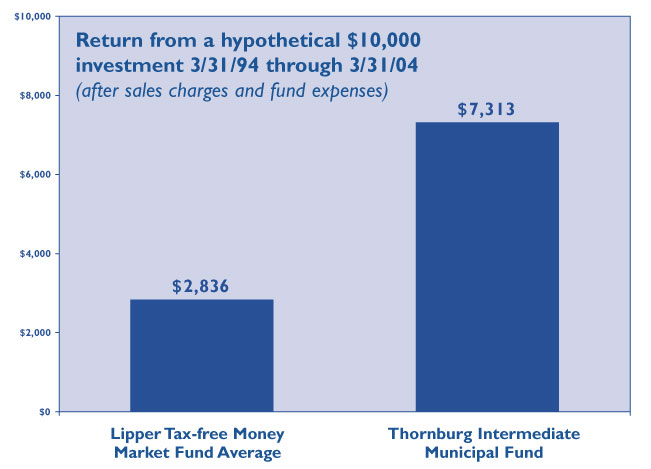
The chart above is for the Fund’s Class I Shares. Class I Shares have different sales charges and expenses than Class A and Class C shares of the Fund. See the inside front cover page for the 30-day SEC yield and the total returns at NAV for one year, three years, five years, and since inception for Class I shares of the Fund.
*Prior to 7/5/96 the illustration includes actual returns of the Class A shares adjusted for the lower Institutional expenses.
Note 1: Future increases, if any, of any of these investments may bear no relationship to prior increases. Quotations for the money fund averages are based upon 30-day yield quotations for tax-exempt money funds as sourced from the ” Lipper Tax-free Money Market Average” for the months covered by this analysis. The increase for the Class I Shares of Thornburg Intermediate Municipal Fund is based upon the dividends paid for the months covered by this analysis, the beginning NAV price at $12.85 per share and the ending NAV at $13.58 per share. These investments returned the $10,000 initial investment in addition to the amounts shown above.
Note 2: This analysis does not take into account the effect, if any, caused by state and local income taxes. The portion of the increase, if any, of Thornburg Intermediate Municipal Fund representing appreciation of the share price is assumed to be taxed at a 15% federal tax rate. The average money market fund increases shown above may differ from the return of a particular money market fund. It is not possible to invest in this money fund average.
Note 3: Generally, money market funds seek to maintain an investment portfolio with an average maturity of 90 days or less. Thornburg Intermediate Municipal Fund invests in short-to-intermediate maturity municipal obligations. The net asset value of the money funds did not fluctuate. The net asset value of the Class I Shares of THMIX did vary from time to time, and will continue to vary in the future due to the effect of changes in interest rates on the value of the investments the Fund holds. The analysis assumes that the investor received the net asset value of the shares owned, plus accrued income, at time of sale. Redemptions are made at the then current net asset value, which may give you a gain or loss when you sell your shares.
Note 4: This analysis assumes that the dividends from each of these investment vehicles were reinvested and compounded monthly. Most money funds declare dividends daily and pay them monthly. Thornburg Intermediate Municipal Fund also declares dividends daily and pays them monthly.
23
Investment Manager Thornburg Investment Management, Inc.
119 East Marcy Street Santa Fe, New Mexico 87501
800.847.0200
Principal Underwriter Thornburg Securities Corporation
119 East Marcy Street Santa Fe, New Mexico 87501
800.847.0200
This report is submitted for the general information of shareholders of the Fund. It is not authorized for distribution to prospective investors in the Fund unless preceded or accompanied by an effective prospectus. Carefully consider information in the prospectus regarding the Fund’s investment objectives and policies, risks, sales charges, expenses, experience of its management, marketability of shares, and other information. Performance data quoted represent past performance and do not guarantee future results.
www.thornburg.com
Thornburg Value Fund
Semi-Annual Report March 31, 2004


William V. Fries, CFA
Portfolio Manager
Thornburg Value Fund
Letter to shareholders
Dear Fellow Shareholder,
Investment performance for the quarter ended March 31, 2004 was positive. Even though equity prices eroded near the end of the period in the U.S. and most other developed markets (in local currency), performance results were good on both an absolute basis and relative to benchmarks. Economic and business developments remain encouraging. A robust recovery from recessionary forces in place since 2000 is well underway. Corporate earnings are rising at a healthy pace; with inflationary pressures still containable, the business environment for stocks is reasonable. Evidence is accumulating, however, that inflation will accelerate in the absence of monetary and fiscal discipline. It is encouraging to see the U.S. Dollar rallying against the Euro and the Yen, because this does take some of the pricing pressure off dollar traded commodities—a current source of inflationary cost pressure.
Though the economic and business environment may be sound, the psychological environment for stocks is challenging. The high level of anxiety from daunting uncertainties—such as the situation in Iraq and large fiscal and trade deficits—undermines investor confidence. These issues and a related upward shift in the yield curve are a rational constraint on equity valuations. Credit sensitive stocks of all stripes have become suspect of earnings estimate contraction and have come under selling pressure recently. Even financial service companies likely to benefit or remain unaffected by higher rates have traded lower. Nonetheless, the financial service stocks we hold represent compelling values and are held in part because of business models allowing earnings improvement even in an adverse interest rate environment. Company earnings and cash flow growth ultimately drive stock prices, especially when valuation is compelling.
Despite all we have been through in the past couple of years, a modicum of confidence seems to underpin equity markets. Our portfolio seeks to achieve capital appreciation through the acquisition of promising companies when they are available at a discount to their intrinsic values. This normally occurs when the companies are out of favor or suffering weakness for some controversial or transitory reason. Our stocks are selected one company at a time—based on fundamental research, analysis, and independent judgment. The portfolio is currently focused on approximately 50 stocks, but is adequately diversified to keep risk under control. All stocks may not be performing well simultaneously. For instance, in the quarter just ended, a number of healthcare service holdings such as Caremark (CMX), Quest Diagnostics (DGX), Anthem (ATH), performed well. Media and communications issues such as Comcast (CMCSK), Time Warner (TWX), and Nextel (NXTL) did not. Caremark and Quest hit target prices. We took profits in Quest, and trimmed Caremark for risk control reasons. Underperforming stocks are re-examined for validation of our investment thesis. All three of our underperforming media and communication stocks remain in the portfolio.
1
April 15, 2004
Thornburg Value Fund
Letter to shareholders, Continued
While the investment environment may be one of rational caution at the moment, it is also an environment in which societal change is being recognized in the marketplace. Companies with exceptional revenue and earnings growth tied to these changes are receiving considerable investor attention. Portfolio diversification to include what we call emerging franchises includes younger and high-potential equities. Companies that are involved in the use of the internet are illustrative. Despite the excess exuberance of the market related to the internet in 2000, the internet has become part of a daily routine for most of us and a number of franchises relating to this service have moved from an embryonic stage to real businesses. A couple of our holdings have promising businesses in this area: Interactive Corp (IACI) and E-Trade (ET) are examples. Holdings in which the primary business is telecommunications or media also are benefiting. Comcast, Nextel, and Electronic Arts (ERTS), are all expected to generate some portion of revenues from internet linked services. Because companies involved in this type of business tend to be more volatile than the average stock, we limit the amount of exposure to companies of this nature. The majority of Thornburg Value Fund holdings are what we classify as basic values or consistent earners. These represent holdings of firms that are better established in more mature industries.
On the following pages, you will find the management’s discussion of your Fund’s performance. Also, you can learn a good deal more about our investment philosophy and portfolios by visiting our website at www.thornburg.com/funds. We include descriptive information on each holding, a link to company websites, up-to-date performance information, and a monthly market commentary.
Thank you for your trust and confidence. We are confident that your Thornburg Value Fund is well positioned and we look forward to more clarity on what seems an unusual number of investment environment uncertainties.
Sincerely,
William V. Fries, CFA
Portfolio Manager
2
Thornburg Value Fund
management’s discussion of performance
| Value Fund | 1Q-04 | 6 Mos. | 1 Yr | 3 Yrs | 5 Yrs | Incep. | |
|---|---|---|---|---|---|---|---|
| A shares (TVAFX) | NAV | 2.23% | 13.16% | 40.09% | 0.61% | 4.61% | 14.02% |
| 10/2/95 Inception | POP | -2.36% | 8.06% | 33.80% | -0.93% | 3.66% | 13.41% |
| B Shares (TVBFX) | NAV | 2.03% | 12.64% | 38.80% | -0.25% | -- | -2.75% |
| 4/3/00 Inception | POP | -2.97%* | 7.64%* | 33.80%* | -1.43%* | -- | -3.61%* |
| C Shares (TVCFX) | NAV | 2.06% | 12.74% | 38.90% | -0.18% | 3.79% | 13.13% |
| 10/2/95 Inception | POP | 1.06%* | 11.74%* | 37.90%* | -0.18% | 3.79% | 13.13% |
| S&P 500 Index (since 10/2/95) | 1.69% | 14.07% | 35.12% | 0.63% | -1.20% | 9.83% |
Performance
| Your Thornburg Value Fund outperformed the broad-based S&P 500 Index during the quarter ended March 31, 2004. The Fund was up 2.23% compared to 1.69% for the index. Performance was driven by a diverse group of holdings. Samsung Electronics Co. Ltd. (05930 KS), Amerada Hess Corp. (AHC), Caremark Rx Inc., and AON Corp. (AOC) were top contributors to performance, each hailing from a different industry (technology, energy, healthcare, and insurance). Not every investment had a positive impact on the portfolio; Union Pacific Corp. (UNP), Nextel Communications Inc., Seagate Technology (STX), and Comcast Corp. were among the main detractors from the Fund’s overall performance. From an industry-level perspective, the Fund’s performance was limited by its lack of exposure and poor performance in the telecommunications industry, but was boosted by strong performance from healthcare and technology holdings in a quarter when overall performance of the two industries within the index was negative. |
Performance Impact during 1st quarter 2004
| Top Contributors | Top Detractors | ||
|---|---|---|---|
| Samsung Electronics Co. Ltd. | Union Pacific Corp. | ||
| Amerada Hess Corp. | Nextel Communications Inc. | ||
| Caremark RxInc | Seagate Technology | ||
| Aon Corp. | Comcast Corp. | ||
| Lincoln National Corp. | Interactive Corp. | ||
Total returns for periods greater than one year are annualized averages. *Assumes redemption during the period.
A-share data presented includes the effects of the maximum sales charge of 4.50% and the reinvestment of dividends and capital gains. The B-share total return figures at POP include subtraction of the maximum contingent deferred sales charge (CDSC): if redeemed within one year of purchase, the CDSC is 5.00%; within two years, 4.25%; within three years, 3.50%; within four years, 2.75%; within five years, 2.00%; within six years, 1.25%; within seven years, 0.50%. There is no charge for redemption within the eighth year after purchase. Total return figures at the public offering price for the C shares include a 1% CDSC for the first year only.
Past performance is no guarantee of future results. Current returns may be either lower or higher than those shown. Share prices and returns will fluctuate and investors may experience a loss upon redemption. There is no guarantee that the Fund will meet its objectives. Shares in the Fund carry risks, including possible loss of principal. They are not deposits or obligations of, or guaranteed or endorsed by, any bank, the Federal Deposit Insurance Corporation, the Federal Reserve Board or any government agency.
Carefully consider the Fund’s investment objectives, risks, sales charges, and expenses; this information is found in the prospectus, which is available from your financial advisor or from www.thornburg.com. Read it carefully before you invest or send money.
For month-end performance information, or for information and commentary on Fund holdings, including links to each company’s home page, visit www.thornburg.com.
There are special risk considerations associated with international investing, including fluctuating exchange rates, government regulations and differences in liquidity, which may affect the volatility of the Fund.
The Standard & Poor’s 500 Stock Index (S&P 500) is an unmanaged index generally representative of the U.S. Stock Market, without regard to company size.
3
Thornburg Value Fund
management’s discussion of performance, Continued
March 31, 2004
Activity
Investment activity during the quarter was moderate. Six holdings were added to the portfolio, while eight were eliminated. Among new holdings were healthcare companies Amerisource Bergen Corp. and Anthem Inc., financial firm Price T Rowe Group Inc. (TROW), and energy holding Exxon Mobil Corp. (XOM). Eliminated holdings included Bank of Ireland (IRE), Marathon Oil Corp. (MRO), and Quest Diagnostics, all of which reached target prices. Freddie Mac (FRE) was consolidated into Fannie Mae (FNM), which is now the portfolio’s largest holding. H.J. Heinz Co. (HNZ), Circuit City Stores Inc. (CG), and El Paso Corp. (EP) were sold because of deterioration of fundamentals supporting the investment thesis for each company.
| Activity during 1st quarter 2004 | |||||
|---|---|---|---|---|---|
| New Holdings | Eliminated Holdings | ||||
| Amerisourcebergen Corp. | Alliance Capital Management Holdings LP | ||||
| Anthem Inc. | Bank of Ireland | ||||
| Exxon Mobil Corp. | Circuit City Stores Inc. | ||||
| FTI Consulting Inc. | El Paso Corp. | ||||
| NII Holdings Inc. | Freddie Mac | ||||
| Price T Rowe Group Inc. | HJ Heinz Co. | ||||
| -- | Marathon Oil Corp. | ||||
| -- | Quest Diagnostics | ||||
| Top 10 Holdings | |||||||||||
|---|---|---|---|---|---|---|---|---|---|---|---|
| 12/31/03 | 3/31/04 | ||||||||||
| E Trade Financial Corp. | 3 | .4% | Fannie Mae | 3 | .7% | ||||||
| Citigroup Inc. | 3 | .1% | Samsung Electronics Co. Ltd | 3 | .3% | ||||||
| Pfizer Inc. | 3 | .0% | Pfizer Inc. | 3 | .2% | ||||||
| The St. Paul Cos. Inc. | 2 | .8% | Citigroup Inc. | 3 | .1% | ||||||
| Unocal Corp. | 2 | .7% | Marsh & McLennan Cos. Inc. | 2 | .9% | ||||||
| Comcast Corp. | 2 | .7% | Alltell Corp. | 2 | .9% | ||||||
| Amerada Hess Corp. | 2 | .5% | Amerada Hess Corp. | 2 | .9% | ||||||
| Fannie Mae | 2 | .5% | AON Corp. | 2 | .8% | ||||||
| Wells Fargo & Co. | 2 | .4% | St. Paul Cos. Inc. | 2 | .6% | ||||||
| Hughes Electronics Corp. | 2 | .4% | Unocal Corp. | 2 | .6% | ||||||
Portfolio Diversification
During the quarter the industry exposure of your Fund continued to be well diversified. Exposure to the telecommunications industry increased with the addition of NII Holdings Inc. (NIHD), while exposure to the energy industry decreased as a result of the elimination of Marathon Oil Corp. and El Paso Corp. Exposure to other industries remained fairly stable. Capitalization exposure during
| Top 10 Industries | |||||||||||
|---|---|---|---|---|---|---|---|---|---|---|---|
| 12/31/03 | 3/31/04 | ||||||||||
| Diversified Financials | 10 | .8% | Diversified Financials | 10 | .8% | ||||||
| Energy | 10 | .3% | Insurance | 10 | .6% | ||||||
| Media | 9 | .3% | Telecommunication Services | 9 | .3% | ||||||
| Insurance | 9 | .2% | Technology - Hardware & Equip.8.8% | ||||||||
| Technology - Hardware & Equip | 8 | .8% | Healthcare Equip. & Services | 8 | .0% | ||||||
| Banks | 7 | .8% | Media | 7 | .9% | ||||||
| Retailing | 7 | .8% | Retailing | 6 | .6% | ||||||
| Healthcare Equipment & Services | 6 | .3% | Banks | 6 | .5% | ||||||
| Software & Services | 5 | .4% | Energy | 6 | .3% | ||||||
| Pharmaceuticals & Biotechnology | 5 | .3% | Software & Services | 5 | .3% | ||||||
4
Thornburg Value Fund
management’s discussion of performance, Continued
March 31, 2004
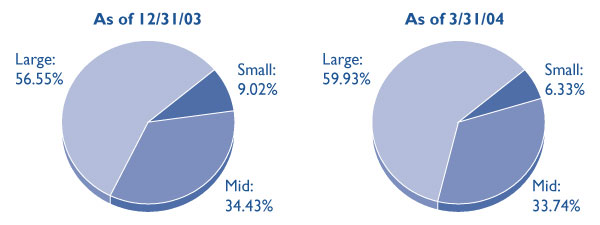
| the quarter remained relatively unchanged. The largest amount of exposure was to large cap holdings (greater than $8 billion market cap), consistent with the Fund’s investment philosophy. New opportunities in the market were primarily found in stocks we consider consistent earners. This is an indication that many cyclical value stocks have appreciated to price levels that are not as attractive as they once were, and that value in the market is now being found in stocks that exhibit the ability to consistently grow earnings as the economy recovers. |
5
| Statement of assets and liabilities | |||||
|---|---|---|---|---|---|
| Thornburg Value Fund | March 31, 2004 | ||||
| (Unaudited) | |||||
| ASSETS | |||||
| Investments at value (cost $1,889,095,638) | $ | 2,165,479,173 | |||
| Cash | 3,298,416 | ||||
| Cash denominated in foreign currency (cost $423,791) | 442,828 | ||||
| Receivable for securities sold | 1,468,008 | ||||
| Receivable for fund shares sold | 6,565,117 | ||||
| Dividends receivable | 6,182,589 | ||||
| Interest receivable | 1,994,715 | ||||
| Prepaid expenses and other assets | 97,697 | ||||
| Total Assets | 2,185,528,543 | ||||
| LIABILITIES | |||||
| Payable for securities purchased | 20,329,124 | ||||
| Payable for fund shares redeemed | 1,667,063 | ||||
| Payable to investment advisor (Note 3) | 1,633,967 | ||||
| Accounts payable and accrued expenses | 1,519,119 | ||||
| Dividends payable | 2,908,620 | ||||
| Total Liabilities | 28,057,893 | ||||
| NET ASSETS | $ | 2,157,470,650 | |||
| NET ASSETS CONSIST OF: | |||||
| Undistributed net investment gain (loss) | $ | 3,897,875 | |||
| Net unrealized appreciation (depreciation) on investments | 276,500,684 | ||||
| Accumulated net realized gain (loss) | (315,360,325 | ) | |||
| Net capital paid in on shares of beneficial interest | 2,192,432,416 | ||||
| $ | 2,157,470,650 | ||||
| NET ASSET VALUE: | |||||
| Class A Shares: | |||||
| Net asset value and redemption price per share | |||||
| ($1,184,777,388 applicable to 39,887,250 shares of beneficial interest outstanding - Note 4) | $ | 29.70 | |||
| Maximum sales charge, 4.50% of offering price | 1.40 | ||||
| Maximum Offering Price Per Share | $ | 31.10 | |||
| Class B Shares: | |||||
| Net asset value and offering price per share * | |||||
| ($102,991,535 applicable to 3,589,406 shares of beneficial interest outstanding - Note 4) | $ | 28.69 | |||
| Class C Shares: | |||||
| Net asset value and offering price per share * | |||||
| ($526,172,414 applicable to 18,164,914 shares of beneficial interest outstanding - Note 4) | $ | 28.97 | |||
| Class I Shares: | |||||
| Net asset value, offering, and redemption price per share | |||||
| ($341,281,561 applicable to 11,323,871 shares of beneficial interest outstanding - Note 4) | $ | 30.14 | |||
| Class R-1 Shares: | |||||
| Net asset value, offering, and redemption price per share | |||||
| ($2,247,752 applicable to 75,651 shares of beneficial interest outstanding - Note 4) | $ | 29.71 | |||
*Redemption price per share is equal to net asset value less any applicable contingent deferred sales charge.
See notes to financial statements.
6
| Statement of Operations | |||||
|---|---|---|---|---|---|
| Thornburg Value Fund | Six Months Ended March 31, 2004 | ||||
| (Unaudited) | |||||
| INVESTMENT INCOME | |||||
| Dividend income (net of foreign taxes withheld of $476,389) | $ | 16,599,858 | |||
| Interest income | 5,840,127 | ||||
| Other income | 293 | ||||
| Total Income | 22,440,278 | ||||
| EXPENSES | |||||
| Investment advisory fees (Note 3) | 7,999,526 | ||||
| Administration fees (Note 3) | |||||
| Class A Shares | 690,291 | ||||
| Class B Shares | 62,151 | ||||
| Class C Shares | 310,012 | ||||
| Class I Shares | 75,939 | ||||
| Class R-1 Shares | 162 | ||||
| Distribution and service fees (Note 3) | |||||
| Class A Shares | 1,405,361 | ||||
| Class B Shares | 511,628 | ||||
| Class C Shares | 2,524,348 | ||||
| Class R-1 Shares | 687 | ||||
| Transfer agent fees | |||||
| Class A Shares | 637,150 | ||||
| Class B Shares | 94,735 | ||||
| Class C Shares | 376,360 | ||||
| Class I Shares | 84,630 | ||||
| Class R-1 Shares | 1,396 | ||||
| Registration & filing fees | |||||
| Class A Shares | 11,705 | ||||
| Class B Shares | 9,397 | ||||
| Class C Shares | 9,946 | ||||
| Class I Shares | 10,587 | ||||
| Class R-1 Shares | 7,794 | ||||
| Custodian fees (Note 3) | 278,904 | ||||
| Professional fees | 75,010 | ||||
| Accounting fees | 67,050 | ||||
| Trustee fees | 20,835 | ||||
| Other expenses | 112,542 | ||||
| Total Expenses | 15,378,146 | ||||
| Less: | |||||
| Expenses reimbursed by investment advisor (Note 3) | (9,439 | ) | |||
| Fees paid indirectly (Note3) | (4,654 | ) | |||
| Net Expenses | 15,364,053 | ||||
| Net Investment Income | $ | 7,076,225 | |||
| REALIZED AND UNREALIZED GAIN (LOSS) | |||||
| Net realized gain (loss) on: | |||||
| Investments | $ | 101,596,317 | |||
| Foreign currency transactions | 7,963 | ||||
| -- | 101,604,280 | ||||
| Net change in unrealized appreciation (depreciation) on: | |||||
| Investments | 126,425,531 | ||||
| Foreign currency translation | 91,370 | ||||
| -- | 126,516,901 | ||||
| Net Realized and Unrealized | |||||
| Gain (Loss) on Investments | 228,121,181 | ||||
| Net Increase (Decrease) in Net Assets Resulting | |||||
| From Operations | $ | 235,197,406 | |||
See notes to financial statements.
8
Thornburg Value Fund
Statements of Changes in net assets
| Six Months Ended March 31, 2004 | Year Ended September 30, 2003 | |||||||
|---|---|---|---|---|---|---|---|---|
| INCREASE (DECREASE) IN NET ASSETS FROM: | ||||||||
| OPERATIONS: | ||||||||
| Net investment income gain (loss) | $ | 7,076,225 | $ | 7,313,471 | ||||
| Net realized gain (loss) on investments and foreign currency | ||||||||
| transactions | 101,604,280 | (71,469,466 | ) | |||||
| Increase (Decrease) in unrealized appreciation (depreciation ) | ||||||||
| on investments and foreign currency translation | 126,516,901 | 418,721,057 | ||||||
| Net Increase (Decrease) in Net Assets | ||||||||
| Resulting from Operations | 235,197,406 | 354,565,062 | ||||||
| DIVIDENDS TO SHAREHOLDERS: | ||||||||
| From net investment income | ||||||||
| Class A Shares | (1,994,363 | ) | (608,906 | ) | ||||
| Class B Shares | (1,328 | ) | 0 | |||||
| Class C Shares | (93,549 | ) | 0 | |||||
| Class I Shares | (817,584 | ) | (313,321 | ) | ||||
| Class R-1 Shares | (1,797 | ) | 0 | |||||
| From return of capital | ||||||||
| Class A Shares | 0 | (841,616 | ) | |||||
| Class I Shares | 0 | (433,066 | ) | |||||
| FUND SHARE TRANSACTIONS - (Note 4) | ||||||||
| Class A Shares | 61,882,012 | (9,595,663 | ) | |||||
| Class B Shares | 1,857,939 | 1,176,900 | ||||||
| Class C Shares | 28,277,969 | (15,910,000 | ) | |||||
| Class I Shares | 45,500,208 | 1,829,284 | ||||||
| Class R-1 Shares | 2,232,993 | 75 | ||||||
| Net Increase (Decrease) in Net Assets | 372,039,906 | 329,868,749 | ||||||
| NET ASSETS: | ||||||||
| Beginning of period | 1,785,430,744 | 1,455,561,995 | ||||||
| End of period | $ | 2,157,470,650 | $ | 1,785,430,744 | ||||
See notes to financial statements.
9
Thornburg Value Fund
Notes to financial statements
NOTE 1 – ORGANIZATION Thornburg Value Fund, hereinafter referred to as the “Fund,” is a diversified series of Thornburg Investment Trust (the “Trust”). The Trust was organized as a Massachusetts business trust under a Declaration of Trust dated June 3, 1987 and is registered as a diversified, open-end management investment company under the Investment Company Act of 1940, as amended. The Trust is currently issuing nine series of shares of beneficial interest in addition to those of the Fund: Thornburg Limited Term U.S. Government Fund, Thornburg New Mexico Intermediate Municipal Fund, Thornburg Intermediate Municipal Fund, Thornburg Limited Term Income Fund, Thornburg Florida Intermediate Municipal Fund, Thornburg International Value Fund, Thornburg Core Growth Fund, Thornburg New York Intermediate Municipal Fund, and Thornburg Investment Income Builder Fund. Each series is considered to be a separate entity for financial reporting and tax purposes and bears expenses directly attributable to it. The Fund seeks long-term capital appreciation by investing primarily in domestic equity securities selected on a value basis.
The Fund currently offers five classes of shares of beneficial interest, Class A, Class B, Class C, Institutional Class (Class I) and Retirement Class (Class R-1) shares. Each class of shares of a Fund represents an interest in the same portfolio of investments of the Fund, except that (i) Class A shares are sold subject to a front-end sales charge collected at the time the shares are purchased and bear a service fee, (ii) Class B shares are sold at net asset value without a sales charge at the time of purchase, but are subject to a contingent deferred sales charge upon redemption and bear both a service fee and distribution fee, (iii) Class C shares are sold at net asset value without a sales charge at the time of purchase, but are subject to a contingent deferred sales charge upon redemption within one year, and bear a service fee and a distribution fee, (iv) Class I shares are sold at net asset value without a sales charge at the time of purchase, (v) Class R-1 shares are sold at net asset value without a sales charge at the time of purchase but bear both a service fee and distribution fee, and (vi) the respective classes have different reinvestment privileges. Additionally, the Fund may allocate among its classes certain expenses, to the extent allowable to specific classes, including transfer agent fees, government registration fees, certain printing and postage costs, and administrative and legal expenses. Currently, class specific expenses of the Fund are limited to service and distribution fees, administration fees and certain registration and transfer agent expenses. Class B shares of the Fund outstanding for eight years will convert to Class A shares of the Fund.
NOTE 2 – SIGNIFICANT ACCOUNTING POLICIES Significant accounting policies of the Fund are as follows:
Valuation of Securities: In determining net asset value, investments are stated at value based on latest sales prices, normally at 4:00 pm EST reported on national securities exchanges on the last business day of the period. Investments for which no sale is reported are valued at the mean between bid and asked prices or in accordance with such other method as the Trustees may authorize. Securities for which market quotations are not readily available are valued at fair value as determined by management and approved in good faith by the Board of Trustees. Short term obligations having remaining maturities of 60 days or less are valued at amortized cost, which approximates market value.
Foreign Currency Translation: Portfolio securities and other assets and liabilities denominated in foreign currencies are translated into U.S. dollars based on the exchange rate of such currencies against the U.S. dollar on the date of valuation. Purchases and sales of securities and income items denominated in foreign currencies are translated into U.S. dollars at the exchange rate in effect on the translation date. When the Fund purchases or sells foreign securities it will customarily enter into a foreign exchange contract to minimize foreign exchange risk from the trade date to the settlement date of such transactions.
The Fund does not separately report the effect of changes in foreign exchange rates from changes in market prices on securities held. Such changes are included in net realized and unrealized gain or loss from investments.
Reported net realized foreign exchange gains or losses arise from sales of foreign currencies, currency gains or losses realized between the trade and settlement dates on securities transactions and the difference between the amount of interest recorded on the Fund’s books, and the U.S. dollar equivalent of the amounts actually received or paid.
Federal Income Taxes: It is the policy of the Fund to comply with the provisions of the Internal Revenue Code applicable to “regulated investment companies” and to distribute all of its taxable income to its shareholders. Therefore, no provision for Federal income tax is required.
When-Issued and Delayed Delivery Transactions: The Fund may engage in when-issued or delayed delivery transactions. To the extent the Fund engages in such transactions, it will do so for the purpose of acquiring portfolio securities consistent with its investment objectives and not for the purpose of investment leverage or to speculate on market changes. At
10
Thornburg Value Fund
Notes to financial statements, continued
March 31, 2004
the time the Fund makes a commitment to purchase a security on a when-issued basis, it will record the transaction and reflect the value in determining its net asset value. When effecting such transactions, assets of the Fund of an amount sufficient to make payment for the portfolio securities to be purchased will be segregated on the Fund’s records on the trade date.
Dividends: Dividends to shareholders are generally paid quarterly and are reinvested in additional shares of the Fund at net asset value per share at the close of business on the dividend payment date, or at the shareholder’s option, paid in cash. Net realized capital gains, to the extent available, will be distributed at least annually. Distributions to shareholders are based on income tax regulations and therefore, their characteristics may differ for financial statement and tax purposes.
General: Securities transactions are accounted for on a trade date basis. Interest income is accrued as earned and dividend income is recorded on the ex-dividend date. Certain income from foreign securities is recognized as soon as information is available to the Fund. Realized gains and losses from the sale of securities are recorded on an identified cost basis. Net investment income, other than class specific expenses, and realized and unrealized gains and losses, are allocated daily to each class of shares based upon the relative net asset value of outstanding shares of each class of shares at the beginning of the day (after adjusting for the current share activity of the respective class). Expenses common to all funds are allocated among the funds comprising the Trust based upon their relative net asset values or other appropriate allocation methods.
Guarantees and Indemnifications: Under the Trust’s organizational documents, its officers and trustees are indemnified against certain liability arising out of the performance of their duties to the Fund. Additionally, in the normal course of business the Trust enters into contracts with service providers that contain general indemnification clauses. The Trust’s maximum exposure under these arrangements is unknown. However, based on experience, the Trust expects the risk of loss to be remote.
Use of Estimates: The preparation of financial statements, in conformity with generally accepted accounting principles, requires management to make estimates and assumptions that affect the reported amounts of assets and liabilities and the disclosure of contingent assets and liabilities at the date of the financial statements and the reported amounts of increases and decreases in net assets from operations during the reporting period. Actual results could differ from those estimates.
NOTE 3 — INVESTMENT ADVISORY FEE AND OTHER TRANSACTIONS WITH AFFILIATES
Pursuant to an investment advisory agreement, Thornburg Investment Management, Inc. (the “Advisor”) serves as the investment advisor and performs services to the Fund for which the fees are payable at the end of each month. For the period ended March 31, 2004, these fees were payable at annual rates ranging from .875 of 1% to .675 of 1% of the average daily net assets of the Fund depending on the Fund’s asset size. The Fund also has an administrative services agreement with the Advisor, whereby the Advisor will perform certain administrative services for the shareholders of each class of the Fund’s shares, and for which fees will be payable at an annual rate of up to .125 of 1% of the average daily net assets attributable to each class of shares. For the period ended March 31, 2004, the Advisor voluntarily reimbursed certain class specific expenses and administrative fees of $9,439 for Class R-1 shares.
The Fund has an underwriting agreement with Thornburg Securities Corporation (the “Distributor”), which acts as the distributor of the Fund’s shares. For the period ended March 31, 2004, the Distributor has advised the Fund that it earned net commissions aggregating $108,256 from the sale of Class A shares of the Fund, and collected contingent deferred sales charges aggregating $14,628 from redemptions of Class C shares of the Fund.
Pursuant to a service plan under Rule 12b-1 of the Investment Company Act of 1940, the Fund may reimburse to the Advisor an amount not to exceed .25 of 1% per annum of its average daily net assets attributable to each class of shares of the Fund for payments made by the Advisor to securities dealers and other financial institutions to obtain various shareholder related services. The Advisor may pay out of its own resources additional expenses for distribution of the Fund’s shares.
The Fund has also adopted distribution plans pursuant to Rule 12b-1, applicable only to the Fund’s Class B, Class C, and Class R-1 shares under which the Fund compensates the Distributor for services in promoting the sale of Class B, Class C, and Class R-1 shares of the Fund at an annual rate of up to .75 of 1% of the average daily net assets attributable to Class B, Class C, and Class R-1 shares. Total fees incurred by each class of shares of the Fund under its respective service and distribution Plans for the period ended March 31, 2004 are set forth in the Statement of Operations.
The Fund has an agreement with the custodian bank to indirectly pay a portion of the custodian’s fees through credits earned by the Fund’s cash on deposit with the bank. This
11
Thornburg Value Fund
Notes to financial statements, continued
deposit agreement is an alternative to overnight investments. Custodial fees have been adjusted to reflect amounts that would have been paid without this agreement, with a corresponding adjustment reflected as fees paid indirectly in the statements of operations. For the period ended March 31, 2004, the fees paid indirectly were $4,654.
Certain officers and trustees of the Trust are also officers and/or directors of the Advisor and Distributor. The compensation of unaffiliated trustees is borne by the Trust.
March 31, 2004
NOTE 4 — SHARES OF BENEFICIAL INTEREST
At March 31, 2004 there were an unlimited number of shares of beneficial interest authorized. Sales of Class R-1 shares commenced July 1, 2003. Transactions in shares of beneficial interest were as follows:
| Period Ended March 31, 2004 | Year Ended September 30, 2003 | |||||||||||||
|---|---|---|---|---|---|---|---|---|---|---|---|---|---|---|
| Shares | Amount | Shares | Amount | |||||||||||
| Class A Shares | ||||||||||||||
| Shares sold | 6,856,915 | $ | 197,901,422 | 10,779,879 | $ | 260,163,852 | ||||||||
| Shares issued to shareholders in | -- | -- | 51,321 | 1,323,066 | ||||||||||
| reinvestment of dividends | ||||||||||||||
| Shares repurchased ** | (4,778,638 | ) | (136,019,410 | ) | (12,057,032 | ) | (271,082,581 | ) | ||||||
| Net Increase (Decrease) | 2,078,277 | $ | 61,882,012 | (1,225,832 | ) | $ | (9,595,663 | ) | ||||||
| ** The Fund charges a redemption fee of 1% of the Class A shares exchanged within 90 days of purchase. For the period ended March 31, 2004, $8,441 was netted in the amount reported for shares repurchased | ||||||||||||||
| Class B Shares | ||||||||||||||
| Shares sold | 262,835 | $ | 7,300,130 | 513,612 | $ | 11,953,625 | ||||||||
| Shares repurchased | (194,243 | ) | (5,442,191 | ) | (487,795 | ) | (10,776,725 | ) | ||||||
| Net Increase (Decrease) | 68,592 | $ | 1,857,939 | 25,817 | $ | 1,176,900 | ||||||||
| Class C Shares | ||||||||||||||
| Shares sold | 2,232,155 | $ | 62,719,232 | 2,810,602 | $ | 66,343,222 | ||||||||
| Shares repurchased | (1,228,014 | ) | (34,441,263 | ) | (3,690,038 | ) | (82,253,222 | ) | ||||||
| Net Increase (Decrease) | 1,004,141 | $ | 28,277,969 | (879,436 | ) | $ | (15,910,000 | ) | ||||||
| Class I Shares | ||||||||||||||
| Shares sold | 2,602,698 | $ | 76,317,168 | 3,982,384 | $ | 94,533,465 | ||||||||
| Shares issued to shareholders in | -- | -- | 23,269 | 607,316 | ||||||||||
| reinvestment of dividends | ||||||||||||||
| Shares repurchased ** | (1,060,545 | ) | (30,816,960 | ) | (4,135,473 | ) | (93,311,497 | ) | ||||||
| Net Increase (Decrease) | 1,542,153 | $ | 45,500,208 | (129,820 | ) | $ | 1,829,284 | |||||||
| ** The Fund charges a redemption fee of 1% of the Class I shares exchanged within 90 days of purchase. For the period ended March 31, 2004, $4,224 was netted in the amount reported for shares repurchased | ||||||||||||||
| Class R-1 Shares | ||||||||||||||
| Shares sold | 77,640 | $ | 2,291,771 | 3 | $ | 75 | ||||||||
| Shares repurchased | (1,992 | ) | (58,778 | ) | -- | -- | ||||||||
| Net Increase (Decrease) | 75,648 | $ | 2,232,993 | 3 | $ | 75 | ||||||||
12
Thornburg Value Fund
Notes to financial statements, continued
March 31, 2004
NOTE 5 – SECURITIES TRANSACTIONS
For the period ended March 31, 2004 the Fund had purchase and sale transactions of investment securities excluding short-term securities of $862,612,627 and $709,928,543, respectively.
NOTE 6 – INCOME TAXES
At March 31, 2004, information on the tax components of capital is as follows:
Cost of investments for tax purpose $ 1,889,095,638
| Gross unrealized appreciation on a tax basis | $ 355,301,945 | ||
| Gross unrealized depreciation on a tax basis | (78,918,410 | ) | |
| Net unrealized | |||
| appreciation (depreciation) on investments (tax basis) | $ 276,383,535 | ||
At March 31, 2004, the Fund had tax basis capital losses, which may be carried over to offset future capital gains. Such losses expire as follows:
Capital loss carryovers expiring in:
| 2009 | $ | 11,324,648 | |||
| 2010 | 188,545,264 | ||||
| 2011 | 174,918,826 | ||||
| -- | $ | 374,788,738 | |||
At March 31, 2004, the Fund had deferred currency and capital losses occurring subsequent to October 31, 2002 of $269,729 and $42,175,867, respectively. For tax purposes, such losses will be reflected in the year ended September 30, 2004.
Unutilized tax basis capital losses may be carried forward to offset realized gains in future years. To the extent such carry forwards are used, capital gains distributions may be reduced to the extent provided by regulations.
Net investment income and net realized gain (loss) differ for financial statement and tax purposes primarily due to differing treatments of foreign currency transactions and losses realized subsequent to October 31 on the sale of securities and foreign currencies.
13
| Financial highlights | ||||||
|---|---|---|---|---|---|---|
| Thornburg Value Fund | ||||||
| Six Months Ended | Year Ended September 30, | |||||
| March 31, 2004 | 2003 | 2002 | 2001 | 2000 | 1999 | |
| Class A Shares: | ||||||
| Per Share Performance (for a share outstanding throughout the period)+ | ||||||
| Net asset value, beginning of period | $ 26.29 | $ 20.73 | $ 26.04 | $ 32.98 | $ 26.20 | $ 19.48 |
| Income from investment operations | ||||||
| Net investment income | 0.13 | 0.15 | 0.00(d) | 0.02 | 0.74 | 0.16 |
| Net realized and unrealized | ||||||
| gain (loss) on investments | 3.33 | 5.45 | (5.31) | (6.38) | 7.29 | 6.76 |
| Total from investment operations | 3.46 | 5.60 | (5.31) | (6.36) | 8.03 | 6.92 |
| Less dividends from: | ||||||
| Net investment income | (0.05) | (0.02) | -- | (0.25) | (0.86) | (0.20) |
| Net realized gains | -- | -- | -- | (0.25) | (0.39) | -- |
| Return of Capital | -- | (0.02) | -- | (0.08) | -- | -- |
| Total dividends | (0.05) | (0.04) | -- | (0.58) | (1.25) | (0.20) |
| Change in net asset value | 3.41 | 5.56 | (5.31) | (6.94) | 6.78 | 6.72 |
| Net asset value, end of period | $ 29.70 | $ 26.29 | $ 20.73 | $ 26.04 | $ 32.98 | $ 26.20 |
| Total return (a) | 13.16% | 27.02% | (20.39)% | (19.59)% | 30.68% | 35.50% |
| Ratios/Supplemental Data | ||||||
| Ratios to average net assets: | ||||||
| Net investment income | 0.89% (b) | 0.66% | 0.00%(c) | 0.07% | 2.31% | 0.62% |
| Expenses, after expense reductions | 1.35% (b) | 1.43% | 1.40% | 1.37% | 1.38% | 1.44% |
| Expenses, after expense reductions | ||||||
| and net of custody credits | 1.35% (b) | 1.43% | 1.40% | -- | -- | -- |
| Expenses, before expense reductions | 1.35% (b) | 1.43% | 1.40% | 1.38% | 1.38% | 1.44% |
| Portfolio turnover rate | 36.13% | 82.89% | 76.37% | 71.81% | 72.35% | 62.71% |
| Net assets at end of period (000) | $ 1,184,777 | $ 994,043 | $ 809,229 | $ 1,078,582 | $ 873,433 | $ 360,966 |
(a) Sales loads are not reflected in computing total return, which is not annualized for periods less than one year.
(b) Annualized.
(c) The ratio of net investment loss to average net assets is less than 0.01%.
(d) Net investment loss per share is less than 0.01%.
+ Based on weighted average shares outstanding.
14
| Financial highlights, Continued | |||||
|---|---|---|---|---|---|
| Thornburg Value Fund | |||||
| Six Months Ended | Year Ended September 30, | Period Ended | |||
| March 31, 2004 | 2003 | 2002 | 2001 | September 30, 2000 (c) | |
| Class B Shares: | |||||
| Per Share Performance | |||||
| (for a share outstanding throughout the period)+ | |||||
| Net asset value, beginning of period | $ 25.47 | $ 20.22 | $ 25.61 | $ 32.63 | $ 33.22 |
| Income from investment operations: | |||||
| Net investment income | -- | (0.05) | (0.22) | (0.24) | -- |
| Net realized and unrealized | |||||
| gain (loss) on investments | 3.22 | 5.30 | (5.17) | (6.31) | 0.09 |
| Total from investment operations | 3.22 | 5.25 | (5.39) | (6.55) | 0.09 |
| Less dividends from: | |||||
| Net investment income | -- | -- | -- | (0.19) | (0.68) |
| Net realized gains | -- | -- | -- | (0.25) | -- |
| Return of Capital | -- | -- | -- | (0.03) | -- |
| Total dividends | -- | -- | -- | (0.47) | (0.68) |
| Change in net asset value | 3.22 | 5.25 | (5.39) | (7.02) | (0.59) |
| Net asset value, end of period | $ 28.69 | $ 25.47 | $ 20.22 | $ 25.61 | $ 32.63 |
| Total return (a) | 12.64% | 25.96% | (21.05)% | (20.35)% | 0.25% |
| Ratios/Supplemental Data | |||||
| Ratios to average net assets: | |||||
| Net investment income | 0.02%(b) | (0.22)% | (0.85)% | (0.83)% | 0.02%(b) |
| Expenses, after expense reductions | 2.22%(b) | 2.31% | 2.25% | 2.27% | 2.38%(b) |
| Expenses, after expense reductions | |||||
| and net of custody credits | 2.22%(b) | 2.31% | 2.25% | -- | -- |
| Expenses, before expense reductions | 2.22%(b) | 2.32% | 2.25% | 2.30% | 2.43%(b) |
| Portfolio turnover rate | 36.13% | 82.89% | 76.37% | 71.81% | 72.35% |
| Net assets at end of period (000) | $ 102,992 | $ 89,661 | $ 70,682 | $ 68,740 | $ 17,945 |
(a) Not annualized for periods less than one year.
(b) Annualized.
(c) Effective date of Class B Shares was April 3, 2000.
+ Based on weighted average shares outstanding.
15
| Financial highlights, Continued | ||||||
|---|---|---|---|---|---|---|
| Thornburg Value Fund | ||||||
| Six Months Ended | Year Ended September 30, | |||||
| March 31, 2004 | 2003 | 2002 | 2001 | 2000 | 1999 | |
| Class C Shares: | ||||||
| Per Share Performance | ||||||
| (for a share outstanding throughout the period)+ | ||||||
| Net asset value, beginning of period | $ 25.70 | $ 20.40 | $ 25.82 | $ 32.80 | $ 26.08 | $ 19.45 |
| Income from investment operations: | ||||||
| Net investment income | 0.01 | (0.04) | (0.20) | (0.22) | 0.49 | (0.01) |
| Net realized and unrealized | ||||||
| gain (loss) on investments | 3.27 | 5.34 | (5.22) | (6.34) | 7.23 | 6.71 |
| Total from investment operations | 3.28 | 5.30 | (5.42) | (6.56) | 7.72 | 6.70 |
| Less dividends from: | ||||||
| Net investment income | (0.01) | -- | -- | (0.16) | (0.61) | (0.07) |
| Net realized gains | -- | -- | -- | (0.25) | (0.39) | -- |
| Return of Capital | -- | -- | -- | (0.01) | -- | -- |
| Total dividends | (0.01) | -- | -- | (0.42) | (1.00) | (0.07) |
| Change in net asset value | 3.27 | 5.30 | (5.42) | (6.98) | 6.72 | 6.63 |
| Net asset value, end of period | $ 28.97 | $ 25.70 | $ 20.40 | $ 25.82 | $ 32.80 | $ 26.08 |
| Total return (a) | 12.74% | 25.98% | (20.99)% | (20.24)% | 29.90% | 34.45% |
| Ratios/Supplemental Data | ||||||
| Ratios to average net assets: | ||||||
| Net investment income | 0.09% (b) | (0.16)% | (0.77)% | (0.74)% | 1.53% | (0.17)% |
| Expenses, after expense reductions | 2.15% (b) | 2.25% | 2.17% | 2.18% | 2.16% | 2.23% |
| Expenses, after expense reductions | ||||||
| and net of custody credits | 2.15% (b) | 2.25% | 2.17% | -- | -- | -- |
| Expenses, before expense reductions | 2.15% (b) | 2.25% | 2.17% | 2.19% | 2.17% | 2.23% |
| Portfolio turnover rate | 36.13% | 82.89% | 76.37% | 71.81% | 72.35% | 62.71% |
| Net assets at end of period (000) | $ 526,172 | $ 441,103 | $ 368,038 | $ 437,199 | $ 361,447 | $ 133,934 |
(a) Not annualized for periods less than one year.
(b) Annualized.
+ Based on weighted average shares outstanding.
16
| Financial highlights, Continued | ||||||
|---|---|---|---|---|---|---|
| Thornburg Value Fund | ||||||
| Six Months Ended | Year Ended September 30, | Period Ended | ||||
| March 31, 2004 | 2003 | 2002 | 2001 | 2000 | September 30, 1999(c) | |
| Class I Shares: | ||||||
| Per Share Performance | ||||||
| (for a share outstanding throughout the period)+ | ||||||
| Net asset value, beginning of period | $ 26.64 | $ 20.95 | $ 26.18 | $ 33.09 | $ 26.26 | $ 21.78 |
| Income from investment operations: | ||||||
| Net investment income | 0.19 | 0.26 | 0.11 | 0.14 | 0.91 | 0.25 |
| Net realized and unrealized | ||||||
| gain (loss) on investments | 3.38 | 5.51 | (5.34) | (6.42) | 7.25 | 4.48 |
| Total from investment operations | 3.57 | 5.77 | (5.23) | (6.28) | 8.16 | 4.73 |
| Less dividends from: | ||||||
| Net investment income | (0.07) | (0.03) | -- | (0.28) | (0.94) | (0.25) |
| Net realized gains | -- | -- | -- | (0.25) | (0.39) | -- |
| Return of Capital | -- | (0.05) | -- | (0.10) | -- | -- |
| Total dividends | (0.07) | (0.08) | -- | (0.63) | (1.33) | (0.25) |
| Change in net asset value | 3.50 | 5.69 | (5.23) | (6.91) | 6.83 | 4.48 |
| Net asset value, end of period | $ 30.14 | $ 26.64 | $ 20.95 | $ 26.18 | $ 33.09 | $ 26.26 |
| Total return (a) | 13.41% | 27.55% | (19.98)% | (19.29)% | 31.44% | 21.70% |
| Ratios/Supplemental Data | ||||||
| Ratios to average net assets: | ||||||
| Net investment income | 1.28%(b) | 1.10% | 0.42% | 0.45% | 2.82% | 1.14%(b) |
| Expenses, after expense reductions | 0.97%(b) | 0.99% | 0.98% | 0.99% | 0.99% | 1.00%(b) |
| Expenses, after expense reductions | ||||||
| and net of custody credits | 0.97%(b) | 0.99% | 0.98% | -- | -- | -- |
| Expenses, before expense reductions | 0.97%(b) | 1.03% | 0.99% | 1.01% | 1.00% | 1.13%(b) |
| Portfolio turnover rate | 36.13% | 82.89% | 76.37% | 71.81% | 72.35% | 62.71% |
| Net assets at end of period (000) | $ 341,282 | $ 260,624 | $ 207,613 | $ 293,784 | $ 242,974 | $ 52,357 |
(a) Not annualized for periods less than one year.
(b) Annualized.
(c) Effective date of Class I Shares was November 2, 1998.
+ Based on weighted average shares outstanding.
17
| Financial highlights, Continued | ||
|---|---|---|
| Thornburg Value Fund | ||
| Six Months Ended March 31, 2004 | Period Ended September 30, 2003(c) | |
| Class R-1 Shares: | ||
| Per Share Performance | ||
| (for a share outstanding throughout the period)+ | ||
| Net asset value, beginning of period | $ 26.27 | $ 25.83 |
| Income from investment operations: | ||
| Net investment income | 0.26 | 0.03 |
| Net realized and unrealized | ||
| gain (loss) on investments | 3.20 | 0.41 |
| Total from investment operations | 3.46 | 0.44 |
| Less dividends from: | ||
| Net investment income | (0.02) | -- |
| Total dividends | (0.02) | -- |
| Change in net asset value | 3.44 | 0.44 |
| Net asset value, end of period | $ 29.71 | $ 26.27 |
| Total return (a) | 13.19% | 1.70% |
| Ratios/Supplemental Data | ||
| Ratios to average net assets: | ||
| Net investment income | 1.86%(b) | 0.48%(b) |
| Expenses, after expense reductions | 1.35%(b) | 1.45%(b) |
| Expenses, after expense reductions | ||
| and net of custody credits | 1.34%(b) | 1.45%(b) |
| Expenses, before expense reductions | 8.57%(b) | 44,445.63%(b)* |
| Portfolio turnover rate | 36.13% | 82.89% |
| Net assets at end of period (000) | $ 2,248 | $ - (d) |
(a) Not annualized for periods less than one year.
(b) Annualized.
(c) Effective date of Class R-1 Shares was July 1, 2003.
(d) Net assets at end of year were less than $1,000.
* Due to the size of net assets and fixed expenses, ratios may appear disproportionate.
+ Based on weighted average shares outstanding.
18
| Schedule of investments | ||||||||
|---|---|---|---|---|---|---|---|---|
| Thornburg Value Fund | March 31, 2004 | |||||||
| CUSIPS: CLASS A - 885-215-731, CLASS B - 885-215-590, CLASS C - 885-215-715, CLASS I - 885-215-632, CLASS R-1 - 885-215-533 NASDAQ SYMBOLS: CLASS A - TVAFX, CLASS B - TVBFX, CLASS C - TVCFX, CLASS I - TVIFX, CLASS R-1 - TVRFX | ||||||||
| Shares | Value | |||||||
| COMMON STOCKS-- 95.80% | ||||||||
| AUTOMOBILES & COMPONENTS (2.10%) | ||||||||
| Hyundai Motor Co. | 978,000 | $ | 44,700,772 | |||||
| BANKS (6.50%) | ||||||||
| Lloyds TSB Group PLC | 5,446,500 | 41,449,314 | ||||||
| The Bank of New York Co. Inc. | 1,682,200 | 52,989,300 | ||||||
| Wells Fargo & Co. | 835,400 | 47,342,118 | ||||||
| CAPITAL GOODS (2.20%) | ||||||||
| Deere & Co. | 680,800 | 47,186,248 | ||||||
| COMMERCIAL SERVICES & SUPPLIES (0.90%) | ||||||||
| FTI Consulting Inc. + | 1,236,500 | 20,600,090 | ||||||
| DIVERSIFIED FINANCIALS (10.80%) | ||||||||
| Citigroup Inc. | 1,279,000 | 66,124,300 | ||||||
| E-Trade Financial Corp. + | 3,179,677 | 42,448,688 | ||||||
| Fannie Mae | 1,090,800 | 81,100,980 | ||||||
| Price T Rowe Group Inc. | 815,600 | 43,903,748 | ||||||
| ENERGY (6.30%) | ||||||||
| Amerada Hess Corp. | 962,300 | 62,818,944 | ||||||
| Exxon Mobil Corp. | 447,500 | 18,611,525 | ||||||
| Unocal Corp. | 1,485,000 | 55,360,800 | ||||||
| HEALTHCARE EQUIPMENT & SERVICES (8.00%) | ||||||||
| Amerisourcebergen Corp. | 752,700 | 41,157,636 | ||||||
| Anthem Inc. + | 459,200 | 41,621,888 | ||||||
| Caremark Rx Inc. + | 1,202,200 | 39,973,150 | ||||||
| Health Management Associates | 2,190,255 | 50,835,819 | ||||||
| HOUSEHOLD & PERSONAL PRODUCTS (1.50%) | ||||||||
| American Greetings Corp. + | 1,448,700 | 32,986,899 | ||||||
| INSURANCE (10.60%) | ||||||||
| Aon Corp. | 2,175,700 | 60,723,787 | ||||||
| Lincoln National Corp. | 1,029,022 | 48,693,321 | ||||||
| Marsh & McLennan Cos. Inc. | 1,359,900 | 62,963,370 | ||||||
| The St. Paul Cos | 1,415,100 | 56,618,151 | ||||||
| MEDIA (7.90%) | ||||||||
| AOL Time Warner Inc. + | 2,533,755 | 42,719,109 | ||||||
| Comcast Corp. + | 1,430,200 | 39,873,976 | ||||||
| Directv Group Inc. + | 2,914,185 | 44,820,165 | ||||||
| Fox Entertainment Group Inc. + | 1,576,175 | 42,714,343 | ||||||
| PHARMACEUTICALS & BIOTECHNOLOGY (5.10%) | ||||||||
| Genzyme Corp. + | 870,300 | 40,938,912 | ||||||
| Pfizer Inc. | 1,989,300 | 69,724,965 | ||||||
| REAL ESTATE MANAGEMENT & DEVELOPMENT (2.00%) | ||||||||
| Boston Properties Inc. | 803,400 | 43,632,654 | ||||||
| RETAILING (6.60%) | ||||||||
| InterActiveCorp + | 1,538,075 | $ | 48,587,789 | |||||
| Lowe's Cos. Inc. | 949,200 | 53,278,596 | ||||||
| Target Corp. | 906,400 | 40,824,256 | ||||||
| SOFTWARE & SERVICES (5.30%) | ||||||||
| Affiliated Computer Services Inc. + | 622,090 | 32,286,471 | ||||||
| DoubleClick Inc. + | 2,244,364 | 25,249,095 | ||||||
| Eclipsys Corp. + | 1,866,440 | 25,159,611 | ||||||
| Electronic Arts Inc. + | 587,800 | 31,717,688 | ||||||
| TECHNOLOGY - HARDWARE & EQUIPMENT (8.80%) | ||||||||
| Hewlett-Packard Co. | 1,795,400 | 41,006,936 | ||||||
| Samsung Electronics Co. Ltd. | 141,800 | 70,748,484 | ||||||
| Seagate Technology + | 2,247,300 | 36,248,949 | ||||||
| Texas Instruments Inc. | 1,480,675 | 43,265,324 | ||||||
| TELECOMMUNICATION SERVICES (7.10%) | ||||||||
| Alltel Corp. | 1,262,000 | 62,961,180 | ||||||
| Nextel Communications Inc. + | 1,942,600 | 48,040,498 | ||||||
| NII Holdings Inc. + | 1,203,204 | 42,148,236 | ||||||
| TRANSPORTATION (2.10%) | ||||||||
| Union Pacific Corp. | 777,700 | 46,522,014 | ||||||
| UTILITIES (2.00%) | ||||||||
| Dominion Resources Inc. | 657,200 | 42,257,960 | ||||||
| TOTAL COMMON STOCKS (Cost $1,793,298,225) | -- | 2,074,938,059 | ||||||
| CORPORATE BONDS -- 2.00% | ||||||||
| TELECOMMUNICATION SERVICES (0.90%) | ||||||||
| Level 3 Communications Inc., 9.125%, 5/1/2008 | $ | 23,400,000 | $ | 18,954,000 | ||||
| TRANSPORTATION (1.10%) | ||||||||
| Delta Air Lines Inc., 10.00%, 8/15/2008 | 6,160,000 | 4,373,600 | ||||||
| Delta Air Lines Inc., 7.90%, 12/15/2009 | 5,000,000 | 3,300,000 | ||||||
| Delta Air Lines Inc., 10.125%, 5/15/2010 | 2,900,000 | 1,972,000 | ||||||
| Delta Air Lines Inc., 9.75%, 5/15/2021 | 2,000,000 | 1,240,000 | ||||||
| Delta Air Lines Inc., 8.30%, 12/15/2029 | 24,500,000 | 14,087,500 | ||||||
| TOTAL CORPORATE BONDS (Cost $47,807,408) | -- | 43,927,100 | ||||||
| CONVERTIBLE BONDS -- 1.30% | ||||||||
| TELECOMMUNICATION SERVICES (1.30%) | ||||||||
| Level 3 Communications Inc., 6.00%, 9/15/2009 | 18,700,000 | 11,407,000 | ||||||
| Level 3 Communications Inc., 6.00%, 3/15/2010 | 28,800,000 | 17,208,000 | ||||||
| TOTAL CONVERTIBLE BONDS (Cost $29,990,991) | -- | 28,615,000 | ||||||
| SHORT TERM INVESTMENTS -- 0.90% | ||||||||
| American General Finance, 1.07% due 4/2/2004 | $ | 15,000,000 | $ | 14,999,554 | ||||
| American General Finance, 1.08% due 4/7/2004 | 3,000,000 | 2,999,460 | ||||||
| TOTAL SHORT TERM INVESTMENTS (Cost $17,999,014) | -- | 17,999,014 | ||||||
| TOTAL INVESTMENTS (100%) (Cost $1,889,095,638) | -- | $ | 2,165,479,173 | |||||
| + Non-income producing | ||||||||
| See notes to financial statements | ||||||||
21
Index Comparison
March 31, 2004
The charts below compare performance of Thornburg Value Fund and the Standard & Poor’s 500 Index for the period October 2, 1995 to March 31, 2004. Past performance of the Index and the Fund may not be indicative of future performance. The performance data and graph do not reflect the deduction of taxes that a shareholder would pay on distributions or the redemption of Fund shares.
Thornburg Value Fund Class A Total Returns, Since Inception,versus
S&P 500 Index
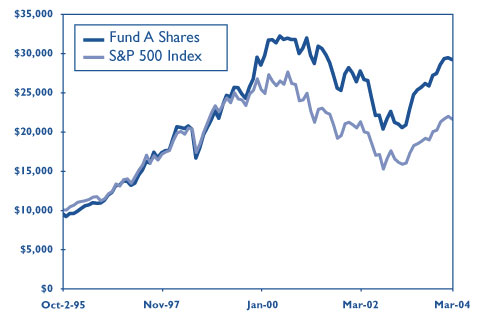
Average Annual Total Returns
(periods ending 3/31/04) (at max. offering price)
| A Shares | |
|---|---|
| 1 Year: | 33.80% |
| 5 Year: | 3.66% |
| From Inception (10/2/95): | 13.41% |
Thornburg Value Fund
index comparisons
Thornburg Value Fund Class C Total Returns, Since Inception, versus S&P 500 Index
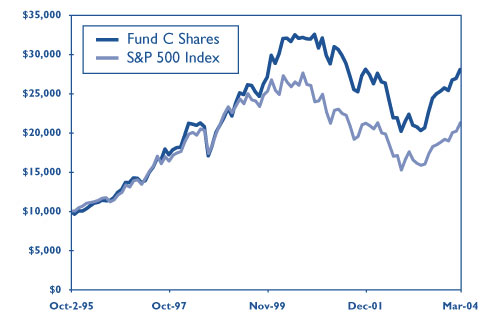
Average Annual Total Returns(periods ending 3/31/04)
| C Shares | |
|---|---|
| 1 Year: | 37.90% |
| 5 Year: | 3.79% |
| From Inception (10/2/95): | 13.13% |
A-share data presented includes the effects of the maximum sales charge of 4.50% and the reinvestment of dividends and capital gains. The B-share total return figures at POP include subtraction of the maximum contingent deferred sales charge (CDSC): if redeemed within one year of purchase, the CDSC is 5.00%; within two years, 4.25%; within three years, 3.50%; within four years, 2.75%; within five years, 2.00%; within six years, 1.25%; within seven years, 0.50%. There is no charge for redemption within the eighth year after purchase. Total return figures at the public offering price for the C shares include a 1% CDSC for the first year only. *Assumes redemption during the period.
Past performance is no guarantee of future results. Current returns may be either lower or higher than those shown. Share prices and returns will fluctuate and investors may experience a loss upon redemption. There is no guarantee that the Fund will meet its objectives. Shares in the Fund carry risks, including possible loss of principal.
Carefully consider the Fund’s investment objectives, risks, sales charges, and expenses; this is found in the prospectus, which is available from your financial advisor or from www.thornburg.com. Read it carefully before you invest or send money.
There are special risk considerations associated with international investing, including fluctuating exchange rates, government regulations and differences in liquidity, which may affect the volatility of the Fund.
For month-end performance information, or for information and commentary on Fund holdings, including links to each company’s home page, visit www.thornburg.com.
The Standard & Poor’s 500 Stock Index (S&P 500) is an unmanaged index generally representative of the U.S. Stock Market, without regard to company size.
Unless otherwise noted, index returns reflect the reinvestment of income dividends and capital gains, if any, but do not reflect fees, brokerage commissions or other expenses of investing. Investors may not make direct investments into any index.
22
Thornburg Value Fund
Portfolio proxy voting
March 31, 2004
Policies and Procedures (Unaudited):
The Trust has delegated to Thornburg Investment Management, Inc. (“the Advisor”) voting decisions respecting proxies for the Fund’s voting securities. The Advisor makes voting decisions in accordance with its Proxy Voting Policy and Procedures. A description of the policy and Procedures is available (i) without charge, upon request, by calling the Advisor toll-free at 1.800.847.0200, (ii) on the Thornburg website at www.thornburg.com, and (iii) on the Securities and Exchange Commission’s website at www.sec.gov.
Commencing August 31, 2004, information regarding how proxies were voted will be available on or before August 31 of each year for the twelve months ending the preceding June 30. This information will be available (i) without charge, upon request, on the Thornburg website at www.thornburg.com and (ii) on the Securities and Exchange Commission’s website at www.sec.gov.
23
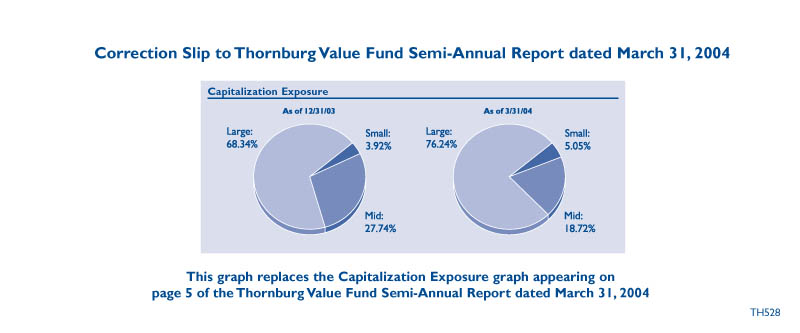
Investment Manager Thornburg Investment Management, Inc.
119 East Marcy Street
Santa Fe, New Mexico 87501
800.847.0200
Principal Underwriter Thornburg Securities Corporation
119 East Marcy Street
Santa Fe, New Mexico 87501
800.847.0200
This report is submitted for the general information of shareholders of the Fund. It is not authorized for distribution to prospective investors in the Fund unless preceded or accompanied by an effective prospectus. Carefully consider information in the prospectus regarding the Fund’s investment objectives and policies, risks, sales charges, expenses, experience of its management, marketability of shares, and other information. Performance data quoted represent past performance and do not guarantee future results.
www.thornburg.com
Thornburg Value Fund I Shares
Semi-Annual Report March 31, 2004
VALUE I
William V. Fries, CFA
Portfolio Manager
Thornburg Value Fund
Letter to shareholders
Dear Fellow Shareholder,
Investment performance for the quarter ended March 31, 2004 was positive. Even though equity prices eroded near the end of the period in the U.S. and most other developed markets (in local currency), performance results were good on both an absolute basis and relative to benchmarks. Economic and business developments remain encouraging. A robust recovery from recessionary forces in place since 2000 is well underway. Corporate earnings are rising at a healthy pace; with inflationary pressures still containable, the business environment for stocks is reasonable. Evidence is accumulating, however, that inflation will accelerate in the absence of monetary and fiscal discipline. It is encouraging to see the U.S. Dollar rallying against the Euro and the Yen, because this does take some of the pricing pressure off dollar traded commodities—a current source of inflationary cost pressure.
Though the economic and business environment may be sound, the psychological environment for stocks is challenging. The high level of anxiety from daunting uncertainties—such as the situation in Iraq and large fiscal and trade deficits—undermines investor confidence. These issues and a related upward shift in the yield curve are a rational constraint on equity valuations. Credit sensitive stocks of all stripes have become suspect of earnings estimate contraction and have come under selling pressure recently. Even financial service companies likely to benefit or remain unaffected by higher rates have traded lower. Nonetheless, the financial service stocks we hold represent compelling values and are held in part because of business models allowing earnings improvement even in an adverse interest rate environment. Company earnings and cash flow growth ultimately drive stock prices, especially when valuation is compelling.
Despite all we have been through in the past couple of years, a modicum of confidence seems to underpin equity markets. Our portfolio seeks to achieve capital appreciation through the acquisition of promising companies when they are available at a discount to their intrinsic values. This normally occurs when the companies are out of favor or suffering weakness for some controversial or transitory reason. Our stocks are selected one company at a time—based on fundamental research, analysis, and independent judgment. The portfolio is currently focused on approximately 50 stocks, but is adequately diversified to keep risk under control. All stocks may not be performing well simultaneously. For instance, in the quarter just ended, a number of healthcare service holdings such as Caremark (CMX), Quest Diagnostics (DGX), Anthem (ATH), performed well. Media and communications issues such as Comcast (CMCSK), Time Warner (TWX), and Nextel (NXTL) did not. Caremark and Quest hit target prices. We took profits in Quest, and trimmed Caremark for risk control reasons. Underperforming stocks are re-examined for validation of our investment thesis. All three of our underperforming media and communication stocks remain in the portfolio.
1
April 15, 2004
Thornburg Value Fund
Letter to shareholders, Continued
While the investment environment may be one of rational caution at the moment, it is also an environment in which societal change is being recognized in the marketplace. Companies with exceptional revenue and earnings growth tied to these changes are receiving considerable investor attention. Portfolio diversification to include what we call emerging franchises includes younger and high-potential equities. Companies that are involved in the use of the internet are illustrative. Despite the excess exuberance of the market related to the internet in 2000, the internet has become part of a daily routine for most of us and a number of franchises relating to this service have moved from an embryonic stage to real businesses. A couple of our holdings have promising businesses in this area: Interactive Corp (IACI) and E-Trade (ET) are examples. Holdings in which the primary business is telecommunications or media also are benefiting. Comcast, Nextel, and Electronic Arts (ERTS), are all expected to generate some portion of revenues from internet linked services. Because companies involved in this type of business tend to be more volatile than the average stock, we limit the amount of exposure to companies of this nature. The majority of Thornburg Value Fund holdings are what we classify as basic values or consistent earners. These represent holdings of firms that are better established in more mature industries.
On the following pages, you will find the management’s discussion of your Fund’s performance. Also, you can learn a good deal more about our investment philosophy and portfolios by visiting our website at www.thornburg.com/funds. We include descriptive information on each holding, a link to company websites, up-to-date performance information, and a monthly market commentary.
Thank you for your trust and confidence. We are confident that your Thornburg Value Fund is well positioned and we look forward to more clarity on what seems an unusual number of investment environment uncertainties.
Sincerely,
William V. Fries, CFA
Portfolio Manager
2
Thornburg Value Fund
management’s discussion of performance
| Value Fund | 1Q-04 | 6 Mos. | 1 Yr | 3 Yrs | 5 Yrs | Incep. | |
|---|---|---|---|---|---|---|---|
| I shares (TVIFX) | NAV | 2.34% | 13.41% | 40.63% | 1.06% | 5.05% | 7.70% |
| 11/2/98 Inception | |||||||
| S&P 500 Index (since 11/2/98) | 1.69% | 14.07% | 35.12% | 0.63% | -1.20% | 1.92% | |
Total returns for periods greater than one year are annualized averages.
There is no up-front sales charge for I shares.
Past performance is no guarantee of future results. Current returns may be either lower or higher than those shown. Share prices and returns will fluctuate and investors may experience a loss upon redemption. There is no guarantee that the Fund will meet its objectives. Shares in the Fund carry risks, including possible loss of principal. They are not deposits or obligations of, or guaranteed or endorsed by, any bank, the Federal Deposit Insurance Corporation, the Federal Reserve Board or any government agency.
Carefully consider the Fund’s investment objectives, risks, sales charges, and expenses; this information is found in the prospectus, which is available from your financial advisor or from www.thornburg.com. Read it carefully before you invest or send money.
For month-end performance information, or for information and commentary on Fund holdings, including links to each company’s home page, visit www.thornburg.com.
There are special risk considerations associated with international investing, including fluctuating exchange rates, government regulations and differences in liquidity, which may affect the volatility of the Fund.
The Standard & Poor’s 500 Stock Index (S&P 500) is an unmanaged index generally representative of the U.S. Stock Market, without regard to company size.
Performance
| Your Thornburg Value Fund outperformed the broad-based S&P 500 Index during the quarter ended March 31, 2004. The Fund was up 2.34% compared to 1.69% for the index. Performance was driven by a diverse group of holdings. Samsung Electronics Co. Ltd. (05930 KS), Amerada Hess Corp. (AHC), Caremark Rx Inc., and AON Corp. (AOC) were top contributors to performance, each hailing from a different industry (technology, energy, healthcare, and insurance). Not every investment had a positive impact on the portfolio; Union Pacific Corp. (UNP), Nextel Communications Inc., Seagate Technology (STX), and Comcast Corp. were among the main detractors from the Fund’s overall performance. From an industry-level perspective the Fund’s performance was limited by its lack of exposure and poor performance in the telecommunications industry, but was boosted by strong performance from healthcare and technology holdings in a quarter when overall performance of the two industries within the index was negative. |
Performance Impact during 1st quarter 2004
| Top Contributors | Top Detractors |
|---|---|
| Samsung Electronics Co. Ltd. | Union Pacific Corp. |
| Amerada Hess Corp. | Nextel Communications Inc. |
| Caremark RxInc | Seagate Technology |
| Aon Corp. | Comcast Corp. |
| Lincoln National Corp. | Interactive Corp. |
3
Thornburg Value Fund
management’s discussion of performance, Continued
March 31, 2004
Activity
Investment activity during the quarter was moderate. Six holdings were added to the portfolio, while eight were eliminated. Among new holdings were healthcare companies Amerisource Bergen Corp. and Anthem Inc., financial firm Price T Rowe Group Inc. (TROW), and energy holding Exxon Mobil Corp. (XOM). Eliminated holdings included Bank of Ireland (IRE), Marathon Oil Corp. (MRO), and Quest Diagnostics, all of which reached target prices. Freddie Mac (FRE) was consolidated into Fannie Mae (FNM), which is now the portfolio’s largest holding. H.J. Heinz Co. (HNZ), Circuit City Stores Inc. (CG), and El Paso Corp. (EP) were sold because of deterioration of fundamentals supporting the investment thesis for each company.
| Activity during 1st quarter 2004 | |||||
|---|---|---|---|---|---|
| New Holdings | Eliminated Holdings | ||||
| Amerisourcebergen Corp. | Alliance Capital Management Holdings LP | ||||
| Anthem Inc. | Bank of Ireland | ||||
| Exxon Mobil Corp. | Circuit City Stores Inc. | ||||
| FTI Consulting Inc. | El Paso Corp. | ||||
| NII Holdings Inc. | Freddie Mac | ||||
| Price T Rowe Group Inc. | HJ Heinz Co. | ||||
| -- | Marathon Oil Corp. | ||||
| -- | Quest Diagnostics | ||||
| Top 10 Holdings | |||||||||||
|---|---|---|---|---|---|---|---|---|---|---|---|
| 12/31/03 | 3/31/04 | ||||||||||
| E Trade Financial Corp. | 3 | .4% | Fannie Mae | 3 | .7% | ||||||
| Citigroup Inc. | 3 | .1% | Samsung Electronics Co. Ltd | 3 | .3% | ||||||
| Pfizer Inc. | 3 | .0% | Pfizer Inc. | 3 | .2% | ||||||
| The St. Paul Cos. Inc. | 2 | .8% | Citigroup Inc. | 3 | .1% | ||||||
| Unocal Corp. | 2 | .7% | Marsh & McLennan Cos. Inc. | 2 | .9% | ||||||
| Comcast Corp. | 2 | .7% | Alltell Corp. | 2 | .9% | ||||||
| Amerada Hess Corp. | 2 | .5% | Amerada Hess Corp. | 2 | .9% | ||||||
| Fannie Mae | 2 | .5% | AON Corp. | 2 | .8% | ||||||
| Wells Fargo & Co. | 2 | .4% | St. Paul Cos. Inc. | 2 | .6% | ||||||
| Hughes Electronics Corp. | 2 | .4% | Unocal Corp. | 2 | .6% | ||||||
Portfolio Diversification
During the quarter the industry exposure of your Fund continued to be well diversified. Exposure to the telecommunications industry increased with the addition of NII Holdings Inc. (NIHD), while exposure to the energy industry decreased as a result of the elimination of Marathon Oil Corp. and El Paso Corp. Exposure to other industries remained fairly stable. Capitalization exposure during
| Top 10 Industries | |||||||||||
|---|---|---|---|---|---|---|---|---|---|---|---|
| 12/31/03 | 3/31/04 | ||||||||||
| Diversified Financials | 10 | .8% | Diversified Financials | 10 | .8% | ||||||
| Energy | 10 | .3% | Insurance | 10 | .6% | ||||||
| Media | 9 | .3% | Telecommunication Services | 9 | .3% | ||||||
| Insurance | 9 | .2% | Technology - Hardware & Equip.8.8% | ||||||||
| Technology - Hardware & Equip | 8 | .8% | Healthcare Equip. & Services | 8 | .0% | ||||||
| Banks | 7 | .8% | Media | 7 | .9% | ||||||
| Retailing | 7 | .8% | Retailing | 6 | .6% | ||||||
| Healthcare Equipment & Services | 6 | .3% | Banks | 6 | .5% | ||||||
| Software & Services | 5 | .4% | Energy | 6 | .3% | ||||||
| Pharmaceuticals & Biotechnology | 5 | .3% | Software & Services | 5 | .3% | ||||||
4
Thornburg Value Fund
management’s discussion of performance, Continued
March 31, 2004
| the quarter remained relatively unchanged. The largest amount of exposure was to large cap holdings (greater than $8 billion market cap), consistent with the Fund’s investment philosophy. New opportunities in the market were primarily found in stocks we consider consistent earners. This is an indication that many cyclical value stocks have appreciated to price levels that are not as attractive as they once were, and that value in the market is now being found in stocks that exhibit the ability to consistently grow earnings as the economy recovers. |
5
| Statement of assets and liabilities | |||||
|---|---|---|---|---|---|
| Thornburg Value Fund | March 31, 2004 | ||||
| (Unaudited) | |||||
| ASSETS | |||||
| Investments at value (cost $1,889,095,638) | $ | 2,165,479,173 | |||
| Cash | 3,298,416 | ||||
| Cash denominated in foreign currency (cost $423,791) | 442,828 | ||||
| Receivable for securities sold | 1,468,008 | ||||
| Receivable for fund shares sold | 6,565,117 | ||||
| Dividends receivable | 6,182,589 | ||||
| Interest receivable | 1,994,715 | ||||
| Prepaid expenses and other assets | 97,697 | ||||
| Total Assets | 2,185,528,543 | ||||
| LIABILITIES | |||||
| Payable for securities purchased | 20,329,124 | ||||
| Payable for fund shares redeemed | 1,667,063 | ||||
| Payable to investment advisor (Note 3) | 1,633,967 | ||||
| Accounts payable and accrued expenses | 1,519,119 | ||||
| Dividends payable | 2,908,620 | ||||
| Total Liabilities | 28,057,893 | ||||
| NET ASSETS | $ | 2,157,470,650 | |||
| NET ASSETS CONSIST OF: | |||||
| Undistributed net investment gain (loss) | $ | 3,897,875 | |||
| Net unrealized appreciation (depreciation) on investments | 276,500,684 | ||||
| Accumulated net realized gain (loss) | (315,360,325 | ) | |||
| Net capital paid in on shares of beneficial interest | 2,192,432,416 | ||||
| $ | 2,157,470,650 | ||||
| NET ASSET VALUE: | |||||
| Class A Shares: | |||||
| Net asset value and redemption price per share | |||||
| ($1,184,777,388 applicable to 39,887,250 shares of beneficial interest outstanding - Note 4) | $ | 29.70 | |||
| Maximum sales charge, 4.50% of offering price | 1.40 | ||||
| Maximum Offering Price Per Share | $ | 31.10 | |||
| Class B Shares: | |||||
| Net asset value and offering price per share * | |||||
| ($102,991,535 applicable to 3,589,406 shares of beneficial interest outstanding - Note 4) | $ | 28.69 | |||
| Class C Shares: | |||||
| Net asset value and offering price per share * | |||||
| ($526,172,414 applicable to 18,164,914 shares of beneficial interest outstanding - Note 4) | $ | 28.97 | |||
| Class I Shares: | |||||
| Net asset value, offering, and redemption price per share | |||||
| ($341,281,561 applicable to 11,323,871 shares of beneficial interest outstanding - Note 4) | $ | 30.14 | |||
| Class R-1 Shares: | |||||
| Net asset value, offering, and redemption price per share | |||||
| ($2,247,752 applicable to 75,651 shares of beneficial interest outstanding - Note 4) | $ | 29.71 | |||
*Redemption price per share is equal to net asset value less any applicable contingent deferred sales charge.
See notes to financial statements.
6
| Statement of Operations | |||||
|---|---|---|---|---|---|
| Thornburg Value Fund | Six Months Ended March 31, 2004 | ||||
| (Unaudited) | |||||
| INVESTMENT INCOME | |||||
| Dividend income (net of foreign taxes withheld of $476,389) | $ | 16,599,858 | |||
| Interest income | 5,840,127 | ||||
| Other income | 293 | ||||
| Total Income | 22,440,278 | ||||
| EXPENSES | |||||
| Investment advisory fees (Note 3) | 7,999,526 | ||||
| Administration fees (Note 3) | |||||
| Class A Shares | 690,291 | ||||
| Class B Shares | 62,151 | ||||
| Class C Shares | 310,012 | ||||
| Class I Shares | 75,939 | ||||
| Class R-1 Shares | 162 | ||||
| Distribution and service fees (Note 3) | |||||
| Class A Shares | 1,405,361 | ||||
| Class B Shares | 511,628 | ||||
| Class C Shares | 2,524,348 | ||||
| Class R-1 Shares | 687 | ||||
| Transfer agent fees | |||||
| Class A Shares | 637,150 | ||||
| Class B Shares | 94,735 | ||||
| Class C Shares | 376,360 | ||||
| Class I Shares | 84,630 | ||||
| Class R-1 Shares | 1,396 | ||||
| Registration & filing fees | |||||
| Class A Shares | 11,705 | ||||
| Class B Shares | 9,397 | ||||
| Class C Shares | 9,946 | ||||
| Class I Shares | 10,587 | ||||
| Class R-1 Shares | 7,794 | ||||
| Custodian fees (Note 3) | 278,904 | ||||
| Professional fees | 75,010 | ||||
| Accounting fees | 67,050 | ||||
| Trustee fees | 20,835 | ||||
| Other expenses | 112,542 | ||||
| Total Expenses | 15,378,146 | ||||
| Less: | |||||
| Expenses reimbursed by investment advisor (Note 3) | (9,439 | ) | |||
| Fees paid indirectly (Note3) | (4,654 | ) | |||
| Net Expenses | 15,364,053 | ||||
| Net Investment Income | $ | 7,076,225 | |||
| REALIZED AND UNREALIZED GAIN (LOSS) | |||||
| Net realized gain (loss) on: | |||||
| Investments | $ | 101,596,317 | |||
| Foreign currency transactions | 7,963 | ||||
| -- | 101,604,280 | ||||
| Net change in unrealized appreciation (depreciation) on: | |||||
| Investments | 126,425,531 | ||||
| Foreign currency translation | 91,370 | ||||
| -- | 126,516,901 | ||||
| Net Realized and Unrealized | |||||
| Gain (Loss) on Investments | 228,121,181 | ||||
| Net Increase (Decrease) in Net Assets Resulting | |||||
| From Operations | $ | 235,197,406 | |||
See notes to financial statements.
8
Thornburg Value Fund
Statements of Changes in net assets
| Six Months Ended March 31, 2004 | Year Ended September 30, 2003 | |||||||
|---|---|---|---|---|---|---|---|---|
| INCREASE (DECREASE) IN NET ASSETS FROM: | ||||||||
| OPERATIONS: | ||||||||
| Net investment income gain (loss) | $ | 7,076,225 | $ | 7,313,471 | ||||
| Net realized gain (loss) on investments and foreign currency | ||||||||
| transactions | 101,604,280 | (71,469,466 | ) | |||||
| Increase (Decrease) in unrealized appreciation (depreciation ) | ||||||||
| on investments and foreign currency translation | 126,516,901 | 418,721,057 | ||||||
| Net Increase (Decrease) in Net Assets | ||||||||
| Resulting from Operations | 235,197,406 | 354,565,062 | ||||||
| DIVIDENDS TO SHAREHOLDERS: | ||||||||
| From net investment income | ||||||||
| Class A Shares | (1,994,363 | ) | (608,906 | ) | ||||
| Class B Shares | (1,328 | ) | 0 | |||||
| Class C Shares | (93,549 | ) | 0 | |||||
| Class I Shares | (817,584 | ) | (313,321 | ) | ||||
| Class R-1 Shares | (1,797 | ) | 0 | |||||
| From return of capital | ||||||||
| Class A Shares | 0 | (841,616 | ) | |||||
| Class I Shares | 0 | (433,066 | ) | |||||
| FUND SHARE TRANSACTIONS - (Note 4) | ||||||||
| Class A Shares | 61,882,012 | (9,595,663 | ) | |||||
| Class B Shares | 1,857,939 | 1,176,900 | ||||||
| Class C Shares | 28,277,969 | (15,910,000 | ) | |||||
| Class I Shares | 45,500,208 | 1,829,284 | ||||||
| Class R-1 Shares | 2,232,993 | 75 | ||||||
| Net Increase (Decrease) in Net Assets | 372,039,906 | 329,868,749 | ||||||
| NET ASSETS: | ||||||||
| Beginning of period | 1,785,430,744 | 1,455,561,995 | ||||||
| End of period | $ | 2,157,470,650 | $ | 1,785,430,744 | ||||
See notes to financial statements.
9
Notes to financial statements
Thornburg Value Fund
March 31, 2004
NOTE 1 – ORGANIZATION Thornburg Value Fund, hereinafter referred to as the “Fund,” is a diversified series of Thornburg Investment Trust (the “Trust”). The Trust was organized as a Massachusetts business trust under a Declaration of Trust dated June 3, 1987 and is registered as a diversified, open-end management investment company under the Investment Company Act of 1940, as amended. The Trust is currently issuing nine series of shares of beneficial interest in addition to those of the Fund: Thornburg Limited Term U.S. Government Fund, Thornburg New Mexico Intermediate Municipal Fund, Thornburg Intermediate Municipal Fund, Thornburg Limited Term Income Fund, Thornburg Florida Intermediate Municipal Fund, Thornburg International Value Fund, Thornburg Core Growth Fund, Thornburg New York Intermediate Municipal Fund, and Thornburg Investment Income Builder Fund. Each series is considered to be a separate entity for financial reporting and tax purposes and bears expenses directly attributable to it. The Fund seeks long-term capital appreciation by investing primarily in domestic equity securities selected on a value basis.
The Fund currently offers five classes of shares of beneficial interest, Class A, Class B, Class C, Institutional Class (Class I) and Retirement Class (Class R-1) shares. Each class of shares of a Fund represents an interest in the same portfolio of investments of the Fund, except that (i) Class A shares are sold subject to a front-end sales charge collected at the time the shares are purchased and bear a service fee, (ii) Class B shares are sold at net asset value without a sales charge at the time of purchase, but are subject to a contingent deferred sales charge upon redemption and bear both a service fee and distribution fee, (iii) Class C shares are sold at net asset value without a sales charge at the time of purchase, but are subject to a contingent deferred sales charge upon redemption within one year, and bear a service fee and a distribution fee, (iv) Class I shares are sold at net asset value without a sales charge at the time of purchase, (v) Class R-1 shares are sold at net asset value without a sales charge at the time of purchase but bear both a service fee and distribution fee, and (vi) the respective classes have different reinvestment privileges. Additionally, the Fund may allocate among its classes certain expenses, to the extent allowable to specific classes, including transfer agent fees, government registration fees, certain printing and postage costs, and administrative and legal expenses. Currently, class specific expenses of the Fund are limited to service and distribution fees, administration fees and certain registration and transfer agent expenses. Class B shares of the Fund outstanding for eight years will convert to Class A shares of the Fund.
NOTE 2 – SIGNIFICANT ACCOUNTING POLICIES Significant accounting policies of the Fund are as follows:
Valuation of Securities: In determining net asset value, investments are stated at value based on latest sales prices, normally at 4:00 pm EST reported on national securities exchanges on the last business day of the period. Investments for which no sale is reported are valued at the mean between bid and asked prices or in accordance with such other method as the Trustees may authorize. Securities for which market quotations are not readily available are valued at fair value as determined by management and approved in good faith by the Board of Trustees. Short term obligations having remaining maturities of 60 days or less are valued at amortized cost, which approximates market value.
Foreign Currency Translation: Portfolio securities and other assets and liabilities denominated in foreign currencies are translated into U.S. dollars based on the exchange rate of such currencies against the U.S. dollar on the date of valuation. Purchases and sales of securities and income items denominated in foreign currencies are translated into U.S. dollars at the exchange rate in effect on the translation date. When the Fund purchases or sells foreign securities it will customarily enter into a foreign exchange contract to minimize foreign exchange risk from the trade date to the settlement date of such transactions.
The Fund does not separately report the effect of changes in foreign exchange rates from changes in market prices on securities held. Such changes are included in net realized and unrealized gain or loss from investments.
Reported net realized foreign exchange gains or losses arise from sales of foreign currencies, currency gains or losses realized between the trade and settlement dates on securities transactions and the difference between the amount of interest recorded on the Fund’s books, and the U.S. dollar equivalent of the amounts actually received or paid.
Federal Income Taxes: It is the policy of the Fund to comply with the provisions of the Internal Revenue Code applicable to “regulated investment companies” and to distribute all of its taxable income to its shareholders. Therefore, no provision for Federal income tax is required.
When-Issued and Delayed Delivery Transactions: The Fund may engage in when-issued or delayed delivery transactions. To the extent the Fund engages in such transactions, it will do so for the purpose of acquiring portfolio securities consistent with its investment objectives and not for the purpose of investment leverage or to speculate on market changes. At
10
Thornburg Value Fund
Notes to financial statements, continued
the time the Fund makes a commitment to purchase a security on a when-issued basis, it will record the transaction and reflect the value in determining its net asset value. When effecting such transactions, assets of the Fund of an amount sufficient to make payment for the portfolio securities to be purchased will be segregated on the Fund’s records on the trade date.
Dividends: Dividends to shareholders are generally paid quarterly and are reinvested in additional shares of the Fund at net asset value per share at the close of business on the dividend payment date, or at the shareholder’s option, paid in cash. Net realized capital gains, to the extent available, will be distributed at least annually. Distributions to shareholders are based on income tax regulations and therefore, their characteristics may differ for financial statement and tax purposes.
General: Securities transactions are accounted for on a trade date basis. Interest income is accrued as earned and dividend income is recorded on the ex-dividend date. Certain income from foreign securities is recognized as soon as information is available to the Fund. Realized gains and losses from the sale of securities are recorded on an identified cost basis. Net investment income, other than class specific expenses, and realized and unrealized gains and losses, are allocated daily to each class of shares based upon the relative net asset value of outstanding shares of each class of shares at the beginning of the day (after adjusting for the current share activity of the respective class). Expenses common to all funds are allocated among the funds comprising the Trust based upon their relative net asset values or other appropriate allocation methods.
Guarantees and Indemnifications: Under the Trust’s organizational documents, its officers and trustees are indemnified against certain liability arising out of the performance of their duties to the Fund. Additionally, in the normal course of business the Trust enters into contracts with service providers that contain general indemnification clauses. The Trust’s maximum exposure under these arrangements is unknown. However, based on experience, the Trust expects the risk of loss to be remote.
Use of Estimates: The preparation of financial statements, in conformity with generally accepted accounting principles, requires management to make estimates and assumptions that affect the reported amounts of assets and liabilities and the disclosure of contingent assets and liabilities at the date of the financial statements and the reported amounts of increases and decreases in net assets from operations during the reporting period. Actual results could differ from those estimates.
NOTE 3 — INVESTMENT ADVISORY FEE AND OTHER TRANSACTIONS WITH AFFILIATES
Pursuant to an investment advisory agreement, Thornburg Investment Management, Inc. (the “Advisor”) serves as the investment advisor and performs services to the Fund for which the fees are payable at the end of each month. For the period ended March 31, 2004, these fees were payable at annual rates ranging from .875 of 1% to .675 of 1% of the average daily net assets of the Fund depending on the Fund’s asset size. The Fund also has an administrative services agreement with the Advisor, whereby the Advisor will perform certain administrative services for the shareholders of each class of the Fund’s shares, and for which fees will be payable at an annual rate of up to .125 of 1% of the average daily net assets attributable to each class of shares. For the period ended March 31, 2004, the Advisor voluntarily reimbursed certain class specific expenses and administrative fees of $9,439 for Class R-1 shares.
The Fund has an underwriting agreement with Thornburg Securities Corporation (the “Distributor”), which acts as the distributor of the Fund’s shares. For the period ended March 31, 2004, the Distributor has advised the Fund that it earned net commissions aggregating $108,256 from the sale of Class A shares of the Fund, and collected contingent deferred sales charges aggregating $14,628 from redemptions of Class C shares of the Fund.
Pursuant to a service plan under Rule 12b-1 of the Investment Company Act of 1940, the Fund may reimburse to the Advisor an amount not to exceed .25 of 1% per annum of its average daily net assets attributable to each class of shares of the Fund for payments made by the Advisor to securities dealers and other financial institutions to obtain various shareholder related services. The Advisor may pay out of its own resources additional expenses for distribution of the Fund’s shares.
The Fund has also adopted distribution plans pursuant to Rule 12b-1, applicable only to the Fund’s Class B, Class C, and Class R-1 shares under which the Fund compensates the Distributor for services in promoting the sale of Class B, Class C, and Class R-1 shares of the Fund at an annual rate of up to .75 of 1% of the average daily net assets attributable to Class B, Class C, and Class R-1 shares. Total fees incurred by each class of shares of the Fund under its respective service and distribution Plans for the period ended March 31, 2004 are set forth in the Statement of Operations.
The Fund has an agreement with the custodian bank to indirectly pay a portion of the custodian’s fees through credits earned by the Fund’s cash on deposit with the bank. This
11
Thornburg Value Fund
Notes to financial statements, continued
March 31, 2004
deposit agreement is an alternative to overnight investments. Custodial fees have been adjusted to reflect amounts that would have been paid without this agreement, with a corresponding adjustment reflected as fees paid indirectly in the statements of operations. For the period ended March 31, 2004, the fees paid indirectly were $4,654.
Certain officers and trustees of the Trust are also officers and/or directors of the Advisor and Distributor. The compensation of unaffiliated trustees is borne by the Trust.
NOTE 4 — SHARES OF BENEFICIAL INTEREST
At March 31, 2004 there were an unlimited number of shares of beneficial interest authorized. Sales of Class R-1 shares commenced July 1, 2003. Transactions in shares of beneficial interest were as follows:
| Period Ended March 31, 2004 | Year Ended September 30, 2003 | |||||||||||||
|---|---|---|---|---|---|---|---|---|---|---|---|---|---|---|
| Shares | Amount | Shares | Amount | |||||||||||
| Class A Shares | ||||||||||||||
| Shares sold | 6,856,915 | $ | 197,901,422 | 10,779,879 | $ | 260,163,852 | ||||||||
| Shares issued to shareholders in | -- | -- | 51,321 | 1,323,066 | ||||||||||
| reinvestment of dividends | ||||||||||||||
| Shares repurchased ** | (4,778,638 | ) | (136,019,410 | ) | (12,057,032 | ) | (271,082,581 | ) | ||||||
| Net Increase (Decrease) | 2,078,277 | $ | 61,882,012 | (1,225,832 | ) | $ | (9,595,663 | ) | ||||||
| ** The Fund charges a redemption fee of 1% of the Class A shares exchanged within 90 days of purchase. For the period ended March 31, 2004, $8,441 was netted in the amount reported for shares repurchased | ||||||||||||||
| Class B Shares | ||||||||||||||
| Shares sold | 262,835 | $ | 7,300,130 | 513,612 | $ | 11,953,625 | ||||||||
| Shares repurchased | (194,243 | ) | (5,442,191 | ) | (487,795 | ) | (10,776,725 | ) | ||||||
| Net Increase (Decrease) | 68,592 | $ | 1,857,939 | 25,817 | $ | 1,176,900 | ||||||||
| Class C Shares | ||||||||||||||
| Shares sold | 2,232,155 | $ | 62,719,232 | 2,810,602 | $ | 66,343,222 | ||||||||
| Shares repurchased | (1,228,014 | ) | (34,441,263 | ) | (3,690,038 | ) | (82,253,222 | ) | ||||||
| Net Increase (Decrease) | 1,004,141 | $ | 28,277,969 | (879,436 | ) | $ | (15,910,000 | ) | ||||||
| Class I Shares | ||||||||||||||
| Shares sold | 2,602,698 | $ | 76,317,168 | 3,982,384 | $ | 94,533,465 | ||||||||
| Shares issued to shareholders in | -- | -- | 23,269 | 607,316 | ||||||||||
| reinvestment of dividends | ||||||||||||||
| Shares repurchased ** | (1,060,545 | ) | (30,816,960 | ) | (4,135,473 | ) | (93,311,497 | ) | ||||||
| Net Increase (Decrease) | 1,542,153 | $ | 45,500,208 | (129,820 | ) | $ | 1,829,284 | |||||||
| ** The Fund charges a redemption fee of 1% of the Class I shares exchanged within 90 days of purchase. For the period ended March 31, 2004, $4,224 was netted in the amount reported for shares repurchased | ||||||||||||||
| Class R-1 Shares | ||||||||||||||
| Shares sold | 77,640 | $ | 2,291,771 | 3 | $ | 75 | ||||||||
| Shares repurchased | (1,992 | ) | (58,778 | ) | -- | -- | ||||||||
| Net Increase (Decrease) | 75,648 | $ | 2,232,993 | 3 | $ | 75 | ||||||||
12
Thornburg Value Fund
Notes to financial statements, continued
March 31, 2004
NOTE 5 – SECURITIES TRANSACTIONS
For the period ended March 31, 2004 the Fund had purchase and sale transactions of investment securities excluding short-term securities of $862,612,627 and $709,928,543, respectively.
NOTE 6 – INCOME TAXES
At March 31, 2004, information on the tax components of capital is as follows:
Cost of investments for tax purpose $ 1,889,095,638
| Gross unrealized appreciation on a tax basis | $ 355,301,945 | ||
| Gross unrealized depreciation on a tax basis | (78,918,410 | ) | |
| Net unrealized | |||
| appreciation (depreciation) on investments (tax basis) | $ 276,383,535 | ||
At March 31, 2004, the Fund had tax basis capital losses, which may be carried over to offset future capital gains. Such losses expire as follows:
Capital loss carryovers expiring in:
| 2009 | $ | 11,324,648 | |||
| 2010 | 188,545,264 | ||||
| 2011 | 174,918,826 | ||||
| -- | $ | 374,788,738 | |||
At March 31, 2004, the Fund had deferred currency and capital losses occurring subsequent to October 31, 2002 of $269,729 and $42,175,867, respectively. For tax purposes, such losses will be reflected in the year ended September 30, 2004.
Unutilized tax basis capital losses may be carried forward to offset realized gains in future years. To the extent such carry forwards are used, capital gains distributions may be reduced to the extent provided by regulations.
Net investment income and net realized gain (loss) differ for financial statement and tax purposes primarily due to differing treatments of foreign currency transactions and losses realized subsequent to October 31 on the sale of securities and foreign currencies.
13
| Financial highlights | ||||||
|---|---|---|---|---|---|---|
| Thornburg Value Fund | ||||||
| Six Months Ended | Year Ended September 30, | Period Ended | ||||
| March 31, 2004 | 2003 | 2002 | 2001 | 2000 | September 30, 1999(c) | |
| Class I Shares: | ||||||
| Per Share Performance | ||||||
| (for a share outstanding throughout the period)+ | ||||||
| Net asset value, beginning of period | $ 26.64 | $ 20.95 | $ 26.18 | $ 33.09 | $ 26.26 | $ 21.78 |
| Income from investment operations: | ||||||
| Net investment income | 0.19 | 0.26 | 0.11 | 0.14 | 0.91 | 0.25 |
| Net realized and unrealized | ||||||
| gain (loss) on investments | 3.38 | 5.51 | (5.34) | (6.42) | 7.25 | 4.48 |
| Total from investment operations | 3.57 | 5.77 | (5.23) | (6.28) | 8.16 | 4.73 |
| Less dividends from: | ||||||
| Net investment income | (0.07) | (0.03) | -- | (0.28) | (0.94) | (0.25) |
| Net realized gains | -- | -- | -- | (0.25) | (0.39) | -- |
| Return of Capital | -- | (0.05) | -- | (0.10) | -- | -- |
| Total dividends | (0.07) | (0.08) | -- | (0.63) | (1.33) | (0.25) |
| Change in net asset value | 3.50 | 5.69 | (5.23) | (6.91) | 6.83 | 4.48 |
| Net asset value, end of period | $ 30.14 | $ 26.64 | $ 20.95 | $ 26.18 | $ 33.09 | $ 26.26 |
| Total return (a) | 13.41% | 27.55% | (19.98)% | (19.29)% | 31.44% | 21.70% |
| Ratios/Supplemental Data | ||||||
| Ratios to average net assets: | ||||||
| Net investment income | 1.28%(b) | 1.10% | 0.42% | 0.45% | 2.82% | 1.14%(b) |
| Expenses, after expense reductions | 0.97%(b) | 0.99% | 0.98% | 0.99% | 0.99% | 1.00%(b) |
| Expenses, after expense reductions | ||||||
| and net of custody credits | 0.97%(b) | 0.99% | 0.98% | -- | -- | -- |
| Expenses, before expense reductions | 0.97%(b) | 1.03% | 0.99% | 1.01% | 1.00% | 1.13%(b) |
| Portfolio turnover rate | 36.13% | 82.89% | 76.37% | 71.81% | 72.35% | 62.71% |
| Net assets at end of period (000) | $ 341,282 | $ 260,624 | $ 207,613 | $ 293,784 | $ 242,974 | $ 52,357 |
(a) Not annualized for periods less than one year.
(b) Annualized.
(c) Effective date of Class I Shares was November 2, 1998.
+ Based on weighted average shares outstanding.
14
| Schedule of investments | ||||||||
|---|---|---|---|---|---|---|---|---|
| Thornburg Value Fund | March 31, 2004 | |||||||
| CUSIPS: CLASS A - 885-215-731, CLASS B - 885-215-590, CLASS C - 885-215-715, CLASS I - 885-215-632, CLASS R-1 - 885-215-533 NASDAQ SYMBOLS: CLASS A - TVAFX, CLASS B - TVBFX, CLASS C - TVCFX, CLASS I - TVIFX, CLASS R-1 - TVRFX | ||||||||
| Shares | Value | |||||||
| COMMON STOCKS-- 95.80% | ||||||||
| AUTOMOBILES & COMPONENTS (2.10%) | ||||||||
| Hyundai Motor Co. | 978,000 | $ | 44,700,772 | |||||
| BANKS (6.50%) | ||||||||
| Lloyds TSB Group PLC | 5,446,500 | 41,449,314 | ||||||
| The Bank of New York Co. Inc. | 1,682,200 | 52,989,300 | ||||||
| Wells Fargo & Co. | 835,400 | 47,342,118 | ||||||
| CAPITAL GOODS (2.20%) | ||||||||
| Deere & Co. | 680,800 | 47,186,248 | ||||||
| COMMERCIAL SERVICES & SUPPLIES (0.90%) | ||||||||
| FTI Consulting Inc. + | 1,236,500 | 20,600,090 | ||||||
| DIVERSIFIED FINANCIALS (10.80%) | ||||||||
| Citigroup Inc. | 1,279,000 | 66,124,300 | ||||||
| E-Trade Financial Corp. + | 3,179,677 | 42,448,688 | ||||||
| Fannie Mae | 1,090,800 | 81,100,980 | ||||||
| Price T Rowe Group Inc. | 815,600 | 43,903,748 | ||||||
| ENERGY (6.30%) | ||||||||
| Amerada Hess Corp. | 962,300 | 62,818,944 | ||||||
| Exxon Mobil Corp. | 447,500 | 18,611,525 | ||||||
| Unocal Corp. | 1,485,000 | 55,360,800 | ||||||
| HEALTHCARE EQUIPMENT & SERVICES (8.00%) | ||||||||
| Amerisourcebergen Corp. | 752,700 | 41,157,636 | ||||||
| Anthem Inc. + | 459,200 | 41,621,888 | ||||||
| Caremark Rx Inc. + | 1,202,200 | 39,973,150 | ||||||
| Health Management Associates | 2,190,255 | 50,835,819 | ||||||
| HOUSEHOLD & PERSONAL PRODUCTS (1.50%) | ||||||||
| American Greetings Corp. + | 1,448,700 | 32,986,899 | ||||||
| INSURANCE (10.60%) | ||||||||
| Aon Corp. | 2,175,700 | 60,723,787 | ||||||
| Lincoln National Corp. | 1,029,022 | 48,693,321 | ||||||
| Marsh & McLennan Cos. Inc. | 1,359,900 | 62,963,370 | ||||||
| The St. Paul Cos | 1,415,100 | 56,618,151 | ||||||
| MEDIA (7.90%) | ||||||||
| AOL Time Warner Inc. + | 2,533,755 | 42,719,109 | ||||||
| Comcast Corp. + | 1,430,200 | 39,873,976 | ||||||
| Directv Group Inc. + | 2,914,185 | 44,820,165 | ||||||
| Fox Entertainment Group Inc. + | 1,576,175 | 42,714,343 | ||||||
| PHARMACEUTICALS & BIOTECHNOLOGY (5.10%) | ||||||||
| Genzyme Corp. + | 870,300 | 40,938,912 | ||||||
| Pfizer Inc. | 1,989,300 | 69,724,965 | ||||||
| REAL ESTATE MANAGEMENT & DEVELOPMENT (2.00%) | ||||||||
| Boston Properties Inc. | 803,400 | 43,632,654 | ||||||
| RETAILING (6.60%) | ||||||||
| InterActiveCorp + | 1,538,075 | $ | 48,587,789 | |||||
| Lowe's Cos. Inc. | 949,200 | 53,278,596 | ||||||
| Target Corp. | 906,400 | 40,824,256 | ||||||
| SOFTWARE & SERVICES (5.30%) | ||||||||
| Affiliated Computer Services Inc. + | 622,090 | 32,286,471 | ||||||
| DoubleClick Inc. + | 2,244,364 | 25,249,095 | ||||||
| Eclipsys Corp. + | 1,866,440 | 25,159,611 | ||||||
| Electronic Arts Inc. + | 587,800 | 31,717,688 | ||||||
| TECHNOLOGY - HARDWARE & EQUIPMENT (8.80%) | ||||||||
| Hewlett-Packard Co. | 1,795,400 | 41,006,936 | ||||||
| Samsung Electronics Co. Ltd. | 141,800 | 70,748,484 | ||||||
| Seagate Technology + | 2,247,300 | 36,248,949 | ||||||
| Texas Instruments Inc. | 1,480,675 | 43,265,324 | ||||||
| TELECOMMUNICATION SERVICES (7.10%) | ||||||||
| Alltel Corp. | 1,262,000 | 62,961,180 | ||||||
| Nextel Communications Inc. + | 1,942,600 | 48,040,498 | ||||||
| NII Holdings Inc. + | 1,203,204 | 42,148,236 | ||||||
| TRANSPORTATION (2.10%) | ||||||||
| Union Pacific Corp. | 777,700 | 46,522,014 | ||||||
| UTILITIES (2.00%) | ||||||||
| Dominion Resources Inc. | 657,200 | 42,257,960 | ||||||
| TOTAL COMMON STOCKS (Cost $1,793,298,225) | -- | 2,074,938,059 | ||||||
| CORPORATE BONDS -- 2.00% | ||||||||
| TELECOMMUNICATION SERVICES (0.90%) | ||||||||
| Level 3 Communications Inc., 9.125%, 5/1/2008 | $ | 23,400,000 | $ | 18,954,000 | ||||
| TRANSPORTATION (1.10%) | ||||||||
| Delta Air Lines Inc., 10.00%, 8/15/2008 | 6,160,000 | 4,373,600 | ||||||
| Delta Air Lines Inc., 7.90%, 12/15/2009 | 5,000,000 | 3,300,000 | ||||||
| Delta Air Lines Inc., 10.125%, 5/15/2010 | 2,900,000 | 1,972,000 | ||||||
| Delta Air Lines Inc., 9.75%, 5/15/2021 | 2,000,000 | 1,240,000 | ||||||
| Delta Air Lines Inc., 8.30%, 12/15/2029 | 24,500,000 | 14,087,500 | ||||||
| TOTAL CORPORATE BONDS (Cost $47,807,408) | -- | 43,927,100 | ||||||
| CONVERTIBLE BONDS -- 1.30% | ||||||||
| TELECOMMUNICATION SERVICES (1.30%) | ||||||||
| Level 3 Communications Inc., 6.00%, 9/15/2009 | 18,700,000 | 11,407,000 | ||||||
| Level 3 Communications Inc., 6.00%, 3/15/2010 | 28,800,000 | 17,208,000 | ||||||
| TOTAL CONVERTIBLE BONDS (Cost $29,990,991) | -- | 28,615,000 | ||||||
| SHORT TERM INVESTMENTS -- 0.90% | ||||||||
| American General Finance, 1.07% due 4/2/2004 | $ | 15,000,000 | $ | 14,999,554 | ||||
| American General Finance, 1.08% due 4/7/2004 | 3,000,000 | 2,999,460 | ||||||
| TOTAL SHORT TERM INVESTMENTS (Cost $17,999,014) | -- | 17,999,014 | ||||||
| TOTAL INVESTMENTS (100%) (Cost $1,889,095,638) | -- | $ | 2,165,479,173 | |||||
| + Non-income producing | ||||||||
| See notes to financial statements | ||||||||
17
March 31, 2004
Index Comparison
The chart below compares performance of Thornburg Value Fund and the Standard & Poor’s 500 Index for the period November 2, 1998 to March 31, 2004. Past performance of the Index and the Fund may not be indicative of future performance. The performance data and graph do not reflect the deduction of taxes that a shareholder would pay on distributions or the redemption of Fund shares.
Thornburg Value Fund
index comparisons
Thornburg Value Fund Class I Total Returns, Since Inception,versus
S&P 500 Index
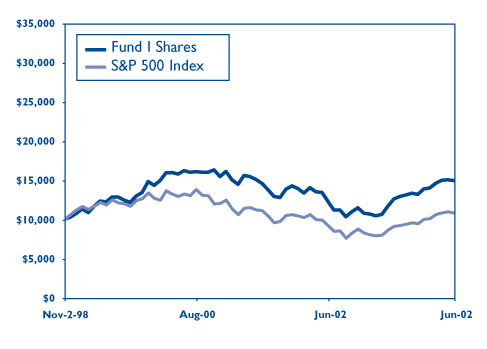
Average Annual Total Returns(periods
ending 3/31/04)
| I Shares | |
|---|---|
| 1 Year: | 40.63% |
| 5 Year: | 5.05% |
| From Inception (11/2/98): | 7.70% |
There is no up-front sales charge for I shares.
Past performance is no guarantee of future results. Current returns may be either lower or higher than those shown. Share prices and returns will fluctuate and investors may experience a loss upon redemption. There is no guarantee that the Fund will meet its objectives. Shares in the Fund carry risks, including possible loss of principal.
Carefully consider the Fund’s investment objectives, risks, sales charges, and expenses; this is found in the prospectus, which is available from your financial advisor or from www.thornburg.com. Read it carefully before you invest or send money.
There are special risk considerations associated with international investing, including fluctuating exchange rates, government regulations and differences in liquidity, which may affect the volatility of the Fund.
For month-end performance information, or for information and commentary on Fund holdings, including links to each company’s home page, visit www.thornburg.com.
The Standard & Poor’s 500 Stock Index (S&P 500) is an unmanaged index generally representative of the U.S. Stock Market, without regard to company size.
Unless otherwise noted, index returns reflect the reinvestment of income dividends and capital gains, if any, but do not reflect fees, brokerage commissions or other expenses of investing. Investors may not make direct investments into any index.
18
Thornburg Value Fund
Portfolio proxy voting
March 31, 2004
Policies and Procedures (Unaudited):
The Trust has delegated to Thornburg Investment Management, Inc. (“the Advisor”) voting decisions respecting proxies for the Fund’s voting securities. The Advisor makes voting decisions in accordance with its Proxy Voting Policy and Procedures. A description of the policy and Procedures is available (i) without charge, upon request, by calling the Advisor toll-free at 1.800.847.0200, (ii) on the Thornburg website at www.thornburg.com, and (iii) on the Securities and Exchange Commission’s website at www.sec.gov.
Commencing August 31, 2004, information regarding how proxies were voted will be available on or before August 31 of each year for the twelve months ending the preceding June 30. This information will be available (i) without charge, upon request, on the Thornburg website at www.thornburg.com and (ii) on the Securities and Exchange Commission’s website at www.sec.gov.
19
Investment Manager Thornburg Investment Management, Inc.
119 East Marcy Street
Santa Fe, New Mexico 87501
800.847.0200
Principal Underwriter Thornburg Securities Corporation
119 East Marcy Street
Santa Fe, New Mexico 87501
800.847.0200
This report is submitted for the general information of shareholders of the Fund. It is not authorized for distribution to prospective investors in the Fund unless preceded or accompanied by an effective prospectus. Carefully consider information in the prospectus regarding the Fund’s investment objectives and policies, risks, sales charges, expenses, experience of its management, marketability of shares, and other information. Performance data quoted represent past performance and do not guarantee future results.
www.thornburg.com
Thornburg Value Fund I Shares
Semi-Annual Report March 31, 2004
VALUE I
William V. Fries, CFA
Portfolio Manager
Thornburg Value Fund
Letter to shareholders
Dear Fellow Shareholder,
Investment performance for the quarter ended March 31, 2004 was positive. Even though equity prices eroded near the end of the period in the U.S. and most other developed markets (in local currency), performance results were good on both an absolute basis and relative to benchmarks. Economic and business developments remain encouraging. A robust recovery from recessionary forces in place since 2000 is well underway. Corporate earnings are rising at a healthy pace; with inflationary pressures still containable, the business environment for stocks is reasonable. Evidence is accumulating, however, that inflation will accelerate in the absence of monetary and fiscal discipline. It is encouraging to see the U.S. Dollar rallying against the Euro and the Yen, because this does take some of the pricing pressure off dollar traded commodities—a current source of inflationary cost pressure.
Though the economic and business environment may be sound, the psychological environment for stocks is challenging. The high level of anxiety from daunting uncertainties—such as the situation in Iraq and large fiscal and trade deficits—undermines investor confidence. These issues and a related upward shift in the yield curve are a rational constraint on equity valuations. Credit sensitive stocks of all stripes have become suspect of earnings estimate contraction and have come under selling pressure recently. Even financial service companies likely to benefit or remain unaffected by higher rates have traded lower. Nonetheless, the financial service stocks we hold represent compelling values and are held in part because of business models allowing earnings improvement even in an adverse interest rate environment. Company earnings and cash flow growth ultimately drive stock prices, especially when valuation is compelling.
Despite all we have been through in the past couple of years, a modicum of confidence seems to underpin equity markets. Our portfolio seeks to achieve capital appreciation through the acquisition of promising companies when they are available at a discount to their intrinsic values. This normally occurs when the companies are out of favor or suffering weakness for some controversial or transitory reason. Our stocks are selected one company at a time—based on fundamental research, analysis, and independent judgment. The portfolio is currently focused on approximately 50 stocks, but is adequately diversified to keep risk under control. All stocks may not be performing well simultaneously. For instance, in the quarter just ended, a number of healthcare service holdings such as Caremark (CMX), Quest Diagnostics (DGX), Anthem (ATH), performed well. Media and communications issues such as Comcast (CMCSK), Time Warner (TWX), and Nextel (NXTL) did not. Caremark and Quest hit target prices. We took profits in Quest, and trimmed Caremark for risk control reasons. Underperforming stocks are re-examined for validation of our investment thesis. All three of our underperforming media and communication stocks remain in the portfolio.
1
April 15, 2004
Thornburg Value Fund
Letter to shareholders, Continued
While the investment environment may be one of rational caution at the moment, it is also an environment in which societal change is being recognized in the marketplace. Companies with exceptional revenue and earnings growth tied to these changes are receiving considerable investor attention. Portfolio diversification to include what we call emerging franchises includes younger and high-potential equities. Companies that are involved in the use of the internet are illustrative. Despite the excess exuberance of the market related to the internet in 2000, the internet has become part of a daily routine for most of us and a number of franchises relating to this service have moved from an embryonic stage to real businesses. A couple of our holdings have promising businesses in this area: Interactive Corp (IACI) and E-Trade (ET) are examples. Holdings in which the primary business is telecommunications or media also are benefiting. Comcast, Nextel, and Electronic Arts (ERTS), are all expected to generate some portion of revenues from internet linked services. Because companies involved in this type of business tend to be more volatile than the average stock, we limit the amount of exposure to companies of this nature. The majority of Thornburg Value Fund holdings are what we classify as basic values or consistent earners. These represent holdings of firms that are better established in more mature industries.
On the following pages, you will find the management’s discussion of your Fund’s performance. Also, you can learn a good deal more about our investment philosophy and portfolios by visiting our website at www.thornburg.com/funds. We include descriptive information on each holding, a link to company websites, up-to-date performance information, and a monthly market commentary.
Thank you for your trust and confidence. We are confident that your Thornburg Value Fund is well positioned and we look forward to more clarity on what seems an unusual number of investment environment uncertainties.
Sincerely,
William V. Fries, CFA
Portfolio Manager
2
Thornburg Value Fund
management’s discussion of performance
| Value Fund | 1Q-04 | 6 Mos. | 1 Yr | 3 Yrs | 5 Yrs | Incep. | |
|---|---|---|---|---|---|---|---|
| I shares (TVIFX) | NAV | 2.34% | 13.41% | 40.63% | 1.06% | 5.05% | 7.70% |
| 11/2/98 Inception | |||||||
| S&P 500 Index (since 11/2/98) | 1.69% | 14.07% | 35.12% | 0.63% | -1.20% | 1.92% | |
Total returns for periods greater than one year are annualized averages.
There is no up-front sales charge for I shares.
Past performance is no guarantee of future results. Current returns may be either lower or higher than those shown. Share prices and returns will fluctuate and investors may experience a loss upon redemption. There is no guarantee that the Fund will meet its objectives. Shares in the Fund carry risks, including possible loss of principal. They are not deposits or obligations of, or guaranteed or endorsed by, any bank, the Federal Deposit Insurance Corporation, the Federal Reserve Board or any government agency.
Carefully consider the Fund’s investment objectives, risks, sales charges, and expenses; this information is found in the prospectus, which is available from your financial advisor or from www.thornburg.com. Read it carefully before you invest or send money.
For month-end performance information, or for information and commentary on Fund holdings, including links to each company’s home page, visit www.thornburg.com.
There are special risk considerations associated with international investing, including fluctuating exchange rates, government regulations and differences in liquidity, which may affect the volatility of the Fund.
The Standard & Poor’s 500 Stock Index (S&P 500) is an unmanaged index generally representative of the U.S. Stock Market, without regard to company size.
Performance
| Your Thornburg Value Fund outperformed the broad-based S&P 500 Index during the quarter ended March 31, 2004. The Fund was up 2.34% compared to 1.69% for the index. Performance was driven by a diverse group of holdings. Samsung Electronics Co. Ltd. (05930 KS), Amerada Hess Corp. (AHC), Caremark Rx Inc., and AON Corp. (AOC) were top contributors to performance, each hailing from a different industry (technology, energy, healthcare, and insurance). Not every investment had a positive impact on the portfolio; Union Pacific Corp. (UNP), Nextel Communications Inc., Seagate Technology (STX), and Comcast Corp. were among the main detractors from the Fund’s overall performance. From an industry-level perspective the Fund’s performance was limited by its lack of exposure and poor performance in the telecommunications industry, but was boosted by strong performance from healthcare and technology holdings in a quarter when overall performance of the two industries within the index was negative. |
Performance Impact during 1st quarter 2004
| Top Contributors | Top Detractors |
|---|---|
| Samsung Electronics Co. Ltd. | Union Pacific Corp. |
| Amerada Hess Corp. | Nextel Communications Inc. |
| Caremark RxInc | Seagate Technology |
| Aon Corp. | Comcast Corp. |
| Lincoln National Corp. | Interactive Corp. |
3
Thornburg Value Fund
management’s discussion of performance, Continued
March 31, 2004
Activity
Investment activity during the quarter was moderate. Six holdings were added to the portfolio, while eight were eliminated. Among new holdings were healthcare companies Amerisource Bergen Corp. and Anthem Inc., financial firm Price T Rowe Group Inc. (TROW), and energy holding Exxon Mobil Corp. (XOM). Eliminated holdings included Bank of Ireland (IRE), Marathon Oil Corp. (MRO), and Quest Diagnostics, all of which reached target prices. Freddie Mac (FRE) was consolidated into Fannie Mae (FNM), which is now the portfolio’s largest holding. H.J. Heinz Co. (HNZ), Circuit City Stores Inc. (CG), and El Paso Corp. (EP) were sold because of deterioration of fundamentals supporting the investment thesis for each company.
| Activity during 1st quarter 2004 | |||||
|---|---|---|---|---|---|
| New Holdings | Eliminated Holdings | ||||
| Amerisourcebergen Corp. | Alliance Capital Management Holdings LP | ||||
| Anthem Inc. | Bank of Ireland | ||||
| Exxon Mobil Corp. | Circuit City Stores Inc. | ||||
| FTI Consulting Inc. | El Paso Corp. | ||||
| NII Holdings Inc. | Freddie Mac | ||||
| Price T Rowe Group Inc. | HJ Heinz Co. | ||||
| -- | Marathon Oil Corp. | ||||
| -- | Quest Diagnostics | ||||
| Top 10 Holdings | |||||||||||
|---|---|---|---|---|---|---|---|---|---|---|---|
| 12/31/03 | 3/31/04 | ||||||||||
| E Trade Financial Corp. | 3 | .4% | Fannie Mae | 3 | .7% | ||||||
| Citigroup Inc. | 3 | .1% | Samsung Electronics Co. Ltd | 3 | .3% | ||||||
| Pfizer Inc. | 3 | .0% | Pfizer Inc. | 3 | .2% | ||||||
| The St. Paul Cos. Inc. | 2 | .8% | Citigroup Inc. | 3 | .1% | ||||||
| Unocal Corp. | 2 | .7% | Marsh & McLennan Cos. Inc. | 2 | .9% | ||||||
| Comcast Corp. | 2 | .7% | Alltell Corp. | 2 | .9% | ||||||
| Amerada Hess Corp. | 2 | .5% | Amerada Hess Corp. | 2 | .9% | ||||||
| Fannie Mae | 2 | .5% | AON Corp. | 2 | .8% | ||||||
| Wells Fargo & Co. | 2 | .4% | St. Paul Cos. Inc. | 2 | .6% | ||||||
| Hughes Electronics Corp. | 2 | .4% | Unocal Corp. | 2 | .6% | ||||||
Portfolio Diversification
During the quarter the industry exposure of your Fund continued to be well diversified. Exposure to the telecommunications industry increased with the addition of NII Holdings Inc. (NIHD), while exposure to the energy industry decreased as a result of the elimination of Marathon Oil Corp. and El Paso Corp. Exposure to other industries remained fairly stable. Capitalization exposure during
| Top 10 Industries | |||||||||||
|---|---|---|---|---|---|---|---|---|---|---|---|
| 12/31/03 | 3/31/04 | ||||||||||
| Diversified Financials | 10 | .8% | Diversified Financials | 10 | .8% | ||||||
| Energy | 10 | .3% | Insurance | 10 | .6% | ||||||
| Media | 9 | .3% | Telecommunication Services | 9 | .3% | ||||||
| Insurance | 9 | .2% | Technology - Hardware & Equip.8.8% | ||||||||
| Technology - Hardware & Equip | 8 | .8% | Healthcare Equip. & Services | 8 | .0% | ||||||
| Banks | 7 | .8% | Media | 7 | .9% | ||||||
| Retailing | 7 | .8% | Retailing | 6 | .6% | ||||||
| Healthcare Equipment & Services | 6 | .3% | Banks | 6 | .5% | ||||||
| Software & Services | 5 | .4% | Energy | 6 | .3% | ||||||
| Pharmaceuticals & Biotechnology | 5 | .3% | Software & Services | 5 | .3% | ||||||
4
Thornburg Value Fund
management’s discussion of performance, Continued
March 31, 2004
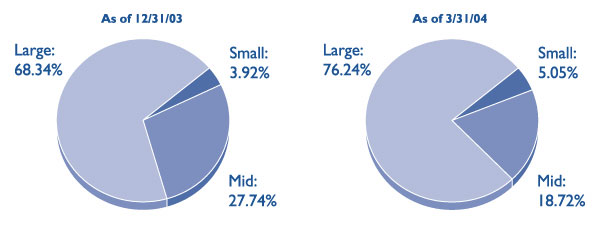
| the quarter remained relatively unchanged. The largest amount of exposure was to large cap holdings (greater than $8 billion market cap), consistent with the Fund’s investment philosophy. New opportunities in the market were primarily found in stocks we consider consistent earners. This is an indication that many cyclical value stocks have appreciated to price levels that are not as attractive as they once were, and that value in the market is now being found in stocks that exhibit the ability to consistently grow earnings as the economy recovers. |
5
| Statement of assets and liabilities | |||||
|---|---|---|---|---|---|
| Thornburg Value Fund | March 31, 2004 | ||||
| (Unaudited) | |||||
| ASSETS | |||||
| Investments at value (cost $1,889,095,638) | $ | 2,165,479,173 | |||
| Cash | 3,298,416 | ||||
| Cash denominated in foreign currency (cost $423,791) | 442,828 | ||||
| Receivable for securities sold | 1,468,008 | ||||
| Receivable for fund shares sold | 6,565,117 | ||||
| Dividends receivable | 6,182,589 | ||||
| Interest receivable | 1,994,715 | ||||
| Prepaid expenses and other assets | 97,697 | ||||
| Total Assets | 2,185,528,543 | ||||
| LIABILITIES | |||||
| Payable for securities purchased | 20,329,124 | ||||
| Payable for fund shares redeemed | 1,667,063 | ||||
| Payable to investment advisor (Note 3) | 1,633,967 | ||||
| Accounts payable and accrued expenses | 1,519,119 | ||||
| Dividends payable | 2,908,620 | ||||
| Total Liabilities | 28,057,893 | ||||
| NET ASSETS | $ | 2,157,470,650 | |||
| NET ASSETS CONSIST OF: | |||||
| Undistributed net investment gain (loss) | $ | 3,897,875 | |||
| Net unrealized appreciation (depreciation) on investments | 276,500,684 | ||||
| Accumulated net realized gain (loss) | (315,360,325 | ) | |||
| Net capital paid in on shares of beneficial interest | 2,192,432,416 | ||||
| $ | 2,157,470,650 | ||||
| NET ASSET VALUE: | |||||
| Class A Shares: | |||||
| Net asset value and redemption price per share | |||||
| ($1,184,777,388 applicable to 39,887,250 shares of beneficial interest outstanding - Note 4) | $ | 29.70 | |||
| Maximum sales charge, 4.50% of offering price | 1.40 | ||||
| Maximum Offering Price Per Share | $ | 31.10 | |||
| Class B Shares: | |||||
| Net asset value and offering price per share * | |||||
| ($102,991,535 applicable to 3,589,406 shares of beneficial interest outstanding - Note 4) | $ | 28.69 | |||
| Class C Shares: | |||||
| Net asset value and offering price per share * | |||||
| ($526,172,414 applicable to 18,164,914 shares of beneficial interest outstanding - Note 4) | $ | 28.97 | |||
| Class I Shares: | |||||
| Net asset value, offering, and redemption price per share | |||||
| ($341,281,561 applicable to 11,323,871 shares of beneficial interest outstanding - Note 4) | $ | 30.14 | |||
| Class R-1 Shares: | |||||
| Net asset value, offering, and redemption price per share | |||||
| ($2,247,752 applicable to 75,651 shares of beneficial interest outstanding - Note 4) | $ | 29.71 | |||
*Redemption price per share is equal to net asset value less any applicable contingent deferred sales charge.
See notes to financial statements.
6
| Statement of Operations | |||||
|---|---|---|---|---|---|
| Thornburg Value Fund | Six Months Ended March 31, 2004 | ||||
| (Unaudited) | |||||
| INVESTMENT INCOME | |||||
| Dividend income (net of foreign taxes withheld of $476,389) | $ | 16,599,858 | |||
| Interest income | 5,840,127 | ||||
| Other income | 293 | ||||
| Total Income | 22,440,278 | ||||
| EXPENSES | |||||
| Investment advisory fees (Note 3) | 7,999,526 | ||||
| Administration fees (Note 3) | |||||
| Class A Shares | 690,291 | ||||
| Class B Shares | 62,151 | ||||
| Class C Shares | 310,012 | ||||
| Class I Shares | 75,939 | ||||
| Class R-1 Shares | 162 | ||||
| Distribution and service fees (Note 3) | |||||
| Class A Shares | 1,405,361 | ||||
| Class B Shares | 511,628 | ||||
| Class C Shares | 2,524,348 | ||||
| Class R-1 Shares | 687 | ||||
| Transfer agent fees | |||||
| Class A Shares | 637,150 | ||||
| Class B Shares | 94,735 | ||||
| Class C Shares | 376,360 | ||||
| Class I Shares | 84,630 | ||||
| Class R-1 Shares | 1,396 | ||||
| Registration & filing fees | |||||
| Class A Shares | 11,705 | ||||
| Class B Shares | 9,397 | ||||
| Class C Shares | 9,946 | ||||
| Class I Shares | 10,587 | ||||
| Class R-1 Shares | 7,794 | ||||
| Custodian fees (Note 3) | 278,904 | ||||
| Professional fees | 75,010 | ||||
| Accounting fees | 67,050 | ||||
| Trustee fees | 20,835 | ||||
| Other expenses | 112,542 | ||||
| Total Expenses | 15,378,146 | ||||
| Less: | |||||
| Expenses reimbursed by investment advisor (Note 3) | (9,439 | ) | |||
| Fees paid indirectly (Note3) | (4,654 | ) | |||
| Net Expenses | 15,364,053 | ||||
| Net Investment Income | $ | 7,076,225 | |||
| REALIZED AND UNREALIZED GAIN (LOSS) | |||||
| Net realized gain (loss) on: | |||||
| Investments | $ | 101,596,317 | |||
| Foreign currency transactions | 7,963 | ||||
| -- | 101,604,280 | ||||
| Net change in unrealized appreciation (depreciation) on: | |||||
| Investments | 126,425,531 | ||||
| Foreign currency translation | 91,370 | ||||
| -- | 126,516,901 | ||||
| Net Realized and Unrealized | |||||
| Gain (Loss) on Investments | 228,121,181 | ||||
| Net Increase (Decrease) in Net Assets Resulting | |||||
| From Operations | $ | 235,197,406 | |||
See notes to financial statements.
8
Thornburg Value Fund
Statements of Changes in net assets
| Six Months Ended March 31, 2004 | Year Ended September 30, 2003 | |||||||
|---|---|---|---|---|---|---|---|---|
| INCREASE (DECREASE) IN NET ASSETS FROM: | ||||||||
| OPERATIONS: | ||||||||
| Net investment income gain (loss) | $ | 7,076,225 | $ | 7,313,471 | ||||
| Net realized gain (loss) on investments and foreign currency | ||||||||
| transactions | 101,604,280 | (71,469,466 | ) | |||||
| Increase (Decrease) in unrealized appreciation (depreciation ) | ||||||||
| on investments and foreign currency translation | 126,516,901 | 418,721,057 | ||||||
| Net Increase (Decrease) in Net Assets | ||||||||
| Resulting from Operations | 235,197,406 | 354,565,062 | ||||||
| DIVIDENDS TO SHAREHOLDERS: | ||||||||
| From net investment income | ||||||||
| Class A Shares | (1,994,363 | ) | (608,906 | ) | ||||
| Class B Shares | (1,328 | ) | 0 | |||||
| Class C Shares | (93,549 | ) | 0 | |||||
| Class I Shares | (817,584 | ) | (313,321 | ) | ||||
| Class R-1 Shares | (1,797 | ) | 0 | |||||
| From return of capital | ||||||||
| Class A Shares | 0 | (841,616 | ) | |||||
| Class I Shares | 0 | (433,066 | ) | |||||
| FUND SHARE TRANSACTIONS - (Note 4) | ||||||||
| Class A Shares | 61,882,012 | (9,595,663 | ) | |||||
| Class B Shares | 1,857,939 | 1,176,900 | ||||||
| Class C Shares | 28,277,969 | (15,910,000 | ) | |||||
| Class I Shares | 45,500,208 | 1,829,284 | ||||||
| Class R-1 Shares | 2,232,993 | 75 | ||||||
| Net Increase (Decrease) in Net Assets | 372,039,906 | 329,868,749 | ||||||
| NET ASSETS: | ||||||||
| Beginning of period | 1,785,430,744 | 1,455,561,995 | ||||||
| End of period | $ | 2,157,470,650 | $ | 1,785,430,744 | ||||
See notes to financial statements.
9
Notes to financial statements
Thornburg Value Fund
March 31, 2004
NOTE 1 – ORGANIZATION Thornburg Value Fund, hereinafter referred to as the “Fund,” is a diversified series of Thornburg Investment Trust (the “Trust”). The Trust was organized as a Massachusetts business trust under a Declaration of Trust dated June 3, 1987 and is registered as a diversified, open-end management investment company under the Investment Company Act of 1940, as amended. The Trust is currently issuing nine series of shares of beneficial interest in addition to those of the Fund: Thornburg Limited Term U.S. Government Fund, Thornburg New Mexico Intermediate Municipal Fund, Thornburg Intermediate Municipal Fund, Thornburg Limited Term Income Fund, Thornburg Florida Intermediate Municipal Fund, Thornburg International Value Fund, Thornburg Core Growth Fund, Thornburg New York Intermediate Municipal Fund, and Thornburg Investment Income Builder Fund. Each series is considered to be a separate entity for financial reporting and tax purposes and bears expenses directly attributable to it. The Fund seeks long-term capital appreciation by investing primarily in domestic equity securities selected on a value basis.
The Fund currently offers five classes of shares of beneficial interest, Class A, Class B, Class C, Institutional Class (Class I) and Retirement Class (Class R-1) shares. Each class of shares of a Fund represents an interest in the same portfolio of investments of the Fund, except that (i) Class A shares are sold subject to a front-end sales charge collected at the time the shares are purchased and bear a service fee, (ii) Class B shares are sold at net asset value without a sales charge at the time of purchase, but are subject to a contingent deferred sales charge upon redemption and bear both a service fee and distribution fee, (iii) Class C shares are sold at net asset value without a sales charge at the time of purchase, but are subject to a contingent deferred sales charge upon redemption within one year, and bear a service fee and a distribution fee, (iv) Class I shares are sold at net asset value without a sales charge at the time of purchase, (v) Class R-1 shares are sold at net asset value without a sales charge at the time of purchase but bear both a service fee and distribution fee, and (vi) the respective classes have different reinvestment privileges. Additionally, the Fund may allocate among its classes certain expenses, to the extent allowable to specific classes, including transfer agent fees, government registration fees, certain printing and postage costs, and administrative and legal expenses. Currently, class specific expenses of the Fund are limited to service and distribution fees, administration fees and certain registration and transfer agent expenses. Class B shares of the Fund outstanding for eight years will convert to Class A shares of the Fund.
NOTE 2 – SIGNIFICANT ACCOUNTING POLICIES Significant accounting policies of the Fund are as follows:
Valuation of Securities: In determining net asset value, investments are stated at value based on latest sales prices, normally at 4:00 pm EST reported on national securities exchanges on the last business day of the period. Investments for which no sale is reported are valued at the mean between bid and asked prices or in accordance with such other method as the Trustees may authorize. Securities for which market quotations are not readily available are valued at fair value as determined by management and approved in good faith by the Board of Trustees. Short term obligations having remaining maturities of 60 days or less are valued at amortized cost, which approximates market value.
Foreign Currency Translation: Portfolio securities and other assets and liabilities denominated in foreign currencies are translated into U.S. dollars based on the exchange rate of such currencies against the U.S. dollar on the date of valuation. Purchases and sales of securities and income items denominated in foreign currencies are translated into U.S. dollars at the exchange rate in effect on the translation date. When the Fund purchases or sells foreign securities it will customarily enter into a foreign exchange contract to minimize foreign exchange risk from the trade date to the settlement date of such transactions.
The Fund does not separately report the effect of changes in foreign exchange rates from changes in market prices on securities held. Such changes are included in net realized and unrealized gain or loss from investments.
Reported net realized foreign exchange gains or losses arise from sales of foreign currencies, currency gains or losses realized between the trade and settlement dates on securities transactions and the difference between the amount of interest recorded on the Fund’s books, and the U.S. dollar equivalent of the amounts actually received or paid.
Federal Income Taxes: It is the policy of the Fund to comply with the provisions of the Internal Revenue Code applicable to “regulated investment companies” and to distribute all of its taxable income to its shareholders. Therefore, no provision for Federal income tax is required.
When-Issued and Delayed Delivery Transactions: The Fund may engage in when-issued or delayed delivery transactions. To the extent the Fund engages in such transactions, it will do so for the purpose of acquiring portfolio securities consistent with its investment objectives and not for the purpose of investment leverage or to speculate on market changes. At
10
Thornburg Value Fund
Notes to financial statements, continued
the time the Fund makes a commitment to purchase a security on a when-issued basis, it will record the transaction and reflect the value in determining its net asset value. When effecting such transactions, assets of the Fund of an amount sufficient to make payment for the portfolio securities to be purchased will be segregated on the Fund’s records on the trade date.
Dividends: Dividends to shareholders are generally paid quarterly and are reinvested in additional shares of the Fund at net asset value per share at the close of business on the dividend payment date, or at the shareholder’s option, paid in cash. Net realized capital gains, to the extent available, will be distributed at least annually. Distributions to shareholders are based on income tax regulations and therefore, their characteristics may differ for financial statement and tax purposes.
General: Securities transactions are accounted for on a trade date basis. Interest income is accrued as earned and dividend income is recorded on the ex-dividend date. Certain income from foreign securities is recognized as soon as information is available to the Fund. Realized gains and losses from the sale of securities are recorded on an identified cost basis. Net investment income, other than class specific expenses, and realized and unrealized gains and losses, are allocated daily to each class of shares based upon the relative net asset value of outstanding shares of each class of shares at the beginning of the day (after adjusting for the current share activity of the respective class). Expenses common to all funds are allocated among the funds comprising the Trust based upon their relative net asset values or other appropriate allocation methods.
Guarantees and Indemnifications: Under the Trust’s organizational documents, its officers and trustees are indemnified against certain liability arising out of the performance of their duties to the Fund. Additionally, in the normal course of business the Trust enters into contracts with service providers that contain general indemnification clauses. The Trust’s maximum exposure under these arrangements is unknown. However, based on experience, the Trust expects the risk of loss to be remote.
Use of Estimates: The preparation of financial statements, in conformity with generally accepted accounting principles, requires management to make estimates and assumptions that affect the reported amounts of assets and liabilities and the disclosure of contingent assets and liabilities at the date of the financial statements and the reported amounts of increases and decreases in net assets from operations during the reporting period. Actual results could differ from those estimates.
NOTE 3 — INVESTMENT ADVISORY FEE AND OTHER TRANSACTIONS WITH AFFILIATES
Pursuant to an investment advisory agreement, Thornburg Investment Management, Inc. (the “Advisor”) serves as the investment advisor and performs services to the Fund for which the fees are payable at the end of each month. For the period ended March 31, 2004, these fees were payable at annual rates ranging from .875 of 1% to .675 of 1% of the average daily net assets of the Fund depending on the Fund’s asset size. The Fund also has an administrative services agreement with the Advisor, whereby the Advisor will perform certain administrative services for the shareholders of each class of the Fund’s shares, and for which fees will be payable at an annual rate of up to .125 of 1% of the average daily net assets attributable to each class of shares. For the period ended March 31, 2004, the Advisor voluntarily reimbursed certain class specific expenses and administrative fees of $9,439 for Class R-1 shares.
The Fund has an underwriting agreement with Thornburg Securities Corporation (the “Distributor”), which acts as the distributor of the Fund’s shares. For the period ended March 31, 2004, the Distributor has advised the Fund that it earned net commissions aggregating $108,256 from the sale of Class A shares of the Fund, and collected contingent deferred sales charges aggregating $14,628 from redemptions of Class C shares of the Fund.
Pursuant to a service plan under Rule 12b-1 of the Investment Company Act of 1940, the Fund may reimburse to the Advisor an amount not to exceed .25 of 1% per annum of its average daily net assets attributable to each class of shares of the Fund for payments made by the Advisor to securities dealers and other financial institutions to obtain various shareholder related services. The Advisor may pay out of its own resources additional expenses for distribution of the Fund’s shares.
The Fund has also adopted distribution plans pursuant to Rule 12b-1, applicable only to the Fund’s Class B, Class C, and Class R-1 shares under which the Fund compensates the Distributor for services in promoting the sale of Class B, Class C, and Class R-1 shares of the Fund at an annual rate of up to .75 of 1% of the average daily net assets attributable to Class B, Class C, and Class R-1 shares. Total fees incurred by each class of shares of the Fund under its respective service and distribution Plans for the period ended March 31, 2004 are set forth in the Statement of Operations.
The Fund has an agreement with the custodian bank to indirectly pay a portion of the custodian’s fees through credits earned by the Fund’s cash on deposit with the bank. This
11
Thornburg Value Fund
Notes to financial statements, continued
March 31, 2004
deposit agreement is an alternative to overnight investments. Custodial fees have been adjusted to reflect amounts that would have been paid without this agreement, with a corresponding adjustment reflected as fees paid indirectly in the statements of operations. For the period ended March 31, 2004, the fees paid indirectly were $4,654.
Certain officers and trustees of the Trust are also officers and/or directors of the Advisor and Distributor. The compensation of unaffiliated trustees is borne by the Trust.
NOTE 4 — SHARES OF BENEFICIAL INTEREST
At March 31, 2004 there were an unlimited number of shares of beneficial interest authorized. Sales of Class R-1 shares commenced July 1, 2003. Transactions in shares of beneficial interest were as follows:
| Period Ended March 31, 2004 | Year Ended September 30, 2003 | |||||||||||||
|---|---|---|---|---|---|---|---|---|---|---|---|---|---|---|
| Shares | Amount | Shares | Amount | |||||||||||
| Class A Shares | ||||||||||||||
| Shares sold | 6,856,915 | $ | 197,901,422 | 10,779,879 | $ | 260,163,852 | ||||||||
| Shares issued to shareholders in | -- | -- | 51,321 | 1,323,066 | ||||||||||
| reinvestment of dividends | ||||||||||||||
| Shares repurchased ** | (4,778,638 | ) | (136,019,410 | ) | (12,057,032 | ) | (271,082,581 | ) | ||||||
| Net Increase (Decrease) | 2,078,277 | $ | 61,882,012 | (1,225,832 | ) | $ | (9,595,663 | ) | ||||||
| ** The Fund charges a redemption fee of 1% of the Class A shares exchanged within 90 days of purchase. For the period ended March 31, 2004, $8,441 was netted in the amount reported for shares repurchased | ||||||||||||||
| Class B Shares | ||||||||||||||
| Shares sold | 262,835 | $ | 7,300,130 | 513,612 | $ | 11,953,625 | ||||||||
| Shares repurchased | (194,243 | ) | (5,442,191 | ) | (487,795 | ) | (10,776,725 | ) | ||||||
| Net Increase (Decrease) | 68,592 | $ | 1,857,939 | 25,817 | $ | 1,176,900 | ||||||||
| Class C Shares | ||||||||||||||
| Shares sold | 2,232,155 | $ | 62,719,232 | 2,810,602 | $ | 66,343,222 | ||||||||
| Shares repurchased | (1,228,014 | ) | (34,441,263 | ) | (3,690,038 | ) | (82,253,222 | ) | ||||||
| Net Increase (Decrease) | 1,004,141 | $ | 28,277,969 | (879,436 | ) | $ | (15,910,000 | ) | ||||||
| Class I Shares | ||||||||||||||
| Shares sold | 2,602,698 | $ | 76,317,168 | 3,982,384 | $ | 94,533,465 | ||||||||
| Shares issued to shareholders in | -- | -- | 23,269 | 607,316 | ||||||||||
| reinvestment of dividends | ||||||||||||||
| Shares repurchased ** | (1,060,545 | ) | (30,816,960 | ) | (4,135,473 | ) | (93,311,497 | ) | ||||||
| Net Increase (Decrease) | 1,542,153 | $ | 45,500,208 | (129,820 | ) | $ | 1,829,284 | |||||||
| ** The Fund charges a redemption fee of 1% of the Class I shares exchanged within 90 days of purchase. For the period ended March 31, 2004, $4,224 was netted in the amount reported for shares repurchased | ||||||||||||||
| Class R-1 Shares | ||||||||||||||
| Shares sold | 77,640 | $ | 2,291,771 | 3 | $ | 75 | ||||||||
| Shares repurchased | (1,992 | ) | (58,778 | ) | -- | -- | ||||||||
| Net Increase (Decrease) | 75,648 | $ | 2,232,993 | 3 | $ | 75 | ||||||||
12
Thornburg Value Fund
Notes to financial statements, continued
March 31, 2004
NOTE 5 – SECURITIES TRANSACTIONS
For the period ended March 31, 2004 the Fund had purchase and sale transactions of investment securities excluding short-term securities of $862,612,627 and $709,928,543, respectively.
NOTE 6 – INCOME TAXES
At March 31, 2004, information on the tax components of capital is as follows:
Cost of investments for tax purpose $ 1,889,095,638
| Gross unrealized appreciation on a tax basis | $ 355,301,945 | ||
| Gross unrealized depreciation on a tax basis | (78,918,410 | ) | |
| Net unrealized | |||
| appreciation (depreciation) on investments (tax basis) | $ 276,383,535 | ||
At March 31, 2004, the Fund had tax basis capital losses, which may be carried over to offset future capital gains. Such losses expire as follows:
Capital loss carryovers expiring in:
| 2009 | $ | 11,324,648 | |||
| 2010 | 188,545,264 | ||||
| 2011 | 174,918,826 | ||||
| -- | $ | 374,788,738 | |||
At March 31, 2004, the Fund had deferred currency and capital losses occurring subsequent to October 31, 2002 of $269,729 and $42,175,867, respectively. For tax purposes, such losses will be reflected in the year ended September 30, 2004.
Unutilized tax basis capital losses may be carried forward to offset realized gains in future years. To the extent such carry forwards are used, capital gains distributions may be reduced to the extent provided by regulations.
Net investment income and net realized gain (loss) differ for financial statement and tax purposes primarily due to differing treatments of foreign currency transactions and losses realized subsequent to October 31 on the sale of securities and foreign currencies.
13
| Financial highlights | ||||||
|---|---|---|---|---|---|---|
| Thornburg Value Fund | ||||||
| Six Months Ended | Year Ended September 30, | Period Ended | ||||
| March 31, 2004 | 2003 | 2002 | 2001 | 2000 | September 30, 1999(c) | |
| Class I Shares: | ||||||
| Per Share Performance | ||||||
| (for a share outstanding throughout the period)+ | ||||||
| Net asset value, beginning of period | $ 26.64 | $ 20.95 | $ 26.18 | $ 33.09 | $ 26.26 | $ 21.78 |
| Income from investment operations: | ||||||
| Net investment income | 0.19 | 0.26 | 0.11 | 0.14 | 0.91 | 0.25 |
| Net realized and unrealized | ||||||
| gain (loss) on investments | 3.38 | 5.51 | (5.34) | (6.42) | 7.25 | 4.48 |
| Total from investment operations | 3.57 | 5.77 | (5.23) | (6.28) | 8.16 | 4.73 |
| Less dividends from: | ||||||
| Net investment income | (0.07) | (0.03) | -- | (0.28) | (0.94) | (0.25) |
| Net realized gains | -- | -- | -- | (0.25) | (0.39) | -- |
| Return of Capital | -- | (0.05) | -- | (0.10) | -- | -- |
| Total dividends | (0.07) | (0.08) | -- | (0.63) | (1.33) | (0.25) |
| Change in net asset value | 3.50 | 5.69 | (5.23) | (6.91) | 6.83 | 4.48 |
| Net asset value, end of period | $ 30.14 | $ 26.64 | $ 20.95 | $ 26.18 | $ 33.09 | $ 26.26 |
| Total return (a) | 13.41% | 27.55% | (19.98)% | (19.29)% | 31.44% | 21.70% |
| Ratios/Supplemental Data | ||||||
| Ratios to average net assets: | ||||||
| Net investment income | 1.28%(b) | 1.10% | 0.42% | 0.45% | 2.82% | 1.14%(b) |
| Expenses, after expense reductions | 0.97%(b) | 0.99% | 0.98% | 0.99% | 0.99% | 1.00%(b) |
| Expenses, after expense reductions | ||||||
| and net of custody credits | 0.97%(b) | 0.99% | 0.98% | -- | -- | -- |
| Expenses, before expense reductions | 0.97%(b) | 1.03% | 0.99% | 1.01% | 1.00% | 1.13%(b) |
| Portfolio turnover rate | 36.13% | 82.89% | 76.37% | 71.81% | 72.35% | 62.71% |
| Net assets at end of period (000) | $ 341,282 | $ 260,624 | $ 207,613 | $ 293,784 | $ 242,974 | $ 52,357 |
(a) Not annualized for periods less than one year.
(b) Annualized.
(c) Effective date of Class I Shares was November 2, 1998.
+ Based on weighted average shares outstanding.
14
| Schedule of investments | ||||||||
|---|---|---|---|---|---|---|---|---|
| Thornburg Value Fund | March 31, 2004 | |||||||
| CUSIPS: CLASS A - 885-215-731, CLASS B - 885-215-590, CLASS C - 885-215-715, CLASS I - 885-215-632, CLASS R-1 - 885-215-533 NASDAQ SYMBOLS: CLASS A - TVAFX, CLASS B - TVBFX, CLASS C - TVCFX, CLASS I - TVIFX, CLASS R-1 - TVRFX | ||||||||
| Shares | Value | |||||||
| COMMON STOCKS-- 95.80% | ||||||||
| AUTOMOBILES & COMPONENTS (2.10%) | ||||||||
| Hyundai Motor Co. | 978,000 | $ | 44,700,772 | |||||
| BANKS (6.50%) | ||||||||
| Lloyds TSB Group PLC | 5,446,500 | 41,449,314 | ||||||
| The Bank of New York Co. Inc. | 1,682,200 | 52,989,300 | ||||||
| Wells Fargo & Co. | 835,400 | 47,342,118 | ||||||
| CAPITAL GOODS (2.20%) | ||||||||
| Deere & Co. | 680,800 | 47,186,248 | ||||||
| COMMERCIAL SERVICES & SUPPLIES (0.90%) | ||||||||
| FTI Consulting Inc. + | 1,236,500 | 20,600,090 | ||||||
| DIVERSIFIED FINANCIALS (10.80%) | ||||||||
| Citigroup Inc. | 1,279,000 | 66,124,300 | ||||||
| E-Trade Financial Corp. + | 3,179,677 | 42,448,688 | ||||||
| Fannie Mae | 1,090,800 | 81,100,980 | ||||||
| Price T Rowe Group Inc. | 815,600 | 43,903,748 | ||||||
| ENERGY (6.30%) | ||||||||
| Amerada Hess Corp. | 962,300 | 62,818,944 | ||||||
| Exxon Mobil Corp. | 447,500 | 18,611,525 | ||||||
| Unocal Corp. | 1,485,000 | 55,360,800 | ||||||
| HEALTHCARE EQUIPMENT & SERVICES (8.00%) | ||||||||
| Amerisourcebergen Corp. | 752,700 | 41,157,636 | ||||||
| Anthem Inc. + | 459,200 | 41,621,888 | ||||||
| Caremark Rx Inc. + | 1,202,200 | 39,973,150 | ||||||
| Health Management Associates | 2,190,255 | 50,835,819 | ||||||
| HOUSEHOLD & PERSONAL PRODUCTS (1.50%) | ||||||||
| American Greetings Corp. + | 1,448,700 | 32,986,899 | ||||||
| INSURANCE (10.60%) | ||||||||
| Aon Corp. | 2,175,700 | 60,723,787 | ||||||
| Lincoln National Corp. | 1,029,022 | 48,693,321 | ||||||
| Marsh & McLennan Cos. Inc. | 1,359,900 | 62,963,370 | ||||||
| The St. Paul Cos | 1,415,100 | 56,618,151 | ||||||
| MEDIA (7.90%) | ||||||||
| AOL Time Warner Inc. + | 2,533,755 | 42,719,109 | ||||||
| Comcast Corp. + | 1,430,200 | 39,873,976 | ||||||
| Directv Group Inc. + | 2,914,185 | 44,820,165 | ||||||
| Fox Entertainment Group Inc. + | 1,576,175 | 42,714,343 | ||||||
| PHARMACEUTICALS & BIOTECHNOLOGY (5.10%) | ||||||||
| Genzyme Corp. + | 870,300 | 40,938,912 | ||||||
| Pfizer Inc. | 1,989,300 | 69,724,965 | ||||||
| REAL ESTATE MANAGEMENT & DEVELOPMENT (2.00%) | ||||||||
| Boston Properties Inc. | 803,400 | 43,632,654 | ||||||
| RETAILING (6.60%) | ||||||||
| InterActiveCorp + | 1,538,075 | $ | 48,587,789 | |||||
| Lowe's Cos. Inc. | 949,200 | 53,278,596 | ||||||
| Target Corp. | 906,400 | 40,824,256 | ||||||
| SOFTWARE & SERVICES (5.30%) | ||||||||
| Affiliated Computer Services Inc. + | 622,090 | 32,286,471 | ||||||
| DoubleClick Inc. + | 2,244,364 | 25,249,095 | ||||||
| Eclipsys Corp. + | 1,866,440 | 25,159,611 | ||||||
| Electronic Arts Inc. + | 587,800 | 31,717,688 | ||||||
| TECHNOLOGY - HARDWARE & EQUIPMENT (8.80%) | ||||||||
| Hewlett-Packard Co. | 1,795,400 | 41,006,936 | ||||||
| Samsung Electronics Co. Ltd. | 141,800 | 70,748,484 | ||||||
| Seagate Technology + | 2,247,300 | 36,248,949 | ||||||
| Texas Instruments Inc. | 1,480,675 | 43,265,324 | ||||||
| TELECOMMUNICATION SERVICES (7.10%) | ||||||||
| Alltel Corp. | 1,262,000 | 62,961,180 | ||||||
| Nextel Communications Inc. + | 1,942,600 | 48,040,498 | ||||||
| NII Holdings Inc. + | 1,203,204 | 42,148,236 | ||||||
| TRANSPORTATION (2.10%) | ||||||||
| Union Pacific Corp. | 777,700 | 46,522,014 | ||||||
| UTILITIES (2.00%) | ||||||||
| Dominion Resources Inc. | 657,200 | 42,257,960 | ||||||
| TOTAL COMMON STOCKS (Cost $1,793,298,225) | -- | 2,074,938,059 | ||||||
| CORPORATE BONDS -- 2.00% | ||||||||
| TELECOMMUNICATION SERVICES (0.90%) | ||||||||
| Level 3 Communications Inc., 9.125%, 5/1/2008 | $ | 23,400,000 | $ | 18,954,000 | ||||
| TRANSPORTATION (1.10%) | ||||||||
| Delta Air Lines Inc., 10.00%, 8/15/2008 | 6,160,000 | 4,373,600 | ||||||
| Delta Air Lines Inc., 7.90%, 12/15/2009 | 5,000,000 | 3,300,000 | ||||||
| Delta Air Lines Inc., 10.125%, 5/15/2010 | 2,900,000 | 1,972,000 | ||||||
| Delta Air Lines Inc., 9.75%, 5/15/2021 | 2,000,000 | 1,240,000 | ||||||
| Delta Air Lines Inc., 8.30%, 12/15/2029 | 24,500,000 | 14,087,500 | ||||||
| TOTAL CORPORATE BONDS (Cost $47,807,408) | -- | 43,927,100 | ||||||
| CONVERTIBLE BONDS -- 1.30% | ||||||||
| TELECOMMUNICATION SERVICES (1.30%) | ||||||||
| Level 3 Communications Inc., 6.00%, 9/15/2009 | 18,700,000 | 11,407,000 | ||||||
| Level 3 Communications Inc., 6.00%, 3/15/2010 | 28,800,000 | 17,208,000 | ||||||
| TOTAL CONVERTIBLE BONDS (Cost $29,990,991) | -- | 28,615,000 | ||||||
| SHORT TERM INVESTMENTS -- 0.90% | ||||||||
| American General Finance, 1.07% due 4/2/2004 | $ | 15,000,000 | $ | 14,999,554 | ||||
| American General Finance, 1.08% due 4/7/2004 | 3,000,000 | 2,999,460 | ||||||
| TOTAL SHORT TERM INVESTMENTS (Cost $17,999,014) | -- | 17,999,014 | ||||||
| TOTAL INVESTMENTS (100%) (Cost $1,889,095,638) | -- | $ | 2,165,479,173 | |||||
| + Non-income producing | ||||||||
| See notes to financial statements | ||||||||
17
March 31, 2004
Index Comparison
The chart below compares performance of Thornburg Value Fund and the Standard & Poor’s 500 Index for the period November 2, 1998 to March 31, 2004. Past performance of the Index and the Fund may not be indicative of future performance. The performance data and graph do not reflect the deduction of taxes that a shareholder would pay on distributions or the redemption of Fund shares.
Thornburg Value Fund
index comparisons
Thornburg Value Fund Class I Total Returns, Since Inception,versus
S&P 500 Index
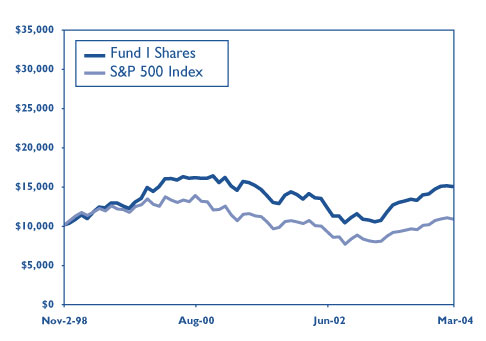
Average Annual Total Returns(periods
ending 3/31/04)
| I Shares | |
|---|---|
| 1 Year: | 40.63% |
| 5 Year: | 5.05% |
| From Inception (11/2/98): | 7.70% |
There is no up-front sales charge for I shares.
Past performance is no guarantee of future results. Current returns may be either lower or higher than those shown. Share prices and returns will fluctuate and investors may experience a loss upon redemption. There is no guarantee that the Fund will meet its objectives. Shares in the Fund carry risks, including possible loss of principal.
Carefully consider the Fund’s investment objectives, risks, sales charges, and expenses; this is found in the prospectus, which is available from your financial advisor or from www.thornburg.com. Read it carefully before you invest or send money.
There are special risk considerations associated with international investing, including fluctuating exchange rates, government regulations and differences in liquidity, which may affect the volatility of the Fund.
For month-end performance information, or for information and commentary on Fund holdings, including links to each company’s home page, visit www.thornburg.com.
The Standard & Poor’s 500 Stock Index (S&P 500) is an unmanaged index generally representative of the U.S. Stock Market, without regard to company size.
Unless otherwise noted, index returns reflect the reinvestment of income dividends and capital gains, if any, but do not reflect fees, brokerage commissions or other expenses of investing. Investors may not make direct investments into any index.
18
Thornburg Value Fund
Portfolio proxy voting
March 31, 2004
Policies and Procedures (Unaudited):
The Trust has delegated to Thornburg Investment Management, Inc. (“the Advisor”) voting decisions respecting proxies for the Fund’s voting securities. The Advisor makes voting decisions in accordance with its Proxy Voting Policy and Procedures. A description of the policy and Procedures is available (i) without charge, upon request, by calling the Advisor toll-free at 1.800.847.0200, (ii) on the Thornburg website at www.thornburg.com, and (iii) on the Securities and Exchange Commission’s website at www.sec.gov.
Commencing August 31, 2004, information regarding how proxies were voted will be available on or before August 31 of each year for the twelve months ending the preceding June 30. This information will be available (i) without charge, upon request, on the Thornburg website at www.thornburg.com and (ii) on the Securities and Exchange Commission’s website at www.sec.gov.
19
Investment Manager Thornburg Investment Management, Inc.
119 East Marcy Street
Santa Fe, New Mexico 87501
800.847.0200
Principal Underwriter Thornburg Securities Corporation
119 East Marcy Street
Santa Fe, New Mexico 87501
800.847.0200
This report is submitted for the general information of shareholders of the Fund. It is not authorized for distribution to prospective investors in the Fund unless preceded or accompanied by an effective prospectus. Carefully consider information in the prospectus regarding the Fund’s investment objectives and policies, risks, sales charges, expenses, experience of its management, marketability of shares, and other information. Performance data quoted represent past performance and do not guarantee future results.
www.thornburg.com
Thornburg
Florida Intermediate Municipal Fund
Semi-Annual Report March 31, 2004
| Thornburg Florida Intermediate Municipal Fund ALL DATA AS OF 3/31/04. |
| FUND FACTS: Thornburg Florida Intermediate Municipal Fund | |
| -- | A Shares |
| Annualized Distribution Rate (at NAV) | 3.09% |
| SEC Yield | 2.30% |
| NAV | $ 12.52 |
| Maximum Offering Price | $ 12.78 |
| TOTAL RETURNS: Annual Average - (After Subtracting Maximum Sales Charge) | |
| One Year | 2.05% |
| Three Years | 4.45% |
| Five Years | 4.28% |
| Ten Years | N/A |
| Since Inception | 4.79% |
| Inception Date | 2/1/1994 |
| Maximum sales charge of the Fund’s Class A Shares is 2.00%. Past performance is no guarantee of future results. Current returns may be either lower or higher than those shown. Share prices and returns will fluctuate and investors may experience a loss upon redemption. There is no guarantee that the Fund will meet its objectives. Shares in the Fund carry risks, including possible loss of principal. |
| Carefully consider the Fund’s investment objectives, risks, sales charges, and expenses; this information is found in the prospectus, which is available from your financial advisor or from www.thornburg.com. Read it carefully before you invest or send money. |
| For month-end performance information, visit www.thornburg.com. The SEC Yield is computed in accordance with SEC standards measuring the net investment income per share over a specified 30-day period expressed as a percentage of the maximum offering price of the Fund’s shares at the end of the period. |
| The distribution rate is calculated by taking the sum of the month’s total distribution factors and dividing this sum by a 30-day period and annualizing to 360-day year. The value is then divided by the ending NAV to arrive at the annualized distribution yield. The yield is calculated on a periodic basis and is subject to change depending on the Fund’s NAV and current distributions. |
1
Thornburg Florida Intermediate Municipal Fund
Letter to shareholders
April 19, 2004
Dear Fellow Shareholder:
I am pleased to present the Semi-Annual Report for your Thornburg Florida Intermediate Fund. The net asset value of the A shares increased by 6 cents to $12.52 during the six-month period ending March 31, 2004. If you were with us for the entire period, you received dividends of 19.8 cents per share. If you reinvested dividends, you received 20.0 cents per share.
Interest rates on intermediate municipal bonds fell slightly over the six-month period ending March 31, 2004. For example, the interest rate on a ten-year AAA rated municipal bond dropped from 3.67% to 3.49% from the end of September to the end of March. Lower interest rates helped the fund’s net asset value appreciate somewhat to produce a total return of 2.09% over the six-month period. The Merrill Lynch 7-12 Year Municipal Bond Index had a total return of 3.33% over the same time period. The Index has a significantly longer duration than the fund (7.3 versus 4.4 years), causing it to perform better than the fund in falling interest rate environments such as the 6 months ending March 31, 2004.
Municipal bond yields reached a low point on March 9th and have been trending upwards since then. For example, the yield on a ten-year AAA municipal bond is up 0.55% to 3.81% as of April 15, 2004. Yields are up because economic growth has finally led to employment growth. That point was made abundantly clear with the announcement of 308,000 new jobs on April 2nd. Whether interest rates will keep climbing depends largely upon what happens to inflation.
We believe that consumer price inflation has probably bottomed around the 1.2% level. Many commodity prices have doubled over the last year. Price pressures abound in metals, petroleum products, chemicals, paper, and even in soybeans! Transportation costs are going up rapidly. Unit labor costs have been subdued because of productivity gains, but past productivity gains may prove very hard to replicate. All these factors should lead to somewhat higher inflation over the next few years.
Higher inflation, coupled with rising bond issuance will likely give rise to higher interest rates on bonds. For now, a 1% Fed Funds target seems to be keeping a cap on how high bond yields can go, but the Federal Reserve will probably have to start moving to a less accommodative policy before the end of this year. If that happens, we would expect bond yields to rise above current trading ranges.
We have prepared for this environment by keeping the duration of your portfolio to the short end of its typical range. We have also generally favored bonds that we believe will be less price sensitive to interest rate changes. We have not deviated from our long-held strategy of laddering short and intermediate bonds because we believe that laddering is the most effective way to deal with changing interest rates in an uncertain world.
Your Thornburg Florida Intermediate Municipal Fund is a laddered portfolio of over 75 municipal obligations from all over Florida. Today, your fund’s weighted average maturity is 7.0 years. We always keep it below 10 years. We ladder the maturity dates of the bonds in your portfolio so that some of the bonds are scheduled to mature during each of the coming years. Laddering intermediate bonds
2
Thornburg Florida Intermediate Municipal Fund
Letter to shareholders, Continued
accomplishes two goals. First, the diverse bond maturities contained in a ladder defuse interest-rate risk and dampen the fund’s price volatility. Second, laddering gives the fund a steady cash flow stream from maturing bonds to reinvest toward the top of the ladder where yields are typically higher. The chart at left describes the percentages of your fund’s bond portfolio maturing in each of the coming years.
The Florida State Revenue Estimating Conference recently revised its revenue forecast upward by over $500 million. Revenues are now projected to grow by over 7% in 2004 adding to budgetary reserves that, at roughly $3 billion, are the highest in the nation. The state does face future challenges meeting the requirements of voter initiatives concerning school class size and high-speed rail service. However, the state has significant resources available and a very healthy economy. Currently, 96% of the portfolio is rated A or above and 73% is rated AAA by Moody’s or Standard and Poor’s.
Over the years, our practice of laddering a diversified portfolio of short and intermediate maturity municipal bonds has allowed your fund to perform consistently well in varying interest rate environments. Thank you for investing in Thornburg Florida Intermediate Municipal Fund.
| % of portfolio maturing within | Cumulative % maturing by end of | ||
|---|---|---|---|
| 1 to 2 years = 12% | Year 2 = 12% | ||
| 2 to 4 years = 13% | Year 4 = 25% | ||
| 4 to 6 years = 13% | Year 6 = 38% | ||
| 6 to 8 years = 17% | Year 8 = 55% | ||
| 8 to 10 years = 16% | Year 10 = 71% | ||
| 10 to 12 years = 13% | Year 12 = 84% | ||
| 12 to 14 years = 10% | Year 14 = 94% | ||
| 14 to 16 years = 1% | Year 16 = 95% | ||
| Over 16 years = 5% | Over 16 Years= 100% | ||
Percentages can and do vary. Data as of 3/31/04
Sincerely,
George Strickland
Portfolio Manager
The Merrill Lynch 7-12 Year Municipal Bond Index represents a broad measure of market performance. It is a model portfolio of municipal obligations throughout the U.S., with an average maturity which ranges from seven to twelve years.
Unless otherwise noted, index returns reflect the reinvestment of income dividends and capital gains, if any, but do not reflect fees, brokerage commissions or other expenses of investing. Investors may not make direct investments into any index.
3
| Statement of assets and liabilities | |||
|---|---|---|---|
| Thornburg Florida Intermediate Municipal Fund | March 31, 2004 | ||
| (Unaudited) | |||
| ASSETS | |||
| Investments at value (cost $55,098,284) | $ 57,542,724 | ||
| Cash | 237,557 | ||
| Receivable for investments sold | 110,000 | ||
| Receivable for fund shares sold | 231,363 | ||
| Interest receivable | 1,009,184 | ||
| Prepaid expenses and other assets | 791 | ||
| Total Assets | 59,131,619 | ||
| LIABILITIES | |||
| Payable for fund shares redeemed | 440,100 | ||
| Accounts payable and accrued expenses | 24,098 | ||
| Payable to investment advisor (Note 3) | 22,316 | ||
| Dividends payable | 148,379 | ||
| Total Liabilities | 634,893 | ||
| NET ASSETS | $ 58,496,726 | ||
| NET ASSETS CONSIST OF: | |||
| Net unrealized appreciation (depreciation) on investments | $ 2,444,440 | ||
| Accumulated net realized gain (loss) | (529,844 | ) | |
| Net capital paid in on shares of beneficial interest | 56,582,130 | ||
| $ 58,496,726 | |||
| NET ASSET VALUE: | |||
| Class A Shares: | |||
| Net asset value and redemption price per share | |||
| ($58,496,726 applicable to 4,673,070 shares of beneficial | |||
| interest outstanding - Note 4) | $ 12.52 | ||
| Maximum sales charge, 2.00% of offering price | 0.26 | ||
| Maximum Offering Price Per Share | $ 12.78 | ||
| See notes to financial statements | |||
4
| Statement of operations | |||
|---|---|---|---|
| Thornburg Florida Intermediate Municipal Fund | Six Months Ended March 31, 2004 | ||
| (Unaudited) | |||
| INVESTMENT INCOME: | |||
| Interest income (net of premium amortized of $225,940) | $ 1,177,044 | ||
| EXPENSES: | |||
| Investment advisory fees (Note 3) | 145,532 | ||
| Administration fees (Note 3) | 36,383 | ||
| Service fees (Note 3) | 62,799 | ||
| Transfer agent fees | 11,788 | ||
| Custodian fees (Note 3) | 19,866 | ||
| Registration and filing fees | 0 | ||
| Professional fees | 8,263 | ||
| Accounting fees | 2,072 | ||
| Trustee fees | 732 | ||
| Other expenses | 4,783 | ||
| Total Expenses | 292,218 | ||
| Less: | |||
| Management fees waived by investment advisor (Note 3) | (35,282 | ) | |
| Fees paid indirectly (Note 3) | (801 | ) | |
| Net Expenses | 256,135 | ||
| Net Investment Income | 920,909 | ||
| REALIZED AND UNREALIZED GAIN (LOSS) | |||
| Net realized gain (loss) on investments | 138,274 | ||
| Increase (Decrease) in unrealized appreciation of investments | 139,136 | ||
| Net Realized and Unrealized | |||
| Gain (Loss) on Investments | 277,410 | ||
| Net Increase (Decrease) in Net Assets Resulting | |||
| From Operations | $ 1,198,319 | ||
| See notes to financial statements | |||
5
| Statements of changes in net assets | |||||
|---|---|---|---|---|---|
| Thornburg Florida Intermediate Municipal Fund | |||||
| Six Months Ended March 31, 2004 | Year Ended September 30, 2003 | ||||
| INCREASE (DECREASE) IN NET ASSETS FROM: | |||||
| OPERATIONS: | |||||
| Net investment income | $ 920,909 | $ 1,766,245 | |||
| Net realized gain (loss) on investments sold | 138,274 | (16,605 | ) | ||
| Increase (Decrease) in unrealized appreciation of investments | 139,136 | (341,196 | ) | ||
| Net Increase (Decrease) in Net Assets | |||||
| Resulting from Operations | 1,198,319 | 1,408,444 | |||
| DIVIDENDS TO SHAREHOLDERS: | |||||
| From net investment income | |||||
| Class A Shares | (920,909 | ) | (1,766,245 | ) | |
| FUND SHARE TRANSACTIONS (Note 4): | |||||
| Class A Shares | 4,307,612 | 12,409,008 | |||
| Net Increase in Net Assets | 4,585,022 | 12,051,207 | |||
| NET ASSETS: | |||||
| Beginning of period | 53,911,704 | 41,860,497 | |||
| End of period | $ 58,496,726 | $ 53,911,704 | |||
| See notes to financial statements | |||||
6
Thornburg Florida Intermediate Municipal Fund
Notes to financial statements
NOTE 1 – ORGANIZATION Thornburg Florida Intermediate Municipal Fund (the “Fund”) is a non-diversified series of Thornburg Investment Trust (the “Trust”). The Trust is organized as a Massachusetts business trust under a Declaration of Trust dated June 3, 1987 and is registered as a diversified, open-end management investment company under the Investment Company Act of 1940, as amended. The Trust is currently issuing nine series of shares of beneficial interest in addition to those of the Fund: Thornburg New Mexico Intermediate Municipal Fund, Thornburg New York Intermediate Municipal Fund, Thornburg Intermediate Municipal Fund, Thornburg Limited Term U.S. Government Fund, Thornburg Limited Term Income Fund, Thornburg Value Fund, Thornburg International Value Fund, Thornburg Core Growth Fund, and Thornburg Investment Income Builder Fund. Each series is considered to be a separate entity for financial reporting and tax purposes and bears expenses directly attributable to it. The Fund’s investment objective is to obtain as high a level of current income exempt from Federal income tax as is consistent with the preservation of capital. The Fund currently offers only one class of shares of beneficial interest, Class A shares.
NOTE 2 – SIGNIFICANT ACCOUNTING POLICIES Significant accounting policies of the Fund are as follows:
Valuation of Investments: In determining net asset value, the Fund utilizes an independent pricing service approved by the Trustees. Debt investment securities have a primary market over the counter and are valued on the basis of valuations furnished by the pricing service. The pricing service values portfolio securities at quoted bid prices, normally at 4:00 pm EST or the yield equivalents when quotations are not readily available. Securities for which quotations are not readily available are valued at fair value as determined by the pricing service using methods which include consideration of yields or prices of municipal obligations of comparable quality, type of issue, coupon, maturity, and rating; indications as to value from dealers and general market conditions. The valuation procedures used by the pricing service and the portfolio valuations received by the Fund are reviewed by the officers of the Trust under the general supervision of the Trustees. Short-term obligations having remaining maturities of 60 days or less are valued at amortized cost, which approximates market value.
Federal Income Taxes: It is the policy of the Fund to comply with the provisions of the Internal Revenue Code applicable to “regulated investment companies” and to distribute all of its taxable (if any) and tax exempt income to its shareholders. Therefore no provision for Federal income tax is required.
When-Issued and Delayed Delivery Transactions: The Fund may engage in when-issued or delayed delivery transactions. To the extent the Fund engages in such transactions, it will do so for the purpose of acquiring portfolio securities consistent with its investment objectives and not for the purpose of investment leverage or to speculate on interest rate changes. At the time the Fund makes a commitment to purchase a security on a when-issued basis, it will record the transaction and reflect the value in determining its net asset value. When effecting such transactions, assets of the Fund of an amount sufficient to make payment for the portfolio securities to be purchased will be segregated on the Fund’s records on the trade date. Securities purchased on a when-issued or delayed delivery basis do not earn interest until the settlement date.
Dividends: Net investment income of the Fund is declared daily as a dividend on shares for which the Fund has received payment. Dividends are paid monthly and are reinvested in additional shares of the Fund at net asset value per share at the close of business on the dividend payment date, or at the shareholder’s option, paid in cash. Net capital gains, to the extent available, will be distributed at least annually.
General: Securities transactions are accounted for on a trade date basis. Interest income is accrued as earned. Premiums and discounts on securities purchased are amortized to call dates or maturity dates of the respective securities. Realized gains and losses from the sale of securities are recorded on an identified cost basis. Expenses common to all funds are allocated among the funds comprising the Trust based upon their relative net asset values or other appropriate allocation methods.
Guarantees and Indemnifications: Under the Trust’s organizational documents, its officers and trustees are indemnified against certain liability arising out of the performance of their duties to the Fund. Additionally, in the normal course of business the Trust enters into contracts with service providers that contain general indemnification clauses. The Trust’s maximum exposure under these arrangements is unknown. However, based on experience, the Trust expects the risk of loss to be remote.
Use of Estimates: The preparation of financial statements, in conformity with generally accepted accounting principles, requires management to make estimates and assumptions that affect the reported amounts of assets and liabilities and the disclosure of contingent assets and liabilities at the date of the financial statements and the reported amounts of increases and decreases in net assets from operations during the reporting period. Actual results could differ from those estimates.
7
Thornburg Florida Intermediate Municipal Fund
Notes to financial statements, Continued
March 31, 2004
NOTE 3 — INVESTMENT ADVISORY FEE AND OTHER TRANSACTIONS WITH AFFILIATES
Pursuant to an investment advisory agreement, Thornburg Investment Management, Inc. (the “Advisor”) serves as the investment advisor and performs services for which the fees are payable at the end of each month. For the period ended March 31, 2004, these fees were payable at annual rates ranging from .50 of 1% to .275 of 1% of the average daily net assets of the Fund. For the period ended March 31, 2004, the Advisor voluntarily waived investment advisory fees of $35,282. The Fund entered into an administrative services agreement with the Advisor, whereby the Advisor will perform certain administrative services for the shareholders of each class of the Fund’s shares, and for which fees will be payable at an annual rate of up to .125 of 1% of the average daily net assets attributable to each class of shares.
The Fund has an underwriting agreement with Thornburg Securities Corporation (the “Distributor”), which acts as the Distributor of Fund shares. For the period ended March 31, 2004, the Distributor has advised the Fund that it earned net commissions aggregating $1,145 from the sale of Class A shares.
Pursuant to a Service Plan, under Rule 12b-1 of the Investment Company Act of 1940, the Fund may reimburse to the Advisor an amount not to exceed .25 of 1% per annum of the average daily net assets attributable to each class of shares of the Fund for payments made by the Advisor to securities dealers and other financial institutions to obtain various shareholder related services. The Advisor may pay out of its own resources additional expenses for distribution of the Fund’s shares.
The Fund has an agreement with the custodian bank to indirectly pay a portion of the custodian’s fees through credits earned by the Fund’s cash on deposit with the bank. This deposit agreement is an alternative to overnight investments.
Custodial fees have been adjusted to reflect amounts that would have been paid without this agreement, with a corresponding adjustment reflected as fees paid indirectly in the statements of operations. For the period ended March 31, 2004, the fees paid indirectly were $801.
Certain officers and trustees of the Trust are also officers and/or directors of the Advisor and Distributor. The compensation of unaffiliated trustees is borne by the Trust.
8
Thornburg Florida Intermediate Municipal Fund
Notes to financial statements, Continued
March 31, 2004
NOTE 4 - SHARES OF BENEFICIAL INTEREST
At March 31, 2004 there were an unlimited number of shares of beneficial interest authorized. Transactions in shares of beneficial interest were as follows:
| Period Ended March 31, 2004 | Year Ended September 30, 2003 | ||||||||
|---|---|---|---|---|---|---|---|---|---|
| Shares | Amount | Shares | Amount | ||||||
| Class A Shares | |||||||||
| Shares sold | 2,165,347 | $ 26,987,987 | 2,522,567 | $ 31,358,503 | |||||
| Shares issued to shareholders in | 26,273 | 327,804 | 63,396 | 787,452 | |||||
| reinvestment of dividends | |||||||||
| Shares repurchased | (1,844,861 | ) | (23,008,179 | ) | (1,590,032 | ) | (19,736,947 | ) | |
| Net Increase (Decrease) | 346,759 | $ 4,307,612 | 995,931 | $ 12,409,008 | |||||
NOTE 5 – SECURITIES TRANSACTIONS
For the period ended March 31, 2004, the Fund had purchase and sale transactions (excluding short-term securities) of $20,082,895 and $12,129,362, respectively.
NOTE 6 – INCOME TAXES
At March 31, 2004, information on the tax components of capital is as follows:
| Cost of investments for tax purpose | $ 55,098,284 | ||
| Gross unrealized appreciation on a tax basis | $ 2,497,309 | ||
| Gross unrealized depreciation on a tax basis | (52,869 | ) | |
| Net unrealized appreciation | |||
| (depreciation) on investments (tax basis) | $ 2,444,440 | ||
At March 31, 2004, the Fund had tax basis capital losses, which may be carried over to offset future capital gains. Such losses expire as follows: Capital loss carryovers expiring in:
| 2004 | $ 13,904 | ||
| 2005 | 34,967 | ||
| 2006 | 7,356 | ||
| 2007 | 6,459 | ||
| 2008 | 306,777 | ||
| 2009 | 282,018 | ||
| -- | $651,481 | ||
Unutilized tax basis capital losses may be carried forward to offset realized gains in future years. To the extent such carry forwards are used, capital gain distributions may be reduced to the extent provided by regulations.
At March 31, 2004 the Fund had deferred capital losses occurring subsequent to October 31, 2002 of $16,637. For tax purposes, such losses will be reflected in the year ending September 30, 2004.
9
| Financial highlights | ||||||
|---|---|---|---|---|---|---|
| Thornburg Florida Intermediate Municipal Fund | ||||||
| Six Months Ended | Year Ended September 30, | |||||
| March 31,2004 | 2003 | 2002 | 2001 | 2000 | 1999 | |
| Class A Shares: | ||||||
| Per Share Performance | ||||||
| (for a share outstanding throughout the period) | ||||||
| Net asset value, beginning of period | $ 12.46 | $ 12.57 | $ 12.24 | $ 11.73 | $ 11.79 | $ 12.37 |
| Income from investment operations: | ||||||
| Net investment income | 0.20 | 0.45 | 0.52 | 0.55 | 0.54 | 0.54 |
| Net realized and unrealized | ||||||
| gain (loss) on investments | 0.06 | (0.11) | 0.33 | 0.51 | (0.06) | (0.58) |
| Total from investment operations | 0.26 | 0.34 | 0.85 | 1.06 | 0.48 | (0.04) |
| Less dividends from: | ||||||
| Net investment income | (0.20) | (0.45) | (0.52) | (0.55) | (0.54) | (0.54) |
| Change in net asset value | 0.06 | (0.11) | 0.33 | 0.51 | (0.06) | (0.58) |
| Net asset value, end of period | $ 12.52 | $ 12.46 | $ 12.57 | $ 12.24 | $ 11.73 | $ 11.79 |
| Total return (a) | 2.09% | 2.77% | 7.10% | 9.20% | 4.19% | (0.36)% |
| Ratios/Supplemental Data | ||||||
| Ratios to average net assets: | ||||||
| Net investment income | 3.16% (b) | 3.60% | 4.18% | 4.55% | 4.60% | 4.44% |
| Expenses, after expense reductions | 0.88% (b) | 0.91% | 0.85% | 0.89% | 0.98% | 0.99% |
| Expenses, after expense reductions | ||||||
| and net of custody credits | 0.88% (b) | 0.91% | 0.84% | -- | -- | -- |
| Expenses, before expense reductions | 1.00% (b) | 1.01% | 1.06% | 1.10% | 1.10% | 1.08% |
| Portfolio turnover rate | 22.11% | 30.98% | 30.28% | 22.99% | 40.70% | 35.91% |
| Net assets at end of period (000) | $ 58,497 | $ 53,912 | $ 41,860 | $ 28,934 | $ 25,876 | $ 30,221 |
(a) Sales loads are not reflected in computing total return, which is not annualized for periods less than one year.
(b) Annualized.
10
| Schedule of Investments | |||||||||||
|---|---|---|---|---|---|---|---|---|---|---|---|
| Thornburg Florida Intermediate Municipal Fund | March 31, 2004 | ||||||||||
| CUSIPS: CLASS A - 885-215-707 NASDAQ SYMBOLS: CLASS A - THFLX | |||||||||||
| Issuer-Description | Credit Rating Moody's/S&P | Principal Amount | Value | ||||||||
| Brevard County School Board Certificates of Participation Series A, 5.00% | Aaa/AAA | 745,000 | $ | 780,484 | |||||||
| due 7/1/2005 (Insured: AMBAC) | |||||||||||
| Broward County Educational Facilities Authority Series 1994, 5.60% due | Baa2/AAA | 400,000 | 400,000 | ||||||||
| 4/1/2004 (Nova Southeastern University Project; Guaranty: Connie Lee) | |||||||||||
| Broward County Multi Family Housing, 5.40% due 10/1/2011 (Pembroke Park | NR/NR | 825,000 | 881,851 | ||||||||
| Apts Project; Guaranty: Florida Housing Finance Corp.) | |||||||||||
| Broward County Resource Recovery Revenue Refunding, 5.375% due 12/1/2009 | A3/AA- | 1,240,000 | 1,378,434 | ||||||||
| Capital Projects Finance Authority Student Housing, 5.50% due 10/1/2012 | Aaa/AAA | 820,000 | 925,116 | ||||||||
| (Capital Projects Student Housing; Insured: MBIA) | |||||||||||
| Capital Trust Agency Multi Family Housing Revenue Series A, 5.15% due | Aaa/NR | 1,000,000 | 1,099,330 | ||||||||
| 11/1/2030 put 11/1/2010 (Shadow Run Project; Collateralized: FNMA) | |||||||||||
| Collier County Housing Finance Authority Multi Family Revenue A-1, 4.90% | Aaa/NR | 800,000 | 839,688 | ||||||||
| due 2/15/2032 put 2/15/2012 (Goodlette Arms Project; Collateralized: FNMA) | |||||||||||
| Cooper City Utility Systems Capital Appreciation Refunding Series A, 0% due | Aaa/AAA | 2,705,000 | 1,554,915 | ||||||||
| 10/1/2013 (Insured: AMBAC) | |||||||||||
| Crossings at Fleming Island Community Development Refunding Series A, 5.60% | Aaa/AAA | 350,000 | 401,800 | ||||||||
| due 5/1/2012 (Insured: MBIA) | |||||||||||
| Crossings at Fleming Island Community Development Refunding Series B, 5.45% | Aaa/AAA | 714,000 | 820,172 | ||||||||
| due 5/1/2010 (Insured: MBIA) | |||||||||||
| Dade County Seaport Revenue Refunding Series E, 8.00% due 10/1/2008 | Aaa/AAA | 655,000 | 813,739 | ||||||||
| (Insured: MBIA) | |||||||||||
| Dade County Solid Waste Systems Special Obligation Revenue Refunding, 6.00% | Aaa/AAA | 1,000,000 | 1,137,110 | ||||||||
| due 10/1/2007 (Insured: AMBAC) | |||||||||||
| Deltona Utility Systems Revenue, 5.25% due 10/1/2015 (Insured: MBIA) | Aaa/AAA | 1,185,000 | 1,339,109 | ||||||||
| Duval County HFA Multi Family Housing Revenue Series 1996, 5.35% due | NR/A+ | 625,000 | 665,050 | ||||||||
| 9/1/2006 (St. Augustine Apartments Project) | |||||||||||
| Duval County Multi Family Housing Revenue Refunding, 5.90% due 9/1/2016 | NR/A+ | 700,000 | 730,471 | ||||||||
| (St. Augustine Apartments Project) | |||||||||||
| Enterprise Community Development District Florida Water & Sewer Revenue, | Aaa/AAA | 230,000 | 233,121 | ||||||||
| 6.125% due 5/1/2024 (Insured: MBIA) | |||||||||||
| Escambia County Health Facility Revenue, 5.95% due 7/1/2020 (Florida Health | Aaa/NR | 1,000,000 | 1,050,140 | ||||||||
| Care Facility Loan Project; Insured: AMBAC) | |||||||||||
| First Florida Govt. Financing Commission Revenue Refunding Series B, 5.50% | Aaa/AAA | 300,000 | 348,282 | ||||||||
| due 7/1/2016 | |||||||||||
| Florida Board of Education Capital Outlay, 9.125% due 6/1/2014 (ETM)* | Aaa/AAA | 155,000 | 215,107 | ||||||||
| Florida Board of Education Capital Outlay, 9.125% due 6/1/2014 | Aa2/AA+ | 905,000 | 1,264,629 | ||||||||
| Florida Board of Education Capital Outlay Public Education Series C, 5.50% | Aaa/AAA | 1,000,000 | 1,150,800 | ||||||||
| due 6/1/2013 (Insured: FGIC) | |||||||||||
| Florida Board of Education Capital Outlay Refunding Public Education Series | Aa2/AA+ | 260,000 | 296,990 | ||||||||
| D, 5.75% due 6/1/2018 | |||||||||||
| Florida Finance Corp. Revenue Homeowner Mortgage Series 1, 4.80% due | Aa2/AA | 620,000 | 649,376 | ||||||||
| 1/1/2016 | |||||||||||
| Florida Housing Finance Agency, 3.90% due 12/1/2007 (Multi Family | NR/A+ | 1,000,000 | 1,036,920 | ||||||||
| Guaranteed Mortgage) | |||||||||||
| Florida Housing Finance Agency Revenue Bonds, 5.30% due 12/1/2004 (Insured: | Aaa/AAA | 65,000 | 65,763 | ||||||||
| AMBAC) | |||||||||||
| Florida Housing Finance Authority Series 94-B, 5.70% due 10/1/2024 | NR/AAA | 870,000 | 888,053 | ||||||||
| mandatory put 10/1/2004 (Plantation Colony Project; Collateralized: FNMA) | |||||||||||
| Florida Housing Finance Corp. Revenue Homeowner Mortgage Series 1, 4.80% | Aa2/AA | 640,000 | 670,323 | ||||||||
| due 7/1/2016 | |||||||||||
| Florida Housing Finance Corp. Revenue Housing D 1, 5.10% due 10/1/2011 | Aaa/NR | 200,000 | 213,480 | ||||||||
| (Augustine Club Apartments Project; Insured: MBIA) | |||||||||||
| Florida Housing Finance Corp. Revenue Housing D 1, 5.40% due 4/1/2014 | Aaa/NR | 415,000 | 439,879 | ||||||||
| (Augustine Club Apartments Project; Insured: MBIA) | |||||||||||
| Florida State Department of Corrections, 6.25% due 3/1/2015 (Okeechobee | Aaa/AAA | 700,000 | $ | 743,988 | |||||||
| Correctional Project; Insured: AMBAC) | |||||||||||
| Florida State Department of Corrections Certificates of Participation, | Aaa/AAA | 500,000 | 521,860 | ||||||||
| 5.90% due 3/1/2005 (Okeechobee Correctional Project; Insured: AMBAC) | |||||||||||
| Florida State Department of Environmental Protection Revenue Series A, | Aaa/AAA | 1,000,000 | 1,096,570 | ||||||||
| 5.00% due 7/1/2017 (Florida Forever Project; Insured: FGIC) | |||||||||||
| Grand Haven Community Development District Florida Special Assessment | NR/NR | 285,000 | 290,102 | ||||||||
| Series A, 6.90% due 5/1/2019 | |||||||||||
| Gulf Breeze Revenue, 4.50% due 12/1/2015 put 12/1/2007 (Insured: FGIC) | Aaa/AAA | 250,000 | 266,440 | ||||||||
| Gulf Breeze Revenue, 4.70% due 12/1/2015 put 12/1/2010 (Insured: FGIC) | Aaa/AAA | 375,000 | 404,288 | ||||||||
| Hillsborough County Aviation Authority Revenue Tampa International Airport | Aaa/AAA | 1,000,000 | 1,115,980 | ||||||||
| Series A, 5.25% due 10/1/2009 (Insured: MBIA) | |||||||||||
| Hillsborough County Capital Improvement Program Revenue Refunding Junior | Aaa/AAA | 1,000,000 | 1,115,840 | ||||||||
| Lien, 5.00% due 8/1/2008 (Criminal Justice Project; Insured: FGIC) | |||||||||||
| Hillsborough County Industrial Development Authority, 5.50% due 8/15/2006 | Aaa/AAA | 1,000,000 | 1,034,070 | ||||||||
| (University Community Hospital Inc. Project; Insured: MBIA) | |||||||||||
| Hillsborough County Industrial Development Authority, 5.10% due 10/1/2013 | Baa2/BBB- | 1,000,000 | 1,016,620 | ||||||||
| (Tampa Electric Co. Project) | |||||||||||
| Jacksonville Electric St. John's River Park Systems Revenue Refunding | Aa2/AA | 1,000,000 | 1,123,820 | ||||||||
| Issue-2 17th Series, 5.25% due 10/1/2012 | |||||||||||
| Jacksonville Health Facilities Authority Hospital Revenue, 5.75% due | Aa2/NR | 1,000,000 | 1,159,830 | ||||||||
| 8/15/2014 pre-refunded 8/15/2011 | |||||||||||
| Lee County Airport Revenue Refunding, 5.00% due 10/1/2007 (Insured: FSA) | Aaa/AAA | 1,015,000 | 1,119,251 | ||||||||
| Lee County Certificates of Participation, 4.90% due 10/1/2006 (Master Lease | Aaa/AAA | 500,000 | 511,400 | ||||||||
| Project; Insured: AMBAC) | |||||||||||
| Miami Dade County School Board Series B, 5.00% due 5/1/2031 put 5/1/11 | Aaa/AAA | 1,000,000 | 1,108,840 | ||||||||
| (Insured: MBIA) | |||||||||||
| Miami Dade County Special Housing Revenue Refunding, 5.80% due 10/1/2012 | Baa3/NR | 960,000 | 947,357 | ||||||||
| (HUD Section 8) | |||||||||||
| Miami Dade County Special Obligation Capital Asset Acquisition Series A-2, | Aaa/AAA | 825,000 | 929,758 | ||||||||
| 5.00% due 4/1/2011 (Insured: AMBAC) | |||||||||||
| Miami Refunding, 5.375% due 9/1/2015 (Insured: MBIA) | Aaa/AAA | 1,000,000 | 1,125,550 | ||||||||
| Mirimar Wastewater Improvement Assessment Revenue, 6.25% due 10/1/2005 | Aaa/AAA | 760,000 | 787,337 | ||||||||
| pre-refunded 10/1/2004 (Insured: FGIC) | |||||||||||
| North Miami Florida Health Facilities Authority Revenue, 6.00% due | Aa3/NR | 300,000 | 318,150 | ||||||||
| 8/15/2024 (Catholic Health Services Obligation Group Project; LOC: Suntrust | |||||||||||
| Bank) | |||||||||||
| Orange County Health Facilities Authority Revenue Refunding, 6.25% due | Aaa/AAA | 1,000,000 | 1,091,000 | ||||||||
| 11/15/2008 (Adventist Health Systems Project; Insured: AMBAC) | |||||||||||
| Orange County Health Facilities Authority Revenue Refunding, 5.125% due | NR/AA | 1,000,000 | 1,062,550 | ||||||||
| 6/1/2014 (Mayflower Retirement Project; Insured: Radian) | |||||||||||
| Orange County Health Facilities Authority Revenue Refunding, 6.375% due | A3/A | 1,000,000 | 1,104,660 | ||||||||
| 11/15/2020 (Adventist Health Systems Project) | |||||||||||
| Orange County Health Facilities Authority Revenue Unrefunded Balance Series | Aaa/AAA | 440,000 | 537,077 | ||||||||
| A, 6.25% due 10/1/2013 (Orlando Regional Hospital Project; Insured: MBIA) | |||||||||||
| Orange County Health Facilities Authority Revenue Unrefunded Balance Series | Aaa/AAA | 300,000 | 371,967 | ||||||||
| A, 6.25% due 10/1/2016 (Insured: MBIA) | |||||||||||
| Orange County Housing Finance Authority, 6.10% due 10/1/2005 | NR/AAA | 35,000 | 36,377 | ||||||||
| (Collateralized: FNMA/GNMA) | |||||||||||
| Orange County Housing Finance Authority Multi Family, 5.50% due 7/1/2010 | Aaa/NR | 425,000 | 461,384 | ||||||||
| (Insured: MBIA) | |||||||||||
| Orange County School Board Certificates of Participation Refunding Series | Aaa/NR | 310,000 | 342,277 | ||||||||
| A, 5.10% due 8/1/2007 (Insured: MBIA) | |||||||||||
| Orange County School Board Certificates of Participation Series A, 5.50% | Aaa/AAA | 735,000 | 827,735 | ||||||||
| due 8/1/2017 (Insured: MBIA) | |||||||||||
| Orange County Solid Waste Facility Revenue Refunding, 5.00% due 10/1/2011 | Aaa/AAA | 500,000 | 558,425 | ||||||||
| (Insured: MBIA) | |||||||||||
| Orlando & Orange County Expressway Revenue, 8.25% due 7/1/2014 (Insured: | Aaa/AAA | 500,000 | 705,690 | ||||||||
| FGIC) | |||||||||||
| Osceola County Health Facilities Revenue Series 1994, 5.75% due 5/1/2004 | Aaa/AAA | 115,000 | 115,435 | ||||||||
| (Evangelical Lutheran Good Samaritan Project; Insured: AMBAC) | |||||||||||
| Palm Beach County Industrial Development Revenue Series 1996, 6.10% due | NR/A | 515,000 | 583,227 | ||||||||
| 12/1/2007 (Lourdes-Noreen McKeen-Geriatric Care Project; LOC: Allied Irish | |||||||||||
| Bank) | |||||||||||
| Palm Beach County Industrial Development Revenue Series 1996, 6.20% due | NR/A | 270,000 | $ | 306,472 | |||||||
| 12/1/2008 (Lourdes-Noreen McKeen-Geriatric Care Project; LOC: Allied Irish | |||||||||||
| Bank) | |||||||||||
| Palm Beach County School Board Certificates of Participation Series D, | Aaa/AAA | 400,000 | 451,256 | ||||||||
| 5.00% due 8/1/2012 (Insured: FSA) | |||||||||||
| Palm Beach County Solid Waste Authority Revenue Refunding Series A, 6.00% | Aaa/AAA | 1,000,000 | 1,157,780 | ||||||||
| due 10/1/2008 (Insured: AMBAC) | |||||||||||
| Palm Beach County Solid Waste Revenue Refunding Series A, 6.00% due | Aaa/AAA | 1,000,000 | 1,177,180 | ||||||||
| 10/1/2010 (Insured: AMBAC) | |||||||||||
| Pasco County Housing Finance Authority MFHR, 5.50% due 6/1/2027 put | NR/AA- | 800,000 | 844,288 | ||||||||
| 6/1/2008 (Cypress Trail Apartments Project; Guaranty: Axa Reinsurance) | |||||||||||
| Pasco County Water & Sewer Revenue Refunding, 5.00% due 10/1/2004 (Insured: | Aaa/AAA | 1,000,000 | 1,019,800 | ||||||||
| FSA) | |||||||||||
| Pensacola Airport Revenue, 6.25% due 10/1/2005 (Insured: MBIA) | Aaa/AAA | 690,000 | 738,224 | ||||||||
| Pinellas County Educational Facility Authority Revenue, 8.00% due 2/1/2011 | NR/NR | 590,000 | 658,116 | ||||||||
| pre-refunded 2/1/2006 @ 102 (Clearwater Christian College Project) | |||||||||||
| Sarasota County Public Hospital Board, 1.15% due 7/1/2037 put 4/1/2004 | VMIG1/A1+ | 100,000 | 100,000 | ||||||||
| (Sarasota Memorial Hospital Project) (daily demand notes) | |||||||||||
| State Board of Education Series C, 6.00% due 5/1/2007 (ETM)* | Aaa/AA+ | 300,000 | 302,619 | ||||||||
| State Board of Education Series D, 6.20% due 5/1/2007 (Insured: MBIA) | Aaa/AAA | 220,000 | 221,958 | ||||||||
| (ETM)* | |||||||||||
| Tampa Revenue, 5.50% due 11/15/2013 (Insured: MBIA) | Aaa/AAA | 1,050,000 | 1,217,937 | ||||||||
| Tohopekaliga Water Authority Utility Series A, 5.25% due 10/1/2016 | Aaa/AAA | 1,345,000 | 1,508,417 | ||||||||
| (Insured: FSA) | |||||||||||
| University Athletic Association Inc. Florida Athletic Program Revenue | VMIG1/NR | 1,000,000 | 1,013,690 | ||||||||
| Refunding, 2.20% due 10/1/2031 put 10/1/2005 (LOC: Suntrust Bank) | |||||||||||
| TOTAL INVESTMENTS (Cost $55,098,284) | -- | -- | $ | 57,542,724 | |||||||
| †Credit ratings are unaudited | |||||||||||
| *Escrowed to maturity | |||||||||||
| See notes to financial statements | |||||||||||
13
Thornburg Florida Intermediate Municipal Fund
March 31, 2004
Index Comparison
Compares performance of Florida Intermediate Municipal Fund, the Merrill Lynch Municipal Bond (7-12 year) Index and the Consumer Price Index, February 1, 1994 to March 31, 2004. On March 31, 2004, the weighted average securities ratings of the Index and the Fund were AA and AA+, respectively, and the weighted average portfolio maturities of the Index and the Fund were 9.5 years and 7.0 years, respectively. Past performance of the Index and the Fund may not be indicative of future performance. The performance data and graph do not reflect the deduction of taxes that a shareholder would pay on distributions or the redemption of fund shares.
Thornburg Florida Intermediate Fund Class A Total Returns, Since Inception, versus Merrill Lynch 7-12 Year Municipal Index and Consumer Price Index (CPI)

Class A
Average Annual Total Returns (at max. offering price) (periods ended 3/31/04)
One Year: 2.05%
Five Years: 4.28%
From Inception (2/1/94):4.79% </PRE>
Maximum sales charge of the Fund’s Class A Shares is 2.00%.
Past performance is no guarantee of future results. Current returns may be either lower or higher than those shown. Share prices and returns will fluctuate and investors may experience a loss upon redemption. There is no guarantee that the Fund will meet its objectives. Shares in the Fund carry risks, including possible loss of principal.
Carefully consider the Fund’s investment objectives, risks, sales charges, and expenses; this is found in the prospectus, which is available from your financial advisor or from www.thornburg.com. Read it carefully before you invest or send money.
For month-end performance information, visit www.thornburg.com.
The Merrill Lynch 7-12 Year Municipal Bond Index represents a broad measure of market performance. It is a model portfolio of municipal obligations throughout the U.S., with an average maturity which ranges from seven to twelve years.
The Consumer Price Index (“CPI”) measures prices of a fixed basket of goods bought by a typical consumer, including food, transportation, shelter, utilities, clothing, medical care, entertainment and other items. The CPI, published by the Bureau of Labor Statistics in the Department of Labor, is based at 100 in 1982 and is released monthly. It is widely used as a cost-of-living benchmark to adjust Social Security payments and other payment schedules, union contracts and tax brackets. Also known as the cost-of-living index.
Unless otherwise noted, index returns reflect the reinvestment of income dividends and capital gains, if any, but do not reflect fees, brokerage commissions or other expenses of investing. Investors may not make direct investments into any index.
14
Thornburg Florida Intermediate Municipal Fund
A shares
Outperformed Tax-Free Money Market Funds
(Unaudited)
Investors sometimes ask us to compare the returns of the Thornburg Florida Intermediate Municipal Fund to money market fund returns. These investments have certain differences, and investors in Thornburg Florida Intermediate Municipal Fund took more risk than money market fund investors to earn their higher returns.
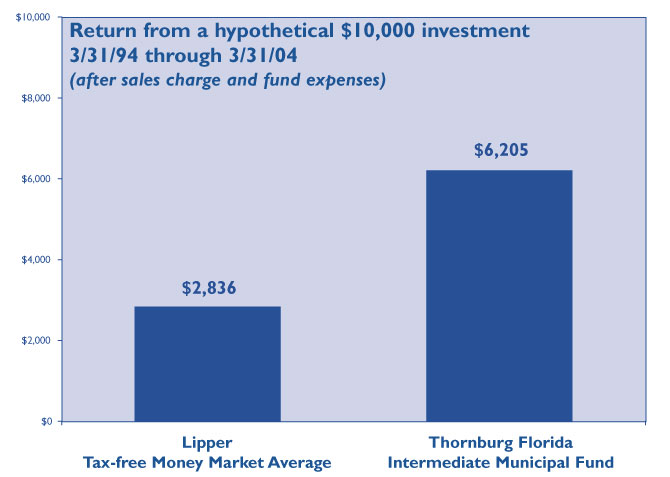
See the inside front cover page for the 30-day SEC yield and the total returns at the maximum offering prices for one year, three years years, five years and since inception for the Fund.
Note 1: Future increases, if any, of any of these investments may bear no relationship to prior increases. Quotations for the money fund averages are based upon 30-day yield quotations for tax-exempt money funds as sourced from the “Tax-free Money Market Average CDA/Wiesenberger” for the months covered by this analysis. The increase for the Class A Shares of Thornburg Florida Intermediate Municipal Fund is based upon the dividends paid for the months covered by this analysis, the beginning offering price at $11.83 per share and the ending NAV at $12.52 per share. These investments returned the $10,000 initial investment in addition to the amounts shown above.
Note 2: This analysis does not take into account the effect, if any, caused by state and local income taxes. The portion of the increase, if any, of Thornburg Florida Intermediate Municipal Fund representing appreciation of the share price is assumed to be taxed at a 15% federal tax rate. The average money market fund increases shown above may differ from the return of a particular money market fund. It is not possible to invest in this money fund average.
Note 3: Generally, money market funds seek to maintain an investment portfolio with an average maturity of 90 days or less. Thornburg Florida Intermediate Municipal Fund invests in short-to-intermediate maturity municipal obligations. The net asset value of the money funds did not fluctuate. The net asset value of the Class A Shares of THFLX did vary from time to time, and will continue to vary in the future due to the effect of changes in interest rates on the value of the investments the Fund holds. The analysis assumes that the investor received the net asset value of the shares owned, plus accrued income, at time of sale. Redemptions are made at the then current net asset value, which may give you a gain or loss when you sell your shares.
Note 4: This analysis assumes that the dividends from each of these investment vehicles were reinvested and compounded monthly. Most money funds declare dividends daily and pay them monthly. Thornburg Florida Intermediate Municipal Fund also declares dividends daily and pays them monthly.
15
Investment Manager Thornburg Investment Management, Inc.
119 East Marcy Street
Santa Fe, New Mexico 87501
800.847.0200
Principal Underwriter Thornburg Securities Corporation
119 East Marcy Street
Santa Fe, New Mexico 87501
800.847.0200
This report is submitted for the general information of shareholders of the Fund. It is not authorized for distribution to prospective investors in the Fund unless preceded or accompanied by an effective prospectus. Carefully consider information in the prospectus regarding the Fund’s investment objectives and policies, risks, sales charges, expenses, experience of its management, marketability of shares, and other information. Performance data quoted represent past performance and do not guarantee future results.
www.thornburg.com
Thornburg International Value Fund
Semi-Annual Report March 31, 2004
William V. Fries,
CFA Portfolio Manager
April 15, 2004
Thornburg International Value Fund
Letter to shareholders
Dear Fellow Shareholder,
Investment performance for the quarter ended March 31, 2004, was positive. While global markets eroded near the end of the quarter, stock price development during the quarter reflected continued economic expansion in most parts of the world, especially in the Far East. The robust recovery from recessionary forces in place in the U. S. since 2000 is well underway and is an important driver of the export-driven economies of the Far East, including Japan’s. Indications that the long economic recession in Japan may finally be ending are the prime catalysts for the improvement in the Japanese market. With the notable exception of continental Europe, economic and business developments remain encouraging. The Euro’s strength versus the U.S. Dollar last year weakened the competitive position of some European exports. Recent strength in the Dollar may provide some reversal of this negative impact for European exporters.
Evidence is accumulating that inflationary forces will surface as the global economy expands. Monetary and fiscal discipline, along with work force flexibility, will be important as companies manage for productivity and cost containment. This is not well established in some of the most important European countries. Because of the weak Dollar last year, commodity price increases have not occurred to the same extent as in the U.S. This has changed since January as commodity price inflation may have peaked in Dollar terms, but not in Euro terms. Equilibrium pricing for commodities is subject to continuous change, but it appears reasonable in an expanding global economy to expect cost pressures to become more of an issue. Pricing power remains as important as ever for business success.
Though the economic and business environment may be sound, the psychological environment for stocks is challenging. The situation in Iraq, along with global terrorism, is unsettling, but is less of a market focus outside the U.S. For U.S. investors, investing overseas during a period of Dollar weakness has been productive. Nonetheless, our overseas investments are driven by individual company promise and value, not currency prospects. We believe our focused portfolio (about 50 stocks) of unique and financially sound holdings represents attractive businesses with the potential for capital appreciation. Portfolio diversification is broad, as shown in the tables on the following pages, and includes broad geographic participation, including a number of the world’s most dynamic economies. Our holdings in these emerging markets are typically recognized as premiere companies in those markets.
1
Thornburg International Value Fund
Letter to shareholders, Continued
You can learn a good deal more about our investment philosophy and portfolios by visiting our website at http://www.thornburg.com/funds. We include descriptive information on each holding, a link to company websites, up-to-date performance information, and a monthly market commentary.
Thank you for your trust and confidence in investing with us.
Sincerely,
William V. Fries, CFAPortfolio
Manager

Thornburg Investment Management is proud to announce that Bill Fries, manager of the Thornburg International Value Fund, was named Morningstar’s 2003 International Manager of the Year.
2
Thornburg International Value Fund
management’s discussion of performance
March 31, 2004
| International Value Fund | 1Q-04 | 6 Mos. | 1 Yr | 3 Yrs | 5 Yrs | Incep. | |
|---|---|---|---|---|---|---|---|
| A shares (TGVAX) | NAV | 4.95% | 22.07% | 62.22% | 7.94% | 12.68% | 9.68% |
| 5/28/98 Inception | POP | 0.22%* | 16.61% | 54.92% | 6.30% | 11.64% | 8.83% |
| B Shares (THGBX) | NAV | 4.70% | 21.55% | 60.77% | 6.98% | -- | 2.07% |
| 4/3/00 Inception | POP | -0.30%* | 16.55%* | 55.77%* | 5.95%* | -- | 1.23%* |
| C Shares (THGCX) | NAV | 4.82% | 21.63% | 60.88% | 7.00% | 11.68% | 8.71% |
| 5/28/98 Inception | POP | 3.82%* | 20.63%* | 59.88%* | 7.00% | 11.68% | 8.71% |
| MSCI EAFE Index (Since 5/28/98) | 4.41% | 22.16% | 58.15% | 3.80% | 0.83% | 1.72% |
Performance
During the quarter ended March 31, 2004, the Thornburg International Value Fund outperformed the MSCI EAFE index. The Fund was up 4.95% compared to 4.41% for the Index. Many of the quarter’s strongest performers are based in Japan. Familymart Co. Ltd. (8028 JP), Bank of Fukuoka Ltd. (8326 JP), Nippon Telegraph & Telephone Corp. (9432 JP), and Toyota Motor Corp. (7203 JP) each made significant contributions to the positive performance of the portfolio. Russian holding Mobile Telesystems (MBT) and Korean holding Samsung Electronics Co. Ltd. (0593 KS) were also exceptional performers. Dr. Reddy’s Laboratories Ltd. ADR (RDY), the Indian pharmaceutical firm, hurt performance, as its stock price suffered as a result of a negative court decision regarding one of its potential generic drugs. Much of the other weakness in the portfolio resulted from European holdings, including Bank of Ireland (BKIR LN), Novartis AG (NVS), and Lloyds TSB Group PLC (LLOYLN).
Total returns for periods greater than one year are annualized averages. *Assumes redemption during the period.
A-share data presented includes the effects of the maximum sales charge of 4.50% and the reinvestment of dividends and capital gains. The B-share total return figures at POP include subtraction of the maximum contingent deferred sales charge (CDSC): if redeemed within one year of purchase, the CDSC is 5.00%; within two years, 4.25%; within three years, 3.50%; within four years, 2.75%; within five years, 2.00%; within six years, 1.25%; within seven years, 0.50%. There is no charge for redemption within the eighth year after purchase. Total return figures at the public offering price for the C shares include a 1% CDSC for the first year only.
Past performance is no guarantee of future results. Current returns may be either lower or higher than those shown. Share prices and returns will fluctuate and investors may experience a loss upon redemption. There is no guarantee that the Fund will meet its objectives. Shares in the Fund carry risks, including possible loss of principal. They are not deposits or obligations of, or guaranteed or endorsed by, any bank, the Federal Deposit Insurance Corporation, the Federal Reserve Board or any government agency.
Carefully consider the Fund’s investment objectives, risks, sales charges, and expenses; this information is found in the prospectus, which is available from your financial advisor or from www.thornburg.com. Read it carefully before you invest or send money.
For month-end performance information, or for information and commentary on Fund holdings, including links to each company’s home page, visit www.thornburg.com.
There are special risk considerations associated with international investing, including fluctuating exchange rates, government regulations and differences in liquidity, which may affect the volatility of the fund.
The Morgan Stanley Capital International (“MSCI”) Europe, Australasia, Far East Index (“EAFE”) is an unmanaged index of over 900 companies, and is a generally accepted benchmark for major overseas markets. Index weightings represent the relative capitalizations of the major overseas markets included in the index on a U.S. dollar adjusted basis. The index is calculated separately; without dividends, with gross dividends reinvested and estimated tax withheld, and with gross dividends reinvested, in both U.S. Dollars and local currency.
| Performance Impact during 1st quarter 2004 | |||
|---|---|---|---|
| Top Contributors | Top Detractors | ||
| Mobile Telesystems | Dr. Reddy's Laboratories Ltd. ADR | ||
| Samsung Electronics Co. Ltd. | ASE Test Ltd. | ||
| Familymart Co. Ltd. | Bank of Ireland | ||
| Bank of Fukuoka Ltd. | Novartis AG | ||
| Nippon Telegraph & Telephone Corp. | Lloyds TSB Group PLC | ||
3
Thornburg International Value Fund
management’s discussion of performance, Continued
March 31, 2004
Activity
During the quarter, the level of activity in the portfolio was moderate. Six holdings were added and six eliminated. Among the new holdings was Hero Honda Motors Ltd. (6327327), the leading manufacturer of motorcycles in India, the world’s largest and fastest growing motorcycle market. Portugal Telecom SGPS SA (58171890) was also added. This telecommunications company offers a broad line of communications in Portugal, where it maintains a dominant market share in both wireline and mobile communications. In addition, Portugal Telecom holds a 50% interest in the leading Brazilian cellular phone company, Vivo. Other additions were Korea Tobacco & Ginseng Corp (003780), Adidas-Salomon AG (ADS GR), Belgacom SA (BGAOF PK), and Mitsubishi Tokyo Financial Group (8306 JP). Most of the eliminated holdings were sold as they hit target prices. China Life Insurance Co. Ltd. (LFC) was removed for a better risk/reward opportunity found elsewhere, while IHC Caland NV (ICHHF PK) was removed due to deterioration of the fundamentals supporting the investment thesis.
| Activity during 1st Quarter 2004 | |||
|---|---|---|---|
| New Holdings | Eliminated Holdings | ||
| Portugal Telecom SGPS SA | Muhlbauer Holding AG | ||
| Hero Honda Motors Ltd. | NTT DoCoMo Inc. | ||
| Korean Tobacco & Ginseng Corp. | Depfa Bank | ||
| Adidas-Salomon AG | Swedish Match AB | ||
| Belgacom SA | IHC Caland NV | ||
| Mitsubishi Tokyo Financial Group | China Life Insurance Co. Ltd. | ||
| Top 10 Holdings | 12/31/03 | 3/31/04 | |||||
|---|---|---|---|---|---|---|---|
| Novartis AGADR | 2 | .9% | Samsung Electronics Co. Ltd. | 2 | .9% | ||
| Tesco PLC | 2 | .7% | Cadbury Schweppes PLC | 2 | .7% | ||
| Petroleo Brasileiro SA ADR | 2 | .7% | Tesco PLC | 2 | .7% | ||
| Lloyds TSB Group PLC | 2 | .6% | Euronext NV | 2 | .6% | ||
| Cadbury Schweppes PLC | 2 | .6% | Toyota Motor Corp. | 2 | .5% | ||
| ING Groep NV | 2 | .5% | Rogers Communications Inc. | 2 | .5% | ||
| Vodafone Group PLC | 2 | .5% | BP Amoco ADR | 2 | .5% | ||
| Deutsche Boerse AG | 2 | .3% | Burberry Group PLC | 2 | .5% | ||
| Canon Inc. | 2 | .3% | Petroleo Brasileiro SA ADR | 2 | .5% | ||
| BP Amoco ADR | 2 | .3% | Bank of Ireland | 2 | .5% | ||
4
Thornburg International Value Fund
management’s discussion of performance, Continued
March 31, 2004
Portfolio Diversification
During the quarter modest changes occurred in industry and country diversification. The portfolio is currently diversified across 16 industries. Exposure to the telecommunications industry increased as Mobile Telesystems and Nippon Telegraph and Telephone Corp. performed very well, and Portugal Telecom SGPS SA and Belgacom SA were added to the portfolio. Exposure to consumer durables & apparel increased with the addition of Adidas-Salomon AG. Exposure to the insurance industry decreased with the sale of China Life Insurance Co. Ltd. Representation of materials and capital goods industries also decreased as MMC Norilsk Nickel (NILSY PK), IHC Caland NV and Muhlbauer Holding AG (MBHDF PK) were eliminated. In terms of country diversification, exposure to Japan and South Korea increased due to the strong performance of Japanese holdings Familymart Co. Ltd., Bank of Fukuoka Ltd., Nippon Telegraph & Telephone Corp., and Korean holding Samsung Electronics Co. Ltd. The addition of Korean Tobacco & Ginseng Corp. and Mitsubishi Tokyo Financial Group also increased exposure to Japan and South Korea. Exposure to the Netherlands decreased significantly with the sale of IHC Caland NV and
| Top 10 Industries | 12/31/03 | 3/31/04 | |||||
|---|---|---|---|---|---|---|---|
| Banks | 10 | .0% | Telecommunication Services | 12 | .6% | ||
| Diversified Financials | 9 | .5% | Banks | 10 | .9% | ||
| Telecommunication Services | 8 | .6% | Technology Hardware & Equip. | 8 | .5% | ||
| Automobiles & Components | 8 | .4% | Diversified Financials | 8 | .4% | ||
| Technology Hardware & Equip | 8 | .0% | Automobiles & Components | 8 | .2% | ||
| Media | 8 | .0% | Consumer Durables & Apparel | 7 | .9% | ||
| Pharmaceuticals & Biotechnology | 7 | .5% | Retailing | 6 | .7% | ||
| Energy | 6 | .8% | Energy | 6 | .7% | ||
| Retailing | 5 | .4% | Media | 6 | .5% | ||
| Consumer Durables & Apparel | 5 | .2% | Pharmaceuticals & Biotechnology | 6 | .0% | ||
| Country Exposure | 12/31/03 | 3/31/04 | |||||
|---|---|---|---|---|---|---|---|
| U.K | 21 | .3% | U.K. | 20 | .6% | ||
| Japan | 12 | .2% | Japan | 15 | .7% | ||
| Germany | 8 | .7% | Germany | 8 | .2% | ||
| Canada | 6 | .4% | South Korea | 6 | .8% | ||
| Switzerland | 5 | .3% | Canada | 5 | .8% | ||
| Brazil | 4 | .6% | Brazil | 4 | .4% | ||
| Netherlands | 4 | .2% | Mexico | 4 | .3% | ||
| South Korea | 4 | .2% | Switzerland | 4 | .2% | ||
| Russia | 3 | .9% | India | 2 | .9% | ||
| Taiwan | 3 | .2% | France | 2 | .6% | ||
| France | 2 | .3% | Taiwan | 2 | .6% | ||
| Belgium | 2 | .2% | Ireland | 2 | .4% | ||
| Spain | 2 | .0% | Italy | 2 | .3% | ||
| Italy | 2 | .0% | Portugal | 2 | .3% | ||
| India | 2 | .0% | Hungary | 2 | .3% | ||
| Mexico | 1 | .9% | Russia | 2 | .2% | ||
| Hungary | 1 | .9% | Netherlands | 2 | .1% | ||
| China | 1 | .8% | Belgium | 1 | .9% | ||
| Hong Kong | 1 | .7% | China | 1 | .7% | ||
| Ireland | 1 | .5% | Spain | 1 | .0% | ||
| Sweden | 1 | .0% | Cash | 3 | .7% | ||
| Cash | 5 | .7% | |||||
5
Thornburg International Value Fund
management’s discussion of performance, Continued
March 31, 2004
| the poor performance of ING Groep NV (ING). The portfolio is currently diversified across 20 countries. Capitalization exposure of the portfolio did not change significantly. |
6
| Statement of assets and liabilities | |||
|---|---|---|---|
| Thornburg International Value Fund | March 31, 2004 | ||
| (Unaudited) | |||
| ASSETS | |||
| Investments at value (cost $799,726,016) | $ 893,703,607 | ||
| Cash | 890,340 | ||
| Cash denominated in foreign currency (cost $13,905,926) | 14,129,000 | ||
| Receivable for fund shares sold | 10,632,298 | ||
| Unrealized gain on forward exchange contracts (Note 6) | 486,021 | ||
| Dividends receivable | 3,528,756 | ||
| Prepaid expenses and other assets | 99,280 | ||
| Total Assets | 923,469,302 | ||
| LIABILITIES | |||
| Payable for securities purchased | 12,922,270 | ||
| Payable for fund shares redeemed | 142,573 | ||
| Payable to investment advisor (Note 3) | 670,117 | ||
| Deferred tax payable | 23,238 | ||
| Accounts payable and accrued expenses | 568,294 | ||
| Total Liabilities | 14,326,492 | ||
| NET ASSETS | $ 909,142,810 | ||
| NET ASSETS CONSIST OF: | |||
| Undistributed net investment gain (loss) | $ (104,046 | ) | |
| Net unrealized appreciation (depreciation) on investments | 94,481,888 | ||
| Accumulated net realized gain (loss) | (12,059,672 | ) | |
| Net capital paid in on shares of beneficial interest | 826,824,640 | ||
| $ 909,142,810 | |||
| NET ASSET VALUE: | |||
| Class A Shares: | |||
| Net asset value and redemption price per share | |||
| ($574,159,639 applicable to 31,457,725 shares of beneficial interest outstanding - Note 4) | $ 18.25 | ||
| Maximum sales charge, 4.50% of offering price | 0.86 | ||
| Maximum Offering Price Per Share | $ 19.11 | ||
| Class B Shares: | |||
| Net asset value and offering price per share * | |||
| ($14,922,653 applicable to 850,704 shares of beneficial interest outstanding - Note 4) | $ 17.54 | ||
| Class C Shares: | |||
| Net asset value and offering price per share* | |||
| ($157,394,588 applicable to 8,944,511 shares of beneficial interest outstanding - Note 4) | $ 17.60 | ||
| Class I Shares: | |||
| Net asset value, offering, and redemption price per share | |||
| ($160,847,387 applicable to 8,688,861 shares of beneficial interest outstanding - Note 4) | $ 18.51 | ||
| Class R-1 Shares: | |||
| Net asset value, offering, and redemption price per share | |||
| ($1,818,544 applicable to 99,087 shares of beneficial interest outstanding - Note 4) | $ 18.35 | ||
| *Redemption price per share is equal to net asset value less any applicable contingent deferred sales charge | |||
| See notes to financial statements | |||
7
| Statement of Operations | |||
|---|---|---|---|
| Thornburg International Value Fund | Six Months Ended March 31, 2004 | ||
| (Unaudited) | |||
| INVESTMENT INCOME | |||
| Dividend income (net of foreign taxes withheld of $561,243) | $ 4,669,500 | ||
| Interest income | 85,918 | ||
| Other income | 4,665 | ||
| Total Income | 4,760,083 | ||
| EXPENSES | |||
| Investment advisory fees (Note 3) | 2,240,259 | ||
| Administration fees (Note 3) | |||
| Class A Shares | 198,657 | ||
| Class B Shares | 6,144 | ||
| Class C Shares | 59,993 | ||
| Class I Shares | 23,649 | ||
| Class R-1 Shares | 365 | ||
| Distribution and service fees (Note 3) | |||
| Class A Shares | 406,240 | ||
| Class B Shares | 50,542 | ||
| Class C Shares | 479,245 | ||
| Class R-1 Shares | 1,524 | ||
| Transfer agent fees | |||
| Class A Shares | 139,000 | ||
| Class B Shares | 12,658 | ||
| Class C Shares | 57,845 | ||
| Class I Shares | 23,142 | ||
| Class R-1 Shares | 1,696 | ||
| Registration & filing fees | |||
| Class A Shares | 5,759 | ||
| Class B Shares | 3,806 | ||
| Class C Shares | 4,452 | ||
| Class I Shares | 4,899 | ||
| Class R-1 Shares | 7,794 | ||
| Custodian fees (Note 3) | 173,487 | ||
| Professional fees | 22,415 | ||
| Accounting fees | 7,780 | ||
| Trustee fees | 3,495 | ||
| Other expenses | 51,690 | ||
| Total Expenses | 3,986,536 | ||
| Less: | |||
| Expenses reimbursed by investment advisor (Note 3) | (51,799 | ) | |
| Expenses paid indirectly (Note 3) | (8,877 | ) | |
| Net Expenses | 3,925,860 | ||
| Net Investment Income | $ 834,223 | ||
8
| Statement of operations, continued | |||
|---|---|---|---|
| Thornburg International Value Fund | Six Months Ended March 31, 2004 | ||
| (Unaudited) | |||
| REALIZED AND UNREALIZED GAIN (LOSS) | |||
| Net realized gain (loss) on: | |||
| Investments | $ 15,702,080 | ||
| Foreign currency transactions | (3,314,336 | ) | |
| -- | 12,387,744 | ||
| Net change in unrealized appreciation (depreciation) on: | |||
| Investments | 64,879,968 | ||
| Foreign currency translation | 1,333,171 | ||
| -- | 66,213,139 | ||
| Net Realized and Unrealized | |||
| Gain (Loss) on Investments | 78,600,883 | ||
| Net Increase (Decrease) in Net Assets Resulting | |||
| From Operations | $ 79,435,106 | ||
| See notes to financial statements | |||
9
| Statements of Changes in net assets | |||||
|---|---|---|---|---|---|
| Thornburg International Value Fund | |||||
| Six Months Ended March 31, 2004 | Year Ended September 30, 2003 | ||||
| INCREASE (DECREASE) IN NET ASSETS FROM: | |||||
| OPERATIONS: | |||||
| Net investment income gain (loss) | $ 834,223 | $ 448,338 | |||
| Net realized gain (loss) on investments and foreign currency | |||||
| transactions | 12,387,744 | (11,991,488 | ) | ||
| Increase (Decrease) in unrealized appreciation (depreciation) | |||||
| on investments and foreign currency translation | 66,213,139 | 46,112,063 | |||
| Net Increase (Decrease) in Net Assets | |||||
| Resulting from Operations | 79,435,106 | 34,568,913 | |||
| FUND SHARE TRANSACTIONS - (Note 4) | |||||
| Class A Shares | 429,056,964 | 11,087,620 | |||
| Class B Shares | 6,916,689 | 485,325 | |||
| Class C Shares | 86,216,835 | 5,432,349 | |||
| Class I Shares | 112,453,256 | 8,371,956 | |||
| Class R-1 Shares | 1,773,862 | 75 | |||
| Net Increase (Decrease) in Net Assets | 715,852,712 | 59,946,238 | |||
| NET ASSETS: | |||||
| Beginning of period | 193,290,098 | 133,343,860 | |||
| End of period | $909,142,810 | $ 193,290,098 | |||
| See notes to financial statements | |||||
10
Thornburg International Value Fund
Notes to financial statements
NOTE 1 – ORGANIZATION Thornburg International Value Fund, hereinafter referred to as the “Fund,” is a diversified series of Thornburg Investment Trust (the “Trust”). The Trust was organized as a Massachusetts business trust under a Declaration of Trust dated June 3, 1987 and is registered as a diversified, open-end management investment company under the Investment Company Act of 1940, as amended. The Trust is currently issuing nine series of shares of beneficial interest in addition to those of the Fund: Thornburg Limited Term U.S. Government Fund, Thornburg New Mexico Intermediate Municipal Fund, Thornburg Intermediate Municipal Fund, Thornburg Limited Term Income Fund, Thornburg Florida Intermediate Municipal Fund, Thornburg Value Fund, Thornburg Core Growth Fund, Thornburg New York Intermediate Municipal Fund, and Thornburg Investment Income Builder Fund. Each series is considered to be a separate entity for financial reporting and tax purposes and bears expenses directly attributable to it. The Fund seeks long-term capital appreciation by investing in both foreign and domestic equity securities selected on a value basis.
The Fund currently offers five classes of shares of beneficial interest, Class A, Class B, Class C, Institutional Class (Class I) and Retirement Class (Class R-1) shares. Each class of shares of a Fund represents an interest in the same portfolio of investments of the Fund, except that (i) Class A shares are sold subject to a front-end sales charge collected at the time the shares are purchased and bear a service fee, (ii) Class B shares are sold at net asset value without a sales charge at the time of purchase, but are subject to a contingent deferred sales charge upon redemption and bear both a service fee and distribution fee, (iii) Class C shares are sold at net asset value without a sales charge at the time of purchase, but are subject to a contingent deferred sales charge upon redemption within one year, and bear a service fee and a distribution fee, (iv) Class I shares are sold at net asset value without a sales charge at the time of purchase, (v) Class R-1 shares are sold at net asset value without a sales charge at the time of purchase, but bear both a service fee and distribution fee, and (vi) the respective classes have different reinvestment privileges. Additionally, the Fund may allocate among its classes certain expenses, to the extent allowable to specific classes, including transfer agent fees, government registration fees, certain printing and postage costs, and administrative and legal expenses. Currently, class specific expenses of the Fund are limited to service and distribution fees, administration fees and certain registration and transfer agent expenses. Class B shares of the Fund outstanding for eight years will convert to Class A shares of the Fund.
NOTE 2 – SIGNIFICANT ACCOUNTING POLICIES Significant accounting policies of the Funds are as follows:
Valuation of Securities: In determining net asset value, investments are stated at value based on latest sales prices, normal
ly at 4:00 pm EST reported on national securities exchanges on the last business day of the period. Investments for which no sale is reported are valued at the mean between bid and asked prices. Securities for which market quotations are not readily available are valued at fair value as determined by management and approved in good faith by the Board of Trustees. Short term obligations having remaining maturities of 60 days or less are valued at amortized cost, which approximates market value.
Foreign Currency Translation: Portfolio securities and other assets and liabilities denominated in foreign currencies are translated into U.S. dollars based on the exchange rate of such currencies against the U.S. dollar on the date of valuation. Purchases and sales of securities and income items denominated in foreign currencies are translated into U.S. dollars at the exchange rate in effect on the translation date. When the Fund purchases or sells foreign securities it will customarily enter into a foreign exchange contract to minimize foreign exchange risk from the trade date to the settlement date of such transactions.
The Fund does not separately report the effect of changes in foreign exchange rates from changes in market prices on securities held. Such changes are included in net realized and unrealized gain or loss from investments.
Reported net realized foreign exchange gains or losses arise from sales of foreign currencies, currency gains or losses realized between the trade and settlement dates on securities transactions and the difference between the amount of interest recorded on the Fund’s books, and the U.S. dollar equivalent of the amounts actually received or paid.
Federal Income Taxes: It is the policy of the Fund to comply with the provisions of the Internal Revenue Code applicable to “regulated investment companies” and to distribute all of its taxable income to its shareholders. Therefore, no provision for Federal income tax is required.
When-Issued and Delayed Delivery Transactions: The Fund may engage in when-issued or delayed delivery transactions. To the extent the Fund engages in such transactions, it will do so for the purpose of acquiring portfolio securities consistent with its investment objectives and not for the purpose of investment leverage or to speculate on market changes. At the time the Fund makes a commitment to purchase a security on a when-issued basis, it will record the transaction and reflect the value in determining its net asset value. When effecting such transactions, assets of the Fund of an amount sufficient to make payment for the portfolio securities to be purchased will be segregated on the Fund’s records on the trade date.
11
Thornburg International Value Fund
Notes to financial statements, continued
March 31, 2004
Dividends: Dividends to shareholders are generally paid quarterly and are reinvested in additional shares of the Fund at net asset value per share at the close of business on the dividend payment date, or at the shareholder’s option, paid in cash. Net realized capital gains, to the extent available, will be distributed at least annually. Distributions to shareholders are based on income tax regulations and therefore, their characteristics may differ for financial statement and tax purposes.
General: Securities transactions are accounted for on a trade date basis. Interest income is accrued as earned and dividend income is recorded on the ex-dividend date. Certain income from foreign securities is recognized as soon as information is available to the Fund. Realized gains and losses from the sale of securities are recorded on an identified cost basis. Net investment income, other than class specific expenses, and realized and unrealized gains and losses, are allocated daily to each class of shares based upon the relative net asset value of outstanding shares of each class of shares at the beginning of the day (after adjusting for the current share activity of the respective class). Expenses common to all funds are allocated among the funds comprising the Trust based upon their relative net asset values or other appropriate allocation methods.
Guarantees and Indemnifications: Under the Trust’s organizational documents, its officers and trustees are indemnified against certain liability arising out of the performance of their duties to the Fund. Additionally, in the normal course of business the Trust enters into contracts with service providers that contain general indemnification clauses. The Trust’s maximum exposure under these arrangements is unknown. However, based on experience, the Trust expects the risk of loss to be remote.
Use of Estimates: The preparation of financial statements, in conformity with generally accepted accounting principles, requires management to make estimates and assumptions that affect the reported amounts of assets and liabilities and the disclosure of contingent assets and liabilities at the date of the financial statements and the reported amounts of increases and decreases in net assets from operations during the reporting period. Actual results could differ from those estimates.
NOTE 3 — INVESTMENT ADVISORY FEE AND OTHER TRANSACTIONS WITH AFFILIATES
Pursuant to an investment advisory agreement, Thornburg Investment Management, Inc. (the “Advisor”) serves as the investment advisor and performs services to the Fund for which the fees are payable at the end of each month. For the period ended March 31, 2004, these fees were payable at annual rates ranging from .875 of 1% to .675 of 1% of the average daily net assets of the Fund depending on the Fund’s asset size. The Fund also has an administrative services agreement
with the Advisor, whereby the Advisor will perform certain administrative services for the shareholders of each class of the Fund’s shares, and for which fees will be payable at an annual rate of up to .125 of 1% of the average daily net assets attributable to each class of shares. For the period ended March 31, 2004, the Advisor voluntarily reimbursed certain class specific expenses and administrative fees of $3,779 for Class B shares, $38,119 for Class I shares, and $9,901 for Class R-1 shares.
The Fund has an underwriting agreement with Thornburg Securities Corporation (the “Distributor”), which acts as the Distributor of the Fund’s shares. For the period ended March 31, 2004, the Distributor has advised the Fund that it earned net commissions aggregating $134,989 from the sale of Class A shares of the Fund, and collected contingent deferred sales charges aggregating $5,739 from redemptions of Class C shares of the Fund.
Pursuant to a service plan under Rule 12b-1 of the Investment Company Act of 1940, the Fund may reimburse to the Advisor an amount not to exceed .25 of 1% per annum of its average daily net assets attributable to each class of shares of the Fund for payments made by the Advisor to securities dealers and other financial institutions to obtain various shareholder related services. The Advisor may pay out of its own resources additional expenses for distribution of the Fund’s shares.
The Fund has also adopted distribution plans pursuant to Rule 12b-1, applicable only to the Fund’s Class B, Class C and Class R-1 shares under which the Fund compensates the Distributor for services in promoting the sale of Class B, Class C and Class R-1 shares of the Fund at an annual rate of up to .75 of 1% of the average daily net assets attributable to Class B, Class C and Class R-1 shares. Total fees incurred by each class of shares of the Fund under their respective Service and Distribution Plans for the period ended March 31, 2004 are set forth in the Statement of Operations.
The Fund has an agreement with the custodian bank to indirectly pay a portion of the custodian’s fees through credits earned by the Fund’s cash on deposit with the bank. This deposit agreement is an alternative to overnight investments. Custodial fees have been adjusted to reflect amounts that would have been paid without this agreement, with a corresponding adjustment reflected as fees paid indirectly in the statement of operations. For the period ended March 31, 2004 fees paid indirectly were $8,877.
Certain officers and trustees of the Trust are also officers and/or directors of the Advisor and Distributor. The compensation of unaffiliated trustees is borne by the Trust.
12
Thornburg International Value Fund
Notes to financial statements, continued
March 31, 2004
NOTE 4 — SHARES OF BENEFICIAL INTEREST
At March 31, 2004, there were an unlimited number of shares of beneficial interest authorized. Sales of R-1 shares commenced July 1, 2003. Transactions in shares of beneficial interest were as follows:
| Period Ended March 31, 2004 | Year Ended September 30, 2003 | ||||||||
|---|---|---|---|---|---|---|---|---|---|
| Shares | Amount | Shares | Amount | ||||||
| Class A Shares | |||||||||
| Shares sold | 26,680,365 | $ 459,950,461 | 3,378,754 | $ 44,006,739 | |||||
| Shares repurchased** | (1,777,473 | ) | (30,893,497 | ) | (2,671,582 | ) | (32,919,119 | ) | |
| Net Increase (Decrease) | 24,902,892 | $ 429,056,964 | 707,172 | $ 11,087,620 | |||||
| ** The Fund charges a redemption fee of 1% of the Class A shares exchanged within 90 days of purchase. For the year ended September 30, 2003 and period ended March 31, 2004, $55,020 and $19,654, respectively, were netted in the amount reported for shares repurchased | |||||||||
| Class B Shares | |||||||||
| Shares sold | 431,966 | $ 7,276,362 | 136,594 | $ 1,695,976 | |||||
| Shares repurchased | (21,132 | ) | (359,673 | ) | (100,676 | ) | (1,210,651 | ) | |
| Net Increase (Decrease) | 410,834 | $ 6,916,689 | 35,918 | $ 485,325 | |||||
| Class C Shares | |||||||||
| Shares sold | 5,466,682 | $ 92,125,551 | 1,397,752 | $ 17,554,897 | |||||
| Shares repurchased | (354,538 | ) | (5,908,716 | ) | (1,014,225 | ) | (12,122,548 | ) | |
| Net Increase (Decrease) | 5,112,144 | $ 86,216,835 | 383,527 | $ 5,432,349 | |||||
| Class I Shares | |||||||||
| Shares sold | 6,665,536 | $ 115,851,708 | 1,169,448 | $ 15,121,898 | |||||
| Shares repurchased** | (191,924 | ) | (3,398,452 | ) | (558,936 | ) | (6,749,942 | ) | |
| Net Increase (Decrease) | 6,473,612 | $ 112,453,256 | 610,512 | $ 8,371,956 | |||||
| ** The Fund charges a redemption fee of 1% of the Class I shares exchanged within 90 days of purchase. For the year ended September 30, 2003 and period ended March 31, 2004, $7,078 and $6,372, respectively, were netted in the amount reported for shares repurchased | |||||||||
| Class R-1 Shares | |||||||||
| Shares sold | 116,055 | $ 2,078,378 | 5 | $ 75 | |||||
| Shares repurchased | (16,973 | ) | (304,516 | ) | -- | -- | |||
| Net Increase (Decrease) | 99,082 | $ 1,773,862 | 5 | $ 75 | |||||
13
Thornburg International Value Fund
Notes to financial statements, continued
March 31, 2004
NOTE 5 – SECURITIES TRANSACTIONS
For the period ended March 31, 2004, the Fund had purchase and sale transactions of investment securities (excluding short term securities) of $671,597,884 and $79,498,629, respectively.
NOTE 6 – INCOME TAXES
At March 31, 2004, information on the tax components of capital is as follows:
| Cost of investments for tax purpose | $ 799,931,484 | ||
| Gross unrealized appreciation on a tax basis | $ 97,237,935 | ||
| Gross unrealized depreciation on a tax basis | (3,465,812 | ) | |
| Net unrealized appreciation | |||
| (depreciation) on investments (tax basis) | $ 93,772,123 | ||
At March 31, 2004, the Fund had tax basis capital losses, which may be carried over to offset future capital gains. Such losses expire as follows:
| Capital loss carryovers expiring in: | |||
|---|---|---|---|
| 2007 | $ 119,008 | ||
| 2008 | 272,996 | ||
| 2009 | 917,688 | ||
| 2010 | 3,523,281 | ||
| 2011 | 9,267,675 | ||
| -- | $14,100,648 | ||
As of March 31, 2004 the Fund had deferred currency and capital losses occurring subsequent to October 31, 2002 of $1,725,498 and $10,141,290, respectively. For tax purposes, such losses will be reflected in the year ending September 30, 2004.
Unutilized tax basis capital losses may be carried forward to offset realized gains in future years. To the extent such carry forwards are used in future years, capital gain distributions may be reduced to the extent provided by regulations.
Net investment income and net realized gain (loss) differ for financial statement and tax purposes primarily due to differing treatments of wash sale losses, foreign currency transactions and losses realized subsequent to October 31 on the sale of securities and foreign currencies.
NOTE 7 – FINANCIAL INSTRUMENTS WITHOFF-BALANCE
SHEET RISK
During the period ended March 31, 2004, the Fund was a party to financial instruments with off-balance sheet risks, primarily currency forward exchange contracts. A forward exchange contract is an agreement between two parties to exchange different currencies at a specified rate at an agreed upon future date. These contracts are purchased in order to minimize the risk to the Fund with respect to its foreign stock transactions from adverse changes in the relationship between the U.S. dollar and foreign currencies. In each case these contracts have been initiated in conjunction with foreign stock transactions. These instruments may involve market risks in excess of the amount recognized on the Statement of Assets and Liabilities. Such risks would arise from the possible inability of counterparties to meet the terms of their contracts, future movement in currency value and interest rates and contract positions that are not exact offsets. These contracts are reported in the financial statements at the Fund’s net equity, as measured by the difference between the forward exchange rates at the reporting date and the forward exchange rates at the dates of entry into the contract.
CONTRACTS TO SELL:
| 56,000,000 | Mexican Peso for 4,819,692 USD June 18, 2004 | $(136,420 | ) | ||
| Unrealized loss from forward | |||||
| exchange contracts | (136,420 | ) | |||
| 15,000,000 | Euro Dollar for 18,952,500 USD, August 10, 2004 | 569,677 | |||
| 41,000,000 | Mexican Peso for 3,670,875 USD, July 09, 2004 | 52,764 | |||
| Unrealized gain from forward | |||||
| exchange contracts | 622,441 | ||||
| Net unrealized gain (loss) from forward | |||||
| exchange contracts | $ 486,021 | ||||
14
| Financial highlights | ||||||
|---|---|---|---|---|---|---|
| Thornburg International Value Fund | ||||||
| Six Months Ended March 31, | Year Ended September 30, | |||||
| 2004 | 2003 | 2002 | 2001 | 2000 | 1999 | |
| Class A Shares: | ||||||
| Per Share Performance | ||||||
| (for a share outstanding throughout the period)+ | ||||||
| Net asset value, beginning of period | $ 14.95 | $ 11.88 | $ 12.37 | $ 16.64 | $ 12.95 | $ 9.79 |
| Income from investment operations: | ||||||
| Net investment income | 0.04 | 0.06 | 0.03 | 0.03 | 0.44 | 0.12 |
| Net realized and unrealized | ||||||
| gain (loss) on investments | 3.26 | 3.00 | (0.54) | (3.39) | 4.03 | 3.18 |
| Total from investment operations | 3.30 | 3.06 | (0.51) | (3.36) | 4.47 | 3.30 |
| Redemption fees added to paid in capital | -- | 0.01 | 0.02 | -- | -- | -- |
| Less dividends from: | ||||||
| Net investment income | -- | -- | -- | (0.86) | (0.78) | (0.14) |
| Return of Capital | -- | -- | -- | (0.05) | -- | -- |
| Total dividends | -- | -- | -- | (0.91) | (0.78) | (0.14) |
| Change in net asset value | 3.30 | 3.07 | (0.49) | (4.27) | 3.69 | 3.16 |
| Net asset value, end of period | $ 18.25 | $ 14.95 | $ 11.88 | $ 12.37 | $ 16.64 | $ 12.95 |
| Total return (a) | 22.07% | 25.84% | (3.96)% | (21.28)% | 34.42% | 33.79% |
| Ratios/Supplemental Data | ||||||
| Ratios to average net assets: | ||||||
| Net investment income | 0.45% (b) | 0.44% | 0.19% | 0.22% | 2.61% | 1.07% |
| Expenses, after expense reductions | 1.43% (b) | 1.59% | 1.57% | 1.54% | 1.53% | 1.63% |
| Expenses, after expense reductions | ||||||
| and net of custody credits | 1.43% (b) | 1.59% | 1.57% | -- | -- | -- |
| Expenses, before expense reductions | 1.43% (b) | 1.67% | 1.60% | 1.56% | 1.55% | 1.93% |
| Portfolio turnover rate | 15.79% | 58.35% | 28.39% | 61.05% | 86.13% | 58.09% |
| Net assets at end of period (000) | $ 574,160 | $ 97,991 | $ 69,490 | $ 56,507 | $ 76,070 | $ 23,202 |
(a) Sales loads are not reflected in computing total return, which is not annualized for periods less than one year.
(b) Annualized.
+ Based on weighted average shares outstanding.
15
| Financial highlights, continued | |||||
|---|---|---|---|---|---|
| Thornburg International Value Fund | |||||
| Six Months Ended March 31, | Year Ended September 30, | Period Ended September 30, | |||
| 2004 | 2003 | 2002 | 2001 | 2000 (c) | |
| Class B Shares: | |||||
| Per Share Performance | |||||
| (for a share outstanding throughout the period)+ | |||||
| Net asset value, beginning of period | $ 14.43 | $ 11.57 | $ 12.16 | $ 16.44 | $ 17.62 |
| Income from investment operations: | |||||
| Net investment income | (0.06) | (0.04) | (0.08) | (0.06) | 0.14 |
| Net realized and unrealized | |||||
| gain (loss) on investments | 3.17 | 2.90 | (0.51) | (3.36) | (0.79) |
| Total from investment operations | 3.11 | 2.86 | (0.59) | (3.42) | (0.65) |
| Less dividends from: | |||||
| Net investment income | -- | -- | -- | (0.82) | (0.53) |
| Return of Capital | -- | -- | -- | (0.04) | -- |
| Total dividends | 0.00 | -- | -- | (0.86) | (0.53) |
| Change in net asset value | 3.11 | 2.86 | (0.59) | (4.28) | (1.18) |
| Net asset value, end of period | $ 17.54 | $ 14.43 | $ 11.57 | $ 12.16 | $ 16.44 |
| Total return (a) | 21.55% | 24.72% | (4.85)% | (21.86)% | (3.73)% |
| Ratios/Supplemental Data | |||||
| Ratios to average net assets: | |||||
| Net investment income | (0.74)%(b) | (0.32)% | (0.58)% | (0.39)% | 1.63%(b) |
| Expenses, after expense reductions | 2.37%(b) | 2.38% | 2.39% | 2.40% | 2.38%(b) |
| Expenses, after expense reductions | |||||
| and net of custody credits | 2.37%(b) | 2.38% | 2.39% | -- | -- |
| Expenses, before expense reductions | 2.45%(b) | 2.84% | 2.88% | 3.62% | 6.08%(b) |
| Portfolio turnover rate | 15.79% | 58.35% | 28.39% | 61.05% | 86.13% |
| Net assets at end of period (000) | $ 14,923 | $ 6,346 | $ 4,672 | $ 2,570 | $ 1,270 |
(a) Not annualized for periods less than one year.
(b) Annualized.
(c) Effective date of Class B Shares was April 3, 2000.
+ Based on weighted average shares outstanding.
16
| Financial highlights, continued | ||||||
|---|---|---|---|---|---|---|
| Thornburg International Value Fund | ||||||
| Six Months Ended March 31, | Year Ended September 30, | |||||
| 2004 | 2003 | 2002 | 2001 | 2000 | 1999 | |
| Class C Shares: | ||||||
| Per Share Performance | ||||||
| (for a share outstanding throughout the period)+ | ||||||
| Net asset value, beginning of period | $ 14.47 | $ 11.60 | $ 12.19 | $ 16.49 | $ 12.88 | $ 9.77 |
| Income from investment operations: | ||||||
| Net investment income | (0.04) | (0.04) | (0.08) | (0.08) | 0.38 | 0.04 |
| Net realized and unrealized | ||||||
| gain (loss) on investments | 3.17 | 2.91 | (0.51) | (3.37) | 3.91 | 3.14 |
| Total from investment operations | 3.13 | 2.87 | (0.59) | (3.45) | 4.29 | 3.18 |
| Less dividends from: | ||||||
| Net investment income | -- | -- | -- | (0.81) | (0.68) | (0.07) |
| Return of Capital | -- | -- | -- | (0.04) | -- | -- |
| Total dividends | -- | -- | -- | (0.85) | (0.68) | (0.07) |
| Change in net asset value | 3.13 | 2.87 | (0.59) | (4.30) | 3.61 | 3.11 |
| Net asset value, end of period | $ 17.60 | $ 14.47 | $ 11.60 | $ 12.19 | $ 16.49 | $ 12.88 |
| Total return (a) | 21.63% | 24.74% | (4.84)% | (21.96)% | 33.20% | 32.59% |
| Ratios/Supplemental Data | ||||||
| Ratios to average net assets: | ||||||
| Net investment income | (0.48)%(b) | (0.31)% | (0.62)% | (0.51)% | 2.25% | 0.11% |
| Expenses, after expense reductions | 2.21%(b) | 2.37% | 2.36% | 2.37% | 2.37% | 2.38% |
| Expenses, after expense reductions | ||||||
| and net of custody credits | 2.21%(b) | 2.37% | 2.36% | -- | -- | -- |
| Expenses, before expense reductions | 2.21%(b) | 2.45% | 2.36% | 2.39% | 2.43% | 3.63% |
| Portfolio turnover rate | 15.79% | 58.35% | 28.39% | 61.05% | 86.13% | 58.09% |
| Net assets at end of period (000) | $ 157,395 | $ 55,443 | $ 39,995 | $ 26,426 | $ 26,120 | $ 3,235 |
(a) Not annualized for periods less than one year.
(b) Annualized.
+ Based on weighted average shares outstanding.
17
| Financial highlights, continued | ||||
|---|---|---|---|---|
| Thornburg International Value Fund | ||||
| Six Months Ended March 31, | Year Ended | September 30, | Period Ended September 30, | |
| 2004 | 2003 | 2002 | 2001(c) | |
| Class I Shares: | ||||
| Per Share Performance | ||||
| (for a share outstanding throughout the period)+ | ||||
| Net asset value, beginning of period | $ 15.13 | $ 11.96 | $ 12.40 | $ 14.63 |
| Income from investment operations: | ||||
| Net investment income | 0.07 | 0.14 | 0.10 | 0.11 |
| Net realized and unrealized | ||||
| gain (loss) on investments | 3.31 | 3.03 | (0.54) | (2.21) |
| Total from investment operations | 3.38 | 3.17 | (0.44) | (2.10) |
| Less dividends from: | ||||
| Net investment income | -- | -- | -- | (0.08) |
| In excess of net investment income | -- | -- | -- | (0.05) |
| Total dividends | -- | -- | -- | (0.13) |
| Change in net asset value | 3.38 | 3.17 | (0.44) | (2.23) |
| Net asset value, end of period | $ 18.51 | $ 15.13 | $ 11.96 | $ 12.40 |
| Total return (a) | 22.34% | 26.51% | (3.55)% | (14.50)% |
| Ratios/Supplemental Data | ||||
| Ratios to average net assets: | ||||
| Net investment income | 0.80% (b) | 1.07% | 0.71% | 1.57%(b) |
| Expenses, after expense reductions | 0.99% (b) | 0.99% | 0.99% | 0.97%(b) |
| Expenses, after expense reductions | ||||
| and net of custody credits | 0.99% (b) | 0.99% | 0.99% | -- |
| Expenses, before expense reductions | 1.07% (b) | 1.25% | 1.28% | 1.38%(b) |
| Portfolio turnover rate | 15.79% | 58.35% | 28.39% | 61.05% |
| Net assets at end of period (000) | $ 160,847 | $ 33,511 | $ 19,187 | $ 11,249 |
(a) Not annualized for periods less than one year.
(b) Annualized.
(c) Effective date of Class I Shares was March 30, 2001.
+ Based on weighted average shares outstanding.
18
| Financial highlights, continued | ||
|---|---|---|
| Thornburg International Value Fund | ||
| Six Months Ended March 31, | Period Ended September 30, | |
| 2004 | 2003(c) | |
| Class R-1 Shares: | ||
| Per Share Performance | ||
| (for a share outstanding throughout the period)+ | ||
| Net asset value, beginning of period | $ 15.01 | $ 13.59 |
| Income from investment operations: | ||
| Net investment income | 0.12 | 0.02 |
| Net realized and unrealized | ||
| gain (loss) on investments | 3.22 | 1.40 |
| Total from investment operations | 3.34 | 1.42 |
| Less dividends from: | ||
| Net investment income | -- | -- |
| Change in net asset value | 3.34 | 1.42 |
| Net asset value, end of period | $ 18.35 | $ 15.01 |
| Total return (a) | 22.25% | 10.45% |
| Ratios/Supplemental Data | ||
| Ratios to average net assets: | ||
| Net investment income | 1.32%(b) | 0.65%(b) |
| Expenses, after expense reductions | 1.48%(b) | 1.60%(b) |
| Expenses, after expense reductions | ||
| and net of custody credits | 1.48%(b) | 1.60%(b) |
| Expenses, before expense reductions | 4.85%(b) | 30,451.98%(b)* |
| Portfolio turnover rate | 15.79% | 58.35% |
| Net assets at end of period (000) | $ 1,819 | $ - (d) |
(a) Not annualized for periods less than one year.
(b) Annualized.
(c) Effective date of Class R-1 Shares was July 1, 2003.
(d) Net assets at end of year were less than $1,000.
* Due to the size of net assets and fixed expenses, ratios may appear disproportionate.
+ Based on weighted average shares outstanding.
19
| Schedule of investments | ||||||||
|---|---|---|---|---|---|---|---|---|
| Thornburg International Value Fund | March 31, 2004 | |||||||
| CUSIPS: CLASS A - 885-215-657, CLASS B - 885-215-616, CLASS C - 885-215-640, CLASS I - 885-215-566, CLASS R-1 - 885-215-525 NASDAQ SYMBOLS: CLASS A - TGVAX, CLASS B - THGBX, CLASS C - THGCX, CLASS I - TGVIX, CLASS R-1 - TGVRX | ||||||||
| Shares | Value | |||||||
| COMMON STOCKS-- 96.30% | ||||||||
| AUTOMOBILES & COMPONENTS (8.20%) | ||||||||
| Bayerische Motoren Werke AG | 202,505 | $ | 8,237,071 | |||||
| Hero Honda Motors Ltd. | 1,269,300 | 14,360,512 | ||||||
| Hyundai Motor Co. | 379,600 | 17,350,116 | ||||||
| Magna International Inc. | 136,900 | 10,842,480 | ||||||
| Toyota Motor Corp. | 610,200 | 22,724,730 | ||||||
| BANKS (10.90%) | ||||||||
| Bank of Fukuoka Ltd. | 4,392,500 | 21,923,502 | ||||||
| Bank of Ireland | 1,761,200 | 21,995,948 | ||||||
| HSBC Holdings PLC ADR | 235,800 | 17,637,840 | ||||||
| Lloyds TSB Group PLC | 2,447,100 | 18,623,082 | ||||||
| Mitsubishi Tokyo Financial Group | 1,700 | 16,806,642 | ||||||
| CAPITAL GOODS (2.20%) | ||||||||
| Boskalis Westminster Groep NV | 81,380 | 2,175,791 | ||||||
| Embraer Brasileira de Aeronaut | 295,895 | 2,392,408 | ||||||
| Embraer Brasileira de Aeronaut ADR | 456,955 | 14,668,255 | ||||||
| CONSUMER DURABLES & APPAREL (7.90%) | ||||||||
| Adidas-Salomon AG | 183,400 | 21,336,067 | ||||||
| Burberry Group PLC | 3,359,819 | 22,059,933 | ||||||
| Hugo Boss AG | 321,603 | 6,922,238 | ||||||
| Merloni Elettrodomestici S.P.A | 1,149,600 | 20,518,882 | ||||||
| DIVERSIFIED FINANCIALS (8.40%) | ||||||||
| Almanij NV | 264,839 | 16,066,061 | ||||||
| Deutsche Boerse AG | 341,024 | 19,354,641 | ||||||
| Euronext NV | 772,860 | 23,038,430 | ||||||
| ING Groep NV | 757,300 | 16,644,693 | ||||||
| ENERGY (6.70%) | ||||||||
| BP Amoco ADR | 432,700 | 22,154,240 | ||||||
| CNOOC Ltd. ADR | 361,400 | 15,540,200 | ||||||
| Petroleo Brasileiro SA ADR | 656,800 | 22,002,800 | ||||||
| FOOD BEVERAGE & TOBACCO (4.70%) | ||||||||
| Cadbury Schweppes PLC | 3,076,600 | 24,291,406 | ||||||
| Korean Tobacco & Ginseng Corp. | 789,100 | 18,136,670 | ||||||
| FOOD & DRUG RETAILING (2.70%) | ||||||||
| Tesco PLC | 5,368,153 | 24,279,668 | ||||||
| INSURANCE (0.70%) | ||||||||
| Alea Group Holdings Ltd. | 1,514,600 | 6,690,114 | ||||||
| MATERIALS (1.70%) | ||||||||
| Givaudan AG | 30,625 | 15,635,727 | ||||||
| MEDIA (6.50%) | ||||||||
| Pearson PLC | 706,600 | 8,043,363 | ||||||
| Promotora De Informaciones SA | 497,885 | 8,849,885 | ||||||
| Rogers Communications Inc. | 1,202,000 | $ | 22,477,579 | |||||
| Shaw Communications | 1,132,000 | 18,619,700 | ||||||
| PHARMACEUTICALS & BIOTECHNOLOGY (6.00%) | ||||||||
| Bachem Holding AG | 63,188 | 3,365,705 | ||||||
| Doctor Reddys Laboratories Ltd. ADR | 470,400 | 11,266,080 | ||||||
| Gedeon Richter RT | 179,143 | 20,180,140 | ||||||
| Novartis AG ADR | 432,900 | 18,441,540 | ||||||
| RETAILING (6.70%) | ||||||||
| FamilyMart Co. Ltd. | 616,400 | 18,932,476 | ||||||
| Kingfisher PLC | 3,725,375 | 19,780,631 | ||||||
| Wal-Mart de Mexico | 6,912,400 | 21,030,614 | ||||||
| TECHNOLOGY - HARDWARE & EQUIPMENT (8.50%) | ||||||||
| ASE Test Ltd + | 1,034,956 | 11,384,516 | ||||||
| Canon Inc. | 373,200 | 19,307,463 | ||||||
| Nec Electronics Corp. | 253,400 | 19,457,695 | ||||||
| Samsung Electronics Co. Ltd. | 51,100 | 25,495,399 | ||||||
| TELECOMMUNICATION SERVICES (12.60%) | ||||||||
| America Movil S.A. de C.V | 457,400 | 17,678,510 | ||||||
| Belgacom SA | 35,000 | 1,105,711 | ||||||
| Chunghwa Telecom Co. Ltd. ADR | 649,100 | 11,495,561 | ||||||
| Mobile Telesystems ADR | 149,700 | 19,685,550 | ||||||
| Nippon Telegraph & Telephone Corp. | 3,788 | 21,451,456 | ||||||
| Portugal Telecom SGPS SA | 1,814,300 | 20,295,081 | ||||||
| Vodafone Group PLC | 862,500 | 2,043,764 | ||||||
| Vodafone Group PLC ADR | 792,500 | 18,940,750 | ||||||
| TRANSPORTATION (1.90%) | ||||||||
| Fraport AG + | 624,804 | 17,265,550 | ||||||
| TOTAL COMMON STOCKS (Cost $767,027,274) | -- | 861,004,866 | ||||||
| SHORT TERM INVESTMENTS-- 3.70% | ||||||||
| American General Finance Corp., 1.07% due 4/2/2004 | 6,000,000 | 5,999,821 | ||||||
| American General Finance Corp., 1.08% due 4/7/2004 | 6,000,000 | 5,998,920 | ||||||
| International Business Machines, 0.95% due 4/1/2004 | 15,000,000 | 15,000,000 | ||||||
| USAA Capital Corp., 1.01% due 4/1/2004 | 5,700,000 | 5,700,000 | ||||||
| TOTAL SHORT TERM INVESTMENTS (Cost $32,698,742) | -- | 32,698,741 | ||||||
| TOTAL INVESTMENTS (100%) (Cost $799,726,016) | -- | $ | 893,703,607 | |||||
| + Non-income producing See notes to financial statement | ||||||||
21
Index Comparison
Thornburg International Value Fund
March 31, 2004
The charts below compare performance of Thornburg International Value Fund and the Morgan Stanley Capital International (MSCI) Europe, Australia and Far East Index (EAFE) for the period May 31, 1998 to March 31, 2004. Past performance of the Index and the Fund may not be indicative of future performance. The performance data and graph do not reflect the deduction of taxes that a shareholder would pay on distributions or the redemption of Fund shares.
Thornburg International Value Fund Class A Total Returns,Since
5/31/98, versus MSCI EAFE Index
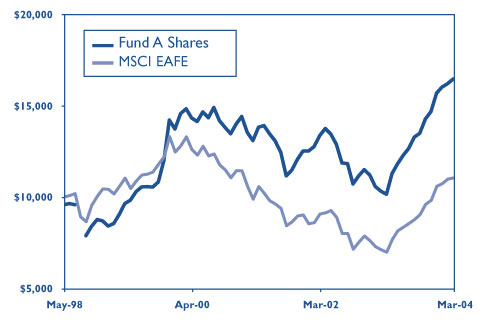
Class A Shares Average Annual Total Returns (at max. offering price) (periods ending 3/31/04)
| 1 Year: | 54 | .92% | |
| 3 Years: | 6 | .30% | |
| 5 Years: | 11 | .64% | |
| From Inception (05/28/98): | 8 | .83% | |
Thornburg International Value Fund Class C Total Returns,Since
5/31/98, versus MSCI EAFE Index
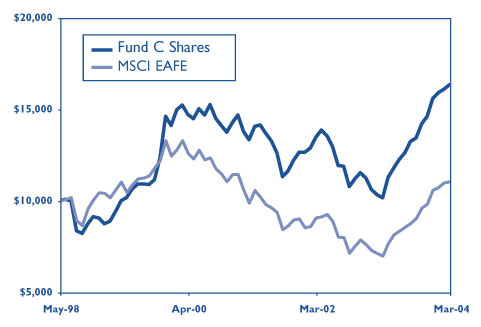
Class C Shares Average Annual Total Returns(periods
ending 3/31/04)
| 1 Year: | 59 | .88% | |
| 3 Years: | 7 | .00% | |
| 5 Years: | 11 | .68% | |
| From Inception (05/28/98): | 8 | .71% | |
A-share data presented includes the effects of the maximum sales charge of 4.50% and the reinvestment of dividends and capital gains. The B-share total return figures at POP include subtraction of the maximum contingent deferred sales charge (CDSC): if redeemed within one year of purchase, the CDSC is 5.00%; within two years, 4.25%; within three years, 3.50%; within four years, 2.75%; within five years, 2.00%; within six years, 1.25%; within seven years, 0.50%. There is no charge for redemption within the eighth year after purchase. Total return figures at the public offering price for the C shares include a 1% CDSC for the first year only.
Past performance is no guarantee of future results. Current returns may be either lower or higher than those shown. Share prices and returns will fluctuate and investors may experience a loss upon redemption. There is no guarantee that the Fund will meet its objectives. Shares in the Fund carry risks, including possible loss of principal.
Carefully consider the Fund’s investment objectives, risks, sales charges, and expenses; this is found in the prospectus, which is available from your financial advisor or from www.thornburg.com. Read it carefully before you invest or send money.
For month-end performance information, or for information and commentary on Fund holdings, including links to each company’s home page, visit www.thornburg.com.
The Morgan Stanley Capital International (“MSCI”) Europe, Australasia, Far East Index (“EAFE”) is an unmanaged index of over 900 companies, and is a generally accepted benchmark for major overseas markets. Index weightings represent the relative capitalizations of the major overseas markets included in the index on a U.S. dollar adjusted basis. The index is calculated separately; without dividends, with gross dividends reinvested and estimated tax withheld, and with gross dividends reinvested, in both U.S. Dollars and local currency.
There are special risk considerations associated with international investing, including fluctuating exchange rates, government regulations and differences in liquidity, which may affect the volatility of the Fund.
Unless otherwise noted, index returns reflect the reinvestment of income dividends and capital gains, if any, but do not reflect fees, brokerage commissions or other expenses of investing. Investors may not make direct investments into any index.
22
Thornburg International Value Fund
Portfolio proxy voting
March 31, 2004
Policies and Procedures (Unaudited):
The Trust has delegated to Thornburg Investment Management, Inc. (“the Advisor”) voting decisions respecting proxies for the Fund’s voting securities. The Advisor makes voting decisions in accordance with its Proxy Voting Policy and Procedures. A description of the policy and Procedures is available (i) without charge, upon request, by calling the Advisor toll-free at 1.800.847.0200, (ii) on the Thornburg website at www.thornburg.com, and (iii) on the Securities and Exchange Commission’s website at www.sec.gov.
Commencing August 31, 2004, information regarding how proxies were voted will be available on or before August 31 of each year for the twelve months ending the preceding June 30. This information will be available (i) without charge, upon request, on the Thornburg website at www.thornburg.com and (ii) on the Securities and Exchange Commission’s website at www.sec.gov.
23
Investment Manager Thornburg
Investment Management, Inc.
119 East Marcy Street
Santa Fe, New Mexico 87501
800.847.0200
Principal Underwriter Thornburg Securities Corporation
119 East Marcy Street
Santa Fe, New Mexico 87501
800.847.0200
This report is submitted for the general information of shareholders of the Fund. It is not authorized for distribution to prospective investors in the Fund unless preceded or accompanied by an effective prospectus. Carefully consider information in the prospectus regarding the Fund’s investment objectives and policies, risks, sales charges, expenses, experience of its management, marketability of shares, and other information. Performance data quoted represent past performance and do not guarantee future results.
www.thornburg.com
Thornburg International Value Fund I Shares
Semi-Annual Report March 31, 2004
Thornburg International Value Fund
Letter to shareholders
April 15, 2004
William V. Fries, CFA
Portfolio Manager
Dear Fellow Shareholder,
Investment performance for the quarter ended March 31, 2004, was positive. While global markets eroded near the end of the quarter, stock price development during the quarter reflected continued economic expansion in most parts of the world, especially in the Far East. The robust recovery from recessionary forces in place in the U. S. since 2000 is well underway and is an important driver of the export-driven economies of the Far East, including Japan’s. Indications that the long economic recession in Japan may finally be ending are the prime catalysts for the improvement in the Japanese market. With the notable exception of continental Europe, economic and business developments remain encouraging. The Euro’s strength versus the U.S. Dollar last year weakened the competitive position of some European exports. Recent strength in the Dollar may provide some reversal of this negative impact for European exporters.
Evidence is accumulating that inflationary forces will surface as the global economy expands. Monetary and fiscal discipline, along with work force flexibility, will be important as companies manage for productivity and cost containment. This is not well established in some of the most important European countries. Because of the weak Dollar last year, commodity price increases have not occurred to the same extent as in the U.S. This has changed since January as commodity price inflation may have peaked in Dollar terms, but not in Euro terms. Equilibrium pricing for commodities is subject to continuous change, but it appears reasonable in an expanding global economy to expect cost pressures to become more of an issue. Pricing power remains as important as ever for business success.
Though the economic and business environment may be sound, the psychological environment for stocks is challenging. The situation in Iraq, along with global terrorism, is unsettling, but is less of a market focus outside the U.S. For U.S. investors, investing overseas during a period of Dollar weakness has been productive. Nonetheless, our overseas investments are driven by individual company promise and value, not currency prospects. We believe our focused portfolio (about 50 stocks) of unique and financially sound holdings represents attractive businesses with the potential for capital appreciation. Portfolio diversification is broad, as shown in the tables on the following pages, and includes broad geographic participation, including a number of the world’s most dynamic economies. Our holdings in these emerging markets are typically recognized as premiere companies in those markets.
1
Thornburg International Value Fund
Letter to shareholders, Continued
You can learn a good deal more about our investment philosophy and portfolios by visiting our website at http://www.thornburg.com/funds. We include descriptive information on each holding, a link to company websites, up-to-date performance information, and a monthly market commentary.
Thank you for your trust and confidence in investing with us.
Sincerely,
William V. Fries, CFA
Portfolio Manager
Thornburg Investment Management is proud to announce that Bill Fries, manager of the Thornburg International Value Fund, was named Morningstar’s 2003 International Manager of the Year.
2
Thornburg International Value Fund
management’s discussion of performance
March 31, 2004
| International Value Fund | 1Q-04 | 6 Mos. | 1 Yr | 3 Yrs | Inception | ||||||||
|---|---|---|---|---|---|---|---|---|---|---|---|---|---|
| I shares (TGVIX) | NAV | 5.11% | 22.34% | 62 | .94% | 8 | .47% | 8 | .46% | ||||
| 3/30/01 Inception | |||||||||||||
| MSCI EAFE Index (Since 3/30/01) | -- | 4 | .41% | 22.16% | 58 | .15% | 3 | .80% | 3 | .80% | |||
Total returns for periods greater than one year are annualized averages.
There is no up front sales charge for I shares.
Past performance is no guarantee of future results. Current returns may be either lower or higher than those shown. Share prices and returns will fluctuate and investors may experience a loss upon redemption. There is no guarantee that the Fund will meet its objectives. Shares in the Fund carry risks, including possible loss of principal. They are not deposits or obligations of, or guaranteed or endorsed by, any bank, the Federal Deposit Insurance Corporation, the Federal Reserve Board or any government agency.
Carefully consider the Fund’s investment objectives, risks, sales charges, and expenses; this information is found in the prospectus, which is available from your financial advisor or from www.thornburg.com. Read it carefully before you invest or send money.
For month-end performance information, or for information and commentary on Fund holdings, including links to each company’s home page, visit www.thornburg.com.
There are special risk considerations associated with international investing, including fluctuating exchange rates, government regulations and differences in liquidity, which may affect the volatility of the fund.
The Morgan Stanley Capital International (“MSCI”) Europe, Australasia, Far East Index (“EAFE”) is an unmanaged index of over 900 companies, and is a generally accepted benchmark for major overseas markets. Index weightings represent the relative capitalizations of the major overseas markets included in the index on a U.S. dollar adjusted basis. The index is calculated separately; without dividends, with gross dividends reinvested and estimated tax withheld, and with gross dividends reinvested, in both U.S. Dollars and local currency.
Performance
During the quarter ended March 31, 2004, the Thornburg International Value Fund outperformed the MSCI EAFE Index. The Fund was up 5.11% compared to 4.41% for the index. Many of the quarter’s strongest performers are based in Japan. Familymart Co. Ltd. (8028 JP), Bank of Fukuoka Ltd. (8326 JP), Nippon Telegraph & Telephone Corp. (9432 JP), and Toyota Motor Corp. (7203 JP) each made significant contributions to the positive performance of the portfolio. Russian holding Mobile Telesystems (MBT) and Korean holding Samsung Electronics Co. Ltd. (0593 KS) were also exceptional performers. Dr. Reddy’s Laboratories Ltd. ADR (RDY), the Indian pharmaceutical firm, hurt performance, as its stock price suffered as a result of a negative court decision regarding one of its potential generic drugs. Much of the other weakness in the portfolio resulted from European holdings, including Bank of Ireland (BKIR LN), Novartis AG (NVS), and Lloyds TSB Group PLC (LLOYLN).
| Performance Impact during 1st quarter 2004 Top Contributors | Top Detractors | ||
|---|---|---|---|
| Mobile Telesystems | Dr. Reddy's Laboratories Ltd. ADR | ||
| Samsung Electronics Co. Ltd. | ASE Test Ltd. | ||
| Familymart Co. Ltd. | Bank of Ireland | ||
| Bank of Fukuoka Ltd. | Novartis AG | ||
| Nippon Telegraph & Telephone Corp. | Lloyds TSB Group PLC | ||
3
Thornburg International Value Fund
management’s discussion of performance, Continued
Activity
During the quarter, the level of activity in the portfolio was moderate. Six holdings were added and six eliminated. Among the new holdings was Hero Honda Motors Ltd. (6327327), the leading manufacturer of motorcycles in India, the world’s largest and fastest growing motorcycle market. Portugal Telecom SGPS SA (58171890) was also added. This telecommunications company offers a broad line of communications in Portugal, where it maintains a dominant market share in both wireline and mobile communications. In addition, Portugal Telecom holds a 50% interest in the leading Brazilian cellular phone company, Vivo. Other additions were Korea Tobacco & Ginseng Corp (003780), Adidas-Salomon AG (ADS GR), Belgacom SA (BGAOF PK), and Mitsubishi Tokyo Financial Group (8306 JP). Most of the eliminated holdings were sold as they hit target prices. China Life Insurance Co. Ltd. (LFC) was removed for a better risk/reward opportunity found elsewhere, while IHC Caland NV (ICHHF PK) was removed due to deterioration of the fundamentals supporting the investment thesis.
| Activity during 1st Quarter 2004 | |||
|---|---|---|---|
| New Holdings | Eliminated Holdings | ||
| Portugal Telecom SGPS SA | Muhlbauer Holding AG | ||
| Hero Honda Motors Ltd. | NTT DoCoMo Inc. | ||
| Korean Tobacco & Ginseng Corp. | Depfa Bank | ||
| Adidas-Salomon AG | Swedish Match AB | ||
| Belgacom SA | IHC Caland NV | ||
| Mitsubishi Tokyo Financial Group | China Life Insurance Co. Ltd. | ||
| Top 10 Holdings | 12/31/03 | 3/31/04 | |||||
|---|---|---|---|---|---|---|---|
| Novartis AGADR | 2 | .9% | Samsung Electronics Co. Ltd. | 2 | .9% | ||
| Tesco PLC | 2 | .7% | Cadbury Schweppes PLC | 2 | .7% | ||
| Petroleo Brasileiro SA ADR | 2 | .7% | Tesco PLC | 2 | .7% | ||
| Lloyds TSB Group PLC | 2 | .6% | Euronext NV | 2 | .6% | ||
| Cadbury Schweppes PLC | 2 | .6% | Toyota Motor Corp. | 2 | .5% | ||
| ING Groep NV | 2 | .5% | Rogers Communications Inc. | 2 | .5% | ||
| Vodafone Group PLC | 2 | .5% | BP Amoco ADR | 2 | .5% | ||
| Deutsche Boerse AG | 2 | .3% | Burberry Group PLC | 2 | .5% | ||
| Canon Inc. | 2 | .3% | Petroleo Brasileiro SA ADR | 2 | .5% | ||
| BP Amoco ADR | 2 | .3% | Bank of Ireland | 2 | .5% | ||
4
Management’s discussion of performance, Continued
Thornburg International Value Fund
March 31, 2004
Portfolio Diversification
During the quarter modest changes occurred in industry and country diversification. The portfolio is currently diversified across 16 industries. Exposure to the telecommunications industry increased as Mobile Telesystems and Nippon Telegraph and Telephone Corp. performed very well, and Portugal Telecom SGPS SA and Belgacom SA were added to the portfolio. Exposure to consumer durables & apparel increased with the addition of Adidas-Salomon AG. Exposure to the insurance industry decreased with the sale of China Life Insurance Co. Ltd. Representation of materials and capital goods industries also decreased as MMC Norilsk Nickel (NILSY PK), IHC Caland NV and Muhlbauer Holding AG (MBHDF PK) were eliminated. In terms of country diversification, exposure to Japan and South Korea increased due to the strong performance of Japanese holdings Familymart Co. Ltd., Bank of Fukuoka Ltd., Nippon Telegraph & Telephone Corp., and Korean holding Samsung Electronics Co. Ltd. The addition of Korean Tobacco & Ginseng Corp. and Mitsubishi Tokyo Financial Group also increased exposure to Japan and South Korea. Exposure to the Netherlands decreased significantly with the sale of IHC Caland NV and
| Top 10 Industries | 12/31/03 | 3/31/04 | |||||
|---|---|---|---|---|---|---|---|
| Banks | 10 | .0% | Telecommunication Services | 12 | .6% | ||
| Diversified Financials | 9 | .5% | Banks | 10 | .9% | ||
| Telecommunication Services | 8 | .6% | Technology Hardware & Equip. | 8 | .5% | ||
| Automobiles & Components | 8 | .4% | Diversified Financials | 8 | .4% | ||
| Technology Hardware & Equip | 8 | .0% | Automobiles & Components | 8 | .2% | ||
| Media | 8 | .0% | Consumer Durables & Apparel | 7 | .9% | ||
| Pharmaceuticals & Biotechnology | 7 | .5% | Retailing | 6 | .7% | ||
| Energy | 6 | .8% | Energy | 6 | .7% | ||
| Retailing | 5 | .4% | Media | 6 | .5% | ||
| Consumer Durables & Apparel | 5 | .2% | Pharmaceuticals & Biotechnology | 6 | .0% | ||
| Country Exposure | 12/31/03 | 3/31/04 | |||||
|---|---|---|---|---|---|---|---|
| U.K | 21 | .3% | U.K. | 20 | .6% | ||
| Japan | 12 | .2% | Japan | 15 | .7% | ||
| Germany | 8 | .7% | Germany | 8 | .2% | ||
| Canada | 6 | .4% | South Korea | 6 | .8% | ||
| Switzerland | 5 | .3% | Canada | 5 | .8% | ||
| Brazil | 4 | .6% | Brazil | 4 | .4% | ||
| Netherlands | 4 | .2% | Mexico | 4 | .3% | ||
| South Korea | 4 | .2% | Switzerland | 4 | .2% | ||
| Russia | 3 | .9% | India | 2 | .9% | ||
| Taiwan | 3 | .2% | France | 2 | .6% | ||
| France | 2 | .3% | Taiwan | 2 | .6% | ||
| Belgium | 2 | .2% | Ireland | 2 | .4% | ||
| Spain | 2 | .0% | Italy | 2 | .3% | ||
| Italy | 2 | .0% | Portugal | 2 | .3% | ||
| India | 2 | .0% | Hungary | 2 | .3% | ||
| Mexico | 1 | .9% | Russia | 2 | .2% | ||
| Hungary | 1 | .9% | Netherlands | 2 | .1% | ||
| China | 1 | .8% | Belgium | 1 | .9% | ||
| Hong Kong | 1 | .7% | China | 1 | .7% | ||
| Ireland | 1 | .5% | Spain | 1 | .0% | ||
| Sweden | 1 | .0% | Cash | 3 | .7% | ||
| Cash | 5 | .7% | |||||
5
Thornburg International Value Fund
management's discussion of performance, Continued
the poor performance of ING Groep NV (ING). The portfolio is currently diversified across 20 countries. Capitalization exposure of the portfolio did not change significantly.
Capitalization Exposure
6
| Statement of assets and liabilities | |||
|---|---|---|---|
| Thornburg International Value Fund | March 31, 2004 | ||
| (Unaudited) | |||
| ASSETS | |||
| Investments at value (cost $799,726,016) | $ 893,703,607 | ||
| Cash | 890,340 | ||
| Cash denominated in foreign currency (cost $13,905,926) | 14,129,000 | ||
| Receivable for fund shares sold | 10,632,298 | ||
| Unrealized gain on forward exchange contracts (Note 6) | 486,021 | ||
| Dividends receivable | 3,528,756 | ||
| Prepaid expenses and other assets | 99,280 | ||
| Total Assets | 923,469,302 | ||
| LIABILITIES | |||
| Payable for securities purchased | 12,922,270 | ||
| Payable for fund shares redeemed | 142,573 | ||
| Payable to investment advisor (Note 3) | 670,117 | ||
| Deferred tax payable | 23,238 | ||
| Accounts payable and accrued expenses | 568,294 | ||
| Total Liabilities | 14,326,492 | ||
| NET ASSETS | $ 909,142,810 | ||
| NET ASSETS CONSIST OF: | |||
| Undistributed net investment gain (loss) | $ (104,046 | ) | |
| Net unrealized appreciation (depreciation) on investments | 94,481,888 | ||
| Accumulated net realized gain (loss) | (12,059,672 | ) | |
| Net capital paid in on shares of beneficial interest | 826,824,640 | ||
| $ 909,142,810 | |||
| NET ASSET VALUE: | |||
| Class A Shares: | |||
| Net asset value and redemption price per share | |||
| ($574,159,639 applicable to 31,457,725 shares of beneficial interest outstanding - Note 4) | $ 18.25 | ||
| Maximum sales charge, 4.50% of offering price | 0.86 | ||
| Maximum Offering Price Per Share | $ 19.11 | ||
| Class B Shares: | |||
| Net asset value and offering price per share * | |||
| ($14,922,653 applicable to 850,704 shares of beneficial interest outstanding - Note 4) | $ 17.54 | ||
| Class C Shares: | |||
| Net asset value and offering price per share* | |||
| ($157,394,588 applicable to 8,944,511 shares of beneficial interest outstanding - Note 4) | $ 17.60 | ||
| Class I Shares: | |||
| Net asset value, offering, and redemption price per share | |||
| ($160,847,387 applicable to 8,688,861 shares of beneficial interest outstanding - Note 4) | $ 18.51 | ||
| Class R-1 Shares: | |||
| Net asset value, offering, and redemption price per share | |||
| ($1,818,544 applicable to 99,087 shares of beneficial interest outstanding - Note 4) | $ 18.35 | ||
| *Redemption price per share is equal to net asset value less any applicable contingent deferred sales charge | |||
| See notes to financial statements | |||
7
| Statement of Operations | |||
|---|---|---|---|
| Thornburg International Value Fund | Six Months Ended March 31, 2004 | ||
| (Unaudited) | |||
| INVESTMENT INCOME | |||
| Dividend income (net of foreign taxes withheld of $561,243) | $ 4,669,500 | ||
| Interest income | 85,918 | ||
| Other income | 4,665 | ||
| Total Income | 4,760,083 | ||
| EXPENSES | |||
| Investment advisory fees (Note 3) | 2,240,259 | ||
| Administration fees (Note 3) | |||
| Class A Shares | 198,657 | ||
| Class B Shares | 6,144 | ||
| Class C Shares | 59,993 | ||
| Class I Shares | 23,649 | ||
| Class R-1 Shares | 365 | ||
| Distribution and service fees (Note 3) | |||
| Class A Shares | 406,240 | ||
| Class B Shares | 50,542 | ||
| Class C Shares | 479,245 | ||
| Class R-1 Shares | 1,524 | ||
| Transfer agent fees | |||
| Class A Shares | 139,000 | ||
| Class B Shares | 12,658 | ||
| Class C Shares | 57,845 | ||
| Class I Shares | 23,142 | ||
| Class R-1 Shares | 1,696 | ||
| Registration & filing fees | |||
| Class A Shares | 5,759 | ||
| Class B Shares | 3,806 | ||
| Class C Shares | 4,452 | ||
| Class I Shares | 4,899 | ||
| Class R-1 Shares | 7,794 | ||
| Custodian fees (Note 3) | 173,487 | ||
| Professional fees | 22,415 | ||
| Accounting fees | 7,780 | ||
| Trustee fees | 3,495 | ||
| Other expenses | 51,690 | ||
| Total Expenses | 3,986,536 | ||
| Less: | |||
| Expenses reimbursed by investment advisor (Note 3) | (51,799 | ) | |
| Expenses paid indirectly (Note 3) | (8,877 | ) | |
| Net Expenses | 3,925,860 | ||
| Net Investment Income | $ 834,223 | ||
8
| Statement of operations, continued | |||
|---|---|---|---|
| Thornburg International Value Fund | Six Months Ended March 31, 2004 | ||
| (Unaudited) | |||
| REALIZED AND UNREALIZED GAIN (LOSS) | |||
| Net realized gain (loss) on: | |||
| Investments | $ 15,702,080 | ||
| Foreign currency transactions | (3,314,336 | ) | |
| -- | 12,387,744 | ||
| Net change in unrealized appreciation (depreciation) on: | |||
| Investments | 64,879,968 | ||
| Foreign currency translation | 1,333,171 | ||
| -- | 66,213,139 | ||
| Net Realized and Unrealized | |||
| Gain (Loss) on Investments | 78,600,883 | ||
| Net Increase (Decrease) in Net Assets Resulting | |||
| From Operations | $ 79,435,106 | ||
| See notes to financial statements | |||
9
| Statements of Changes in net assets | |||||
|---|---|---|---|---|---|
| Thornburg International Value Fund | |||||
| Six Months Ended March 31, 2004 | Year Ended September 30, 2003 | ||||
| INCREASE (DECREASE) IN NET ASSETS FROM: | |||||
| OPERATIONS: | |||||
| Net investment income gain (loss) | $ 834,223 | $ 448,338 | |||
| Net realized gain (loss) on investments and foreign currency | |||||
| transactions | 12,387,744 | (11,991,488 | ) | ||
| Increase (Decrease) in unrealized appreciation (depreciation) | |||||
| on investments and foreign currency translation | 66,213,139 | 46,112,063 | |||
| Net Increase (Decrease) in Net Assets | |||||
| Resulting from Operations | 79,435,106 | 34,568,913 | |||
| FUND SHARE TRANSACTIONS - (Note 4) | |||||
| Class A Shares | 429,056,964 | 11,087,620 | |||
| Class B Shares | 6,916,689 | 485,325 | |||
| Class C Shares | 86,216,835 | 5,432,349 | |||
| Class I Shares | 112,453,256 | 8,371,956 | |||
| Class R-1 Shares | 1,773,862 | 75 | |||
| Net Increase (Decrease) in Net Assets | 715,852,712 | 59,946,238 | |||
| NET ASSETS: | |||||
| Beginning of period | 193,290,098 | 133,343,860 | |||
| End of period | $909,142,810 | $ 193,290,098 | |||
| See notes to financial statements | |||||
10
Thornburg International Value Fund
Notes to financial statements
NOTE 1 – ORGANIZATION Thornburg International Value Fund, hereinafter referred to as the “Fund,” is a diversified series of Thornburg Investment Trust (the “Trust”). The Trust was organized as a Massachusetts business trust under a Declaration of Trust dated June 3, 1987 and is registered as a diversified, open-end management investment company under the Investment Company Act of 1940, as amended. The Trust is currently issuing nine series of shares of beneficial interest in addition to those of the Fund: Thornburg Limited Term U.S. Government Fund, Thornburg New Mexico Intermediate Municipal Fund, Thornburg Intermediate Municipal Fund, Thornburg Limited Term Income Fund, Thornburg Florida Intermediate Municipal Fund, Thornburg Value Fund, Thornburg Core Growth Fund, Thornburg New York Intermediate Municipal Fund, and Thornburg Investment Income Builder Fund. Each series is considered to be a separate entity for financial reporting and tax purposes and bears expenses directly attributable to it. The Fund seeks long-term capital appreciation by investing in both foreign and domestic equity securities selected on a value basis.
The Fund currently offers five classes of shares of beneficial interest, Class A, Class B, Class C, Institutional Class (Class I) and Retirement Class (Class R-1) shares. Each class of shares of a Fund represents an interest in the same portfolio of investments of the Fund, except that (i) Class A shares are sold subject to a front-end sales charge collected at the time the shares are purchased and bear a service fee, (ii) Class B shares are sold at net asset value without a sales charge at the time of purchase, but are subject to a contingent deferred sales charge upon redemption and bear both a service fee and distribution fee, (iii) Class C shares are sold at net asset value without a sales charge at the time of purchase, but are subject to a contingent deferred sales charge upon redemption within one year, and bear a service fee and a distribution fee, (iv) Class I shares are sold at net asset value without a sales charge at the time of purchase, (v) Class R-1 shares are sold at net asset value without a sales charge at the time of purchase, but bear both a service fee and distribution fee, and (vi) the respective classes have different reinvestment privileges. Additionally, the Fund may allocate among its classes certain expenses, to the extent allowable to specific classes, including transfer agent fees, government registration fees, certain printing and postage costs, and administrative and legal expenses. Currently, class specific expenses of the Fund are limited to service and distribution fees, administration fees and certain registration and transfer agent expenses. Class B shares of the Fund outstanding for eight years will convert to Class A shares of the Fund.
NOTE 2 – SIGNIFICANT ACCOUNTING POLICIES Significant accounting policies of the Funds are as follows:
Valuation of Securities: In determining net asset value, investments are stated at value based on latest sales prices, normally at 4:00 pm EST reported on national securities exchanges on the last business day of the period. Investments for which no sale is reported are valued at the mean between bid and asked prices. Securities for which market quotations are not readily available are valued at fair value as determined by management and approved in good faith by the Board of Trustees. Short term obligations having remaining maturities of 60 days or less are valued at amortized cost, which approximates market value.
Foreign Currency Translation: Portfolio securities and other assets and liabilities denominated in foreign currencies are translated into U.S. dollars based on the exchange rate of such currencies against the U.S. dollar on the date of valuation. Purchases and sales of securities and income items denominated in foreign currencies are translated into U.S. dollars at the exchange rate in effect on the translation date. When the Fund purchases or sells foreign securities it will customarily enter into a foreign exchange contract to minimize foreign exchange risk from the trade date to the settlement date of such transactions.
The Fund does not separately report the effect of changes in foreign exchange rates from changes in market prices on securities held. Such changes are included in net realized and unrealized gain or loss from investments.
Reported net realized foreign exchange gains or losses arise from sales of foreign currencies, currency gains or losses realized between the trade and settlement dates on securities transactions and the difference between the amount of interest recorded on the Fund’s books, and the U.S. dollar equivalent of the amounts actually received or paid.
Federal Income Taxes: It is the policy of the Fund to comply with the provisions of the Internal Revenue Code applicable to “regulated investment companies” and to distribute all of its taxable income to its shareholders. Therefore, no provision for Federal income tax is required.
When-Issued and Delayed Delivery Transactions: The Fund may engage in when-issued or delayed delivery transactions. To the extent the Fund engages in such transactions, it will do so for the purpose of acquiring portfolio securities consistent with its investment objectives and not for the purpose of investment leverage or to speculate on market changes. At the time the Fund makes a commitment to purchase a security on a when-issued basis, it will record the transaction and reflect the value in determining its net asset value. When effecting such transactions, assets of the Fund of an amount sufficient to make payment for the portfolio securities to be purchased will be segregated on the Fund’s records on the trade date.
11
Notes to financial statements, continued
Thornburg International Value Fund
March 31, 2004
Dividends: Dividends to shareholders are generally paid quarterly and are reinvested in additional shares of the Fund at net asset value per share at the close of business on the dividend payment date, or at the shareholder’s option, paid in cash. Net realized capital gains, to the extent available, will be distributed at least annually. Distributions to shareholders are based on income tax regulations and therefore, their characteristics may differ for financial statement and tax purposes.
General: Securities transactions are accounted for on a trade date basis. Interest income is accrued as earned and dividend income is recorded on the ex-dividend date. Certain income from foreign securities is recognized as soon as information is available to the Fund. Realized gains and losses from the sale of securities are recorded on an identified cost basis. Net investment income, other than class specific expenses, and realized and unrealized gains and losses, are allocated daily to each class of shares based upon the relative net asset value of outstanding shares of each class of shares at the beginning of the day (after adjusting for the current share activity of the respective class). Expenses common to all funds are allocated among the funds comprising the Trust based upon their relative net asset values or other appropriate allocation methods.
Guarantees and Indemnifications: Under the Trust’s organizational documents, its officers and trustees are indemnified against certain liability arising out of the performance of their duties to the Fund. Additionally, in the normal course of business the Trust enters into contracts with service providers that contain general indemnification clauses. The Trust’s maximum exposure under these arrangements is unknown. However, based on experience, the Trust expects the risk of loss to be remote.
Use of Estimates: The preparation of financial statements, in conformity with generally accepted accounting principles, requires management to make estimates and assumptions that affect the reported amounts of assets and liabilities and the disclosure of contingent assets and liabilities at the date of the financial statements and the reported amounts of increases and decreases in net assets from operations during the reporting period. Actual results could differ from those estimates.
NOTE 3 — INVESTMENT ADVISORY FEE AND OTHER TRANSACTIONS WITH AFFILIATES
Pursuant to an investment advisory agreement, Thornburg Investment Management, Inc. (the “Advisor”) serves as the investment advisor and performs services to the Fund for which the fees are payable at the end of each month. For the period ended March 31, 2004, these fees were payable at annual rates ranging from .875 of 1% to .675 of 1% of the average daily net assets of the Fund depending on the Fund’s asset size. The Fund also has an administrative services agreement
with the Advisor, whereby the Advisor will perform certain administrative services for the shareholders of each class of the Fund’s shares, and for which fees will be payable at an annual rate of up to .125 of 1% of the average daily net assets attributable to each class of shares. For the period ended March 31, 2004, the Advisor voluntarily reimbursed certain class specific expenses and administrative fees of $3,779 for Class B shares, $38,119 for Class I shares, and $9,901 for Class R-1 shares.
The Fund has an underwriting agreement with Thornburg Securities Corporation (the “Distributor”), which acts as the Distributor of the Fund’s shares. For the period ended March 31, 2004, the Distributor has advised the Fund that it earned net commissions aggregating $134,989 from the sale of Class A shares of the Fund, and collected contingent deferred sales charges aggregating $5,739 from redemptions of Class C shares of the Fund.
Pursuant to a service plan under Rule 12b-1 of the Investment Company Act of 1940, the Fund may reimburse to the Advisor an amount not to exceed .25 of 1% per annum of its average daily net assets attributable to each class of shares of the Fund for payments made by the Advisor to securities dealers and other financial institutions to obtain various shareholder related services. The Advisor may pay out of its own resources additional expenses for distribution of the Fund’s shares.
The Fund has also adopted distribution plans pursuant to Rule 12b-1, applicable only to the Fund’s Class B, Class C and Class R-1 shares under which the Fund compensates the Distributor for services in promoting the sale of Class B, Class C and Class R-1 shares of the Fund at an annual rate of up to .75 of 1% of the average daily net assets attributable to Class B, Class C and Class R-1 shares. Total fees incurred by each class of shares of the Fund under their respective Service and Distribution Plans for the period ended March 31, 2004 are set forth in the Statement of Operations.
The Fund has an agreement with the custodian bank to indirectly pay a portion of the custodian’s fees through credits earned by the Fund’s cash on deposit with the bank. This deposit agreement is an alternative to overnight investments. Custodial fees have been adjusted to reflect amounts that would have been paid without this agreement, with a corresponding adjustment reflected as fees paid indirectly in the statement of operations. For the period ended March 31, 2004 fees paid indirectly were $8,877.
Certain officers and trustees of the Trust are also officers and/or directors of the Advisor and Distributor. The compensation of unaffiliated trustees is borne by the Trust.
12
Thornburg International Value Fund
Notes to financial statements, continued
March 31, 2004
NOTE 4 — SHARES OF BENEFICIAL INTEREST
At March 31, 2004, there were an unlimited number of shares of beneficial interest authorized. Sales of R-1 shares commenced July 1, 2003. Transactions in shares of beneficial interest were as follows:
| Period Ended March 31, 2004 | Year Ended September 30, 2003 | ||||||||
|---|---|---|---|---|---|---|---|---|---|
| Shares | Amount | Shares | Amount | ||||||
| Class A Shares | |||||||||
| Shares sold | 26,680,365 | $ 459,950,461 | 3,378,754 | $ 44,006,739 | |||||
| Shares repurchased** | (1,777,473 | ) | (30,893,497 | ) | (2,671,582 | ) | (32,919,119 | ) | |
| Net Increase (Decrease) | 24,902,892 | $ 429,056,964 | 707,172 | $ 11,087,620 | |||||
| ** The Fund charges a redemption fee of 1% of the Class A shares exchanged within 90 days of purchase. For the year ended September 30, 2003 and period ended March 31, 2004, $55,020 and $19,654, respectively, were netted in the amount reported for shares repurchased | |||||||||
| Class B Shares | |||||||||
| Shares sold | 431,966 | $ 7,276,362 | 136,594 | $ 1,695,976 | |||||
| Shares repurchased | (21,132 | ) | (359,673 | ) | (100,676 | ) | (1,210,651 | ) | |
| Net Increase (Decrease) | 410,834 | $ 6,916,689 | 35,918 | $ 485,325 | |||||
| Class C Shares | |||||||||
| Shares sold | 5,466,682 | $ 92,125,551 | 1,397,752 | $ 17,554,897 | |||||
| Shares repurchased | (354,538 | ) | (5,908,716 | ) | (1,014,225 | ) | (12,122,548 | ) | |
| Net Increase (Decrease) | 5,112,144 | $ 86,216,835 | 383,527 | $ 5,432,349 | |||||
| Class I Shares | |||||||||
| Shares sold | 6,665,536 | $ 115,851,708 | 1,169,448 | $ 15,121,898 | |||||
| Shares repurchased** | (191,924 | ) | (3,398,452 | ) | (558,936 | ) | (6,749,942 | ) | |
| Net Increase (Decrease) | 6,473,612 | $ 112,453,256 | 610,512 | $ 8,371,956 | |||||
| ** The Fund charges a redemption fee of 1% of the Class I shares exchanged within 90 days of purchase. For the year ended September 30, 2003 and period ended March 31, 2004, $7,078 and $6,372, respectively, were netted in the amount reported for shares repurchased | |||||||||
| Class R-1 Shares | |||||||||
| Shares sold | 116,055 | $ 2,078,378 | 5 | $ 75 | |||||
| Shares repurchased | (16,973 | ) | (304,516 | ) | -- | -- | |||
| Net Increase (Decrease) | 99,082 | $ 1,773,862 | 5 | $ 75 | |||||
13
Thornburg International Value Fund
Notes to financial statements, continued
March 31, 2004
NOTE 5 – SECURITIES TRANSACTIONS
For the period ended March 31, 2004, the Fund had purchase and sale transactions of investment securities (excluding short term securities) of $671,597,884 and $79,498,629, respectively.
NOTE 6 – INCOME TAXES
At March 31, 2004, information on the tax components of capital is as follows:
| Cost of investments for tax purpose | $ 799,931,484 | ||
| Gross unrealized appreciation on a tax basis | $ 97,237,935 | ||
| Gross unrealized depreciation on a tax basis | (3,465,812 | ) | |
| Net unrealized appreciation | |||
| (depreciation) on investments (tax basis) | $ 93,772,123 | ||
At March 31, 2004, the Fund had tax basis capital losses, which may be carried over to offset future capital gains. Such losses expire as follows:
| Capital loss carryovers expiring in: | |||
|---|---|---|---|
| 2007 | $ 119,008 | ||
| 2008 | 272,996 | ||
| 2009 | 917,688 | ||
| 2010 | 3,523,281 | ||
| 2011 | 9,267,675 | ||
| -- | $14,100,648 | ||
As of March 31, 2004 the Fund had deferred currency and capital losses occurring subsequent to October 31, 2002 of $1,725,498 and $10,141,290, respectively. For tax purposes, such losses will be reflected in the year ending September 30, 2004.
Unutilized tax basis capital losses may be carried forward to offset realized gains in future years. To the extent such carry forwards are used in future years, capital gain distributions may be reduced to the extent provided by regulations.
Net investment income and net realized gain (loss) differ for financial statement and tax purposes primarily due to differing treatments of wash sale losses, foreign currency transactions and losses realized subsequent to October 31 on the sale of securities and foreign currencies.
NOTE 7 – FINANCIAL INSTRUMENTS WITHOFF-BALANCE
SHEET RISK
During the period ended March 31, 2004, the Fund was a party to financial instruments with off-balance sheet risks, primarily currency forward exchange contracts. A forward exchange contract is an agreement between two parties to exchange different currencies at a specified rate at an agreed upon future date. These contracts are purchased in order to minimize the risk to the Fund with respect to its foreign stock transactions from adverse changes in the relationship between the U.S. dollar and foreign currencies. In each case these contracts have been initiated in conjunction with foreign stock transactions. These instruments may involve market risks in excess of the amount recognized on the Statement of Assets and Liabilities. Such risks would arise from the possible inability of counterparties to meet the terms of their contracts, future movement in currency value and interest rates and contract positions that are not exact offsets. These contracts are reported in the financial statements at the Fund’s net equity, as measured by the difference between the forward exchange rates at the reporting date and the forward exchange rates at the dates of entry into the contract.
CONTRACTS TO SELL:
| 56,000,000 | Mexican Peso for 4,819,692 USD, June 18, 2004 | $ (136,420) |
| Unrealized loss from forward exchange contracts. | (136,420) | |
| 15,000,000 | Euro Dollar for 18,952,500 USD, August 10, 2004 | 569,677 |
| 41,000,000 | Mexican Peso for 3,670,875 USD, July 09, 2004 | 52,764 |
| Unrealized gain from forward exchange contracts. | 622,441 | |
| Net unrealized gain (loss) from forward exchange contracts | $ 486,021 |
14
| Financial highlights | ||||
|---|---|---|---|---|
| Thornburg International Value Fund | ||||
| Six Months Ended March 31, | Year Ended | September 30, | Period Ended September 30, | |
| 2004 | 2003 | 2002 | 2001(c) | |
| Class I Shares: | ||||
| Per Share Performance | ||||
| (for a share outstanding throughout the period)+ | ||||
| Net asset value, beginning of period | $ 15.13 | $ 11.96 | $ 12.40 | $ 14.63 |
| Income from investment operations: | ||||
| Net investment income | 0.07 | 0.14 | 0.10 | 0.11 |
| Net realized and unrealized | ||||
| gain (loss) on investments | 3.31 | 3.03 | (0.54) | (2.21) |
| Total from investment operations | 3.38 | 3.17 | (0.44) | (2.10) |
| Less dividends from: | ||||
| Net investment income | -- | -- | -- | (0.08) |
| In excess of net investment income | -- | -- | -- | (0.05) |
| Total dividends | -- | -- | -- | (0.13) |
| Change in net asset value | 3.38 | 3.17 | (0.44) | (2.23) |
| Net asset value, end of period | $ 18.51 | $ 15.13 | $ 11.96 | $ 12.40 |
| Total return (a) | 22.34% | 26.51% | (3.55)% | (14.50)% |
| Ratios/Supplemental Data | ||||
| Ratios to average net assets: | ||||
| Net investment income | 0.80% (b) | 1.07% | 0.71% | 1.57%(b) |
| Expenses, after expense reductions | 0.99% (b) | 0.99% | 0.99% | 0.97%(b) |
| Expenses, after expense reductions | ||||
| and net of custody credits | 0.99% (b) | 0.99% | 0.99% | -- |
| Expenses, before expense reductions | 1.07% (b) | 1.25% | 1.28% | 1.38%(b) |
| Portfolio turnover rate | 15.79% | 58.35% | 28.39% | 61.05% |
| Net assets at end of period (000) | $ 160,847 | $ 33,511 | $ 19,187 | $ 11,249 |
(a) Not annualized for periods less than one year.
(b) Annualized.
(c) Effective date of Class I Shares was March 30, 2001.
+ Based on weighted average shares outstanding.
15
| Schedule of investments | ||||||||
|---|---|---|---|---|---|---|---|---|
| Thornburg International Value Fund | March 31, 2004 | |||||||
| CUSIPS: CLASS A - 885-215-657, CLASS B - 885-215-616, CLASS C - 885-215-640, CLASS I - 885-215-566, CLASS R-1 - 885-215-525 NASDAQ SYMBOLS: CLASS A - TGVAX, CLASS B - THGBX, CLASS C - THGCX, CLASS I - TGVIX, CLASS R-1 - TGVRX | ||||||||
| Shares | Value | |||||||
| COMMON STOCKS-- 96.30% | ||||||||
| AUTOMOBILES & COMPONENTS (8.20%) | ||||||||
| Bayerische Motoren Werke AG | 202,505 | $ | 8,237,071 | |||||
| Hero Honda Motors Ltd. | 1,269,300 | 14,360,512 | ||||||
| Hyundai Motor Co. | 379,600 | 17,350,116 | ||||||
| Magna International Inc. | 136,900 | 10,842,480 | ||||||
| Toyota Motor Corp. | 610,200 | 22,724,730 | ||||||
| BANKS (10.90%) | ||||||||
| Bank of Fukuoka Ltd. | 4,392,500 | 21,923,502 | ||||||
| Bank of Ireland | 1,761,200 | 21,995,948 | ||||||
| HSBC Holdings PLC ADR | 235,800 | 17,637,840 | ||||||
| Lloyds TSB Group PLC | 2,447,100 | 18,623,082 | ||||||
| Mitsubishi Tokyo Financial Group | 1,700 | 16,806,642 | ||||||
| CAPITAL GOODS (2.20%) | ||||||||
| Boskalis Westminster Groep NV | 81,380 | 2,175,791 | ||||||
| Embraer Brasileira de Aeronaut | 295,895 | 2,392,408 | ||||||
| Embraer Brasileira de Aeronaut ADR | 456,955 | 14,668,255 | ||||||
| CONSUMER DURABLES & APPAREL (7.90%) | ||||||||
| Adidas-Salomon AG | 183,400 | 21,336,067 | ||||||
| Burberry Group PLC | 3,359,819 | 22,059,933 | ||||||
| Hugo Boss AG | 321,603 | 6,922,238 | ||||||
| Merloni Elettrodomestici S.P.A | 1,149,600 | 20,518,882 | ||||||
| DIVERSIFIED FINANCIALS (8.40%) | ||||||||
| Almanij NV | 264,839 | 16,066,061 | ||||||
| Deutsche Boerse AG | 341,024 | 19,354,641 | ||||||
| Euronext NV | 772,860 | 23,038,430 | ||||||
| ING Groep NV | 757,300 | 16,644,693 | ||||||
| ENERGY (6.70%) | ||||||||
| BP Amoco ADR | 432,700 | 22,154,240 | ||||||
| CNOOC Ltd. ADR | 361,400 | 15,540,200 | ||||||
| Petroleo Brasileiro SA ADR | 656,800 | 22,002,800 | ||||||
| FOOD BEVERAGE & TOBACCO (4.70%) | ||||||||
| Cadbury Schweppes PLC | 3,076,600 | 24,291,406 | ||||||
| Korean Tobacco & Ginseng Corp. | 789,100 | 18,136,670 | ||||||
| FOOD & DRUG RETAILING (2.70%) | ||||||||
| Tesco PLC | 5,368,153 | 24,279,668 | ||||||
| INSURANCE (0.70%) | ||||||||
| Alea Group Holdings Ltd. | 1,514,600 | 6,690,114 | ||||||
| MATERIALS (1.70%) | ||||||||
| Givaudan AG | 30,625 | 15,635,727 | ||||||
| MEDIA (6.50%) | ||||||||
| Pearson PLC | 706,600 | 8,043,363 | ||||||
| Promotora De Informaciones SA | 497,885 | 8,849,885 | ||||||
| Rogers Communications Inc. | 1,202,000 | $ | 22,477,579 | |||||
| Shaw Communications | 1,132,000 | 18,619,700 | ||||||
| PHARMACEUTICALS & BIOTECHNOLOGY (6.00%) | ||||||||
| Bachem Holding AG | 63,188 | 3,365,705 | ||||||
| Doctor Reddys Laboratories Ltd. ADR | 470,400 | 11,266,080 | ||||||
| Gedeon Richter RT | 179,143 | 20,180,140 | ||||||
| Novartis AG ADR | 432,900 | 18,441,540 | ||||||
| RETAILING (6.70%) | ||||||||
| FamilyMart Co. Ltd. | 616,400 | 18,932,476 | ||||||
| Kingfisher PLC | 3,725,375 | 19,780,631 | ||||||
| Wal-Mart de Mexico | 6,912,400 | 21,030,614 | ||||||
| TECHNOLOGY - HARDWARE & EQUIPMENT (8.50%) | ||||||||
| ASE Test Ltd + | 1,034,956 | 11,384,516 | ||||||
| Canon Inc. | 373,200 | 19,307,463 | ||||||
| Nec Electronics Corp. | 253,400 | 19,457,695 | ||||||
| Samsung Electronics Co. Ltd. | 51,100 | 25,495,399 | ||||||
| TELECOMMUNICATION SERVICES (12.60%) | ||||||||
| America Movil S.A. de C.V | 457,400 | 17,678,510 | ||||||
| Belgacom SA | 35,000 | 1,105,711 | ||||||
| Chunghwa Telecom Co. Ltd. ADR | 649,100 | 11,495,561 | ||||||
| Mobile Telesystems ADR | 149,700 | 19,685,550 | ||||||
| Nippon Telegraph & Telephone Corp. | 3,788 | 21,451,456 | ||||||
| Portugal Telecom SGPS SA | 1,814,300 | 20,295,081 | ||||||
| Vodafone Group PLC | 862,500 | 2,043,764 | ||||||
| Vodafone Group PLC ADR | 792,500 | 18,940,750 | ||||||
| TRANSPORTATION (1.90%) | ||||||||
| Fraport AG + | 624,804 | 17,265,550 | ||||||
| TOTAL COMMON STOCKS (Cost $767,027,274) | -- | 861,004,866 | ||||||
| SHORT TERM INVESTMENTS-- 3.70% | ||||||||
| American General Finance Corp., 1.07% due 4/2/2004 | 6,000,000 | 5,999,821 | ||||||
| American General Finance Corp., 1.08% due 4/7/2004 | 6,000,000 | 5,998,920 | ||||||
| International Business Machines, 0.95% due 4/1/2004 | 15,000,000 | 15,000,000 | ||||||
| USAA Capital Corp., 1.01% due 4/1/2004 | 5,700,000 | 5,700,000 | ||||||
| TOTAL SHORT TERM INVESTMENTS (Cost $32,698,742) | -- | 32,698,741 | ||||||
| TOTAL INVESTMENTS (100%) (Cost $799,726,016) | -- | $ | 893,703,607 | |||||
| + Non-income producing See notes to financial statement | ||||||||
17
March 31, 2004
Thornburg International Value Fund
Index Comparison
The chart below compares performance of Thornburg International Value Fund and the Morgan Stanley Capital International (MSCI) Europe, Australia and Far East Index (EAFE) for the period March 30, 2001 to March 31, 2004. Past performance of the Index and the Fund may not be indicative of future performance. The performance data and graph do not reflect the deduction of taxes that a shareholder would pay on distributions or the redemption of Fund shares.
Thornburg International Value Fund Class I Total Returns,Since
3/30/01, versus MSCI EAFE Index
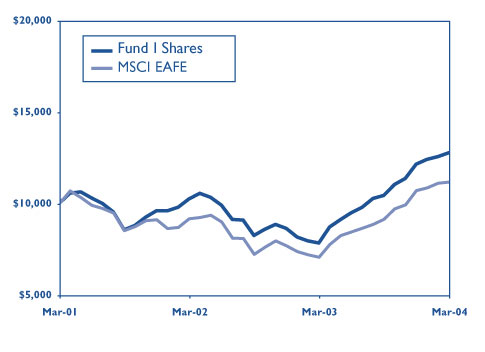
Class I Shares Average Annual Total Returns(periods ending 3/31/04)
| 1 Year: | 62.94% |
| 3 Years: | 8.47% |
| From Inception (3/30/01): | 8.46% |
There is no up front sales charge for I shares.
Past performance is no guarantee of future results. Current returns may be either lower or higher than those shown. Share prices and returns will fluctuate and investors may experience a loss upon redemption. There is no guarantee that the Fund will meet its objectives. Shares in the Fund carry risks, including possible loss of principal.
Carefully consider the Fund’s investment objectives, risks, sales charges, and expenses; this is found in the prospectus, which is available from your financial advisor or from www.thornburg.com. Read it carefully before you invest or send money.
For month-end performance information, or for information and commentary on Fund holdings, including links to each company’s home page, visit www.thornburg.com.
The Morgan Stanley Capital International (“MSCI”) Europe, Australasia, Far East Index (“EAFE”) is an unmanaged index of over 900 companies, and is a generally accepted benchmark for major overseas markets. Index weightings represent the relative capitalizations of the major overseas markets included in the index on a U.S. dollar adjusted basis. The index is calculated separately; without dividends, with gross dividends reinvested and estimated tax withheld, and with gross dividends reinvested, in both U.S. Dollars and local currency.
There are special risk considerations associated with international investing, including fluctuating exchange rates, government regulations and differences in liquidity, which may affect the volatility of the Fund.
Unless otherwise noted, index returns reflect the reinvestment of income dividends and capital gains, if any, but do not reflect fees, brokerage commissions or other expenses of investing. Investors may not make direct investments into any index.
18
Thornburg International Value Fund
Portfolio proxy voting
March 31, 2004
Policies and Procedures (Unaudited):
The Trust has delegated to Thornburg Investment Management, Inc. (“the Advisor”) voting decisions respecting proxies for the Fund’s voting securities. The Advisor makes voting decisions in accordance with its Proxy Voting Policy and Procedures. A description of the policy and Procedures is available (i) without charge, upon request, by calling the Advisor toll-free at 1.800.847.0200, (ii) on the Thornburg website at www.thornburg.com, and (iii) on the Securities and Exchange Commission’s website at www.sec.gov.
Commencing August 31, 2004, information regarding how proxies were voted will be available on or before August 31 of each year for the twelve months ending the preceding June 30. This information will be available (i) without charge, upon request, on the Thornburg website at www.thornburg.com and (ii) on the Securities and Exchange Commission’s website at www.sec.gov.
19
Investment Manager Thornburg Investment Management, Inc.
119 East Marcy Street
Santa Fe, New Mexico 87501
800.847.0200
Principal Underwriter Thornburg Securities Corporation
119 East Marcy Street
Santa Fe, New Mexico 87501
800.847.0200
This report is submitted for the general information of shareholders of the Fund. It is not authorized for distribution to prospective investors in the Fund unless preceded or accompanied by an effective prospectus. Carefully consider information in the prospectus regarding the Fund’s investment objectives and policies, risks, sales charges, expenses, experience of its management, marketability of shares, and other information. Performance data quoted represent past performance and do not guarantee future results.
www.thornburg.com
Thornburg Core Growth Fund
Semi-Annual Report March 31, 2004
Thornburg Core Growth Fund
Letter to shareholders
Dear Fellow Shareholder:
The Thornburg Core Growth Fund generated solid results in the first quarter of this year. We outperformed each of our target benchmarks: the Nasdaq Composite Index and the Russell 1000 Growth Index. Unfortunately, we underperformed our peer group, the Lipper Multi-Cap Growth Fund Universe. Since the fund started in late 2000, we have had consistent success relative to the benchmarks and our peer group. In March, the Fund was recognized by Lipper for its ability to generate attractive, consistent, risk-adjusted returns compared to its peer group.
Financials and foreign stocks were strong contributors to performance in the first quarter. Affiliated Managers Group (AMG), a long-time holding, continued to benefit from the positive trends in the equity market. Capital One Financial (COF) has done an excellent job of executing on their business model and has benefited recently from improving charge-offs. Another long time holding, Amdocs Ltd (DOX) continues to prosper at the expense of its competition. A similar trend exists at Samsung Electronics Co. (05930 KS), where the company has been successful in taking market share in several markets, most noticeably the cell phone handset market.
Technology was a tough sector for the Fund in the first quarter. Our worst performers—Novellus Systems (NVLS) and ASE Test (ASTSF)—are both involved in the process of semiconductor manufacturing. Novellus manufactures capital equipment and ASE Test performs packaging and testing on an outsourced basis. Concerns over valuation and mixed data points increased the volatility of semiconductor related stocks during the quarter.
During the quarter, we added several new holdings, which include Guidant (GDT), NII Holdings (NIHD), August Technology (AUGT), Hero Honda Motors (HH.IN), Atheros Communications (ATHR), Ditech Communications (DITC), NetEase.com (NTES), and Semiconductor Manufacturing International (SMI) to the portfolio. Since our investment process is research- intensive, we continue to stay abreast of developments in companies that we have owned in the past but have sold due to valuation or other concerns that may have now been remedied. In the first quarter, we purchased three previously owned stocks: Amgen (AMGN), Silicon Laboratories (SLAB), and eResearch Technology (ERES). Sales during the quarter included Circuit City Stores (CC), Clear Channel Communications
| Total return performance as of 3/31/04 | ||||||||||
|---|---|---|---|---|---|---|---|---|---|---|
| A Shares | C Shares | |||||||||
| Qtr Ended 3/31/04 | 6 Mos. | 1 Year | 3 Years | Since Inception | Qtr Ended 3/31/04 | 6 Mos. | 1 Year | 3 Years | Since Inception | |
| Net Asset Value | 0.64% | 8.70% | 51.38% | 6.07% | (2.51)% | 0.47% | 8.32% | 50.07% | 5.07% | (3.39)% |
| Maximum Offering Price | (3.85)%* | 3.78% | 44.61% | 4.47% | (3.87)% | (0.53)%* | 7.32* | 49.07%* | 5.07% | (3.39)% |
*Assumes redemption within the period.
Total returns for periods greater than one year are annualized averages. Inception of Class A and C: 12/27/00
The maximum sales charge for the Fund's A shares is 4.50%. C shares include a 1% CDSC for the first year only. Past performance is no guarantee of future results. Current returns may be either lower or higher than those shown. Share prices and returns will fluctuate and investors may experience a loss upon redemption. There is no guarantee that the Fund will meet its objectives. Shares in the Fund carry risks, including possible loss of principal. Carefully consider the Fund's investment objectives, risks, sales charges, and expenses; this information is found in the prospectus, which is available from your financial advisor or from www.thornburg.com. Read it carefully before you invest or send money. For month-end performance information, or for information and commentary on Fund holdings, including links to each company's home page, visit www.thornburg.com.
1
(CCU), Integrated Circuit Systems (ICST), Johnson & Johnson (JNJ), Lexar Media (LEXR), Quiksilver (ZQK), Ross Stores (ROST), LeapFrog (LF), Microsoft (MSFT), and UT Starcom (UTSI). Two positions purchased and then subsequently sold were Ceradyne (CRON) and Siebel Systems (SEBL).
Amdocs Ltd. has been a long-term success story for the Fund. The Fund owned this stock near inception, but sold the stock when it hit its target price. Amdocs was repurchased initially in November of 2002 (there have been subsequent purchases as the fund has grown to maintain our target exposure). Five quarters ago, Amdocs Ltd. was selling at around 12 times cash flow, which appeared to be an excellent valuation for a company that was widely considered to be the market leader in selling billing and customer care software to leading telecommunications service providers. At the time of purchase, revenues were declining slightly, but they are now growing modestly. Billing applications are critical to phone companies--if these companies cannot produce a timely and accurate bill, their business is in jeopardy. Our research did not indicate when phone companies would again invest in this critical area, but it did support the thesis that, at some point, spending increases would again be the norm. Fortunately, both the value of the Amdocs Ltd. franchise and the necessity of their products have been more clearly recognized over the past year.
The Thornburg Core Growth Fund rose 0.64% in the first quarter, and increased 51.4% during the past twelve months. This compares with a 0.35% first-quarter decline in the Nasdaq Composite, and a 49.4% rise over the trailing twelve months. The Russell 1000 Growth rose 0.54% in the first quarter and was up 30.1% for the past twelve months.
Initial public offerings contributed 0.02% of total return to the Fund during the first quarter. As of the end of the quarter, no shares received on their initial offering during the first quarter had been sold. The effects of offerings in prior periods are disclosed in prior quarterly reports
Our motto is Core Strategies for Serious Investors. We believe the Thornburg Core Growth Fund continues to fulfill its mandate as a growth oriented investment vehicle that can form part of the nucleus of an asset allocation strategy. Our focus is on maximizing long term after-tax returns while controlling risk. We encourage you to learn more about your portfolio. You can read more about the investments in your Fund by going to www.thornburg.com/funds. Thank you for investing in the Thornburg Core Growth Fund.
Regards, Alexander M.V. Motola, CFA
Portfolio Manager
The NASDAQ Composite Index is a market value-weighted, technology-oriented index comprised of approximately 5,000 domestic and non-US-based securities. The Russell 1000 Growth Index measures the performance of those Russell 1000 companies with higher price-to-book ratios and higher forecasted growth values. Unless otherwise noted, index returns reflect the reinvestment of income dividends and capital gains, if any, but do not reflect fees, brokerage commissions or other expenses of investing. Investors may not make direct investments into any index. There are special risk considerations associated with international investing, including fluctuating exchange rates, government regulations and differences in liquidity, which may affect the volatility of the fund.
| Top Industries 3/31/04 | |
|---|---|
| Health Care Equip. & Services | 19.6% |
| Technology Hardware & Equip | 19.0% |
| Telecom Services | 10.4% |
| Diversified Financials | 8.1% |
| Media | 5.8% |
| 12/31/03 | |
| Technology Hardware & Equip | 23.5% |
| Healthcare Equip. & Services | 15.8% |
| Retailing | 13.9% |
| Diversified Financials | 10.0% |
| Media | 8.2% |
New Holdings during the Quarter
| Hero Honda Motors Ltd. | Atheros Communications Inc. |
| eResearch Technology Inc. | Ditech Communications Corp. |
| Guidant Corp. | Semiconductor Mfg. Intl. Corp. |
| Directv Group Inc. | Silicon Laboratories Inc. |
| August Technology Corp. | NetEase.com Inc. |
| Amgen Inc. | NII Holdings Inc. |
2
| Statement of assets and liabilities | |||
|---|---|---|---|
| Thornburg Core Growth Fund | March 31, 2004 | ||
| (Unaudited) | |||
| ASSETS | |||
| Investments at value (cost $66,396,575) | $ 74,006,093 | ||
| Cash | 110,127 | ||
| Cash denominated in foreign currency (cost $19,169) | 20,030 | ||
| Receivable for fund shares sold | 345,279 | ||
| Dividends receivable | 7,014 | ||
| Prepaid expenses and other assets | 27,929 | ||
| Total Assets | 74,516,472 | ||
| LIABILITIES | |||
| Payable for securities purchased | 1,609,274 | ||
| Payable for fund shares redeemed | 46,250 | ||
| Payable to investment advisor (Note 3) | 52,271 | ||
| Deferred tax payable | 8,849 | ||
| Accounts payable and accrued expenses | 30,805 | ||
| Total Liabilities | 1,747,449 | ||
| NET ASSETS | $ 72,769,023 | ||
| NET ASSETS CONSIST OF: | |||
| Undistributed net investment gain (loss) | $ (431,250 | ) | |
| Net unrealized appreciation (depreciation) on investments | 7,601,530 | ||
| Accumulated net realized gain (loss) | (2,301,290 | ) | |
| Net capital paid in on shares of beneficial interest | 67,900,033 | ||
| $ 72,769,023 | |||
| NET ASSET VALUE: | |||
| Class A Shares: | |||
| Net asset value and redemption price per share | |||
| ($42,507,763 applicable to 3,867,974 shares of beneficial | |||
| interest outstanding - Note 4) | $ 10.99 | ||
| Maximum sales charge, 4.50% of offering price | 0.52 | ||
| Maximum Offering Price Per Share | $ 11.51 | ||
| Class C Shares: | |||
| Net asset value and offering price per share * | |||
| ($12,931,112 applicable to 1,212,375 shares of beneficial | |||
| interest outstanding - Note 4) | $ 10.67 | ||
| Class I Shares: | |||
| Net asset value, offering and redemption price per share | |||
| ($17,330,086 applicable to 1,572,951 shares of beneficial | |||
| interest outstanding - Note 4) | $ 11.02 | ||
| Class R-1 Shares: | |||
| Net asset value, offering and redemption price per share | |||
| ($62 applicable to 6 shares of beneficial | |||
| interest outstanding - Note 4) | $ 11.00 | ||
| *Redemption price per share is equal to net asset value less any applicable contingent deferred sales charge | |||
| See notes to financial statements | |||
3
| Statement of Operations | |||
|---|---|---|---|
| Thornburg Core Growth Fund | Six Months Ended March 31, 2004 | ||
| (Unaudited) | |||
| INVESTMENT INCOME | |||
| Dividend income (net of foreign taxes withheld of $3,768) | $ 57,465 | ||
| Interest income | 3,753 | ||
| Total Income | 61,218 | ||
| EXPENSES | |||
| Investment advisory fees (Note 3) | 265,321 | ||
| Administration fees (Note 3) | |||
| Class A Shares | 24,183 | ||
| Class C Shares | 6,582 | ||
| Class I Shares | 2,855 | ||
| Distribution and service fees (Note 3) | |||
| Class A Shares | 49,134 | ||
| Class C Shares | 53,592 | ||
| Transfer agent fees | |||
| Class A Shares | 40,490 | ||
| Class C Shares | 13,998 | ||
| Class I Shares | 7,193 | ||
| Class R-1 Shares | 1,396 | ||
| Registration & filing fees | |||
| Class A Shares | 5,759 | ||
| Class C Shares | 4,452 | ||
| Class I Shares | 6,408 | ||
| Class R-1 Shares | 7,794 | ||
| Custodian fees (Note 3) | 23,786 | ||
| Professional fees | 6,950 | ||
| Accounting fees | 700 | ||
| Trustee fees | 792 | ||
| Other expenses | 18,556 | ||
| Total Expenses | 539,941 | ||
| Less: | |||
| Expenses reimbursed by investment advisor (Note 3) | (32,258 | ) | |
| Management fees waived by investment advisor (Note 3) | (13,125 | ) | |
| Expenses paid indirectly (Note 3) | (4,126 | ) | |
| Net Expenses | 490,432 | ||
| Net Investment Income (Loss) | (429,214 | ) | |
| REALIZED AND UNREALIZED GAIN (LOSS) | |||
| Net realized gain (loss) on: | |||
| Investments | (79,513 | ) | |
| Foreign currency transactions | 4,521 | ||
| (74,992 | ) | ||
| Net change in unrealized appreciation (depreciation) on: | |||
| Investments | 4,210,877 | ||
| Foreign currency translation | 861 | ||
| 4,211,738 | |||
| Net Realized and Unrealized | |||
| Gain (Loss) on Investments | 4,136,746 | ||
| Net Increase (Decrease) in Net Assets Resulting | |||
| From Operations | $ 3,707,532 | ||
| See notes to financial statements | |||
4
| Statements of Changes in net assets | |||||
|---|---|---|---|---|---|
| Thornburg Core Growth Fund | |||||
| Six Months Ended March 31, 2004 | Year Ended September 30, 2003 | ||||
| INCREASE (DECREASE) IN NET ASSETS FROM: | |||||
| OPERATIONS: | |||||
| Net investment gain (loss) | $ (429,214 | ) | $ (256,573 | ) | |
| Net realized gain (loss) on investments and | |||||
| foreign currency transactions | (74,992 | ) | 2,052,999 | ||
| Increase (Decrease) in unrealized appreciation on investments | |||||
| and foreign currency translations | 4,211,738 | 4,261,917 | |||
| Net Increase (Decrease) in Net Assets | |||||
| Resulting from Operations | 3,707,532 | 6,058,343 | |||
| FUND SHARE TRANSACTIONS - (Note 4) | |||||
| Class A Shares | 3,192,313 | 25,630,774 | |||
| Class C Shares | 5,187,518 | 4,106,879 | |||
| Class I Shares | 17,308,640 | 0 | |||
| Class R-1 Shares | (25 | ) | 75 | ||
| Net Increase (Decrease) in Net Assets | 29,395,978 | 35,796,071 | |||
| NET ASSETS: | |||||
| Beginning of period | 43,373,045 | 7,576,974 | |||
| End of period | $ 72,769,023 | $ 43,373,045 | |||
| See notes to financial statements | |||||
5
Thornburg Core Growth Fund
Notes to financial statements
NOTE 1 – ORGANIZATION Thornburg Core Growth Fund, hereinafter referred to as the “Fund,” is a diversified series of Thornburg Investment Trust (the “Trust”). The Fund commenced operations on December 27, 2000. The Trust was organized as a Massachusetts business trust under a Declaration of Trust dated June 3, 1987 and is registered as a diversified, open-end management investment company under the Investment Company Act of 1940, as amended. The Trust is currently issuing nine series of shares of beneficial interest in addition to those of the Fund: Thornburg Limited Term U.S. Government Fund, Thornburg New Mexico Intermediate Municipal Fund, Thornburg Intermediate Municipal Fund, Thornburg Limited Term Income Fund, Thornburg Core Growth Fund, Thornburg Value Fund, Thornburg International Value Fund, Thornburg New York Intermediate Municipal Fund, and Thornburg Investment Income Builder Fund. Each series is considered to be a separate entity for financial reporting and tax purposes and bears expenses directly attributable to it. The Fund seeks long-term capital appreciation by investing primarily in domestic equity securities selected for their growth potential.
The Fund currently offers four classes of shares of beneficial interest, Class A, Class C, Institutional Class (Class I), and Retirement Class (Class R-1) shares. Each class of shares of the Fund represents an interest in the same portfolio of investments of the Fund, except that (i) Class A shares are sold subject to a front-end sales charge collected at the time the shares are purchased and bear a service fee, (ii) Class C shares are sold at net asset value without a sales charge at the time of purchase, but are subject to a contingent deferred sales charge upon redemption within one year, and bear both a service fee and a distribution fee, (iii) Class I shares are sold at net asset value without a sales charge at the time of purchase, (iv) Class R-1 shares are sold at net asset value without a sales charge at the time of purchase but bear both a service fee and a distribution fee, and (iv) the respective classes have different reinvestment privileges. Additionally, the Fund may allocate among its classes certain expenses, to the extent allowable, to specific classes including transfer agent fees, government registration fees, certain printing and postage costs, and administration and legal expenses. Currently, class specific expenses of the Fund are limited to service and distribution fees, administration fees and certain registration and transfer agent expenses.
NOTE 2 – SIGNIFICANT ACCOUNTING POLICIES Significant accounting policies of the Fund are as follows:
Valuation of Securities: In determining net asset value, investments are stated at value based on latest sales prices, normally at 4:00 pm EST, reported on national securities exchanges on the last business day of the period. Investments for which no sale is reported are valued at the mean between bid and asked prices. Securities for which market quotations are not readily available are valued at fair value as determined by management and approved in good faith by the Board of Trustees. Short term obligations having remaining maturities of 60 days or less are valued at amortized cost, which approximates market value.
Options Transactions: The Fund may buy or write put and call options through listed exchanges and the over-the-counter market. The buyer has the right to purchase (in the case of a call option) or sell (in the case of a put option) a specified quantity of a specific security or other underlying asset at a specified price prior to or on a specified expiration date. The writer of an option is exposed to the risk of loss if the market price of the underlying asset declines (in the case of a put option) or increases (in the case of a call option). The writer of an option can never profit by more than the premium paid by the buyer but can lose an unlimited amount. The writer also has the additional risk of not being able to enter into a closing transaction if a liquid secondary market does not exist.
Premiums received/paid from writing/purchasing options are recorded as liabilities/assets on the Statement of Assets and Liabilities, and are subsequently adjusted to current values. The difference between the current value of an option and the premium received/paid is treated as an unrealized gain or loss.
When a purchased option expires on its stipulated expiration date or when a closing transaction is entered into, the premium paid on the purchase of the option is treated by the Fund as a realized loss. When a written option expires on its stipulated expiration date or when a closing transaction is entered into, the related liability is extinguished and the Fund realizes a gain (loss if the cost of the closing transaction exceeds the premium received when the option was written).
Foreign Currency Translation: Portfolio securities and other assets and liabilities denominated in foreign currencies are translated into U.S. dollars based on the exchange rate of such currencies against the U.S. dollar on the date of valuation. Purchases and sales of securities and income items denominated in foreign currencies are translated into U.S. dollars at the exchange rate in effect on the translation date. When the Fund purchases or sells foreign securities it will customarily enter into a foreign exchange contract to minimize foreign exchange risk from the trade date to the settlement date of such transactions.
The Fund does not separately report the effect of changes in foreign exchange rates from changes in market prices on securities held. Such changes are included in net realized and unrealized gain or loss from investments.
Reported net realized foreign exchange gains or losses arise from sales of foreign currencies, currency gains or losses realized between the trade and settlement dates on securities transactions and the difference between the amount of interest recorded on the Fund’s books, and the U.S. dollar equivalent of the amounts actually received or paid.
6
Thornburg Core Growth Fund
Notes to financial statements, continued
Federal Income Taxes: It is the policy of the Fund to comply with the provisions of the Internal Revenue Code applicable to "regulated investment companies" and to distribute all of its taxable income to its shareholders. Therefore, no provision for Federal income tax is required.
Dividends: Dividends to shareholders are generally paid quarterly and are reinvested in additional shares of the Fund at net asset value per share at the close of business on the dividend payment date, or at the shareholder’s option, paid in cash. Net realized capital gains, to the extent available, will be distributed at least annually. Distributions to shareholders are based on income tax regulations and therefore, their characteristics may differ for financial statement and tax purposes.
General: Securities transactions are accounted for on a trade date basis. Interest income is accrued as earned and dividend income is recorded on the ex-dividend date. Certain income from foreign securities is recognized as soon as information is available to the Fund. Realized gains and losses from the sale of securities are recorded on an identified cost basis. Net investment income, other than class specific expenses, and realized and unrealized gains and losses, are allocated daily to each class of shares based upon the relative net asset value of outstanding shares of each class of shares at the beginning of the day (after adjusting for the current share activity of the respective class). Expenses common to all funds are allocated among the funds comprising the Trust based upon their relative net asset values or other appropriate allocation methods.
Guarantees and Indemnifications: Under the Trust’s organizational documents, its officers and trustees are indemnified against certain liability arising out of the performance of their duties to the Fund. Additionally, in the normal course of business the Trust enters into contracts with service providers that contain general indemnification clauses. The Trust’s maximum exposure under these arrangements is unknown. However, based on experience, the Trust expects the risk of loss to be remote.
Use of Estimates: The preparation of financial statements, in conformity with generally accepted accounting principles, requires management to make estimates and assumptions that affect the reported amounts of assets and liabilities and the disclosure of contingent assets and liabilities at the date of the financial statements and the reported amounts of increases and decreases in net assets from operations during the reporting period. Actual results could differ from those estimates.
NOTE 3 — INVESTMENT ADVISORY FEE AND OTHER TRANSACTIONS WITH AFFILIATES
Pursuant to an investment advisory agreement, Thornburg Investment Management, Inc. (the “Advisor”) serves as the investment advisor and performs services to the Fund for which the fees are payable at the end of each month. For the period ended March 31, 2004, these fees were payable at annual rates ranging from .875 of 1% to .675 of 1% of the average daily net assets of the Fund depending on the Fund’s asset size. For the period ended March 31, 2004, the Advisor voluntarily waived investment advisory fees of $13,125. The Fund
also has an administrative services agreement with the Advisor, whereby the Advisor will perform certain administrative services for the shareholders of each class of the Fund’s shares, and for which fees will be payable at an annual rate of up to .125 of 1% of the average daily net assets attributable to each class of shares. For the period ended March 31, 2004, the Advisor voluntarily reimbursed certain class specific expenses and administrative fees of $1,384 for Class A shares, $5,227 for Class C shares, $16,457 for Class I shares, and $9,190 for Class R-1 shares.
The Fund has an underwriting agreement with Thornburg Securities Corporation (the “Distributor”), which acts as the Distributor of the Fund’s shares. For the period ended March 31, 2004, the Distributor has advised the Fund that it earned commissions aggregating $35,355 from the sale of Class A shares of the Fund and collected contingent deferred sales charges aggregating $2,136 from redemptions of Class C shares of the Fund.
Pursuant to a service plan under Rule 12b-1 of the Investment Company Act of 1940, the Fund may reimburse to the Advisor an amount not to exceed .25 of 1% per annum of its average daily net assets attributable to each class of shares of the Fund for payments made by the Advisor to securities dealers and other financial institutions to obtain various shareholder related services. The Advisor may pay out of its own resources additional expenses for distribution of the Fund’s shares.
The Fund has also adopted distribution plans pursuant to Rule 12b-1, applicable only to the Fund’s Class C and Class R-1 shares, under which the Fund compensates the Distributor for services in promoting the sale of Class C and Class R-1 shares of the Fund at an annual rate of up to ..75 of 1% of the average daily net assets attributable to Class C and Class R-1 shares. Total fees incurred by each class of shares of the Fund under its respective Service and Distribution Plans are set forth in the Statement of Operations.
The Fund has an agreement with the custodian bank to indirectly pay a portion of the custodian’s fees through credits earned by the Fund’s cash on deposit with the bank. This deposit agreement is an alternative to overnight investments. Custodial fees have been adjusted to reflect amounts that would have been paid without this agreement, with a corresponding adjustment reflected as fees paid indirectly in the statement of operations. For the period ended March 31, 2004, the fees paid indirectly were $4,126.
Certain officers and trustees of the Trust are also officers and/or directors of the Advisor and Distributor. The compensation of unaffiliated trustees is borne by the Trust.
At March 31, 2004, 16.1% of the Fund’s shares were owned by the Advisor and other affiliates of the Fund.
7
Thornburg Core Growth Fund
Notes to financial statements, continued
March 31, 2004
NOTE 4 — SHARES OF BENEFICIAL INTEREST
At March 31, 2004 there were an unlimited number of shares of beneficial interest authorized. Sales of Class R-1 and Class I shares commenced July 1, 2003 and November 1, 2003, respectively. Transactions in shares of beneficial interest were as follows:
| Period Ended March 31, 2004 | Year Ended September 30, 2003 | ||||||||
|---|---|---|---|---|---|---|---|---|---|
| Shares | Amount | Shares | Amount | ||||||
| Class A Shares | |||||||||
| Shares sold | 1,932,054 | $ 21,136,103 | 3,221,438 | $ 29,901,018 | |||||
| Shares repurchased** | (1,648,583 | ) | (17,943,790 | ) | (517,802 | ) | (4,270,244 | ) | |
| Net Increase (Decrease) | 283,471 | $ 3,192,313 | 2,703,636 | $ 25,630,774 | |||||
| **The Fund charges a redemption fee of 1% of the Class A shares exchanged within 90 days of purchase. For the year ended September 30, 2003 and period ended March 31, 2004, $29,916 and $14,808, respectively, were netted in the amount reported for shares repurchased | |||||||||
| Class C Shares | |||||||||
| Shares sold | 572,031 | $ 6,090,948 | 596,335 | $ 5,369,114 | |||||
| Shares repurchased | (85,042 | ) | (903,430 | ) | (167,711 | ) | (1,262,235 | ) | |
| Net Increase (Decrease) | 486,989 | $ 5,187,518 | 428,624 | $ 4,106,879 | |||||
| Class I Shares | |||||||||
| Shares sold | 1,579,541 | $ 17,382,156 | -- | $ -- | |||||
| Shares repurchased ** | (6,590 | ) | (73,516 | ) | -- | -- | |||
| Net Increase (Decrease) | 1,572,951 | $ 17,308,640 | -- | $ -- | |||||
| **The Fund charges a redemption fee of 1% of the Class I shares exchanged within 90 days of purchase. For the period ended March 31, 2004, $86 was netted in the amount reported for shares repurchased | |||||||||
| Class R-1 Shares | |||||||||
| Shares sold | -- | $ -- | 8 | $ 75 | |||||
| Shares repurchased | (2 | ) | (25 | ) | -- | -- | |||
| Net Increase (Decrease) | (2 | ) | $ (25 | ) | 8 | $ 75 | |||
NOTE 5 – SECURITIES TRANSACTIONS
For the period ended March 31, 2004 the Fund had purchase and sale transactions of investment securities (excluding short-term investments) of $58,010,442 and $32,580,870, respectively.
NOTE 6 – INCOME TAXES
At March 31, 2004, information on the tax components of capital is as follows:
| Cost of investments for tax purpose | $ 66,342,491 | ||
| Gross unrealized appreciation on a tax basis | $ 9,822,920 | ||
| Gross unrealized depreciation on a tax basis | (2,159,317 | ) | |
| Net unrealized appreciation | |||
| (depreciation) on investments (tax basis) | $ 7,663,603 | ||
At March 31, 2004, the Fund has deferred currency losses occurring subsequent to October 31, 2002 of $2,036. For tax purposes, such losses will be reflected in the year ending September 30, 2004.
At March 31, 2004, the Fund had tax basis capital losses of $2,280,382, which may be carried over to offset future capital gains. Such losses expire September 30, 2010.
Unutilized tax basis capital losses may be carried forward to offset realized gains in future years. To the extent such carry forwards are used, capital gains distributions may be reduced to the extent provided by regulations.
Net investment income and net realized gain (loss) differ for financial statement and tax purposes primarily due to differing treatments of wash sale losses, foreign currency transactions, index options, and losses realized subsequent to October 31 on the sale of foreign currencies.
8
March 31, 2004
| Financial highlights | ||||
|---|---|---|---|---|
| Thornburg Core Growth Fund | ||||
| Six Months Ended March 31, | Year Ended | September 30, | Period Ended September 30, | |
| 2004 | 2003 | 2002 | 2001(c) | |
| Class A Shares: | ||||
| Per Share Performance | ||||
| (for a share outstanding throughout the period)+ | ||||
| Net asset value, beginning of period | $ 10.11 | $ 6.45 | $ 7.80 | $ 11.94 |
| Income from investment operations: | ||||
| Net investment income | (0.08) | (0.13) | (0.12) | (0.08) |
| Net realized and unrealized | ||||
| gain (loss) on investments | 0.96 | 3.77 | (1.23) | (4.06) |
| Total from investment operations | 0.88 | 3.64 | (1.35) | (4.14) |
| Redemption fees added to paid in capital | -- | 0.02 | -- | -- |
| Change in net asset value | 0.88 | 3.66 | (1.35) | (4.14) |
| Net asset value, end of period | $ 10.99 | $ 10.11 | $ 6.45 | $ 7.80 |
| Total return (a) | 8.70% | 56.74% | (17.31)% | (34.67)% |
| Ratios/Supplemental Data | ||||
| Ratios to average net assets: | ||||
| Net investment income | (1.39)%(b) | (1.43)% | (1.44)% | (1.02)% |
| (b) | ||||
| Expenses, after expense reductions | 1.61%(b) | 1.65% | 1.64% | 1.71%(b) |
| Expenses, after expense reductions | ||||
| and net of custody credits | 1.59%(b) | 1.63% | 1.63% | -- |
| Expenses, before expense reductions | 1.66%(b) | 2.03% | 2.39% | 2.80%(b) |
| Portfolio turnover rate | 54.96% | 102.91% | 212.17% | 126.15% |
| Net assets at end of period (000) | $ 42,508 | $ 36,247 | 5,685 | 6,337 |
(a) Sales loads are not reflected in computing total return, which is not annualized for periods less than one year.
(b) Annualized.
(c) Fund commenced operations on December 27, 2000.
+ Based on weighted average shares outstanding.
9
| Financial highlights, continued | ||||
|---|---|---|---|---|
| Thornburg Core Growth Fund | ||||
| Six Months Ended March 31, | Year Ended | September 30, | Period Ended September 30, | |
| 2004 | 2003 | 2002 | 2001(c) | |
| Class C Shares: | ||||
| Per Share Performance | ||||
| (for a share outstanding throughout the period)+ | ||||
| Net asset value, beginning of period | $ 9.85 | $ 6.38 | $ 7.76 | $ 11.94 |
| Income from investment operations: | ||||
| Net investment income | (0.12) | (0.18) | (0.18) | (0.13) |
| Net realized and unrealized | ||||
| gain (loss) on investments | 0.94 | 3.65 | (1.20) | (4.05) |
| Total from investment operations | 0.82 | 3.47 | (1.38) | (4.18) |
| Change in net asset value | 0.82 | 3.47 | (1.38) | (4.18) |
| Net asset value, end of period | $ 10.67 | $ 9.85 | $ 6.38 | $ 7.76 |
| Total return (a) | 8.32% | 54.39% | (17.78)% | (35.01)% |
| Ratios/Supplemental Data | ||||
| Ratios to average net assets: | ||||
| Net investment income | (2.18)%(b) | (2.19)% | (2.19)% | (1.78)% |
| (b) | ||||
| Expenses, after expense reductions | 2.39%(b) | 2.40% | 2.39% | 2.49%(b) |
| Expenses, after expense reductions | ||||
| and net of custody credits | 2.38%(b) | 2.38% | 2.38% | -- |
| Expenses, before expense reductions | 2.53%(b) | 3.35% | 3.45% | 4.43%(b) |
| Portfolio turnover rate | 54.96% | 102.91% | 212.17% | 126.15% |
| Net assets at end of period (000) | $ 12,931 | 7,146 | 1,892 | 2,216 |
(a) Total return is not annualized for periods less than one year.
(b) Annualized.
(c) Fund commenced operations on December 27, 2000.
+ Based on weighted average shares outstanding.
10
| Financial highlights, continued | |
|---|---|
| Thornburg Core Growth Fund | |
| Period Ended March 31, | |
| 2004(c) | |
| Class I Shares: | |
| Per Share Performance | |
| (for a share outstanding throughout the period)+ | |
| Net asset value, beginning of period | $ 10.87 |
| Income from investment operations: | |
| Net investment income | (0.04) |
| Net realized and unrealized | |
| gain (loss) on investments | 0.19 |
| Total from investment operations | 0.15 |
| Change in net asset value | 0.15 |
| Net asset value, end of period | $ 11.02 |
| Total return (a) | 9.89% |
| Ratios/Supplemental Data | |
| Ratios to average net assets: | |
| Net investment income | (0.79)%(b) |
| Expenses, after expense reductions | 1.00% (b) |
| Expenses, after expense reductions | |
| and net of custody credits | 0.99% (b) |
| Expenses, before expense reductions | 1.33% (b) |
| Portfolio turnover rate | 54.96% |
| Net assets at end of period (000) | $ 17,330 |
(a) Total return is not annualized for periods less than one year.
(b) Annualized.
(c) Effective date of Class I Shares was November 01, 2003.
+ Based on weighted average shares outstanding.
11
| Financial highlights, continued | ||
|---|---|---|
| Thornburg Core Growth Fund | ||
| Six Months Ended March 31, | Period Ended September 30, | |
| 2004 | 2003(c) | |
| Class R-1 Shares: | ||
| Per Share Performance | ||
| (for a share outstanding throughout the period)+ | ||
| Net asset value, beginning of period | $ 10.11 | $ 9.59 |
| Income from investment operations: | ||
| Net investment income | (0.07) | (0.03) |
| Net realized and unrealized | ||
| gain (loss) on investments | 0.96 | 0.55 |
| Total from investment operations | 0.89 | 0.52 |
| Change in net asset value | 0.89 | 0.52 |
| Net asset value, end of period | $ 11.00 | $ 10.11 |
| Total return (a) | 8.80% | 5.42% |
| Ratios/Supplemental Data | ||
| Ratios to average net assets: | ||
| Net investment income | (1.29)%(b) | (1.06)%(b) |
| Expenses, after expense reductions | 1.48%(b) | 1.65%(b) |
| Expenses, after expense reductions | ||
| and net of custody credits | 1.48%(b) | 1.65%(b) |
| Expenses, before expense reductions | 29,009.85%(b)* | 22,219.77%(b)* |
| Portfolio turnover rate | 54.96% | 102.91% |
| Net assets at end of period (000) | $ - (d) | $ - (d) |
(a) Not annualized for periods less than one year.
(b) Annualized.
(c) Effective date of Class R-1 Shares was July 1, 2003.
(d) Net assets at end of year were less than $1,000.
* Due to the size of net assets and fixed expenses, ratios may appear disproportionate.
+ Based on weighted average shares outstanding.
12
| Schedule of investments | ||||||||
|---|---|---|---|---|---|---|---|---|
| Thornburg Core Growth Fund | March 31, 2004 | |||||||
| CUSIPS: CLASS A - 885-215-582, CLASS C - 885-215-574, CLASS I - 885-215-475, CLASS R-1 - 885-215-517 NASDAQ SYMBOLS: CLASS A - THCGX , CLASS C - TCGCX, CLASS I - THIGX, CLASS R-1 THCRX | ||||||||
| Shares | Value | |||||||
| COMMON STOCKS - 97.30% | ||||||||
| AUTOMOBILES & COMPONENTS (3.10%) | ||||||||
| Hero Honda Motors Ltd. | 199,800 | $ | 2,260,482 | |||||
| CONSUMER DURABLES & APPAREL (3.60%) | ||||||||
| Carter's Inc. + | 55,055 | 1,574,022 | ||||||
| Tempur-Pedic International Inc. + | 71,975 | 1,125,689 | ||||||
| DIVERSIFIED FINANCIALS (8.10%) | ||||||||
| Affiliated Managers Group Inc. + | 25,095 | 1,369,685 | ||||||
| Capital One Financial Corp. | 42,870 | 3,233,684 | ||||||
| E-Trade Financial Corp. + | 101,665 | 1,357,228 | ||||||
| ENERGY (5.10%) | ||||||||
| Apache Corp. | 47,820 | 2,064,389 | ||||||
| Evergreen Resources + | 50,260 | 1,726,431 | ||||||
| HEALTHCARE EQUIPMENT & SERVICES (19.60%) | ||||||||
| Anthem Inc. + | 27,700 | 2,510,728 | ||||||
| Boston Scientific Corp. + | 79,400 | 3,364,972 | ||||||
| Caremark Rx Inc. + | 53,400 | 1,775,550 | ||||||
| eResearch Technology Inc. + | 64,895 | 1,820,305 | ||||||
| Guidant Corp. | 39,870 | 2,526,562 | ||||||
| UnitedHealth Group Inc. | 38,600 | 2,487,384 | ||||||
| INSURANCE (3.10%) | ||||||||
| Platinum Underwriters Holdings | 71,830 | 2,302,152 | ||||||
| MEDIA (5.80%) | ||||||||
| Comcast Corp. + | 80,100 | 2,233,188 | ||||||
| The Directv Group Inc. + | 132,688 | 2,040,741 | ||||||
| PHARMACEUTICALS & BIOTECHNOLOGY (5.70%) | ||||||||
| Amgen Inc. + | 37,600 | 2,187,192 | ||||||
| Gilead Sciences Inc. + | 36,750 | 2,049,547 | ||||||
| RETAILING (5.20%) | ||||||||
| GameStop Corp. + | 94,850 | 1,709,197 | ||||||
| InterActiveCorp + | 67,700 | 2,138,643 | ||||||
| SEMICONDUCTOR EQUIPMENT (2.40%) | ||||||||
| August Technology Corp. + | 14,500 | 217,500 | ||||||
| Novellus Systems Inc. + | 49,350 | 1,568,837 | ||||||
| SOFTWARE & SERVICES (4.00%) | ||||||||
| Amdocs Ltd + | 50,100 | 1,392,279 | ||||||
| Open Solutions Inc. + | 71,400 | 1,576,512 | ||||||
| TECHNOLOGY - HARDWARE & EQUIPMENT (19.00%) | ||||||||
| ASE Test Ltd + | 155,800 | 1,713,800 | ||||||
| Atheros Communications Inc. + | 103,500 | 1,770,885 | ||||||
| Dell Inc. + | 67,800 | 2,279,436 | ||||||
| Ditech Communications Corp. + | 87,000 | 1,450,290 | ||||||
| Nam Tai Electronics | 48,800 | $ | 1,240,008 | |||||
| Samsung Electronics Co. Ltd. | 5,500 | 2,744,123 | ||||||
| Semiconductor Mfg. Intl. Corp. + | 87,045 | 1,314,380 | ||||||
| Silicon Laboratories Inc. + | 30,175 | 1,595,654 | ||||||
| TELECOMMUNICATION SERVICES (10.40%) | ||||||||
| Mobile Telesystems | 12,800 | 1,683,200 | ||||||
| Netease.com Inc. + | 26,000 | 1,294,540 | ||||||
| Nextel Communications Inc. + | 105,400 | 2,606,542 | ||||||
| NII Holdings Inc. + | 59,430 | 2,081,833 | ||||||
| TRANSPORTATION (2.20%) | ||||||||
| JetBlue Airways Corp. + | 64,000 | 1,618,560 | ||||||
| TOTAL COMMON STOCKS (Cost $64,396,632) | -- | 72,006,150 | ||||||
| SHORT TERM INVESTMENTS - 2.70% | ||||||||
| American General Finance Corp., 1.03% due 4/2/2004 | 2,000,000 | 1,999,943 | ||||||
| TOTAL SHORT TERM INVESTMENTS (Cost $1,999,943) | -- | 1,999,943 | ||||||
| TOTAL INVESTMENTS (100%) (Cost $66,396,575) | -- | $ | 74,006,093 | |||||
| +Non-income producing | ||||||||
| See notes to financial statements | ||||||||
14
Thornburg Core Growth Fund
March 31, 2004
Index Comparison
Compares performance of Thornburg Core Growth Fund and the NASDAQ Composite Index for the period December 31, 2000 to March 31, 2004. Past performance of the Index and the Fund may not be indicative of future performance. The performance data and graph do not reflect the deduction of taxes that a shareholder would pay on distributions or the redemption of fund shares.
Thornburg Core Growth Fund Class A Total Returns, Since December 31, 2000, versus the NASDAQ Composite Index
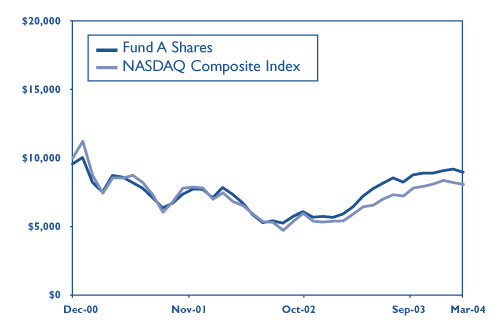
Average Annual Total Returns (periods ending 3/31/04, at max. offering price)
A Shares
| 1 Year: | 44 | .61% | |
| 3 Years: | 4 | .47% | |
| From Inception (12/27/00): | (3 | .87)% | |
Thornburg Core Growth Fund Class C Total Returns, Since December 31, 2000, versus the NASDAQ Composite Index
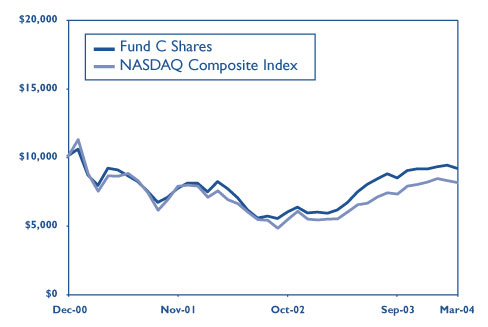
Average Annual Total Returns(periods ending 3/31/04)
| C Shares | |||
|---|---|---|---|
| 1 Year: | 49 | .07% | |
| 3 Years: | 5 | .07% | |
| From Inception (12/27/00): | (3 | .39)% | |
Past performance is no guarantee of future results. Current returns may be either lower or higher than those shown. Share prices and returns will fluctuate and investors may experience a loss upon redemption. There is no guarantee that the fund will meet its objectives. Shares in the Fund carry risks, including possible loss of principal.
Carefully consider the Fund’s investment objectives, risks, sales charges, and expenses; this information is found in the prospectus, which is available from your financial advisor or from www.thornburg.com. Read it carefully before you invest or send money.
For month-end performance information, or for information and commentary on Fund holdings, including links to each company’s home page, visit www.thornburg.com.
The NASDAQ Composite Index is a market value-weighted, technology-oriented index comprised of approximately 5,000 domestic and non-US-based securities. Unless otherwise noted, index returns reflect the reinvestment of income dividends and capital gains, if any, but do not reflect fees, brokerage commissions or other expenses of investing. Investors may not make direct investments into any index.
Investments in overseas markets pose special risks, including currency fluctuation and political risks, and the portfolio share price is expected to be more volatile than that of a U.S. only portfolio.
15
Thornburg Core Growth Fund
Portfolio Proxy Voting
March 31, 2004
Policies and Procedures (Unaudited):
The Trust has delegated to Thornburg Investment Management, Inc. (“the Advisor”) voting decisions respecting proxies for the Fund’s voting securities. The Advisor makes voting decisions in accordance with its Proxy Voting Policy and Procedures. A description of the policy and Procedures is available (i) without charge, upon request, by calling the Advisor toll-free at 1.800.847.0200, (ii) on the Thornburg website at www.thornburg.com, and (iii) on the Securities and Exchange Commission’s website at www.sec.gov.
Commencing August 31, 2004, information regarding how proxies were voted will be available on or before August 31 of each year for the twelve months ending the preceding June 30. This information will be available (i) without charge, upon request, on the Thornburg website at www.thornburg.com and (ii) on the Securities and Exchange Commission’s website at www.sec.gov.
16
Investment Manager Thornburg Investment Management, Inc.
119 East Marcy Street
Santa Fe, New Mexico 87501
800.847.0200
Principal Underwriter Thornburg Securities Corporation
119 East Marcy Street
Santa Fe, New Mexico 87501
800.847.0200
This report is submitted for the general information of shareholders of the Fund. It is not authorized for distribution to prospective investors in the Fund unless preceded or accompanied by an effective prospectus. Carefully consider information in the prospectus regarding the Fund’s investment objectives and policies, risks, sales charges, expenses, experience of its management, marketability of shares, and other information. Performance data quoted represent past performance and do not guarantee future results.
www.thornburg.com
Thornburg Core Growth Fund - I Shares
Semi-Annual Report March 31, 2004
Thornburg Core Growth Fund
Letter to shareholders
Dear Fellow Shareholder:
The Thornburg Core Growth Fund generated solid results in the first quarter of this year. We outperformed each of our target benchmarks: the Nasdaq Composite Index and the Russell 1000 Growth Index. Unfortunately, we underperformed our peer group, the Lipper Multi-Cap Growth Fund Universe. Since the fund started in late 2000, we have had consistent success relative to the benchmarks and our peer group. In March, the Fund was recognized by Lipper for its ability to generate attractive, consistent, risk-adjusted returns compared to its peer group.
| Total return performance as of 3/31/04 I Shares | ||||
|---|---|---|---|---|
| Qtr Ended 3/31/04 | 1 Year | 3 Years | Since Inception | |
| Net Asset Value | 0.82% | N/A | N/A | 1.38% |
| Maximum Offering Price | 0.82% | N/A | N/A | 1.38% |
Total returns for periods greater than one year are annualized averages. Inception of Class I shares: 11/01/03 There is no up front sales charge for this class of shares. Past performance is no guarantee of future results. Current returns may be either lower or higher than those shown. Share prices and returns will fluctuate and investors may experience a loss upon redemption. There is no guarantee that the Fund will meet its objectives. Shares in the Fund carry risks, including possible loss of principal. Carefully consider the Fund's investment objectives, risks, sales charges, and expenses; this information is found in the prospectus, which is available from your financial advisor or from www.thornburg.com. Read it carefully before you invest or send money. For month-end performance information, or for information and commentary on Fund holdings, including links to each company's home page, visit www.thornburg.com.
Financials and foreign stocks were strong contributors to performance in the first quarter. Affiliated Managers Group (AMG), a long-time holding, continued to benefit from the positive trends in the equity market. Capital One Financial (COF) has done an excellent job of executing on their business model and has benefited recently from improving charge-offs. Another long time holding, Amdocs Ltd (DOX) continues to prosper at the expense of its competition. A similar trend exists at Samsung Electronics Co. (05930 KS), where the company has been successful in taking market share in several markets, most noticeably the cell phone handset market.
Technology was a tough sector for the Fund in the first quarter. Our worst performers—Novellus Systems (NVLS) and ASE Test (ASTSF)—are both involved in the process of semiconductor manufacturing. Novellus manufactures capital equipment and ASE Test performs packaging and testing on an outsourced basis. Concerns over valuation and mixed data points increased the volatility of semiconductor related stocks during the quarter.
During the quarter, we added several new holdings, which include Guidant (GDT), NII Holdings (NIHD), August Technology (AUGT), Hero Honda Motors (HH.IN), Atheros Communications (ATHR), Ditech Communications (DITC), NetEase.com (NTES), and Semiconductor Manufacturing International (SMI) to the portfolio. Since our investment process is research- intensive, we continue to stay abreast of developments in companies that we have owned in the past but have sold due to valuation or other concerns that may have now been remedied. In the first quarter, we purchased three previously owned stocks: Amgen (AMGN), Silicon Laboratories (SLAB), and eResearch Technology (ERES). Sales during the quarter included Circuit City Stores (CC), Clear Channel Communications (CCU), Integrated Circuit Systems (ICST), Johnson & Johnson (JNJ), Lexar Media (LEXR), Quiksilver (ZQK), Ross
1
Thornburg Core Growth Fund
Letter to shareholders, continued
| Top Industries 3/31/04 | |||
|---|---|---|---|
| Health Care Equip. & Services | 19 | .6% | |
| Technology Hardware & Equip | 19 | .0% | |
| Telecom Services | 10 | .4% | |
| Diversified Financials | 8 | .1% | |
| Media | 5 | .8% | |
| 12/31/03 | |||
| Technology Hardware & Equip | 23 | .5% | |
| Healthcare Equip. & Services | 15 | .8% | |
| Retailing | 13 | .9% | |
| Diversified Financials | 10 | .0% | |
| Media | 8 | .2% | |
Stores (ROST), LeapFrog (LF), Microsoft (MSFT), and UT Starcom (UTSI). Two positions purchased and then subsequently sold were Ceradyne (CRON) and Siebel Systems (SEBL).
Amdocs Ltd. has been a long-term success story for the Fund. The Fund owned this stock near inception, but sold the stock when it hit its target price. Amdocs was repurchased initially in November of 2002 (there have been subsequent purchases as the fund has grown to maintain our target exposure). Five quarters ago, Amdocs Ltd. was selling at around 12 times cash flow, which appeared to be an excellent valuation for a company that was widely considered to be the market leader in selling billing and customer care software to leading telecommunications service providers. At the time of purchase, revenues were declining slightly, but they are now growing modestly. Billing applications are critical to phone companies--if these companies cannot produce a timely and accurate bill, their business is in jeopardy. Our research did not indicate when phone companies would again invest in this critical area, but it did support the thesis that, at some point, spending increases would again be the norm. Fortunately, both the value of the Amdocs Ltd. franchise and the necessity of their products have been more clearly recognized over the past year.
The Thornburg Core Growth Fund rose 0.82% in the first quarter, and increased 1.38% since the inception date of November 1, 2003. This compares with a 0.35% first-quarter decline in the Nasdaq Composite, and a 1.5% rise over the period since inception of the I shares. The Russell 1000 Growth rose 0.54% in the first quarter and was up 4.0% since inception of the I shares.
Initial public offerings contributed 0.02% of total return to the Fund during the first quarter. As of the end of the quarter, no shares received on their initial offering during the first quarter had been sold. The effects of offerings in prior periods are disclosed in prior quarterly reports.
Our motto is Core Strategies for Serious Investors. We believe the Thornburg Core Growth Fund continues to fulfill its mandate as a growth oriented investment vehicle that can form part of the nucleus of an asset allocation strategy. Our focus is on maximizing long term after-tax returns while controlling risk. We encourage you to learn more about your portfolio. You can read more about the investments in your Fund by going to www.thornburg.com/funds. Thank you for investing in the Thornburg Core Growth Fund.
Regards, Alexander M.V. Motola, CFA
Portfolio Manager
The NASDAQ Composite Index is a market value-weighted, technology-oriented index comprised of approximately 5,000 domestic and non-US-based securities. The Russell 1000 Growth Index measures the performance of those Russell 1000 companies with higher price-to-book ratios and higher forecasted growth values. Unless otherwise noted, index returns reflect the reinvestment of income dividends and capital gains, if any, but do not reflect fees, brokerage commissions or other expenses of investing. Investors may not make direct investments into any index.
There are special risk considerations associated with international investing, including fluctuating exchange rates, government regulations and differences in liquidity, which may affect the volatility of the fund.
New Holdings during the Quarter
| Hero Honda Motors Ltd. | Atheros Communications Inc. |
| eResearch Technology Inc. | Ditech Communications Corp. |
| Guidant Corp. | Semiconductor Mfg. Intl. Corp. |
| Directv Group Inc. | Silicon Laboratories Inc. |
| August Technology Corp. | NetEase.com Inc. |
| Amgen Inc. | NII Holdings Inc. |
As of 3/31/04
2
| Statement of assets and liabilities | |||
|---|---|---|---|
| Thornburg Core Growth Fund | March 31, 2004 | ||
| (Unaudited) | |||
| ASSETS | |||
| Investments at value (cost $66,396,575) | $ 74,006,093 | ||
| Cash | 110,127 | ||
| Cash denominated in foreign currency (cost $19,169) | 20,030 | ||
| Receivable for fund shares sold | 345,279 | ||
| Dividends receivable | 7,014 | ||
| Prepaid expenses and other assets | 27,929 | ||
| Total Assets | 74,516,472 | ||
| LIABILITIES | |||
| Payable for securities purchased | 1,609,274 | ||
| Payable for fund shares redeemed | 46,250 | ||
| Payable to investment advisor (Note 3) | 52,271 | ||
| Deferred tax payable | 8,849 | ||
| Accounts payable and accrued expenses | 30,805 | ||
| Total Liabilities | 1,747,449 | ||
| NET ASSETS | $ 72,769,023 | ||
| NET ASSETS CONSIST OF: | |||
| Undistributed net investment gain (loss) | $ (431,250 | ) | |
| Net unrealized appreciation (depreciation) on investments | 7,601,530 | ||
| Accumulated net realized gain (loss) | (2,301,290 | ) | |
| Net capital paid in on shares of beneficial interest | 67,900,033 | ||
| $ 72,769,023 | |||
| NET ASSET VALUE: | |||
| Class A Shares: | |||
| Net asset value and redemption price per share | |||
| ($42,507,763 applicable to 3,867,974 shares of beneficial | |||
| interest outstanding - Note 4) | $ 10.99 | ||
| Maximum sales charge, 4.50% of offering price | 0.52 | ||
| Maximum Offering Price Per Share | $ 11.51 | ||
| Class C Shares: | |||
| Net asset value and offering price per share * | |||
| ($12,931,112 applicable to 1,212,375 shares of beneficial | |||
| interest outstanding - Note 4) | $ 10.67 | ||
| Class I Shares: | |||
| Net asset value, offering and redemption price per share | |||
| ($17,330,086 applicable to 1,572,951 shares of beneficial | |||
| interest outstanding - Note 4) | $ 11.02 | ||
| Class R-1 Shares: | |||
| Net asset value, offering and redemption price per share | |||
| ($62 applicable to 6 shares of beneficial | |||
| interest outstanding - Note 4) | $ 11.00 | ||
| *Redemption price per share is equal to net asset value less any applicable contingent deferred sales charge | |||
| See notes to financial statements | |||
3
| Statement of Operations | |||
|---|---|---|---|
| Thornburg Core Growth Fund | Six Months Ended March 31, 2004 | ||
| (Unaudited) | |||
| INVESTMENT INCOME | |||
| Dividend income (net of foreign taxes withheld of $3,768) | $ 57,465 | ||
| Interest income | 3,753 | ||
| Total Income | 61,218 | ||
| EXPENSES | |||
| Investment advisory fees (Note 3) | 265,321 | ||
| Administration fees (Note 3) | |||
| Class A Shares | 24,183 | ||
| Class C Shares | 6,582 | ||
| Class I Shares | 2,855 | ||
| Distribution and service fees (Note 3) | |||
| Class A Shares | 49,134 | ||
| Class C Shares | 53,592 | ||
| Transfer agent fees | |||
| Class A Shares | 40,490 | ||
| Class C Shares | 13,998 | ||
| Class I Shares | 7,193 | ||
| Class R-1 Shares | 1,396 | ||
| Registration & filing fees | |||
| Class A Shares | 5,759 | ||
| Class C Shares | 4,452 | ||
| Class I Shares | 6,408 | ||
| Class R-1 Shares | 7,794 | ||
| Custodian fees (Note 3) | 23,786 | ||
| Professional fees | 6,950 | ||
| Accounting fees | 700 | ||
| Trustee fees | 792 | ||
| Other expenses | 18,556 | ||
| Total Expenses | 539,941 | ||
| Less: | |||
| Expenses reimbursed by investment advisor (Note 3) | (32,258 | ) | |
| Management fees waived by investment advisor (Note 3) | (13,125 | ) | |
| Expenses paid indirectly (Note 3) | (4,126 | ) | |
| Net Expenses | 490,432 | ||
| Net Investment Income (Loss) | (429,214 | ) | |
| REALIZED AND UNREALIZED GAIN (LOSS) | |||
| Net realized gain (loss) on: | |||
| Investments | (79,513 | ) | |
| Foreign currency transactions | 4,521 | ||
| (74,992 | ) | ||
| Net change in unrealized appreciation (depreciation) on: | |||
| Investments | 4,210,877 | ||
| Foreign currency translation | 861 | ||
| 4,211,738 | |||
| Net Realized and Unrealized | |||
| Gain (Loss) on Investments | 4,136,746 | ||
| Net Increase (Decrease) in Net Assets Resulting | |||
| From Operations | $ 3,707,532 | ||
| See notes to financial statements | |||
4
| Statements of Changes in net assets | |||||
|---|---|---|---|---|---|
| Thornburg Core Growth Fund | |||||
| Six Months Ended March 31, 2004 | Year Ended September 30, 2003 | ||||
| INCREASE (DECREASE) IN NET ASSETS FROM: | |||||
| OPERATIONS: | |||||
| Net investment gain (loss) | $ (429,214 | ) | $ (256,573 | ) | |
| Net realized gain (loss) on investments and | |||||
| foreign currency transactions | (74,992 | ) | 2,052,999 | ||
| Increase (Decrease) in unrealized appreciation on investments | |||||
| and foreign currency translations | 4,211,738 | 4,261,917 | |||
| Net Increase (Decrease) in Net Assets | |||||
| Resulting from Operations | 3,707,532 | 6,058,343 | |||
| FUND SHARE TRANSACTIONS - (Note 4) | |||||
| Class A Shares | 3,192,313 | 25,630,774 | |||
| Class C Shares | 5,187,518 | 4,106,879 | |||
| Class I Shares | 17,308,640 | 0 | |||
| Class R-1 Shares | (25 | ) | 75 | ||
| Net Increase (Decrease) in Net Assets | 29,395,978 | 35,796,071 | |||
| NET ASSETS: | |||||
| Beginning of period | 43,373,045 | 7,576,974 | |||
| End of period | $ 72,769,023 | $ 43,373,045 | |||
| See notes to financial statements | |||||
5
Thornburg Core Growth Fund
Notes to financial statements
NOTE 1 – ORGANIZATION Thornburg Core Growth Fund, hereinafter referred to as the “Fund,” is a diversified series of Thornburg Investment Trust (the “Trust”). The Fund commenced operations on December 27, 2000. The Trust was organized as a Massachusetts business trust under a Declaration of Trust dated June 3, 1987 and is registered as a diversified, open-end management investment company under the Investment Company Act of 1940, as amended. The Trust is currently issuing nine series of shares of beneficial interest in addition to those of the Fund: Thornburg Limited Term U.S. Government Fund, Thornburg New Mexico Intermediate Municipal Fund, Thornburg Intermediate Municipal Fund, Thornburg Limited Term Income Fund, Thornburg Core Growth Fund, Thornburg Value Fund, Thornburg International Value Fund, Thornburg New York Intermediate Municipal Fund, and Thornburg Investment Income Builder Fund. Each series is considered to be a separate entity for financial reporting and tax purposes and bears expenses directly attributable to it. The Fund seeks long-term capital appreciation by investing primarily in domestic equity securities selected for their growth potential.
The Fund currently offers four classes of shares of beneficial interest, Class A, Class C, Institutional Class (Class I), and Retirement Class (Class R-1) shares. Each class of shares of the Fund represents an interest in the same portfolio of investments of the Fund, except that (i) Class A shares are sold subject to a front-end sales charge collected at the time the shares are purchased and bear a service fee, (ii) Class C shares are sold at net asset value without a sales charge at the time of purchase, but are subject to a contingent deferred sales charge upon redemption within one year, and bear both a service fee and a distribution fee, (iii) Class I shares are sold at net asset value without a sales charge at the time of purchase, (iv) Class R-1 shares are sold at net asset value without a sales charge at the time of purchase but bear both a service fee and a distribution fee, and (iv) the respective classes have different reinvestment privileges. Additionally, the Fund may allocate among its classes certain expenses, to the extent allowable, to specific classes including transfer agent fees, government registration fees, certain printing and postage costs, and administration and legal expenses. Currently, class specific expenses of the Fund are limited to service and distribution fees, administration fees and certain registration and transfer agent expenses.
NOTE 2 – SIGNIFICANT ACCOUNTING POLICIES Significant accounting policies of the Fund are as follows:
Valuation of Securities: In determining net asset value, investments are stated at value based on latest sales prices, normally at 4:00 pm EST, reported on national securities exchanges on the last business day of the period. Investments for which no sale is reported are valued at the mean between bid and asked prices. Securities for which market quotations are not readily available are valued at fair value as determined by management and approved in good faith by the Board of Trustees. Short term obligations having remaining
maturities of 60 days or less are valued at amortized cost, which approximates market value.
Options Transactions: The Fund may buy or write put and call options through listed exchanges and the over-the-counter market. The buyer has the right to purchase (in the case of a call option) or sell (in the case of a put option) a specified quantity of a specific security or other underlying asset at a specified price prior to or on a specified expiration date. The writer of an option is exposed to the risk of loss if the market price of the underlying asset declines (in the case of a put option) or increases (in the case of a call option). The writer of an option can never profit by more than the premium paid by the buyer but can lose an unlimited amount. The writer also has the additional risk of not being able to enter into a closing transaction if a liquid secondary market does not exist.
Premiums received/paid from writing/purchasing options are recorded as liabilities/assets on the Statement of Assets and Liabilities, and are subsequently adjusted to current values. The difference between the current value of an option and the premium received/paid is treated as an unrealized gain or loss.
When a purchased option expires on its stipulated expiration date or when a closing transaction is entered into, the premium paid on the purchase of the option is treated by the Fund as a realized loss. When a written option expires on its stipulated expiration date or when a closing transaction is entered into, the related liability is extinguished and the Fund realizes a gain (loss if the cost of the closing transaction exceeds the premium received when the option was written).
Foreign Currency Translation: Portfolio securities and other assets and liabilities denominated in foreign currencies are translated into U.S. dollars based on the exchange rate of such currencies against the U.S. dollar on the date of valuation. Purchases and sales of securities and income items denominated in foreign currencies are translated into U.S. dollars at the exchange rate in effect on the translation date. When the Fund purchases or sells foreign securities it will customarily enter into a foreign exchange contract to minimize foreign exchange risk from the trade date to the settlement date of such transactions.
The Fund does not separately report the effect of changes in foreign exchange rates from changes in market prices on securities held. Such changes are included in net realized and unrealized gain or loss from investments.
Reported net realized foreign exchange gains or losses arise from sales of foreign currencies, currency gains or losses realized between the trade and settlement dates on securities transactions and the difference between the amount of interest recorded on the Fund’s books, and the U.S. dollar equivalent of the amounts actually received or paid.
Federal Income Taxes: It is the policy of the Fund to comply with the provisions of the Internal Revenue Code applicable to "regulated investment companies" and to distribute all of its taxable income to its shareholders. Therefore, no provision for Federal income tax is required.
6
Thornburg Core Growth Fund
Notes to financial statements, continued
March 31, 2004
Dividends: Dividends to shareholders are generally paid quarterly and are reinvested in additional shares of the Fund at net asset value per share at the close of business on the dividend payment date, or at the shareholder’s option, paid in cash. Net realized capital gains, to the extent available, will be distributed at least annually. Distributions to shareholders are based on income tax regulations and therefore, their characteristics may differ for financial statement and tax purposes.
General: Securities transactions are accounted for on a trade date basis. Interest income is accrued as earned and dividend income is recorded on the ex-dividend date. Certain income from foreign securities is recognized as soon as information is available to the Fund. Realized gains and losses from the sale of securities are recorded on an identified cost basis. Net investment income, other than class specific expenses, and realized and unrealized gains and losses, are allocated daily to each class of shares based upon the relative net asset value of outstanding shares of each class of shares at the beginning of the day (after adjusting for the current share activity of the respective class). Expenses common to all funds are allocated among the funds comprising the Trust based upon their relative net asset values or other appropriate allocation methods.
Guarantees and Indemnifications: Under the Trust’s organizational documents, its officers and trustees are indemnified against certain liability arising out of the performance of their duties to the Fund. Additionally, in the normal course of business the Trust enters into contracts with service providers that contain general indemnification clauses. The Trust’s maximum exposure under these arrangements is unknown. However, based on experience, the Trust expects the risk of loss to be remote.
Use of Estimates: The preparation of financial statements, in conformity with generally accepted accounting principles, requires management to make estimates and assumptions that affect the reported amounts of assets and liabilities and the disclosure of contingent assets and liabilities at the date of the financial statements and the reported amounts of increases and decreases in net assets from operations during the reporting period. Actual results could differ from those estimates.
NOTE 3 — INVESTMENT ADVISORY FEE AND OTHER TRANSACTIONS WITH AFFILIATES
Pursuant to an investment advisory agreement, Thornburg Investment Management, Inc. (the “Advisor”) serves as the investment advisor and performs services to the Fund for which the fees are payable at the end of each month. For the period ended March 31, 2004, these fees were payable at annual rates ranging from .875 of 1% to .675 of 1% of the average daily net assets of the Fund depending on the Fund’s asset size. For the period ended March 31, 2004, the Advisor voluntarily waived investment advisory fees of $13,125. The Fund
also has an administrative services agreement with the Advisor, whereby the Advisor will perform certain administrative services for the shareholders of each class of the Fund’s shares, and for which fees will be payable at an annual rate of up to .125 of 1% of the average daily net assets attributable to each class of shares. For the period ended March 31, 2004, the Advisor voluntarily reimbursed certain class specific expenses and administrative fees of $1,384 for Class A shares, $5,227 for Class C shares, $16,457 for Class I shares, and $9,190 for Class R-1 shares.
The Fund has an underwriting agreement with Thornburg Securities Corporation (the “Distributor”), which acts as the Distributor of the Fund’s shares. For the period ended March 31, 2004, the Distributor has advised the Fund that it earned commissions aggregating $35,355 from the sale of Class A shares of the Fund and collected contingent deferred sales charges aggregating $2,136 from redemptions of Class C shares of the Fund.
Pursuant to a service plan under Rule 12b-1 of the Investment Company Act of 1940, the Fund may reimburse to the Advisor an amount not to exceed .25 of 1% per annum of its average daily net assets attributable to each class of shares of the Fund for payments made by the Advisor to securities dealers and other financial institutions to obtain various shareholder related services. The Advisor may pay out of its own resources additional expenses for distribution of the Fund’s shares.
The Fund has also adopted distribution plans pursuant to Rule 12b-1, applicable only to the Fund’s Class C and Class R-1 shares, under which the Fund compensates the Distributor for services in promoting the sale of Class C and Class R-1 shares of the Fund at an annual rate of up to ..75 of 1% of the average daily net assets attributable to Class C and Class R-1 shares. Total fees incurred by each class of shares of the Fund under its respective Service and Distribution Plans are set forth in the Statement of Operations.
The Fund has an agreement with the custodian bank to indirectly pay a portion of the custodian’s fees through credits earned by the Fund’s cash on deposit with the bank. This deposit agreement is an alternative to overnight investments. Custodial fees have been adjusted to reflect amounts that would have been paid without this agreement, with a corresponding adjustment reflected as fees paid indirectly in the statement of operations. For the period ended March 31, 2004, the fees paid indirectly were $4,126.
Certain officers and trustees of the Trust are also officers and/or directors of the Advisor and Distributor. The compensation of unaffiliated trustees is borne by the Trust.
At March 31, 2004, 16.1% of the Fund’s shares were owned by the Advisor and other affiliates of the Fund.
7
Thornburg Core Growth Fund
Notes to financial statements, continued
March 31, 2004
NOTE 4 — SHARES OF BENEFICIAL INTEREST
At March 31, 2004 there were an unlimited number of shares of beneficial interest authorized. Sales of Class R-1 and Class I shares commenced July 1, 2003 and November 1, 2003, respectively. Transactions in shares of beneficial interest were as follows:
| Period Ended March 31, 2004 | Year Ended September 30, 2003 | ||||||||
|---|---|---|---|---|---|---|---|---|---|
| Shares | Amount | Shares | Amount | ||||||
| Class A Shares | |||||||||
| Shares sold | 1,932,054 | $ 21,136,103 | 3,221,438 | $ 29,901,018 | |||||
| Shares repurchased** | (1,648,583 | ) | (17,943,790 | ) | (517,802 | ) | (4,270,244 | ) | |
| Net Increase (Decrease) | 283,471 | $ 3,192,313 | 2,703,636 | $ 25,630,774 | |||||
| **The Fund charges a redemption fee of 1% of the Class A shares exchanged within 90 days of purchase. For the year ended September 30, 2003 and period ended March 31, 2004, $29,916 and $14,808, respectively, were netted in the amount reported for shares repurchased | |||||||||
| Class C Shares | |||||||||
| Shares sold | 572,031 | $ 6,090,948 | 596,335 | $ 5,369,114 | |||||
| Shares repurchased | (85,042 | ) | (903,430 | ) | (167,711 | ) | (1,262,235 | ) | |
| Net Increase (Decrease) | 486,989 | $ 5,187,518 | 428,624 | $ 4,106,879 | |||||
| Class I Shares | |||||||||
| Shares sold | 1,579,541 | $ 17,382,156 | -- | $ -- | |||||
| Shares repurchased ** | (6,590 | ) | (73,516 | ) | -- | -- | |||
| Net Increase (Decrease) | 1,572,951 | $ 17,308,640 | -- | $ -- | |||||
| **The Fund charges a redemption fee of 1% of the Class I shares exchanged within 90 days of purchase. For the period ended March 31, 2004, $86 was netted in the amount reported for shares repurchased | |||||||||
| Class R-1 Shares | |||||||||
| Shares sold | -- | $ -- | 8 | $ 75 | |||||
| Shares repurchased | (2 | ) | (25 | ) | -- | -- | |||
| Net Increase (Decrease) | (2 | ) | $ (25 | ) | 8 | $ 75 | |||
NOTE 5 – SECURITIES TRANSACTIONS
For the period ended March 31, 2004 the Fund had purchase and sale transactions of investment securities (excluding short-term investments) of $58,010,442 and $32,580,870, respectively.
NOTE 6 – INCOME TAXES
At March 31, 2004, information on the tax components of capital is as follows:
| Cost of investments for tax purpose | $ 66,342,491 | ||
| Gross unrealized appreciation on a tax basis | $ 9,822,920 | ||
| Gross unrealized depreciation on a tax basis | (2,159,317 | ) | |
| Net unrealized appreciation | |||
| (depreciation) on investments (tax basis) | $ 7,663,603 | ||
At March 31, 2004, the Fund has deferred currency losses occurring subsequent to October 31, 2002 of $2,036. For tax purposes, such losses will be reflected in the year ending September 30, 2004.
At March 31, 2004, the Fund had tax basis capital losses of $2,280,382, which may be carried over to offset future capital gains. Such losses expire September 30, 2010.
Unutilized tax basis capital losses may be carried forward to offset realized gains in future years. To the extent such carry forwards are used, capital gains distributions may be reduced to the extent provided by regulations.
Net investment income and net realized gain (loss) differ for financial statement and tax purposes primarily due to differing treatments of wash sale losses, foreign currency transactions, index options, and losses realized subsequent to October 31 on the sale of foreign currencies.
8
March 31, 2004
| Financial highlights | ||||
|---|---|---|---|---|
| Thornburg Core Growth Fund | ||||
| Six Months Ended March 31, | Year Ended | September 30, | Period Ended September 30, | |
| 2004 | 2003 | 2002 | 2001(c) | |
| Class A Shares: | ||||
| Per Share Performance | ||||
| (for a share outstanding throughout the period)+ | ||||
| Net asset value, beginning of period | $ 10.11 | $ 6.45 | $ 7.80 | $ 11.94 |
| Income from investment operations: | ||||
| Net investment income | (0.08) | (0.13) | (0.12) | (0.08) |
| Net realized and unrealized | ||||
| gain (loss) on investments | 0.96 | 3.77 | (1.23) | (4.06) |
| Total from investment operations | 0.88 | 3.64 | (1.35) | (4.14) |
| Redemption fees added to paid in capital | -- | 0.02 | -- | -- |
| Change in net asset value | 0.88 | 3.66 | (1.35) | (4.14) |
| Net asset value, end of period | $ 10.99 | $ 10.11 | $ 6.45 | $ 7.80 |
| Total return (a) | 8.70% | 56.74% | (17.31)% | (34.67)% |
| Ratios/Supplemental Data | ||||
| Ratios to average net assets: | ||||
| Net investment income | (1.39)%(b) | (1.43)% | (1.44)% | (1.02)% |
| (b) | ||||
| Expenses, after expense reductions | 1.61%(b) | 1.65% | 1.64% | 1.71%(b) |
| Expenses, after expense reductions | ||||
| and net of custody credits | 1.59%(b) | 1.63% | 1.63% | -- |
| Expenses, before expense reductions | 1.66%(b) | 2.03% | 2.39% | 2.80%(b) |
| Portfolio turnover rate | 54.96% | 102.91% | 212.17% | 126.15% |
| Net assets at end of period (000) | $ 42,508 | $ 36,247 | 5,685 | 6,337 |
(a) Sales loads are not reflected in computing total return, which is not annualized for periods less than one year.
(b) Annualized.
(c) Fund commenced operations on December 27, 2000.
+ Based on weighted average shares outstanding.
9
| Financial highlights, Continued | |
|---|---|
| Thornburg Core Growth Fund | |
| Period Ended March 31, | |
| 2004(c) | |
| Class I Shares: | |
| Per Share Performance | |
| (for a share outstanding throughout the period)+ | |
| Net asset value, beginning of period | $ 10.87 |
| Income from investment operations: | |
| Net investment income | (0.04) |
| Net realized and unrealized | |
| gain (loss) on investments | 0.19 |
| Total from investment operations | 0.15 |
| Change in net asset value | 0.15 |
| Net asset value, end of period | $ 11.02 |
| Total return (a) | 9.89% |
| Ratios/Supplemental Data | |
| Ratios to average net assets: | |
| Net investment income | (0.79)%(b) |
| Expenses, after expense reductions | 1.00% (b) |
| Expenses, after expense reductions | |
| and net of custody credits | 0.99% (b) |
| Expenses, before expense reductions | 1.33% (b) |
| Portfolio turnover rate | 54.96% |
| Net assets at end of period (000) | $ 17,330 |
(a) Total return is not annualized for periods less than one year.
(b) Annualized.
(c) Effective date of Class I Shares was November 01, 2003.
+ Based on weighted average shares outstanding.
10
| Schedule of investments | ||||||||
|---|---|---|---|---|---|---|---|---|
| Thornburg Core Growth Fund | March 31, 2004 | |||||||
| CUSIPS: CLASS A - 885-215-582, CLASS C - 885-215-574, CLASS I - 885-215-475, CLASS R-1 - 885-215-517 NASDAQ SYMBOLS: CLASS A - THCGX , CLASS C - TCGCX, CLASS I - THIGX, CLASS R-1 THCRX | ||||||||
| Shares | Value | |||||||
| COMMON STOCKS - 97.30% | ||||||||
| AUTOMOBILES & COMPONENTS (3.10%) | ||||||||
| Hero Honda Motors Ltd. | 199,800 | $ | 2,260,482 | |||||
| CONSUMER DURABLES & APPAREL (3.60%) | ||||||||
| Carter's Inc. + | 55,055 | 1,574,022 | ||||||
| Tempur-Pedic International Inc. + | 71,975 | 1,125,689 | ||||||
| DIVERSIFIED FINANCIALS (8.10%) | ||||||||
| Affiliated Managers Group Inc. + | 25,095 | 1,369,685 | ||||||
| Capital One Financial Corp. | 42,870 | 3,233,684 | ||||||
| E-Trade Financial Corp. + | 101,665 | 1,357,228 | ||||||
| ENERGY (5.10%) | ||||||||
| Apache Corp. | 47,820 | 2,064,389 | ||||||
| Evergreen Resources + | 50,260 | 1,726,431 | ||||||
| HEALTHCARE EQUIPMENT & SERVICES (19.60%) | ||||||||
| Anthem Inc. + | 27,700 | 2,510,728 | ||||||
| Boston Scientific Corp. + | 79,400 | 3,364,972 | ||||||
| Caremark Rx Inc. + | 53,400 | 1,775,550 | ||||||
| eResearch Technology Inc. + | 64,895 | 1,820,305 | ||||||
| Guidant Corp. | 39,870 | 2,526,562 | ||||||
| UnitedHealth Group Inc. | 38,600 | 2,487,384 | ||||||
| INSURANCE (3.10%) | ||||||||
| Platinum Underwriters Holdings | 71,830 | 2,302,152 | ||||||
| MEDIA (5.80%) | ||||||||
| Comcast Corp. + | 80,100 | 2,233,188 | ||||||
| The Directv Group Inc. + | 132,688 | 2,040,741 | ||||||
| PHARMACEUTICALS & BIOTECHNOLOGY (5.70%) | ||||||||
| Amgen Inc. + | 37,600 | 2,187,192 | ||||||
| Gilead Sciences Inc. + | 36,750 | 2,049,547 | ||||||
| RETAILING (5.20%) | ||||||||
| GameStop Corp. + | 94,850 | 1,709,197 | ||||||
| InterActiveCorp + | 67,700 | 2,138,643 | ||||||
| SEMICONDUCTOR EQUIPMENT (2.40%) | ||||||||
| August Technology Corp. + | 14,500 | 217,500 | ||||||
| Novellus Systems Inc. + | 49,350 | 1,568,837 | ||||||
| SOFTWARE & SERVICES (4.00%) | ||||||||
| Amdocs Ltd + | 50,100 | 1,392,279 | ||||||
| Open Solutions Inc. + | 71,400 | 1,576,512 | ||||||
| TECHNOLOGY - HARDWARE & EQUIPMENT (19.00%) | ||||||||
| ASE Test Ltd + | 155,800 | 1,713,800 | ||||||
| Atheros Communications Inc. + | 103,500 | 1,770,885 | ||||||
| Dell Inc. + | 67,800 | 2,279,436 | ||||||
| Ditech Communications Corp. + | 87,000 | 1,450,290 | ||||||
| Nam Tai Electronics | 48,800 | $ | 1,240,008 | |||||
| Samsung Electronics Co. Ltd. | 5,500 | 2,744,123 | ||||||
| Semiconductor Mfg. Intl. Corp. + | 87,045 | 1,314,380 | ||||||
| Silicon Laboratories Inc. + | 30,175 | 1,595,654 | ||||||
| TELECOMMUNICATION SERVICES (10.40%) | ||||||||
| Mobile Telesystems | 12,800 | 1,683,200 | ||||||
| Netease.com Inc. + | 26,000 | 1,294,540 | ||||||
| Nextel Communications Inc. + | 105,400 | 2,606,542 | ||||||
| NII Holdings Inc. + | 59,430 | 2,081,833 | ||||||
| TRANSPORTATION (2.20%) | ||||||||
| JetBlue Airways Corp. + | 64,000 | 1,618,560 | ||||||
| TOTAL COMMON STOCKS (Cost $64,396,632) | -- | 72,006,150 | ||||||
| SHORT TERM INVESTMENTS - 2.70% | ||||||||
| American General Finance Corp., 1.03% due 4/2/2004 | 2,000,000 | 1,999,943 | ||||||
| TOTAL SHORT TERM INVESTMENTS (Cost $1,999,943) | -- | 1,999,943 | ||||||
| TOTAL INVESTMENTS (100%) (Cost $66,396,575) | -- | $ | 74,006,093 | |||||
| +Non-income producing | ||||||||
| See notes to financial statements | ||||||||
12
Thornburg Core Growth Fund
Portfolio proxy Voting
March 31, 2004
Policies and Procedures (Unaudited):
The Trust has delegated to Thornburg Investment Management, Inc. (“the Advisor”) voting decisions respecting proxies for the Fund’s voting securities. The Advisor makes voting decisions in accordance with its Proxy Voting Policy and Procedures. A description of the policy and Procedures is available (i) without charge, upon request, by calling the Advisor toll-free at 1.800.847.0200, (ii) on the Thornburg website at www.thornburg.com, and (iii) on the Securities and Exchange Commission’s website at www.sec.gov.
Commencing August 31, 2004, information regarding how proxies were voted will be available on or before August 31 of each year for the twelve months ending the preceding June 30. This information will be available (i) without charge, upon request, on the Thornburg website at www.thornburg.com and (ii) on the Securities and Exchange Commission’s website at www.sec.gov.
13
Investment Manager Thornburg Investment Management, Inc.
119 East Marcy Street
Santa Fe, New Mexico 87501
800.847.0200
Principal Underwriter Thornburg Securities Corporation
119 East Marcy Street
Santa Fe, New Mexico 87501
800.847.0200
This report is submitted for the general information of shareholders of the Fund. It is not authorized for distribution to prospective investors in the Fund unless preceded or accompanied by an effective prospectus. Carefully consider information in the prospectus regarding the Fund’s investment objectives and policies, risks, sales charges, expenses, experience of its management, marketability of shares, and other information. Performance data quoted represent past performance and do not guarantee future results.
www.thornburg.com
Thornburg Investment Income Builder Fund
semi-Annual Report March 31, 2004
Thornburg Investment Income Builder Fund
Letter to shareholders
April 13, 2004
Dear Fellow Shareholder:
Recall that the objective of the Thornburg Investment Income Builder Fund is to pay attractive, growing dividends to shareholders. As a byproduct of achieving this, we also aim to generate capital appreciation of the share price over time. Following are the quarterly dividends paid by your Fund in the last five quarters:
| 2003 | 2003 | 2003 | 2003 | 2004 | |
|---|---|---|---|---|---|
| March Qtr. | June Qtr. | Sept. Qtr. | Dec. Qtr. | March Qtr. | |
| A Shares | 9.2 | 11.2 | 12.4 | 17.5 | 10.2 |
| C Shares | 8.3 | 9.5 | 10.4 | 15.9 | 8.4 |
The net asset values of the A and C shares ended the fiscal period at $15.62 and $15.63, having increased by 43 and 42 cents, respectively, since December 31, 2003. It’s a challenging objective, but we will attempt to improve on the calendar 2003 dividend in 2004. The numbers above make clear that each sequential quarter’s dividend will not increase over the prior quarter. There is seasonality in the flow of dividends, particularly outside the USA. Nevertheless, the progress of the March 2004 dividend against the prior year’s level is a good start toward our objective.
On March 31, 2004, your Fund had 51 equity holdings, comprising 85% of Fund assets. Your Fund also owned 28 different bonds and short-term investments.
We were busy last quarter meeting with a variety of company managements worldwide. As a general rule, order books are improving. Against this general backdrop of heightened activity, not all business managers are smiling. Why? Not all companies can pass along increases in input costs. Input costs have been rising for firms that make intensive use of the most basic materials. Component suppliers, in particular, are challenged to pass these higher costs along.
In your Thornburg Investment Income Builder Portfolio, this challenge is reflected in the negative year-to-date price performance of PPG Industries (PPG) (chemical ingredients) and Sindo Ricoh (029530 KS) (copiers and printers, including much private label production). One may not think of banks as users of “basic materials,” but their input, money, is quite basic. While the cost of money is low these days, U.S. and U.K. investors are worried that it will soon be rising. We believe the ability of various banks to benefit or be hurt by this is quite varied. (Some banks always pay a market price for money, some get it for below market prices. Some lend at market, some below). We have invested, and will likely continue to invest, a significant percentage of this portfolio in banks and financial services firms. We will try to orient our investments toward those that buy money below market, sell money at market, and can benefit from rising interest rates. The return performance of our banking & financial holdings was mixed during the first quarter, with Lincoln National (LNC) and Citigroup (C)among the best in the Fund, while our non-U.S. banks lagged.
Your portfolio had input cost winners, too. The oil company holdings in the Fund—Ente Nazionale Idrocarburi (ENI), Petrobras (PBR), BP Plc. (BP), and Occidental Petroleum (OXY)—performed well in the first quarter. Petrochina (PTR.N) performed so well relative to other oil and gas companies that we sold it early in the quarter. We are a bit nervous about the 11% weighting of the energy holdings in your Investment Income Builder portfolio. We do take com
| Exposure at | |
|---|---|
| Industry Grouping | March 31, 2004 |
| Banks | 11.2% |
| Energy | 11.0% |
| Diversified Financials | 10.7% |
| Telecommunication Services | 8.8% |
| Food Beverage & Tobacco | 6.4% |
| Other Key Summary Statistics | |
|---|---|
| Bonds and Cash | 15% |
| Domestic Equity | 37% |
| Foreign Equity | 48% |
Percentages and holdings can and do vary over time.
1
Thornburg Investment Income Builder Fund
Letter to shareholders
fort in the fact that senior oil company executives have told us that their assumed oil price when evaluating projects remains in the $16–$20 per barrel range (around 50% of today’s price). This indicates that over- investment in the global oil patch, unlike in so many industries in today’s liquidity-rich world, is not yet present. As owners, we are comforted by that and by the growing energy demand of India, China, and other energy-poor economies that have grown rapidly in recent years. Your portfolio’s collection of telephony service providers—Hungary’s Matav (MATAV HB), Italy’s Telecom Italia Mobile (TIM IM), Portugal Telecom (PT), and Alltel (AT)—operate largely fixed-cost businesses. The fixed assets they need are largely in place, for the time being. These businesses are generating wonderful cash flows, paying attractive dividends, and all have attractive mobile telephony franchises. We sold shares of lower-yielding Vodaphone (VOD), which played a constructive role in the portfolio while we held it, when we added these higher dividend payers. Business conditions, and first quarter stock price performance of Samsung Electronics (05930 KS), Korea Tobacco & Ginseng (033780 KS), and Independent News & Media (INWS ID), were all good. These firms sell, respectively, semiconductors/digital appliances, tobacco/tea/ginseng, and newspapers/outdoor advertising.
When you put it all together, Thornburg Investment Income Builder Fund had more winners than losers in the first quarter. We shortened the duration of the bond component of your portfolio from around 3.5 years to 2.3 years, and decreased the bond/cash portfolio allocation from 16% to 15% during the quarter. If we see rising yields in the coming months, we are well positioned to increase our bond allocation to take advantage. In the meantime, we can find enough attractive dividend paying stocks to be patient. The Thornburg Investment Income Builder Fund Class A shares rose 3.5% in the first quarter, and increased 37.8% during the past twelve months. This compares with a 2.6% increase in the blended benchmark, and a 19.1% rise over the trailing twelve months.
Your Fund’s investments are reported to you in the latter pages of this report. You can read more about the equity investments in your Fund by going to www.thornburg.com/funds. (If you do not have internet access, please call us at 800-847-0200. We will print and mail you a copy.) You can follow price movements of your shares at www.thornburg.com, under “Daily NAVs”. Your Fund has reached the size at which daily price quotes for the “A” shares are appearing in many newspapers around the country. Thank you for your support, and best wishes.
Sincerely,
 |  | |
|---|---|---|
| Brian McMahon | Brad Kinkelaar | Steven J. Bohlin |
| President & Chief Investment Officer | Managing Director | Managing Director |
Past performance is no guarantee of future results. Current returns may be either lower or higher than those shown. Share prices and returns will fluctuate and investors may experience a loss upon redemption. There is no guarantee that the Fund will meet its objectives. Shares in the Fund carry risks, including possible loss of principal. Carefully consider the Fund’s investment objectives, risks, sales charges, and expenses; this information is found in the prospectus, which is available from your financial advisor or from www.thornburg.com. Read it carefully before you invest or send money. For month-end performance information, or for information and commentary on Fund holdings, including links to each company’s home page, visit www.thornburg.com.
The blended index is comprised of 25% Lehman Brothers Aggregate Bond Index and 75% MSCI World Equity Index. The Lehman Brothers Aggregate Bond Index is composed of approximately 6,000 publicly traded bonds including US government, mortgage-backed, corporate and Yankee bonds with an average maturity of approximately 10 years. The index is weighted by the market value of the bond included in the index. This index represents asset types which are subject to risk, including loss of principal. The Morgan Stanley Capital International World Equity Index is a total return index, reported in US dollars, based on share prices and reinvested gross dividends of approximately 1600 companies from 22 countries: Australia, Austria, Belgium, Canada, Denmark, Finland, France, Germany, Hong Kong, Ireland, Italy, Japan, Malaysia, Netherlands, New Zealand, Norway, Singapore, Spain, Sweden, Switzerland, the United Kingdom, and the United States. Unless otherwise noted, index returns reflect the reinvestment of income dividends and capital gains, if any, but do not reflect fees, brokerage commissions or other expenses of investing. Investors may not make direct investments into any index.
There are special risk considerations associated with international investing, including fluctuating exchange rates, government regulations and differences in liquidity, which may affect the volatility of the fund.
2
Thornburg Investment Income Builder Fund
regarding the dividend landscape
The S&P 500 Index Payout Ratio -- A Historical Perspective

| The dividend payout ratio is a fraction that expresses dividend payments as a percentage of per-share earnings. By long-term historical standards, the dividend payout ratio of the S&P 500 Index is relatively low at this time. |
| The Standard & Poor’s 500 Stock Index (S&P 500) is an unmanaged index generally representative of the U.S. Stock Market, without regard to company size. |
Corporate Willingness to Pay Dividends is Improving
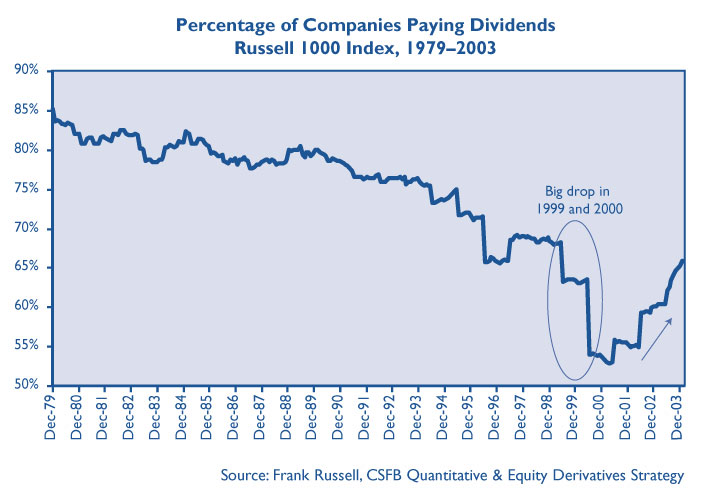
| The Russell 1000 Index includes 1000 public companies that are supposed to be generally representative of corporate America. Between 1980 and 1993, at least 80% of these firms paid some dividend. Between 1994 and 2001, the percentage of Russell 1000 companies paying dividends sunk to just over 50%, indicating investor and management preference for reinvesting retained earnings in growth initiatives. Now the pendulum appears to be swinging back, and the percentage of dividend payers is increasing. Long-term academic studies have shown that subsequent earnings-per-share growth of dividend-paying firms actually exceeds that of non-payers. |
3
Thornburg Investment Income Builder Fund
Regarding the dividend landscape, continued
March 31, 2004
Rising Dividend Payments Despite Changing Dividend Yields
Over time, the dollar dividend per unit of the S&P 500 Index has increased. Because the price of the index itself has increased even more, the yield on the S&P 500 Index, as a percentage of the current index price, has generally decreased in recent decades. You should note, however, that the yield on the original investment made at a fixed point in time (say, 1970 or 1989) has increased, even without reinvestment of dividends.
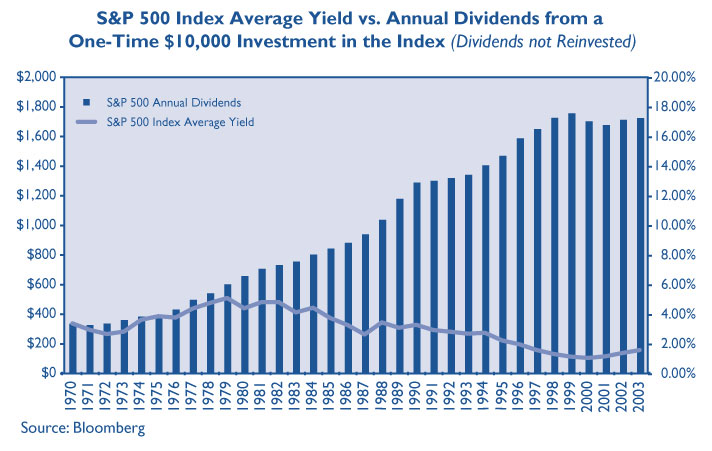
A Truly Diversified Dividend-Paying PortfolioMust
Look Beyond the Obvious High Yield Stocks!
In the (large cap) Russell 1000 Index, 81% of the top 100 dividend payers are either real estate investment trusts (REITs) or utilities. In the (small cap) Russell 2000 Index, 87% of the top 100 dividend-yielding stocks are either REITs or utilities. In order to construct a diversified portfolio of attractive yielding stocks, one must beyond these two sectors. We do!
| The Top 100 Dividend Yields | |||||
|---|---|---|---|---|---|
| Russell 1000 Index | Russell 2000 Index | ||||
| REITs | 47 | % | 78 | % | |
| Utilities | 34 | % | 9 | % | |
| Banks | 6 | % | 2 | % | |
| Other Financials | 2 | % | 1 | % | |
| Cons. Staples | 5 | % | 3 | % | |
| Telecom | 3 | % | 0 | % | |
| Materials | 2 | % | 2 | % | |
| Health Care | 1 | % | 0 | % | |
| Consumer Discretionary | 0 | % | 4 | % | |
| Industrials | 0 | % | 1 | % | |
| Energy | 0 | % | 0 | % | |
| Technology | 0 | % | 0 | % | |
Source: Bloomberg (Numbers may not add to 100% due to rounding.)
The Russell 1000 Index consists of the 1,000 largest securities in the Russell 3000 Index, which represents approximately 90% of the total market capitalization of the Russell 3000 Index. It is a large-cap, market-oriented index and is highly correlated with the S&P 500 Index. The Russell 2000 Index is an unmanaged index generally representative of the 2,000 smallest companies in the Russell 3000 Index, which represents approximately 10% of the total market capitalization of the Russell 3000 Index.
4
Thornburg Investment Income Builder Fund
regarding the dividend landscape, continued
March 31, 2004
Global Diversification Can Improve the Portfolio Yield
| Since firms outside the U.S. tend to pay higher dividends than U.S. firms, particularly outside the REIT and utility sectors, we diversify the Thornburg Investment Income Builder portfolio into some foreign dividend-paying stocks to take advantage of these opportunities. |
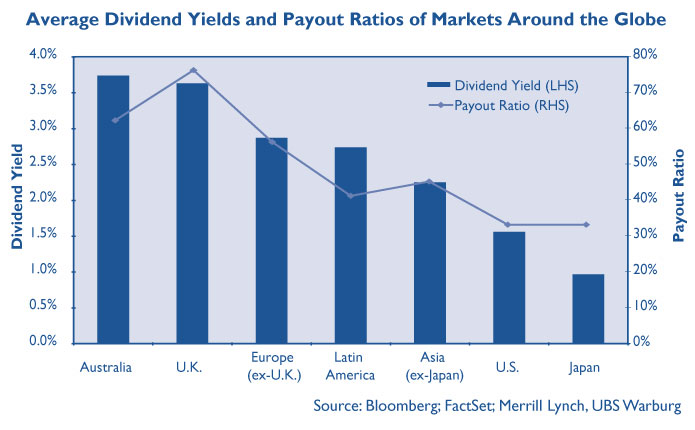
Corporate Willingness to Pay Dividends May Come from Unlikely Sources
| Since the passage of the 2003 tax bill, which lowered maximum tax rates on dividends to 15%, Citigroup and several other leading U.S. firms have redirected funds previously allocated to share buybacks to increased dividend payments. This graph shows the potential for dividend increases, by S&P sector, if all funds used to repurchase shares were to be redirected to dividend payments. We do not expect this outcome, but we are seeing movement in this direction. |
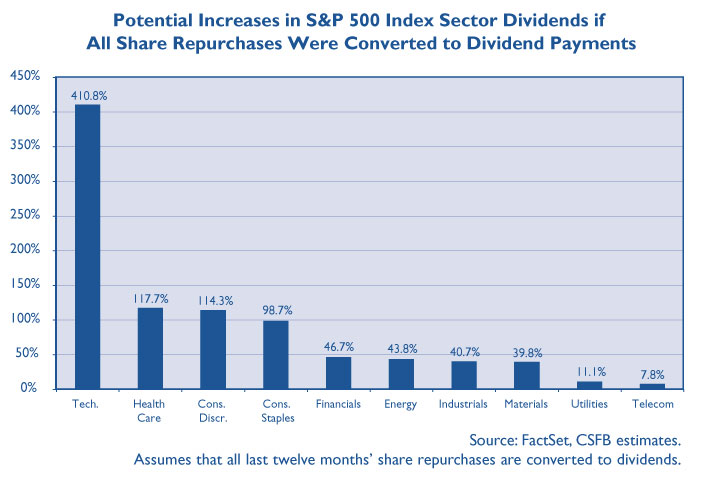
5
| Statement of assets and liabilities | |||
|---|---|---|---|
| Thornburg Investment Income Builder Fund | March 31, 2004 | ||
| (Unaudited) | |||
| ASSETS | |||
| Investments at value (cost $270,006,418) | $286,166,386 | ||
| Cash | 330,197 | ||
| Cash denominated in foreign currency (cost $1,189,424) | 1,234,066 | ||
| Receivable for fund shares sold | 2,749,239 | ||
| Unrealized gain (loss) on forward exchange contracts (Note 6) | 36,438 | ||
| Dividends receivable | 3,644,420 | ||
| Interest receivable | 403,960 | ||
| Prepaid expenses and other assets | 65,505 | ||
| Total Assets | 294,630,211 | ||
| LIABILITIES | |||
| Payable for securities purchased | 12,162,842 | ||
| Payable for fund shares redeemed | 97,805 | ||
| Payable to investment advisor (Note 3) | 194,352 | ||
| Accounts payable and accrued expenses | 553,642 | ||
| Dividends payable | 1,412,338 | ||
| Total Liabilities | 14,420,979 | ||
| NET ASSETS | $280,209,232 | ||
| NET ASSETS CONSIST OF: | |||
| Undistributed net investment income | $ 2,144,853 | ||
| Net unrealized appreciation (depreciation) on investments | 16,211,438 | ||
| Accumulated net realized gain (loss) | 5,139,403 | ||
| Net capital paid in on shares of beneficial interest | 256,713,538 | ||
| $280,209,232 | |||
| NET ASSET VALUE: | |||
| Class A Shares: | |||
| Net asset value and redemption price per share | |||
| ($163,271,671 applicable to 10,455,836 shares of beneficial | |||
| interest outstanding - Note 4) | $ 15.62 | ||
| Maximum sales charge, 4.50% of offering price | 0.74 | ||
| Maximum Offering Price Per Share | $ 16.36 | ||
| Class C Shares: | |||
| Net asset value and offering price per share * | |||
| ($98,969,828 applicable to 6,330,504 shares of beneficial | |||
| interest outstanding - Note 4) | $ 15.63 | ||
| Class I Shares: | |||
| Net asset value, offering and redemption price per share | |||
| ($17,967,733 applicable to 1,149,755 shares of beneficial | |||
| interest outstanding - Note 4) | $ 15.63 | ||
| *Redemption price per share is equal to net asset value less any applicable contingent deferred sales charge | |||
| See notes to financial statements | |||
6
| Statement of Operations | |||
|---|---|---|---|
| Thornburg Investment Income Builder Fund | Six months ended March 31, 2004 | ||
| (Unaudited) | |||
| INVESTMENT INCOME | |||
| Dividend income (net of foreign taxes withheld of $511,672) | $ 5,402,281 | ||
| Interest income (net of premium amortized of $61,187) | 824,400 | ||
| Total Income | 6,226,681 | ||
| EXPENSES | |||
| Investment advisory fees (Note 3) | 818,859 | ||
| Administration fees (Note 3) | |||
| Class A Shares | 70,237 | ||
| Class C Shares | 40,240 | ||
| Class I Shares | 2,559 | ||
| Distribution and service fees (Note 3) | |||
| Class A Shares | 143,115 | ||
| Class C Shares | 327,678 | ||
| Transfer agent fees | |||
| Class A Shares | 53,860 | ||
| Class C Shares | 32,890 | ||
| Class I Shares | 5,912 | ||
| Registration & filing fees | |||
| Class A Shares | 5,856 | ||
| Class C Shares | 4,529 | ||
| Class I Shares | 6,408 | ||
| Custodian fees (Note 3) | 54,515 | ||
| Professional fees | 12,247 | ||
| Accounting fees | 2,257 | ||
| Trustee fees | 1,760 | ||
| Other expenses | 24,626 | ||
| Total Expenses | 1,607,548 | ||
| Less: | |||
| Expenses reimbursed by investment advisor (Note 3) | (119,820 | ) | |
| Fees paid indirectly (Note 3) | (5,425 | ) | |
| Net Expenses | 1,482,303 | ||
| Net Investment Income | 4,744,378 | ||
| REALIZED AND UNREALIZED GAIN (LOSS) | |||
| Net realized gain (loss) on: | |||
| Investments | 5,444,223 | ||
| Foreign currency transactions | (176,369 | ) | |
| 5,267,854 | |||
| Net change in unrealized appreciation (depreciation) on: | |||
| Investments | 12,661,497 | ||
| Foreign currency translations | 46,447 | ||
| 12,707,944 | |||
| Net Realized and Unrealized | |||
| Gain (Loss) on Investments | 17,975,798 | ||
| Net Increase (Decrease) in Net Assets Resulting | |||
| From Operations | $ 22,720,176 | ||
| See notes to financial statements | |||
7
| Statements of Changes in net assets | |||||
|---|---|---|---|---|---|
| Thornburg Investment Income Builder Fund | |||||
| Six Months Ended March 31, 2004 | For the period from December 24, 2002 (commencement of operations) to September 30, 2003 | ||||
| INCREASE (DECREASE) IN NET ASSETS FROM: | |||||
| OPERATIONS: | |||||
| Net investment income | $ 4,744,378 | $ 1,531,993 | |||
| Net realized gain (loss) on investments and foreign currency | |||||
| transactions | 5,267,854 | (150,743 | ) | ||
| Increase (Decrease) in unrealized appreciation | |||||
| on investments and foreign currency translations | 12,707,944 | 3,503,494 | |||
| Net Increase (Decrease) in Net Assets | |||||
| Resulting from Operations | 22,720,176 | 4,884,744 | |||
| DIVIDENDS TO SHAREHOLDERS: | |||||
| From net investment income | |||||
| Class A Shares | (1,994,505 | ) | (662,771 | ) | |
| Class C Shares | (989,576 | ) | (266,157 | ) | |
| Class I Shares | (196,217 | ) | 0 | ||
| FUND SHARE TRANSACTIONS - (Note 4) | |||||
| Class A Shares | 78,091,295 | 70,256,269 | |||
| Class C Shares | 52,693,164 | 38,483,680 | |||
| Class I Shares | 17,189,130 | 0 | |||
| Net Increase in Net Assets | 167,513,467 | 112,695,765 | |||
| NET ASSETS: | |||||
| Beginning of period | 112,695,765 | 0 | |||
| End of period | $ 280,209,232 | $ 112,695,765 | |||
| See notes to financial statements | |||||
8
Thornburg Investment Income Builder Fund
Notes to financial statements
NOTE 1 – ORGANIZATION Thornburg Investment Income Builder Fund, hereinafter referred to as the “Fund,” is a diversified series of Thornburg Investment Trust (the “Trust”). The Fund commenced operations on December 24, 2002. The Trust was organized as a Massachusetts business trust under a Declaration of Trust dated June 3, 1987 and is registered as a diversified, open-end management investment company under the Investment Company Act of 1940, as amended. The Trust is currently issuing nine series of shares of beneficial interest in addition to those of the Fund: Thornburg Limited Term U.S. Government Fund, Thornburg New Mexico Intermediate Municipal Fund, Thornburg Intermediate Municipal Fund, Thornburg Limited Term Income Fund, Thornburg Florida Intermediate Municipal Fund, Thornburg Value Fund, Thornburg International Value Fund, Thornburg New York Intermediate Municipal Fund and Thornburg Core Growth Fund. Each series is considered to be a separate entity for financial reporting and tax purposes and bears expenses directly attributable to it. The Fund pursues its investment objectives by investing in a broad range of income producing securities, primarily including stocks and bonds.
The Fund currently offers three classes of shares of beneficial interest, Class A, Class C, and Institutional Class (Class I) shares. Each class of shares of the Fund represents an interest in the same portfolio of investments of the Fund, except that (i) Class A shares are sold subject to a front-end sales charge collected at the time the shares are purchased and bear a service fee, (ii) Class C shares are sold at net asset value without a sales charge at the time of purchase, but are subject to a contingent deferred sales charge upon redemption within one year, and bear both a service fee and a distribution fee, (iii) Class I shares are sold at net asset value without a sales charge at the time of purchase, and (iv) the respective classes have different reinvestment privileges. Additionally, the Fund may allocate among its classes certain expenses, to the extent allowable, to specific classes including transfer agent fees, government registration fees, certain printing and postage costs, and administration and legal expenses. Currently, class specific expenses of the Fund are limited to service and distribution fees, administration fees and certain registration and transfer agent expenses.
NOTE 2 – SIGNIFICANT ACCOUNTING POLICIES Significant accounting policies of the Fund are as follows:
Valuation of Securities: In determining net asset value, investments are stated at value based on latest sales prices, normally at 4:00 pm EST, reported on national securities exchanges on the last business day of the period. Investments for which no sale is reported are valued at the mean between bid and asked prices. Securities for which market quotations are not readily available are valued at fair value as determined by management and approved in good faith by the Board of Trustees. Short term obligations having remaining
maturities of 60 days or less are valued at amortized cost, which approximates market value.
Foreign Currency Translation: Portfolio securities and other assets and liabilities denominated in foreign currencies are translated into U.S. dollars based on the exchange rate of such currencies against the U.S. dollar on the date of valuation. Purchases and sales of securities and income items denominated in foreign currencies are translated into U.S. dollars at the exchange rate in effect on the translation date. When the Fund purchases or sells foreign securities it will customarily enter into a foreign exchange contract to minimize foreign exchange risk from the trade date to the settlement date of such transactions.
The Fund does not separately report the effect of changes in foreign exchange rates from changes in market prices on securities held. Such changes are included in net realized and unrealized gain or loss from investments.
Reported net realized foreign exchange gains or losses arise from sales of foreign currencies, currency gains or losses realized between the trade and settlement dates on securities transactions and the difference between the amount of interest recorded on the Fund’s books and the U.S. dollar equivalent of the amounts actually received or paid.
Federal Income Taxes: It is the policy of the Fund to comply with the provisions of the Internal Revenue Code applicable to “regulated investment companies” and to distribute all of its taxable income to its shareholders. Therefore, no provision for Federal income tax is required.
When-Issued and Delayed Delivery Transactions: The Fund may engage in when-issued or delayed delivery transactions. To the extent the Fund engages in such transactions, it will do so for the purpose of acquiring portfolio securities consistent with its investment objectives and not for the purpose of investment leverage or to speculate on market changes. At the time the Fund makes a commitment to purchase a security on a when-issued basis, it will record the transaction and reflect the value in determining its net asset value. When effecting such transactions, assets of the Fund of an amount sufficient to make payment for the portfolio securities to be purchased will be segregated on the Fund’s records on the trade date.
Dividends: Net investment income of the Fund is declared daily as a dividend on shares for which the Fund has received payment. Dividends are paid quarterly and are reinvested in additional shares of the Fund at net asset value per share at the close of business on the dividend payment date, or at the shareholder’s option, paid in cash. Net capital gains, to the extent available, will be distributed at least annually. Distributions to shareholders are based on income tax regulations and therefore, their characteristics may differ for financial statement and tax purposes.
9
Thornburg Investment Income Builder Fund
Notes to financial statements, continued
March 31, 2004
General: Securities transactions are accounted for on a trade date basis. Interest income is accrued as earned and dividend income is recorded on the ex-dividend date. Certain income from foreign securities is recognized as soon as information is available to the Fund. Realized gains and losses from the sale of securities are recorded on an identified cost basis. Net investment income, other than class specific expenses, and realized and unrealized gains and losses, are allocated daily to each class of shares based upon the relative net asset value of outstanding shares of each class of shares at the beginning of the day (after adjusting for the current share activity of the respective class). Expenses common to all funds are allocated among the funds comprising the Trust based upon their relative net asset values or other appropriate allocation methods.
Guarantees and Indemnifications: Under the Trust’s organizational documents, its officers and trustees are indemnified against certain liability arising out of the performance of their duties to the Fund. Additionally, in the normal course of business the Trust enters into contracts with service providers that contain general indemnification clauses. The Trust’s maximum exposure under these arrangements is unknown. However, based on experience, the Trust expects the risk of loss to be remote.
Use of Estimates: The preparation of financial statements, in conformity with generally accepted accounting principles, requires management to make estimates and assumptions that affect the reported amounts of assets and liabilities and the disclosure of contingent assets and liabilities at the date of the financial statements and the reported amounts of increases and decreases in net assets from operations during the reporting period. Actual results could differ from those estimates.
NOTE 3 — INVESTMENT ADVISORY FEE AND OTHER TRANSACTIONS WITH AFFILIATES
Pursuant to an investment advisory agreement, Thornburg Investment Management, Inc. (the “Advisor”) serves as the investment advisor and performs services to the Fund for which the fees are payable at the end of each month. For the period ended March 31, 2004, these fees were payable at annual rates ranging from .875 of 1% to .675 of 1% of the average daily net assets of the Fund depending on the Fund’s asset size. The Fund also has an administrative services agreement with the Advisor, whereby the Advisor will perform certain administrative services for the shareholders of each class of the Fund’s shares, and for which fees will be payable at an annual rate of up to .125 of 1% of the average daily net assets attributable to each class of shares. For the period ended March 31, 2004, the Advisor voluntarily reimbursed certain class specific expenses and administrative fees of $105,681 for Class C shares and $14,139 for Class I shares.
The Fund has an underwriting agreement with Thornburg Securities Corporation (the “Distributor”), which acts as the
Distributor of the Fund’s shares. For the period ended March 31, 2004, the Distributor has advised the Fund that it earned commissions aggregating $144,304 from the sale of Class A shares of the Fund and collected contingent deferred sales charges aggregating $6,020 from redemptions of Class C shares of the Fund.
Pursuant to a service plan under Rule 12b-1 of the Investment Company Act of 1940, the Fund may reimburse to the Advisor an amount not to exceed .25 of 1% per annum of its average daily net assets attributable to each class of shares of the Fund for payments made by the Advisor to securities dealers and other financial institutions to obtain various shareholder related services. The Advisor may pay out of its own resources additional expenses for distribution of the Fund’s shares.
The Fund has also adopted distribution plans pursuant to Rule 12b-1, applicable only to the Fund’s Class C shares, under which the Fund compensates the Distributor for services in promoting the sale of Class C shares of the Fund at an annual rate of up to .75 of 1% of the average daily net assets attributable to Class C shares. Total fees incurred by each class of shares of the Fund under its respective Service and Distribution Plans are set forth in the statement of operations.
The Fund has an agreement with the custodian bank to indirectly pay a portion of the custodian’s fees through credits earned by the Fund’s cash on deposit with the bank. This deposit agreement is an alternative to overnight investments. Custodial fees have been adjusted to reflect amounts that would have been paid without this agreement, with a corresponding adjustment reflected as fees paid indirectly in the Statement of Operations. For the period ended March 31, 2004, the fees paid indirectly were $5,425.
Certain officers and trustees of the Trust are also officers and/or directors of the Advisor and Distributor. The compensation of unaffiliated trustees is borne by the Trust.
10
Thornburg Investment Income Builder Fund
Notes to financial statements, continued
March 31, 2004
NOTE 4 — SHARES OF BENEFICIAL INTEREST
At March 31, 2004 there were an unlimited number of shares of beneficial interest authorized. Sales of Class I shares of the Thornburg Investment Income Builder Fund commenced November 01, 2003. Transactions in shares of beneficial interest were as follows:
| Period Ended March 31, 2004 | For the Period from December 24, 2002 (commencement of operations) to Sept. 30, 2003 | ||||||||
|---|---|---|---|---|---|---|---|---|---|
| Shares | Amount | Shares | Amount | ||||||
| Class A Shares | |||||||||
| Shares sold | 5,936,820 | $ 89,594,492 | 5,334,254 | $ 70,587,793 | |||||
| Shares issued to shareholders in | 57,990 | 880,886 | 41,869 | 568,052 | |||||
| reinvestment of dividends | |||||||||
| Shares repurchased** | (845,804 | ) | (12,384,083 | ) | (69,293 | ) | (899,576 | ) | |
| Net Increase (Decrease) | 5,149,006 | $ 78,091,295 | 5,306,830 | $ 70,256,269 | |||||
| **The Fund charges a redemption fee of 1% of the Class A shares exchanged within 90 days of purchase. For the period ended September 30, 2003 and March 31, 2004, $2,155 and $4,769, respectively, were netted in the amount reported for shares repurchased | |||||||||
| Class C Shares | |||||||||
| Shares sold | 3,532,652 | $ 53,801,395 | 2,880,165 | $ 38,582,969 | |||||
| Shares issued to shareholders in | 22,889 | 348,149 | 12,283 | 167,691 | |||||
| reinvestment of dividends | |||||||||
| Shares repurchased | (97,210 | ) | (1,456,380 | ) | (20,275 | ) | (266,980 | ) | |
| Net Increase (Decrease) | 3,458,331 | $ 52,693,164 | 2,872,173 | $ 38,483,680 | |||||
| Class I Shares | |||||||||
| Shares sold | 1,151,368 | $ 17,212,429 | -- | $ -- | |||||
| Shares issued to shareholders in | 5,408 | 82,142 | -- | -- | |||||
| reinvestment of dividends | |||||||||
| Shares repurchased ** | (7,021 | ) | (105,441 | ) | -- | -- | |||
| Net Increase (Decrease) | 1,149,755 | $ 17,189,130 | -- | $ -- | |||||
| **The Fund charges a redemption fee of 1% of the Class I shares exchanged within 90 days of purchase. For the period ended March 31, 2004, $1,065 was netted in the amount reported for shares repurchased | |||||||||
NOTE 5 – SECURITIES TRANSACTIONS
For the period ended March 31, 2004 the Fund had purchase and sale transactions of investment securities (excluding short-term investments) of $211,600,917 and $63,634,461, respectively.
NOTE 6 – INCOME TAXES
At March 31, 2004, information on the tax components of capital is as follows:
| Cost of investments for tax purpose | $ 270,070,497 | ||
| Gross unrealized appreciation on a tax basis | $ 20,465,122 | ||
| Gross unrealized depreciation on a tax basis | (4,369,232 | ) | |
| Net unrealized appreciation | |||
| (depreciation) on investments (tax basis) | $ 16,095,890 | ||
| Distributable earnings-ordinary income | $ 2,167,144 | ||
At March 31, 2004, the Fund had deferred tax basis currency and capital losses occurring subsequent to October 31, 2002 of $22,291 and $64,372, respectively. For tax purposes, such losses will be reflected in the year ending September 30, 2004.
Net investment income and net realized gain (loss) differ for financial statement and tax purposes primarily due to differing treatments of wash sale losses, foreign currency transactions and losses realized subsequent to October 31 on the sale of securities and foreign currencies.
11
Thornburg Investment Income Builder Fund
Notes to financial statements, continued
March 31, 2004
NOTE 7 – FINANCIAL INSTRUMENTS WITHOFF-BALANCE
SHEET RISK
During the period ended March 31, 2004, the Fund was a party to financial instruments with off-balance sheet risks, primarily currency forward exchange contracts. A forward exchange contract is an agreement between two parties to exchange different currencies at a specified rate at an agreed upon future date. These contracts are purchased in order to minimize the risk to the Fund with respect to its foreign stock transactions from adverse changes in the relationship between the U.S. dollar and foreign currencies. In each case these contracts have been initiated in conjunction with foreign stock transactions. These instruments may involve market risks in excess of the amount recognized on the Statement of Assets and Liabilities. Such risks would arise from the possible inability of counterparties to meet the terms of their contracts, future movement in currency value and interest rates and contract positions that are not exact offsets. These contracts are reported in the financial statements at the Fund’s net equity, as measured by the difference between the forward exchange rates at the reporting date and the forward exchange rates at the dates of entry into the contract.
CONTRACTS TO SELL:
| 15,000,000 | Euro Dollar for 18,155,100 USD, September 30, 2004 | $(209,029 | ) | ||
| 8,500,000 | Euro Dollar for 10,662,400 USD, August 10, 2004 | 245,467 | |||
| Net unrealized gain (loss) from forward exchange contracts | $ 36,438 | ||||
12
| Financial highlights | ||
|---|---|---|
| Thornburg Investment Income Builder Fund | ||
| Six Months Ended March 31, | Period Ended September 30, | |
| 2004 | 2003(c) | |
| Class A Shares: | ||
| Per Share Performance | ||
| (for a share outstanding throughout the period)+ | ||
| Net asset value, beginning of period | $ 13.77 | $ 11.94 |
| Income from investment operations: | ||
| Net investment income | 0.38 | 0.56 |
| Net realized and unrealized | ||
| gain (loss) on investments | 1.75 | 1.60 |
| Total from investment operations | 2.13 | 2.16 |
| Less dividends from: | ||
| Net investment income | (0.28) | (0.33) |
| Change in net asset value | 1.85 | 1.83 |
| Net asset value, end of period | $ 15.62 | $ 13.77 |
| Total return (a) | 15.49% | 18.25% |
| Ratios/Supplemental Data | ||
| Ratios to average net assets: | ||
| Net investment income | 5.12% (b) | 5.65% (b) |
| Expenses, after expense reductions | 1.46% (b) | 1.61% (b) |
| Expenses, after expense reductions | ||
| and net of custody credits | 1.46% (b) | 1.60% (b) |
| Expenses, before expense reductions | 1.46% (b) | 1.74% (b) |
| Portfolio turnover rate | 34.91% | 52.10% |
| Net assets at end of period (000) | $ 163,272 | $ 73,083 |
(a) Sales loads are not reflected in computing total return, which is not annualized for periods less than one year.
(b) Annualized.
(c) Fund commenced operations on December 24, 2002.
+ Based on weighted average shares outstanding.
13
| Financial highlights, continued | ||
|---|---|---|
| Thornburg Investment Income Builder Fund | ||
| Six Months Ended March 31, | Period Ended September 30, | |
| 2004 | 2003(c) | |
| Class C Shares: | ||
| Per Share Performance | ||
| (for a share outstanding throughout the period)+ | ||
| Net asset value, beginning of period | $ 13.79 | $ 11.94 |
| Income from investment operations: | ||
| Net investment income | 0.36 | 0.51 |
| Net realized and unrealized | ||
| gain (loss) on investments | 1.72 | 1.62 |
| Total from investment operations | 2.08 | 2.13 |
| Less dividends from: | ||
| Net investment income | (0.24) | (0.28) |
| Change in net asset value | 1.84 | 1.85 |
| Net asset value, end of period | $ 15.63 | $ 13.79 |
| Total return (a) | 15.15% | 18.01% |
| Ratios/Supplemental Data | ||
| Ratios to average net assets: | ||
| Net investment income | 4.78% (b) | 5.10% (b) |
| Expenses, after expense reductions | 1.90% (b) | 1.91% (b) |
| Expenses, after expense reductions | ||
| and net of custody credits | 1.90% (b) | 1.90% (b) |
| Expenses, before expense reductions | 2.23% (b) | 2.55% (b) |
| Portfolio turnover rate | 34.91% | 52.10% |
| Net assets at end of period (000) | $ 98,970 | $ 39,613 |
(a) Not annualized for periods less than one year.
(b) Annualized.
(c) Fund commenced operations on December 24, 2002.
+ Based on weighted average shares outstanding.
14
| Financial highlights, continued | |
|---|---|
| Thornburg Investment Income Builder Fund | |
| Period Ended March 31, | |
| 2004(c) | |
| Class I Shares: | |
| Per Share Performance | |
| (for a share outstanding throughout the period)+ | |
| Net asset value, beginning of period | $ 14.45 |
| Income from investment operations: | |
| Net investment income | 0.39 |
| Net realized and unrealized | |
| gain (loss) on investments | 1.05 |
| Total from investment operations | 1.44 |
| Less dividends from: | |
| Net investment income | (0.26) |
| Change in net asset value | 1.18 |
| Net asset value, end of period | $ 15.63 |
| Total return (a) | 10.01% |
| Ratios/Supplemental Data | |
| Ratios to average net assets: | |
| Net investment income | 6.29%(b) |
| Expenses, after expense reductions | 1.00%(b) |
| Expenses, after expense reductions | |
| and net of custody credits | 0.99%(b) |
| Expenses, before expense reductions | 1.27%(b) |
| Portfolio turnover rate | 34.91% |
| Net assets at end of period (000) | $ 17,968 |
(a) Not annualized for periods less than one year.
(b) Annualized.
(c) Effective date of Class I Shares was November 01, 2003.
+ Based on weighted average shares outstanding.
15
| Schedule of investments | ||||||||
|---|---|---|---|---|---|---|---|---|
| Thornburg Investment Income Builder Fund | March 31, 2004 | |||||||
| CUSIPS: CLASS A - 885-215-558, CLASS C - 885-215-541, CLASS I - 885-215-467 NASDAQ SYMBOLS: CLASS A - TIBAX, CLASS C - TIBCX, CLASS I - TIBIX | ||||||||
| Shares | Value | |||||||
| COMMON STOCKS - 81.50% | ||||||||
| BANKS (10.40%) | ||||||||
| Allied Irish Banks | 350,000 | $ | 5,218,782 | |||||
| Bank of Ireland | 200,000 | 2,497,837 | ||||||
| Barclays PLC | 130,000 | 1,146,647 | ||||||
| Liechenstein Landesbank | 4,000 | 1,934,898 | ||||||
| Lloyds TSB Group PLC | 925,000 | 7,039,496 | ||||||
| Oko Osuuspankkien | 225,000 | 5,219,089 | ||||||
| The Bank of New York Co. Inc. | 100,000 | 3,150,000 | ||||||
| Washington Mutual Inc. | 84,000 | 3,587,640 | ||||||
| CAPITAL GOODS (0.20%) | ||||||||
| Boskalis Westminster Groep NV | 25,000 | 668,405 | ||||||
| COMMERCIAL SERVICES & SUPPLIES (1.30%) | ||||||||
| Electrocomponents | 600,000 | 3,771,085 | ||||||
| DIVERSIFIED FINANCIALS (7.20%) | ||||||||
| Citigroup Inc. | 160,000 | 8,272,000 | ||||||
| Morgan Stanley | 120,000 | 6,876,000 | ||||||
| WP Stewart & Co. Ltd. | 280,000 | 5,583,200 | ||||||
| ENERGY (10.60%) | ||||||||
| BP Amoco | 80,000 | 4,096,000 | ||||||
| CNOOC Ltd. | 85,000 | 3,655,000 | ||||||
| El Paso Tennessee Pipeline Co. | 10,000 | 460,000 | ||||||
| ENI S.p.A | 300,000 | 6,033,160 | ||||||
| Occidental Petroleum Corp. | 170,000 | 7,828,500 | ||||||
| Petroleo Brasileiro SA ADR | 250,000 | 8,375,000 | ||||||
| FOOD BEVERAGE & TOBACCO (6.40%) | ||||||||
| Altria Group Inc. | 135,000 | 7,350,750 | ||||||
| Avi Ltd. | 433,497 | 1,192,228 | ||||||
| Fresh Del Monte Produce Inc. | 195,000 | 5,023,200 | ||||||
| Korean Tobacco & Ginseng Corp. | 210,000 | 4,826,639 | ||||||
| FOOD & DRUG RETAILING (3.10%) | ||||||||
| Kesko Oyj | 300,000 | 5,273,484 | ||||||
| Tesco PLC | 800,000 | 3,618,327 | ||||||
| HEALTHCARE EQUIPMENT & SERVICES (1.90%) | ||||||||
| Johnson & Johnson | 105,000 | 5,325,600 | ||||||
| HOUSEHOLD & PERSONAL PRODUCTS (1.00%) | ||||||||
| Kimberly Clark de Mexico | 1,030,000 | 2,787,270 | ||||||
| HOTELS RESTAURANTS & LEISURE (0.70%) | ||||||||
| IHOP Corp. | 55,000 | 1,894,200 | ||||||
| INSURANCE (2.30%) | ||||||||
| Lincoln National Corp. | 140,000 | 6,624,800 | ||||||
| MATERIALS (5.80%) | ||||||||
| PPG Industries Inc. | 46,000 | 2,681,800 | ||||||
| UPM Kymmene Oyj | 450,000 | 8,242,123 | ||||||
| Worthington Industries Inc. | 295,000 | 5,655,150 | ||||||
| MEDIA (3.30%) | ||||||||
| APN News & Media | 500,000 | $ | 1,457,043 | |||||
| Independent News & Media Finance | 1,310,000 | 3,172,326 | ||||||
| Pearson PLC | 425,000 | 4,837,857 | ||||||
| PHARMACEUTICALS & BIOTECHNOLOGY (2.80%) | ||||||||
| Pfizer Inc. | 230,000 | 8,061,500 | ||||||
| REAL ESTATE MANAGEMENT & DEVELOPMENT (2.20%) | ||||||||
| Boston Properties Inc. | 113,000 | 6,137,030 | ||||||
| RETAILING (2.80%) | ||||||||
| Kingfisher PLC | 1,500,000 | 7,964,553 | ||||||
| TECHNOLOGY - HARDWARE & EQUIPMENT (4.90%) | ||||||||
| Samsung Electronics Co. Ltd. | 15,000 | 7,483,972 | ||||||
| Sindo Ricoh | 125,000 | 6,596,450 | ||||||
| TELECOMMUNICATION SERVICES (6.20%) | ||||||||
| Alltel Corp. | 115,000 | 5,737,350 | ||||||
| Matav Rt | 1,400,000 | 6,446,640 | ||||||
| Portugal Telecom SGPS SA | 300,000 | 3,355,853 | ||||||
| TIM S.p.A | 400,000 | 2,261,821 | ||||||
| UTILITIES (8.40%) | ||||||||
| Fortum Oyj | 600,000 | 6,136,417 | ||||||
| Kelda Group PLC | 300,000 | 2,488,750 | ||||||
| Nisource Inc. | 185,000 | 3,931,250 | ||||||
| Progress Energy Inc. | 108,000 | 5,084,640 | ||||||
| Scottish Power PLC | 220,000 | 6,239,200 | ||||||
| TOTAL COMMON STOCKS (Cost $217,560,917) | -- | 233,300,962 | ||||||
| PREFERRED STOCK - 2.00% | ||||||||
| DIVERSIFIED FINANCIALS (2.00%) | ||||||||
| J P Morgan Chase & Co. | 50,000 | 2,521,875 | ||||||
| Lehman Brothers Holdings Inc. | 130,000 | 3,302,000 | ||||||
| TOTAL PREFERRED STOCK (Cost $5,796,000) | -- | 5,823,875 | ||||||
| Principal Amount | Value | |||||||
|---|---|---|---|---|---|---|---|---|
| CORPORATE BONDS - 9.80% | ||||||||
| BANKS (0.80%) | ||||||||
| Capital One Bank, 6.70%, 5/15/2008 | $ | 655,000 | 733,786 | |||||
| Capital One Bank, 6.50%, 6/13/2013 | 1,500,000 | 1,631,715 | ||||||
| COMMERCIAL SERVICES & SUPPLIES (0.10%) | ||||||||
| Waste Management Inc., 7.375%, 8/1/2010 | 175,000 | 206,188 | ||||||
| DIVERSIFIED FINANCIALS (1.40%) | ||||||||
| SLM Corp. Medium Term Note CPI Floating Rate, 3.08%, 4/1/2004 | 2,000,000 | 2,017,280 | ||||||
| SLM Corp. Medium Term Note CPI Floating Rate, 4.00%, 4/1/2004 | 2,000,000 | 2,045,800 | ||||||
| ENERGY (0.40%) | ||||||||
| Sonat Inc., 7.625%, 7/15/2011 | 1,400,000 | 1,214,500 | ||||||
| INSURANCE (2.60%) | ||||||||
| AAG Holding Co. Inc., 6.875%, 6/1/2008 | 335,000 | 362,079 | ||||||
| Hartford Life Inc., 7.10%, 6/15/2007 | 400,000 | 453,418 | ||||||
| Liberty Mutual Group Inc. Guaranteed Senior Notes, 5.75%, 3/15/2014 | $ | 1,000,000 | $ | 996,658 | ||||
| Old Republic International Corp., 7.00%, 6/15/2007 | 1,000,000 | 1,135,091 | ||||||
| Pacific Life Global Funding CPI Floating Rate, 4.106%, 4/6/2004 | 2,000,000 | 2,022,540 | ||||||
| Provident Cos Inc., 6.375%, 7/15/2005 | 353,000 | 359,396 | ||||||
| Unumprovident Corp., 7.625%, 3/1/2011 | 2,070,000 | 2,170,913 | ||||||
| MEDIA (0.40%) | ||||||||
| AOL Time Warner Inc., 6.875%, 5/1/2012 | 425,000 | 486,206 | ||||||
| Independent News & Media Finance, 5.75%, 5/17/2009 | 600,000 | 709,892 | ||||||
| PHARMACEUTICALS & BIOTECHNOLOGY (1.80%) | ||||||||
| Tiers Inflation Linked Trust Series Wye 2004 21 Trust Certificate CPI | ||||||||
| Floating Rate, 4.00%, 5/1/2004 | 5,000,000 | 5,000,000 | ||||||
| REAL ESTATE MANAGEMENT & DEVELOPMENT (0.60%) | ||||||||
| MDC Holdings Inc., 7.00%, 12/1/2012 | 1,500,000 | 1,700,669 | ||||||
| TECHNOLOGY - HARDWARE & EQUIPMENT (0.20%) | ||||||||
| Jabil Circuit Inc., 5.875%, 7/15/2010 | 500,000 | 536,407 | ||||||
| TELECOMMUNICATION SERVICES (1.50%) | ||||||||
| Level 3 Communications Inc., 9.125%, 5/1/2008 | 300,000 | 243,000 | ||||||
| Level 3 Communications Inc., 1.00%, 3/15/2010 | 1,500,000 | 1,155,000 | ||||||
| TCI Communications Inc., 7.875%, 8/1/2013 | 2,285,000 | 2,754,963 | ||||||
| TOTAL CORPORATE BONDS (Cost $27,288,056) | -- | 27,935,501 | ||||||
| CONVERTIBLE BONDS - 1.20% | ||||||||
| DIVERSIFIED FINANCIALS (0.10%) | ||||||||
| E-Trade Financial Corp., 6.00%, 2/1/2007 | 265,000 | 271,294 | ||||||
| TELECOMMUNICATION SERVICES (1.10%) | ||||||||
| Level 3 Communications Inc., 6.00%, 9/15/2009 | 1,420,000 | 866,200 | ||||||
| Level 3 Communications Inc., 6.00%, 3/15/2010 | 4,000,000 | 2,390,000 | ||||||
| TOTAL CONVERTIBLE BONDS (Cost $3,975,033) | -- | 3,527,494 | ||||||
| U.S. GOVERNMENT AGENCIES - 0.70% | ||||||||
| Federal National Mortgage Association CPI Floating Rate, 3.00%, 4/17/2004 | 2,000,000 | 2,032,700 | ||||||
| TOTAL U.S. GOVERNMENT AGENCIES (Cost $2,000,000) | -- | 2,032,700 | ||||||
| TAXABLE MUNICIPAL BONDS - 1.60% | ||||||||
| Short Pump Town Center Community Development, 6.26%, 2/1/2009 | 2,000,000 | 2,031,200 | ||||||
| Victor New York Taxable-Tax Increment, 9.05%, 5/1/2008 | 2,300,000 | 2,514,912 | ||||||
| TOTAL TAXABLE MUNICIPAL BONDS (Cost $4,386,670) | -- | 4,546,112 | ||||||
| SHORT TERM INVESTMENTS - 3.20% | ||||||||
| American General Finance Corp., 1.03% due 4/2/2004 | 9,000,000 | 8,999,742 | ||||||
| TOTAL SHORT TERM INVESTMENTS (Cost $8,999,742) | -- | 8,999,742 | ||||||
| TOTAL INVESTMENTS (100%) (Cost $270,006,418) | -- | $ | 286,166,386 | |||||
| See notes to financial statements | ||||||||
18
Index Comparisons
March 31, 2004
Index Comparison
Compares performance of Thornburg Investment Income Builder Fund and the blended benchmark index for the period December 24, 2002 to March 31, 2004. Past performance of the index and the Fund may not be indicative of future performance. The performance data and graph do not reflect the deduction of taxes that a shareholder would pay on distributions or the redemption of Fund shares.
Thornburg Investment Income Builder Fund
Thornburg Investment Income Builder Fund Class A Total Returns, Since December 24, 2002, versus the Blended Benchmark Index
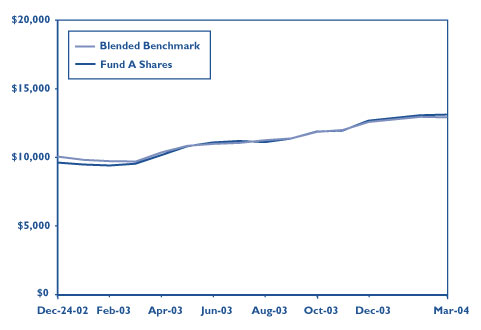
Average Annual Total Returns (period ending 3/31/04, at max. offering price)
A Shares
| 1 Year: | 31 | .64% | |
| From Inception (12/24/02): | 23 | .31% | |
Thornburg Investment Income Builder Fund Class C Total Returns, Since December 24, 2002, versus the Blended Benchmark Index
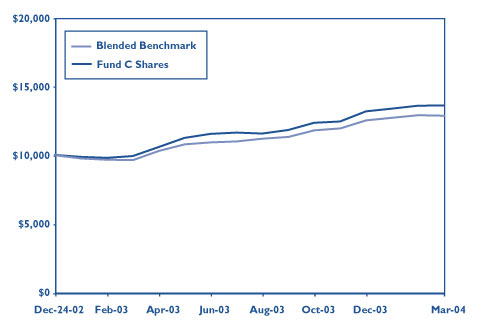
Average Annual Total Returns(period ending 3/31/04)
| C Shares | |||
|---|---|---|---|
| 1 Year: | 36 | .11% | |
| From Inception (12/24/02): | 26 | .61% | |
The maximum sales charge for the Fund’s A shares is 4.50%. C shares include a 1% CDSC for the first year only.
Past performance is no guarantee of future results. Current returns may be either lower or higher than those shown. Share prices and returns will fluctuate and investors may experience a loss upon redemption. There is no guarantee that the Fund will meet its objectives. Shares in the Fund carry risks, including possible loss of principal.
Carefully consider the Fund’s investment objectives, risks, sales charges, and expenses; this information is found in the prospectus, which is available from your financial advisor or from www.thornburg.com. Read it carefully before you invest or send money.
For month-end performance information, or for information and commentary on Fund holdings, including links to each company’s home page, visit www.thornburg.com.
The blended index is comprised of 25% Lehman Brothers Aggregate Bond Index and 75% MSCI World Equity Index. The Lehman Brothers Aggregate Bond Index is composed of approximately 6,000 publicly traded bonds including U.S. government, mortgage-backed, corporate and Yankee bonds with an average maturity of approximately 10 years. The index is weighted by the market value of the bond included in the index. This index represents asset types which are subject to risk, including loss of principal. The Morgan Stanley Capital International World Equity Index is a total return index, reported in US dollars, based on share prices and reinvested gross dividends of approximately 1600 companies from 22 countries: Australia, Austria, Belgium, Canada, Denmark, Finland, France, Germany, Hong Kong, Ireland, Italy, Japan, Malaysia, Netherlands, New Zealand, Norway, Singapore, Spain, Sweden, Switzerland, the United Kingdom, and the United States. Unless otherwise noted, index returns reflect the reinvestment of income dividends and capital gains, if any, but do not reflect fees, brokerage commissions or other expenses of investing. Investors may not make direct investments into any index.
There are special risk considerations associated with international investing, including fluctuating exchange rates, government regulations and differences in liquidity, which may affect the volatility of the fund.
19
Thornburg Investment Income Builder Fund
Portfolio proxy Voting
March 31, 2004
Policies and Procedures (Unaudited):
The Trust has delegated to Thornburg Investment Management, Inc. (“the Advisor”) voting decisions respecting proxies for the Fund’s voting securities. The Advisor makes voting decisions in accordance with its Proxy Voting Policy and Procedures. A description of the policy and Procedures is available (i) without charge, upon request, by calling the Advisor toll-free at 1.800.847.0200, (ii) on the Thornburg website at www.thornburg.com, and (iii) on the Securities and Exchange Commission’s website at www.sec.gov.
Commencing August 31, 2004, information regarding how proxies were voted will be available on or before August 31 of each year for the twelve months ending the preceding June 30. This information will be available (i) without charge, upon request, on the Thornburg website at www.thornburg.com and (ii) on the Securities and Exchange Commission’s website at www.sec.gov.
20
Investment Manager Thornburg Investment Management, Inc.
119 East Marcy Street
Santa Fe, New Mexico 87501
800.847.0200
Principal Underwriter Thornburg Securities Corporation
119 East Marcy Street
Santa Fe, New Mexico 87501
800.847.0200
This report is submitted for the general information of shareholders of the Fund. It is not authorized for distribution to prospective investors in the Fund unless preceded or accompanied by an effective prospectus. Carefully consider information in the prospectus regarding the Fund’s investment objectives and policies, risks, sales charges, expenses, experience of its management, marketability of shares, and other information. Performance data quoted represent past performance and do not guarantee future results.
www.thornburg.com
Thornburg Investment Income Builder Fund - I Shares
Semi-Annual Report March 31, 2004
Thornburg Investment Income Builder Fund
Letter to shareholders
Dear Fellow Shareholder:
Recall that the objective of the Thornburg Investment Income Builder Fund is to pay attractive, growing dividends to shareholders. As a byproduct of achieving this, we also aim to generate capital appreciation of the share price over time. Following are the quarterly dividends paid by your Fund in the last two quarters:
The net asset values of the I shares ended the fiscal period at $15.63, having increased by 44 cents, since December 31, 2003. It’s a challenging objective, but we will attempt to improve on the calendar 2003 dividend in 2004. The numbers above make clear that each sequential quarter’s dividend will not increase over the prior quarter. There is seasonality in the flow of dividends, particularly outside the USA. Nevertheless, the progress of the March 2004 dividend against the prior year’s level is a good start toward our objective.
On March 31, 2004, your Fund had 51 equity holdings, comprising 85% of Fund assets. Your Fund also owned 28 different bonds and short-term investments.
We were busy last quarter meeting with a variety of company managements worldwide. As a general rule, order books are improving. Against this general backdrop of heightened activity, not all business managers are smiling. Why? Not all companies can pass along increases in input costs. Input costs have been rising for firms that make intensive use of the most basic materials. Component suppliers, in particular, are challenged to pass these higher costs along.
In your Thornburg Investment Income Builder Portfolio, this challenge is reflected in the negative year-to-date price performance of PPG Industries (PPG) (chemical ingredients) and Sindo Ricoh (029530 KS) (copiers and printers, including much private label production). One may not think of banks as users of “basic materials,” but their input, money, is quite basic. While the cost of money is low these days, U.S. and U.K. investors are worried that it will soon be rising. We believe the ability of various banks to benefit or be hurt by this is quite varied. (Some banks always pay a market price for money, some get it for below market prices. Some lend at market, some below). We have invested, and will likely continue to invest, a significant percentage of this portfolio in banks and financial services firms. We will try to orient our investments toward those that buy money below market, sell money at market, and can benefit from rising interest rates. The return performance of our banking & financial holdings was mixed during the first quarter, with Lincoln National (LNC) and Citigroup (C)among the best in the Fund, while our non-U.S. banks lagged.
Your portfolio had input cost winners, too. The oil company holdings in the Fund—Ente Nazionale Idrocarburi (ENI), Petrobras (PBR), BP Plc. (BP), and Occidental Petroleum (OXY)—performed well in the first quarter. Petrochina (PTR.N) performed so well relative to other oil and gas companies that we sold it early in the quarter. We are a bit
| 2003 | 2003 | 2003 | 2003 | 2004 | |
|---|---|---|---|---|---|
| March Qtr. | June Qtr. | Sept. Qtr. | Dec. Qtr. | March Qtr. | |
| A Shares | 9.2 | 11.2 | 12.4 | 17.5 | 10.2 |
| I Shares | N/A | N/A | N/A | 14.5 | 11.7 |
| *Inception date: 11/1/03 |
| Exposure at | |
|---|---|
| Industry Grouping | March 31, 2004 |
| Banks | 11.2% |
| Energy | 11.0% |
| Diversified Financials | 10.7% |
| Telecommunication Services | 8.8% |
| Food Beverage & Tobacco | 6.4% |
| Other Key Summary Statistics | |
|---|---|
| Bonds and Cash | 15% |
| Domestic Equity | 37% |
| Foreign Equity | 48% |
Percentages and holdings can and do vary over time.
1
Thornburg Investment Income Builder Fund
Letter to shareholders, continued
April 13, 2004
nervous about the 11% weighting of the energy holdings in your Investment Income Builder portfolio. We do take comfort in the fact that senior oil company executives have told us that their assumed oil price when evaluating projects remains in the $16–$20 per barrel range (around 50% of today’s price). This indicates that over- investment in the global oil patch, unlike in so many industries in today’s liquidity-rich world, is not yet present. As owners, we are comforted by that and by the growing energy demand of India, China, and other energy-poor economies that have grown rapidly in recent years. Your portfolio’s collection of telephony service providers—Hungary’s Matav (MATAV HB), Italy’s Telecom Italia Mobile (TIM IM), Portugal Telecom (PT), and Alltel (AT)—operate largely fixed-cost businesses. The fixed assets they need are largely in place, for the time being. These businesses are generating wonderful cash flows, paying attractive dividends, and all have attractive mobile telephony franchises. We sold shares of lower-yielding Vodaphone (VOD), which played a constructive role in the portfolio while we held it, when we added these higher dividend payers. Business conditions, and first quarter stock price performance of Samsung Electronics (05930 KS), Korea Tobacco & Ginseng (033780 KS), and Independent News & Media (INWS ID), were all good. These firms sell, respectively, semiconductors/digital appliances, tobacco/tea/ginseng, and newspapers/outdoor advertising.
When you put it all together, Thornburg Investment Income Builder Fund had more winners than losers in the first quarter. We shortened the duration of the bond component of your portfolio from around 3.5 years to 2.3 years, and decreased the bond/cash portfolio allocation from 16% to 15% during the quarter. If we see rising yields in the coming months, we are well positioned to increase our bond allocation to take advantage. In the meantime, we can find enough attractive dividend paying stocks to be patient. The Thornburg Investment Income Builder Fund Class I shares rose 3.7% in the first quarter, and increased 10.0% since inception of November 1, 2003. This compares with a 2.6% increase in the blended benchmark, and a 9.0% rise over the period since inception of the I shares.
Your Fund’s investments are reported to you in the latter pages of this report. You can read more about the equity investments in your Fund by going to www.thornburg.com/funds. (If you do not have internet access, please call us at 800-847-0200. We will print and mail you a copy.) You can follow price movements of your shares at www.thornburg.com, under “Daily NAVs”. Thank you for your support, and best wishes.
Sincerely,
| | | ||||||
|---|---|---|---|---|---|---|---|---|
| Brian McMahon | Brad Kinkelaar | Steven J. Bohlin | ||||||
| President & Chief Investment Officer | Managing Director | Managing Director | ||||||
Past performance is no guarantee of future results. Current returns may be either lower or higher than those shown. Share prices and returns will fluctuate and investors may experience a loss upon redemption. There is no guarantee that the Fund will meet its objectives. Shares in the Fund carry risks, including possible loss of principal. Carefully consider the Fund’s investment objectives, risks, sales charges, and expenses; this information is found in the prospectus, which is available from your financial advisor or from www.thornburg.com. Read it carefully before you invest or send money. For month-end performance information, or for information and commentary on Fund holdings, including links to each company’s home page, visit www.thornburg.com.
The blended index is comprised of 25% Lehman Brothers Aggregate Bond Index and 75% MSCI World Equity Index. The Lehman Brothers Aggregate Bond Index is composed of approximately 6,000 publicly traded bonds including US government, mortgage-backed, corporate and Yankee bonds with an average maturity of approximately 10 years. The index is weighted by the market value of the bond included in the index. This index represents asset types which are subject to risk, including loss of principal. The Morgan Stanley Capital International World Equity Index is a total return index, reported in US dollars, based on share prices and reinvested gross dividends of approximately 1600 companies from 22 countries: Australia, Austria, Belgium, Canada, Denmark, Finland, France, Germany, Hong Kong, Ireland, Italy, Japan, Malaysia, Netherlands, New Zealand, Norway, Singapore, Spain, Sweden, Switzerland, the United Kingdom, and the United States. Unless otherwise noted, index returns reflect the reinvestment of income dividends and capital gains, if any, but do not reflect fees, brokerage commissions or other expenses of investing. Investors may not make direct investments into any index.
There are special risk considerations associated with international investing, including fluctuating exchange rates, government regulations and differences in liquidity, which may affect the volatility of the fund.
2
Thornburg Investment Income Builder Fund
regarding the dividend landscape
The S&P 500 Index Payout Ratio -- A Historical Perspective
| The dividend payout ratio is a fraction that expresses dividend payments as a percentage of per-share earnings. By long-term historical standards, the dividend payout ratio of the S&P 500 Index is relatively low at this time. |
| The Standard & Poor’s 500 Stock Index (S&P 500) is an unmanaged index generally representative of the U.S. Stock Market, without regard to company size. |
Corporate Willingness to Pay Dividends is Improving
| The Russell 1000 Index includes 1000 public companies that are supposed to be generally representative of corporate America. Between 1980 and 1993, at least 80% of these firms paid some dividend. Between 1994 and 2001, the percentage of Russell 1000 companies paying dividends sunk to just over 50%, indicating investor and management preference for reinvesting retained earnings in growth initiatives. Now the pendulum appears to be swinging back, and the percentage of dividend payers is increasing. Long-term academic studies have shown that subsequent earnings-per-share growth of dividend-paying firms actually exceeds that of non-payers. |
3
Thornburg Investment Income Builder Fund
regarding the dividend landscape, continued
March 31, 2004
Rising Dividend Payments Despite Changing Dividend Yields
Over time, the dollar dividend per unit of the S&P 500 Index has increased. Because the price of the index itself has increased even more, the yield on the S&P 500 Index, as a percentage of the current index price, has generally decreased in recent decades. You should note, however, that the yield on the original investment made at a fixed point in time (say, 1970 or 1989) has increased, even without reinvestment of dividends.
A Truly Diversified Dividend-Paying PortfolioMust
Look Beyond the Obvious High Yield Stocks!
In the (large cap) Russell 1000 Index, 81% of the top 100 dividend payers are either real estate investment trusts (REITs) or utilities. In the (small cap) Russell 2000 Index, 87% of the top 100 dividend-yielding stocks are either REITs or utilities. In order to construct a diversified portfolio of attractive yielding stocks, one must beyond these two sectors. We do!
| The Top 100 Dividend Yields | |||||
|---|---|---|---|---|---|
| Russell 1000 Index | Russell 2000 Index | ||||
| REITs | 47 | % | 78 | % | |
| Utilities | 34 | % | 9 | % | |
| Banks | 6 | % | 2 | % | |
| Other Financials | 2 | % | 1 | % | |
| Cons. Staples | 5 | % | 3 | % | |
| Telecom | 3 | % | 0 | % | |
| Materials | 2 | % | 2 | % | |
| Health Care | 1 | % | 0 | % | |
| Consumer Discretionary | 0 | % | 4 | % | |
| Industrials | 0 | % | 1 | % | |
| Energy | 0 | % | 0 | % | |
| Technology | 0 | % | 0 | % | |
Source: Bloomberg (Numbers may not add to 100% due to rounding.)
The Russell 1000 Index consists of the 1,000 largest securities in the Russell 3000 Index, which represents approximately 90% of the total market capitalization of the Russell 3000 Index. It is a large-cap, market-oriented index and is highly correlated with the S&P 500 Index. The Russell 2000 Index is an unmanaged index generally representative of the 2,000 smallest companies in the Russell 3000 Index, which represents approximately 10% of the total market capitalization of the Russell 3000 Index.
4
Thornburg Investment Income Builder Fund
regarding the dividend landscape, continued
March 31, 2004
Global Diversification Can Improve the Portfolio Yield
| Since firms outside the U.S. tend to pay higher dividends than U.S. firms, particularly outside the REIT and utility sectors, we diversify the Thornburg Investment Income Builder portfolio into some foreign dividend-paying stocks to take advantage of these opportunities. |
Assumes that all last twelve months’ share repurchases are converted to dividends.
Corporate Willingness to Pay Dividends May Come from Unlikely Sources
| Since the passage of the 2003 tax bill, which lowered maximum tax rates on dividends to 15%, Citigroup and several other leading U.S. firms have redirected funds previously allocated to share buybacks to increased dividend payments. This graph shows the potential for dividend increases, by S&P sector, if all funds used to repurchase shares were to be redirected to dividend payments. We do not expect this outcome, but we are seeing movement in this direction. |
5
| Statement of assets and liabilities | |||
|---|---|---|---|
| Thornburg Investment Income Builder Fund | March 31, 2004 | ||
| (Unaudited) | |||
| ASSETS | |||
| Investments at value (cost $270,006,418) | $286,166,386 | ||
| Cash | 330,197 | ||
| Cash denominated in foreign currency (cost $1,189,424) | 1,234,066 | ||
| Receivable for fund shares sold | 2,749,239 | ||
| Unrealized gain (loss) on forward exchange contracts (Note 6) | 36,438 | ||
| Dividends receivable | 3,644,420 | ||
| Interest receivable | 403,960 | ||
| Prepaid expenses and other assets | 65,505 | ||
| Total Assets | 294,630,211 | ||
| LIABILITIES | |||
| Payable for securities purchased | 12,162,842 | ||
| Payable for fund shares redeemed | 97,805 | ||
| Payable to investment advisor (Note 3) | 194,352 | ||
| Accounts payable and accrued expenses | 553,642 | ||
| Dividends payable | 1,412,338 | ||
| Total Liabilities | 14,420,979 | ||
| NET ASSETS | $280,209,232 | ||
| NET ASSETS CONSIST OF: | |||
| Undistributed net investment income | $ 2,144,853 | ||
| Net unrealized appreciation (depreciation) on investments | 16,211,438 | ||
| Accumulated net realized gain (loss) | 5,139,403 | ||
| Net capital paid in on shares of beneficial interest | 256,713,538 | ||
| $280,209,232 | |||
| NET ASSET VALUE: | |||
| Class A Shares: | |||
| Net asset value and redemption price per share | |||
| ($163,271,671 applicable to 10,455,836 shares of beneficial | |||
| interest outstanding - Note 4) | $ 15.62 | ||
| Maximum sales charge, 4.50% of offering price | 0.74 | ||
| Maximum Offering Price Per Share | $ 16.36 | ||
| Class C Shares: | |||
| Net asset value and offering price per share * | |||
| ($98,969,828 applicable to 6,330,504 shares of beneficial | |||
| interest outstanding - Note 4) | $ 15.63 | ||
| Class I Shares: | |||
| Net asset value, offering and redemption price per share | |||
| ($17,967,733 applicable to 1,149,755 shares of beneficial | |||
| interest outstanding - Note 4) | $ 15.63 | ||
| *Redemption price per share is equal to net asset value less any applicable contingent deferred sales charge | |||
| See notes to financial statements | |||
6
| Statement of Operations | |||
|---|---|---|---|
| Thornburg Investment Income Builder Fund | Six months ended March 31, 2004 | ||
| (Unaudited) | |||
| INVESTMENT INCOME | |||
| Dividend income (net of foreign taxes withheld of $511,672) | $ 5,402,281 | ||
| Interest income (net of premium amortized of $61,187) | 824,400 | ||
| Total Income | 6,226,681 | ||
| EXPENSES | |||
| Investment advisory fees (Note 3) | 818,859 | ||
| Administration fees (Note 3) | |||
| Class A Shares | 70,237 | ||
| Class C Shares | 40,240 | ||
| Class I Shares | 2,559 | ||
| Distribution and service fees (Note 3) | |||
| Class A Shares | 143,115 | ||
| Class C Shares | 327,678 | ||
| Transfer agent fees | |||
| Class A Shares | 53,860 | ||
| Class C Shares | 32,890 | ||
| Class I Shares | 5,912 | ||
| Registration & filing fees | |||
| Class A Shares | 5,856 | ||
| Class C Shares | 4,529 | ||
| Class I Shares | 6,408 | ||
| Custodian fees (Note 3) | 54,515 | ||
| Professional fees | 12,247 | ||
| Accounting fees | 2,257 | ||
| Trustee fees | 1,760 | ||
| Other expenses | 24,626 | ||
| Total Expenses | 1,607,548 | ||
| Less: | |||
| Expenses reimbursed by investment advisor (Note 3) | (119,820 | ) | |
| Fees paid indirectly (Note 3) | (5,425 | ) | |
| Net Expenses | 1,482,303 | ||
| Net Investment Income | 4,744,378 | ||
| REALIZED AND UNREALIZED GAIN (LOSS) | |||
| Net realized gain (loss) on: | |||
| Investments | 5,444,223 | ||
| Foreign currency transactions | (176,369 | ) | |
| 5,267,854 | |||
| Net change in unrealized appreciation (depreciation) on: | |||
| Investments | 12,661,497 | ||
| Foreign currency translations | 46,447 | ||
| 12,707,944 | |||
| Net Realized and Unrealized | |||
| Gain (Loss) on Investments | 17,975,798 | ||
| Net Increase (Decrease) in Net Assets Resulting | |||
| From Operations | $ 22,720,176 | ||
| See notes to financial statements | |||
7
| Statements of Changes in net assets | |||||
|---|---|---|---|---|---|
| Thornburg Investment Income Builder Fund | |||||
| Six Months Ended March 31, 2004 | For the period from December 24, 2002 (commencement of operations) to September 30, 2003 | ||||
| INCREASE (DECREASE) IN NET ASSETS FROM: | |||||
| OPERATIONS: | |||||
| Net investment income | $ 4,744,378 | $ 1,531,993 | |||
| Net realized gain (loss) on investments and foreign currency | |||||
| transactions | 5,267,854 | (150,743 | ) | ||
| Increase (Decrease) in unrealized appreciation | |||||
| on investments and foreign currency translations | 12,707,944 | 3,503,494 | |||
| Net Increase (Decrease) in Net Assets | |||||
| Resulting from Operations | 22,720,176 | 4,884,744 | |||
| DIVIDENDS TO SHAREHOLDERS: | |||||
| From net investment income | |||||
| Class A Shares | (1,994,505 | ) | (662,771 | ) | |
| Class C Shares | (989,576 | ) | (266,157 | ) | |
| Class I Shares | (196,217 | ) | 0 | ||
| FUND SHARE TRANSACTIONS - (Note 4) | |||||
| Class A Shares | 78,091,295 | 70,256,269 | |||
| Class C Shares | 52,693,164 | 38,483,680 | |||
| Class I Shares | 17,189,130 | 0 | |||
| Net Increase in Net Assets | 167,513,467 | 112,695,765 | |||
| NET ASSETS: | |||||
| Beginning of period | 112,695,765 | 0 | |||
| End of period | $ 280,209,232 | $ 112,695,765 | |||
| See notes to financial statements | |||||
8
Thornburg Investment Income Builder Fund
Notes to financial statements
NOTE 1 – ORGANIZATION Thornburg Investment Income Builder Fund, hereinafter referred to as the “Fund,” is a diversified series of Thornburg Investment Trust (the “Trust”). The Fund commenced operations on December 24, 2002. The Trust was organized as a Massachusetts business trust under a Declaration of Trust dated June 3, 1987 and is registered as a diversified, open-end management investment company under the Investment Company Act of 1940, as amended. The Trust is currently issuing nine series of shares of beneficial interest in addition to those of the Fund: Thornburg Limited Term U.S. Government Fund, Thornburg New Mexico Intermediate Municipal Fund, Thornburg Intermediate Municipal Fund, Thornburg Limited Term Income Fund, Thornburg Florida Intermediate Municipal Fund, Thornburg Value Fund, Thornburg International Value Fund, Thornburg New York Intermediate Municipal Fund and Thornburg Core Growth Fund. Each series is considered to be a separate entity for financial reporting and tax purposes and bears expenses directly attributable to it. The Fund pursues its investment objectives by investing in a broad range of income producing securities, primarily including stocks and bonds.
The Fund currently offers three classes of shares of beneficial interest, Class A, Class C, and Institutional Class (Class I) shares. Each class of shares of the Fund represents an interest in the same portfolio of investments of the Fund, except that (i) Class A shares are sold subject to a front-end sales charge collected at the time the shares are purchased and bear a service fee, (ii) Class C shares are sold at net asset value without a sales charge at the time of purchase, but are subject to a contingent deferred sales charge upon redemption within one year, and bear both a service fee and a distribution fee, (iii) Class I shares are sold at net asset value without a sales charge at the time of purchase, and (iv) the respective classes have different reinvestment privileges. Additionally, the Fund may allocate among its classes certain expenses, to the extent allowable, to specific classes including transfer agent fees, government registration fees, certain printing and postage costs, and administration and legal expenses. Currently, class specific expenses of the Fund are limited to service and distribution fees, administration fees and certain registration and transfer agent expenses.
NOTE 2 – SIGNIFICANT ACCOUNTING POLICIES Significant accounting policies of the Fund are as follows:
Valuation of Securities: In determining net asset value, investments are stated at value based on latest sales prices, normally at 4:00 pm EST, reported on national securities exchanges on the last business day of the period. Investments for which no sale is reported are valued at the mean between bid and asked prices. Securities for which market quotations are not readily available are valued at fair value as determined by management and approved in good faith by the Board of Trustees. Short term obligations having remaining
maturities of 60 days or less are valued at amortized cost, which approximates market value.
Foreign Currency Translation: Portfolio securities and other assets and liabilities denominated in foreign currencies are translated into U.S. dollars based on the exchange rate of such currencies against the U.S. dollar on the date of valuation. Purchases and sales of securities and income items denominated in foreign currencies are translated into U.S. dollars at the exchange rate in effect on the translation date. When the Fund purchases or sells foreign securities it will customarily enter into a foreign exchange contract to minimize foreign exchange risk from the trade date to the settlement date of such transactions.
The Fund does not separately report the effect of changes in foreign exchange rates from changes in market prices on securities held. Such changes are included in net realized and unrealized gain or loss from investments.
Reported net realized foreign exchange gains or losses arise from sales of foreign currencies, currency gains or losses realized between the trade and settlement dates on securities transactions and the difference between the amount of interest recorded on the Fund’s books and the U.S. dollar equivalent of the amounts actually received or paid.
Federal Income Taxes: It is the policy of the Fund to comply with the provisions of the Internal Revenue Code applicable to “regulated investment companies” and to distribute all of its taxable income to its shareholders. Therefore, no provision for Federal income tax is required.
When-Issued and Delayed Delivery Transactions: The Fund may engage in when-issued or delayed delivery transactions. To the extent the Fund engages in such transactions, it will do so for the purpose of acquiring portfolio securities consistent with its investment objectives and not for the purpose of investment leverage or to speculate on market changes. At the time the Fund makes a commitment to purchase a security on a when-issued basis, it will record the transaction and reflect the value in determining its net asset value. When effecting such transactions, assets of the Fund of an amount sufficient to make payment for the portfolio securities to be purchased will be segregated on the Fund’s records on the trade date.
Dividends: Net investment income of the Fund is declared daily as a dividend on shares for which the Fund has received payment. Dividends are paid quarterly and are reinvested in additional shares of the Fund at net asset value per share at the close of business on the dividend payment date, or at the shareholder’s option, paid in cash. Net capital gains, to the extent available, will be distributed at least annually. Distributions to shareholders are based on income tax regulations and therefore, their characteristics may differ for financial statement and tax purposes.
9
Thornburg Investment Income Builder Fund
Notes to financial statements, continued
March 31, 2004
General: Securities transactions are accounted for on a trade date basis. Interest income is accrued as earned and dividend income is recorded on the ex-dividend date. Certain income from foreign securities is recognized as soon as information is available to the Fund. Realized gains and losses from the sale of securities are recorded on an identified cost basis. Net investment income, other than class specific expenses, and realized and unrealized gains and losses, are allocated daily to each class of shares based upon the relative net asset value of outstanding shares of each class of shares at the beginning of the day (after adjusting for the current share activity of the respective class). Expenses common to all funds are allocated among the funds comprising the Trust based upon their relative net asset values or other appropriate allocation methods.
Guarantees and Indemnifications: Under the Trust’s organizational documents, its officers and trustees are indemnified against certain liability arising out of the performance of their duties to the Fund. Additionally, in the normal course of business the Trust enters into contracts with service providers that contain general indemnification clauses. The Trust’s maximum exposure under these arrangements is unknown. However, based on experience, the Trust expects the risk of loss to be remote.
Use of Estimates: The preparation of financial statements, in conformity with generally accepted accounting principles, requires management to make estimates and assumptions that affect the reported amounts of assets and liabilities and the disclosure of contingent assets and liabilities at the date of the financial statements and the reported amounts of increases and decreases in net assets from operations during the reporting period. Actual results could differ from those estimates.
NOTE 3 — INVESTMENT ADVISORY FEE AND OTHER TRANSACTIONS WITH AFFILIATES
Pursuant to an investment advisory agreement, Thornburg Investment Management, Inc. (the “Advisor”) serves as the investment advisor and performs services to the Fund for which the fees are payable at the end of each month. For the period ended March 31, 2004, these fees were payable at annual rates ranging from .875 of 1% to .675 of 1% of the average daily net assets of the Fund depending on the Fund’s asset size. The Fund also has an administrative services agreement with the Advisor, whereby the Advisor will perform certain administrative services for the shareholders of each class of the Fund’s shares, and for which fees will be payable at an annual rate of up to .125 of 1% of the average daily net assets attributable to each class of shares. For the period ended March 31, 2004, the Advisor voluntarily reimbursed certain class specific expenses and administrative fees of $105,681 for Class C shares and $14,139 for Class I shares.
The Fund has an underwriting agreement with Thornburg Securities Corporation (the “Distributor”), which acts as the
Distributor of the Fund’s shares. For the period ended March 31, 2004, the Distributor has advised the Fund that it earned commissions aggregating $144,304 from the sale of Class A shares of the Fund and collected contingent deferred sales charges aggregating $6,020 from redemptions of Class C shares of the Fund.
Pursuant to a service plan under Rule 12b-1 of the Investment Company Act of 1940, the Fund may reimburse to the Advisor an amount not to exceed .25 of 1% per annum of its average daily net assets attributable to each class of shares of the Fund for payments made by the Advisor to securities dealers and other financial institutions to obtain various shareholder related services. The Advisor may pay out of its own resources additional expenses for distribution of the Fund’s shares.
The Fund has also adopted distribution plans pursuant to Rule 12b-1, applicable only to the Fund’s Class C shares, under which the Fund compensates the Distributor for services in promoting the sale of Class C shares of the Fund at an annual rate of up to .75 of 1% of the average daily net assets attributable to Class C shares. Total fees incurred by each class of shares of the Fund under its respective Service and Distribution Plans are set forth in the statement of operations.
The Fund has an agreement with the custodian bank to indirectly pay a portion of the custodian’s fees through credits earned by the Fund’s cash on deposit with the bank. This deposit agreement is an alternative to overnight investments. Custodial fees have been adjusted to reflect amounts that would have been paid without this agreement, with a corresponding adjustment reflected as fees paid indirectly in the Statement of Operations. For the period ended March 31, 2004, the fees paid indirectly were $5,425.
Certain officers and trustees of the Trust are also officers and/or directors of the Advisor and Distributor. The compensation of unaffiliated trustees is borne by the Trust.
10
Thornburg Investment Income Builder Fund
Notes to financial statements, continued
March 31, 2004
NOTE 4 — SHARES OF BENEFICIAL INTEREST
At March 31, 2004 there were an unlimited number of shares of beneficial interest authorized. Sales of Class I shares of the Thornburg Investment Income Builder Fund commenced November 01, 2003. Transactions in shares of beneficial interest were as follows:
| Period Ended March 31, 2004 | For the Period from December 24, 2002 (commencement of operations) to Sept. 30, 2003 | ||||||||
|---|---|---|---|---|---|---|---|---|---|
| Shares | Amount | Shares | Amount | ||||||
| Class A Shares | |||||||||
| Shares sold | 5,936,820 | $ 89,594,492 | 5,334,254 | $ 70,587,793 | |||||
| Shares issued to shareholders in | 57,990 | 880,886 | 41,869 | 568,052 | |||||
| reinvestment of dividends | |||||||||
| Shares repurchased** | (845,804 | ) | (12,384,083 | ) | (69,293 | ) | (899,576 | ) | |
| Net Increase (Decrease) | 5,149,006 | $ 78,091,295 | 5,306,830 | $ 70,256,269 | |||||
| **The Fund charges a redemption fee of 1% of the Class A shares exchanged within 90 days of purchase. For the period ended September 30, 2003 and March 31, 2004, $2,155 and $4,769, respectively, were netted in the amount reported for shares repurchased | |||||||||
| Class C Shares | |||||||||
| Shares sold | 3,532,652 | $ 53,801,395 | 2,880,165 | $ 38,582,969 | |||||
| Shares issued to shareholders in | 22,889 | 348,149 | 12,283 | 167,691 | |||||
| reinvestment of dividends | |||||||||
| Shares repurchased | (97,210 | ) | (1,456,380 | ) | (20,275 | ) | (266,980 | ) | |
| Net Increase (Decrease) | 3,458,331 | $ 52,693,164 | 2,872,173 | $ 38,483,680 | |||||
| Class I Shares | |||||||||
| Shares sold | 1,151,368 | $ 17,212,429 | -- | $ -- | |||||
| Shares issued to shareholders in | 5,408 | 82,142 | -- | -- | |||||
| reinvestment of dividends | |||||||||
| Shares repurchased ** | (7,021 | ) | (105,441 | ) | -- | -- | |||
| Net Increase (Decrease) | 1,149,755 | $ 17,189,130 | -- | $ -- | |||||
| **The Fund charges a redemption fee of 1% of the Class I shares exchanged within 90 days of purchase. For the period ended March 31, 2004, $1,065 was netted in the amount reported for shares repurchased | |||||||||
NOTE 5 – SECURITIES TRANSACTIONS
For the period ended March 31, 2004 the Fund had purchase and sale transactions of investment securities (excluding short-term investments) of $211,600,917 and $63,634,461, respectively.
NOTE 6 – INCOME TAXES
At March 31, 2004, information on the tax components of capital is as follows:
| Cost of investments for tax purpose | $ 270,070,497 | ||
| Gross unrealized appreciation on a tax basis | $ 20,465,122 | ||
| Gross unrealized depreciation on a tax basis | (4,369,232 | ) | |
| Net unrealized appreciation | |||
| (depreciation) on investments (tax basis) | $ 16,095,890 | ||
| Distributable earnings-ordinary income | $ 2,167,144 | ||
At March 31, 2004, the Fund had deferred tax basis currency and capital losses occurring subsequent to October 31, 2002 of $22,291 and $64,372, respectively. For tax purposes, such losses will be reflected in the year ending September 30, 2004.
Net investment income and net realized gain (loss) differ for financial statement and tax purposes primarily due to differing treatments of wash sale losses, foreign currency transactions and losses realized subsequent to October 31 on the sale of securities and foreign currencies.
11
Thornburg Investment Income Builder Fund
Notes to financial statements, continued
March 31, 2004
NOTE 7 – FINANCIAL INSTRUMENTS WITHOFF-BALANCE
SHEET RISK
During the period ended March 31, 2004, the Fund was a party to financial instruments with off-balance sheet risks, primarily currency forward exchange contracts. A forward exchange contract is an agreement between two parties to exchange different currencies at a specified rate at an agreed upon future date. These contracts are purchased in order to minimize the risk to the Fund with respect to its foreign stock transactions from adverse changes in the relationship between the U.S. dollar and foreign currencies. In each case these contracts have been initiated in conjunction with foreign stock transactions. These instruments may involve market risks in excess of the amount recognized on the Statement of Assets and Liabilities. Such risks would arise from the possible inability of counterparties to meet the terms of their contracts, future movement in currency value and interest rates and contract positions that are not exact offsets. These contracts are reported in the financial statements at the Fund’s net equity, as measured by the difference between the forward exchange rates at the reporting date and the forward exchange rates at the dates of entry into the contract.
CONTRACTS TO SELL:
| 15,000,000 | Euro Dollar for 18,155,100 USD, September 30, 2004 | $(209,029 | ) | ||
| 8,500,000 | Euro Dollar for 10,662,400 USD, August 10, 2004 | 245,467 | |||
| Net unrealized gain (loss) from forward exchange contracts | $ 36,438 | ||||
12
March 31, 2004
| Financial highlights | ||
|---|---|---|
| Thornburg Investment Income Builder Fund | ||
| Six Months Ended March 31, | Period Ended September 30, | |
| 2004 | 2003(c) | |
| Class A Shares: | ||
| Per Share Performance | ||
| (for a share outstanding throughout the period)+ | ||
| Net asset value, beginning of period | $ 13.77 | $ 11.94 |
| Income from investment operations: | ||
| Net investment income | 0.38 | 0.56 |
| Net realized and unrealized | ||
| gain (loss) on investments | 1.75 | 1.60 |
| Total from investment operations | 2.13 | 2.16 |
| Less dividends from: | ||
| Net investment income | (0.28) | (0.33) |
| Change in net asset value | 1.85 | 1.83 |
| Net asset value, end of period | $ 15.62 | $ 13.77 |
| Total return (a) | 15.49% | 18.25% |
| Ratios/Supplemental Data | ||
| Ratios to average net assets: | ||
| Net investment income | 5.12% (b) | 5.65% (b) |
| Expenses, after expense reductions | 1.46% (b) | 1.61% (b) |
| Expenses, after expense reductions | ||
| and net of custody credits | 1.46% (b) | 1.60% (b) |
| Expenses, before expense reductions | 1.46% (b) | 1.74% (b) |
| Portfolio turnover rate | 34.91% | 52.10% |
| Net assets at end of period (000) | $ 163,272 | $ 73,083 |
(a) Sales loads are not reflected in computing total return, which is not annualized for periods less than one year.
(b) Annualized.
(c) Fund commenced operations on December 24, 2002.
+ Based on weighted average shares outstanding.
13
| Financial highlights | |
|---|---|
| Thornburg Investment Income Builder Fund | |
| Period Ended March 31, | |
| 2004(c) | |
| Class I Shares: | |
| Per Share Performance | |
| (for a share outstanding throughout the period)+ | |
| Net asset value, beginning of period | $ 14.45 |
| Income from investment operations: | |
| Net investment income | 0.39 |
| Net realized and unrealized | |
| gain (loss) on investments | 1.05 |
| Total from investment operations | 1.44 |
| Less dividends from: | |
| Net investment income | (0.26) |
| Change in net asset value | 1.18 |
| Net asset value, end of period | $ 15.63 |
| Total return (a) | 10.01% |
| Ratios/Supplemental Data | |
| Ratios to average net assets: | |
| Net investment income | 6.29%(b) |
| Expenses, after expense reductions | 1.00%(b) |
| Expenses, after expense reductions | |
| and net of custody credits | 0.99%(b) |
| Expenses, before expense reductions | 1.27%(b) |
| Portfolio turnover rate | 34.91% |
| Net assets at end of period (000) | $ 17,968 |
(a) Not annualized for periods less than one year.
(b) Annualized.
(c) Effective date of Class I Shares was November 01, 2003.
+ Based on weighted average shares outstanding.
14
| Schedule of investments | ||||||||
|---|---|---|---|---|---|---|---|---|
| Thornburg Investment Income Builder Fund | March 31, 2004 | |||||||
| CUSIPS: CLASS A - 885-215-558, CLASS C - 885-215-541, CLASS I - 885-215-467 NASDAQ SYMBOLS: CLASS A - TIBAX, CLASS C - TIBCX, CLASS I - TIBIX | ||||||||
| Shares | Value | |||||||
| COMMON STOCKS - 81.50% | ||||||||
| BANKS (10.40%) | ||||||||
| Allied Irish Banks | 350,000 | $ | 5,218,782 | |||||
| Bank of Ireland | 200,000 | 2,497,837 | ||||||
| Barclays PLC | 130,000 | 1,146,647 | ||||||
| Liechenstein Landesbank | 4,000 | 1,934,898 | ||||||
| Lloyds TSB Group PLC | 925,000 | 7,039,496 | ||||||
| Oko Osuuspankkien | 225,000 | 5,219,089 | ||||||
| The Bank of New York Co. Inc. | 100,000 | 3,150,000 | ||||||
| Washington Mutual Inc. | 84,000 | 3,587,640 | ||||||
| CAPITAL GOODS (0.20%) | ||||||||
| Boskalis Westminster Groep NV | 25,000 | 668,405 | ||||||
| COMMERCIAL SERVICES & SUPPLIES (1.30%) | ||||||||
| Electrocomponents | 600,000 | 3,771,085 | ||||||
| DIVERSIFIED FINANCIALS (7.20%) | ||||||||
| Citigroup Inc. | 160,000 | 8,272,000 | ||||||
| Morgan Stanley | 120,000 | 6,876,000 | ||||||
| WP Stewart & Co. Ltd. | 280,000 | 5,583,200 | ||||||
| ENERGY (10.60%) | ||||||||
| BP Amoco | 80,000 | 4,096,000 | ||||||
| CNOOC Ltd. | 85,000 | 3,655,000 | ||||||
| El Paso Tennessee Pipeline Co. | 10,000 | 460,000 | ||||||
| ENI S.p.A | 300,000 | 6,033,160 | ||||||
| Occidental Petroleum Corp. | 170,000 | 7,828,500 | ||||||
| Petroleo Brasileiro SA ADR | 250,000 | 8,375,000 | ||||||
| FOOD BEVERAGE & TOBACCO (6.40%) | ||||||||
| Altria Group Inc. | 135,000 | 7,350,750 | ||||||
| Avi Ltd. | 433,497 | 1,192,228 | ||||||
| Fresh Del Monte Produce Inc. | 195,000 | 5,023,200 | ||||||
| Korean Tobacco & Ginseng Corp. | 210,000 | 4,826,639 | ||||||
| FOOD & DRUG RETAILING (3.10%) | ||||||||
| Kesko Oyj | 300,000 | 5,273,484 | ||||||
| Tesco PLC | 800,000 | 3,618,327 | ||||||
| HEALTHCARE EQUIPMENT & SERVICES (1.90%) | ||||||||
| Johnson & Johnson | 105,000 | 5,325,600 | ||||||
| HOUSEHOLD & PERSONAL PRODUCTS (1.00%) | ||||||||
| Kimberly Clark de Mexico | 1,030,000 | 2,787,270 | ||||||
| HOTELS RESTAURANTS & LEISURE (0.70%) | ||||||||
| IHOP Corp. | 55,000 | 1,894,200 | ||||||
| INSURANCE (2.30%) | ||||||||
| Lincoln National Corp. | 140,000 | 6,624,800 | ||||||
| MATERIALS (5.80%) | ||||||||
| PPG Industries Inc. | 46,000 | 2,681,800 | ||||||
| UPM Kymmene Oyj | 450,000 | 8,242,123 | ||||||
| Worthington Industries Inc. | 295,000 | 5,655,150 | ||||||
| MEDIA (3.30%) | ||||||||
| APN News & Media | 500,000 | $ | 1,457,043 | |||||
| Independent News & Media Finance | 1,310,000 | 3,172,326 | ||||||
| Pearson PLC | 425,000 | 4,837,857 | ||||||
| PHARMACEUTICALS & BIOTECHNOLOGY (2.80%) | ||||||||
| Pfizer Inc. | 230,000 | 8,061,500 | ||||||
| REAL ESTATE MANAGEMENT & DEVELOPMENT (2.20%) | ||||||||
| Boston Properties Inc. | 113,000 | 6,137,030 | ||||||
| RETAILING (2.80%) | ||||||||
| Kingfisher PLC | 1,500,000 | 7,964,553 | ||||||
| TECHNOLOGY - HARDWARE & EQUIPMENT (4.90%) | ||||||||
| Samsung Electronics Co. Ltd. | 15,000 | 7,483,972 | ||||||
| Sindo Ricoh | 125,000 | 6,596,450 | ||||||
| TELECOMMUNICATION SERVICES (6.20%) | ||||||||
| Alltel Corp. | 115,000 | 5,737,350 | ||||||
| Matav Rt | 1,400,000 | 6,446,640 | ||||||
| Portugal Telecom SGPS SA | 300,000 | 3,355,853 | ||||||
| TIM S.p.A | 400,000 | 2,261,821 | ||||||
| UTILITIES (8.40%) | ||||||||
| Fortum Oyj | 600,000 | 6,136,417 | ||||||
| Kelda Group PLC | 300,000 | 2,488,750 | ||||||
| Nisource Inc. | 185,000 | 3,931,250 | ||||||
| Progress Energy Inc. | 108,000 | 5,084,640 | ||||||
| Scottish Power PLC | 220,000 | 6,239,200 | ||||||
| TOTAL COMMON STOCKS (Cost $217,560,917) | -- | 233,300,962 | ||||||
| PREFERRED STOCK - 2.00% | ||||||||
| DIVERSIFIED FINANCIALS (2.00%) | ||||||||
| J P Morgan Chase & Co. | 50,000 | 2,521,875 | ||||||
| Lehman Brothers Holdings Inc. | 130,000 | 3,302,000 | ||||||
| TOTAL PREFERRED STOCK (Cost $5,796,000) | -- | 5,823,875 | ||||||
| Principal Amount | Value | |||||||
|---|---|---|---|---|---|---|---|---|
| CORPORATE BONDS - 9.80% | ||||||||
| BANKS (0.80%) | ||||||||
| Capital One Bank, 6.70%, 5/15/2008 | $ | 655,000 | 733,786 | |||||
| Capital One Bank, 6.50%, 6/13/2013 | 1,500,000 | 1,631,715 | ||||||
| COMMERCIAL SERVICES & SUPPLIES (0.10%) | ||||||||
| Waste Management Inc., 7.375%, 8/1/2010 | 175,000 | 206,188 | ||||||
| DIVERSIFIED FINANCIALS (1.40%) | ||||||||
| SLM Corp. Medium Term Note CPI Floating Rate, 3.08%, 4/1/2004 | 2,000,000 | 2,017,280 | ||||||
| SLM Corp. Medium Term Note CPI Floating Rate, 4.00%, 4/1/2004 | 2,000,000 | 2,045,800 | ||||||
| ENERGY (0.40%) | ||||||||
| Sonat Inc., 7.625%, 7/15/2011 | 1,400,000 | 1,214,500 | ||||||
| INSURANCE (2.60%) | ||||||||
| AAG Holding Co. Inc., 6.875%, 6/1/2008 | 335,000 | 362,079 | ||||||
| Hartford Life Inc., 7.10%, 6/15/2007 | 400,000 | 453,418 | ||||||
| Liberty Mutual Group Inc. Guaranteed Senior Notes, 5.75%, 3/15/2014 | $ | 1,000,000 | $ | 996,658 | ||||
| Old Republic International Corp., 7.00%, 6/15/2007 | 1,000,000 | 1,135,091 | ||||||
| Pacific Life Global Funding CPI Floating Rate, 4.106%, 4/6/2004 | 2,000,000 | 2,022,540 | ||||||
| Provident Cos Inc., 6.375%, 7/15/2005 | 353,000 | 359,396 | ||||||
| Unumprovident Corp., 7.625%, 3/1/2011 | 2,070,000 | 2,170,913 | ||||||
| MEDIA (0.40%) | ||||||||
| AOL Time Warner Inc., 6.875%, 5/1/2012 | 425,000 | 486,206 | ||||||
| Independent News & Media Finance, 5.75%, 5/17/2009 | 600,000 | 709,892 | ||||||
| PHARMACEUTICALS & BIOTECHNOLOGY (1.80%) | ||||||||
| Tiers Inflation Linked Trust Series Wye 2004 21 Trust Certificate CPI | ||||||||
| Floating Rate, 4.00%, 5/1/2004 | 5,000,000 | 5,000,000 | ||||||
| REAL ESTATE MANAGEMENT & DEVELOPMENT (0.60%) | ||||||||
| MDC Holdings Inc., 7.00%, 12/1/2012 | 1,500,000 | 1,700,669 | ||||||
| TECHNOLOGY - HARDWARE & EQUIPMENT (0.20%) | ||||||||
| Jabil Circuit Inc., 5.875%, 7/15/2010 | 500,000 | 536,407 | ||||||
| TELECOMMUNICATION SERVICES (1.50%) | ||||||||
| Level 3 Communications Inc., 9.125%, 5/1/2008 | 300,000 | 243,000 | ||||||
| Level 3 Communications Inc., 1.00%, 3/15/2010 | 1,500,000 | 1,155,000 | ||||||
| TCI Communications Inc., 7.875%, 8/1/2013 | 2,285,000 | 2,754,963 | ||||||
| TOTAL CORPORATE BONDS (Cost $27,288,056) | -- | 27,935,501 | ||||||
| CONVERTIBLE BONDS - 1.20% | ||||||||
| DIVERSIFIED FINANCIALS (0.10%) | ||||||||
| E-Trade Financial Corp., 6.00%, 2/1/2007 | 265,000 | 271,294 | ||||||
| TELECOMMUNICATION SERVICES (1.10%) | ||||||||
| Level 3 Communications Inc., 6.00%, 9/15/2009 | 1,420,000 | 866,200 | ||||||
| Level 3 Communications Inc., 6.00%, 3/15/2010 | 4,000,000 | 2,390,000 | ||||||
| TOTAL CONVERTIBLE BONDS (Cost $3,975,033) | -- | 3,527,494 | ||||||
| U.S. GOVERNMENT AGENCIES - 0.70% | ||||||||
| Federal National Mortgage Association CPI Floating Rate, 3.00%, 4/17/2004 | 2,000,000 | 2,032,700 | ||||||
| TOTAL U.S. GOVERNMENT AGENCIES (Cost $2,000,000) | -- | 2,032,700 | ||||||
| TAXABLE MUNICIPAL BONDS - 1.60% | ||||||||
| Short Pump Town Center Community Development, 6.26%, 2/1/2009 | 2,000,000 | 2,031,200 | ||||||
| Victor New York Taxable-Tax Increment, 9.05%, 5/1/2008 | 2,300,000 | 2,514,912 | ||||||
| TOTAL TAXABLE MUNICIPAL BONDS (Cost $4,386,670) | -- | 4,546,112 | ||||||
| SHORT TERM INVESTMENTS - 3.20% | ||||||||
| American General Finance Corp., 1.03% due 4/2/2004 | 9,000,000 | 8,999,742 | ||||||
| TOTAL SHORT TERM INVESTMENTS (Cost $8,999,742) | -- | 8,999,742 | ||||||
| TOTAL INVESTMENTS (100%) (Cost $270,006,418) | -- | $ | 286,166,386 | |||||
| See notes to financial statements | ||||||||
17
Thornburg Investment Income Builder Fund
Portfolio Proxy Voting
March 31, 2004
Policies and Procedures (Unaudited):
The Trust has delegated to Thornburg Investment Management, Inc. (“the Advisor”) voting decisions respecting proxies for the Fund’s voting securities. The Advisor makes voting decisions in accordance with its Proxy Voting Policy and Procedures. A description of the policy and Procedures is available (i) without charge, upon request, by calling the Advisor toll-free at 1.800.847.0200, (ii) on the Thornburg website at www.thornburg.com, and (iii) on the Securities and Exchange Commission’s website at www.sec.gov.
Commencing August 31, 2004, information regarding how proxies were voted will be available on or before August 31 of each year for the twelve months ending the preceding June 30. This information will be available (i) without charge, upon request, on the Thornburg website at www.thornburg.com and (ii) on the Securities and Exchange Commission’s website at www.sec.gov.
Item 2. Code of Ethics
Not applicable.
Item 3. Audit Committee Financial Expert
Not applicable.
Item 4. Principal Accountant Fees and Services
Not applicable.
Item 5. Audit Committee of Listed Registrants
Not applicable.
Item 6. Schedule of Investments
Not applicable.
Item 7. Disclosure of Proxy Voting Policies and Procedures for Closed-End Management Investment Companies
Not applicable.
Item 8. Purchases of Equity Securities by Closed-End Management Investment Companies and Affiliated Purchasers.
Not applicable.
Item 9. Submission of Matters to a Vote of Security Holders
On April 8, 2004, the Trustees of Thornburg Investment Trust adopted (i) a procedure for Shareholder Communications to Trustees providing a procedure by which shareholders may recommend candidates for nomination as Trustees, and (ii) a Nominating Committee Charter providing for the committee’s consideration of candidates for nomination recommended by shareholders.
Item 10. Controls and Procedures
(a) The principal executive officer and the principal financial officer have concluded that Thornburg Investment Trust disclosure controls and procedures (as defined in Rule 30a-3(c) under the Investment Company Act of 1940) provide reasonable assurance that material information relating to Thornburg Investment Trust is made known to them by the appropriate persons, based on their evaluation of these controls and procedures as of a date within 90 days prior to the filing date of this report.
(b) There was no change in the Thornburg Investment Trust’s internal control over financial reporting (as defined in Rule 30a-3(d) under the Investment Company Act of 1940) that occurred during the registrant’s most recent fiscal half-year that has materially affected, or is reasonably likely to materially affect, the registrant’s internal control over financial reporting.
Item 11. Exhibits
| (a) | (1) Not applicable. |
| (a) | (2) Certifications pursuant to Rule 30a-2 under the Investment Company Act of 1940 (17 CFR 70.30a-2) attached hereto as Exhibit 99.CERT. |
| (b) | Certification pursuant to Section 906 of the Sarbanes-Oxley Act of 2002 attached hereto as Exhibit 99.906CERT. |
SIGNATURES
Pursuant to the requirements of the Securities Exchange Act of 1934 and the Investment Company Act of 1940, the registrant has duly caused this report to be signed on its behalf by the undersigned, thereunto duly authorized.
Thornburg Investment Trust, in respect of Thornburg Intermediate Municipal Fund, Thornburg New Mexico Intermediate Municipal Fund, Thornburg Florida Intermediate Municipal Fund, Thornburg Limited Term U.S. Government Fund, Thornburg Limited Term Income Fund, Thornburg Value Fund, Thornburg International Value Fund, Thornburg Core Growth Fund, and Thornburg Investment Income Builder Fund.
By: /s/ Brian J. McMahon
Brian J. McMahon
President and principal executive officer
Date: May 27, 2004
Pursuant to the requirements of the Securities Exchange Act of 1934 and the Investment Company Act of 1940, this report has been signed below by the following persons on behalf of the registrant and in the capacities and on the dates indicated.
By: /s/ Brian J. McMahon
Brian J. McMahon
President and principal executive officer
Date: May 27, 2004
By: /s/ Steven J. Bohlin
Steven J. Bohlin
Treasurer and principal financial officer
Date: May 27, 2004