UNITED STATES
SECURITIES AND EXCHANGE COMMISSION
Washington, D.C. 20549
FORM N-CSR
CERTIFIED SHAREHOLDER REPORT OF REGISTERED MANAGEMENT
INVESTMENT COMPANIES
Investment Company Act file number 811-05201
Thornburg Investment Trust
(Exact name of registrant as specified in charter)
c/o Thornburg Investment Management, Inc.
2300 North Ridgetop Road, Santa Fe, New Mexico 87506
(Address of principal executive offices) (Zip code)
Garrett Thornburg, 2300 North Ridgetop Road, Santa Fe, New Mexico 87506
(Name and address of agent for service)
Registrant’s telephone number, including area code: 505-984-0200
Date of fiscal year end: September 30, 2010
Date of reporting period: March 31, 2010
| Item 1. | Reports to Stockholders |
The following annual reports are attached hereto, in order:
Thornburg Limited Term Municipal Fund
Thornburg Intermediate Municipal Fund
Thornburg Strategic Municipal Income Fund
Thornburg California Limited Term Municipal Fund
Thornburg New Mexico Intermediate Municipal Fund
Thornburg New York Intermediate Municipal Fund
Thornburg Limited Term Income Funds
Thornburg Strategic Income Fund
Thornburg Value Fund
Thornburg International Value Fund
Thornburg Core Growth Fund
Thornburg International Growth Fund
Thornburg Investment Income Builder Fund
Thornburg Global Opportunities Fund
Thornburg Developing World Fund

2 This page is not part of the Semi-Annual Report.
Important Information
The information presented on the following pages is current as of March 31, 2010. The managers’ views, portfolio holdings, and sector diversification are provided for the general information of the Fund’s shareholders; they are historical and subject to change. This material should not be deemed a recommendation to buy or sell any of the securities mentioned.
Investments in the Fund carry risks, including possible loss of principal. Bond funds have the same interest rate, inflation, and credit risks that are associated with the underlying bonds. The principal value of bonds will fluctuate relative to changes in interest rates, decreasing when interest rates rise. Unlike bonds, bond funds have ongoing fees and expenses. Please see the Fund’s Prospectus for a discussion of the risks associated with an investment in the Fund. Investments in the Fund are not FDIC insured, nor are they deposits of or guaranteed by a bank or any other entity. There is no guarantee that the Fund will meet its investment objectives. The laddering strategy does not assure or guarantee better performance and cannot eliminate the risk of investment losses.
Performance data given at net asset value (NAV) does not take into account applicable sales charges. If the sales charges had been included, the performance would have been lower.
Minimum investments for Class I shares are higher than those for other classes. Class I shares may not be available to all investors.
| | | | |
Share Class | | NASDAQ Symbol | | Cusip |
Class A | | LTMFX | | 885-215-459 |
Class C | | LTMCX | | 885-215-442 |
Class I | | LTMIX | | 885-215-434 |
Lipper’s 2008
Best Fixed-Income Fund Family
Thornburg Investment Management ranked #1 out of 41 eligible firms in Lipper, Inc.’s fixed income large firm universe for the three-year period ended 12/31/07, based on risk-adjusted returns. Past performance does not guarantee future results.
Lipper’s large firm universe is comprised of fund families with more than $28 billion in total net assets. Only fund families with at least five bond funds were eligible. Risk-adjusted returns were calculated with dividends reinvested and without sales charges. We did not win this award in 2009 or 2010.
Glossary
Barclays Capital Five-Year Municipal Bond Index – A rules-based, market-value-weighted index of the tax-exempt bond market. To be included in the index, bonds must have a minimum credit rating of Baa. The approximate maturity of the municipal bonds in the index is five years.
Unless otherwise noted, index returns reflect the reinvestment of income dividends and capital gains, if any, but do not reflect fees, brokerage commissions or other expenses of investing. Investors may not make direct investments into any index.
Alternative Minimum Tax (AMT) – A federal tax aimed at ensuring that high-income individuals, estates, trusts, and corporations pay a minimal level income tax. For individuals, the AMT is calculated by adding tax preference items to regular taxable income.
Annualized Distribution Yield – The distribution yield is calculated by taking the sum of the month’s total distribution factors and dividing this sum by a 30-day period and annualizing to a 360-day year. The value is then divided by the ending maximum offering price per share to arrive at the annualized distribution yield. The yield is calculated on a periodic basis and is subject to change.
Bond Credit Ratings – A bond credit rating assesses the financial ability of a debt issuer to make timely payments of principal and interest. Ratings of AAA (the highest), AA, A, and BBB are investment-grade quality. Ratings of BB, B, CCC, CC, C, and D (the lowest) are considered below investment grade, speculative grade, or junk bonds. Unless otherwise noted, the ratings listed are from Municipal Market Data and are a combination of ratings from Standard and Poor’s, Moody’s Investors Service, and Fitch Ratings.
Duration – The weighted maturity of a bond’s cash flows. Duration measures the price sensitivity of a bond for a given change in interest rates. Bonds with longer durations experience greater price volatility than bonds with shorter durations.
Fed Funds Rate – The Fed Funds Rate is the interest rate at which a depository institution lends immediately available funds (balances at the Federal Reserve) to another depository institution overnight.
Revenue Bond – A bond on which the debt service is payable solely from the revenue generated from the operation of the project being financed or a category of facilities, or from other non-tax sources.
SEC Yield – SEC Yield is computed in accordance with SEC standards measuring the net investment income per share over a specified 30-day period expressed as a percentage of the maximum offering price of the Fund’s shares at the end of the period.
This page is not part of the Semi-Annual Report. 3
Thornburg Limited Term Municipal Fund
At Thornburg, our approach to management of the Fund is based on the premise that investors in the Fund seek preservation of capital along with an attractive, relatively stable yield. While aggressive bond strategies may generate stronger returns when the market is turning a blind eye towards risk, they usually fail to stack up over longer periods of time. Our patience and diligence were recognized by Lipper in 2008 with the Best Fixed-Income Fund Family Award.
We apply time-tested techniques to manage risk and provide attractive returns. These include:
| | • | | Building a laddered portfolio. Laddering has been shown over time to mitigate price and interest rate risk. |
| | • | | Investing on a cash-only basis without using leverage. While leveraged strategies may enhance returns when market conditions are favorable, they can quickly compound losses when sentiment shifts. |
| | • | | Conducting in-depth fundamental research on each issue and actively monitoring positions for subsequent credit events. |
| | • | | Diversifying among a large number of generally high-quality bonds. |
IMPORTANT PERFORMANCE INFORMATION
Performance data shown represents past performance and is no guarantee of future results. Investment return and principal value will fluctuate so shares, when redeemed, may be worth more or less than their original cost. Current performance may be lower or higher than quoted. For performance current to the most recent month end, visit thornburg.com.
The maximum sales charge for the Fund’s Class A shares is 1.50%. The total annual fund operating expense of Class A shares is 0.86%, as disclosed in the most recent Prospectus.
AVERAGE ANNUAL TOTAL RETURNS
For periods ended March 31, 2010
| | | | | | | | | | | | | | | |
| | | 1 Yr | | | 3 Yrs | | | 5 Yrs | | | 10 Yrs | | | Since
Inception | |
A Shares (Incep: 9/28/84) | | | | | | | | | | | | | | | |
Without sales charge | | 7.09 | % | | 4.55 | % | | 3.86 | % | | 4.14 | % | | 5.57 | % |
With sales charge | | 5.51 | % | | 4.01 | % | | 3.54 | % | | 3.98 | % | | 5.50 | % |
30-DAY YIELDS, A SHARES
As of March 31, 2010
| | | | |
Annualized
Distribution Yield | | | SEC
Yield | |
| 2.41 | % | | 1.90 | % |
KEY PORTFOLIO ATTRIBUTES
As of March 31, 2010
| | |
Number of Bonds | | 942 |
Duration | | 3.4 Yrs |
Average Maturity | | 4.4 Yrs |
| | |
| | |
See the entire portfolio in the Schedule of Investments beginning on page 10.
4 This page is not part of the Semi-Annual Report.
THORNBURG LIMITED TERM MUNICIPAL FUND VERSUS
LIPPER TAX-EXEMPT MONEY MARKET FUNDS AVERAGE
Class A shares as of March 31, 2010
We are often asked to compare Thornburg Limited Term Municipal Fund to money market fund returns. Municipal bond funds are not an exact substitute for money market funds. These investments have certain differences, which are summarized below. Investors in the Thornburg Limited Term Municipal Fund took more risk than tax-exempt money market fund investors to earn their higher returns.
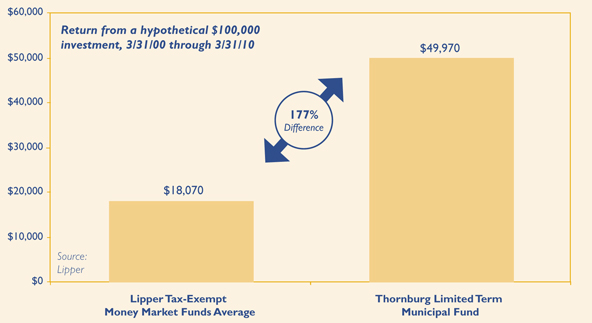
Past performance does not guarantee future results. Performance data above does not include the 1.50% sales charge for Class A shares. If the sales charge had been included, returns would have been lower. Returns shown are minus the initial investment.
Investors in municipal bond funds may experience more volatility than those in comparable money market funds. There are also differences in fees and expenses.
Investors in the Thornburg Limited Term Municipal Fund took more risk than money market investors to earn their higher returns, including interest rate and credit risk. Unlike money market funds, the prices of bonds fluctuate relative to changes in interest rates, with principal values decreasing when interest rates rise and increasing when interest rates fall. Generally, money market funds seek to maintain an investment portfolio with an average maturity of 90 days or less. Thornburg Limited Term Municipal Fund has an average maturity of normally less than five years. Interest dividends paid by the Fund or by tax-exempt money market funds are generally exempt from federal income tax (interest dividends may be subject to AMT). Income sourced from state of residency is generally exempt from state income tax.
Money market funds seek to preserve the value per share at $1.00, whereas the Thornburg Limited Term Municipal Fund’s net asset value changes daily. It is possible to lose money when investing in either the Thornburg Limited Term Municipal Fund or a tax-exempt money market fund. Neither are insured by the FDIC or any other government agency.
Lipper Tax-Exempt Money Market Funds Average is an arithmetic average of the total return of all tax-exempt money market mutual funds. You cannot invest in a category average.
This page is not part of the Semi-Annual Report. 5

Thornburg Limited Term Municipal Fund
March 31, 2010
Table of Contents
This report is certified under the Sarbanes-Oxley Act of 2002, which requires that public companies, including mutual funds, affirm that the information provided in their annual and semiannual shareholder reports fully and fairly represents their financial position.
6 Certified Semi-Annual Report
Letter to Shareholders
| | |

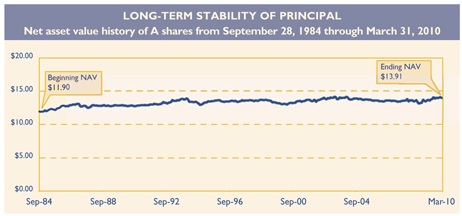
| | April 15, 2010 Dear Fellow Shareholder: We are pleased to present the semi-annual report for the Thornburg Limited Term Municipal Fund. The net asset value of the Class A shares declined by 9 cents to $13.91 during the six months ended March 31, 2010. If you were with us for the entire period, you received dividends of 19.7 cents per share. If you reinvested your dividends, you received 19.8 cents per share. Dividends per share were lower for Class C shares and higher for Class I shares to account for varying class-specific expenses. After a couple of years of unprecedented volatility, the municipal bond market has regained its status as one of the least exciting U.S. capital markets. While we embrace the new reality – slow and steady is what we strive for – we do not entirely trust it. Like other U.S. markets, the municipal market is benefiting from U.S. Treasury and Federal Reserve Bank support. By setting the Fed Funds Rate effectively at 0%, the Federal Open Market Committee (FOMC) is basically pushing hundreds of billions of dollars into bonds and bond funds. Flows into bond funds were $357 billion last year and may reach that level again this year. While we do not expect the Federal Reserve (the Fed) to hike the Fed Funds Rate soon, it is a reasonable bet that the next move will not be down. A significantly higher Fed Funds Rate, if and when it materializes, would likely not be good for bond fund flows or bond prices. The second major element of federal support has been the implementation of the Build America Bond (BAB) program. This program allows municipalities to issue taxable bonds for qualified projects and receive a subsidy of 35% of their interest cost from the federal government. The program has been very popular, with almost $100 billion issued since the first deal was sold in April 2009. BAB issues currently account for over 30% of new issue municipal bond supply, crowding out much of the supply of traditional tax-exempt bonds. The reduced supply, coupled with heavy demand for bonds has provided significant support to municipal bond prices. The BAB program is scheduled to expire at the end of this year, but will probably be extended, most likely with a reduced subsidy. Depending upon the final form of the program, we may see the balance shift back to more traditional tax-exempt issuance in 2011, which could erode some support for bond prices. Another part of the American Recovery and Reinvestment Act allocated approximately $280 billion to the states for various stimulus-related projects. The federal dollars helped the states close over $300 billion of budget gaps during the current recession, but most of that money will be spent by June 30, 2011. If tax revenues come back strongly over the next 12-24 months, the disappearing stimulus money may not be missed. However, if tax revenues are slow to bounce back, budget balancing will remain a perilous task. |
| |
| |
| |
| |
| |
Certified Semi-Annual Report 7
| | |
Letter to Shareholders, Continued | | |
Working in the opposite direction, higher tax rates should bolster demand for tax-exempt municipals, as the Bush tax cuts expire and the highest marginal tax rates climb back up to 39.6% from 35%. On top of this, the recently signed health insurance reform law applies Medicare taxes to virtually all investment income except interest from tax-exempt municipal bonds. We believe that the status of municipal bonds as perhaps the last true legal tax shelter available to investors is not fully priced into the market.
The U.S. economy apparently hit bottom last summer and has been growing the last three quarters. However, payroll employment growth just showed up last month, and so many jobs were lost in the last two years that it will take several years of robust growth just to get back down to 6% unemployment. Most banks are still very reluctant to increase lending, and core consumer price inflation has slowed to a level not seen since 1960. So, despite the large amount of additional debt (particularly from the U.S. Treasury) coming into the marketplace, we don’t expect a dramatic rise in interest rates this year.
After three quarters of positive GDP growth, state tax revenues are still falling. The 4th quarter of 2009 marks the fifth consecutive quarter of declining state tax revenues. The rate of decline has decreased to 4.2% from a peak of 16.5% in the second quarter, but state tax revenues are still down over 8% from levels two years ago. Prior to the current downturn, state tax revenues grew 5 to 5.5% on average for two decades, allowing budgets and entitlements to expand at an unsustainable pace. Most states are going through a very difficult adjustment process and dealing with shrinking tax revenues in very different ways. In general, we have favored states that set aside large reserve balances when times were better, and cut budgets and/or found new ongoing revenue streams when tax revenues declined. A few states have primarily added to debt loads, borrowed from future revenues, delayed payments and pension contributions, or used other accounting gimmicks to balance their budgets. These states seem to be making the assumption that tax revenues will bounce back strongly. There has been some recent improvement in revenues from some states in the early months of 2010, but it is still too early to count on. We will have to watch the numbers carefully to determine if the more aggressive states get bailed out by rapid revenue growth or end up confronting even worse challenges ahead.
Tax revenues have held up much better at the local level, not yet going negative and growing 4.6% in the fourth quarter of 2009. Most local governments rely heavily on property taxes, which have traditionally been quite stable, and have proven to be so even in the worst real estate downturn in decades. Real estate taxes take a while to adjust and there are some areas of the country that are starting to see significantly lower tax revenues as properties make their way through the appeal process. We are watching these trends as they develop. Revenue bonds such as municipal utility bonds, hospital bonds, and toll roads have generally held up quite well in the current recession, and we continue to find issuers we like in these sectors. Hospitals, in particular, appear to be one of the few clear winners coming out of the recent health care reform.
Despite much improved market liquidity, strong demand for bonds, and general economic optimism, it is clearly a time for careful diligence and diversification of investment portfolios. Your Fund is broadly diversified and 87% invested in bonds rated A or above by at least one of the major rating agencies. Your Thornburg Limited Term Municipal Fund is a laddered portfolio of over 900 municipal obligations from 47 states. We ladder the maturity dates of the bonds in
8 Certified Semi-Annual Report
your portfolio so that some of the bonds are scheduled to mature during each of the coming years. Laddering short and intermediate bonds accomplishes two goals. First, the staggered bond maturities contained in a ladder defuse interest-rate risk and dampen the Fund’s price volatility. Second, laddering gives the Fund a steady cash flow stream from maturing bonds to reinvest toward the top of the ladder where yields are typically higher. The chart on the right describes the percentages of your Fund’s bond portfolio maturing in each of the coming years.
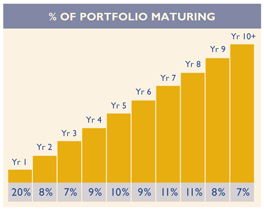
As of 3/31/10. Percentages vary over time.
Data may not add up to 100% due to rounding.
The Class A shares of your Fund produced a total return of 0.77% (at NAV) over the six-month period ended March 31, 2010, compared to a 1.32% return for the Barclays Capital Five-Year Municipal Bond Index. Over the last six months, 5-year bonds outperformed 1-4 year bonds and 6-10 year bonds. Since the Fund invests In a laddered portfolio of bonds from one to ten years, many of the shorter and longer bonds in the Fund underperformed the Index, leading to some underperformance by the Fund relative to the Index.
Historically, our practice of laddering a diversified portfolio of short and intermediate maturity municipal bonds has allowed your Fund to perform consistently well in varying interest rate environments. Thank you for investing in Thornburg Limited Term Municipal Fund.
Sincerely,
| | | | |
 | |  | |  |
George Strickland Co-Portfolio Manager Managing Director | | Josh Gonze Co-Portfolio Manager Managing Director | | Christopher Ihlefeld Co-Portfolio Manager Managing Director |
The matters discussed in this report may constitute forward-looking statements made pursuant to the safe harbor provisions of the Securities Litigation Reform Act of 1995. These include any advisor or portfolio manager prediction, assessment, analysis or outlook for individual securities, industries, investment styles, market sectors and/or markets. These statements involve risks and uncertainties. In addition to the general risks described for each fund in its current prospectus, other factors bearing on these reports include the accuracy of the advisor’s or portfolio manager’s forecasts and predictions, the appropriateness of the investment strategies designed by the advisor or portfolio manager and the ability of the advisor or portfolio manager to implement their strategies efficiently and successfully. Any one or more of these factors, as well as other risks affecting the securities markets generally, could cause the actual results of any fund to differ materially as compared to its benchmarks.
Certified Semi-Annual Report 9
| | |
| SCHEDULE OF INVESTMENTS | | |
| |
| Thornburg Limited Term Municipal Fund | | March 31, 2010 (Unaudited) |
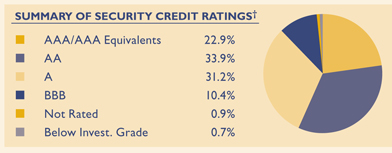
We have used ratings from Standard & Poor’s (S&P). Where S&P ratings are not available, we have used Moody’s Investors Service. Where neither rating is available, we have used ratings from Fitch Ratings. The category of investments identified as “AAA” in this graph includes investments which are pre-refunded or escrowed to maturity. Such investments are backed by an escrow or trust containing sufficient U.S. Government or U.S. Government agency securities to satisfy the timely payment of principal and interest and, therefore, are normally deemed to be equivalent to AAA-rated securities.
| | | | | | | | |
Issuer-Description | | Credit Rating†
S&P/ Moody’s | | Principal
Amount | | Value |
ALABAMA — 1.22% | | | | | | | | |
Alabama State Public School & College Authority, 5.00% due 5/1/2012 | | AA/Aa2 | | $ | 2,000,000 | | $ | 2,159,500 |
Alabama State Public School & College Authority, 5.00% due 5/1/2013 | | AA/Aa2 | | | 5,000,000 | | | 5,527,050 |
Alabama State Public School & College Authority, 5.00% due 5/1/2016 | | AA/Aa2 | | | 5,000,000 | | | 5,623,150 |
Birmingham GO, 5.00% due 10/1/2013 (Insured: Natl-Re) | | AA/Aa3 | | | 2,500,000 | | | 2,774,050 |
Huntsville GO, 5.50% due 11/1/2014 | | AAA/Aa1 | | | 3,425,000 | | | 3,804,045 |
Lake Martin Area IDA, 5.00% due 11/1/2011 | | NR/NR | | | 3,000,000 | | | 3,090,150 |
Mobile GO Warrants, 5.25% due 8/1/2012 (Insured: AGM) | | AAA/Aa3 | | | 1,025,000 | | | 1,123,082 |
Mobile GO Warrants, 4.50% due 8/15/2016 | | NR/NR | | | 2,185,000 | | | 2,316,603 |
a Mobile Industrial Development PCR, 5.00% due 6/1/2034 put 3/19/2015 (Alabama Power Co.) | | A/A2 | | | 6,000,000 | | | 6,476,820 |
University of Alabama at Birmingham Hospital Revenue, 5.25% due 9/1/2017 | | A+/A1 | | | 2,500,000 | | | 2,682,175 |
University of Alabama at Birmingham Hospital Revenue, 5.00% due 9/1/2018 | | A+/A1 | | | 1,500,000 | | | 1,569,120 |
ALASKA — 0.75% | | | | | | | | |
Alaska Energy Power Authority, 6.00% due 7/1/2011 (Bradley Lake Hydroelectric; Insured: AGM) | | AAA/Aa3 | | | 955,000 | | | 1,011,574 |
Alaska Housing Finance Corp. GO, 5.00% due 12/1/2018 (Insured: Natl-Re) | | AA/Aa2 | | | 2,000,000 | | | 2,156,700 |
Alaska Industrial Development & Export Authority GO, 5.00% due 4/1/2014 | | AA-/A1 | | | 2,000,000 | | | 2,223,840 |
Alaska Industrial Development & Export Authority GO, 5.00% due 4/1/2015 | | AA-/A1 | | | 1,900,000 | | | 2,131,078 |
Alaska Industrial Development & Export Authority GO, 5.00% due 4/1/2016 | | AA-/A1 | | | 1,000,000 | | | 1,110,990 |
Alaska Industrial Development & Export Authority GO, 5.00% due 4/1/2017 | | AA-/A1 | | | 3,000,000 | | | 3,307,200 |
Alaska Industrial Development & Export Authority GO, 5.00% due 4/1/2018 | | AA-/A1 | | | 2,455,000 | | | 2,694,387 |
Alaska Municipal Bond Bank, 5.00% due 6/1/2014 (Insured: Natl-Re; State Aid Withholding) | | A+/A1 | | | 1,175,000 | | | 1,293,640 |
Alaska Student Loan Corp., 5.25% due 1/1/2012 (Insured: AGM) | | AAA/NR | | | 3,000,000 | | | 3,157,200 |
North Slope Boro GO, 5.00% due 6/30/2015 (Insured: Natl-Re) | | AA-/A2 | | | 3,250,000 | | | 3,681,698 |
ARIZONA — 3.54% | | | | | | | | |
a Arizona Board of Regents COP, 5.00% due 7/1/2018 (Arizona State University; Insured: Natl-Re) | | AA-/A2 | | | 1,285,000 | | | 1,384,793 |
Arizona HFA, 5.00% due 7/1/2018 (Catholic Healthcare West ) | | A/A2 | | | 1,470,000 | | | 1,530,373 |
Arizona HFA, 5.00% due 7/1/2019 (Catholic Healthcare West) | | A/A2 | | | 1,365,000 | | | 1,411,383 |
a Arizona HFA, 5.00% due 7/1/2020 (Catholic Healthcare West) | | A/A2 | | | 1,290,000 | | | 1,318,664 |
Arizona Transportation Board Highway Revenue, 5.25% due 7/1/2015 | | AAA/Aa1 | | | 3,860,000 | | | 4,244,533 |
b Chandler Street & Highway User Revenue, 3.00% due 7/1/2013 | | AA/Aa3 | | | 1,905,000 | | | 1,994,040 |
b Chandler Street & Highway User Revenue, 3.00% due 7/1/2014 | | AA/Aa3 | | | 2,790,000 | | | 2,922,832 |
Glendale IDA, 5.00% due 5/15/2015 (Midwestern University) | | A-/NR | | | 1,000,000 | | | 1,075,570 |
Glendale IDA, 5.00% due 5/15/2016 (Midwestern University) | | A-/NR | | | 1,325,000 | | | 1,417,034 |
Glendale IDA, 5.00% due 5/15/2017 (Midwestern University) | | A-/NR | | | 1,440,000 | | | 1,527,494 |
Glendale Western Loop 101 Public Facilities Corp., 6.00% due 7/1/2019 | | AA/A2 | | | 2,200,000 | | | 2,339,832 |
Maricopa County IDA Health Facilities Revenue, 4.125% due 7/1/2015 (Catholic Healthcare West) | | A/A2 | | | 1,000,000 | | | 1,035,030 |
Maricopa County IDA Health Facilities Revenue, 5.00% due 7/1/2016 (Catholic Healthcare West) | | A/A2 | | | 2,355,000 | | | 2,361,076 |
Maricopa County IDA Health Facilities Revenue, 5.00% due 7/1/2038 put 7/1/2014 (Catholic Healthcare West) | | A/A2 | | | 7,500,000 | | | 8,100,225 |
10 Certified Semi-Annual Report
| | |
| SCHEDULE OF INVESTMENTS, CONTINUED | | |
| |
| Thornburg Limited Term Municipal Fund | | March 31, 2010 (Unaudited) |
| | | | | | | | |
Issuer-Description | | Credit Rating†
S&P/ Moody’s | | Principal
Amount | | Value |
Maricopa County Pollution Control Corp. PCR, 5.50% due 5/1/2029 put 5/1/2012 (Arizona Public Service Co.) | | BBB-/Baa2 | | $ | 10,000,000 | | $ | 10,409,800 |
Mohave County IDA, 5.00% due 4/1/2014 (Mohave Prison LLC; Insured: Syncora) (ETM) | | AAA/NR | | | 3,135,000 | | | 3,543,146 |
Mohave County IDA, 7.25% due 5/1/2015 (Mohave Prison LLC) | | BBB+/NR | | | 12,100,000 | | | 12,845,723 |
Navajo County PCR, 5.50% due 6/1/2034 put 6/1/2014 (Arizona Public Service Co.) | | BBB-/Baa2 | | | 1,200,000 | | | 1,258,380 |
Navajo County PCR, 5.50% due 6/1/2034 put 6/1/2014 (Arizona Public Service Co.) | | BBB-/Baa2 | | | 2,600,000 | | | 2,726,490 |
Navajo County PCR, 5.75% due 6/1/2034 put 6/1/2016 (Arizona Public Service Co.) | | BBB-/Baa2 | | | 5,600,000 | | | 5,825,512 |
Northern Arizona University COP, 5.00% due 9/1/2019 (Insured: AMBAC) | | A/A3 | | | 3,500,000 | | | 3,538,115 |
Phoenix Civic Improvement Wastewater Systems, 6.00% due 7/1/2011 (Insured: FGIC) | | AA+/Aa3 | | | 4,105,000 | | | 4,204,751 |
Pima County IDA, 6.40% due 7/1/2013 (Arizona Charter Schools) | | NR/Baa3 | | | 825,000 | | | 830,099 |
Pima County IDA, 5.00% due 7/1/2016 (Metro Police Facility) | | AA/NR | | | 2,500,000 | | | 2,747,750 |
Pima County IDA, 5.00% due 7/1/2017 (Metro Police Facility) | | AA/NR | | | 3,000,000 | | | 3,280,770 |
Pima County IDA, 5.00% due 7/1/2018 (Metro Police Facility) | | AA/NR | | | 3,285,000 | | | 3,577,529 |
Pima County IDA, 5.00% due 7/1/2019 (Metro Police Facility) | | AA/Aa3 | | | 2,000,000 | | | 2,166,120 |
Salt River Agricultural Improvement & Power District, 3.00% due 1/1/2014 | | AA/Aa1 | | | 11,275,000 | | | 11,889,262 |
Salt River Agricultural Improvement & Power District, 5.00% due 1/1/2020 | | AA/Aa1 | | | 1,205,000 | | | 1,209,025 |
Show Low IDA Hospital, 5.25% due 12/1/2010 (Navapache Regional Medical Center; Insured: ACA) | | BBB/NR | | | 1,000,000 | | | 1,002,110 |
Yuma Property Corp. Utility Systems Revenue, 5.00% due 7/1/2016 (Insured: XCLA) | | A+/A3 | | | 2,000,000 | | | 2,162,920 |
Yuma Property Corp. Utility Systems Revenue, 5.00% due 7/1/2018 (Insured: XCLA) | | A+/A3 | | | 2,130,000 | | | 2,267,598 |
ARKANSAS — 0.07% | | | | | | | | |
Jefferson County Hospital Improvement, 5.50% due 6/1/2010 (Jefferson Hospital Association) | | A/NR | | | 1,000,000 | | | 1,006,930 |
Jefferson County Hospital Improvement, 5.50% due 6/1/2011 (Jefferson Hospital Association) | | A/NR | | | 1,075,000 | | | 1,123,579 |
CALIFORNIA — 10.03% | | | | | | | | |
Alameda County COP, 5.00% due 12/1/2017 (Santa Rita Jail; Insured: AMBAC) | | AA-/NR | | | 1,000,000 | | | 1,100,690 |
Anaheim Public Financing Authority, 5.25% due 10/1/2018 (Electric Systems Generation; Insured: AGM) | | AAA/Aa3 | | | 1,560,000 | | | 1,686,220 |
Calexico USD COP, 5.75% due 9/1/2013 | | BBB+/NR | | | 2,185,000 | | | 2,276,617 |
California Educational Facilities, 5.00% due 4/1/2017 (Pitzer College) | | NR/A3 | | | 1,460,000 | | | 1,556,448 |
California GO, 0.29% due 5/1/2034 put 4/1/2010 (Kindergarten; LOC: Citibank/California State Teachers Retirement) (daily demand notes) | | A+/Aaa | | | 12,700,000 | | | 12,700,000 |
California HFA, 5.00% due 7/1/2027 put 7/1/2014 (Catholic Healthcare West) | | A/A2 | | | 3,500,000 | | | 3,797,570 |
California HFA, 5.00% due 7/1/2028 (Catholic Healthcare West) | | A/A2 | | | 2,000,000 | | | 2,170,040 |
California State Department of Transportation COP, 5.25% due 3/1/2016 (Insured: Natl-Re) | | A/Baa2 | | | 1,000,000 | | | 1,003,390 |
California State Department of Water Resources, 6.00% due 5/1/2013 | | AA-/Aa3 | | | 2,550,000 | | | 2,830,092 |
California State Department of Water Resources Power Supply, 5.50% due 5/1/2012 | | AA-/Aa3 | | | 2,600,000 | | | 2,818,660 |
California State Department of Water Resources Power Supply, 0.32% due 5/1/2022 put 4/1/2010 (Insured: AGM) (daily demand notes) | | AAA/Aa3 | | | 21,700,000 | | | 21,700,000 |
California State Economic Recovery, 5.00% due 7/1/2020 | | A+/A1 | | | 4,000,000 | | | 4,335,480 |
California State Economic Recovery GO, 5.00% due 7/1/2016 | | A+/A1 | | | 12,000,000 | | | 12,424,440 |
California State Economic Recovery GO, 5.00% due 7/1/2018 | | A+/A1 | | | 4,000,000 | | | 4,408,440 |
California State GO, 5.15% due 12/1/2014 (Veterans Bonds) | | AA-/Baa1 | | | 1,000,000 | | | 1,001,990 |
California State Public Works Board, 5.00% due 9/1/2016 (Regents of University of California; Insured: FGIC) | | AA-/Aa2 | | | 3,000,000 | | | 3,336,660 |
California State Public Works Board, 5.00% due 9/1/2017 (Regents of University of California; Insured: FGIC) | | AA-/Aa2 | | | 3,000,000 | | | 3,324,060 |
California State Public Works Board, 5.00% due 11/1/2017 (California State University Trustees) | | BBB+/A1 | | | 3,000,000 | | | 3,090,510 |
California State Public Works Board, 5.00% due 11/1/2018 (California State University Trustees) | | BBB+/A1 | | | 2,700,000 | | | 2,740,554 |
California Statewide Communities Development Authority, 5.00% due 6/15/2013 | | A-/Baa1 | | | 7,000,000 | | | 7,509,670 |
California Statewide Communities Development Authority, 5.00% due 5/15/2017 (Irvine LLC-UCI East Campus) | | NR/Baa2 | | | 2,200,000 | | | 2,316,952 |
Certified Semi-Annual Report 11
| | |
| SCHEDULE OF INVESTMENTS, CONTINUED | | |
| |
| Thornburg Limited Term Municipal Fund | | March 31, 2010 (Unaudited) |
| | | | | | | | |
Issuer-Description | | Credit Rating†
S&P/ Moody’s | | Principal
Amount | | Value |
California Statewide Communities Development Authority, 5.00% due 4/1/2019 (Guaranty Agreement; Kaiser Permanente) | | A+/NR | | $ | 25,000,000 | | $ | 26,505,250 |
California Statewide Communities Development Authority, 5.00% due 7/1/2020 (Aspire Public Schools) | | NR/NR | | | 2,000,000 | | | 1,996,680 |
California Statewide Community Development Authority PCR, 4.10% due 4/1/2028 put 4/1/2013 (Southern California Edison Co.; Insured: XLCA) | | A/A1 | | | 1,000,000 | | | 1,048,330 |
Central Valley Financing Authority, 5.00% due 7/1/2017 (Carson Ice) | | A+/A1 | | | 600,000 | | | 654,150 |
Central Valley Financing Authority, 5.00% due 7/1/2019 (Carson Ice) | | A+/A1 | | | 1,500,000 | | | 1,618,545 |
Chula Vista COP, 5.25% due 3/1/2018 | | A-/NR | | | 1,170,000 | | | 1,221,679 |
Chula Vista COP, 5.25% due 3/1/2019 | | A-/NR | | | 1,235,000 | | | 1,279,139 |
Desert Sands USD COP, 5.25% due 3/1/2016 | | A+/A2 | | | 1,500,000 | | | 1,601,535 |
East Bay Water Systems Revenue, 0.28% due 6/1/2038 put 4/1/2010 (Insured: Dexia) (daily demand notes) | | AAA/Aa2 | | | 2,215,000 | | | 2,215,000 |
Golden State Tobacco Securitization Corp., 5.50% due 6/1/2043 pre-refunded 6/1/2013 | | AAA/Aaa | | | 2,000,000 | | | 2,249,780 |
Inland Valley Development Agency, 5.25% due 4/1/2013 | | A/NR | | | 2,000,000 | | | 2,105,740 |
Inland Valley Development Agency, 5.50% due 4/1/2014 | | A/NR | | | 2,000,000 | | | 2,113,280 |
Irvine Ranch Water District GO, 0.28% due 4/1/2033 put 4/1/2010 (LOC: Bank of America) (daily demand notes) | | A+/Aa3 | | | 1,800,000 | | | 1,800,000 |
Irvine Ranch Water District GO, 0.35% due 7/1/2035 put 4/1/2010 (LOC: Landesbank Baden) (daily demand notes) | | A-/Aa2 | | | 14,215,000 | | | 14,215,000 |
Irvine USD, 5.25% due 9/1/2017 (Community Facilities District 86; Insured: AGM) | | AAA/NR | | | 5,000,000 | | | 5,397,500 |
Irvine USD, 5.25% due 9/1/2018 (Community Facilities District 86; Insured: AGM) | | AAA/NR | | | 3,000,000 | | | 3,216,240 |
Irvine USD, 5.25% due 9/1/2019 (Community Facilities District 86; Insured: AGM) | | AAA/NR | | | 3,000,000 | | | 3,194,760 |
Kern Community College District COP, 4.00% due 4/1/2014 | | SP-1+/NR | | | 2,000,000 | | | 2,037,240 |
Los Angeles Convention & Exhibition Center Authority, 5.00% due 8/15/2018 | | AA-/A1 | | | 2,000,000 | | | 2,151,620 |
Los Angeles USD COP, 5.00% due 10/1/2017 (Insured: AMBAC) | | A+/A2 | | | 2,445,000 | | | 2,625,343 |
Los Angeles USD GO, 5.00% due 7/1/2018 (Insured: AGM) | | AAA/Aa3 | | | 4,000,000 | | | 4,418,800 |
Los Angeles Water & Power Revenue, 0.32% due 7/1/2034 put 4/1/2010 (SPA: Bank of America) (daily demand notes) | | AA-/Aa3 | | | 39,860,000 | | | 39,860,000 |
Modesto Irrigation District COP, 4.30% due 7/1/2010 (Insured: AMBAC) | | A+/A1 | | | 1,000,000 | | | 1,008,000 |
Monterey County COP, 5.00% due 8/1/2016 (Insured: AGM) | | AAA/Aa3 | | | 1,435,000 | | | 1,578,672 |
Monterey County COP, 5.00% due 8/1/2018 (Insured: AGM) | | AAA/Aa3 | | | 2,260,000 | | | 2,464,869 |
Newport Beach Revenue, 5.00% due 12/1/2038 put 2/7/2013 (Hoag Memorial Hospital) | | AA/Aa3 | | | 3,000,000 | | | 3,252,750 |
b Northern California Power Agency Revenue, 5.00% due 7/1/2017 | | A/A2 | | | 1,000,000 | | | 1,096,270 |
b Northern California Power Agency Revenue, 5.00% due 7/1/2019 | | A/A2 | | | 1,000,000 | | | 1,078,230 |
b Northern California Power Agency Revenue, 5.00% due 7/1/2020 | | A/A2 | | | 1,325,000 | | | 1,410,701 |
Orange County Public Financing Authority, 5.00% due 7/1/2017 (Insured: Natl-Re) | | A+/A1 | | | 1,245,000 | | | 1,352,394 |
Pittsburgh Redevelopment Agency, 5.00% due 8/1/2012 (Los Medanos Community Development; Insured: Natl-Re) | | A+/Baa1 | | | 1,255,000 | | | 1,335,144 |
Pittsburgh Redevelopment Agency, 5.00% due 8/1/2018 (Los Medanos Community Development; Insured: Natl-Re) | | A+/Baa1 | | | 5,000,000 | | | 5,094,550 |
Sacramento Cogeneration Authority, 5.00% due 7/1/2017 (Procter & Gamble) | | A+/A1 | | | 750,000 | | | 825,735 |
Sacramento Municipal Utility District, 5.00% due 7/1/2016 (Cosumnes Project; Insured: Natl-Re) | | A/Baa1 | | | 4,870,000 | | | 5,197,702 |
Sacramento Municipal Utility District, 5.00% due 7/1/2019 (Cosumnes Project; Insured: Natl-Re) | | A/Baa1 | | | 5,000,000 | | | 5,146,900 |
San Diego County Regional Transportation, 0.32% due 4/1/2038 put 4/1/2010 (SPA: Dexia) (daily demand notes) | | AAA/Aa2 | | | 14,705,000 | | | 14,705,000 |
San Joaquin County Transportation Authority, 5.00% due 4/1/2011 | | SP-1+/NR | | | 3,000,000 | | | 3,109,470 |
San Joaquin Delta Community College District GO, 0% due 8/1/2019 (Insured: AGM) | | AAA/Aa3 | | | 7,600,000 | | | 4,972,908 |
San Luis & Delta-Mendota Water Authority, 4.50% due 3/1/2014 (Water Utility Improvements) | | A+/NR | | | 3,900,000 | | | 4,136,340 |
San Mateo USD GO, 2.00% due 2/28/2011 | | NR/NR | | | 5,000,000 | | | 5,063,000 |
Santa Clara County Financing Authority Lease Revenue, 4.00% due 5/15/2011 (Multiple Facilities) | | AA/Aa3 | | | 2,000,000 | | | 2,073,960 |
Santa Clara County Financing Authority Lease Revenue, 4.00% due 5/15/2014 (Multiple Facilities) | | AA/Aa3 | | | 4,245,000 | | | 4,581,713 |
Santa Clara County Financing Authority Lease Revenue, 4.00% due 5/15/2017 (Multiple Facilities) | | AA/Aa3 | | | 1,000,000 | | | 1,054,610 |
12 Certified Semi-Annual Report
| | |
| SCHEDULE OF INVESTMENTS, CONTINUED | | |
| |
| Thornburg Limited Term Municipal Fund | | March 31, 2010 (Unaudited) |
| | | | | | | | |
Issuer-Description | | Credit Rating†
S&P/ Moody’s | | Principal
Amount | | Value |
Solano County COP, 5.00% due 11/15/2017 | | AA-/A2 | | $ | 1,580,000 | | $ | 1,646,360 |
Southeast Resource Recovery Facilities Authority, 5.25% due 12/1/2017 (Insured: AMBAC) | | A+/A2 | | | 2,000,000 | | | 2,086,240 |
Tuolumne Wind Project Authority, 5.00% due 1/1/2018 (Tuolumne Co.) | | A+/A1 | | | 2,000,000 | | | 2,165,280 |
Tuolumne Wind Project Authority, 5.00% due 1/1/2019 (Tuolumne Co.) | | A+/A1 | | | 2,000,000 | | | 2,144,780 |
Twin Rivers USD GO, 0% due 4/1/2014 | | A+/NR | | | 3,490,000 | | | 3,064,744 |
Ventura County COP, 5.00% due 8/15/2016 | | AA/A1 | | | 1,520,000 | | | 1,635,930 |
Ventura County COP, 5.25% due 8/15/2017 | | AA/A1 | | | 1,635,000 | | | 1,770,149 |
COLORADO — 2.28% | | | | | | | | |
Adams County Platte Valley Medical Center, 5.00% due 2/1/2015 (Brighton Community Hospital Association; Insured: FHA, Natl-Re) | | A/NR | | | 1,530,000 | | | 1,649,080 |
Adams County Platte Valley Medical Center, 5.00% due 8/1/2015 (Brighton Community Hospital Association; Insured: FHA, Natl-Re) | | A/NR | | | 1,565,000 | | | 1,690,810 |
Beacon Point Metropolitan District, 4.375% due 12/1/2015 (LOC: Compass Bank) | | A+/NR | | | 1,905,000 | | | 1,873,796 |
Colorado COP, 3.00% due 3/1/2013 (Colorado Penitentiary) | | AA-/Aa3 | | | 1,205,000 | | | 1,256,104 |
Colorado COP, 4.00% due 3/1/2014 (Colorado Penitentiary) | | AA-/Aa3 | | | 1,285,000 | | | 1,380,527 |
Colorado COP, 5.00% due 3/1/2016 (Colorado Penitentiary) | | AA-/Aa3 | | | 2,000,000 | | | 2,225,080 |
Colorado COP, 5.00% due 3/1/2017 (Colorado Penitentiary) | | AA-/Aa3 | | | 2,000,000 | | | 2,214,140 |
Colorado COP, 5.00% due 3/1/2018 (Colorado Penitentiary) | | AA-/Aa3 | | | 1,500,000 | | | 1,652,400 |
Colorado Educational & Cultural Facilities, 6.00% due 6/1/2011 | | A/A3 | | | 710,000 | | | 720,742 |
Colorado HFA, 5.00% due 11/15/2013 | | AA-/A1 | | | 2,365,000 | | | 2,580,735 |
Colorado HFA, 5.00% due 11/15/2015 | | AA-/A1 | | | 2,365,000 | | | 2,587,215 |
Colorado HFA, 5.25% due 5/15/2017 (Northern Colorado Medical Center; Insured: AGM) | | AAA/NR | | | 1,185,000 | | | 1,275,427 |
Colorado HFA, 5.25% due 5/15/2019 (Northern Colorado Medical Center; Insured: AGM) | | AAA/NR | | | 2,225,000 | | | 2,375,210 |
Colorado HFA, 5.50% due 10/1/2038 put 11/12/2015 (Catholic Health Initiatives) | | AA/Aa2 | | | 1,000,000 | | | 1,124,230 |
Colorado HFA, 5.00% due 7/1/2039 put 11/8/2012 (Catholic Health) | | AA/Aa2 | | | 3,500,000 | | | 3,776,885 |
Colorado HFA, 5.00% due 7/1/2039 put 11/12/2013 (Catholic Health) | | AA/Aa2 | | | 5,000,000 | | | 5,486,400 |
Colorado HFA, 5.00% due 7/1/2039 put 11/11/2014 (Catholic Health) | | AA/Aa2 | | | 3,000,000 | | | 3,317,760 |
Denver City & County Airport System, 5.00% due 11/15/2016 (Insured: Natl-Re) | | A+/A1 | | | 1,515,000 | | | 1,676,423 |
Denver City & County Airport System, 5.00% due 11/15/2017 (Insured: Natl-Re) | | A+/A1 | | | 1,000,000 | | | 1,099,130 |
Denver City & County COP, 5.00% due 5/1/2013 (Insured: Natl-Re) | | AA+/Aa2 | | | 3,890,000 | | | 4,261,806 |
Denver City & County COP, 5.00% due 5/1/2014 (Insured: Natl-Re) | | AA+/Aa2 | | | 4,000,000 | | | 4,463,880 |
Denver Convention Center Hotel, 5.25% due 12/1/2014 (Insured: Syncora) | | BBB-/Baa3 | | | 3,450,000 | | | 3,651,308 |
E-470 Public Highway Authority Capital Appreciation, 0% due 9/1/2014 (Insured: Natl-Re) | | A/Baa1 | | | 1,910,000 | | | 1,569,390 |
Park Creek Metropolitan District, 5.00% due 12/1/2015 (Insured: AGM) | | AAA/NR | | | 1,000,000 | | | 1,121,520 |
Park Creek Metropolitan District, 5.00% due 12/1/2016 (Insured: AGM) | | AAA/NR | | | 1,035,000 | | | 1,148,757 |
Park Creek Metropolitan District, 5.00% due 12/1/2017 (Insured: AGM) | | AAA/NR | | | 1,525,000 | | | 1,686,986 |
Park Creek Metropolitan District, 5.50% due 12/1/2018 (Insured: AGM) | | AAA/NR | | | 1,200,000 | | | 1,366,188 |
Park Creek Metropolitan District, 5.50% due 12/1/2019 (Insured: AGM) | | AAA/NR | | | 1,000,000 | | | 1,139,270 |
Plaza Metropolitan District, 7.125% due 12/1/2010 (Public Improvement Fee/Tax Increment) | | NR/NR | | | 2,270,000 | | | 2,272,679 |
Plaza Metropolitan District, 7.60% due 12/1/2016 (Public Improvement Fee/Tax Increment) | | NR/NR | | | 6,000,000 | | | 5,916,240 |
Southlands Metropolitan District GO, 6.75% due 12/1/2016 pre-refunded 12/1/2014 | | AAA/NR | | | 930,000 | | | 1,083,617 |
CONNECTICUT — 0.07% | | | | | | | | |
Connecticut Development Authority PCR, 5.75% due 6/1/2026 put 2/1/2012 | | NR/Baa2 | | | 1,000,000 | | | 1,049,000 |
Connecticut Health & Educational Facilities, 3.50% due 11/15/2029 put 2/1/2012 (Ascension Health) | | AA/Aa1 | | | 965,000 | | | 989,665 |
DELAWARE — 0.15% | | | | | | | | |
Delaware EDA, 5.50% due 7/1/2025 put 7/1/2010 (Delmarva Power & Light) | | BBB/Baa2 | | | 2,045,000 | | | 2,065,941 |
Delaware EDA, 6.375% due 5/1/2027 (Peninsula United Methodist Homes) | | NR/NR | | | 1,000,000 | | | 1,114,800 |
Delaware HFA, 5.25% due 6/1/2011 (Beebe Medical Center) | | BBB+/Baa1 | | | 1,275,000 | | | 1,317,802 |
Certified Semi-Annual Report 13
| | |
| SCHEDULE OF INVESTMENTS, CONTINUED | | |
| |
| Thornburg Limited Term Municipal Fund | | March 31, 2010 (Unaudited) |
| | | | | | | | |
Issuer-Description | | Credit Rating†
S&P/ Moody’s | | Principal
Amount | | Value |
DISTRICT OF COLUMBIA — 1.47% | | | | | | | | |
District of Columbia Convention Center Authority, 5.00% due 10/1/2013 (Washington Convention Center; Insured: AMBAC) | | A/A2 | | $ | 3,000,000 | | $ | 3,255,300 |
District of Columbia COP, 5.25% due 1/1/2013 (Insured: AMBAC) | | A/NR | | | 5,950,000 | | | 6,275,167 |
District of Columbia COP, 5.25% due 1/1/2015 (Insured: FGIC) | | A/A2 | | | 2,875,000 | | | 3,157,929 |
District of Columbia COP, 5.25% due 1/1/2016 (Insured: FGIC) | | A/A2 | | | 4,625,000 | | | 5,053,044 |
District of Columbia COP, 5.00% due 1/1/2019 (Insured: Natl-Re) | | A/A2 | | | 5,000,000 | | | 5,259,500 |
District of Columbia GO, 6.00% due 6/1/2018 (Insured: Natl-Re) | | A+/A1 | | | 5,000,000 | | | 5,851,550 |
b District of Columbia Revenue, 3.00% due 4/1/2014 (National Public Radio) | | NR/Aa3 | | | 1,020,000 | | | 1,057,832 |
b District of Columbia Revenue, 4.00% due 4/1/2015 (National Public Radio) | | NR/Aa3 | | | 1,000,000 | | | 1,076,720 |
b District of Columbia Revenue, 5.00% due 4/1/2016 (National Public Radio) | | NR/Aa3 | | | 500,000 | | | 558,990 |
b District of Columbia Revenue, 4.00% due 4/1/2017 (National Public Radio) | | NR/Aa3 | | | 1,630,000 | | | 1,716,749 |
b District of Columbia Revenue, 5.00% due 4/1/2018 (National Public Radio) | | NR/Aa3 | | | 1,195,000 | | | 1,322,913 |
b District of Columbia Revenue, 5.00% due 4/1/2019 (National Public Radio) | | NR/Aa3 | | | 805,000 | | | 892,294 |
b District of Columbia Revenue, 5.00% due 4/1/2020 (National Public Radio) | | NR/Aa3 | | | 1,250,000 | | | 1,377,112 |
District of Columbia Tax Increment, 0% due 7/1/2011 (Mandarin Oriental; Insured: AGM) | | AAA/Aa3 | | | 1,990,000 | | | 1,949,782 |
District of Columbia Tax Increment, 0% due 7/1/2012 (Mandarin Oriental; Insured: AGM) | | AAA/Aa3 | | | 1,580,000 | | | 1,508,458 |
Metropolitan Washington Airports Authority, 0% due 10/1/2014 (Dulles Toll Road; Insured: AGM) | | AAA/Aa3 | | | 2,000,000 | | | 1,709,000 |
Metropolitan Washington Airports Authority, 0% due 10/1/2016 (Dulles Toll Road; Insured: AGM) | | AAA/Aa3 | | | 4,000,000 | | | 3,027,240 |
FLORIDA — 9.09% | | | | | | | | |
Broward County Airport Systems, 5.00% due 10/1/2014 (Insured: AMBAC) | | A+/A1 | | | 4,000,000 | | | 4,412,360 |
Broward County Educational Facilities Authority, 6.25% due 4/1/2013 (Nova Southeastern; Insured: Radian) | | BBB/Baa2 | | | 1,705,000 | | | 1,743,857 |
Broward County Port Facilities, 5.00% due 9/1/2013 | | A-/A2 | | | 2,000,000 | | | 2,167,500 |
Broward County Port Facilities, 5.00% due 9/1/2017 | | A-/A2 | | | 2,820,000 | | | 3,001,213 |
Broward County Port Facilities, 5.50% due 9/1/2018 | | A-/A2 | | | 3,500,000 | | | 3,821,475 |
Broward County Port Facilities, 5.50% due 9/1/2019 | | A-/A2 | | | 2,800,000 | | | 3,044,944 |
Broward County School Board COP, 5.00% due 7/1/2010 (Insured: AMBAC) | | NR/A1 | | | 2,000,000 | | | 2,006,780 |
Broward County School Board COP, 5.25% due 7/1/2016 (Insured: AGM) | | AAA/Aa3 | | | 7,630,000 | | | 8,461,441 |
Broward County School Board COP, 5.00% due 7/1/2017 (Insured: FGIC) | | A+/A1 | | | 1,000,000 | | | 1,082,940 |
Capital Projects Finance Authority, 5.50% due 10/1/2012 (Insured: Natl-Re) | | A/Baa1 | | | 1,820,000 | | | 1,897,041 |
Capital Projects Finance Authority, 5.50% due 10/1/2015 (Insured: Natl-Re) | | A/Baa1 | | | 3,260,000 | | | 3,350,498 |
Capital Trust Agency Multi Family Housing, 5.15% due 11/1/2030 put 11/1/2010 (Shadow Run; Collateralized: FNMA) | | NR/Aaa | | | 3,190,000 | | | 3,255,523 |
Crossings at Fleming Island Community Development, 5.45% due 5/1/2010 (Insured: Natl-Re) | | A/Baa1 | | | 825,000 | | | 826,559 |
Escambia County HFA, 5.25% due 11/15/2014 (Ascension Health Credit) | | AA/Aa1 | | | 1,000,000 | | | 1,128,160 |
Escambia County HFA, 5.00% due 11/1/2028 pre-refunded 11/1/2010 (Charity Obligated Group) | | NR/Aaa | | | 2,540,000 | | | 2,562,657 |
a FAU Financing Corp. Capital Improvements Revenue, 5.00% due 7/1/2014 (Innovation Village) | | NR/A2 | | | 1,950,000 | | | 2,124,778 |
FAU Financing Corp. Capital Improvements Revenue, 5.00% due 7/1/2015 (Innovation Village) | | NR/A2 | | | 2,395,000 | | | 2,611,508 |
FAU Financing Corp. Capital Improvements Revenue, 5.00% due 7/1/2016 (Innovation Village) | | NR/A2 | | | 2,275,000 | | | 2,447,104 |
Flagler County School Board COP, 5.00% due 8/1/2014 (Insured: AGM) | | AAA/Aa3 | | | 1,605,000 | | | 1,758,871 |
Flagler County School Board COP, 5.00% due 8/1/2015 (Insured: AGM) | | AAA/Aa3 | | | 1,500,000 | | | 1,645,380 |
Florida Department of Management Services, 5.25% due 9/1/2016 (Insured: AGM) | | AAA/Aa2 | | | 3,500,000 | | | 3,954,930 |
Florida Hurricane Catastrophe, 5.00% due 7/1/2014 | | AA-/Aa3 | | | 11,000,000 | | | 12,073,930 |
Florida State Correctional Privatization Commission COP, 5.00% due 8/1/2015 (Insured: AMBAC) | | AA+/Aa2 | | | 2,000,000 | | | 2,181,040 |
Florida State Department of Children & Families COP, 5.00% due 10/1/2012 | | AA+/NR | | | 770,000 | | | 828,012 |
Florida State Department of Children & Families COP, 5.00% due 10/1/2014 | | AA+/NR | | | 905,000 | | | 996,676 |
Florida State Department of Children & Families COP, 5.00% due 10/1/2015 | | AA+/NR | | | 925,000 | | | 1,022,106 |
Florida State Department of Transportation GO, 5.375% due 7/1/2017 | | AAA/Aa1 | | | 4,675,000 | | | 5,119,405 |
Florida State Department of Transportation GO, 5.00% due 7/1/2018 | | AAA/Aa1 | | | 3,000,000 | | | 3,376,860 |
14 Certified Semi-Annual Report
| | |
| SCHEDULE OF INVESTMENTS, CONTINUED | | |
| |
| Thornburg Limited Term Municipal Fund | | March 31, 2010 (Unaudited) |
| | | | | | | | |
Issuer-Description | | Credit Rating†
S&P/ Moody’s | | Principal
Amount | | Value |
Florida State Division of Bond Finance, 5.375% due 7/1/2011 (Preservation 2000; Insured: Natl-Re/FGIC) | | AA-/A1 | | $ | 2,515,000 | | $ | 2,539,119 |
Gainesville Utilities Systems Revenue, 0.42% due 10/1/2026 put 4/1/2010 (SPA: Suntrust Bank) (daily demand notes) | | AA/Aa2 | | | 28,205,000 | | | 28,205,000 |
Highlands County HFA, 5.00% due 11/15/2015 (Adventist Health) | | AA-/A1 | | | 1,000,000 | | | 1,103,710 |
Highlands County HFA, 5.00% due 11/15/2016 (Adventist/Sunbelt) | | AA-/A1 | | | 1,000,000 | | | 1,089,360 |
Highlands County HFA, 5.00% due 11/15/2017 (Adventist/Sunbelt) | | AA-/A1 | | | 3,200,000 | | | 3,449,728 |
Highlands County HFA, 5.00% due 11/15/2017 (Adventist Health) | | AA-/A1 | | | 1,000,000 | | | 1,059,670 |
Highlands County HFA, 5.00% due 11/15/2019 (Adventist/Sunbelt) | | AA-/A1 | | | 3,000,000 | | | 3,140,070 |
Highlands County HFA, 3.95% due 11/15/2032 (Adventist/Sunbelt) | | AA-/A1 | | | 2,500,000 | | | 2,607,975 |
Hillsborough County Assessment, 5.00% due 3/1/2015 (Insured: FGIC) | | A+/A3 | | | 5,000,000 | | | 5,353,650 |
Hillsborough County IDA PCR, 5.10% due 10/1/2013 (Tampa Electric Co.) | | BBB/Baa1 | | | 6,410,000 | | | 6,813,061 |
Hillsborough County IDA PCR, 5.00% due 12/1/2034 put 3/15/2012 (Tampa Electric Co.; Insured: AMBAC) | | BBB/Baa1 | | | 3,250,000 | | | 3,407,007 |
Hollywood Community Redevelopment Agency, 5.00% due 3/1/2016 (Insured: Syncora) | | NR/Baa1 | | | 2,000,000 | | | 2,023,280 |
Hollywood Community Redevelopment Agency, 5.00% due 3/1/2017 (Insured: Syncora) | | NR/Baa1 | | | 2,000,000 | | | 1,998,180 |
JEA, 5.25% due 10/1/2012 (St. John’s River Park Systems) | | AA-/Aa2 | | | 5,000,000 | | | 5,303,250 |
JEA, 5.00% due 10/1/2014 (Electric Systems) | | A+/Aa3 | | | 7,165,000 | | | 7,880,067 |
JEA Water & Sewer Systems Revenue, 3.50% due 10/1/2013 | | NR/Aa3 | | | 5,565,000 | | | 5,906,914 |
JEA Water & Sewer Systems Revenue, 5.00% due 10/1/2018 | | AA-/Aa3 | | | 1,500,000 | | | 1,658,970 |
Marion County Hospital District, 5.00% due 10/1/2015 (Munroe Regional Health Systems) | | NR/A3 | | | 1,000,000 | | | 1,061,350 |
Miami Dade County Educational Facilities Authority, 5.00% due 4/1/2016 (University of Miami; Insured: AMBAC; GO of University) | | A-/A2 | | | 3,000,000 | | | 3,242,160 |
Miami Dade County GO, 5.25% due 7/1/2018 (Building Better Communities) | | AA-/Aa3 | | | 4,540,000 | | | 5,123,889 |
Miami Dade County Professional Sports Franchise Facilities Tax, 0% due 10/1/2015 (Insured: AGM) | | AAA/Aa3 | | | 3,845,000 | | | 3,117,526 |
Miami Dade County Professional Sports Franchise Facilities Tax, 0% due 10/1/2016 (Insured: AGM) | | AAA/Aa3 | | | 3,535,000 | | | 2,683,878 |
a Miami Dade County Professional Sports Franchise Facilities Tax, 0% due 10/1/2017 (Insured: AGM) | | AAA/Aa3 | | | 2,435,000 | | | 1,729,751 |
Miami Dade County Professional Sports Franchise Facilities Tax, 0% due 10/1/2018 (Insured: AGM) | | AAA/Aa3 | | | 5,385,000 | | | 3,562,554 |
Miami Dade County Professional Sports Franchise Facilities Tax, 0% due 10/1/2019 (Insured: AGM) | | AAA/Aa3 | | | 2,170,000 | | | 1,342,753 |
Miami Dade County School Board COP, 5.00% due 5/1/2014 (Insured: Natl-Re) | | A/A3 | | | 1,000,000 | | | 1,071,690 |
Miami Dade County School Board COP, 5.00% due 10/1/2015 (Insured: AMBAC) | | A/A3 | | | 1,000,000 | | | 1,076,270 |
Miami Dade County School Board COP, 5.00% due 5/1/2016 (Insured: Natl-Re) | | A/A3 | | | 4,015,000 | | | 4,259,594 |
Miami Dade County School Board COP, 5.00% due 10/1/2016 (Insured: AMBAC) | | A/A3 | | | 1,000,000 | | | 1,061,150 |
Miami Dade County School Board COP, 5.50% due 5/1/2030 put 5/1/2011 (Insured: Natl-Re) | | A/A3 | | | 1,010,000 | | | 1,049,228 |
Miami Dade County School District GO, 5.375% due 8/1/2015 (Insured: AGM) | | AAA/Aa3 | | | 5,000,000 | | | 5,669,850 |
Miami Dade County Special Housing, 5.80% due 10/1/2012 (HUD Section 8) | | NR/Baa3 | | | 1,735,000 | | | 1,807,870 |
Miami GO, 5.00% due 1/1/2017 (Homeland Defense/Neighborhood Capital Improvements) | | A/A3 | | | 1,245,000 | | | 1,338,512 |
Miami GO, 5.00% due 1/1/2018 (Homeland Defense/Neighborhood Capital Improvements) | | A/A3 | | | 2,040,000 | | | 2,183,086 |
Miami GO, 5.00% due 1/1/2019 (Homeland Defense/Neighborhood Capital Improvements) | | A/A3 | | | 1,870,000 | | | 1,988,334 |
Miami Special Obligation, 5.00% due 1/1/2018 (Insured: Natl-Re) | | A/A3 | | | 1,970,000 | | | 2,156,362 |
Orange County HFA, 5.00% due 10/1/2014 (Orlando Health) | | A/A2 | | | 2,790,000 | | | 3,020,203 |
Orange County HFA, 5.00% due 10/1/2017 (Orlando Health) | | A/A2 | | | 1,980,000 | | | 2,077,119 |
Orange County HFA, 5.25% due 10/1/2019 (Orlando Health) | | A/A2 | | | 3,000,000 | | | 3,097,860 |
Orlando & Orange County Expressway Authority, 6.50% due 7/1/2011 (Insured: Natl-Re/FGIC) | | A/A1 | | | 3,550,000 | | | 3,783,625 |
Orlando & Orange County Expressway Authority, 5.00% due 7/1/2013 (Insured: AMBAC) | | A/A1 | | | 5,695,000 | | | 6,251,515 |
Palm Beach County Public Improvement, 5.00% due 11/1/2030 put 11/1/2011 (Convention Center; Insured: FGIC) | | AA+/Aa1 | | | 3,000,000 | | | 3,158,310 |
Palm Beach County School Board COP, 5.375% due 8/1/2017 (Insured: AMBAC) | | AA-/A1 | | | 7,000,000 | | | 7,387,380 |
Palm Beach County School Board COP, 5.00% due 8/1/2025 (Insured: FGIC) | | AA-/A1 | | | 1,500,000 | | | 1,556,550 |
Pelican Marsh Community Development District, 5.00% due 5/1/2011 (Insured: Radian) | | AA/NR | | | 570,000 | | | 565,839 |
Polk County Transportation Improvement Revenue, 5.00% due 12/1/2025 (Insured: AGM) | | NR/Aa3 | | | 1,550,000 | | | 1,586,611 |
Port Everglades Authority, 5.00% due 9/1/2016 (Insured: AGM) | | AAA/Aa3 | | | 9,990,000 | | | 10,074,316 |
Putnam County Development Authority PCR, 5.35% due 3/15/2042 put 5/1/2018 (Seminole Project; Insured: AMBAC) | | A-/Baa1 | | | 10,000,000 | | | 10,609,900 |
Certified Semi-Annual Report 15
| | |
| SCHEDULE OF INVESTMENTS, CONTINUED | | |
| |
| Thornburg Limited Term Municipal Fund | | March 31, 2010 (Unaudited) |
| | | | | | | | |
Issuer-Description | | Credit Rating†
S&P/ Moody’s | | Principal
Amount | | Value |
South Miami HFA, 5.00% due 8/15/2016 (Baptist Health) | | AA-/Aa3 | | $ | 1,560,000 | | $ | 1,697,202 |
South Miami HFA, 5.00% due 8/15/2017 (Baptist Health) | | AA-/Aa3 | | | 4,610,000 | | | 4,984,148 |
St. John’s County IDA, 5.50% due 8/1/2014 (Presbyterian Retirement) | | NR/NR | | | 2,755,000 | | | 2,892,034 |
Tampa Sports Authority Revenue, 5.75% due 10/1/2015 (Tampa Bay Arena; Insured: Natl-Re) | | A/Baa1 | | | 1,500,000 | | | 1,584,210 |
University of Central Florida Athletics Association Inc. COP, 5.00% due 10/1/2016 (Insured: FGIC) | | A/NR | | | 1,640,000 | | | 1,719,015 |
GEORGIA — 2.62% | | | | | | | | |
Atlanta Tax Allocation, 5.25% due 12/1/2016 (Atlantic Station; Insured: AGM) | | AAA/Aa3 | | | 3,850,000 | | | 4,233,422 |
Atlanta Water & Wastewater Revenue, 5.50% due 11/1/2014 (Insured: Natl-Re/FGIC) | | A/Baa1 | | | 3,000,000 | | | 3,244,410 |
Atlanta Water & Wastewater Revenue, 5.00% due 11/1/2016 (Insured: AGM) | | AAA/Aa3 | | | 3,215,000 | | | 3,538,943 |
Atlanta Water & Wastewater Revenue, 5.50% due 11/1/2016 (Insured: Natl-Re/FGIC) | | A/Baa1 | | | 8,215,000 | | | 8,825,867 |
Atlanta Water & Wastewater Revenue, 5.00% due 11/1/2017 (Insured: AGM) | | AAA/Aa3 | | | 4,745,000 | | | 5,161,943 |
Atlanta Water & Wastewater Revenue, 6.00% due 11/1/2019 | | A/Baa1 | | | 5,650,000 | | | 6,252,629 |
Burke County PCR, 4.75% due 1/1/2039 put 4/1/2011 (Oglethorpe Power; Insured: Natl-Re) | | A/A3 | | | 10,000,000 | | | 10,371,700 |
a Fulton County Facilities COP, 5.90% due 11/1/2019 pre-refunded 11/1/2010 (Insured: AGM/ AMBAC) | | AAA/Aa3 | | | 16,865,000 | | | 17,571,138 |
Gainesville Water & Sewer Revenue, 6.00% due 11/15/2012 (Insured: Natl-Re/FGIC) | | AA-/A2 | | | 1,200,000 | | | 1,286,352 |
Lagrange Troup County Hospital Authority, 5.00% due 7/1/2018 | | A+/A1 | | | 2,500,000 | | | 2,699,325 |
Main Street Natural Gas Inc., 5.00% due 3/15/2013 (Georgia Gas) | | A/A2 | | | 1,500,000 | | | 1,580,130 |
Main Street Natural Gas Inc., 5.00% due 3/15/2014 (Georgia Gas) | | A+/Aa3 | | | 3,000,000 | | | 3,224,280 |
Main Street Natural Gas Inc., 5.00% due 3/15/2014 (Georgia Gas) | | A/A2 | | | 3,590,000 | | | 3,803,318 |
Main Street Natural Gas Inc., 5.00% due 3/15/2015 (Georgia Gas) | | A/A2 | | | 2,000,000 | | | 2,120,980 |
a Monroe County Development Authority PCR, 6.80% due 1/1/2012 (Oglethorpe Power; Insured: Natl-Re) | | A/A3 | | | 1,000,000 | | | 1,088,590 |
Monroe County Development Authority PCR, 4.50% due 7/1/2025 put 4/1/2011 (Georgia Power Co.) | | A/A2 | | | 5,000,000 | | | 5,166,850 |
GUAM — 0.43% | | | | | | | | |
Guam Educational Financing Foundation COP, 5.00% due 10/1/2010 (Guam Public Schools) | | A-/NR | | | 1,000,000 | | | 1,007,540 |
Guam Government Limited Obligation Revenue, 5.25% due 12/1/2016 | | BBB-/NR | | | 5,610,000 | | | 5,869,070 |
Guam Government Limited Obligation Revenue, 5.25% due 12/1/2017 | | BBB-/NR | | | 2,000,000 | | | 2,082,400 |
Guam Government Limited Obligation Revenue, 5.50% due 12/1/2018 | | BBB-/NR | | | 3,000,000 | | | 3,170,790 |
Guam Government Limited Obligation Revenue, 5.50% due 12/1/2019 | | BBB-/NR | | | 1,000,000 | | | 1,045,220 |
HAWAII — 0.24% | | | | | | | | |
Hawaii Department of Budget & Finance, 6.40% due 7/1/2013 (Kapiolani Health Care; Insured: Natl-Re) | | A/Baa1 | | | 1,150,000 | | | 1,191,768 |
Hawaii Department of Budget & Finance, 4.95% due 4/1/2012 (Hawaiian Electric Company; Insured: Natl-Re) | | A/Baa1 | | | 5,850,000 | | | 6,140,219 |
IDAHO — 0.30% | | | | | | | | |
Twin Falls Urban Renewal Agency, 4.95% due 8/1/2014 | | NR/NR | | | 1,640,000 | | | 1,595,802 |
Twin Falls Urban Renewal Agency, 5.15% due 8/1/2017 | | NR/NR | | | 1,455,000 | | | 1,348,610 |
b University of Idaho, 1.00% due 4/1/2041 | | A+/A1 | | | 6,250,000 | | | 6,349,875 |
ILLINOIS — 7.45% | | | | | | | | |
Bolingbrook GO, 0% due 1/1/2016 (Insured: Natl-Re) | | NR/A2 | | | 1,500,000 | | | 1,212,045 |
Bolingbrook GO, 0% due 1/1/2017 (Insured: Natl-Re) | | NR/A2 | | | 2,000,000 | | | 1,512,380 |
Broadview Tax Increment Revenue, 5.375% due 7/1/2015 | | NR/NR | | | 3,400,000 | | | 3,315,578 |
Chicago Board of Education GO, 5.25% due 12/1/2017 (Chicago School Reform Board; Insured: Natl-Re/FGIC) | | AA-/A1 | | | 4,100,000 | | | 4,631,237 |
Chicago Board of Education GO, 5.00% due 12/1/2018 (Insured: Natl-Re) | | AA-/A1 | | | 1,000,000 | | | 1,103,310 |
16 Certified Semi-Annual Report
| | |
| SCHEDULE OF INVESTMENTS, CONTINUED | | |
| |
| Thornburg Limited Term Municipal Fund | | March 31, 2010 (Unaudited) |
| | | | | | | | |
Issuer-Description | | Credit Rating†
S&P/ Moody’s | | Principal
Amount | | Value |
Chicago Gas Supply, 4.75% due 3/1/2030 put 6/30/2014 (Peoples Gas Light & Coke) | | A-/A2 | | $ | 1,500,000 | | $ | 1,525,290 |
Chicago GO, 6.125% due 1/1/2012 (Insured: AMBAC) | | NR/Aa3 | | | 775,000 | | | 845,564 |
Chicago GO, 6.125% due 1/1/2012 (Insured: AMBAC) | | NR/Aa3 | | | 225,000 | | | 243,882 |
Chicago GO, 5.375% due 1/1/2013 (Insured: Natl-Re) | | AA-/Aa3 | | | 2,435,000 | | | 2,593,689 |
Chicago GO, 0% due 1/1/2016 (City Colleges; Insured: FGIC) | | AA-/Aa3 | | | 2,670,000 | | | 2,183,393 |
Chicago GO, 5.40% due 1/1/2018 (Insured: AGM) | | AAA/Aa3 | | | 3,000,000 | | | 3,009,930 |
Chicago GO, 0.32% due 1/1/2040 put 4/8/2010 (Insured: AGM/SPA-Dexia ) (weekly demand notes) | | AAA/Aa3 | | | 27,900,000 | | | 27,900,000 |
Chicago Housing Authority Capital Program, 5.25% due 7/1/2010 (ETM) | | NR/Aaa | | | 2,300,000 | | | 2,328,589 |
Chicago Housing Authority Capital Program, 5.00% due 7/1/2015 (Insured: AGM) | | AAA/Aa3 | | | 8,460,000 | | | 9,393,476 |
Chicago Housing Authority Capital Program, 5.00% due 7/1/2016 (Insured: AGM) | | AAA/Aa3 | | | 2,000,000 | | | 2,204,160 |
Chicago Metropolitan Water Reclamation District, 7.00% due 1/1/2011 (ETM) | | NR/Aaa | | | 380,000 | | | 396,750 |
Chicago Midway Airport, 5.50% due 1/1/2013 (Insured: Natl-Re) | | A/A2 | | | 1,180,000 | | | 1,283,639 |
Cicero Illinois GO, 5.25% due 1/1/2019 (Insured: XLCA) | | NR/NR | | | 6,140,000 | | | 6,000,683 |
Cook County Community Consolidated School District GO, 0% due 12/1/2010 (Insured: AGM) | | NR/Aa3 | | | 2,000,000 | | | 1,993,760 |
Cook County Community Consolidated School District GO, 9.00% due 12/1/2016 (Tinley Park; Insured: FGIC) | | NR/A1 | | | 2,500,000 | | | 3,347,875 |
Cook County Community High School District, 5.00% due 12/15/2012 (Insured: Assured Guaranty) | | AAA/NR | | | 3,180,000 | | | 3,493,357 |
Cook County Community High School District, 5.00% due 12/15/2013 (Insured: Assured Guaranty) | | AAA/NR | | | 6,875,000 | | | 7,693,331 |
Cook County Community School District GO, 9.00% due 12/1/2013 (Oak Park; Insured: FGIC) | | NR/Aa3 | | | 2,250,000 | | | 2,810,768 |
Cook County GO, 3.25% due 11/15/2011 | | AA/Aa3 | | | 1,250,000 | | | 1,296,263 |
Cook County GO, 5.00% due 11/15/2012 | | AA/Aa3 | | | 6,000,000 | | | 6,557,880 |
Cook County GO, 6.25% due 11/15/2013 (Insured: Natl-Re) | | AA/Aa3 | | | 3,995,000 | | | 4,494,495 |
Illinois DFA, 6.00% due 11/15/2010 (Adventist Health; Insured: Natl-Re) | | AA/Baa1 | | | 3,860,000 | | | 3,956,461 |
Illinois DFA, 6.00% due 11/15/2011 (Adventist Health; Insured: Natl-Re) | | AA/Baa1 | | | 1,000,000 | | | 1,032,170 |
Illinois Educational Facilities, 4.75% due 3/1/2030 put 3/1/2017 (Art Institute of Chicago) | | A+/A1 | | | 2,625,000 | | | 2,786,989 |
Illinois Educational Facilities, 5.00% due 3/1/2030 put 3/1/2017 (Art Institute of Chicago) | | NR/NR | | | 3,000,000 | | | 3,161,250 |
Illinois Educational Facilities, 5.25% due 3/1/2034 put 3/1/2018 (Art Institute of Chicago) | | NR/NR | | | 3,500,000 | | | 3,723,895 |
a Illinois Educational Facilities, 4.15% due 11/1/2036 put 11/1/2012 (Field Museum) | | A/A2 | | | 5,250,000 | | | 5,460,788 |
Illinois Educational Facilities, 4.30% due 11/1/2036 put 11/1/2013 (Field Museum) | | A/A2 | | | 3,000,000 | | | 3,155,820 |
Illinois Finance Authority, 5.00% due 11/1/2014 (Cent Dupage Health) | | AA/NR | | | 5,000,000 | | | 5,501,600 |
Illinois Finance Authority, 4.00% due 4/1/2015 (Advocate Health) | | AA/Aa2 | | | 2,800,000 | | | 2,930,424 |
Illinois Finance Authority, 5.00% due 11/1/2015 (Cent Dupage Health) | | AA/NR | | | 5,000,000 | | | 5,469,000 |
Illinois Finance Authority, 5.00% due 4/1/2016 (Advocate Health) | | AA/Aa2 | | | 1,250,000 | | | 1,352,788 |
Illinois Finance Authority, 5.00% due 11/1/2017 (Rush University Medical Center; Insured: Natl-Re) | | A/A3 | | | 1,000,000 | | | 1,048,020 |
Illinois Finance Authority, 5.50% due 11/1/2018 (Advocate Health) | | AA/Aa2 | | | 1,000,000 | | | 1,099,640 |
Illinois Finance Authority, 5.00% due 4/1/2020 (Advocate Health) | | AA/Aa2 | | | 1,000,000 | | | 1,044,200 |
Illinois Finance Authority, 3.875% due 11/1/2030 put 5/1/2012 (Advocate Health) | | AA/Aa2 | | | 2,000,000 | | | 2,046,860 |
Illinois Finance Authority Student Housing, 5.00% due 5/1/2014 | | NR/Baa3 | | | 3,895,000 | | | 3,874,980 |
Illinois HFA, 5.50% due 11/15/2011 (Methodist Medical Center; Insured: Natl-Re) | | A/A2 | | | 3,000,000 | | | 3,007,890 |
Illinois HFA, 5.00% due 11/15/2013 (Northwestern Medical Facility; Insured: Natl-Re) | | NR/A2 | | | 2,470,000 | | | 2,476,101 |
Illinois HFA, 6.00% due 7/1/2017 (Lake Forest Hospital) | | AA+/Aa2 | | | 1,500,000 | | | 1,568,775 |
Illinois HFA, 6.125% due 11/15/2022 (Advocate Network Health Care) | | AAA/Aa2 | | | 1,000,000 | | | 1,035,600 |
Illinois HFA, 0.31% due 7/1/2032 put 4/1/2010 (Northwest Community Hospital) (daily demand notes) | | AA-/Aa3 | | | 6,000,000 | | | 6,000,000 |
Illinois Sales Tax, 5.00% due 6/15/2011 | | AAA/A2 | | | 6,050,000 | | | 6,320,737 |
Illinois Sales Tax, 3.50% due 6/15/2012 | | AAA/A2 | | | 6,055,000 | | | 6,302,286 |
Illinois Sales Tax, 3.50% due 6/15/2013 | | AAA/A2 | | | 6,455,000 | | | 6,771,101 |
Illinois Sales Tax, 3.50% due 6/15/2014 | | AAA/A2 | | | 6,455,000 | | | 6,747,024 |
Illinois Sales Tax, 5.50% due 6/15/2016 | | AAA/A2 | | | 3,000,000 | | | 3,147,930 |
Illinois Sales Tax, 5.50% due 6/15/2016 | | AAA/A2 | | | 4,000,000 | | | 4,197,240 |
Kane County Forest Preservation District GO, 5.00% due 12/15/2015 (Insured: FGIC) | | AA/NR | | | 2,780,000 | | | 3,171,452 |
Certified Semi-Annual Report 17
| | |
| SCHEDULE OF INVESTMENTS, CONTINUED | | |
| |
| Thornburg Limited Term Municipal Fund | | March 31, 2010 (Unaudited) |
| | | | | | | | |
Issuer-Description | | Credit Rating†
S&P/ Moody’s | | Principal
Amount | | Value |
Kane County Waubonsee Community College District GO, 0% due 12/15/2013 (Insured: FGIC) | | AA-/Aa3 | | $ | 3,000,000 | | $ | 2,591,490 |
Lake County Community High School District GO, 0% due 12/1/2011 (Insured: FGIC) | | NR/NR | | | 3,235,000 | | | 3,109,903 |
McLean & Woodford Counties United School District GO, 6.25% due 12/1/2014 (Insured: AGM) | | NR/Aa3 | | | 1,005,000 | | | 1,090,807 |
McHenry & Kane Counties Community Consolidated School District GO, 0% due 1/1/2012 (Insured: FGIC) | | A/NR | | | 2,200,000 | | | 2,100,934 |
Melrose Park Water Revenue, 5.20% due 7/1/2018 (Insured: Natl-Re) | | A/Baa1 | | | 1,190,000 | | | 1,200,924 |
Metropolitan Pier & Exposition Authority Dedicated State Tax, 0% due 6/15/2013 (McCormick Place; Insured: Natl-Re) | | AAA/A3 | | | 1,045,000 | | | 963,145 |
Metropolitan Pier & Exposition Authority Dedicated State Tax, 0% due 6/15/2016 (McCormick Place; Insured: FGIC) | | A/A3 | | | 11,295,000 | | | 8,915,934 |
Quincy Illinois, 5.00% due 11/15/2014 (Blessing Hospital) | | A-/A3 | | | 1,000,000 | | | 1,049,440 |
Quincy Illinois, 5.00% due 11/15/2016 (Blessing Hospital) | | A-/A3 | | | 1,000,000 | | | 1,021,590 |
Southwestern Illinois Development Authority, 5.125% due 8/15/2016 (Anderson Hospital) | | BBB/
Baa2 | | | 1,935,000 | | | 1,968,843 |
Springfield Electric Revenue, 5.50% due 3/1/2013 (Insured: Natl-Re) | | AA-/NR | | | 2,000,000 | | | 2,112,160 |
INDIANA — 4.29% | | | | | | | | |
Allen County Economic Development, 5.00% due 12/30/2012 (Indiana Institute of Technology) | | NR/NR | | | 1,370,000 | | | 1,380,042 |
Allen County Jail Building Corp. First Mortgage, 5.75% due 10/1/2010 (ETM) | | NR/NR | | | 565,000 | | | 571,571 |
Allen County Jail Building Corp. First Mortgage, 5.00% due 10/1/2014 (Insured: Syncora) | | NR/Aa3 | | | 1,000,000 | | | 1,119,800 |
Allen County Jail Building Corp. First Mortgage, 5.00% due 10/1/2015 (Insured: Syncora) | | NR/Aa3 | | | 1,480,000 | | | 1,661,344 |
Allen County Jail Building Corp. First Mortgage, 5.00% due 10/1/2016 (Insured: Syncora) | | NR/Aa3 | | | 1,520,000 | | | 1,680,254 |
Allen County Redevelopment District, 5.00% due 11/15/2016 | | NR/A3 | | | 1,000,000 | | | 1,083,610 |
Avon Community School Building Corp., 5.00% due 7/15/2017 (Insured: AMBAC; State Aid Withholding) | | A/NR | | | 2,500,000 | | | 2,731,050 |
Ball State University Student Fee, 5.75% due 7/1/2012 (Insured: FGIC) | | A+/A1 | | | 1,000,000 | | | 1,074,830 |
Boonville Junior High School Building Corp., 0% due 7/1/2010 (State Aid Withholding) | | A/NR | | | 850,000 | | | 845,351 |
Boonville Junior High School Building Corp., 0% due 1/1/2011 (State Aid Withholding) | | A/NR | | | 850,000 | | | 834,743 |
a Boonville Junior High School Building Corp., 0% due 7/1/2011 (State Aid Withholding) | | A/NR | | | 950,000 | | | 920,379 |
Brownsburg 1999 School Building Corp., 5.00% due 7/15/2013 (Insured: AGM; State Aid Withholding) | | AAA/Aa3 | | | 1,000,000 | | | 1,102,530 |
Brownsburg 1999 School Building Corp., 5.00% due 8/1/2018 (Insured: AGM; State Aid Withholding) | | AAA/Aa3 | | | 1,250,000 | | | 1,337,488 |
Carmel Redevelopment Authority, 0% due 2/1/2015 (Performing Arts Center) | | AA+/Aa2 | | | 1,575,000 | | | 1,358,233 |
Center Grove Building Corp., 5.00% due 7/15/2010 (Insured: AMBAC) (ETM) | | AA+/NR | | | 575,000 | | | 582,849 |
Central High School Building Corp., 5.00% due 2/1/2011 (First Mortgage; Insured: AMBAC; State Aid Withholding) | | AA+/NR | | | 1,970,000 | | | 2,043,658 |
Clay Multiple School Building Corp., 4.00% due 7/15/2015 | | AA+/NR | | | 1,000,000 | | | 1,059,440 |
Clay Multiple School Building Corp., 5.00% due 7/15/2016 | | AA+/NR | | | 1,295,000 | | | 1,437,515 |
Clay Multiple School Building Corp., 5.00% due 1/15/2017 | | AA+/NR | | | 1,000,000 | | | 1,106,700 |
Evansville Vanderburgh, 5.00% due 7/15/2014 (Insured: AMBAC) | | A+/NR | | | 1,000,000 | | | 1,095,240 |
Evansville Vanderburgh, 5.00% due 7/15/2015 (Insured: AMBAC) | | A+/NR | | | 1,000,000 | | | 1,096,690 |
b Fort Wayne Sewer Works Improvement, 4.25% due 8/1/2013 | | NR/A2 | | | 1,715,000 | | | 1,819,546 |
b Fort Wayne Sewer Works Improvement, 4.25% due 8/1/2014 | | NR/A2 | | | 1,745,000 | | | 1,852,317 |
b Fort Wayne Sewer Works Improvement, 4.25% due 8/1/2015 | | NR/A2 | | | 1,780,000 | | | 1,876,031 |
Indiana Bond Bank, 4.80% due 2/1/2014 | | AAA/NR | | | 4,060,000 | | | 4,070,353 |
a Indiana Bond Bank, 5.25% due 10/15/2016 (Special Gas Program) | | NR/Aa3 | | | 1,545,000 | | | 1,658,156 |
Indiana Bond Bank, 5.00% due 10/15/2017 | | NR/Aa3 | | | 5,000,000 | | | 5,153,100 |
Indiana Finance Authority, 5.00% due 5/1/2015 (Parkview Health Systems) | | A+/A1 | | | 1,500,000 | | | 1,621,830 |
Indiana Finance Authority, 5.00% due 5/1/2016 (Parkview Health Systems) | | A+/A1 | | | 3,090,000 | | | 3,281,673 |
Indiana Finance Authority, 5.00% due 5/1/2017 (Parkview Health Systems) | | A+/A1 | | | 1,000,000 | | | 1,045,420 |
Indiana Health Facilities, 5.00% due 11/1/2014 (Sisters of St. Francis) | | NR/Aa3 | | | 1,000,000 | | | 1,098,960 |
Indiana Health Facilities, 5.50% due 11/15/2016 | | AA/Aa1 | | | 1,385,000 | | | 1,518,916 |
a Indiana Health Facilities, 5.00% due 11/1/2018 (Sisters of St. Francis) | | NR/Aa3 | | | 1,250,000 | | | 1,326,025 |
Indiana Health Facilities, 5.75% due 11/1/2021 pre-refunded 11/1/11 (Sisters of St. Francis) | | NR/Aa3 | | | 3,545,000 | | | 3,852,564 |
18 Certified Semi-Annual Report
| | |
| SCHEDULE OF INVESTMENTS, CONTINUED | | |
| |
| Thornburg Limited Term Municipal Fund | | March 31, 2010 (Unaudited) |
| | | | | | | | |
Issuer-Description | | Credit Rating†
S&P/ Moody’s | | Principal
Amount | | Value |
Indiana Health Facilities, 3.625% due 11/15/2036 put 8/1/2011 (Ascension Health) | | NR/Aa1 | | $ | 3,955,000 | | $ | 4,085,159 |
Indiana Multi School Building Corp. First Mortgage, 5.00% due 7/15/2016 (Insured: Natl-Re) | | AA/Baa1 | | | 5,000,000 | | | 5,572,350 |
Indiana State Finance Authority Revenue, 5.00% due 7/1/2011 (Wabash Correctional Facilities) | | AA+/Aa2 | | | 1,390,000 | | | 1,458,360 |
Indiana State Finance Authority Revenue, 4.90% due 1/1/2016 (Indianapolis Power & Light Co.) | | BBB/A3 | | | 11,650,000 | | | 12,183,104 |
Indiana State Finance Authority Revenue, 5.00% due 7/1/2016 (Forensic & Health Science; Insured: Natl-Re) | | AA+/Aa2 | | | 1,030,000 | | | 1,140,066 |
Indiana State Finance Authority Revenue, 5.25% due 7/1/2018 (Wabash Correctional Facilities) | | AA+/Aa2 | | | 1,000,000 | | | 1,116,430 |
Indiana State Finance Authority Revenue, 5.25% due 7/1/2018 (Rockville Correctional Facilities) | | AA+/Aa2 | | | 2,150,000 | | | 2,400,324 |
Indiana State Finance Authority Revenue, 5.00% due 11/1/2018 | | AA+/Aa3 | | | 2,750,000 | | | 3,023,075 |
Indianapolis Local Public Improvement Bond Bank, 6.75% due 2/1/2014 | | AA/NR | | | 1,270,000 | | | 1,394,752 |
Indianapolis Local Public Improvement Bond Bank, 5.00% due 1/1/2015 (Waterworks; Insured: Natl-Re) | | AA-/A3 | | | 1,000,000 | | | 1,107,490 |
Indianapolis Local Public Improvement Bond Bank, 5.00% due 7/1/2015 (Waterworks; Insured: Natl-Re) | | AA-/A3 | | | 1,000,000 | | | 1,112,410 |
Indianapolis Local Public Improvement Bond Bank, 5.00% due 7/1/2016 (Insured: FGIC) | | AA+/Aa2 | | | 1,030,000 | | | 1,142,528 |
Indianapolis Multi-School Building Corp., 5.50% due 7/15/2015 (First Mortgage; Insured: Natl-Re) | | AA/Baa1 | | | 1,690,000 | | | 1,932,346 |
Ivy Tech Community College, 4.00% due 7/1/2013 | | AA-/NR | | | 1,000,000 | | | 1,073,420 |
Ivy Tech Community College, 4.00% due 7/1/2014 | | AA-/NR | | | 1,500,000 | | | 1,618,185 |
Knox Middle School Building Corp. First Mortgage, 0% due 1/15/2020 (Insured: FGIC; State Aid Withholding) | | A/NR | | | 1,295,000 | | | 770,732 |
Madison Schools Lydia Middleton Building Corp., 5.00% due 7/15/2014 (Insured: Natl-Re/ FGIC; State Aid Withholding) | | AA+/NR | | | 1,200,000 | | | 1,358,100 |
Madison Schools Lydia Middleton Building Corp., 5.00% due 7/15/2015 (Insured: Natl-Re/ FGIC; State Aid Withholding) | | AA+/NR | | | 1,250,000 | | | 1,421,062 |
Mount Vernon of Hancock County First Mortgage, 5.00% due 7/15/2013 (Insured: Natl-Re; State Aid Withholding) | | A+/Baa1 | | | 1,055,000 | | | 1,165,131 |
Mount Vernon of Hancock County First Mortgage, 5.00% due 7/15/2014 (Insured: Natl-Re; State Aid Withholding) | | A+/Baa1 | | | 1,135,000 | | | 1,266,524 |
Mount Vernon of Hancock County First Mortgage, 5.00% due 7/15/2015 (Insured: Natl-Re; State Aid Withholding) | | A+/Baa1 | | | 1,140,000 | | | 1,277,450 |
Noblesville Redevelopment Authority, 5.00% due 8/1/2016 (146th Street Extension A) | | AA-/NR | | | 1,660,000 | | | 1,821,518 |
Perry Township Multi School Building Corp., 5.00% due 7/10/2014 (Insured: AGM; State Aid Withholding) | | NR/Aa3 | | | 2,130,000 | | | 2,383,172 |
Peru Community School Corp. First Mortgage, 0% due 7/1/2010 (State Aid Withholding) | | A/NR | | | 835,000 | | | 830,433 |
Plainfield Community High School Building Corp. First Mortgage, 5.00% due 1/15/2015 (Insured: Natl-Re/FGIC) | | A/NR | | | 1,445,000 | | | 1,611,319 |
Rockport PCR, 6.25% due 6/1/2025 put 6/2/2014 (Indiana Michigan Power Co.) | | BBB/Baa2 | | | 4,100,000 | | | 4,542,185 |
Rockport PCR, 6.25% due 6/1/2025 put 6/2/2014 (Indiana Michigan Power Co.) | | BBB/Baa2 | | | 1,000,000 | | | 1,107,850 |
South Bend Community School Building Corp., 5.00% due 7/15/2016 (Insured: Natl-Re/FGIC; State Aid Withholding) | | AA+/NR | | | 1,785,000 | | | 2,013,105 |
Vincennes University, 3.00% due 6/1/2014 | | NR/A1 | | | 1,000,000 | | | 1,026,880 |
Vincennes University, 3.00% due 6/1/2015 | | NR/A1 | | | 1,000,000 | | | 1,013,050 |
Vincennes University, 4.00% due 6/1/2018 | | NR/A1 | | | 1,000,000 | | | 1,020,580 |
Vincennes University, 5.00% due 6/1/2020 | | NR/A1 | | | 1,000,000 | | | 1,079,600 |
Warren Township Vision 2005, 5.00% due 7/10/2015 (Insured: Natl-Re/FGIC; State Aid Withholding) | | AA+/NR | | | 2,895,000 | | | 3,251,056 |
Wawasee Community School Corp. First Mortgage, 5.50% due 7/15/2010 (State Aid Withholding) (ETM) | | AA+/NR | | | 510,000 | | | 517,196 |
Wawasee Community School Corp. First Mortgage, 5.50% due 7/15/2011 (State Aid Withholding) (ETM) | | AA+/NR | | | 1,095,000 | | | 1,148,337 |
West Clark School Building Corp., 5.25% due 1/15/2014 (Insured: Natl-Re) | | AA+/Baa1 | | | 1,335,000 | | | 1,506,160 |
West Clark School Building Corp. First Mortgage, 5.75% due 7/15/2011 (Insured: Natl-Re/ FGIC; State Aid Withholding) | | AA+/NR | | | 2,080,000 | | | 2,214,826 |
Certified Semi-Annual Report 19
| | |
| SCHEDULE OF INVESTMENTS, CONTINUED | | |
| |
| Thornburg Limited Term Municipal Fund | | March 31, 2010 (Unaudited) |
| | | | | | | | |
Issuer-Description | | Credit Rating†
S&P/ Moody’s | | Principal
Amount | | Value |
IOWA — 0.80% | | | | | | | | |
Ankeny Community School District Sales & Services Tax, 5.00% due 7/1/2010 | | AA-/NR | | $ | 2,900,000 | | $ | 2,931,204 |
Des Moines Limited Obligation, 4.40% due 12/1/2015 put 12/1/2011 (Des Moines Parking Associates; LOC: Wells Fargo Bank) | | NR/NR | | | 2,270,000 | | | 2,273,746 |
Dubuque Community School District, 2.75% due 7/1/2011 | | NR/NR | | | 450,000 | | | 454,757 |
Dubuque Community School District, 2.75% due 1/1/2012 | | NR/NR | | | 1,500,000 | | | 1,514,310 |
Dubuque Community School District, 5.00% due 1/1/2013 | | NR/A3 | | | 1,600,000 | | | 1,618,528 |
Dubuque Community School District, 5.00% due 7/1/2013 | | NR/A3 | | | 1,640,000 | | | 1,658,991 |
Iowa Finance Authority, 5.75% due 12/1/2010 (Trinity Health) | | AA/Aa2 | | | 1,160,000 | | | 1,187,631 |
Iowa Health Facilities Revenue, 5.00% due 2/15/2014 (Iowa Health System; Insured: AGM) | | NR/Aa3 | | | 2,500,000 | | | 2,719,100 |
Iowa Health Facilities Revenue, 5.00% due 2/15/2015 (Iowa Health System; Insured: AGM) | | NR/Aa3 | | | 2,300,000 | | | 2,509,162 |
Iowa Health Facilities Revenue, 5.00% due 2/15/2016 (Iowa Health System; Insured: AGM) | | NR/Aa3 | | | 1,600,000 | | | 1,731,456 |
Iowa Health Facilities Revenue, 5.00% due 8/15/2016 (Iowa Health System; Insured: AGM) | | NR/Aa3 | | | 1,500,000 | | | 1,640,715 |
Iowa Health Facilities Revenue, 5.00% due 2/15/2017 (Iowa Health System; Insured: AGM) | | NR/Aa3 | | | 1,600,000 | | | 1,719,904 |
Iowa Health Facilities Revenue, 5.00% due 8/15/2017 (Iowa Health System; Insured: AGM) | | NR/Aa3 | | | 990,000 | | | 1,072,873 |
Iowa Health Facilities Revenue, 5.00% due 2/15/2018 (Iowa Health System; Insured: AGM) | | NR/Aa3 | | | 1,405,000 | | | 1,501,762 |
KANSAS — 0.91% | | | | | | | | |
Burlington Environmental Improvement, 5.00% due 12/1/2023 put 4/1/2011 (Kansas City Power & Light; Insured: Syncora) | | BBB+/A3 | | | 2,800,000 | | | 2,896,488 |
Burlington Environmental Improvement, 5.25% due 12/1/2023 put 4/1/2013 (Kansas City Power & Light; Insured: Syncora) | | BBB+/A3 | | | 5,000,000 | | | 5,387,500 |
Burlington Environmental Improvement, 5.375% due 9/1/2035 put 4/1/2013 (Kansas City Power & Light; Insured: FGIC) | | A/Baa2 | | | 12,400,000 | | | 13,405,516 |
Johnson County USD GO, 4.50% due 10/1/2014 | | AA/Aa1 | | | 5,750,000 | | | 6,043,250 |
KENTUCKY — 0.56% | | | | | | | | |
Jefferson County School District, 5.25% due 1/1/2016 (Insured: AGM) | | AAA/Aa3 | | | 2,145,000 | | | 2,433,202 |
Kentucky Economic DFA, 5.40% due 10/1/2010 (Norton Healthcare; Insured: Natl-Re) (ETM) | | A/NR | | | 3,775,000 | | | 3,864,543 |
Kentucky Economic DFA, 5.40% due 10/1/2010 (Norton Healthcare; Insured Natl-Re) | | A/Baa1 | | | 4,055,000 | | | 4,125,314 |
a Kentucky Economic DFA, 0% due 10/1/2021 (Norton Healthcare; Insured: Natl-Re) | | A/Baa1 | | | 2,100,000 | | | 1,093,575 |
Kentucky Economic DFA, 5.00% due 5/1/2039 (Catholic Health) | | AA/Aa2 | | | 5,000,000 | | | 5,515,150 |
LOUISIANA — 2.91% | | | | | | | | |
East Baton Rouge Sewer, 5.00% due 2/1/2018 (Insured: AGM) | | AAA/Aa3 | | | 3,000,000 | | | 3,277,980 |
Ernest N. Morial New Orleans Exhibit Hall, 5.00% due 7/15/2013 (Insured: AMBAC) | | BBB/NR | | | 2,075,000 | | | 2,161,610 |
Jefferson Sales Tax, 5.00% due 12/1/2018 (Insured: AGM) | | AAA/Aa3 | | | 2,000,000 | | | 2,185,280 |
Louisiana Citizens Property Insurance Corp., 5.00% due 6/1/2015 (Insured: AMBAC) | | A-/Baa2 | | | 10,265,000 | | | 10,547,185 |
Louisiana Environmental Facilities & Community Development Authority, 5.00% due 9/1/2012 (Bellemont Apartments) | | NR/Ba3 | | | 460,000 | | | 449,167 |
Louisiana Environmental Facilities & Community Development Authority, 4.00% due 10/1/2013 (LCTCS Facilities Corp.) | | A+/A3 | | | 1,500,000 | | | 1,598,985 |
Louisiana Environmental Facilities & Community Development Authority, 4.00% due 10/1/2014 (LCTCS Facilities Corp.) | | A+/A3 | | | 1,500,000 | | | 1,597,830 |
Louisiana Environmental Facilities & Community Development Authority, 5.00% due 3/1/2015 (Independence Stadium) | | A/NR | | | 1,000,000 | | | 1,074,620 |
Louisiana Environmental Facilities & Community Development Authority, 5.00% due 3/1/2016 (Independence Stadium) | | A/NR | | | 1,000,000 | | | 1,063,400 |
Louisiana Environmental Facilities & Community Development Authority, 5.00% due 3/1/2017 (Independence Stadium) | | A/NR | | | 1,265,000 | | | 1,334,866 |
Louisiana Environmental Facilities & Community Development Authority, 5.00% due 3/1/2018 (Independence Stadium) | | A/NR | | | 1,000,000 | | | 1,051,100 |
20 Certified Semi-Annual Report
| | |
| SCHEDULE OF INVESTMENTS, CONTINUED | | |
| |
| Thornburg Limited Term Municipal Fund | | March 31, 2010 (Unaudited) |
| | | | | | | | |
Issuer-Description | | Credit Rating†
S&P/ Moody’s | | Principal
Amount | | Value |
Louisiana Offshore Terminal Authority, 5.00% due 10/1/2018 (Loop LLC) | | A/NR | | $ | 22,000,000 | | $ | 23,654,180 |
Louisiana Offshore Terminal Authority, 4.25% due 10/1/2037 put 10/1/2010 (Deepwater Port Loop LLC) | | A/A3 | | | 4,200,000 | | | 4,240,362 |
Louisiana Public Facilities Authority Hospital Revenue, 5.75% due 7/1/2015 (Franciscan Missionaries; Insured: AGM) | | AAA/Aa3 | | | 1,325,000 | | | 1,468,113 |
Louisiana Public Facilities Authority Revenue, 5.00% due 8/1/2012 (Department of Public Safety; Insured: AGM) | | AAA/Aa3 | | | 1,250,000 | | | 1,336,250 |
Louisiana Public Facilities Authority Revenue, 5.00% due 8/1/2013 (Department of Public Safety; Insured: AGM) | | AAA/Aa3 | | | 2,500,000 | | | 2,716,250 |
Louisiana Public Facilities Authority Revenue, 5.00% due 5/15/2014 (Ochsner Clinic Foundation) | | NR/Baa1 | | | 1,000,000 | | | 1,054,250 |
Louisiana Public Facilities Authority Revenue, 5.00% due 5/15/2015 (Ochsner Clinic Foundation) | | NR/Baa1 | | | 1,825,000 | | | 1,913,075 |
Louisiana Public Facilities Authority Revenue, 5.00% due 5/15/2016 (Ochsner Clinic Foundation) | | NR/Baa1 | | | 1,000,000 | | | 1,029,840 |
Louisiana Public Facilities Authority Revenue, 5.00% due 5/15/2017 (Ochsner Clinic Foundation) | | NR/Baa1 | | | 1,035,000 | | | 1,044,822 |
Louisiana Public Facilities Authority Revenue, 5.00% due 5/15/2018 (Ochsner Clinic Foundation) | | NR/Baa1 | | | 1,000,000 | | | 994,020 |
Louisiana Public Facilities Authority Revenue, 7.00% due 12/1/2038 put 12/1/2011 (Cleco Power LLC) | | BBB/Baa2 | | | 9,000,000 | | | 9,609,840 |
Louisiana State GO, 5.00% due 8/1/2017 (Insured: Natl-Re) | | AA-/A1 | | | 4,000,000 | | | 4,374,080 |
Monroe Sales Tax Increment Garrett Road Economic Development Area, 5.00% due 3/1/2017 (Insured: Radian) | | NR/NR | | | 1,505,000 | | | 1,690,928 |
Morehouse Parish PCR, 5.25% due 11/15/2013 (International Paper Co.) | | BBB/Baa3 | | | 2,400,000 | | | 2,496,840 |
Plaquemines Parish Law Enforcement District GO, 5.00% due 9/1/2019 | | BBB+/NR | | | 1,005,000 | | | 1,024,085 |
Plaquemines Parish Law Enforcement District GO, 5.00% due 9/1/2021 | | BBB+/NR | | | 1,115,000 | | | 1,118,523 |
Regional Transportation Authority, 8.00% due 12/1/2011 (Insured: FGIC) | | A-/NR | | | 1,250,000 | | | 1,358,875 |
St. Tammany Parish, 5.00% due 6/1/2017 (Insured: CIFG) | | A+/NR | | | 1,405,000 | | | 1,524,369 |
MARYLAND — 0.07% | | | | | | | | |
Maryland Health & Higher Educational Facilities, 5.00% due 1/1/2017 (Washington County Hospital) | | BBB-/NR | | | 1,000,000 | | | 1,013,070 |
Maryland Health & Higher Educational Facilities, 5.00% due 1/1/2018 (Washington County Hospital) | | BBB-/NR | | | 1,000,000 | | | 999,920 |
MASSACHUSETTS — 1.85% | | | | | | | | |
Massachusetts DFA, 5.625% due 1/1/2015 (Semass Partnership; Insured: Natl-Re) | | AA-/Baa1 | | | 1,025,000 | | | 1,057,800 |
Massachusetts DFA, 3.45% due 12/1/2015 (Carleton-Willard Village) | | NR/NR | | | 3,225,000 | | | 3,206,327 |
Massachusetts DFA, 5.625% due 1/1/2016 (Semass Partnership; Insured: Natl-Re) | | AA-/Baa1 | | | 1,080,000 | | | 1,105,963 |
Massachusetts DFA Resource Recovery, 5.50% due 1/1/2011 (Semass Partnership; Insured: Natl-Re) | | AA-/Baa1 | | | 3,970,000 | | | 4,055,395 |
Massachusetts Educational Financing Authority, 5.50% due 1/1/2017 | | AA/NR | | | 1,700,000 | | | 1,843,157 |
Massachusetts Educational Financing Authority, 5.50% due 1/1/2018 | | AA/NR | | | 7,500,000 | | | 8,077,050 |
Massachusetts Educational Financing Authority, 5.75% due 1/1/2020 | | AA/NR | | | 7,500,000 | | | 8,085,375 |
Massachusetts Health & Educational Facilities Authority, 5.00% due 10/1/2011 (Berkshire Health Systems; Insured: AGM) | | AAA/NR | | | 2,345,000 | | | 2,462,344 |
Massachusetts Health & Educational Facilities Authority, 5.375% due 5/15/2012 (New England Medical Center Hospital; Insured: FGIC) (ETM) | | NR/NR | | | 3,415,000 | | | 3,720,438 |
Massachusetts Health & Educational Facilities Authority, 5.00% due 10/1/2012 (Berkshire Health Systems; Insured: AGM) | | AAA/NR | | | 2,330,000 | | | 2,483,757 |
Massachusetts Health & Educational Facilities Authority, 5.00% due 10/1/2013 (Berkshire Health Systems; Insured: AGM) | | AAA/NR | | | 3,215,000 | | | 3,458,150 |
Massachusetts Health & Educational Facilities Authority, 5.00% due 10/1/2019 (Berkshire Health Systems; Insured: AGM) | | AAA/NR | | | 1,750,000 | | | 1,793,925 |
Massachusetts Solid Waste Disposal Revenue, 5.75% due 12/1/2042 put 5/1/2019 (Dominion Energy Brayton) | | A-/NR | | | 1,800,000 | | | 1,912,356 |
Massachusetts Western Turnpike Revenue, 5.55% due 1/1/2017 (Insured: Natl-Re) | | A/Aa3 | | | 13,160,000 | | | 13,216,193 |
Certified Semi-Annual Report 21
| | |
| SCHEDULE OF INVESTMENTS, CONTINUED | | |
| |
| Thornburg Limited Term Municipal Fund | | March 31, 2010 (Unaudited) |
| | | | | | | | |
Issuer-Description | | Credit Rating†
S&P/ Moody’s | | Principal
Amount | | Value |
MICHIGAN — 4.88% | | | | | | | | |
Battle Creek, 5.00% due 5/1/2020 (Insured: AMBAC) | | AA-/A1 | | $ | 3,200,000 | | $ | 3,346,368 |
Detroit Sewage Disposal Revenue, 6.00% due 7/1/2010 (Insured: Natl-Re) | | A/A2 | | | 1,380,000 | | | 1,393,207 |
Detroit Sewage Disposal Revenue, 5.00% due 7/1/2014 (Insured: Natl-Re) | | A/A3 | | | 2,000,000 | | | 2,138,620 |
Detroit Sewage Disposal Revenue, 5.25% due 7/1/2019 (Insured: Natl-Re) | | A/A2 | | | 3,900,000 | | | 4,059,393 |
Detroit Water, 5.40% due 7/1/2011 (Insured: Natl-Re) | | A/A2 | | | 1,000,000 | | | 1,037,240 |
Detroit Water Supply Systems, 6.00% due 7/1/2015 (Insured: Natl-Re) | | A+/A2 | | | 3,280,000 | | | 3,705,186 |
Detroit Water Supply Systems, 5.00% due 7/1/2016 (Insured: AGM) | | AAA/Aa3 | | | 1,250,000 | | | 1,344,925 |
Dickinson County Economic Development Corp. Environmental Impact, 5.75% due 6/1/2016 (International Paper Co.) | | BBB/Baa3 | | | 4,845,000 | | | 4,946,600 |
Dickinson County Healthcare Systems, 5.50% due 11/1/2013 (Insured: ACA) | | NR/NR | | | 2,535,000 | | | 2,563,113 |
Gull Lake Community School District GO, 0% due 5/1/2013 (Insured: FGIC) | | A/NR | | | 1,980,000 | | | 1,732,460 |
Kalamazoo Hospital Finance Authority Facilities Revenue, 5.00% due 5/15/2018 (Bronson Hospital; Insured: AGM) | | AAA/Aa3 | | | 1,520,000 | | | 1,594,662 |
Kalamazoo Hospital Finance Authority Facilities Revenue, 5.00% due 5/15/2018 (Bronson Hospital; Insured: AGM) | | AAA/Aa3 | | | 2,500,000 | | | 2,622,800 |
Kent Hospital Finance Authority, 5.25% due 1/15/2047 put 1/15/2014 (Spectrum Health) | | AA/Aa3 | | | 5,865,000 | | | 6,422,586 |
Kentwood Public Schools GO, 5.00% due 5/1/2015 (Insured: Natl-Re) | | AA-/Aa3 | | | 4,050,000 | | | 4,306,932 |
Michigan HFA, 5.375% due 7/1/2012 (Port Huron Hospital; Insured: AGM) | | AAA/NR | | | 1,085,000 | | | 1,087,962 |
Michigan Housing Development Authority Rental Housing Revenue, 5.00% due 4/1/2016 (GO of Authority) | | AA/NR | | | 4,900,000 | | | 5,078,703 |
Michigan State Building Authority, 5.25% due 10/15/2014 (Insured: AGM) | | AAA/Aa3 | | | 4,300,000 | | | 4,644,430 |
Michigan State Building Authority, 5.00% due 10/15/2015 (Insured: AMBAC) | | A+/A1 | | | 6,000,000 | | | 6,486,240 |
Michigan State Building Authority, 5.50% due 10/15/2017 | | A+/A1 | | | 4,000,000 | | | 4,387,920 |
Michigan State COP, 4.25% due 9/1/2031 put 9/1/2011 (Insured: Natl-Re) | | A/Baa1 | | | 5,500,000 | | | 5,572,600 |
Michigan State COP, 5.00% due 9/1/2031 put 9/1/2011 (Insured: Natl-Re) | | A/Baa1 | | | 11,530,000 | | | 11,767,172 |
Michigan State HFA, 5.50% due 11/15/2015 (Henry Ford Health System) | | A/A1 | | | 2,300,000 | | | 2,482,620 |
Michigan State HFA, 5.00% due 11/15/2017 (Sparrow Memorial Hospital) | | A+/A1 | | | 1,000,000 | | | 1,046,360 |
Michigan State HFA, 5.50% due 11/15/2017 (Henry Ford Health System) | | A/A1 | | | 1,530,000 | | | 1,611,580 |
Michigan State HFA, 5.50% due 11/15/2018 (Henry Ford Health System) | | A/A1 | | | 3,000,000 | | | 3,129,450 |
Michigan State HFA, 5.75% due 12/1/2034 put 12/1/2015 (Trinity Health) | | AA/Aa2 | | | 10,000,000 | | | 11,375,900 |
Michigan State Hospital Finance Authority, 5.00% due 11/15/2013 (Sparrow Hospital) | | A+/A1 | | | 1,225,000 | | | 1,317,316 |
Michigan State Hospital Finance Authority, 5.00% due 7/15/2016 (Oakwood Hospital) | | A/A2 | | | 1,045,000 | | | 1,089,726 |
Michigan State Hospital Finance Authority, 5.00% due 11/15/2016 (Ascension Health) | | AA/Aa1 | | | 3,000,000 | | | 3,301,050 |
Michigan State Hospital Finance Authority, 5.00% due 7/15/2018 (Oakwood Hospital) | | A/A2 | | | 1,000,000 | | | 1,016,410 |
Michigan State Hospital Finance Authority, 6.00% due 12/1/2018 | | AA/Aa2 | | | 2,000,000 | | | 2,263,800 |
Michigan State Hospital Finance Authority, 5.00% due 7/15/2019 (Oakwood Hospital) | | A/A2 | | | 2,000,000 | | | 2,007,720 |
Michigan State Hospital Finance Authority, 6.00% due 12/1/2020 (Trinity Health) | | AA/Aa2 | | | 1,175,000 | | | 1,200,580 |
Michigan State Strategic Fund, 4.75% due 8/1/2011 (NSF International) | | A-/NR | | | 2,240,000 | | | 2,312,486 |
Michigan State Strategic Fund, 5.00% due 10/15/2017 (Insured: AGM) | | AAA/Aa3 | | | 2,000,000 | | | 2,200,740 |
Michigan State Strategic Fund, 5.25% due 6/1/2018 (Clark Retirement Community) | | BBB-/NR | | | 1,000,000 | | | 944,640 |
Michigan State Strategic Fund, 5.25% due 8/1/2029 put 8/1/2014 (Detroit Edison Co.) | | A-/NR | | | 2,500,000 | | | 2,715,000 |
Michigan State Strategic Fund, 5.50% due 8/1/2029 put 8/1/2016 (Detroit Edison Co.) | | A-/A2 | | | 2,500,000 | | | 2,755,125 |
Michigan State Strategic Fund, 4.85% due 9/1/2030 put 9/1/2011 (Detroit Edison Co.; Insured: AMBAC) | | BBB/Baa1 | | | 4,850,000 | | | 4,974,790 |
Romeo Community School District GO, 5.00% due 5/1/2018
(Insured: Natl-Re; Q-SBLF) | | AA-/Aa3 | | | 3,050,000 | | | 3,298,179 |
Royal Oak Hospital Finance Authority Hospital Revenue, 6.25% due 9/1/2014 (William Beaumont Hospital) | | A/A1 | | | 1,000,000 | | | 1,124,050 |
Royal Oak Hospital Finance Authority Hospital Revenue, 5.25% due 8/1/2017 (William Beaumont Hospital) | | A/A1 | | | 5,855,000 | | | 6,178,723 |
Western Townships Utilities Authority Sewage Disposal GO, 3.00% due 1/1/2011 | | AA/NR | | | 1,000,000 | | | 1,014,440 |
Western Townships Utilities Authority Sewage Disposal GO, 3.00% due 1/1/2012 | | AA/NR | | | 655,000 | | | 672,240 |
Western Townships Utilities Authority Sewage Disposal GO, 4.00% due 1/1/2013 | | AA/NR | | | 1,000,000 | | | 1,057,920 |
22 Certified Semi-Annual Report
| | |
| SCHEDULE OF INVESTMENTS, CONTINUED | | |
| |
| Thornburg Limited Term Municipal Fund | | March 31, 2010 (Unaudited) |
| | | | | | | | |
Issuer-Description | | Credit Rating†
S&P/ Moody’s | | Principal
Amount | | Value |
Western Townships Utilities Authority Sewage Disposal GO, 4.00% due 1/1/2014 | | AA/NR | | $ | 1,000,000 | | $ | 1,061,830 |
Western Townships Utilities Authority Sewage Disposal GO, 5.00% due 1/1/2015 | | AA/NR | | | 1,585,000 | | | 1,749,412 |
Western Townships Utilities Authority Sewage Disposal GO, 5.00% due 1/1/2016 | | AA/NR | | | 1,670,000 | | | 1,835,864 |
Western Townships Utilities Authority Sewage Disposal GO, 5.00% due 1/1/2017 | | AA/NR | | | 1,500,000 | | | 1,645,485 |
Western Townships Utilities Authority Sewage Disposal GO, 5.00% due 1/1/2018 | | AA/NR | | | 1,500,000 | | | 1,641,900 |
MINNESOTA — 1.45% | | | | | | | | |
Dakota County Community Development Agency Multi Family Housing, 5.00% due 11/1/2017 (Commons on Marice) | | NR/NR | | | 1,150,000 | | | 1,070,742 |
Minneapolis St. Paul Health Care Systems, 5.25% due 12/1/2012 (HealthPartners Obligated Group) | | BBB/Baa1 | | | 1,000,000 | | | 1,053,420 |
Minneapolis St. Paul Health Care Systems, 5.25% due 12/1/2013 (HealthPartners Obligated Group) | | BBB/Baa1 | | | 2,200,000 | | | 2,318,580 |
Minneapolis St. Paul Metropolitan Airports, 5.00% due 1/1/2017 (Insured: AMBAC) | | AA-/NR | | | 8,005,000 | | | 8,811,904 |
Minnesota Agricultural & Economic Development Board, 4.00% due 2/15/2014 (Insured: Assured Guaranty) | | AAA/NR | | | 3,460,000 | | | 3,636,598 |
Minnesota Agricultural & Economic Development Board, 5.00% due 2/15/2015 (Insured: Assured Guaranty) | | AAA/NR | | | 1,335,000 | | | 1,453,882 |
Minnesota Agricultural & Economic Development Board, 5.00% due 2/15/2017 (Insured: Assured Guaranty) | | AAA/NR | | | 2,500,000 | | | 2,684,225 |
St. Cloud Health Care Revenue, 5.00% due 5/1/2012 (Centracare Health Systems) | | NR/A2 | | | 1,000,000 | | | 1,067,830 |
St. Cloud Health Care Revenue, 5.00% due 5/1/2013 (Centracare Health Systems) | | NR/A2 | | | 1,000,000 | | | 1,083,540 |
St. Cloud Health Care Revenue, 5.00% due 5/1/2015 (Centracare Health Systems) | | NR/A2 | | | 1,000,000 | | | 1,089,190 |
St. Cloud Health Care Revenue, 5.00% due 5/1/2016 (Centracare Health Systems) | | NR/A2 | | | 1,250,000 | | | 1,344,600 |
St. Cloud Health Care Revenue, 5.00% due 5/1/2017 (Centracare Health Systems) | | NR/A2 | | | 2,920,000 | | | 3,085,564 |
St. Cloud Health Care Revenue, 5.00% due 5/1/2017 (Centracare Health Systems) | | NR/A2 | | | 1,000,000 | | | 1,056,700 |
St. Cloud Health Care Revenue, 5.00% due 5/1/2018 (Centracare Health Systems) | | NR/A2 | | | 3,105,000 | | | 3,232,616 |
St. Cloud Health Care Revenue, 5.00% due 5/1/2019 (Centracare Health Systems) | | NR/A2 | | | 3,495,000 | | | 3,591,707 |
St. Cloud Health Care Revenue, 5.00% due 5/1/2020 (Centracare Health Systems) | | NR/A2 | | | 3,200,000 | | | 3,255,680 |
St. Paul Housing & Redevelopment Authority Health Care Revenue, 5.00% due 2/1/2018 (Gillette Children’s Specialty) | | A-/NR | | | 1,255,000 | | | 1,295,122 |
St. Paul Housing & Redevelopment Authority Health Care Revenue, 5.25% due 2/1/2020 (Gillette Children’s Specialty) | | A-/NR | | | 2,010,000 | | | 2,077,295 |
St. Paul Housing & Redevelopment Authority Health Care Revenue, 5.25% due 5/15/2021 (HealthPartners Obligated Group) | | NR/Baa1 | | | 1,070,000 | | | 1,070,524 |
MISSISSIPPI — 0.79% | | | | | | | | |
Gautier Utility District Systems, 5.50% due 3/1/2012 (Insured: FGIC) | | NR/NR | | | 1,020,000 | | | 1,079,476 |
Medical Center Educational Building, 4.00% due 6/1/2015 (University of Mississippi Medical Center) | | AA-/Aa3 | | | 2,325,000 | | | 2,480,078 |
Medical Center Educational Building, 4.00% due 6/1/2016 (University of Mississippi Medical Center) | | AA-/Aa3 | | | 3,300,000 | | | 3,470,742 |
Mississippi Business Finance Corp., 0.34% due 12/1/2030 put 4/1/2010 (Chevron USA Inc; Guaranty Agreement: Chevron Corp.) (daily demand notes) | | AA/Aa1 | | | 10,500,000 | | | 10,500,000 |
a Mississippi Development Bank Public Improvement GO, 4.75% due 7/1/2017 | | NR/NR | | | 1,565,000 | | | 1,579,711 |
Mississippi Development Bank Special Obligation, 5.00% due 1/1/2011 (Madison County; Insured: AGM/FGIC/County Guaranty) | | AAA/Aa3 | | | 5,000,000 | | | 5,168,200 |
MISSOURI — 0.30% | | | | | | | | |
Missouri Development Finance Board Healthcare Facilities, 4.80% due 11/1/2012 (Lutheran Home Aged; LOC: Commerce Bank) | | NR/Aa2 | | | 800,000 | | | 829,792 |
Missouri Regional Convention & Sports Complex, 5.25% due 8/15/2016 (Insured: AMBAC) | | AA+/Aa2 | | | 1,800,000 | | | 1,976,652 |
Certified Semi-Annual Report 23
| | |
| SCHEDULE OF INVESTMENTS, CONTINUED | | |
| |
| Thornburg Limited Term Municipal Fund | | March 31, 2010 (Unaudited) |
| | | | | | | | |
Issuer-Description | | Credit Rating†
S&P/ Moody’s | | Principal
Amount | | Value |
Missouri State Health & Educational Facilities Authority, 5.00% due 6/1/2011 (SSM Healthcare Corp.) | | AA-/NR | | $ | 1,000,000 | | $ | 1,050,900 |
Missouri State Health & Educational Facilities Authority, 5.00% due 5/15/2017 (Children’s Mercy Hospital) | | A+/NR | | | 1,000,000 | | | 1,055,690 |
Missouri State Health & Educational Facilities Authority, 5.00% due 5/15/2019 (Children’s Mercy Hospital) | | A+/NR | | | 1,000,000 | | | 1,032,940 |
Missouri State Health & Educational Facilities Authority, 5.00% due 5/15/2020 (Children’s Mercy Hospital) | | A+/NR | | | 1,000,000 | | | 1,023,490 |
Springfield Public Utilities COP, 5.00% due 12/1/2013 (Insured: Natl-Re) | | AA/A1 | | | 2,000,000 | | | 2,187,600 |
NEBRASKA — 0.38% | | | | | | | | |
Lancaster County School District GO, 2.00% due 1/15/2011 (Lincoln Park Schools) | | AAA/Aa1 | | | 1,540,000 | | | 1,559,619 |
Madison County Hospital Authority, 5.25% due 7/1/2010 (Faith Regional Health Services; Insured: Radian) | | NR/NR | | | 750,000 | | | 759,075 |
Madison County Hospital Authority, 5.50% due 7/1/2012 (Faith Regional Health Services; Insured: Radian) | | NR/NR | | | 1,625,000 | | | 1,747,379 |
Omaha Public Power District Electric Systems, 5.00% due 2/1/2013 | | AA/Aa1 | | | 5,000,000 | | | 5,478,200 |
a University of Nebraska Facilities Corp., 2.00% due 7/15/2011 | | AA/Aa2 | | | 2,100,000 | | | 2,137,989 |
NEVADA — 1.93% | | | | | | | | |
Clark County GO, 5.00% due 11/1/2014 | | AA+/Aa1 | | | 4,000,000 | | | 4,486,800 |
Clark County GO, 5.00% due 11/1/2017 (Insured: AMBAC) | | AA+/Aa1 | | | 1,185,000 | | | 1,302,422 |
Clark County Improvement District, 5.00% due 12/1/2015 (Insured: AMBAC) | | BBB+/NR | | | 1,845,000 | | | 1,909,224 |
Clark County School District GO, 5.00% due 6/15/2015 (Insured: Natl-Re) | | AA/Aa2 | | | 1,000,000 | | | 1,083,490 |
Las Vegas Clark County Library District GO, 5.00% due 1/1/2018 | | AA/Aa3 | | | 6,535,000 | | | 7,167,131 |
Las Vegas Clark County Library District GO, 5.00% due 1/1/2019 | | AA/Aa3 | | | 3,000,000 | | | 3,275,010 |
Las Vegas Convention & Visitors Authority, 5.25% due 7/1/2013 (Insured: AMBAC) | | A+/Aa3 | | | 1,530,000 | | | 1,661,243 |
Las Vegas Convention & Visitors Authority, 5.25% due 7/1/2014 (Insured: AMBAC) | | A+/Aa3 | | | 2,555,000 | | | 2,803,525 |
Las Vegas Convention & Visitors Authority, 5.00% due 7/1/2019 (Insured: AMBAC) | | A+/Aa3 | | | 6,000,000 | | | 6,145,500 |
Las Vegas COP, 5.00% due 9/1/2016 (City Hall) | | AA-/Aa3 | | | 4,000,000 | | | 4,303,960 |
Las Vegas COP, 5.00% due 9/1/2017 (City Hall) | | AA-/Aa3 | | | 4,300,000 | | | 4,592,529 |
Las Vegas COP, 5.00% due 9/1/2018 (City Hall) | | AA-/Aa3 | | | 4,000,000 | | | 4,229,720 |
Las Vegas GO, 7.00% due 4/1/2017 (Performing Arts Center) | | AA/Aa2 | | | 1,825,000 | | | 2,197,555 |
Las Vegas GO, 7.00% due 4/1/2018 (Performing Arts Center) | | AA/Aa2 | | | 2,095,000 | | | 2,544,566 |
Las Vegas Special Local Improvement District, 5.125% due 6/1/2011 (Insured: AGM) | | AAA/Aa3 | | | 1,555,000 | | | 1,561,966 |
Las Vegas Special Local Improvement District, 5.375% due 6/1/2013 (Insured: AGM) | | AAA/Aa3 | | | 1,075,000 | | | 1,078,601 |
Las Vegas Valley Water District, 0.35% due 6/1/2036 put 4/1/2010 (SPA: Dexia) (daily demand notes) | | AA+/Aa1 | | | 700,000 | | | 700,000 |
Las Vegas Water District GO, 5.00% due 6/1/2017 | | AA+/Aa2 | | | 1,050,000 | | | 1,170,425 |
Las Vegas Water District GO, 5.00% due 6/1/2019 | | AA+/Aa2 | | | 1,000,000 | | | 1,100,810 |
Las Vegas Water District GO, 0.35% due 6/1/2036 put 4/1/2010 (SPA: Dexia) (daily demand notes) | | AA+/Aa1 | | | 1,200,000 | | | 1,200,000 |
Reno Hospital Revenue, 5.25% due 6/1/2014 (Washoe Medical Center; Insured: AGM) | | AAA/Aa3 | | | 1,000,000 | | | 1,082,450 |
Reno Hospital Revenue, 5.25% due 6/1/2016 (Washoe Medical Center; Insured: AGM) | | AAA/Aa3 | | | 1,100,000 | | | 1,173,062 |
Reno Hospital Revenue, 5.25% due 6/1/2018 (Washoe Medical Center; Insured: AGM) | | AAA/Aa3 | | | 1,000,000 | | | 1,052,050 |
Sparks Redevelopment Agency Tax Allocation, 5.75% due 1/15/2011 (Insured: Radian) | | NR/NR | | | 1,285,000 | | | 1,295,049 |
NEW HAMPSHIRE — 0.37% | | | | | | | | |
New Hampshire Health & Educational Facilities, 4.50% due 8/1/2014 (Dartmouth-Hitchcock) | | A+/NR | | | 1,835,000 | | | 1,967,451 |
New Hampshire Health & Educational Facilities, 5.00% due 10/1/2016 (Southern NH Health Systems) | | A-/NR | | | 1,260,000 | | | 1,308,472 |
New Hampshire Health & Educational Facilities, 5.00% due 10/1/2017 (Southern NH Health Systems) | | A-/NR | | | 1,000,000 | | | 1,027,050 |
New Hampshire Municipal Bond Bank, 5.00% due 8/15/2016 (Insured: Natl-Re; GO of Bond Bank) | | AA/Aa3 | | | 2,985,000 | | | 3,386,214 |
24 Certified Semi-Annual Report
| | |
| SCHEDULE OF INVESTMENTS, CONTINUED | | |
| |
| Thornburg Limited Term Municipal Fund | | March 31, 2010 (Unaudited) |
| | | | | | | | |
Issuer-Description | | Credit Rating†
S&P/ Moody’s | | Principal
Amount | | Value |
New Hampshire Municipal Bond Bank, 5.00% due 8/15/2017 (Insured: Natl-Re; GO of Bond Bank) | | AA/Aa3 | | $ | 3,130,000 | | $ | 3,548,919 |
NEW JERSEY — 1.82% | | | | | | | | |
Hudson County COP, 7.00% due 12/1/2012 (Insured: Natl-Re) | | A/Baa1 | | | 1,000,000 | | | 1,123,840 |
Hudson County COP, 6.25% due 12/1/2014 (Insured: Natl-Re) | | A/Baa1 | | | 1,500,000 | | | 1,710,330 |
New Jersey EDA, 5.00% due 11/15/2011 (Seabrook Village) | | NR/NR | | | 1,000,000 | | | 1,016,770 |
New Jersey EDA, 5.00% due 11/15/2014 (Seabrook Village) | | NR/NR | | | 1,000,000 | | | 1,006,910 |
New Jersey EDA, 0.30% due 9/1/2031 put 4/1/2010 (LOC: Bank of Nova Scotia/Lloyds TSB Bank plc) (daily demand notes) | | A+/Aa3 | | | 13,000,000 | | | 13,000,000 |
New Jersey EDA Cigarette Tax Revenue, 5.00% due 6/15/2011 (Insured: FGIC) | | BBB/Baa2 | | | 5,000,000 | | | 5,093,450 |
New Jersey EDA Cigarette Tax Revenue, 5.00% due 6/15/2012 (Insured: FGIC) | | BBB/Baa2 | | | 7,375,000 | | | 7,594,775 |
New Jersey Higher Educational Assistance Authority, 5.00% due 12/1/2017 | | AA/Aa2 | | | 1,500,000 | | | 1,601,895 |
New Jersey Higher Educational Assistance Authority, 5.00% due 12/1/2018 | | AA/Aa2 | | | 3,000,000 | | | 3,169,770 |
New Jersey Higher Educational Assistance Authority, 5.25% due 12/1/2019 | | AA/Aa2 | | | 5,000,000 | | | 5,344,800 |
New Jersey State Transit Corp. COP, 5.25% due 9/15/2013 (Insured: AMBAC) | | A/A1 | | | 6,000,000 | | | 6,619,320 |
New Jersey State Transit Corp. COP, 5.50% due 9/15/2013 (Insured: AMBAC) | | A/A1 | | | 7,650,000 | | | 8,503,051 |
NEW MEXICO — 0.55% | | | | | | | | |
Albuquerque Airport, 5.50% due 7/1/2013 | | A/A1 | | | 1,820,000 | | | 1,994,720 |
Farmington PCR, 0.30% due 5/1/2024 put 4/1/2010 (LOC: Barclays Bank) (daily demand notes) | | AA/Aa3 | | | 200,000 | | | 200,000 |
Gallup PCR, 5.00% due 8/15/2016 (Insured: AMBAC) | | A/Baa1 | | | 2,300,000 | | | 2,421,463 |
Los Alamos County Gross Receipts Tax, 5.50% due 6/1/2017 | | AA+/A1 | | | 2,365,000 | | | 2,659,845 |
Los Alamos County Gross Receipts Tax, 5.50% due 6/1/2018 | | AA+/A1 | | | 2,205,000 | | | 2,478,133 |
New Mexico Highway Commission Tax, 5.00% due 6/15/2011 (Insured: AMBAC) (ETM) | | AAA/Aa2 | | | 4,865,000 | | | 5,124,499 |
Santa Fe Gross Receipts Tax, 5.00% due 6/1/2011 | | AA+/A1 | | | 1,750,000 | | | 1,832,425 |
NEW YORK — 8.67% | | | | | | | | |
Erie County Individual Development Agency, 5.00% due 5/1/2011 (Buffalo School District; Insured: AGM) | | AAA/Aa3 | | | 8,750,000 | | | 9,167,375 |
Erie County Individual Development Agency, 5.00% due 5/1/2015 (Buffalo School District) | | AA-/A1 | | | 3,000,000 | | | 3,376,770 |
Erie County Individual Development Agency, 5.00% due 5/1/2016 (Buffalo School District) | | AA-/A1 | | | 9,145,000 | | | 10,241,211 |
Erie County Individual Development Agency, 5.00% due 5/1/2017 (Buffalo School District) | | AA-/A1 | | | 7,265,000 | | | 8,119,001 |
Erie County Individual Development Agency, 5.00% due 5/1/2018 (Buffalo School District) | | AA-/A1 | | | 5,000,000 | | | 5,573,850 |
Monroe County IDA, 5.375% due 6/1/2017 (St. John Fisher College; Insured: Radian) | | NR/NR | | | 3,910,000 | | | 3,942,883 |
Nassau County Industrial Development Agency, 5.25% due 3/1/2018 (NY Institute of Technology) | | BBB+/Baa2 | | | 1,260,000 | | | 1,327,876 |
Nassau County Industrial Development Agency, 5.25% due 3/1/2020 (NY Institute of Technology) | | BBB+/Baa2 | | | 1,480,000 | | | 1,534,360 |
New York City GO, 3.00% due 8/1/2011 | | AA/Aa3 | | | 17,400,000 | | | 17,944,446 |
New York City GO, 0.32% due 8/1/2023 put 4/1/2010 (Fiscal 2008; LOC: Allied Irish Bank PLC) (daily demand notes) | | AAA/Aaa | | | 10,100,000 | | | 10,100,000 |
New York City GO, 0.35% due 8/1/2028 put 4/1/2010 (SPA: Dexia) (daily demand notes) | | AA/Aa3 | | | 12,195,000 | | | 12,195,000 |
New York City GO, 0.35% due 4/1/2035 put 4/1/2010 (SPA: Dexia) (daily demand notes) | | AA/Aa3 | | | 15,500,000 | | | 15,500,000 |
New York City Health & Hospital Corp. GO, 5.00% due 2/15/2013 | | A+/A1 | | | 2,755,000 | | | 2,964,903 |
New York City IDA, 5.00% due 6/1/2010 (Lycee Francais de New York; Insured: ACA) | | BBB/Baa1 | | | 1,175,000 | | | 1,182,532 |
New York City IDA, 5.25% due 6/1/2011 (Lycee Francais de New York; Insured: ACA) | | BBB/Baa1 | | | 2,215,000 | | | 2,312,659 |
New York City IDA, 5.25% due 6/1/2012 (Lycee Francais de New York; Insured: ACA) | | BBB/Baa1 | | | 2,330,000 | | | 2,501,954 |
New York City Municipal Water Finance Authority, 0.31% due 6/15/2032 put 4/1/2010 (SPA: Dexia) (daily demand notes) | | AA+/Aa3 | | | 7,700,000 | | | 7,700,000 |
New York City Municipal Water Finance Authority, 0.31% due 6/15/2033 put 4/1/2010 (SPA: Dexia) (daily demand notes) | | AAA/Aa2 | | | 10,000,000 | | | 10,000,000 |
New York City Transitional Finance Authority, 5.00% due 11/1/2012 | | AAA/Aa1 | | | 5,000,000 | | | 5,505,500 |
New York City Transitional Finance Authority, 5.00% due 11/1/2014 | | AAA/Aa1 | | | 2,000,000 | | | 2,286,580 |
New York City Transitional Finance Authority, 5.00% due 1/15/2018 (State Aid Withholding) | | AA-/A1 | | | 4,865,000 | | | 5,343,181 |
Certified Semi-Annual Report 25
| | |
| SCHEDULE OF INVESTMENTS, CONTINUED | | |
| |
| Thornburg Limited Term Municipal Fund | | March 31, 2010 (Unaudited) |
| | | | | | | | |
Issuer-Description | | Credit Rating†
S&P/ Moody’s | | Principal
Amount | | Value |
New York Liberty Development Corp., 0.50% due 12/1/2049 put 1/18/2011 (World Trade Center) | | A-1+/Aaa | | $ | 25,000,000 | | $ | 25,017,750 |
New York State Dormitory Authority, 5.00% due 8/15/2010 (Mental Health Services; Insured: Natl-Re) | | AA-/A1 | | | 1,600,000 | | | 1,628,256 |
New York State Dormitory Authority, 5.50% due 7/1/2012 (South Nassau Community Hospital) | | NR/Baa1 | | | 1,820,000 | | | 1,942,377 |
New York State Dormitory Authority, 5.00% due 11/1/2012 pre-refunded 11/1/2010 (Insured: SONYMA) | | NR/NR | | | 605,000 | | | 621,051 |
New York State Dormitory Authority, 5.00% due 11/1/2012 (Insured: SONYMA) | | NR/NR | | | 1,395,000 | | | 1,425,704 |
New York State Dormitory Authority, 5.50% due 7/1/2013 (South Nassau Community Hospital) | | NR/Baa1 | | | 1,500,000 | | | 1,617,645 |
New York State Dormitory Authority, 5.25% due 8/15/2013 (Presbyterian Hospital; Insured: AGM/FHA) | | AAA/Aa3 | | | 3,650,000 | | | 4,053,069 |
New York State Dormitory Authority, 5.00% due 11/1/2013 pre-refunded 11/1/2010 (Insured: SONYMA) | | NR/NR | | | 1,495,000 | | | 1,534,662 |
New York State Dormitory Authority, 5.00% due 11/1/2013 (Insured: SONYMA) | | NR/NR | | | 3,105,000 | | | 3,173,341 |
New York State Dormitory Authority, 3.00% due 8/15/2014 (Mental Health Services) | | AA-/NR | | | 2,640,000 | | | 2,733,245 |
New York State Dormitory Authority, 5.00% due 11/1/2014 pre-refunded 11/1/2010 (Insured: SONYMA) | | NR/NR | | | 490,000 | | | 503,000 |
New York State Dormitory Authority, 5.00% due 11/1/2014 (Insured: SONYMA) | | NR/NR | | | 1,010,000 | | | 1,032,230 |
New York State Dormitory Authority, 5.25% due 8/15/2015 (New York Presbyterian Hospital; Insured: AGM/FHA) | | AAA/Aa3 | | | 4,805,000 | | | 5,226,879 |
a New York State Dormitory Authority, 5.50% due 7/1/2016 (Brooklyn Law School; Insured: Radian) | | BBB+/Baa1 | | | 1,220,000 | | | 1,280,488 |
New York State Dormitory Authority, 5.50% due 2/15/2017 (Mental Health Services) | | AA-/NR | | | 5,000,000 | | | 5,669,900 |
New York State Dormitory Authority, 5.50% due 7/1/2017 (Insured: Radian) | | BBB+/Baa1 | | | 2,500,000 | | | 2,600,675 |
New York State Dormitory Authority, 5.50% due 10/1/2017 (School Districts Financing; Insured: Natl-Re; State Aid Withholding) | | A+/A2 | | | 1,570,000 | | | 1,700,545 |
New York State Dormitory Authority, 5.50% due 2/15/2018 (Mental Health Services) | | AA-/NR | | | 5,000,000 | | | 5,666,500 |
New York State Dormitory Authority, 6.625% due 7/1/2018 (Mount Sinai Hospital) | | BBB+/A2 | | | 4,375,000 | | | 4,446,356 |
New York State Dormitory Authority, 6.625% due 7/1/2019 (Mount Sinai Health) | | BBB+/A2 | | | 1,330,000 | | | 1,351,001 |
New York State Dormitory Authority, 5.25% due 11/15/2026 put 5/15/2012 (Insured: AMBAC) | | AA-/A1 | | | 4,000,000 | | | 4,310,880 |
New York State Dormitory Authority, 0.32% due 7/1/2037 put 4/1/2010 (Cornell University) (daily demand notes) | | AA/Aa1 | | | 3,250,000 | | | 3,250,000 |
New York State Thruway Authority Service Contract, 5.50% due 4/1/2013 (Local Highway & Bridge; Insured: Syncora) | | AA-/A1 | | | 1,000,000 | | | 1,075,540 |
Port Authority 148th, 5.00% due 8/15/2017 (Insured: AGM; GO of Authority) | | AAA/Aa2 | | | 4,725,000 | | | 5,363,442 |
Rockland County GO, 1.50% due 3/9/2011 | | NR/Mig1 | | | 17,500,000 | | | 17,580,850 |
Suffolk County Industrial Development Agency Civic Facilities GO, 5.25% due 3/1/2019 (NY Institute of Technology) | | BBB+/Baa2 | | | 1,400,000 | | | 1,436,302 |
Tobacco Settlement Financing Corp. Asset Backed, 5.00% due 6/1/2011 | | AA-/NR | | | 1,695,000 | | | 1,776,190 |
Tobacco Settlement Financing Corp. Asset Backed, 5.25% due 6/1/2013 | | AA-/A1 | | | 1,145,000 | | | 1,148,779 |
Tobacco Settlement Financing Corp. Asset Backed, 5.25% due 6/1/2013 (Insured: Syncora) | | AA-/A1 | | | 715,000 | | | 717,360 |
Tobacco Settlement Financing Corp. Asset Backed, 5.50% due 6/1/2015 | | AA-/A1 | | | 3,000,000 | | | 3,021,240 |
Tompkins County IDA, 0.29% due 7/1/2037 put 4/1/2010 (Cornell University; Insured: JP Morgan Chase Bank) (daily demand notes) | | AA/Aa1 | | | 300,000 | | | 300,000 |
Tompkins County IDA, 0.32% due 7/1/2037 put 4/1/2010 (Cornell University; Insured: JP Morgan Chase Bank) (daily demand notes) | | AA/Aa1 | | | 1,660,000 | | | 1,660,000 |
United Nations Development Corp., 5.00% due 7/1/2016 | | NR/A1 | | | 3,400,000 | | | 3,772,470 |
United Nations Development Corp., 5.00% due 7/1/2017 | | NR/A1 | | | 3,000,000 | | | 3,329,370 |
United Nations Development Corp., 5.00% due 7/1/2019 | | NR/A1 | | | 4,000,000 | | | 4,407,280 |
NORTH CAROLINA — 1.87% | | | | | | | | |
Charlotte Mecklenberg Hospital Authority Health Care Systems, 5.00% due 1/15/2016 (Carolinas Health Network) | | AA-/Aa3 | | | 3,420,000 | | | 3,727,697 |
Charlotte Mecklenberg Hospital Authority Health Care Systems, 5.00% due 1/15/2017 (Carolinas Health Network) | | AA-/Aa3 | | | 2,000,000 | | | 2,163,460 |
26 Certified Semi-Annual Report
| | |
| SCHEDULE OF INVESTMENTS, CONTINUED | | |
| |
| Thornburg Limited Term Municipal Fund | | March 31, 2010 (Unaudited) |
| | | | | | | | |
Issuer-Description | | Credit Rating†
S&P/ Moody’s | | Principal
Amount | | Value |
Mecklenburg County COP, 5.00% due 2/1/2011 | | AA+/Aa1 | | $ | 1,000,000 | | $ | 1,037,300 |
North Carolina Eastern Municipal Power Agency, 5.375% due 1/1/2011 | | A-/Baa1 | | | 3,000,000 | | | 3,097,560 |
North Carolina Eastern Municipal Power Agency, 5.25% due 1/1/2012 | | A-/Baa1 | | | 650,000 | | | 691,347 |
North Carolina Eastern Municipal Power Agency, 5.50% due 1/1/2012 | | A-/Baa1 | | | 1,100,000 | | | 1,173,513 |
North Carolina Eastern Municipal Power Agency, 5.25% due 1/1/2013 | | A-/Baa1 | | | 1,055,000 | | | 1,152,197 |
North Carolina Eastern Municipal Power Agency, 7.00% due 1/1/2013 (Insured: Natl-Re-IBC) | | A/Baa1 | | | 2,990,000 | | | 3,242,715 |
North Carolina Eastern Municipal Power Agency, 5.00% due 1/1/2016 (Insured: AMBAC) | | A-/NR | | | 1,700,000 | | | 1,856,672 |
North Carolina Eastern Municipal Power Agency, 6.00% due 1/1/2018 (Insured: AMBAC) | | NR/Baa1 | | | 7,500,000 | | | 8,565,750 |
North Carolina Eastern Municipal Power Agency, 6.00% due 1/1/2018 (Insured: BHAC/AMBAC) | | AA+/Aa1 | | | 5,700,000 | | | 6,638,562 |
North Carolina Eastern Municipal Power Agency, 5.25% due 1/1/2019 (Insured: AGM) | | AAA/Aa3 | | | 3,000,000 | | | 3,251,760 |
North Carolina Infrastructure Finance Corp. COP, 5.00% due 2/1/2017 (Correctional Facilities) | | AA+/Aa1 | | | 2,400,000 | | | 2,579,712 |
North Carolina Medical Care Commission, 5.00% due 9/1/2013 (Rowan Regional Medical Center; Insured: AGM/FHA 242) | | AAA/Aa3 | | | 1,000,000 | | | 1,073,310 |
North Carolina Municipal Power Agency, 5.50% due 1/1/2013 (Catawba Electric) | | A/A2 | | | 2,505,000 | | | 2,758,205 |
North Carolina Municipal Power Agency, 5.25% due 1/1/2017 (Catawba Electric) | | A/A2 | | | 3,000,000 | | | 3,347,400 |
North Carolina State Infrastructure Finance Corp. COP, 5.00% due 2/1/2016 (Correctional Facilities) | | AA+/Aa1 | | | 5,000,000 | | | 5,429,250 |
University of North Carolina Systems Pool Revenue, 5.00% due 4/1/2012 (Insured: AMBAC) | | NR/NR | | | 1,030,000 | | | 1,100,936 |
Wake County GO, 5.00% due 3/1/2011 | | AAA/Aaa | | | 4,000,000 | | | 4,168,720 |
NORTH DAKOTA — 0.09% | | | | | | | | |
Ward County Health Care Facilities, 5.00% due 7/1/2011 (Trinity Obligated Group) | | BBB+/NR | | | 1,000,000 | | | 1,022,080 |
Ward County Health Care Facilities, 5.00% due 7/1/2013 (Trinity Obligated Group) | | BBB+/NR | | | 1,560,000 | | | 1,607,970 |
OHIO — 1.61% | | | | | | | | |
Akron COP, 5.00% due 12/1/2013 (Insured: AGM) | | AAA/NR | | | 3,000,000 | | | 3,353,010 |
Akron COP, 5.00% due 12/1/2014 (Insured: AGM) | | AAA/NR | | | 2,000,000 | | | 2,260,300 |
American Municipal Power, 5.25% due 2/15/2018 (Hydroelectric) | | A/A2 | | | 4,500,000 | | | 4,958,190 |
American Municipal Power, 5.25% due 2/15/2019 (Hydroelectric) | | A/A2 | | | 5,015,000 | | | 5,498,697 |
Greater Cleveland Regional Transportation Authority GO, 5.00% due 12/1/2015 (Insured: Natl-Re) | | NR/Aa3 | | | 1,000,000 | | | 1,117,560 |
Hudson City GO, 6.35% due 12/1/2011 pre-refunded 12/1/2010 (Library Improvement) | | NR/Aa1 | | | 960,000 | | | 1,017,341 |
Montgomery County, 6.00% due 12/1/2010 (Catholic Health Initiatives) | | AA/Aa2 | | | 1,530,000 | | | 1,559,728 |
Montgomery County, 5.25% due 10/1/2038 put 11/1/2013 (Catholic Health Initiatives) | | AA/Aa2 | | | 2,500,000 | | | 2,721,350 |
Montgomery County, 4.10% due 10/1/2041 put 11/10/2011 (Catholic Health Initiatives) | | AAA/Aa2 | | | 2,500,000 | | | 2,603,150 |
Ohio State Air Quality Development Authority, 5.625% due 6/1/2018 (First Energy Nuclear) | | BBB-/Baa1 | | | 5,000,000 | | | 5,252,900 |
Ohio State Air Quality Development Authority, 5.75% due 6/1/2033 put 12/1/2011 (First Energy Nuclear) | | BBB-/Baa2 | | | 2,500,000 | | | 2,725,150 |
Ohio State Air Quality Development Authority, 3.875% due 12/1/2038 (Columbus Southern Power Co.) | | BBB/A3 | | | 4,800,000 | | | 4,932,288 |
Ohio State GO, 4.00% due 10/1/2014 | | NR/A1 | | | 2,075,000 | | | 2,252,744 |
Ohio State Higher Educational Facilities, 5.05% due 7/1/2037 put 7/1/2016 (Kenyon College) | | A+/A1 | | | 3,375,000 | | | 3,672,135 |
Ohio State Water Development Authority PCR, 5.875% due 6/1/2033 put 6/1/2016 (FirstEnergy Nuclear) | | BBB-/Baa1 | | | 5,000,000 | | | 5,428,750 |
OKLAHOMA — 2.06% | | | | | | | | |
Cleveland County ISD, 3.00% due 3/1/2012 | | NR/Aa3 | | | 4,040,000 | | | 4,186,894 |
Comanche County Hospital Authority, 5.00% due 7/1/2011 (Insured: Radian) | | BBB-/NR | | | 1,000,000 | | | 1,030,790 |
Comanche County Hospital Authority, 5.25% due 7/1/2015 (Insured: Radian) | | BBB-/NR | | | 1,340,000 | | | 1,417,224 |
Oklahoma County Finance Authority Educational Facilities, 3.50% due 3/1/2012 (Putnam City Public Schools) | | A/NR | | | 3,825,000 | | | 3,928,084 |
Oklahoma County Finance Authority Educational Facilities, 4.00% due 3/1/2013 (Putnam City Public Schools) | | A/NR | | | 2,580,000 | | | 2,702,421 |
Certified Semi-Annual Report 27
| | |
| SCHEDULE OF INVESTMENTS, CONTINUED | | |
| |
| Thornburg Limited Term Municipal Fund | | March 31, 2010 (Unaudited) |
| | | | | | | | |
Issuer-Description | | Credit Rating†
S&P/ Moody’s | | Principal
Amount | | Value |
Oklahoma County Finance Authority Educational Facilities, 4.00% due 3/1/2014 (Putnam City Public Schools) | | A/NR | | $ | 3,380,000 | | $ | 3,542,713 |
Oklahoma County Finance Authority Educational Facilities, 5.00% due 9/1/2016 (Western Heights Public Schools) | | A+/NR | | | 3,000,000 | | | 3,236,850 |
Oklahoma County Finance Authority Educational Facilities, 5.00% due 9/1/2017 (Western Heights Public Schools) | | A+/NR | | | 4,075,000 | | | 4,363,877 |
Oklahoma County Finance Authority Educational Facilities, 5.00% due 9/1/2018 (Western Heights Public Schools) | | A+/NR | | | 2,120,000 | | | 2,245,292 |
Oklahoma County ISD, 3.00% due 1/1/2012 | | A+/NR | | | 3,880,000 | | | 4,000,552 |
Oklahoma County ISD, 3.00% due 1/1/2013 | | A+/NR | | | 3,880,000 | | | 4,044,706 |
Oklahoma County ISD, 3.00% due 1/1/2014 | | A+/NR | | | 3,880,000 | | | 4,045,172 |
Oklahoma County ISD, 3.00% due 1/1/2015 | | A+/NR | | | 3,735,000 | | | 3,868,974 |
Oklahoma DFA, 5.75% due 6/1/2011 pre-refunded 12/1/2010 (Integris Health; Insured: AMBAC) | | NR/Aa3 | | | 740,000 | | | 774,018 |
Oklahoma DFA Health Facilities, 5.00% due 8/15/2017 (Integris Health) | | AA-/Aa3 | | | 4,375,000 | | | 4,744,731 |
Oklahoma DFA Health Systems, 5.25% due 12/1/2011 (Duncan Regional Hospital) | | A/NR | | | 1,215,000 | | | 1,288,799 |
Oklahoma DFA Health Systems, 5.25% due 12/1/2012 (Duncan Regional Hospital) | | A/NR | | | 1,330,000 | | | 1,441,880 |
Oklahoma Municipal Power Authority, 5.00% due 1/1/2013 | | A/A2 | | | 3,745,000 | | | 4,097,817 |
Oklahoma Municipal Power Authority, 5.00% due 1/1/2014 (Insured: AGM) | | NR/Aa3 | | | 4,005,000 | | | 4,450,676 |
Oklahoma State Capital Improvement Authority, 0.31% due 7/1/2033 put 4/1/2010 (daily demand notes) | | AA/A1 | | | 1,100,000 | | | 1,100,000 |
a Oklahoma State Industrial Authority, 5.00% due 7/1/2016 (Medical Research Foundation) | | NR/A1 | | | 1,165,000 | | | 1,251,443 |
Oklahoma State Industrial Authority, 5.25% due 7/1/2017 (Medical Research Foundation) | | NR/A1 | | | 1,075,000 | | | 1,158,076 |
OREGON — 0.52% | | | | | | | | |
Clackamas County Oregon Hospital Facilities, 5.00% due 7/15/2037 put 7/15/2014 (Legacy Health Systems) | | A+/A2 | | | 6,000,000 | | | 6,407,520 |
Clackamas County Oregon Hospital Facilities, 5.00% due 7/15/2039 put 7/15/2012 (Legacy Health Systems) | | A+/A2 | | | 2,000,000 | | | 2,099,180 |
Oregon Facilities Authority Revenue, 5.00% due 3/15/2015 (Legacy Health) | | A+/A2 | | | 1,635,000 | | | 1,780,270 |
Oregon Facilities Authority Revenue, 5.00% due 3/15/2016 (Legacy Health) | | A+/A2 | | | 1,000,000 | | | 1,074,540 |
Oregon State Department of Administrative Services COP, 5.00% due 11/1/2014 (Insured: Natl-Re/FGIC) | | AA-/Aa3 | | | 1,000,000 | | | 1,121,240 |
Port of St Helens Pollution Control, 4.80% due 6/1/2010 (Portland General Electric Company) | | BBB/Baa2 | | | 3,500,000 | | | 3,518,760 |
PENNSYLVANIA — 3.63% | | | | | | | | |
Allegheny County Hospital Development Authority, 5.00% due 6/15/2017 (UPMC Health Systems) | | A+/Aa3 | | | 3,000,000 | | | 3,260,370 |
a Allegheny County Hospital Development Authority, 5.00% due 5/15/2018 (UPMC Health Systems) | | A+/Aa3 | | | 5,000,000 | | | 5,372,300 |
Allegheny County Hospital Development Authority, 5.00% due 6/15/2018 (UPMC Health Systems) | | A+/Aa3 | | | 3,000,000 | | | 3,225,300 |
Allegheny County Redevelopment Authority, 5.10% due 7/1/2014 (Pittsburgh Mills) | | NR/NR | | | 1,740,000 | | | 1,673,288 |
Chester County School Authority, 5.00% due 4/1/2016 (Intermediate School; Insured: AMBAC) | | A/NR | | | 1,915,000 | | | 2,090,912 |
Commonwealth of Pennsylvania, 5.00% due 2/15/2011 | | AA/Aa2 | | | 5,000,000 | | | 5,200,250 |
Northampton County IDA, 5.35% due 7/1/2010 (Moravian Hall Square; Insured: Radian) | | NR/NR | | | 615,000 | | | 616,556 |
Pennsylvania EDA, 5.00% due 12/1/2042 put 6/1/2012 (Exelon Generation) | | NR/A3 | | | 2,550,000 | | | 2,701,853 |
Pennsylvania Higher Educational Facilities Authority, 5.00% due 6/1/2015 | | BBB/Baa2 | | | 1,200,000 | | | 1,248,372 |
Pennsylvania Higher Educational Facilities Authority, 5.00% due 5/15/2019 (UPMC Health Systems) | | NR/Aa3 | | | 5,600,000 | | | 5,993,288 |
Pennsylvania Higher Educational Facilities Authority, 5.00% due 5/15/2020 (UPMC Health Systems) | | NR/Aa3 | | | 5,100,000 | | | 5,411,763 |
Pennsylvania Turnpike Commission Revenue, 0.81% due 12/1/2011 | | A+/Aa3 | | | 2,500,000 | | | 2,500,000 |
28 Certified Semi-Annual Report
| | |
| SCHEDULE OF INVESTMENTS, CONTINUED | | |
| |
| Thornburg Limited Term Municipal Fund | | March 31, 2010 (Unaudited) |
| | | | | | | | |
Issuer-Description | | Credit Rating†
S&P/ Moody’s | | Principal
Amount | | Value |
Pennsylvania Turnpike Commission Revenue, 0.91% due 12/1/2012 | | A+/Aa3 | | $ | 2,500,000 | | $ | 2,500,000 |
Philadelphia Authority for Industrial Development, 5.00% due 8/1/2020 (Mast Charter School) | | BBB+/NR | | | 1,000,000 | | | 992,530 |
Philadelphia Gas Works, 5.00% due 9/1/2014 (Insured: AGM) | | AAA/Aa3 | | | 3,000,000 | | | 3,330,690 |
Philadelphia Gas Works, 5.00% due 10/1/2014 (Insured: AMBAC) | | BBB-/Baa2 | | | 1,825,000 | | | 1,929,335 |
Philadelphia Gas Works, 5.00% due 9/1/2015 (Insured: AGM) | | AAA/Aa3 | | | 3,315,000 | | | 3,626,477 |
Philadelphia Hospital & Higher Educational Facilities, 0.28% due 2/15/2021 put 4/1/2010 (Children’s Hospital; SPA: Bank of America) (daily demand notes) | | AA/Aa2 | | | 6,000,000 | | | 6,000,000 |
Philadelphia Parking Authority Revenue, 5.00% due 9/1/2016 | | A-/A2 | | | 1,500,000 | | | 1,633,665 |
Philadelphia Parking Authority Revenue, 5.00% due 9/1/2017 | | A-/A2 | | | 1,020,000 | | | 1,105,078 |
b Philadelphia School District GO, 5.00% due 9/1/2012 (State Aid Withholding) | | A+/Aa3 | | | 5,000,000 | | | 5,400,850 |
b Philadelphia School District GO, 5.00% due 9/1/2013 (State Aid Withholding) | | A+/Aa3 | | | 5,000,000 | | | 5,487,200 |
b Philadelphia School District GO, 5.00% due 9/1/2019 (State Aid Withholding) | | A+/Aa3 | | | 15,000,000 | | | 16,248,900 |
Pittsburgh GO, 5.00% due 9/1/2012 (Insured: Natl-Re) | | A/Baa1 | | | 3,415,000 | | | 3,612,216 |
Pittsburgh GO, 5.50% due 9/1/2014 (Insured: AMBAC) | | BBB/Baa1 | | | 1,710,000 | | | 1,840,507 |
Pittsburgh GO, 5.50% due 9/1/2014 (Insured: AMBAC) | | BBB/Baa1 | | | 1,750,000 | | | 1,820,788 |
Pittsburgh GO, 5.25% due 9/1/2016 (Insured: AGM) | | AAA/Aa3 | | | 3,000,000 | | | 3,288,480 |
Pittsburgh GO, 5.25% due 9/1/2018 (Insured: AGM) | | AAA/Aa3 | | | 2,740,000 | | | 2,923,580 |
Pittsburgh School District GO, 3.00% due 9/1/2011 (Insured: AGM) | | AAA/Aa3 | | | 1,425,000 | | | 1,466,824 |
Pittsburgh School District GO, 3.00% due 9/1/2012 (Insured: AGM) | | AAA/Aa3 | | | 1,670,000 | | | 1,735,698 |
Pittsburgh School District GO, 3.00% due 9/1/2013 (Insured: AGM) | | AAA/Aa3 | | | 2,100,000 | | | 2,189,019 |
Pittsburgh Water & Sewer Authority Revenue, 2.625% due 9/1/2035 put 9/1/2012 (Insured: AGM) | | AAA/NR | | | 2,000,000 | | | 2,005,940 |
Sayre HFA, 5.25% due 7/1/2011 (Latrobe Area Hospital; Insured: AMBAC) (ETM) | | NR/NR | | | 1,400,000 | | | 1,478,400 |
Sayre HFA, 5.25% due 7/1/2012 (Latrobe Area Hospital; Insured: AMBAC) (ETM) | | NR/NR | | | 1,000,000 | | | 1,091,260 |
RHODE ISLAND — 0.47% | | | | | | | | |
East Greenwich GO, 1.50% due 2/16/2011 | | SP-1+/NR | | | 8,750,000 | | | 8,830,063 |
Providence GO, 5.50% due 1/15/2012 (Insured: FGIC) | | A/A3 | | | 1,880,000 | | | 2,018,894 |
Rhode Island COP, 5.00% due 10/1/2014 (Providence Plantations; Insured Natl-Re) | | AA-/A1 | | | 1,000,000 | | | 1,108,030 |
Rhode Island State Economic Development Corp., 5.75% due 7/1/2010 (Providence Place Mall; Insured: Radian) | | NR/NR | | | 635,000 | | | 635,381 |
Rhode Island State Health & Education Building Corp., 5.25% due 7/1/2014 (Memorial Hospital; LOC: Fleet Bank) | | AA+/NR | | | 1,565,000 | | | 1,683,752 |
SOUTH CAROLINA — 1.39% | | | | | | | | |
Georgetown County Environmental Improvement, 5.70% due 4/1/2014 (International Paper Co.) | | BBB/Baa3 | | | 7,975,000 | | | 8,465,542 |
Greenville County School District, 5.25% due 12/1/2015 (Building Equity Sooner Tomorrow) | | AA/Aa3 | | | 1,000,000 | | | 1,094,930 |
Greenwood County Hospital Facilities, 5.00% due 10/1/2013 (Self Regional Healthcare; Insured: AGM) | | AAA/Aa3 | | | 2,000,000 | | | 2,167,960 |
Greenwood Fifty Facilities School District, 5.00% due 12/1/2015 (Insured: AGM) | | AAA/Aa3 | | | 1,000,000 | | | 1,112,730 |
Greenwood Fifty Facilities School District, 5.00% due 12/1/2016 (Insured: AGM) | | AAA/Aa3 | | | 1,000,000 | | | 1,102,960 |
South Carolina Jobs Economic Development Carealliance, 5.00% due 8/15/2014 | | AAA/Aa3 | | | 4,000,000 | | | 4,361,360 |
South Carolina Jobs Economic Development Carealliance, 5.00% due 8/15/2015 | | AAA/Aa3 | | | 3,000,000 | | | 3,265,710 |
York County PCR, 0.875% due 9/15/2024 (North Carolina Electric) | | A/A2 | | | 11,000,000 | | | 10,994,720 |
York County PCR, 0.875% due 9/15/2024 (North Carolina Electric) | | A/A2 | | | 9,900,000 | | | 9,895,248 |
SOUTH DAKOTA — 0.07% | | | | | | | | |
South Dakota State Health & Educational Facilities Authority, 5.50% due 9/1/2011 (Rapid City Regional Hospital; Insured: Natl-Re) | | A/A1 | | | 1,100,000 | | | 1,157,607 |
South Dakota State Health & Educational Facilities Authority, 5.00% due 11/1/2015 (Sanford Health) | | AA-/A1 | | | 1,000,000 | | | 1,095,250 |
Certified Semi-Annual Report 29
| | |
| SCHEDULE OF INVESTMENTS, CONTINUED | | |
| |
| Thornburg Limited Term Municipal Fund | | March 31, 2010 (Unaudited) |
| | | | | | | | |
Issuer-Description | | Credit Rating†
S&P/ Moody’s | | Principal
Amount | | Value |
TENNESSEE — 1.00% | | | | | | | | |
Knox County Health, Educational, & Housing Facilities, 5.00% due 4/1/2017 (University Health Systems) | | BBB+/NR | | $ | 3,130,000 | | $ | 3,178,014 |
Knox County Health, Educational, & Housing Facilities, 0.46% due 1/1/2046 put 4/1/2010 (Covenant Health; Insured: Assured Guaranty, SPA: Suntrust Bank) (daily demand notes) | | AAA/Aa3 | | | 1,400,000 | | | 1,400,000 |
Tennessee Energy Acquisition Corp., 5.00% due 9/1/2015 | | BB+/Ba3 | | | 3,000,000 | | | 3,164,280 |
Tennessee Energy Acquisition Corp., 5.00% due 2/1/2017 | | A/Baa1 | | | 5,000,000 | | | 5,133,800 |
Tennessee Energy Acquisition Corp., 5.25% due 9/1/2017 | | BB+/Ba3 | | | 11,000,000 | | | 11,500,830 |
Tennessee Energy Acquisition Corp., 5.25% due 9/1/2018 | | BB+/Ba3 | | | 5,000,000 | | | 5,129,700 |
Tennessee Energy Acquisition Corp., 5.25% due 9/1/2020 | | BB+/Ba3 | | | 1,190,000 | | | 1,204,233 |
TEXAS — 9.61% | | | | | | | | |
Amarillo Health Facilities Corp., 5.50% due 1/1/2011 (St. Anthony’s Hospital Corp.; Insured: AGM) | | NR/Aa3 | | | 1,350,000 | | | 1,390,298 |
Austin Community College Public Facilities Corp., 5.25% due 8/1/2017 (Round Rock Campus) | | AA+/Aa3 | | | 1,500,000 | | | 1,692,195 |
Austin Electrical Utilities Systems, 5.50% due 11/15/2013 (Insured: AMBAC) | | A+/A1 | | | 1,000,000 | | | 1,128,820 |
Austin Water & Wastewater, 5.00% due 5/15/2014 (Insured: AMBAC) | | AA/Aa3 | | | 2,890,000 | | | 3,266,336 |
Austin Water & Wastewater, 5.00% due 5/15/2015 (Insured: AMBAC) | | AA/Aa3 | | | 1,520,000 | | | 1,728,544 |
a Bexar County Housing Finance Corp. Multi Family Housing, 5.00% due 1/1/2011 (American Opportunity Housing; Insured: Natl-Re) | | NR/Baa1 | | | 630,000 | | | 625,073 |
Brazos River Authority, 4.90% due 10/1/2015 (Center Point Energy; Insured: Natl-Re) | | A/Baa1 | | | 2,315,000 | | | 2,351,785 |
Bryan Electrical Systems, 4.00% due 7/1/2014 | | A+/A1 | | | 1,300,000 | | | 1,400,438 |
Bryan Electrical Systems, 4.00% due 7/1/2014 | | A+/A1 | | | 1,000,000 | | | 1,032,850 |
Bryan Electrical Systems, 4.00% due 7/1/2015 | | A+/A1 | | | 1,110,000 | | | 1,143,655 |
Bryan Electrical Systems, 5.00% due 7/1/2015 | | A+/A1 | | | 1,150,000 | | | 1,288,242 |
Bryan Electrical Systems, 5.00% due 7/1/2016 | | A+/A1 | | | 1,500,000 | | | 1,604,310 |
Bryan Electrical Systems, 5.00% due 7/1/2017 | | A+/A1 | | | 3,205,000 | | | 3,408,133 |
Bryan Electrical Systems, 5.00% due 7/1/2019 | | A+/A1 | | | 8,000,000 | | | 8,655,600 |
Clint ISD GO, 5.50% due 2/15/2011 (Guaranty: PSF) | | AAA/Aaa | | | 1,700,000 | | | 1,775,480 |
Clint ISD GO, 5.50% due 2/15/2012 (Guaranty: PSF) | | AAA/NR | | | 1,155,000 | | | 1,203,637 |
Collin County Limited Tax Improvement GO, 5.00% due 2/15/2016 | | AAA/Aaa | | | 1,465,000 | | | 1,678,905 |
Corpus Christi Business & Job Development Corp., 5.00% due 9/1/2012 (Arena Project; Insured: AMBAC) | | A/A3 | | | 1,025,000 | | | 1,111,500 |
Dallas Convention Center Hotel Development Corp., 0% due 1/1/2018 | | A+/A2 | | | 5,240,000 | | | 3,600,771 |
Dallas Convention Center Hotel Development Corp., 5.00% due 1/1/2019 | | A+/A2 | | | 5,200,000 | | | 5,489,952 |
Dallas County Texas Utility & Reclamation District, 5.00% due 2/15/2017 (Insured: AMBAC) | | BBB+/Baa3 | | | 1,160,000 | | | 1,207,537 |
Dallas County Texas Utility & Reclamation District, 5.00% due 2/15/2017 (Insured: AMBAC) | | BBB+/Baa3 | | | 1,260,000 | | | 1,311,635 |
Dallas County Texas Utility & Reclamation District, 5.00% due 2/15/2018 (Insured: AMBAC) | | BBB+/Baa3 | | | 1,935,000 | | | 1,992,237 |
Dallas County Texas Utility & Reclamation District, 5.00% due 2/15/2018 (Insured: AMBAC) | | BBB+/Baa3 | | | 2,035,000 | | | 2,095,195 |
Dallas County Texas Utility & Reclamation District, 5.00% due 2/15/2019 (Insured: AMBAC) | | BBB+/Baa3 | | | 2,175,000 | | | 2,208,995 |
Dallas Fort Worth International Airport, 4.00% due 11/1/2012 | | A+/A1 | | | 1,000,000 | | | 1,065,680 |
Dallas Fort Worth International Airport, 5.00% due 11/1/2013 | | A+/A1 | | | 1,175,000 | | | 1,302,217 |
Dallas Fort Worth International Airport, 5.00% due 11/1/2014 | | A+/A1 | | | 1,300,000 | | | 1,451,593 |
Dallas Fort Worth International Airport, 5.00% due 11/1/2015 | | A+/A1 | | | 3,370,000 | | | 3,757,314 |
Denton GO, 2.00% due 2/15/2012 | | AA/Aa3 | | | 3,115,000 | | | 3,165,338 |
Denton GO, 3.00% due 2/15/2014 | | AA/Aa3 | | | 3,325,000 | | | 3,479,280 |
Denton GO, 4.00% due 2/15/2015 | | AA/Aa3 | | | 3,445,000 | | | 3,737,928 |
Denton GO, 4.00% due 2/15/2016 | | AA/Aa3 | | | 3,535,000 | | | 3,793,868 |
Denton GO, 5.00% due 2/15/2017 | | AA/Aa3 | | | 3,675,000 | | | 4,144,077 |
Denton GO, 5.00% due 2/15/2018 | | AA/Aa3 | | | 3,825,000 | | | 4,303,775 |
Denton GO, 5.00% due 2/15/2019 | | AA/Aa3 | | | 3,990,000 | | | 4,476,261 |
Denton GO, 5.00% due 2/15/2020 | | AA/Aa3 | | | 4,195,000 | | | 4,652,633 |
Duncanville ISD GO, 0% due 2/15/2011 (Guaranty: PSF) | | AAA/Aaa | | | 4,945,000 | | | 4,915,824 |
30 Certified Semi-Annual Report
| | |
| SCHEDULE OF INVESTMENTS, CONTINUED | | |
| |
| Thornburg Limited Term Municipal Fund | | March 31, 2010 (Unaudited) |
| | | | | | | | |
Issuer-Description | | Credit Rating†
S&P/ Moody’s | | Principal
Amount | | Value |
Duncanville ISD GO, 0% due 2/15/2012 (Guaranty: PSF) | | AAA/Aaa | | $ | 1,245,000 | | $ | 1,220,038 |
Fort Worth Water & Sewer, 5.25% due 2/15/2011 (Tarrant & Denton County) | | AA/Aa2 | | | 1,390,000 | | | 1,447,449 |
Grapevine Colleyville ISD GO, 0% due 8/15/2011 (Guaranty: PSF) | | AAA/Aaa | | | 7,350,000 | | | 7,271,502 |
Harris County Educational Facilities Finance Corp., 5.00% due 11/15/2015 (Teco Project) | | AA/Aa3 | | | 1,450,000 | | | 1,639,646 |
Harris County Educational Facilities Finance Corp., 5.00% due 11/15/2018 (Teco Project) | | AA/Aa3 | | | 1,365,000 | | | 1,523,094 |
Harris County Educational Facilities Finance Corp., 5.00% due 11/15/2019 (Teco Project) | | AA/Aa3 | | | 1,000,000 | | | 1,111,250 |
Harris County Health Facilities Development Corp. Thermal Utility, 5.00% due 11/15/2015 (Teco Project; Insured: Natl-Re) | | AA/Aa3 | | | 1,500,000 | | | 1,597,845 |
Harris County Hospital District, 5.75% due 2/15/2011 pre-refunded 8/15/2010 (Insured: Natl-Re) | | A/NR | | | 10,000,000 | | | 10,197,200 |
Harris County Hospital District Senior Lien, 5.00% due 2/15/2014 (Insured: Natl-Re) | | A/A1 | | | 1,275,000 | | | 1,375,508 |
Harris County Hospital District Senior Lien, 5.00% due 2/15/2017 (Insured: Natl-Re) | | A/A1 | | | 1,500,000 | | | 1,594,755 |
a Harris County Sports Authority Senior Lien, 0% due 11/15/2010 (Insured: Natl-Re) | | A/Baa1 | | | 3,260,000 | | | 3,181,434 |
Houston Airport Systems Revenue, 5.00% due 7/1/2015 | | AA-/Aa3 | | | 2,600,000 | | | 2,937,116 |
Houston Airport Systems Revenue, 5.00% due 7/1/2017 | | AA-/Aa3 | | | 1,600,000 | | | 1,794,304 |
Houston Airport Systems Revenue, 5.00% due 7/1/2018 | | AA-/Aa3 | | | 1,000,000 | | | 1,118,410 |
Houston Airport Systems Revenue, 5.00% due 7/1/2019 | | AA-/Aa3 | | | 1,500,000 | | | 1,655,415 |
Houston Independent School District, 5.00% due 2/15/2014 (Limited Tax Schoolhouse) | | AA+/Aa2 | | | 2,000,000 | | | 2,259,360 |
Houston Independent School District, 5.00% due 2/15/2015 (Limited Tax Schoolhouse) | | AA+/Aa2 | | | 2,450,000 | | | 2,795,646 |
Houston ISD Public West Side, 0% due 9/15/2014 (Insured: AMBAC) | | AA/Aa3 | | | 6,190,000 | | | 5,625,967 |
Houston Utilities System Revenue, 5.00% due 11/15/2013 (Insured: AGM) | | AAA/Aa3 | | | 3,000,000 | | | 3,366,540 |
Hutto ISD GO, 0% due 8/1/2017 (Guaranty: PSF) | | AAA/NR | | | 2,170,000 | | | 1,687,869 |
Irving ISD GO, 0% due 2/15/2017 (Guaranty: PSF) | | AAA/Aaa | | | 1,000,000 | | | 794,720 |
Keller ISD GO, 0% due 8/15/2012 (Guaranty: PSF) | | AAA/Aaa | | | 1,250,000 | | | 1,215,188 |
Kerrville Health Facilities Development Corp. Hospital Revenue, 5.25% due 8/15/2021 (Sid Peterson Memorial Hospital) | | BBB-/NR | | | 4,000,000 | | | 3,834,440 |
Laredo GO, 5.00% due 2/15/2018 (Insured: Natl-Re) | | AA-/A1 | | | 2,000,000 | | | 2,171,700 |
Laredo Sports Venue Sales Refunding & Improvement, 5.00% due 3/15/2012 (Insured: AMBAC) | | A+/A2 | | | 1,660,000 | | | 1,769,610 |
Laredo Sports Venue Sales Refunding & Improvement, 5.00% due 3/15/2013 (Insured: AMBAC) | | A+/A2 | | | 1,745,000 | | | 1,890,620 |
Laredo Sports Venue Sales Refunding & Improvement, 5.00% due 3/15/2014 (Insured: AMBAC) | | A+/A2 | | | 1,835,000 | | | 2,011,967 |
a Laredo Sports Venue Sales Refunding & Improvement, 5.00% due 3/15/2015 (Insured: AMBAC) | | A+/A2 | | | 1,930,000 | | | 2,121,610 |
Lower Colorado River Authority, 5.875% due 5/15/2016 (Insured: BHAC/FSA) | | NR/NR | | | 2,210,000 | | | 2,222,619 |
Mesquite ISD GO, 0% due 8/15/2011 pre-refunded 8/15/2010 (Guaranty: PSF) | | AAA/NR | | | 1,865,000 | | | 1,770,090 |
Mesquite ISD GO, 0% due 8/15/2011 (Guaranty: PSF) | | AAA/NR | | | 1,200,000 | | | 1,136,892 |
Midtown Redevelopment Authority, 6.00% due 1/1/2011 (Insured: Radian) | | A-/Baa1 | | | 740,000 | | | 762,518 |
North Central Health Facility Development, 5.00% due 5/15/2017 (Baylor Health Care System) | | AA-/Aa2 | | | 5,000,000 | | | 5,006,300 |
North East ISD GO, 5.00% due 8/1/2016 (Guaranty: PSF) | | AAA/Aaa | | | 2,000,000 | | | 2,297,820 |
North Texas Tollway Authority, 5.50% due 1/1/2038 put 1/1/2011 | | A-/A2 | | | 19,500,000 | | | 20,138,820 |
North Texas Tollway Authority, 5.00% due 1/1/2043 put 1/1/2011 | | A-/A2 | | | 2,140,000 | | | 2,202,124 |
North Texas University Revenue, 5.00% due 4/15/2014 | | NR/Aa3 | | | 1,250,000 | | | 1,410,500 |
North Texas University Revenue, 5.00% due 4/15/2016 | | NR/Aa3 | | | 2,250,000 | | | 2,545,268 |
Red River Authority PCR, 5.20% due 7/1/2011 (Southwestern Public Service; Insured: AMBAC) | | BBB-/Baa1 | | | 7,780,000 | | | 7,800,928 |
Richardson Refunding & Improvement GO, 5.00% due 2/15/2014 (Insured: Natl-Re) | | AAA/Aa1 | | | 3,000,000 | | | 3,370,020 |
Sam Rayburn Municipal Power Agency, 5.50% due 10/1/2012 | | BBB/Baa2 | | | 6,000,000 | | | 6,435,120 |
Sam Rayburn Municipal Power Agency, 6.00% due 10/1/2021 | | BBB/Baa2 | | | 8,300,000 | | | 8,494,718 |
Tarrant County Cultural Educational Facilities, 5.00% due 8/15/2014 (Scott & White Memorial Hospital) | | A+/Aa3 | | | 1,180,000 | | | 1,293,221 |
Tarrant County Cultural Educational Facilities, 5.00% due 8/15/2016 (Scott & White Memorial Hospital) | | A+/Aa3 | | | 2,280,000 | | | 2,453,508 |
Tarrant County Cultural Educational Facilities, 5.00% due 8/15/2017 (Scott & White Memorial Hospital) | | A+/Aa3 | | | 2,000,000 | | | 2,133,100 |
Tarrant County Health Facilities Development Corp., 6.10% due 11/15/2011 pre-refunded 11/15/2010 (Adventist/Sunbelt Health System) | | NR/A1 | | | 730,000 | | | 762,777 |
Texas Municipal Power Agency, 0% due 9/1/2013 (Insured: Natl-Re) | | A+/A2 | | | 1,000,000 | | | 929,410 |
Certified Semi-Annual Report 31
| | |
| SCHEDULE OF INVESTMENTS, CONTINUED | | |
| |
| Thornburg Limited Term Municipal Fund | | March 31, 2010 (Unaudited) |
| | | | | | | | |
Issuer-Description | | Credit Rating†
S&P/ Moody’s | | Principal
Amount | | Value |
Texas Municipal Power Agency, 5.00% due 9/1/2017 (Insured: AGM) | | AAA/Aa3 | | $ | 10,000,000 | | $ | 11,221,900 |
Texas State Public Finance Authority, 5.00% due 10/15/2014 (Stephen F. Austin University; Insured: Natl-Re) | | NR/A2 | | | 1,305,000 | | | 1,462,253 |
Texas State Public Finance Authority, 5.00% due 10/15/2015 (Stephen F. Austin University; Insured: Natl-Re) | | NR/A2 | | | 1,450,000 | | | 1,628,191 |
Texas Tax & Revenue, 2.50% due 8/31/2010 | | SP-1+/Mig1 | | | 20,000,000 | | | 20,183,600 |
Uptown Development Authority, 5.00% due 9/1/2015 (Infrastructure Improvements) | | BBB+/NR | | | 1,370,000 | | | 1,469,161 |
Uptown Development Authority, 5.00% due 9/1/2017 (Infrastructure Improvements) | | BBB+/NR | | | 1,580,000 | | | 1,628,285 |
Uptown Development Authority, 5.00% due 9/1/2018 (Infrastructure Improvements) | | BBB+/NR | | | 1,870,000 | | | 1,903,342 |
Uptown Development Authority, 5.00% due 9/1/2019 (Infrastructure Improvements) | | BBB+/NR | | | 1,945,000 | | | 1,959,451 |
Washington County Health Facilities Development Corp., 5.75% due 6/1/2019 (Trinity Medical Center; Insured: ACA) | | NR/NR | | | 3,840,000 | | | 3,677,491 |
Weslaco GO Waterworks & Sewer System, 5.25% due 2/15/2019 (Insured: Natl-Re) | | A/Baa2 | | | 2,835,000 | | | 3,104,779 |
West Harris County Regional Water, 5.25% due 12/15/2012 (Insured: AGM) | | AAA/Aa3 | | | 2,435,000 | | | 2,665,765 |
U.S. VIRGIN ISLANDS — 0.40% | | | | | | | | |
Virgin Islands Public Finance Authority, 6.75% due 10/1/2019 (Matching Fund Loan Diageo Project) | | BBB/Baa3 | | | 7,690,000 | | | 8,568,583 |
Virgin Islands Water & Power Authority, 4.75% due 7/1/2015 | | BBB-/Baa2 | | | 1,000,000 | | | 1,053,050 |
Virgin Islands Water & Power Authority, 4.75% due 7/1/2016 | | BBB-/Baa2 | | | 1,225,000 | | | 1,273,571 |
Virgin Islands Water & Power Authority, 4.75% due 7/1/2017 | | BBB-/Baa2 | | | 1,300,000 | | | 1,338,064 |
UTAH — 0.96% | | | | | | | | |
Intermountain Power Agency Supply, 5.00% due 7/1/2012 (ETM) | | AAA/NR | | | 4,355,000 | | | 4,370,460 |
Intermountain Power Agency Supply, 5.00% due 7/1/2012 | | A+/A1 | | | 15,000,000 | | | 16,242,150 |
Intermountain Power Agency Supply, 5.00% due 7/1/2013 | | A+/A1 | | | 5,000,000 | | | 5,533,650 |
Nebo School District GO, 2.00% due 7/1/2011 | | AAA/Aaa | | | 1,245,000 | | | 1,267,921 |
Nebo School District GO, 2.50% due 7/1/2012 | | AAA/Aaa | | | 1,510,000 | | | 1,562,654 |
Utah State Board of Regents Auxiliary Systems & Student Fee, 5.00% due 5/1/2010 | | AA/NR | | | 510,000 | | | 511,999 |
VIRGINIA — 0.90% | | | | | | | | |
Alexandria IDA, 5.75% due 10/1/2010 (Institute for Defense; Insured: AMBAC) (ETM) | | NR/NR | | | 1,195,000 | | | 1,227,695 |
Louisa IDA PCR, 5.00% due 11/1/2035 put 12/1/2011 (Virginia Electric & Power Company) | | A-/NR | | | 3,000,000 | | | 3,171,630 |
Norton IDA Hospital Improvement, 5.75% due 12/1/2012 (Norton Community Hospital; Insured: ACA) | | NR/NR | | | 1,460,000 | | | 1,492,938 |
Suffolk Redevelopment Housing Authority, 4.85% due 7/1/2031 put 7/1/2011 (Windsor at Potomac; Collateralized: FNMA) | | NR/Aaa | | | 3,000,000 | | | 3,128,040 |
Virginia Commonwealth University, 0.28% due 11/1/2030 put 4/1/2010 (Insured: AMBAC; LOC: Wells Fargo Bank) (daily demand notes) | | AA/Aa2 | | | 18,600,000 | | | 18,600,000 |
WASHINGTON — 2.98% | | | | | | | | |
Energy Northwest Washington Electric, 5.50% due 7/1/2012 (Insured: Natl-Re) | | AA/Aaa | | | 3,000,000 | | | 3,301,680 |
Energy Northwest Washington Electric, 5.00% due 7/1/2014 (Wind Project) (Insured: AMBAC) | | A-/A3 | | | 2,575,000 | | | 2,860,387 |
Energy Northwest Washington Electric, 6.00% due 7/1/2016 (Number 3; Insured: AMBAC) | | AA/Aaa | | | 2,415,000 | | | 2,644,328 |
Energy Northwest Washington Electric, 5.00% due 7/1/2017 (Number 3) | | AA/Aaa | | | 5,470,000 | | | 6,252,483 |
Energy Northwest Washington Electric, 5.00% due 7/1/2018 (Insured: Natl-Re) | | AA/Aaa | | | 8,000,000 | | | 9,079,920 |
King & Snohomish Counties School District GO, 5.60% due 12/1/2010 (Insured: Natl-Re/FGIC) | | AA-/Aa2 | | | 3,160,000 | | | 3,258,940 |
King County Sewer, 5.50% due 1/1/2016 (Insured: AGM) | | AAA/Aa3 | | | 7,205,000 | | | 7,733,271 |
a Lewis County Public Utility District, 5.00% due 10/1/2011 (Cowlitz Falls Hydroelectric; Insured: XLCA) | | AA/Aaa | | | 2,000,000 | | | 2,126,300 |
Port Seattle Washington Revenue, 5.50% due 9/1/2018 (Insured: Natl-Re/FGIC) | | A/A1 | | | 5,000,000 | | | 5,648,350 |
Snohomish County Public Utilities District, 5.00% due 12/1/2015 (Insured: AGM) | | AAA/Aa3 | | | 5,015,000 | | | 5,548,446 |
Washington State Convention and Trade Center, 5.00% due 7/1/2011 (Insured: Natl-Re) | | AA/Aa2 | | | 4,395,000 | | | 4,408,844 |
32 Certified Semi-Annual Report
| | |
| SCHEDULE OF INVESTMENTS, CONTINUED | | |
| |
| Thornburg Limited Term Municipal Fund | | March 31, 2010 (Unaudited) |
| | | | | | | | | |
Issuer-Description | | Credit Rating†
S&P/ Moody’s | | Principal
Amount | | Value | |
Washington State GO, 0% due 1/1/2018 (Insured: Natl-Re/FGIC) | | AA+/Aa1 | | $ | 4,000,000 | | $ | 3,059,200 | |
Washington State GO, 0% due 1/1/2019 (Insured: Natl-Re/FGIC) | | AA+/Aa1 | | | 3,000,000 | | | 2,174,850 | |
Washington State HFA, 6.75% due 12/1/2011 (Group Health Co-op of Puget Sound; Insured: Natl-Re) | | NR/Baa1 | | | 1,390,000 | | | 1,396,394 | |
Washington State HFA, 5.00% due 7/1/2013 (Overlake Hospital; Insured: AGM) | | AAA/Aa3 | | | 1,000,000 | | | 1,068,810 | |
Washington State HFA, 5.00% due 8/15/2013 (Multicare Health Systems) | | A+/A1 | | | 1,250,000 | | | 1,359,637 | |
Washington State HFA, 5.00% due 8/15/2014 (Multicare Health Systems) | | A+/A1 | | | 1,500,000 | | | 1,639,590 | |
Washington State HFA, 5.00% due 8/15/2015 (Multicare Health Systems) | | A+/A1 | | | 2,000,000 | | | 2,183,860 | |
Washington State HFA, 5.00% due 8/15/2016 (Multicare Health Systems) | | A+/A1 | | | 2,075,000 | | | 2,239,755 | |
Washington State HFA, 5.375% due 12/1/2016 (Group Health Co-op of Puget Sound; Insured: AMBAC) | | BBB+/NR | | | 2,000,000 | | | 2,040,100 | |
Washington State HFA, 5.00% due 8/15/2017 (Multicare Health Systems) | | A+/A1 | | | 1,000,000 | | | 1,059,980 | |
Washington State HFA, 5.25% due 8/1/2018 (Highline Medical Center; Insured: AGM 242) | | A+/NR | | | 8,095,000 | | | 8,769,880 | |
Washington State HFA, 5.00% due 8/15/2018 (Multicare Health Systems) | | A+/A1 | | | 2,000,000 | | | 2,087,460 | |
b Washington State HFA, 5.00% due 7/1/2019 (Overlake Hospital Medical Center) | | BBB+/NR | | | 1,050,000 | | | 1,071,357 | |
b Washington State HFA, 4.75% due 7/1/2020 (Overlake Hospital Medical Center) | | BBB+/NR | | | 1,000,000 | | | 989,540 | |
Washington State Public Power Supply Systems, 5.40% due 7/1/2012 (Nuclear Number 2; Insured: AGM) | | AAA/Aaa | | | 1,300,000 | | | 1,424,488 | |
Washington State Public Power Supply Systems, 0% due 7/1/2013 (Insured: Natl-Re-IBC) | | AA/Aaa | | | 1,760,000 | | | 1,663,112 | |
Washington State Public Power Supply Systems, 0% due 7/1/2015 (Insured: Natl-Re-IBC) | | AA/Aaa | | | 3,000,000 | | | 2,635,320 | |
Yakima County School District, 5.00% due 12/1/2012 (Insured: Natl-Re) | | NR/Aa1 | | | 1,270,000 | | | 1,397,140 | |
WEST VIRGINIA — 0.29% | | | | | | | | | |
Kanawha, Mercer, Nicholas Counties Single Family Mortgage, 0% due 2/1/2015 pre-refunded 2/1/2014 | | NR/Aaa | | | 2,260,000 | | | 1,870,534 | |
Monongalia County Community Hospital, 5.25% due 7/1/2020 (Monongalia General Hospital) | | BBB+/NR | | | 4,750,000 | | | 4,823,578 | |
West Virginia EDA PCR, 4.85% due 5/1/2019 (Appalachian Power Company) | | BBB/Baa2 | | | 1,000,000 | | | 1,052,600 | |
West Virginia EDA PCR, 4.85% due 5/1/2019 (Appalachian Power Company) | | BBB/Baa2 | | | 1,000,000 | | | 1,052,600 | |
WISCONSIN — 0.45% | | | | | | | | | |
Hudson School District GO, 4.625% due 10/1/2014 (Insured: AGM) | | AAA/Aa2 | | | 1,885,000 | | | 1,981,041 | |
Wisconsin Clean Water Revenue, 5.00% due 6/1/2017 | | AA+/Aa1 | | | 2,455,000 | | | 2,582,144 | |
Wisconsin Health & Educational Facilities Authority, 5.125% due 8/15/2027 put 8/15/2016 (Aurora Health Care Inc.) | | NR/A3 | | | 4,500,000 | | | 4,755,645 | |
Wisconsin Petroleum, 5.00% due 7/1/2015 | | AA/Aa3 | | | 4,000,000 | | | 4,518,400 | |
WYOMING — 0.02% | | | | | | | | | |
West Park Hospital District, 5.90% due 7/1/2010 (Insured: ACA) | | NR/NR | | | 550,000 | | | 551,122 | |
| | | | | | | | | |
TOTAL INVESTMENTS — 100.56% (Cost $3,003,707,453) | | | | | | | $ | 3,074,731,064 | |
LIABILITIES NET OF OTHER ASSETS — (0.56)% | | | | | | | | (16,994,006 | ) |
| | | | | | | | | |
NET ASSETS — 100.00% | | | | | | | $ | 3,057,737,058 | |
| | | | | | | | | |
Footnote Legend
| † | Credit ratings are unaudited. Rating changes may have occurred subsequent to the reporting period end. |
| a | Segregated as collateral for a when-issued security. |
Certified Semi-Annual Report 33
| | |
| SCHEDULE OF INVESTMENTS, CONTINUED | | |
| |
| Thornburg Limited Term Municipal Fund | | March 31, 2010 (Unaudited) |
Portfolio Abbreviations
To simplify the listings of securities, abbreviations are used per the table below:
| ACA | Insured by American Capital Access |
| AGM | Insured by Assured Guaranty Municipal Corp. |
| AMBAC | Insured by American Municipal Bond Assurance Corp. |
| BHAC | Insured by Berkshire Hathaway Assurance Corp. |
| CIFG | Insured by CIFG Assurance North America Inc. |
| COP | Certificates of Participation |
| DFA | Development Finance Authority |
| EDA | Economic Development Authority |
| FGIC | Insured by Financial Guaranty Insurance Co. |
| FHA | Insured by Federal Housing Administration |
| FNMA | Collateralized by Federal National Mortgage Association |
| FSA | Insured by Financial Security Assurance Co. |
| HFA | Health Facilities Authority |
| HUD | Department of Housing & Urban Development |
| IDA | Industrial Development Authority |
| ISD | Independent School District |
| JEA | Jacksonville Electric Authority |
| Natl-Re | Insured by National Public Finance Guarantee Corp. |
| PCR | Pollution Control Revenue Bond |
| PSF | Guaranteed by Permanent School Fund |
| Q-SBLF | Qualified School Bond Loan Fund |
| Radian | Insured by Radian Asset Assurance |
| SONYMA | State of New York Mortgage Authority |
| SPA | Stand-by Purchase Agreement |
| Syncora | Insured by Syncora Guarantee Inc. |
| UPMC | University of Pittsburgh Medical Center |
| USD | Unified School District |
| XLCA | Insured by XL Capital Assurance |
See notes to financial statements.
34 Certified Semi-Annual Report
| | |
| STATEMENT OF ASSETS AND LIABILITIES | | |
| |
| Thornburg Limited Term Municipal Fund | | March 31, 2010 (Unaudited) |
| | | | |
ASSETS | | | | |
Investments at value (cost $3,003,707,453) (Note 2) | | $ | 3,074,731,064 | |
Cash | | | 211,544 | |
Receivable for investments sold | | | 30,070,224 | |
Receivable for fund shares sold | | | 23,051,308 | |
Interest receivable | | | 32,479,311 | |
Prepaid expenses and other assets | | | 140,745 | |
| | | | |
Total Assets | | | 3,160,684,196 | |
| | | | |
| |
LIABILITIES | | | | |
Payable for securities purchased | | | 90,892,018 | |
Payable for fund shares redeemed | | | 8,967,150 | |
Payable to investment advisor and other affiliates (Note 3) | | | 1,464,325 | |
Accounts payable and accrued expenses | | | 99,656 | |
Dividends payable | | | 1,523,989 | |
| | | | |
Total Liabilities | | | 102,947,138 | |
| | | | |
| |
NET ASSETS | | $ | 3,057,737,058 | |
| | | | |
NET ASSETS CONSIST OF: | | | | |
Undistributed net investment income | | $ | 40,807 | |
Net unrealized appreciation on investments | | | 71,023,611 | |
Accumulated net realized gain (loss) | | | (4,067,123 | ) |
Net capital paid in on shares of beneficial interest | | | 2,990,739,763 | |
| | | | |
| | $ | 3,057,737,058 | |
| | | | |
| |
NET ASSET VALUE: | | | | |
Class A Shares: | | | | |
Net asset value and redemption price per share ($1,366,312,969 applicable to 98,194,032 shares of beneficial interest outstanding - - Note 4) | | $ | 13.91 | |
Maximum sales charge, 1.50% of offering price | | | 0.21 | |
| | | | |
Maximum offering price per share | | $ | 14.12 | |
| | | | |
| |
Class C Shares: | | | | |
Net asset value and offering price per share * ($349,320,786 applicable to 25,058,979 shares of beneficial interest outstanding - Note 4) | | $ | 13.94 | |
| | | | |
| |
Class I Shares: | | | | |
Net asset value, offering and redemption price per share ($1,342,103,303 applicable to 96,440,373 shares of beneficial interest outstanding - Note 4) | | $ | 13.92 | |
| | | | |
| * | Redemption price per share is equal to net asset value less any applicable contingent deferred sales charge. |
See notes to financial statements.
Certified Semi-Annual Report 35
| | |
| STATEMENT OF OPERATIONS | | |
| |
| Thornburg Limited Term Municipal Fund | | Six Months Ended March 31, 2010 (Unaudited) |
| | | | |
INVESTMENT INCOME: | | | | |
Interest income (net of premium amortized of $8,351,167) | | $ | 45,820,326 | |
| | | | |
| |
EXPENSES: | | | | |
Investment advisory fees (Note 3) | | | 4,234,005 | |
Administration fees (Note 3) | | | | |
Class A Shares | | | 741,916 | |
Class C Shares | | | 167,397 | |
Class I Shares | | | 272,446 | |
Distribution and service fees (Note 3) | | | | |
Class A Shares | | | 1,483,832 | |
Class C Shares | | | 1,365,300 | |
Transfer agent fees | | | | |
Class A Shares | | | 182,885 | |
Class C Shares | | | 48,342 | |
Class I Shares | | | 132,837 | |
Registration and filing fees | | | | |
Class A Shares | | | 65,302 | |
Class C Shares | | | 26,477 | |
Class I Shares | | | 52,194 | |
Custodian fees (Note 3) | | | 162,495 | |
Professional fees | | | 39,678 | |
Accounting fees | | | 41,744 | |
Trustee fees | | | 30,620 | |
Other expenses | | | 115,196 | |
| | | | |
Total Expenses | | | 9,162,666 | |
Less: | | | | |
Distribution fees waived (Note 3) | | | (682,650 | ) |
| | | | |
Net Expenses | | | 8,480,016 | |
| | | | |
Net Investment Income | | | 37,340,310 | |
| | | | |
REALIZED AND UNREALIZED GAIN (LOSS) | | | | |
Net realized gain (loss) on investments | | | 818,524 | |
Net change in unrealized appreciation (depreciation) of investments | | | (14,747,595 | ) |
| | | | |
Net Realized and Unrealized Loss | | | (13,929,071 | ) |
| | | | |
Net Increase in Net Assets Resulting From Operations | | $ | 23,411,239 | |
| | | | |
See notes to financial statements.
36 Certified Semi-Annual Report
STATEMENTS OF CHANGES IN NET ASSETS
Thornburg Limited Term Municipal Fund
| | | | | | | | |
| | | Six Months Ended
March 31, 2010* | | | Year Ended
September 30, 2009 | |
INCREASE (DECREASE) IN NET ASSETS FROM: | | | | | | | | |
| | |
OPERATIONS: | | | | | | | | |
Net investment income | | $ | 37,340,310 | | | $ | 54,062,992 | |
Net realized gain (loss) on investments | | | 818,524 | | | | 424,567 | |
Increase (decrease) in unrealized appreciation (depreciation) of investments | | | (14,747,595 | ) | | | 94,999,972 | |
| | | | | | | | |
| | |
Net Increase (Decrease) in Net Assets Resulting from Operations | | | 23,411,239 | | | | 149,487,531 | |
| | |
DIVIDENDS TO SHAREHOLDERS: | | | | | | | | |
From net investment income | | | | | | | | |
Class A Shares | | | (16,774,771 | ) | | | (27,978,683 | ) |
Class C Shares | | | (3,403,574 | ) | | | (4,327,521 | ) |
Class I Shares | | | (17,161,965 | ) | | | (21,756,788 | ) |
FUND SHARE TRANSACTIONS (NOTE 4): | | | | | | | | |
Class A Shares | | | 332,165,166 | | | | 286,098,982 | |
Class C Shares | | | 143,856,238 | | | | 98,146,852 | |
Class I Shares | | | 482,237,161 | | | | 391,133,787 | |
| | | | | | | | |
| | |
Net Increase in Net Assets | | | 944,329,494 | | | | 870,804,160 | |
| | |
NET ASSETS: | | | | | | | | |
Beginning of Period | | | 2,113,407,564 | | | | 1,242,603,404 | |
| | | | | | | | |
| | |
End of Period | | $ | 3,057,737,058 | | | $ | 2,113,407,564 | |
| | | | | | | | |
| | |
Undistributed net investment income | | $ | 40,807 | | | $ | 40,807 | |
See notes to financial statements.
Certified Semi-Annual Report 37
| | |
| NOTES TO FINANCIAL STATEMENTS | | |
| |
| Thornburg Limited Term Municipal Fund | | March 31, 2010 (Unaudited) |
NOTE 1 – ORGANIZATION
Thornburg Limited Term Municipal Fund (the “Fund”) is a diversified series of Thornburg Investment Trust (the “Trust”). The Trust is organized as a Massachusetts business trust under a Declaration of Trust dated June 3, 1987 and is registered as a diversified, open-end management investment company under the Investment Company Act of 1940, as amended. The Fund is currently one of sixteen separate series of the Trust. Each series is considered to be a separate entity for financial reporting and tax purposes and bears expenses directly attributable to it. The Fund’s primary investment objective is to obtain as high a level of current income exempt from federal individual income taxes as is consistent, in the view of the Fund’s investment advisor, with the preservation of capital. The Fund’s secondary objective is to reduce expected changes in its share price compared to longer intermediate and long-term bond portfolios.
The Fund currently offers three classes of shares of beneficial interest: Class A, Class C, and Institutional Class (Class I) shares. Each class of shares of the Fund represents an interest in the same portfolio of investments, except that (i) Class A shares are sold subject to a front-end sales charge collected at the time the shares are purchased and bear a service fee, (ii) Class C shares are sold at net asset value without a sales charge at the time of purchase, but are subject to a contingent deferred sales charge upon redemption within one year of purchase, and bear both a service fee and a distribution fee, (iii) Class I shares are sold at net asset value without a sales charge at the time of purchase, and (iv) the respective classes may have different reinvestment privileges and conversion rights. Additionally, the Fund may allocate among its classes certain expenses, to the extent allowable to specific classes, including transfer agent fees, government registration fees, certain printing and postage costs, and administrative and legal expenses. Currently, class specific expenses of the Fund are limited to service and distribution fees, administration fees, and certain registration and transfer agent expenses.
NOTE 2 – SIGNIFICANT ACCOUNTING POLICIES
Significant accounting policies of the Trust are as follows:
Valuation of Investments: Debt obligations have a primary market over the counter and are valued by an independent pricing service approved by the Trustees of the Trust. The pricing service ordinarily values debt obligations at quoted bid prices. When quotations are not available, debt obligations are valued at evaluated prices determined by the pricing service using methods which include consideration of yields or prices of debt obligations of comparable quality, type of issue, coupon, maturity and rating, and indications as to value from dealers and general market conditions. Short-term obligations having remaining maturities of 60 days or less are valued at amortized cost, which approximates market value.
In any case where a pricing service fails to provide a price for a debt obligation held by the Fund, the valuation and pricing committee determines a fair value for the obligation using procedures approved by the Trustees. Additionally, in any case where management believes that a price provided by a pricing service for a debt obligation may be unreliable, the valuation and pricing committee decides whether or not to use the pricing service’s valuation or to determine a fair value for the obligation.
In determining fair value for any portfolio security or other investment, the valuation and pricing committee seeks to determine the amount that an owner of the investment might reasonably expect to receive upon a sale of the investment. However, because fair value prices are estimated prices, the valuation and pricing committee’s determination of fair value for an investment may differ from the value that would be realized by the Fund upon a sale of the investment, and that difference could be material to the Fund’s financial statements. The valuation and pricing committee’s determination of fair value for an investment may also differ from the prices obtained by other persons (including other mutual funds) for the investment.
Valuation Measurements: Various inputs are used in determining the value of the Fund’s investments. These inputs are summarized in the three levels listed below.
Level 1: Quoted prices in active markets for identical investments.
Level 2: Other significant observable inputs (including quoted prices for similar investments, interest rates, prepayment rates, credit risk, etc.).
Level 3: Significant unobservable inputs (including the Fund’s own assumptions in determining the fair value of investments).
38 Certified Semi-Annual Report
| | |
| NOTES TO FINANCIAL STATEMENTS, CONTINUED | | |
| |
| Thornburg Limited Term Municipal Fund | | March 31, 2010 (Unaudited) |
The following table displays a summary of the inputs used to value the Fund’s net assets as of March 31, 2010. In any instance when valuation inputs from more than one level are used to determine the fair value of a specific investment, the investment is placed in the level of the table based upon the lowest level input that is significant in determining the fair value of the investment:
| | | | | | | | | | | | |
| | | Fair Value Measurements at March 31, 2010 |
| | | Total | | Level 1 | | Level 2 | | Level 3 |
Assets | | | | | | | | | | | | |
Investments in Securities Municipal Bonds | | $ | 3,074,731,064 | | $ | — | | $ | 3,074,731,064 | | $ | — |
| | | | | | | | | | | | |
Total Investments in Securities | | $ | 3,074,731,064 | | $ | — | | $ | 3,074,731,064 | | $ | — |
Federal Income Taxes: It is the policy of the Trust to comply with the provisions of the Internal Revenue Code applicable to “regulated investment companies” and to distribute to shareholders substantially all taxable (if any) and tax exempt income of the Fund. Therefore, no provision for federal income tax is required.
When-Issued and Delayed Delivery Transactions: The Fund may engage in when-issued or delayed delivery transactions. To the extent the Fund engages in such transactions, it will do so for the purpose of acquiring portfolio securities consistent with the Fund’s investment objectives and not for the purpose of investment leverage or to speculate on interest rate and/or market changes. At the time the Fund makes a commitment to purchase a security on a when-issued or delayed delivery basis, the Fund will record the transaction and reflect the value in determining its net asset value. When effecting such transactions, assets of an amount sufficient to make payment for the portfolio securities to be purchased will be segregated on the Fund’s records on the trade date. Securities purchased on a when-issued or delayed delivery basis do not earn interest until the settlement date.
Dividends: Net investment income of the Fund is declared daily as a dividend on shares for which the Fund has received payment. Dividends are paid monthly and are reinvested in additional shares of the Fund at net asset value per share at the close of business on the dividend payment date, or at the shareholder’s option, paid in cash. Net realized capital gains, to the extent available, will be distributed at least annually.
General: Securities transactions are accounted for on a trade date basis. Interest income is accrued as earned. Premiums and discounts on securities purchased are amortized to call dates or maturity dates of the respective securities. Realized gains and losses from the sale of securities are recorded on an identified cost basis. Net investment income (other than class specific expenses) and realized and unrealized gains and losses are allocated daily to each class of shares based upon the relative net asset value of outstanding shares (or the value of the dividend-eligible shares, as appropriate) of each class of shares at the beginning of the day (after adjusting for the current capital shares activity of the respective class). Expenses common to all funds are allocated among the funds comprising the Trust based upon their relative net asset values or other appropriate allocation methods.
Guarantees and Indemnifications: Under the Trust’s organizational documents, its officers and Trustees are indemnified against certain liabilities arising out of the performance of their duties to the Fund. Additionally, in the normal course of business the Trust enters into contracts with service providers that contain general indemnification clauses. The Trust’s maximum exposure under these arrangements is unknown. However, based on experience, the Trust expects the risk of loss to be remote.
Use of Estimates: The preparation of financial statements, in conformity with generally accepted accounting principles, requires management to make estimates and assumptions that affect the reported amounts of assets and liabilities and the disclosure of contingent assets and liabilities at the date of the financial statements and the reported amounts of increases and decreases in net assets from operations during the reporting period. Actual results could differ from those estimates.
NOTE 3 – INVESTMENT ADVISORY FEE AND OTHER TRANSACTIONS WITH AFFILIATES
Pursuant to an investment advisory agreement, Thornburg Investment Management, Inc. (the “Advisor”) serves as the investment advisor and performs services to the Fund for which the fees are payable at the end of each month. For the six months ended March 31, 2010, these fees were payable at annual rates ranging from .50 of 1% to .225 of 1% per annum of the average daily net assets of the Fund depending on the Fund’s asset size. The Trust also has entered into administrative services agreements with the Advisor, whereby
Certified Semi-Annual Report 39
| | |
| NOTES TO FINANCIAL STATEMENTS, CONTINUED | | |
| |
| Thornburg Limited Term Municipal Fund | | March 31, 2010 (Unaudited) |
the Advisor will perform certain administrative services for the shareholders of each class of the Fund’s shares, and for which fees will be payable at an annual rate of up to .125 of 1% per annum of the average daily net assets attributable to each class of shares.
The Trust has an underwriting agreement with Thornburg Securities Corporation (the “Distributor,” an affiliate of the Advisor), which acts as the distributor of the Fund’s shares. For the six months ended March 31, 2010, the Distributor has advised the Fund that it earned commissions aggregating $17,518 from the sale of Class A shares, and collected contingent deferred sales charges aggregating $21,565 from redemptions of Class C shares of the Fund.
Pursuant to a service plan under Rule 12b-1 of the Investment Company Act of 1940, the Fund may reimburse to the Advisor an amount not to exceed .25 of 1% per annum of the average daily net assets attributable to each class of shares of the Fund for payments made by the Advisor to securities dealers and other financial institutions to obtain various shareholder and distribution related services. The Advisor may pay out of its own resources additional expenses for distribution of the Fund’s shares.
The Trust has also adopted distribution plans pursuant to Rule 12b-1, applicable only to the Fund’s Class C shares under which the Fund compensates the Distributor for services in promoting the sale of Class C shares of the Fund at an annual rate of up to .75 of 1% per annum of the average daily net assets attributable to Class C shares. Total fees incurred by the Distributor for each class of shares of the Fund under their respective Service and Distribution Plans and Class C distribution fees waived by the Distributor for the six months ended March 31, 2010, are set forth in the Statement of Operations. Distribution fees in the amount of $682,650 were waived for Class C shares.
The Trust has an agreement with the custodian bank to indirectly pay a portion of the custodian’s fees through credits earned by the Fund’s cash on deposit with the bank. This deposit agreement is an alternative to overnight investments. Custodial fees have been adjusted to reflect amounts that would have been paid without this agreement, with a corresponding adjustment reflected as fees paid indirectly in the Statement of Operations. For the six months ended March 31, 2010, there were no fees paid indirectly.
Certain officers and Trustees of the Trust are also officers and/or directors of the Advisor and Distributor. The compensation of independent Trustees is borne by the Trust.
NOTE 4 – SHARES OF BENEFICIAL INTEREST
At March 31, 2010, there were an unlimited number of shares of beneficial interest authorized. Transactions in shares of beneficial interest were as follows:
| | | | | | | | | | | | | | |
| | | Six Months Ended
March 31, 2010 (Unaudited) | | | Year Ended
September 30, 2009 (Audited) | |
| | | Shares | | | Amount | | | Shares | | | Amount | |
Class A Shares | | | | | | | | | | | | | | |
Shares sold | | 30,726,538 | | | $ | 427,990,981 | | | 30,849,769 | | | $ | 417,998,677 | |
Shares issued to shareholders in reinvestment of dividends | | 850,599 | | | | 11,840,315 | | | 1,454,357 | | | | 19,643,817 | |
Shares repurchased | | (7,729,056 | ) | | | (107,666,130 | ) | | (11,307,850 | ) | | | (151,543,512 | ) |
| | | | | | | | | | | | | | |
| | | | |
Net Increase (Decrease) | | 23,848,081 | | | $ | 332,165,166 | | | 20,996,276 | | | $ | 286,098,982 | |
| | | | | | | | | | | | | | |
| | | | |
Class C Shares | | | | | | | | | | | | | | |
Shares sold | | 11,392,059 | | | $ | 159,090,061 | | | 8,903,827 | | | $ | 120,924,995 | |
Shares issued to shareholders in reinvestment of dividends | | 160,279 | | | | 2,235,970 | | | 206,648 | | | | 2,800,254 | |
Shares repurchased | | (1,251,767 | ) | | | (17,469,793 | ) | | (1,900,973 | ) | | | (25,578,397 | ) |
| | | | | | | | | | | | | | |
| | | | |
Net Increase (Decrease) | | 10,300,571 | | | $ | 143,856,238 | | | 7,209,502 | | | $ | 98,146,852 | |
| | | | | | | | | | | | | | |
40 Certified Semi-Annual Report
| | |
| NOTES TO FINANCIAL STATEMENTS, CONTINUED | | |
| |
| Thornburg Limited Term Municipal Fund | | March 31, 2010 (Unaudited) |
| | | | | | | | | | | | | | |
| | | Six Months Ended
March 31, 2010 (Unaudited) | | | Year Ended
September 30, 2009 (Audited) | |
| | | Shares | | | Amount | | | Shares | | | Amount | |
Class I Shares | | | | | | | | | | | | | | |
Shares sold | | 47,035,151 | | | $ | 655,688,642 | | | 43,056,660 | | | $ | 582,984,830 | |
Shares issued to shareholders in reinvestment of dividends | | 1,024,813 | | | | 14,270,202 | | | 1,340,862 | | | | 18,142,630 | |
Shares repurchased | | (13,468,569 | ) | | | (187,721,683 | ) | | (15,632,398 | ) | | | (209,993,673 | ) |
| | | | | | | | | | | | | | |
Net Increase (Decrease) | | 34,591,395 | | | $ | 482,237,161 | | | 28,765,124 | | | $ | 391,133,787 | |
| | | | | | | | | | | | | | |
NOTE 5 – SECURITIES TRANSACTIONS
For the six months ended March 31, 2010, the Fund had purchase and sale transactions of investment securities (excluding short-term investments) of $1,088,957,398 and $214,574,976, respectively.
NOTE 6 – INCOME TAXES
At March 31, 2010, information on the tax components of capital is as follows:
| | | | |
Cost of investments for tax purposes | | $ | 3,003,707,453 | |
| | | | |
Gross unrealized appreciation on a tax basis | | $ | 77,578,006 | |
Gross unrealized depreciation on a tax basis | | | (6,554,395 | ) |
| | | | |
Net unrealized appreciation (depreciation) on investments (tax basis) | | $ | 71,023,611 | |
| | | | |
At March 31, 2010, the Fund had tax basis capital losses, which may be carried forward to offset future capital gains. To the extent such carryforwards are used, capital gain distributions may be reduced to the extent provided by regulations.
Such capital loss carryforwards expire as follows:
| | | |
2014 | | $ | 1,882,060 |
2015 | | | 2,811,143 |
2016 | | | 192,444 |
| | | |
| | $ | 4,885,647 |
| | | |
OTHER NOTES
Fund management believes no events have occurred between March 31, 2010 and May 20, 2010, the date of issuance of the financial statements, that require adjustment of, or disclosure in, the accompanying financial statements.
Certified Semi-Annual Report 41
FINANCIAL HIGHLIGHTS
Thornburg Limited Term Municipal Fund
| | | | | | | | | | | | | | | | | | | | | | | | | | | | | | | | | | | | | | | | |
| | | PER SHARE PERFORMANCE (for a share outstanding throughout the period) | | RATIOS TO AVERAGE NET ASSETS | | | SUPPLEMENTAL DATA |
Unless
Otherwise
Noted, Periods
are Fiscal Years
Ended Sept. 30, | | Net Asset
Value
Beginning
of Period | | Net
Investment
Income
(Loss) | | Net
Realized &
Unrealized
Gain (Loss)
on
Investments | | | Total from
Investment
Operations | | Dividends
from Net
Investment
Income | | | Dividends
from Net
Realized
Gains | | Total
Dividends | | | Net
Asset
Value
End
of
Period | | Net
Investment
Income
(Loss) (%) | | | Expenses,
After
Expense
Reductions
(%) | | | Expenses,
After
Expense
Reductions
and Net of
Custody
Credits
(%) | | | Expenses,
Before
Expense
Reductions
(%) | | | Total
Return
(%)(a) | | Portfolio
Turnover
Rate (%) | | Net Assets
at End of
Period
(Thousands) |
Class A Shares | | | | | | | | | | | | | | | | | | | | | | | | | | | | | | | | | | | | | | | | |
2010(b)(c) | | $ | 14.00 | | 0.20 | | (0.09 | ) | | 0.11 | | (0.20 | ) | | — | | (0.20 | ) | | $ | 13.91 | | 2.83 | (d) | | 0.78 | (d) | | 0.78 | (d) | | 0.78 | (d) | | 0.77 | | 9.24 | | $ | 1,366,313 |
2009(c) | | $ | 13.22 | | 0.47 | | 0.78 | | | 1.25 | | (0.47 | ) | | — | | (0.47 | ) | | $ | 14.00 | | 3.50 | | | 0.86 | | | 0.86 | | | 0.86 | | | 9.67 | | 12.18 | | $ | 1,040,628 |
2008(c) | | $ | 13.49 | | 0.48 | | (0.27 | ) | | 0.21 | | (0.48 | ) | | — | | (0.48 | ) | | $ | 13.22 | | 3.54 | | | 0.89 | | | 0.88 | | | 0.89 | | | 1.54 | | 17.78 | | $ | 705,238 |
2007(c) | | $ | 13.53 | | 0.46 | | (0.04 | ) | | 0.42 | | (0.46 | ) | | — | | (0.46 | ) | | $ | 13.49 | | 3.43 | | | 0.90 | | | 0.90 | | | 0.90 | | | 3.18 | | 21.35 | | $ | 696,717 |
2006(c) | | $ | 13.59 | | 0.44 | | (0.06 | ) | | 0.38 | | (0.44 | ) | | — | | (0.44 | ) | | $ | 13.53 | | 3.28 | | | 0.91 | | | 0.90 | | | 0.91 | | | 2.87 | | 23.02 | | $ | 833,189 |
2005(c) | | $ | 13.83 | | 0.40 | | (0.24 | ) | | 0.16 | | (0.40 | ) | | — | | (0.40 | ) | | $ | 13.59 | | 2.91 | | | 0.90 | | | 0.90 | | | 0.90 | | | 1.16 | | 27.80 | | $ | 967,650 |
Class C Shares | | | | | | | | | | | | | | | | | | | | | | | | | | | | | | | | | | | | | | | | |
2010(b) | | $ | 14.02 | | 0.17 | | (0.07 | ) | | 0.10 | | (0.18 | ) | | — | | (0.18 | ) | | $ | 13.94 | | 2.54 | (d) | | 1.05 | (d) | | 1.05 | (d) | | 1.56 | (d) | | 0.71 | | 9.24 | | $ | 349,321 |
2009 | | $ | 13.24 | | 0.43 | | 0.79 | | | 1.22 | | (0.44 | ) | | — | | (0.44 | ) | | $ | 14.02 | | 3.21 | | | 1.13 | | | 1.13 | | | 1.63 | | | 9.37 | | 12.18 | | $ | 206,952 |
2008 | | $ | 13.51 | | 0.44 | | (0.27 | ) | | 0.17 | | (0.44 | ) | | — | | (0.44 | ) | | $ | 13.24 | | 3.26 | | | 1.17 | | | 1.16 | | | 1.67 | | | 1.26 | | 17.78 | | $ | 99,972 |
2007 | | $ | 13.55 | | 0.43 | | (0.04 | ) | | 0.39 | | (0.43 | ) | | — | | (0.43 | ) | | $ | 13.51 | | 3.15 | | | 1.19 | | | 1.18 | | | 1.68 | | | 2.90 | | 21.35 | | $ | 86,564 |
2006 | | $ | 13.62 | | 0.41 | | (0.07 | ) | | 0.34 | | (0.41 | ) | | — | | (0.41 | ) | | $ | 13.55 | | 3.00 | | | 1.18 | | | 1.18 | | | 1.68 | | | 2.52 | | 23.02 | | $ | 105,436 |
2005 | | $ | 13.86 | | 0.36 | | (0.24 | ) | | 0.12 | | (0.36 | ) | | — | | (0.36 | ) | | $ | 13.62 | | 2.63 | | | 1.18 | | | 1.18 | | | 1.68 | | | 0.89 | | 27.80 | | $ | 140,606 |
Class I Shares | | | | | | | | | | | | | | | | | | | | | | | | | | | | | | | | | | | | | | | | |
2010(b) | | $ | 14.00 | | 0.22 | | (0.08 | ) | | 0.14 | | (0.22 | ) | | — | | (0.22 | ) | | $ | 13.92 | | 3.15 | (d) | | 0.45 | (d) | | 0.45 | (d) | | 0.45 | (d) | | 1.01 | | 9.24 | | $ | 1,342,103 |
2009 | | $ | 13.22 | | 0.51 | | 0.79 | | | 1.30 | | (0.52 | ) | | — | | (0.52 | ) | | $ | 14.00 | | 3.81 | | | 0.53 | | | 0.53 | | | 0.53 | | | 10.03 | | 12.18 | | $ | 865,827 |
2008 | | $ | 13.49 | | 0.52 | | (0.27 | ) | | 0.25 | | (0.52 | ) | | — | | (0.52 | ) | | $ | 13.22 | | 3.88 | | | 0.55 | | | 0.55 | | | 0.55 | | | 1.88 | | 17.78 | | $ | 437,393 |
2007 | | $ | 13.53 | | 0.51 | | (0.04 | ) | | 0.47 | | (0.51 | ) | | — | | (0.51 | ) | | $ | 13.49 | | 3.78 | | | 0.57 | | | 0.57 | | | 0.57 | | | 3.53 | | 21.35 | | $ | 303,716 |
2006 | | $ | 13.59 | | 0.49 | | (0.06 | ) | | 0.43 | | (0.49 | ) | | — | | (0.49 | ) | | $ | 13.53 | | 3.62 | | | 0.57 | | | 0.57 | | | 0.57 | | | 3.22 | | 23.02 | | $ | 285,878 |
2005 | | $ | 13.83 | | 0.44 | | (0.24 | ) | | 0.20 | | (0.44 | ) | | — | | (0.44 | ) | | $ | 13.59 | | 3.25 | | | 0.57 | | | 0.57 | | | 0.57 | | | 1.50 | | 27.80 | | $ | 290,369 |
| (a) | Not annualized for periods less than one year. |
| (b) | Unaudited Six Month Period Ended March 31. |
| (c) | Sales loads are not reflected in computing total return. |
See notes to financial statements.
| | |
| 42 Certified Semi-Annual Report | | Certified Semi-Annual Report 43 |
| | |
| EXPENSE EXAMPLE | | |
| |
| Thornburg Limited Term Municipal Fund | | March 31, 2010 (Unaudited) |
As a shareholder of the Fund, you incur two types of costs:
| | (1) | transaction costs, including |
(a) sales charges (loads) on purchase payments, for Class A shares;
(b) a deferred sales charge on redemptions of any part or all of a purchase of $1 million of Class A shares within 12 months of purchase;
(c) a deferred sales charge on redemptions of Class C shares within 12 months of purchase;
| | (2) | ongoing costs, including management fees; distribution and/or service (12b-1) fees; and other Fund expenses. |
This example is intended to help you understand your ongoing costs (in dollars) of investing in the Fund and to compare these costs with the ongoing costs of investing in other mutual funds.
The example is based on a $1,000 investment beginning on October 1, 2009, and held until March 31, 2010.
ACTUAL EXPENSES
For each class of shares, the first line of the table at right provides information about actual account values and actual expenses. You may use the information in this line, together with the amount you invested, to estimate the expenses that you paid over the period. Simply divide your account value by $1,000 (for example, an $8,600 account value divided by $1,000 = 8.6), then multiply the result by the number in the first line for your class of shares under the heading entitled “Expenses Paid During Period” to estimate the expenses you paid on your account during this period.
HYPOTHETICAL EXAMPLE FOR COMPARISON PURPOSES
For each class of shares, the second line of the table at right provides information about hypothetical account values and hypothetical expenses based on the Fund’s actual expense ratio and an assumed rate of return of 5% per year before expenses, which is not the Fund’s actual return. The hypothetical account values and expenses may not be used to estimate the actual ending account balance or expenses you paid for the period. You may use this information to compare the ongoing costs of investing in the Fund and other funds. To do so, compare this 5% hypothetical example with the 5% hypothetical examples that appear in the shareholder reports of the other funds.
| | | | | | | | | |
| �� | | Beginning
Account Value
10/1/09 | | Ending
Account Value
3/31/10 | | Expenses Paid
During Period†
10/1/09–3/31/10 |
Class A Shares | | | | | | | | | |
Actual | | $ | 1,000.00 | | $ | 1,007.70 | | $ | 3.91 |
Hypothetical* | | $ | 1,000.00 | | $ | 1,021.04 | | $ | 3.93 |
Class C Shares | | | | | | | | | |
Actual | | $ | 1,000.00 | | $ | 1,007.10 | | $ | 5.27 |
Hypothetical* | | $ | 1,000.00 | | $ | 1,019.68 | | $ | 5.31 |
Class I Shares | | | | | | | | | |
Actual | | $ | 1,000.00 | | $ | 1,010.10 | | $ | 2.24 |
Hypothetical* | | $ | 1,000.00 | | $ | 1,022.70 | | $ | 2.25 |
| † | Expenses are equal to the annualized expense ratio for each class (A: 0.78%; C: 1.05%; I: 0.45%) multiplied by the average account value over the period, multiplied by 182/365 to reflect the one-half year period. |
| * | Hypothetical assumes a rate of return of 5% per year before expenses. |
Please note that the expenses shown in the table are meant to highlight your ongoing costs only and do not reflect any transactional costs, such as sales charges (loads), redemption fees, or exchange fees. Therefore, the second line of the table for each class of shares is useful in comparing ongoing costs only, and will not help you determine the relative total costs of owning different funds. In addition, if these transactional costs were included, your costs would have been higher.
44 Certified Semi-Annual Report
| | |
| OTHER INFORMATION | | |
| |
| Thornburg Limited Term Municipal Fund | | March 31, 2010 (Unaudited) |
PORTFOLIO PROXY VOTING
Policies and Procedures:
The Trust has delegated to Thornburg Investment Management, Inc. (the “Advisor”) voting decisions respecting proxies for the Fund’s voting securities. The Advisor makes voting decisions in accordance with its Proxy Voting Policy and Procedures. A description of the Policy and Procedures is available (i) without charge, upon request, by calling the Advisor toll-free at 1-800-847-0200, (ii) on the Thornburg website at www.thornburg.com, and (iii) on the Securities and Exchange Commission’s website at www.sec.gov.
Information regarding how proxies were voted is available on or before August 31 of each year for the twelve months ending the preceding June 30. This information is available (i) without charge, upon request by calling the Advisor toll-free at 1-800-847-0200, (ii) on the Thornburg website at www.thornburg.com, and (iii) on the Securities and Exchange Commission’s website at www.sec.gov.
AVAILABILITY OF QUARTERLY PORTFOLIO SCHEDULE
The Fund files with the Securities and Exchange Commission schedules of its portfolio holdings on Form N-Q for the first and third quarters of each fiscal year. The Fund’s Forms N-Q are available on the Commission’s website at www.sec.gov, or may be reviewed and copied at the Commission’s Public Reference Room in Washington, D.C. Information on the operation of the Public Reference Room may be obtained by calling 1-800-SEC-0330. The Fund also makes this information available on its website at www.thornburg.com/ download or upon request by calling 1-800-847-0200.
Certified Semi-Annual Report 45
Trustees’ Statement to Shareholders
Not part of the Certified Semi-Annual Report
February 8, 2005, as readopted July 22, 2009
The Trustees are concerned that ongoing commentaries and opinions reported in the media may confuse investors in general as to the supervisory duties of trustees of mutual funds and, in particular, leave Thornburg Investment Trust shareholders uncertain regarding how we discharge our responsibilities in supervising the Funds’ investment advisor and in reviewing the advisor’s contract for renewal. We decided to spell out clearly three principal guidelines that we follow in supervising the Trust’s investment advisor on your behalf.
We begin with the premise that each shareholder selected his or her Fund because its investments are managed by the investment advisor identified in the prospectus and in accordance with the objective and policies described in the prospectus. We realize, as each of you do, that if you believe that your Fund’s stated objective and policies no longer serve your personal investment goals, you can sell your shares and leave the Fund.
Therefore, we believe that our primary supervisory task – our principal obligation to you – is to assess the nature and quality of the advisor’s services, and to confirm that the advisor actively and competently pursues the Fund’s objective, in accordance with the policies set out in the prospectus. To do this, we meet regularly with management to review your Fund’s portfolio and to discuss the advisor’s specific actions and judgments in pursuing the Fund’s objective. We do not substitute our own judgment for the advisor’s decisions in selecting investments; the advisor is paid to exercise its informed judgment on investment decisions, and we seek to confirm, in reviewing the advisor’s performance, that the advisor is doing just that.
Second, while we are conscious of costs and the effect that costs have on shareholders’ returns, we do not seek the lowest fees or expense ratio as our sole or primary objective. We try to make sure that your Fund’s fees and costs are reasonable in relationship to the services rendered and that they are generally in line with those charged by other expert investment advisors, consistent with our belief that the Fund’s investors searched for and expect that expertise and attention and have decided to pay a reasonable price for it. We do not put the management contract “out to bid” as a matter of course, and we would not do so unless we had concluded that the advisor materially had failed to pursue the Fund’s objectives in accordance with its policies, or for other equally important reasons. We believe that any other approach would be inconsistent with your interests and contrary to your expectations when you bought shares of the Fund in the first place.
Finally, because we believe that most Thornburg Fund shareholders have invested with a long-term perspective, we try not to focus too much on the fashions of the moment and on short-term performance. The market will not favor any specific investment objective or set of policies at all times and under all economic circumstances. A fund will experience periods of both high and low returns relative to other funds and other investments. Even if one of our Funds is not favored by the market at a particular time, we believe that the advisor is nonetheless obliged to remain true to the Fund’s objective and policies, and we watch to see that it does so.
46 This page is not part of the Semi-Annual Report.
This page intentionally left blank.
This page is not part of the Semi-Annual Report. 47
This page intentionally left blank.
48 This page is not part of the Semi-Annual Report.
Retirement and Education Accounts
Thornburg Investment Management offers retirement and education savings accounts that can help you meet a variety of planning challenges. For account applications or further information on any of the accounts below, please call 1-800-847-0200 or go to www.thornburg.com/ira. Your financial advisor can help you determine which plan is right for you.
Individual Retirement Accounts
Individual Retirement Accounts (IRAs) provide a tax-advantaged means to save money for the future. For a detailed outline of the difference between retirement accounts, see www.thornburg.com/ira. Rollovers are available. Call 1-800-847-0200 for more information.
Traditional IRAs – Contributions to Traditional IRAs are tax deductible for eligible individuals, and withdrawals are taxed as additional ordinary income. You may contribute to an IRA if you receive compensation and are under 70 1/ 2, even if you are covered by an employer retirement plan. Deductible contributions are subject to certain qualifications. Please consult your tax advisor.
Roth IRAs – Under a Roth IRA, there is no tax deduction for contributions, but there is no income tax on qualified withdrawals. For a more detailed comparison of Traditional and Roth IRAs, please see our web site at www.thornburg.com/ira.
SEP IRAs – Simplified Employee Pension (SEP) IRAs are established by employers. The employer is allowed a tax deduction for contributions made to the SEP Plan and makes contributions to each eligible employee’s SEP IRA on a discretionary basis.
SIMPLE IRAs – Savings Incentive Match Plan for Employees of Small Employers (SIMPLE) is designed to give small business owners a simplified method to establish and contribute to a retirement plan for employees. The employer is allowed a tax deduction for contributions and makes either matching or non-elective contributions to each eligible employee’s SIMPLE IRA. Employees may make salary deferral contributions.
Coverdell Education Savings Account
These savings accounts are designed to provide a way to save money for higher education expenses. In an Education Savings Account, earnings and interest grow tax-free, and qualified withdrawals used to pay for eligible higher-education expenses are tax- and penalty-free.
Funds Available
The following funds are available in the accounts listed above:
| | • | | Thornburg International Value Fund |
| | • | | Thornburg Core Growth Fund |
| | • | | Thornburg Investment Income Builder Fund |
| | • | | Thornburg Global Opportunities Fund |
| | • | | Thornburg International Growth Fund |
| | • | | Thornburg Developing World Fund |
| | • | | Thornburg Limited Term U.S. Government Fund |
| | • | | Thornburg Limited Term Income Fund |
| | • | | Thornburg Strategic Income Fund |
This page is not part of the Semi-Annual Report. 49

50 This page is not part of the Semi-Annual Report.
Thornburg Equity Funds
Thornburg’s equity research uses a fundamental and comprehensive analytical approach. Thornburg equity funds focus on a limited number of securities so that each holding can impact performance. The equity team searches for firms believed to have a promising future and seeks to buy shares of those companies at a discount to their intrinsic value.
| | • | | Thornburg International Value Fund |
| | • | | Thornburg Core Growth Fund |
| | • | | Thornburg Investment Income Builder Fund |
| | • | | Thornburg Global Opportunities Fund |
| | • | | Thornburg International Growth Fund |
| | • | | Thornburg Developing World Fund |
Thornburg Bond Funds
Thornburg Investment Management applies a disciplined philosophy to fixed-income management. Since the launch of our first fixed-income fund over 25 years ago, we have been conducting fundamental, bottom-up research in an effort to identify bonds which we believe provide the best return for a given level of risk. We are very organic in our approach, avoiding leverage or complex strategies which could backfire in periods of market uncertainty.
| | • | | Thornburg Limited Term Municipal Fund |
| | • | | Thornburg Intermediate Municipal Fund |
| | • | | Thornburg California Limited Term Municipal Fund |
| | • | | Thornburg New Mexico Intermediate Municipal Fund |
| | • | | Thornburg New York Intermediate Municipal Fund |
| | • | | Thornburg Strategic Municipal Income Fund |
| | • | | Thornburg Limited Term U.S. Government Fund |
| | • | | Thornburg Limited Term Income Fund |
| | • | | Thornburg Strategic Income Fund |
Before investing, carefully consider the Fund’s investment goals, risks, charges, and expenses. For a prospectus containing this and other information, contact your financial advisor or visit thornburg.com. Read it carefully before investing.
For additional information, please visit www.thornburg.com
Thornburg Investment Management, Inc. 2300 North Ridgetop Road, Santa Fe, NM 87506
This page is not part of the Semi-Annual Report. 51
| | | | | | |
 | | Waste not, | | 
|
| | Wait not | |
| | | | Get instant access to your shareholder reports. |
| | |
| | This Semi-Annual Report is submitted for the general information of shareholders of the Fund. It is not authorized for distribution to prospective investors in the Fund unless preceded or accompanied by an effective prospectus. | | By switching from your postal mailbox to your email inbox, you reduce paper clutter, improve record keeping access, and help conserve our natural resources. |

| | Investment Advisor: | | Go to www.thornburg.com/edelivery and sign up to receive your shareholder reports, prospectuses, and proxy statements electronically. |
| | Thornburg Investment Management® 800.847.0200 | |
| | Distributor: | | |
| | Thornburg Securities Corporation® 800.847.0200 | | You invest in the future, without spending a dime. |
| | TH1072 | | |

2 This page is not part of the Semi-Annual Report.
Important Information
The information presented on the following pages was current as of March 31, 2010. The managers’ views, portfolio holdings, and sector diversification are provided for the general information of the Fund’s shareholders; they are historical and subject to change. This material should not be deemed a recommendation to buy or sell any of the securities mentioned.
Investments in the Fund carry risks, including possible loss of principal. Bond funds have the same interest rate, inflation, and credit risks that are associated with the underlying bonds. The principal value of bonds will fluctuate relative to changes in interest rates, decreasing when interest rates rise. Unlike bonds, bond funds have ongoing fees and expenses. Please see the Fund’s Prospectus for a discussion of the risks associated with an investment in the Fund. Investments in the Fund are not FDIC insured, nor are they deposits of or guaranteed by a bank or any other entity. There is no guarantee that the Fund will meet its investment objectives. The laddering strategy does not assure or guarantee better performance and cannot eliminate the risk of investment losses.
Performance data given at net asset value (NAV) does not take into account applicable sales charges. If the sales charges had been included, the performance would have been lower.
Minimum investments for Class I shares are higher than those for other classes. Class I shares may not be available to all investors.
| | | | |
Share Class | | NASDAQ Symbol | | Cusip |
| Class A | | THIMX | | 885-215-202 |
| Class C | | THMCX | | 885-215-780 |
| Class I | | THMIX | | 885-215-673 |
Lipper’s 2008
Best Fixed-Income Fund Family
Thornburg Investment Management ranked #1 out of 41 eligible firms in Lipper, Inc.’s fixed income large firm universe for the three-year period ended 12/31/07, based on risk-adjusted returns. Past performance does not guarantee future results.
Lipper’s large firm universe is comprised of fund families with more than $28 billion in total net assets. Only fund families with at least five bond funds were eligible. Risk-adjusted returns were calculated with dividends reinvested and without sales charges. We did not win this award in 2009 or 2010.
Glossary
Bank of America (BofA) Merrill Lynch 7-12 Year Municipal Bond Index – The BofA Merrill Lynch 7-12 Year Municipal Bond Index represents a broad measure of market performance. It is a model portfolio of municipal obligations throughout the U.S., with an average maturity which ranges from seven to twelve years.
Unless otherwise noted, index returns reflect the reinvestment of income dividends and capital gains, if any, but do not reflect fees, brokerage commissions or other expenses of investing. Investors may not make direct investments into any index.
Alternative Minimum Tax (AMT) – A federal tax aimed at ensuring that high-income individuals, estates, trusts, and corporations pay a minimal level income tax. For individuals, the AMT is calculated by adding tax preference items to regular taxable income.
Annualized Distribution Yield – The distribution yield is calculated by taking the sum of the month’s total distribution factors and dividing this sum by a 30-day period and annualizing to a 360-day year. The value is then divided by the ending maximum offering price per share to arrive at the annualized distribution yield. The yield is calculated on a periodic basis and is subject to change.
Bond Credit Ratings – A bond credit rating assesses the financial ability of a debt issuer to make timely payments of principal and interest. Ratings of AAA (the highest), AA, A, and BBB are investment-grade quality. Ratings of BB, B, CCC, CC, C, and D (the lowest) are considered below investment grade, speculative grade, or junk bonds. Unless otherwise noted, the ratings listed are from Municipal Market Data and are a combination of ratings from Standard and Poor’s, Moody’s Investors Service, and Fitch Ratings.
Duration – The weighted maturity of a bond’s cash flows. Duration measures the price sensitivity of a bond for a given change in interest rates. Bonds with longer durations experience greater price volatility than bonds with shorter durations.
Fed Funds Rate – The Fed Funds Rate is the interest rate at which a depository institution lends immediately available funds (balances at the Federal Reserve) to another depository institution overnight.
General Obligation (GO) Bonds – A municipal bond secured by the pledge of the issuer’s full faith, credit, and taxing power rather than the revenue from a given project.
Revenue Bond – A bond on which the debt service is payable solely from the revenue generated from the operation of the project being financed or a category of facilities, or from other non-tax sources.
SEC Yield – SEC Yield is computed in accordance with SEC standards measuring the net investment income per share over a specified 30-day period expressed as a percentage of the maximum offering price of the Fund’s shares at the end of the period.
This page is not part of the Semi-Annual Report. 3
Thornburg Intermediate Municipal Fund
At Thornburg, our approach to management of the Fund is based on the premise that investors in the Fund seek preservation of capital along with an attractive, relatively stable yield. While aggressive bond strategies may generate stronger returns when the market is turning a blind eye towards risk, they usually fail to stack up over longer periods of time. Our patience and diligence was recognized by Lipper in 2008 with the Best Fixed-Income Fund Family Award.
We apply time-tested techniques to manage risk and provide attractive returns. These include:
| | • | | Building a laddered portfolio. Laddering has been shown over time to mitigate price and interest rate risk. |
| | • | | Investing on a cash-only basis without using leverage. While leveraged strategies may enhance returns when market conditions are favorable, they can quickly compound losses when sentiment shifts. |
| | • | | Conducting in-depth fundamental research on each issue and actively monitoring positions for subsequent credit events. |
| | • | | Diversifying among a large number of generally high-quality bonds. |
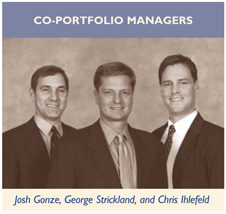
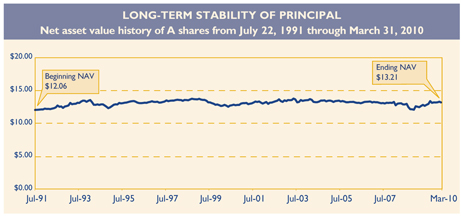
IMPORTANT PERFORMANCE INFORMATION
Performance data shown represents past performance and is no guarantee of future results. Investment return and principal value will fluctuate so shares, when redeemed, may be worth more or less than their original cost. Current performance may be lower or higher than quoted. For performance current to the most recent month end, visit thornburg.com.
The maximum sales charge for the Fund’s Class A shares is 2.00%. The total annual fund operating expense of Class A shares is 0.98%, as disclosed in the most recent Prospectus.
AVERAGE ANNUAL TOTAL RETURNS
For periods ended March 31, 2010
| | | | | | | | | | | | | | | |
| | | 1 Yr | | | 3 Yrs | | | 5 Yrs | | | 10 Yrs | | | Since
Inception | |
A Shares (Incep: 7/22/91) | | | | | | | | | | | | | | | |
Without sales charge | | 10.26 | % | | 4.05 | % | | 3.88 | % | | 4.44 | % | | 5.21 | % |
With sales charge | | 8.09 | % | | 3.36 | % | | 3.46 | % | | 4.23 | % | | 5.10 | % |
30-DAY YIELDS, A SHARES
As of March 31, 2010
| | | | |
Annualized
Distribution Yield | | | SEC
Yield | |
| 3.50 | % | | 2.85 | % |
KEY PORTFOLIO ATTRIBUTES
As of March 31, 2010
| | |
Number of Bonds | | 344 |
Duration | | 4.8 Yrs |
Average Maturity | | 8.2 Yrs |
See the entire portfolio in the Schedule of Investments beginning on page 10.
4 This page is not part of the Semi-Annual Report.
THORNBURG INTERMEDIATE MUNICIPAL FUND VERSUS
LIPPER TAX-EXEMPT MONEY MARKET FUNDS AVERAGE
Class A shares as of March 31, 2010
We are often asked to compare Thornburg Intermediate Municipal Fund to money market fund returns. Municipal bond funds are not an exact substitute for money market funds. These investments have certain differences, which are summarized below. Investors in the Thornburg Intermediate Municipal Fund took more risk than tax-exempt money market fund investors to earn their higher returns.
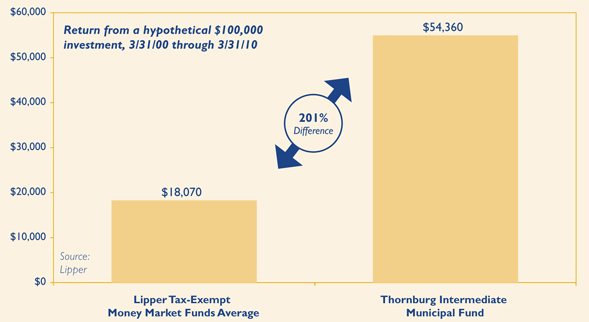
Past performance does not guarantee future results. Performance data above does not include the 2.00% sales charge for Class A shares. If the sales charge had been included, returns would have been lower. Returns shown are minus the initial investment.
Investors in municipal bond funds may experience more volatility than those in comparable money market funds. There are also differences in fees and expenses.
Investors in the Thornburg Intermediate Municipal Fund took more risk than money market investors to earn their higher returns, including interest rate and credit risk. Unlike money market funds, the prices of bonds fluctuate relative to changes in interest rates, with principal values decreasing when interest rates rise and increasing when interest rates fall. Generally, money market funds seek to maintain an investment portfolio with an average maturity of 90 days or less. Thornburg Intermediate Municipal Fund has an aver-age maturity of normally between three and ten years. Interest dividends paid by the Fund or by tax-exempt money market funds are generally exempt from federal income tax (may be subject to AMT). Income sourced from state of residency is generally exempt from state income tax.
Money market funds seek to preserve the value per share at $1.00, whereas the Thornburg Intermediate Municipal Fund’s net asset value changes daily. It is possible to lose money when investing in either the Thornburg Intermediate Municipal Fund or a tax-exempt money market fund. Neither are insured by the FDIC or any other government agency.
Lipper Tax-Exempt Money Market Funds Average is an arithmetic average of the total return of all tax-exempt money market mutual funds. You cannot invest in a category average.
This page is not part of the Semi-Annual Report. 5

Thornburg Intermediate Municipal Fund
March 31, 2010
Table of Contents
This report is certified under the Sarbanes-Oxley Act of 2002, which requires that public companies, including mutual funds, affirm that the information provided in their annual and semiannual shareholder reports fully and fairly represents their financial position.
6 Certified Semi-Annual Report
Letter to Shareholders
| | |
 | | April 15, 2010 |
| | Dear Fellow Shareholder: |
| | We are pleased to present the semi-annual report for the Thornburg Intermediate Municipal Fund. The net asset value of the Class A shares declined by 19 cents to $13.21 during the six months ended March 31, 2010. If you were with us for the entire period, you received dividends of 25.5 cents per share. If you reinvested your dividends, you received 25.7 cents per share. Dividends per share were lower for Class C shares and higher for Class I shares to account for varying class- specific expenses. |
| | After a couple of years of unprecedented volatility, the municipal bond market has regained its status as one of the least exciting U.S. capital markets. While we embrace the new reality – slow and steady is what we strive for – we do not entirely trust it. Like other U.S. markets, the municipal market is benefiting from U.S. Treasury and Federal Reserve Bank support. By setting the Fed Funds Rate effectively at 0%, the Federal Open Market Committee (FOMC) is basically pushing hundreds of billions of dollars into bonds and bond funds. Flows into bond funds were $357 billion last year and may reach that level again this year. While we do not expect the Federal Reserve (the Fed) to hike the Fed Funds Rate soon, it is a reasonable bet that the next move will not be down. A significantly higher Fed Funds Rate, if and when it materializes, would likely not be good for bond fund flows or bond prices. |
| | The second major element of federal support has been the implementation of the Build America Bond (BAB) program. This program allows municipalities to issue taxable bonds for qualified projects and receive a subsidy of 35% of their interest cost from the federal government. The program has been very popular, with almost $100 billion issued since the first deal was sold in April 2009. BAB issues currently account for over 30% of new issue municipal bond supply, crowding out much of the supply of traditional tax-exempt bonds. The reduced supply, coupled with heavy demand for bonds has provided significant support to municipal bond prices. The BAB program is scheduled to expire at the end of this year, but will probably be extended, most likely with a reduced subsidy. Depending upon the final form of the program, we may see the balance shift back to more traditional tax-exempt issuance in 2011, which could erode some support for bond prices. |
| | Another part of the American Recovery and Reinvestment Act allocated approximately $280 billion to the states for various stimulus-related projects. The federal dollars helped the states close over $300 billion of budget gaps during the current recession, but most of that money will be spent by June 30, 2011. If tax revenues come back strongly over the next 12-24 months, the disappearing stimulus money may not be missed. However, if tax revenues are slow to bounce back, budget balancing will remain a perilous task. |
| | Working in the opposite direction, higher tax rates should bolster demand for tax-exempt municipals, as Bush tax cuts expire and the highest marginal tax rates climb back up to 39.6% from 35%. |
Certified Semi-Annual Report 7
Letter to Shareholders,
Continued
On top of this, the recently signed health insurance reform law applies Medicare taxes to virtually all investment income except interest from tax-exempt municipal bonds. We believe that the status of municipal bonds as perhaps the last true legal tax shelter available to investors is not fully priced into the market.
The U.S. economy apparently hit bottom last summer and has been growing the last three quarters. However, payroll employment growth just showed up last month, and so many jobs were lost in the last two years that it will take several years of robust growth just to get back down to six percent unemployment. Most banks are still very reluctant to increase lending, and core consumer price inflation has slowed to a level not seen since 1960. So, despite the large amount of additional debt (particularly from the U.S. Treasury) coming into the marketplace, we don’t expect a dramatic rise in interest rates this year.
After three quarters of positive GDP growth, state tax revenues are still falling. The fourth quarter of 2009 marks the fifth consecutive quarter of declining state tax revenues. The rate of decline has moderated to 4.2% from a peak of 16.5% in the second quarter, but state tax revenues are still down over eight percent from levels two years ago. Prior to the current downturn, state tax revenues grew 5 to 5.5% on average for two decades, allowing budgets and entitlements to expand at an unsustainable pace. Most states are going through a very difficult adjustment process and dealing with shrinking tax revenues in very different ways. In general, we have favored states that set aside large reserve balances when times were better, and cut budgets and/or found new ongoing revenue streams when tax revenues declined. A few states have primarily added to debt loads, borrowed from future revenues, delayed payments and pension contributions, or used other accounting gimmicks to balance their budgets. These states seem to be making the assumption that tax revenues will bounce back strongly. There has been some recent improvement in revenues from some states in the early months of 2010, but it is still too early to count on. We will have to watch the numbers carefully to determine if the more aggressive states get bailed out by rapid revenue growth or end up confronting even worse challenges ahead.
Tax revenues have held up much better at the local level, not yet going negative and growing 4.6% in the fourth quarter of 2009. Most local governments rely heavily on property taxes, which have traditionally been quite stable, and have proven to be so even in the worst real estate downturn in decades. Real estate taxes take a while to adjust and there are some areas of the country that are starting to see significantly lower tax revenues as properties make their way through the appeal process. We are watching these trends as they develop. Revenue bonds such as municipal utility bonds, hospital bonds, and toll roads have generally held up quite well in the current recession, and we continue to find issuers we like in these sectors. Hospitals, in particular, appear to be one of the few clear winners coming out of the recent health care reform law.
Despite much improved market liquidity, strong demand for bonds, and general economic optimism, it is a clearly a time for careful diligence and diversification of investment portfolios. Your Fund is broadly diversified and 75% invested in bonds rated A or above by at least one of the major rating agencies. Your Thornburg Intermediate Municipal Fund is a laddered portfolio of over 340 municipal obligations from 44 states. We ladder the maturity dates of the bonds in your portfolio so that some of the bonds are scheduled to mature during each of the coming years. Laddering intermediate bonds accomplishes two goals. First, the staggered bond maturities contained in a ladder defuse interest-rate risk and dampen the Fund’s price volatility. Second, laddering gives the Fund a steady cash flow stream from maturing bonds to reinvest toward the top of the ladder where yields are typically higher. The chart on the next page describes the percentages of your Fund’s bond portfolio maturing in each of the coming years.
8 Certified Semi-Annual Report
The Class A shares of your Fund produced a total return of 0.50% (at NAV) over the six-month period ended March 31, 2010, compared to a negative 0.13% return for the BofA Merrill Lynch 7-12 Year Municipal Bond Index. Over the last six months, 1-5 year bonds outperformed longer term bonds, and revenue bonds generally outperformed general obligation bonds. The Fund’s overweight of revenue bonds and short term bonds relative to the index contributed to its outperformance.
Historically, our practice of laddering a diversified portfolio of short and intermediate maturity municipal bonds has allowed your Fund to perform consistently well in varying interest rate environments.
Thank you for investing in Thornburg Intermediate Municipal Fund.
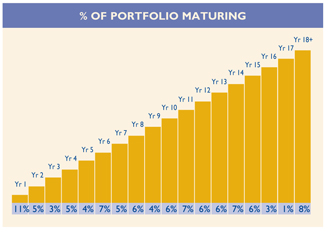
As of 3/31/10. Percentages vary over time.
Data may not add up to 100% due to rounding.
| | | | |
| Sincerely, | | | | |
| | |
 | |  | |  |
| George Strickland | | Josh Gonze | | Christopher Ihlefeld |
| Co-Portfolio Manager | | Co-Portfolio Manager | | Co-Portfolio Manager |
| Managing Director | | Managing Director | | Managing Director |
The matters discussed in this report may constitute forward-looking statements made pursuant to the safe harbor provisions of the Securities Litigation Reform Act of 1995. These include any advisor or portfolio manager prediction, assessment, analysis or outlook for individual securities, industries, investment styles, market sectors and/or markets. These statements involve risks and uncertainties. In addition to the general risks described for each fund in its current prospectus, other factors bearing on these reports include the accuracy of the advisor’s or portfolio manager’s forecasts and predictions, the appropriateness of the investment strategies designed by the advisor or portfolio manager and the ability of the advisor or portfolio manager to implement their strategies efficiently and successfully. Any one or more of these factors, as well as other risks affecting the securities markets generally, could cause the actual results of any fund to differ materially as compared to its benchmarks.
Certified Semi-Annual Report 9
| | |
| SCHEDULE OF INVESTMENTS | | |
| |
| Thornburg Intermediate Municipal Fund | | March 31, 2010 (Unaudited) |
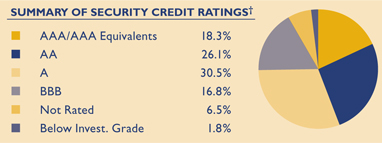
We have used ratings from Standard & Poor’s (S&P). Where S&P ratings are not available, we have used Moody’s Investors Service. Where neither rating is available, we have used ratings from Fitch Ratings. The category of investments identified as “AAA” in this graph includes investments which are pre-refunded or escrowed to maturity. Such investments are backed by an escrow or trust containing sufficient U.S. Government or U.S. Government agency securities to satisfy the timely payment of principal and interest and, therefore, are normally deemed to be equivalent to AAA-rated securities.
| | | | | | | | |
Issuer-Description | | Credit Rating†
S&P/ Moody’s | | Principal
Amount | | Value |
ALABAMA — 0.33% | | | | | | | | |
University of Alabama at Birmingham Hospital Revenue, 5.25% due 9/1/2025 | | A+/A1 | | $ | 2,000,000 | | $ | 2,039,020 |
ALASKA — 0.50% | | | | | | | | |
Alaska Municipal Bond Bank, 5.00% due 10/1/2017 (Insured: FGIC) | | A+/A1 | | | 2,470,000 | | | 2,632,427 |
Anchorage GO, 6.00% due 10/1/2012 (Insured: Natl-Re/FGIC) | | AA/NR | | | 365,000 | | | 391,087 |
ARIZONA — 2.41% | | | | | | | | |
Arizona Health Facilities Authority, 5.00% due 1/1/2011 (Banner Health System) | | A+/NR | | | 1,000,000 | | | 1,032,100 |
Arizona Health Facilities Authority, 5.00% due 7/1/2017 (Catholic Healthcare West) | | A/A2 | | | 1,450,000 | | | 1,525,473 |
Mohave County IDA, 7.25% due 5/1/2015 (Mohave Prison LLC) | | BBB+/NR | | | 4,640,000 | | | 4,925,963 |
Phoenix Civic Improvement Corp., 5.00% due 7/1/2017 (Insured: Natl-Re) | | AA/Aa3 | | | 1,000,000 | | | 1,107,750 |
Pima County IDA, 6.70% due 7/1/2021 (Arizona Charter Schools) | | NR/Baa3 | | | 2,615,000 | | | 2,539,217 |
Salt Verde Financial Corp. Gas Revenue, 5.25% due 12/1/2022 | | A/A3 | | | 2,000,000 | | | 1,972,400 |
Salt Verde Financial Corp. Gas Revenue, 5.25% due 12/1/2028 | | A/A3 | | | 500,000 | | | 476,520 |
Tucson GO, 9.75% due 7/1/2012 (ETM) | | AA-/NR | | | 400,000 | | | 477,548 |
Tucson GO, 9.75% due 7/1/2013 (ETM) | | AA-/NR | | | 500,000 | | | 633,235 |
CALIFORNIA — 11.02% | | | | | | | | |
California Department of Water Resources, 0.32% due 5/1/2022 put 4/8/2010 (Insured: AGM) (weekly demand notes) | | AAA/Aa3 | | | 1,150,000 | | | 1,150,000 |
California Educational Facilities Authority, 5.50% due 4/1/2029 (Pitzer College) | | NR/A3 | | | 3,000,000 | | | 3,114,540 |
California GO, 0.29% due 5/1/2034 put 4/8/2010 (Various Kindergarten; LOC: Citibank/ California State Teachers Retirement) (weekly demand notes) | | A+/Aaa | | | 5,200,000 | | | 5,200,000 |
California HFA, 5.125% due 7/1/2022 (Catholic Healthcare West) | | A/A2 | | | 1,120,000 | | | 1,163,960 |
California HFA, 0% due 8/1/2029 (Insured: AMBAC/FHA/VA) | | AA-/Aa3 | | | 7,000,000 | | | 2,211,300 |
California PCR, 5.35% due 12/1/2016 (Pacific Gas & Electric) (AMT) | | A/A3 | | | 2,740,000 | | | 2,824,611 |
California State Economic Recovery GO, 5.00% due 7/1/2016 | | A+/A1 | | | 3,400,000 | | | 3,520,258 |
California State Public Works Board Lease, 5.00% due 6/1/2017 (Regents of University of California; Insured: FGIC) | | AA-/Aa2 | | | 2,000,000 | | | 2,213,180 |
California Statewide Community Development Authority, 6.25% due 8/15/2028 (Enloe Medical Center; Insured: CA Mtg Insurance) | | A-/NR | | | 1,050,000 | | | 1,086,530 |
a California Statewide Community Development Authority, 6.00% due 7/1/2030 (Aspire Public Schools) | | NR/NR | | | 7,045,000 | | | 7,044,225 |
Carson Redevelopment Agency Tax Allocation, 6.25% due 10/1/2022 (Project Area 1) | | A-/NR | | | 1,620,000 | | | 1,715,612 |
Carson Redevelopment Agency Tax Allocation, 6.375% due 10/1/2024 (Project Area 1) | | A-/NR | | | 1,300,000 | | | 1,373,060 |
El Camino Hospital District, 6.25% due 8/15/2017 (ETM) | | NR/NR | | | 1,000,000 | | | 1,155,330 |
Golden West Schools Financing Authority, 0% due 8/1/2018 (Insured: Natl-Re) | | A/Baa1 | | | 2,140,000 | | | 1,328,812 |
Lee Lake Water District Community Facilities, 5.75% due 9/1/2023 | | NR/NR | | | 3,000,000 | | | 2,599,290 |
10 Certified Semi-Annual Report
| | |
| SCHEDULE OF INVESTMENTS, CONTINUED | | |
| |
| Thornburg Intermediate Municipal Fund | | March 31, 2010 (Unaudited) |
| | | | | | | | |
Issuer-Description | | Credit Rating†
S&P/ Moody’s | | Principal
Amount | | Value |
Los Angeles Department of Water & Power, 0.27% due 7/1/2034 put 4/1/2010 (SPA: Bank of America N.A.) (daily demand notes) | | AA-/Aa3 | | $ | 2,500,000 | | $ | 2,500,000 |
Los Angeles Regional Airport Improvement Corp., 5.00% due 1/1/2017 (LAX Fuel Corp.; Insured: AGM) (AMT) | | AAA/Aa3 | | | 1,120,000 | | | 1,165,494 |
M-S-R Energy Authority, 6.125% due 11/1/2029 | | A/NR | | | 2,500,000 | | | 2,582,325 |
Merced Redevelopment Agency, 6.25% due 9/1/2029 (Gateways Redevelopment) | | A-/NR | | | 1,500,000 | | | 1,538,520 |
Mojave USD COP, 0% due 9/1/2021 (Insured: AGM) | | AAA/NR | | | 1,095,000 | | | 585,924 |
Mojave USD COP, 0% due 9/1/2023 (Insured: AGM) | | AAA/NR | | | 1,100,000 | | | 514,602 |
Monterey County COP, 5.25% due 8/1/2021 (Refinancing Project; Insured: AGM) | | AAA/Aa3 | | | 3,700,000 | | | 4,016,313 |
Redwood City Redevelopment Agency, 0% due 7/15/2023 (Redevelopment Area A-2; Insured: AMBAC) | | A-/NR | | | 2,060,000 | | | 887,160 |
San Diego County Regional Transportation, 0.32% due 4/1/2038 put 4/1/2010 (SPA: Dexia) (daily demand notes) | | AAA/Aa2 | | | 4,900,000 | | | 4,900,000 |
San Francisco City & County Airports, 6.50% due 5/1/2019 put 5/1/2010 (International Airport) | | A/A1 | | | 2,000,000 | | | 2,009,600 |
San Mateo USD GO, 0% due 9/1/2019 (Insured: FGIC) | | AA/Aa2 | | | 3,000,000 | | | 1,963,950 |
Southeast Resource Recovery Facilities Authority, 5.375% due 12/1/2013 (Insured: AMBAC) (AMT) | | A+/A2 | | | 1,000,000 | | | 1,073,100 |
Tuolumne Wind Project Authority, 5.875% due 1/1/2029 (Tuolumne Co.) | | A+/A1 | | | 3,000,000 | | | 3,248,010 |
Victor Elementary School District GO, 0% due 8/1/2025 (Insured: FGIC) | | A+/A2 | | | 1,535,000 | | | 586,861 |
Washington USD COP, 5.00% due 8/1/2022 (New High School; Insured: AMBAC) | | A/NR | | | 2,010,000 | | | 1,988,734 |
COLORADO — 4.28% | | | | | | | | |
Adams County, 5.00% due 8/1/2014 (Platte Valley Medical Center; Insured: Natl-Re/FHA 242) | | A/NR | | | 1,000,000 | | | 1,085,320 |
Adams County Communication Center COP, 5.75% due 12/1/2016 | | NR/Baa1 | | | 1,265,000 | | | 1,291,982 |
Colorado Educational & Cultural Facilities, 5.25% due 8/15/2019 (Peak to Peak Charter School; Insured: Syncora) | | A/NR | | | 1,375,000 | | | 1,409,581 |
Colorado HFA, 5.75% due 1/15/2022 (Vail Valley Medical Center) | | BBB+/NR | | | 1,380,000 | | | 1,388,239 |
Denver City & County Airport, 5.50% due 11/15/2015 (Insured: FGIC) (AMT) | | A+/A1 | | | 5,000,000 | | | 5,288,900 |
Denver City & County Housing Authority, 5.20% due 11/1/2027 (Three Towers Rehabilitation; Insured: AGM) (AMT) | | NR/Aa3 | | | 2,555,000 | | | 2,520,150 |
El Paso County School District GO, 7.10% due 12/1/2013 (State Aid Withholding) | | AA-/Aa3 | | | 500,000 | | | 595,430 |
Madre Metropolitan District GO, 5.375% due 12/1/2026 | | NR/NR | | | 2,215,000 | | | 1,559,338 |
Murphy Creek Metropolitan District GO, 6.00% due 12/1/2026 | | NR/NR | | | 2,000,000 | | | 1,107,220 |
North Range Metropolitan District GO, 5.00% due 12/15/2021 (Insured: ACA) | | NR/NR | | | 1,500,000 | | | 1,242,810 |
Northwest Parkway Public Highway Authority, 0% due 6/15/2014 (Insured: AGM) (ETM) | | AAA/Aa3 | | | 1,005,000 | | | 1,067,702 |
Park Creek Metropolitan District, 5.25% due 12/1/2020 (Insured: AGM) | | AAA/NR | | | 1,120,000 | | | 1,239,123 |
Plaza Metropolitan District Public Improvement Fee/Tax Increment, 7.70% due 12/1/2017 | | NR/NR | | | 2,500,000 | | | 2,520,700 |
Public Authority for Colorado Energy Gas Revenue, 6.125% due 11/15/2023 | | A/A2 | | | 2,000,000 | | | 2,148,640 |
Southlands Metropolitan District GO, 7.00% due 12/1/2024 pre-refunded 12/1/2014 | | AAA/NR | | | 1,370,000 | | | 1,686,415 |
CONNECTICUT — 0.21% | | | | | | | | |
Connecticut Health & Educational Facility Authority, 5.75% due 7/1/2029 (Ethel Walker School) | | BBB-/NR | | | 1,350,000 | | | 1,295,285 |
DISTRICT OF COLUMBIA — 2.51% | | | | | | | | |
District of Columbia Association of American Medical Colleges, 5.00% due 2/15/2017 (Insured: AMBAC) | | AA/Aa2 | | | 1,000,000 | | | 1,112,570 |
District of Columbia COP, 5.25% due 1/1/2014 (Insured: FGIC) | | A/A2 | | | 2,000,000 | | | 2,182,880 |
District of Columbia COP, 5.00% due 1/1/2020 (Insured: FGIC) | | A/A2 | | | 3,900,000 | | | 4,063,722 |
District of Columbia GO, 6.00% due 6/1/2015 (Insured: Natl-Re) | | A+/A1 | | | 3,000,000 | | | 3,489,870 |
Metropolitan Airports Authority, 0% due 10/1/2023 (Dulles Toll Road; Insured: AGM) | | AAA/Aa3 | | | 4,890,000 | | | 2,285,293 |
Metropolitan Airports Authority, 0% due 10/1/2024 (Dulles Toll Road; Insured: AGM) | | AAA/Aa3 | | | 5,000,000 | | | 2,176,800 |
Certified Semi-Annual Report 11
| | |
| SCHEDULE OF INVESTMENTS, CONTINUED | | |
| |
| Thornburg Intermediate Municipal Fund | | March 31, 2010 (Unaudited) |
| | | | | | | | |
Issuer-Description | | Credit Rating†
S&P/ Moody’s | | Principal
Amount | | Value |
FLORIDA — 9.43% | | | | | | | | |
Broward County Housing Finance Authority MFR, 5.40% due 10/1/2011 (Pembroke Park Apartments; Guaranty: Florida Housing Finance Corp.) (AMT) | | NR/NR | | $ | 160,000 | | $ | 161,192 |
Broward County School Board COP, 5.00% due 7/1/2020 (Insured: AGM) | | AAA/Aa3 | | | 1,000,000 | | | 1,046,870 |
Collier County Housing Finance Authority MFR, 4.90% due 2/15/2032 put 2/15/2012 (Goodlette Arms; Collateralized: FNMA) | | NR/Aaa | | | 1,000,000 | | | 1,050,230 |
Crossings at Fleming Island Community Development, 5.60% due 5/1/2012 (Insured: Natl-Re) | | A/Baa1 | | | 740,000 | | | 748,614 |
Enterprise Community Development District Assessment Bonds, 6.00% due 5/1/2010 (Insured: Natl-Re) | | A/Baa1 | | | 305,000 | | | 306,171 |
Escambia County HFA, 5.95% due 7/1/2020 (Florida Health Care Facility Loan; Insured: AMBAC) | | NR/NR | | | 2,665,000 | | | 2,701,724 |
Flagler County School Board COP, 5.00% due 8/1/2020 (Insured: AGM) | | AAA/Aa3 | | | 2,560,000 | | | 2,650,240 |
Florida Board of Education GO Capital Outlay, 9.125% due 6/1/2014 | | AAA/Aa1 | | | 720,000 | | | 807,718 |
Florida Board of Education GO Capital Outlay, 5.75% due 6/1/2018 | | AAA/Aa1 | | | 1,460,000 | | | 1,485,944 |
Florida Housing Finance Corp., 5.40% due 4/1/2014 pre-refunded 10/1/2010 (Augustine Club Apartments; Insured: Natl-Re) | | NR/Aaa | | | 415,000 | | | 433,853 |
Florida Housing Finance Corp. Homeowner Mtg, 4.80% due 1/1/2016 | | AA+/Aa1 | | | 225,000 | | | 230,333 |
Florida Municipal Loan Council, 5.00% due 10/1/2024 (Insured: Natl-Re) | | A/Baa1 | | | 2,235,000 | | | 2,305,470 |
Florida State Department of Children & Families COP, 5.00% due 10/1/2018 (South Florida Evaluation Treatment) | | AA+/NR | | | 2,090,000 | | | 2,205,995 |
Florida State Department of Children & Families COP, 5.00% due 10/1/2019 (South Florida Evaluation Treatment) | | AA+/NR | | | 2,255,000 | | | 2,357,422 |
Florida State Department of Environmental Protection, 5.00% due 7/1/2017 (Florida Forever; Insured: FGIC) | | AA-/A1 | | | 1,000,000 | | | 1,061,080 |
Highlands County HFA, 5.00% due 11/15/2019 (Adventist Health Hospital) | | AA-/A1 | | | 875,000 | | | 900,900 |
Highlands County HFA, 5.00% due 11/15/2019 (Adventist Health Hospital) | | AA-/A1 | | | 1,100,000 | | | 1,132,560 |
Hillsborough County IDA PCR, 5.10% due 10/1/2013 (Tampa Electric Co.) | | BBB/Baa1 | | | 1,000,000 | | | 1,062,880 |
Hillsborough County Special Assessment, 5.00% due 3/1/2017 (Insured: FGIC) | | A+/A3 | | | 1,000,000 | | | 1,042,660 |
Hollywood Community Redevelopment Agency, 5.00% due 3/1/2021 (Insured: Syncora) | | NR/Baa1 | | | 3,000,000 | | | 2,851,950 |
Jacksonville HFA Hospital, 5.75% due 8/15/2014 pre-refunded 8/15/2011 | | NR/NR | | | 1,000,000 | | | 1,058,250 |
Lee County Solid Waste System, 5.625% due 10/1/2013 (Insured: Natl-Re) | | NR/A3 | | | 2,400,000 | | | 2,505,504 |
Manatee County, 5.00% due 10/1/2016 (Insured: AMBAC) | | AA-/Aa3 | | | 1,000,000 | | | 1,081,720 |
Marion County Hospital District, 5.00% due 10/1/2022 (Munroe Regional Health) | | NR/A3 | | | 1,000,000 | | | 985,390 |
Miami Dade County GO, 6.25% due 7/1/2026 (Building Better Communities) | | AA-/Aa3 | | | 2,130,000 | | | 2,420,809 |
bMiami Dade County School Board COP, 5.00% due 10/1/2021 (Insured: AMBAC) | | A/A3 | | | 3,035,000 | | | 3,088,719 |
Miami Dade County School Board COP, 5.25% due 5/1/2022 (Insured: AGM) | | AAA/Aa3 | | | 2,600,000 | | | 2,786,680 |
Miami GO, 5.375% due 9/1/2015 (Insured: Natl-Re) | | A+/A2 | | | 1,000,000 | | | 1,086,040 |
Orange County HFA, 6.25% due 10/1/2013 (Orlando Regional Hospital; Insured: Natl-Re) | | A/A2 | | | 440,000 | | | 488,954 |
Orange County HFA, 5.125% due 6/1/2014 (Mayflower Retirement; Insured: Radian) | | NR/NR | | | 1,000,000 | | | 1,003,370 |
Orange County HFA, 6.25% due 10/1/2016 (Orlando Regional Hospital; Insured: Natl-Re) | | A/A2 | | | 1,515,000 | | | 1,686,801 |
Orange County HFA, 6.375% due 11/15/2020 pre-refunded 11/15/2010 (Adventist Health Systems) | | NR/A1 | | | 1,000,000 | | | 1,046,610 |
South Miami HFA, 5.00% due 8/15/2022 (Baptist Health Group) | | AA-/Aa3 | | | 1,500,000 | | | 1,533,315 |
St. Johns County IDA, 5.85% due 8/1/2024 (Presbyterian Retirement) | | NR/NR | | | 4,885,000 | | | 4,764,389 |
Tampa Bay Water Utilities System Revenue, 5.50% due 10/1/2022 (Insured: FGIC) | | AA+/Aa3 | | | 2,750,000 | | | 3,192,420 |
Tampa Health Systems, 5.50% due 11/15/2013 (Catholic Health East Group; Insured: Natl-Re) | | A/Aa3 | | | 1,050,000 | | | 1,161,982 |
University of Central Florida COP Convocation Corp., 5.00% due 10/1/2019 (Insured: FGIC) | | A/NR | | | 1,135,000 | | | 1,153,807 |
GEORGIA — 1.14% | | | | | | | | |
Atlanta Water and Wastewater, 5.50% due 11/1/2022 (Insured: Natl-Re/FGIC) | | A/Baa1 | | | 530,000 | | | 569,220 |
Atlanta Water and Wastewater, 5.50% due 11/1/2024 (Insured: AGM) | | AAA/Aa3 | | | 5,000,000 | | | 5,369,450 |
Atlanta Airport Revenue, 6.00% due 1/1/2018 (Insured: FGIC) (AMT) | | A+/A1 | | | 1,000,000 | | | 1,010,910 |
12 Certified Semi-Annual Report
| | |
| SCHEDULE OF INVESTMENTS, CONTINUED | | |
| |
| Thornburg Intermediate Municipal Fund | | March 31, 2010 (Unaudited) |
| | | | | | | | |
Issuer-Description | | Credit Rating†
S&P/ Moody’s | | Principal
Amount | | Value |
HAWAII — 0.28% | | | | | | | | |
Hawaii Department of Budget & Finance, 6.40% due 7/1/2013 (Kapiolani Health Care; Insured: Natl-Re) | | A/Baa1 | | $ | 1,645,000 | | $ | 1,704,746 |
IDAHO — 0.83% | | | | | | | | |
Boise City IDRB Corp., 5.00% due 5/15/2020 (Western Trailer Co.; LOC: Wells Fargo) (AMT) | | NR/Aa2 | | | 2,000,000 | | | 2,007,320 |
Madison County Hospital Revenue, 5.25% due 9/1/2030 | | BBB-/NR | | | 1,000,000 | | | 902,540 |
Madison County Hospital Revenue, 5.25% due 9/1/2037 | | BBB-/NR | | | 2,500,000 | | | 2,165,100 |
ILLINOIS — 7.69% | | | | | | | | |
Chicago Midway Airport Second Lien, 5.00% due 1/1/2019 (Insured: AMBAC) (AMT) | | A-/A3 | | | 1,210,000 | | | 1,217,526 |
Chicago O’Hare International Airport Revenue Second Lien, 5.75% due 1/1/2018 (Insured: AMBAC) (AMT) | | A-/A2 | | | 3,050,000 | | | 3,159,282 |
Chicago Tax Increment, 6.25% due 11/15/2013 (Near South Redevelopment; Insured: ACA) | | NR/NR | | | 1,500,000 | | | 1,544,790 |
Chicago Tax Increment, 0% due 11/15/2014 (Near South Redevelopment; Insured: ACA) | | NR/NR | | | 1,340,000 | | | 1,026,038 |
Chicago Tax Increment Allocation, 5.30% due 1/1/2014 (Lincoln Belmont; Insured: ACA) | | NR/NR | | | 2,285,000 | | | 2,273,301 |
Cook County School District GO, 0% due 12/1/2022 (ETM) | | NR/NR | | | 2,000,000 | | | 1,196,400 |
Illinois DFA, 6.00% due 11/15/2012 (Adventist Health Group; Insured: Natl-Re) | | AA/Baa1 | | | 2,860,000 | | | 2,944,141 |
Illinois Educational Facilities Authority, 5.00% due 11/1/2016 (Rush University Medical Center) | | A/A3 | | | 1,000,000 | | | 1,055,150 |
Illinois Educational Facilities Authority, 5.625% due 10/1/2022 (Augustana College) | | NR/Baa1 | | | 1,000,000 | | | 1,014,990 |
Illinois Educational Facilities Authority, 5.75% due 11/1/2028 (Rush University Medical Center) | | A/A3 | | | 1,000,000 | | | 1,031,360 |
Illinois Finance Authority, 5.00% due 11/1/2016 (Cent Dupage Health) | | AA/NR | | | 2,000,000 | | | 2,163,980 |
Illinois Finance Authority, 5.00% due 11/1/2017 (Cent Dupage Health) | | AA/NR | | | 2,000,000 | | | 2,154,040 |
Illinois Finance Authority, 5.00% due 8/1/2022 (Bradley University; Insured: Syncora) | | A/NR | | | 1,000,000 | | | 1,037,200 |
b Illinois Finance Authority, 6.125% due 11/1/2023 (Advocate Health) | | AA/Aa2 | | | 5,000,000 | | | 5,494,550 |
Illinois Finance Authority, 5.00% due 2/1/2027 (Newman Foundation; Insured: Radian) | | NR/NR | | | 1,220,000 | | | 1,039,830 |
Illinois HFA, 6.00% due 7/1/2011 (Loyola University Health Systems; Insured: Natl-Re) | | A/Baa1 | | | 1,370,000 | | | 1,437,623 |
Illinois HFA, 6.00% due 7/1/2012 (Loyola University Health Systems; Insured: Natl-Re) (ETM) | | A/NR | | | 230,000 | | | 255,847 |
Illinois HFA, 6.00% due 7/1/2012 (Loyola University Health Systems; Insured: Natl-Re) | | A/Baa1 | | | 1,080,000 | | | 1,166,098 |
Illinois HFA, 5.70% due 2/20/2021 (Midwest Care Center; Collateralized: GNMA) | | NR/Aaa | | | 805,000 | | | 829,070 |
Melrose Park Tax Increment, 6.50% due 12/15/2015 (Insured: AGM) | | AAA/Aa3 | | | 1,015,000 | | | 1,051,926 |
Sangamon County School District COP, 5.875% due 8/15/2018 (Hay Edwards; Insured: ACA) | | NR/NR | | | 2,300,000 | | | 2,212,393 |
Sherman Mtg, 6.10% due 10/1/2014 (Villa Vianney Health Care; Collateralized: FHA/GNMA) | | AAA/NR | | | 1,170,000 | | | 1,196,255 |
Sherman Mtg, 6.20% due 10/1/2019 (Villa Vianney Health Care; Collateralized: FHA/GNMA) | | AAA/NR | | | 1,600,000 | | | 1,634,208 |
Southern Illinois University, 0% due 4/1/2014 (Insured: Natl-Re) | | A/A3 | | | 1,425,000 | | | 1,255,810 |
Southwestern Illinois Development Authority, 0% due 12/1/2024 (Insured: AGM) | | AAA/NR | | | 2,975,000 | | | 1,438,561 |
Tazewell County School District GO, 9.00% due 12/1/2024 (Insured: FGIC) | | NR/A3 | | | 1,205,000 | | | 1,782,484 |
University of Illinois, 0% due 4/1/2014 (Insured: Natl-Re) | | A/Aa3 | | | 1,590,000 | | | 1,448,426 |
Will County Community School District GO, 0% due 11/1/2011 (Insured: AGM) | | AAA/Aa3 | | | 2,965,000 | | | 2,897,042 |
INDIANA — 5.05% | | | | | | | | |
Allen County Economic Development, 5.80% due 12/30/2012 (Indiana Institute of Technology) | | NR/NR | | | 895,000 | | | 906,420 |
Allen County Economic Development, 5.75% due 12/30/2015
(Indiana Institute of Technology) | | NR/NR | | | 1,355,000 | | | 1,362,561 |
Allen County Jail Building Corp., 5.00% due 4/1/2018 (Insured: Syncora) | | NR/Aa3 | | | 2,495,000 | | | 2,696,396 |
Allen County Redevelopment District, 5.00% due 11/15/2018 | | NR/A3 | | | 1,560,000 | | | 1,644,334 |
Boone County Hospital Association, 5.625% due 1/15/2015 pre-refunded 7/15/2011 (Insured: FGIC) | | A+/NR | | | 1,000,000 | | | 1,064,220 |
Carmel Redevelopment Authority Lease, 0% due 2/1/2016 (Performing Arts Center) | | AA+/Aa2 | | | 1,730,000 | | | 1,411,144 |
Carmel Redevelopment Authority Lease, 0% due 2/1/2021 (Performing Arts Center) | | AA+/Aa2 | | | 2,000,000 | | | 1,208,840 |
Clay Multi School Building Corp., 4.00% due 7/15/2013 (First Mortgage) | | AA+/NR | | | 1,290,000 | | | 1,368,316 |
Clay Multi School Building Corp., 5.00% due 1/15/2018 (First Mortgage) | | AA+/NR | | | 1,735,000 | | | 1,919,101 |
Fort Wayne Redevelopment Authority, 5.00% due 8/1/2023 (Harrison Square; Insured: AGM) | | NR/Aa3 | | | 2,290,000 | | | 2,440,842 |
Certified Semi-Annual Report 13
| | |
| SCHEDULE OF INVESTMENTS, CONTINUED | | |
| |
| Thornburg Intermediate Municipal Fund | | March 31, 2010 (Unaudited) |
| | | | | | | | |
Issuer-Description | | Credit Rating†
S&P/ Moody’s | | Principal
Amount | | Value |
Goshen Chandler School Building, 0% due 1/15/2011 (Insured: Natl-Re; State Aid Withholding) | | A/Baa1 | | $ | 1,020,000 | | $ | 1,007,209 |
Indiana Bond Bank, 5.25% due 4/1/2023 (Hendricks Regional; Insured: AMBAC) | | AA/NR | | | 2,000,000 | | | 2,183,540 |
Indiana Bond Bank Gas Program Revenue, 5.25% due 10/15/2020 | | NR/Aa3 | | | 5,000,000 | | | 5,062,900 |
Indiana HFA, 5.75% due 9/1/2015 (Methodist Hospital) (ETM) | | AAA/A3 | | | 575,000 | | | 587,725 |
Noblesville Redevelopment Authority, 5.00% due 8/1/2017 (146th Street Extension) | | AA-/NR | | | 1,000,000 | | | 1,081,670 |
Noblesville Redevelopment Authority, 5.00% due 8/1/2020 (146th Street Extension) | | AA-/NR | | | 1,000,000 | | | 1,055,640 |
Vanderburgh County Redevelopment District Tax Increment, 5.00% due 2/1/2020 | | A/NR | | | 1,000,000 | | | 1,018,950 |
Vincennes University, 5.375% due 6/1/2022 (Student Fee) | | NR/A1 | | | 895,000 | | | 981,708 |
West Clark School Building Corp. First Mtg, 5.75% due 7/15/2017 (Insured: FGIC; State Aid Withholding) | | AA+/NR | | | 1,685,000 | | | 1,811,577 |
IOWA — 1.31% | | | | | | | | |
Coralville COP, 5.25% due 6/1/2022 | | NR/A3 | | | 2,980,000 | | | 3,033,133 |
Iowa Finance Authority, 6.00% due 7/1/2012 (Trinity Regional Hospital; Insured: AGM) | | AAA/Aa3 | | | 635,000 | | | 671,944 |
Iowa Finance Authority, 6.00% due 7/1/2013 (Genesis Medical Center) | | NR/A1 | | | 1,000,000 | | | 1,007,710 |
Iowa Finance Authority, 5.75% due 12/1/2015 (Trinity Health) | | AA/Aa2 | | | 1,250,000 | | | 1,284,088 |
Iowa Finance Authority, 6.00% due 12/1/2018 (Catholic Health Initiatives) | | AA/Aa2 | | | 2,000,000 | | | 2,026,700 |
KANSAS — 0.19% | | | | | | | | |
Wyandotte County School District GO, 5.00% due 9/1/2014 (Insured: FGIC) | | NR/A3 | | | 1,030,000 | | | 1,152,251 |
KENTUCKY — 0.94% | | | | | | | | |
Kentucky EDA, 5.85% due 10/1/2015 (Norton Healthcare; Insured: Natl-Re) | | A/Baa1 | | | 2,665,000 | | | 2,868,100 |
Kentucky EDA, 0% due 10/1/2024 (Norton Healthcare; Insured: Natl-Re) | | A/Baa1 | | | 3,000,000 | | | 1,268,040 |
Kentucky EDA, 5.75% due 12/1/2028 (Louisville Arena; Insured: AGM) | | AAA/Aa3 | | | 1,500,000 | | | 1,632,195 |
LOUISIANA — 2.77% | | | | | | | | |
Louisiana Local Government Environment Facilities Authority, 5.00% due 3/1/2014 (Independence Stadium) | | A/NR | | | 1,000,000 | | | 1,072,100 |
Louisiana Public Facilities Authority, 5.00% due 7/1/2022 (Black & Gold Facilities; Insured: CIFG) | | BBB-/Baa3 | | | 1,500,000 | | | 1,477,620 |
Morehouse Parish PCR, 5.25% due 11/15/2013 (International Paper Co.) | | BBB/Baa3 | | | 3,000,000 | | | 3,121,050 |
New Orleans Aviation Board, 5.25% due 1/1/2018 (Insured: AGM) (AMT) | | AAA/Aa3 | | | 1,000,000 | | | 1,031,370 |
New Orleans Aviation Board, 5.25% due 1/1/2020 (Insured: AGM) | | AAA/Aa3 | | | 2,000,000 | | | 2,169,220 |
Plaquemines Parish Law Enforcement District GO, 5.00% due 9/1/2023 | | BBB+/NR | | | 1,230,000 | | | 1,213,051 |
Plaquemines Parish Law Enforcement District GO, 5.00% due 9/1/2025 | | BBB+/NR | | | 1,350,000 | | | 1,318,329 |
Plaquemines Parish Law Enforcement District GO, 5.15% due 9/1/2027 | | BBB+/NR | | | 1,490,000 | | | 1,456,430 |
Plaquemines Parish Law Enforcement District GO, 5.30% due 9/1/2029 | | BBB+/NR | | | 1,650,000 | | | 1,607,001 |
St. Tammany Parish Sales Tax Revenue, 5.00% due 6/1/2019 (Insured: CIFG) | | A+/NR | | | 1,300,000 | | | 1,382,953 |
St. Tammany Parish Sales Tax Revenue, 5.00% due 6/1/2020 (Insured: CIFG) | | A+/NR | | | 1,000,000 | | | 1,055,940 |
MASSACHUSETTS — 0.68% | | | | | | | | |
Massachusetts Health & Educational Facilities Authority, 0.27% due 8/15/2034 put 4/1/2010 (Tufts University; SPA: Bank of America N.A.) (daily demand notes) | | AA-/Aa2 | | | 2,400,000 | | | 2,400,000 |
Massachusetts Health & Educational Facilities Authority, 0.30% due 12/1/2037 put 4/1/2010 (Museum of Fine Arts; SPA: Bank of America N.A.) (daily demand notes) | | AA/Aa2 | | | 700,000 | | | 700,000 |
Massachusetts Health & Educational Facilities Authority, 0.28% due 8/15/2040 put 4/1/2010 (Tufts University; SPA: JPMorgan Chase Bank) (daily demand notes) | | AA-/Aa2 | | | 125,000 | | | 125,000 |
Massachusetts Housing Finance Agency, 5.05% due 6/1/2010 (Insured: Natl-Re) (AMT) | | A/Baa1 | | | 290,000 | | | 291,105 |
Massachusetts Housing Finance Agency, 6.125% due 12/1/2011 (Insured: Natl-Re) (AMT) | | NR/Baa1 | | | 610,000 | | | 611,501 |
14 Certified Semi-Annual Report
| | |
| SCHEDULE OF INVESTMENTS, CONTINUED | | |
| |
| Thornburg Intermediate Municipal Fund | | March 31, 2010 (Unaudited) |
| | | | | | | | |
Issuer-Description | | Credit Rating†
S&P/ Moody’s | | Principal
Amount | | Value |
MICHIGAN — 4.29% | | | | | | | | |
Detroit Water Supply Systems, 5.00% due 7/1/2015 (Insured: AGM) | | AAA/Aa3 | | $ | 1,000,000 | | $ | 1,084,800 |
Kalamazoo Hospital Finance Authority, 6.25% due 6/1/2014 (Borgess Medical Center) (ETM) | | AAA/Aaa | | | 650,000 | | | 760,513 |
Kalamazoo Hospital Finance Authority, 5.00% due 5/15/2019 (Bronson Hospital; Insured: AGM) | | AAA/Aa3 | | | 1,500,000 | | | 1,560,315 |
Kent Hospital Finance Authority, 7.25% due 1/15/2013 (Butterworth Hospital; Insured: Natl-Re) | | AA/A2 | | | 490,000 | | | 533,042 |
Michigan Higher Education Student Loan Authority, 3.95% due 3/1/2011 (AMT) | | AA/A1 | | | 750,000 | | | 733,163 |
Michigan Public Educational Facilities Authority, 5.50% due 9/1/2022 (Black River School) | | NR/NR | | | 1,110,000 | | | 941,335 |
Michigan Public Educational Facilities Authority, 8.50% due 9/1/2029 (Bradford Academy) | | BBB-/NR | | | 1,500,000 | | | 1,664,970 |
Michigan State Building Authority, 5.25% due 10/15/2017 (Insured: AGM) | | AAA/Aa3 | | | 2,450,000 | | | 2,602,194 |
Michigan State Building Authority, 0% due 10/15/2025 (Insured: FGIC) | | A+/A1 | | | 6,000,000 | | | 2,502,300 |
Michigan State Hospital Finance Authority, 5.10% due 6/1/2013 (McLaren Health Care) | | NR/Aa3 | | | 1,000,000 | | | 1,003,830 |
Michigan State Hospital Finance Authority, 5.00% due 11/15/2024 (Sparrow Obligated Group) | | A+/A1 | | | 2,140,000 | | | 2,111,495 |
Michigan State Hospital Finance Authority, 5.00% due 7/15/2025 (Oakwood Obligated Group) | | A/A2 | | | 3,000,000 | | | 2,857,620 |
Michigan State Housing Development Authority, 5.05% due 10/1/2015 (Insured: Natl-Re) | | AA/Baa1 | | | 1,400,000 | | | 1,407,868 |
Michigan Strategic Fund, 5.25% due 10/15/2023 (Michigan House of Representatives Facilities; Insured: AGM) | | AAA/Aa3 | | | 1,000,000 | | | 1,070,520 |
Royal Oak Hospital Finance Authority, 5.25% due 8/1/2016 (William Beaumont Hospital) | | A/A1 | | | 2,000,000 | | | 2,127,040 |
Royal Oak Hospital Finance Authority, 8.00% due 9/1/2029 (William Beaumont Hospital) | | A/A1 | | | 2,500,000 | | | 2,938,525 |
Southfield Economic Development Corp., 7.25% due 12/1/2010 (N.W. 12 LP; Transcon Builders, Inc.) | | NR/NR | | | 270,000 | | | 268,380 |
MINNESOTA — 1.08% | | | | | | | | |
Minneapolis St. Paul Health, 6.00% due 12/1/2018 (Healthpartners Obligated Group) | | BBB/Baa1 | | | 1,000,000 | | | 1,029,000 |
Minnesota Agriculture & Economic Development Board, 5.50% due 2/15/2025 (Essentia Healthcare; Insured: AGM) | | AAA/NR | | | 2,500,000 | | | 2,658,400 |
St. Cloud Health Care Revenue, 5.00% due 5/1/2014 (Centracare Health System) | | NR/A2 | | | 835,000 | | | 910,117 |
St. Paul Housing & Redevelopment Authority, 5.25% due 5/15/2020 (Healthpartners Obligated Group) | | NR/Baa1 | | | 1,965,000 | | | 1,972,506 |
MISSISSIPPI — 1.83% | | | | | | | | |
Medical Center Educational Building Corp., 3.00% due 6/1/2011 (Univerisity of Mississippi Medical Center) | | AA-/Aa3 | | | 1,750,000 | | | 1,788,098 |
Medical Center Educational Building Corp., 4.00% due 6/1/2014 (University of Mississippi Medical Center) | | AA-/Aa3 | | | 1,240,000 | | | 1,326,527 |
Mississippi Business Finance Corp., 0.34% due 12/1/2030 put 4/1/2010 (Chevron USA Inc; Guaranty Agreement: Chevron Corp.) (daily demand notes) | | AA/Aa1 | | | 700,000 | | | 700,000 |
Mississippi Development Bank Special Obligation, 5.00% due 7/1/2022 (Canton Public Improvement) | | NR/NR | | | 1,935,000 | | | 1,878,788 |
Mississippi Development Bank Special Obligation, 5.00% due 7/1/2027 (Lowndes County Industrial Development; Insured: AGM) | | AAA/Aa3 | | | 2,500,000 | | | 2,559,325 |
Mississippi Development Bank Special Obligation Municipal Energy Agency Power Supply, 5.00% due 3/1/2018 (Insured: Syncora) | | NR/Baa2 | | | 1,920,000 | | | 1,938,509 |
Mississippi Development Bank Special Obligation Municipal Energy Agency Power Supply, 5.00% due 3/1/2020 (Insured: Syncora) | | NR/Baa2 | | | 1,000,000 | | | 991,480 |
MISSOURI — 0.94% | | | | | | | | |
Kansas City Tax Increment Financing Commission, 5.00% due 3/1/2012 (Maincor) | | NR/NR | | | 620,000 | | | 622,443 |
Missouri Development Finance Board, 5.00% due 4/1/2019 (Eastland Center) | | A/NR | | | 1,000,000 | | | 1,038,250 |
Missouri Development Finance Board, 5.00% due 4/1/2021 (Eastland Center) | | A/NR | | | 2,000,000 | | | 2,048,620 |
Missouri Development Finance Board, 5.125% due 4/1/2022 (Eastland Center) | | A/NR | | | 2,000,000 | | | 2,058,820 |
Certified Semi-Annual Report 15
| | |
| SCHEDULE OF INVESTMENTS, CONTINUED | | |
| |
| Thornburg Intermediate Municipal Fund | | March 31, 2010 (Unaudited) |
| | | | | | | | |
Issuer-Description | | Credit Rating†
S&P/ Moody’s | | Principal
Amount | | Value |
NEBRASKA — 0.33% | | | | | | | | |
Adams County Hospital Authority, 5.00% due 12/15/2023 (Mary Lanning Memorial Hospital; Insured: Radian) | | A-/NR | | $ | 2,000,000 | | $ | 1,997,880 |
NEVADA — 0.59% | | | | | | | | |
Reno Sparks Indian Colony, 5.00% due 6/1/2021 (LOC: U.S. Bank N.A.) | | NR/NR | | | 1,000,000 | | | 1,005,200 |
Washoe County GO, 0% due 7/1/2011 (Reno Sparks Convention Center; Insured: AGM) | | AAA/Aa2 | | | 2,600,000 | | | 2,571,608 |
NEW HAMPSHIRE — 1.65% | | | | | | | | |
Manchester Housing & Redevelopment Authority, 0% due 1/1/2016 (Insured: Radian/ACA) | | NR/Ba2 | | | 4,990,000 | | | 3,162,712 |
New Hampshire Business Finance Authority, 7.125% due 7/1/2027 put 2/1/2012 (United Illuminating Co.) (AMT) | | NR/Baa2 | | | 1,000,000 | | | 1,059,500 |
New Hampshire Health & Education Facilities, 5.25% due 10/1/2023 (Southern New Hampshire Medical Center) | | A-/NR | | | 1,000,000 | | | 1,000,000 |
New Hampshire IDA PCR, 5.90% due 8/1/2018 (CT Light & Power) (AMT) | | BBB/Baa1 | | | 1,000,000 | | | 1,015,550 |
New Hampshire PCR, 5.375% due 5/1/2014 (Central Maine Power Co.) | | BBB+/A3 | | | 3,500,000 | | | 3,805,900 |
NEW JERSEY — 0.92% | | | | | | | | |
New Jersey EDA, 7.50% due 12/1/2019 (Spectrum for Living Development) | | NR/NR | | | 140,000 | | | 140,626 |
New Jersey EDA, 5.50% due 9/1/2026 (School Facilities Construction; Insured: AMBAC) | | AA-/A1 | | | 2,000,000 | | | 2,213,080 |
New Jersey EDA, 0.30% due 9/1/2031 put 4/1/2010 (LOC: Bank of Nova Scotia/Lloyds TSB Bank plc) (daily demand notes) | | A+/Aa3 | | | 3,240,000 | | | 3,240,000 |
NEW MEXICO — 0.23% | | | | | | | | |
Santa Fe County Charter School Foundation, 6.50% due 1/15/2026 (ATC Foundation) | | NR/NR | | | 1,510,000 | | | 1,402,986 |
NEW YORK — 3.89% | | | | | | | | |
Erie County IDA, 5.00% due 5/1/2019 (Buffalo City School District) | | AA-/A1 | | | 3,000,000 | | | 3,331,200 |
New York City GO, 0.35% due 8/1/2028 put 4/1/2010 (SPA: Dexia) (daily demand notes) | | AA/Aa3 | | | 5,200,000 | | | 5,200,000 |
New York City GO, 0.35% due 4/1/2035 put 4/1/2010 (SPA: Dexia) (daily demand notes) | | AA/Aa3 | | | 3,050,000 | | | 3,050,000 |
New York City Municipal Water Finance Authority, 0.31% due 6/15/2032 put 4/1/2010 (SPA: Dexia) (daily demand notes) | | AA+/Aa3 | | | 2,000,000 | | | 2,000,000 |
New York City Trust Cultural Resources, 5.75% due 7/1/2015 (Museum of American Folk Art; Insured: ACA) | | NR/NR | | | 875,000 | | | 488,775 |
New York State Dormitory Authority, 5.00% due 7/1/2017 (Bishop Henry B. Hucles Nursing; Insured: SONYMA) | | NR/Aa1 | | | 850,000 | | | 929,704 |
New York State Dormitory Authority, 5.25% due 5/15/2021 (State University Educational Facilities) | | AA-/A1 | | | 500,000 | | | 550,455 |
New York State Dormitory Authority, 0.29% due 7/1/2037 put 4/1/2010 (Cornell University; SPA: Bank of America N.A.) (daily demand notes) | | AA/Aa1 | | | 6,400,000 | | | 6,400,000 |
United Nations Development Corp., 5.00% due 7/1/2025 | | NR/A1 | | | 1,700,000 | | | 1,788,587 |
NORTH CAROLINA — 0.11% | | | | | | | | |
North Carolina Housing Finance Agency SFMR, 6.50% due 9/1/2026 (AMT) | | AA/Aa2 | | | 675,000 | | | 685,476 |
NORTH DAKOTA — 0.16% | | | | | | | | |
Ward County Health Care Facilities, 5.125% due 7/1/2021 (Trinity Obligated Group) | | BBB+/NR | | | 1,000,000 | | | 948,660 |
OHIO — 2.96% | | | | | | | | |
Cleveland Cuyahoga County Port Authority, 6.25% due 5/15/2016 (LOC: FifthThird Bank) | | NR/NR | | | 1,425,000 | | | 1,410,636 |
Deerfield Township Tax Increment, 5.00% due 12/1/2025 | | NR/A3 | | | 1,000,000 | | | 989,230 |
16 Certified Semi-Annual Report
| | |
| SCHEDULE OF INVESTMENTS, CONTINUED | | |
| |
| Thornburg Intermediate Municipal Fund | | March 31, 2010 (Unaudited) |
| | | | | | | | |
Issuer-Description | | Credit Rating†
S&P/ Moody’s | | Principal
Amount | | Value |
Franklin County Health Care, 6.00% due 11/1/2010 (Heinzerling Foundation; LOC: Banc One) | | NR/Aa1 | | $ | 215,000 | | $ | 215,987 |
Hamilton Wastewater Systems, 5.25% due 10/1/2017 (Insured: AGM) | | NR/Aa3 | | | 1,500,000 | | | 1,675,620 |
Lorain County Hospital Revenue, 5.625% due 10/1/2016 (Catholic Healthcare) | | AA-/A1 | | | 1,435,000 | | | 1,490,032 |
North Ridgeville Economic Development, 0% due 2/1/2015 (Lake Ridge Nursing Home; Collateralized: FHA) | | AAA/NR | | | 135,000 | | | 92,883 |
Ohio State Air Quality Development Authority, 5.70% due 8/1/2020 (First Energy Generation) | | BBB-/Baa2 | | | 3,000,000 | | | 3,140,490 |
Ohio State Air Quality Development Authority, 4.85% due 8/1/2040 put 5/1/2012 (Columbus Southern Power; Insured: Natl-Re) (AMT) | | BBB-/A3 | | | 1,500,000 | | | 1,564,935 |
Ohio State Air Quality Development Authority, 5.10% due 11/1/2042 put 5/1/2013 (Columbus Southern Power; Insured: Natl-Re) (AMT) | | BBB/A3 | | | 3,000,000 | | | 3,192,060 |
Ohio State Higher Educational Facilities, 5.05% due 7/1/2037 put 7/1/2016 (Kenyon College) | | A+/A1 | | | 1,200,000 | | | 1,305,648 |
Ohio State Higher Educational Facility Commission, 0.28% due 1/1/2043 put 4/1/2010 (Cleveland Clinic) (daily demand notes) | | AA-/Aa2 | | | 3,000,000 | | | 3,000,000 |
OKLAHOMA — 1.56% | | | | | | | | |
Oklahoma City Municipal Water & Sewer, 0% due 7/1/2011 (Insured: AMBAC) | | NR/NR | | | 1,125,000 | | | 1,100,486 |
Oklahoma City Municipal Water & Sewer, 0% due 7/1/2013 (Insured: AMBAC) | | NR/NR | | | 1,485,000 | | | 1,362,354 |
Oklahoma State DFA, 5.40% due 6/1/2013 pre-refunded 12/1/2010 (Oklahoma Hospital Association; Insured: AMBAC) | | NR/Aa3 | | | 825,000 | | | 861,003 |
Oklahoma State Industries Authority, 5.50% due 7/1/2023 (Oklahoma Medical Research Foundation) | | NR/A1 | | | 3,730,000 | | | 3,929,219 |
Oklahoma State Power Authority, 5.00% due 1/1/2018 (Insured: AGM) | | AAA/Aa3 | | | 1,000,000 | | | 1,111,030 |
Tulsa IDA, 5.00% due 12/15/2024 (St. Francis Health Systems) | | AA/Aa2 | | | 1,130,000 | | | 1,146,634 |
OREGON — 0.06% | | | | | | | | |
Oregon State Housing & Community Services Department SFMR, 5.35% due 7/1/2018 (AMT) | | NR/Aa2 | | | 375,000 | | | 382,526 |
PENNSYLVANIA — 2.23% | | | | | | | | |
Allegheny County Hospital Development, 5.00% due 5/15/2019 (University of Pittsburgh Medical Center) | | A+/Aa3 | | | 2,500,000 | | | 2,669,700 |
Carbon County IDA, 6.65% due 5/1/2010 (Panther Creek Partners) (AMT) | | BBB-/NR | | | 2,405,000 | | | 2,403,990 |
Chartiers Valley Industrial & Community Development Authority, 5.75% due 12/1/2022 (Asbury Health Center) | | NR/NR | | | 900,000 | | | 789,579 |
Lancaster County, 0% due 5/1/2014 (Insured: FGIC) | | NR/Aa3 | | | 795,000 | | | 688,947 |
Lancaster County, 0% due 5/1/2015 (Insured: FGIC) | | NR/Aa3 | | | 800,000 | | | 651,424 |
Pennsylvania Higher Education Facilities Authority, 0% due 7/1/2020 (Insured: AMBAC) | | NR/NR | | | 2,032,839 | | | 955,272 |
a Philadelphia School District GO, 5.00% due 9/1/2018 (State Aid Withholding) | | A+/Aa3 | | | 5,000,000 | | | 5,446,250 |
RHODE ISLAND — 0.55% | | | | | | | | |
Rhode Island Health & Education Building Corp., 5.00% due 3/15/2014 (Salve Regina University; Insured: Radian) | | NR/NR | | | 1,065,000 | | | 1,107,962 |
Rhode Island Health & Education Building Corp., 6.00% due 8/1/2014 (Roger Williams Realty; Insured: FHA) | | BB/NR | | | 830,000 | | | 849,480 |
Rhode Island Health & Education Building Corp., 5.25% due 7/1/2015 (Memorial Hospital; LOC: Fleet Bank) | | AA+/NR | | | 1,325,000 | | | 1,406,885 |
SOUTH CAROLINA — 3.42% | | | | | | | | |
Berkeley County School District Installment Lease, 5.00% due 12/1/2019 | | A-/A3 | | | 2,000,000 | | | 2,114,360 |
Charleston Educational Excellence Financing Corp., 5.25% due 12/1/2020 (Charleston County School District) | | AA-/A1 | | | 1,855,000 | | | 1,967,858 |
Greenwood School Facilities, Inc., 5.00% due 12/1/2025 (Greenwood School District 50; Insured: AGM) | | AAA/Aa3 | | | 2,400,000 | | | 2,481,648 |
Certified Semi-Annual Report 17
| | |
| SCHEDULE OF INVESTMENTS, CONTINUED | | |
| |
| Thornburg Intermediate Municipal Fund | | March 31, 2010 (Unaudited) |
| | | | | | | | |
Issuer-Description | | Credit Rating†
S&P/ Moody’s | | Principal
Amount | | Value |
Lexington One School Facilities Corp. School District 1, 5.00% due 12/1/2019 | | NR/A1 | | $ | 1,000,000 | | $ | 1,060,780 |
Lexington One School Facilities Corp. School District 1, 5.25% due 12/1/2021 | | NR/A1 | | | 1,700,000 | | | 1,803,156 |
Scago Educational Facilities Corp., 5.00% due 12/1/2017 (Colleton School District; Insured: AGM) | | AAA/Aa3 | | | 1,000,000 | | | 1,096,990 |
Scago Educational Facilities Corp., 5.00% due 4/1/2019 (Spartanburg School District; Insured: AGM) | | AAA/Aa3 | | | 2,740,000 | | | 2,915,086 |
Scago Educational Facilities Corp., 5.00% due 4/1/2021 (Spartanburg School District; Insured: AGM) | | AAA/Aa3 | | | 1,000,000 | | | 1,050,600 |
South Carolina Housing Finance & Development Authority, 5.875% due 7/1/2022 (AMT) | | NR/Aa1 | | | 2,240,000 | | | 2,354,173 |
South Carolina Housing Finance & Development Authority, 5.30% due 7/1/2023 (AMT) | | NR/Aa1 | | | 1,000,000 | | | 1,036,430 |
Sumter School Facilities Inc. School District 2, 5.00% due 12/1/2021 (Insured: AGM) | | AAA/Aa3 | | | 2,855,000 | | | 3,008,970 |
SOUTH DAKOTA — 0.28% | | | | | | | | |
South Dakota Health & Educational Facilities Authority, 5.00% due 11/1/2024 (Sanford Health) | | AA-/A1 | | | 1,700,000 | | | 1,716,694 |
TENNESSEE — 1.87% | | | | | | | | |
Knox County Health, 4.90% due 6/1/2031 put 6/1/2011 (Eastowne Partners II Ltd.; Collateralized: FNMA) | | AAA/NR | | | 1,895,000 | | | 1,977,603 |
Tennessee Energy Acquisition Corp., 5.00% due 2/1/2023 | | A/Baa1 | | | 2,500,000 | | | 2,455,025 |
Tennessee Energy Acquisition Corp., 5.25% due 9/1/2023 | | BB+/Ba3 | | | 7,000,000 | | | 6,999,650 |
TEXAS — 13.51% | | | | | | | | |
Austin Community College District, 5.50% due 8/1/2023 (Round Rock Campus) | | AA+/Aa3 | | | 2,180,000 | | | 2,401,226 |
Bexar County Health Facilities Development Corp., 6.125% due 7/1/2022 pre-refunded 7/1/2012 (Army Retirement Residence) | | NR/NR | | | 1,250,000 | | | 1,391,563 |
Bexar County Health Facilities Development Corp., 5.00% due 7/1/2027 (Army Retirement Residence) | | BBB/NR | | | 2,000,000 | | | 1,757,360 |
Bexar County Housing Finance Corp., 5.50% due 1/1/2016 (American Opportunity Housing & Colinas; Insured: Natl-Re) | | NR/Baa1 | | | 600,000 | | | 560,610 |
Bexar County Housing Finance Corp., 6.50% due 12/1/2021 (American Opportunity Housing-Waterford) | | NR/Ba1 | | | 2,000,000 | | | 1,847,480 |
Bexar County Housing Finance Corp. MFR, 5.70% due 1/1/2021 (American Opportunity Housing; Insured: Natl-Re) | | NR/Baa1 | | | 1,035,000 | | | 888,755 |
Bexar Metropolitan Water District Waterworks, 5.00% due 5/1/2021 (Insured: Syncora) | | A/A3 | | | 1,300,000 | | | 1,369,615 |
Bexar Metropolitan Water District Waterworks, 5.00% due 5/1/2022 (Insured: Syncora) | | A/A3 | | | 2,300,000 | | | 2,412,654 |
Birdville ISD GO, 0% due 2/15/2012 (Guaranty: PSF) | | AAA/Aaa | | | 2,800,000 | | | 2,743,860 |
Bryan Electric Systems, 2.00% due 7/1/2011 | | A+/A1 | | | 1,500,000 | | | 1,520,850 |
Bryan Electric Systems, 3.00% due 7/1/2012 | | A+/A1 | | | 1,850,000 | | | 1,917,618 |
Bryan Electric Systems, 3.00% due 7/1/2013 | | A+/A1 | | | 1,000,000 | | | 1,042,370 |
Cedar Park Improvement District GO, 5.00% due 2/15/2016 (Insured: Natl-Re) | | AA/A1 | | | 1,000,000 | | | 1,092,160 |
Dallas County Utilities & Reclamation District, 5.15% due 2/15/2022 (Insured: AMBAC) | | BBB+/Baa3 | | | 3,000,000 | | | 3,006,510 |
Dallas Fort Worth International Airport, 5.00% due 11/1/2015 | | A+/A1 | | | 1,000,000 | | | 1,114,930 |
Denton GO, 2.00% due 2/15/2011 | | AA/Aa3 | | | 2,080,000 | | | 2,106,208 |
Denton GO, 3.00% due 2/15/2013 | | AA/Aa3 | | | 2,710,000 | | | 2,824,850 |
Duncanville ISD GO, 0% due 2/15/2016 pre-refunded 2/15/2012 (Guaranty: PSF) | | AAA/Aaa | | | 2,985,000 | | | 2,323,225 |
Duncanville ISD GO, 0% due 2/15/2016 (Guaranty: PSF) | | AAA/Aaa | | | 15,000 | | | 11,523 |
Ennis ISD GO, 0% due 8/15/2012 pre-refunded 8/15/2010 (Guaranty: PSF) | | NR/Aaa | | | 1,625,000 | | | 1,470,463 |
Ennis ISD GO, 0% due 8/15/2012 (Guaranty: PSF) | | NR/Aaa | | | 835,000 | | | 754,164 |
Ennis ISD GO, 0% due 8/15/2013 (Guaranty: PSF) | | NR/Aaa | | | 845,000 | | | 716,256 |
Ennis ISD GO, 0% due 8/15/2014 (Guaranty: PSF) | | NR/Aaa | | | 855,000 | | | 679,494 |
Gulf Coast Center, 6.75% due 9/1/2020 (Mental Health Retardation Center) | | BBB/NR | | | 1,320,000 | | | 1,353,251 |
Harris County Hospital District, 5.00% due 2/15/2015 (Insured: Natl-Re) | | A/A1 | | | 2,075,000 | | | 2,249,985 |
Hays Consolidated ISD GO, 0% due 8/15/2013 pre-refunded 8/15/2011 (Guaranty: PSF) | | AAA/Aaa | | | 4,000,000 | | | 3,555,280 |
Kimble County Hospital District GO, 5.00% due 8/15/2017 | | NR/NR | | | 510,000 | | | 515,013 |
18 Certified Semi-Annual Report
| | |
| SCHEDULE OF INVESTMENTS, CONTINUED | | |
| |
| Thornburg Intermediate Municipal Fund | | March 31, 2010 (Unaudited) |
| | | | | | | | |
Issuer-Description | | Credit Rating†
S&P/ Moody’s | | Principal
Amount | | Value |
Kimble County Hospital District GO, 5.00% due 8/15/2018 | | NR/NR | | $ | 525,000 | | $ | 520,616 |
La Vernia Higher Education Finance Corp., 5.75% due 8/15/2024 (Kipp, Inc.) | | BBB/NR | | | 3,000,000 | | | 3,062,940 |
Laredo Sports Venue Sales Tax, 5.00% due 3/15/2018 (Insured: AMBAC) | | A+/A2 | | | 2,040,000 | | | 2,144,142 |
Lewisville Combination Contract Special Assessment District, 4.75% due 9/1/2012 (Insured: ACA) | | NR/NR | | | 1,530,000 | | | 1,527,185 |
Midtown Redevelopment Authority Tax, 6.00% due 1/1/2012 (Insured: Radian) | | A-/Baa1 | | | 735,000 | | | 753,853 |
Midtown Redevelopment Authority Tax, 6.00% due 1/1/2013 (Insured: Radian) | | A-/Baa1 | | | 500,000 | | | 511,880 |
Mission EDA, 6.00% due 8/1/2020 put 8/1/2013 (Waste Management, Inc.) (AMT) | | BBB/NR | | | 3,000,000 | | | 3,265,230 |
b Pharr Higher Education Finance Authority, 5.75% due 8/15/2024 (Idea Public School) | | BBB/NR | | | 5,050,000 | | | 5,137,415 |
Sam Rayburn Municipal Power Agency, 6.00% due 10/1/2016 | | BBB/Baa2 | | | 3,000,000 | | | 3,150,870 |
Sam Rayburn Municipal Power Agency, 6.00% due 10/1/2021 | | BBB/Baa2 | | | 2,575,000 | | | 2,635,409 |
Stafford Economic Development, 6.00% due 9/1/2017 (Insured: FGIC) | | A+/A2 | | | 1,775,000 | | | 2,067,005 |
Tarrant County Health Facilities, 6.625% due 11/15/2020 pre-refunded 11/15/2010 (Adventist/ Sunbelt) | | NR/A1 | | | 3,500,000 | | | 3,668,560 |
Texas City Industrial Development Corp., 7.375% due 10/1/2020 (Arco Pipe Line Company) | | AA/Aa1 | | | 2,450,000 | | | 3,101,675 |
Texas State Public Finance Authority, 5.00% due 8/15/2023 (Idea Public School; Insured: ACA) | | BBB/NR | | | 3,000,000 | | | 2,734,320 |
Texas State Public Finance Authority Charter School Finance Corp., 5.00% due 8/15/2030 (Idea Public School; Insured: ACA) | | BBB/NR | | | 2,000,000 | | | 1,726,420 |
Travis County GO, 5.25% due 3/1/2021 | | AAA/Aaa | | | 1,000,000 | | | 1,110,870 |
Uptown Development Authority, 5.25% due 9/1/2024 (Infrastructure Improvement) | | BBB+/NR | | | 500,000 | | | 486,675 |
Uptown Development Authority, 5.50% due 9/1/2029 (Infrastructure Improvement) | | BBB+/NR | | | 1,250,000 | | | 1,235,250 |
U.S. VIRGIN ISLANDS — 0.87% | | | | | | | | |
Virgin Islands Public Finance Authority, 6.625% due 10/1/2029 | | BBB/Baa3 | | | 5,000,000 | | | 5,335,700 |
UTAH — 0.40% | | | | | | | | |
Salt Lake Valley Fire Services, 5.25% due 4/1/2020 | | NR/Aa3 | | | 1,250,000 | | | 1,382,200 |
Utah County Municipal Building Authority, 5.50% due 11/1/2016 pre-refunded 11/1/2011 (Insured: AMBAC) | | NR/Aa3 | | | 1,000,000 | | | 1,075,440 |
Utah Housing Finance Authority SFMR, 5.85% due 7/1/2015 (Insured: FHA) (AMT) | | NR/Aaa | | | 5,000 | | | 5,006 |
VIRGINIA — 0.47% | | | | | | | | |
Fauquier County IDRB, 5.50% due 10/1/2016 (Insured: Radian) | | BBB+/NR | | | 1,000,000 | | | 1,052,980 |
Hanover County IDRB Medical Facilities, 6.00% due 10/1/2021 (ETM) | | A/NR | | | 795,000 | | | 798,601 |
Norton IDA, 6.00% due 12/1/2014 (Norton Community Hospital; Insured: ACA) | | NR/NR | | | 1,000,000 | | | 1,022,840 |
WASHINGTON — 3.46% | | | | | | | | |
King County Housing Authority, 5.20% due 5/1/2028 (Birch Creek Apts.) | | AAA/NR | | | 2,400,000 | | | 2,495,904 |
Skagit County Public Hospital District GO, 5.125% due 12/1/2015 (Insured: Natl-Re) | | NR/A3 | | | 1,900,000 | | | 2,110,767 |
Washington Health Care Facilities, 6.00% due 12/1/2014 (Catholic Health Services; Insured: Natl-Re) | | AA/Aa2 | | | 1,735,000 | | | 1,762,396 |
Washington Health Care Facilities, 6.00% due 12/1/2015 (Catholic Health Services; Insured: Natl-Re) | | AA/Aa2 | | | 1,945,000 | | | 1,973,883 |
Washington Health Care Facilities, 6.25% due 12/1/2021 (Group Health Co-op of Puget Sound; Insured: Natl-Re) | | NR/Baa1 | | | 3,775,000 | | | 3,790,893 |
Washington Health Care Facilities, 5.25% due 8/15/2024 (Multicare Systems; Insured: AGM) | | AAA/Aa3 | | | 1,000,000 | | | 1,050,360 |
Washington Health Care Facilities, 6.25% due 8/1/2028 (Highline Medical Centers; Insured: FHA 242) | | A+/NR | | | 4,000,000 | | | 4,382,680 |
Washington Housing Finance Commission, 5.60% due 7/1/2011 (Kline Galland Center; Insured: Radian) | | NR/NR | | | 500,000 | | | 505,960 |
Washington Housing Finance Commission, 6.10% due 1/1/2016 (Seattle Academy; Insured: ACA) | | NR/NR | | | 1,040,000 | | | 1,041,861 |
Washington Housing Finance Commission, 5.875% due 7/1/2019 (Kline Galland Center; Insured: Radian) | | NR/NR | | | 1,000,000 | | | 1,003,710 |
Washington Public Power Supply, 0% due 7/1/2011 | | AA/Aaa | | | 1,000,000 | | | 987,850 |
Certified Semi-Annual Report 19
| | |
| SCHEDULE OF INVESTMENTS, CONTINUED | | |
| |
| Thornburg Intermediate Municipal Fund | | March 31, 2010 (Unaudited) |
| | | | | | | | |
Issuer-Description | | Credit Rating†
S&P/ Moody’s | | Principal
Amount | | Value |
WEST VIRGINIA — 0.26% | | | | | | | | |
West Virginia Hospital Finance Authority, 5.00% due 6/1/2020 (United Hospital Center; Insured: AMBAC) | | A+/A2 | | $ | 1,530,000 | | $ | 1,575,686 |
WISCONSIN — 0.44% | | | | | | | | |
Wisconsin Health & Educational Facilities, 5.75% due 8/15/2020 (Eagle River Memorial Hospital Inc.; Insured: Radian) | | NR/NR | | | 1,000,000 | | | 1,002,330 |
Wisconsin Housing & Economic Development, 5.875% due 11/1/2016 (Insured: AMBAC; GO of Authority) | | AA/Aa3 | | | 1,635,000 | | | 1,653,982 |
| | | | | | | | |
TOTAL INVESTMENTS — 99.93% (Cost $597,725,633) | | | | | | | $ | 609,972,702 |
OTHER ASSETS LESS LIABILITIES — 0.07% | | | | | | | | 419,931 |
| | | | | | | | |
NET ASSETS — 100.00% | | | | | | | $ | 610,392,633 |
| | | | | | | | |
Footnote Legend
| † | Credit ratings are unaudited. Rating changes may have occurred subsequent to the reporting period end. |
| b | Segregated as collateral for a when-issued security. |
Portfolio Abbreviations
To simplify the listings of securities, abbreviations are used per the table below:
| | |
ACA | | Insured by American Capital Access |
AGM | | Insured by Assured Guaranty Municipal Corp. |
AMBAC | | Insured by American Municipal Bond Assurance Corp. |
AMT | | Alternative Minimum Tax |
CIFG | | Insured by CIFG Assurance North America Inc. |
COP | | Certificates of Participation |
DFA | | Development Finance Authority |
EDA | | Economic Development Authority |
ETM | | Escrowed to Maturity |
FGIC | | Insured by Financial Guaranty Insurance Co. |
FHA | | Insured by Federal Housing Administration |
FNMA | | Collateralized by Federal National Mortgage Association |
GNMA | | Insured by Government National Mortgage Co. |
GO | | General Obligation |
HFA | | Health Facilities Authority |
IDA | | Industrial Development Authority |
IDRB | | Industrial Development Revenue Bond |
ISD | | Independent School District |
LOC | | Letter of Credit |
Mtg | | Mortgage |
MFR | | Multi Family Revenue |
Natl-Re | | Insured by National Public Finance Guarantee Corp. |
PCR | | Pollution Control Revenue Bond |
PSF | | Guaranteed by Permanent School Fund |
Radian | | Insured by Radian Asset Assurance |
SFMR | | Single Family Mortgage Revenue Bond |
SONYMA | | State of New York Mortgage Authority |
SPA | | Stand-by Purchase Agreement |
Syncora | | Insured by Syncora Guarantee Inc. |
USD | | Unified School District |
See notes to financial statements.
20 Certified Semi-Annual Report
| | |
| STATEMENT OF ASSETS AND LIABILITIES | | |
| |
| Thornburg Intermediate Municipal Fund | | March 31, 2010 (Unaudited) |
| | | | |
ASSETS | | | | |
Investments at value (cost $597,725,633) (Note 2) | | $ | 609,972,702 | |
Cash | | | 201,305 | |
Receivable for investments sold | | | 2,876,295 | |
Receivable for fund shares sold | | | 5,260,172 | |
Interest receivable | | | 7,989,780 | |
Prepaid expenses and other assets | | | 33,245 | |
| | | | |
Total Assets | | | 626,333,499 | |
| | | | |
| |
LIABILITIES | | | | |
Payable for securities purchased | | | 12,761,285 | |
Payable for fund shares redeemed | | | 2,070,838 | |
Payable to investment advisor and other affiliates (Note 3) | | | 428,193 | |
Accounts payable and accrued expenses | | | 85,273 | |
Dividends payable | | | 595,277 | |
| | | | |
Total Liabilities | | | 15,940,866 | |
| | | | |
| |
NET ASSETS | | $ | 610,392,633 | |
| | | | |
NET ASSETS CONSIST OF: | | | | |
Distribution in excess of net investment income | | $ | (5,236 | ) |
Net unrealized appreciation on investments | | | 12,247,069 | |
Accumulated net realized gain (loss) | | | (5,769,098 | ) |
Net capital paid in on shares of beneficial interest | | | 603,919,898 | |
| | | | |
| | $ | 610,392,633 | |
| | | | |
| |
NET ASSET VALUE: | | | | |
Class A Shares: | | | | |
Net asset value and redemption price per share ($368,360,373 applicable to 27,876,096 shares of beneficial interest outstanding - Note 4) | | $ | 13.21 | |
Maximum sales charge, 2.00% of offering price | | | 0.27 | |
| | | | |
Maximum offering price per share | | $ | 13.48 | |
| | | | |
| |
Class C Shares: | | | | |
Net asset value and offering price per share * ($100,983,515 applicable to 7,632,238 shares of beneficial interest outstanding - Note 4) | | $ | 13.23 | |
| | | | |
| |
Class I Shares: | | | | |
Net asset value, offering and redemption price per share ($141,048,745 applicable to 10,687,578 shares of beneficial interest outstanding - Note 4) | | $ | 13.20 | |
| | | | |
| * | Redemption price per share is equal to net asset value less any applicable contingent deferred sales charge. |
See notes to financial statements.
Certified Semi-Annual Report 21
| | |
| STATEMENT OF OPERATIONS | | |
| |
| Thornburg Intermediate Municipal Fund | | Six Months Ended March 31, 2010 (Unaudited) |
| | | | |
INVESTMENT INCOME: | | | | |
Interest income (net of premium amortized of $827,886) | | $ | 13,726,238 | |
| | | | |
EXPENSES: | | | | |
Investment advisory fees (Note 3) | | | 1,404,488 | |
Administration fees (Note 3) | | | | |
Class A Shares | | | 217,957 | |
Class C Shares | | | 55,912 | |
Class I Shares | | | 32,656 | |
Distribution and service fees (Note 3) | | | | |
Class A Shares | | | 435,913 | |
Class C Shares | | | 451,370 | |
Transfer agent fees | | | | |
Class A Shares | | | 64,556 | |
Class C Shares | | | 19,064 | |
Class I Shares | | | 36,625 | |
Registration and filing fees | | | | |
Class A Shares | | | 26,077 | |
Class C Shares | | | 10,462 | |
Class I Shares | | | 9,630 | |
Custodian fees (Note 3) | | | 64,837 | |
Professional fees | | | 18,506 | |
Accounting fees | | | 12,720 | |
Trustee fees | | | 7,590 | |
Other expenses | | | 29,570 | |
| | | | |
Total Expenses | | | 2,897,933 | |
Less: | | | | |
Expenses reimbursed by investment advisor (Note 3) | | | (46,499 | ) |
Distribution fees waived (Note 3) | | | (180,548 | ) |
| | | | |
Net Expenses | | | 2,670,886 | |
| | | | |
Net Investment Income | | | 11,055,352 | |
| | | | |
REALIZED AND UNREALIZED GAIN (LOSS) | | | | |
Net realized gain (loss) on investments | | | (492,001 | ) |
Net change in unrealized appreciation (depreciation) of investments | | | (7,327,994 | ) |
| | | | |
Net Realized and Unrealized Loss | | | (7,819,995 | ) |
| | | | |
Net Increase in Net Assets Resulting From Operations | | $ | 3,235,357 | |
| | | | |
See notes to financial statements.
22 Certified Semi-Annual Report
| | |
| STATEMENTS OF CHANGES IN NET ASSETS | | |
| |
| Thornburg Intermediate Municipal Fund | | |
| | | | | | | | |
| | | Six Months Ended
March 31, 2010* | | | Year Ended
September 30, 2009 | |
INCREASE (DECREASE) IN NET ASSETS FROM: | | | | | | | | |
| | |
OPERATIONS: | | | | | | | | |
Net investment income | | $ | 11,055,352 | | | $ | 21,828,387 | |
Net realized gain (loss) on investments | | | (492,001 | ) | | | (927,942 | ) |
Increase (Decrease) in unrealized appreciation (depreciation) of investments | | | (7,327,994 | ) | | | 37,279,718 | |
| | | | | | | | |
Net Increase (Decrease) in Net Assets Resulting from Operations | | | 3,235,357 | | | | 58,180,163 | |
| | |
DIVIDENDS TO SHAREHOLDERS: | | | | | | | | |
From net investment income | | | | | | | | |
Class A Shares | | | (6,730,275 | ) | | | (12,998,383 | ) |
Class C Shares | | | (1,603,532 | ) | | | (2,592,017 | ) |
Class I Shares | | | (2,721,545 | ) | | | (6,237,987 | ) |
| | |
FUND SHARE TRANSACTIONS (NOTE 4): | | | | | | | | |
Class A Shares | | | 36,175,304 | | | | 2,986,741 | |
Class C Shares | | | 21,599,341 | | | | 16,101,754 | |
Class I Shares | | | 17,121,185 | | | | (54,649,369 | ) |
| | | | | | | | |
| | |
Net Increase in Net Assets | | | 67,075,835 | | | | 790,902 | |
NET ASSETS: | | | | | | | | |
Beginning of Period | | | 543,316,798 | | | | 542,525,896 | |
| | | | | | | | |
| | |
End of Period | | $ | 610,392,633 | | | $ | 543,316,798 | |
| | | | | | | | |
See notes to financial statements.
Certified Semi-Annual Report 23
| | |
| NOTES TO FINANCIAL STATEMENTS | | |
| |
| Thornburg Intermediate Municipal Fund | | March 31, 2010 (Unaudited) |
NOTE 1 – ORGANIZATION
Thornburg Intermediate Municipal Fund (the “Fund”) is a diversified series of Thornburg Investment Trust (the “Trust”). The Trust is organized as a Massachusetts business trust under a Declaration of Trust dated June 3, 1987 and is registered as a diversified, open-end management investment company under the Investment Company Act of 1940, as amended. The Fund is currently one of sixteen separate series of the Trust. Each series is considered to be a separate entity for financial reporting and tax purposes and bears expenses directly attributable to it. The Fund’s primary investment objective is to obtain as high a level of current income exempt from federal individual income taxes as is consistent, in the view of the Fund’s investment advisor, with the preservation of capital. The Fund’s secondary objective is to reduce expected changes in its share price compared to long-term bond portfolios.
The Fund currently offers three classes of shares of beneficial interest: Class A, Class C, and Institutional Class (Class I) shares. Each class of shares of the Fund represents an interest in the same portfolio of investments, except that (i) Class A shares are sold subject to a front-end sales charge collected at the time the shares are purchased and bear a service fee, (ii) Class C shares are sold at net asset value without a sales charge at the time of purchase, but are subject to a contingent deferred sales charge upon redemption within one year of purchase, and bear both a service fee and a distribution fee, (iii) Class I shares are sold at net asset value without a sales charge at the time of purchase, and (iv) the respective classes may have different reinvestment privileges and conversion rights. Additionally, the Fund may allocate among its classes certain expenses, to the extent allowable to specific classes, including transfer agent fees, government registration fees, certain printing and postage costs, and administrative and legal expenses. Currently, class specific expenses of the Fund are limited to service and distribution fees, administration fees, and certain registration and transfer agent expenses.
NOTE 2 – SIGNIFICANT ACCOUNTING POLICIES
Significant accounting policies of the Trust are as follows:
Valuation of Investments: Debt obligations have a primary market over the counter and are valued by an independent pricing service approved by the Trustees of the Trust. The pricing service ordinarily values debt obligations at quoted bid prices. When quotations are not available, debt obligations are valued at evaluated prices determined by the pricing service using methods which include consideration of yields or prices of debt obligations of comparable quality, type of issue, coupon, maturity and rating, and indications as to value from dealers and general market conditions. Short-term obligations having remaining maturities of 60 days or less are valued at amortized cost, which approximates market value.
In any case where a pricing service fails to provide a price for a debt obligation held by the Fund, the valuation and pricing committee determines a fair value for the obligation using procedures approved by the Trustees. Additionally, in any case where management believes that a price provided by a pricing service for a debt obligation may be unreliable, the valuation and pricing committee decides whether or not to use the pricing service’s valuation or to determine a fair value for the obligation.
In determining fair value for any portfolio security or other investment, the valuation and pricing committee seeks to determine the amount that an owner of the investment might reasonably expect to receive upon a sale of the investment. However, because fair value prices are estimated prices, the valuation and pricing committee’s determination of fair value for an investment may differ from the value that would be realized by the Fund upon a sale of the investment, and that difference could be material to the Fund’s financial statements. The valuation and pricing committee’s determination of fair value for an investment may also differ from the prices obtained by other persons (including other mutual funds) for the investment.
Valuation Measurements: Various inputs are used in determining the value of the Fund’s investments. These inputs are summarized in the three levels listed below.
Level 1: Quoted prices in active markets for identical investments.
Level 2: Other significant observable inputs (including quoted prices for similar investments, interest rates, prepayment rates, credit risk, etc.).
Level 3: Significant unobservable inputs (including the Fund’s own assumptions in determining the fair value of investments).
24 Certified Semi-Annual Report
| | |
| NOTES TO FINANCIAL STATEMENTS, CONTINUED | | |
| |
| Thornburg Intermediate Municipal Fund | | March 31, 2010 (Unaudited) |
The following table displays a summary of the inputs used to value the Fund’s net assets as of March 31, 2010. In any instance when valuation inputs from more than one level are used to determine the fair value of a specific investment, the investment is placed in the level of the table based upon the lowest level input that is significant in determining the fair value of the investment:
| | | | | | | | | | | | |
| | | Fair Value Measurements at March 31, 2010 |
| | | Total | | Level 1 | | Level 2 | | Level 3 |
Assets | | | | | | | | | | | | |
Investments in Securities | | | | | | | | | | | | |
Municipal Bonds | | $ | 609,972,702 | | $ | — | | $ | 609,972,702 | | $ | — |
| | | | | | | | | | | | |
Total Investments in Securities | | $ | 609,972,702 | | $ | — | | $ | 609,972,702 | | $ | — |
Federal Income Taxes: It is the policy of the Trust to comply with the provisions of the Internal Revenue Code applicable to “regulated investment companies” and to distribute to shareholders substantially all taxable (if any) and tax exempt income of the Fund. Therefore, no provision for federal income tax is required.
When-Issued and Delayed Delivery Transactions: The Fund may engage in when-issued or delayed delivery transactions. To the extent the Fund engages in such transactions, it will do so for the purpose of acquiring portfolio securities consistent with the Fund’s investment objectives and not for the purpose of investment leverage or to speculate on interest rate and/or market changes. At the time the Fund makes a commitment to purchase a security on a when-issued or delayed delivery basis, the Fund will record the transaction and reflect the value in determining its net asset value. When effecting such transactions, assets of an amount sufficient to make payment for the portfolio securities to be purchased will be segregated on the Fund’s records on the trade date. Securities purchased on a when-issued or delayed delivery basis do not earn interest until the settlement date.
Dividends: Net investment income of the Fund is declared daily as a dividend on shares for which the Fund has received payment. Dividends are paid monthly and are reinvested in additional shares of the Fund at net asset value per share at the close of business on the dividend payment date, or at the shareholder’s option, paid in cash. Net realized capital gains, to the extent available, will be distributed at least annually.
General: Securities transactions are accounted for on a trade date basis. Interest income is accrued as earned. Premiums and discounts on securities purchased are amortized to call dates or maturity dates of the respective securities. Realized gains and losses from the sale of securities are recorded on an identified cost basis. Net investment income (other than class specific expenses) and realized and unrealized gains and losses are allocated daily to each class of shares based upon the relative net asset value of outstanding shares (or the value of the dividend-eligible shares, as appropriate) of each class of shares at the beginning of the day (after adjusting for the current capital shares activity of the respective class). Expenses common to all funds are allocated among the funds comprising the Trust based upon their relative net asset values or other appropriate allocation methods.
Guarantees and Indemnifications: Under the Trust’s organizational documents, its officers and Trustees are indemnified against certain liabilities arising out of the performance of their duties to the Fund. Additionally, in the normal course of business the Trust enters into contracts with service providers that contain general indemnification clauses. The Trust’s maximum exposure under these arrangements is unknown. However, based on experience, the Trust expects the risk of loss to be remote.
Use of Estimates: The preparation of financial statements, in conformity with generally accepted accounting principles, requires management to make estimates and assumptions that affect the reported amounts of assets and liabilities and the disclosure of contingent assets and liabilities at the date of the financial statements and the reported amounts of increases and decreases in net assets from operations during the reporting period. Actual results could differ from those estimates.
NOTE 3 – INVESTMENT ADVISORY FEE AND OTHER TRANSACTIONS WITH AFFILIATES
Pursuant to an investment advisory agreement, Thornburg Investment Management, Inc. (the “Advisor”) serves as the investment advisor and performs services to the Fund for which the fees are payable at the end of each month. For the six months ended March 31, 2010, these fees were payable at annual rates ranging from .50 of 1% to .275 of 1% per annum of the average daily net assets of the Fund depending on the Fund’s asset size. The Trust also has entered into administrative services agreements with the Advisor, whereby
Certified Semi-Annual Report 25
| | |
| NOTES TO FINANCIAL STATEMENTS, CONTINUED | | |
| |
| Thornburg Intermediate Municipal Fund | | March 31, 2010 (Unaudited) |
the Advisor will perform certain administrative services for the shareholders of each class of the Fund’s shares, and for which fees will be payable at an annual rate of up to .125 of 1% per annum of the average daily net assets attributable to each class of shares. For the six months ended March 31, 2010, the Advisor voluntarily or contractually agreed to reimburse certain class specific expenses and administrative fees of $1,974 for Class A shares, $43,341 for Class C shares, and $1,184 for Class I shares.
The Trust has an underwriting agreement with Thornburg Securities Corporation (the “Distributor,” an affiliate of the Advisor), which acts as the distributor of the Fund’s shares. For the six months ended March 31, 2010, the Distributor has advised the Fund that it earned net commissions aggregating $2,846 from the sale of Class A shares, and collected contingent deferred sales charges aggregating $2,235 from redemptions of Class C shares of the Fund.
Pursuant to a service plan under Rule 12b-1 of the Investment Company Act of 1940, the Fund may reimburse to the Advisor an amount not to exceed .25 of 1% per annum of the average daily net assets attributable to each class of shares of the Fund for payments made by the Advisor to securities dealers and other financial institutions to obtain various shareholder and distribution related services. The Advisor may pay out of its own resources additional expenses for distribution of the Fund’s shares.
The Trust has also adopted distribution plans pursuant to Rule 12b-1, applicable only to the Fund’s Class C shares, under which the Fund compensates the Distributor for services in promoting the sale of Class C shares of the Fund at an annual rate of up to .75 of 1% per annum of the average daily net assets attributable to Class C shares. Total fees incurred by the Distributor for each class of shares of the Fund under their respective Service and Distribution Plans for the six months ended March 31, 2010, are set forth in the Statement of Operations. Distribution fees in the amount of $180,548 were waived for Class C shares.
The Trust has an agreement with the custodian bank to indirectly pay a portion of the custodian’s fees through credits earned by the Fund’s cash on deposit with the bank. This deposit agreement is an alternative to overnight investments. Custodial fees have been adjusted to reflect amounts that would have been paid without this agreement, with a corresponding adjustment reflected as fees paid indirectly in the Statement of Operations. For the six months ended March 31, 2010, there were no fees paid indirectly.
Certain officers and Trustees of the Trust are also officers and/or directors of the Advisor and Distributor. The compensation of independent Trustees is borne by the Trust.
NOTE 4 – SHARES OF BENEFICIAL INTEREST
At March 31, 2010, there were an unlimited number of shares of beneficial interest authorized. Transactions in shares of beneficial interest were as follows:
| | | | | | | | | | | | | | |
| | | Six Months Ended
March 31, 2010 (Unaudited) | | | Year Ended
September 30, 2009 (Audited) | |
| | | Shares | | | Amount | | | Shares | | | Amount | |
Class A Shares | | | | | | | | | | | | | | |
Shares sold | | 4,585,421 | | | $ | 60,748,396 | | | 5,285,883 | | | $ | 66,600,182 | |
Shares issued to shareholders in reinvestment of dividends | | 320,065 | | | | 4,229,302 | | | 648,398 | | | | 8,176,580 | |
Shares repurchased | | (2,177,372 | ) | | | (28,802,394 | ) | | (5,770,790 | ) | | | (71,790,021 | ) |
| | | | | | | | | | | | | | |
| | | | |
Net Increase (Decrease) | | 2,728,114 | | | $ | 36,175,304 | | | 163,491 | | | $ | 2,986,741 | |
| | | | | | | | | | | | | | |
| | | | |
Class C Shares | | | | | | | | | | | | | | |
Shares sold | | 1,987,293 | | | $ | 26,360,525 | | | 2,555,789 | | | $ | 32,283,723 | |
Shares issued to shareholders in reinvestment of dividends | | 79,122 | | | | 1,046,917 | | | 132,970 | | | | 1,681,843 | |
Shares repurchased | | (438,255 | ) | | | (5,808,101 | ) | | (1,431,411 | ) | | | (17,863,812 | ) |
| | | | | | | | | | | | | | |
| | | | |
Net Increase (Decrease) | | 1,628,160 | | | $ | 21,599,341 | | | 1,257,348 | | | $ | 16,101,754 | |
| | | | | | | | | | | | | | |
26 Certified Semi-Annual Report
| | |
| NOTES TO FINANCIAL STATEMENTS, CONTINUED | | |
| |
| Thornburg Intermediate Municipal Fund | | March 31, 2010 (Unaudited) |
| | | | | | | | | | | | | | |
| | | Six Months Ended
March 31, 2010 (Unaudited) | | | Year Ended
September 30, 2009 (Audited) | |
| | | Shares | | | Amount | | | Shares | | | Amount | |
Class I Shares | | | | | | | | | | | | | | |
Shares sold | | 2,092,375 | | | $ | 27,661,155 | | | 4,442,308 | | | $ | 55,720,365 | |
Shares issued to shareholders in reinvestment of dividends | | 150,591 | | | | 1,987,094 | | | 367,683 | | | | 4,621,413 | |
Shares repurchased | | (947,180 | ) | | | (12,527,064 | ) | | (9,222,969 | ) | | | (114,991,147 | ) |
| | | | | | | | | | | | | | |
| | | | |
Net Increase (Decrease) | | 1,295,786 | | | $ | 17,121,185 | | | (4,412,978 | ) | | $ | (54,649,369 | ) |
| | | | | | | | | | | | | | |
NOTE 5 – SECURITIES TRANSACTIONS
For the six months ended March 31, 2010, the Fund had purchase and sale transactions of investment securities (excluding short-term investments) of $101,886,909 and $28,825,426, respectively.
NOTE 6 – INCOME TAXES
At March 31, 2010, information on the tax components of capital is as follows:
| | | | |
Cost of investments for tax purposes | | $ | 597,725,633 | |
| | | | |
Gross unrealized appreciation on a tax basis | | $ | 18,889,427 | |
Gross unrealized depreciation on a tax basis | | | (6,642,358 | ) |
| | | | |
Net unrealized appreciation (depreciation) on investments (tax basis) | | $ | 12,247,069 | |
| | | | |
At March 31, 2010, the Fund had deferred tax basis capital losses occurring subsequent to October 31, 2008 of $519,133. For tax purposes, such losses will be reflected in the year ending September 30, 2010.
At March 31, 2010, the Fund had tax basis capital losses, which may be carried forward to offset future capital gains. Such losses include losses from the merger of the Thornburg Florida Intermediate Municipal Fund. Utilization of these losses may be subject to limitations from the IRS regulations. To the extent such carry forwards are used, capital gain distributions may be reduced to the extent provided by regulations.
Such capital loss carryforwards expire as follows:
| | | |
2011 | | $ | 11,597 |
2012 | | | 4,297,982 |
2013 | | | 39,577 |
2017 | | | 391,762 |
| | | |
| | $ | 4,740,918 |
| | | |
OTHER NOTES
Fund management believes no events have occurred between March 31, 2010 and May 20, 2010, the date of issuance of the financial statements, that require adjustment of, or disclosure in, the accompanying financial statements.
Certified Semi-Annual Report 27
| | |
| FINANCIAL HIGHLIGHTS | | |
| |
| Thornburg Intermediate Municipal Fund | | |
| | | | | | | | | | | | | | | | | | | | | | | | | | | | | | | | | | | | | | | | | | |
| | | PER SHARE PERFORMANCE (for a share outstanding throughout the period) | | RATIOS TO AVERAGE NET ASSETS | | | SUPPLEMENTAL DATA |
Unless
Otherwise
Noted, Periods
are Fiscal Years
Ended Sept. 30, | | Net Asset
Value
Beginning
of Period | | Net
Investment
Income
(Loss) | | Net
Realized
& Unrealized
Gain (Loss)
on
Investments | | | Total from
Investment
Operations | | | Dividends
from Net
Investment
Income | | | Dividends
from Net
Realized
Gains | | Total
Dividends | | | Net Asset
Value
End of
Period | | Net
Investment
Income
(Loss) (%) | | | Expenses,
After
Expense
Reductions
(%) | | | Expenses,
After
Expense
Reductions
and Net of
Custody
Credits
(%) | | | Expenses,
Before Expense
Reductions
(%) | | | Total
Return
(%)(a) | | | Portfolio
Turnover
Rate (%) | | Net Assets
at End of
Period
(Thousands) |
Class A Shares | | | | | | | | | | | | | | | | | | | | | | | | | | | | | | | | | | | | | | | | | | |
2010(b)(c) | | $ | 13.40 | | 0.25 | | (0.19 | ) | | 0.06 | | | (0.25 | ) | | — | | (0.25 | ) | | $ | 13.21 | | 3.86 | (d) | | 0.97 | (d) | | 0.97 | (d) | | 0.97 | (d) | | 0.50 | | | 5.37 | | $ | 368,360 |
2009(c) | | $ | 12.47 | | 0.54 | | 0.93 | | | 1.47 | | | (0.54 | ) | | — | | (0.54 | ) | | $ | 13.40 | | 4.26 | | | 0.98 | | | 0.98 | | | 0.98 | | | 12.12 | | | 15.15 | | $ | 337,037 |
2008(c) | | $ | 13.15 | | 0.52 | | (0.68 | ) | | (0.16 | ) | | (0.52 | ) | | — | | (0.52 | ) | | $ | 12.47 | | 3.95 | | | 0.96 | | | 0.95 | | | 0.96 | | | (1.33 | ) | | 22.00 | | $ | 311,435 |
2007(c) | | $ | 13.30 | | 0.51 | | (0.15 | ) | | 0.36 | | | (0.51 | ) | | — | | (0.51 | ) | | $ | 13.15 | | 3.84 | | | 0.99 | | | 0.98 | | | 0.99 | | | 2.74 | | | 22.55 | | $ | 333,800 |
2006(c) | | $ | 13.33 | | 0.49 | | (0.03 | ) | | 0.46 | | | (0.49 | ) | | — | | (0.49 | ) | | $ | 13.30 | | 3.74 | | | 0.99 | | | 0.99 | | | 1.00 | | | 3.57 | | | 18.95 | | $ | 366,702 |
2005(c) | | $ | 13.48 | | 0.49 | | (0.15 | ) | | 0.34 | | | (0.49 | ) | | — | | (0.49 | ) | | $ | 13.33 | | 3.66 | | | 0.99 | | | 0.99 | | | 1.01 | | | 2.57 | | | 20.06 | | $ | 362,783 |
Class C Shares | | | | | | | | | | | | | | | | | | | | | | | | | | | | | | | | | | | | | | | | | | |
2010(b) | | $ | 13.42 | | 0.24 | | (0.19 | ) | | 0.05 | | | (0.24 | ) | | — | | (0.24 | ) | | $ | 13.23 | | 3.59 | (d) | | 1.24 | (d) | | 1.24 | (d) | | 1.74 | (d) | | 0.36 | | | 5.37 | | $ | 100,984 |
2009 | | $ | 12.48 | | 0.50 | | 0.94 | | | 1.44 | | | (0.50 | ) | | — | | (0.50 | ) | | $ | 13.42 | | 3.99 | | | 1.24 | | | 1.24 | | | 1.76 | | | 11.90 | | | 15.15 | | $ | 80,571 |
2008 | | $ | 13.16 | | 0.48 | | (0.68 | ) | | (0.20 | ) | | (0.48 | ) | | — | | (0.48 | ) | | $ | 12.48 | | 3.67 | | | 1.25 | | | 1.24 | | | 1.75 | | | (1.61 | ) | | 22.00 | | $ | 59,243 |
2007 | | $ | 13.31 | | 0.47 | | (0.15 | ) | | 0.32 | | | (0.47 | ) | | — | | (0.47 | ) | | $ | 13.16 | | 3.59 | | | 1.24 | | | 1.24 | | | 1.78 | | | 2.48 | | | 22.55 | | $ | 53,890 |
2006 | | $ | 13.34 | | 0.46 | | (0.03 | ) | | 0.43 | | | (0.46 | ) | | — | | (0.46 | ) | | $ | 13.31 | | 3.49 | | | 1.24 | | | 1.24 | | | 1.78 | | | 3.31 | | | 18.95 | | $ | 55,497 |
2005 | | $ | 13.50 | | 0.46 | | (0.16 | ) | | 0.30 | | | (0.46 | ) | | — | | (0.46 | ) | | $ | 13.34 | | 3.41 | | | 1.25 | | | 1.24 | | | 1.80 | | | 2.24 | | | 20.06 | | $ | 55,382 |
Class I Shares | | | | | | | | | | | | | | | | | | | | | | | | | | | | | | | | | | | | | | | | | | |
2010(b) | | $ | 13.39 | | 0.27 | | (0.19 | ) | | 0.08 | | | (0.27 | ) | | — | | (0.27 | ) | | $ | 13.20 | | 4.17 | (d) | | 0.66 | (d) | | 0.66 | (d) | | 0.66 | (d) | | 0.65 | | | 5.37 | | $ | 141,049 |
2009 | | $ | 12.45 | | 0.57 | | 0.94 | | | 1.51 | | | (0.57 | ) | | — | | (0.57 | ) | | $ | 13.39 | | 4.59 | | | 0.66 | | | 0.66 | | | 0.68 | | | 12.56 | | | 15.15 | | $ | 125,709 |
2008 | | $ | 13.13 | | 0.56 | | (0.68 | ) | | (0.12 | ) | | (0.56 | ) | | — | | (0.56 | ) | | $ | 12.45 | | 4.28 | | | 0.64 | | | 0.63 | | | 0.64 | | | (1.02 | ) | | 22.00 | | $ | 171,848 |
2007 | | $ | 13.28 | | 0.55 | | (0.15 | ) | | 0.40 | | | (0.55 | ) | | — | | (0.55 | ) | | $ | 13.13 | | 4.16 | | | 0.67 | | | 0.67 | | | 0.73 | | | 3.06 | | | 22.55 | | $ | 125,890 |
2006 | | $ | 13.31 | | 0.54 | | (0.03 | ) | | 0.51 | | | (0.54 | ) | | — | | (0.54 | ) | | $ | 13.28 | | 4.07 | | | 0.67 | | | 0.67 | | | 0.75 | | | 3.90 | | | 18.95 | | $ | 89,589 |
2005 | | $ | 13.46 | | 0.53 | | (0.15 | ) | | 0.38 | | | (0.53 | ) | | — | | (0.53 | ) | | $ | 13.31 | | 3.98 | | | 0.67 | | | 0.67 | | | 0.77 | | | 2.90 | | | 20.06 | | $ | 52,037 |
| (a) | Not annualized for periods less than one year. |
| (b) | Unaudited Six Month Period Ended March 31. |
| (c) | Sales loads are not reflected in computing total return. |
See notes to financial statements.
| | |
| 28 Certified Semi-Annual Report | | Certified Semi-Annual Report 29 |
| | |
| EXPENSE EXAMPLE | | |
| |
| Thornburg Intermediate Municipal Fund | | March 31, 2010 (Unaudited) |
As a shareholder of the Fund, you incur two types of costs:
| | (1) | transaction costs, including |
(a) sales charges (loads) on purchase payments, for Class A shares;
(b) a deferred sales charge on redemptions of any part or all of a purchase of $1 million of Class A shares within 12 months of purchase;
(c) a deferred sales charge on redemptions of Class C shares within 12 months of purchase;
| | (2) | ongoing costs, including management fees; distribution and/or service (12b-1) fees; and other Fund expenses. |
This example is intended to help you understand your ongoing costs (in dollars) of investing in the Fund and to compare these costs with the ongoing costs of investing in other mutual funds.
The example is based on a $1,000 investment beginning on October 1, 2009, and held until March 31, 2010.
ACTUAL EXPENSES
For each class of shares, the first line of the table at right provides information about actual account values and actual expenses. You may use the information in this line, together with the amount you invested, to estimate the expenses that you paid over the period. Simply divide your account value by $1,000 (for example, an $8,600 account value divided by $1,000 = 8.6), then multiply the result by the number in the first line for your class of shares under the heading entitled “Expenses Paid During Period” to estimate the expenses you paid on your account during this period.
HYPOTHETICAL EXAMPLE FOR COMPARISON PURPOSES
For each class of shares, the second line of the table at right provides information about hypothetical account values and hypothetical expenses based on the Fund’s actual expense ratio and an assumed rate of return of 5% per year before expenses, which is not the Fund’s actual return. The hypothetical account values and expenses may not be used to estimate the actual ending account balance or expenses you paid for the period. You may use this information to compare the ongoing costs of investing in the Fund and other funds. To do so, compare this 5% hypothetical example with the 5% hypothetical examples that appear in the shareholder reports of the other funds.
| | | | | | | | | |
| | | Beginning
Account Value
10/1/09 | | Ending
Account Value
3/31/10 | | Expenses Paid
During Period†
10/1/09–3/31/10 |
Class A Shares | | | | | | | | | |
Actual | | $ | 1,000.00 | | $ | 1,005.00 | | $ | 4.83 |
Hypothetical* | | $ | 1,000.00 | | $ | 1,020.11 | | $ | 4.87 |
Class C Shares | | | | | | | | | |
Actual | | $ | 1,000.00 | | $ | 1,003.60 | | $ | 6.19 |
Hypothetical* | | $ | 1,000.00 | | $ | 1,018.75 | | $ | 6.24 |
Class I Shares | | | | | | | | | |
Actual | | $ | 1,000.00 | | $ | 1,006.50 | | $ | 3.30 |
Hypothetical* | | $ | 1,000.00 | | $ | 1,021.64 | | $ | 3.33 |
| † | Expenses are equal to the annualized expense ratio for each class (A: 0.97%; C: 1.24%; I: 0.66%) multiplied by the average account value over the period, multiplied by 182/365 to reflect the one-half year period. |
| * | Hypothetical assumes a rate of return of 5% per year before expenses. |
Please note that the expenses shown in the table are meant to highlight your ongoing costs only and do not reflect any transactional costs, such as sales charges (loads), redemption fees, or exchange fees. Therefore, the second line of the table for each class of shares is useful in comparing ongoing costs only, and will not help you determine the relative total costs of owning different funds. In addition, if these transactional costs were included, your costs would have been higher.
30 Certified Semi-Annual Report
| | |
OTHER INFORMATION | | |
| |
| Thornburg Intermediate Municipal Fund | | March 31, 2010 (Unaudited) |
PORTFOLIO PROXY VOTING
Policies and Procedures:
The Trust has delegated to Thornburg Investment Management, Inc. (the “Advisor”) voting decisions respecting proxies for the Fund’s voting securities. The Advisor makes voting decisions in accordance with its Proxy Voting Policy and Procedures. A description of the Policy and Procedures is available (i) without charge, upon request, by calling the Advisor toll-free at 1-800-847-0200, (ii) on the Thornburg website at www.thornburg.com, and (iii) on the Securities and Exchange Commission’s website at www.sec.gov.
Information regarding how proxies were voted is available on or before August 31 of each year for the twelve months ending the preceding June 30. This information is available (i) without charge, upon request by calling the Advisor toll-free at 1-800-847-0200, (ii) on the Thornburg website at www.thornburg.com, and (iii) on the Securities and Exchange Commission’s website at www.sec.gov.
AVAILABILITY OF QUARTERLY PORTFOLIO SCHEDULE
The Fund files with the Securities and Exchange Commission schedules of its portfolio holdings on Form N-Q for the first and third quarters of each fiscal year. The Fund’s Forms N-Q are available on the Commission’s website at www.sec.gov, or may be reviewed and copied at the Commission’s Public Reference Room in Washington, D.C. Information on the operation of the Public Reference Room may be obtained by calling 1-800-SEC-0330. The Fund also makes this information available on its website at www.thornburg.com/ download or upon request by calling 1-800-847-0200.
Certified Semi-Annual Report 31
Trustees’ Statement to Shareholders
Not part of the Certified Semi-Annual Report
February 8, 2005, as readopted July 22, 2009
The Trustees are concerned that ongoing commentaries and opinions reported in the media may confuse investors in general as to the supervisory duties of trustees of mutual funds and, in particular, leave Thornburg Investment Trust shareholders uncertain regarding how we discharge our responsibilities in supervising the Funds’ investment advisor and in reviewing the advisor’s contract for renewal. We decided to spell out clearly three principal guidelines that we follow in supervising the Trust’s investment advisor on your behalf.
We begin with the premise that each shareholder selected his or her Fund because its investments are managed by the investment advisor identified in the prospectus and in accordance with the objective and policies described in the prospectus. We realize, as each of you do, that if you believe that your Fund’s stated objective and policies no longer serve your personal investment goals, you can sell your shares and leave the Fund.
Therefore, we believe that our primary supervisory task – our principal obligation to you – is to assess the nature and quality of the advisor’s services, and to confirm that the advisor actively and competently pursues the Fund’s objective, in accordance with the policies set out in the prospectus. To do this, we meet regularly with management to review your Fund’s portfolio and to discuss the advisor’s specific actions and judgments in pursuing the Fund’s objective. We do not substitute our own judgment for the advisor’s decisions in selecting investments; the advisor is paid to exercise its informed judgment on investment decisions, and we seek to confirm, in reviewing the advisor’s performance, that the advisor is doing just that.
Second, while we are conscious of costs and the effect that costs have on shareholders’ returns, we do not seek the lowest fees or expense ratio as our sole or primary objective. We try to make sure that your Fund’s fees and costs are reasonable in relationship to the services rendered and that they are generally in line with those charged by other expert investment advisors, consistent with our belief that the Fund’s investors searched for and expect that expertise and attention and have decided to pay a reasonable price for it. We do not put the management contract “out to bid” as a matter of course, and we would not do so unless we had concluded that the advisor materially had failed to pursue the Fund’s objectives in accordance with its policies, or for other equally important reasons. We believe that any other approach would be inconsistent with your interests and contrary to your expectations when you bought shares of the Fund in the first place.
Finally, because we believe that most Thornburg Fund shareholders have invested with a long-term perspective, we try not to focus too much on the fashions of the moment and on short-term performance. The market will not favor any specific investment objective or set of policies at all times and under all economic circumstances. A fund will experience periods of both high and low returns relative to other funds and other investments. Even if one of our Funds is not favored by the market at a particular time, we believe that the advisor is nonetheless obliged to remain true to the Fund’s objective and policies, and we watch to see that it does so.
32 This page is not part of the Semi-Annual Report.
Retirement and Education Accounts
Thornburg Investment Management offers retirement and education savings accounts that can help you meet a variety of planning challenges. For account applications or further information on any of the accounts below, please call 1-800-847-0200 or go to www.thornburg.com/ira. Your financial advisor can help you determine which plan is right for you.
Individual Retirement Accounts
Individual Retirement Accounts (IRAs) provide a tax-advantaged means to save money for the future. For a detailed outline of the difference between retirement accounts, see www.thornburg.com/ira. Rollovers are available. Call 1-800-847-0200 for more information.
Traditional IRAs – Contributions to Traditional IRAs are tax deductible for eligible individuals, and withdrawals are taxed as additional ordinary income. You may contribute to an IRA if you receive compensation and are under 70 1/ 2, even if you are covered by an employer retirement plan. Deductible contributions are subject to certain qualifications. Please consult your tax advisor.
Roth IRAs – Under a Roth IRA, there is no tax deduction for contributions, but there is no income tax on qualified withdrawals. For a more detailed comparison of Traditional and Roth IRAs, please see our web site at www.thornburg.com/ira.
SEP IRAs – Simplified Employee Pension (SEP) IRAs are established by employers. The employer is allowed a tax deduction for contributions made to the SEP Plan and makes contributions to each eligible employee’s SEP IRA on a discretionary basis.
SIMPLE IRAs – Savings Incentive Match Plan for Employees of Small Employers (SIMPLE) is designed to give small business owners a simplified method to establish and contribute to a retirement plan for employees. The employer is allowed a tax deduction for contributions and makes either matching or non-elective contributions to each eligible employee’s SIMPLE IRA. Employees may make salary deferral contributions.
Coverdell Education Savings Account
These savings accounts are designed to provide a way to save money for higher education expenses. In an Education Savings Account, earnings and interest grow tax-free, and qualified withdrawals used to pay for eligible higher-education expenses are tax- and penalty-free.
Funds Available
The following funds are available in the accounts listed above:
| | • | | Thornburg International Value Fund |
| | • | | Thornburg Core Growth Fund |
| | • | | Thornburg Investment Income Builder Fund |
| | • | | Thornburg Global Opportunities Fund |
| | • | | Thornburg International Growth Fund |
| | • | | Thornburg Developing World Fund |
| | • | | Thornburg Limited Term U.S. Government Fund |
| | • | | Thornburg Limited Term Income Fund |
| | • | | Thornburg Strategic Income Fund |
This page is not part of the Semi-Annual Report. 33

34 This page is not part of the Semi-Annual Report.
Thornburg Equity Funds
Thornburg’s equity research uses a fundamental and comprehensive analytical approach. Thornburg equity funds focus on a limited number of securities so that each holding can impact performance. The equity team searches for firms believed to have a promising future and seeks to buy shares of those companies at a discount to their intrinsic value.
| | • | | Thornburg International Value Fund |
| | • | | Thornburg Core Growth Fund |
| | • | | Thornburg Investment Income Builder Fund |
| | • | | Thornburg Global Opportunities Fund |
| | • | | Thornburg International Growth Fund |
| | • | | Thornburg Developing World Fund |
Thornburg Bond Funds
Thornburg Investment Management applies a disciplined philosophy to fixed-income management. Since the launch of our first fixed-income fund over 25 years ago, we have been conducting fundamental, bottom-up research in an effort to identify bonds which we believe provide the best return for a given level of risk. We are very organic in our approach, avoiding leverage or complex strategies which could backfire in periods of market uncertainty.
| | • | | Thornburg Limited Term Municipal Fund |
| | • | | Thornburg Intermediate Municipal Fund |
| | • | | Thornburg California Limited Term Municipal Fund |
| | • | | Thornburg New Mexico Intermediate Municipal Fund |
| | • | | Thornburg New York Intermediate Municipal Fund |
| | • | | Thornburg Strategic Municipal Income Fund |
| | • | | Thornburg Limited Term U.S. Government Fund |
| | • | | Thornburg Limited Term Income Fund |
| | • | | Thornburg Strategic Income Fund |
Before investing, carefully consider the Fund’s investment goals, risks, charges, and expenses. For a prospectus containing this and other information, contact your financial advisor or visit thornburg.com. Read it carefully before investing.
For additional information, please visit www.thornburg.com
Thornburg Investment Management, Inc. 2300 North Ridgetop Road, Santa Fe, NM 87506
This page is not part of the Semi-Annual Report. 35
| | | | | | |
 | | Waste not, | | 
|
| | Wait not | |
| | | | Get instant access to your shareholder reports. |
| | |
| | This Semi-Annual Report is submitted for the general information of shareholders of the Fund. It is not authorized for distribution to prospective investors in the Fund unless preceded or accompanied by an effective prospectus. | | By switching from your postal mailbox to your email inbox, you reduce paper clutter, improve record keeping access, and help conserve our natural resources. |

| | Investment Advisor: | | Go to www.thornburg.com/edelivery and sign up to receive your shareholder reports, prospectuses, and proxy statements electronically. |
| | Thornburg Investment Management® 800.847.0200 | |
| | Distributor: | | |
| | Thornburg Securities Corporation® 800.847.0200 | | You invest in the future, without spending a dime. |
| | TH172 | | |

Important Information
The information presented on the following pages is current as of March 31, 2010. The managers’ views, portfolio holdings, and sector diversification are provided for the general information of the Fund’s shareholders; they are historical and subject to change. This material should not be deemed a recommendation to buy or sell any of the securities mentioned.
Investments in the Fund carry risks, including possible loss of principal. Bond funds have the same interest rate, inflation, and credit risks that are associated with the underlying bonds. The principal value of bonds will fluctuate relative to changes in interest rates, decreasing when interest rates rise. This effect is more pronounced for longer-term bonds. Unlike bonds, bond funds have ongoing fees and expenses. Investments in lower-rated and unrated bonds may be more sensitive to default, downgrades, and market volatility; these investments may also be less liquid than higher-rated bonds. Investments in derivatives are subject to the risks associated with the securities or other assets underlying the pool of securities, including illiquidity and difficulty in valuation. Please see the Fund’s Prospectus for a discussion of the risks associated with an investment in the Fund. Investments in the Fund are not FDIC insured, nor are they deposits of or guaranteed by a bank or any other entity. There is no guarantee that the Fund will meet its investment objectives.
Performance data shown represents past performance and is no guarantee of future results. Investment return and principal value will fluctuate so shares, when redeemed, may be worth more or less than their original cost. Current performance may be lower or higher than quoted. For performance current to the most recent month end, visit thornburg.com.
Performance data given at net asset value (NAV) does not take into account applicable sales charges. If the sales charges had been included, the performance would have been lower.
Minimum investments for Class I shares are higher than those for other classes. Class I shares may not be available to all investors.
| | | | |
Share Class | | NASDAQ Symbol | | Cusip |
Class A | | TSSAX | | 885-216-101 |
Class C | | TSSCX | | 885-216-200 |
Class I | | TSSIX | | 885-216-309 |
Glossary
Bank of America (BofA) Merrill Lynch Municipal Master Index – This index tracks the performance of the investment-grade U.S. tax-exempt bond market. Qualifying bonds must have at least one year remaining term to maturity, a fixed coupon schedule, and an investment grade rating (based on average of Moody’s, S&P, and Fitch).
Morningstar High-Yield Municipal Fund Category – High-yield muni portfolios invest at least 50% of assets in high-income municipal securities that are not rated or that are rated by a major agency such as Standard & Poor’s or Moody’s at the level of BBB and below.
Unless otherwise noted, index returns reflect the reinvestment of income dividends and capital gains, if any, but do not reflect fees, brokerage commissions or other expenses of investing. Investors may not make direct investments into any index.
Alternative Minimum Tax (AMT) – A federal tax aimed at ensuring that high-income individuals, estates, trusts, and corporations pay a minimal level income tax. For individuals, the AMT is calculated by adding tax preference items to regular taxable income.
Annualized Distribution Yield – The distribution yield is calculated by taking the sum of the month’s total distribution factors and dividing this sum by a 30-day period and annualizing to a 360-day year. The value is then divided by the ending maximum offering price per share to arrive at the annualized distribution yield. The yield is calculated on a periodic basis and is subject to change.
Bond Credit Ratings – A bond credit rating assesses the financial ability of a debt issuer to make timely payments of principal and interest. Ratings of AAA (the highest), AA, A, and BBB are investment-grade quality. Ratings of BB, B, CCC, CC, C, and D (the lowest) are considered below investment grade, speculative grade, or junk bonds. Unless otherwise noted, the ratings listed are from Municipal Market Data and are a combination of ratings from Standard and Poor’s, Moody’s Investors Service, and Fitch Ratings.
Duration – The weighted maturity of a bond’s cash flows. Duration measures the price sensitivity of a bond for a given change in interest rates. Bonds with longer durations experience greater price volatility than bonds with shorter durations.
Fed Funds Rate – The Fed Funds Rate is the interest rate at which a depository institution lends immediately available funds (balances at the Federal Reserve) to another depository institution overnight.
General Obligation (GO) Bonds – A municipal bond secured by the pledge of the issuer’s full faith, credit, and taxing power rather than the revenue from a given project.
Leverage – The amount of debt used to finance a firm’s assets. A firm with significantly more debt than equity is considered to be highly leveraged.
Revenue Bond – A bond on which the debt service is payable solely from the revenue generated from the operation of the project being financed or a category of facilities, or from other non-tax sources.
U.S. Treasury Securities – U.S. Treasury securities, such as bills, notes and bonds, are negotiable debt obligations of the U.S. government. These debt obligations are backed by the “full faith and credit” of the government and issued at various schedules and maturities. Income from Treasury securities is exempt from state and local, but not federal income taxes.
This page is not part of the Semi-Annual Report. 3

Thornburg Strategic Municipal Income Fund
March 31, 2010
Table of Contents
This report is certified under the Sarbanes-Oxley Act of 2002, which requires that public companies, including mutual funds, affirm that the information provided in their annual and semiannual shareholder reports fully and fairly represents their financial position.
4 Certified Semi-Annual Report
Letter to Shareholders
| | |

George Strickland Co-Portfolio Manager | | April 15, 2010 Dear Fellow Shareholder: We are pleased to present the semi-annual report for the Thornburg Strategic Municipal Income Fund. The net asset value of the Class A shares declined by 27 cents to $13.59 during the six months ended March 31, 2010. If you were with us for the entire period, you received dividends of 31.9 cents per share. If you reinvested your dividends, you received 32.2 cents per share. Dividends per share were lower for Class C shares and higher for Class I shares to account for varying class-specific expenses. |
| |
| |

Josh Gonze Co-Portfolio Manager 
Christopher Ryon, CFA Co-Portfolio Manager | | After a couple of years of unprecedented volatility, the municipal bond market has regained its status as one of the least exciting U.S. capital markets. While we embrace the new reality – slow and steady is what we strive for – we do not entirely trust it. Like other U.S. markets, the municipal market is benefiting from U.S. Treasury and Federal Reserve Bank support. By setting the Fed Funds Rate effectively at 0%, the Federal Open Market Committee (FOMC) is basically pushing hundreds of billions of dollars into bonds and bond funds. Flows into bond funds were $357 billion last year and may reach that level again this year. While we do not expect the Fed to hike the Fed Funds Rate soon, it is a reasonable bet that the next move will not be down. A significantly higher Fed Funds Rate, if and when it materializes, would likely not be good for bond fund flows or bond prices. |
| | The second major element of federal support has been the implementation of the Build America Bond (BAB) program. This program allows municipalities to issue taxable bonds for qualified projects and receive a subsidy of 35% of their interest cost from the federal government. The program has been very popular, with almost $100 billion issued since the first deal was sold in April 2009. BAB issues currently account for over 30% of new issue municipal bond supply, crowding out much of the supply of traditional tax-exempt bonds. The reduced supply, coupled with heavy demand for bonds, has provided significant support to municipal bond prices. The BAB program is scheduled to expire at the end of this year, but will probably be extended, most likely with a reduced subsidy. Depending upon the final form of the program, we may see the balance shift back to more traditional tax-exempt issuance in 2011, which could erode some support for bond prices. |
| |
| | Another part of the American Recovery and Reinvestment Act allocated approximately $280 billion to the states for various stimulus-related projects. The federal dollars helped the states close over $300 billion of budget gaps during the current recession, but most of that money will be spent by June 30, 2011. If tax revenues come back strongly over the next 12-24 months, the disappearing stimulus money may not be missed. However, if tax revenues are slow to bounce back, budget balancing will remain a perilous task. Working in the opposite direction, higher tax rates should bolster demand for tax-exempt municipals, as Bush tax cuts expire and the highest marginal tax rates climb back up to 39.6% from 35%. |
Certified Semi-Annual Report 5
| | |
| Letter to Shareholders, | | |
| |
| Continued | | |
On top of this, the recently signed health insurance reform law applies Medicare taxes to virtually all investment income except interest from tax-exempt municipal bonds. We believe that the status of municipal bonds as perhaps the last true legal tax shelter available to investors is not fully priced into the market.
The U.S. economy apparently hit bottom last summer and has been growing the last three quarters. However, payroll employment growth just showed up last month, and so many jobs were lost in the last two years that it will take several years of robust growth just to get back down to 6% unemployment. Most banks are still very reluctant to increase lending, and core consumer price inflation has slowed to a level not seen since 1960. So, despite the large amount of additional debt (particularly from the U.S. Treasury) coming into the marketplace, we don’t expect a dramatic rise in interest rates this year.
After three quarters of positive GDP growth, state tax revenues are still falling. The fourth quarter of 2009 marks the fifth consecutive quarter of declining state tax revenues. The rate of decline has moderated to 4.2% from a peak of 16.5% in the second quarter, but state tax revenues are still down over 8% from levels two years ago. Prior to the current downturn, state tax revenues grew 5 to 5.5% on average for two decades, allowing budgets and entitlements to expand at an unsustainable pace. Most states are going through a very difficult adjustment process and are dealing with shrinking tax revenues in very different ways. In general, we have favored states that set aside large reserve balances when times were better, and cut budgets and/or found new ongoing revenue streams when tax revenues declined. A few states have primarily added to debt loads, borrowed from future revenues, delayed payments and pension contributions, or used other accounting gimmicks to balance their budgets. These states seem to be making the assumption that tax revenues will bounce back strongly. There has been some recent improvement in revenues from some states in the early months of 2010, but it is still too early to count on. We will have to monitor the numbers carefully to determine if the more aggressive states get bailed out by rapid revenue growth or end up confronting even worse challenges ahead.
Tax revenues have held up much better at the local level, not yet going negative and growing 4.6% in the fourth quarter of 2009. Most local governments rely heavily on property taxes, which have traditionally been quite stable, and have proven to be so even in the worst real estate downturn in decades. Real estate taxes take a while to adjust and there are some areas of the country that are starting to see significantly lower tax revenues as properties make their way through the appeal process. We are watching these trends as they develop. Revenue bonds such as municipal utility bonds, hospital bonds, and toll roads have generally held up quite well in the current recession, and we continue to find issuers we like in these sectors. Hospitals, in particular, appear to be one of the few clear winners emerging from the recent health care reform.
Despite much improved market liquidity, strong demand for bonds, and general economic optimism, it is clearly a time for careful diligence and diversification of investment portfolios. Your Fund is broadly diversified and 75% invested in bonds rated BBB or above by at least one of the major rating agencies. The Fund is permitted by prospectus to invest up to 50% of assets in speculative grade (below BBB-) bonds, but currently has only 9.4% of assets in this category. We may increase this allocation if the credit environment improves or if credit spreads become more attractive, but see no reason to do this now. We do have 15.1% of the portfolio allocated to non-rated bonds that carry acceptable credit characteristics for the Fund, in our opinion. Your Thornburg Strategic Municipal Income Fund is a diversified portfolio of over 100 municipal obligations from 29 states. It is designed to take on more credit and interest rate risk when we believe the municipal bond market is offering an attractive risk/reward trade-off, and less risk when we believe it is not. Currently, municipal credit
6 Certified Semi-Annual Report
spreads are quite wide relative to historic averages, but the credit environment is tenuous. Default rates on speculative grade bonds have been elevated for the last two years, and some investment-grade issuers such as Harrisburg, PA, and Jefferson County, AL, have fallen on hard times. Significant challenges lie ahead for municipal issuers, and we will strive to capitalize on opportunities and avoid pitfalls wherever possible.
The Class A shares of your Fund produced a total return of 1.24% over the six-month period ended March 31, 2010, compared to a negative 0.02% return for the BofA Merrill Lynch Municipal Master Index. Over the last six months, lower rated bonds generally outperformed higher rated bonds, and revenue bonds generally outperformed general obligation bonds. The Fund’s overweight of revenue bonds and lower rated bonds relative to the index contributed to its outperformance.
We started this Fund on April 1, 2009 because we saw an opportunity to capitalize on the severe financial dislocation that arose from the demise of the monoline bond insurers, municipal-focused hedge funds and other leveraged investors. Much of that dislocation has abated, largely due to government intervention, but significant opportunities still exist. We plan to capitalize on those opportunities wherever possible, using our fundamental, bottom-up, careful approach to portfolio construction. Thank you for investing in the Thornburg Strategic Municipal Income Fund.
Sincerely,
| | | | | | |
 | |  | |  | | |
| George Strickland | | Josh Gonze | | Christopher Ryon,CFA | | |
| Co-Portfolio Manager | | Co-Portfolio Manager | | Co-Portfolio Manager | | |
| Managing Director | | Managing Director | | Managing Director | | |
The matters discussed in this report may constitute forward-looking statements made pursuant to the safe harbor provisions of the Securities Litigation Reform Act of 1995. These include any advisor or portfolio manager prediction, assessment, analysis or outlook for individual securities, industries, investment styles, market sectors and/or markets. These statements involve risks and uncertainties. In addition to the general risks described for each fund in its current prospectus, other factors bearing on these reports include the accuracy of the advisor’s or portfolio manager’s forecasts and predictions, the appropriateness of the investment strategies designed by the advisor or portfolio manager and the ability of the advisor or portfolio manager to implement their strategies efficiently and successfully. Any one or more of these factors, as well as other risks affecting the securities markets generally, could cause the actual results of any fund to differ materially as compared to its benchmarks.
Certified Semi-Annual Report 7
| | |
| SCHEDULE OF INVESTMENTS | | |
| |
| Thornburg Strategic Municipal Income Fund | | March 31, 2010 (Unaudited) |
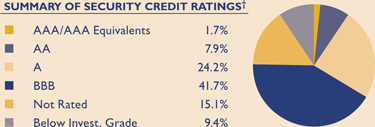
We have used ratings from Standard & Poor’s (S&P). Where S&P ratings are not available, we have used Moody’s Investors Service. Where neither rating is available, we have used ratings from Fitch Ratings. The category of investments identified as “AAA” in this graph includes investments which are pre-refunded or escrowed to maturity. Such investments are backed by an escrow or trust containing sufficient U.S. Government or U.S. Government agency securities to satisfy the timely payment of principal and interest and, therefore, are normally deemed to be equivalent to AAA-rated securities.
| | | | | | | | |
Issuer-Description | | Credit Rating†
S&P/ Moody’s | | Principal
Amount | | Value |
ARIZONA — 2.40% | | | | | | | | |
Maricopa County PCR, 6.00% due 5/1/2029 put 5/1/2014 (Arizona Public Service Co.) | | BBB-/Baa2 | | $ | 500,000 | | $ | 524,515 |
Salt Verde Financial Corp., 5.25% due 12/1/2028 | | A/A3 | | | 235,000 | | | 223,965 |
University Medical Center Corp., 6.25% due 7/1/2029 | | BBB+/Baa1 | | | 100,000 | | | 105,816 |
University Medical Center Corp., 6.50% due 7/1/2039 | | BBB+/Baa1 | | | 275,000 | | | 291,629 |
| | | |
CALIFORNIA — 18.40% | | | | | | | | |
| | | |
California Financial Authority Revenue, 8.50% due 11/1/2039 (Harbor Regulation) | | NR/Ba1 | | | 1,000,000 | | | 1,009,710 |
California HFA, 0% due 8/1/2029 (Insured: AMBAC/FHA/VA) | | AA-/Aa3 | | | 2,135,000 | | | 674,446 |
California State Department of Water Resources Power Supply, 0.27% due 5/1/2022 put 4/1/2010 (Insured: Bank of New York) (daily demand notes) | | A-1+/
VMIG1 | | | 500,000 | | | 500,000 |
California State Public Works Board, 6.25% due 4/1/2034 | | BBB+/Baa2 | | | 100,000 | | | 102,909 |
California Statewide Communities Development Authority, 6.125% due 7/1/2046 (Aspire Public Schools) | | NR/NR | | | 1,000,000 | | | 969,500 |
Carson Redevelopment Agency Tax Allocation, 7.00% due 10/1/2036 (Project Area 1) | | A-/NR | | | 500,000 | | | 544,115 |
Daly County Housing Development Finance Agency, 5.25% due 12/15/2023 (Franciscan Mobile Park) | | A-/NR | | | 650,000 | | | 599,229 |
Irvine Ranch Water District GO, 0.27% due 10/1/2041 put 4/1/2010 (Community Facilities District; LOC: Bank of America) (daily demand notes) | | A-1/VMIG1 | | | 300,000 | | | 300,000 |
Lee Lake Water District, 5.875% due 9/1/2027 | | NR/NR | | | 500,000 | | | 420,825 |
Los Angeles COP, 5.70% due 2/1/2018 | | NR/Baa2 | | | 750,000 | | | 750,135 |
Los Angeles Department of Water & Power, 0.27% due 7/1/2034 put 4/1/2010 (SPA: Bank of America N.A.) (daily demand notes) | | A-1/VMIG1 | | | 300,000 | | | 300,000 |
M-S-R Energy Authority, 6.50% due 11/1/2039 | | A/NR | | | 1,000,000 | | | 1,065,880 |
Merced Redevelopment Agency Tax Allocation, 6.50% due 9/1/2039 (Merced Gateways) | | A-/NR | | | 300,000 | | | 305,472 |
Oak Park USD GO, 0% due 8/1/2030 (Insured: AGM) | | AAA/Aa3 | | | 500,000 | | | 139,435 |
Riverside County Asset Leasing Corp., 0% due 6/1/2021 (Riverside County Hospital; Insured: Natl-Re) | | A/A2 | | | 435,000 | | | 223,390 |
San Francisco City & County Redevelopment Financing Authority Tax Allocation, 6.50% due 8/1/2039 (Mission Bay North Redevelopment) | | A-/NR | | | 250,000 | | | 262,085 |
Sonoma County Community Redevelopment Agency Tax Allocation, 6.50% due 8/1/2034 (The Springs; Insured: AGM) | | AAA/NR | | | 100,000 | | | 105,612 |
State of California, 0.29% due 5/1/2034 put 4/1/2010 (Kindergarten; LOC: Citibank/California State Teachers Retirement) (daily demand notes) | | A-1/VMIG1 | | | 500,000 | | | 500,000 |
| | | |
COLORADO — 7.92% | | | | | | | | |
| | | |
Colorado Educational & Cultural Facilities, 5.25% due 8/15/2019 (Peak to Peak Charter School; Insured: Syncora) | | A/NR | | | 100,000 | | | 102,515 |
Denver Convention Center, 5.125% due 12/1/2026 (Insured: XLCA) | | BBB-/Baa3 | | | 1,000,000 | | | 899,760 |
8 Certified Semi-Annual Report
| | |
| SCHEDULE OF INVESTMENTS, CONTINUED | | |
| |
| Thornburg Strategic Municipal Income Fund | | March 31, 2010 (Unaudited) |
| | | | | | | | |
Issuer-Description | | Credit Rating†
S&P/ Moody’s | | Principal
Amount | | Value |
Denver Convention Center, 5.00% due 12/1/2030 (Insured: Syncora) | | BBB-/Baa3 | | $ | 250,000 | | $ | 216,337 |
Denver Convention Center, 5.00% due 12/1/2035 (Insured: XLCA) | | BBB-/Baa3 | | | 250,000 | | | 208,890 |
Eagle Bend Metropolitan District GO, 5.00% due 12/1/2020 (Insured: Radian) | | A-/NR | | | 1,100,000 | | | 1,060,279 |
Eagle River Fire District, 6.625% due 12/1/2024 | | NR/NR | | | 225,000 | | | 240,145 |
Eagle River Fire District, 6.875% due 12/1/2030 | | NR/NR | | | 400,000 | | | 422,944 |
Pinery West Metropolitan District No. 2 4.50% due 12/1/2032 | | NR/NR | | | 500,000 | | | 367,990 |
Public Authority For Colorado Energy, 5.75% due 11/15/2018 (Natural Gas Purchase Revenue) | | A/A2 | | | 240,000 | | | 257,400 |
| | | |
CONNECTICUT — 2.03% | | | | | | | | |
| | | |
Connecticut Health & Educational Facilities Authority, 6.00% due 7/1/2039 (Ethel Walker School) | | BBB-/NR | | | 1,000,000 | | | 965,200 |
| | | |
DISTRICT OF COLUMBIA — 1.12% | | | | | | | | |
| | | |
Metropolitan Washington Airports Authority, 0% due 10/1/2027 (Dulles Toll Road; Insured: AGM) | | AAA/Aa3 | | | 1,500,000 | | | 533,985 |
| | | |
FLORIDA — 1.49% | | | | | | | | |
| | | |
Capital Trust Agency MFR, 5.875% due 6/1/2038 (American Opportunity Housing) | | NR/B2 | | | 380,000 | | | 163,404 |
Hollywood Community Redevelopment Agency, 5.625% due 3/1/2024 | | NR/Baa1 | | | 340,000 | | | 322,840 |
Santa Rosa Bay Bridge Authority, 0% due 7/1/2013 (Insured: Radian-IBCC) | | NR/B3 | | | 100,000 | | | 59,305 |
St. Johns County IDA, 5.625% due 8/1/2034 (Presbyterian Retirement) | | NR/NR | | | 180,000 | | | 162,074 |
| | | |
GEORGIA — 1.86% | | | | | | | | |
| | | |
Atlanta Water & Waste Water, 6.25% due 11/1/2034 | | A/Baa1 | | | 500,000 | | | 532,600 |
Main Street Natural Gas, Inc., 5.50% due 9/15/2023 (Georgia Gas) | | A/A2 | | | 350,000 | | | 355,082 |
| | | |
GUAM — 2.24% | | | | | | | | |
| | | |
Guam Government, 5.75% due 12/1/2034 (Section 30) | | BBB-/NR | | | 500,000 | | | 509,610 |
Guam Government GO, 7.00% due 11/15/2039 | | B+/NR | | | 520,000 | | | 555,859 |
| | | |
HAWAII — 0.63% | | | | | | | | |
| | | |
Hawaii State Department of Budget & Finance, 5.45% due 11/1/2023 (Hawaiian Electric Co.; Insured: Natl-Re) (AMT) | | AA/Baa1 | | | 300,000 | | | 300,054 |
| | | |
IDAHO — 0.36% | | | | | | | | |
| | | |
Madison County Hospital Revenue COP, 5.25% due 9/1/2037 | | BBB-/NR | | | 200,000 | | | 173,208 |
| | | |
ILLINOIS — 5.87% | | | | | | | | |
| | | |
Broadview Tax Increment Revenue, 5.25% due 7/1/2012 | | NR/NR | | | 750,000 | | | 749,310 |
Chicago Tax Increment, 4.70% due 11/15/2013 (Insured: AMBAC) | | NR/NR | | | 800,000 | | | 801,320 |
Illinois Educational Facilities Authority, 5.625% due 10/1/2022 (Augustana College) | | NR/Baa1 | | | 625,000 | | | 634,369 |
Illinois Finance Authority, 5.75% due 11/15/2037 (OSF Healthcare Systems) | | A/A2 | | | 330,000 | | | 326,373 |
Sangamon County School District COP, 5.875% due 8/15/2018 (Hay Edwards; Insured: ACA) | | NR/NR | | | 300,000 | | | 288,573 |
| | | |
INDIANA — 0.19% | | | | | | | | |
| | | |
Indiana Bond Bank, 5.25% due 10/15/2020 (Gas Revenue Program) | | NR/Aa3 | | | 90,000 | | | 91,132 |
| | | |
KANSAS — 1.44% | | | | | | | | |
| | | |
Wichita Multi Family Housing, 5.85% due 12/1/2025 (Lein-Brentwood Apartments) | | B/NR | | | 895,000 | | | 688,380 |
| | | |
KENTUCKY — 4.05% | | | | | | | | |
| | | |
Kentucky EDA, 0% due 10/1/2021 (Norton Healthcare, Inc.; Insured: Natl-Re) | | A/Baa1 | | | 365,000 | | | 190,074 |
Certified Semi-Annual Report 9
| | |
| SCHEDULE OF INVESTMENTS, CONTINUED | | |
| |
| Thornburg Strategic Municipal Income Fund | | March 31, 2010 (Unaudited) |
| | | | | | | | |
Issuer-Description | | Credit Rating†
S&P/ Moody’s | | Principal
Amount | | Value |
Kentucky EDA, 0% due 10/1/2022 (Norton Healthcare, Inc.; Insured: Natl-Re) | | A/Baa1 | | $ | 2,490,000 | | $ | 1,211,833 |
Owen County Waterworks Systems, 6.25% due 6/1/2039 (American Water Co.) | | BBB+/Baa2 | | | 500,000 | | | 530,365 |
| | | |
LOUISIANA — 3.82% | | | | | | | | |
| | | |
Louisiana Public Facilities Authority, 5.00% due 7/1/2032 (Black & Gold Facilities; Insured: CIFG) | | BBB-/Baa3 | | | 120,000 | | | 107,113 |
Louisiana Public Facilities Authority, 5.375% due 5/15/2043 (Ochsner Clinic Foundation) | | NR/NR | | | 500,000 | | | 440,335 |
Orleans Parish School Board GO, 0% due 2/1/2015 (Insured: FGIC) | | NR/NR | | | 255,000 | | | 189,761 |
West Feliciana Parish PCR, 6.60% due 9/1/2028 (Entergy Gulf States) | | BBB/Baa3 | | | 1,085,000 | | | 1,085,803 |
| | | |
MASSACHUSETTS — 1.55% | | | | | | | | |
| | | |
Massachusetts Development Finance Agency, 5.75% due 12/1/2042 put 5/1/2019 (Dominion Energy Brayton) | | A-/NR | | | 200,000 | | | 212,484 |
Massachusetts Educational Financing Authority, 6.00% due 1/1/2028 | | AA/NR | | | 500,000 | | | 528,285 |
| | | |
MICHIGAN — 8.29% | | | | | | | | |
| | | |
Dickinson County Healthcare Systems, 5.80% due 11/1/2024 (Insured: ACA-CBI) | | NR/NR | | | 180,000 | | | 172,809 |
Michigan Public Educational Facilities Authority, 8.75% due 9/1/2039 (Bradford Academy) | | BBB-/NR | | | 500,000 | | | 555,170 |
Michigan State Hospital Finance Authority, 5.00% due 7/15/2025 (Oakwood Obligated Group) | | A/A2 | | | 650,000 | | | 619,151 |
Michigan State Hospital Finance Authority, 5.75% due 4/1/2032 (Oakwood Obligated Group) | | A/A2 | | | 150,000 | | | 148,523 |
Michigan State Hospital Finance Authority Revenue, 5.75% due 11/15/2039 | | A/A1 | | | 1,000,000 | | | 974,940 |
Michigan State Strategic Fund, 5.00% due 8/1/2013 (NSF International) | | A-/NR | | | 300,000 | | | 319,572 |
Michigan State Strategic Fund, 5.25% due 6/1/2018 (Clark Retirement Community) | | BBB-/NR | | | 985,000 | | | 930,470 |
Michigan Strategic Fund, 7.00% due 5/1/2021 (The Detroit Edison Company; Insured: Natl-Re/IBC AMBAC) | | NR/NR | | | 200,000 | | | 232,356 |
| | | |
MINNESOTA — 1.71% | | | | | | | | |
| | | |
Dakota County Community Development Agency, 5.00% due 11/1/2022 | | NR/NR | | | 400,000 | | | 352,396 |
St. Paul Housing & Redevelopment Authority, 5.25% due 5/15/2023 (Healthpartners Obligated Group) | | NR/Baa1 | | | 100,000 | | | 98,874 |
Washington County Housing Redevelopment Authority, 5.625% due 6/1/2037 (Birchwood & Woodbury) | | NR/NR | | | 415,000 | | | 364,864 |
| | | |
MISSOURI — 0.72% | | | | | | | | |
| | | |
Kansas City Tax Increment Financing Commission, 5.00% due 3/1/2012 (Maincor) | | NR/NR | | | 340,000 | | | 341,340 |
| | | |
NEVADA — 1.08% | | | | | | | | |
| | | |
Mesquite Redevelopment Agency Tax Allocation, 7.375% due 6/1/2024 | | A-/NR | | | 500,000 | | | 515,170 |
| | | |
NEW MEXICO — 0.92% | | | | | | | | |
| | | |
Santa Fe County Charter School Foundation, 6.625% due 1/15/2036 (ATC Foundation) | | NR/NR | | | 485,000 | | | 435,908 |
| | | |
NEW YORK — 3.57% | | | | | | | | |
| | | |
Hempstead IDA, 5.00% due 12/1/2010 put 6/1/2010 (American Ref-Fuel) | | BB+/Baa2 | | | 1,000,000 | | | 1,001,600 |
New York City GO, 0.32% due 8/1/2023 put 4/1/2010 (Fiscal 2008; LOC: Allied Irish Bank plc) (daily demand notes) | | A-1/VMIG1 | | | 250,000 | | | 250,000 |
New York City GO, 0.35% due 8/1/2028 put 4/1//2010 (SPA: Dexia) (daily demand notes) | | A-1/VMIG1 | | | 200,000 | | | 200,000 |
New York City GO, 0.35% due 4/1/2035 put 4/1/2010 (SPA: Dexia) (daily demand notes) | | A-1/VMIG1 | | | 250,000 | | | 250,000 |
| | | |
OHIO — 1.35% | | | | | | | | |
| | | |
Cleveland Cuyahoga County Port Authority, 6.25% due 5/15/2016 (LOC: FifthThird Bank) | | NR/NR | | | 100,000 | | | 98,992 |
10 Certified Semi-Annual Report
| | |
| SCHEDULE OF INVESTMENTS, CONTINUED | | |
| |
| Thornburg Strategic Municipal Income Fund | | March 31, 2010 (Unaudited) |
| | | | | | | | |
Issuer-Description | | Credit Rating†
S&P/ Moody’s | | Principal
Amount | | Value |
Ohio State Water Development Authority PCR, 5.875% due 6/1/2033 put 6/1/2016 (FirstEnergy Nuclear) | | BBB-/Baa1 | | $ | 500,000 | | $ | 542,875 |
| | | |
OREGON — 2.00% | | | | | | | | |
| | | |
Western Generation Agency, 5.00% due 1/1/2016 (Wauna Cogeneration; Insured: ACA) | | NR/NR | | | 1,000,000 | | | 953,790 |
| | | |
PENNSYLVANIA — 3.48% | | | | | | | | |
| | | |
Allegheny County Redevelopment Authority, 5.10% due 7/1/2014 (Pittsburgh Mills) | | NR/NR | | | 220,000 | | | 211,565 |
Pennsylvania EDA, 5.00% due 12/1/2014 (Colver Project; Insured: AMBAC) (AMT) | | BBB-/Ba1 | | | 450,000 | | | 445,001 |
Philadelphia IDA, 6.00% due 8/1/2035 | | BBB+/NR | | | 1,000,000 | | | 1,000,660 |
| | | |
SOUTH DAKOTA — 1.61% | | | | | | | | |
| | | |
South Dakota Health & Educational Facilities Authority, 5.50% due 11/1/2040 (Sanford Health) | | AA-/A1 | | | 750,000 | | | 769,050 |
| | | |
TENNESSEE — 1.26% | | | | | | | | |
| | | |
Tennessee Energy Acquisition Corp., 5.00% due 2/1/2015 | | A/Baa1 | | | 100,000 | | | 105,610 |
Tennessee Energy Acquisition Corp., 5.25% due 9/1/2024 | | BB+/Ba3 | | | 500,000 | | | 496,485 |
| | | |
TEXAS — 11.55% | | | | | | | | |
| | | |
Austin Convention Enterprises, Inc., 5.25% due 1/1/2024 (Austin Convention Center; Insured: XLCA) | | BB+/Baa3 | | | 720,000 | | | 658,253 |
Austin Convention Enterprises, Inc., 5.00% due 1/1/2034 (Austin Convention Center; Insured: Syncora) | | BB+/Baa3 | | | 415,000 | | | 315,616 |
Bexar County Housing Finance Corp. MFR, 5.70% due 1/1/2021 (American Opportunity Housing; Insured: Natl-Re) | | NR/Baa1 | | | 100,000 | | | 85,870 |
Bexar County Housing Finance Corp. MFR, 5.80% due 1/1/2031 (American Opportunity Housing; Insured: Natl Re) | | NR/Baa1 | | | 550,000 | | | 434,417 |
Clifton Higher Education Finance Corp., 9.00% due 2/15/2038 | | BBB-/NR | | | 1,000,000 | | | 1,154,030 |
Gulf Coast Waste Disposal Authority, 6.10% due 8/1/2024 (International Paper Co.) (AMT) | | BBB/Baa3 | | | 100,000 | | | 99,499 |
Kimble County Hospital District, 6.25% due 8/15/2033 | | NR/NR | | | 500,000 | | | 490,925 |
La Vernia Higher Education Finance Corp., 6.25% due 8/15/2039 | | BBB/NR | | | 1,000,000 | | | 1,027,010 |
Sam Rayburn Municipal Power Agency, 6.00% due 10/1/2021 | | BBB/Baa2 | | | 100,000 | | | 102,346 |
San Antonio Energy Acquisition Public Facilities Corp., 5.50% due 8/1/2021 | | A/A2 | | | 40,000 | | | 42,387 |
Texas Public Finance Authority Charter School Finance Corp., 4.15% due 8/15/2016 (Idea Public School; Insured: ACA) | | BBB/NR | | | 100,000 | | | 93,587 |
Texas Public Finance Authority Charter School Finance Corp., 5.00% due 8/15/2023 (Idea Public School; Insured: ACA) | | BBB/NR | | | 155,000 | | | 141,273 |
Texas Public Finance Authority Charter School Finance Corp., 5.00% due 8/15/2030 (Idea Public School; Insured: ACA) | | BBB/NR | | | 1,000,000 | | | 863,210 |
| | | |
U.S. VIRGIN ISLANDS — 1.45% | | | | | | | | |
| | | |
Virgin Islands Public Finance Authority, 6.75% due 10/1/2037 | | BBB/Baa3 | | | 500,000 | | | 541,845 |
Virgin Islands Water & Power Authority, 5.50% due 7/1/2017 | | NR/Baa3 | | | 150,000 | | | 150,432 |
| | | |
VIRGINIA — 3.51% | | | | | | | | |
| | | |
Norton IDA, 6.00% due 12/1/2014 (Norton Community Hospital; Insured: ACA) | | NR/NR | | | 635,000 | | | 649,503 |
Virginia College Building Authority, 5.00% due 9/1/2016 (Hampden-Sydney College) | | A/NR | | | 500,000 | | | 503,105 |
Virginia Small Business Financing Authority, 9.00% due 7/1/2039 (Hampton RDS Proton) | | NR/NR | | | 500,000 | | | 519,150 |
Certified Semi-Annual Report 11
| | |
| SCHEDULE OF INVESTMENTS, CONTINUED | | |
| |
| Thornburg Strategic Municipal Income Fund | | March 31, 2010 (Unaudited) |
| | | | | | | | |
Issuer-Description | | Credit Rating†
S&P/ Moody’s | | Principal
Amount | | Value |
WASHINGTON — 2.07% | | | | | | | | |
| | | |
aWashington HFA, 5.70% due 7/1/2038 (Overlake Hospital Medical Center) | | BBB+/NR | | $ | 1,000,000 | | $ | 987,450 |
| | | | | | | | |
TOTAL INVESTMENTS — 99.94% (Cost $45,404,954) | | | | | | | $ | 47,650,738 |
OTHER ASSETS LESS LIABILITIES — 0.06% | | | | | | | | 29,418 |
| | | | | | | | |
NET ASSETS — 100.00% | | | | | | | $ | 47,680,156 |
| | | | | | | | |
Footnote Legend
| † | Credit ratings are unaudited. Rating changes may have occurred subsequent to the reporting period end. |
| | |
| Portfolio Abbreviations |
|
| To simplify the listings of securities, abbreviations are used per the table below: |
| |
| ACA | | Insured by American Capital Access |
| AGM | | Insured by Assured Guaranty Municipal Corp. |
| AMBAC | | Insured by American Municipal Bond Assurance Corp. |
| AMT | | Alternative Minimum Tax |
| CIFG | | Insured by CIFG Assurance North America Inc. |
| COP | | Certificates of Participation |
| EDA | | Economic Development Authority |
| FGIC | | Insured by Financial Guaranty Insurance Co. |
| FHA | | Insured by Federal Housing Administration |
| GO | | General Obligation |
| HFA | | Health Facilities Authority |
| IBC | | Insured Bond Certificate |
| IDA | | Industrial Development Authority |
| LOC | | Letter of Credit |
| MFR | | Multi Family Revenue |
| Natl-Re | | Insured by National Public Finance Guarantee Corp. |
| PCR | | Pollution Control Revenue Bond |
| Radian | | Insured by Radian Asset Assurance |
| SPA | | Stand-by Purchase Agreement |
| Syncora | | Insured by Syncora Guarantee Inc. |
| USD | | Unified School District |
| XLCA | | Insured by XL Capital Assurance |
See notes to financial statements.
12 Certified Semi-Annual Report
| | |
STATEMENT OF ASSETS AND LIABILITIES | | |
| |
| Thornburg Strategic Municipal Income Fund | | March 31, 2010 (Unaudited) |
| | | | |
ASSETS | | | | |
Investments at value (cost $45,404,954) (Note 2) | | $ | 47,650,738 | |
Cash | | | 208,123 | |
Receivable for investments sold | | | 1,000,000 | |
Receivable for fund shares sold | | | 259,027 | |
Interest receivable | | | 710,533 | |
Prepaid expenses and other assets | | | 35,927 | |
| | | | |
Total Assets | | | 49,864,348 | |
| | | | |
| |
LIABILITIES | | | | |
Payable for securities purchased | | | 2,059,920 | |
Payable for fund shares redeemed | | | 19,634 | |
Payable to investment advisor and other affiliates (Note 3) | | | 32,746 | |
Accounts payable and accrued expenses | | | 24,593 | |
Dividends payable | | | 47,299 | |
| | | | |
Total Liabilities | | | 2,184,192 | |
| | | | |
| |
NET ASSETS | | $ | 47,680,156 | |
| | | | |
NET ASSETS CONSIST OF: | | | | |
Distribution in excess of net investment income | | $ | (3,026 | ) |
Net unrealized appreciation on investments | | | 2,245,784 | |
Accumulated net realized gain (loss) | | | 107,500 | |
Net capital paid in on shares of beneficial interest | | | 45,329,898 | |
| | | | |
| | $ | 47,680,156 | |
| | | | |
| |
NET ASSET VALUE: | | | | |
Class A Shares: | | | | |
Net asset value and redemption price per share ($16,492,987 applicable to 1,213,396 shares of beneficial interest outstanding - Note 4) | | $ | 13.59 | |
Maximum sales charge, 2.00% of offering price | | | 0.28 | |
| | | | |
Maximum offering price per share | | $ | 13.87 | |
| | | | |
| |
Class C Shares: | | | | |
Net asset value and offering price per share * ($7,212,597 applicable to 530,041 shares of beneficial interest outstanding - Note 4) | | $ | 13.61 | |
| | | | |
| |
Class I Shares: | | | | |
Net asset value, offering and redemption price per share ($23,974,572 applicable to 1,762,472 shares of beneficial interest outstanding - Note 4) | | $ | 13.60 | |
| | | | |
| * | Redemption price per share is equal to net asset value less any applicable contingent deferred sales charge. |
See notes to financial statements.
Certified Semi-Annual Report 13
| | |
STATEMENT OF OPERATIONS | | |
| |
| Thornburg Strategic Municipal Income Fund | | Six Months Ended March 31, 2010 (Unaudited) |
| | | | |
INVESTMENT INCOME: | | | | |
Interest income (net of premium amortized of $15,590) | | $ | 1,204,962 | |
| | | | |
| |
EXPENSES: | | | | |
Investment advisory fees (Note 3) | | | 151,543 | |
Administration fees (Note 3) | | | | |
Class A Shares | | | 8,929 | |
Class C Shares | | | 3,318 | |
Class I Shares | | | 5,204 | |
Distribution and service fees (Note 3) | | | | |
Class A Shares | | | 17,858 | |
Class C Shares | | | 26,906 | |
Transfer agent fees | | | | |
Class A Shares | | | 2,962 | |
Class C Shares | | | 1,358 | |
Class I Shares | | | 1,812 | |
Registration and filing fees | | | | |
Class A Shares | | | 7,520 | |
Class C Shares | | | 6,899 | |
Class I Shares | | | 7,484 | |
Custodian fees (Note 3) | | | 22,472 | |
Professional fees | | | 23,088 | |
Accounting fees | | | 610 | |
Trustee fees | | | 563 | |
Other expenses | | | 4,609 | |
| | | | |
Total Expenses | | | 293,135 | |
Less: | | | | |
Expenses reimbursed by investment advisor (Note 3) | | | (42,788 | ) |
Investment advisory fees waived by investment advisor (Note 3) | | | (6,038 | ) |
Distribution fees waived (Note 3) | | | (10,762 | ) |
Fees paid indirectly (Note 3) | | | (74 | ) |
| | | | |
Net Expenses | | | 233,473 | |
| | | | |
Net Investment Income | | | 971,489 | |
| | | | |
| |
REALIZED AND UNREALIZED GAIN (LOSS) | | | | |
Net realized gain (loss) on investments | | | 342,803 | |
Net change in unrealized appreciation (depreciation) of investments | | | (666,826 | ) |
| | | | |
Net Realized and Unrealized Loss | | | (324,023 | ) |
| | | | |
Net Increase in Net Assets Resulting From Operations | | $ | 647,466 | |
| | | | |
See notes to financial statements.
14 Certified Semi-Annual Report
| | |
STATEMENTS OF CHANGES IN NET ASSETS | | |
| |
| Thornburg Strategic Municipal Income Fund | | |
| | | | | | | | |
| | | Six Months Ended
March 31, 2010* | | | Period Ended
September 30, 2009** | |
INCREASE (DECREASE) IN NET ASSETS FROM: | | | | | | | | |
| | |
OPERATIONS: | | | | | | | | |
Net investment income | | $ | 971,489 | | | $ | 397,331 | |
Net realized gain (loss) on investments | | | 342,803 | | | | 80,474 | |
Increase (Decrease) in unrealized appreciation (depreciation) of investments | | | (666,826 | ) | | | 2,912,610 | |
| | | | | | | | |
| | |
Net Increase (Decrease) in Net Assets
Resulting from Operations | | | 647,466 | | | | 3,390,415 | |
| | |
DIVIDENDS TO SHAREHOLDERS: | | | | | | | | |
From net investment income | | | | | | | | |
Class A Shares | | | (336,684 | ) | | | (113,802 | ) |
Class C Shares | | | (117,274 | ) | | | (29,017 | ) |
Class I Shares | | | (517,531 | ) | | | (257,538 | ) |
From realized gains | | | | | | | | |
Class A Shares | | | (110,998 | ) | | | — | |
Class C Shares | | | (40,025 | ) | | | — | |
Class I Shares | | | (164,754 | ) | | | — | |
| | |
FUND SHARE TRANSACTIONS (NOTE 4): | | | | | | | | |
Class A Shares | | | 4,948,097 | | | | 10,808,011 | |
Class C Shares | | | 3,611,668 | | | | 3,417,545 | |
Class I Shares | | | 5,753,747 | | | | 16,790,830 | |
| | | | | | | | |
| | |
Net Increase in Net Assets | | | 13,673,712 | | | | 34,006,444 | |
| | |
NET ASSETS: | | | | | | | | |
Beginning of Period | | | 34,006,444 | | | | — | |
| | | | | | | | |
| | |
End of Period | | $ | 47,680,156 | | | $ | 34,006,444 | |
| | | | | | | | |
| ** | Fund Commenced operations on April 1, 2009. |
See notes to financial statements.
Certified Semi-Annual Report 15
| | |
NOTES TO FINANCIAL STATEMENTS | | |
| |
| Thornburg Strategic Municipal Income Fund | | March 31, 2010 (Unaudited) |
NOTE 1 – ORGANIZATION
Thornburg Strategic Municipal Income Fund (the “Fund”) is a diversified series of Thornburg Investment Trust (the “Trust”). The Trust is organized as a Massachusetts business trust under a Declaration of Trust dated June 3, 1987 and is registered as a diversified, open-end management investment company under the Investment Company Act of 1940, as amended. The Fund is currently one of sixteen separate series of the Trust. Each series is considered to be a separate entity for financial reporting and tax purposes and bears expenses directly attributable to it. The Fund’s primary investment objective is to seek a high level of current income exempt from federal individual income tax.
The Fund currently offers three classes of shares of beneficial interest: Class A, Class C, and Institutional Class (Class I) shares. Each class of shares of the Fund represents an interest in the same portfolio of investments, except that (i) Class A shares are sold subject to a front-end sales charge collected at the time the shares are purchased and bear a service fee, (ii) Class C shares are sold at net asset value without a sales charge at the time of purchase, but are subject to a contingent deferred sales charge upon redemption within one year of purchase, and bear both a service fee and a distribution fee, (iii) Class I shares are sold at net asset value without a sales charge at the time of purchase, and (iv) the respective classes may have different reinvestment privileges and conversion rights. Additionally, the Fund may allocate among its classes certain expenses, to the extent allowable to specific classes, including transfer agent fees, government registration fees, certain printing and postage costs, and administrative and legal expenses. Currently, class specific expenses of the Fund are limited to service and distribution fees, administration fees, and certain registration and transfer agent expenses.
NOTE 2 – SIGNIFICANT ACCOUNTING POLICIES
Significant accounting policies of the Trust are as follows:
Valuation of Investments: Debt obligations have a primary market over the counter and are valued by an independent pricing service approved by the Trustees of the Trust. The pricing service ordinarily values debt obligations at quoted bid prices. When quotations are not available, debt obligations are valued at evaluated prices determined by the pricing service using methods which include consideration of yields or prices of debt obligations of comparable quality, type of issue, coupon, maturity and rating, and indications as to value from dealers and general market conditions. Short-term obligations having remaining maturities of 60 days or less are valued at amortized cost, which approximates market value.
In any case where a pricing service fails to provide a price for a debt obligation held by the Fund, the valuation and pricing committee determines a fair value for the obligation using procedures approved by the Trustees. Additionally, in any case where management believes that a price provided by a pricing service for a debt obligation may be unreliable, the valuation and pricing committee decides whether or not to use the pricing service’s valuation or to determine a fair value for the obligation.
In determining fair value for any portfolio security or other investment, the valuation and pricing committee seeks to determine the amount that an owner of the investment might reasonably expect to receive upon a sale of the investment. However, because fair value prices are estimated prices, the valuation and pricing committee’s determination of fair value for an investment may differ from the value that would be realized by the Fund upon a sale of the investment, and that difference could be material to the Fund’s financial statements. The valuation and pricing committee’s determination of fair value for an investment may also differ from the prices obtained by other persons (including other mutual funds) for the investment.
Valuation Measurements: Various inputs are used in determining the value of the Fund’s investments. These inputs are summarized in the three levels listed below.
Level 1: Quoted prices in active markets for identical investments.
Level 2: Other significant observable inputs (including quoted prices for similar investments, interest rates, prepayment rates, credit risk, etc.).
Level 3: Significant unobservable inputs (including the Fund’s own assumptions in determining the fair value of investments).
16 Certified Semi-Annual Report
| | |
NOTES TO FINANCIAL STATEMENTS, CONTINUED | | |
| |
| Thornburg Strategic Municipal Income Fund | | March 31, 2010 (Unaudited) |
The following table displays a summary of the inputs used to value the Fund’s net assets as of March 31, 2010. In any instance when valuation inputs from more than one level are used to determine the fair value of a specific investment, the investment is placed in the level of the table based upon the lowest level input that is significant in determining the fair value of the investment:
| | | | | | | | | | | | |
| | | Fair Value Measurements at March 31, 2010 |
| | | Total | | Level 1 | | Level 2 | | Level 3 |
Assets | | | | | | | | | | | | |
Investments in Securities Municipal Bonds | | $ | 47,650,738 | | $ | — | | $ | 47,650,738 | | $ | — |
| | | | | | | | | | | | |
Total Investments in Securities | | $ | 47,650,738 | | $ | — | | $ | 47,650,738 | | $ | — |
Federal Income Taxes: It is the policy of the Trust to comply with the provisions of the Internal Revenue Code applicable to “regulated investment companies” and to distribute to shareholders substantially all taxable (if any) and tax exempt income of the Fund. Therefore, no provision for federal income tax is required.
When-Issued and Delayed Delivery Transactions: The Fund may engage in when-issued or delayed delivery transactions. To the extent the Fund engages in such transactions, it will do so for the purpose of acquiring portfolio securities consistent with the Fund’s investment objectives and not for the purpose of investment leverage or to speculate on interest rate and/or market changes. At the time the Fund makes a commitment to purchase a security on a when-issued or delayed delivery basis, the Fund will record the transaction and reflect the value in determining its net asset value. When effecting such transactions, assets of an amount sufficient to make payment for the portfolio securities to be purchased will be segregated on the Fund’s records on the trade date. Securities purchased on a when-issued or delayed delivery basis do not earn interest until the settlement date.
Dividends: Net investment income of the Fund is declared daily as a dividend on shares for which the Fund has received payment. Dividends are paid monthly and are reinvested in additional shares of the Fund at net asset value per share at the close of business on the dividend payment date, or at the shareholder’s option, paid in cash. Net realized capital gains, to the extent available, will be distributed at least annually.
General: Securities transactions are accounted for on a trade date basis. Interest income is accrued as earned. Premiums and discounts on securities purchased are amortized to call dates or maturity dates of the respective securities. Realized gains and losses from the sale of securities are recorded on an identified cost basis. Net investment income (other than class specific expenses) and realized and unrealized gains and losses are allocated daily to each class of shares based upon the relative net asset value of outstanding shares (or the value of the dividend-eligible shares, as appropriate) of each class of shares at the beginning of the day (after adjusting for the current capital shares activity of the respective class). Expenses common to all funds are allocated among the funds comprising the Trust based upon their relative net asset values or other appropriate allocation methods.
Guarantees and Indemnifications: Under the Trust’s organizational documents, its officers and Trustees are indemnified against certain liabilities arising out of the performance of their duties to the Fund. Additionally, in the normal course of business the Trust enters into contracts with service providers that contain general indemnification clauses. The Trust’s maximum exposure under these arrangements is unknown. However, based on experience, the Trust expects the risk of loss to be remote.
Use of Estimates: The preparation of financial statements, in conformity with generally accepted accounting principles, requires management to make estimates and assumptions that affect the reported amounts of assets and liabilities and the disclosure of contingent assets and liabilities at the date of the financial statements and the reported amounts of increases and decreases in net assets from operations during the reporting period. Actual results could differ from those estimates.
NOTE 3 – INVESTMENT ADVISORY FEE AND OTHER TRANSACTIONS WITH AFFILIATES
Pursuant to an investment advisory agreement, Thornburg Investment Management, Inc. (the “Advisor”) serves as the investment advisor and performs services to the Fund for which the fees are payable at the end of each month. For the six months ended March 31, 2010, these fees were payable at annual rates ranging from .75 of 1% to .50 of 1% per annum of the average daily net assets of the Fund depending on the Fund’s asset size. For the six months ended March 31, 2010 the Advisor voluntarily waived investment advisory fees of
Certified Semi-Annual Report 17
| | |
NOTES TO FINANCIAL STATEMENTS, CONTINUED | | |
| |
| Thornburg Strategic Municipal Income Fund | | March 31, 2010 (Unaudited) |
$6,038. The Trust also has entered into administrative services agreements with the Advisor, whereby the Advisor will perform certain administrative services for the shareholders of each class of the Fund’s shares, and for which fees will be payable at an annual rate of up to .125 of 1% per annum of the average daily net assets attributable to each class of shares. For the six months ended March 31, 2010, the Advisor voluntarily or contractually agreed to reimburse certain class specific expenses and administrative fees of $17,548 for Class A shares, $12,385 for Class C shares, and $12,855 for Class I shares.
The Trust has an underwriting agreement with Thornburg Securities Corporation (the “Distributor,” an affiliate of the Advisor), which acts as the distributor of the Fund’s shares. For the six months ended March 31, 2010, the Distributor has advised the Fund that it earned net commissions aggregating $354 from the sale of Class A shares, and collected contingent deferred sales charges aggregating $111 from redemptions of Class C shares of the Fund.
Pursuant to a service plan under Rule 12b-1 of the Investment Company Act of 1940, the Fund may reimburse to the Advisor an amount not to exceed .25 of 1% per annum of the average daily net assets attributable to each class of shares of the Fund for payments made by the Advisor to securities dealers and other financial institutions to obtain various shareholder and distribution related services. The Advisor may pay out of its own resources additional expenses for distribution of the Fund’s shares.
The Trust has also adopted distribution plans pursuant to Rule 12b-1, applicable only to the Fund’s Class C shares, under which the Fund compensates the Distributor for services in promoting the sale of Class C shares of the Fund at an annual rate of up to .75 of 1% per annum of the average daily net assets attributable to Class C shares. Total fees incurred by the Distributor for each class of shares of the Fund under their respective Service and Distribution Plans for the six months ended March 31, 2010, are set forth in the Statement of Operations. Distribution fees in the amount of $10,762 were waived for Class C shares.
The Trust has an agreement with the custodian bank to indirectly pay a portion of the custodian’s fees through credits earned by the Fund’s cash on deposit with the bank. This deposit agreement is an alternative to overnight investments. Custodial fees have been adjusted to reflect amounts that would have been paid without this agreement, with a corresponding adjustment reflected as fees paid indirectly in the Statement of Operations. For the six months ended March 31, 2010, fees paid indirectly were $74.
Certain officers and Trustees of the Trust are also officers and/or directors of the Advisor and Distributor. The compensation of independent Trustees is borne by the Trust.
NOTE 4 – SHARES OF BENEFICIAL INTEREST
At March 31, 2010, there were an unlimited number of shares of beneficial interest authorized. Transactions in shares of beneficial interest were as follows:
| | | | | | | | | | | | | | |
| | | Six Months Ended | | | Period Ended* | |
| | | March 31, 2010
(Unaudited) | | | September 30, 2009
(Audited) | |
| | | Shares | | | Amount | | | Shares | | | Amount | |
Class A Shares | | | | | | | | | | | | | | |
Shares sold | | 439,223 | | | $ | 5,959,843 | | | 850,895 | | | $ | 10,837,932 | |
Shares issued to shareholders in reinvestment of dividends | | 28,026 | | | | 378,322 | | | 7,045 | | | | 92,971 | |
Shares repurchased | | (102,566 | ) | | | (1,390,068 | ) | | (9,227 | ) | | | (122,892 | ) |
| | | | | | | | | | | | | | |
| | | | |
Net Increase (Decrease) | | 364,683 | | | $ | 4,948,097 | | | 848,713 | | | $ | 10,808,011 | |
| | | | | | | | | | | | | | |
| | | | |
Class C Shares | | | | | | | | | | | | | | |
Shares sold | | 309,098 | | | $ | 4,212,053 | | | 264,135 | | | $ | 3,399,093 | |
Shares issued to shareholders inreinvestment of dividends | | 8,042 | | | | 108,687 | | | 1,396 | | | | 18,452 | |
Shares repurchased | | (52,630 | ) | | | (709,072 | ) | | — | | | | — | |
| | | | | | | | | | | | | | |
| | | | |
Net Increase (Decrease) | | 264,510 | | | $ | 3,611,668 | | | 265,531 | | | $ | 3,417,545 | |
| | | | | | | | | | | | | | |
18 Certified Semi-Annual Report
| | |
| NOTES TO FINANCIAL STATEMENTS, CONTINUED | | |
| |
| Thornburg Strategic Municipal Income Fund | | March 31, 2010 (Unaudited) |
| | | | | | | | | | | | | | |
| | | Six Months Ended
March 31, 2010
(Unaudited) | | | Period Ended*
September 30, 2009
(Audited) | |
| | | Shares | | | Amount | | | Shares | | | Amount | |
Class I Shares | | | | | | | | | | | | | | |
Shares sold | | 458,833 | | | $ | 6,230,287 | | | 1,383,622 | | | $ | 17,417,043 | |
Shares issued to shareholders in reinvestment of dividends | | 37,089 | | | | 501,129 | | | 13,885 | | | | 181,497 | |
Shares repurchased | | (71,850 | ) | | | (977,669 | ) | | (59,107 | ) | | | (807,710 | ) |
| | | | | | | | | | | | | | |
| | | | |
Net Increase (Decrease) | | 424,072 | | | $ | 5,753,747 | | | 1,338,400 | | | $ | 16,790,830 | |
| | | | | | | | | | | | | | |
| * | The Fund commenced operations on April 1, 2009. |
NOTE 5 – SECURITIES TRANSACTIONS
For the six months ended March 31, 2010, the Fund had purchase and sale transactions of investment securities (excluding short-term investments) of $11,651,821 and $3,818,711, respectively.
NOTE 6 – INCOME TAXES
At March 31, 2010, information on the tax components of capital is as follows:
| | | | |
Cost of investments for tax purposes | | $ | 45,404,954 | |
| | | | |
Gross unrealized appreciation on a tax basis | | $ | 2,389,307 | |
Gross unrealized depreciation on a tax basis | | | (143,523 | ) |
| | | | |
Net unrealized appreciation (depreciation) on investments (tax basis) | | $ | 2,245,784 | |
| | | | |
OTHER NOTES
Fund management believes no events have occurred between March 31, 2010 and May 20, 2010, the date of issuance of the financial statements, that require adjustment of, or disclosure in, the accompanying financial statements.
Certified Semi-Annual Report 19
FINANCIAL HIGHLIGHTS
Thornburg Strategic Municipal Income Fund
| | | | | | | | | | | | | | | | | | | | | | | | | | | | | | | | | | | | | | | | | |
| | | PER SHARE PERFORMANCE (for a share outstanding throughout the period) | | RATIOS TO AVERAGE NET ASSETS | | | SUPPLEMENTAL DATA |
Unless Otherwise Noted,
Periods are
Fiscal
Years Ended
Sept. 30, | | Net Asset
Value
Beginning
of
Period | | Net
Investment
Income
(Loss) | | Net
Realized
&
Unrealized
Gain
(Loss)
on
Investments | | | Total from
Investment
Operations | | Dividends
from Net
Investment
Income | | | Dividends
from Net
Realized
Gains | | | Total
Dividends | | | Net
Asset
Value
End
of
Period | | Net
Investment
Income
(Loss)
(%) | | | Expenses,
After
Expense
Reductions
(%) | | | Expenses,
After
Expense
Reductions
and
Net of
Custody
Credits
(%) | | | Expenses,
Before
Expense
Reductions
(%) | | | Total
Return
(%)(a) | | Portfolio
Turnover
Rate (%) | | Net
Assets at
End
of
Period
(Thousands) |
Class A Shares | | | | | | | | | | | | | | | | | | | | | | | |
2010(b)(c) | | $ | 13.86 | | 0.32 | | (0.16 | ) | | 0.16 | | (0.32 | ) | | (0.11 | ) | | (0.43 | ) | | $ | 13.59 | | 4.71 | (d) | | 1.25 | (d) | | 1.25 | (d) | | 1.53 | (d) | | 1.24 | | 9.81 | | $ | 16,493 |
2009(c)(e) | | $ | 11.94 | | 0.29 | | 1.91 | | | 2.20 | | (0.28 | ) | | — | | | (0.28 | ) | | $ | 13.86 | | 4.71 | (d) | | 1.25 | (d) | | 1.25 | (d) | | 2.92 | (d) | | 18.65 | | 14.37 | | $ | 11,761 |
| | | | | | | | |
Class C Shares | | | | | | | | | | | | | | | | | | | | | | | |
2010(b) | | $ | 13.87 | | 0.30 | | (0.15 | ) | | 0.15 | | (0.30 | ) | | (0.11 | ) | | (0.41 | ) | | $ | 13.61 | | 4.42 | (d) | | 1.55 | (d) | | 1.55 | (d) | | 2.45 | (d) | | 1.16 | | 9.81 | | $ | 7,213 |
2009(e) | | $ | 11.94 | | 0.27 | | 1.93 | | | 2.20 | | (0.27 | ) | | — | | | (0.27 | ) | | $ | 13.87 | | 4.40 | (d) | | 1.55 | (d) | | 1.55 | (d) | | 6.40 | (d)(f) | | 18.58 | | 14.37 | | $ | 3,684 |
| | | | | | | | |
Class I Shares | | | | | | | | | | | | | | | | | | | | | | | |
2010(b) | | $ | 13.87 | | 0.33 | | (0.15 | ) | | 0.18 | | (0.34 | ) | | (0.11 | ) | | (0.45 | ) | | $ | 13.60 | | 4.97 | (d) | | 0.99 | (d) | | 0.99 | (d) | | 1.14 | (d) | | 1.37 | | 9.81 | | $ | 23,974 |
2009(e) | | $ | 11.94 | | 0.31 | | 1.92 | | | 2.23 | | (0.30 | ) | | — | | | (0.30 | ) | | $ | 13.87 | | 4.90 | (d) | | 0.99 | (d) | | 0.99 | (d) | | 2.12 | (d) | | 18.87 | | 14.37 | | $ | 18,561 |
| (a) | Not annualized for periods less than one year. |
| (b) | Unaudited Six Month Period Ended March 31. |
| (c) | Sales loads are not reflected in computing total return. |
| (e) | Fund commenced operations on April 1, 2009. |
| (f) | Due to the size of net assets and fixed expenses, ratios may appear disproportionate. See notes to financial statements. |
| | |
| 20 Certified Semi-Annual Report | | Certified Semi-Annual Report 21 |
| | |
| EXPENSE EXAMPLE | | |
| |
| Thornburg Strategic Municipal Income Fund | | March 31, 2010 (Unaudited) |
As a shareholder of the Fund, you incur two types of costs:
| | (1) | transaction costs, including |
(a) sales charges (loads) on purchase payments, for Class A shares;
(b) a deferred sales charge on redemptions of any part or all of a purchase of $1 million of Class A shares within 12 months of purchase;
(c) a deferred sales charge on redemptions of Class C shares within 12 months of purchase;
| | (2) | ongoing costs, including management fees; distribution and/or service (12b-1) fees; and other Fund expenses. |
This example is intended to help you understand your ongoing costs (in dollars) of investing in the Fund and to compare these costs with the ongoing costs of investing in other mutual funds.
The example is based on a $1,000 investment beginning on October 1, 2009, and held until March 31, 2010.
ACTUAL EXPENSES
For each class of shares, the first line of the table at right provides information about actual account values and actual expenses. You may use the information in this line, together with the amount you invested, to estimate the expenses that you paid over the period. Simply divide your account value by $1,000 (for example, an $8,600 account value divided by $1,000 = 8.6), then multiply the result by the number in the first line for your class of shares under the heading entitled “Expenses Paid During Period” to estimate the expenses you paid on your account during this period.
HYPOTHETICAL EXAMPLE FOR COMPARISON PURPOSES
For each class of shares, the second line of the table at right provides information about hypothetical account values and hypothetical expenses based on the Fund’s actual expense ratio and an assumed rate of return of 5% per year before expenses, which is not the Fund’s actual return. The hypothetical account values and expenses may not be used to estimate the actual ending account balance or expenses you paid for the period. You may use this information to compare the ongoing costs of investing in the Fund and other funds. To do so, compare this 5% hypothetical example with the 5% hypothetical examples that appear in the shareholder reports of the other funds.
| | | | | | | | | |
| | | Beginning
Account Value
10/1/09 | | Ending
Account Value
3/31/10 | | Expenses Paid
During Period†
10/1/09–3/31/10 |
Class A Shares | | | | | | | | | |
Actual | | $ | 1,000.00 | | $ | 1,012.40 | | $ | 6.27 |
Hypothetical* | | $ | 1,000.00 | | $ | 1,018.70 | | $ | 6.29 |
Class C Shares | | | | | | | | | |
Actual | | $ | 1,000.00 | | $ | 1,011.60 | | $ | 7.77 |
Hypothetical* | | $ | 1,000.00 | | $ | 1,017.20 | | $ | 7.80 |
Class I Shares | | | | | | | | | |
Actual | | $ | 1,000.00 | | $ | 1,013.70 | | $ | 4.97 |
Hypothetical* | | $ | 1,000.00 | | $ | 1,020.00 | | $ | 4.99 |
| † | Expenses are equal to the annualized expense ratio for each class (A: 1.25%; C: 1.55%; I: 0.99%) multiplied by the average account value over the period, multiplied by 182/365 to reflect the one-half year period. |
| * | Hypothetical assumes a rate of return of 5% per year before expenses. |
Please note that the expenses shown in the table are meant to highlight your ongoing costs only and do not reflect any transactional costs, such as sales charges (loads), redemption fees, or exchange fees. Therefore, the second line of the table for each class of shares is useful in comparing ongoing costs only, and will not help you determine the relative total costs of owning different funds. In addition, if these transactional costs were included, your costs would have been higher.
22 Certified Semi-Annual Report
| | |
| OTHER INFORMATION | | |
| |
| Thornburg Strategic Municipal Income Fund | | March 31, 2010 (Unaudited) |
PORTFOLIO PROXY VOTING
Policies and Procedures:
The Trust has delegated to Thornburg Investment Management, Inc. (the “Advisor”) voting decisions respecting proxies for the Fund’s voting securities. The Advisor makes voting decisions in accordance with its Proxy Voting Policy and Procedures. A description of the Policy and Procedures is available (i) without charge, upon request, by calling the Advisor toll-free at 1-800-847-0200, (ii) on the Thornburg website at www.thornburg.com, and (iii) on the Securities and Exchange Commission’s website at www.sec.gov.
Information regarding how proxies were voted is available on or before August 31 of each year for the twelve months ending the preceding June 30 (and in the case of the Fund’s first year, is available from inception on April 1, 2009 through June 30, 2009). This information is available (i) without charge, upon request by calling the Advisor toll-free at 1-800-847-0200, (ii) on the Thornburg website at www.thornburg.com, and (iii) on the Securities and Exchange Commission’s website at www.sec.gov.
AVAILABILITY OF QUARTERLY PORTFOLIO SCHEDULE
The Fund files with the Securities and Exchange Commission schedules of its portfolio holdings on Form N-Q for the first and third quarters of each fiscal year. The Fund’s Forms N-Q are available on the Commission’s website at www.sec.gov, or may be reviewed and copied at the Commission’s Public Reference Room in Washington, D.C. Information on the operation of the Public Reference Room may be obtained by calling 1-800-SEC-0330. The Fund also makes this information available on its website at www.thornburg.com/ download or upon request by calling 1-800-847-0200.
Certified Semi-Annual Report 23
Trustees’ Statement to Shareholders
Not part of the Certified Semi-Annual Report
February 8, 2005, as readopted July 22, 2009
The Trustees are concerned that ongoing commentaries and opinions reported in the media may confuse investors in general as to the supervisory duties of trustees of mutual funds and, in particular, leave Thornburg Investment Trust shareholders uncertain regarding how we discharge our responsibilities in supervising the Funds’ investment advisor and in reviewing the advisor’s contract for renewal. We decided to spell out clearly three principal guidelines that we follow in supervising the Trust’s investment advisor on your behalf.
We begin with the premise that each shareholder selected his or her Fund because its investments are managed by the investment advisor identified in the prospectus and in accordance with the objective and policies described in the prospectus. We realize, as each of you do, that if you believe that your Fund’s stated objective and policies no longer serve your personal investment goals, you can sell your shares and leave the Fund.
Therefore, we believe that our primary supervisory task – our principal obligation to you – is to assess the nature and quality of the advisor’s services, and to confirm that the advisor actively and competently pursues the Fund’s objective, in accordance with the policies set out in the prospectus. To do this, we meet regularly with management to review your Fund’s portfolio and to discuss the advisor’s specific actions and judgments in pursuing the Fund’s objective. We do not substitute our own judgment for the advisor’s decisions in selecting investments; the advisor is paid to exercise its informed judgment on investment decisions, and we seek to confirm, in reviewing the advisor’s performance, that the advisor is doing just that.
Second, while we are conscious of costs and the effect that costs have on shareholders’ returns, we do not seek the lowest fees or expense ratio as our sole or primary objective. We try to make sure that your Fund’s fees and costs are reasonable in relationship to the services rendered and that they are generally in line with those charged by other expert investment advisors, consistent with our belief that the Fund’s investors searched for and expect that expertise and attention and have decided to pay a reasonable price for it. We do not put the management contract “out to bid” as a matter of course, and we would not do so unless we had concluded that the advisor materially had failed to pursue the Fund’s objectives in accordance with its policies, or for other equally important reasons. We believe that any other approach would be inconsistent with your interests and contrary to your expectations when you bought shares of the Fund in the first place.
Finally, because we believe that most Thornburg Fund shareholders have invested with a long-term perspective, we try not to focus too much on the fashions of the moment and on short-term performance. The market will not favor any specific investment objective or set of policies at all times and under all economic circumstances. A fund will experience periods of both high and low returns relative to other funds and other investments. Even if one of our Funds is not favored by the market at a particular time, we believe that the advisor is nonetheless obliged to remain true to the Fund’s objective and policies, and we watch to see that it does so.
24 This page is not part of the Semi-Annual Report.
Retirement and Education Accounts
Thornburg Investment Management offers retirement and education savings accounts that can help you meet a variety of planning challenges. For account applications or further information on any of the accounts below, please call 1-800-847-0200 or go to www.thornburg.com/ira. Your financial advisor can help you determine which plan is right for you.
Individual Retirement Accounts
Individual Retirement Accounts (IRAs) provide a tax-advantaged means to save money for the future. For a detailed outline of the difference between retirement accounts, see www.thornburg.com/ira. Rollovers are available. Call 1-800-847-0200 for more information.
Traditional IRAs – Contributions to Traditional IRAs are tax deductible for eligible individuals, and withdrawals are taxed as additional ordinary income. You may contribute to an IRA if you receive compensation and are under 70 1/ 2, even if you are covered by an employer retirement plan. Deductible contributions are subject to certain qualifications. Please consult your tax advisor.
Roth IRAs – Under a Roth IRA, there is no tax deduction for contributions, but there is no income tax on qualified withdrawals. For a more detailed comparison of Traditional and Roth IRAs, please see our web site at www.thornburg.com/ira.
SEP IRAs – Simplified Employee Pension (SEP) IRAs are established by employers. The employer is allowed a tax deduction for contributions made to the SEP Plan and makes contributions to each eligible employee’s SEP IRA on a discretionary basis.
SIMPLE IRAs – Savings Incentive Match Plan for Employees of Small Employers (SIMPLE) is designed to give small business owners a simplified method to establish and contribute to a retirement plan for employees. The employer is allowed a tax deduction for contributions and makes either matching or non-elective contributions to each eligible employee’s SIMPLE IRA. Employees may make salary deferral contributions.
Coverdell Education Savings Account
These savings accounts are designed to provide a way to save money for higher education expenses. In an Education Savings Account, earnings and interest grow tax-free, and qualified withdrawals used to pay for eligible higher-education expenses are tax- and penalty-free.
Funds Available
The following funds are available in the accounts listed above:
| | • | | Thornburg International Value Fund |
| | • | | Thornburg Core Growth Fund |
| | • | | Thornburg Investment Income Builder Fund |
| | • | | Thornburg Global Opportunities Fund |
| | • | | Thornburg International Growth Fund |
| | • | | Thornburg Developing World Fund |
| | • | | Thornburg Limited Term U.S. Government Fund |
| | • | | Thornburg Limited Term Income Fund |
| | • | | Thornburg Strategic Income Fund |
This page is not part of the Semi-Annual Report. 25

Thornburg Equity Funds
Thornburg’s equity research uses a fundamental and comprehensive analytical approach. Thornburg equity funds focus on a limited number of securities so that each holding can impact performance. The equity team searches for firms believed to have a promising future and seeks to buy shares of those companies at a discount to their intrinsic value.
| | • | | Thornburg International Value Fund |
| | • | | Thornburg Core Growth Fund |
| | • | | Thornburg Investment Income Builder Fund |
| | • | | Thornburg Global Opportunities Fund |
| | • | | Thornburg International Growth Fund |
| | • | | Thornburg Developing World Fund |
Thornburg Bond Funds
Thornburg Investment Management applies a disciplined philosophy to fixed-income management. Since the launch of our first fixed-income fund over 25 years ago, we have been conducting fundamental, bottom-up research in an effort to identify bonds which we believe provide the best return for a given level of risk. We are very organic in our approach, avoiding leverage or complex strategies which could backfire in periods of market uncertainty.
| | • | | Thornburg Limited Term Municipal Fund |
| | • | | Thornburg Intermediate Municipal Fund |
| | • | | Thornburg California Limited Term Municipal Fund |
| | • | | Thornburg New Mexico Intermediate Municipal Fund |
| | • | | Thornburg New York Intermediate Municipal Fund |
| | • | | Thornburg Strategic Municipal Income Fund |
| | • | | Thornburg Limited Term U.S. Government Fund |
| | • | | Thornburg Limited Term Income Fund |
| | • | | Thornburg Strategic Income Fund |
Before investing, carefully consider the Fund’s investment goals, risks, charges, and expenses. For a prospectus containing this and other information, contact your financial advisor or visit thornburg.com. Read it carefully before investing.
For additional information, please visit www.thornburg.com
Thornburg Investment Management, Inc. 2300 North Ridgetop Road, Santa Fe, NM 87506
This page is not part of the Semi-Annual Report. 27
| | | | | | |
 | | Waste not, Wait not | |  |
| | | | |
| | | | Get instant access to your shareholder reports. |
| | |
| | This Semi-Annual Report is submitted for the general information of shareholders of the Fund. It is not authorized for distribution to prospective investors in the Fund unless preceded or accompanied by an effective prospectus. | | By switching from your postal mailbox to your email inbox, you reduce paper clutter, improve record keeping access, and help conserve our natural resources. |
| | |
 | | Investment Advisor: Thornburg Investment Management® 800.847.0200 | | Go to www.thornburg.com/edelivery and sign up to receive your shareholder reports, prospectuses, and proxy statements electronically. |
| | Distributor: Thornburg Securities Corporation® 800.847.0200 | | You invest in the future, without spending a dime. |
| | TH1979 | | | | |

Important Information
The information presented on the following pages is current as of March 31, 2010. The managers’ views, portfolio holdings, and sector diversification are provided for the general information of the Fund’s shareholders; they are historical and subject to change. This material should not be deemed a recommendation to buy or sell any of the securities mentioned.
Investments in the Fund carry risks, including possible loss of principal. Bond funds have the same interest rate, inflation, and credit risks that are associated with the underlying bonds. The principal value of bonds will fluctuate relative to changes in interest rates, decreasing when interest rates rise. Unlike bonds, bond funds have ongoing fees and expenses. Please see the Fund’s Prospectus for a discussion of the risks associated with an investment in the Fund. Investments in the Fund are not FDIC insured, nor are they deposits of or guaranteed by a bank or any other entity. There is no guarantee that the Fund will meet its investment objectives. The laddering strategy does not assure or guarantee better performance and cannot eliminate the risk of investment losses.
Performance data given at net asset value (NAV) does not take into account applicable sales charges. If the sales charges had been included, the performance would have been lower. Minimum investments for Class I shares are higher than those for other classes. Class I shares may not be available to all investors.
| | | | |
Share Class | | NASDAQ Symbol | | Cusip |
Class A | | LTCAX | | 885-215-426 |
Class C | | LTCCX | | 885-215-418 |
Class I | | LTCIX | | 885-215-392 |
Lipper’s 2008
Best Fixed-Income Fund Family
Thornburg Investment Management ranked #1 out of 41 eligible firms in Lipper, Inc.’s fixed income large firm universe for the three-year period ended 12/31/07, based on risk-adjusted returns. Past performance does not guarantee future results.
Lipper’s large firm universe is comprised of fund families with more than $28 billion in total net assets. Only fund families with at least five bond funds were eligible. Risk-adjusted returns were calculated with dividends reinvested and without sales charges. We did not win this award in 2009 or 2010.
Glossary
Barclays Capital Five-Year Municipal Bond Index – A rules-based, market-value-weighted index of the tax-exempt bond market. To be included in the index, bonds must have a minimum credit rating of Baa. The approximate maturity of the municipal bonds in the index is five years.
Unless otherwise noted, index returns reflect the reinvestment of income dividends and capital gains, if any, but do not reflect fees, brokerage commissions or other expenses of investing. Investors may not make direct investments into any index.
Alternative Minimum Tax (AMT) – A federal tax aimed at ensuring that high-income individuals, estates, trusts, and corporations pay a minimal level income tax. For individuals, the AMT is calculated by adding tax preference items to regular taxable income.
Annualized Distribution Yield – The distribution yield is calculated by taking the sum of the month’s total distribution factors and dividing this sum by a 30-day period and annualizing to a 360-day year. The value is then divided by the ending maximum offering price per share to arrive at the annualized distribution yield. The yield is calculated on a periodic basis and is subject to change.
Bond Credit Ratings – A bond credit rating assesses the financial ability of a debt issuer to make timely payments of principal and interest. Ratings of AAA (the highest), AA, A, and BBB are investment-grade quality. Ratings of BB, B, CCC, CC, C, and D (the lowest) are considered below investment grade, speculative grade, or junk bonds. Unless otherwise noted, the ratings listed are from Municipal Market Data and are a combination of ratings from Standard and Poor’s, Moody’s Investors Service, and Fitch Ratings.
Duration – The weighted maturity of a bond’s cash flows. Duration measures the price sensitivity of a bond for a given change in interest rates. Bonds with longer durations experience greater price volatility than bonds with shorter durations.
Fed Funds Rate – The Fed Funds Rate is the interest rate at which a depository institution lends immediately available funds (balances at the Federal Reserve) to another depository institution overnight.
General Obligation (GO) Bonds – A municipal bond secured by the pledge of the issuer’s full faith, credit, and taxing power rather than the revenue from a given project.
Revenue Bond – A bond on which the debt service is payable solely from the revenue generated from the operation of the project being financed or a category of facilities, or from other non-tax sources.
SEC Yield – SEC Yield is computed in accordance with SEC standards measuring the net investment income per share over a specified 30-day period expressed as a percentage of the maximum offering price of the Fund’s shares at the end of the period.
This page is not part of the Semi-Annual Report. 3
Thornburg California Limited Term Municipal Fund
At Thornburg, our approach to management of the Fund is based on the premise that investors in the Fund seek preservation of capital along with an attractive, relatively stable yield. While aggressive bond strategies may generate stronger returns when the market is turning a blind eye towards risk, they usually fail to stack up over longer periods of time. Our patience and diligence was recognized by Lipper in 2008 with the Best Fixed-Income Fund Family Award.
We apply time-tested techniques to manage risk and provide attractive returns. These include:
| | • | | Building a laddered portfolio. Laddering has been shown over time to mitigate price and interest rate risk. |
| | • | | Investing on a cash-only basis without using leverage. While leveraged strategies may enhance returns when market conditions are favorable, they can quickly compound losses when sentiment shifts. |
| | • | | Conducting in-depth fundamental research on each issue and actively monitoring positions for subsequent credit events. |
| | • | | Diversifying among a large number of generally high-quality bonds. |

Josh Gonze, George Strickland, and Chris Ihiefeld
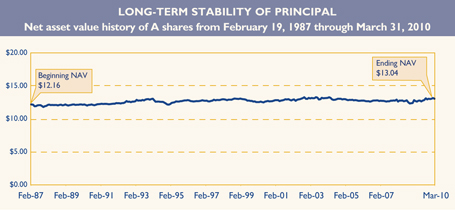
IMPORTANT
PERFORMANCE INFORMATION
Performance data shown represents past performance and is no guarantee of future results. Investment return and principal value will fluctuate so shares, when redeemed, may be worth more or less than their original cost. Current performance may be lower or higher than quoted. For performance current to the most recent month end, visit thornburg.com.
The maximum sales charge for the Fund’s Class A shares is 1.50%. The total annual fund operating expense of Class A shares is 0.99%, as disclosed in the most recent Prospectus.
| | | | | | | | | | | | | | | |
| AVERAGE ANNUAL TOTAL RETURNS | |
| For periods ended March 31, 2010 | |
| | | | | |
| | | 1 Yr | | | 3 Yrs | | | 5 Yrs | | | 10 Yrs | | | Since
Inception | |
A Shares (Incep: 2/19/87) | | | | | | | | | | | | | | | |
Without sales charge | | 6.91 | % | | 4.29 | % | | 3.69 | % | | 3.69 | % | | 4.78 | % |
With sales charge | | 5.33 | % | | 3.78 | % | | 3.37 | % | | 3.54 | % | | 4.71 | % |
30-DAY YIELDS, A SHARES
As of March 31, 2010
| | |
Annualized Distribution Yield | | SEC Yield |
2.80% | | 2.05% |
| | |
| KEY PORTFOLIO ATTRIBUTES |
| As of March 31, 2010 |
| |
Number of Bonds | | 145 |
Duration | | 3.6 Yrs |
Average Maturity | | 4.7 Yrs |
See the entire portfolio in the Schedule of Investments beginning on page 10.
4 This page is not part of the Semi-Annual Report.
THORNBURG CALIFORNIA LIMITED TERM MUNICIPAL FUND VERSUS
LIPPER CALIFORNIA TAX-EXEMPT MONEY MARKET FUNDS AVERAGE
Class A shares as of March 31, 2010
We are often asked to compare Thornburg California Limited Term Municipal Fund to money market fund returns. Municipal bond funds are not an exact substitute for money market funds. These investments have certain differences, which are summarized below. Investors in the Thornburg California Limited Term Municipal Fund took more risk than tax-exempt money market fund investors to earn their higher returns.
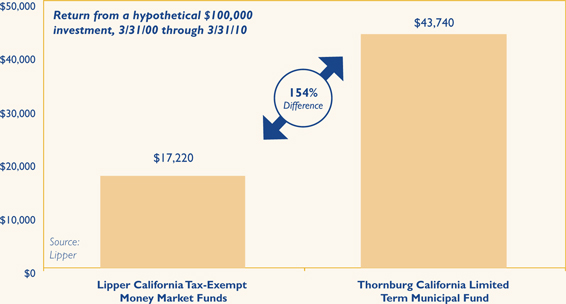
Past performance does not guarantee future results. Performance data above does not include the 1.50% sales charge for Class A shares. If the sales charge had been included, returns would have been lower. Returns shown are minus the initial investment.
Investors in municipal bond funds may experience more volatility than those in comparable money market funds. There are also differences in fees and expenses.
Investors in the Thornburg California Limited Term Municipal Fund took more risk than money market investors to earn their higher returns, including interest rate and credit risk. Unlike money market funds, the prices of bonds fluctuate relative to changes in interest rates, with principal values decreasing when interest rates rise and increasing when interest rates fall. Generally, money market funds seek to maintain an investment portfolio with an average maturity of 90 days or less. Thornburg California Limited Term Municipal Fund has an average maturity of normally less than five years. Interest dividends paid by the Fund or by California tax-exempt money market funds are generally exempt from federal income tax and, for residents of California, state income tax (may be subject to AMT).
Money market funds seek to preserve the value per share at $1.00, whereas, the Thornburg California Limited Term Municipal Fund’s net asset value changes daily. It is possible to lose money when investing in either the Thornburg California Limited Term Municipal Fund or a tax-exempt money market fund. Neither are insured by the FDIC or any other government agency.
Lipper California Tax-Exempt Money Market Funds Average is an arithmetic average of the total return of all tax-exempt money market mutual funds. You cannot invest in a category average.
This page is not part of the Semi-Annual Report. 5

Thornburg California Limited Term Municipal Fund
March 31, 2010
This report is certified under the Sarbanes-Oxley Act of 2002, which requires that public companies, including mutual funds, affirm that the information provided in their annual and semiannual shareholder reports fully and fairly represents their financial position.
6 Certified Semi-Annual Report
Letter to Shareholders
| | |

George Strickland Co-Portfolio Manager | | April 15, 2010 Dear Shareholder: We are pleased to present the semi-annual report for the Thornburg California Limited Term Municipal Fund. The net asset value of the Class A shares declined by five cents to $13.04 during the six months ended March 31, 2010. If you were with us for the entire period, you received dividends of 20.4 cents per share. If you reinvested your dividends, you received 20.6 cents per share. Dividends per share were lower for Class C shares and higher for Class I shares to account for varying class-specific expenses. |
| |
| |
| |

Josh Gonze Co-Portfolio Manager | | After a couple of years of unprecedented volatility, the municipal bond market has regained its status as one of the least exciting U.S. capital markets. While we embrace the new reality – slow and steady is what we strive for – we do not entirely trust it. Like other U.S. markets, the municipal market is benefiting from U.S. Treasury and Federal Reserve Bank support. By setting the Fed Funds Rate effectively at 0%, the Federal Open Market Committee (FOMC) is basically pushing hundreds of billions of dollars into bonds and bond funds. Flows into bond funds were $357 billion last year and may reach that level again this year. While we do not expect the Fed to hike the Fed Funds Rate soon, it is a reasonable bet that the next move will not be down. A significantly higher Fed Funds Rate, if and when it materializes, would likely not be good for bond fund flows or bond prices. |
| |

Christopher Ihlefeld Co-Portfolio Manager | | The second major element of federal support has been the implementation of the Build America Bond (BAB) program. This program allows municipalities to issue taxable bonds for qualified projects and receive a subsidy of 35% of their interest cost from the federal government. The program has been very popular, with almost $100 billion issued since the first deal was sold in April 2009. BAB issues currently account for over 30% of new issue municipal bond supply, crowding out much of the supply of traditional tax-exempt bonds. The reduced supply, coupled with heavy demand for bonds has provided significant support to municipal bond prices. The BAB program is scheduled to expire at the end of this year, but will probably be extended, most likely with a reduced subsidy. Depending upon the final form of the program, we may see the balance shift back to more traditional tax-exempt issuance in 2011, which could erode some support for bond prices. Another part of the American Recovery and Reinvestment Act allocated approximately $280 billion to the states for various stimulus-related projects. The federal dollars helped the states close over $300 billion of budget gaps during the current recession, but most of that money will be spent by June 30, 2011. If tax revenues come back strongly over the next 12-24 months, the disappearing stimulus money may not be missed. However, if tax revenues are slow to bounce back, budget balancing will remain a perilous task. |
| |
| |
| | Working in the opposite direction, higher tax rates should bolster demand for tax-exempt municipals, as Bush tax cuts expire and the highest marginal tax rates climb back up to 39.6% from 35%. On top of this, the recently signed health insurance reform law applies Medicare taxes to virtually all investment income except interest from tax-exempt municipal bonds. We believe that the status of municipal bonds as perhaps the last true legal tax shelter available to investors is not fully priced into the market. |
Certified Semi-Annual Report 7
Letter to Shareholders,
Continued
The U.S. economy apparently hit bottom last summer and has been growing the last three quarters. However, payroll employment growth just showed up last month, and so many jobs were lost in the last two years that it will take several years of robust growth just to get back down to six percent unemployment. Most banks are still very reluctant to increase lending, and core consumer price inflation has slowed to a level not seen since 1960. So, despite the large amount of additional debt (particularly from the U.S. Treasury) coming into the marketplace, we don’t expect a dramatic rise in interest rates this year.
After three quarters of positive GDP growth, state tax revenues are still falling. The fourth quarter of 2009 marks the fifth consecutive quarter of declining state tax revenues. The rate of decline has moderated to 4.2% from a peak of 16.5% in the second quarter, but state tax revenues are still down over 8% from levels two years ago. Prior to the current downturn, state tax revenues grew 5 to 5.5% on average for two decades, allowing budgets and entitlements to expand at an unsustainable pace. Most states are going through a very difficult adjustment process and dealing with shrinking tax revenues in very different ways.
California’s economy was particularly hard hit by the recent recession. The current unemployment rate of 12.6% is up 2% in the last year and almost 3% above the national unemployment rate. State tax revenues have dropped precipitously due primarily to a heavy reliance on income and capital gains taxes. Some previous budget solutions have proven difficult to enact, opening up a $6 billion deficit in the current (2009/10) fiscal year. The state expects the deficit to grow to $18.9 billion through the end of fiscal 2011, absent balancing measures. The governor has proposed filling the gap with $8.5 billion in spending cuts, $6.9 billion in extraordinary federal assistance, and $4.5 billion in fund shifts and other measures. Since some of the proposals are quite controversial, and it takes a 2/3 vote from the legislature to approve a budget, we can expect negotiations to be prolonged and contentious (yet again). In addition, it appears that the governor will not get much of the $6.9 billion of federal assistance he is counting on. Recent tax revenues have been $2 billion (3.9%) above expectations and home sales and prices have shown some strength lately. If the California economy continues to improve, budget balancing should get easier. However, long-term issues remain, including replacing lost revenue in 2012 when the federal stimulus funds dry up, and evidence of large underfunded pension obligations. We are optimistic that solutions can be reached, but cautious while we await further developments.
Tax revenues have held up much better at the local level, not yet going negative and growing 4.6% in the fourth quarter of 2009. Most local governments rely heavily on property taxes, which have traditionally been quite stable, and have proven to be so even in the worst real estate downturn in decades. Real estate taxes take a while to adjust and there are some areas of the country that are starting to see significantly lower tax revenues as properties make their way through the appeal process. We are watching these trends as they develop. Revenue bonds such as municipal utility bonds, hospital bonds, and toll roads have generally held up quite well in the current recession, and we continue to find issuers we like in these sectors. Hospitals, in particular, appear to be one of the few clear winners coming out of the recent health care reform law.
Despite much improved market liquidity, strong demand for bonds, and general economic optimism, it is a clearly a time for careful diligence and diversification of investment portfolios. Your Fund is broadly diversified and 90% invested in bonds rated A or above by at least one of the major rating agencies. Your Thornburg California Limited Term Municipal Fund is
8 Certified Semi-Annual Report
a laddered portfolio of over 140 municipal obligations from various municipal sectors and geographic regions within the state of California. We ladder the maturity dates of the bonds in your portfolio so that some of the bonds are scheduled to mature during each of the coming years. Laddering short and intermediate bonds accomplishes two goals. First, the staggered bond maturities contained in a ladder defuse interest-rate risk and dampen the Fund’s price volatility. Second, laddering gives the Fund a steady cash flow stream from maturing bonds to reinvest toward the top of the ladder where yields are typically higher. The chart on the right describes the percentages of your Fund’s bond portfolio maturing in each of the coming years.
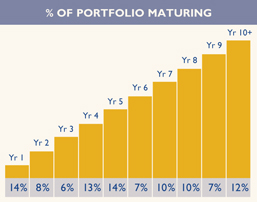
The Class A shares of your Fund produced a total return of 1.19% (at NAV) over the six-month period ended March 31, 2010, compared to a 1.32% return for the Barclays Capital Five-Year Municipal Bond Index. California bonds have significantly underperformed bonds from most other states over the last six months as many investors have steered their investments elsewhere (the Barclays index is a national index). In addition, over the last six months, 5-year bonds outperformed 1-4 year bonds and 6-10 year bonds. Since the Fund invests in a laddered portfolio of bonds from 1 to 10 years, many of the shorter and longer bonds in the Fund underperformed the index, leading to some underperformance by the Fund relative to the index.
Historically, our practice of laddering a diversified portfolio of short and intermediate maturity municipal bonds has allowed your Fund to perform consistently well in varying interest rate environments. Thank you for investing in Thornburg California Limited Term Municipal Fund.
Sincerely,
| | | | |
 | |  | |  |
| George Strickland | | Josh Gonze | | Christopher Ihlefeld |
| Co-Portfolio Manager | | Co-Portfolio Manager | | Co-Portfolio Manager |
| Managing Director | | Managing Director | | Managing Director |
The matters discussed in this report may constitute forward-looking statements made pursuant to the safe harbor provisions of the Securities Litigation Reform Act of 1995. These include any advisor or portfolio manager prediction, assessment, analysis or outlook for individual securities, industries, investment styles, market sectors and/or markets. These statements involve risks and uncertainties. In addition to the general risks described for each fund in its current prospectus, other factors bearing on these reports include the accuracy of the advisor’s or portfolio manager’s forecasts and predictions, the appropriateness of the investment strategies designed by the advisor or portfolio manager and the ability of the advisor or portfolio manager to implement their strategies efficiently and successfully. Any one or more of these factors, as well as other risks affecting the securities markets generally, could cause the actual results of any fund to differ materially as compared to its benchmarks.
Certified Semi-Annual Report 9
| | |
| SCHEDULE OF INVESTMENTS | | |
| |
| Thornburg California Limited Term Municipal Fund | | March 31, 2010 (Unaudited) |
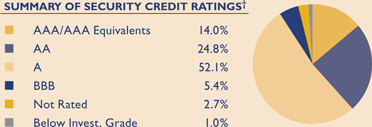
We have used ratings from Standard & Poor’s (S&P). Where S&P ratings are not available, we have used Moody’s Investors Service. Where neither rating is available, we have used ratings from Fitch Ratings. The category of investments identified as “AAA” in this graph includes investments which are pre-refunded or escrowed to maturity. Such investments are backed by an escrow or trust containing sufficient U.S. Government or U.S. Government agency securities to satisfy the timely payment of principal and interest and, therefore, are normally deemed to be equivalent to AAA-rated securities.
| | | | | | | | |
Issuer-Description | | Credit Rating†
S&P/ Moody’s | | Principal
Amount | | Value |
ABAG Finance Authority, 4.75% due 10/1/2011 (California School of Mechanical Arts) | | NR/A3 | | $ | 435,000 | | $ | 452,261 |
ABAG Finance Authority, 4.75% due 10/1/2012 (California School of Mechanical Arts) | | NR/A3 | | | 455,000 | | | 474,806 |
Alameda County COP, 5.375% due 12/1/2010 (Insured: Natl-Re) | | NR/A2 | | | 2,000,000 | | | 2,047,800 |
Alameda County COP, 5.625% due 12/1/2016 (Santa Rita Jail; Insured: AMBAC) | | AA-/NR | | | 1,830,000 | | | 2,087,591 |
Alvord USD GO, 5.25% due 2/1/2014 (Insured: Natl-Re) | | A+/Baa1 | | | 1,150,000 | | | 1,267,794 |
Bay Area Toll Authority, 5.00% due 4/1/2016 (San Francisco Bay Area) | | AA/Aa3 | | | 2,075,000 | | | 2,356,557 |
Burbank Water & Power, 5.00% due 6/1/2015 | | AA-/A1 | | | 750,000 | | | 849,540 |
Burbank Water & Power, 5.00% due 6/1/2016 | | AA-/A1 | | | 500,000 | | | 565,150 |
Burbank Water & Power, 5.00% due 6/1/2017 | | AA-/A1 | | | 1,000,000 | | | 1,127,110 |
Burbank Water & Power, 5.00% due 6/1/2018 | | AA-/A1 | | | 360,000 | | | 401,544 |
Burbank Water & Power, 5.00% due 6/1/2020 | | AA-/A1 | | | 625,000 | | | 690,112 |
Calexico USD GO, 6.75% due 9/1/2017 | | BBB+/NR | | | 3,060,000 | | | 3,237,358 |
California Educational Facilities Authority, 5.00% due 4/1/2018 (Pitzer College) | | NR/A3 | | | 1,540,000 | | | 1,630,490 |
California Educational Facilities Authority, 5.00% due 4/1/2020 (Pitzer College) | | NR/A3 | | | 1,445,000 | | | 1,507,395 |
California HFA, 5.00% due 11/15/2011 (Cedars Sinai Medical Center) | | AAA/A2 | | | 1,500,000 | | | 1,588,530 |
a California HFA, 5.25% due 10/1/2013 (Providence Health) | | AA/Aa2 | | | 650,000 | | | 726,206 |
California HFA, 5.00% due 8/15/2014 (Cedars Sinai Medical Center) | | NR/A2 | | | 1,500,000 | | | 1,639,590 |
California HFA, 6.00% due 10/1/2018 (Providence Health) | | AA/Aa2 | | | 500,000 | | | 586,800 |
California HFA, 5.10% due 2/1/2019 (Episcopal Home) | | A-/NR | | | 2,000,000 | | | 1,996,900 |
California HFA, 5.00% due 7/1/2027 put 7/1/2014 (Catholic Healthcare West) | | A/A2 | | | 2,000,000 | | | 2,170,040 |
California HFA, 0% due 8/1/2029 (Insured: AMBAC/FHA/VA) | | AA-/Aa3 | | | 3,200,000 | | | 1,010,880 |
California Housing Finance Agency, 4.85% due 8/1/2016 (Insured: AGM) (AMT) | | AAA/Aa2 | | | 1,000,000 | | | 1,010,310 |
California Housing Finance Agency, 9.875% due 2/1/2017 | | AA-/Aa3 | | | 1,345,000 | | | 1,369,829 |
California Housing Finance Agency, 5.00% due 8/1/2017 (Insured: AGM) (AMT) | | AAA/Aa2 | | | 980,000 | | | 1,000,070 |
California Housing Finance Agency, 5.125% due 8/1/2018 (Insured: AGM) (AMT) | | AAA/Aa2 | | | 1,000,000 | | | 983,770 |
California Mobile Home Park Financing Authority, 4.75% due 11/15/2010 (Rancho Vallecitos; Insured: ACA) | | NR/NR | | | 255,000 | | | 255,918 |
California Mobile Home Park Financing Authority, 5.00% due 11/15/2013 (Rancho Vallecitos; Insured: ACA) | | NR/NR | | | 570,000 | | | 571,277 |
California PCR, 5.90% due 6/1/2014 (San Diego Gas & Electric) | | A/A2 | | | 2,500,000 | | | 2,805,200 |
California PCR, 5.35% due 12/1/2016 (Pacific Gas & Electric) (AMT) | | A/A3 | | | 2,000,000 | | | 2,061,760 |
California PCR Solid Waste Disposal, 6.75% due 7/1/2011 (North County Recycling Center) (ETM) | | NR/Aaa | | | 980,000 | | | 1,021,513 |
California PCR Solid Waste Disposal, 5.25% due 6/1/2023 put 12/1/2017 (Republic Services, Inc.) (AMT) | | BBB/Baa3 | | | 1,620,000 | | | 1,638,014 |
California State Department of Transportation COP, 5.25% due 3/1/2016 (Insured: Natl-Re) | | A/Baa2 | | | 2,000,000 | | | 2,006,780 |
California State Department of Water Resources, 6.00% due 5/1/2013 | | AA-/Aa3 | | | 2,270,000 | | | 2,519,337 |
California State Department of Water Resources, 0.27% due 5/1/2022 put 4/1/2010 (Insured: Bank of New York) (daily demand notes) | | AA/Aaa | | | 1,000,000 | | | 1,000,000 |
California State Economic Recovery GO, 5.00% due 7/1/2018 | | A+/A1 | | | 3,000,000 | | | 3,306,330 |
California State GO, 5.75% due 10/1/2010 (Insured: AGM) | | AAA/Aa3 | | | 1,000,000 | | | 1,024,550 |
California State GO, 5.50% due 3/1/2012 (School Improvements; Insured: FGIC-TCRS) | | A/Baa1 | | | 230,000 | | | 233,855 |
10 Certified Semi-Annual Report
| | |
| SCHEDULE OF INVESTMENTS, CONTINUED | | |
| |
| Thornburg California Limited Term Municipal Fund | | March 31, 2010 (Unaudited) |
| | | | | | | | |
Issuer-Description | | Credit Rating†
S&P/ Moody’s | | Principal
Amount | | Value |
California State GO, 0.29% due 5/1/2034 put 4/1/2010 (Various Kindergarten; LOC: Citibank N.A.) (weekly demand notes) | | A+/Aaa | | $ | 1,000,000 | | $ | 1,000,000 |
California State Public Works Board, 5.00% due 11/1/2016 (California State University) | | BBB+/A1 | | | 1,000,000 | | | 1,047,500 |
California State Public Works Board Lease, 5.50% due 6/1/2010 (Various Universities) | | AA-/Aa2 | | | 360,000 | | | 363,020 |
California State Public Works Board Lease, 5.25% due 10/1/2013 (California State University) | | BBB+/A1 | | | 500,000 | | | 501,080 |
California State Public Works Board Lease, 5.25% due 12/1/2014 | | BBB+/Baa2 | | | 1,525,000 | | | 1,535,187 |
California State Public Works Board Lease, 5.00% due 1/1/2015 (Department of Corrections; Insured: AMBAC) | | BBB+/Baa3 | | | 2,000,000 | | | 2,139,160 |
California State Public Works Board Lease, 5.00% due 11/1/2015 (Various Universities) | | AA-/Aa2 | | | 1,000,000 | | | 1,086,630 |
California Statewide Communities Development Authority, 5.00% due 6/15/2013 | | A-/Baa1 | | | 2,500,000 | | | 2,682,025 |
California Statewide Communities Development Authority, 5.00% due 5/15/2015 (Irvine LLC- UCI East Campus) | | NR/Baa2 | | | 2,300,000 | | | 2,478,296 |
California Statewide Communities Development Authority, 5.00% due 4/1/2019 (Guaranty Agreement: Kaiser Permanente) | | A+/NR | | | 3,000,000 | | | 3,180,630 |
b California Statewide Communities Development Authority, 5.00% due 7/1/2020 (Aspire Public Schools) | | NR/NR | | | 1,350,000 | | | 1,347,759 |
California Statewide Community Development Authority, 5.00% due 7/1/2010 (Huntington Memorial Hospital) | | A+/NR | | | 1,000,000 | | | 1,009,000 |
California Statewide Community Development Authority, 5.25% due 8/1/2014 (East Campus Apartments; Insured: ACA) | | NR/Baa1 | | | 1,215,000 | | | 1,258,047 |
California Statewide Community Development Authority, 5.50% due 8/15/2014 (Enloe Medical Center; Insured: CA Mtg Insurance) | | A-/NR | | | 750,000 | | | 809,437 |
California Statewide Community Development Authority COP, 6.50% due 8/1/2012 (Cedars Sinai Center Hospital; Insured: Natl-Re) | | A/A2 | | | 430,000 | | | 456,153 |
California Statewide Community Development Authority PCR, 4.10% due 4/1/2028 put 4/1/2013 (Southern California Edison Co.; Insured: Syncora) | | A/A1 | | | 2,575,000 | | | 2,699,450 |
Carson Redevelopment Agency Tax Allocation, 6.00% due 10/1/2019 (Project Area 1) | | A-/NR | | | 1,050,000 | | | 1,147,734 |
Central Union High School District Imperial County, 5.00% due 8/1/2012 (Insured: FGIC) | | A+/NR | | | 830,000 | | | 881,377 |
Central Valley Financing Authority, 5.00% due 7/1/2015 (Carson Ice) | | A+/A1 | | | 1,000,000 | | | 1,102,110 |
Central Valley Financing Authority, 5.25% due 7/1/2020 (Carson Ice) | | A+/A1 | | | 500,000 | | | 545,945 |
Cerritos Public Financing Authority Tax Allocation, 5.00% due 11/1/2014 (Insured: AMBAC) | | A-/NR | | | 1,260,000 | | | 1,345,025 |
Chula Vista COP, 5.25% due 3/1/2020 | | A-/NR | | | 1,300,000 | | | 1,330,524 |
Corona Norco USD GO, 0% due 9/1/2017 (Insured: AGM) | | AAA/Aa3 | | | 1,595,000 | | | 1,152,212 |
Daly City Housing Development Financing Agency, 5.00% due 12/15/2019 (Franciscan Mobile Home Park) | | A-/NR | | | 1,815,000 | | | 1,743,616 |
Desert Sands USD COP, 5.25% due 3/1/2014 (School Improvements) | | A+/A2 | | | 1,745,000 | | | 1,874,793 |
Desert Sands USD COP, 5.00% due 3/1/2017 (School Improvements) | | A+/A2 | | | 1,500,000 | | | 1,565,115 |
East Bay Municipal Utility District, 0.28% due 6/1/2038 put 4/1/2010 (SPA: Dexia) (daily demand notes) | | AAA/Aa2 | | | 1,300,000 | | | 1,300,000 |
Escondido USD GO, 6.10% due 11/1/2011 (Insured: Natl-Re) | | A/Baa1 | | | 500,000 | | | 502,245 |
Fillmore Public Financing Authority, 5.00% due 5/1/2016 (Water Recycling; Insured: CIFG) | | A/Baa2 | | | 735,000 | | | 777,329 |
High Desert California Memorial Health Care, 5.40% due 10/1/2011 | | NR/NR | | | 1,315,000 | | | 1,316,328 |
Inland Valley Development Agency, 5.25% due 4/1/2012 | | A/NR | | | 1,490,000 | | | 1,563,278 |
Irvine Ranch Water District GO, 0.28% due 4/1/2033 put 4/1/2010 (LOC: Bank of America N.A.) (daily demand notes) | | A+/Aa3 | | | 1,075,000 | | | 1,075,000 |
Irvine Ranch Water District GO, 0.35% due 7/1/2035 put 4/1/2010 (LOC: Landesbank Baden) (daily demand notes) | | A-/Aa2 | | | 650,000 | | | 650,000 |
Irvine Ranch Water District GO, 0.27% due 10/1/2041 put 4/1/2010 (LOC: Bank of America) (daily demand notes) | | A+/Aa3 | | | 2,300,000 | | | 2,300,000 |
Kern Community College District COP, 4.00% due 4/1/2014 | | SP-1+/NR | | | 2,000,000 | | | 2,037,240 |
Kern High School District GO, 7.00% due 8/1/2010 (ETM) | | NR/Baa1 | | | 165,000 | | | 168,673 |
Kings Canyon Joint USD GO, 5.375% due 8/1/2017 (Insured: Natl-Re) | | A/NR | | | 1,000,000 | | | 1,067,200 |
Lindsay USD COP, 5.75% due 10/1/2017 (Insured: AGM) | | AAA/NR | | | 1,160,000 | | | 1,210,182 |
Certified Semi-Annual Report 11
| | |
| SCHEDULE OF INVESTMENTS, CONTINUED | | |
| |
| Thornburg California Limited Term Municipal Fund | | March 31, 2010 (Unaudited) |
| | | | | | | | |
Issuer-Description | | Credit Rating† S&P/ Moody’s | | Principal
Amount | | Value |
Lindsay USD COP, 6.00% due 10/1/2018 (Insured: AGM) | | AAA/NR | | $ | 680,000 | | $ | 711,620 |
Los Angeles Community Redevelopment Agency, 5.75% due 7/1/2010 (Cinerama Dome Public | | | | | | | | |
Parking; Insured: ACA) | | NR/NR | | | 435,000 | | | 432,542 |
Los Angeles Convention & Exhibition Center Authority, 5.00% due 8/15/2016 | | AA-/A1 | | | 2,000,000 | | | 2,209,240 |
aLos Angeles COP, 5.00% due 2/1/2012 (Insured: Natl-Re) | | A+/A1 | | | 1,400,000 | | | 1,488,410 |
Los Angeles County Schools, 5.00% due 6/1/2016 (Pooled Financing; Insured: Natl-Re) | | A/Baa1 | | | 1,000,000 | | | 1,050,660 |
Los Angeles County Schools, 5.00% due 6/1/2017 (Pooled Financing; Insured: Natl-Re) | | A/Baa1 | | | 1,010,000 | | | 1,048,350 |
Los Angeles Department of Airports, 5.50% due 5/15/2018 (Los Angeles Int’l.) | | AA/Aa3 | | | 2,000,000 | | | 2,179,280 |
Los Angeles Department of Water & Power, 5.25% due 7/1/2011 (Insured: Natl-Re) | | AA-/Aa3 | | | 3,000,000 | | | 3,175,770 |
Los Angeles Solid Waste, 3.00% due 2/1/2011 | | AA/Aa3 | | | 1,610,000 | | | 1,642,168 |
Los Angeles Solid Waste, 4.00% due 2/1/2012 | | AA/NR | | | 850,000 | | | 895,738 |
Los Angeles USD, 5.00% due 10/1/2015 (Insured: AMBAC) | | A+/A2 | | | 1,500,000 | | | 1,648,830 |
Los Angeles USD GO, 5.50% due 7/1/2012 (Insured: Natl-Re) | | AA-/Aa3 | | | 2,500,000 | | | 2,737,875 |
Merced Redevelopment Agency Tax Allocation, 5.25% due 9/1/2020 | | A-/NR | | | 1,190,000 | | | 1,215,038 |
Milpitas Redevelopment Agency Tax Allocation, 5.00% due 9/1/2015 (Insured: Natl-Re) | | A/Baa1 | | | 2,000,000 | | | 2,094,260 |
Mojave USD COP, 0% due 9/1/2017 (Insured: AGM) | | AAA/NR | | | 1,045,000 | | | 765,933 |
Mojave USD COP, 0% due 9/1/2018 (Insured: AGM) | | AAA/NR | | | 1,095,000 | | | 738,194 |
Monterey County COP, 5.00% due 8/1/2014 Refinancing Project; Insured: AGM) | | AAA/Aa3 | | | 2,000,000 | | | 2,210,740 |
Moorpark Mobile Home Park, 5.80% due 5/15/2010 (Villa Del Arroyo; Insured: ACA) | | NR/NR | | | 270,000 | | | 270,459 |
bNorthern California Power Agency, 4.00% due 7/1/2015 | | A/A2 | | | 500,000 | | | 536,825 |
bNorthern California Power Agency, 5.00% due 7/1/2016 | | A/A2 | | | 500,000 | | | 552,680 |
bNorthern California Power Agency, 5.00% due 7/1/2018 | | A/A2 | | | 1,250,000 | | | 1,354,850 |
aNorwalk Redevelopment Agency Tax Allocation, 5.00% due 10/1/2014 (Insured: Natl-Re) | | A/Baa1 | | | 625,000 | | | 663,375 |
Oxnard Financing Authority Solid Waste, 5.25% due 6/1/2014 (Insured: FGIC) | | A+/NR | | | 1,000,000 | | | 1,083,640 |
Oxnard Financing Authority Waste Water, 5.00% due 5/1/2013 (Insured: AMBAC) (AMT) | | A/NR | | | 2,115,000 | | | 2,255,817 |
Palomar Pomerado Health GO, 0% due 8/1/2019 (Insured: AGM) | | AAA/Aa3 | | | 2,000,000 | | | 1,268,080 |
Port Oakland California, 5.75% due 11/1/2012 (Port, Airport & Marina Improvements; Insured: | | | | | | | | |
FGIC) (AMT) | | A/A2 | | | 2,160,000 | | | 2,166,480 |
Richmond Joint Powers Financing Authority, 5.25% due 5/15/2013 (Lease & Gas Tax) | | A/NR | | | 390,000 | | | 390,113 |
Riverside County Palm Desert Financing Authority, 5.00% due 5/1/2013 | | AA-/A2 | | | 1,000,000 | | | 1,080,210 |
Roseville Natural Gas Financing Authority, 5.00% due 2/15/2017 | | A/A2 | | | 1,000,000 | | | 1,040,980 |
Sacramento City Financing Authority, 0% due 11/1/2014 (Insured: Natl-Re) | | A/Baa1 | | | 3,310,000 | | | 2,674,712 |
Sacramento Cogeneration Authority, 5.00% due 7/1/2015 (Procter & Gamble) | | A+/A1 | | | 1,100,000 | | | 1,224,223 |
Sacramento Cogeneration Authority, 5.00% due 7/1/2019 (Procter & Gamble) | | A+/A1 | | | 625,000 | | | 682,488 |
San Bernardino County Community Facilities District, 5.10% due 9/1/2011 | | NR/NR | | | 190,000 | | | 193,154 |
San Bernardino County Community Facilities District, 5.20% due 9/1/2012 | | NR/NR | | | 205,000 | | | 209,278 |
San Bernardino County Community Facilities District, 5.30% due 9/1/2013 | | NR/NR | | | 300,000 | | | 306,633 |
San Bernardino County Multi Family Housing, 4.75% due 12/15/2031 put 12/15/2011 (Rolling | | | | | | | | |
Ridge LLC; Collateralized: FNMA) | | NR/Aaa | | | 3,100,000 | | | 3,285,938 |
San Diego County COP, 5.625% due 9/1/2012 (Insured: AMBAC) | | NR/NR | | | 350,000 | | | 361,753 |
San Diego County COP, 5.50% due 9/1/2017 (Developmental Services Foundation) | | NR/Ba1 | | | 2,000,000 | | | 1,921,080 |
San Francisco City & County Airports, 5.25% due 5/1/2013 (Insured: Natl-Re/FGIC) | | A/A1 | | | 1,055,000 | | | 1,098,972 |
aSan Francisco City & County Airports, 6.50% due 5/1/2019 put 5/1/2010 (International Airport) | | A/A1 | | | 1,480,000 | | | 1,487,104 |
San Francisco City & County Redevelopment Agency, 0% due 7/1/2010 (George R. Moscone | | | | | | | | |
Convention Center) | | AA-/Aa3 | | | 1,380,000 | | | 1,374,232 |
San Francisco City & County Redevelopment Agency, 0% due 7/1/2011 (George R. Moscone; | | | | | | | | |
Insured: Natl Re-IBC) | | AA-/Aa3 | | | 1,200,000 | | | 1,190,604 |
San Joaquin County COP, 5.50% due 11/15/2013 (Capital Facilities; Insured: Natl-Re) | | A/Baa1 | | | 1,000,000 | | | 1,042,050 |
San Joaquin Delta Community College District GO, 0% due 8/1/2019 (Insured: AGM) | | AAA/Aa3 | | | 5,000,000 | | | 3,271,650 |
San Jose Evergreen Community College District GO, 0% due 9/1/2011 crossover refunded 9/1/2010 (Insured: AMBAC) | | AA-/Aa2 | | | 2,200,000 | | | 2,073,324 |
San Jose Redevelopment Agency Tax Allocation, 5.25% due 8/1/2012 (Merged Area Redevelopment; Insured: Natl-Re) | | A/A3 | | | 1,000,000 | | | 1,057,300 |
12 Certified Semi-Annual Report
| | |
| SCHEDULE OF INVESTMENTS, CONTINUED | | |
| |
| Thornburg California Limited Term Municipal Fund | | March 31, 2010 (Unaudited) |
| | | | | | | | | |
Issuer-Description | | Credit Rating† S&P/ Moody’s | | Principal
Amount | | Value | |
San Luis & Delta-Mendota Water Authority, 4.50% due 3/1/2014 (Water Utility Improvements) | | A+/NR | | $ | 2,000,000 | | $ | 2,121,200 | |
San Mateo Flood Control District COP, 5.25% due 8/1/2017 (Colma Creek; Insured: Natl-Re) | | A/Baa1 | | | 1,000,000 | | | 1,000,600 | |
San Mateo USD GO, 0% due 9/1/2019 (Insured: FGIC) | | AA/Aa2 | | | 2,000,000 | | | 1,309,300 | |
Santa Barbara County, 5.25% due 12/1/2014 (Insured: AMBAC) | | AA+/A1 | | | 1,145,000 | | | 1,244,981 | |
Santa Clara County Financing Authority, 5.00% due 5/15/2012 (Multiple Facilities) | | AA/Aa3 | | | 1,000,000 | | | 1,081,750 | |
Seal Beach Redevelopment Agency Mobile Home Park, 5.20% due 12/15/2013 (Insured: ACA) | | NR/NR | | | 470,000 | | | 480,725 | |
Solano County COP, 5.00% due 11/15/2013 | | AA-/A2 | | | 1,780,000 | | | 1,933,205 | |
Solano County COP, 5.00% due 11/15/2016 | | AA-/A2 | | | 1,000,000 | | | 1,065,290 | |
Southeast Resource Recovery Facilities Authority, 5.375% due 12/1/2013 (Insured: AMBAC) (AMT) | | A+/A2 | | | 1,060,000 | | | 1,137,486 | |
Southeast Resource Recovery Facilities Authority, 5.25% due 12/1/2017 (Insured: AMBAC) | | A+/A2 | | | 1,000,000 | | | 1,043,120 | |
Southern California Public Power Authority, 5.15% due 7/1/2015 (Insured: AMBAC) | | NR/Aa3 | | | 350,000 | | | 393,960 | |
Southern California Public Power Authority, 5.15% due 7/1/2015 (Insured: AMBAC) | | NR/Aa3 | | | 250,000 | | | 281,400 | |
Torrance Hospital Revenue, 6.00% due 6/1/2022 (Torrance Memorial Medical Center) | | A+/A1 | | | 2,600,000 | | | 2,648,568 | |
Tracy Area Public Facilities Financing Agency Special Tax, 5.875% due 10/1/2019 (Community | | | | | | | | | |
Facilities District No. 87) | | A/Baa1 | | | 835,000 | | | 841,872 | |
Tuolumne Wind Project Authority, 5.00% due 1/1/2015 (Tuolumne Co.) | | A+/A1 | | | 500,000 | | | 554,455 | |
Tuolumne Wind Project Authority, 5.00% due 1/1/2018 (Tuolumne Co.) | | A+/A1 | | | 1,460,000 | | | 1,580,654 | |
Twin Rivers USD GO, 0% due 4/1/2014 | | A+/NR | | | 1,000,000 | | | 878,150 | |
Val Verde USD COP, 5.00% due 1/1/2014 (Insured: FGIC) (ETM) | | NR/NR | | | 445,000 | | | 502,797 | |
Victorville Redevelopment Agency, 5.00% due 12/1/2014 (Bear Valley Road; Insured: AGM) | | AAA/Aa3 | | | 255,000 | | | 273,044 | |
Walnut Valley USD GO, 8.75% due 8/1/2010 (Insured: Natl-Re) (ETM) | | AA-/NR | | | 1,000,000 | | | 1,027,990 | |
Washington USD COP, 5.00% due 8/1/2017 (New High School; Insured: AMBAC) | | A/NR | | | 725,000 | | | 754,094 | |
Washington USD Yolo County, 5.00% due 8/1/2021 (New High School; Insured: AMBAC) | | A/NR | | | 910,000 | | | 908,298 | |
Whittier Solid Waste, 5.375% due 8/1/2014 (Insured: AMBAC) | | NR/NR | | | 855,000 | | | 856,197 | |
Woodland GO, 2.50% due 6/30/2010 (Revenue Anticipation Notes) | | SP-1+/NR | | | 1,900,000 | | | 1,906,575 | |
| | | | | | | | | |
TOTAL INVESTMENTS — 100.55% (Cost $185,455,235) | | | | | | | $ | 189,660,630 | |
LIABILITIES NET OF OTHER ASSETS — (0.55)% | | | | | | | | (1,045,342 | ) |
| | | | | | | | | |
NET ASSETS — 100.00% | | | | | | | $ | 188,615,288 | |
| | | | | | | | | |
Footnote Legend
| † | Credit ratings are unaudited. Rating changes may have occurred subsequent to the reporting period end. |
| a | Segregated as collateral for a when-issued security. |
Portfolio Abbreviations
To simplify the listings of securities, abbreviations are used per the table below:
| | |
| ABAG | | Association of Bay Area Governments |
| ACA | | Insured by American Capital Access |
| AGM | | Insured by Assured Guaranty Municipal Corp. |
| AMBAC | | Insured by American Municipal Bond Assurance Corp. |
| AMT | | Alternative Minimum Tax |
| CIFG | | Insured by CIFG Assurance North America Inc. |
| COP | | Certificates of Participation |
| ETM | | Escrowed to Maturity |
| FGIC | | Insured by Financial Guaranty Insurance Co. |
| FHA | | Insured by Federal Housing Administration |
| FNMA | | Collateralized by Federal National Mortgage Association |
| GO | | General Obligation |
| HFA | | Health Facilities Authority |
| LOC | | Letter of Credit |
| Mtg | | Mortgage |
| Natl-Re | | Insured by National Public Finance Guarantee Corp. |
| PCR | | Pollution Control Revenue Bond |
| SPA | | Stand-by Purchase Agreement |
| Syncora | | Insured by Syncora Guarantee Inc. |
| USD | | Unified School District |
See notes to financial statements.
Certified Semi-Annual Report 13
| | |
| STATEMENT OF ASSETS AND LIABILITIES | | |
| |
| Thornburg California Limited Term Municipal Fund | | March 31, 2010 (Unaudited) |
| | | | |
ASSETS | | | | |
Investments at value (cost $185,455,235) (Note 2) | | $ | 189,660,630 | |
Cash | | | 188,807 | |
Receivable for investments sold | | | 15,000 | |
Receivable for fund shares sold | | | 988,800 | |
Interest receivable | | | 2,245,036 | |
Prepaid expenses and other assets | | | 494 | |
| | | | |
Total Assets | | | 193,098,767 | |
| | | | |
| |
LIABILITIES | | | | |
Payable for securities purchased | | | 3,810,450 | |
Payable for fund shares redeemed | | | 315,983 | |
Payable to investment advisor and other affiliates (Note 3) | | | 128,676 | |
Accounts payable and accrued expenses | | | 32,221 | |
Dividends payable | | | 196,149 | |
| | | | |
Total Liabilities | | | 4,483,479 | |
| | | | |
| |
NET ASSETS | | $ | 188,615,288 | |
| | | | |
NET ASSETS CONSIST OF: | | | | |
Net unrealized appreciation on investments | | $ | 4,205,395 | |
Accumulated net realized gain (loss) | | | (208,619 | ) |
Net capital paid in on shares of beneficial interest | | | 184,618,512 | |
| | | | |
| | $ | 188,615,288 | |
| | | | |
| |
NET ASSET VALUE: | | | | |
Class A Shares: | | | | |
Net asset value and redemption price per share ($95,982,136 applicable to 7,363,074 shares of beneficial interest outstanding - Note 4) | | $ | 13.04 | |
Maximum sales charge, 1.50% of offering price | | | 0.20 | |
| | | | |
Maximum offering price per share | | $ | 13.24 | |
| | | | |
| |
Class C Shares: | | | | |
Net asset value and offering price per share * ($33,482,018 applicable to 2,566,394 shares of beneficial interest outstanding - Note 4) | | $ | 13.05 | |
| | | | |
| |
Class I Shares: | | | | |
Net asset value, offering and redemption price per share ($59,151,134 applicable to 4,533,365 shares of beneficial interest outstanding - Note 4) | | $ | 13.05 | |
| | | | |
| * | Redemption price per share is equal to net asset value less any applicable contingent deferred sales charge. |
See notes to financial statements.
14 Certified Semi-Annual Report
| | |
| STATEMENT OF OPERATIONS | | |
| |
| Thornburg California Limited Term Municipal Fund | | Six Months Ended March 31, 2010 (Unaudited) |
| | | | |
INVESTMENT INCOME: | | | | |
Interest income (net of premium amortized of $430,080) | | $ | 3,378,184 | |
| | | | |
| |
EXPENSES: | | | | |
Investment advisory fees (Note 3) | | | 411,059 | |
Administration fees (Note 3) | | | | |
Class A Shares | | | 54,180 | |
Class C Shares | | | 18,102 | |
Class I Shares | | | 12,193 | |
Distribution and service fees (Note 3) | | | | |
Class A Shares | | | 108,358 | |
Class C Shares | | | 146,299 | |
Transfer agent fees | | | | |
Class A Shares | | | 13,126 | |
Class C Shares | | | 6,411 | |
Class I Shares | | | 4,809 | |
Registration and filing fees | | | | |
Class A Shares | | | 21 | |
Class C Shares | | | 21 | |
Class I Shares | | | 21 | |
Custodian fees (Note 3) | | | 27,832 | |
Professional fees | | | 11,204 | |
Accounting fees | | | 3,045 | |
Trustee fees | | | 2,802 | |
Other expenses | | | 8,608 | |
| | | | |
Total Expenses | | | 828,091 | |
Less: | | | | |
Expenses reimbursed by investment advisor (Note 3) | | | (952 | ) |
Distribution fees waived (Note 3) | | | (73,150 | ) |
Fees paid indirectly (Note 3) | | | (237 | ) |
| | | | |
Net Expenses | | | 753,752 | |
| | | | |
Net Investment Income | | | 2,624,432 | |
| | | | |
REALIZED AND UNREALIZED GAIN (LOSS) | | | | |
Net realized gain (loss) on investments | | | 83,811 | |
Net change in unrealized appreciation (depreciation) of investments | | | (664,177 | ) |
| | | | |
Net Realized and Unrealized Loss | | | (580,366 | ) |
| | | | |
Net Increase in Net Assets Resulting From Operations | | $ | 2,044,066 | |
| | | | |
See notes to financial statements.
Certified Semi-Annual Report 15
| | |
| STATEMENTS OF CHANGES IN NET ASSETS | | |
| |
| Thornburg California Limited Term Municipal Fund | | |
| | | | | | | | |
| | | Six Months Ended
March 31, 2010* | | | Year Ended
September 30, 2009 | |
INCREASE (DECREASE) IN NET ASSETS FROM: | | | | | | | | |
| | |
OPERATIONS: | | | | | | | | |
Net investment income | | $ | 2,624,432 | | | $ | 4,598,784 | |
Net realized gain (loss) on investments | | | 83,811 | | | | 361,086 | |
Increase (Decrease) in unrealized appreciation (depreciation) of investments | | | (664,177 | ) | | | 5,790,621 | |
| | | | | | | | |
| | |
Net Increase (Decrease) in Net Assets Resulting from Operations | | | 2,044,066 | | | | 10,750,491 | |
| | |
DIVIDENDS TO SHAREHOLDERS: | | | | | | | | |
From net investment income | | | | | | | | |
Class A Shares | | | (1,361,167 | ) | | | (2,466,623 | ) |
Class C Shares | | | (416,455 | ) | | | (626,833 | ) |
Class I Shares | | | (846,810 | ) | | | (1,505,328 | ) |
| | |
FUND SHARE TRANSACTIONS (NOTE 4): | | | | | | | | |
Class A Shares | | | 16,813,496 | | | | 10,028,096 | |
Class C Shares | | | 7,590,791 | | | | 9,046,521 | |
Class I Shares | | | 18,146,377 | | | | (2,380,406 | ) |
| | | | | | | | |
| | |
Net Increase in Net Assets | | | 41,970,298 | | | | 22,845,918 | |
| | |
NET ASSETS: | | | | | | | | |
Beginning of Period | | | 146,644,990 | | | | 123,799,072 | |
| | | | | | | | |
| | |
End of Period | | $ | 188,615,288 | | | $ | 146,644,990 | |
| | | | | | | | |
See notes to financial statements.
16 Certified Semi-Annual Report
| | |
| NOTES TO FINANCIAL STATEMENTS | | |
| |
| Thornburg California Limited Term Municipal Fund | | March 31, 2010 (Unaudited) |
NOTE 1 – ORGANIZATION
Thornburg California Limited Term Municipal Fund (the “Fund”) is a diversified series of Thornburg Investment Trust (the “Trust”). The Trust is organized as a Massachusetts business trust under a Declaration of Trust dated June 3, 1987 and is registered as a diversified, open-end management investment company under the Investment Company Act of 1940, as amended. The Fund is currently one of sixteen separate series of the Trust. Each series is considered to be a separate entity for financial reporting and tax purposes and bears expenses directly attributable to it. The Fund’s primary investment objective is to obtain as high a level of current income exempt from federal and California state individual income tax as is consistent, in the view of the Fund’s investment advisor, with the preservation of capital. The Fund’s secondary objective is to reduce expected changes in its share price compared to longer intermediate and long-term bond portfolios.
The Fund currently offers three classes of shares of beneficial interest: Class A, Class C, and Institutional Class (Class I) shares. Each class of shares of the Fund represents an interest in the same portfolio of investments, except that (i) Class A shares are sold subject to a front-end sales charge collected at the time the shares are purchased and bear a service fee, (ii) Class C shares are sold at net asset value without a sales charge at the time of purchase, but are subject to a contingent deferred sales charge upon redemption within one year of purchase, and bear both a service fee and a distribution fee, (iii) Class I shares are sold at net asset value without a sales charge at the time of purchase, and (iv) the respective classes may have different reinvestment privileges and conversion rights. Additionally, the Fund may allocate among its classes certain expenses, to the extent allowable to specific classes, including transfer agent fees, government registration fees, certain printing and postage costs, and administrative and legal expenses. Currently, class specific expenses of the Fund are limited to service and distribution fees, administration fees, and certain registration and transfer agent expenses.
NOTE 2 – SIGNIFICANT ACCOUNTING POLICIES
Significant accounting policies of the Trust are as follows:
Valuation of Investments: Debt obligations have a primary market over the counter and are valued by an independent pricing service approved by the Trustees of the Trust. The pricing service ordinarily values debt obligations at quoted bid prices. When quotations are not available, debt obligations are valued at evaluated prices determined by the pricing service using methods which include consideration of yields or prices of debt obligations of comparable quality, type of issue, coupon, maturity and rating, and indications as to value from dealers and general market conditions. Short-term obligations having remaining maturities of 60 days or less are valued at amortized cost, which approximates market value.
In any case where a pricing service fails to provide a price for a debt obligation held by the Fund, the valuation and pricing committee determines a fair value for the obligation using procedures approved by the Trustees. Additionally, in any case where management believes that a price provided by a pricing service for a debt obligation may be unreliable, the valuation and pricing committee decides whether or not to use the pricing service’s valuation or to determine a fair value for the obligation.
In determining fair value for any portfolio security or other investment, the valuation and pricing committee seeks to determine the amount that an owner of the investment might reasonably expect to receive upon a sale of the investment. However, because fair value prices are estimated prices, the valuation and pricing committee’s determination of fair value for an investment may differ from the value that would be realized by the Fund upon a sale of the investment, and that difference could be material to the Fund’s financial statements. The valuation and pricing committee’s determination of fair value for an investment may also differ from the prices obtained by other persons (including other mutual funds) for the investment.
Valuation Measurements: Various inputs are used in determining the value of the Fund’s investments. These inputs are summarized in the three levels listed below.
Level 1: Quoted prices in active markets for identical investments.
Level 2: Other significant observable inputs (including quoted prices for similar investments, interest rates, prepayment rates, credit risk, etc.).
Level 3: Significant unobservable inputs (including the Fund’s own assumptions in determining the fair value of investments).
Certified Semi-Annual Report 17
| | |
| NOTES TO FINANCIAL STATEMENTS, CONTINUED | | |
| |
| Thornburg California Limited Term Municipal Fund | | March 31, 2010 (Unaudited) |
The following table displays a summary of the inputs used to value the Fund’s net assets as of March 31, 2010. In any instance when valuation inputs from more than one level are used to determine the fair value of a specific investment, the investment is placed in the level of the table based upon the lowest level input that is significant in determining the fair value of the investment:
| | | | | | | | | | | | |
| | | Fair Value Measurements at March 31, 2010 |
| | | Total | | Level 1 | | Level 2 | | Level 3 |
Assets | | | | | | | | | | | | |
Investments in Securities | | | | | | | | | | | | |
Municipal Bonds | | $ | 189,660,630 | | $ | — | | $ | 189,660,630 | | $ | — |
| | | | | | | | | | | | |
Total Investments in Securities | | $ | 189,660,630 | | $ | — | | $ | 189,660,630 | | $ | — |
Federal Income Taxes: It is the policy of the Trust to comply with the provisions of the Internal Revenue Code applicable to “regulated investment companies” and to distribute to shareholders substantially all taxable (if any) and tax exempt income of the Fund. Therefore, no provision for federal income tax is required.
When-Issued and Delayed Delivery Transactions: The Fund may engage in when-issued or delayed delivery transactions. To the extent the Fund engages in such transactions, it will do so for the purpose of acquiring portfolio securities consistent with the Fund’s investment objectives and not for the purpose of investment leverage or to speculate on interest rate and/or market changes. At the time the Fund makes a commitment to purchase a security on a when-issued or delayed delivery basis, the Fund will record the transaction and reflect the value in determining its net asset value. When effecting such transactions, assets of an amount sufficient to make payment for the portfolio securities to be purchased will be segregated on the Fund’s records on the trade date. Securities purchased on a when-issued or delayed delivery basis do not earn interest until the settlement date.
Dividends: Net investment income of the Fund is declared daily as a dividend on shares for which the Fund has received payment. Dividends are paid monthly and are reinvested in additional shares of the Fund at net asset value per share at the close of business on the dividend payment date, or at the shareholder’s option, paid in cash. Net realized capital gains, to the extent available, will be distributed at least annually.
General: Securities transactions are accounted for on a trade date basis. Interest income is accrued as earned. Premiums and discounts on securities purchased are amortized to call dates or maturity dates of the respective securities. Realized gains and losses from the sale of securities are recorded on an identified cost basis. Net investment income (other than class specific expenses) and realized and unrealized gains and losses are allocated daily to each class of shares based upon the relative net asset value of outstanding shares (or the value of the dividend-eligible shares, as appropriate) of each class of shares at the beginning of the day (after adjusting for the current capital shares activity of the respective class). Expenses common to all funds are allocated among the funds comprising the Trust based upon their relative net asset values or other appropriate allocation methods.
Guarantees and Indemnifications: Under the Trust’s organizational documents, its officers and Trustees are indemnified against certain liabilities arising out of the performance of their duties to the Fund. Additionally, in the normal course of business the Trust enters into contracts with service providers that contain general indemnification clauses. The Trust’s maximum exposure under these arrangements is unknown. However, based on experience, the Trust expects the risk of loss to be remote.
Use of Estimates: The preparation of financial statements, in conformity with generally accepted accounting principles, requires management to make estimates and assumptions that affect the reported amounts of assets and liabilities and the disclosure of contingent assets and liabilities at the date of the financial statements and the reported amounts of increases and decreases in net assets from operations during the reporting period. Actual results could differ from those estimates.
NOTE 3 – INVESTMENT ADVISORY FEE AND OTHER TRANSACTIONS WITH AFFILIATES
Pursuant to an investment advisory agreement, Thornburg Investment Management, Inc. (the “Advisor”) serves as the investment advisor and performs services to the Fund for which the fees are payable at the end of each month. For the six months ended March 31, 2010, these fees were payable at annual rates ranging from .50 of 1% to .225 of 1% per annum of the average daily net assets of the Fund depending on the Fund’s asset size. The Trust also has entered into administrative services agreements with the Advisor, whereby
18 Certified Semi-Annual Report
| | |
| NOTES TO FINANCIAL STATEMENTS, CONTINUED | | |
| |
| Thornburg California Limited Term Municipal Fund | | March 31, 2010 (Unaudited) |
the Advisor will perform certain administrative services for the shareholders of each class of the Fund’s shares, and for which fees will be payable at an annual rate of up to .125 of 1% per annum of the average daily net assets attributable to each class of shares. For the six months ended March 31, 2010, the Advisor voluntarily or contractually agreed to reimburse certain class specific expenses and administrative fees of $42 for Class A shares and $910 for Class C shares.
The Trust has an underwriting agreement with Thornburg Securities Corporation (the “Distributor,” an affiliate of the Advisor), which acts as the distributor of the Fund’s shares. For the six months ended March 31, 2010, the Distributor has advised the Fund that it earned $568 in commissions from the sale of Class A shares, and collected contingent deferred sales charges aggregating $2,051 from redemptions of Class C shares of the Fund.
Pursuant to a service plan under Rule 12b-1 of the Investment Company Act of 1940, the Fund may reimburse to the Advisor an amount not to exceed .25 of 1% per annum of the average daily net assets attributable to each class of shares of the Fund for payments made by the Advisor to securities dealers and other financial institutions to obtain various shareholder and distribution related services. The Advisor may pay out of its own resources additional expenses for distribution of the Fund’s shares.
The Trust has also adopted distribution plans pursuant to Rule 12b-1, applicable only to the Fund’s Class C shares, under which the Fund compensates the Distributor for services in promoting the sale of Class C shares of the Fund at an annual rate of up to .75 of 1% per annum of the average daily net assets attributable to Class C shares. Total fees incurred by the Distributor for each class of shares of the Fund under their respective Service and Distribution Plans and Class C distribution fees waived by the Distributor for the six months ended March 31, 2010, are set forth in the Statement of Operations. Distribution fees in the amount of $73,150 were waived for Class C shares.
The Trust has an agreement with the custodian bank to indirectly pay a portion of the custodian’s fees through credits earned by the Fund’s cash on deposit with the bank. This deposit agreement is an alternative to overnight investments. Custodial fees have been adjusted to reflect amounts that would have been paid without this agreement, with a corresponding adjustment reflected as fees paid indirectly in the Statement of Operations. For the six months ended March 31, 2010, fees paid indirectly were $237.
Certain officers and Trustees of the Trust are also officers and/or directors of the Advisor and Distributor. The compensation of independent Trustees is borne by the Trust.
NOTE 4 – SHARES OF BENEFICIAL INTEREST
At March 31, 2010, there were an unlimited number of shares of beneficial interest authorized. Transactions in shares of beneficial interest were as follows:
| | | | | | | | | | | | | | |
| | | Six Months Ended
March 31, 2010 (Unaudited) | | | Year Ended
September 30, 2009 (Audited) | |
| | | Shares | | | Amount | | | Shares | | | Amount | |
Class A Shares | | | | | | | | | | | | | | |
Shares sold | | 1,810,523 | | | $ | 23,576,751 | | | 2,070,439 | | | $ | 26,212,377 | |
Shares issued to shareholders in reinvestment of dividends | | 61,103 | | | | 796,156 | | | 131,040 | | | | 1,660,161 | |
Shares repurchased | | (579,931 | ) | | | (7,559,411 | ) | | (1,417,806 | ) | | | (17,844,442 | ) |
| | | | | | | | | | | | | | |
| | | | |
Net Increase (Decrease) | | 1,291,695 | | | $ | 16,813,496 | | | 783,673 | | | $ | 10,028,096 | |
| | | | | | | | | | | | | | |
Certified Semi-Annual Report 19
| | |
| NOTES TO FINANCIAL STATEMENTS, CONTINUED | | |
| |
| Thornburg California Limited Term Municipal Fund | | March 31, 2010 (Unaudited) |
| | | | | | | | | | | | | | |
| | | Six Months Ended
March 31, 2010 (Unaudited) | | | Year Ended
September 30, 2009 (Audited) | |
| | | Shares | | | Amount | | | Shares | | | Amount | |
Class C Shares | | | | | | | | | | | | | | |
Shares sold | | 720,348 | | | $ | 9,410,599 | | | 968,746 | | | $ | 12,324,994 | |
Shares issued to shareholders in reinvestment of dividends | | 21,686 | | | | 282,883 | | | 34,750 | | | | 441,022 | |
Shares repurchased | | (160,988 | ) | | | (2,102,691 | ) | | (295,558 | ) | | | (3,719,495 | ) |
| | | | | | | | | | | | | | |
| | | | |
Net Increase (Decrease) | | 581,046 | | | $ | 7,590,791 | | | 707,938 | | | $ | 9,046,521 | |
| | | | | | | | | | | | | | |
| | | | |
Class I Shares | | | | | | | | | | | | | | |
Shares sold | | 1,746,207 | | | $ | 22,799,236 | | | 2,296,396 | | | $ | 29,206,706 | |
Shares issued to shareholders in reinvestment of dividends | | 38,627 | | | | 503,978 | | | 86,889 | | | | 1,099,647 | |
Shares repurchased | | (395,519 | ) | | | (5,156,837 | ) | | (2,584,811 | ) | | | (32,686,759 | ) |
| | | | | | | | | | | | | | |
| | | | |
Net Increase (Decrease) | | 1,389,315 | | | $ | 18,146,377 | | | (201,526 | ) | | $ | (2,380,406 | ) |
| | | | | | | | | | | | | | |
NOTE 5 – SECURITIES TRANSACTIONS
For the six months ended March 31, 2010, the Fund had purchase and sale transactions of investment securities (excluding short-term investments) of $58,072,003 and $6,735,000, respectively.
NOTE 6 – INCOME TAXES
At March 31, 2010, information on the tax components of capital is as follows:
| | | | |
Cost of investments for tax purposes | | $ | 185,455,235 | |
| | | | |
Gross unrealized appreciation on a tax basis | | $ | 4,747,197 | |
Gross unrealized depreciation on a tax basis | | | (541,802 | ) |
| | | | |
Net unrealized appreciation (depreciation) on investments (tax basis) | | $ | 4,205,395 | |
| | | | |
At March 31, 2010, the Fund had tax basis capital losses of $292,430, which may be carried forward to offset future capital gains. To the extent such carryforwards are used, capital gain distributions may be reduced to the extent provided by regulations. Such capital loss carryforwards expire September 30, 2015.
OTHER NOTES
Fund management believes no events have occurred between March 31, 2010 and May 20, 2010, the date of issuance of the financial statements, that require adjustment of, or disclosure in, the accompanying financial statements.
20 Certified Semi-Annual Report
This page intentionally left blank.
Certified Semi-Annual Report 21
| | |
| FINANCIAL HIGHLIGHTS | | |
| |
| Thornburg California Limited Term Municipal Fund | | |
| | | | | | | | | | | | | | | | | | | | | | | | | | | | | | | | | | | | | | | | |
| | | PER SHARE PERFORMANCE (for a share outstanding throughout the period) | | RATIOS TO AVERAGE NET ASSETS | | | SUPPLEMENTAL DATA |
Unless
Otherwise
Noted,
Periods
are
Fiscal
Years Ended
Sept. 30, | | Net Asset
Value
Beginning
of
Period | | Net
Investment
Income
(Loss) | | Net
Realized
&
Unrealized
Gain (Loss)
on
Investments | | | Total from
Investment
Operations | | Dividends
from Net
Investment
Income | | | Dividends
from Net
Realized
Gains | | Total
Dividends | | | Net
Asset
Value
End
of
Period | | Net
Investment
Income
(Loss)
(%) | | | Expenses,
After
Expense
Reductions
(%) | | | Expenses,
After
Expense
Reductions
and
Net of
Custody
Credits
(%) | | | Expenses,
Before
Expense
Reductions
(%) | | | Total
Return
(%)(a) | | Portfolio
Turnover
Rate (%) | | Net Assets
at End
of Period
(Thousands) |
Class A Shares | | | | | | | | | | | | | | | | | | | | | | | | | |
2010(b)(c) | | $ | 13.09 | | 0.20 | | (0.05 | ) | | 0.15 | | (0.20 | ) | | — | | (0.20 | ) | | $ | 13.04 | | 3.14 | (d) | | 0.97 | (d) | | 0.97 | (d) | | 0.97 | (d) | | 1.19 | | 4.33 | | $ | 95,982 |
2009(c) | | $ | 12.49 | | 0.44 | | 0.60 | | | 1.04 | | (0.44 | ) | | — | | (0.44 | ) | | $ | 13.09 | | 3.48 | | | 0.98 | | | 0.98 | | | 0.99 | | | 8.50 | | 44.06 | | $ | 79,455 |
2008(c) | | $ | 12.73 | | 0.42 | | (0.24 | ) | | 0.18 | | (0.42 | ) | | — | | (0.42 | ) | | $ | 12.49 | | 3.32 | | | 1.00 | | | 0.98 | | | 1.00 | | | 1.42 | | 34.88 | | $ | 66,023 |
2007(c) | | $ | 12.77 | | 0.43 | | (0.04 | ) | | 0.39 | | (0.43 | ) | | — | | (0.43 | ) | | $ | 12.73 | | 3.37 | | | 0.99 | | | 0.99 | | | 1.01 | | | 3.10 | | 22.71 | | $ | 67,183 |
2006(c) | | $ | 12.79 | | 0.40 | | (0.02 | ) | | 0.38 | | (0.40 | ) | | — | | (0.40 | ) | | $ | 12.77 | | 3.17 | | | 0.92 | | | 0.87 | | | 1.01 | | | 3.06 | | 25.77 | | $ | 80,589 |
2005(c) | | $ | 13.02 | | 0.36 | | (0.23 | ) | | 0.13 | | (0.36 | ) | | — | | (0.36 | ) | | $ | 12.79 | | 2.75 | | | 1.00 | | | 0.99 | | | 1.02 | | | 0.98 | | 26.33 | | $ | 111,102 |
| | | | | | | | | |
Class C Shares | | | | | | | | | | | | | | | | | | | | | | | | | |
2010(b) | | $ | 13.10 | | 0.19 | | (0.05 | ) | | 0.14 | | (0.19 | ) | | — | | (0.19 | ) | | $ | 13.05 | | 2.88 | (d) | | 1.23 | (d) | | 1.23 | (d) | | 1.74 | (d) | | 1.06 | | 4.33 | | $ | 33,482 |
2009 | | $ | 12.50 | | 0.41 | | 0.60 | | | 1.01 | | (0.41 | ) | | — | | (0.41 | ) | | $ | 13.10 | | 3.23 | | | 1.24 | | | 1.24 | | | 1.76 | | | 8.22 | | 44.06 | | $ | 26,004 |
2008 | | $ | 12.74 | | 0.39 | | (0.24 | ) | | 0.15 | | (0.39 | ) | | — | | (0.39 | ) | | $ | 12.50 | | 3.06 | | | 1.26 | | | 1.24 | | | 1.78 | | | 1.16 | | 34.88 | | $ | 15,963 |
2007 | | $ | 12.78 | | 0.40 | | (0.04 | ) | | 0.36 | | (0.40 | ) | | — | | (0.40 | ) | | $ | 12.74 | | 3.13 | | | 1.24 | | | 1.23 | | | 1.79 | | | 2.85 | | 22.71 | | $ | 14,449 |
2006 | | $ | 12.80 | | 0.37 | | (0.02 | ) | | 0.35 | | (0.37 | ) | | — | | (0.37 | ) | | $ | 12.78 | | 2.92 | | | 1.18 | | | 1.13 | | | 1.83 | | | 2.80 | | 25.77 | | $ | 16,801 |
2005 | | $ | 13.03 | | 0.32 | | (0.23 | ) | | 0.09 | | (0.32 | ) | | — | | (0.32 | ) | | $ | 12.80 | | 2.50 | | | 1.25 | | | 1.24 | | | 1.82 | | | 0.73 | | 26.33 | | $ | 20,021 |
| | | | | | | | | |
Class I Shares | | | | | | | | | | | | | | | | | | | | | | | | | |
2010(b) | | $ | 13.10 | | 0.23 | | (0.05 | ) | | 0.18 | | (0.23 | ) | | — | | (0.23 | ) | | $ | 13.05 | | 3.47 | (d) | | 0.63 | (d) | | 0.63 | (d) | | 0.63 | (d) | | 1.36 | | 4.33 | | $ | 59,151 |
2009 | | $ | 12.50 | | 0.48 | | 0.60 | | | 1.08 | | (0.48 | ) | | — | | (0.48 | ) | | $ | 13.10 | | 3.81 | | | 0.65 | | | 0.65 | | | 0.65 | | | 8.86 | | 44.06 | | $ | 41,186 |
2008 | | $ | 12.74 | | 0.47 | | (0.24 | ) | | 0.23 | | (0.47 | ) | | — | | (0.47 | ) | | $ | 12.50 | | 3.66 | | | 0.65 | | | 0.63 | | | 0.65 | | | 1.77 | | 34.88 | | $ | 41,814 |
2007 | | $ | 12.78 | | 0.47 | | (0.04 | ) | | 0.43 | | (0.47 | ) | | — | | (0.47 | ) | | $ | 12.74 | | 3.71 | | | 0.66 | | | 0.65 | | | 0.68 | | | 3.44 | | 22.71 | | $ | 31,918 |
2006 | | $ | 12.80 | | 0.44 | | (0.02 | ) | | 0.42 | | (0.44 | ) | | — | | (0.44 | ) | | $ | 12.78 | | 3.50 | | | 0.66 | | | 0.55 | | | 0.71 | | | 3.39 | | 25.77 | | $ | 28,334 |
2005 | | $ | 13.03 | | 0.40 | | (0.23 | ) | | 0.17 | | (0.40 | ) | | — | | (0.40 | ) | | $ | 12.80 | | 3.09 | | | 0.68 | | | 0.67 | | | 0.73 | | | 1.31 | | 26.33 | | $ | 30,843 |
| (a) | Not annualized for periods less than one year. |
| (b) | Unaudited Six Month Period Ended March 31. |
| (c) | Sales loads are not reflected in computing total return. |
See notes to financial statements.
| | |
| 22 Certified Semi-Annual Report | | Certified Semi-Annual Report 23 |
| | |
| EXPENSE EXAMPLE | | |
| |
| Thornburg California Limited Term Municipal Fund | | March 31, 2010 (Unaudited) |
As a shareholder of the Fund, you incur two types of costs:
| | (1) | transaction costs, including |
(a) sales charges (loads) on purchase payments, for Class A shares;
(b) a deferred sales charge on redemptions of any part or all of a purchase of $1 million of Class A shares within 12 months of purchase;
(c) a deferred sales charge on redemptions of Class C shares within 12 months of purchase;
| | (2) | ongoing costs, including management fees; distribution and/or service (12b-1) fees; and other Fund expenses. |
This example is intended to help you understand your ongoing costs (in dollars) of investing in the Fund and to compare these costs with the ongoing costs of investing in other mutual funds.
The example is based on a $1,000 investment beginning on October 1, 2009, and held until March 31, 2010.
ACTUAL EXPENSES
For each class of shares, the first line of the table at right provides information about actual account values and actual expenses. You may use the information in this line, together with the amount you invested, to estimate the expenses that you paid over the period. Simply divide your account value by $1,000 (for example, an $8,600 account value divided by $1,000 = 8.6), then multiply the result by the number in the first line for your class of shares under the heading entitled “Expenses Paid During Period” to estimate the expenses you paid on your account during this period.
HYPOTHETICAL EXAMPLE FOR COMPARISON PURPOSES
For each class of shares, the second line of the table at right provides information about hypothetical account values and hypothetical expenses based on the Fund’s actual expense ratio and an assumed rate of return of 5% per year before expenses, which is not the Fund’s actual return. The hypothetical account values and expenses may not be used to estimate the actual ending account balance or expenses you paid for the period. You may use this information to compare the ongoing costs of investing in the Fund and other funds. To do so, compare this 5% hypothetical example with the 5% hypothetical examples that appear in the shareholder reports of the other funds.
| | | | | | | | | |
| | | Beginning
Account Value
10/1/09 | | Ending
Account Value
3/31/10 | | Expenses Paid
During Period†
10/1/09–3/31/10 |
Class A Shares | | | | | | | | | |
Actual | | $ | 1,000.00 | | $ | 1,011.90 | | $ | 4.87 |
Hypothetical* | | $ | 1,000.00 | | $ | 1,020.09 | | $ | 4.89 |
Class C Shares | | | | | | | | | |
Actual | | $ | 1,000.00 | | $ | 1,010.60 | | $ | 6.18 |
Hypothetical* | | $ | 1,000.00 | | $ | 1,018.78 | | $ | 6.21 |
Class I Shares | | | | | | | | | |
Actual | | $ | 1,000.00 | | $ | 1,013.60 | | $ | 3.18 |
Hypothetical* | | $ | 1,000.00 | | $ | 1,021.77 | | $ | 3.20 |
| † | Expenses are equal to the annualized expense ratio for each class (A: 0.97%; C: 1.23%; I: 0.63%) multiplied by the average account value over the period, multiplied by 182/365 to reflect the one-half year period. |
| * | Hypothetical assumes a rate of return of 5% per year before expenses. |
Please note that the expenses shown in the table are meant to highlight your ongoing costs only and do not reflect any transactional costs, such as sales charges (loads), redemption fees, or exchange fees. Therefore, the second line of the table for each class of shares is useful in comparing ongoing costs only, and will not help you determine the relative total costs of owning different funds. In addition, if these transactional costs were included, your costs would have been higher.
24 Certified Semi-Annual Report
| | |
| OTHER INFORMATION | | |
| |
| Thornburg California Limited Term Municipal Fund | | March 31, 2010 (Unaudited) |
PORTFOLIO PROXY VOTING
Policies and Procedures:
The Trust has delegated to Thornburg Investment Management, Inc. (the “Advisor”) voting decisions respecting proxies for the Fund’s voting securities. The Advisor makes voting decisions in accordance with its Proxy Voting Policy and Procedures. A description of the Policy and Procedures is available (i) without charge, upon request, by calling the Advisor toll-free at 1-800-847-0200, (ii) on the Thornburg website at www.thornburg.com, and (iii) on the Securities and Exchange Commission’s website at www.sec.gov.
Information regarding how proxies were voted is available on or before August 31 of each year for the twelve months ending the preceding June 30. This information is available (i) without charge, upon request by calling the Advisor toll-free at 1-800-847-0200, (ii) on the Thornburg website at www.thornburg.com, and (iii) on the Securities and Exchange Commission’s website at www.sec.gov.
AVAILABILITY OF QUARTERLY PORTFOLIO SCHEDULE
The Fund files with the Securities and Exchange Commission schedules of its portfolio holdings on Form N-Q for the first and third quarters of each fiscal year. The Fund’s Forms N-Q are available on the Commission’s website at www.sec.gov, or may be reviewed and copied at the Commission’s Public Reference Room in Washington, D.C. Information on the operation of the Public Reference Room may be obtained by calling 1-800-SEC-0330. The Fund also makes this information available on its website at www.thornburg.com/download or upon request by calling 1-800-847-0200.
Certified Semi-Annual Report 25
Trustees’ Statement to Shareholders
Not part of the Certified Semi-Annual Report
February 8, 2005, as readopted July 22, 2009
The Trustees are concerned that ongoing commentaries and opinions reported in the media may confuse investors in general as to the supervisory duties of trustees of mutual funds and, in particular, leave Thornburg Investment Trust shareholders uncertain regarding how we discharge our responsibilities in supervising the Funds’ investment advisor and in reviewing the advisor’s contract for renewal. We decided to spell out clearly three principal guidelines that we follow in supervising the Trust’s investment advisor on your behalf.
We begin with the premise that each shareholder selected his or her Fund because its investments are managed by the investment advisor identified in the prospectus and in accordance with the objective and policies described in the prospectus. We realize, as each of you do, that if you believe that your Fund’s stated objective and policies no longer serve your personal investment goals, you can sell your shares and leave the Fund.
Therefore, we believe that our primary supervisory task – our principal obligation to you – is to assess the nature and quality of the advisor’s services, and to confirm that the advisor actively and competently pursues the Fund’s objective, in accordance with the policies set out in the prospectus. To do this, we meet regularly with management to review your Fund’s portfolio and to discuss the advisor’s specific actions and judgments in pursuing the Fund’s objective. We do not substitute our own judgment for the advisor’s decisions in selecting investments; the advisor is paid to exercise its informed judgment on investment decisions, and we seek to confirm, in reviewing the advisor’s performance, that the advisor is doing just that.
Second, while we are conscious of costs and the effect that costs have on shareholders’ returns, we do not seek the lowest fees or expense ratio as our sole or primary objective. We try to make sure that your Fund’s fees and costs are reasonable in relationship to the services rendered and that they are generally in line with those charged by other expert investment advisors, consistent with our belief that the Fund’s investors searched for and expect that expertise and attention and have decided to pay a reasonable price for it. We do not put the management contract “out to bid” as a matter of course, and we would not do so unless we had concluded that the advisor materially had failed to pursue the Fund’s objectives in accordance with its policies, or for other equally important reasons. We believe that any other approach would be inconsistent with your interests and contrary to your expectations when you bought shares of the Fund in the first place.
Finally, because we believe that most Thornburg Fund shareholders have invested with a long-term perspective, we try not to focus too much on the fashions of the moment and on short-term performance. The market will not favor any specific investment objective or set of policies at all times and under all economic circumstances. A fund will experience periods of both high and low returns relative to other funds and other investments. Even if one of our Funds is not favored by the market at a particular time, we believe that the advisor is nonetheless obliged to remain true to the Fund’s objective and policies, and we watch to see that it does so.
26 This page is not part of the Semi-Annual Report.
This page intentionally left blank.
This page is not part of the Semi-Annual Report. 27
This page intentionally left blank.
28 This page is not part of the Semi-Annual Report.
Retirement and Education Accounts
Thornburg Investment Management offers retirement and education savings accounts that can help you meet a variety of planning challenges. For account applications or further information on any of the accounts below, please call 1-800-847-0200 or go to www.thornburg.com/ira. Your financial advisor can help you determine which plan is right for you.
Individual Retirement Accounts
Individual Retirement Accounts (IRAs) provide a tax-advantaged means to save money for the future. For a detailed outline of the difference between retirement accounts, see www.thornburg.com/ira. Rollovers are available. Call 1-800-847-0200 for more information.
Traditional IRAs – Contributions to Traditional IRAs are tax deductible for eligible individuals, and withdrawals are taxed as additional ordinary income. You may contribute to an IRA if you receive compensation and are under 70 1/ 2, even if you are covered by an employer retirement plan. Deductible contributions are subject to certain qualifications. Please consult your tax advisor.
Roth IRAs – Under a Roth IRA, there is no tax deduction for contributions, but there is no income tax on qualified withdrawals. For a more detailed comparison of Traditional and Roth IRAs, please see our web site at www.thornburg.com/ira.
SEP IRAs – Simplified Employee Pension (SEP) IRAs are established by employers. The employer is allowed a tax deduction for contributions made to the SEP Plan and makes contributions to each eligible employee’s SEP IRA on a discretionary basis.
SIMPLE IRAs – Savings Incentive Match Plan for Employees of Small Employers (SIMPLE) is designed to give small business owners a simplified method to establish and contribute to a retirement plan for employees. The employer is allowed a tax deduction for contributions and makes either matching or non-elective contributions to each eligible employee’s SIMPLE IRA. Employees may make salary deferral contributions.
Coverdell Education Savings Account
These savings accounts are designed to provide a way to save money for higher education expenses. In an Education Savings Account, earnings and interest grow tax-free, and qualified withdrawals used to pay for eligible higher-education expenses are tax- and penalty-free.
Funds Available
The following funds are available in the accounts listed above:
| | • | | Thornburg International Value Fund |
| | • | | Thornburg Core Growth Fund |
| | • | | Thornburg Investment Income Builder Fund |
| | • | | Thornburg Global Opportunities Fund |
| | • | | Thornburg International Growth Fund |
| | • | | Thornburg Developing World Fund |
| | • | | Thornburg Limited Term U.S. Government Fund |
| | • | | Thornburg Limited Term Income Fund |
| | • | | Thornburg Strategic Income Fund |
This page is not part of the Semi-Annual Report. 29

Thornburg Equity Funds
Thornburg’s equity research uses a fundamental and comprehensive analytical approach. Thornburg equity funds focus on a limited number of securities so that each holding can impact performance. The equity team searches for firms believed to have a promising future and seeks to buy shares of those companies at a discount to their intrinsic value.
| | • | | Thornburg International Value Fund |
| | • | | Thornburg Core Growth Fund |
| | • | | Thornburg Investment Income Builder Fund |
| | • | | Thornburg Global Opportunities Fund |
| | • | | Thornburg International Growth Fund |
| | • | | Thornburg Developing World Fund |
Thornburg Bond Funds
Thornburg Investment Management applies a disciplined philosophy to fixed-income management. Since the launch of our first fixed-income fund over 25 years ago, we have been conducting fundamental, bottom-up research in an effort to identify bonds which we believe provide the best return for a given level of risk. We are very organic in our approach, avoiding leverage or complex strategies which could backfire in periods of market uncertainty.
| | • | | Thornburg Limited Term Municipal Fund |
| | • | | Thornburg Intermediate Municipal Fund |
| | • | | Thornburg California Limited Term Municipal Fund |
| | • | | Thornburg New Mexico Intermediate Municipal Fund |
| | • | | Thornburg New York Intermediate Municipal Fund |
| | • | | Thornburg Strategic Municipal Income Fund |
| | • | | Thornburg Limited Term U.S. Government Fund |
| | • | | Thornburg Limited Term Income Fund |
| | • | | Thornburg Strategic Income Fund |
Before investing, carefully consider the Fund’s investment goals, risks, charges, and expenses. For a prospectus containing this and other information, contact your financial advisor or visit thornburg.com. Read it carefully before investing.
For additional information, please visit www.thornburg.com
Thornburg Investment Management, Inc. 2300 North Ridgetop Road, Santa Fe, NM 87506
This page is not part of the Semi-Annual Report. 31
| | | | | | |

| | Waste not, Wait not | |  |
| | |
| | |
| | | | Get instant access to your shareholder reports. |
| | |
| | This Semi-Annual Report is submitted for the general information of shareholders of the Fund. It is not authorized for distribution to prospective investors in the Fund unless preceded or accompanied by an effective prospectus. | | By switching from your postal mailbox to your email inbox, you reduce paper clutter, improve record keeping access, and help conserve our natural resources. |
| | |

| | Investment Advisor: Thornburg Investment Management® | | Go to www.thornburg.com/edelivery and sign up to receive your shareholder reports, prospectuses, and proxy statements electronically. |
| | 800.847.0200 | | |
| | Distributor: | | |
| | Thornburg Securities Corporation® 800.847.0200 | | You invest in the future, without spending a dime. |
| | TH1070 | | |

2 This page is not part of the Semi-Annual Report.
Important Information
The information presented on the following pages was current as of March 31, 2010. The managers’ views, portfolio holdings, and sector diversification are provided for the general information of the Fund’s shareholders; they are historical and subject to change. This material should not be deemed a recommendation to buy or sell any of the securities mentioned.
Investments in the Fund carry risks, including possible loss of principal. Bond funds have the same interest rate, inflation, and credit risks that are associated with the underlying bonds. The principal value of bonds will fluctuate relative to changes in interest rates, decreasing when interest rates rise. Unlike bonds, bond funds have ongoing fees and expenses. Please see the Fund’s Prospectus for a discussion of the risks associated with an investment in the Fund. Investments in the Fund are not FDIC insured, nor are they deposits of or guaranteed by a bank or any other entity. There is no guarantee that the Fund will meet its investment objectives. The laddering strategy does not assure or guarantee better performance and cannot eliminate the risk of investment losses.
Performance data given at net asset value (NAV) does not take into account the applicable sales charges. If the sales charges had been included, the performance would have been lower.
Minimum investments for Class I shares are higher than those for other classes. Class I shares may not be available to all investors.
| | | | |
Share Class | | NASDAQ Symbol | | Cusip |
| Class A | | THNMX | | 885-215-301 |
| Class D | | THNDX | | 885-215-624 |
| Class I | | THNIX | | 885-215-285 |
Lipper’s 2008
Best Fixed-Income Fund Family
Thornburg Investment Management ranked #1 out of 41 eligible firms in Lipper, Inc.’s fixed income large firm universe for the three-year period ended 12/31/07, based on risk-adjusted returns. Past performance does not guarantee future results.
Lipper’s large firm universe is comprised of fund families with more than $28 billion in total net assets. Only fund families with at least five bond funds were eligible. Risk-adjusted returns were calculated with dividends reinvested and without sales charges. We did not win this award in 2009 or 2010.
Glossary
Bank of America (BofA) Merrill Lynch 7-12 Year Municipal Bond Index – The BofA Merrill Lynch 7-12 Year Municipal Bond Index represents a broad measure of market performance. It is a model portfolio of municipal obligations throughout the U.S., with an average maturity which ranges from seven to twelve years.
Unless otherwise noted, index returns reflect the reinvestment of income dividends and capital gains, if any, but do not reflect fees, brokerage commissions or other expenses of investing. Investors may not make direct investments into any index.
Alternative Minimum Tax (AMT) – A federal tax aimed at ensuring that high-income individuals, estates, trusts, and corporations pay a minimal level income tax. For individuals, the AMT is calculated by adding tax preference items to regular taxable income.
Annualized Distribution Yield – The distribution yield is calculated by taking the sum of the month’s total distribution factors and dividing this sum by a 30-day period and annualizing to a 360-day year. The value is then divided by the ending maximum offering price per share to arrive at the annualized distribution yield. The yield is calculated on a periodic basis and is subject to change.
Bond Credit Ratings – A bond credit rating assesses the financial ability of a debt issuer to make timely payments of principal and interest. Ratings of AAA (the highest), AA, A, and BBB are investment-grade quality. Ratings of BB, B, CCC, CC, C, and D (the lowest) are considered below investment grade, speculative grade, or junk bonds. Unless otherwise noted, the ratings listed are from Municipal Market Data and are a combination of ratings from Standard and Poor’s, Moody’s Investors Service, and Fitch Ratings.
Duration – The weighted maturity of a bond’s cash flows. Duration measures the price sensitivity of a bond for a given change in interest rates. Bonds with longer durations experience greater price volatility than bonds with shorter durations.
Fed Funds Rate – The Fed Funds Rate is the interest rate at which a depository institution lends immediately available funds (balances at the Federal Reserve) to another depository institution overnight.
General Obligation (GO) Bonds – A municipal bond secured by the pledge of the issuer’s full faith, credit, and taxing power rather than the revenue from a given project.
Revenue Bond – A bond on which the debt service is payable solely from the revenue generated from the operation of the project being financed or a category of facilities, or from other non-tax sources.
SEC Yield – SEC Yield is computed in accordance with SEC standards measuring the net investment income per share over a specified 30-day period expressed as a percentage of the maximum offering price of the Fund’s shares at the end of the period.
This page is not part of the Semi-Annual Report. 3
Thornburg New Mexico Intermediate Municipal Fund
At Thornburg, our approach to management of the Fund is based on the premise that investors in the Fund seek preservation of capital along with an attractive, relatively stable yield. While aggressive bond strategies may generate stronger returns when the market is turning a blind eye towards risk, they usually fail to stack up over longer periods of time. Our patience and diligence was recognized by Lipper in 2008 with the Best Fixed-Income Fund Family Award.
We apply time-tested techniques to manage risk and provide attractive returns. These include:
| | • | | Building a laddered portfolio. Laddering has been shown over time to mitigate price and interest rate risk. |
| | • | | Investing on a cash-only basis without using leverage. While leveraged strategies may enhance returns when market conditions are favorable, they can quickly compound losses when sentiment shifts. |
| | • | | Conducting in-depth fundamental research on each issue and actively monitoring positions for subsequent credit events. |
| | • | | Diversifying among a large number of generally high-quality bonds. |
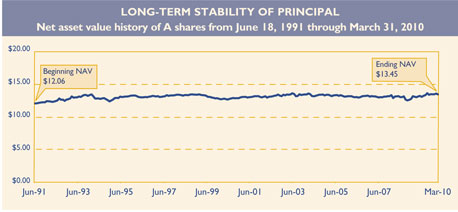
IMPORTANT PERFORMANCE INFORMATION
Performance data shown represents past performance and is no guarantee of future results. Investment return and principal value will fluctuate so shares, when redeemed, may be worth more or less than their original cost. Current performance may be lower or higher than quoted. For performance current to the most recent month end, visit thornburg.com.
The maximum sales charge for the Fund’s Class A shares is 2.00% . The total annual fund operating expense of Class A shares is 0.96%, as disclosed in the most recent Prospectus.
AVERAGE ANNUAL TOTAL RETURNS
For periods ended March 31, 2010
| | | | | | | | | | | | | | | |
| | | 1 Yr | | | 3 Yrs | | | 5 Yrs | | | 10 Yrs | | | Since
Inception | |
A Shares (Incep: 6/18/91) | | | | | | | | | | | | | | | |
Without sales charge | | 6.98 | % | | 4.42 | % | | 3.97 | % | | 4.28 | % | | 4.97 | % |
With sales charge | | 4.80 | % | | 3.71 | % | | 3.55 | % | | 4.07 | % | | 4.86 | % |
30-DAY YIELDS, A SHARES
As of March 31, 2010
| | | |
Annualized Distribution Yield | | SEC
Yield | |
3.09% | | 2.28 | % |
KEY PORTFOLIO ATTRIBUTES
As of March 31, 2010
| | |
Number of Bonds | | 127 |
Duration | | 4.5 Yrs |
Average Maturity | | 8.1 Yrs |
See the entire portfolio in the Schedule of Investments beginning on page 10.
4 This page is not part of the Semi-Annual Report.
THORNBURG NEW MEXICO INTERMEDIATE MUNICIPAL FUND VERSUS
LIPPER OTHER STATES TAX-EXEMPT MONEY MARKET FUNDS AVERAGE
Class A shares as of March 31, 2010
We are often asked to compare Thornburg New Mexico Intermediate Municipal Fund to money market fund returns. Municipal bond funds are not an exact substitute for money market funds. These investments have certain differences, which are summarized below. Investors in the Thornburg New Mexico Intermediate Municipal Fund took more risk than tax-exempt money market fund investors to earn their higher returns.
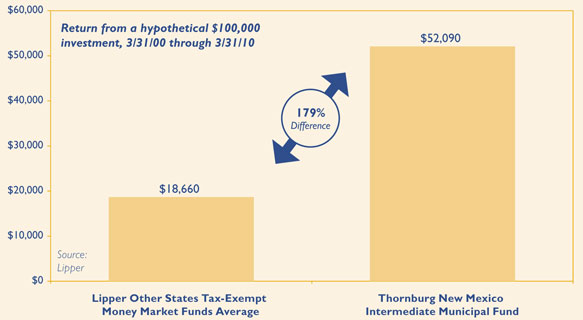
Past performance does not guarantee future results. Performance data above does not include the 2.00% sales charge for Class A shares. If the sales charge had been included, returns would have been lower. Returns shown are minus the initial investment.
Investors in municipal bond funds may experience more volatility than those in comparable money market funds. There are also differences in fees and expenses.
Investors in the Thornburg New Mexico Intermediate Municipal Fund took more risk than money market investors to earn their higher returns, including interest rate and credit risk. Unlike money market funds, the prices of bonds fluctuate relative to changes in interest rates, with principal values decreasing when interest rates rise and increasing when interest rates fall. Generally, money market funds seek to maintain an investment portfolio with an average maturity of 90 days or less. Thornburg New Mexico Intermediate Municipal Fund has an average maturity of normally between three and ten years. Interest dividends paid by the Fund or by tax-exempt money market funds are generally exempt from federal income tax and, for residents of New Mexico, state income tax (may be subject to AMT).
Money market funds seek to preserve the value per share at $1.00, whereas the Thornburg New Mexico Intermediate Municipal Fund’s net asset value changes daily. It is possible to lose money when investing in either the Thornburg New Mexico Intermediate Municipal Fund or a tax-exempt money market fund. Neither are insured by the FDIC or any other government agency.
Lipper Other States Tax-Exempt Money Market Funds Average is an arithmetic average of the total return of all tax-exempt money market mutual funds. You cannot invest in a category average.
This page is not part of the Semi-Annual Report. 5

Thornburg New Mexico Intermediate Municipal Fund
March 31, 2010
Table of Contents
This report is certified under the Sarbanes-Oxley Act of 2002, which requires that public companies, including mutual funds, affirm that the information provided in their annual and semiannual shareholder reports fully and fairly represents their financial position.
6 Certified Semi-Annual Report
Letter to Shareholders
| | |
 | | April 15, 2010 Dear Fellow Shareholder: We are pleased to present the semi-annual report for the Thornburg New Mexico Intermediate Municipal Fund. The net asset value of the Class A shares declined by 18 cents to $13.45 during the six months ended March 31, 2010. If you were with us for the entire period, you received dividends of 22.5 cents per share. If you reinvested your dividends, you received 22.6 cents per share. Dividends per share were lower for Class D shares and higher for Class I shares to account for varying class-specific expenses. After a couple of years of unprecedented volatility, the municipal bond market has regained its status as one of the least exciting U.S. capital markets. While we embrace the new reality – slow and steady is what we strive for – we do not entirely trust it. Like other U.S. markets, the municipal market is benefiting from U.S. Treasury and Federal Reserve Bank support. By setting the Fed Funds Rate effectively at 0%, the Federal Open Market Committee (FOMC) is effectively pushing hundreds of billions of dollars into bonds and bond funds. Flows into bond funds were $357 billion last year and may reach that level again this year. While we do not expect the Federal Reserve (the Fed) to hike the Fed Funds Rate soon, it is a reasonable bet that the next move will not be down. A significantly higher Fed Funds Rate, if and when it materializes, would likely not be good for bond fund flows or bond prices. The second major element of federal support has been the implementation of the Build America Bond (BAB) program. This program allows municipalities to issue taxable bonds for qualified projects and receive a subsidy of 35% of their interest cost from the federal government. The program has been very popular, with almost $100 billion issued since the first deal was sold in April 2009. BAB issues currently account for over 30% of new issue municipal bond supply, crowding out much of the supply of traditional tax-exempt bonds. The reduced supply, coupled with heavy demand for bonds has provided significant support to municipal bond prices. The BAB program is scheduled to expire at the end of this year, but will probably be extended, most likely with a reduced subsidy. Depending upon the final form of the program, we may see the balance shift back to more traditional tax-exempt issuance in 2011, which could erode some support for bond prices. Another part of the American Recovery and Reinvestment Act allocated approximately $280 billion to the states for various stimulus-related projects. The federal dollars helped the states close over $300 billion of budget gaps during the current recession, but most of that money will be spent by June 30, 2011. If tax revenues come back strongly over the next 12-24 months, the disappearing stimulus money may not be missed. However, if tax revenues are slow to bounce back, budget balancing will remain a perilous task. |
Certified Semi-Annual Report 7
Letter to Shareholders,
Continued
Working in the opposite direction, higher tax rates should bolster demand for tax-exempt municipals, as Bush tax cuts expire and the highest marginal tax rates climb back up to 39.6% from 35%. On top of this, the recently signed health insurance reform law applies Medicare taxes to virtually all investment income except interest from tax-exempt municipal bonds. We believe that the status of municipal bonds as perhaps the last true legal tax shelter available to investors is not fully priced into the market.
The U.S. economy apparently hit bottom last summer and has been growing the last three quarters. However, payroll employment growth just showed up last month, and so many jobs were lost in the last two years that it will take several years of robust growth just to get back down to 6% unemployment. Most banks are still very reluctant to increase lending, and core consumer price inflation has slowed to a level not seen since 1960. So, despite the large amount of additional debt (particularly from the U.S. Treasury) coming into the marketplace, we don’t expect a dramatic rise in interest rates this year.
After three quarters of positive GDP growth, state tax revenues are still falling. The fourth quarter of 2009 marks the fifth consecutive quarter of declining state tax revenues. The rate of decline has moderated to 4.2% from a peak of 16.5% in the second quarter, but state tax revenues are still down over 8% from levels two years ago. Prior to the current downturn, state tax revenues grew 5 to 5.5% on average for two decades, allowing budgets and entitlements to expand at an unsustainable pace. Most states are going through a very difficult adjustment process and dealing with shrinking tax revenues in very different ways.
New Mexico’s economy has held up significantly better than the national economy in the current downturn. The March 2010 unemployment rate is 8.8%, up from 6.3% a year ago, but almost 1% below the national average. The state has used a combination of spending cuts, tax increases, reserve fund draws, and stimulus funds to plug a $373 million gap in its $5.4 billion 2011 fiscal year budget. While the budget appears sound, it does draw reserves down to only $233 million and anticipates a 6% increase in recurring revenues. We will have to keep watching to see if the assumptions hold up or if further measures become necessary.
Tax revenues have held up much better at the local level, not yet going negative and growing 4.6% in the fourth quarter of 2009. Most local governments rely heavily on property taxes, which have traditionally been quite stable, and have proven to be so even in the worst real estate downturn in decades. Real estate taxes take a while to adjust and there are some areas of the country that are starting to see significantly lower tax revenues as properties make their way through the appeal process. We are watching these trends as they develop. Revenue bonds such as municipal utility bonds, hospital bonds, and toll roads have generally held up quite well in the current recession and we continue to find issuers we like in these sectors. Hospitals, in particular, appear to be one of the few clear winners coming out of the recent health care reform law.
Despite much improved market liquidity, strong demand for bonds, and general economic optimism, it is a clearly a time for careful diligence and diversification of investment portfolios. Your Fund is broadly diversified and 89% invested in bonds rated A or above by at least one of the major rating agencies. Your Thornburg New Mexico Intermediate Municipal Fund is a laddered portfolio of over 125 municipal obligations from all over the state. We ladder the maturity dates of the bonds in your portfolio so that some of the bonds are scheduled to mature during each of the coming years. Laddering intermediate bonds accomplishes two goals. First, the staggered bond maturities contained in a ladder defuse interest-rate risk and dampen the Fund’s price volatility. Second, laddering gives the Fund a steady cash flow stream from maturing bonds to reinvest toward the top of the ladder where yields are typically higher. The chart on the next page describes the percentages of your Fund’s bond portfolio maturing in each of the coming years.
8 Certified Semi-Annual Report
The Class A shares of your Fund produced a total return of 0.34% (at NAV) over the six-month period ended March 31, 2010, compared to a negative 0.13% return for the BofA Merrill Lynch 7-12 Year Municipal Bond Index. Over the last six months, 1-5 year bonds outperformed longer-term bonds, and revenue bonds generally outperformed general obligation bonds. The Fund’s overweight of revenue bonds and short-term bonds relative to the index contributed to its outperformance.
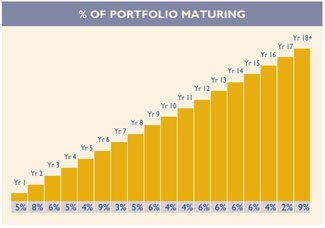
As of 3/31/10. Percentages vary over time.
Data may not add up to 100% due to rounding.
Historically, our practice of laddering a diversified portfolio of short- and intermediate-maturity municipal bonds has allowed your Fund to perform consistently well in varying interest rate environments.
Thank you for investing in Thornburg New Mexico Intermediate Municipal Fund.
| | | | |
| Sincerely, | | | | |
| | |
 | |  | |  |
| George Strickland | | Josh Gonze | | Christopher Ihlefeld |
| Co-Portfolio Manager | | Co-Portfolio Manager | | Co-Portfolio Manager |
| Managing Director | | Managing Director | | Managing Director |
The matters discussed in this report may constitute forward-looking statements made pursuant to the safe harbor provisions of the Securities Litigation Reform Act of 1995. These include any advisor or portfolio manager prediction, assessment, analysis or outlook for individual securities, industries, investment styles, market sectors and/or markets. These statements involve risks and uncertainties. In addition to the general risks described for each fund in its current prospectus, other factors bearing on these reports include the accuracy of the advisor’s or portfolio manager’s forecasts and predictions, the appropriateness of the investment strategies designed by the advisor or portfolio manager and the ability of the advisor or portfolio manager to implement their strategies efficiently and successfully. Any one or more of these factors, as well as other risks affecting the securities markets generally, could cause the actual results of any fund to differ materially as compared to its benchmarks.
Certified Semi-Annual Report 9
| | |
| SCHEDULE OF INVESTMENTS | | |
| |
| Thornburg New Mexico Intermediate Municipal Fund | | March 31, 2010 (Unaudited) |

We have used ratings from Standard & Poor’s (S&P). Where S&P ratings are not available, we have used Moody’s Investors Service. Where neither rating is available, we have used ratings from Fitch Ratings. The category of investments identified as “AAA” in this graph includes investments which are pre-refunded or escrowed to maturity. Such investments are backed by an escrow or trust containing sufficient U.S. Government or U.S. Government agency securities to satisfy the timely payment of principal and interest and, therefore, are normally deemed to be equivalent to AAA-rated securities.
| | | | | | | | |
Issuer-Description | | Credit Rating†
S&P/ Moody’s | | Principal
Amount | | Value |
Albuquerque Airport, 5.50% due 7/1/2013 | | A/A1 | | $ | 4,000,000 | | $ | 4,384,000 |
Albuquerque GO, 3.25% due 7/1/2011 | | AAA/Aa2 | | | 3,000,000 | | | 3,102,270 |
Albuquerque GRT, 0% due 7/1/2012 pre-refunded 7/1/2011 | | AAA/Aa3 | | | 1,775,000 | | | 1,692,480 |
Albuquerque GRT, 0% due 7/1/2012 (Insured: AGM) | | AAA/Aa3 | | | 225,000 | | | 210,607 |
Albuquerque GRT, 5.00% due 7/1/2021 | | AAA/Aa3 | | | 1,340,000 | | | 1,473,678 |
Albuquerque GRT, 5.00% due 7/1/2021 | | AAA/Aa3 | | | 3,000,000 | | | 3,299,280 |
Albuquerque IDRB, 5.15% due 4/1/2016 (MCT Industries Inc.; LOC: Bank of the West) (AMT) | | NR/A1 | | | 1,170,000 | | | 1,208,587 |
Albuquerque IDRB, 5.25% due 4/1/2017 (MCT Industries Inc.; LOC: Bank of the West) (AMT) | | NR/A1 | | | 2,140,000 | | | 2,200,284 |
Albuquerque Municipal School District GO, 5.00% due 8/1/2015 | | AA/Aa2 | | | 1,175,000 | | | 1,191,697 |
Albuquerque Refuse Removal & Disposal, 5.00% due 7/1/2010 (Insured: AGM) | | AAA/Aa3 | | | 415,000 | | | 419,860 |
Belen Gasoline Tax Improvement, 5.40% due 1/1/2011 | | NR/NR | | | 175,000 | | | 175,084 |
Bernalillo County GRT, 5.25% due 10/1/2012 | | AAA/Aa3 | | | 1,000,000 | | | 1,101,670 |
Bernalillo County GRT, 5.00% due 4/1/2021 (Insured: Natl-Re) | | AA/Aa3 | | | 3,000,000 | | | 3,334,590 |
Bernalillo County GRT, 5.25% due 10/1/2022 (Insured: AMBAC) | | AAA/Aa3 | | | 3,170,000 | | | 3,716,191 |
Bernalillo County GRT, 5.25% due 10/1/2023 (Insured: AMBAC) | | AAA/Aa3 | | | 1,275,000 | | | 1,498,826 |
Bernalillo County GRT, 5.25% due 10/1/2025 (Insured: AMBAC) | | AAA/Aa3 | | | 3,850,000 | | | 4,554,165 |
Bernalillo County Water Utility Authority, 5.00% due 7/1/2021 | | AAA/Aa2 | | | 1,520,000 | | | 1,695,575 |
Bernalillo County Water Utility Authority, 5.50% due 7/1/2025 | | AAA/Aa2 | | | 1,000,000 | | | 1,136,080 |
Bernalillo County Water Utility Authority, 5.00% due 7/1/2026 | | AAA/Aa2 | | | 1,420,000 | | | 1,532,322 |
Chaves County GRT, 5.00% due 7/1/2017 pre-refunded 7/1/2010 (Insured: FGIC) | | NR/A3 | | | 1,000,000 | | | 1,011,810 |
Chaves County GRT, 5.05% due 7/1/2019 pre-refunded 7/1/2010 (Insured: FGIC) | | NR/A3 | | | 735,000 | | | 743,769 |
Cibola County GRT, 6.00% due 11/1/2010 (Insured: AMBAC) (ETM) | | NR/NR | | | 555,000 | | | 573,454 |
Colfax County GRT, 5.00% due 9/1/2019 | | A-/NR | | | 1,000,000 | | | 1,000,180 |
Colfax County GRT, 5.50% due 9/1/2029 | | A-/NR | | | 2,510,000 | | | 2,524,533 |
Farmington Hospital, 5.00% due 6/1/2017 (San Juan Regional Medical Center) | | NR/A3 | | | 1,035,000 | | | 1,091,625 |
Farmington Hospital, 5.125% due 6/1/2018 (San Juan Regional Medical Center) | | NR/A3 | | | 570,000 | | | 586,633 |
Farmington Hospital, 5.125% due 6/1/2019 (San Juan Regional Medical Center) | | NR/A3 | | | 645,000 | | | 660,267 |
Farmington Hospital, 5.00% due 6/1/2022 (San Juan Regional Medical Center) | | NR/A3 | | | 2,325,000 | | | 2,369,710 |
Farmington PCR, 0.30% due 5/1/2024 put 4/1/2010 (LOC: Barclays Bank) (daily demand notes) | | A-1+/VMIG1 | | | 6,800,000 | | | 6,800,000 |
Farmington PCR, 4.00% due 6/1/2032 put 8/1/2012 (El Paso Electric Co; Insured: FGIC) | | BBB/Baa2 | | | 2,000,000 | | | 2,003,880 |
Farmington Utility Systems, 5.00% due 5/15/2012 (Insured: AGM) | | AAA/Aa3 | | | 6,095,000 | | | 6,354,159 |
Gallup PCR Tri-State Generation, 5.00% due 8/15/2011 (Insured: AMBAC) | | A/Baa1 | | | 500,000 | | | 520,675 |
Gallup PCR Tri-State Generation, 5.00% due 8/15/2012 (Insured: AMBAC) | | A/Baa1 | | | 3,345,000 | | | 3,537,137 |
Gallup PCR Tri-State Generation, 5.00% due 8/15/2013 (Insured: AMBAC) | | A/Baa1 | | | 2,110,000 | | | 2,260,422 |
Gallup PCR Tri-State Generation, 5.00% due 8/15/2017 (Insured: AMBAC) | | A/Baa1 | | | 3,540,000 | | | 3,673,033 |
Grant County Department of Health, 5.50% due 7/1/2020 (Ft. Bayard) | | AA/Aa2 | | | 1,565,000 | | | 1,712,360 |
Grant County Department of Health, 5.50% due 7/1/2021 (Ft. Bayard) | | AA/Aa2 | | | 1,655,000 | | | 1,798,786 |
Grant County Department of Health, 5.50% due 7/1/2022 (Ft. Bayard) | | AA/Aa2 | | | 1,745,000 | | | 1,883,989 |
Grant County Hospital Facility, 5.50% due 8/1/2010 (Gila Regional Medical Center; Insured: Radian) | | BBB/NR | | | 700,000 | | | 708,085 |
Guam Government, 5.375% due 12/1/2024 | | BBB-/NR | | | 2,000,000 | | | 2,009,580 |
Los Alamos County GRT Improvement, 5.75% due 6/1/2016 | | AA+/A1 | | | 1,000,000 | | | 1,139,110 |
10 Certified Semi-Annual Report
| | |
| SCHEDULE OF INVESTMENTS, CONTINUED | | |
| |
| Thornburg New Mexico Intermediate Municipal Fund | | March 31, 2010 (Unaudited) |
| | | | | | | | |
Issuer-Description | | Credit Rating†
S&P/ Moody’s | | Principal
Amount | | Value |
Los Alamos County GRT Improvement, 5.625% due 6/1/2023 | | AA+/A1 | | $ | 1,000,000 | | $ | 1,087,220 |
Los Alamos County GRT Improvement, 5.75% due 6/1/2024 | | AA+/A1 | | | 3,000,000 | | | 3,266,550 |
Los Alamos County GRT Improvement, 5.75% due 6/1/2025 | | AA+/A1 | | | 1,000,000 | | | 1,084,570 |
Los Alamos County Utility Systems, 5.00% due 7/1/2013 (Insured: AGM) | | AAA/Aa3 | | | 1,265,000 | | | 1,400,646 |
New Mexico Educational Assistance Foundation, 4.10% due 9/1/2015 (AMT) | | AAA/Aaa | | | 2,000,000 | | | 2,091,860 |
New Mexico Finance Authority, 5.00% due 6/15/2013 (Insured: AMBAC) | | NR/Aa3 | | | 2,280,000 | | | 2,516,938 |
New Mexico Finance Authority, 5.00% due 6/1/2014 (Insured: Natl-Re) | | AA+/Aa2 | | | 2,660,000 | | | 2,912,806 |
New Mexico Finance Authority, 5.00% due 6/15/2014 (Insured: Natl-Re) | | AA+/Aa2 | | | 2,100,000 | | | 2,382,807 |
New Mexico Finance Authority, 5.25% due 6/1/2015 (Insured: AMBAC) | | AA+/Aa2 | | | 1,000,000 | | | 1,114,940 |
New Mexico Finance Authority, 5.00% due 6/15/2015 (Insured: AMBAC) | | NR/Aa3 | | | 2,360,000 | | | 2,654,811 |
New Mexico Finance Authority, 5.00% due 6/15/2018 (Insured: AMBAC) | | NR/Aa3 | | | 2,915,000 | | | 3,134,208 |
New Mexico Finance Authority, 5.00% due 6/15/2019 (Insured: Natl-Re) | | NR/Aa3 | | | 1,215,000 | | | 1,294,668 |
New Mexico Finance Authority, 5.00% due 6/1/2020 (Insured: AMBAC) | | AA+/Aa2 | | | 365,000 | | | 390,787 |
New Mexico Finance Authority, 5.00% due 6/15/2022 (Insured: Natl-Re) | | AA-/Aa3 | | | 1,300,000 | | | 1,383,538 |
New Mexico Finance Authority, 5.00% due 6/15/2024 (Insured: Natl-Re) | | AA-/Aa3 | | | 7,000,000 | | | 7,515,620 |
New Mexico Highway Commission Senior Sub Lien Tax, 5.00% due 6/15/2010 (ETM) | | AAA/Aa2 | | | 255,000 | | | 257,443 |
New Mexico Highway Commission Senior Sub Lien Tax, 5.00% due 6/15/2010 | | AAA/Aa2 | | | 245,000 | | | 247,394 |
New Mexico Highway Commission Senior Sub Lien Tax, 5.50% due 6/15/2014 pre-refunded 6/15/2011 | | AAA/Aa2 | | | 2,000,000 | | | 2,117,920 |
New Mexico Hospital Equipment Loan Council, 4.80% due 8/1/2010 (Presbyterian Healthcare Services) | | AA-/Aa3 | | | 500,000 | | | 505,355 |
New Mexico Hospital Equipment Loan Council, 5.75% due 8/1/2016 pre-refunded 8/1/2011 (Presbyterian Healthcare Services) | | AA-/Aa3 | | | 3,205,000 | | | 3,449,798 |
New Mexico Hospital Equipment Loan Council, 5.00% due 7/1/2017 pre-refunded 7/1/2015 (St. Vincent Hospital; Insured: Radian) | | NR/Baa1 | | | 1,730,000 | | | 1,952,391 |
New Mexico Hospital Equipment Loan Council, 5.00% due 7/1/2019 pre-refunded 7/1/2015 (St. Vincent Hospital; Insured: Radian) | | NR/Baa1 | | | 1,000,000 | | | 1,128,550 |
New Mexico Hospital Equipment Loan Council, 5.00% due 7/1/2021 pre-refunded 7/1/2015 (St. Vincent Hospital; Insured: Radian) | | NR/Baa1 | | | 1,185,000 | | | 1,337,332 |
New Mexico Hospital Equipment Loan Council, 6.00% due 8/1/2023 (Presbyterian Healthcare Services) | | AA-/Aa3 | | | 6,000,000 | | | 6,584,280 |
New Mexico Hospital Equipment Loan Council, 5.25% due 7/1/2025 pre-refunded 7/1/2015 (St. Vincent Hospital; Insured: Radian) | | NR/Baa1 | | | 1,000,000 | | | 1,140,820 |
New Mexico Housing Authority MFR, 5.30% due 12/1/2022 (El Paseo Apartments; Insured: AMBAC) (AMT) | | NR/NR | | | 960,000 | | | 838,186 |
New Mexico MFA Forward Mtg, 6.50% due 7/1/2025 (Collateralized: FNMA/GNMA) | | AAA/NR | | | 115,000 | | | 119,907 |
New Mexico MFA MFR, 5.05% due 9/1/2027 (St. Anthony Apartments; Insured: FHA) (AMT) | | AAA/NR | | | 890,000 | | | 895,429 |
New Mexico MFA MFR, 6.05% due 7/1/2028 (Sandpiper Apartments; Insured: FHA) (AMT) | | AA-/NR | | | 2,335,000 | | | 2,445,936 |
New Mexico MFA MFR, 5.00% due 7/1/2031 put 7/1/2011 (Sombra Del Oso Apartments; Collateralized: FNMA) | | NR/Aaa | | | 2,000,000 | | | 2,088,480 |
New Mexico MFA MFR, 5.00% due 7/1/2031 put 7/1/2011 (Riverwalk Apartments; Collateralized: FNMA) | | NR/Aaa | | | 1,910,000 | | | 1,994,498 |
New Mexico MFA MFR, 5.00% due 7/1/2031 put 7/1/2011 (Tierra Pointe I Apartments; Collateralized: FNMA) | | NR/Aaa | | | 2,785,000 | | | 2,908,208 |
New Mexico MFA SFMR, 5.875% due 9/1/2020 (AMT) | | AAA/NR | | | 145,000 | | | 150,072 |
New Mexico MFA SFMR, 5.25% due 7/1/2023 (Collateralized: GNMA/FNMA/FHLMC) (AMT) | | AAA/NR | | | 1,410,000 | | | 1,457,009 |
New Mexico MFA SFMR, 5.375% due 7/1/2023 (Collateralized: GNMA/FNMA/FHLMC) (AMT) | | AAA/NR | | | 1,955,000 | | | 2,048,801 |
New Mexico MFA SFMR, 5.50% due 7/1/2028 (Collateralized: GNMA/FNMA/FHLMC) (AMT) | | AAA/NR | | | 3,075,000 | | | 3,172,539 |
New Mexico MFA SFMR, 5.60% due 7/1/2028 (Collateralized: GNMA/FNMA/FHLMC) (AMT) | | AAA/NR | | | 1,755,000 | | | 1,833,290 |
New Mexico MFA SFMR, 5.40% due 9/1/2029 (Collateralized: GNMA/FNMA/FHLMC) | | AAA/NR | | | 990,000 | | | 1,031,907 |
New Mexico Severance Tax, 5.00% due 7/1/2010 (Insured: Natl-Re) | | AA/Aa2 | | | 1,000,000 | | | 1,011,860 |
New Mexico State University, 5.00% due 4/1/2013 (Insured: AGM) | | AAA/Aa3 | | | 1,000,000 | | | 1,105,870 |
Rio Rancho GRT, 5.00% due 6/1/2014 (Insured: Natl-Re/FGIC) | | AA-/A1 | | | 955,000 | | | 1,065,885 |
Rio Rancho GRT, 5.00% due 6/1/2016 (Insured: Natl-Re/FGIC) | | AA-/A1 | | | 555,000 | | | 610,755 |
Certified Semi-Annual Report 11
| | |
| SCHEDULE OF INVESTMENTS, CONTINUED | | |
| |
| Thornburg New Mexico Intermediate Municipal Fund | | March 31, 2010 (Unaudited) |
| | | | | | | | |
Issuer-Description | | Credit Rating†
S&P/ Moody’s | | Principal
Amount | | Value |
Rio Rancho GRT, 5.00% due 6/1/2022 (Insured: Natl-Re/FGIC) | | AA-/A1 | | $ | 1,000,000 | | $ | 1,047,920 |
San Juan County Gasoline Tax/Motor Vehicle Improvement, 5.25% due 5/15/2014 | | NR/A1 | | | 400,000 | | | 426,864 |
San Juan County Gasoline Tax/Motor Vehicle Improvement, 5.25% due 5/15/2022 | | NR/A1 | | | 1,725,000 | | | 1,781,494 |
San Juan County GRT, 5.00% due 6/15/2014 (Insured: Natl-Re) | | A+/A1 | | | 1,225,000 | | | 1,364,993 |
Sandoval County Incentive Payment, 5.00% due 6/1/2020 (Intel Corp.) | | A+/NR | | | 6,390,000 | | | 6,696,209 |
Sandoval County Landfill Improvement, 5.50% due 8/15/2015 | | NR/Baa2 | | | 1,420,000 | | | 1,490,205 |
Sandoval County Landfill Improvement, 5.75% due 8/15/2018 | | NR/Baa2 | | | 1,335,000 | | | 1,363,823 |
Santa Fe Community College GO, 1.00% due 8/1/2010 | | NR/Aa2 | | | 4,100,000 | | | 4,109,143 |
Santa Fe County, 5.50% due 5/15/2015 (El Castillo Retirement) | | BBB-/NR | | | 1,099,000 | | | 1,099,835 |
Santa Fe County, 5.80% due 5/15/2018 (El Castillo Retirement) | | BBB-/NR | | | 1,835,000 | | | 1,834,890 |
Santa Fe County, 7.25% due 7/1/2029 (Rancho Viejo Improvement District) | | NR/NR | | | 1,705,000 | | | 1,644,046 |
Santa Fe County Charter School Foundation, 6.50% due 1/15/2026 (ATC Foundation) | | NR/NR | | | 1,000,000 | | | 929,130 |
Santa Fe County Charter School Foundation, 6.625% due 1/15/2036 (ATC Foundation) | | NR/NR | | | 1,030,000 | | | 925,743 |
Santa Fe County Correctional Systems, 5.00% due 2/1/2018 (Insured: AGM) | | AAA/Aa3 | | | 1,000,000 | | | 1,114,780 |
Santa Fe County Correctional Systems, 6.00% due 2/1/2027 (Insured: AGM) | | AAA/Aa3 | | | 1,520,000 | | | 1,746,997 |
Santa Fe County GRT, 5.00% due 6/1/2025 | | AA+/Aa2 | | | 1,400,000 | | | 1,504,314 |
Santa Fe County GRT, 5.00% due 6/1/2026 | | AA+/Aa2 | | | 1,535,000 | | | 1,638,766 |
Santa Fe Educational Facilities, 5.40% due 3/1/2017 (St. John’s College) | | BBB+/NR | | | 990,000 | | | 990,307 |
Santa Fe GRT, 5.25% due 6/1/2014 (Insured: AMBAC) | | AA+/A1 | | | 1,025,000 | | | 1,090,467 |
Santa Fe SFMR, 6.00% due 11/1/2010 (Collateralized: FNMA/GNMA) (AMT) | | NR/Aaa | | | 30,000 | | | 30,085 |
Santa Fe SFMR, 6.10% due 11/1/2011 (Collateralized: FNMA/GNMA) (AMT) | | NR/Aaa | | | 50,000 | | | 50,129 |
Santa Fe SFMR, 6.20% due 11/1/2016 (Collateralized: FNMA/GNMA) (AMT) | | NR/Aaa | | | 85,000 | | | 85,109 |
Taos County GRT, 4.25% due 10/1/2010 (Insured: Radian) | | NR/Baa1 | | | 1,000,000 | | | 1,011,590 |
Taos County GRT, 4.75% due 10/1/2012 (ETM) | | NR/Baa1 | | | 1,500,000 | | | 1,633,095 |
University of New Mexico, 5.25% due 6/1/2013 | | AA/Aa3 | | | 665,000 | | | 719,690 |
University of New Mexico, 5.25% due 6/1/2014 | | AA/Aa3 | | | 335,000 | | | 361,428 |
University of New Mexico, 5.00% due 6/1/2015 (Insured: AMBAC) | | AA/Aa3 | | | 1,590,000 | | | 1,806,431 |
University of New Mexico, 5.25% due 6/1/2015 | | AA/Aa3 | | | 1,195,000 | | | 1,315,420 |
University of New Mexico, 5.25% due 6/1/2016 | | AA/Aa3 | | | 645,000 | | | 695,884 |
University of New Mexico, 5.25% due 6/1/2017 | | AA/Aa3 | | | 1,730,000 | | | 1,864,559 |
University of New Mexico, 5.25% due 6/1/2018 | | AA/Aa3 | | | 1,825,000 | | | 1,963,298 |
University of New Mexico, 5.25% due 6/1/2018 | | AA/Aa3 | | | 1,200,000 | | | 1,320,924 |
University of New Mexico, 5.25% due 6/1/2021 | | AA/Aa3 | | | 1,000,000 | | | 1,078,920 |
University of New Mexico, 6.00% due 6/1/2021 | | AA/Aa3 | | | 610,000 | | | 712,645 |
University of New Mexico Hospital Mtg Bonds, 5.00% due 1/1/2016 (Insured: AGM/FHA) | | AAA/Aa3 | | | 2,920,000 | | | 3,127,174 |
University of New Mexico Hospital Mtg Bonds, 5.00% due 1/1/2017 (Insured: AGM/FHA) | | AAA/Aa3 | | | 2,000,000 | | | 2,119,840 |
University of New Mexico Hospital Mtg Bonds, 5.00% due 1/1/2018 (Insured: AGM/FHA) | | AAA/Aa3 | | | 2,000,000 | | | 2,102,880 |
University of New Mexico Hospital Mtg Bonds, 5.00% due 1/1/2019 (Insured: AGM/FHA) | | AAA/Aa3 | | | 3,000,000 | | | 3,136,290 |
University of New Mexico Hospital Mtg Bonds, 5.00% due 7/1/2019 (Insured: AGM/FHA) | | AAA/Aa3 | | | 3,000,000 | | | 3,133,890 |
University of New Mexico Hospital Mtg Bonds, 5.00% due 1/1/2020 (Insured: AGM/FHA) | | AAA/Aa3 | | | 2,310,000 | | | 2,402,977 |
University of New Mexico Hospital Mtg Bonds, 5.00% due 7/1/2020 (Insured AGM/FHA) | | AAA/Aa3 | | | 500,000 | | | 520,030 |
Ventana West Public Improvement District Special Tax, 6.625% due 8/1/2023 | | NR/NR | | | 2,000,000 | | | 1,816,280 |
Villa Hermosa Multi Family Housing, 5.85% due 11/20/2016 (Villa Hermosa Apartments; Collateralized: GNMA) (AMT) | | CC/NR | | | 1,105,000 | | | 1,024,524 |
Virgin Islands Public Finance Authority, 6.625% due 10/1/2029 | | BBB/Baa3 | | | 5,000,000 | | | 5,335,700 |
| | | | | | | | |
TOTAL INVESTMENTS — 98.68% (Cost $ 223,570,513) | | | | | | | $ | 232,791,045 |
OTHER ASSETS LESS LIABILITIES — 1.32% | | | | | | | | 3,123,394 |
| | | | | | | | |
NET ASSETS — 100.00% | | | | | | | $ | 235,914,439 |
| | | | | | | | |
12 Certified Semi-Annual Report
| | |
| SCHEDULE OF INVESTMENTS, CONTINUED | | |
| |
| Thornburg New Mexico Intermediate Municipal Fund | | March 31, 2010 (Unaudited) |
Footnote Legend
| † | Credit ratings are unaudited. Rating changes may have occurred subsequent to the reporting period end. |
Portfolio Abbreviations
To simplify the listings of securities, abbreviations are used per the table below:
| | |
| AGM | | Insured by Assured Guaranty Municipal Corp. |
| AMBAC | | Insured by American Municipal Bond Assurance Corp. |
| AMT | | Alternative Minimum Tax |
| ETM | | Escrowed to Maturity |
| FGIC | | Insured by Financial Guaranty Insurance Co. |
| FHA | | Insured by Federal Housing Administration |
| FHLMC | | Insured by Federal Home Loan Mortgage Corp. |
| FNMA | | Collateralized by Federal National Mortgage Association |
| GNMA | | Insured by Government National Mortgage Co. |
| GO | | General Obligation |
| GRT | | Gross Receipts Tax |
| IDRB | | Industrial Development Revenue Bond |
| LOC | | Letter of Credit |
| MFA | | Mortgage Finance Authority |
| Mtg | | Mortgage |
| MFR | | Multi-Family Revenue Bond |
| Natl-Re | | Insured by National Public Finance Guarantee Corp. |
| PCR | | Pollution Control Revenue Bond |
| Radian | | Insured by Radian Asset Assurance |
| SFMR | | Single Family Mortgage Revenue Bond |
See notes to financial statements.
Certified Semi-Annual Report 13
| | |
| STATEMENT OF ASSETS AND LIABILITIES | | |
| |
| Thornburg New Mexico Intermediate Municipal Fund | | March 31, 2010 (Unaudited) |
| | | | |
ASSETS | | | | |
Investments at value (cost $223,570,513) (Note 2) | | $ | 232,791,045 | |
Cash | | | 146,690 | |
Receivable for fund shares sold | | | 381,350 | |
Interest receivable | | | 3,138,944 | |
Prepaid expenses and other assets | | | 1,229 | |
| | | | |
Total Assets | | | 236,459,258 | |
| | | | |
LIABILITIES | | | | |
Payable for fund shares redeemed | | | 122,657 | |
Payable to investment advisor and other affiliates (Note 3) | | | 172,659 | |
Accounts payable and accrued expenses | | | 35,486 | |
Dividends payable | | | 214,017 | |
| | | | |
Total Liabilities | | | 544,819 | |
| | | | |
NET ASSETS | | $ | 235,914,439 | |
| | | | |
NET ASSETS CONSIST OF: | | | | |
Distribution in excess of net investment income | | $ | (25,824 | ) |
Net unrealized appreciation on investments | | | 9,220,532 | |
Accumulated net realized gain (loss) | | | (307,533 | ) |
Net capital paid in on shares of beneficial interest | | | 227,027,264 | |
| | | | |
| | $ | 235,914,439 | |
| | | | |
NET ASSET VALUE: | | | | |
Class A Shares: | | | | |
Net asset value and redemption price per share
($189,103,644 applicable to 14,064,217 shares of beneficial interest outstanding - Note 4) | | $ | 13.45 | |
Maximum sales charge, 2.00% of offering price | | | 0.27 | |
| | | | |
Maximum offering price per share | | $ | 13.72 | |
| | | | |
Class D Shares: | | | | |
Net asset value, offering and redemption price per share
($20,030,681 applicable to 1,489,079 shares of beneficial interest outstanding - Note 4) | | $ | 13.45 | |
| | | | |
Class I Shares: | | | | |
Net asset value, offering and redemption price per share
($26,780,114 applicable to 1,992,750 shares of beneficial interest outstanding - Note 4) | | $ | 13.44 | |
| | | | |
See notes to financial statements.
14 Certified Semi-Annual Report
| | |
| STATEMENT OF OPERATIONS | | |
| |
| Thornburg New Mexico Intermediate Municipal Fund | | Six Months Ended March 31, 2010 (Unaudited) |
| | | | |
INVESTMENT INCOME: | | | | |
Interest income (net of premium amortized of $482,920) | | $ | 5,002,421 | |
| | | | |
EXPENSES: | | | | |
Investment advisory fees (Note 3) | | | 581,533 | |
Administration fees (Note 3) | | | | |
Class A Shares | | | 116,961 | |
Class D Shares | | | 11,473 | |
Class I Shares | | | 6,780 | |
Distribution and service fees (Note 3) | | | | |
Class A Shares | | | 233,921 | |
Class D Shares | | | 92,252 | |
Transfer agent fees | | | | |
Class A Shares | | | 26,201 | |
Class D Shares | | | 3,538 | |
Class I Shares | | | 1,239 | |
Registration and filing fees | | | | |
Class A Shares | | | 261 | |
Class D Shares | | | 97 | |
Class I Shares | | | 220 | |
Custodian fees (Note 3) | | | 35,974 | |
Professional fees | | | 11,574 | |
Accounting fees | | | 5,269 | |
Trustee fees | | | 3,345 | |
Other expenses | | | 9,025 | |
| | | | |
Total Expenses | | | 1,139,663 | |
Less: | | | | |
Distribution fees waived (Note 3) | | | (46,126 | ) |
Fees paid indirectly (Note 3) | | | (781 | ) |
| | | | |
Net Expenses | | | 1,092,756 | |
| | | | |
Net Investment Income | | | 3,909,665 | |
| | | | |
REALIZED AND UNREALIZED GAIN (LOSS) | | | | |
Net realized gain (loss) on investments | | | (369 | ) |
Net change in unrealized appreciation (depreciation) of investments | | | (3,108,964 | ) |
| | | | |
Net Realized and Unrealized Loss | | | (3,109,333 | ) |
| | | | |
Net Increase in Net Assets Resulting From Operations | | $ | 800,332 | |
| | | | |
See notes to financial statements.
Certified Semi-Annual Report 15
| | |
| STATEMENTS OF CHANGES IN NET ASSETS | | |
| |
| Thornburg New Mexico Intermediate Municipal Fund | | |
| | | | | | | | |
| | | Six Months Ended
March 31, 2010* | | | Year Ended
September 30, 2009 | |
INCREASE (DECREASE) IN NET ASSETS FROM: | | | | | | | | |
| | |
OPERATIONS: | | | | | | | | |
Net investment income | | $ | 3,909,665 | | | $ | 7,681,490 | |
Net realized gain (loss) on investments | | | (369 | ) | | | 112,309 | |
Increase (Decrease) in unrealized appreciation (depreciation) of investments | | | (3,108,964 | ) | | | 16,000,619 | |
| | | | | | | | |
| | |
Net Increase (Decrease) in Net Assets Resulting from Operations | | | 800,332 | | | | 23,794,418 | |
| | |
DIVIDENDS TO SHAREHOLDERS: | | | | | | | | |
From net investment income | | | | | | | | |
Class A Shares | | | (3,127,414 | ) | | | (6,101,848 | ) |
Class D Shares | | | (282,636 | ) | | | (551,422 | ) |
Class I Shares | | | (499,615 | ) | | | (1,028,220 | ) |
| | |
FUND SHARE TRANSACTIONS (NOTE 4): | | | | | | | | |
Class A Shares | | | 3,670,885 | | | | 11,158,658 | |
Class D Shares | | | 2,971,575 | | | | 545,907 | |
Class I Shares | | | (367,713 | ) | | | 1,750,212 | |
| | | | | | | | |
| | |
Net Increase in Net Assets | | | 3,165,414 | | | | 29,567,705 | |
| | |
NET ASSETS: | | | | | | | | |
Beginning of Period | | | 232,749,025 | | | | 203,181,320 | |
| | | | | | | | |
| | |
End of Period | | $ | 235,914,439 | | | $ | 232,749,025 | |
| | | | | | | | |
See notes to financial statements.
16 Certified Semi-Annual Report
| | |
| NOTES TO FINANCIAL STATEMENTS | | |
| |
| Thornburg New Mexico Intermediate Municipal Fund | | March 31, 2010 (Unaudited) |
NOTE 1 – ORGANIZATION
Thornburg New Mexico Intermediate Municipal Fund (the “Fund”) is a non-diversified series of Thornburg Investment Trust (the “Trust”). The Trust is organized as a Massachusetts business trust under a Declaration of Trust dated June 3, 1987 and is registered as a diversified, open-end management investment company under the Investment Company Act of 1940, as amended. The Fund is currently one of sixteen separate series of the Trust. Each series is considered to be a separate entity for financial reporting and tax purposes and bears expenses directly attributable to it. The Fund’s primary investment objective is to obtain as high a level of current income exempt from federal and New Mexico state individual income tax as is consistent, in the view of the Fund’s investment advisor, with the preservation of capital. The Fund’s secondary objective is to reduce expected changes in its share price compared to long-term bond portfolios.
The Fund currently offers three classes of shares of beneficial interest: Class A, Class D, and Institutional Class (Class I) shares. Each class of shares of the Fund represents an interest in the same portfolio of investments, except that (i) Class A shares are sold subject to a front-end sales charge collected at the time the shares are purchased and bear a service fee, (ii) Class D shares are sold at net asset value without a sales charge at the time of purchase or redemption, and bear both a service fee and a distribution fee, (iii) Class I shares are sold at net asset value without a sales charge at the time of purchase, and (iv) the respective classes may have different reinvestment privileges and conversion rights. Additionally, the Fund may allocate among its classes certain expenses, to the extent allowable to specific classes, including transfer agent fees, government registration fees, certain printing and postage costs, and administrative and legal expenses. Currently, class specific expenses of the Fund are limited to service and distribution fees, administration fees, and certain registration and transfer agent expenses.
NOTE 2 – SIGNIFICANT ACCOUNTING POLICIES
Significant accounting policies of the Trust are as follows:
Valuation of Investments: Debt obligations have a primary market over the counter and are valued by an independent pricing service approved by the Trustees of the Trust. The pricing service ordinarily values debt obligations at quoted bid prices. When quotations are not available, debt obligations are valued at evaluated prices determined by the pricing service using methods which include consideration of yields or prices of debt obligations of comparable quality, type of issue, coupon, maturity and rating, and indications as to value from dealers and general market conditions. Short-term obligations having remaining maturities of 60 days or less are valued at amortized cost, which approximates market value.
In any case where a pricing service fails to provide a price for a debt obligation held by the Fund, the valuation and pricing committee determines a fair value for the obligation using procedures approved by the Trustees. Additionally, in any case where management believes that a price provided by a pricing service for a debt obligation may be unreliable, the valuation and pricing committee decides whether or not to use the pricing service’s valuation or to determine a fair value for the obligation.
In determining fair value for any portfolio security or other investment, the valuation and pricing committee seeks to determine the amount that an owner of the investment might reasonably expect to receive upon a sale of the investment. However, because fair value prices are estimated prices, the valuation and pricing committee’s determination of fair value for an investment may differ from the value that would be realized by the Fund upon a sale of the investment, and that difference could be material to the Fund’s financial statements. The valuation and pricing committee’s determination of fair value for an investment may also differ from the prices obtained by other persons (including other mutual funds) for the investment.
Valuation Measurements: Various inputs are used in determining the value of the Fund’s investments. These inputs are summarized in the three levels listed below.
Level 1: Quoted prices in active markets for identical investments.
Level 2: Other significant observable inputs (including quoted prices for similar investments, interest rates, prepayment rates, credit risk, etc.).
Level 3: Significant unobservable inputs (including the Fund’s own assumptions in determining the fair value of investments).
Certified Semi-Annual Report 17
| | |
| NOTES TO FINANCIAL STATEMENTS, CONTINUED | | |
| |
| Thornburg New Mexico Intermediate Municipal Fund | | March 31, 2010 (Unaudited) |
The following table displays a summary of the inputs used to value the Fund’s net assets as of March 31, 2010. In any instance when valuation inputs from more than one level are used to determine the fair value of a specific investment, the investment is placed in the level of the table based upon the lowest level input that is significant in determining the fair value of the investment:
| | | | | | | | | | | | |
| | | Fair Value Measurements at March 31, 2010 |
| | | Total | | Level 1 | | Level 2 | | Level 3 |
Assets | | | | | | | | | | | | |
Investments in Securities Municipal Bonds | | $ | 232,791,045 | | $ | — | | $ | 232,791,045 | | $ | — |
| | | | | | | | | | | | |
Total Investments in Securities | | $ | 232,791,045 | | $ | — | | $ | 232,791,045 | | $ | — |
Federal Income Taxes: It is the policy of the Trust to comply with the provisions of the Internal Revenue Code applicable to “regulated investment companies” and to distribute to shareholders substantially all taxable (if any) and tax exempt income of the Fund. Therefore, no provision for federal income tax is required.
When-Issued and Delayed Delivery Transactions: The Fund may engage in when-issued or delayed delivery transactions. To the extent the Fund engages in such transactions, it will do so for the purpose of acquiring portfolio securities consistent with the Fund’s investment objectives and not for the purpose of investment leverage or to speculate on interest rate and/or market changes. At the time the Fund makes a commitment to purchase a security on a when-issued or delayed delivery basis, the Fund will record the transaction and reflect the value in determining its net asset value. When effecting such transactions, assets of an amount sufficient to make payment for the portfolio securities to be purchased will be segregated on the Fund’s records on the trade date. Securities purchased on a when-issued or delayed delivery basis do not earn interest until the settlement date.
Dividends: Net investment income of the Fund is declared daily as a dividend on shares for which the Fund has received payment. Dividends are paid monthly and are reinvested in additional shares of the Fund at net asset value per share at the close of business on the dividend payment date, or at the shareholder’s option, paid in cash. Net realized capital gains, to the extent available, will be distributed at least annually.
General: Securities transactions are accounted for on a trade date basis. Interest income is accrued as earned. Premiums and discounts on securities purchased are amortized to call dates or maturity dates of the respective securities. Realized gains and losses from the sale of securities are recorded on an identified cost basis. Net investment income (other than class specific expenses) and realized and unrealized gains and losses are allocated daily to each class of shares based upon the relative net asset value of outstanding shares (or the value of the dividend-eligible shares, as appropriate) of each class of shares at the beginning of the day (after adjusting for the current capital shares activity of the respective class). Expenses common to all funds are allocated among the funds comprising the Trust based upon their relative net asset values or other appropriate allocation methods.
Guarantees and Indemnifications: Under the Trust’s organizational documents, its officers and Trustees are indemnified against certain liabilities arising out of the performance of their duties to the Fund. Additionally, in the normal course of business the Trust enters into contracts with service providers that contain general indemnification clauses. The Trust’s maximum exposure under these arrangements is unknown. However, based on experience, the Trust expects the risk of loss to be remote.
Use of Estimates: The preparation of financial statements, in conformity with generally accepted accounting principles, requires management to make estimates and assumptions that affect the reported amounts of assets and liabilities and the disclosure of contingent assets and liabilities at the date of the financial statements and the reported amounts of increases and decreases in net assets from operations during the reporting period. Actual results could differ from those estimates.
NOTE 3 – INVESTMENT ADVISORY FEE AND OTHER TRANSACTIONS WITH AFFILIATES
Pursuant to an investment advisory agreement, Thornburg Investment Management, Inc. (the “Advisor”) serves as the investment advisor and performs services to the Fund for which the fees are payable at the end of each month. For the six months ended March 31, 2010, these fees were payable at annual rates ranging from .50 of 1% to .275 of 1% per annum of the average daily net assets of the Fund depending on the Fund’s asset size. The Trust also has entered into administrative services agreements with the Advisor, whereby
18 Certified Semi-Annual Report
| | |
| NOTES TO FINANCIAL STATEMENTS, CONTINUED | | |
| |
| Thornburg New Mexico Intermediate Municipal Fund | | March 31, 2010 (Unaudited) |
the Advisor will perform certain administrative services for the shareholders of each class of the Fund’s shares, and for which fees will be payable at an annual rate of up to .125 of 1% per annum of the average daily net assets attributable to each class of shares.
The Trust has an underwriting agreement with Thornburg Securities Corporation (the “Distributor,” an affiliate of the Advisor), which acts as the distributor of the Fund’s shares. For the six months ended March 31, 2010, the Distributor has advised the Fund that it earned net commissions aggregating $1,808 from the sale of Class A shares.
Pursuant to a service plan under Rule 12b-1 of the Investment Company Act of 1940, the Fund may reimburse to the Advisor an amount not to exceed .25 of 1% per annum of the average daily net assets attributable to each class of shares of the Fund for payments made by the Advisor to securities dealers and other financial institutions to obtain various shareholder and distribution related services. The Advisor may pay out of its own resources additional expenses for distribution of the Fund’s shares.
The Trust has also adopted distribution plans pursuant to Rule 12b-1, applicable only to the Fund’s Class D shares, under which the Fund compensates the Distributor for services in promoting the sale of Class D shares of the Fund at an annual rate of up to .75 of 1% per annum of the average daily net assets attributable to Class D shares. Total fees incurred by the Distributor for each class of shares of the Fund under their respective Service and Distribution Plans for the six months ended March 31, 2010, are set forth in the Statement of Operations. Distribution fees in the amount of $46,126 were waived for Class D shares.
The Trust has an agreement with the custodian bank to indirectly pay a portion of the custodian’s fees through credits earned by the Fund’s cash on deposit with the bank. This deposit agreement is an alternative to overnight investments. Custodial fees have been adjusted to reflect amounts that would have been paid without this agreement, with a corresponding adjustment reflected as fees paid indirectly in the Statement of Operations. For the six months ended March 31, 2010, fees paid indirectly were $781.
Certain officers and Trustees of the Trust are also officers and/or directors of the Advisor and Distributor. The compensation of independent Trustees is borne by the Trust.
NOTE 4 – SHARES OF BENEFICIAL INTEREST
At March 31, 2010, there were an unlimited number of shares of beneficial interest authorized. Transactions in shares of beneficial interest were as follows:
| | | | | | | | | | | | | | |
| | | Six Months Ended
March 31, 2010 (Unaudited) | | | Year Ended
September 30, 2009 (Audited) | |
| | | Shares | | | Amount | | | Shares | | | Amount | |
Class A Shares | | | | | | | | | | | | | | |
Shares sold | | 918,809 | | | $ | 12,396,180 | | | 2,378,616 | | | $ | 31,086,102 | |
Shares issued to shareholders in reinvestment of dividends | | 140,626 | | | | 1,894,075 | | | 282,925 | | | | 3,693,096 | |
Shares repurchased | | (787,558 | ) | | | (10,619,370 | ) | | (1,840,942 | ) | | | (23,620,540 | ) |
| | | | | | | | | | | | | | |
| | | | |
Net Increase (Decrease) | | 271,877 | | | $ | 3,670,885 | | | 820,599 | | | $ | 11,158,658 | |
| | | | | | | | | | | | | | |
| | | | |
Class D Shares | | | | | | | | | | | | | | |
Shares sold | | 379,633 | | | $ | 5,129,281 | | | 391,536 | | | $ | 5,149,917 | |
Shares issued to shareholders in reinvestment of dividends | | 15,997 | | | | 215,551 | | | 33,869 | | | | 442,320 | |
Shares repurchased | | (175,589 | ) | | | (2,373,257 | ) | | (384,329 | ) | | | (5,046,330 | ) |
| | | | | | | | | | | | | | |
| | | | |
Net Increase (Decrease) | | 220,041 | | | $ | 2,971,575 | | | 41,076 | | | $ | 545,907 | |
| | | | | | | | | | | | | | |
Certified Semi-Annual Report 19
| | |
| NOTES TO FINANCIAL STATEMENTS, CONTINUED | | |
| |
| Thornburg New Mexico Intermediate Municipal Fund | | March 31, 2010 (Unaudited) |
| | | | | | | | | | | | | | |
| | | Six Months Ended
March 31, 2010 (Unaudited) | | | Year Ended
September 30, 2009 (Audited) | |
| | | Shares | | | Amount | | | Shares | | | Amount | |
Class I Shares | | | | | | | | | | | | | | |
Shares sold | | 524,893 | | | $ | 7,079,294 | | | 194,089 | | | $ | 2,427,879 | |
Shares issued to shareholders in reinvestment of dividends | | 26,181 | | | | 352,446 | | | 59,290 | | | | 773,319 | |
Shares repurchased | | (577,987 | ) | | | (7,799,453 | ) | | (112,173 | ) | | | (1,450,986 | ) |
| | | | | | | | | | | | | | |
| | | | |
Net Increase (Decrease) | | (26,913 | ) | | $ | (367,713 | ) | | 141,206 | | | $ | 1,750,212 | |
| | | | | | | | | | | | | | |
NOTE 5 – SECURITIES TRANSACTIONS
For the six months ended March 31, 2010, the Fund had purchase and sale transactions of investment securities (excluding short-term investments) of $8,835,530 and $3,010,000, respectively.
NOTE 6 – INCOME TAXES
At March 31, 2010, information on the tax components of capital is as follows:
| | | | |
Cost of investments for tax purposes | | $ | 223,570,513 | |
| | | | |
Gross unrealized appreciation on a tax basis | | $ | 9,868,110 | |
Gross unrealized depreciation on a tax basis | | | (647,578 | ) |
| | | | |
Net unrealized appreciation (depreciation) on investments (tax basis) | | $ | 9,220,532 | |
| | | | |
At March 31, 2010, the Fund had tax basis capital losses, which may be carried forward to offset future capital gains. To the extent such carryforwards are used, capital gains distributions may be reduced to the extent provided by regulations.
Such capital loss carryforwards expire as follows:
| | | |
2011 | | $ | 145,437 |
2013 | | | 255 |
2014 | | | 49,136 |
2015 | | | 112,336 |
| | | |
| | $ | 307,164 |
| | | |
OTHER NOTES
Fund management believes no events have occurred between March 31, 2010 and May 20, 2010, the date of issuance of the financial statements, that require adjustment of, or disclosure in, the accompanying financial statements.
20 Certified Semi-Annual Report
This page intentionally left blank.
Certified Semi-Annual Report 21
FINANCIAL HIGHLIGHTS
Thornburg New Mexico Intermediate Municipal Fund
| | | | | | | | | | | | | | | | | | | | | | | | | | | | | | | | | | | | | | | | | | |
| | | PER SHARE PERFORMANCE (for a share outstanding throughout the period) | | RATIOS TO AVERAGE NET ASSETS | | | SUPPLEMENTAL DATA |
Unless
Otherwise
Noted, Periods
are Fiscal Years
Ended Sept. 30, | | Net Asset
Value
Beginning
of Period | | Net
Investment
Income
(Loss) | | Net
Realized
& Unrealized
Gain (Loss)
on
Investments | | | Total from
Investment
Operations | | | Dividends
from Net
Investment
Income | | | Dividends
from Net
Realized
Gains | | Total
Dividends | | | Net Asset
Value
End of
Period | | Net
Investment
Income
(Loss) (%) | | | Expenses,
After
Expense
Reductions
(%) | | | Expenses,
After
Expense
Reductions
and Net of
Custody
Credits
(%) | | | Expenses,
Before
Expense
Reductions
(%) | | | Total
Return
(%)(a) | | | Portfolio
Turnover
Rate (%) | | Net Assets
at End of
Period
(Thousands) |
Class A Shares | | | | | | | | | | | | | | | | | | | | | | | | | | | | | | | | | | | | | | | | | | |
2010(b)(c) | | $ | 13.63 | | 0.22 | | (0.18 | ) | | 0.04 | | | (0.22 | ) | | — | | (0.22 | ) | | $ | 13.45 | | 3.34 | (d) | | 0.96 | (d) | | 0.96 | (d) | | 0.96 | (d) | | 0.34 | | | 1.34 | | $ | 189,104 |
2009(c) | | $ | 12.64 | | 0.47 | | 0.99 | | | 1.46 | | | (0.47 | ) | | — | | (0.47 | ) | | $ | 13.63 | | 3.62 | | | 0.96 | | | 0.96 | | | 0.96 | | | 11.79 | | | 14.12 | | $ | 187,940 |
2008(c) | | $ | 13.10 | | 0.47 | | (0.46 | ) | | 0.01 | | | (0.47 | ) | | — | | (0.47 | ) | | $ | 12.64 | | 3.56 | | | 0.97 | | | 0.95 | | | 0.97 | | | (0.00 | )(e) | | 13.48 | | $ | 163,928 |
2007(c) | | $ | 13.20 | | 0.47 | | (0.10 | ) | | 0.37 | | | (0.47 | ) | | — | | (0.47 | ) | | $ | 13.10 | | 3.55 | | | 0.98 | | | 0.97 | | | 0.98 | | | 2.82 | | | 17.38 | | $ | 169,130 |
2006(c) | | $ | 13.22 | | 0.45 | | (0.02 | ) | | 0.43 | | | (0.45 | ) | | — | | (0.45 | ) | | $ | 13.20 | | 3.41 | | | 0.99 | | | 0.98 | | | 0.99 | | | 3.31 | | | 11.59 | | $ | 196,163 |
2005(c) | | $ | 13.40 | | 0.43 | | (0.18 | ) | | 0.25 | | | (0.43 | ) | | — | | (0.43 | ) | | $ | 13.22 | | 3.22 | | | 0.99 | | | 0.98 | | | 0.99 | | | 1.88 | | | 16.63 | | $ | 212,335 |
Class D Shares | | | | | | | | | | | | | | | | | | | | | | | | | | | | | | | | | | | | | | | | | | |
2010(b) | | $ | 13.63 | | 0.14 | | (0.11 | ) | | 0.03 | | | (0.21 | ) | | — | | (0.21 | ) | | $ | 13.45 | | 3.08 | (d) | | 1.22 | (d) | | 1.22 | (d) | | 1.73 | (d) | | 0.21 | | | 1.34 | | $ | 20,031 |
2009 | | $ | 12.64 | | 0.44 | | 0.99 | | | 1.43 | | | (0.44 | ) | | — | | (0.44 | ) | | $ | 13.63 | | 3.35 | | | 1.23 | | | 1.23 | | | 1.73 | | | 11.50 | | | 14.12 | | $ | 17,301 |
2008 | | $ | 13.11 | | 0.43 | | (0.47 | ) | | (0.04 | ) | | (0.43 | ) | | — | | (0.43 | ) | | $ | 12.64 | | 3.29 | | | 1.24 | | | 1.22 | | | 1.74 | | | (0.35 | ) | | 13.48 | | $ | 15,525 |
2007 | | $ | 13.21 | | 0.43 | | (0.10 | ) | | 0.33 | | | (0.43 | ) | | — | | (0.43 | ) | | $ | 13.11 | | 3.30 | | | 1.23 | | | 1.23 | | | 1.77 | | | 2.57 | | | 17.38 | | $ | 13,524 |
2006 | | $ | 13.23 | | 0.41 | | (0.02 | ) | | 0.39 | | | (0.41 | ) | | — | | (0.41 | ) | | $ | 13.21 | | 3.15 | | | 1.24 | | | 1.24 | | | 1.82 | | | 3.04 | | | 11.59 | | $ | 14,113 |
2005 | | $ | 13.41 | | 0.39 | | (0.18 | ) | | 0.21 | | | (0.39 | ) | | — | | (0.39 | ) | | $ | 13.23 | | 2.96 | | | 1.25 | | | 1.24 | | | 1.83 | | | 1.62 | | | 16.63 | | $ | 18,577 |
Class I Shares | | | | | | | | | | | | | | | | | | | | | | | | | | | | | | | | | | | | | | | | | | |
2010(b) | | $ | 13.62 | | 0.36 | | (0.29 | ) | | 0.07 | | | (0.25 | ) | | — | | (0.25 | ) | | $ | 13.44 | | 3.68 | (d) | | 0.62 | (d) | | 0.62 | (d) | | 0.62 | (d) | | 0.51 | | | 1.34 | | $ | 26,780 |
2009 | | $ | 12.63 | | 0.52 | | 0.99 | | | 1.51 | | | (0.52 | ) | | — | | (0.52 | ) | | $ | 13.62 | | 3.96 | | | 0.62 | | | 0.62 | | | 0.62 | | | 12.18 | | | 14.12 | | $ | 27,508 |
2008 | | $ | 13.10 | | 0.51 | | (0.47 | ) | | 0.04 | | | (0.51 | ) | | — | | (0.51 | ) | | $ | 12.63 | | 3.90 | | | 0.63 | | | 0.61 | | | 0.63 | | | 0.26 | | | 13.48 | | $ | 23,728 |
2007(f) | | $ | 13.10 | | 0.34 | | — | | | 0.34 | | | (0.34 | ) | | — | | (0.34 | ) | | $ | 13.10 | | 3.95 | (d) | | 0.63 | (d) | | 0.62 | (d) | | 0.63 | (d) | | 2.64 | | | 17.38 | | $ | 19,427 |
| (a) | Not annualized for periods less than one year. |
| (b) | Unaudited Six Month Period Ended March 31. |
| (c) | Sales loads are not reflected in computing total return. |
| (e) | Total return figure was less than 0.01% . |
| (f) | Effective date of this class of shares was February 1, 2007. |
See notes to financial statements.
| | |
| 22 Certified Semi-Annual Report | | Certified Semi-Annual Report 23 |
| | |
| EXPENSE EXAMPLE | | |
| |
| Thornburg New Mexico Intermediate Municipal Fund | | March 31, 2010 (Unaudited) |
As a shareholder of the Fund, you incur two types of costs:
| | (1) | transaction costs, including |
(a) sales charges (loads) on purchase payments, for Class A shares;
(b) a deferred sales charge on redemptions of any part or all of a purchase of $1 million of Class A shares within 12 months of purchase;
| | (2) | ongoing costs, including management fees; distribution and/or service (12b-1) fees; and other Fund expenses. |
This example is intended to help you understand your ongoing costs (in dollars) of investing in the Fund and to compare these costs with the ongoing costs of investing in other mutual funds.
The example is based on a $1,000 investment beginning on October 1, 2009, and held until March 31, 2010.
ACTUAL EXPENSES
For each class of shares, the first line of the table at right provides information about actual account values and actual expenses. You may use the information in this line, together with the amount you invested, to estimate the expenses that you paid over the period. Simply divide your account value by $1,000 (for example, an $8,600 account value divided by $1,000 = 8.6), then multiply the result by the number in the first line for your class of shares under the heading entitled “Expenses Paid During Period” to estimate the expenses you paid on your account during this period.
HYPOTHETICAL EXAMPLE FOR COMPARISON PURPOSES
For each class of shares, the second line of the table at right provides information about hypothetical account values and hypothetical expenses based on the Fund’s actual expense ratio and an assumed rate of return of 5% per year before expenses, which is not the Fund’s actual return. The hypothetical account values and expenses may not be used to estimate the actual ending account balance or expenses you paid for the period. You may use this information to compare the ongoing costs of investing in the Fund and other funds. To do so, compare this 5% hypothetical example with the 5% hypothetical examples that appear in the shareholder reports of the other funds.
| | | | | | | | | |
| | | Beginning
Account Value
10/1/09 | | Ending
Account Value
3/31/10 | | Expenses Paid
During Period†
10/1/09–3/31/10 |
Class A Shares | | | | | | | | | |
Actual | | $ | 1,000.00 | | $ | 1,003.40 | | $ | 4.79 |
Hypothetical* | | $ | 1,000.00 | | $ | 1,020.15 | | $ | 4.83 |
Class D Shares | | | | | | | | | |
Actual | | $ | 1,000.00 | | $ | 1,002.10 | | $ | 6.10 |
Hypothetical* | | $ | 1,000.00 | | $ | 1,018.84 | | $ | 6.15 |
Class I Shares | | | | | | | | | |
Actual | | $ | 1,000.00 | | $ | 1,005.10 | | $ | 3.08 |
Hypothetical* | | $ | 1,000.00 | | $ | 1,021.86 | | $ | 3.11 |
| † | Expenses are equal to the annualized expense ratio for each class (A: 0.96%; D: 1.22%; I: 0.62%) multiplied by the average account value over the period, multiplied by 182/365 to reflect the one-half year period. |
| * | Hypothetical assumes a rate of return of 5% per year before expenses. |
Please note that the expenses shown in the table are meant to highlight your ongoing costs only and do not reflect any transactional costs, such as sales charges (loads), redemption fees, or exchange fees. Therefore, the second line of the table for each class of shares is useful in comparing ongoing costs only, and will not help you determine the relative total costs of owning different funds. In addition, if these transactional costs were included, your costs would have been higher.
24 Certified Semi-Annual Report
| | |
| OTHER INFORMATION | | |
| |
| Thornburg New Mexico Intermediate Municipal Fund | | March 31, 2010 (Unaudited) |
PORTFOLIO PROXY VOTING
Policies and Procedures:
The Trust has delegated to Thornburg Investment Management, Inc. (the “Advisor”) voting decisions respecting proxies for the Fund’s voting securities. The Advisor makes voting decisions in accordance with its Proxy Voting Policy and Procedures. A description of the Policy and Procedures is available (i) without charge, upon request, by calling the Advisor toll-free at 1-800-847-0200, (ii) on the Thornburg website at www.thornburg.com, and (iii) on the Securities and Exchange Commission’s website at www.sec.gov.
Information regarding how proxies were voted is available on or before August 31 of each year for the twelve months ending the preceding June 30. This information is available (i) without charge, upon request by calling the Advisor toll-free at 1-800-847-0200, (ii) on the Thornburg website at www.thornburg.com, and (iii) on the Securities and Exchange Commission’s website at www.sec.gov.
AVAILABILITY OF QUARTERLY PORTFOLIO SCHEDULE
The Fund files with the Securities and Exchange Commission schedules of its portfolio holdings on Form N-Q for the first and third quarters of each fiscal year. The Fund’s Forms N-Q are available on the Commission’s website at www.sec.gov, or may be reviewed and copied at the Commission’s Public Reference Room in Washington, D.C. Information on the operation of the Public Reference Room may be obtained by calling 1-800-SEC-0330. The Fund also makes this information available on its website at www.thornburg.com/ download or upon request by calling 1-800-847-0200.
Certified Semi-Annual Report 25
Trustees’ Statement to Shareholders
Not part of the Certified Semi-Annual Report
February 8, 2005, as readopted July 22, 2009
The Trustees are concerned that ongoing commentaries and opinions reported in the media may confuse investors in general as to the supervisory duties of trustees of mutual funds and, in particular, leave Thornburg Investment Trust shareholders uncertain regarding how we discharge our responsibilities in supervising the Funds’ investment advisor and in reviewing the advisor’s contract for renewal. We decided to spell out clearly three principal guidelines that we follow in supervising the Trust’s investment advisor on your behalf.
We begin with the premise that each shareholder selected his or her Fund because its investments are managed by the investment advisor identified in the prospectus and in accordance with the objective and policies described in the prospectus. We realize, as each of you do, that if you believe that your Fund’s stated objective and policies no longer serve your personal investment goals, you can sell your shares and leave the Fund.
Therefore, we believe that our primary supervisory task – our principal obligation to you – is to assess the nature and quality of the advisor’s services, and to confirm that the advisor actively and competently pursues the Fund’s objective, in accordance with the policies set out in the prospectus. To do this, we meet regularly with management to review your Fund’s portfolio and to discuss the advisor’s specific actions and judgments in pursuing the Fund’s objective. We do not substitute our own judgment for the advisor’s decisions in selecting investments; the advisor is paid to exercise its informed judgment on investment decisions, and we seek to confirm, in reviewing the advisor’s performance, that the advisor is doing just that.
Second, while we are conscious of costs and the effect that costs have on shareholders’ returns, we do not seek the lowest fees or expense ratio as our sole or primary objective. We try to make sure that your Fund’s fees and costs are reasonable in relationship to the services rendered and that they are generally in line with those charged by other expert investment advisors, consistent with our belief that the Fund’s investors searched for and expect that expertise and attention and have decided to pay a reasonable price for it. We do not put the management contract “out to bid” as a matter of course, and we would not do so unless we had concluded that the advisor materially had failed to pursue the Fund’s objectives in accordance with its policies, or for other equally important reasons. We believe that any other approach would be inconsistent with your interests and contrary to your expectations when you bought shares of the Fund in the first place.
Finally, because we believe that most Thornburg Fund shareholders have invested with a long-term perspective, we try not to focus too much on the fashions of the moment and on short-term performance. The market will not favor any specific investment objective or set of policies at all times and under all economic circumstances. A fund will experience periods of both high and low returns relative to other funds and other investments. Even if one of our Funds is not favored by the market at a particular time, we believe that the advisor is nonetheless obliged to remain true to the Fund’s objective and policies, and we watch to see that it does so.
This page is not part of the Semi-Annual Report 26
This page intentionally left blank.
This page is not part of the Semi-Annual Report. 27
This page intentionally left blank.
28 This page is not part of the Semi-Annual Report.
Retirement and Education Accounts
Thornburg Investment Management offers retirement and education savings accounts that can help you meet a variety of planning challenges. For account applications or further information on any of the accounts below, please call 1-800-847-0200 or go to www.thornburg.com/ira. Your financial advisor can help you determine which plan is right for you.
Individual Retirement Accounts
Individual Retirement Accounts (IRAs) provide a tax-advantaged means to save money for the future. For a detailed outline of the difference between retirement accounts, see www.thornburg.com/ira. Rollovers are available. Call 1-800-847-0200 for more information.
Traditional IRAs – Contributions to Traditional IRAs are tax deductible for eligible individuals, and withdrawals are taxed as additional ordinary income. You may contribute to an IRA if you receive compensation and are under 70 1/ 2, even if you are covered by an employer retirement plan. Deductible contributions are subject to certain qualifications. Please consult your tax advisor.
Roth IRAs – Under a Roth IRA, there is no tax deduction for contributions, but there is no income tax on qualified withdrawals. For a more detailed comparison of Traditional and Roth IRAs, please see our web site at www.thornburg.com/ira.
SEP IRAs – Simplified Employee Pension (SEP) IRAs are established by employers. The employer is allowed a tax deduction for contributions made to the SEP Plan and makes contributions to each eligible employee’s SEP IRA on a discretionary basis.
SIMPLE IRAs – Savings Incentive Match Plan for Employees of Small Employers (SIMPLE) is designed to give small business owners a simplified method to establish and contribute to a retirement plan for employees. The employer is allowed a tax deduction for contributions and makes either matching or non-elective contributions to each eligible employee’s SIMPLE IRA. Employees may make salary deferral contributions.
Coverdell Education Savings Account
These savings accounts are designed to provide a way to save money for higher education expenses. In an Education Savings Account, earnings and interest grow tax-free, and qualified withdrawals used to pay for eligible higher-education expenses are tax- and penalty-free.
Funds Available
The following funds are available in the accounts listed above:
| | • | | Thornburg International Value Fund |
| | • | | Thornburg Core Growth Fund |
| | • | | Thornburg Investment Income Builder Fund |
| | • | | Thornburg Global Opportunities Fund |
| | • | | Thornburg International Growth Fund |
| | • | | Thornburg Developing World Fund |
| | • | | Thornburg Limited Term U.S. Government Fund |
| | • | | Thornburg Limited Term Income Fund |
| | • | | Thornburg Strategic Income Fund |
This page is not part of the Semi-Annual Report. 29

30 This page is not part of the Semi-Annual Report.
Thornburg Equity Funds
Thornburg’s equity research uses a fundamental and comprehensive analytical approach. Thornburg equity funds focus on a limited number of securities so that each holding can impact performance. The equity team searches for firms believed to have a promising future and seeks to buy shares of those companies at a discount to their intrinsic value.
| | • | | Thornburg International Value Fund |
| | • | | Thornburg Core Growth Fund |
| | • | | Thornburg Investment Income Builder Fund |
| | • | | Thornburg Global Opportunities Fund |
| | • | | Thornburg International Growth Fund |
| | • | | Thornburg Developing World Fund |
Thornburg Bond Funds
Thornburg Investment Management applies a disciplined philosophy to fixed-income management. Since the launch of our first fixed-income fund over 25 years ago, we have been conducting fundamental, bottom-up research in an effort to identify bonds which we believe provide the best return for a given level of risk. We are very organic in our approach, avoiding leverage or complex strategies which could backfire in periods of market uncertainty.
| | • | | Thornburg Limited Term Municipal Fund |
| | • | | Thornburg Intermediate Municipal Fund |
| | • | | Thornburg California Limited Term Municipal Fund |
| | • | | Thornburg New Mexico Intermediate Municipal Fund |
| | • | | Thornburg New York Intermediate Municipal Fund |
| | • | | Thornburg Strategic Municipal Income Fund |
| | • | | Thornburg Limited Term U.S. Government Fund |
| | • | | Thornburg Limited Term Income Fund |
| | • | | Thornburg Strategic Income Fund |
Before investing, carefully consider the Fund’s investment goals, risks, charges, and expenses. For a prospectus containing this and other information, contact your financial advisor or visit thornburg.com. Read it carefully before investing.
For additional information, please visit www.thornburg.com
Thornburg Investment Management, Inc. 2300 North Ridgetop Road, Santa Fe, NM 87506
This page is not part of the Semi-Annual Report. 31
| | | | | | |
 | | Waste not, | |  |
| | Wait not | |
| | | | Get instant access to your shareholder reports. |
| | |
| | This Semi-Annual Report is submitted for the general information of shareholders of the Fund. It is not authorized for distribution to prospective investors in the Fund unless preceded or accompanied by an effective prospectus. | | By switching from your postal mailbox to your email inbox, you reduce paper clutter, improve record keeping access, and help conserve our natural resources. |

| | Investment Advisor: | | Go to www.thornburg.com/edelivery and sign up to receive your shareholder reports, prospectuses, and proxy statements electronically. |
| | Thornburg Investment Management® 800.847.0200 | |
| | Distributor: | | |
| | Thornburg Securities Corporation® 800.847.0200 | | You invest in the future, without spending a dime. |
| | TH178 | | |

Important Information
The information presented on the following pages is current as of March 31, 2010. The managers’ views, portfolio holdings, and sector diversification are provided for the general information of the Fund’s shareholders; they are historical and subject to change. This material should not be deemed a recommendation to buy or sell any of the securities mentioned.
Investments in the Fund carry risks, including possible loss of principal. Bond funds have the same interest rate, inflation, and credit risks that are associated with the underlying bonds. The principal value of bonds will fluctuate relative to changes in interest rates, decreasing when interest rates rise. Unlike bonds, bond funds have ongoing fees and expenses. Please see the Fund’s Prospectus for a discussion of the risks associated with an investment in the Fund. Investments in the Fund are not FDIC insured, nor are they deposits of or guaranteed by a bank or any other entity. There is no guarantee that the Fund will meet its investment objectives. The laddering strategy does not assure or guarantee better performance and cannot eliminate the risk of investment losses.
Performance data given at net asset value (NAV) does not take into account applicable sales charges. If the sales charges had been included, the performance would have been lower.
Minimum investments for Class I shares are higher than those for other classes. Class I shares may not be available to all investors.
| | | | |
Share Class | | NASDAQ Symbol | | Cusip |
Class A | | THNYX | | 885-215-665 |
Class I | | TNYIX | | 885-216-705 |
Lipper’s 2008
Best Fixed-Income Fund Family
Thornburg Investment Management ranked #1 out of 41 eligible firms in Lipper, Inc.’s fixed income large firm universe for the three-year period ended 12/31/07, based on risk-adjusted returns. Past performance does not guarantee future results.
Lipper’s large firm universe is comprised of fund families with more than $28 billion in total net assets. Only fund families with at least five bond funds were eligible. Risk-adjusted returns were calculated with dividends reinvested and without sales charges. We did not win this award in 2009 or 2010.
Glossary
Bank of America (BofA) Merrill Lynch 7-12 Year Municipal Bond Index – The BofA Merrill Lynch 7-12 Year Municipal Bond Index represents a broad measure of market performance. It is a model portfolio of municipal obligations throughout the U.S., with an average maturity which ranges from seven to twelve years.
Unless otherwise noted, index returns reflect the reinvestment of income dividends and capital gains, if any, but do not reflect fees, brokerage commissions or other expenses of investing. Investors may not make direct investments into any index.
Alternative Minimum Tax (AMT) – A federal tax aimed at ensuring that high-income individuals, estates, trusts, and corporations pay a minimal level income tax. For individuals, the AMT is calculated by adding tax preference items to regular taxable income.
Annualized Distribution Yield – The distribution yield is calculated by taking the sum of the month’s total distribution factors and dividing this sum by a 30-day period and annualizing to a 360-day year. The value is then divided by the ending maximum offering price per share to arrive at the annualized distribution yield. The yield is calculated on a periodic basis and is subject to change.
Bond Credit Ratings – A bond credit rating assesses the financial ability of a debt issuer to make timely payments of principal and interest. Ratings of AAA (the highest), AA, A, and BBB are investment-grade quality. Ratings of BB, B, CCC, CC, C, and D (the lowest) are considered below investment grade, speculative grade, or junk bonds. Unless otherwise noted, the ratings listed are from Municipal Market Data and are a combination of ratings from Standard and Poor’s, Moody’s Investors Service, and Fitch Ratings.
Duration – The weighted maturity of a bond’s cash flows. Duration measures the price sensitivity of a bond for a given change in interest rates. Bonds with longer durations experience greater price volatility than bonds with shorter durations.
Fed Funds Rate – The Fed Funds Rate is the interest rate at which a depository institution lends immediately available funds (balances at the Federal Reserve) to another depository institution overnight.
General Obligation (GO) Bonds – A municipal bond secured by the pledge of the issuer’s full faith, credit, and taxing power rather than the revenue from a given project.
Revenue Bond – A bond on which the debt service is payable solely from the revenue generated from the operation of the project being financed or a category of facilities, or from other non-tax sources.
SEC Yield – SEC Yield is computed in accordance with SEC standards measuring the net investment income per share over a specified 30-day period expressed as a percentage of the maximum offering price of the Fund’s shares at the end of the period.
This page is not part of the Semi-Annual Report. 3
Thornburg New York Intermediate Municipal Fund
At Thornburg, our approach to management of the Fund is based on the premise that investors in the Fund seek preservation of capital along with an attractive, relatively stable yield. While aggressive bond strategies may generate stronger returns when the market is turning a blind eye towards risk, they usually fail to stack up over longer periods of time. Our patience and diligence were recognized by Lipper in 2008 with the Best Fixed-Income Fund Family Award.
We apply time-tested techniques to manage risk and provide attractive returns. These include:
| | • | | Building a laddered portfolio. Laddering has been shown over time to mitigate price and interest rate risk. |
| | • | | Investing on a cash-only basis without using leverage. While leveraged strategies may enhance returns when market conditions are favorable, they can quickly compound losses when sentiment shifts. |
| | • | | Conducting in-depth fundamental research on each issue and actively monitoring positions for subsequent credit events. |
| | • | | Diversifying among a large number of generally high-quality bonds. |

Josh Gonze, George Strickland, and Chris Ihlefeld
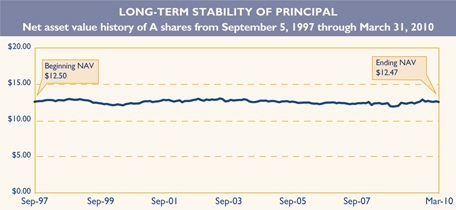
IMPORTANT
PERFORMANCE INFORMATION
Performance data shown represents past performance and is no guarantee of future results. Investment return and principal value will fluctuate so shares, when redeemed, may be worth more or less than their original cost. Current performance may be lower or higher than quoted. For performance current to the most recent month end, visit thornburg.com.
The maximum sales charge for the Fund’s Class A shares is 2.00%. The total annual operating expenses of Class A shares are 1.07%. Thornburg Investment Management and Thornburg Securities Corporation have contractually agreed to waive fees and reimburse expenses through at least February 1, 2011, so that actual expenses do not exceed 0.99%.
| | | | | | | | | | | | | | | |
| AVERAGE ANNUAL TOTAL RETURNS | |
| For periods ended March 31, 2010 | |
| | | | | |
| | | 1 Yr | | | 3 Yrs | | | 5 Yrs | | | 10 Yrs | | | Since
Inception | |
A Shares (Incep: 9/5/97) | | | | | | | | | | | | | | | |
Without sales charge | | 5.76 | % | | 4.13 | % | | 3.77 | % | | 4.24 | % | | 4.20 | % |
With sales charge | | 3.64 | % | | 3.43 | % | | 3.36 | % | | 4.02 | % | | 4.03 | % |
| | |
| 30-DAY YIELDS, A SHARES |
| As of March 31, 2010 |
Annualized Distribution Yield | | SEC Yield |
| 3.28% | | 2.52% |
Without fee waivers and expense reimbursements, the 30-day SEC yield would have been 2.46% and the Annualized Distribution Yield would have been 3.14%.
| | |
| KEY PORTFOLIO ATTRIBUTES |
| As of March 31, 2010 |
| |
Number of Bonds | | 47 |
Duration | | 4.2 Yrs |
Average Maturity | | 8.6 Yrs |
See the entire portfolio in the Schedule of Investments beginning on page 10.
4 This page is not part of the Semi-Annual Report.
THORNBURG NEW YORK INTERMEDIATE MUNICIPAL FUND VERSUS
LIPPER NEW YORK TAX-EXEMPT MONEY MARKET FUNDS AVERAGE
Class A shares as of March 31, 2010
We are often asked to compare Thornburg New York Intermediate Municipal Fund to money market fund returns. Municipal bond funds are not an exact substitute for money market funds. These investments have certain differences, which are summarized below. Investors in the Thornburg New York Intermediate Municipal Fund took more risk than tax-exempt money market fund investors to earn their higher returns.
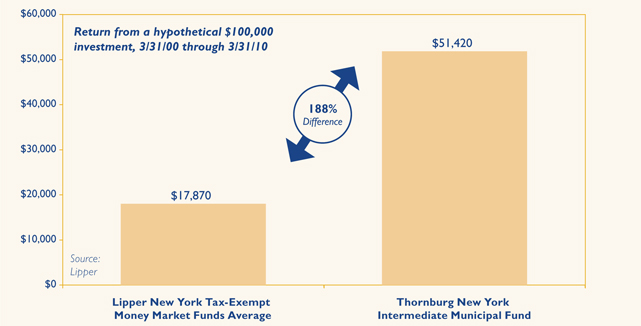
Past performance does not guarantee future results. Performance data above does not include the 2.00% sales charge for Class A shares. If the sales charge had been included, returns would have been lower. Returns shown are minus the initial investment.
Investors in municipal bond funds may experience more volatility than those in comparable money market funds. There are also differences in fees and expenses.
Investors in the Thornburg New York Intermediate Municipal Fund took more risk than money market investors to earn their higher returns, including interest rate and credit risk. Unlike money market funds, the prices of bonds fluctuate relative to changes in interest rates, with principal values decreasing when interest rates rise and increasing when interest rates fall. Generally, money market funds seek to maintain an investment portfolio with an average maturity of 90 days or less. Thornburg New York Intermediate Municipal Fund has an average maturity of normally between three and ten years. Interest dividends paid by the Fund or by New York tax-exempt money market funds are generally exempt from federal income tax and for residents of New York State and New York City, state, and local income tax (may be subject to AMT).
Money market funds seek to preserve the value per share at $1.00, whereas the Thornburg New York Intermediate Municipal Fund’s net asset value changes daily. It is possible to lose money when investing in either the Thornburg New York Intermediate Municipal Fund or a tax-exempt money market fund. Neither are insured by the FDIC or any other government agency.
Lipper New York Tax-Exempt Money Market Funds Average is an arithmetic average of the total return of all tax-exempt money market mutual funds. You cannot invest in a category average.
This page is not part of the Semi-Annual Report. 5

Thornburg New York Intermediate Municipal Fund
March 31, 2010
This report is certified under the Sarbanes-Oxley Act of 2002, which requires that public companies, including mutual funds, affirm that the information provided in their annual and semiannual shareholder reports fully and fairly represents their financial position.
6 Certified Semi-Annual Report
Letter to Shareholders
| | |

George Strickland Co-Portfolio Manager | | April 15, 2010 Dear Shareholder: We are pleased to present the semi-annual report for the Thornburg New York Intermediate Municipal Fund. The net asset value of the Class A shares declined by 32 cents to $12.47 during the six months ended March 31, 2010. If you were with us for the entire period, you received dividends of 22.3 cents per share. If you reinvested your dividends, you received 22.5 cents per share. Dividends per share on an annual basis were higher for Class I shares to account for varying class-specific expenses. |
| |

Josh Gonze Co-Portfolio Manager | | After a couple of years of unprecedented volatility, the municipal bond market has regained its status as one of the least exciting U.S. capital markets. While we embrace the new reality – slow and steady is what we strive for – we do not entirely trust it. Like other U.S. markets, the municipal market is benefiting from U.S. Treasury and Federal Reserve Bank support. By setting the Fed Funds Rate effectively at 0%, the Federal Open Market Committee (FOMC) is basically pushing hundreds of billions of dollars into bonds and bond funds. Flows into bond funds were $357 billion last year and may reach that level again this year. While we do not expect the Federal Reserve (the Fed) to hike the Fed Funds Rate soon, it is a reasonable bet that the next move will not be down. A significantly higher Fed Funds Rate, if and when it materializes, would likely not be good for bond fund flows or bond prices. |
| |

Christopher Ihlefeld Co-Portfolio Manager | | The second major element of federal support has been the implementation of the Build America Bond (BAB) program. This program allows municipalities to issue taxable bonds for qualified projects and receive a subsidy of 35% of their interest cost from the federal government. The program has been very popular, with almost $100 billion issued since the first deal was sold in April 2009. BAB issues currently account for over 30% of new issue municipal bond supply, crowding out much of the supply of traditional tax-exempt bonds. The reduced supply, coupled with heavy demand for bonds has provided significant support to municipal bond prices. The BAB program is scheduled to expire at the end of this year, but will probably be extended, most likely with a reduced subsidy. Depending upon the final form of the program, we may see the balance shift back to more traditional tax-exempt issuance in 2011, which could erode some support for bond prices. Another part of the American Recovery and Reinvestment Act allocated approximately $280 billion to the states for various stimulus-related projects. The federal dollars helped the states close over $300 billion of budget gaps during the current recession, but most of that money will be spent by June 30, 2011. If tax revenues come back strongly over the next 12-24 months, the disappearing stimulus money may not be missed. However, if tax revenues are slow to bounce back, budget balancing will remain a perilous task. Working in the opposite direction, higher tax rates should bolster demand for tax-exempt municipals, pals, as Bush tax cuts expire and the highest marginal tax rates climb back up to 39.6% from 35%. |
Certified Semi-Annual Report 7
Letter to Shareholders,
Continued
On top of this, the recently signed health insurance reform law applies Medicare taxes to virtually all investment income except interest from tax-exempt municipal bonds. We believe that the status of municipal bonds as perhaps the last true legal tax shelter available to investors is not fully priced into the market.
The U.S. economy apparently hit bottom last summer and has been growing the last three quarters. However, payroll employment growth just showed up last month, and so many jobs were lost in the last two years that it will take several years of robust growth just to get back down to 6% unemployment. Most banks are still very reluctant to increase lending, and core consumer price inflation has slowed to a level not seen since 1960. So, despite the large amount of additional debt (particularly from the U.S. Treasury) coming into the marketplace, we don’t expect a dramatic rise in interest rates this year.
After three quarters of positive GDP growth, state tax revenues are still falling. The fourth quarter of 2009 marks the fifth consecutive quarter of declining state tax revenues. The rate of decline has decreased to 4.2% from a peak of 16.5% in the second quarter, but state tax revenues are still down over 8% from levels two years ago. Prior to the current downturn, state tax revenues grew 5 to 5.5% on average for two decades, allowing budgets and entitlements to expand at an unsustainable pace. Most states are going through a difficult adjustment process and are dealing with shrinking tax revenues in very different ways.
New York’s economy has held up significantly better than the national economy in the current downturn. The March 2010 unemployment rate is 8.6%, up from 7.8% a year ago, but over two percent below the national average. However, tax receipts have been hampered by the state’s heavy reliance on the financial services industry and income taxes. New York used a combination of spending cuts, tax increases, reserve fund draws, and stimulus funds to plug a $17.9 billion gap in its 2010 fiscal year budget, but faces an additional $9.5 billion gap in the 2011 budget. Wall Street profits have bounced back strongly and tax revenues have recently started growing again, but the state will continue to face challenges as federal stimulus funds run out and the temporary income tax increase expires in 2012. We will have to keep watching to see how the state deals with these new hurdles.
Tax revenues have held up much better at the local level, not yet going negative and growing 4.6% in the fourth quarter of 2009. Most local governments rely heavily on property taxes, which have traditionally been quite stable, and have proven to be so even in the worst real estate downturn in decades. Real estate taxes take a while to adjust and there are some areas of the country that are starting to see significantly lower tax revenues as properties make their way through the appeal process. We are watching these trends as they develop. Revenue bonds such as municipal utility bonds, hospital bonds, and toll roads have generally held up quite well in the current recession, and we continue to find issuers we like in these sectors. Hospitals, in particular, appear to be one of the few clear winners coming out of the recent health care reform law.
Despite much improved market liquidity, strong demand for bonds, and general economic optimism, it is a clearly a time for careful diligence and diversification of investment portfolios. Your Fund is broadly diversified and 77% invested in bonds rated A or above by at least one of the major rating agencies. Your Thornburg New York Intermediate Municipal Fund is a laddered portfolio of over 45 municipal obligations from all over the state. We ladder the maturity dates of the bonds in your portfolio so that some of the bonds are scheduled to mature during each of the coming years. Laddering intermediate bonds accomplishes two goals. First, the staggered bond maturities contained in a ladder defuse interest-rate risk and dampen the Fund’s price volatility. Second, laddering gives the Fund a steady cash flow stream from maturing bonds to reinvest
8 Certified Semi-Annual Report
toward the top of the ladder where yields are typically higher. The chart on the right describes the percentages of your Fund’s bond portfolio maturing in each of the coming years.

As of 3/31/10. Percentages vary over time.
Data may not add up to 100% due to rounding.
The Class A shares of your Fund produced a total return of negative 0.75% (at NAV) over the six-month period ended March 31, 2010, compared to a negative 0.13% return for the BofA Merrill Lynch 7-12 Year Municipal Bond Index. Over the last six months, 5-10 year bonds outperformed longer-term bonds. The Fund’s overweighting of 10-20 year bonds relative to the index contributed to its underperformance, as did a substantial price adjustment on some bonds issued for the American Folk Art Museum.
Historically, our practice of laddering a diversified portfolio of short and intermediate maturity municipal bonds has allowed your Fund to perform consistently well in varying interest rate environments. Thank you for investing in Thornburg New York Intermediate Municipal Fund.
Sincerely,
| | | | |
 | |  | |  |
| George Strickland | | Josh Gonze | | Christopher Ihlefeld |
| Co-Portfolio Manager | | Co-Portfolio Manager | | Co-Portfolio Manager |
| Managing Director | | Managing Director | | Managing Director |
The matters discussed in this report may constitute forward-looking statements made pursuant to the safe harbor provisions of the Securities Litigation Reform Act of 1995. These include any advisor or portfolio manager prediction, assessment, analysis or outlook for individual securities, industries, investment styles, market sectors and/or markets. These statements involve risks and uncertainties. In addition to the general risks described for each fund in its current prospectus, other factors bearing on these reports include the accuracy of the advisor’s or portfolio manager’s forecasts and predictions, the appropriateness of the investment strategies designed by the advisor or portfolio manager and the ability of the advisor or portfolio manager to implement their strategies efficiently and successfully. Any one or more of these factors, as well as other risks affecting the securities markets generally, could cause the actual results of any fund to differ materially as compared to its benchmarks.
Certified Semi-Annual Report 9
| | |
| SCHEDULE OF INVESTMENTS | | |
| |
| Thornburg New York Intermediate Municipal Fund | | March 31, 2010 (Unaudited) |
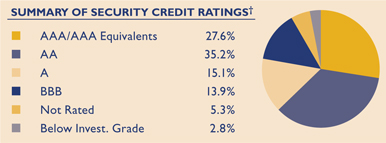
We have used ratings from Standard & Poor’s (S&P). Where S&P ratings are not available, we have used Moody’s Investors Service. Where neither rating is available, we have used ratings from Fitch Ratings. The category of investments identified as “AAA” in this graph includes investments which are pre-refunded or escrowed to maturity. Such investments are backed by an escrow or trust containing sufficient U.S. Government or U.S. Government agency securities to satisfy the timely payment of principal and interest and, therefore, are normally deemed to be equivalent to AAA-rated securities.
| | | | | | | | |
Issuer-Description | | Credit Rating†
S&P/ Moody’s | | Principal
Amount | | Value |
Amherst IDA Civic Facility, 5.75% due 4/1/2015 (Insured: ACA) | | NR/NR | | $ | 465,000 | | $ | 462,414 |
Brookhaven IDA Civic Facility Revenue, 4.25% due 11/1/2037 put 11/1/2011 (LOC: North Fork Bank) | | A-/NR | | | 1,085,000 | | | 1,085,271 |
Clarence Central School District, 5.00% due 5/15/2016 (Insured: AGM; State Aid Withholding) | | NR/Aa3 | | | 2,000,000 | | | 2,147,220 |
Dutchess County IDA, 5.00% due 8/1/2021 (Bard College) | | NR/Baa1 | | | 1,100,000 | | | 1,113,398 |
Erie County IDA School Facilities Revenue, 5.25% due 5/1/2025 (Buffalo City School District) | | AA-/A1 | | | 1,000,000 | | | 1,082,500 |
Guam Government, 5.375% due 12/1/2024 | | BBB-/NR | | | 1,000,000 | | | 1,004,790 |
Hempstead IDA, 5.00% due 12/1/2010 put 6/1/2010 (American Ref-Fuel) | | BB+/Baa2 | | | 1,200,000 | | | 1,201,920 |
Monroe County IDA, 5.375% due 6/1/2017 (St. John Fisher College; Insured: Radian) | | NR/NR | | | 495,000 | | | 499,163 |
Nassau County IDA, 4.75% due 3/1/2026 (NY Institute of Technology) | | BBB+/Baa2 | | | 1,000,000 | | | 972,740 |
New York City GO, 0.32% due 8/1/2023 put 4/1/2010 (LOC: Allied Irish Bank PLC) (daily demand notes) | | A-1/VMIG1 | | | 250,000 | | | 250,000 |
New York City GO, 5.00% due 8/1/2025 | | AA/Aa3 | | | 400,000 | | | 422,320 |
New York City GO, 0.29% due 11/1/2026 put 4/1/2010 (Insured: AGM) (daily demand notes) | | A-1/VMIG1 | | | 700,000 | | | 700,000 |
New York City Metropolitan Transportation Authority, 6.25% due 11/15/2023 | | A/A3 | | | 1,000,000 | | | 1,162,350 |
New York City Municipal Water Finance Authority, 5.75% due 6/15/2013 (ETM) | | AAA/A2 | | | 1,000,000 | | | 1,068,310 |
New York City Transitional Finance Authority, 5.25% due 8/1/2016 (Insured: AMBAC) | | AAA/Aa1 | | | 1,000,000 | | | 1,089,340 |
New York City Transitional Finance Authority, 5.00% due 1/15/2020 (State Aid Withholding) | | AA-/A1 | | | 1,000,000 | | | 1,081,830 |
New York City Transitional Finance Authority, 5.00% due 11/1/2020 | | AAA/Aa1 | | | 1,000,000 | | | 1,089,170 |
New York City Trust Cultural Resources, 5.75% due 7/1/2014 (Museum of American Folk Art; Insured: ACA) | | NR/NR | | | 920,000 | | | 561,614 |
New York Convention Center Development Corp. Hotel Unit Fee, 5.00% due 11/15/2017 (Insured: AMBAC) | | NR/A2 | | | 1,000,000 | | | 1,064,930 |
New York Dormitory Authority, 5.25% due 7/1/2010 (D’Youville College; Insured: Radian) | | NR/NR | | | 350,000 | | | 352,940 |
New York Dormitory Authority, 5.25% due 7/1/2011 (D’Youville College; Insured: Radian) | | NR/NR | | | 370,000 | | | 384,012 |
New York Dormitory Authority, 5.25% due 8/15/2013 (Master Boces; Insured: AGM) | | AAA/Aa3 | | | 1,000,000 | | | 1,056,790 |
New York Dormitory Authority, 5.00% due 2/15/2015 (Mental Health Services; Insured: AMBAC) | | AA-/NR | | | 1,000,000 | | | 1,115,200 |
New York Dormitory Authority, 5.25% due 8/15/2015 (New York Presbyterian Hospital; Insured: AGM/FHA) | | AAA/Aa3 | | | 600,000 | | | 652,680 |
New York Dormitory Authority, 5.00% due 7/1/2016 (Bishop Henry B. Hucles Nursing Home; Insured: SONYMA) | | NR/Aa1 | | | 600,000 | | | 664,296 |
New York Dormitory Authority, 5.00% due 10/1/2018 (School District Revenue; Insured: AGM) | | AAA/Aa3 | | | 1,000,000 | | | 1,098,510 |
New York Dormitory Authority, 5.50% due 2/15/2019 pre-refunded 8/15/2011 (Mental Health Services; Insured: Natl-Re) | | AA-/NR | | | 585,000 | | | 624,160 |
New York Dormitory Authority, 5.50% due 7/1/2019 (Brooklyn Law School; Insured: Radian) | | BBB+/Baa1 | | | 1,400,000 | | | 1,436,680 |
New York Dormitory Authority, 6.10% due 7/1/2019 (Ryan Clinton Community Health Center; Insured: SONYMA) | | NR/Aa1 | | | 1,000,000 | | | 1,013,790 |
New York Dormitory Authority, 5.00% due 1/15/2023 (Municipal Health Facilities) | | AA-/A1 | | | 1,000,000 | | | 1,056,020 |
New York Dormitory Authority, 5.00% due 7/1/2024 (Bishop Henry B. Hucles Nursing Home; Insured: SONYMA) | | NR/Aa1 | | | 1,000,000 | | | 1,040,170 |
New York Dormitory Authority, 5.25% due 7/1/2027 (Health Quest Systems; Insured: AGM) | | AAA/Aa3 | | | 500,000 | | | 528,010 |
New York Dormitory Authority, 5.25% due 5/1/2030 (North Shore Long Island Jewish Medical) | | A-/Baa1 | | | 1,000,000 | | | 1,006,410 |
10 Certified Semi-Annual Report
| | |
| SCHEDULE OF INVESTMENTS, CONTINUED | | |
| |
| Thornburg New York Intermediate Municipal Fund | | March 31, 2010 (Unaudited) |
| | | | | | | | |
Issuer-Description | | Credit Rating†
S&P/ Moody’s | | Principal
Amount | | Value |
New York Dormitory Authority Personal Income Tax, 5.50% due 3/15/2012 | | AAA/Aa3 | | $ | 1,000,000 | | $ | 1,088,480 |
New York Dormitory Authority Personal Income Tax, 5.00% due 3/15/2019 (Insured: AGM) | | AAA/Aa3 | | | 1,000,000 | | | 1,079,870 |
New York Environmental Facilities Corp. PCR Water, 6.875% due 6/15/2014 (State Revolving Fund) | | AAA/Aaa | | | 400,000 | | | 402,084 |
New York State Thruway Authority General, 5.00% due 1/1/2018 (Insured: AMBAC) | | A+/A1 | | | 1,000,000 | | | 1,071,400 |
New York State Thruway Authority Highway & Bridge Trust Fund, 5.00% due 4/1/2022 | | AA/NR | | | 1,000,000 | | | 1,079,370 |
New York State Urban Development Corp., 5.25% due 1/1/2021 | | AA-/NR | | | 1,000,000 | | | 1,093,780 |
Oneida County IDA, 6.10% due 6/1/2020 (Presbyterian Home for Central NY; LOC: HSBC Bank USA) | | NR/Aa3 | | | 450,000 | | | 456,021 |
Port Authority New York & New Jersey, 5.00% due 8/15/2022 (Insured: AGM) | | AAA/Aa2 | | | 1,000,000 | | | 1,087,740 |
Port Chester IDA, 4.75% due 7/1/2031 put 7/1/2011 (American Foundation; Collateralized: FNMA) | | AAA/NR | | | 750,000 | | | 775,815 |
Tobacco Settlement Funding Corp., 5.50% due 6/1/2021 | | AA-/A1 | | | 1,000,000 | | | 1,065,240 |
Triborough Bridge & Tunnel Authority, 5.00% due 11/15/2025 | | AA-/Aa2 | | | 1,410,000 | | | 1,513,381 |
United Nations Development Corp., 5.00% due 7/1/2025 | | NR/A1 | | | 710,000 | | | 746,998 |
Utica IDA Civic Facility, 5.25% due 7/15/2016 (Munson Williams Proctor Institute) | | NR/A1 | | | 210,000 | | | 216,833 |
Virgin Islands Water & Power Authority, 5.50% due 7/1/2017 | | NR/Baa3 | | | 1,350,000 | | | 1,353,889 |
| | | | | | | | |
TOTAL INVESTMENTS — 97.57% (Cost $ 41,900,157) | | | | | | | $ | 43,119,849 |
OTHER ASSETS LESS LIABILITIES — 2.43% | | | | | | | | 1,072,063 |
| | | | | | | | |
NET ASSETS — 100.00% | | | | | | | $ | 44,191,912 |
| | | | | | | | |
Footnote Legend
| † | Credit ratings are unaudited. Rating changes may have occurred subsequent to the reporting period end. |
Portfolio Abbreviations
To simplify the listings of securities, abbreviations are used per the table below:
| | |
| ACA | | Insured by American Capital Access |
| AGM | | Insured by Assured Guaranty Municipal Corp. |
| AMBAC | | Insured by American Municipal Bond Assurance Corp. |
| ETM | | Escrowed to Maturity |
| FHA | | Insured by Federal Housing Administration |
| FNMA | | Collateralized by Federal National Mortgage Association |
| GO | | General Obligation |
| IDA | | Industrial Development Authority |
| LOC | | Letter of Credit |
| Natl-Re | | Insured by National Public Finance Guarantee Corp. |
| PCR | | Pollution Control Revenue Bond |
| Radian | | Insured by Radian Asset Assurance |
| SONYMA | | State of New York Mortgage Authority |
See notes to financial statements.
Certified Semi-Annual Report 11
| | |
| STATEMENT OF ASSETS AND LIABILITIES | | |
| |
| Thornburg New York Intermediate Municipal Fund | | March 31, 2010 (Unaudited) |
| | | | |
ASSETS | | | | |
Investments at value (cost $41,900,157) (Note 2) | | $ | 43,119,849 | |
Cash | | | 205,707 | |
Receivable for investments sold | | | 445,000 | |
Receivable for fund shares sold | | | 161,405 | |
Interest receivable | | | 628,770 | |
Prepaid expenses and other assets | | | 1,157 | |
| | | | |
Total Assets | | | 44,561,888 | |
| | | | |
| |
LIABILITIES | | | | |
Payable for fund shares redeemed | | | 285,569 | |
Payable to investment advisor and other affiliates (Note 3) | | | 30,160 | |
Accounts payable and accrued expenses | | | 16,392 | |
Dividends payable | | | 37,855 | |
| | | | |
Total Liabilities | | | 369,976 | |
| | | | |
| |
NET ASSETS | | $ | 44,191,912 | |
| | | | |
NET ASSETS CONSIST OF: | | | | |
Distribution in excess of net investment income | | $ | (16,847 | ) |
Net unrealized appreciation on investments | | | 1,219,692 | |
Accumulated net realized gain (loss) | | | (32,312 | ) |
Net capital paid in on shares of beneficial interest | | | 43,021,379 | |
| | | | |
| | $ | 44,191,912 | |
| | | | |
| |
NET ASSET VALUE: | | | | |
Class A Shares: | | | | |
Net asset value and redemption price per share ($43,801,339 applicable to 3,512,091 shares of beneficial interest outstanding - Note 4) | | $ | 12.47 | |
Maximum sales charge, 2.00% of offering price | | | 0.25 | |
| | | | |
Maximum offering price per share | | $ | 12.72 | |
| | | | |
| |
Class I Shares: | | | | |
Net asset value, offering and redemption price per share ($390,573 applicable to 31,322 shares of beneficial interest outstanding - - Note 4) | | $ | 12.47 | |
| | | | |
See notes to financial statements.
12 Certified Semi-Annual Report
| | |
| STATEMENT OF OPERATIONS | | |
| |
| Thornburg New York Intermediate Municipal Fund | | Six Months Ended March 31, 2010 (Unaudited) |
| | | | |
INVESTMENT INCOME: | | | | |
Interest income (net of premium amortized of $77,784) | | $ | 944,275 | |
| | | | |
| |
EXPENSES: | | | | |
Investment advisory fees (Note 3) | | | 103,800 | |
Administration fees (Note 3) | | | | |
Class A Shares | | | 25,893 | |
Class I Shares | | | 23 | |
Distribution and service fees (Note 3) | | | | |
Class A Shares | | | 51,786 | |
Transfer agent fees | | | | |
Class A Shares | | | 9,385 | |
Class I Shares | | | 295 | |
Registration and filing fees | | | | |
Class A Shares | | | 146 | |
Custodian fees (Note 3) | | | 9,402 | |
Professional fees | | | 10,115 | |
Accounting fees | | | 848 | |
Trustee fees | | | 640 | |
Other expenses | | | 3,846 | |
| | | | |
Total Expenses | | | 216,179 | |
Less: | | | | |
Expenses reimbursed by investment advisor (Note 3) | | | (10,773 | ) |
Fees paid indirectly (Note 3) | | | (27 | ) |
| | | | |
Net Expenses | | | 205,379 | |
| | | | |
Net Investment Income | | | 738,896 | |
| | | | |
REALIZED AND UNREALIZED GAIN (LOSS) | | | | |
Net realized gain (loss) on investments | | | 6,567 | |
Net change in unrealized appreciation (depreciation) of investments | | | (1,045,042 | ) |
| | | | |
Net Realized and Unrealized Loss | | | (1,038,475 | ) |
| | | | |
Net Decrease in Net Assets Resulting From Operations | | $ | (299,579 | ) |
| | | | |
See notes to financial statements.
Certified Semi-Annual Report 13
| | |
| STATEMENTS OF CHANGES IN NET ASSETS | | |
| |
Thornburg New York Intermediate Municipal Fund | | |
| | | | | | | | |
| | | Six Months Ended
March 31, 2010* | | | Year Ended
September 30, 2009 | |
INCREASE (DECREASE) IN NET ASSETS FROM: | | | | | | | | |
| | |
OPERATIONS: | | | | | | | | |
Net investment income | | $ | 738,896 | | | $ | 1,286,130 | |
Net realized gain (loss) on investments | | | 6,567 | | | | 40,909 | |
Increase (decrease) in unrealized appreciation (depreciation) of investments | | | (1,045,042 | ) | | | 2,647,069 | |
| | | | | | | | |
| | |
Net Increase (Decrease) in Net Assets Resulting from Operations | | | (299,579 | ) | | | 3,974,108 | |
| | |
DIVIDENDS TO SHAREHOLDERS: | | | | | | | | |
From net investment income | | | | | | | | |
Class A Shares | | | (737,127 | ) | | | (1,286,130 | ) |
Class I Shares | | | (1,769 | ) | | | — | |
| | |
FUND SHARE TRANSACTIONS (NOTE 4): | | | | | | | | |
Class A Shares | | | 4,722,620 | | | | 6,741,948 | |
Class I Shares | | | 392,687 | | | | — | |
| | | | | | | | |
| | |
Net Increase in Net Assets | | | 4,076,832 | | | | 9,429,926 | |
| | |
NET ASSETS: | | | | | | | | |
Beginning of Period | | | 40,115,080 | | | | 30,685,154 | |
| | | | | | | | |
| | |
End of Period | | $ | 44,191,912 | | | $ | 40,115,080 | |
| | | | | | | | |
See notes to financial statements.
14 Certified Semi-Annual Report
| | |
| NOTES TO FINANCIAL STATEMENTS | | |
| |
| Thornburg New York Intermediate Municipal Fund | | March 31, 2010 (Unaudited) |
NOTE 1 – ORGANIZATION
Thornburg New York Intermediate Municipal Fund (the “Fund”) is a non-diversified series of Thornburg Investment Trust (the “Trust”). The Trust is organized as a Massachusetts business trust under a Declaration of Trust dated June 3, 1987 and is registered as a diversified, open-end management investment company under the Investment Company Act of 1940, as amended. The Fund is currently one of sixteen separate series of the Trust. Each series is considered to be a separate entity for financial reporting and tax purposes and bears expenses directly attributable to it. The Fund’s primary investment objective is to obtain as high a level of current income exempt from federal, New York State, and New York City individual income tax as is consistent, in the view of the Fund’s investment advisor, with the preservation of capital. The Fund’s secondary objective is to reduce expected changes in its share price compared to long-term bond portfolios. The Fund will invest primarily in municipal obligations within the state of New York.
The Fund currently offers two classes of shares of beneficial interest; Class A and Class I shares. Each class of shares of the Fund represents an interest in the same portfolio of investments, except that (i) Class A shares are sold subject to a front-end sales charge collected at the time the shares are purchased and bear a service fee and (ii) Class I shares are sold at net asset value without a sales charge at the time of purchase, and (iii) the respective classes may have different reinvestment privileges and conversion rights. Additionally, the Fund may allocate among its classes certain expenses, to the extent allowable to specific classes, including transfer agent fees, government registration fees, certain printing and postage costs, and administrative and legal expenses. Currently, class specific expenses of the Fund are limited to service and distribution fees, administration fees, and certain registration and transfer agent expenses.
NOTE 2 – SIGNIFICANT ACCOUNTING POLICIES
Significant accounting policies of the Trust are as follows:
Valuation of Investments: Debt obligations have a primary market over the counter and are valued by an independent pricing service approved by the Trustees of the Trust. The pricing service ordinarily values debt obligations at quoted bid prices. When quotations are not available, debt obligations are valued at evaluated prices determined by the pricing service using methods which include consideration of yields or prices of debt obligations of comparable quality, type of issue, coupon, maturity and rating, and indications as to value from dealers and general market conditions. Short-term obligations having remaining maturities of 60 days or less are valued at amortized cost, which approximates market value.
In any case where a pricing service fails to provide a price for a debt obligation held by the Fund, the valuation and pricing committee determines a fair value for the obligation using procedures approved by the Trustees. Additionally, in any case where management believes that a price provided by a pricing service for a debt obligation may be unreliable, the valuation and pricing committee decides whether or not to use the pricing service’s valuation or to determine a fair value for the obligation.
In determining fair value for any portfolio security or other investment, the valuation and pricing committee seeks to determine the amount that an owner of the investment might reasonably expect to receive upon a sale of the investment. However, because fair value prices are estimated prices, the valuation and pricing committee’s determination of fair value for an investment may differ from the value that would be realized by the Fund upon a sale of the investment, and that difference could be material to the Fund’s financial statements. The valuation and pricing committee’s determination of fair value for an investment may also differ from the prices obtained by other persons (including other mutual funds) for the investment.
Valuation Measurements: Various inputs are used in determining the value of the Fund’s investments. These inputs are summarized in the three levels listed below.
Level 1: Quoted prices in active markets for identical investments.
Level 2: Other significant observable inputs (including quoted prices for similar investments, interest rates, prepayment rates, credit risk, etc.).
Level 3: Significant unobservable inputs (including the Fund’s own assumptions in determining the fair value of investments).
Certified Semi-Annual Report �� 15
| | |
| NOTES TO FINANCIAL STATEMENTS, CONTINUED | | |
| |
| Thornburg New York Intermediate Municipal Fund | | March 31, 2010 (Unaudited) |
The following table displays a summary of the inputs used to value the Fund’s net assets as of March 31, 2010. In any instance when valuation inputs from more than one level are used to determine the fair value of a specific investment, the investment is placed in the level of the table based upon the lowest level input that is significant in determining the fair value of the investment:
| | | | | | | | | | | | |
| | | Fair Value Measurements at March 31, 2010 |
| | | Total | | Level 1 | | Level 2 | | Level 3 |
Assets | | | | | | | | | | | | |
Investments in Securities | | | | | | | | | | | | |
Municipal Bonds | | $ | 43,119,849 | | $ | — | | $ | 43,119,849 | | $ | — |
| | | | | | | | | | | | |
Total Investments in Securities | | $ | 43,119,849 | | $ | — | | $ | 43,119,849 | | $ | — |
Federal Income Taxes: It is the policy of the Trust to comply with the provisions of the Internal Revenue Code applicable to “regulated investment companies” and to distribute to shareholders substantially all taxable (if any) and tax exempt income of the Fund. Therefore, no provision for federal income tax is required.
When-Issued and Delayed Delivery Transactions: The Fund may engage in when-issued or delayed delivery transactions. To the extent the Fund engages in such transactions, it will do so for the purpose of acquiring portfolio securities consistent with the Fund’s investment objectives and not for the purpose of investment leverage or to speculate on interest rate and/or market changes. At the time the Fund makes a commitment to purchase a security on a when-issued or delayed delivery basis, the Fund will record the transaction and reflect the value in determining its net asset value. When effecting such transactions, assets of an amount sufficient to make payment for the portfolio securities to be purchased will be segregated on the Fund’s records on the trade date. Securities purchased on a when-issued or delayed delivery basis do not earn interest until the settlement date.
Dividends: Net investment income of the Fund is declared daily as a dividend on shares for which the Fund has received payment. Dividends are paid monthly and are reinvested in additional shares of the Fund at net asset value per share at the close of business on the dividend payment date, or at the shareholder’s option, paid in cash. Net realized capital gains, to the extent available, will be distributed at least annually.
General: Securities transactions are accounted for on a trade date basis. Interest income is accrued as earned. Premiums and discounts on securities purchased are amortized to call dates or maturity dates of the respective securities. Realized gains and losses from the sale of securities are recorded on an identified cost basis. Expenses common to all funds are allocated among the funds comprising the Trust based upon their relative net asset values or other appropriate allocation methods.
Guarantees and Indemnifications: Under the Trust’s organizational documents, its officers and Trustees are indemnified against certain liabilities arising out of the performance of their duties to the Fund. Additionally, in the normal course of business the Trust enters into contracts with service providers that contain general indemnification clauses. The Trust’s maximum exposure under these arrangements is unknown. However, based on experience, the Trust expects the risk of loss to be remote.
Use of Estimates: The preparation of financial statements, in conformity with generally accepted accounting principles, requires management to make estimates and assumptions that affect the reported amounts of assets and liabilities and the disclosure of contingent assets and liabilities at the date of the financial statements and the reported amounts of increases and decreases in net assets from operations during the reporting period. Actual results could differ from those estimates.
NOTE 3 – INVESTMENT ADVISORY FEE AND OTHER TRANSACTIONS WITH AFFILIATES
Pursuant to an investment advisory agreement, Thornburg Investment Management, Inc. (the “Advisor”) serves as the investment advisor and performs services to the Fund for which the fees are payable at the end of each month. For the six months ended March 31, 2010, these fees were payable at annual rates ranging from .50 of 1% to .275 of 1% per annum of the average daily net assets of the Fund depending on the Fund’s asset size. The Trust also has entered into administrative services agreements with the Advisor, whereby the Advisor will perform certain administrative services for the shareholders of each class of the fund shares, and for which fees will be payable at an annual rate of up to .125 of 1% per annum of the average daily net assets attributable to each class of shares. For the period ended March 31, 2010, the Advisor voluntarily or contractually agreed to reimburse certain class specific expenses and administrative fees of $10,477 for Class A shares and $296 for Class I shares.
16 Certified Semi-Annual Report
| | |
| NOTES TO FINANCIAL STATEMENTS, CONTINUED | | |
| |
| Thornburg New York Intermediate Municipal Fund | | March 31, 2010 (Unaudited) |
The Trust has an underwriting agreement with Thornburg Securities Corporation (the “Distributor,” an affiliate of the Advisor), which acts as the distributor of the Fund’s shares. For the six months ended March 31, 2010, the Distributor has advised the Fund that it earned net commissions aggregating $416 from the sale of Class A shares.
Pursuant to a service plan under Rule 12b-1 of the Investment Company Act of 1940, the Fund may reimburse to the Advisor an amount not to exceed .25 of 1% per annum of the average daily net assets attributable to each class of shares of the Fund. for payments made by the Advisor to securities dealers and other financial institutions to obtain various shareholder and distribution related services. The Advisor may pay out of its own resources additional expenses for distribution of the Fund’s shares.
The Trust has an agreement with the custodian bank to indirectly pay a portion of the custodian’s fees through credits earned by the Fund’s cash on deposit with the bank. This deposit agreement is an alternative to overnight investments. Custodial fees have been adjusted to reflect amounts that would have been paid without this agreement, with a corresponding adjustment reflected as fees paid indirectly in the Statement of Operations. For the six months ended March 31, 2010, fees paid indirectly were $27.
Certain officers and Trustees of the Trust are also officers and/or directors of the Advisor and Distributor. The compensation of independent Trustees is borne by the Trust.
NOTE 4 – SHARES OF BENEFICIAL INTEREST
At March 31, 2010, there were an unlimited number of shares of beneficial interest authorized. Transactions in shares of beneficial interest were as follows:
| | | | | | | | | | | | | | |
| | | Six Months Ended
March 31, 2010 (Unaudited) | | | Year Ended
September 30, 2009 (Audited) | |
| | | Shares | | | Amount | | | Shares | | | Amount | |
Class A Shares | | | | | | | | | | | | | | |
Shares sold | | 671,666 | | | $ | 8,439,646 | | | 957,975 | | | $ | 11,722,549 | |
Shares issued to shareholders in reinvestment of dividends | | 40,947 | | | | 513,130 | | | 75,315 | | | | 924,154 | |
Shares repurchased | | (336,783 | ) | | | (4,230,156 | ) | | (481,247 | ) | | | (5,904,755 | ) |
| | | | | | | | | | | | | | |
| | | | |
Net Increase (Decrease) | | 375,830 | | | $ | 4,722,620 | | | 552,043 | | | $ | 6,741,948 | |
| | | | | | | | | | | | | | |
| | | | |
Class I Shares* | | | | | | | | | | | | | | |
Shares sold | | 31,180 | | | $ | 390,918 | | | — | | | $ | — | |
Shares issued to shareholders in reinvestment of dividends | | 142 | | | | 1,769 | | | — | | | | — | |
Shares repurchased | | — | | | | — | | | — | | | | — | |
| | | | | | | | | | | | | | |
| | | | |
Net Increase (Decrease) | | 31,322 | | | $ | 392,687 | | | — | | | $ | — | |
| | | | | | | | | | | | | | |
| * | The effective date of this class of shares was February 1, 2010. |
NOTE 5 – SECURITIES TRANSACTIONS
For the six months ended March 31, 2010, the Fund had purchase and sale transactions of investment securities (excluding short-term investments) of $7,268,187 and $2,383,987, respectively.
Certified Semi-Annual Report 17
| | |
| NOTES TO FINANCIAL STATEMENTS, CONTINUED | | |
| |
| Thornburg New York Intermediate Municipal Fund | | March 31, 2010 (Unaudited) |
NOTE 6 – INCOME TAXES
At March 31, 2010, information on the tax components of capital is as follows:
| | | | |
Cost of investments for tax purposes | | $ | 41,900,157 | |
| | | | |
Gross unrealized appreciation on a tax basis | | $ | 1,617,661 | |
Gross unrealized depreciation on a tax basis | | | (397,969 | ) |
| | | | |
Net unrealized appreciation (depreciation)on investments (tax basis) | | $ | 1,219,692 | |
| | | | |
At March 31, 2010, the Fund had tax basis capital losses of $38,879, which may be carried forward to offset future capital gains. To the extent such carryforwards are used, capital gain distributions may be reduced to the extent provided by regulations. Such capital loss carryforwards will expire September 30, 2014.
OTHER NOTES
Fund management believes no events have occurred between March 31, 2010 and May 20, 2010, the date of issuance of the financial statements, that require adjustment of, or disclosure in, the accompanying financial statements.
18 Certified Semi-Annual Report
This page intentionally left blank.
Certified Semi-Annual Report 19
FINANCIAL HIGHLIGHTS
Thornburg New York Intermediate Municipal Fund
| | | | | | | | | | | | | | | | | | | | | | | | | | | | | | | | | | | | | | | | | | |
| | | PER SHARE PERFORMANCE (for a share outstanding throughout the period) | | RATIOS TO AVERAGE NET ASSETS | | | SUPPLEMENTAL DATA |
Unless
Otherwise
Noted,
Periods
are
Fiscal
Years
Ended
Sept. 30, | | Net Asset
Value
Beginning
of
Period | | Net
Investment
Income
(Loss) | | Net
Realized
&
Unrealized
Gain (Loss)
on
Investments | | | Total from
Investment
Operations | | | Dividends
from Net
Investment
Income | | | Dividends
from Net
Realized
Gains | | Total
Dividends | | | Net
Asset
Value
End
of
Period | | Net
Investment
Income
(Loss)
(%) | | | Expenses,
After
Expense
Reductions
(%) | | | Expenses,
After
Expense
Reductions
and
Net of
Custody
Credits
(%) | | | Expenses,
Before
Expense
Reductions
(%) | | | Total
Return
(%)(a) | | | Portfolio
Turnover
Rate (%) | | Net Assets
at End
of Period
(Thousands) |
Class A Shares | | | | | | | | | | | | | | | | | | | | | | | | | | |
2010(b)(c) | | $ | 12.79 | | 0.22 | | (0.32 | ) | | (0.10 | ) | | (0.22 | ) | | — | | (0.22 | ) | | $ | 12.47 | | 3.56 | (d) | | 0.99 | (d) | | 0.99 | (d) | | 1.04 | (d) | | (0.75 | ) | | 5.87 | | $ | 43,801 |
2009(c) | | $ | 11.87 | | 0.45 | | 0.92 | | | 1.37 | | | (0.45 | ) | | — | | (0.45 | ) | | $ | 12.79 | | 3.67 | | | 0.99 | | | 0.99 | | | 1.07 | | | 11.77 | | | 13.00 | | $ | 40,115 |
2008(c) | | $ | 12.30 | | 0.44 | | (0.43 | ) | | 0.01 | | | (0.44 | ) | | — | | (0.44 | ) | | $ | 11.87 | | 3.61 | | | 1.01 | | | 0.99 | | | 1.08 | | | 0.07 | | | 13.42 | | $ | 30,685 |
2007(c) | | $ | 12.38 | | 0.46 | | (0.08 | ) | | 0.38 | | | (0.46 | ) | | — | | (0.46 | ) | | $ | 12.30 | | 3.74 | | | 1.01 | | | 0.99 | | | 1.11 | | | 3.13 | | | 14.91 | | $ | 33,016 |
2006(c) | | $ | 12.44 | | 0.45 | | (0.06 | ) | | 0.39 | | | (0.45 | ) | | — | | (0.45 | ) | | $ | 12.38 | | 3.66 | | | 1.01 | | | 0.99 | | | 1.11 | | | 3.23 | | | 15.38 | | $ | 34,849 |
2005(c) | | $ | 12.64 | | 0.42 | | (0.20 | ) | | 0.22 | | | (0.42 | ) | | — | | (0.42 | ) | | $ | 12.44 | | 3.31 | | | 1.00 | | | 0.99 | | | 1.12 | | | 1.73 | | | 28.70 | | $ | 41,375 |
| | | | | | | | | |
Class I Shares | | | | | | | | | | | | | | | | | | | | | | | | | | |
2010(b)(e) | | $ | 12.48 | | 0.08 | | (0.01 | ) | | 0.07 | | | (0.08 | ) | | — | | (0.08 | ) | | $ | 12.47 | | 3.87 | (d) | | 0.67 | (d) | | 0.67 | (d) | | 1.32 | (d) | | 0.56 | | | 5.87 | | $ | 391 |
| (a) | Not annualized for periods less than one year. |
| (b) | Unaudited Six Month Period Ended March 31. |
| (c) | Sales loads are not reflected in computing total return. |
| (e) | Effective date of this class of shares was February 1, 2010. |
See notes to financial statements.
| | |
| 20 Certified Semi-Annual Report | | Certified Semi-Annual Report 21 |
| | |
| EXPENSE EXAMPLE | | |
| |
| Thornburg New York Intermediate Municipal Fund | | March 31, 2010 (Unaudited) |
As a shareholder of the Fund, you incur two types of costs:
| | (1) | transaction costs, including |
(a) sales charges (loads) on purchase payments, for Class A shares;
(b) a deferred sales charge on redemptions of any part or all of a purchase of $1 million of Class A shares within 12 months of purchase;
| | (2) | ongoing costs, including management fees; distribution and/or service (12b-1) fees; and other Fund expenses. |
This example is intended to help you understand your ongoing costs (in dollars) of investing in the Fund and to compare these costs with the ongoing costs of investing in other mutual funds.
The example is based on a $1,000 investment beginning on October 1, 2009, and held until March 31, 2010.
ACTUAL EXPENSES
The first line of the table at right provides information about actual account values and actual expenses. You may use the information in this line, together with the amount you invested, to estimate the expenses that you paid over the period. Simply divide your account value by $1,000 (for example, an $8,600 account value divided by $1,000 = 8.6), then multiply the result by the number in the first line under the heading entitled “Expenses Paid During Period” to estimate the expenses you paid on your account during this period.
HYPOTHETICAL EXAMPLE FOR COMPARISON PURPOSES
The second line of the table at right provides information about hypothetical account values and hypothetical expenses based on the Fund’s actual expense ratio and an assumed rate of return of 5% per year before expenses, which is not the Fund’s actual return. The hypothetical account values and expenses may not be used to estimate the actual ending account balance or expenses you paid for the period. You may use this information to compare the ongoing costs of investing in the Fund and other funds. To do so, compare this 5% hypothetical example with the 5% hypothetical examples that appear in the shareholder reports of the other funds.
| | | | | | | | | |
| | | Beginning
Account Value
10/1/09 | | Ending
Account Value
3/31/10 | | Expenses Paid
During Period†
10/1/09–3/31/10 |
Class A Shares | | | | | | | | | |
Actual | | $ | 1,000.00 | | $ | 992.50 | | $ | 4.92 |
Hypothetical* | | $ | 1,000.00 | | $ | 1,020.00 | | $ | 4.99 |
Class I Shares | | | | | | | | | |
Actual | | $ | 1,000.00 | | $ | 1,017.27 | | $ | 3.36 |
Hypothetical* | | $ | 1,000.00 | | $ | 1,021.60 | | $ | 3.37 |
| † | Expenses are equal to the annualized expense ratio for each class (A: 0.99%; I: 0.67%) multiplied by the average account value over the period, multiplied by 182/365 to reflect the one-half year period. |
| * | Hypothetical assumes a rate of return of 5% per year before expenses. |
Please note that the expenses shown in the table are meant to highlight your ongoing costs only and do not reflect any transactional costs, such as sales charges (loads), redemption fees, or exchange fees. Therefore, the second line of the table is useful in comparing ongoing costs only, and will not help you determine the relative total costs of owning different funds. In addition, if these transactional costs were included, your costs would have been higher.
22 Certified Semi-Annual Report
| | |
| OTHER INFORMATION | | |
| |
| Thornburg New York Intermediate Municipal Fund | | March 31, 2010 (Unaudited) |
PORTFOLIO PROXY VOTING
Policies and Procedures:
The Trust has delegated to Thornburg Investment Management, Inc. (the “Advisor”) voting decisions respecting proxies for the Fund’s voting securities. The Advisor makes voting decisions in accordance with its Proxy Voting Policy and Procedures. A description of the Policy and Procedures is available (i) without charge, upon request, by calling the Advisor toll-free at 1-800-847-0200, (ii) on the Thornburg website at www.thornburg.com, and (iii) on the Securities and Exchange Commission’s website at www.sec.gov.
Information regarding how proxies were voted is available on or before August 31 of each year for the twelve months ending the preceding June 30. This information is available (i) without charge, upon request by calling the Advisor toll-free at 1-800-847-0200, (ii) on the Thornburg website at www.thornburg.com, and (iii) on the Securities and Exchange Commission’s website at www.sec.gov.
AVAILABILITY OF QUARTERLY PORTFOLIO SCHEDULE
The Fund files with the Securities and Exchange Commission schedules of its portfolio holdings on Form N-Q for the first and third quarters of each fiscal year. The Fund’s Forms N-Q are available on the Commission’s website at www.sec.gov, or may be reviewed and copied at the Commission’s Public Reference Room in Washington, D.C. Information on the operation of the Public Reference Room may be obtained by calling 1-800-SEC-0330. The Fund also makes this information available on its website at www.thornburg.com/ download or upon request by calling 1-800-847-0200.
Certified Semi-Annual Report 23
Trustees’ Statement to Shareholders
Not part of the Certified Semi-Annual Report
February 8, 2005, as readopted July 22, 2009
The Trustees are concerned that ongoing commentaries and opinions reported in the media may confuse investors in general as to the supervisory duties of trustees of mutual funds and, in particular, leave Thornburg Investment Trust shareholders uncertain regarding how we discharge our responsibilities in supervising the Funds’ investment advisor and in reviewing the advisor’s contract for renewal. We decided to spell out clearly three principal guidelines that we follow in supervising the Trust’s investment advisor on your behalf.
We begin with the premise that each shareholder selected his or her Fund because its investments are managed by the investment advisor identified in the prospectus and in accordance with the objective and policies described in the prospectus. We realize, as each of you do, that if you believe that your Fund’s stated objective and policies no longer serve your personal investment goals, you can sell your shares and leave the Fund.
Therefore, we believe that our primary supervisory task – our principal obligation to you – is to assess the nature and quality of the advisor’s services, and to confirm that the advisor actively and competently pursues the Fund’s objective, in accordance with the policies set out in the prospectus. To do this, we meet regularly with management to review your Fund’s portfolio and to discuss the advisor’s specific actions and judgments in pursuing the Fund’s objective. We do not substitute our own judgment for the advisor’s decisions in selecting investments; the advisor is paid to exercise its informed judgment on investment decisions, and we seek to confirm, in reviewing the advisor’s performance, that the advisor is doing just that.
Second, while we are conscious of costs and the effect that costs have on shareholders’ returns, we do not seek the lowest fees or expense ratio as our sole or primary objective. We try to make sure that your Fund’s fees and costs are reasonable in relationship to the services rendered and that they are generally in line with those charged by other expert investment advisors, consistent with our belief that the Fund’s investors searched for and expect that expertise and attention and have decided to pay a reasonable price for it. We do not put the management contract “out to bid” as a matter of course, and we would not do so unless we had concluded that the advisor materially had failed to pursue the Fund’s objectives in accordance with its policies, or for other equally important reasons. We believe that any other approach would be inconsistent with your interests and contrary to your expectations when you bought shares of the Fund in the first place.
Finally, because we believe that most Thornburg Fund shareholders have invested with a long-term perspective, we try not to focus too much on the fashions of the moment and on short-term performance. The market will not favor any specific investment objective or set of policies at all times and under all economic circumstances. A fund will experience periods of both high and low returns relative to other funds and other investments. Even if one of our Funds is not favored by the market at a particular time, we believe that the advisor is nonetheless obliged to remain true to the Fund’s objective and policies, and we watch to see that it does so.
24 This page is not part of the Semi-Annual Report.
Retirement and Education Accounts
Thornburg Investment Management offers retirement and education savings accounts that can help you meet a variety of planning challenges. For account applications or further information on any of the accounts below, please call 1-800-847-0200 or go to www.thornburg.com/ira. Your financial advisor can help you determine which plan is right for you.
Individual Retirement Accounts
Individual Retirement Accounts (IRAs) provide a tax-advantaged means to save money for the future. For a detailed outline of the difference between retirement accounts, see www.thornburg.com/ira. Rollovers are available. Call 1-800-847-0200 for more information.
Traditional IRAs – Contributions to Traditional IRAs are tax deductible for eligible individuals, and withdrawals are taxed as additional ordinary income. You may contribute to an IRA if you receive compensation and are under 70 1/ 2, even if you are covered by an employer retirement plan. Deductible contributions are subject to certain qualifications. Please consult your tax advisor.
Roth IRAs – Under a Roth IRA, there is no tax deduction for contributions, but there is no income tax on qualified withdrawals. For a more detailed comparison of Traditional and Roth IRAs, please see our web site at www.thornburg.com/ira.
SEP IRAs – Simplified Employee Pension (SEP) IRAs are established by employers. The employer is allowed a tax deduction for contributions made to the SEP Plan and makes contributions to each eligible employee’s SEP IRA on a discretionary basis.
SIMPLE IRAs – Savings Incentive Match Plan for Employees of Small Employers (SIMPLE) is designed to give small business owners a simplified method to establish and contribute to a retirement plan for employees. The employer is allowed a tax deduction for contributions and makes either matching or non-elective contributions to each eligible employee’s SIMPLE IRA. Employees may make salary deferral contributions.
Coverdell Education Savings Account
These savings accounts are designed to provide a way to save money for higher education expenses. In an Education Savings Account, earnings and interest grow tax-free, and qualified withdrawals used to pay for eligible higher-education expenses are tax- and penalty-free.
Funds Available
The following funds are available in the accounts listed above:
| | • | | Thornburg International Value Fund |
| | • | | Thornburg Core Growth Fund |
| | • | | Thornburg Investment Income Builder Fund |
| | • | | Thornburg Global Opportunities Fund |
| | • | | Thornburg International Growth Fund |
| | • | | Thornburg Developing World Fund |
| | • | | Thornburg Limited Term U.S. Government Fund |
| | • | | Thornburg Limited Term Income Fund |
| | • | | Thornburg Strategic Income Fund |
This page is not part of the Semi-Annual Report. 25

Thornburg Equity Funds
Thornburg’s equity research uses a fundamental and comprehensive analytical approach. Thornburg equity funds focus on a limited number of securities so that each holding can impact performance. The equity team searches for firms believed to have a promising future and seeks to buy shares of those companies at a discount to their intrinsic value.
| | • | | Thornburg International Value Fund |
| | • | | Thornburg Core Growth Fund |
| | • | | Thornburg Investment Income Builder Fund |
| | • | | Thornburg Global Opportunities Fund |
| | • | | Thornburg International Growth Fund |
| | • | | Thornburg Developing World Fund |
Thornburg Bond Funds
Thornburg Investment Management applies a disciplined philosophy to fixed-income management. Since the launch of our first fixed-income fund over 25 years ago, we have been conducting fundamental, bottom-up research in an effort to identify bonds which we believe provide the best return for a given level of risk. We are very organic in our approach, avoiding leverage or complex strategies which could backfire in periods of market uncertainty.
| | • | | Thornburg Limited Term Municipal Fund |
| | • | | Thornburg Intermediate Municipal Fund |
| | • | | Thornburg California Limited Term Municipal Fund |
| | • | | Thornburg New Mexico Intermediate Municipal Fund |
| | • | | Thornburg New York Intermediate Municipal Fund |
| | • | | Thornburg Strategic Municipal Income Fund |
| | • | | Thornburg Limited Term U.S. Government Fund |
| | • | | Thornburg Limited Term Income Fund |
| | • | | Thornburg Strategic Income Fund |
Before investing, carefully consider the Fund’s investment goals, risks, charges, and expenses. For a prospectus containing this and other information, contact your financial advisor or visit thornburg.com. Read it carefully before investing.
For additional information, please visit www.thornburg.com
Thornburg Investment Management, Inc. 2300 North Ridgetop Road, Santa Fe, NM 87506
This page is not part of the Semi-Annual Report. 27
| | | | | | |
 | | Waste not, Wait not | |  |
| |
| | Get instant access to your shareholder reports. |
| | |
| | This Semi-Annual Report is submitted for the general information of shareholders of the Fund. It is not authorized for distribution to prospective investors in the Fund unless preceded or accompanied by an effective prospectus. | | By switching from your postal mailbox to your email inbox, you reduce paper clutter, improve record keeping access, and help conserve our natural resources. |
| | |

| | Investment Advisor: Thornburg Investment Management® | | Go to www.thornburg.com/edelivery and sign up to receive your shareholder reports, prospectuses, and proxy statements electronically. |
| | 800.847.0200 | | |
| | Distributor: | | |
| | Thornburg Securities Corporation® 800.847.0200 | | You invest in the future, without spending a dime. |
| | TH1069 | | |

2 This page is not part of the Semi-Annual Report.
Important Information
The information presented on the following pages was current as of March 31, 2010. The managers’ views, portfolio holdings, and sector diversification are provided for the general information of the Funds’ shareholders; they are historical and subject to change. This material should not be deemed a recommendation to buy or sell any of the securities mentioned.
Investments in the Funds carry risks, including possible loss of principal. Bond funds have the same interest rate, inflation, and credit risks that are associated with the underlying bonds. The principal value of a bond will fluctuate relative to changes in interest rates, decreasing when interest rates rise. Unlike bonds, bond funds have ongoing fees and expenses. Funds invested in mortgage backed securities may bear additional risk. Please see each Fund’s Prospectus for a discussion of the risks associated with an investment in either Fund. Investments in the Funds are not FDIC insured, nor are they deposits of or guaranteed by a bank or any other entity. There is no guarantee that the Funds will meet their investment objectives. The laddering strategy does not assure or guarantee better performance and cannot eliminate the risk of investment losses.
Performance data given at net asset value (NAV) does not take into account applicable sales charges. If the sales charges had been included, the performance would have been lower. Minimum investments for Class I shares are higher than those for other classes. Class I and R3 shares may not be available to all investors.
| | | | |
Limited Term U.S. Government Fund | | CUSIPS | | NASDAQ SYMBOLS |
Class A | | 885-215-103 | | LTUSX |
Class B | | 885-215-848 | | LTUBX |
Class C | | 885-215-830 | | LTUCX |
Class I | | 885-215-699 | | LTUIX |
Class R3 | | 885-215-491 | | LTURX |
| | |
Limited Term Income Fund | | | | |
Class A | | 885-215-509 | | THIFX |
Class C | | 885-215-764 | | THICX |
Class I | | 885-215-681 | | THIIX |
Class R3 | | 885-215-483 | | THIRX |
Lipper’s 2008
Best Fixed-Income Fund Family
Thornburg Investment Management ranked #1 out of 41 eligible firms in Lipper, Inc.’s fixed income large firm universe for the three-year period ended 12/31/07, based on risk-adjusted returns. Past performance does not guarantee future results.
Lipper’s large firm universe is comprised of fund families with more than $28 billion in total net assets. Only fund families with at least five bond funds were eligible. Risk-adjusted returns were calculated with dividends reinvested and without sales charges. We did not win this award in 2009 or 2010.
Glossary
Barclays Capital Intermediate Government/Credit Bond Index – An unmanaged, market-weighted index generally representative of intermediate government and investment-grade corporate debt securities having maturities of up to ten years.
Barclays Capital Intermediate Government Bond Index – An unmanaged, market-weighted index generally representative of all public obligations of the U.S. Government, its agencies and instrumentalities having maturities of up to ten years.
Barclays Capital U.S. Corporate Index – The U.S. Corporate Index covers USD-denominated, investment-grade, fixed-rate, taxable securities sold by industrial, utility and financial issuers. It includes publicly issued U.S. corporate and foreign debentures and secured notes that meet specified maturity, liquidity, and quality requirements.
Unless otherwise noted, index returns reflect the reinvestment of income dividends and capital gains, if any, but do not reflect fees, brokerage commissions or other expenses of investing. Investors may not make direct investments into any index.
Annualized Distribution Yield – The distribution yield is calculated by taking the sum of the month’s total distribution factors and dividing this sum by a 30-day period and annualizing to a 360-day year. The value is then divided by the ending maximum offering price per share to arrive at the annualized distribution yield. The yield is calculated on a periodic basis and is subject to change.
Bond Credit Ratings – A bond credit rating assesses the financial ability of a debt issuer to make timely payments of principal and interest. Ratings of AAA (the highest), AA, A, and BBB are investment-grade quality. Ratings of BB, B, CCC, CC, C, and D (the lowest) are considered below investment grade, speculative grade, or junk bonds. Unless otherwise noted, the ratings listed are from Bloomberg Market Data and are a combination of ratings from Standard and Poor’s, Moody’s Investors Service, and/or Fitch Ratings.
Duration – The weighted maturity of a bond’s cash flows. Duration measures the price sensitivity of a bond for a given change in interest rates. Bonds with longer durations experience greater price volatility than bonds with shorter durations.
SEC Yield – SEC Yield is computed in accordance with SEC standards measuring the net investment income per share over a specified 30-day period expressed as a percentage of the maximum offering price of the Fund’s shares at the end of the period.
U.S. Treasury Securities – U.S. Treasury securities, such as bills, notes and bonds, are negotiable debt obligations of the U.S. government. These debt obligations are backed by the “full faith and credit” of the government and issued at various schedules and maturities. Income from Treasury securities is exempt from state and local, but not federal income taxes.
This page is not part of the Semi-Annual Report. 3
Thornburg Limited Term U.S. Government Fund
At Thornburg, our approach to management of the Fund is based on the premise that investors in the Fund seek preservation of capital along with an attractive, relatively stable yield. While aggressive bond strategies may generate stronger returns when the market is turning a blind eye towards risk, they usually fail to stack up over longer periods of time. Our patience and diligence was recognized by Lipper, which named Thornburg Investment Management its 2008 Best Fixed-Income Fund Family.
We apply time-tested techniques to manage risk and provide attractive returns. These include:
| | • | | Building a laddered portfolio. Laddering has been shown over time to mitigate price and interest rate risk. |
| | • | | Investing on a cash-only basis without using leverage. While leveraged strategies may enhance returns when market conditions are favorable, they can quickly compound losses when sentiment shifts. |
| | • | | Conducting careful research to invest where we see the best relative value among government and agency sectors. |
IMPORTANT PERFORMANCE INFORMATION
Performance data shown represents past performance and is no guarantee of future results. Investment return and principal value will fluctuate so shares, when redeemed, may be worth more or less than their original cost. Current performance may be lower or higher than quoted. For performance current to the most recent month end, visit thornburg.com.
The maximum sales charge for the Limited Term U.S. Government Fund’s Class A shares is 1.50% . The total annual fund operating expense of Class A shares is 0.94%, as disclosed in the most recent Prospectus.
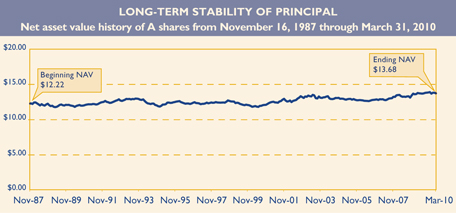
AVERAGE ANNUAL TOTAL RETURNS
For periods ended March 31, 2010
| | | | | | | | | | | | | | | |
| | | 1 Yr | | | 3 Yrs | | | 5 Yrs | | | 10 Yrs | | | Since
Inception | |
A Shares (Incep: 11/16/87) | | | | | | | | | | | | | | | |
Without sales charge | | 3.63 | % | | 5.72 | % | | 4.67 | % | | 5.19 | % | | 5.97 | % |
With sales charge | | 2.07 | % | | 5.18 | % | | 4.36 | % | | 5.03 | % | | 5.90 | % |
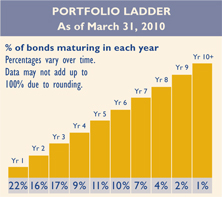
30-DAY YIELDS
As of March 31, 2010
| | | | | | |
| | | Annualized
Distribution Yield | | | SEC
Yield | |
A Shares | | 2.95 | % | | 2.75 | % |
KEY PORTFOLIO ATTRIBUTES
As of March 31, 2010
| | |
Number of Bonds | | 141 |
Duration | | 3.0 Yrs |
Average Maturity | | 3.3 Yrs |
See the entire portfolio in the Schedule of Investments beginning on page 12.
4 This page is not part of the Semi-Annual Report.
THORNBURG LIMITED TERM U.S. GOVERNMENT FUND VERSUS
LIPPER U.S. GOVERNMENT MONEY MARKET FUNDS AVERAGE
Class A shares as of March 31, 2010
We often are asked to compare Thornburg Limited Term U.S. Government Fund to money market fund returns. U.S. Government bond funds are not an exact substitute for money market funds. These investments have certain differences, which are discussed below. Investors in Thornburg Limited Term U.S. Government Fund took more risk than money market fund investors to earn their higher returns.
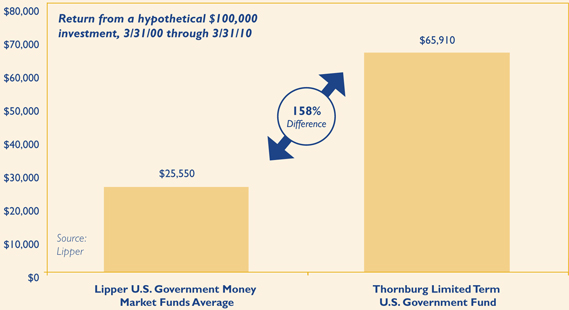
Past performance does not guarantee future results. Performance data above does not include the 1.50% sales charge for Class A shares. If the sales charge had been included, returns would have been lower. Returns shown are minus the initial investment.
Investors in U.S. Government bond funds may experience more volatility than those in comparable money market funds. There are also differences in fees and expenses.
Investors in the Thornburg Limited Term U.S. Government Fund took more risk than money market investors to earn their higher returns, including interest rate and credit risk. Unlike money market funds, the prices of bonds fluctuate relative to changes in interest rates, with principal values decreasing when interest rates rise and increasing when interest rates fall. Generally, money market funds seek to maintain an investment portfolio with an average maturity of 90 days or less. Thornburg Limited Term U.S. Government Fund has an average maturity of normally less than five years. Interest dividends paid by the Fund or by U.S. Government money market funds may be exempt from state income tax.
Money market funds seek to preserve the value per share at $1.00, whereas, the Thornburg Limited Term U.S. Government Fund’s net asset value changes daily. It is possible to lose money when investing in either the Thornburg Limited Term U.S. Government Fund or a U.S. Government money market fund. Neither are insured by the FDIC or any other government agency.
Lipper U.S. Government Money Market Funds Average is an arithmetic average of the total return of all U.S. Government money market mutual funds. You cannot invest in a category average.
This page is not part of the Semi-Annual Report. 5
Thornburg Limited Term Income Fund
The Thornburg Limited Term Income Fund takes the laddering strategy to the broader fixed-income market. Expanding beyond government and agency securities brings additional risks – as well as potentially higher returns. Our team addresses these uncertainties by employing a comprehensive approach to risk management. While utilizing the ladder to balance interest rate and reinvestment risk, the team also:
| | • | | Invests on a cash-only basis. While leveraged strategies may enhance returns when market conditions are favorable, they can quickly compound losses when sentiment shifts. |
| | • | | Conducts in-depth fundamental research on each credit issue under consideration. The goal of this research is identification of bonds which provide a reasonable return for their given level of risk. |
| | • | | Maintains a portfolio of high-quality bonds and diversifies among a large number of bonds to minimize the potential impact of default by any single issuer. |
IMPORTANT PERFORMANCE INFORMATION
Performance data shown represents past performance and is no guarantee of future results. Investment return and principal value will fluctuate so shares, when redeemed, may be worth more or less than their original cost. Current performance may be lower or higher than quoted. For performance current to the most recent month end, visit thornburg.com.
The maximum sales charge for the Limited Term Income Fund’s Class A shares is 1.50% . The total annual operating expenses of Class A shares are 1.04% . Thornburg Investment Management and Thornburg Securities Corporation have contractually agreed to waive fees and reimburse expenses through at least February 1, 2011, so that actual expenses do not exceed 0.99% .
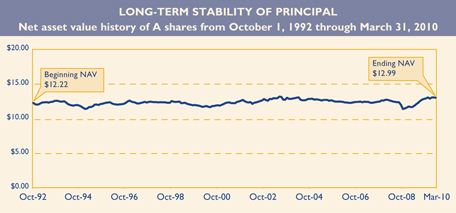
AVERAGE ANNUAL TOTAL RETURNS
For periods ended March 31, 2010
| | | | | | | | | | | | | | | |
| | | 1 Yr | | | 3 Yrs | | | 5 Yrs | | | 10 Yrs | | | Since
Inception | |
A Shares (Incep: 10/1/92) | | | | | | | | | | | | | | | |
Without sales charge | | 16.81 | % | | 6.34 | % | | 5.10 | % | | 5.60 | % | | 5.66 | % |
With sales charge | | 15.03 | % | | 5.80 | % | | 4.79 | % | | 5.44 | % | | 5.57 | % |
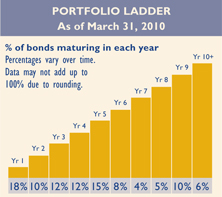
30-DAY YIELDS
As of March 31, 2010
| | | | | | |
| | | Annualized
Distribution Yield | | | SEC
Yield | |
A Shares | | 3.70 | % | | 2.75 | % |
Without fee waivers and expense reimbursements, the 30-day SEC yield would have been 2.75% and the Annualized Distribution Yield would have been 3.70% .
KEY PORTFOLIO ATTRIBUTES
As of March 31, 2010
| | |
Number of Bonds | | 332 |
Duration | | 3.6 Yrs |
Average Maturity | | 4.1 Yrs |
See the entire portfolio in the Schedule of Investments beginning on page 16.
6 This page is not part of the Semi-Annual Report.
THORNBURG LIMITED TERM INCOME FUND VERSUS
LIPPER MONEY MARKET FUNDS (TAXABLE) AVERAGE
Class A shares as of March 31, 2010
We often are asked to compare Thornburg Limited Term Income Fund to money market fund returns. Taxable bond funds are not an exact substitute for money market funds. These investments have certain differences, which are discussed below. Investors in Thornburg Limited Term Income Fund took more risk than money market fund investors to earn their higher returns.
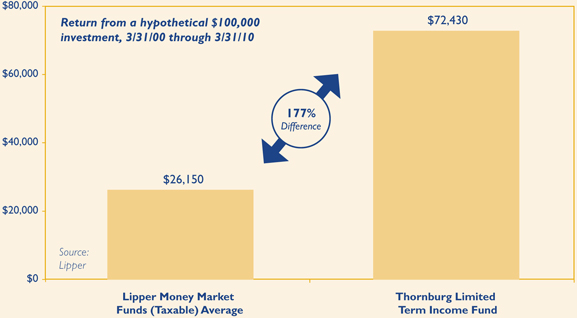
Past performance does not guarantee future results. Performance data above does not include the 1.50% sales charge for Class A shares. If the sales charge had been included, returns would have been lower. Returns shown are minus the initial investment.
Investors in taxable bond funds may experience more volatility than those in comparable money market funds. There are also differences in fees and expenses.
Investors in the Thornburg Limited Term Income Fund took more risk than money market investors to earn their higher returns, including interest rate and credit risk. Unlike money market funds, the prices of bonds fluctuate relative to changes in interest rates, with principal values decreasing when interest rates rise and increasing when interest rates fall. Generally, money market funds seek to maintain an investment portfolio with an average maturity of 90 days or less. Thornburg Limited Term Income Fund has an average maturity of normally less than five years. Interest dividends paid by the Fund or by taxable money market funds are generally subject to federal income tax and state income tax (except that income from U.S. Government Securities may be exempt from state income tax).
Money market funds seek to preserve the value per share at $1.00, whereas, the Thornburg Limited Term Income Fund’s net asset value changes daily. It is possible to lose money when investing in either the Thornburg Limited Term Income Fund or a taxable money market fund. Neither are insured by the FDIC or any other government agency.
Lipper Money Market Funds (Taxable) Average is an arithmetic average of the total return of all taxable money market mutual funds. You cannot invest in a category average.
This page is not part of the Semi-Annual Report. 7

Thornburg Limited Term Income Funds
March 31, 2010
Table of Contents
This report is certified under the Sarbanes-Oxley Act of 2002, which requires that public companies, including mutual funds, affirm that the information provided in their annual and semiannual shareholder reports fully and fairly represents their financial position.
8 Certified Semi-Annual Report
Letter to Shareholders
| | |
 | | April 22, 2010 Dear Fellow Shareholder: I am pleased to present the semi-annual report for the Thornburg Limited Term U.S. Government Fund and the Thornburg Limited Term Income Fund for the six-month period ended March 31, 2010. The net asset value of a Class A share of the Thornburg Limited Term U.S. Government Fund decreased 10 cents in the period to $13.68. If you were invested for the entire period, you received dividends of 22.6 cents per share. If you reinvested your dividends, you received 22.8 cents per share. The net asset value of a Class A share of the Thornburg Limited Term Income Fund increased 18 cents in the period to $12.99. If you were invested for the entire period, you received dividends of 27.5 cents per share. If you reinvested your dividends, you received 27.7 cents per share. Dividends per share were lower for Class B, C, and R3 shares and higher for Class I shares to account for varying class-specific expenses. Please examine the accompanying information for more details. The yields on U.S. Treasuries were volatile over the course of the past year, with general price depreciation in U.S. Treasuries driving returns in that sector. A much larger factor in the fixed income market generally, however, was a nearly uninterrupted tightening in spreads (the additional yield the market requires for investing in risky securities versus credit risk-less U.S. Treasuries) on all non-Treasury bond asset classes. The two-year U.S. Treasury moved from a 0.80% yield to a 1.02% yield over the course of the past year, while the ten-year U.S. Treasury moved from a 2.67% yield to a 3.83% yield. Credit spreads continued to tighten throughout the year after reaching their wide point in early December 2008 and revisiting similar levels early in March of 2009. As an example of the tightening in credit spreads, the Barclays Corporate Credit Index Option Adjusted Spread (or the difference between Treasuries and the average Investment Grade Corporate Bond) moved from 5.43% on March 31, 2009 to 1.50% one year later. The 30-year average of this index is 1.27%, to put these levels in perspective. In dramatic contrast to the late 2008/early 2009 time frame, non-Treasury fixed income had its best year on record. This nearly uninterrupted recovery has been a boon to us at Thornburg, as we moved the Limited Term Income Fund’s credit allocation (along with multiple other funds) to take advantage of unprecedented levels during the late 2008/early 2009 blowout. The Fund reached its prospectus maximum in BBB-rated securities (35%) at about this time and many of those holdings continue to provide significant income for our shareholders, although the BBB-rated allocation has been pared back recently to approximately 26% of the Fund as spreads have tightened. Even in the Thornburg Limited Term U.S. Government Fund, with its more restrictive purview, we took advantage of spread widening by significantly increasing the proportion of Government Sponsored Entity (GSE) mortgage debt, which was trading at levels that provided a notable income advantage versus U.S. Treasuries. |
Putting income and change in price together, the Class A shares of the Thornburg Limited Term U.S. Government Fund produced a total return of 1.37% return over the six-month period, assuming a beginning-of-period investment at the net asset value. The Barclays Capital Intermediate Government Bond Index produced a 0.70% total return over the same
Certified Semi-Annual Report 9
Letter to Shareholders,
Continued
time period. The average return for the Lipper Short-Intermediate U.S. Government Bond category was 1.29% . The Class A shares of the Thornburg Limited Term Income Fund produced a total return of 3.57% over the six-month period, assuming a beginning-of-period investment at the net asset value. The Barclays Intermediate Government/Credit Index produced a 1.85% total return over the same time period. The average return for the Lipper Short-Intermediate Investment Grade category was 2.84% . Both Barclays indices reflect no deduction for fees, expenses, or taxes.
The Funds kept their durations somewhat shorter than their benchmarks during much of the past year, and this benefited us from a pure interest rate risk perspective as U.S. Treasuries were some of the worst performing assets in the fixed income universe, with longer bonds performing the worst, given yield curve steepening. At the same time, Thornburg’s laddered portfolio strategy and prudent credit selection (within the Income Fund) clearly benefited the Fund. The Thornburg Limited Term Income portfolio maintained a high credit quality while moving to take advantage of some opportunities, particularly in corporate credits. I wrote a year ago (near to the worst of the storm) that we were able to purchase bonds which I believed “represent tremendous long-term value.” I did not at the time anticipate that all of the credit spread widening we had recently experienced would be reversed in just one year’s time, but that is indeed what occurred. The extraordinary total return environment that many fixed income asset classes experienced does not currently hold.
As a result, it is likely that the large positive returns in fixed income that were available in duration in 2008 (not that most noticed) and credit in 2009 (which everyone seemed to see) are very much gone for the time being. “Making” money in the sector will no longer be the order of the day; just “maintaining” that stored wealth will be as good as it gets. An eventual move by the Federal Reserve (the Fed) to higher rates (and an increased rate of return on cash) will only serve to reduce interest in longer term fixed income securities. As a result, investors are likely to move out of an asset class (at first slowly, and then perhaps with increasing alacrity) that they had only just rediscovered.
We believe this would be a mistake. Certainly, the fervor with which investors embraced fixed income in 2009 was overdone, but in the context of a failed cult of equity and an over-allocation to risk it was in many ways reasonable. More to the point, the reason that fixed income looked attractive was not because it offered wonderful positive returns but because it insulated investors from large negative ones. This is especially true with bond portfolios that offer a low correlation to equities (as do Thornburg’s core bond portfolios, such as the Limited Term Income Fund and the Limited Term U.S. Government Fund).
The recent volatility in the marketplace continues to underline the importance of high-quality bonds in your bond portfolio allocation. Both Thornburg Funds continue to perform even in an environment with nearly unprecedented movements in all asset classes. These periods of volatility have been relatively short in the past, and credit spreads have remained fairly well behaved. However, the past two years have shown that volatility is alive and well. Furthermore, the challenges to continued smooth economic and asset growth are significant. Though we have seen some better economic news of late, it is likely that the road to recovery will be long.
Thornburg Investment Management will continue to strive to give you, the bond investor, a consistent income stream and a set of funds which are not highly correlated to equity markets’ returns. The broad distribution of bond mutual fund returns in the past two years shows that those that reached for yield by taking incremental risk, for which
10 Certified Semi-Annual Report
they were not compensated, have suffered. In the following rally, those not nimble enough to take advantage of opportunities in the market did not benefit from a market recovery. In many cases, investors have been surprised by their fixed income allocation’s performance. We believe that the store of value in your bond portfolio should benefit you through economic cycles and we strive to invest with that in mind. In this environment, though low-quality fixed income can move in tandem with equities, the risk of holding extremely high-quality cash instruments or U.S. Treasuries alone, is also present, especially when one considers potential erosion of purchasing power due to potential long-run inflation. As a result, we continue to try to place capital preservation (in all senses of the term) at the top of the list of priorities for these core funds. While I don’t believe that yields will rise dramatically in the near term, given an outlook for slow economic growth trends, rest assured that we at Thornburg are very cognizant of that longer-term risk, and are preparing the portfolios accordingly.
No matter the direction of interest rates or credit spreads in the near term, we believe your Funds are well positioned to achieve their longer-term goals of principal stability and reasonable income. The Thornburg Limited Term U.S. Government Fund and the Thornburg Limited Term Income Fund are laddered portfolios of short-to-intermediate bonds. This balances duration and yield in a way which is designed to provide the best risk-adjusted bond returns over time.
As a final note, I am happy to have Lon Erickson join me as co-portfolio manager on the Thornburg Limited Term Income Fund. His input has been highly valuable over the course of the past couple of years, especially with regard to his corporate credit knowledge, and that input will no doubt continue to be valuable.
Thank you very much for investing in our Funds. We feel that the Thornburg Limited Term U.S. Government Fund and the Thornburg Limited Term Income Fund are appropriate investments for those looking for core bond investments. While we of course cannot guarantee future performance, Thornburg Investment Management will continue to strive to chart a steady course in what continues to be a volatile marketplace.
Sincerely,
| | | | |
| | |
 | |  | | |
| Jason H. Brady,CFA | | Lon Erickson,CFA | | |
| Co-Portfolio Manager | | Co-Portfolio Manager | | |
| Managing Director | | Managing Director | | |
The matters discussed in this report may constitute forward-looking statements made pursuant to the safe harbor provisions of the Securities Litigation Reform Act of 1995. These include any advisor or portfolio manager prediction, assessment, analysis or outlook for individual securities, industries, investment styles, market sectors and/or markets. These statements involve risks and uncertainties. In addition to the general risks described for each fund in its current prospectus, other factors bearing on these reports include the accuracy of the advisor’s or portfolio manager’s forecasts and predictions, the appropriateness of the investment strategies designed by the advisor or portfolio manager and the ability of the advisor or portfolio manager to implement their strategies efficiently and successfully. Any one or more of these factors, as well as other risks affecting the securities markets generally, could cause the actual results of any fund to differ materially as compared to its benchmarks.
Certified Semi-Annual Report 11
| | |
| SCHEDULE OF INVESTMENTS | | |
| |
| Thornburg Limited Term U.S. Government Fund | | March 31, 2010 (Unaudited) |
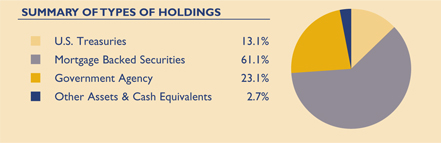
| | | | | | |
Issuer-Description | | Principal
Amount | | Value |
U.S. TREASURY SECURITIES — 13.17% | | | | | | |
United States Treasury Notes, 2.125%, 4/30/2010 | | $ | 5,000,000 | | $ | 5,008,106 |
United States Treasury Notes, 4.625%, 10/31/2011 | | | 2,000,000 | | | 2,121,680 |
United States Treasury Notes, 4.875%, 6/30/2012 | | | 4,000,000 | | | 4,331,562 |
United States Treasury Notes, 2.625%, 2/29/2016 | | | 2,000,000 | | | 1,966,016 |
United States Treasury Notes, 4.875%, 8/15/2016 | | | 5,000,000 | | | 5,541,601 |
United States Treasury Notes, 4.625%, 2/15/2017 | | | 4,000,000 | | | 4,358,906 |
United States Treasury Notes, 3.625%, 2/15/2020 | | | 1,000,000 | | | 983,047 |
United States Treasury Notes Inflationary Index, 2.00%, 7/15/2014 | | | 2,298,860 | | | 2,445,656 |
United States Treasury Notes Inflationary Index, 1.875%, 7/15/2015 | | | 4,455,560 | | | 4,714,456 |
United States Treasury Notes Inflationary Index, 2.00%, 1/15/2016 | | | 5,458,150 | | | 5,790,712 |
| | | | | | |
TOTAL U.S. TREASURY SECURITIES (Cost $35,601,055) | | | | | | 37,261,742 |
| | | | | | |
U.S. GOVERNMENT AGENCIES — 23.07% | | | | | | |
Federal Agricultural Mtg Corp., 6.71%, 7/28/2014 | | | 200,000 | | | 234,270 |
Federal Farm Credit Bank, 6.06%, 5/28/2013 | | | 240,000 | | | 270,936 |
Federal Farm Credit Bank, 3.98%, 1/22/2015 | | | 1,000,000 | | | 1,049,871 |
Federal Home Loan Bank, 4.125%, 8/13/2010 | | | 3,000,000 | | | 3,041,554 |
Federal Home Loan Bank, 5.375%, 6/13/2014 | | | 2,000,000 | | | 2,231,704 |
Federal Home Loan Bank, 5.00%, 12/8/2017 | | | 3,000,000 | | | 3,246,459 |
Federal Home Loan Bank, 2.25%, 3/26/2018 | | | 3,000,000 | | | 2,990,666 |
Federal Home Loan Mtg Corp., 4.50%, 1/15/2015 | | | 5,000,000 | | | 5,398,317 |
Federal Home Loan Mtg Corp., 5.50%, 3/28/2016 | | | 1,190,000 | | | 1,244,642 |
Federal Home Loan Mtg Corp., 4.875%, 6/13/2018 | | | 3,000,000 | | | 3,208,482 |
Federal Home Loan Mtg Corp., 5.50%, 7/15/2019 | | | 4,445,281 | | | 4,788,159 |
Federal National Mtg Assoc., 4.40%, 2/19/2015 | | | 1,585,000 | | | 1,696,462 |
Federal National Mtg Assoc., 2.00%, 3/26/2015 | | | 3,000,000 | | | 2,991,710 |
Federal National Mtg Assoc., 3.00%, 3/22/2018 | | | 3,000,000 | | | 2,968,596 |
Federal National Mtg Assoc., 3.00%, 3/16/2020 | | | 3,000,000 | | | 2,994,635 |
Federal National Mtg Assoc., 3.00%, 3/30/2020 | | | 3,000,000 | | | 3,001,883 |
aOverseas Private Investment Corp., 4.10%, 11/15/2014 | | | 1,252,800 | | | 1,312,308 |
Private Export Funding Corp., 5.685%, 5/15/2012 | | | 5,000,000 | | | 5,462,660 |
Private Export Funding Corp., 4.974%, 8/15/2013 | | | 2,700,000 | | | 2,949,410 |
Private Export Funding Corp., 5.45%, 9/15/2017 | | | 3,000,000 | | | 3,331,362 |
Small Business Administration Participation Certificates, Series 2007-20I Class 1, 5.56%, 9/1/2027 | | | 4,475,625 | | | 4,848,553 |
Tennessee Valley Authority, 4.75%, 8/1/2013 | | | 3,000,000 | | | 3,262,246 |
a,bU.S. Department of Transportation Headquarters, Series 2004 Class A-2, 5.594%, 12/7/2021 | | | 2,741,334 | | | 2,741,334 |
| | | | | | |
TOTAL U.S. GOVERNMENT AGENCIES (Cost $62,834,452) | | | | | | 65,266,219 |
| | | | | | |
12 Certified Semi-Annual Report
| | |
| SCHEDULE OF INVESTMENTS, CONTINUED | | |
| |
| Thornburg Limited Term U.S. Government Fund | | March 31, 2010 (Unaudited) |
| | | | | | |
Issuer-Description | | Principal
Amount | | Value |
MORTGAGE BACKED — 61.06% | | | | | | |
Federal Home Loan Mtg Corp., CMO Series 1321 Class TE, 7.00%, 8/15/2022 | | $ | 581,354 | | $ | 634,729 |
Federal Home Loan Mtg Corp., CMO Series 2420 Class MC, 6.00%, 2/15/2017 | | | 1,059,032 | | | 1,137,888 |
Federal Home Loan Mtg Corp., CMO Series 2509 Class TV, 5.50%, 4/15/2022 | | | 2,438,522 | | | 2,584,799 |
Federal Home Loan Mtg Corp., CMO Series 2527 Class BP, 5.00%, 11/15/2017 | | | 2,626,799 | | | 2,780,582 |
Federal Home Loan Mtg Corp., CMO Series 2553 Class GB, 5.00%, 1/15/2018 | | | 1,000,000 | | | 1,073,826 |
Federal Home Loan Mtg Corp., CMO Series 2622 Class PE, 4.50%, 5/15/2018 | | | 2,500,000 | | | 2,627,062 |
Federal Home Loan Mtg Corp., CMO Series 2628 Class AB, 4.50%, 6/15/2018 | | | 1,037,762 | | | 1,081,701 |
Federal Home Loan Mtg Corp., CMO Series 2628 Class DQ, 3.00%, 11/15/2017 | | | 526,180 | | | 535,062 |
Federal Home Loan Mtg Corp., CMO Series 2641 Class WE, 4.50%, 1/15/2033 | | | 680,815 | | | 710,479 |
Federal Home Loan Mtg Corp., CMO Series 2642 Class JE, 5.00%, 9/15/2032 | | | 2,000,000 | | | 2,124,806 |
Federal Home Loan Mtg Corp., CMO Series 2649 Class QH, 4.50%, 7/15/2018 | | | 1,000,000 | | | 1,057,608 |
Federal Home Loan Mtg Corp., CMO Series 2692 Class QD, 5.00%, 12/15/2022 | | | 2,575,000 | | | 2,728,383 |
Federal Home Loan Mtg Corp., CMO Series 2731 Class Vl, 5.50%, 12/15/2014 | | | 2,238,427 | | | 2,393,725 |
Federal Home Loan Mtg Corp., CMO Series 2744 Class JG, 5.00%, 8/15/2032 | | | 1,500,000 | | | 1,580,191 |
Federal Home Loan Mtg Corp., CMO Series 2764 Class UE, 5.00%, 10/15/2032 | | | 2,000,000 | | | 2,111,931 |
Federal Home Loan Mtg Corp., CMO Series 2770 Class UD, 4.50%, 5/15/2017 | | | 2,400,000 | | | 2,523,513 |
Federal Home Loan Mtg Corp., CMO Series 2802 Class NE, 5.00%, 2/15/2033 | | | 1,470,000 | | | 1,552,373 |
Federal Home Loan Mtg Corp., CMO Series 2814 Class GB, 5.00%, 6/15/2019 | | | 956,879 | | | 1,001,127 |
Federal Home Loan Mtg Corp., CMO Series 2825 Class VP, 5.50%, 6/15/2015 | | | 4,363,943 | | | 4,672,076 |
Federal Home Loan Mtg Corp., CMO Series 2834 Class VE, 5.50%, 7/15/2015 | | | 318,802 | | | 319,249 |
Federal Home Loan Mtg Corp., CMO Series 2901 Class UB, 5.00%, 3/15/2033 | | | 2,400,000 | | | 2,520,036 |
Federal Home Loan Mtg Corp., CMO Series 2943 Class HE, 5.00%, 3/15/2033 | | | 1,965,000 | | | 2,078,259 |
Federal Home Loan Mtg Corp., CMO Series 3020 Class VA, 5.50%, 11/15/2014 | | | 1,130,787 | | | 1,200,293 |
Federal Home Loan Mtg Corp., CMO Series 3054 Class DW, 5.50%, 5/15/2034 | | | 1,638,092 | | | 1,744,446 |
Federal Home Loan Mtg Corp., CMO Series 3067 Class PJ, 5.50%, 7/15/2031 | | | 3,000,000 | | | 3,182,513 |
Federal Home Loan Mtg Corp., CMO Series 3068 Class VA, 5.50%, 10/15/2016 | | | 1,344,209 | | | 1,404,963 |
Federal Home Loan Mtg Corp., CMO Series 3078 Class PC, 5.50%, 11/15/2030 | | | 2,250,000 | | | 2,387,132 |
Federal Home Loan Mtg Corp., CMO Series 3178 Class MC, 6.00%, 4/15/2032 | | | 5,275,000 | | | 5,515,437 |
Federal Home Loan Mtg Corp., CMO Series 3184 Class PC, 5.50%, 8/15/2032 | | | 5,535,000 | | | 5,815,251 |
Federal Home Loan Mtg Corp., CMO Series 3187 Class LA, 5.50%, 4/15/2031 | | | 1,995,297 | | | 2,053,166 |
Federal Home Loan Mtg Corp., CMO Series 3192 Class GB, 6.00%, 1/15/2031 | | | 1,000,000 | | | 1,030,864 |
Federal Home Loan Mtg Corp., CMO Series 3216 Class NA, 6.00%, 5/15/2028 | | | 612,634 | | | 613,016 |
Federal Home Loan Mtg Corp., CMO Series 3219 Class PD, 6.00%, 11/15/2035 | | | 3,000,000 | | | 3,236,645 |
Federal Home Loan Mtg Corp., CMO Series 3228 Class PC, 5.50%, 7/15/2030 | | | 5,000,000 | | | 5,059,744 |
Federal Home Loan Mtg Corp., CMO Series 3271 Class LU, 5.50%, 1/15/2018 | | | 2,530,913 | | | 2,702,784 |
Federal Home Loan Mtg Corp., CMO Series 3319 Class PA, 5.50%, 8/15/2030 | | | 571,676 | | | 593,469 |
Federal Home Loan Mtg Corp., CMO Series 3320 Class TC, 5.50%, 10/15/2032 | | | 2,000,000 | | | 2,122,293 |
Federal Home Loan Mtg Corp., CMO Series 3331 Class PB, 6.00%, 1/15/2031 | | | 2,000,000 | | | 2,108,534 |
Federal Home Loan Mtg Corp., CMO Series 3351 Class PK, 5.50%, 1/15/2032 | | | 3,000,000 | | | 3,167,002 |
Federal Home Loan Mtg Corp., CMO Series 3456 Class KV, 5.50%, 9/15/2017 | | | 2,540,906 | | | 2,718,884 |
Federal Home Loan Mtg Corp., CMO Series 3480 Class VA, 6.00%, 6/15/2019 | | | 2,672,460 | | | 2,900,140 |
Federal Home Loan Mtg Corp., CMO Series 3541 Class PA, 5.00%, 5/15/2039 | | | 1,805,346 | | | 1,918,787 |
Federal Home Loan Mtg Corp., CMO Series 3563 Class BC, 4.00%, 6/15/2022 | | | 1,799,434 | | | 1,863,296 |
Federal Home Loan Mtg Corp., CMO Series 3589 Class CA, 4.00%, 10/15/2021 | | | 1,916,042 | | | 1,979,960 |
Federal Home Loan Mtg Corp., CMO Series R003 Class VA, 5.50%, 8/15/2016 | | | 1,170,014 | | | 1,247,546 |
Federal Home Loan Mtg Corp., CMO Series R012 Class AB, 5.50%, 12/15/2020 | | | 1,781,702 | | | 1,855,614 |
Federal Home Loan Mtg Corp., Pool 1N1736, 5.355%, 4/1/2037 | | | 484,688 | | | 504,011 |
Federal Home Loan Mtg Corp., Pool 298107, 10.25%, 8/1/2017 | | | 20,384 | | | 23,412 |
Federal Home Loan Mtg Corp., Pool B14155, 3.50%, 5/1/2019 | | | 1,298,385 | | | 1,305,283 |
Federal Home Loan Mtg Corp., Pool C90041, 6.50%, 11/1/2013 | | | 11,256 | | | 11,869 |
Federal Home Loan Mtg Corp., Pool D37120, 7.00%, 7/1/2023 | | | 22,548 | | | 24,943 |
Certified Semi-Annual Report 13
| | |
| SCHEDULE OF INVESTMENTS, CONTINUED | | |
| |
| Thornburg Limited Term U.S. Government Fund | | March 31, 2010 (Unaudited) |
| | | | | | |
Issuer-Description | | Principal
Amount | | Value |
Federal Home Loan Mtg Corp., Pool G12140, 4.00%, 2/1/2020 | | $ | 1,014,102 | | $ | 1,052,092 |
Federal Home Loan Mtg Corp., REMIC Series 3626 Class AV, 5.50%, 10/15/2020 | | | 2,965,692 | | | 3,153,537 |
Federal National Mtg Assoc., CMO Series 1993-32 Class H, 6.00%, 3/25/2023 | | | 70,819 | | | 75,925 |
Federal National Mtg Assoc., CMO Series 2002-18 Class PC, 5.50%, 4/25/2017 | | | 1,272,853 | | | 1,335,526 |
Federal National Mtg Assoc., CMO Series 2003-15 Class CY, 5.00%, 3/25/2018 | | | 1,017,000 | | | 1,086,378 |
Federal National Mtg Assoc., CMO Series 2003-4 Class PE, 5.00%, 2/25/2018 | | | 2,330,000 | | | 2,492,908 |
Federal National Mtg Assoc., CMO Series 2003-44 Class CB, 4.25%, 3/25/2033 | | | 2,073,989 | | | 2,144,359 |
Federal National Mtg Assoc., CMO Series 2003-66 Class PA, 3.50%, 2/25/2033 | | | 651,557 | | | 663,374 |
Federal National Mtg Assoc., CMO Series 2003-9 Class DB, 5.00%, 2/25/2018 | | | 1,000,000 | | | 1,065,044 |
Federal National Mtg Assoc., CMO Series 2003-92 Class KH, 5.00%, 3/25/2032 | | | 2,000,000 | | | 2,108,383 |
Federal National Mtg Assoc., CMO Series 2004-2 Class QL, 4.00%, 2/25/2019 | | | 2,000,000 | | | 2,030,766 |
Federal National Mtg Assoc., CMO Series 2004-33 Class MW, 4.50%, 1/25/2030 | | | 2,897,000 | | | 3,043,229 |
Federal National Mtg Assoc., CMO Series 2004-35 Class CA, 4.00%, 12/25/2017 | | | 1,132,836 | | | 1,170,446 |
Federal National Mtg Assoc., CMO Series 2006-57 Class PC, 5.50%, 10/25/2032 | | | 1,780,000 | | | 1,910,478 |
Federal National Mtg Assoc., CMO Series 2006-78 Class MB, 5.50%, 7/25/2034 | | | 3,000,000 | | | 3,208,699 |
Federal National Mtg Assoc., CMO Series 2007-42 Class YA, 5.50%, 1/25/2036 | | | 1,879,360 | | | 1,972,643 |
Federal National Mtg Assoc., CMO Series 2007-60 Class VA, 6.00%, 12/25/2017 | | | 3,956,315 | | | 4,237,423 |
Federal National Mtg Assoc., CMO Series 2007-65 Class PB, 6.00%, 10/25/2032 | | | 2,916,000 | | | 3,096,460 |
Federal National Mtg Assoc., CMO Series 2007-79 Class MB, 5.50%, 12/25/2030 | | | 1,000,000 | | | 1,055,717 |
Federal National Mtg Assoc., CMO Series 2007-83 Class PA, 6.00%, 3/25/2029 | | | 1,151,510 | | | 1,186,733 |
Federal National Mtg Assoc., CMO Series 2008-54 Class EA, 5.00%, 7/25/2019 | | | 2,622,990 | | | 2,789,557 |
Federal National Mtg Assoc., CMO Series 2008-77 Class VA, 6.00%, 7/25/2019 | | | 3,604,478 | | | 3,907,408 |
Federal National Mtg Assoc., CMO Series 2009-52 Class AJ, 4.00%, 7/25/2024 | | | 2,540,288 | | | 2,626,853 |
Federal National Mtg Assoc., CMO Series 2009-70 Class NK, 4.50%, 8/25/2019 | | | 1,738,783 | | | 1,817,104 |
Federal National Mtg Assoc., CMO Series 2009-78 Class A, 4.50%, 8/25/2019 | | | 2,637,989 | | | 2,756,709 |
Federal National Mtg Assoc., Pool 044003, 8.00%, 6/1/2017 | | | 15,571 | | | 16,960 |
Federal National Mtg Assoc., Pool 050811, 7.50%, 12/1/2012 | | | 11,614 | | | 12,178 |
Federal National Mtg Assoc., Pool 050832, 7.50%, 6/1/2013 | | | 13,222 | | | 13,827 |
Federal National Mtg Assoc., Pool 076388, 9.25%, 9/1/2018 | | | 53,851 | | | 60,013 |
Federal National Mtg Assoc., Pool 190555, 7.00%, 1/1/2014 | | | 11,936 | | | 12,684 |
Federal National Mtg Assoc., Pool 250387, 7.00%, 11/1/2010 | | | 2,790 | | | 2,824 |
Federal National Mtg Assoc., Pool 251759, 6.00%, 5/1/2013 | | | 20,795 | | | 22,409 |
Federal National Mtg Assoc., Pool 252648, 6.50%, 5/1/2022 | | | 92,324 | | | 101,292 |
Federal National Mtg Assoc., Pool 334996, 7.00%, 2/1/2011 | | | 3,543 | | | 3,611 |
Federal National Mtg Assoc., Pool 342947, 7.25%, 4/1/2024 | | | 172,744 | | | 194,286 |
Federal National Mtg Assoc., Pool 384243, 6.10%, 10/1/2011 | | | 578,147 | | | 593,997 |
Federal National Mtg Assoc., Pool 406384, 8.25%, 12/1/2024 | | | 102,085 | | | 112,446 |
Federal National Mtg Assoc., Pool 443909, 6.50%, 9/1/2018 | | | 65,846 | | | 71,365 |
Federal National Mtg Assoc., Pool 516363, 5.00%, 3/1/2014 | | | 44,467 | | | 46,930 |
Federal National Mtg Assoc., Pool 555207, 7.00%, 11/1/2017 | | | 31,290 | | | 34,533 |
Federal National Mtg Assoc., Pool 895572, 5.722%, 6/1/2036 | | | 1,803,076 | | | 1,894,357 |
Federal National Mtg Assoc., Pool 930986, 4.50%, 4/1/2019 | | | 1,475,177 | | | 1,546,112 |
Federal National Mtg Assoc., REMIC Series 2002-59 Class B, 5.50%, 9/25/2017 | | | 1,444,169 | | | 1,540,268 |
Federal National Mtg Assoc., REMIC Series 2006-B1 Class AB, 6.00%, 6/25/2016 | | | 1,618,399 | | | 1,687,050 |
Federal National Mtg Assoc., REMIC Series 2008-3 Class VB, 5.00%, 10/25/2022 | | | 1,000,000 | | | 1,035,545 |
Federal National Mtg Assoc., REMIC Series 2008-86 Class PC, 5.00%, 3/25/2034 | | | 5,000,000 | | | 5,212,666 |
Government National Mtg Assoc., CMO Series 2008-56 Class CH, 5.00%, 5/20/2035 | | | 5,000,000 | | | 5,133,928 |
Government National Mtg Assoc., Pool 000623, 8.00%, 9/20/2016 | | | 22,570 | | | 24,360 |
Government National Mtg Assoc., Pool 003550, 5.00%, 5/20/2019 | | | 1,092,722 | | | 1,168,871 |
Government National Mtg Assoc., Pool 409921, 7.50%, 8/15/2010 | | | 704 | | | 710 |
Government National Mtg Assoc., Pool 410240, 7.00%, 12/15/2010 | | | 3,299 | | | 3,354 |
Government National Mtg Assoc., Pool 410271, 7.50%, 8/15/2010 | | | 1,987 | | | 2,005 |
14 Certified Semi-Annual Report
| | |
| SCHEDULE OF INVESTMENTS, CONTINUED | | |
| |
| Thornburg Limited Term U.S. Government Fund | | March 31, 2010 (Unaudited) |
| | | | | | |
Issuer-Description | | Principal
Amount | | Value |
Government National Mtg Assoc., Pool 410846, 7.00%, 12/15/2010 | | $ | 6,184 | | $ | 6,275 |
Government National Mtg Assoc., Pool 430150, 7.25%, 12/15/2026 | | | 28,579 | | | 31,897 |
Government National Mtg Assoc., Pool 453928, 7.00%, 7/15/2017 | | | 21,707 | | | 23,625 |
Government National Mtg Assoc., Pool 780448, 6.50%, 8/15/2011 | | | 12,601 | | | 12,913 |
| | | | | | |
TOTAL MORTGAGE BACKED (Cost $168,338,949) | | | | | | 172,731,744 |
| | | | | | |
SHORT TERM INVESTMENTS — 2.12% | | | | | | |
Federal Home Loan Bank, 0.04%, 4/13/2010 | | | 6,000,000 | | | 5,999,920 |
| | | | | | |
TOTAL SHORT TERM INVESTMENTS (Cost $5,999,920) | | | | | | 5,999,920 |
| | | | | | |
TOTAL INVESTMENTS — 99.42% (Cost $272,774,376) | | | | | $ | 281,259,625 |
OTHER ASSETS LESS LIABILITIES — 0.58% | | | | | | 1,631,445 |
| | | | | | |
NET ASSETS — 100.00% | | | | | $ | 282,891,070 |
| | | | | | |
Footnote Legend
| a | Security currently fair valued by the valuation and pricing committee using procedures approved by the Trustees. |
| b | Securities exempt from registration under Rule 144A of the Securities Act of 1933, as amended. These securities may only be resold in the ordinary course of business in transactions exempt from registration, normally to qualified institutional buyers. As of March 31, 2010, the aggregate value of these securities in the Fund’s portfolio was $2,741,334, representing 0.97% of the Fund’s net assets. |
Portfolio Abbreviations
To simplify the listings of securities, abbreviations are used per the table below:
| CMO | Collateralized Mortgage Obligation |
| REMIC | Real Estate Mortgage Investment Conduit |
Certified Semi-Annual Report 15
SCHEDULE OF INVESTMENTS
| | |
| Thornburg Limited Term Income Fund | | March 31, 2010 (Unaudited) |
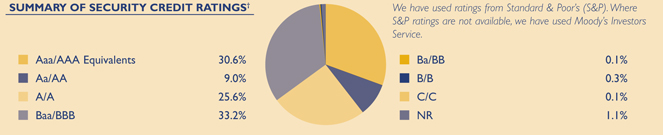
| | | | | | | | |
Issuer-Description | | Credit Rating†
S&P/Moody’s | | Principal
Amount | | Value |
U.S. TREASURY SECURITIES — 1.01% | | | | | | | | |
United States Treasury Notes, 5.125% due 5/15/2016 | | AAA/Aaa | | $ | 1,000,000 | | $ | 1,122,461 |
United States Treasury Notes, 4.875% due 8/15/2016 | | AAA/Aaa | | | 2,000,000 | | | 2,216,640 |
United States Treasury Notes, 3.00% due 2/28/2017 | | AAA/Aaa | | | 2,000,000 | | | 1,968,750 |
United States Treasury Notes, 3.625% due 2/15/2020 | | AAA/Aaa | | | 2,000,000 | | | 1,966,094 |
| | | | | | | | |
TOTAL U.S. TREASURY SECURITIES (Cost $7,041,864) | | | | | | | | 7,273,945 |
| | | | | | | | |
U.S. GOVERNMENT AGENCIES — 3.89% | | | | | | | | |
aAgribank FCB, 9.125% due 7/15/2019 | | A/NR | | | 4,470,000 | | | 5,085,340 |
Federal National Mtg Assoc., 7.00% due 3/1/2011 | | AAA/Aaa | | | 1,814 | | | 1,836 |
Federal National Mtg Assoc., 5.095% due 12/1/2011 | | AAA/Aaa | | | 117,051 | | | 121,154 |
Federal National Mtg Assoc., 7.491% due 8/1/2014 | | AAA/Aaa | | | 21,764 | | | 21,764 |
Federal National Mtg Assoc., 2.00% due 3/26/2015 | | AAA/Aaa | | | 3,000,000 | | | 2,991,710 |
Federal National Mtg Assoc., 3.00% due 3/22/2018 | | AAA/Aaa | | | 3,000,000 | | | 2,968,596 |
Federal National Mtg Assoc., 3.00% due 3/16/2020 | | AAA/Aaa | | | 3,000,000 | | | 2,994,635 |
Federal National Mtg Assoc., 3.00% due 3/30/2020 | | AAA/Aaa | | | 3,000,000 | | | 3,001,883 |
Private Export Funding Corp., 5.45% due 9/15/2017 | | AA+/Aaa | | | 3,000,000 | | | 3,331,363 |
Small Business Administration Participation Certificates, Series 2008-20D Class 1, 5.37% due 4/1/2028 | | NR/NR | | | 3,670,869 | | | 3,927,186 |
Small Business Administration, Series 2005-P10A Class 1, 4.638% due 2/10/2015 | | NR/NR | | | 1,144,908 | | | 1,199,412 |
a,bU.S. Department of Transportation Headquarters, Series 2004 Class A-2, 5.594% due 12/7/2021 | | A-/NR | | | 2,512,890 | | | 2,512,890 |
| | | | | | | | |
TOTAL U.S. GOVERNMENT AGENCIES (Cost $27,581,719) | | | | | | | | 28,157,769 |
| | | | | | | | |
OTHER GOVERNMENT — 0.81% | | | | | | | | |
a,cEmirate of Abu Dhabi, 5.50% due 4/8/2014 | | AA/Aa2 | | | 1,000,000 | | | 1,087,000 |
cNova Scotia Province Canada, 5.75% due 2/27/2012 | | A+/Aa2 | | | 500,000 | | | 538,269 |
cProvince of Ontario Canada, 4.10% due 6/16/2014 | | AA-/Aa1 | | | 4,000,000 | | | 4,221,202 |
| | | | | | | | |
TOTAL OTHER GOVERNMENT (Cost $5,490,679) | | | | | | | | 5,846,471 |
| | | | | | | | |
MORTGAGE BACKED — 19.17% | | | | | | | | |
Federal Home Loan Mtg Corp., CMO Series 2627 Class GY, 4.50% due 6/15/2018 | | AAA/Aaa | | | 5,000,000 | | | 5,227,770 |
Federal Home Loan Mtg Corp., CMO Series 2628 Class AB, 4.50% due 6/15/2018 | | AAA/Aaa | | | 1,556,643 | | | 1,622,552 |
Federal Home Loan Mtg Corp., CMO Series 2640 Class G, 4.50% due 7/15/2018 | | AAA/Aaa | | | 3,005,372 | | | 3,113,953 |
Federal Home Loan Mtg Corp., CMO Series 2654 Class OG, 5.00% due 2/15/2032 | | AAA/Aaa | | | 1,000,000 | | | 1,056,584 |
Federal Home Loan Mtg Corp., CMO Series 2682 Class JG, 4.50% due 10/15/2023 | | AAA/Aaa | | | 5,000,000 | | | 5,127,087 |
Federal Home Loan Mtg Corp., CMO Series 2738 Class QE, 5.00% due 7/15/2032 | | AAA/Aaa | | | 3,000,000 | | | 3,182,709 |
Federal Home Loan Mtg Corp., CMO Series 2778 Class JD, 5.00% due 12/15/2032 | | AAA/Aaa | | | 4,000,000 | | | 4,219,081 |
Federal Home Loan Mtg Corp., CMO Series 2780 Class VJ, 5.00% due 4/15/2015 | | AAA/Aaa | | | 1,323,380 | | | 1,401,343 |
Federal Home Loan Mtg Corp., CMO Series 2802 Class NE, 5.00% due 2/15/2033 | | AAA/Aaa | | | 1,042,000 | | | 1,100,390 |
Federal Home Loan Mtg Corp., CMO Series 2814 Class GB, 5.00% due 6/15/2019 | | AAA/Aaa | | | 956,879 | | | 1,001,127 |
Federal Home Loan Mtg Corp., CMO Series 2825 Class VP, 5.50% due 6/15/2015 | | AAA/Aaa | | | 1,513,795 | | | 1,620,682 |
16 Certified Semi-Annual Report
| | |
| SCHEDULE OF INVESTMENTS, CONTINUED | | |
| |
| Thornburg Limited Term Income Fund | | March 31, 2010 (Unaudited) |
| | | | | | | | |
Issuer-Description | | Credit Rating†
S&P/Moody’s | | Principal
Amount | | Value |
Federal Home Loan Mtg Corp., CMO Series 2902 Class QE, 5.50% due 6/15/2033 | | AAA/Aaa | | $ | 1,400,000 | | $ | 1,498,622 |
Federal Home Loan Mtg Corp., CMO Series 2915 Class KD, 5.00% due 9/15/2033 | | AAA/Aaa | | | 4,046,000 | | | 4,258,829 |
Federal Home Loan Mtg Corp., CMO Series 2943 Class BV, 5.00% due 3/15/2016 | | AAA/Aaa | | | 2,996,797 | | | 3,195,601 |
Federal Home Loan Mtg Corp., CMO Series 3054 Class DW, 5.50% due 5/15/2034 | | AAA/Aaa | | | 1,046,704 | | | 1,114,662 |
Federal Home Loan Mtg Corp., CMO Series 3083 Class U, 4.50% due 1/15/2017 | | AAA/Aaa | | | 3,360,338 | | | 3,523,511 |
Federal Home Loan Mtg Corp., CMO Series 3138 Class PC, 5.50% due 6/15/2032 | | AAA/Aaa | | | 5,000,000 | | | 5,282,247 |
Federal Home Loan Mtg Corp., CMO Series 3192 Class GB, 6.00% due 1/15/2031 | | AAA/Aaa | | | 2,000,000 | | | 2,061,727 |
Federal Home Loan Mtg Corp., CMO Series 3195 Class PD, 6.50% due 7/15/2036 | | AAA/Aaa | | | 5,300,000 | | | 5,801,104 |
Federal Home Loan Mtg Corp., CMO Series 3255 Class QB, 5.50% due 5/15/2029 | | AAA/Aaa | | | 3,000,000 | | | 3,101,283 |
Federal Home Loan Mtg Corp., CMO Series 3504 Class PC, 4.00% due 1/15/2039 | | AAA/Aaa | | | 2,142,758 | | | 2,207,992 |
Federal Home Loan Mtg Corp., CMO Series 3541 Class PA, 5.00% due 5/15/2039 | | AAA/Aaa | | | 2,708,018 | | | 2,878,180 |
Federal Home Loan Mtg Corp., CMO Series 3563 Class BC, 4.00% due 6/15/2022 | | AAA/Aaa | | | 3,598,868 | | | 3,726,592 |
Federal Home Loan Mtg Corp., CMO Series 3589 Class CA, 4.00% due 10/15/2021 | | AAA/Aaa | | | 2,874,064 | | | 2,969,940 |
Federal Home Loan Mtg Corp., Pool P10039, 5.00% due 4/1/2013 | | AAA/Aaa | | | 1,576,711 | | | 1,667,476 |
Federal Home Loan Mtg Corp., REMIC Series 3626 Class AV, 5.50% due 10/15/2020 | | AAA/Aaa | | | 4,942,820 | | | 5,255,894 |
Federal National Mtg Assoc., CMO Series 2003-4 Class PE, 5.00% due 2/25/2018 | | AAA/Aaa | | | 2,348,000 | | | 2,512,166 |
Federal National Mtg Assoc., CMO Series 2003-64 Class EC, 5.50% due 5/25/2030 | | AAA/Aaa | | | 132,985 | | | 134,111 |
Federal National Mtg Assoc., CMO Series 2003-74 Class KN, 4.50% due 8/25/2018 | | AAA/Aaa | | | 1,673,773 | | | 1,739,349 |
Federal National Mtg Assoc., CMO Series 2003-92 Class VG, 5.00% due 9/25/2014 | | AAA/Aaa | | | 927,650 | | | 981,472 |
Federal National Mtg Assoc., CMO Series 2004-33 Class MW, 4.50% due 1/25/2030 | | AAA/Aaa | | | 3,000,000 | | | 3,151,428 |
Federal National Mtg Assoc., CMO Series 2005-35 VG, 5.00% due 4/25/2016 | | AAA/Aaa | | | 1,319,601 | | | 1,400,273 |
Federal National Mtg Assoc., CMO Series 2005-48 Class AR, 5.50% due 2/25/2035 | | AAA/Aaa | | | 2,377,517 | | | 2,547,850 |
Federal National Mtg Assoc., CMO Series 2006-51 Class PB, 5.50% due 8/25/2033 | | AAA/Aaa | | | 3,000,000 | | | 3,204,530 |
Federal National Mtg Assoc., CMO Series 2007-26 Class VH, 5.50% due 2/25/2018 | | AAA/Aaa | | | 4,918,622 | | | 5,288,294 |
Federal National Mtg Assoc., CMO Series 2007-42 Class PA, 5.50% due 4/25/2037 | | AAA/Aaa | | | 3,840,457 | | | 4,051,545 |
Federal National Mtg Assoc., CMO Series 2007-65 Class PB, 6.00% due 10/25/2032 | | AAA/Aaa | | | 3,000,000 | | | 3,185,659 |
Federal National Mtg Assoc., CMO Series 2008-54 Class EA, 5.00% due 7/25/2019 | | AAA/Aaa | | | 3,497,319 | | | 3,750,020 |
Federal National Mtg Assoc., CMO Series 2009-5 Class A, 4.50% due 12/25/2023 | | AAA/Aaa | | | 7,959,805 | | | 8,356,258 |
Federal National Mtg Assoc., CMO Series 2009-52 Class AJ, 4.00% due 7/25/2024 | | AAA/Aaa | | | 4,233,814 | | | 4,378,089 |
Federal National Mtg Assoc., CMO Series 2009-65 Class GA, 4.50% due 11/25/2023 | | AAA/Aaa | | | 2,513,710 | | | 2,621,705 |
Federal National Mtg Assoc., CMO Series 2009-70 Class NK, 4.50% due 8/25/2019 | | AAA/Aaa | | | 4,346,958 | | | 4,573,815 |
Federal National Mtg Assoc., CMO Series 2009-70 Class PA, 5.00% due 8/25/2035 | | AAA/Aaa | | | 3,446,552 | | | 3,680,701 |
Federal National Mtg Assoc., Pool 357384, 4.50% due 5/1/2018 | | AAA/Aaa | | | 1,183,042 | | | 1,245,845 |
Government National Mtg Assoc., CMO Series 2009-68 Class DP, 4.50% due 11/16/2038 | | AAA/Aaa | | | 4,330,831 | | | 4,493,258 |
Government National Mtg Assoc., Pool 003007, 8.50% due 11/20/2015 | | AAA/Aaa | | | 18,280 | | | 19,838 |
Government National Mtg Assoc., Pool 827148, 4.375% due 2/20/2024 | | AAA/Aaa | | | 34,045 | | | 35,124 |
| | | | | | | | |
TOTAL MORTGAGE BACKED (Cost $137,861,062) | | | | | | | | 138,568,268 |
| | | | | | | | |
ASSET BACKED SECURITIES — 3.64% | | | | | | | | |
BANKS — 0.75% | | | | | | | | |
COMMERCIAL BANKS — 0.75% | | | | | | | | |
Wachovia Bank Commercial Mtg Trust, Series 2005-C21 Class A-4, 5.209% due 10/15/2044 | | AAA/Aaa | | | 5,000,000 | | | 5,159,184 |
Wells Fargo Asset Securities Corp., Series 2005-AR1 Class 1B1, 2.876% due 2/25/2035 | | B-/C | | | 991,727 | | | 144,664 |
Wells Fargo Asset Securities Corp., Series 2005-AR2 Class B1, 3.507% due 3/25/2035 | | NR/NR | | | 1,061,469 | | | 122,404 |
| | | | | | | | |
| | | | | | | | 5,426,252 |
| | | | | | | | |
CONSUMER SERVICES — 0.54% | | | | | | | | |
HOTELS, RESTAURANTS & LEISURE — 0.54% | | | | | | | | |
Dunkin 2006-1 Class A2, 5.779% due 6/20/2031 | | NR/NR | | | 4,000,000 | | | 3,883,240 |
| | | | | | | | |
| | | | | | | | 3,883,240 |
| | | | | | | | |
Certified Semi-Annual Report 17
| | |
| SCHEDULE OF INVESTMENTS, CONTINUED | | |
| |
| Thornburg Limited Term Income Fund | | March 31, 2010 (Unaudited) |
| | | | | | | | |
Issuer-Description | | Credit Rating†
S&P/Moody’s | | Principal
Amount | | Value |
DIVERSIFIED FINANCIALS — 2.35% | | | | | | | | |
CAPITAL MARKETS — 0.94% | | | | | | | | |
Bear Stearns Mtg., Series 2004-3 Class 1-A2, 4.106% due 7/25/2034 | | A+/Aa3 | | $ | 396,204 | | $ | 336,769 |
Commercial Mtg Pass-Through Certificates, Series 2001-J1A Class C, 6.83% due 2/14/2034 | | NR/Aaa | | | 3,500,000 | | | 3,603,428 |
aGS Mtg Securities Corp. II, Series 2001-ROCK, Class C, 6.878% due 5/3/2018 | | AAA/Aaa | | | 545,000 | | | 574,097 |
GSR Mtg Loan Trust, Series 2004-3F Class 2-A10, 17.198% due 2/25/2034 | | AAA/NR | | | 41,551 | | | 42,195 |
Merrill Lynch Mtg Investors, Series 2003 E Class B3, 1.746% due 10/25/2028 | | A+/A2 | | | 1,260,610 | | | 467,523 |
Merrill Lynch Mtg Investors, Series 2004 A4 Class M1, 3.115% due 8/25/2034 | | AA/NR | | | 874,547 | | | 354,673 |
Morgan Stanley Dean Witter Capital Trust, Series 2000 Xl-1345 Class C, 7.577% due 9/3/2015 | | NR/Aaa | | | 545,000 | | | 551,733 |
Morgan Stanley Dean Witter Capital Trust, Series 2001 Xl-280 Class C, 6.756% due 2/3/2016 | | NR/Aaa | | | 825,000 | | | 857,124 |
CONSUMER FINANCE — 0.41% | | | | | | | | |
a,bWorld Financial Network Series 2010-1A Class A, 4.16% due 9/15/2017 | | NR/NR | | | 3,000,000 | | | 3,000,000 |
DIVERSIFIED FINANCIAL SERVICES — 1.00% | | | | | | | | |
Banc America Mtg Securities, Inc., Series 2005 A Class B1 Floating Rate Note, 3.521% due 2/25/2035 | | NR/NR | | | 2,871,265 | | | 425,261 |
Citigroup Commercial Mtg Trust, Series 2004-HYB2 Class B1, 4.101% due 3/25/2034 | | AA/A1 | | | 492,823 | | | 194,834 |
Countrywide Home Loan, Series 2004 Class 1-A, 3.281% due 7/20/2034 | | AAA/Aa3 | | | 535,052 | | | 415,222 |
FNBC Trust, Series 1993 A, 8.08% due 1/5/2018 | | AA-/Aa3 | | | 1,009,540 | | | 1,029,520 |
JPMorgan Chase Commercial Mtg, Series 2004-C3 Class A-5, 4.878% due 1/15/2042 | | NR/Aaa | | | 5,000,000 | | | 5,154,707 |
| | | | | | | | |
| | | | | | | | 17,007,086 |
| | | | | | | | |
TOTAL ASSET BACKED SECURITIES (Cost $31,330,506) | | | | | | | | 26,316,578 |
| | | | | | | | |
CORPORATE BONDS — 51.12% | | | | | | | | |
AUTOMOBILES & COMPONENTS — 1.75% | | | | | | | | |
AUTOMOBILES — 1.75% | | | | | | | | |
aAmerican Honda Finance, 2.638% due 6/29/2011 | | A+/A1 | | | 3,500,000 | | | 3,568,471 |
aAmerican Honda Finance, 5.125% due 12/15/2010 | | A+/A1 | | | 1,500,000 | | | 1,544,952 |
aHarley Davidson Funding Corp., 6.80% due 6/15/2018 | | BBB/Baa1 | | | 2,500,000 | | | 2,496,100 |
cHyundai Capital Services, Inc., 6.00% due 5/5/2015 | | BBB/Baa2 | | | 4,000,000 | | | 4,197,424 |
Toyota Motor Credit Corp., 4.35% due 12/15/2010 | | AA/Aa1 | | | 800,000 | | | 819,031 |
| | | | | | | | |
| | | | | | | | 12,625,978 |
| | | | | | | | |
BANKS — 5.69% | | | | | | | | |
COMMERCIAL BANKS — 5.69% | | | | | | | | |
a,cANZ National International, 6.20% due 7/19/2013 | | AA/Aa2 | | | 1,000,000 | | | 1,102,045 |
Charter One Bank NA, 5.50% due 4/26/2011 | | A-/A2 | | | 1,750,000 | | | 1,793,185 |
a,cDanske Bank A/S, 3.75% due 4/1/2015 | | A/Aa3 | | | 4,000,000 | | | 3,974,820 |
a,cICICI Bank Ltd., 5.50% due 3/25/2015 | | BBB-/Baa2 | | | 5,000,000 | | | 5,073,590 |
National City Bank, 7.25% due 7/15/2010 | | A/NR | | | 2,000,000 | | | 2,025,054 |
National City Bank Floating Rate Note, 0.622% due 6/7/2017 | | A/A2 | | | 4,000,000 | | | 3,562,512 |
Nations Bank Corp., 7.23% due 8/15/2012 | | A/A2 | | | 250,000 | | | 271,372 |
North Fork Bancorp, Inc., 5.875% due 8/15/2012 | | BBB-/Baa2 | | | 2,000,000 | | | 2,099,428 |
a,cSantander Issuances, 6.50% due 8/11/2019 | | AA-/Aa3 | | | 5,000,000 | | | 5,237,210 |
Silicon Valley Bank, 5.70% due 6/1/2012 | | BBB+/A2 | | | 3,500,000 | | | 3,658,021 |
Silicon Valley Bank, 6.05% due 6/1/2017 | | BBB/A3 | | | 1,000,000 | | | 936,708 |
Sovereign Bank, 5.125% due 3/15/2013 | | A-/Baa1 | | | 4,000,000 | | | 4,100,168 |
Webster Bank, 5.875% due 1/15/2013 | | BBB-/Baa1 | | | 3,000,000 | | | 2,766,870 |
Whitney National Bank, 5.875% due 4/1/2017 | | BB+/Baa1 | | | 4,000,000 | | | 3,488,988 |
Zions Bancorp, 7.75% due 9/23/2014 | | BBB-/NR | | | 1,000,000 | | | 1,008,620 |
| | | | | | | | |
| | | | | | | | 41,098,591 |
| | | | | | | | |
18 Certified Semi-Annual Report
| | |
| SCHEDULE OF INVESTMENTS, CONTINUED | | |
| |
| Thornburg Limited Term Income Fund | | March 31, 2010 (Unaudited) |
| | | | | | | | |
Issuer-Description | | Credit Rating†
S&P/Moody’s | | Principal
Amount | | Value |
CAPITAL GOODS — 4.17% | | | | | | | | |
AEROSPACE & DEFENSE — 0.22% | | | | | | | | |
Boeing Co., 5.00% due 3/15/2014 | | A/A2 | | $ | 1,500,000 | | $ | 1,623,818 |
ELECTRICAL EQUIPMENT — 0.34% | | | | | | | | |
Emerson Electric Co., 5.75% due 11/1/2011 | | A/A2 | | | 800,000 | | | 859,261 |
Emerson Electric Co., 4.125% due 4/15/2015 | | A/A2 | | | 500,000 | | | 524,735 |
Hubbell, Inc., 6.375% due 5/15/2012 | | A/A3 | | | 1,000,000 | | | 1,075,382 |
INDUSTRIAL CONGLOMERATES — 1.48% | | | | | | | | |
General Electric Capital Corp., 4.875% due 10/21/2010 | | AA+/Aa2 | | | 2,500,000 | | | 2,552,973 |
General Electric Capital Corp. Floating Rate Note, 0.411% due 6/20/2014 | | AA+/Aa2 | | | 4,000,000 | | | 3,795,672 |
aSmiths Group plc, 6.05% due 5/15/2014 | | BBB+/Baa2 | | | 2,500,000 | | | 2,706,050 |
cTyco International Finance, 6.375% due 10/15/2011 | | BBB+/Baa1 | | | 1,500,000 | | | 1,616,145 |
MACHINERY — 2.13% | | | | | | | | |
Caterpillar Financial Services Corp., 5.85% due 9/1/2017 | | A/A2 | | | 1,500,000 | | | 1,625,982 |
Caterpillar Financial Services Corp. Floating Rate Note, 1.035% due 6/24/2011 | | A/A2 | | | 3,200,000 | | | 3,227,190 |
a,bGeneral American Railcar Corp., 6.69% due 9/20/2016 | | AA-/Ba3 | | | 150,295 | | | 137,929 |
cIngersoll-Rand Global Holding Co., 9.50% due 4/15/2014 | | BBB+/Baa1 | | | 500,000 | | | 606,268 |
aITW CUPIDS Finance Trust I, 6.55% due 12/31/2011 | | NR/A1 | | | 5,000,000 | | | 4,986,440 |
John Deere Capital Corp., 5.25% due 10/1/2012 | | A/A2 | | | 1,600,000 | | | 1,737,107 |
a,cVolvo Treasury AB, 5.95% due 4/1/2015 | | BBB-/Baa2 | | | 3,000,000 | | | 3,056,838 |
| | | | | | | | |
| | | | | | | | 30,131,790 |
| | | | | | | | |
COMMERCIAL & PROFESSIONAL SERVICES — 0.83% | | | | | | | | |
COMMERCIAL SERVICES & SUPPLIES — 0.83% | | | | | | | | |
Allied Waste North America, Inc., 6.875% due 6/1/2017 | | BBB/Baa3 | | | 4,000,000 | | | 4,360,000 |
Science Applications International Corp., 6.25% due 7/1/2012 | | A-/A3 | | | 1,000,000 | | | 1,094,840 |
Waste Management, Inc., 7.375% due 8/1/2010 | | BBB/Baa3 | | | 500,000 | | | 510,373 |
| | | | | | | | |
| | | | | | | | 5,965,213 |
| | | | | | | | |
CONSUMER DURABLES & APPAREL — 0.73% | | | | | | | | |
HOUSEHOLD DURABLES — 0.38% | | | | | | | | |
Fortune Brands, Inc., 6.375% due 6/15/2014 | | BBB-/Baa3 | | | 2,500,000 | | | 2,735,955 |
TEXTILES, APPAREL & LUXURY GOODS — 0.35% | | | | | | | | |
Nike, Inc., 5.15% due 10/15/2015 | | A+/A1 | | | 2,315,000 | | | 2,533,862 |
| | | | | | | | |
| | | | | | | | 5,269,817 |
| | | | | | | | |
DIVERSIFIED FINANCIALS — 6.58% | | | | | | | | |
CAPITAL MARKETS — 2.53% | | | | | | | | |
cAMVESCAP plc, 5.375% due 2/27/2013 (Guaranteed: Invesco Ltd.) | | BBB+/A3 | | | 5,606,000 | | | 5,807,194 |
Bear Stearns Co., Inc., 4.50% due 10/28/2010 | | A+/Aa3 | | | 3,000,000 | | | 3,068,613 |
d,eLehman Brothers Holdings, Inc., 5.625% due 1/24/2013 | | NR/NR | | | 1,300,000 | | | 305,500 |
a,cMacquarie Group Ltd., 6.00% due 1/14/2020 | | A-/A2 | | | 1,000,000 | | | 997,480 |
a,cMacquarie Group Ltd., 7.30% due 8/1/2014 | | A-/A2 | | | 3,000,000 | | | 3,349,836 |
a,cMacquarie Group Ltd., 7.625% due 8/13/2019 | | NR/NR | | | 1,000,000 | | | 1,116,204 |
Merrill Lynch & Co., Inc., 6.875% due 4/25/2018 | | A/A2 | | | 2,000,000 | | | 2,155,338 |
cNomura Holdings, Inc., 5.00% due 3/4/2015 | | BBB+/Baa2 | | | 1,500,000 | | | 1,533,322 |
CONSUMER FINANCE — 0.56% | | | | | | | | |
American Express Credit Corp., 5.875% due 5/2/2013 | | BBB+/A2 | | | 2,500,000 | | | 2,708,075 |
Capital One Bank, 6.50% due 6/13/2013 | | BBB/A3 | | | 300,000 | | | 327,946 |
Capital One Financial Corp., 5.70% due 9/15/2011 | | BBB/Baa1 | | | 950,000 | | | 992,891 |
DIVERSIFIED FINANCIAL SERVICES — 3.49% | | | | | | | | |
Bank of America Corp., 4.50% due 4/1/2015 | | A/A2 | | | 1,000,000 | | | 1,008,341 |
Bank of America Corp., 7.40% due 1/15/2011 | | A-/A3 | | | 1,500,000 | | | 1,569,594 |
Certified Semi-Annual Report 19
| | |
| SCHEDULE OF INVESTMENTS, CONTINUED | | |
| |
| Thornburg Limited Term Income Fund | | March 31, 2010 (Unaudited) |
| | | | | | | | |
Issuer-Description | | Credit Rating†
S&P/Moody’s | | Principal
Amount | | Value |
aBank of America Covered Bond Issuer, 5.50% due 6/14/2012 | | AAA/Aa2 | | $ | 3,000,000 | | $ | 3,202,590 |
aBank of America Institutional Series B, 7.70% due 12/31/2026 | | BB/Baa3 | | | 2,000,000 | | | 1,952,500 |
Citigroup, Inc., 6.125% due 5/15/2018 | | A/A3 | | | 500,000 | | | 510,894 |
Citigroup, Inc., 6.50% due 8/19/2013 | | A/A3 | | | 1,000,000 | | | 1,078,012 |
Citigroup, Inc., 5.00% due 9/15/2014 | | A-/Baa1 | | | 3,000,000 | | | 2,995,773 |
aCME Group Index Services, 4.40% due 3/15/2018 | | AA/Aa3 | | | 2,000,000 | | | 1,960,434 |
cExport Import Bank of Korea, 8.125% due 1/21/2014 | | A/A2 | | | 1,000,000 | | | 1,160,113 |
cKorea Development Bank, 0.391% due 4/6/2010 | | A/A2 | | | 500,000 | | | 500,000 |
cKorea Development Bank, 8.00% due 1/23/2014 | | A/A2 | | | 3,000,000 | | | 3,459,726 |
MBNA Corp., 6.125% due 3/1/2013 | | A/A2 | | | 1,000,000 | | | 1,073,915 |
a,cNational Agricultural Cooperative Federation, 5.00% due 9/30/2014 | | A/A2 | | | 2,000,000 | | | 2,072,192 |
National Rural Utilities CFC, 10.375% due 11/1/2018 | | A+/A1 | | | 2,000,000 | | | 2,660,132 |
| | | | | | | | |
| | | | | | | | 47,566,615 |
| | | | | | | | |
ENERGY — 4.61% | | | | | | | | |
ENERGY EQUIPMENT & SERVICES — 0.79% | | | | | | | | |
Detroit Edison Corporate Senior Note Series D, 5.40% due 8/1/2014 | | A-/A2 | | | 2,000,000 | | | 2,150,174 |
Nabors Inds, Inc., 9.25% due 1/15/2019 | | BBB+/Baa1 | | | 1,000,000 | | | 1,243,879 |
Rowan Companies, Inc., 7.875% due 8/1/2019 | | BBB-/Baa3 | | | 2,000,000 | | | 2,290,638 |
OIL, GAS & CONSUMABLE FUELS — 3.82% | | | | | | | | |
cBP Capital Markets plc, 3.875% due 3/10/2015 | | AA/Aa1 | | | 2,000,000 | | | 2,077,154 |
Conocophillips, 4.75% due 2/1/2014 | | A/A1 | | | 1,000,000 | | | 1,075,325 |
aDCP Midstream LLC, 9.75% due 3/15/2019 | | BBB/Baa2 | | | 1,500,000 | | | 1,922,965 |
Enbridge Energy Partners LP, 9.875% due 3/1/2019 | | BBB/Baa2 | | | 2,000,000 | | | 2,598,884 |
cEnbridge, Inc., 5.80% due 6/15/2014 | | A-/Baa1 | | | 2,000,000 | | | 2,204,012 |
Energy Transfer Partners LP, 9.00% due 4/15/2019 | | BBB-/Baa3 | | | 1,000,000 | | | 1,227,912 |
Energy Transfer Partners LP, 6.00% due 7/1/2013 | | BBB-/Baa3 | | | 1,000,000 | | | 1,081,013 |
Enterprise Products Participating LP, 7.50% due 2/1/2011 | | BBB-/Baa3 | | | 250,000 | | | 261,684 |
Murphy Oil Corp., 6.375% due 5/1/2012 | | BBB/Baa3 | | | 750,000 | | | 803,586 |
NuStar Logistics, 7.65% due 4/15/2018 | | BBB-/Baa3 | | | 3,000,000 | | | 3,370,449 |
Occidental Petroleum Corp., 7.00% due 11/1/2013 | | A/A2 | | | 1,000,000 | | | 1,158,345 |
cPetrobras International Finance Co., 7.875% due 3/15/2019 | | BBB-/Baa1 | | | 1,500,000 | | | 1,754,337 |
Phillips Petroleum Co., 9.375% due 2/15/2011 | | A/A1 | | | 900,000 | | | 963,397 |
Phillips Petroleum Co., 8.75% due 5/25/2010 | | A/A1 | | | 250,000 | | | 252,933 |
Sunoco Logistics Partner, 8.75% due 2/15/2014 | | BBB/Baa2 | | | 500,000 | | | 579,842 |
a,cWoodside Finance Ltd., 8.125% due 3/1/2014 | | A-/Baa1 | | | 1,500,000 | | | 1,717,944 |
a,cWoodside Finance Ltd., 8.75% due 3/1/2019 | | A-/Baa1 | | | 2,500,000 | | | 3,069,075 |
a,cWoodside Finance Ltd., 4.50% due 11/10/2014 | | A-/Baa1 | | | 1,500,000 | | | 1,536,840 |
| | | | | | | | |
| | | | | | | | 33,340,388 |
| | | | | | | | |
FOOD, BEVERAGE & TOBACCO — 2.80% | | | | | | | | |
BEVERAGES — 1.42% | | | | | | | | |
Anheuser Busch Cos., Inc., 4.375% due 1/15/2013 | | BBB+/Baa2 | | | 2,000,000 | | | 2,107,174 |
Anheuser Busch Cos., Inc., 4.70% due 4/15/2012 | | BBB+/Baa2 | | | 1,000,000 | | | 1,057,454 |
a,cBacardi Ltd., 7.45% due 4/1/2014 | | BBB/Baa1 | | | 2,500,000 | | | 2,858,417 |
a,cBacardi Ltd., 8.20% due 4/1/2019 | | BBB/Baa1 | | | 1,500,000 | | | 1,797,923 |
Coca Cola Co., 5.75% due 3/15/2011 | | A+/Aa3 | | | 200,000 | | | 209,351 |
a,cSabmiller plc, 6.50% due 7/15/2018 | | BBB+/Baa1 | | | 2,000,000 | | | 2,218,234 |
FOOD PRODUCTS — 0.30% | | | | | | | | |
Conagra, Inc., 7.875% due 9/15/2010 | | BBB/Baa2 | | | 11,000 | | | 11,342 |
General Mills, 5.20% due 3/17/2015 | | BBB+/Baa1 | | | 1,000,000 | | | 1,085,578 |
Kraft Foods, Inc., 6.00% due 2/11/2013 | | BBB-/Baa2 | | | 1,000,000 | | | 1,097,554 |
20 Certified Semi-Annual Report
| | |
| SCHEDULE OF INVESTMENTS, CONTINUED | | |
| |
| Thornburg Limited Term Income Fund | | March 31, 2010 (Unaudited) |
| | | | | | | | |
Issuer-Description | | Credit Rating†
S&P/Moody’s | | Principal
Amount | | Value |
TOBACCO — 1.08% | | | | | | | | |
Altria Group, Inc., 8.50% due 11/10/2013 | | BBB/Baa1 | | $ | 1,000,000 | | $ | 1,168,888 |
Altria Group, Inc., 9.70% due 11/10/2018 | | BBB/Baa1 | | | 1,000,000 | | | 1,229,629 |
Lorillard Tobacco Co., 8.125% due 6/23/2019 | | BBB-/Baa2 | | | 4,000,000 | | | 4,406,788 |
UST, Inc., 5.75% due 3/1/2018 | | BBB/Baa1 | | | 1,000,000 | | | 988,825 |
| | | | | | | | |
| | | | | | | | 20,237,157 |
| | | | | | | | |
HEALTH CARE EQUIPMENT & SERVICES — 0.45% | | | | | | | | |
HEALTH CARE PROVIDERS & SERVICES — 0.45% | | | | | | | | |
McKesson Corp., 6.50% due 2/15/2014 | | A-/Baa3 | | | 1,000,000 | | | 1,116,936 |
UnitedHealth Group, Inc., 6.00% due 2/15/2018 | | A-/Baa1 | | | 1,000,000 | | | 1,067,697 |
Wellpoint, Inc., 6.00% due 2/15/2014 | | A-/Baa1 | | | 1,000,000 | | | 1,099,327 |
| | | | | | | | |
| | | | | | | | 3,283,960 |
| | | | | | | | |
HOTELS RESTAURANTS & LEISURE — 0.57% | | | | | | | | |
HOTELS, RESTAURANTS & LEISURE — 0.57% | | | | | | | | |
aHyatt Hotels Corps., 5.75% due 8/15/2015 | | BBB/Baa1 | | | 2,500,000 | | | 2,551,430 |
a,cTDIC Finance Ltd., 6.50% due 7/2/2014 | | AA/A1 | | | 1,500,000 | | | 1,604,325 |
| | | | | | | | |
| | | | | | | | 4,155,755 |
| | | | | | | | |
INSURANCE — 4.50% | | | | | | | | |
INSURANCE — 4.50% | | | | | | | | |
aGenworth Life Institutional Fund, 5.875% due 5/3/2013 | | A/A2 | | | 1,000,000 | | | 1,020,508 |
Hartford Financial Services Group, Inc., 4.625% due 7/15/2013 | | BBB/Baa3 | | | 1,000,000 | | | 1,035,269 |
International Lease Finance Corp., 5.00% due 9/15/2012 | | BB+/B1 | | | 2,000,000 | | | 1,921,934 |
aLiberty Mutual Group, Inc., 5.75% due 3/15/2014 | | BBB-/Baa2 | | | 1,000,000 | | | 1,046,705 |
Lincoln National Corp., 4.75% due 2/15/2014 | | A-/Baa2 | | | 1,000,000 | | | 1,021,364 |
aNorthwind Holdings LLC, Series 2007-1A Class A1 Floating Rate Bond, 1.032% due 12/1/2037 (Insured: MBIA) | | NR/NR | | | 5,879,281 | | | 4,878,804 |
aPacific Life Global Funding CPI Floating Rate Note, 4.90% due 2/6/2016 | | AA-/A1 | | | 8,000,000 | | | 7,569,440 |
aPrincipal Life Global Funding, 4.40% due 10/1/2010 | | A+/Aa3 | | | 4,000,000 | | | 4,058,048 |
a,cQBE Insurance Group Ltd., 5.647% due 7/1/2023 | | BBB+/Baa1 | | | 1,500,000 | | | 1,397,539 |
Torchmark, Corp., 9.25% due 6/15/2019 | | A/Baa1 | | | 4,000,000 | | | 4,790,912 |
Transatlantic Holdings, Inc., 5.75% due 12/14/2015 | | BBB+/Baa1 | | | 3,000,000 | | | 3,060,870 |
UnumProvident Corp., 7.625% due 3/1/2011 | | BBB-/Ba1 | | | 691,000 | | | 719,074 |
| | | | | | | | |
| | | | | | | | 32,520,467 |
| | | | | | | | |
MATERIALS — 1.88% | | | | | | | | |
CHEMICALS — 0.97% | | | | | | | | |
aChevron Phillips Chemical, 7.00% due 6/15/2014 | | BBB/Baa1 | | | 4,000,000 | | | 4,506,236 |
aChevron Phillips Chemical, 7.00% due 3/15/2011 | | BBB/Baa1 | | | 500,000 | | | 524,996 |
E.I. du Pont de Nemours & Co., 4.125% due 3/6/2013 | | A/A2 | | | 325,000 | | | 341,735 |
E.I. du Pont de Nemours & Co., 5.00% due 1/15/2013 | | A/A2 | | | 1,000,000 | | | 1,079,794 |
cPotash Corp. of Saskatchewan, 5.25% due 5/15/2014 | | A-/Baa1 | | | 500,000 | | | 540,550 |
CONSTRUCTION MATERIALS — 0.75% | | | | | | | | |
CRH America, Inc., 8.125% due 7/15/2018 | | BBB+/Baa1 | | | 2,000,000 | | | 2,355,204 |
a,cHolcim US Finance, 6.00% due 12/30/2019 (Guaranteed: Holcim Ltd.) | | BBB/Baa2 | | | 1,500,000 | | | 1,557,742 |
Martin Marietta Materials, Inc., 0.399% due 4/30/2010 | | BBB+/Baa3 | | | 1,500,000 | | | 1,498,278 |
METALS & MINING — 0.16% | | | | | | | | |
a,cAnglo American Capital, 9.375% due 4/8/2014 | | BBB/Baa1 | | | 1,000,000 | | | 1,201,221 |
| | | | | | | | |
| | | | | | | | 13,605,756 |
| | | | | | | | |
Certified Semi-Annual Report 21
| | |
| SCHEDULE OF INVESTMENTS, CONTINUED | | |
| |
| Thornburg Limited Term Income Fund | | March 31, 2010 (Unaudited) |
| | | | | | | | |
Issuer-Description | | Credit Rating†
S&P/Moody’s | | Principal
Amount | | Value |
MEDIA — 1.17% | | | | | | | | |
MEDIA — 1.17% | | | | | | | | |
Comcast Corp., 6.30% due 11/15/2017 | | BBB+/Baa1 | | $ | 1,000,000 | | $ | 1,101,767 |
cThomson Reuters Corp., 5.95% due 7/15/2013 | | A-/Baa1 | | | 2,000,000 | | | 2,210,342 |
Time Warner Cable, Inc., 7.50% due 4/1/2014 | | BBB/Baa2 | | | 1,500,000 | | | 1,731,681 |
Time Warner Cable, Inc., 5.40% due 7/2/2012 | | BBB/Baa2 | | | 3,000,000 | | | 3,220,503 |
Time Warner Co., Inc., 8.05% due 1/15/2016 | | BBB/Baa2 | | | 200,000 | | | 229,600 |
| | | | | | | | |
| | | | | | | | 8,493,893 |
| | | | | | | | |
PHARMACEUTICALS, BIOTECHNOLOGY & LIFE SCIENCES — 0.70% | | | | | | | | |
PHARMACEUTICALS — 0.70% | | | | | | | | |
Abbott Labs, 3.75% due 3/15/2011 | | AA/A1 | | | 500,000 | | | 512,961 |
Pfizer, Inc., 5.35% due 3/15/2015 | | AA/A1 | | | 2,500,000 | | | 2,754,638 |
Tiers Inflation Linked Trust Series Wyeth 2004-21 Trust Certificate CPI Floating Rate Note, 4.476% due 2/1/2014 | | AA/A1 | | | 2,000,000 | | | 1,768,140 |
| | | | | | | | |
| | | | | | | | 5,035,739 |
| | | | | | | | |
REAL ESTATE — 0.14% | | | | | | | | |
REAL ESTATE INVESTMENT TRUSTS — 0.14% | | | | | | | | |
aDigital Reality Trust LP, 5.875% due 2/1/2020 | | BBB/Baa2 | | | 1,000,000 | | | 977,830 |
| | | | | | | | |
| | | | | | | | 977,830 |
| | | | | | | | |
RETAILING — 0.86% | | | | | | | | |
SPECIALTY RETAIL — 0.86% | | | | | | | | |
Best Buy Co., Inc., 6.75% due 7/15/2013 | | BBB-/Baa2 | | | 2,500,000 | | | 2,798,187 |
Staples, Inc., 7.75% due 4/1/2011 | | BBB/Baa2 | | | 1,500,000 | | | 1,591,590 |
Staples, Inc., 9.75% due 1/15/2014 | | BBB/Baa2 | | | 1,500,000 | | | 1,818,495 |
| | | | | | | | |
| | | | | | | | 6,208,272 |
| | | | | | | | |
SEMICONDUCTORS & SEMICONDUCTOR EQUIPMENT — 1.00% | | | | | | | | |
SEMICONDUCTORS & SEMICONDUCTOR EQUIPMENT — 1.00% | | | | | | | | |
KLA Tencor Corp. Senior Note, 6.90% due 5/1/2018 | | BBB/Baa1 | | | 3,000,000 | | | 3,254,322 |
National Semiconductor Corp. Senior Note, 0.507% due 6/15/2010 | | BB+/Baa1 | | | 4,000,000 | | | 3,995,288 |
| | | | | | | | |
| | | | | | | | 7,249,610 |
| | | | | | | | |
SOFTWARE & SERVICES — 0.46% | | | | | | | | |
INFORMATION TECHNOLOGY SERVICES — 0.46% | | | | | | | | |
Computer Sciences Corp., 5.50% due 3/15/2013 | | A-/Baa1 | | | 1,000,000 | | | 1,074,129 |
Electronic Data Systems Corp., 6.00% due 8/1/2013 | | A/A2 | | | 1,000,000 | | | 1,118,615 |
Western Union Co., 6.50% due 2/26/2014 | | A-/A3 | | | 1,000,000 | | | 1,127,746 |
| | | | | | | | |
| | | | | | | | 3,320,490 |
| | | | | | | | |
TECHNOLOGY HARDWARE & EQUIPMENT — 0.08% | | | | | | | | |
COMPUTERS & PERIPHERALS — 0.08% | | | | | | | | |
Dell, Inc., 5.625% due 4/15/2014 | | A-/A2 | | | 500,000 | | | 550,208 |
| | | | | | | | |
| | | | | | | | 550,208 |
| | | | | | | | |
TELECOMMUNICATION SERVICES — 2.14% | | | | | | | | |
DIVERSIFIED TELECOMMUNICATION SERVICES — 2.14% | | | | | | | | |
AT&T, Inc., 4.85% due 2/15/2014 | | A/A2 | | | 1,000,000 | | | 1,073,688 |
AT&T, Inc., 5.80% due 2/15/2019 | | A/A2 | | | 750,000 | | | 801,710 |
Cellco Partnership, 3.75% due 5/20/2011 | | A/A2 | | | 1,000,000 | | | 1,031,128 |
22 Certified Semi-Annual Report
| | |
| SCHEDULE OF INVESTMENTS, CONTINUED | | |
| |
| Thornburg Limited Term Income Fund | | March 31, 2010 (Unaudited) |
| | | | | | | | |
Issuer-Description | | Credit Rating†
S&P/Moody’s | | Principal
Amount | | Value |
Cellco Partnership Floating Rate Note, 2.851% due 5/20/2011 | | A/A2 | | $ | 2,000,000 | | $ | 2,058,262 |
cDeutsche Telekom International Finance, 6.75% due 8/20/2018 | | BBB+/Baa1 | | | 2,000,000 | | | 2,240,814 |
Michigan Bell Telephone Co., 7.85% due 1/15/2022 | | A/NR | | | 3,000,000 | | | 3,427,059 |
a,cQtel International Finance Ltd., 6.50% due 6/10/2014 | | A-/A1 | | | 1,000,000 | | | 1,085,224 |
cTelecom Italia Capital SA, 6.175% due 6/18/2014 | | BBB/Baa2 | | | 3,000,000 | | | 3,206,685 |
Verizon Communications, Inc., 6.10% due 4/15/2018 | | A/A3 | | | 500,000 | | | 546,936 |
| | | | | | | | |
| | | | | | | | 15,471,506 |
| | | | | | | | |
TRANSPORTATION — 0.46% | | | | | | | | |
AIR FREIGHT & LOGISTICS — 0.07% | | | | | | | | |
FedEx Corp., 8.76% due 5/22/2015 | | BBB/Baa1 | | | 455,875 | | | 513,689 |
AIRLINES — 0.02% | | | | | | | | |
Continental Airlines Series 1997-4 Class 4-A, 6.90% due 1/2/2018 | | BBB+/Baa2 | | | 144,726 | | | 145,811 |
ROAD & RAIL — 0.37% | | | | | | | | |
GATX Corp., 4.75% due 5/15/2015 | | BBB+/Baa1 | | | 1,000,000 | | | 992,531 |
Ryder System, Inc., 7.20% due 9/1/2015 | | BBB+/Baa1 | | | 1,500,000 | | | 1,688,061 |
| | | | | | | | |
| | | | | | | | 3,340,092 |
| | | | | | | | |
UTILITIES — 9.55% | | | | | | | | |
ELECTRIC UTILITIES — 5.16% | | | | | | | | |
Aquila, Inc., 7.95% due 2/1/2011 | | BBB/Baa3 | | | 1,500,000 | | | 1,576,584 |
Arizona Public Service Co., 8.75% due 3/1/2019 | | BBB-/Baa2 | | | 1,000,000 | | | 1,211,888 |
Centerpoint Energy, 7.00% due 3/1/2014 | | BBB+/Baa1 | | | 2,000,000 | | | 2,271,958 |
Commonwealth Edison Co., 4.74% due 8/15/2010 | | A-/Baa1 | | | 975,000 | | | 989,420 |
Commonwealth Edison Co., 6.15% due 3/15/2012 | | A-/Baa1 | | | 910,000 | | | 985,662 |
a,cE. ON International Finance BV, 5.80% due 4/30/2018 (Guaranteed: E. ON AG) | | A/A2 | | | 2,000,000 | | | 2,162,526 |
a,cElectricite de France SA, 5.50% due 1/26/2014 | | A+/Aa3 | | | 1,250,000 | | | 1,372,396 |
Entergy Gulf States, Inc., 5.70% due 6/1/2015 | | BBB+/Baa1 | | | 2,300,000 | | | 2,306,265 |
Entergy Texas, Inc., 7.125% due 2/1/2019 | | BBB+/Baa2 | | | 1,500,000 | | | 1,682,145 |
aGreat River Energy Series 2007-A, 5.829% due 7/1/2017 (Insured: Natl-Re) | | AAA/A2 | | | 3,784,988 | | | 4,179,498 |
Gulf Power Co., 4.35% due 7/15/2013 | | A/A2 | | | 925,000 | | | 973,123 |
Idaho Power Corp., 6.025% due 7/15/2018 | | A-/A3 | | | 1,000,000 | | | 1,066,090 |
Illinois Power Co., 9.75% due 11/15/2018 | | BBB/Baa1 | | | 2,000,000 | | | 2,563,288 |
a,cKorea Southern Power Co., 5.375% due 4/18/2013 | | A/A1 | | | 1,000,000 | | | 1,061,673 |
Metropolitan Edison Co., 7.70% due 1/15/2019 | | BBB-/Baa2 | | | 2,250,000 | | | 2,619,092 |
MP Environmental, 4.982% due 7/1/2014 | | AAA/Aaa | | | 3,206,652 | | | 3,296,183 |
Oglethorpe Power Corp., 6.10% due 3/15/2019 | | A/A3 | | | 2,500,000 | | | 2,718,225 |
PPL Energy Supply LLC, 6.50% due 5/1/2018 | | BBB/Baa2 | | | 1,000,000 | | | 1,065,552 |
Toledo Edison Co., 7.25% due 5/1/2020 | | BBB/Baa1 | | | 1,000,000 | | | 1,156,268 |
cTransAlta Corp., 4.75% due 1/15/2015 | | BBB/Baa2 | | | 2,000,000 | | | 2,065,378 |
GAS UTILITIES — 0.63% | | | | | | | | |
Kaneb Pipe Line Operating Partners, 5.875% due 6/1/2013 | | BBB-/Baa3 | | | 2,000,000 | | | 2,138,952 |
aMaritimes & North East Pipeline, 7.50% due 5/31/2014 | | BBB/Baa3 | | | 1,961,800 | | | 2,146,052 |
Southern California Gas Co., 4.375% due 1/15/2011 | | NR/Aa3 | | | 225,000 | | | 231,552 |
MULTI-UTILITIES — 3.76% | | | | | | | | |
Ameren Energy Generating Co., 7.00% due 4/15/2018 | | BBB-/Baa3 | | | 2,000,000 | | | 2,134,652 |
Dominion Resources, Inc., 8.875% due 1/15/2019 | | A-/Baa2 | | | 1,000,000 | | | 1,261,581 |
aEnogex LLC, 6.875% due 7/15/2014 | | BBB+/Baa3 | | | 4,000,000 | | | 4,283,480 |
aEnogex LLC, 6.25% due 3/15/2020 | | BBB+/Baa3 | | | 2,500,000 | | | 2,484,737 |
Northern States Power Co., 4.75% due 8/1/2010 | | A/A1 | | | 2,825,000 | | | 2,864,635 |
aPower Receivables Financing LLC, 6.29% due 1/1/2012 | | NR/NR | | | 3,723,893 | | | 3,821,422 |
Sempra Energy, 6.50% due 6/1/2016 | | BBB+/Baa1 | | | 500,000 | | | 558,593 |
Southern California Edison Co., 5.75% due 3/15/2014 | | A/A1 | | | 500,000 | | | 555,464 |
Certified Semi-Annual Report 23
| | |
| SCHEDULE OF INVESTMENTS, CONTINUED | | |
| |
| Thornburg Limited Term Income Fund | | March 31, 2010 (Unaudited) |
| | | | | | | | |
Issuer-Description | | Credit Rating†
S&P/Moody’s | | Principal
Amount | | Value |
a,cTaqa Abu Dhabi National Energy Co., 6.60% due 8/1/2013 | | NR/A3 | | $ | 5,000,000 | | $ | 5,316,205 |
Union Electric Co., 6.70% due 2/1/2019 | | BBB/A3 | | | 500,000 | | | 553,102 |
Union Electric Co., 4.65% due 10/1/2013 | | BBB/A3 | | | 2,000,000 | | | 2,113,274 |
Wisconsin Public Service Corp., 6.125% due 8/1/2011 | | A/A1 | | | 1,150,000 | | | 1,218,826 |
| | | | | | | | |
| | | | | | | | 69,005,741 |
| | | | | | | | |
TOTAL CORPORATE BONDS (Cost $345,396,961) | | | | | | | | 369,454,868 |
| | | | | | | | |
MUNICIPAL BONDS — 11.32% | | | | | | | | |
American Campus Properties Student Housing, 7.38% due 9/1/2012 (Insured: Natl-Re) | | A/Baa1 | | | 1,860,000 | | | 1,888,384 |
American Fork City Utah Sales, 4.89% due 3/1/2012 (Insured: AGM) | | AAA/Aa3 | | | 300,000 | | | 316,800 |
American Fork City Utah Sales, 5.07% due 3/1/2013 (Insured: AGM) | | AAA/Aa3 | | | 120,000 | | | 128,104 |
Anaheim California Public Financing Authority, 5.316% due 9/1/2017 (Insured: Natl Re/FGIC) | | A/A3 | | | 2,365,000 | | | 2,230,975 |
Anaheim California Public Financing Authority, 5.486% due 9/1/2020 (Insured: Natl-Re/FGIC) | | A/A3 | | | 3,270,000 | | | 2,889,666 |
Brentwood California Infrastructure Financing Authority, 6.16% due 10/1/2019 | | AA-/NR | | | 2,110,000 | | | 2,169,544 |
Brockton Massachusetts Taxable Economic Development, 6.45% due 5/1/2017 (Insured: FGIC) | | A/A2 | | | 130,000 | | | 131,808 |
Canadian County Oklahoma Educational Facilities Authority, 4.253% due 9/1/2014 | | A+/NR | | | 3,000,000 | | | 3,097,830 |
Cleveland Cuyahoga County Ohio, 6.10% due 5/15/2013 | | NR/NR | | | 805,000 | | | 804,952 |
Connecticut Housing Finance Authority, 5.071% due 11/15/2019 | | AAA/Aaa | | | 4,220,000 | | | 4,444,926 |
Cook County Illinois School District 083, 4.625% due 12/1/2010 (Insured: AGM) | | NR/Aa3 | | | 250,000 | | | 256,960 |
Cook County Illinois School District 083, 4.875% due 12/1/2011 (Insured: AGM) | | NR/Aa3 | | | 150,000 | | | 160,012 |
Florida Capital Improvement Revenue, 5.477% due 7/1/2017 (FAU Finance Corp.) | | NR/A2 | | | 1,400,000 | | | 1,425,508 |
Florida Capital Improvement Revenue, 5.899% due 7/1/2018 (FAU Finance Corp.) | | NR/A2 | | | 1,000,000 | | | 1,024,080 |
Florida State Board of Education, 3.60% due 6/1/2015 | | AAA/Aa1 | | | 3,000,000 | | | 3,061,800 |
Granite City Madison County, 4.875% due 5/1/2027 (Waste Management) | | BBB/NR | | | 1,000,000 | | | 1,001,740 |
Green Bay Wisconsin, 4.875% due 4/1/2011 (Insured: Natl-Re) | | NR/Aa2 | | | 365,000 | | | 377,370 |
Hancock County Mississippi, 4.80% due 8/1/2010 (Insured: Natl-Re) | | NR/A3 | | | 245,000 | | | 247,504 |
Hancock County Mississippi, 4.90% due 8/1/2011 (Insured: Natl-Re) | | NR/A3 | | | 315,000 | | | 317,961 |
Hanover Pennsylvania Area School District Notes, 4.47% due 3/15/2013 (Insured: AGM) | | AAA/Aa3 | | | 1,385,000 | | | 1,476,479 |
Jefferson County Texas Navigation Refunding, 5.50% due 5/1/2010 (Insured: AGM) | | NR/Aa3 | | | 210,000 | | | 210,859 |
Los Angeles California Department of Airports, 5.175% due 5/15/2017 | | AA-/A1 | | | 4,000,000 | | | 4,034,600 |
Louisiana Public Facilities Authority, 5.72% due 7/1/2015 (Insured: CIFG) | | BBB-/Baa3 | | | 2,370,000 | | | 2,198,649 |
Maine Finance Authority Waste Motor Oil, 4.55% due 10/1/2014 | | A/NR | | | 1,855,000 | | | 1,912,431 |
aMidwest Family Housing, 5.168% due 7/1/2016 (Insured: CIFG) | | NR/NR | | | 1,470,000 | | | 1,277,092 |
Mississippi Development Bank Special Obligation, 5.21% due 7/1/2013 (Insured: AGM) | | AAA/NR | | | 1,200,000 | | | 1,300,620 |
Missouri State Development Finance Board, 5.45% due 3/1/2011 (Crackerneck Creek) | | A/NR | | | 1,090,000 | | | 1,128,422 |
Montgomery County Maryland Revenue Authority, 5.00% due 2/15/2012 | | AA+/Aa2 | | | 100,000 | | | 106,145 |
New Jersey Health Care Facilities Financing, 10.75% due 7/1/2010 (ETM) | | NR/NR | | | 110,000 | | | 112,296 |
New Jersey Health Care Facilities Financing, 7.70% due 7/1/2011 (Insured: Connie Lee) | | NR/NR | | | 50,000 | | | 51,811 |
New Mexico Mtg Finance Authority, 5.77% due 1/1/2016 (GNMA/FNMA/FHLMC) | | AAA/NR | | | 865,000 | | | 907,074 |
New Mexico Mtg Finance Authority, 5.00% due 7/1/2025 | | AAA/NR | | | 940,000 | | | 922,178 |
New Rochelle New York Industrial Development Agency, 7.15% due 10/1/2014 (LOC: Bank of New York) | | NR/Aaa | | | 275,000 | | | 286,058 |
New York State Urban Development Corp., 4.75% due 12/15/2011 | | AAA/NR | | | 1,400,000 | | | 1,477,700 |
Newark New Jersey, 4.70% due 4/1/2011 (Insured: Natl-Re) | | NR/A1 | | | 845,000 | | | 847,653 |
Newark New Jersey, 4.90% due 4/1/2012 (Insured: Natl-Re) | | NR/A1 | | | 1,225,000 | | | 1,222,305 |
Niagara Falls New York Public Water, 4.30% due 7/15/2010 (Insured: Natl-Re) | | A/Baa1 | | | 360,000 | | | 362,117 |
North Carolina Eastern Municipal Power, 4.43% due 1/1/2014 | | A-/Baa1 | | | 2,000,000 | | | 2,047,760 |
Oakland California Redevelopment Agency, 8.00% due 9/1/2016 | | A-/NR | | | 4,200,000 | | | 4,273,038 |
Ohio Housing Financing Agency Mtg, 5.20% due 9/1/2014 (GNMA/FNMA) | | NR/Aaa | | | 2,395,000 | | | 2,558,483 |
Ohio State Solid Waste, 4.25% due 4/1/2033 (Republic Services) | | BBB/NR | | | 1,000,000 | | | 999,270 |
Ohio State Taxable Development Assistance, 4.88% due 10/1/2011 (Insured: Natl-Re) | | AA/Aa3 | | | 550,000 | | | 576,048 |
Pasadena California Pension Funding, 7.33% due 5/15/2022 | | AA+/NR | | | 2,000,000 | | | 2,239,920 |
Pennsylvania Economic Development, 4.70% due 11/1/2021 (Waste Management) | | BBB/NR | | | 2,250,000 | | | 2,384,887 |
24 Certified Semi-Annual Report
| | |
| SCHEDULE OF INVESTMENTS, CONTINUED | | |
| |
| Thornburg Limited Term Income Fund | | March 31, 2010 (Unaudited) |
| | | | | | | | |
Issuer-Description | | Credit Rating†
S&P/Moody’s | | Principal
Amount | | Value |
Redlands California Redevelopment Agency, 5.818% due 8/1/2022 (Insured: AMBAC) | | A-/NR | | $ | 2,715,000 | | $ | 2,353,335 |
Riverside California Sewer Revenue, 5.61% due 8/1/2017 | | AA/A1 | | | 2,000,000 | | | 2,095,480 |
San Francisco California City and County Redevelopment Financing Authority, 8.00% due | | | | | | | | |
8/1/2019 | | A/A2 | | | 5,000,000 | | | 5,341,250 |
San Luis Obispo County California, 7.45% due 9/1/2019 | | AA-/NR | | | 3,450,000 | | | 3,766,744 |
Springfield Ohio City School District Tax Anticipation Notes, 6.35% due 12/1/2010 (Insured: | | | | | | | | |
AMBAC) | | NR/NR | | | 1,400,000 | | | 1,432,746 |
Springfield Ohio City School District Tax Anticipation Notes, 6.40% due 12/1/2011 (Insured: | | | | | | | | |
AMBAC) | | NR/NR | | | 1,500,000 | | | 1,574,130 |
Tazewell County Illinois Community High School, 5.20% due 12/1/2011 (Insured: AGM) | | NR/Aa3 | | | 355,000 | | | 378,015 |
Tennessee State Taxable, 6.00% due 2/1/2013 | | AA+/Aa1 | | | 500,000 | | | 535,480 |
Texas Tech University, 6.00% due 8/15/2011 (Insured: Natl-Re) | | AA/Aa3 | | | 245,000 | | | 259,026 |
Victor New York, 9.20% due 5/1/2014 | | NR/NR | | | 905,000 | | | 926,919 |
Wisconsin State General Revenue, 4.80% due 5/1/2013 (Insured: AGM) | | AAA/Aa3 | | | 200,000 | | | 215,788 |
Wisconsin State Health and Educational Facilities, 7.08% due 6/1/2016 (Insured: ACA) | | NR/NR | | | 2,320,000 | | | 2,033,457 |
| | | | | | | | |
TOTAL MUNICIPAL BONDS (Cost $80,687,912) | | | | | | | | 81,802,189 |
| | | | | | | | |
SHORT TERM INVESTMENTS — 7.35% | | | | | | | | |
Chicago GO, 0.32% due 1/1/2040 put 4/1/2010 (Insured: AGM/SPA-Dexia ) (weekly demand notes) | | AAA/Aa3 | | | 6,000,000 | | | 6,000,000 |
Interstate Power and Light, 0.25% due 4/1/2010 | | NR/NR | | | 23,000,000 | | | 23,000,000 |
Vulcan Materials Co., 0.25% due 4/1/2010 | | NR/NR | | | 24,100,000 | | | 24,100,000 |
| | | | | | | | |
TOTAL SHORT TERM INVESTMENTS (Cost $53,100,000) | | | | | | | | 53,100,000 |
| | | | | | | | |
TOTAL INVESTMENTS — 98.31% (Cost $688,490,703) | | | | | | | $ | 710,520,088 |
OTHER ASSETS LESS LIABILITIES — 1.69% | | | | | | | | 12,245,656 |
| | | | | | | | |
NET ASSETS — 100.00% | | | | | | | $ | 722,765,744 |
| | | | | | | | |
Footnote Legend
| a | Securities exempt from registration under Rule 144A of the Securities Act of 1933, as amended. These securities may only be resold in the ordinary course of business in transactions exempt from registration, normally to qualified institutional buyers. As of March 31, 2010, the aggregate value of these securities in the Fund’s portfolio was $138,001,535, representing 19.09% of the Fund’s net assets. |
| b | Security currently fair valued by the valuation and pricing committee using procedures approved by the Trustees. |
| c | Yankee Bond – Denominated in U.S. dollars and is publicly issued in the U.S. by foreign banks and corporations. |
Portfolio Abbreviations
To simplify the listings of securities, abbreviations are used per the table below:
| | |
| ACA | | Insured by American Capital Access |
| AGM | | Insured by Assured Guaranty Municipal Corp. |
| AMBAC | | Insured by American Municipal Bond Assurance Corp. |
| CIFG | | Insured by CIFG Assurance North America Inc. |
| CMO | | Collateralized Mortgage Obligation |
| CPI | | Consumer Price Index |
| Cupids | | Cumulative Undivided Preferred Interests In Debt Securities |
| ETM | | Escrowed to Maturity |
| FCB | | Farm Credit Bank |
| FGIC | | Insured by Financial Guaranty Insurance Co. |
| FHLMC | | Insured by Federal Home Loan Mortgage Corp. |
| FNMA | | Collateralized by Federal National Mortgage Association |
| GNMA | | Insured by Government National Mortgage Co. |
| GO | | General Obligation |
| LOC | | Letter of Credit |
| MBIA | | Insured by Municipal Bond Investors Assurance |
| Mtg | | Mortgage |
| Natl-Re | | Insured by National Public Finance Guarantee Corp. |
| REMIC | | Real Estate Mortgage Investment Conduit |
See notes to financial statements.
Certified Semi-Annual Report 25
| | |
| STATEMENTS OF ASSETS AND LIABILITIES | | |
| |
| Thornburg Limited Term Income Funds | | March 31, 2010 (Unaudited) |
| | | | | | | |
| | | Thornburg Limited
Term U.S.
Government Fund | | Thornburg Limited
Term Income
Fund | |
ASSETS | | | | | | | |
Investments at value (cost $272,774,376 and $688,490,703) (Note 2) | | $ | 281,259,625 | | $ | 710,520,088 | |
Cash | | | 48,827 | | | 210,630 | |
Receivable for investments sold | | | — | | | 1,345,000 | |
Principal receivable | | | 416,514 | | | — | |
Receivable for fund shares sold | | | 1,346,103 | | | 6,249,880 | |
Interest receivable | | | 1,409,683 | | | 6,999,551 | |
Prepaid expenses and other assets | | | 440,989 | | | 290,448 | |
| | | | | | | |
Total Assets | | | 284,921,741 | | | 725,615,597 | |
| | | | | | | |
| | |
LIABILITIES | | | | | | | |
Payable for fund shares redeemed | | | 1,312,900 | | | 1,652,264 | |
Payable to investment advisor and other affiliates (Note 3) | | | 192,291 | | | 484,427 | |
Accounts payable and accrued expenses | | | 348,433 | | | 217,893 | |
Dividends payable | | | 177,047 | | | 495,269 | |
| | | | | | | |
Total Liabilities | | | 2,030,671 | | | 2,849,853 | |
| | | | | | | |
| | |
NET ASSETS | | $ | 282,891,070 | | $ | 722,765,744 | |
| | | | | | | |
NET ASSETS CONSIST OF: | | | | | | | |
Undistributed (distribution in excess of) net investment income | | $ | 23,159 | | $ | (44,795 | ) |
Net unrealized appreciation on investments | | | 8,485,249 | | | 22,029,385 | |
Accumulated net realized gain (loss) | | | 2,464 | | | (989,628 | ) |
Net capital paid in on shares of beneficial interest | | | 274,380,198 | | | 701,770,782 | |
| | | | | | | |
| | $ | 282,891,070 | | $ | 722,765,744 | |
| | | | | | | |
26 Certified Semi-Annual Report
| | |
| STATEMENTS OF ASSETS AND LIABILITIES, CONTINUED |
| |
| Thornburg Limited Term Income Funds | | March 31, 2010 (Unaudited) |
| | | | | | |
| | | Thornburg Limited
Term U.S.
Government Fund | | Thornburg Limited
Term Income
Fund |
NET ASSET VALUE: | | | | | | |
Class A Shares: | | | | | | |
Net asset value and redemption price per share ($155,726,268 and $333,127,323 applicable to 11,382,568 and 25,652,534 shares of beneficial interest outstanding - Note 4) | | $ | 13.68 | | $ | 12.99 |
Maximum sales charge, 1.50% of offering price | | | 0.21 | | | 0.20 |
| | | | | | |
Maximum offering price per share | | $ | 13.89 | | $ | 13.19 |
| | | | | | |
| | |
Class B Shares: | | | | | | |
Net asset value and offering price per share * ($4,672,172 applicable to 342,279 shares of beneficial interest outstanding - Note 4) | | $ | 13.65 | | $ | — |
| | | | | | |
| | |
Class C Shares: | | | | | | |
Net asset value and offering price per share * ($82,556,993 and $170,784,514 applicable to 5,998,052 and 13,172,657 shares of beneficial interest outstanding - Note 4) | | $ | 13.76 | | $ | 12.97 |
| | | | | | |
| | |
Class I Shares: | | | | | | |
Net asset value, offering and redemption price per share ($30,756,575 and $204,760,729 applicable to 2,248,335 and 15,764,868 shares of beneficial interest outstanding - Note 4) | | $ | 13.68 | | $ | 12.99 |
| | | | | | |
Class R3 Shares: | | | | | | |
Net asset value, offering and redemption price per share ($9,179,062 and $14,093,178 applicable to 670,571 and 1,084,525 shares of beneficial interest outstanding - Note 4) | | $ | 13.69 | | $ | 12.99 |
| | | | | | |
| * | Redemption price per share is equal to net asset value less any applicable contingent deferred sales charge. |
See notes to financial statements.
Certified Semi-Annual Report 27
| | |
| STATEMENTS OF OPERATIONS | | |
| |
| Thornburg Limited Term Income Funds | | Six Months Ended March 31, 2010 (Unaudited) |
| | | | | | | | |
| | | Thornburg Limited
Term U.S.
Government Fund | | | Thornburg Limited
Term Income
Fund | |
INVESTMENT INCOME: | | | | | | | | |
Interest income (net of premium amortized of $362,319) | | $ | 5,458,951 | | | $ | 15,927,379 | |
| | | | | | | | |
| | |
EXPENSES: | | | | | | | | |
Investment advisory fees (Note 3) | | | 509,801 | | | | 1,496,514 | |
Administration fees (Note 3) | | | | | | | | |
Class A Shares | | | 93,246 | | | | 177,870 | |
Class B Shares | | | 3,294 | | | | — | |
Class C Shares | | | 50,942 | | | | 87,401 | |
Class I Shares | | | 6,827 | | | | 43,199 | |
Class R3 Shares | | | 5,385 | | | | 7,804 | |
Distribution and service fees (Note 3) | | | | | | | | |
Class A Shares | | | 186,491 | | | | 355,740 | |
Class B Shares | | | 26,228 | | | | — | |
Class C Shares | | | 408,476 | | | | 709,204 | |
Class R3 Shares | | | 21,613 | | | | 31,423 | |
Transfer agent fees | | | | | | | | |
Class A Shares | | | 65,188 | | | | 96,659 | |
Class B Shares | | | 5,855 | | | | — | |
Class C Shares | | | 48,165 | | | | 55,720 | |
Class I Shares | | | 9,333 | | | | 35,056 | |
Class R3 Shares | | | 2,415 | | | | 3,651 | |
Registration and filing fees | | | | | | | | |
Class A Shares | | | 11,396 | | | | 18,069 | |
Class B Shares | | | 7,935 | | | | — | |
Class C Shares | | | 8,817 | | | | 13,771 | |
Class I Shares | | | 8,222 | | | | 9,306 | |
Class R3 Shares | | | 8,563 | | | | 9,104 | |
Custodian fees (Note 3) | | | 43,927 | | | | 55,108 | |
Professional fees | | | 19,341 | | | | 20,677 | |
Accounting fees | | | 6,040 | | | | 10,915 | |
Trustee fees | | | 3,618 | | | | 7,770 | |
Other expenses | | | 18,059 | | | | 29,212 | |
| | | | | | | | |
Total Expenses | | | 1,579,177 | | | | 3,274,173 | |
Less: | | | | | | | | |
Expenses reimbursed by investment advisor (Note 3) | | | (14,295 | ) | | | (41,488 | ) |
Distribution fees waived (Note 3) | | | (204,238 | ) | | | (354,602 | ) |
Fees paid indirectly (Note 3) | | | (2,234 | ) | | | (68 | ) |
| | | | | | | | |
Net Expenses | | | 1,358,410 | | | | 2,878,015 | |
| | | | | | | | |
Net Investment Income | | $ | 4,100,541 | | | $ | 13,049,364 | |
| | | | | | | | |
28 Certified Semi-Annual Report
| | |
| STATEMENTS OF OPERATIONS, CONTINUED | | |
| |
| Thornburg Limited Term Income Funds | | Six Months Ended March 31, 2010 (Unaudited) |
| | | | | | | |
| | | Thornburg Limited
Term U.S.
Government Fund | | | Thornburg Limited
Term Income
Fund |
REALIZED AND UNREALIZED GAIN (LOSS) | | | | | | | |
Net realized gain (loss) on investments | | $ | 2,503 | | | $ | 2,507,244 |
Net change in unrealized appreciation (depreciation) of investments | | | (641,121 | ) | | | 5,075,532 |
| | | | | | | |
Net Realized and Unrealized Gain (Loss) | | | (638,618 | ) | | | 7,582,776 |
| | | | | | | |
Net Increase in Net Assets Resulting From Operations | | $ | 3,461,923 | | | $ | 20,632,140 |
| | | | | | | |
See notes to financial statements.
Certified Semi-Annual Report 29
| | |
| STATEMENTS OF CHANGES IN NET ASSETS | | |
| |
| Thornburg Limited Term U.S. Government Fund | | |
| | | | | | | | |
| | | Six Months Ended
March 31, 2010* | | | Year Ended
September 30, 2009 | |
INCREASE (DECREASE) IN NET ASSETS FROM: | | | | | | | | |
| | |
OPERATIONS: | | | | | | | | |
Net investment income | | $ | 4,100,541 | | | $ | 8,107,838 | |
Net realized gain (loss) on investments | | | 2,503 | | | | 3,084,641 | |
Increase (decrease) in unrealized appreciation (depreciation) of investments | | | (641,121 | ) | | | 7,426,220 | |
| | | | | | | | |
| | |
Net Increase (Decrease) in Net Assets Resulting from Operations | | | 3,461,923 | | | | 18,618,699 | |
| | |
DIVIDENDS TO SHAREHOLDERS: | | | | | | | | |
From net investment income | | | | | | | | |
Class A Shares | | | (2,461,056 | ) | | | (4,723,163 | ) |
Class B Shares | | | (56,245 | ) | | | (135,559 | ) |
Class C Shares | | | (1,227,452 | ) | | | (2,517,507 | ) |
Class I Shares | | | (491,709 | ) | | | (773,676 | ) |
Class R3 Shares | | | (139,079 | ) | | | (226,391 | ) |
From realized gains | | | | | | | | |
Class A Shares | | | (656,646 | ) | | | — | |
Class B Shares | | | (24,928 | ) | | | — | |
Class C Shares | | | (362,681 | ) | | | — | |
Class I Shares | | | (121,390 | ) | | | — | |
Class R3 Shares | | | (36,510 | ) | | | — | |
| | |
FUND SHARE TRANSACTIONS (NOTE 4): | | | | | | | | |
Class A Shares | | | 14,016,145 | | | | 13,712,593 | |
Class B Shares | | | (1,242,122 | ) | | | 559,853 | |
Class C Shares | | | 3,138,004 | | | | 12,728,762 | |
Class I Shares | | | 6,098,620 | | | | 2,724,836 | |
Class R3 Shares | | | 1,622,887 | | | | 992,513 | |
| | | | | | | | |
| | |
Net Increase in Net Assets | | | 21,517,761 | | | | 40,960,960 | |
| | |
NET ASSETS: | | | | | | | | |
Beginning of Period | | | 261,373,309 | | | | 220,412,349 | |
| | | | | | | | |
| | |
End of Period | | $ | 282,891,070 | | | $ | 261,373,309 | |
| | | | | | | | |
| | |
Undistributed net investment income | | $ | 23,159 | | | $ | 298,519 | |
See notes to financial statements.
30 Certified Semi-Annual Report
| | |
| STATEMENTS OF CHANGES IN NET ASSETS | | |
| |
| Thornburg Limited Term Income Fund | | |
| | | | | | | | |
| | | Six Months Ended
March 31, 2010* | | | Year Ended
September 30, 2009 | |
INCREASE (DECREASE) IN NET ASSETS FROM: | | | | | | | | |
| | |
OPERATIONS: | | | | | | | | |
Net investment income | | $ | 13,049,364 | | | $ | 18,869,465 | |
Net realized gain (loss) on investments | | | 2,507,244 | | | | 3,552,821 | |
Increase (decrease) in unrealized appreciation (depreciation) of investments | | | 5,075,532 | | | | 29,669,097 | |
| | | | | | | | |
| | |
Net Increase (Decrease) in Net Assets Resulting from Operations | | | 20,632,140 | | | | 52,091,383 | |
| | |
DIVIDENDS TO SHAREHOLDERS: | | | | | | | | |
From net investment income | | | | | | | | |
Class A Shares | | | (6,034,380 | ) | | | (8,418,379 | ) |
Class C Shares | | | (2,785,806 | ) | | | (3,707,522 | ) |
Class I Shares | | | (3,967,514 | ) | | | (6,277,646 | ) |
Class R3 Shares | | | (264,585 | ) | | | (465,918 | ) |
| | |
FUND SHARE TRANSACTIONS (NOTE 4): | | | | | | | | |
Class A Shares | | | 86,427,615 | | | | 92,947,695 | |
Class C Shares | | | 51,119,112 | | | | 53,379,024 | |
Class I Shares | | | 56,518,159 | | | | 18,599,359 | |
Class R3 Shares | | | 3,840,275 | | | | (287,139 | ) |
| | | | | | | | |
| | |
Net Increase in Net Assets | | | 205,485,016 | | | | 197,860,857 | |
| | |
NET ASSETS: | | | | | | | | |
Beginning of Period | | | 517,280,728 | | | | 319,419,871 | |
| | | | | | | | |
| | |
End of Period | | $ | 722,765,744 | | | $ | 517,280,728 | |
| | | | | | | | |
See notes to financial statements.
Certified Semi-Annual Report 31
| | |
| NOTES TO FINANCIAL STATEMENTS | | |
| |
| Thornburg Limited Term Income Funds | | March 31, 2010 (Unaudited) |
NOTE 1 – ORGANIZATION
Thornburg Limited Term U.S. Government Fund (the “Government Fund”) and Thornburg Limited Term Income Fund (the “Income Fund”), hereafter referred to collectively as the “Funds,” are diversified series of Thornburg Investment Trust (the “Trust”). The Trust is organized as a Massachusetts business trust under a Declaration of Trust dated June 3, 1987 and is registered as a diversified, open-end management investment company under the Investment Company Act of 1940, as amended. The Funds are currently two of sixteen separate series of the Trust. Each series is considered to be a separate entity for financial reporting and tax purposes and bears expenses directly attributable to it. The Funds’ primary objectives are to obtain as high a level of current income as is consistent, in the view of the Funds’ investment advisor, with the safety of capital. As a secondary objective, the Funds seek to reduce changes in their share prices compared to longer term portfolios.
The Government Fund currently offers five classes of shares of beneficial interest: Class A, Class B, Class C, Institutional Class (Class I), and Retirement Class (Class R3) shares. The Income Fund currently offers four classes of shares of beneficial interest, Class A, Class C, Institutional Class (Class I), and Retirement Class (Class R3) shares. Each class of shares of the Funds represents an interest in the same portfolio of investments, except that (i) Class A shares are sold subject to a front-end sales charge collected at the time the shares are purchased and bear a service fee, (ii) Class B shares are sold at net asset value without a sales charge at the time of purchase, but are subject to a contingent deferred sales charge upon redemption and bear both a service fee and distribution fee, (iii) Class C shares are sold at net asset value without a sales charge at the time of purchase, but are subject to a contingent deferred sales charge upon redemption within one year of purchase, and bear both a service fee and a distribution fee, (iv) Class I shares are sold at net asset value without a sales charge at the time of purchase, (v) Class R3 shares are sold at net asset value without a sales charge, but bear both a service fee and a distribution fee, and (vi) the respective classes may have different reinvestment privileges and conversion rights. Additionally, each Fund may allocate among its classes certain expenses, to the extent allowable to specific classes, including transfer agent fees, government registration fees, certain printing and postage costs, and administrative and legal expenses. Currently, class specific expenses of the Funds are limited to distribution and service fees, administration fees, and certain registration and transfer agent expenses. Class B shares of the Government Fund outstanding for eight years will convert to Class A shares of the Government Fund.
NOTE 2 – SIGNIFICANT ACCOUNTING POLICIES
Significant accounting policies of the Trust are as follows:
Valuation of Investments: Debt obligations have a primary market over the counter and are valued by an independent pricing service approved by the Trustees of the Trust. The pricing service ordinarily values debt obligations at quoted bid prices. Quotations for any foreign debt obligations in foreign currencies are converted to U.S. dollar equivalents using the foreign exchange quotation in effect at the time of valuation. When quotations are not available, debt obligations are valued at evaluated prices determined by the pricing service using methods which include consideration of yields or prices of debt obligations of comparable quality, type of issue, coupon, maturity and rating, and indications as to value from dealers and general market conditions. Short-term obligations having remaining maturities of 60 days or less are valued at amortized cost, which approximates market value.
In any case where a pricing service fails to provide a price for a debt obligation held by the Funds, the valuation and pricing committee determines a fair value for the obligation using procedures approved by the Trustees. Additionally, in any case where management believes that a price provided by a pricing service for a debt obligation may be unreliable, the valuation and pricing committee decides whether or not to use the pricing service’s valuation or to determine a fair value for the obligation.
In determining fair value for any portfolio security or other investment, the valuation and pricing committee seeks to determine the amount that an owner of the investment might reasonably expect to receive upon a sale of the investment. However, because fair value prices are estimated prices, the valuation and pricing committee’s determination of fair value for an investment may differ from the value that would be realized by a Fund upon a sale of the investment, and that difference could be material to the Fund’s financial statements. The valuation and pricing committee’s determination of fair value for an investment may also differ from the prices obtained by other persons (including other mutual funds) for the investment.
32 Certified Semi-Annual Report
| | |
| NOTES TO FINANCIAL STATEMENTS, CONTINUED | | |
| |
| Thornburg Limited Term Income Funds | | March 31, 2010 (Unaudited) |
Valuation Measurements: Various inputs are used in determining the value of each Fund’s investments. These inputs are summarized in the three levels listed below.
Level 1: Quoted prices in active markets for identical investments.
Level 2: Other significant observable inputs (including quoted prices for similar investments, interest rates, prepayment rates, credit risk, etc.).
Level 3: Significant unobservable inputs (including the Fund’s own assumptions in determining the fair value of investments).
The following table displays a summary of the inputs used to value the Fund’s net assets as of March 31, 2010. In any instance when valuation inputs from more than one level are used to determine the fair value of a specific investment, the investment is placed in the level of the table based upon the lowest level input that is significant in determining the fair value of the investment:
GOVERNMENT FUND
| | | | | | | | | | | | |
| | | Fair Value Measurements at March 31, 2010 |
| | | Total | | Level 1 | | Level 2 | | Level 3 |
Assets | | | | | | | | | | | | |
Investments in Securities | | | | | | | | | | | | |
U.S. Treasury Securities | | $ | 37,261,742 | | $ | 37,261,742 | | $ | — | | $ | — |
U.S. Government Agencies | | | 65,266,219 | | | — | | | 65,266,219 | | | — |
Mortgage Backed | | | 172,731,744 | | | — | | | 172,731,744 | | | — |
Short Term Investments | | | 5,999,920 | | | — | | | 5,999,920 | | | — |
| | | | | | | | | | | | |
Total Investments in Securities | | $ | 281,259,625 | | $ | 37,261,742 | | $ | 243,997,883 | | $ | — |
| | | | |
| INCOME FUND | | | | | | | | | | | | |
| | | Fair Value Measurements at March 31, 2010 |
| | | Total | | Level 1 | | Level 2 | | Level 3 |
Assets | | | | | | | | | | | | |
Investments in Securities | | | | | | | | | | | | |
U.S. Treasury Securities | | $ | 7,273,945 | | $ | 7,273,945 | | $ | — | | $ | — |
U.S. Government Agencies | | | 28,157,769 | | | — | | | 28,157,769 | | | — |
Other Government | | | 5,846,471 | | | — | | | 5,846,471 | | | — |
Mortgage Backed | | | 138,568,268 | | | — | | | 138,568,268 | | | — |
Asset Backed Securities | | | 26,316,578 | | | — | | | 26,316,578 | | | — |
Corporate Bonds | | | 369,454,868 | | | — | | | 369,454,868 | | | — |
Municipal Bonds | | | 81,802,189 | | | — | | | 81,802,189 | | | — |
Short Term Investments | | | 53,100,000 | | | — | | | 53,100,000 | | | — |
| | | | | | | | | | | | |
Total Investments in Securities | | $ | 710,520,088 | | $ | 7,273,945 | | $ | 703,246,143 | | $ | — |
Federal Income Taxes: It is the policy of the Trust to comply with the provisions of the Internal Revenue Code applicable to “regulated investment companies” and to distribute to shareholders substantially all taxable income, including any net realized gain on investments of the Funds. Therefore, no provision for federal income taxes is required.
When-Issued and Delayed Delivery Transactions: The Funds may engage in when-issued or delayed delivery transactions. To the extent a Fund engages in such transactions, it will do so for the purpose of acquiring portfolio securities consistent with the Fund’s investment objectives and not for the purpose of investment leverage or to speculate on interest rate and/or market changes. At the time the a Fund makes a commitment to purchase a security on a when-issued or delayed delivery basis, the Fund will record the transaction and reflect the value in determining the Fund’s net asset value. When effecting such transactions, assets of an amount sufficient to make payment for the portfolio securities to be purchased will be segregated on each Fund’s records at the trade date. Securities purchased on a when-issued or delayed delivery basis do not earn interest until the settlement date.
Certified Semi-Annual Report 33
| | |
| NOTES TO FINANCIAL STATEMENTS, CONTINUED | | |
| |
| Thornburg Limited Term Income Funds | | March 31, 2010 (Unaudited) |
Dividends: Net investment income of each Fund is declared daily as a dividend on shares for which the Fund has received payment. Dividends are paid monthly and are reinvested in additional shares of the Funds at net asset value per share at the close of business on the dividend payment date, or at the shareholder’s option, paid in cash. Net realized capital gains, to the extent available, will be distributed at least annually.
General: Securities transactions are accounted for on a trade date basis. Interest income is accrued as earned. Premiums and discounts on securities purchased are amortized over the life of the respective securities. Realized gains and losses from the sale of securities are recorded on an identified cost basis. The Funds invest in various mortgage-backed securities. Such securities pay interest and a portion of principal each month, which is then available for investment in securities at prevailing prices. Paydown gains and losses on these securities are included in interest income. Net investment income (other than class specific expenses) and realized and unrealized gains and losses are allocated daily to each class of shares based upon the relative net asset value of outstanding shares (or the value of the dividend-eligible shares, as appropriate) of each class of shares at the beginning of the day (after adjusting for the current share activity of the respective class). Expenses common to all funds are allocated among the funds comprising the Trust based upon their relative net asset values or other appropriate allocation methods.
Foreign Currency Translation: With respect to the Income Fund, portfolio securities and other assets and liabilities denominated in foreign currencies are translated into U.S. dollars based on the rate of exchange of such currencies against U.S. dollars on the date of valuation. Purchases and sales of portfolio securities and interest denominated in foreign currencies are translated into U.S. dollar amounts on the respective dates of such transactions.
The Income Fund does not isolate that portion of the results of operations resulting from changes in foreign exchange rates on investments from the fluctuations arising from changes in market prices of securities held. Such fluctuations are included with the net realized and unrealized gain or loss from investments.
Reported net realized foreign exchange gains or losses arise from sales of foreign currencies, currency gains or losses realized between the trade and settlement dates on securities transactions, and the difference between the amount of interest recorded on the Income Fund’s books and the U.S. dollar equivalent of the amounts actually received or paid.
Guarantees and Indemnifications: Under the Trust’s organizational documents, its officers and Trustees are indemnified against certain liabilities arising out of the performance of their duties to the Funds. Additionally, in the normal course of business the Trust enters into contracts with service providers that contain general indemnification clauses. The Trust’s maximum exposure under these arrangements is unknown. However, based on experience, the Trust expects the risk of loss to be remote.
Use of Estimates: The preparation of financial statements, in conformity with generally accepted accounting principles, requires management to make estimates and assumptions that affect the reported amounts of assets and liabilities and the disclosure of contingent assets and liabilities at the date of the financial statements and the reported amounts of increases and decreases in net assets from operations during the reporting period. Actual results could differ from those estimates.
NOTE 3 – INVESTMENT ADVISORY FEE AND OTHER TRANSACTIONS WITH AFFILIATES
Pursuant to an investment advisory agreement, Thornburg Investment Management, Inc. (the “Advisor”) serves as the investment advisor and performs services to the Funds for which the fees are payable at the end of each month. For the six months ended March 31, 2010, these fees were payable at annual rates ranging from .375 of 1% to .275 of 1% per annum of the average daily net assets of the Government Fund and .50 of 1% to .275 of 1% per annum of the average daily net assets of the Income Fund depending on each Fund’s asset size. The Trust also has entered into administrative services agreements with the Advisor, whereby the Advisor will perform certain administrative services for the shareholders of each class of each Fund’s shares, and for which fees will be payable at an annual rate of up to .125 of 1% per annum of the average daily net assets attributable to Class A, Class B, Class C, and Class R3 shares, and up to .05 of 1% per annum of the average daily net assets attributable to Class I shares. For the six months ended March 31, 2010, the Advisor voluntarily or contractually agreed to reimburse certain class specific expenses and administrative fees of $14,295 for the Class R3 shares, of the Government Fund and $2,097, $16,033, and $23,358 for the Class A, C, and R3 shares, respectively, of the Income Fund.
34 Certified Semi-Annual Report
| | |
| NOTES TO FINANCIAL STATEMENTS, CONTINUED | | |
| |
| Thornburg Limited Term Income Funds | | March 31, 2010 (Unaudited) |
The Trust has an underwriting agreement with Thornburg Securities Corporation (the “Distributor,” an affiliate of the Advisor), which acts as the distributor of each Fund’s shares. For the six months ended March 31, 2010, the Distributor has advised the Funds that they earned net commissions aggregating $3,706 from the sale of Class A shares of the Government Fund, $6,815 from the sale of Class A shares of the Income Fund, and collected contingent deferred sales charges aggregating $6,596 and $10,379 from redemptions of Class C shares of the Government Fund and Income Fund, respectively.
Pursuant to a service plan under Rule 12b-1 of the Investment Company Act of 1940, the Funds may reimburse to the Advisor an amount not to exceed .25 of 1% per annum of the average daily net assets attributable to the Class A, Class B, Class C, Class I, and Class R3 shares of the Funds for payments made by the Advisor to securities dealers and other financial institutions to obtain various shareholder and distribution related services. The Advisor may pay out of its own resources additional expenses for distribution of each Fund’s shares.
The Trust has also adopted distribution plans pursuant to Rule 12b-1, applicable to each Fund’s Class B, Class C, and Class R3 shares under which the Funds compensate the Distributor for services in promoting the sale of Class B, C, and R3 shares of the Funds at an annual rate of up to .75 of 1% per annum of the average daily net assets attributable to these classes. Total fees incurred by the Distributor for each class of shares of the Funds under their respective Service and Distribution Plans for the six months ended March 31, 2010, are set forth in the Statements of Operations. Distribution fees of $204,238 and $354,602, respectively, for Class C shares of the Government Fund and Income Fund were waived.
The Trust has an agreement with the custodian bank to indirectly pay a portion of the custodian’s fees through credits earned by each Fund’s cash on deposit with the bank. This deposit agreement is an alternative to overnight investments. Custodial fees have been adjusted to reflect amounts that would have been paid without this agreement, with a corresponding adjustment reflected as fees paid indirectly in the Statements of Operations. For the six months ended March 31, 2010, fees paid indirectly were $2,234 for the Government Fund and $68 for the Income Fund.
Certain officers and Trustees of the Trust are also officers and/or directors of the Advisor and Distributor. The compensation of independent Trustees is borne by the Trust.
NOTE 4 – SHARES OF BENEFICIAL INTEREST
At March 31, 2010, there were an unlimited number of shares of beneficial interest authorized. Transactions in shares of beneficial interest were as follows:
GOVERNMENT FUND
| | | | | | | | | | | | | | |
| | | Six Months Ended
March 31, 2010 (Unaudited) | | | Year Ended
September 30, 2009 (Audited) | |
| | | Shares | | | Amount | | | Shares | | | Amount | |
Class A Shares | | | | | | | | | | | | | | |
Shares sold | | 3,253,548 | | | $ | 44,808,103 | | | 7,044,523 | | | $ | 95,215,680 | |
Shares issued to shareholders in reinvestment of dividends | | 182,328 | | | | 2,509,221 | | | 279,701 | | | | 3,808,354 | |
Shares repurchased | | (2,419,781 | ) | | | (33,301,179 | ) | | (6,282,151 | ) | | | (85,311,441 | ) |
| | | | | | | | | | | | | | |
| | | | |
Net Increase (Decrease) | | 1,016,095 | | | $ | 14,016,145 | | | 1,042,073 | | | $ | 13,712,593 | |
| | | | | | | | | | | | | | |
Class B Shares | | | | | | | | | | | | | | |
Shares sold | | 22,001 | | | $ | 302,093 | | | 293,980 | | | $ | 3,952,703 | |
Shares issued to shareholders in reinvestment of dividends | | 4,817 | | | | 66,187 | | | 8,315 | | | | 113,015 | |
Shares repurchased | | (117,206 | ) | | | (1,610,402 | ) | | (258,733 | ) | | | (3,505,865 | ) |
| | | | | | | | | | | | | | |
| | | | |
Net Increase (Decrease) | | (90,388 | ) | | $ | (1,242,122 | ) | | 43,562 | | | $ | 559,853 | |
| | | | | | | | | | | | | | |
Certified Semi-Annual Report 35
| | |
| NOTES TO FINANCIAL STATEMENTS, CONTINUED | | |
| |
| Thornburg Limited Term Income Funds | | March 31, 2010 (Unaudited) |
GOVERNMENT FUND
| | | | | | | | | | | | | | |
| | | Six Months Ended
March 31, 2010 (Unaudited) | | | Year Ended
September 30, 2009 (Audited) | |
| | | Shares | | | Amount | | | Shares | | | Amount | |
Class C Shares | | | | | | | | | | | | | | |
Shares sold | | 1,631,636 | | | $ | 22,601,269 | | | 5,398,545 | | | $ | 73,120,285 | |
Shares issued to shareholders in reinvestment of dividends | | 83,202 | | | | 1,152,027 | | | 132,715 | | | | 1,818,052 | |
Shares repurchased | | (1,489,493 | ) | | | (20,615,292 | ) | | (4,556,448 | ) | | | (62,209,575 | ) |
| | | | | | | | | | | | | | |
| | | | |
Net Increase (Decrease) | | 225,345 | | | $ | 3,138,004 | | | 974,812 | | | $ | 12,728,762 | |
| | | | | | | | | | | | | | |
Class I Shares | | | | | | | | | | | | | | |
Shares sold | | 1,157,681 | | | $ | 15,920,066 | | | 1,353,081 | | | $ | 18,389,155 | |
Shares issued to shareholders in reinvestment of dividends | | 25,695 | | | | 353,494 | | | 35,061 | | | | 476,842 | |
Shares repurchased | | (741,013 | ) | | | (10,174,940 | ) | | (1,186,944 | ) | | | (16,141,161 | ) |
| | | | | | | | | | | | | | |
| | | | |
Net Increase (Decrease) | | 442,363 | | | $ | 6,098,620 | | | 201,198 | | | $ | 2,724,836 | |
| | | | | | | | | | | | | | |
Class R3 Shares | | | | | | | | | | | | | | |
Shares sold | | 208,464 | | | $ | 2,873,083 | | | 414,219 | | | $ | 5,628,281 | |
Shares issued to shareholders in reinvestment of dividends | | 12,743 | | | | 175,424 | | | 16,151 | | | | 220,135 | |
Shares repurchased | | (103,641 | ) | | | (1,425,620 | ) | | (357,273 | ) | | | (4,855,903 | ) |
| | | | | | | | | | | | | | |
| | | | |
Net Increase (Decrease) | | 117,566 | | | $ | 1,622,887 | | | 73,097 | | | $ | 992,513 | |
| | | | | | | | | | | | | | |
| | | | |
INCOME FUND | | | | | | | | | | | | | | |
| | |
| | | Six Months Ended
March 31, 2010 (Unaudited) | | | Year Ended
September 30, 2009 (Audited) | |
| | | Shares | | | Amount | | | Shares | | | Amount | |
Class A Shares | | | | | | | | | | | | | | |
Shares sold | | 9,436,769 | | | $ | 122,094,164 | | | 11,110,221 | | | $ | 133,515,913 | |
Shares issued to shareholders in reinvestment of dividends | | 376,121 | | | | 4,876,344 | | | 557,688 | | | | 6,698,514 | |
Shares repurchased | | (3,135,061 | ) | | | (40,542,893 | ) | | (3,969,959 | ) | | | (47,266,732 | ) |
| | | | | | | | | | | | | | |
| | | | |
Net Increase (Decrease) | | 6,677,829 | | | $ | 86,427,615 | | | 7,697,950 | | | $ | 92,947,695 | |
| | | | | | | | | | | | | | |
Class C Shares | | | | | | | | | | | | | | |
Shares sold | | 4,847,383 | | | $ | 62,668,578 | | | 6,724,821 | | | $ | 80,629,530 | |
Shares issued to shareholders in reinvestment of dividends | | 150,875 | | | | 1,953,004 | | | 218,899 | | | | 2,628,336 | |
Shares repurchased | | (1,045,128 | ) | | | (13,502,470 | ) | | (2,524,932 | ) | | | (29,878,842 | ) |
| | | | | | | | | | | | | | |
| | | | |
Net Increase (Decrease) | | 3,953,130 | | | $ | 51,119,112 | | | 4,418,788 | | | $ | 53,379,024 | |
| | | | | | | | | | | | | | |
Class I Shares | | | | | | | | | | | | | | |
Shares sold | | 6,326,145 | | | $ | 81,932,872 | | | 5,532,405 | | | $ | 66,543,531 | |
Shares issued to shareholders in reinvestment of dividends | | 242,407 | | | | 3,143,189 | | | 414,485 | | | | 4,961,968 | |
Shares repurchased | | (2,203,223 | ) | | | (28,557,902 | ) | | (4,467,592 | ) | | | (52,906,140 | ) |
| | | | | | | | | | | | | | |
| | | | |
Net Increase (Decrease) | | 4,365,329 | | | $ | 56,518,159 | | | 1,479,298 | | | $ | 18,599,359 | |
| | | | | | | | | | | | | | |
36 Certified Semi-Annual Report
| | |
| NOTES TO FINANCIAL STATEMENTS, CONTINUED | | |
| |
| Thornburg Limited Term Income Funds | | March 31, 2010 (Unaudited) |
INCOME FUND
| | | | | | | | | | | | | | |
| | | Six Months Ended
March 31, 2010 (Unaudited) | | | Year Ended
September 30, 2009 (Audited) | |
| | | Shares | | | Amount | | | Shares | | | Amount | |
Class R3 Shares | | | | | | | | | | | | | | |
Shares sold | | 432,374 | | | $ | 5,586,307 | | | 492,247 | | | $ | 5,906,665 | |
Shares issued to shareholders in reinvestment of dividends | | 19,170 | | | | 248,656 | | | 35,956 | | | | 429,574 | |
Shares repurchased | | (153,949 | ) | | | (1,994,688 | ) | | (555,753 | ) | | | (6,623,378 | ) |
| | | | | | | | | | | | | | |
| | | | |
Net Increase (Decrease) | | 297,595 | | | $ | 3,840,275 | | | (27,550 | ) | | $ | (287,139 | ) |
| | | | | | | | | | | | | | |
NOTE 5 – SECURITIES TRANSACTIONS
For the six months ended March 31, 2010, the Government Fund had purchase and sale transactions of investment securities (excluding short-term investments) of $61,091,372 and $21,742,181, respectively, while the Income Fund had purchase and sale transactions of investment securities (excluding short-term investments and U.S. Government obligations) of $113,069 and $38,516,272, respectively.
NOTE 6 – INCOME TAXES
At March 31, 2010, information on the tax components of capital is as follows:
| | | | | | | | |
| | | Government Fund | | | Income Fund | |
Cost of investments for tax purposes | | $ | 272,774,376 | | | $ | 688,490,703 | |
| | | | | | | | |
Gross unrealized appreciation on a tax basis | | $ | 8,944,299 | | | $ | 31,292,959 | |
Gross unrealized depreciation on a tax basis | | | (459,050 | ) | | | (9,263,574 | ) |
| | | | | | | | |
Net unrealized appreciation (depreciation) on investments (tax basis) | | $ | 8,485,249 | | | $ | 22,029,385 | |
| | | | | | | | |
The Income Fund deferred tax basis capital losses occurring subsequent to October 31, 2008 of $821,633. For tax purposes, such losses will be reflected in the year ending September 30, 2010. Unutilized tax basis capital losses may be carried forward to offset realized gains in future years. To the extent such carryforwards are used, capital gains distributions may be reduced to the extent provided by regulations.
At March 31, 2010, the Income Fund had tax basis capital losses, which may be carried forward to offset future capital gains. Such capital loss carryforwards expire as follows:
| | | |
2014 | | $ | 107,356 |
2015 | | | 178,155 |
2016 | | | 2,359,034 |
| | | |
| | $ | 2,644,545 |
| | | |
OTHER NOTES
Fund management believes no events have occurred between March 31, 2010 and May 20, 2010, the date of issuance of the financial statements, that require adjustment of, or disclosure in, the accompanying financial statements.
Certified Semi-Annual Report 37
| | |
| FINANCIAL HIGHLIGHTS | | |
| |
| Thornburg Limited Term U.S. Government Fund | | |
| | | | | | | | | | | | | | | | | | | | | | | | | | | | | | | | | | | | | | | | | | | |
| | | PER SHARE PERFORMANCE (for a share outstanding throughout the period) | | RATIOS TO AVERAGE NET ASSETS | | | SUPPLEMENTAL DATA |
Unless
Otherwise
Noted,
Periods
are Fiscal Years
Ended Sept. 30, | | Net Asset
Value
Beginning
of Period | | Net
Investment
Income
(Loss) | | Net
Realized &
Unrealized
Gain (Loss)
on
Investments | | | Total from
Investment
Operations | | | Dividends
from Net
Investment
Income | | | Dividends
from Net
Realized
Gains | | | Total
Dividends | | | Net Asset
Value
End of
Period | | Net
Investment
Income
(Loss) (%) | | | Expenses,
After
Expense
Reductions
(%) | | | Expenses,
After
Expense
Reductions
and Net of
Custody
Credits
(%) | | | Expenses,
Before
Expense
Reductions
(%) | | | Total
Return
(%)(a) | | | Portfolio
Turnover
Rate (%) | | Net Assets
at End of
Period
(Thousands) |
Class A Shares | | | | | | | | | | | | | | | | | | | | | | | | | | | | | | | | | | | | | | | | | | | |
2010(b)(c) | | $ | 13.78 | | 0.21 | | (0.02 | ) | | 0.19 | | | (0.23 | ) | | (0.06 | ) | | (0.29 | ) | | $ | 13.68 | | 3.10 | (d) | | 0.92 | (d) | | 0.92 | (d) | | 0.92 | (d) | | 1.37 | | | 8.40 | | $ | 155,726 |
2009(c) | | $ | 13.26 | | 0.41 | | 0.54 | | | 0.95 | | | (0.43 | ) | | — | | | (0.43 | ) | | $ | 13.78 | | 3.04 | | | 0.94 | | | 0.93 | | | 0.94 | | | 7.21 | | | 39.42 | | $ | 142,872 |
2008(c) | | $ | 12.97 | | 0.45 | | 0.29 | | | 0.74 | | | (0.45 | ) | | — | | | (0.45 | ) | | $ | 13.26 | | 3.39 | | | 0.95 | | | 0.93 | | | 0.95 | | | 5.75 | | | 19.61 | | $ | 123,625 |
2007(c) | | $ | 12.75 | | 0.40 | | 0.23 | | | 0.63 | | | (0.41 | ) | | — | | | (0.41 | ) | | $ | 12.97 | | 3.13 | | | 0.98 | | | 0.97 | | | 0.99 | | | 5.03 | | | 43.35 | | $ | 91,561 |
2006(c) | | $ | 12.76 | | 0.37 | | (0.01 | ) | | 0.36 | | | (0.37 | ) | | — | | | (0.37 | ) | | $ | 12.75 | | 2.90 | | | 0.99 | | | 0.96 | | | 0.99 | | | 2.87 | | | 7.47 | | $ | 106,913 |
2005(c) | | $ | 13.01 | | 0.32 | | (0.24 | ) | | 0.08 | | | (0.33 | ) | | — | | | (0.33 | ) | | $ | 12.76 | | 2.50 | | | 0.99 | | | 0.98 | | | 0.99 | | | 0.66 | | | 18.00 | | $ | 138,422 |
Class B Shares | | | | | | | | | | | | | | | | | | | | | | | | | | | | | | | | | | | | | | | | | | | |
2010(b) | | $ | 13.75 | | 0.13 | | (0.02 | ) | | 0.11 | | | (0.15 | ) | | (0.06 | ) | | (0.21 | ) | | $ | 13.65 | | 1.93 | (d) | | 2.09 | (d) | | 2.08 | (d) | | 2.09 | (d) | | 0.78 | | | 8.40 | | $ | 4,672 |
2009 | | $ | 13.23 | | 0.27 | | 0.53 | | | 0.80 | | | (0.28 | ) | | — | | | (0.28 | ) | | $ | 13.75 | | 1.96 | | | 2.01 | | | 2.01 | | | 2.04 | | | 6.08 | | | 39.42 | | $ | 5,950 |
2008 | | $ | 12.94 | | 0.28 | | 0.28 | | | 0.56 | | | (0.27 | ) | | — | | | (0.27 | ) | | $ | 13.23 | | 2.08 | | | 2.26 | | | 2.25 | | | 2.26 | | | 4.37 | | | 19.61 | | $ | 5,147 |
2007 | | $ | 12.72 | | 0.22 | | 0.23 | | | 0.45 | | | (0.23 | ) | | — | | | (0.23 | ) | | $ | 12.94 | | 1.73 | | | 2.40 | | | 2.39 | | | 2.63 | | | 3.55 | | | 43.35 | | $ | 2,586 |
2006 | | $ | 12.73 | | 0.18 | | (0.01 | ) | | 0.17 | | | (0.18 | ) | | — | | | (0.18 | ) | | $ | 12.72 | | 1.41 | | | 2.51 | | | 2.48 | | | 3.21 | | | 1.32 | | | 7.47 | | $ | 2,476 |
2005 | | $ | 12.98 | | 0.13 | | (0.24 | ) | | (0.11 | ) | | (0.14 | ) | | — | | | (0.14 | ) | | $ | 12.73 | | 1.03 | | | 2.46 | | | 2.45 | | | 2.86 | | | (0.82 | ) | | 18.00 | | $ | 1,875 |
Class C Shares | | | | | | | | | | | | | | | | | | | | | | | | | | | | | | | | | | | | | | | | | | | |
2010(b) | | $ | 13.87 | | 0.19 | | (0.03 | ) | | 0.16 | | | (0.21 | ) | | (0.06 | ) | | (0.27 | ) | | $ | 13.76 | | 2.81 | (d) | | 1.21 | (d) | | 1.21 | (d) | | 1.71 | (d) | | 1.15 | | | 8.40 | | $ | 82,557 |
2009 | | $ | 13.34 | | 0.37 | | 0.55 | | | 0.92 | | | (0.39 | ) | | — | | | (0.39 | ) | | $ | 13.87 | | 2.74 | | | 1.22 | | | 1.21 | | | 1.72 | | | 6.97 | | | 39.42 | | $ | 80,039 |
2008 | | $ | 13.04 | | 0.41 | | 0.30 | | | 0.71 | | | (0.41 | ) | | — | | | (0.41 | ) | | $ | 13.34 | | 3.10 | | | 1.24 | | | 1.22 | | | 1.75 | | | 5.51 | | | 19.61 | | $ | 63,998 |
2007 | | $ | 12.83 | | 0.37 | | 0.22 | | | 0.59 | | | (0.38 | ) | | — | | | (0.38 | ) | | $ | 13.04 | | 2.88 | | | 1.25 | | | 1.24 | | | 1.80 | | | 4.66 | | | 43.35 | | $ | 25,566 |
2006 | | $ | 12.84 | | 0.34 | | (0.01 | ) | | 0.33 | | | (0.34 | ) | | — | | | (0.34 | ) | | $ | 12.83 | | 2.63 | | | 1.26 | | | 1.23 | | | 1.79 | | | 2.60 | | | 7.47 | | $ | 25,132 |
2005 | | $ | 13.09 | | 0.29 | | (0.24 | ) | | 0.05 | | | (0.30 | ) | | — | | | (0.30 | ) | | $ | 12.84 | | 2.24 | | | 1.25 | | | 1.24 | | | 1.79 | | | 0.41 | | | 18.00 | | $ | 32,821 |
Class I Shares | | | | | | | | | | | | | | | | | | | | | | | | | | | | | | | | | | | | | | | | | | | |
2010(b) | | $ | 13.78 | | 0.23 | | (0.02 | ) | | 0.21 | | | (0.25 | ) | | (0.06 | ) | | (0.31 | ) | | $ | 13.68 | | 3.40 | (d) | | 0.62 | (d) | | 0.62 | (d) | | 0.62 | (d) | | 1.52 | | | 8.40 | | $ | 30,757 |
2009 | | $ | 13.26 | | 0.45 | | 0.53 | | | 0.98 | | | (0.46 | ) | | — | | | (0.46 | ) | | $ | 13.78 | | 3.31 | | | 0.66 | | | 0.66 | | | 0.67 | | | 7.51 | | | 39.42 | | $ | 24,887 |
2008 | | $ | 12.97 | | 0.49 | | 0.29 | | | 0.78 | | | (0.49 | ) | | — | | | (0.49 | ) | | $ | 13.26 | | 3.68 | | | 0.66 | | | 0.64 | | | 0.67 | | | 6.06 | | | 19.61 | | $ | 21,275 |
2007 | | $ | 12.75 | | 0.44 | | 0.23 | | | 0.67 | | | (0.45 | ) | | — | | | (0.45 | ) | | $ | 12.97 | | 3.45 | | | 0.68 | | | 0.67 | | | 0.74 | | | 5.35 | | | 43.35 | | $ | 15,963 |
2006 | | $ | 12.76 | | 0.41 | | (0.01 | ) | | 0.40 | | | (0.41 | ) | | — | | | (0.41 | ) | | $ | 12.75 | | 3.22 | | | 0.68 | | | 0.65 | | | 0.78 | | | 3.19 | | | 7.47 | | $ | 14,900 |
2005 | | $ | 13.01 | | 0.36 | | (0.24 | ) | | 0.12 | | | (0.37 | ) | | — | | | (0.37 | ) | | $ | 12.76 | | 2.82 | | | 0.68 | | | 0.67 | | | 0.80 | | | 0.95 | | | 18.00 | | $ | 16,075 |
Class R3 Shares | | | | | | | | | | | | | | | | | | | | | | | | | | | | | | | | | | | | | | | | | | | |
2010(b) | | $ | 13.79 | | 0.21 | | (0.03 | ) | | 0.18 | | | (0.22 | ) | | (0.06 | ) | | (0.28 | ) | | $ | 13.69 | | 3.03 | (d) | | 0.99 | (d) | | 0.99 | (d) | | 1.32 | (d) | | 1.34 | | | 8.40 | | $ | 9,179 |
2009 | | $ | 13.27 | | 0.41 | | 0.53 | | | 0.94 | | | (0.42 | ) | | — | | | (0.42 | ) | | $ | 13.79 | | 3.00 | | | 1.00 | | | 0.99 | | | 1.40 | | | 7.15 | | | 39.42 | | $ | 7,625 |
2008 | | $ | 12.97 | | 0.44 | | 0.30 | | | 0.74 | | | (0.44 | ) | | — | | | (0.44 | ) | | $ | 13.27 | | 3.33 | | | 1.01 | | | 0.99 | | | 1.47 | | | 5.77 | | | 19.61 | | $ | 6,367 |
2007 | | $ | 12.76 | | 0.40 | | 0.22 | | | 0.62 | | | (0.41 | ) | | — | | | (0.41 | ) | | $ | 12.97 | | 3.15 | | | 1.00 | | | 0.99 | | | 1.64 | | | 4.93 | | | 43.35 | | $ | 4,398 |
2006 | | $ | 12.77 | | 0.37 | | (0.01 | ) | | 0.36 | | | (0.37 | ) | | — | | | (0.37 | ) | | $ | 12.76 | | 2.90 | | | 1.00 | | | 0.97 | | | 1.55 | | | 2.86 | | | 7.47 | | $ | 3,591 |
2005 | | $ | 13.02 | | 0.34 | | (0.25 | ) | | 0.09 | | | (0.34 | ) | | — | | | (0.34 | ) | | $ | 12.77 | | 2.66 | | | 0.93 | | | 0.91 | | | 3.55 | | | 0.72 | | | 18.00 | | $ | 3,008 |
| (a) | Not annualized for periods less than one year. |
| (b) | Unaudited Six Month Period Ended March 31. |
| (c) | Sales loads are not reflected in computing total return. |
See notes to financial statements.
| | |
| 38 Certified Semi-Annual Report | | Certified Semi-Annual Report 39 |
| | |
| FINANCIAL HIGHLIGHTS | | |
| |
| Thornburg Limited Term Income Fund | | March 31, 2010 (Unaudited) |
| | | | | | | | | | | | | | | | | | | | | | | | | | | | | | | | | | | | | | | | |
| | | PER SHARE PERFORMANCE (for a share outstanding throughout the period) | | RATIOS TO AVERAGE NET ASSETS | | | SUPPLEMENTAL DATA |
Unless
Otherwise
Noted,
Periods
are Fiscal Years
Ended Sept. 30, | | Net Asset
Value
Beginning
of Period | | Net
Investment
Income
(Loss) | | Net
Realized &
Unrealized
Gain (Loss)
on
Investments | | | Total from
Investment
Operations | | Dividends
from Net
Investment
Income | | | Dividends
from Net
Realized
Gains | | Total
Dividends | | | Net
Asset
End
of
Period | | Net
Investment
Income
(Loss) (%) | | | Expenses,
After
Expense
Reductions
(%) | | | Expenses,
After
Expense
Reductions
and Net of
Custody
Credits
(%) | | | Expenses,
Before
Expense
Reductions
(%) | | | Total
Return
(%)(a) | | Portfolio
Turnover
Rate (%) | | Net Assets
at End of
Period
(Thousands) |
Class A Shares | | | | | | | | | | | | | | | | | | | | | | | | | | | | | | | | | | | | | | | | |
2010(b)(c) | | $ | 12.81 | | 0.27 | | 0.18 | | | 0.45 | | (0.27 | ) | | — | | (0.27 | ) | | $ | 12.99 | | 4.24 | (d) | | 0.99 | (d) | | 0.99 | (d) | | 0.99 | (d) | | 3.57 | | 6.73 | | $ | 333,127 |
2009(c) | | $ | 11.92 | | 0.60 | | 0.90 | | | 1.50 | | (0.61 | ) | | — | | (0.61 | ) | | $ | 12.81 | | 5.04 | | | 0.99 | | | 0.99 | | | 1.04 | | | 13.05 | | 45.31 | | $ | 243,141 |
2008(c) | | $ | 12.40 | | 0.55 | | (0.48 | ) | | 0.07 | | (0.55 | ) | | — | | (0.55 | ) | | $ | 11.92 | | 4.38 | | | 0.99 | | | 0.99 | | | 1.03 | | | 0.44 | | 42.84 | | $ | 134,372 |
2007(c) | | $ | 12.37 | | 0.50 | | 0.04 | | | 0.54 | | (0.51 | ) | | — | | (0.51 | ) | | $ | 12.40 | | 4.07 | | | 1.00 | | | 0.99 | | | 1.08 | | | 4.43 | | 41.55 | | $ | 155,021 |
2006(c) | | $ | 12.51 | | 0.50 | | (0.14 | ) | | 0.36 | | (0.50 | ) | | — | | (0.50 | ) | | $ | 12.37 | | 4.05 | | | 1.00 | | | 0.99 | | | 1.09 | | | 2.96 | | 6.77 | | $ | 190,670 |
2005(c) | | $ | 12.80 | | 0.46 | | (0.28 | ) | | 0.18 | | (0.47 | ) | | — | | (0.47 | ) | | $ | 12.51 | | 3.52 | | | 1.00 | | | 0.99 | | | 1.09 | | | 1.44 | | 23.16 | | $ | 212,881 |
Class C Shares | | | | | | | | | | | | | | | | | | | | | | | | | | | | | | | | | | | | | | | | |
2010(b) | | $ | 12.79 | | 0.25 | | 0.19 | | | 0.44 | | (0.26 | ) | | — | | (0.26 | ) | | $ | 12.97 | | 3.98 | (d) | | 1.24 | (d) | | 1.24 | (d) | | 1.77 | (d) | | 3.44 | | 6.73 | | $ | 170,785 |
2009 | | $ | 11.90 | | 0.57 | | 0.90 | | | 1.47 | | (0.58 | ) | | — | | (0.58 | ) | | $ | 12.79 | | 4.79 | | | 1.24 | | | 1.24 | | | 1.82 | | | 12.78 | | 45.31 | | $ | 117,950 |
2008 | | $ | 12.38 | | 0.52 | | (0.49 | ) | | 0.03 | | (0.51 | ) | | — | | (0.51 | ) | | $ | 11.90 | | 4.15 | | | 1.24 | | | 1.24 | | | 1.83 | | | 0.18 | | 42.84 | | $ | 57,114 |
2007 | | $ | 12.35 | | 0.47 | | 0.03 | | | 0.50 | | (0.47 | ) | | — | | (0.47 | ) | | $ | 12.38 | | 3.82 | | | 1.24 | | | 1.24 | | | 1.89 | | | 4.17 | | 41.55 | | $ | 40,769 |
2006 | | $ | 12.49 | | 0.47 | | (0.14 | ) | | 0.33 | | (0.47 | ) | | — | | (0.47 | ) | | $ | 12.35 | | 3.79 | | | 1.25 | | | 1.24 | | | 1.87 | | | 2.71 | | 6.77 | | $ | 44,361 |
2005 | | $ | 12.78 | | 0.43 | | (0.28 | ) | | 0.15 | | (0.44 | ) | | — | | (0.44 | ) | | $ | 12.49 | | 3.27 | | | 1.25 | | | 1.24 | | | 1.88 | | | 1.19 | | 23.16 | | $ | 59,355 |
Class I Shares | | | | | | | | | | | | | | | | | | | | | | | | | | | | | | | | | | | | | | | | |
2010(b) | | $ | 12.82 | | 0.29 | | 0.18 | | | 0.47 | | (0.30 | ) | | — | | (0.30 | ) | | $ | 12.99 | | 4.59 | (d) | | 0.63 | (d) | | 0.63 | (d) | | 0.63 | (d) | | 3.67 | | 6.73 | | $ | 204,761 |
2009 | | $ | 11.92 | | 0.64 | | 0.90 | | | 1.54 | | (0.64 | ) | | — | | (0.64 | ) | | $ | 12.82 | | 5.39 | | | 0.66 | | | 0.66 | | | 0.68 | | | 13.50 | | 45.31 | | $ | 146,099 |
2008 | | $ | 12.40 | | 0.59 | | (0.48 | ) | | 0.11 | | (0.59 | ) | | — | | (0.59 | ) | | $ | 11.92 | | 4.72 | | | 0.66 | | | 0.66 | | | 0.67 | | | 0.77 | | 42.84 | | $ | 118,222 |
2007 | | $ | 12.37 | | 0.54 | | 0.04 | | | 0.58 | | (0.55 | ) | | — | | (0.55 | ) | | $ | 12.40 | | 4.39 | | | 0.67 | | | 0.67 | | | 0.72 | | | 4.76 | | 41.55 | | $ | 103,530 |
2006 | | $ | 12.51 | | 0.54 | | (0.14 | ) | | 0.40 | | (0.54 | ) | | — | | (0.54 | ) | | $ | 12.37 | | 4.38 | | | 0.68 | | | 0.67 | | | 0.72 | | | 3.30 | | 6.77 | | $ | 111,535 |
2005 | | $ | 12.80 | | 0.51 | | (0.29 | ) | | 0.22 | | (0.51 | ) | | — | | (0.51 | ) | | $ | 12.51 | | 3.85 | | | 0.67 | | | 0.67 | | | 0.72 | | | 1.77 | | 23.16 | | $ | 99,396 |
Class R3 Shares | | | | | | | | | | | | | | | | | | | | | | | | | | | | | | | | | | | | | | | | |
2010(b) | | $ | 12.82 | | 0.27 | | 0.17 | | | 0.44 | | (0.27 | ) | | — | | (0.27 | ) | | $ | 12.99 | | 4.24 | (d) | | 0.99 | (d) | | 0.99 | (d) | | 1.36 | (d) | | 3.49 | | 6.73 | | $ | 14,093 |
2009 | | $ | 11.92 | | 0.61 | | 0.90 | | | 1.51 | | (0.61 | ) | | — | | (0.61 | ) | | $ | 12.82 | | 5.08 | | | 0.99 | | | 0.99 | | | 1.48 | | | 13.13 | | 45.31 | | $ | 10,091 |
2008 | | $ | 12.40 | | 0.55 | | (0.48 | ) | | 0.07 | | (0.55 | ) | | — | | (0.55 | ) | | $ | 11.92 | | 4.42 | | | 0.99 | | | 0.99 | | | 1.52 | | | 0.44 | | 42.84 | | $ | 9,712 |
2007 | | $ | 12.38 | | 0.50 | | 0.03 | | | 0.53 | | (0.51 | ) | | — | | (0.51 | ) | | $ | 12.40 | | 4.09 | | | 0.99 | | | 0.99 | | | 1.71 | | | 4.34 | | 41.55 | | $ | 6,191 |
2006 | | $ | 12.52 | | 0.50 | | (0.14 | ) | | 0.36 | | (0.50 | ) | | — | | (0.50 | ) | | $ | 12.38 | | 4.07 | | | 1.00 | | | 0.99 | | | 1.79 | | | 2.97 | | 6.77 | | $ | 3,331 |
2005 | | $ | 12.81 | | 0.48 | | (0.30 | ) | | 0.18 | | (0.47 | ) | | — | | (0.47 | ) | | $ | 12.52 | | 3.57 | | | 1.00 | | | 0.99 | | | 3.15 | | | 1.43 | | 23.16 | | $ | 2,162 |
| (a) | Not annualized for periods less than one year. |
| (b) | Unaudited Six Month Period Ended March 31. |
| (c) | Sales loads are not reflected in computing total return. |
See notes to financial statements.
| | |
| 40 Certified Semi-Annual Report | | Certified Semi-Annual Report 41 |
| | |
| EXPENSE EXAMPLE | | |
| |
| Thornburg Limited Term Income Funds | | March 31, 2010 (Unaudited) |
As a shareholder of the Funds, you incur two types of costs:
| | (1) | transaction costs, including |
(a) sales charges (loads) on purchase payments, for Class A shares;
(b) a deferred sales charge on redemptions of any part or all of a purchase of $1 million of Class A shares within 12 months of purchase;
(c) a deferred sales charge on redemptions of Class B shares within eight years of purchase;
(d) a deferred sales charge on redemptions of Class C shares within 12 months of purchase;
| | (2) | ongoing costs, including management fees; distribution and/or service (12b-1) fees; and other Fund expenses. |
This example is intended to help you understand your ongoing costs (in dollars) of investing in the Funds and to compare these costs with the ongoing costs of investing in other mutual funds.
The example is based on a $1,000 investment beginning on October 1, 2009, and held until March 31, 2010.
ACTUAL EXPENSES
For each class of shares, the first line of the table at right provides information about actual account values and actual expenses. You may use the information in this line, together with the amount you invested, to estimate the expenses that you paid over the period. Simply divide your account value by $1,000 (for example, an $8,600 account value divided by $1,000 = 8.6), then multiply the result by the number in the first line for your class of shares under the heading entitled “Expenses Paid During Period” to estimate the expenses you paid on your account during this period.
HYPOTHETICAL EXAMPLE FOR COMPARISON PURPOSES
For each class of shares, the second line of the table at right provides information about hypothetical account values and hypothetical expenses based on the Funds’ actual expense ratio and an assumed rate of return of 5% per year before expenses, which is not the Funds’ actual return. The hypothetical account values and expenses may not be used to estimate the actual ending account balance or expenses you paid for the period. You may use this information to compare the ongoing costs of investing in the Funds and other funds. To do so, compare this 5% hypothetical example with the 5% hypothetical examples that appear in the shareholder reports of the other funds.
Please note that the expenses shown in the table are meant to highlight your ongoing costs only and do not reflect any transactional costs, such as sales charges (loads), redemption fees, or exchange fees. Therefore, the second line of the table for each class of shares is useful in comparing ongoing costs only, and will not help you determine the relative total costs of owning different funds. In addition, if these transactional costs were included, your costs would have been higher.
| | | | | | | | | |
| | | Beginning
Account Value
10/1/09 | | Ending
Account Value
3/31/10 | | Expenses Paid
During Period†
10/1/09–3/31/10 |
| Limited Term U.S. Government Fund |
Class A Shares | | | | | | | | | |
Actual | | $ | 1,000.00 | | $ | 1,013.70 | | $ | 4.61 |
Hypothetical* | | $ | 1,000.00 | | $ | 1,020.35 | | $ | 4.62 |
Class B Shares | | | | | | | | | |
Actual | | $ | 1,000.00 | | $ | 1,007.80 | | $ | 10.43 |
Hypothetical* | | $ | 1,000.00 | | $ | 1,014.54 | | $ | 10.47 |
Class C Shares | | | | | | | | | |
Actual | | $ | 1,000.00 | | $ | 1,011.50 | | $ | 6.05 |
Hypothetical* | | $ | 1,000.00 | | $ | 1,018.92 | | $ | 6.07 |
Class I Shares | | | | | | | | | |
Actual | | $ | 1,000.00 | | $ | 1,015.20 | | $ | 3.11 |
Hypothetical* | | $ | 1,000.00 | | $ | 1,021.85 | | $ | 3.12 |
Class R3 Shares | | | | | | | | | |
Actual | | $ | 1,000.00 | | $ | 1,013.40 | | $ | 4.97 |
Hypothetical* | | $ | 1,000.00 | | $ | 1,020.00 | | $ | 4.99 |
|
| Limited Term Income Fund |
Class A Shares | | | | | | | | | |
Actual | | $ | 1,000.00 | | $ | 1,035.70 | | $ | 5.00 |
Hypothetical* | | $ | 1,000.00 | | $ | 1,020.02 | | $ | 4.96 |
Class C Shares | | | | | | | | | |
Actual | | $ | 1,000.00 | | $ | 1,034.40 | | $ | 6.29 |
Hypothetical* | | $ | 1,000.00 | | $ | 1,018.75 | | $ | 6.24 |
Class I Shares | | | | | | | | | |
Actual | | $ | 1,000.00 | | $ | 1,036.70 | | $ | 3.21 |
Hypothetical* | | $ | 1,000.00 | | $ | 1,021.78 | | $ | 3.19 |
Class R3 Shares | | | | | | | | | |
Actual | | $ | 1,000.00 | | $ | 1,034.90 | | $ | 5.02 |
Hypothetical* | | $ | 1,000.00 | | $ | 1,020.00 | | $ | 4.99 |
| † | Thornburg Limited Term U.S. Government Fund expenses are equal to the annualized expense ratio for each class (A: 0.92%; B: 2.08%; C: 1.21%; I: 0.62%; R3: 0.99%) multiplied by the average account value over the period, multiplied by 182/365 to reflect the one-half year period. |
| † | Thornburg Limited Term Income Fund expenses are equal to the annualized expense ratio for each class (A: 0.99%; C: 1.24%; I: 0.63%; R3: 0.99%) multiplied by the average account value over the period, multiplied by 182/365 to reflect the one-half year period. |
| * | Hypothetical assumes a rate of return of 5% per year before expenses. |
42 Certified Semi-Annual Report
OTHER INFORMATION
| | |
| |
| Thornburg Limited Term Income Funds | | March 31, 2010 (Unaudited) |
PORTFOLIO PROXY VOTING
Policies and Procedures:
The Trust has delegated to Thornburg Investment Management, Inc. (the “Advisor”) voting decisions respecting proxies for each of the Fund’s voting securities. The Advisor makes voting decisions in accordance with its Proxy Voting Policy and Procedures. A description of the Policy and Procedures is available (i) without charge, upon request, by calling the Advisor toll-free at 1-800-847-0200, (ii) on the Thornburg website at www.thornburg.com, and (iii) on the Securities and Exchange Commission’s website at www.sec.gov.
Information regarding how proxies were voted is available on or before August 31 of each year for the twelve months ending the preceding June 30. This information is available (i) without charge, upon request by calling the Advisor toll-free at 1-800-847-0200, (ii) on the Thornburg website at www.thornburg.com, and (iii) on the Securities and Exchange Commission’s website at www.sec.gov.
AVAILABILITY OF QUARTERLY PORTFOLIO SCHEDULE
The Funds file with the Securities and Exchange Commission schedules of their portfolio holdings on Form N-Q for the first and third quarters of each fiscal year. The Funds’ Forms N-Q are available on the Commission’s website at www.sec.gov, or may be reviewed and copied at the Commission’s Public Reference Room in Washington, D.C. Information on the operation of the Public Reference Room may be obtained by calling 1-800-SEC-0330. The Funds also make this information available on their website at www.thornburg.com/download or upon request by calling 1-800-847-0200.
Certified Semi-Annual Report 43
Trustees’ Statement to Shareholders
Not part of the Certified Semi-Annual Report
February 8, 2005, as readopted July 22, 2009
The Trustees are concerned that ongoing commentaries and opinions reported in the media may confuse investors in general as to the supervisory duties of trustees of mutual funds and, in particular, leave Thornburg Investment Trust shareholders uncertain regarding how we discharge our responsibilities in supervising the Funds’ investment advisor and in reviewing the advisor’s contract for renewal. We decided to spell out clearly three principal guidelines that we follow in supervising the Trust’s investment advisor on your behalf.
We begin with the premise that each shareholder selected his or her Fund because its investments are managed by the investment advisor identified in the prospectus and in accordance with the objective and policies described in the prospectus. We realize, as each of you do, that if you believe that your Fund’s stated objective and policies no longer serve your personal investment goals, you can sell your shares and leave the Fund.
Therefore, we believe that our primary supervisory task – our principal obligation to you – is to assess the nature and quality of the advisor’s services, and to confirm that the advisor actively and competently pursues the Fund’s objective, in accordance with the policies set out in the prospectus. To do this, we meet regularly with management to review your Fund’s portfolio and to discuss the advisor’s specific actions and judgments in pursuing the Fund’s objective. We do not substitute our own judgment for the advisor’s decisions in selecting investments; the advisor is paid to exercise its informed judgment on investment decisions, and we seek to confirm, in reviewing the advisor’s performance, that the advisor is doing just that.
Second, while we are conscious of costs and the effect that costs have on shareholders’ returns, we do not seek the lowest fees or expense ratio as our sole or primary objective. We try to make sure that your Fund’s fees and costs are reasonable in relationship to the services rendered and that they are generally in line with those charged by other expert investment advisors, consistent with our belief that the Fund’s investors searched for and expect that expertise and attention and have decided to pay a reasonable price for it. We do not put the management contract “out to bid” as a matter of course, and we would not do so unless we had concluded that the advisor materially had failed to pursue the Fund’s objectives in accordance with its policies, or for other equally important reasons. We believe that any other approach would be inconsistent with your interests and contrary to your expectations when you bought shares of the Fund in the first place.
Finally, because we believe that most Thornburg Fund shareholders have invested with a long-term perspective, we try not to focus too much on the fashions of the moment and on short-term performance. The market will not favor any specific investment objective or set of policies at all times and under all economic circumstances. A fund will experience periods of both high and low returns relative to other funds and other investments. Even if one of our Funds is not favored by the market at a particular time, we believe that the advisor is nonetheless obliged to remain true to the Fund’s objective and policies, and we watch to see that it does so.
44 This page is not part of the Semi-Annual Report.
Retirement and Education Accounts
Thornburg Investment Management offers retirement and education savings accounts that can help you meet a variety of planning challenges. For account applications or further information on any of the accounts below, please call 1-800-847-0200 or go to www.thornburg.com/ira. Your financial advisor can help you determine which plan is right for you.
Individual Retirement Accounts
Individual Retirement Accounts (IRAs) provide a tax-advantaged means to save money for the future. For a detailed outline of the difference between retirement accounts, see www.thornburg.com/ira. Rollovers are available. Call 1-800-847-0200 for more information.
Traditional IRAs – Contributions to Traditional IRAs are tax deductible for eligible individuals, and withdrawals are taxed as additional ordinary income. You may contribute to an IRA if you receive compensation and are under 70 1/ 2, even if you are covered by an employer retirement plan. Deductible contributions are subject to certain qualifications. Please consult your tax advisor.
Roth IRAs – Under a Roth IRA, there is no tax deduction for contributions, but there is no income tax on qualified withdrawals. For a more detailed comparison of Traditional and Roth IRAs, please see our web site at www.thornburg.com/ira.
SEP IRAs – Simplified Employee Pension (SEP) IRAs are established by employers. The employer is allowed a tax deduction for contributions made to the SEP Plan and makes contributions to each eligible employee’s SEP IRA on a discretionary basis.
SIMPLE IRAs – Savings Incentive Match Plan for Employees of Small Employers (SIMPLE) is designed to give small business owners a simplified method to establish and contribute to a retirement plan for employees. The employer is allowed a tax deduction for contributions and makes either matching or non-elective contributions to each eligible employee’s SIMPLE IRA. Employees may make salary deferral contributions.
Coverdell Education Savings Account
These savings accounts are designed to provide a way to save money for higher education expenses. In an Education Savings Account, earnings and interest grow tax-free, and qualified withdrawals used to pay for eligible higher-education expenses are tax- and penalty-free.
Funds Available
The following funds are available in the accounts listed above:
| | • | | Thornburg International Value Fund |
| | • | | Thornburg Core Growth Fund |
| | • | | Thornburg Investment Income Builder Fund |
| | • | | Thornburg Global Opportunities Fund |
| | • | | Thornburg International Growth Fund |
| | • | | Thornburg Developing World Fund |
| | • | | Thornburg Limited Term U.S. Government Fund |
| | • | | Thornburg Limited Term Income Fund |
| | • | | Thornburg Strategic Income Fund |
This page is not part of the Semi-Annual Report. 45

46 This page is not part of the Annual Report.
Thornburg Equity Funds
Thornburg’s equity research uses a fundamental and comprehensive analytical approach. Thornburg equity funds focus on a limited number of securities so that each holding can impact performance. The equity team searches for firms believed to have a promising future and seeks to buy shares of those companies at a discount to their intrinsic value.
| | • | | Thornburg International Value Fund |
| | • | | Thornburg Core Growth Fund |
| | • | | Thornburg Investment Income Builder Fund |
| | • | | Thornburg Global Opportunities Fund |
| | • | | Thornburg International Growth Fund |
| | • | | Thornburg Developing World Fund |
Thornburg Bond Funds
Thornburg Investment Management applies a disciplined philosophy to fixed-income management. Since the launch of our first fixed-income fund over 25 years ago, we have been conducting fundamental, bottom-up research in an effort to identify bonds which we believe provide the best return for a given level of risk. We are very organic in our approach, avoiding leverage or complex strategies which could backfire in periods of market uncertainty.
| | • | | Thornburg Limited Term Municipal Fund |
| | • | | Thornburg Intermediate Municipal Fund |
| | • | | Thornburg California Limited Term Municipal Fund |
| | • | | Thornburg New Mexico Intermediate Municipal Fund |
| | • | | Thornburg New York Intermediate Municipal Fund |
| | • | | Thornburg Strategic Municipal Income Fund |
| | • | | Thornburg Limited Term U.S. Government Fund |
| | • | | Thornburg Limited Term Income Fund |
| | • | | Thornburg Strategic Income Fund |
Before investing, carefully consider the Fund’s investment goals, risks, charges, and expenses. For a prospectus containing this and other information, contact your financial advisor or visit thornburg.com. Read it carefully before investing.
For additional information, please visit www.thornburg.com
Thornburg Investment Management, Inc. 2300 North Ridgetop Road, Santa Fe, NM 87506
This page is not part of the Semi-Annual Report. 47
| | | | | | |
 | | Waste not, | | 
|
| | Wait not | |
| | | | Get instant access to your shareholder reports. |
| | |
| | This Semi-Annual Report is submitted for the general information of shareholders of the Fund. It is not authorized for distribution to prospective investors in the Fund unless preceded or accompanied by an effective prospectus. | | By switching from your postal mailbox to your email inbox, you reduce paper clutter, improve record keeping access, and help conserve our natural resources. |

| | Investment Advisor: | | Go to www.thornburg.com/edelivery and sign up to receive your shareholder reports, prospectuses, and proxy statements electronically. |
| | Thornburg Investment Management® 800.847.0200 | |
| | Distributor: | | |
| | Thornburg Securities Corporation® 800.847.0200 | | You invest in the future, without spending a dime. |
| | TH174 | | |

Important Information
The information presented on the following pages was current as of March 31, 2010. The managers’ views, portfolio holdings, and sector and country diversification are provided for the general information of the Fund’s shareholders; they are historical and subject to change. This material should not be deemed a recommendation to buy or sell any of the securities mentioned.
Investments in the Fund carry risks, including possible loss of principal. Bond funds have the same interest rate, inflation, and credit risks that are associated with the underlying bonds. The principal value of bonds will fluctuate relative to changes in interest rates, decreasing when interest rates rise. Unlike bonds, bond funds have ongoing fees and expenses. Funds invested in mortgage-backed securities may bear additional risk. Investments in lower-rated and unrated bonds may be more sensitive to default, downgrades, and market volatility; these investments may also be less liquid than higher-rated bonds. Investments in structured finance arrangements and other types of derivatives are subject to the risks associated with the securities or other assets underlying the pool of securities including illiquidity and difficulty in valuation. Investments in equity securities are subject to additional risks, such as greater market fluctuations. Special risks may be associated with investments outside the United States, especially in emerging markets, including currency fluctuations, illiquidity and volatility. Please see the Fund’s Prospectus for a discussion of the risks associated with an investment in the Fund. Investments in the Fund are not FDIC insured, nor are they deposits of or guaranteed by a bank or any other entity. There is no guarantee that the Fund will meet its investment objectives.
Average Annual Total Returns
for Periods Ended March 31, 2010
| | | | | | |
A Shares (Incep: 12/19/07) | | 1 Yr | | | Since
Inception | |
Without sales charge | | 38.77 | % | | 7.74 | % |
| | |
With sales charge | | 32.53 | % | | 5.59 | % |
Performance data shown represents past performance and is no guarantee of future results. Investment return and principal value will fluctuate so shares, when redeemed, may be worth more or less than their original cost. Current performance may be lower or higher than quoted. For performance current to the most recent month end, visit thornburg.com.
The maximum sales charge for the Fund’s Class A shares is 4.50%. The total annual operating expense of the Fund’s Class A shares is 1.49%, as disclosed in the most recent Prospectus. Thornburg Investment Management and Thornburg Securities Corporation have contractually agreed to waive fees and reimburse expenses through at least February 1, 2011, so that actual expenses do not exceed 1.25%.
Performance data given at net asset value (NAV) does not take into account the applicable sales charges. If the sales charges had been included, the performance would have been lower.
Class I shares may not be available to all investors. Minimum investments for Class I shares may be higher than those for other classes.
| | | | |
Share Class | | NASDAQ Symbol | | Cusip |
Class A | | TSIAX | | 885-215-228 |
Class C | | TSICX | | 885-215-210 |
Class I | | TSIIX | | 885-215-194 |
Glossary
Blended Benchmark – The Blended Benchmark is comprised of 80% Barclays Capital Aggregate Bond Index and 20% MSCI World Index. The Barclays Capital Aggregate Bond Index is composed of approximately 8,000 publicly traded bonds including U.S. government, mortgage-backed, corporate and Yankee bonds. The index is weighted by the market value of the bonds included in the index. The Morgan Stanley Capital International (MSCI) World Index is an unmanaged market-weighted index that consists of over 1,200 equity securities traded in 23 of the world’s most developed countries. The index is calculated with net dividends reinvested, in U.S. dollars.
Barclays Capital U.S. Corporate High Yield Index – Index covering the USD-denominated, non-investment grade, fixed-rate, taxable corporate bond market. Securities are classified as high-yield if the middle rating of Moody’s, Fitch, and S&P is Ba1/BB+ or below.
Barclays Capital U.S. Universal Index – Represents the union of the U.S. Aggregate Index, U.S. Corporate High-Yield Index, Investment-Grade 144A Index, Eurodollar Index, U.S. Emerging Markets Index, and the non-ERISA eligible portion of the CMBS Index. The index covers USD-denominated, taxable bonds that are rated either investment-grade or below investment-grade.
Unless otherwise noted, index returns reflect the reinvestment of income dividends and capital gains, if any, but do not reflect fees, brokerage commissions or other expenses of investing. Investors may not make direct investments into any index. The performance of any index is not indicative of the performance of any particular investment.
Duration – The weighted maturity of a bond’s cash flows. Duration measures the price sensitivity of a bond for a given change in interest rates. Bonds with longer durations experience greater price volatility than bonds with shorter durations.
Leverage – The amount of debt used to finance a firm’s assets. A firm with significantly more debt than equity is considered to be highly leveraged.
U.S. Treasury Securities – U.S. Treasury securities, such as bills, notes and bonds, are negotiable debt obligations of the U.S. government. These debt obligations are backed by the “full faith and credit” of the government and issued at various schedules and maturities. Income from Treasury securities is exempt from state and local, but not federal income taxes.
This page is not part of the Semi-Annual Report. 3

Thornburg Strategic Income Fund
March 31, 2010
This report is certified under the Sarbanes-Oxley Act of 2002, which requires that public companies, including mutual funds, affirm that the information provided in their annual and semiannual shareholder reports fully and fairly represents their financial position.
4 Certified Semi-Annual Report
Letter to Shareholders
| | |
Jason H. Brady, CFA Co-Portfolio Manager | | April 22, 2010 Dear Fellow Shareholder: We are very pleased to present the semi-annual report for the Thornburg Strategic Income Fund for the period ended March 31, 2010. The net asset value of a Class A share of the Fund increased 41 cents to $12.04 since September 30, 2009. If you were invested for the entire period, you received dividends of 40.7 cents per share. If you reinvested your dividends, you received 41.3 cents per share. Dividends per share were lower for Class C shares and higher for Class I shares to account for varying class-specific expenses. |
| |
| | Since the Fund’s inception, we have been navigating an environment of considerably high volatility in both the global fixed income and equity markets. We believe we are well positioned to continue to pursue the Fund’s primary goal, which is a relatively high and sustainable income stream. Though we don’t believe that the past year’s returns are available in many markets for 2010, we remain focused on achieving the best income returns possible for a reasonable level of risk. |
| |
George Strickland Co-Portfolio Manager | | Putting income and price change together, the Class A shares of the Thornburg Strategic Income Fund produced a total return of 7.60% (at NAV) since September 30, 2009. A blended index of 80% Barclays Capital Aggregate Bond Index and 20% MSCI World Index produced a 3.14% total return over the same time period. The Barclays Capital U.S. Universal Index and the Barclays Capital U.S. Corporate High Yield Index produced 2.63% and 11.10% total returns, respectively. These indices reflect no deduction for fees, expenses, or taxes. Over the course of the March 31, 2009 to March 31, 2010 time frame, the Fund has enjoyed a total return of 38.77% on the A shares at NAV. |
| |
| | Given the above figures, it has obviously been an interesting period. Owning risky assets in 2008 was a losing proposition relative to credit-risk-free assets such as U.S. Treasuries (a major component of both the Barclays Aggregate and Barclays Universal Indices). However, the ugliness of 2008 turned around in 2009 and early 2010 as spreads tightened relentlessly and credit has performed better, even at times besting equity returns. While recent returns have been impressive, opportunities for long-term yield have declined. |
| |
| | The U.S. economy seems to have bottomed, though as investors we need to be more interested in what is to come. In our view, “better” does not necessarily mean good. Twelve months ago in this letter we were very constructive on the risk markets, and in |
Certified Semi-Annual Report 5
Letter to Shareholders,
Continued
the intervening period risky assets (i.e. anything other than U.S. Treasuries) have rallied significantly. Whereas in the spring of 2009 we could talk about a significant margin of safety in the fixed income marketplace due to high income streams and low dollar prices, much of that has disappeared. The next phase of the market seems likely to be one where we can differentiate ourselves more based on our security-specific knowledge and credit work rather than on large macro calls. As an investment shop that prides itself on that sort of focus, we are looking forward to the challenge.
Economically, as we said in our last letter, we still expect consumer spending to remain muted as leverage comes down and savings rates climb. This is robust in the long term but growth-reducing in the medium term. Leverage generally, for the investment community, corporations, and individuals, is likely to decline. (In fact, corporate balance sheets are fairly healthy and are even trending towards less leverage at the moment.) Again, we believe this is healthy in the sense that it makes the “system” more robust, but it also hampers returns relative to the past few decades. We believe this is generally to the advantage of shareholders of the Strategic Income Fund as we remain focused on providing strong income returns which we believe will underpin the total return environment in the next several years. For these reasons, we believe that remaining invested in income-producing assets is beneficial.
Thank you very much for investing in the Thornburg Strategic Income Fund. We believe that the Fund continues to be an appropriate investment for those looking for an attractive, sustainable yield from a variety of instruments. While future performance cannot be guaranteed, Thornburg Investment Management will continue to strive to chart a steady course in what continues to be a volatile marketplace.
Regards,
| | | | |
 | |  | | |
| | |
| Jason H. Brady,CFA | | George Strickland | | |
| Co-Portfolio Manager | | Co-Portfolio Manager | | |
| Managing Director | | Managing Director | | |
The matters discussed in this report may constitute forward-looking statements made pursuant to the safe harbor provisions of the Securities Litigation Reform Act of 1995. These include any advisor or portfolio manager prediction, assessment, analysis or outlook for individual securities, industries, investment styles, market sectors and/or markets. These statements involve risks and uncertainties. In addition to the general risks described for each fund in its current prospectus, other factors bearing on these reports include the accuracy of the advisor’s or portfolio manager’s forecasts and predictions, the appropriateness of the investment strategies designed by the advisor or portfolio manager, and the ability of the advisor or portfolio manager to implement their strategies efficiently and successfully. Any one or more of these factors, as well as other risks affecting the securities markets generally, could cause the actual results of any fund to differ materially as compared to its benchmarks.
6 Certified Semi-Annual Report
| | |
| SCHEDULE OF INVESTMENTS | | |
| |
| Thornburg Strategic Income Fund | | March 31, 2010 (Unaudited) |
| | | | | | | | |
|
SUMMARY OF INDUSTRY EXPOSURE As of 3/31/10 | |
| Utilities | | 11.9 | % | | Semiconductors & Semiconductor Equipment | | 1.1 | % |
| Banks | | 10.8 | % | | Consumer Services | | 0.8 | % |
| Insurance | | 10.0 | % | | Pharmaceuticals, Biotechnology & Life Sciences | | 0.7 | % |
| Energy | | 9.7 | % | | Food & Staples Retailing | | 0.6 | % |
| Telecommunication Services | | 9.2 | % | | Industrials | | 0.5 | % |
| Diversified Financials | | 8.0 | % | | Health Care Equipment & Services | | 0.3 | % |
| Capital Goods | | 4.8 | % | | Technology Hardware & Equipment | | 0.3 | % |
| Real Estate | | 3.3 | % | | Commercial & Professional Services | | 0.2 | % |
| Transportation | | 3.0 | % | | Other Non-Classified Securities: | | | |
| Media | | 2.9 | % | | Asset Backed Securities | | 3.2 | % |
| Materials | | 2.7 | % | | Municipal Bonds | | 2.3 | % |
| Food, Beverage & Tobacco | | 2.5 | % | | U.S. Treasury Securities | | 1.0 | % |
| Miscellaneous | | 2.1 | % | | U.S. Government Agencies | | 0.5 | % |
| Consumer Durables & Apparel | | 2.0 | % | | Mortgage Backed* | | 0.0 | % |
| Retailing | | 1.7 | % | | Other Assets & Cash Equivalents | | 2.7 | % |
| Automobiles & Components | | 1.2 | % | | * Percentage was less than 0.1%. | | | |
|
SUMMARY OF COUNTRY EXPOSURE As of 3/31/10 | |
| | | |
| United States | | 73.4 | % | | Canada | | 0.7 | % |
| Australia | | 4.7 | % | | United Kingdom | | 0.6 | % |
| Bermuda | | 4.5 | % | | Mexico | | 0.6 | % |
| Brazil | | 2.0 | % | | Trinidad and Tobago | | 0.6 | % |
| South Korea | | 1.3 | % | | Cayman Islands | | 0.6 | % |
| Luxembourg | | 1.1 | % | | Netherlands | | 0.4 | % |
| Italy | | 1.0 | % | | China | | 0.3 | % |
| Norway | | 0.9 | % | | Belgium | | 0.2 | % |
| Indonesia | | 0.9 | % | | Switzerland | | 0.1 | % |
| Russia | | 0.9 | % | | Singapore | | 0.1 | % |
| United Arab Emirates | | 0.8 | % | | Greece | | 0.1 | % |
| Spain | | 0.8 | % | | Iceland* | | 0.0 | % |
| Germany | | 0.7 | % | | Other Assets & Cash Equivalents | | 2.7 | % |
| | | | | * Country percentage was less than 0.1% | | | |
Certified Semi-Annual Report 7
| | |
| SCHEDULE OF INVESTMENTS, CONTINUED | | |
| |
| Thornburg Strategic Income Fund | | March 31, 2010 (Unaudited) |
| | | | | |
| | | Shares/
Principal Amount | | Value |
COMMON STOCK — 6.63% | | | | | |
| | |
CONSUMER SERVICES — 0.10% | | | | | |
HOTELS, RESTAURANTS & LEISURE — 0.10% | | | | | |
OPAP SA | | 8,300 | | $ | 188,335 |
| | | | | |
| | | | | 188,335 |
| | | | | |
| | |
DIVERSIFIED FINANCIALS — 2.30% | | | | | |
CAPITAL MARKETS — 1.98% | | | | | |
Apollo Investment Corp. | | 168,060 | | | 2,139,404 |
Prospect Capital Corp. | | 131,433 | | | 1,596,911 |
DIVERSIFIED FINANCIAL SERVICES — 0.32% | | | | | |
KKR Financial Holdings LLC | | 73,000 | | | 599,330 |
| | | | | |
| | | | | 4,335,645 |
| | | | | |
| | |
ENERGY — 0.73% | | | | | |
OIL, GAS & CONSUMABLE FUELS — 0.73% | | | | | |
Eni S.p.A. | | 58,500 | | | 1,372,457 |
| | | | | |
| | | | | 1,372,457 |
| | | | | |
| | |
INSURANCE — 0.11% | | | | | |
INSURANCE — 0.11% | | | | | |
Swiss Re | | 4,400 | | | 216,578 |
| | | | | |
| | | | | 216,578 |
| | | | | |
| | |
REAL ESTATE — 1.62% | | | | | |
REAL ESTATE INVESTMENT TRUSTS — 1.62% | | | | | |
Annaly Capital Management, Inc. | | 101,900 | | | 1,750,642 |
Chimera Investment Corp. | | 165,900 | | | 645,351 |
Invesco Mortgage Capital | | 29,000 | | | 667,000 |
| | | | | |
| | | | | 3,062,993 |
| | | | | |
| | |
TELECOMMUNICATION SERVICES — 1.25% | | | | | |
DIVERSIFIED TELECOMMUNICATION SERVICES — 1.02% | | | | | |
France Telecom SA | | 26,900 | | | 643,630 |
Telefonica SA | | 21,500 | | | 509,344 |
Telstra Corp. Ltd. | | 283,000 | | | 776,488 |
WIRELESS TELECOMMUNICATION SERVICES — 0.23% | | | | | |
Mobistar SA | | 7,000 | | | 430,796 |
| | | | | |
| | | | | 2,360,258 |
| | | | | |
| | |
UTILITIES — 0.52% | | | | | |
ELECTRIC UTILITIES — 0.52% | | | | | |
E. ON AG | | 13,100 | | | 483,652 |
Enel S.p.A. | | 87,856 | | | 491,264 |
| | | | | |
| | | | | 974,916 |
| | | | | |
TOTAL COMMON STOCK (Cost $11,852,225) | | | | | 12,511,182 |
| | | | | |
| | |
PREFERRED STOCK — 4.01% | | | | | |
| | |
BANKS — 2.60% | | | | | |
COMMERCIAL BANKS — 1.00% | | | | | |
Huntington Bancshares Pfd, 8.50% | | 750 | | | 735,000 |
8 Certified Semi-Annual Report
| | |
| SCHEDULE OF INVESTMENTS, CONTINUED | | |
| |
| Thornburg Strategic Income Fund | | March 31, 2010 (Unaudited) |
| | | | | | |
| | | Shares/
Principal Amount | | Value |
a Sovereign REIT Pfd 12.00% | | | 1,000 | | $ | 1,140,000 |
Webster Financial Corp. Pfd Series A, 8.50% | | | 15 | | | 14,213 |
THRIFTS & MORTGAGE FINANCE — 1.60% | | | | | | |
a Falcons Funding Trust I Pfd, 8.875% | | | 3,000 | | | 3,017,812 |
| | | | | | |
| | | | | | 4,907,025 |
| | | | | | |
| | |
FOOD, BEVERAGE & TOBACCO — 0.28% | | | | | | |
FOOD PRODUCTS — 0.28% | | | | | | |
a H.J. Heinz Finance Co. Pfd, 8.00% | | | 5 | | | 527,656 |
| | | | | | |
| | | | | | 527,656 |
| | | | | | |
| | |
INSURANCE — 0.53% | | | | | | |
INSURANCE — 0.53% | | | | | | |
Genworth Financial, Inc. Pfd Series A, 5.25% | | | 20,000 | | | 1,005,626 |
| | | | | | |
| | | | | | 1,005,626 |
| | | | | | |
| | |
REAL ESTATE — 0.60% | | | | | | |
REAL ESTATE INVESTMENT TRUSTS — 0.60% | | | | | | |
Alexandria Real Estate Pfd, 7.00% | | | 50,000 | | | 1,138,500 |
| | | | | | |
| | | | | | 1,138,500 |
| | | | | | |
TOTAL PREFERRED STOCK (Cost $7,277,825) | | | | | | 7,578,807 |
| | | | | | |
| | |
ASSET BACKED SECURITIES — 3.22% | | | | | | |
| | |
BANKS — 0.08% | | | | | | |
COMMERCIAL BANKS — 0.08% | | | | | | |
CW Capital Colbalt Series 2007-C2 Class A1, 5.064%, 9/15/2011 | | $ | 6,740 | | | 6,797 |
Greenwich Capital Commercial Funding Corp. Series 2007-GG9 Class A1, 5.233%, 3/10/2039 | | | 1,332 | | | 1,331 |
Wachovia Bank Commercial Mtg Trust Series 2007-C30 Class A1, 5.031%, 12/15/2043 | | | 17,450 | | | 17,741 |
Wachovia Bank Commercial Mtg Trust Series 2007-C31 Class A1, 5.14%, 4/15/2047 | | | 10,342 | | | 10,512 |
Wells Fargo Asset Securities Corp. Series 2005-AR1 Class B1, 2.876%, 2/25/2035 | | | 396,692 | | | 57,866 |
Wells Fargo Asset Securities Corp. Series 2005-AR2 Class B1, 3.507%, 3/25/2035 | | | 393,137 | | | 45,335 |
| | | | | | |
| | | | | | 139,582 |
| | | | | | |
| | |
DIVERSIFIED FINANCIALS — 1.61% | | | | | | |
CAPITAL MARKETS — 0.73% | | | | | | |
Bear Stearns ARM Mtg Series 2003-6 Class 2B-1, 4.803%, 8/25/2033 | | | 765,837 | | | 375,023 |
Bear Stearns Commercial Mtg Securities Series 2007-PW15 Class A1, 5.016%, 2/11/2044 | | | 3,092 | | | 3,169 |
Bear Stearns Commercial Mtg Securities Series 2007-T26 Class A1, 5.145%, 1/12/2045 | | | 48,148 | | | 49,098 |
Bear Stearns Commercial Mtg Securities Series 2007-T28 Class A1, 5.422%, 9/11/2042 | | | 23,305 | | | 24,184 |
Credit Suisse Mtg Capital Certificates Series 2007-C1 Class A1, 5.227%, 2/15/2040 | | | 13,446 | | | 13,660 |
Credit Suisse Mtg Capital Certificates Series 2007-C2 Class A1, 5.269%, 1/15/2049 | | | 5,154 | | | 5,205 |
Credit Suisse Mtg Capital Certificates Series 2007-C3 Class A1, 5.664%, 6/15/2039 | | | 11,063 | | | 11,266 |
GS Mtg Securities Corp. II Series 2007-GG10 Class A1, 5.69%, 8/10/2045 | | | 26,879 | | | 27,805 |
LB-UBS Commercial Mtg Trust Series 2007-C1 Class A1, 5.391%, 2/15/2040 | | | 12,411 | | | 12,683 |
LB-UBS Commercial Mtg Trust Series 2007-C2 Class A1, 5.226%, 2/17/2040 | | | 9,219 | | | 9,372 |
Merrill Lynch Mtg Investors Trust, 3.115%, 8/25/2034 | | | 349,819 | | | 141,869 |
Merrill Lynch Mtg Trust, 5.212%, 11/12/2037 | | | 550,000 | | | 558,246 |
Merrill Lynch/Countrywide Commercial Mtg Trust Series 2007-5 Class A1, 4.275%, 8/12/2048 | | | 8,596 | | | 8,698 |
Merrill Lynch/Countrywide Commercial Mtg Trust Series 2007-6 Class A1, 5.175%, 3/12/2051 | | | 11,457 | | | 11,680 |
Morgan Stanley Capital I Series 2007-HQ11 Class A1, 5.246%, 2/20/2044 | | | 21,712 | | | 22,214 |
Morgan Stanley Capital I Series 2007-IQ13 Class A1, 5.05%, 3/15/2044 | | | 21,202 | | | 21,728 |
Morgan Stanley Capital I Series 2007-IQ14 Class A1, 5.38%, 4/15/2049 | | | 47,269 | | | 49,013 |
Certified Semi-Annual Report 9
| | |
| SCHEDULE OF INVESTMENTS, CONTINUED | | |
| |
| Thornburg Strategic Income Fund | | March 31, 2010 (Unaudited) |
| | | | | | |
| | | Shares/
Principal Amount | | Value |
Morgan Stanley Capital I Series 2007-T25 Class A1, 5.391%, 11/12/2049 | | $ | 34,206 | | $ | 35,313 |
DIVERSIFIED FINANCIAL SERVICES — 0.88% | | | | | | |
Banc of America Commerical Mtg, Inc. Series 2007-2 Class A1, 5.421%, 1/10/2012 | | | 22,044 | | | 22,837 |
Banc of America Funding Corp. Series 2006-I Class SB1, 4.16%, 12/20/2036 | | | 981,901 | | | 82,450 |
Banc of America Mtg Services Series 2005-A Class B1, 3.521%, 2/25/2035 | | | 957,088 | | | 141,754 |
Citigroup Commercial Mtg Trust Series 2004-HYB2 Class B1, 4.101%, 3/25/2034 | | | 221,993 | | | 87,763 |
Citigroup Commercial Mtg Trust Series 2007-C6 Class A1, 5.622%, 12/10/2049 | | | 76,804 | | | 80,302 |
Citigroup/Deutsche Bank Commercial Mtg Series 2007-CD4 Class A1, 4.977%, 12/11/2049 | | | 33,109 | | | 33,568 |
Countrywide Series 2005-11 Class AF3, 4.778%, 2/25/2036 | | | 1,153,113 | | | 907,203 |
Countrywide Series 2006-15 Class A6, 5.826%, 10/25/2046 | | | 412,677 | | | 267,301 |
JPMorgan Chase Commercial Mtg Securities Corp. Series 2006-LDP9 Class A1, 5.17%, 5/15/2047 | | | 25,578 | | | 26,136 |
JPMorgan Chase Commercial Mtg Securities Corp. Series 2007-LDPX Class A1, 5.122%, 1/15/2049 | | | 12,072 | | | 12,331 |
| | | | | | |
| | | | | | 3,041,871 |
| | | | | | |
| | |
PHARMACEUTICALS, BIOTECHNOLOGY & LIFE SCIENCES — 0.77% | | | | | | |
PHARMACEUTICALS — 0.77% | | | | | | |
a QHP PhaRMA, 10.25%, 3/15/2015 | | | 1,436,895 | | | 1,452,485 |
| | | | | | |
| | | | | | 1,452,485 |
| | | | | | |
| | |
TRANSPORTATION — 0.76% | | | | | | |
AIRLINES — 0.76% | | | | | | |
a,b American Airlines Depositor Corp., 8.00%, 10/5/2010 | | | 1,500,000 | | | 1,440,000 |
| | | | | | |
| | | | | | 1,440,000 |
| | | | | | |
TOTAL ASSET BACKED SECURITIES (Cost $8,461,064) | | | | | | 6,073,938 |
| | | | | | |
| | |
CORPORATE BONDS — 68.87% | | | | | | |
| | |
AUTOMOBILES & COMPONENTS — 1.23% | | | | | | |
AUTO COMPONENTS — 0.14% | | | | | | |
a Affinia Group, Inc., 10.75%, 8/15/2016 | | | 250,000 | | | 272,500 |
AUTOMOBILES — 1.09% | | | | | | |
a American Honda Finance, 2.638%, 6/29/2011 | | | 500,000 | | | 509,781 |
a Harley Davidson Funding Corp. Series C, 6.80%, 6/15/2018 | | | 500,000 | | | 499,220 |
a,c Hyundai Capital Services, 6.00%, 5/5/2015 | | | 1,000,000 | | | 1,049,356 |
| | | | | | |
| | | | | | 2,330,857 |
| | | | | | |
| | |
BANKS — 7.70% | | | | | | |
COMMERCIAL BANKS — 7.70% | | | | | | |
a,c Banco Industrial e Comercial S.A., 6.25%, 1/20/2013 | | | 1,000,000 | | | 1,012,500 |
c Banco Industrial e Comercial S.A., 7.00%, 4/23/2010 | | | 500,000 | | | 498,750 |
a,b,c Banco Pine SA, 8.75%, 1/6/2017 | | | 1,000,000 | | | 995,000 |
Charter One Bank NA, 5.50%, 4/26/2011 | | | 250,000 | | | 256,169 |
a,c DBS Bank Ltd., 5.125%, 5/16/2017 | | | 200,000 | | | 207,180 |
a,c,d,e Islandsbanki, 4.41%, 10/15/2008 | | | 60,000 | | | 17,700 |
a,c,d,e LandsBanki Islands HF, 5.73%, 8/25/2009 | | | 175,000 | | | 20,125 |
National City Bank Floating Rate Note, 0.622%, 6/7/2017 | | | 1,000,000 | | | 890,628 |
a PNC Preferred Funding Trust III Floating Rate Note, 8.70%, 12/31/2049 | | | 500,000 | | | 523,850 |
Provident Bank MD, 9.50%, 5/1/2018 | | | 1,500,000 | | | 1,561,071 |
a,c Santander Issuances, 6.50%, 8/11/2019 | | | 1,000,000 | | | 1,047,442 |
c Shinhan Bank, 6.819%, 9/20/2036 | | | 100,000 | | | 96,999 |
Silicon Valley Bank, 6.05%, 6/1/2017 | | | 1,000,000 | | | 936,708 |
Sovereign Bank, 5.125%, 3/15/2013 | | | 100,000 | | | 102,504 |
Suntrust Bank, 7.25%, 3/15/2018 | | | 1,000,000 | | | 1,069,346 |
10 Certified Semi-Annual Report
| | |
| SCHEDULE OF INVESTMENTS, CONTINUED | | |
| |
| Thornburg Strategic Income Fund | | March 31, 2010 (Unaudited) |
| | | | | | |
| | | Shares/
Principal Amount | | Value |
Susquehanna Capital II, 11.00%, 3/23/2040 | | $ | 1,000,000 | | $ | 1,045,000 |
Webster Bank, 5.875%, 1/15/2013 | | | 2,000,000 | | | 1,844,580 |
Wells Fargo Capital XIII Preferred Note, 7.70%, 12/29/2049 | | | 500,000 | | | 516,250 |
Whitney National Bank, 5.875%, 4/1/2017 | | | 1,000,000 | | | 872,247 |
Zions Bancorp, 7.75%, 9/23/2014 | | | 1,000,000 | | | 1,008,620 |
| | | | | | |
| | | | | | 14,522,669 |
| | | | | | |
| | |
CAPITAL GOODS — 4.83% | | | | | | |
BUILDING PRODUCTS — 0.62% | | | | | | |
Owens Corning, Inc., 9.00%, 6/15/2019 | | | 1,000,000 | | | 1,178,407 |
INDUSTRIAL CONGLOMERATES — 2.72% | | | | | | |
General Electric Capital Corp., 0.411%, 6/20/2014 | | | 1,000,000 | | | 948,918 |
Otter Tail Corp., 9.00%, 12/15/2016 | | | 3,000,000 | | | 3,105,000 |
a,c Smiths Group plc, 6.05%, 5/15/2014 | | | 500,000 | | | 541,210 |
c Tyco International Finance SA, 6.375%, 10/15/2011 | | | 500,000 | | | 538,715 |
MACHINERY — 0.89% | | | | | | |
Ingersoll-Rand Co., 9.50%, 4/15/2014 | | | 500,000 | | | 606,268 |
Timken Co., 6.00%, 9/15/2014 | | | 1,000,000 | | | 1,063,471 |
TRADING COMPANIES & DISTRIBUTORS — 0.60% | | | | | | |
a,c Noble Group Ltd. Mtg, 8.50%, 5/30/2013 | | | 1,000,000 | | | 1,123,750 |
| | | | | | |
| | | | | | 9,105,739 |
| | | | | | |
| | |
CONSUMER DURABLES & APPAREL — 2.02% | | | | | | |
HOUSEHOLD DURABLES — 2.02% | | | | | | |
a,c Corporativo Javer SA, 13.00%, 8/4/2014 | | | 1,000,000 | | | 1,142,500 |
Fortune Brands, Inc., 6.375%, 6/15/2014 | | | 500,000 | | | 547,191 |
a Freedom Group, Inc., 10.25%, 8/1/2015 | | | 1,000,000 | | | 1,057,500 |
a Freedom Group, Inc., 10.25%, 8/1/2015 | | | 1,000,000 | | | 1,057,500 |
| | | | | | |
| | | | | | 3,804,691 |
| | | | | | |
| | |
CONSUMER SERVICES — 0.56% | | | | | | |
HOTELS, RESTAURANTS & LEISURE — 0.56% | | | | | | |
a MGM Mirage, Inc., 9.00%, 3/15/2020 | | | 500,000 | | | 515,000 |
a,c TDIC Finance Ltd., 6.50%, 7/2/2014 | | | 500,000 | | | 534,775 |
| | | | | | |
| | | | | | 1,049,775 |
| | | | | | |
| | |
DIVERSIFIED FINANCIALS — 3.86% | | | | | | |
CAPITAL MARKETS — 1.19% | | | | | | |
a,d,e Lehman Brothers Holdings, Inc., 5.625%, 1/24/2013 | | | 200,000 | | | 47,000 |
a,c Macquarie Group Ltd., 7.30%, 8/1/2014 | | | 1,000,000 | | | 1,116,612 |
a Morgan Stanley, 10.09%, 5/3/2017 | | | 2,000,000 | | | 1,085,276 |
CONSUMER FINANCE — 0.84% | | | | | | |
American Express Credit Corp., 5.875%, 5/2/2013 | | | 500,000 | | | 541,615 |
North Fork Bancorp, Inc., 5.875%, 8/15/2012 | | | 1,000,000 | | | 1,049,714 |
DIVERSIFIED FINANCIAL SERVICES — 1.83% | | | | | | |
Bank of America Corp., 7.375%, 5/15/2014 | | | 1,000,000 | | | 1,124,541 |
a Citicorp Series 1999-1 Class 2, 8.04%, 12/15/2019 | | | 250,000 | | | 275,757 |
Citigroup, Inc., 5.00%, 9/15/2014 | | | 750,000 | | | 748,943 |
b Counts Series 1998 II-A, 6.67%, 2/15/2018 | | | 223,531 | | | 172,119 |
c Export-Import Bank of Korea, 8.125%, 1/21/2014 | | | 250,000 | | | 290,028 |
c Korea Development Bank, 0.391%, 4/6/2010 | | | 300,000 | | | 300,000 |
c Korea Development Bank, 5.30%, 1/17/2013 | | | 200,000 | | | 212,318 |
Certified Semi-Annual Report 11
| | |
| SCHEDULE OF INVESTMENTS, CONTINUED | | |
| |
| Thornburg Strategic Income Fund | | March 31, 2010 (Unaudited) |
| | | | | | |
| | | Shares/
Principal Amount | | Value |
MBNA Corp., 6.125%, 3/1/2013 | | $ | 305,000 | | $ | 327,544 |
| | | | | | |
| | | | | | 7,291,467 |
| | | | | | |
| | |
ENERGY — 8.63% | | | | | | |
ENERGY EQUIPMENT & SERVICES — 0.55% | | | | | | |
Seacor Holdings, Inc., 7.375%, 10/1/2019 | | | 1,000,000 | | | 1,029,353 |
OIL, GAS & CONSUMABLE FUELS — 8.08% | | | | | | |
a,c Bumi Capital PTE Ltd., 12.00%, 11/10/2016 | | | 1,000,000 | | | 1,092,500 |
a Cloud Peak Energy, Inc., 8.25%, 12/15/2017 | | | 1,000,000 | | | 1,020,000 |
a DCP Midstream LLC, 9.75%, 3/15/2019 | | | 500,000 | | | 640,988 |
El Paso Corp., 7.75%, 6/15/2010 | | | 55,000 | | | 55,542 |
Enbridge Energy Partners LP, 9.875%, 3/1/2019 | | | 250,000 | | | 324,861 |
Energy Transfer Partners LP, 8.50%, 4/15/2014 | | | 500,000 | | | 581,665 |
Enterprise Products Operating LP, 9.75%, 1/31/2014 | | | 250,000 | | | 303,574 |
Enterprise Products Operating LP, 7.034%, 1/15/2068 | | | 1,100,000 | | | 1,046,375 |
Forest Oil Corp., 8.50%, 2/15/2014 | | | 500,000 | | | 527,500 |
a,c Gaz Capital SA, 7.51%, 7/31/2013 | | | 1,000,000 | | | 1,088,746 |
Inergy LP/Inergy Finance Corp., 8.75%, 3/1/2015 | | | 500,000 | | | 523,125 |
Kinder Morgan Energy Partners LP, 9.00%, 2/1/2019 | | | 250,000 | | | 311,926 |
a Maritimes & Northeast Pipeline LLC, 7.50%, 5/31/2014 | | | 980,900 | | | 1,073,026 |
a Niska Gas Storage, 8.875%, 3/15/2018 | | | 1,500,000 | | | 1,533,750 |
a,c Petro Co. Trinidad Tobago Ltd., 9.75%, 8/14/2019 | | | 1,000,000 | | | 1,137,500 |
a,c Petroplus Finance Ltd., 6.75%, 5/1/2014 | | | 1,000,000 | | | 900,000 |
Plains All American Pipeline, LP, 8.75%, 5/1/2019 | | | 1,000,000 | | | 1,219,968 |
Sunoco Logistics Partners LP, 8.75%, 2/15/2014 | | | 500,000 | | | 579,841 |
Teppco Partners LP, 7.00%, 6/1/2067 | | | 500,000 | | | 458,750 |
c Trans-Canada Pipelines Ltd., 6.35%, 5/15/2067 | | | 275,000 | | | 261,661 |
a,c Woodside Finance Ltd., 8.125%, 3/1/2014 | | | 500,000 | | | 572,648 |
| | | | | | |
| | | | | | 16,283,299 |
| | | | | | |
| | |
FOOD, BEVERAGE & TOBACCO — 1.63% | | | | | | |
BEVERAGES — 0.73% | | | | | | |
Anheuser Busch Cos., Inc., 4.70%, 4/15/2012 | | | 250,000 | | | 264,364 |
a,c Bacardi Ltd., 7.45%, 4/1/2014 | | | 500,000 | | | 571,683 |
Constellation Brands, Inc., 8.375%, 12/15/2014 | | | 500,000 | | | 540,625 |
FOOD PRODUCTS — 0.31% | | | | | | |
Bunge Ltd. Finance Co., 5.10%, 7/15/2015 | | | 321,000 | | | 329,760 |
Treehouse Foods, Inc., 7.75%, 3/1/2018 | | | 250,000 | | | 259,375 |
TOBACCO — 0.59% | | | | | | |
Lorillard Tobacco Co, 8.125%, 6/23/2019 | | | 1,000,000 | | | 1,101,697 |
| | | | | | |
| | | | | | 3,067,504 |
| | | | | | |
| | |
HEALTH CARE EQUIPMENT & SERVICES — 0.29% | | | | | | |
HEALTH CARE EQUIPMENT & SUPPLIES — 0.29% | | | | | | |
Beckman Coulter, Inc., 6.00%, 6/1/2015 | | | 500,000 | | | 544,317 |
| | | | | | |
| | | | | | 544,317 |
| | | | | | |
| | |
INDUSTRIALS — 0.53% | | | | | | |
CAPITAL GOODS — 0.53% | | | | | | |
a,b Da-Lite Screen Co., Inc., 12.50%, 4/1/2015 | | | 1,000,000 | | | 995,000 |
| | | | | | |
| | | | | | 995,000 |
| | | | | | |
12 Certified Semi-Annual Report
| | |
| SCHEDULE OF INVESTMENTS, CONTINUED | | |
| |
| Thornburg Strategic Income Fund | | March 31, 2010 (Unaudited) |
| | | | | | |
| | | Shares/
Principal Amount | | Value |
INSURANCE — 9.00% | | | | | | |
INSURANCE — 9.00% | | | | | | |
a International Lease Finance Corp., 8.625%, 9/15/2015 | | $ | 2,000,000 | | $ | 2,044,514 |
International Lease Finance Corp., 4.875%, 9/1/2010 | | | 1,000,000 | | | 999,991 |
a National Life Insurance of Vermont, 10.50%, 9/15/2039 | | | 1,000,000 | | | 1,070,391 |
Northwind Holdings LLC Series 2007-1A Class A1, 1.032%, 12/1/2037 | | | 1,679,795 | | | 1,393,944 |
a,b,c Oil Casualty Insurance, 8.00%, 9/15/2034 | | | 1,934,000 | | | 1,653,570 |
a,c Oil Insurance Ltd., 7.558%, 12/29/2049 | | | 1,000,000 | | | 864,970 |
a Prudential Holdings LLC, 8.695%, 12/18/2023 | | | 585,000 | | | 673,932 |
a,c QBE Insurance Group Ltd., 9.75%, 3/14/2014 | | | 668,000 | | | 811,831 |
a,c QBE Insurance Group Ltd., 5.647%, 7/1/2023 | | | 1,000,000 | | | 931,693 |
a,c Swiss Re Capital I, LP, 6.854%, 5/29/2049 | | | 3,000,000 | | | 2,737,395 |
Torchmark, Inc., 9.25%, 6/15/2019 | | | 1,000,000 | | | 1,197,728 |
Transatlantic Holdings, Inc., 5.75%, 12/14/2015 | | | 1,000,000 | | | 1,020,290 |
Unum Group, 7.125%, 9/30/2016 | | | 500,000 | | | 543,518 |
f Willis North America, Inc., 7.00%, 9/29/2019 | | | 1,000,000 | | | 1,047,186 |
| | | | | | |
| | | | | | 16,990,953 |
| | | | | | |
| | |
MATERIALS — 2.72% | | | | | | |
CHEMICALS — 0.60% | | | | | | |
a Chevron Phillips Chemical, 7.00%, 6/15/2014 | | | 1,000,000 | | | 1,126,559 |
CONSTRUCTION MATERIALS — 0.26% | | | | | | |
Martin Marietta Materials, Inc. LIBOR Floating Rate Note, 0.399%, 4/30/2010 | | | 500,000 | | | 499,426 |
CONTAINERS & PACKAGING — 0.29% | | | | | | |
a Plastipak Holdings, Inc., 10.625%, 8/15/2019 | | | 500,000 | | | 556,250 |
METALS & MINING — 1.25% | | | | | | |
Allegheny Technologies, Inc., 9.375%, 6/1/2019 | | | 1,000,000 | | | 1,163,522 |
Freeport-McMoRan Copper & Gold, Inc., 8.25%, 4/1/2015 | | | 500,000 | | | 544,375 |
a,c Posco, 8.75%, 3/26/2014 | | | 500,000 | | | 593,694 |
c Rio Tinto Alcan, Inc., 5.00%, 6/1/2015 | | | 50,000 | | | 52,390 |
MISCELLANEOUS — 0.32% | | | | | | |
a,c Anglo American Capital, 9.375%, 4/8/2014 | | | 500,000 | | | 600,610 |
| | | | | | |
| | | | | | 5,136,826 |
| | | | | | |
| | |
MEDIA — 2.11% | | | | | | |
MEDIA — 2.11% | | | | | | |
CBS Corp., 8.20%, 5/15/2014 | | | 500,000 | | | 583,752 |
DIRECTV Holdings LLC, 6.375%, 6/15/2015 | | | 900,000 | | | 934,875 |
Echostar DBS Corp., 7.75%, 5/31/2015 | | | 1,000,000 | | | 1,045,000 |
Washington Post Co., 7.25%, 2/1/2019 | | | 500,000 | | | 561,933 |
a,b Yahoo! Inc., 6.65%, 8/10/2026 | | | 976,113 | | | 858,979 |
| | | | | | |
| | | | | | 3,984,539 |
| | | | | | |
| | |
PHARMACEUTICALS, BIOTECHNOLOGY & LIFE SCIENCES — 0.68% | | | | | | |
BIOTECHNOLOGY — 0.53% | | | | | | |
a Talecris Biotherapeutics, 7.75%, 11/15/2016 | | | 1,000,000 | | | 1,005,000 |
PHARMACEUTICALS — 0.15% | | | | | | |
Axcan Intermediate Holdings, Inc., 12.75%, 3/1/2016 | | | 250,000 | | | 275,000 |
| | | | | | |
| | | | | | 1,280,000 |
| | | | | | |
Certified Semi-Annual Report 13
| | |
| SCHEDULE OF INVESTMENTS, CONTINUED | | |
| |
| Thornburg Strategic Income Fund | | March 31, 2010 (Unaudited) |
| | | | | | |
| | | Shares/
Principal Amount | | Value |
REAL ESTATE — 0.14% | | | | | | |
REAL ESTATE INVESTMENT TRUSTS — 0.14% | | | | | | |
HRPT Properties Trust, 0.857%, 3/16/2011 | | $ | 275,000 | | $ | 270,641 |
| | | | | | |
| | | | | | 270,641 |
| | | | | | |
| | |
RETAILING — 1.72% | | | | | | |
INTERNET & CATALOG RETAIL — 0.30% | | | | | | |
Ticketmaster, 10.75%, 8/1/2016 | | | 500,000 | | | 557,500 |
MULTILINE RETAIL — 0.16% | | | | | | |
c Parkson Retail Group, 7.125%, 5/30/2012 | | | 300,000 | | | 310,293 |
SPECIALTY RETAIL — 1.26% | | | | | | |
Best Buy, Inc., 6.75%, 7/15/2013 | | | 500,000 | | | 559,637 |
Nebraska Book Co., 10.00%, 12/1/2011 | | | 1,250,000 | | | 1,290,625 |
Staples, Inc., 7.75%, 4/1/2011 | | | 500,000 | | | 530,530 |
| | | | | | |
| | | | | | 3,248,585 |
| | | | | | |
| | |
SEMICONDUCTORS & SEMICONDUCTOR EQUIPMENT — 1.10% | | | | | | |
SEMICONDUCTORS & SEMICONDUCTOR EQUIPMENT — 1.10% | | | | | | |
KLA Instruments Corp., 6.90%, 5/1/2018 | | | 1,000,000 | | | 1,084,774 |
National Semiconductor, 0.507%, 6/15/2010 | | | 1,000,000 | | | 998,822 |
| | | | | | |
| | | | | | 2,083,596 |
| | | | | | |
| | |
TECHNOLOGY HARDWARE & EQUIPMENT — 0.27% | | | | | | |
COMMUNICATIONS EQUIPMENT — 0.27% | | | | | | |
Motorola, Inc., 7.625%, 11/15/2010 | | | 500,000 | | | 518,265 |
| | | | | | |
| | | | | | 518,265 |
| | | | | | |
| | |
TELECOMMUNICATION SERVICES — 6.02% | | | | | | |
DIVERSIFIED TELECOMMUNICATION SERVICES — 4.56% | | | | | | |
a,c Global Crossing Ltd., 12.00%, 9/15/2015 | | | 1,000,000 | | | 1,110,000 |
Level 3 Financing, Inc., 9.25%, 11/1/2014 | | | 700,000 | | | 682,500 |
a,g New Communications Holdings, 8.25%, 4/15/2017 | | | 1,000,000 | | | 1,017,500 |
Qwest Corp., 8.875%, 3/15/2012 | | | 1,000,000 | | | 1,095,000 |
Qwest Corp., 8.375%, 5/1/2016 | | | 500,000 | | | 562,500 |
c Telecom Italia Capital, 0.861%, 7/18/2011 | | | 550,000 | | | 547,590 |
a,c Vimpelcom, 8.25%, 5/23/2016 | | | 500,000 | | | 544,375 |
Windstream Corp., 7.875%, 11/1/2017 | | | 1,000,000 | | | 985,000 |
Windstream Corp., 8.125%, 8/1/2013 | | | 1,000,000 | | | 1,047,500 |
a Zayo Group LLC., 10.25%, 3/15/2017 | | | 1,000,000 | | | 1,010,000 |
WIRELESS TELECOMMUNICATION SERVICES — 1.46% | | | | | | |
Crown Castle International Corp., 9.00%, 1/15/2015 | | | 500,000 | | | 541,250 |
a,c Digicel Group Ltd., 10.50%, 4/15/2018 | | | 1,600,000 | | | 1,660,000 |
a,c Digicel SA, 12.00%, 4/1/2014 | | | 500,000 | | | 566,250 |
| | | | | | |
| | | | | | 11,369,465 |
| | | | | | |
| | |
TRANSPORTATION — 2.98% | | | | | | |
AIR FREIGHT & LOGISTICS — 0.27% | | | | | | |
FedEx Corp., 8.76%, 5/22/2015 | | | 455,875 | | | 513,689 |
AIRLINES — 1.10% | | | | | | |
a Jet Equipment Trust, 9.41%, 6/15/2010 | | | 1,716,235 | | | 1,528,685 |
United Air Lines, Inc., 12.75%, 7/15/2012 | | | 500,000 | | | 550,625 |
14 Certified Semi-Annual Report
| | |
| SCHEDULE OF INVESTMENTS, CONTINUED | | |
| |
| Thornburg Strategic Income Fund | | March 31, 2010 (Unaudited) |
| | | | | | |
| | | Shares/
Principal Amount | | Value |
MARINE — 1.31% | | | | | | |
Commercial Barge Line Co., 12.50%, 7/15/2017 | | $ | 500,000 | | $ | 525,625 |
a United Maritime LLC, 11.75%, 6/15/2015 | | | 1,000,000 | | | 1,025,000 |
a Windsor Petroleum Transport Corp., 7.84%, 1/15/2021 | | | 988,394 | | | 909,893 |
ROAD & RAIL — 0.30% | | | | | | |
Ryder System, Inc., 7.20%, 9/1/2015 | | | 500,000 | | | 562,687 |
| | | | | | |
| | | | | | 5,616,204 |
| | | | | | |
| | |
UTILITIES — 10.85% | | | | | | |
ELECTRIC UTILITIES — 4.22% | | | | | | |
Alabama Power Capital Trust V, 3.351%, 10/1/2042 | | | 700,000 | | | 700,000 |
Aquila, Inc., 7.95%, 2/1/2011 | | | 500,000 | | | 525,528 |
Arizona Public Service Co., 8.75%, 3/1/2019 | | | 500,000 | | | 605,944 |
Comed Financing III, 6.35%, 3/15/2033 | | | 1,500,000 | | | 1,192,177 |
Commonwealth Edison, 6.15%, 3/15/2012 | | | 300,000 | | | 324,944 |
Entergy Texas, Inc., 7.125%, 2/1/2019 | | | 500,000 | | | 560,715 |
FPL Group Capital, Inc., 6.65%, 6/15/2067 | | | 1,000,000 | | | 950,000 |
Illinois Power Co., 9.75%, 11/15/2018 | | | 500,000 | | | 640,822 |
a Kansas Gas & Electric Co., 6.70%, 6/15/2019 | | | 500,000 | | | 562,647 |
a,c Listrindo Capital BV, 9.25%, 1/29/2015 | | | 500,000 | | | 541,830 |
Metropolitan Edison, 7.70%, 1/15/2019 | | | 250,000 | | | 291,010 |
a,c Taqa Abu Dhabi National Energy Co., 6.60%, 8/1/2013 | | | 1,000,000 | | | 1,063,241 |
GAS UTILITIES — 2.38% | | | | | | |
a Ferrellgas Partners LP, 9.125%, 10/1/2017 | | | 1,500,000 | | | 1,571,250 |
a Source Gas LLC., 5.90%, 4/1/2017 | | | 1,000,000 | | | 922,198 |
Southern Union Co., 7.20%, 11/1/2066 | | | 1,600,000 | | | 1,484,000 |
Suburban Propane Partners LP, 7.375%, 3/15/2020 | | | 500,000 | | | 508,125 |
INDEPENDENT POWER PRODUCERS & ENERGY TRADERS — 0.25% | | | | | | |
RRI Energy, Inc., 7.625%, 6/15/2014 | | | 500,000 | | | 467,500 |
MULTI-UTILITIES — 4.00% | | | | | | |
Amerenenergy Generating Co., 7.00%, 4/15/2018 | | | 1,000,000 | | | 1,067,326 |
Black Hills Corp., 9.00%, 5/15/2014 | | | 500,000 | | | 577,217 |
DTE Energy Co., 7.625%, 5/15/2014 | | | 1,000,000 | | | 1,137,645 |
a Enogex LLC, 6.875%, 7/15/2014 | | | 1,000,000 | | | 1,070,870 |
NiSource Finance Corp., 6.40%, 3/15/2018 | | | 1,130,000 | | | 1,211,598 |
Sempra Energy, 9.80%, 2/15/2019 | | | 250,000 | | | 324,902 |
a Texas-New Mexico Power, 9.50%, 4/1/2019 | | | 1,000,000 | | | 1,218,330 |
Wisconsin Energy Corp., 6.25%, 5/15/2067 | | | 1,000,000 | | | 950,000 |
| | | | | | |
| | | | | | 20,469,819 |
| | | | | | |
TOTAL CORPORATE BONDS (Cost $116,278,801) | | | | | | 129,964,211 |
| | | | | | |
| | |
CONVERTIBLE BONDS — 4.42% | | | | | | |
| | |
COMMERCIAL & PROFESSIONAL SERVICES — 0.25% | | | | | | |
COMMERCIAL SERVICES & SUPPLIES — 0.25% | | | | | | |
Covanta Holding Corp., 1.00%, 2/1/2027 | | | 500,000 | | | 469,375 |
| | | | | | |
| | | | | | 469,375 |
| | | | | | |
| | |
DIVERSIFIED FINANCIALS — 0.92% | | | | | | |
DIVERSIFIED FINANCIAL SERVICES — 0.92% | | | | | | |
KKR Financial Holdings LLC, 7.50%, 1/15/2017 | | | 1,000,000 | | | 1,221,250 |
Certified Semi-Annual Report 15
| | |
| SCHEDULE OF INVESTMENTS, CONTINUED | | |
| |
| Thornburg Strategic Income Fund | | March 31, 2010 (Unaudited) |
| | | | | | |
| | | Shares/
Principal Amount | | Value |
KKR Financial Holdings LLC, 7.00%, 7/15/2012 | | $ | 505,000 | | $ | 505,000 |
| | | | | | |
| | | | | | 1,726,250 |
| | | | | | |
| | |
ENERGY — 0.34% | | | | | | |
ENERGY EQUIPMENT & SERVICES — 0.34% | | | | | | |
Global Industries Ltd., 2.75%, 8/1/2027 | | | 1,000,000 | | | 647,500 |
| | | | | | |
| | | | | | 647,500 |
| | | | | | |
| | |
MEDIA — 0.23% | | | | | | |
MEDIA — 0.23% | | | | | | |
a,c Central European Media, 3.50%, 3/15/2013 | | | 500,000 | | | 429,375 |
| | | | | | |
| | | | | | 429,375 |
| | | | | | |
| | |
REAL ESTATE — 0.91% | | | | | | |
REAL ESTATE INVESTMENT TRUSTS — 0.91% | | | | | | |
a MPT Operating Partnership LP, 6.125%, 11/15/2011 | | | 1,250,000 | | | 1,228,125 |
Washington REIT, 3.875%, 9/15/2026 | | | 500,000 | | | 495,625 |
| | | | | | |
| | | | | | 1,723,750 |
| | | | | | |
| | |
TELECOMMUNICATION SERVICES — 1.77% | | | | | | |
DIVERSIFIED TELECOMMUNICATION SERVICES — 1.02% | | | | | | |
Global Crossing Ltd., 5.00%, 5/15/2011 | | | 1,000,000 | | | 998,750 |
Level 3 Communications, Inc., 10.00%, 5/1/2011 | | | 900,000 | | | 924,750 |
WIRELESS TELECOMMUNICATION SERVICES — 0.75% | | | | | | |
NII Holdings, Inc., 3.125%, 6/15/2012 | | | 1,500,000 | | | 1,415,625 |
| | | | | | |
| | | | | | 3,339,125 |
| | | | | | |
TOTAL CONVERTIBLE BONDS (Cost $7,204,223) | | | | | | 8,335,375 |
| | | | | | |
| | |
MUNICIPAL BONDS — 2.32% | | | | | | |
Louisiana Public Facilities Authority Revenue (Black & Gold Facilities Project C), 5.15%, 4/1/2012 | | | 175,000 | | | 173,637 |
Michigan Higher Education Student Loan Authority, 3.95%, 3/1/2011 | | | 250,000 | | | 244,387 |
a Midwest Family Housing, 5.168%, 7/1/2016 | | | 955,000 | | | 829,675 |
Oakland California Redevelopment Agency, 8.00%, 9/1/2016 | | | 1,000,000 | | | 1,017,390 |
Ohio State Solid Waste (Republic Services Project), 4.25%, 4/1/2033 | | | 900,000 | | | 899,343 |
Pennsylvania Economic Development Series A (Waste Management, Inc. Project), 4.70%, 11/1/2021 | | | 600,000 | | | 635,970 |
Wisconsin State Health & Educational Facilities (Richland Hospital), 7.08%, 6/1/2016 | | | 655,000 | | | 574,101 |
| | | | | | |
TOTAL MUNICIPAL BONDS (Cost $4,122,965) | | | | | | 4,374,503 |
| | | | | | |
| | |
U.S. TREASURY SECURITIES — 1.05% | | | | | | |
U.S. Treasury, 2.25%, 1/31/2015 | | | 2,000,000 | | | 1,978,438 |
| | | | | | |
TOTAL U.S. TREASURY SECURITIES (Cost $1,991,839) | | | | | | 1,978,438 |
| | | | | | |
| | |
U.S. GOVERNMENT AGENCIES — 0.45% | | | | | | |
a Agribank FCB, 9.125%, 7/15/2019 | | | 750,000 | | | 853,245 |
| | | | | | |
TOTAL U.S. GOVERNMENT AGENCIES (Cost $750,000) | | | | | | 853,245 |
| | | | | | |
| | |
MORTGAGE BACKED — 0.01% | | | | | | |
Federal National Mtg Assoc. CMO Series 1994-37 Class L, 6.50%, 3/25/2024 | | | 13,101 | | | 14,164 |
Federal National Mtg Assoc. Interest Only, 5.50%, 7/15/2030 | | | 79,700 | | | 11 |
| | | | | | |
TOTAL MORTGAGE BACKED (Cost $13,158) | | | | | | 14,175 |
| | | | | | |
16 Certified Semi-Annual Report
| | |
| SCHEDULE OF INVESTMENTS, CONTINUED | | |
| |
| Thornburg Strategic Income Fund | | March 31, 2010 (Unaudited) |
| | | | | | |
| | | Shares/
Principal Amount | | Value |
FOREIGN BONDS — 6.39% | | | | | | |
| | |
BANKS — 0.45% | | | | | | |
COMMERCIAL BANKS — 0.45% | | | | | | |
NRW.Bank (NOK) | | $ | 5,000,000 | | $ | 842,202 |
| | | | | | |
| | | | | | 842,202 |
| | | | | | |
| | |
CONSUMER SERVICES — 0.10% | | | | | | |
HOTELS, RESTAURANTS & LEISURE — 0.10% | | | | | | |
d,e FU JI Food (HKD), 0%, 10/18/2010 | | | 7,000,000 | | | 198,264 |
| | | | | | |
| | | | | | 198,264 |
| | | | | | |
| | |
DIVERSIFIED FINANCIALS — 0.94% | | | | | | |
CAPITAL MARKETS — 0.46% | | | | | | |
Morgan Stanley (AUD), 4.55%, 3/1/2013 | | | 1,000,000 | | | 879,009 |
CONSUMER FINANCE — 0.48% | | | | | | |
SLM Corp. (AUD), 6.00%, 12/15/2010 | | | 1,000,000 | | | 900,513 |
| | | | | | |
| | | | | | 1,779,522 |
| | | | | | |
| | |
FOOD & STAPLES RETAILING — 0.65% | | | | | | |
FOOD & STAPLES RETAILING — 0.65% | | | | | | |
Wesfarmers Ltd. (AUD), 6.967%, 9/11/2014 | | | 1,300,000 | | | 1,221,545 |
| | | | | | |
| | | | | | 1,221,545 |
| | | | | | |
| | |
FOOD, BEVERAGE & TOBACCO — 0.59% | | | | | | |
BEVERAGES — 0.59% | | | | | | |
a Ambev International Fin Co., Ltd. (BRL), 9.50%, 7/24/2017 | | | 2,000,000 | | | 1,113,392 |
| | | | | | |
| | | | | | 1,113,392 |
| | | | | | |
| | |
INSURANCE — 0.38% | | | | | | |
INSURANCE — 0.38% | | | | | | |
ELM BV (AUD), 7.635%, 12/31/2049 | | | 1,000,000 | | | 712,427 |
| | | | | | |
| | | | | | 712,427 |
| | | | | | |
| | |
MEDIA — 0.53% | | | | | | |
MEDIA — 0.53% | | | | | | |
a Corus Entertainment (CAD), 7.25%, 2/10/2017 | | | 1,000,000 | | | 1,002,599 |
| | | | | | |
| | | | | | 1,002,599 |
| | | | | | |
| | |
MISCELLANEOUS — 2.09% | | | | | | |
MISCELLANEOUS — 2.09% | | | | | | |
BK Nederlandse Gemeenten N.V. (NOK), 4.00%, 5/15/2015 | | | 5,000,000 | | | 848,953 |
Kommunalbanken AS (NOK), 4.00%, 1/26/2015 | | | 5,000,000 | | | 852,403 |
New South Wales Treasury Corp. (AUD), 3.75%, 11/20/2020 | | | 1,000,000 | | | 951,052 |
Republic of Brazil (BRL), 12.50%, 1/5/2016 | | | 2,025,000 | | | 1,295,267 |
| | | | | | |
| | | | | | 3,947,675 |
| | | | | | |
| | |
TELECOMMUNICATION SERVICES — 0.20% | | | | | | |
DIVERSIFIED TELECOMMUNICATION SERVICES — 0.20% | | | | | | |
Wind Acquisition Finance SA (EUR), 11.75%, 7/15/2017 | | | 250,000 | | | 374,805 |
| | | | | | |
| | | | | | 374,805 |
| | | | | | |
Certified Semi-Annual Report 17
| | |
| SCHEDULE OF INVESTMENTS, CONTINUED | | |
| |
| Thornburg Strategic Income Fund | | March 31, 2010 (Unaudited) |
| | | | | | |
| | | Shares/
Principal Amount | | Value |
UTILITIES — 0.46% | | | | | | |
INDUSTRIAL POWER PRODUCTION / ENERGY TRADING — 0.46% | | | | | | |
Alinta Networks Holdings (AUD), 4.50%, 9/21/2012 | | $ | 1,000,000 | | $ | 862,251 |
| | | | | | |
| | | | | | 862,251 |
| | | | | | |
TOTAL FOREIGN BONDS (Cost $11,814,917) | | | | | | 12,054,682 |
| | | | | | |
| | |
SHORT TERM INVESTMENTS — 1.69% | | | | | | |
Vulcan Materials Co., 0.25%, 4/1/2010 | | | 3,200,000 | | | 3,200,000 |
| | | | | | |
TOTAL SHORT TERM INVESTMENTS (Cost $3,200,000) | | | | | | 3,200,000 |
| | | | | | |
TOTAL INVESTMENTS — 99.06% (Cost $172,967,017) | | | | | $ | 186,938,556 |
OTHER ASSETS LESS LIABILITIES — 0.94% | | | | | | 1,773,495 |
| | | | | | |
NET ASSETS — 100.00% | | | | | $ | 188,712,051 |
| | | | | | |
Footnote Legend
| a | Securities exempt from registration under Rule 144A of the Securities Act of 1933, as amended. These securities may only be resold in the ordinary course of business in transactions exempt from registration, normally to qualified institutional buyers. As of March 31, 2010, the aggregate value of these securities in the Fund’s portfolio was $70,163,196, representing 37.2% of the Fund’s net assets. |
| b | Security currently fair valued by the valuation and pricing committee using procedures approved by the Trustees. |
| c | Yankee Bond - Denominated in U.S. dollars and is publicly issued in the U.S. by foreign banks and corporations. |
| f | Segregated as collateral for a when-issued security. |
Portfolio Abbreviations
To simplify the listings of securities, abbreviations are used per the table below:
| | |
ARM | | Adjustable Rate Mortgage |
AUD | | Denominated in Australian Dollars |
BRL | | Denominated in Brazilian Dollars |
CAD | | Denominated in Canadian Dollars |
CMO | | Collateralized Mortgage Obligation |
EUR | | Denominated in Euros |
FCB | | Farm Credit Bank |
HKD | | Denominated in Hong Kong Dollars |
LIBOR | | London Interbank Offered Rate |
Mtg | | Mortgage |
NOK | | Denominated in Norwegian Krone |
Pfd | | Preferred Stock |
REIT | | Real Estate Investment Trust |
18 Certified Semi-Annual Report
This page intentionally left blank.
Certified Semi-Annual Report 19
| | |
| STATEMENT OF ASSETS AND LIABILITIES | | |
| |
| Thornburg Strategic Income Fund | | March 31, 2010 (Unaudited) |
| | | |
ASSETS | | | |
Investments at value (cost $172,967,017) (Note 2) | | $ | 186,938,556 |
Cash | | | 175,134 |
Receivable for investments sold | | | 80,000 |
Receivable for fund shares sold | | | 935,933 |
Unrealized appreciation on forward currency contracts (Note 7) | | | 21,511 |
Dividends receivable | | | 255,825 |
Dividend and interest reclaim receivable | | | 75 |
Interest receivable | | | 2,724,288 |
Prepaid expenses and other assets | | | 32,515 |
| | | |
Total Assets | | | 191,163,837 |
| | | |
| |
LIABILITIES | | | |
Payable for securities purchased | | | 1,868,039 |
Payable for fund shares redeemed | | | 263,646 |
Payable to investment advisor and other affiliates (Note 3) | | | 181,485 |
Accounts payable and accrued expenses | | | 40,063 |
Dividends payable | | | 98,553 |
| | | |
Total Liabilities | | | 2,451,786 |
| | | |
| |
NET ASSETS | | $ | 188,712,051 |
| | | |
NET ASSETS CONSIST OF: | | | |
Undistributed net investment income | | $ | 186,321 |
Net unrealized appreciation on investments | | | 13,994,248 |
Accumulated net realized gain (loss) | | | 3,064,310 |
Net capital paid in on shares of beneficial interest | | | 171,467,172 |
| | | |
| | $ | 188,712,051 |
| | | |
20 Certified Semi-Annual Report
| | |
| STATEMENT OF ASSETS AND LIABILITIES, CONTINUED |
| |
| Thornburg Strategic Income Fund | | March 31, 2010 (Unaudited) |
| | | |
NET ASSET VALUE: | | | |
Class A Shares: | | | |
Net asset value and redemption price per share ($73,693,550 applicable to 6,120,065 shares of beneficial interest outstanding - Note 4) | | $ | 12.04 |
Maximum sales charge, 4.50% of offering price | | | 0.57 |
| | | |
Maximum offering price per share | | $ | 12.61 |
| | | |
| |
Class C Shares: | | | |
Net asset value and offering price per share * ($65,197,433 applicable to 5,419,930 shares of beneficial interest outstanding - Note 4) | | $ | 12.03 |
| | | |
| |
Class I Shares: | | | |
Net asset value, offering and redemption price per share ($49,821,068 applicable to 4,135,263 shares of beneficial interest outstanding - Note 4) | | $ | 12.05 |
| | | |
| * | Redemption price per share is equal to net asset value less any applicable contingent deferred sales charge. |
See notes to financial statements.
Certified Semi-Annual Report 21
| | |
| STATEMENT OF OPERATIONS | | |
| |
| Thornburg Strategic Income Fund | | Six Months Ended March 31, 2010 (Unaudited) |
| | | | |
INVESTMENT INCOME: | | | | |
Dividend income (net of foreign taxes withheld of $5,174) | | $ | 778,082 | |
Interest income (net of premium amortized of $34,058) | | | 6,201,905 | |
| | | | |
Total Income | | | 6,979,987 | |
| | | | |
| |
EXPENSES: | | | | |
Investment advisory fees (Note 3) | | | 635,924 | |
Administration fees (Note 3) | | | | |
Class A Shares | | | 40,321 | |
Class C Shares | | | 36,322 | |
Class I Shares | | | 11,738 | |
Distribution and service fees (Note 3) | | | | |
Class A Shares | | | 81,735 | |
Class C Shares | | | 293,198 | |
Transfer agent fees | | | | |
Class A Shares | | | 22,409 | |
Class C Shares | | | 26,973 | |
Class I Shares | | | 9,054 | |
Registration and filing fees | | | | |
Class A Shares | | | 9,103 | |
Class C Shares | | | 10,146 | |
Class I Shares | | | 9,333 | |
Custodian fees (Note 3) | | | 35,492 | |
Professional fees | | | 26,708 | |
Accounting fees | | | 2,633 | |
Trustee fees | | | 2,246 | |
Other expenses | | | 11,780 | |
| | | | |
Total Expenses | | | 1,265,115 | |
Less: | | | | |
Expenses reimbursed by investment advisor (Note 3) | | | (111,204 | ) |
Fees paid indirectly (Note 3) | | | (317 | ) |
| | | | |
Net Expenses | | | 1,153,594 | |
| | | | |
Net Investment Income | | $ | 5,826,393 | |
| | | | |
22 Certified Semi-Annual Report
| | |
| STATEMENT OF OPERATIONS, CONTINUED | | |
| |
| Thornburg Strategic Income Fund | | Six Months Ended March 31, 2010 (Unaudited) |
| | | | |
REALIZED AND UNREALIZED GAIN (LOSS) | | | | |
Net realized gain (loss) from: | | | | |
Investments | | $ | 3,433,683 | |
Forward currency contracts (Note 7) | | | 41,614 | |
Foreign currency transactions | | | 16,557 | |
| | | | |
| | | 3,491,854 | |
| | | | |
Net change in unrealized appreciation (depreciation) on: | | | | |
Investments | | | 3,158,880 | |
Forward currency contracts (Note 7) | | | 83,914 | |
Foreign currency translations | | | (3,928 | ) |
| | | | |
| | | 3,238,866 | |
| | | | |
Net Realized and Unrealized Gain | | | 6,730,720 | |
| | | | |
Net Increase in Net Assets Resulting From Operations | | $ | 12,557,113 | |
| | | | |
See notes to financial statements.
Certified Semi-Annual Report 23
STATEMENTS OF CHANGES IN NET ASSETS
Thornburg Strategic Income Fund
| | | | | | | | |
| | | Six Months Ended
March 31, 2010* | | | Year Ended
September 30, 2009 | |
INCREASE (DECREASE) IN NET ASSETS FROM: | | | | | | | | |
| | |
OPERATIONS: | | | | | | | | |
Net investment income | | $ | 5,826,393 | | | $ | 6,238,168 | |
Net realized gain (loss) on investments, forward currency contracts, and foreign currency transactions | | | 3,491,854 | | | | 688,902 | |
Increase (decrease) in unrealized appreciation (depreciation) on investments, forward currency contracts, and foreign currency translation | | | 3,238,866 | | | | 17,147,020 | |
| | | | | | | | |
| | |
Net Increase (Decrease) in Net Assets Resulting from Operations | | | 12,557,113 | | | | 24,074,090 | |
| | |
DIVIDENDS TO SHAREHOLDERS: | | | | | | | | |
From net investment income | | | | | | | | |
Class A Shares | | | (2,229,456 | ) | | | (2,278,787 | ) |
Class C Shares | | | (1,851,836 | ) | | | (1,843,592 | ) |
Class I Shares | | | (1,687,952 | ) | | | (2,093,817 | ) |
From realized gains | | | | | | | | |
Class A Shares | | | (274,801 | ) | | | — | |
Class C Shares | | | (238,982 | ) | | | — | |
Class I Shares | | | (197,906 | ) | | | — | |
| | |
FUND SHARE TRANSACTIONS (NOTE 4): | | | | | | | | |
Class A Shares | | | 13,556,271 | | | | 33,284,870 | |
Class C Shares | | | 11,336,414 | | | | 31,887,106 | |
Class I Shares | | | 3,782,057 | | | | 23,418,359 | |
| | | | | | | | |
| | |
Net Increase in Net Assets | | | 34,750,922 | | | | 106,448,229 | |
| | |
NET ASSETS: | | | | | | | | |
Beginning of Period | | | 153,961,129 | | | | 47,512,900 | |
| | | | | | | | |
| | |
End of Period | | $ | 188,712,051 | | | $ | 153,961,129 | |
| | | | | | | | |
| | |
Undistributed net investment income | | $ | 186,321 | | | $ | 129,172 | |
See notes to financial statements.
24 Certified Semi-Annual Report
| | |
| NOTES TO FINANCIAL STATEMENTS | | |
| |
| Thornburg Strategic Income Fund | | March 31, 2010 (Unaudited) |
NOTE 1 – ORGANIZATION
Thornburg Strategic Income Fund, hereinafter referred to as the “Fund,” is a diversified series of Thornburg Investment Trust (the “Trust”). The Fund commenced operations on December 19, 2007. The Trust was organized as a Massachusetts business trust under a Declaration of Trust dated June 3, 1987 and is registered as a diversified, open-end management investment company under the Investment Company Act of 1940, as amended. The Fund is currently one of sixteen separate series of the Trust. Each series is considered to be a separate entity for financial reporting and tax purposes and bears expenses directly attributable to it. The Fund’s primary investment goal is to seek a high level of current income. The Fund’s secondary investment goal is some long-term capital appreciation.
The Fund currently offers three classes of shares of beneficial interest: Class A, Class C, and Institutional Class (Class I) shares. Each class of shares of the Fund represents an interest in the same portfolio of investments, except that (i) Class A shares are sold subject to a front-end sales charge collected at the time the shares are purchased and bear a service fee, (ii) Class C shares are sold at net asset value without a sales charge at the time of purchase, but are subject to a contingent deferred sales charge upon redemption within one year of purchase, and bear both a service fee and a distribution fee, (iii) Class I shares are sold at net asset value without a sales charge at the time of purchase, and (iv) the respective classes may have different reinvestment privileges and conversion rights. Additionally, the Fund may allocate among its classes certain expenses, to the extent allowable to specific classes, including transfer agent fees, government registration fees, certain printing and postage costs, and administrative and legal expenses. Currently, class specific expenses of the Fund are limited to service and distribution fees, administration fees, and certain registration and transfer agent expenses.
NOTE 2 – SIGNIFICANT ACCOUNTING POLICIES
Significant accounting policies of the Trust are as follows:
Valuation of Investments: Portfolio securities listed or traded on a national securities exchange are valued on the valuation date at the last reported sale price on the exchange that is the primary market for the security. Portfolio securities traded on an exchange for which there has been no sale that day and other equity securities traded in the over-the-counter market are valued at the mean between the last reported bid and asked prices. Portfolio securities reported by NASDAQ are valued at the NASDAQ official closing price. Any foreign security traded on exchanges outside the United States is valued at the price of the security on the exchange that is normally the security’s primary market, as of the close of that exchange preceding the time of the Fund’s valuation.
Debt obligations held by the Fund have a primary market over the counter and are valued by an independent pricing service approved by the Trustees of the Trust. The pricing service ordinarily values debt obligations at quoted bid prices. When quotations are not available, debt obligations held by the Fund are valued at evaluated prices determined by the pricing service using methods which include consideration of yields or prices of debt obligations of comparable quality, type of issue, coupon, maturity and rating, and indications as to value from dealers and general market conditions. Short-term obligations having remaining maturities of 60 days or less are valued at amortized cost, which approximates market value.
Quotations in foreign currencies for foreign portfolio investments are converted to U.S. dollar equivalents using the foreign exchange quotation in effect at the time of valuation.
In any case where the market value of an equity security held by the Fund is not readily available, the Trust’s valuation and pricing committee determines a fair value for the security using procedures approved by the Trustees, which may include the use of a price obtained from an independent pricing service. The pricing service ordinarily values equity securities in these instances using multi-factor models to adjust market prices based upon various inputs, including exchange data, depository receipt prices, futures and index data and other data. A security’s market value is deemed not readily available whenever the exchange or market on which the security is primarily traded is closed for the entire scheduled day of trading. Additionally, a security’s market value may be deemed not readily available under other circumstances identified by the Trustees, including when developments occurring after the most recent close of the security’s primary exchange or market, but before the most recent close of trading in Fund shares, create a serious question about the reliability of the security’s market value.
In any case where a pricing service fails to provide a price for a debt obligation held by the Fund, the valuation and pricing committee determines a fair value for the debt obligation using procedures approved by the Trustees. Additionally, in any case where management believes that a price provided by a pricing service for a debt obligation held by the Fund may be unreliable, the valuation and pricing committee decides whether or not to use the pricing service’s valuation or to determine a fair value for the debt obligation.
Certified Semi-Annual Report 25
| | |
| NOTES TO FINANCIAL STATEMENTS, CONTINUED | | |
| |
| Thornburg Strategic Income Fund | | March 31, 2010 (Unaudited) |
In determining fair value for any portfolio security or other investment, the valuation and pricing committee seeks to determine the amount that an owner of the investment might reasonably expect to receive upon a sale of the investment. However, because fair value prices are estimated prices, the valuation and pricing committee’s determination of fair value for an investment may differ from the value that would be realized by the Fund upon a sale of the investment, and that difference could be material to the Fund’s financial statements. The valuation and pricing committee’s determination of fair value for an investment may also differ from the prices obtained by other persons (including other mutual funds) for the investment.
Valuation Measurements: Various inputs are used in determining the value of the Fund’s investments. These inputs are summarized in the three levels listed below.
Level 1: Quoted prices in active markets for identical investments.
Level 2: Other significant observable inputs (including quoted prices for similar investments, interest rates, prepayment rates, credit risk, etc.).
Level 3: Significant unobservable inputs (including the Fund’s own assumptions in determining the fair value of investments).
The following table displays a summary of the inputs used to value the Fund’s net assets as of March 31, 2010. In any instance when valuation inputs from more than one level are used to determine the fair value of a specific investment, the investment is placed in the level of the table based upon the lowest level input that is significant in determining the fair value of the investment:
| | | | | | | | | | | | |
| | | Fair Value Measurements at March 31, 2010 |
| | | Total | | Level 1 | | Level 2 | | Level 3 |
Assets | | | | | | | | | | | | |
Investments in Securities* | | | | | | | | | | | | |
Common Stock | | $ | 12,511,182 | | $ | 12,511,182 | | $ | — | | $ | — |
Preferred Stock | | | 7,578,807 | | | 4,891,312 | | | 2,687,495 | | | — |
Asset Backed Securities | | | 6,073,938 | | | — | | | 6,073,938 | | | — |
Corporate Bonds | | | 129,964,211 | | | — | | | 129,964,211 | | | — |
Convertible Bonds | | | 8,335,375 | | | — | | | 8,335,375 | | | — |
Municipal Bonds | | | 4,374,503 | | | — | | | 4,374,503 | | | — |
U.S. Treasury Securities | | | 1,978,438 | | | 1,978,438 | | | — | | | — |
U.S. Government Agencies | | | 853,245 | | | — | | | 853,245 | | | — |
Mortgage Backed | | | 14,175 | | | — | | | 14,175 | | | — |
Foreign Bonds | | | 12,054,682 | | | — | | | 12,054,682 | | | — |
Short Term Investments | | | 3,200,000 | | | — | | | 3,200,000 | | | — |
| | | | | | | | | | | | |
Total Investments in Securities | | $ | 186,938,556 | | $ | 19,380,932 | | $ | 167,557,624 | | $ | — |
Other Financial Instruments** | | | | | | | | | | | | |
Forward Currency Contracts | | $ | 21,511 | | $ | — | | $ | 21,511 | | $ | — |
| * | See Schedule of Investments for a summary of the industry exposure as grouped according to the Global Industry Classification Standard (GICS), which is an industry taxonomy developed by Morgan Stanley Capital International (MSCI), and Standard & Poor’s (S&P). |
| ** | Other Financial Instruments include investments not reflected in the Schedule of Investments, such as futures, forwards and swap contracts, which are valued at the unrealized appreciation (depreciation) on the instrument. |
Foreign Currency Translation: Portfolio securities and other assets and liabilities denominated in foreign currencies are translated into U.S. dollars based on the exchange rate of such currencies against the U.S. dollar on the date of valuation. Purchases and sales of securities and income items denominated in foreign currencies are translated into U.S. dollars at the exchange rate in effect on the translation date. When the Fund purchases or sells foreign securities it will customarily enter into a foreign exchange contract to minimize foreign exchange risk from the trade date to the settlement date of such transactions.
26 Certified Semi-Annual Report
| | |
| NOTES TO FINANCIAL STATEMENTS, CONTINUED | | |
| |
| Thornburg Strategic Income Fund | | March 31, 2010 (Unaudited) |
The Fund does not separately report the effect of changes in foreign exchange rates from changes in market prices on securities held. Such changes are included in net realized and unrealized gain or loss from investments.
Reported net realized foreign exchange gains or losses arise from sales of foreign currencies, currency gains or losses realized between the trade and settlement dates on securities transactions and the difference between the amounts of dividends, interest, and foreign withholding taxes recorded on the Fund’s books, and the U.S. dollar equivalent of the amounts actually received or paid.
Net unrealized foreign exchange gains and losses arise from changes in the fair value of assets and liabilities, other than investments in securities at fiscal period end, resulting from changes in exchange rates.
Deferred Taxes: The Fund is subject to a tax imposed on net realized gains of securities of certain foreign issuers. The Fund records an estimated deferred tax liability for net unrealized gains on these securities as reflected in the accompanying financial statements.
Federal Income Taxes: It is the policy of the Trust to comply with the provisions of the Internal Revenue Code applicable to “regulated investment companies” and to distribute to shareholders substantially all taxable income, including any net realized gain on investments of the Fund. Therefore, no provision for federal income taxes is required.
When-Issued and Delayed Delivery Transactions: The Fund may engage in when-issued or delayed delivery transactions. To the extent the Fund engages in such transactions, it will do so for the purpose of acquiring portfolio securities consistent with the Fund’s investment objectives and not for the purpose of investment leverage or to speculate on interest rate and/or market changes. At the time the Fund makes a commitment to purchase a security on a when-issued or delayed delivery basis, the Fund will record the transaction and reflect the value in determining its net asset value. When effecting such transactions, assets of an amount sufficient to make payment for the portfolio securities to be purchased will be segregated on the Fund’s records on the trade date. Securities purchased on a when-issued or delayed delivery basis do not earn interest until the settlement date.
Dividends: Dividends to shareholders are generally paid quarterly and are reinvested in additional shares of the Fund at net asset value per share at the close of business on the dividend payment date or, at the shareholder’s option, paid in cash. Net realized capital gains, to the extent available, will be distributed at least annually. Distributions to shareholders are based on income tax regulations and therefore, their characteristics may differ for financial statement and tax purposes.
General: Securities transactions are accounted for on a trade date basis. Interest income is accrued as earned and dividend income is recorded on the ex-dividend date. Certain income from foreign securities is recognized as soon as information is available to the Fund. Realized gains and losses from the sale of securities are recorded on an identified cost basis. Net investment income (other than class specific expenses) and realized and unrealized gains and losses are allocated daily to each class of shares based upon the relative net asset value of outstanding shares of each class of shares at the beginning of the day (after adjusting for the current share activity of the respective class). Expenses common to all funds are allocated among the funds comprising the Trust based upon their relative net asset values or other appropriate allocation methods.
Guarantees and Indemnifications: Under the Trust’s organizational documents, its officers and Trustees are indemnified against certain liabilities arising out of the performance of their duties to the Fund. Additionally, in the normal course of business the Trust enters into contracts with service providers that contain general indemnification clauses. The Trust’s maximum exposure under these arrangements is unknown. However, based on experience, the Trust expects the risk of loss to be remote.
Use of Estimates: The preparation of financial statements, in conformity with generally accepted accounting principles, requires management to make estimates and assumptions that affect the reported amounts of assets and liabilities and the disclosure of contingent assets and liabilities at the date of the financial statements and the reported amounts of increases and decreases in net assets from operations during the reporting period. Actual results could differ from those estimates.
NOTE 3 – INVESTMENT ADVISORY FEE AND OTHER TRANSACTIONS WITH AFFILIATES
Pursuant to an investment advisory agreement, Thornburg Investment Management, Inc. (the “Advisor”) serves as the investment advisor and performs services to the Fund for which the fees are payable at the end of each month. For the six months ended March 31, 2010, these fees were payable at annual rates ranging from .75 of 1% to .50 of 1% per annum of the average daily net assets of the Fund
Certified Semi-Annual Report 27
| | |
| NOTES TO FINANCIAL STATEMENTS, CONTINUED | | |
| |
| Thornburg Strategic Income Fund | | March 31, 2010 (Unaudited) |
depending on the Fund’s asset size. The Trust also has entered into administrative services agreements with the Advisor, whereby the Advisor will perform certain administrative services for the shareholders of each class of the Fund’s shares, and for which fees will be payable at an annual rate of up to .125 of 1% per annum of the average daily net assets attributable to each class of shares. For the six months ended March 31, 2010, the Advisor voluntarily or contractually agreed to reimburse certain class specific expenses, administrative fees, and distribution fees of $22,161 for Class A shares, $88,429 for Class C shares, and $614 for Class I shares.
The Trust has an underwriting agreement with Thornburg Securities Corporation (the “Distributor,” an affiliate of the Advisor), which acts as the distributor of the Fund’s shares. For the six months ended March 31, 2010, the Distributor has advised the Fund that it earned commissions aggregating $23,431 from the sale of Class A shares, and collected contingent deferred sales charges aggregating $5,002 from redemptions of Class C shares of the Fund.
Pursuant to a service plan under Rule 12b-1 of the Investment Company Act of 1940, the Fund may reimburse to the Advisor an amount not to exceed .25 of 1% per annum of the average daily net assets attributable to each class of shares of the Fund for payments made by the Advisor to securities dealers and other financial institutions to obtain various shareholder and distribution related services. The Advisor may pay out of its own resources additional expenses for distribution of the Fund’s shares.
The Trust has also adopted distribution plans pursuant to Rule 12b-1, applicable only to the Fund’s Class C shares, under which the Fund compensates the Distributor for services in promoting the sale of Class C shares of the Fund at an annual rate of up to .75 of 1% per annum of the average daily net assets attributable to Class C shares. Total fees incurred by the Distributor for each class of shares of the Fund under their respective Service and Distribution Plans for the six months ended March 31, 2010, are set forth in the Statement of Operations.
The Trust has an agreement with the custodian bank to indirectly pay a portion of the custodian’s fees through credits earned by the Fund’s cash on deposit with the bank. This deposit agreement is an alternative to overnight investments. Custodial fees have been adjusted to reflect amounts that would have been paid without this agreement, with a corresponding adjustment reflected as fees paid indirectly in the Statement of Operations. For the six months ended March 31, 2010, fees paid indirectly were $317.
Certain officers and Trustees of the Trust are also officers and/or directors of the Advisor and Distributor. The compensation of independent Trustees is borne by the Trust.
NOTE 4 – SHARES OF BENEFICIAL INTEREST
At March 31, 2010, there were an unlimited number of shares of beneficial interest authorized. Transactions in shares of beneficial interest were as follows:
| | | | | | | | | | | | | | |
| | | Six Months Ended
March 31, 2010 (Unaudited) | | | Year Ended
September 30, 2009 (Audited) | |
| | | Shares | | | Amount | | | Shares | | | Amount | |
Class A Shares | | | | | | | | | | | | | | |
Shares sold | | 2,199,707 | | | $ | 25,937,533 | | | 4,070,731 | | | $ | 41,692,987 | |
Shares issued to shareholders in reinvestment of dividends | | 154,894 | | | | 1,831,841 | | | 166,612 | | | | 1,745,944 | |
Shares repurchased | | (1,207,829 | ) | | | (14,213,103 | ) | | (1,017,988 | ) | | | (10,154,061 | ) |
| | | | | | | | | | | | | | |
| | | | |
Net Increase (Decrease) | | 1,146,772 | | | $ | 13,556,271 | | | 3,219,355 | | | $ | 33,284,870 | |
| | | | | | | | | | | | | | |
| | | | |
Class C Shares | | | | | | | | | | | | | | |
Shares sold | | 1,259,259 | | | $ | 14,812,784 | | | 3,999,961 | | | $ | 40,130,318 | |
Shares issued to shareholders in reinvestment of dividends | | 117,885 | | | | 1,393,383 | | | 115,785 | | | | 1,220,711 | |
Shares repurchased | | (413,354 | ) | | | (4,869,753 | ) | | (967,856 | ) | | | (9,463,923 | ) |
| | | | | | | | | | | | | | |
| | | | |
Net Increase (Decrease) | | 963,790 | | | $ | 11,336,414 | | | 3,147,890 | | | $ | 31,887,106 | |
| | | | | | | | | | | | | | |
28 Certified Semi-Annual Report
| | |
| NOTES TO FINANCIAL STATEMENTS, CONTINUED | | |
| |
| Thornburg Strategic Income Fund | | March 31, 2010 (Unaudited) |
| | | | | | | | | | | | | | |
| | | Six Months Ended
March 31, 2010 (Unaudited) | | | Year Ended
September 30, 2009 (Audited) | |
| | | Shares | | | Amount | | | Shares | | | Amount | |
Class I Shares | | | | | | | | | | | | | | |
Shares sold | | 1,183,044 | | | $ | 13,944,991 | | | 2,608,167 | | | $ | 25,631,797 | |
Shares issued to shareholders in reinvestment of dividends | | 129,197 | | | | 1,529,659 | | | 155,088 | | | | 1,629,414 | |
Shares repurchased | | (985,611 | ) | | | (11,692,593 | ) | | (386,048 | ) | | | (3,842,852 | ) |
| | | | | | | | | | | | | | |
| | | | |
Net Increase (Decrease) | | 326,630 | | | $ | 3,782,057 | | | 2,377,207 | | | $ | 23,418,359 | |
| | | | | | | | | | | | | | |
NOTE 5 – SECURITIES TRANSACTIONS
For the six months ended March 31, 2010, the Fund had purchase and sale transactions of investment securities (excluding short-term investments and U.S. Government obligations) of $61,149,452 and $34,397,542, respectively.
NOTE 6 – INCOME TAXES
At March 31, 2010, information on the tax components of capital is as follows:
| | | | |
Cost of investments for tax purposes | | $ | 172,967,017 | |
| | | | |
Gross unrealized appreciation on a tax basis | | $ | 19,168,733 | |
Gross unrealized depreciation on a tax basis | | | (5,197,194 | ) |
| | | | |
Net unrealized appreciation (depreciation) on investments (tax basis) | | $ | 13,971,539 | |
| | | | |
At March 31, 2010, the Fund had deferred tax basis currency and capital losses occurring subsequent to October 31, 2008 of $19,065 and $774,429, respectively. For tax purposes, such losses will be reflected in the year ending September 30, 2010.
NOTE 7 – DERIVATIVE FINANCIAL INSTRUMENTS WITH OFF-BALANCE SHEET RISK AND FOREIGN INVESTMENT RISK
The Fund may use a variety of derivative financial instruments to hedge or adjust the risks affecting its investment portfolio or to enhance investment returns. Provisions of FASB Accounting Standards Codification ASC 815-10-50, (“ASC 815”) require certain disclosures. The new requirement amends and expands disclosures related to derivative instruments to provide users of financial statements with an enhanced understanding of the use of derivative instruments by the Fund and how these derivatives affect the financial position, financial performance and cash flows of the Fund. The Fund does not designate any derivative instruments as hedging instruments under ASC 815. During the six months ended March 31, 2010, the Fund’s principal exposure to derivative financial instruments of the type addressed by ASC 815 was investment in foreign exchange contracts. A foreign exchange contract is an agreement between two parties to exchange different currencies at a specified rate of exchange at an agreed upon future date. Foreign exchange contracts involve risks to the Fund, including the risk that a contract counterparty will not meet its obligations to the Fund, the risk that a change in a contract’s value may not correlate perfectly with the currency the contract was intended to track, and the risk that the Fund’s advisor is unable to correctly implement its strategy in using a contract. In any such instance, the Fund may not achieve the intended benefit of entering into a contract, and may experience a loss.
The Fund entered into forward currency contracts during the six months ended March 31, 2010 in the normal course of pursuing its investment objectives, in anticipation of purchasing foreign investments or with the intent of reducing the risk to the value of the Fund’s foreign investments from adverse changes in the relationship between the U.S. dollar and foreign currencies. In each case these contracts have been initiated in conjunction with foreign investment transactions.
These contracts are accounted for by the Fund under ASC 815. Unrealized gains and unrealized losses on outstanding contracts are reported in the Fund’s Statement of Assets and Liabilities at the Fund’s net equity, as measured by the difference between the forward
Certified Semi-Annual Report 29
| | |
| NOTES TO FINANCIAL STATEMENTS, CONTINUED | | |
| |
| Thornburg Strategic Income Fund | | March 31, 2010 (Unaudited) |
exchange rates at the reporting date and the forward exchange rates at each contract’s inception date. Net realized gain (loss) on contracts closed during the period, and changes in net unrealized appreciation (depreciation) on outstanding contracts are recognized in the Fund’s Statement of Operations.
The following table displays the outstanding forward currency contracts, at March 31, 2010:
Outstanding Forward Currency Contracts
to Buy or Sell at March 31, 2010
| | | | | | | | | | | | | | | |
Contract Description | | Buy/Sell | | Contract
Amount | | Contract
Value Date | | Value
USD | | Unrealized
Appreciation | | Unrealized
Depreciation |
Euro | | Sell | | 1,125,000 | | 08/19/2010 | | $ | 1,519,458 | | $ | 21,511 | | $ | — |
| | | | | | | | | | | | | | | |
Total | | | | | | | | | | | $ | 21,511 | | $ | — |
| | | | | | | | | | | | | | | |
The unrealized appreciation (depreciation) of the outstanding forward currency contracts recognized in the Fund’s Statement of Assets and Liabilities at March 31, 2010 is disclosed in the following table:
Fair Values of Derivative Financial Instruments
at March 31, 2010
| | | | | |
Asset Derivatives | | Balance Sheet Location | | Fair Value |
Foreign exchange contracts | | Assets - Unrealized appreciation on forward currency contracts | | $ | 21,511 |
The realized gains (losses) from forward currency contracts, and the change in unrealized appreciation (depreciation) of outstanding forward currency contracts recognized in the Fund’s Statement of Operations for the six months ended March 31, 2010 is disclosed in the following tables:
Amount of Realized Gain (Loss) on Derivative
Financial Instruments Recognized in Income for the
Six Months Ended March 31, 2010
| | | | | | |
| | | Total | | Forward
Currency
Contracts |
Foreign exchange contracts | | $ | 41,614 | | $ | 41,614 |
Change in Unrealized Appreciation (Depreciation)
of Derivative Financial Instruments Recognized in
Income for the Six Months Ended March 31, 2010
| | | | | | |
| | | Total | | Forward
Currency
Contracts |
Foreign exchange contracts | | $ | 83,914 | | $ | 83,914 |
OTHER NOTES
Fund management believes no events have occurred between March 31, 2010 and May 20, 2010, the date of issuance of the financial statements, that require adjustment of, or disclosure in, the accompanying financial statements.
30 Certified Semi-Annual Report
This page intentionally left blank.
Certified Semi-Annual Report 31
FINANCIAL HIGHLIGHTS
Thornburg Strategic Income Fund
| | | | | | | | | | | | | | | | | | | | | | | | | | | | | | | | | | | | | | | | | | | |
| | | PER SHARE PERFORMANCE (for a share outstanding throughout the period)+ | | RATIOS TO AVERAGE NET ASSETS | | | SUPPLEMENTAL DATA |
Unless
Otherwise
Noted,
Periods
are
Fiscal
Years
Ended
Sept. 30, | | Net Asset
Value
Beginning
of
Period | | Net
Investment
Income
(Loss) | | Net
Realized
&
Unrealized
Gain (Loss)
on
Investments | | | Total from
Investment
Operations | | | Dividends
from Net
Investment
Income | | | Dividends
from Net
Realized
Gains | | | Total
Dividends | | | Net
Asset
Value
End
of
Period | | Net
Investment
Income
(Loss)
(%) | | | Expenses,
After
Expense
Reductions
(%) | | | Expenses,
After
Expense
Reductions
and
Net of
Custody
Credits
(%) | | | Expenses,
Before
Expense
Reductions
(%) | | | Total
Return
(%)(a) | | | Portfolio
Turnover
Rate (%) | | Net Assets
at End
of Period
(Thousands) |
Class A Shares |
2010 (b)(c) | | $ | 11.63 | | 0.41 | | 0.46 | | | 0.87 | | | (0.41 | ) | | (0.05 | ) | | (0.46 | ) | | $ | 12.04 | | 6.98 | (d) | | 1.25 | (d) | | 1.25 | (d) | | 1.32 | (d) | | 7.60 | | | 21.57 | | $ | 73,694 |
2009(c) | | $ | 10.57 | | 0.78 | | 1.06 | | | 1.84 | | | (0.78 | ) | | — | | | (0.78 | ) | | $ | 11.63 | | 7.66 | | | 1.25 | | | 1.25 | | | 1.49 | | | 18.67 | | | 47.88 | | $ | 57,853 |
2008(c)(e) | | $ | 11.94 | | 0.59 | | (1.41 | ) | | (0.82 | ) | | (0.55 | ) | | — | | | (0.55 | ) | | $ | 10.57 | | 6.51 | (d) | | 1.27 | (d) | | 1.25 | (d) | | 1.79 | (d) | | (7.18 | ) | | 36.22 | | $ | 18,538 |
|
Class C Shares |
2010 (b) | | $ | 11.62 | | 0.38 | | 0.46 | | | 0.84 | | | (0.38 | ) | | (0.05 | ) | | (0.43 | ) | | $ | 12.03 | | 6.42 | (d) | | 1.80 | (d) | | 1.80 | (d) | | 2.10 | (d) | | 7.33 | | | 21.57 | | $ | 65,197 |
2009 | | $ | 10.57 | | 0.73 | | 1.04 | | | 1.77 | | | (0.72 | ) | | — | | | (0.72 | ) | | $ | 11.62 | | 7.13 | | | 1.79 | | | 1.79 | | | 2.29 | | | 17.95 | | | 47.88 | | $ | 51,789 |
2008(e) | | $ | 11.94 | | 0.55 | | (1.42 | ) | | (0.87 | ) | | (0.50 | ) | | — | | | (0.50 | ) | | $ | 10.57 | | 5.96 | (d) | | 1.82 | (d) | | 1.80 | (d) | | 2.65 | (d) | | (7.57 | ) | | 36.22 | | $ | 13,829 |
|
Class I Shares |
2010 (b) | | $ | 11.64 | | 0.43 | | 0.45 | | | 0.88 | | | (0.42 | ) | | (0.05 | ) | | (0.47 | ) | | $ | 12.05 | | 7.25 | (d) | | 0.97 | (d) | | 0.97 | (d) | | 0.97 | (d) | | 7.74 | | | 21.57 | | $ | 49,821 |
2009 | | $ | 10.58 | | 0.81 | | 1.05 | | | 1.86 | | | (0.80 | ) | | — | | | (0.80 | ) | | $ | 11.64 | | 7.94 | | | 0.99 | | | 0.99 | | | 1.12 | | | 18.95 | | | 47.88 | | $ | 44,319 |
2008(e) | | $ | 11.94 | | 0.63 | | (1.42 | ) | | (0.79 | ) | | (0.57 | ) | | — | | | (0.57 | ) | | $ | 10.58 | | 6.81 | (d) | | 1.01 | (d) | | 0.99 | (d) | | 1.44 | (d) | | (6.90 | ) | | 36.22 | | $ | 15,145 |
| (a) | Not annualized for periods less than one year. |
| (b) | Unaudited Six Month Period Ended March 31. |
| (c) | Sales loads are not reflected in computing total return. |
| (e) | Fund commenced operations on December 19, 2007. |
| + | Based on weighted average shares outstanding. |
See notes to financial statements.
| | |
| 32 Certified Semi-Annual Report | | Certified Semi-Annual Report 33 |
| | |
| EXPENSE EXAMPLE | | |
| |
| Thornburg Strategic Income Fund | | March 31, 2010 (Unaudited) |
As a shareholder of the Fund, you incur two types of costs:
| | (1) | transaction costs, including |
(a) sales charges (loads) on purchase payments for Class A shares;
(b) a deferred sales charge on redemptions of any part or all of a purchase of $1 million of Class A shares within 12 months of purchase;
(c) a deferred sales charge on redemptions of Class C shares within 12 months of purchase;
| | (2) | ongoing costs, including management fees; distribution and/or service (12b-1) fees; and other Fund expenses. |
This example is intended to help you understand your ongoing costs (in dollars) of investing in the Fund and to compare these costs with the ongoing costs of investing in other mutual funds.
The example is based on a $1,000 investment beginning on October 1, 2009, and held until March 31, 2010.
ACTUAL EXPENSES
For each class of shares, the first line of the table at right provides information about actual account values and actual expenses. You may use the information in this line, together with the amount you invested, to estimate the expenses that you paid over the period. Simply divide your account value by $1,000 (for example, an $8,600 account value divided by $1,000 = 8.6), then multiply the result by the number in the first line for your class of shares under the heading entitled “Expenses Paid During Period” to estimate the expenses you paid on your account during this period.
HYPOTHETICAL EXAMPLE FOR COMPARISON PURPOSES
For each class of shares, the second line of the table at right provides information about hypothetical account values and hypothetical expenses based on the Fund’s actual expense ratio and an assumed rate of return of 5% per year before expenses, which is not the Fund’s actual return. The hypothetical account values and expenses may not be used to estimate the actual ending account balance or expenses you paid for the period. You may use this information to compare the ongoing costs of investing in the Fund and other funds. To do so, compare this 5% hypothetical example with the 5% hypothetical examples that appear in the shareholder reports of the other funds.
| | | | | | | | | |
| | | Beginning
Account Value
10/1/09 | | Ending
Account Value
3/31/10 | | Expenses Paid
During Period†
10/1/09–3/31/10 |
Class A Shares | | | | | | | | | |
Actual | | $ | 1,000.00 | | $ | 1,076.00 | | $ | 6.47 |
Hypothetical* | | $ | 1,000.00 | | $ | 1,018.70 | | $ | 6.29 |
Class C Shares | | | | | | | | | |
Actual | | $ | 1,000.00 | | $ | 1,073.30 | | $ | 9.30 |
Hypothetical* | | $ | 1,000.00 | | $ | 1,015.96 | | $ | 9.05 |
Class I Shares | | | | | | | | | |
Actual | | $ | 1,000.00 | | $ | 1,077.40 | | $ | 5.02 |
Hypothetical* | | $ | 1,000.00 | | $ | 1,020.10 | | $ | 4.88 |
| † | Expenses are equal to the annualized expense ratio for each class (A: 1.25%; C: 1.80%; I: 0.97%) multiplied by the average account value over the period, multiplied by 182/365 to reflect the one-half year period. |
| * | Hypothetical assumes a rate of return of 5% per year before expenses. |
Please note that the expenses shown in the table are meant to highlight your ongoing costs only and do not reflect any transactional costs, such as sales charges (loads), redemption fees, or exchange fees. Therefore, the second line of the table for each class of shares is useful in comparing ongoing costs only, and will not help you determine the relative total costs of owning different funds. In addition, if these transactional costs were included, your costs would have been higher.
34 Certified Semi-Annual Report
| | |
| OTHER INFORMATION | | |
| |
| Thornburg Strategic Income Fund | | March 31, 2010 (Unaudited) |
PORTFOLIO PROXY VOTING
Policies and Procedures:
The Trust has delegated to Thornburg Investment Management, Inc. (the “Advisor”) voting decisions respecting proxies for the Fund’s voting securities. The Advisor makes voting decisions in accordance with its Proxy Voting Policy and Procedures. A description of the Policy and Procedures is available (i) without charge, upon request, by calling the Advisor toll-free at 1-800-847-0200, (ii) on the Thornburg web site at www.thornburg.com, and (iii) on the Securities and Exchange Commission’s web site at www.sec.gov.
Information regarding how proxies were voted is available on or before August 31 of each year for the twelve months ending the preceding June 30. This information is available (i) without charge, upon request by calling the Advisor toll-free at 1-800-847-0200, (ii) on the Thornburg web site at www.thornburg.com, and (iii) on the Securities and Exchange Commission’s web site at www.sec.gov.
AVAILABILITY OF QUARTERLY PORTFOLIO SCHEDULE
The Fund files with the Securities and Exchange Commission schedules of its portfolio holdings on Form N-Q for the first and third quarters of each fiscal year. The Fund’s Forms N-Q are available on the Commission’s web site at www.sec.gov, or may be reviewed and copied at the Commission’s Public Reference Room in Washington, D.C. Information on the operation of the Public Reference Room may be obtained by calling 1-800-SEC-0330. The Fund also makes this information available on its web site at www.thornburg.com/download or upon request by calling 1-800-847-0200.
Certified Semi-Annual Report 35
Trustees’ Statement to Shareholders
Not part of the Certified Semi-Annual Report
February 8, 2005, as readopted July 22, 2009
The Trustees are concerned that ongoing commentaries and opinions reported in the media may confuse investors in general as to the supervisory duties of trustees of mutual funds and, in particular, leave Thornburg Investment Trust shareholders uncertain regarding how we discharge our responsibilities in supervising the Funds’ investment advisor and in reviewing the advisor’s contract for renewal. We decided to spell out clearly three principal guidelines that we follow in supervising the Trust’s investment advisor on your behalf.
We begin with the premise that each shareholder selected his or her Fund because its investments are managed by the investment advisor identified in the prospectus and in accordance with the objective and policies described in the prospectus. We realize, as each of you do, that if you believe that your Fund’s stated objective and policies no longer serve your personal investment goals, you can sell your shares and leave the Fund.
Therefore, we believe that our primary supervisory task – our principal obligation to you – is to assess the nature and quality of the advisor’s services, and to confirm that the advisor actively and competently pursues the Fund’s objective, in accordance with the policies set out in the prospectus. To do this, we meet regularly with management to review your Fund’s portfolio and to discuss the advisor’s specific actions and judgments in pursuing the Fund’s objective. We do not substitute our own judgment for the advisor’s decisions in selecting investments; the advisor is paid to exercise its informed judgment on investment decisions, and we seek to confirm, in reviewing the advisor’s performance, that the advisor is doing just that.
Second, while we are conscious of costs and the effect that costs have on shareholders’ returns, we do not seek the lowest fees or expense ratio as our sole or primary objective. We try to make sure that your Fund’s fees and costs are reasonable in relationship to the services rendered and that they are generally in line with those charged by other expert investment advisors, consistent with our belief that the Fund’s investors searched for and expect that expertise and attention and have decided to pay a reasonable price for it. We do not put the management contract “out to bid” as a matter of course, and we would not do so unless we had concluded that the advisor materially had failed to pursue the Fund’s objectives in accordance with its policies, or for other equally important reasons. We believe that any other approach would be inconsistent with your interests and contrary to your expectations when you bought shares of the Fund in the first place.
Finally, because we believe that most Thornburg Fund shareholders have invested with a long-term perspective, we try not to focus too much on the fashions of the moment and on short-term performance. The market will not favor any specific investment objective or set of policies at all times and under all economic circumstances. A fund will experience periods of both high and low returns relative to other funds and other investments. Even if one of our Funds is not favored by the market at a particular time, we believe that the advisor is nonetheless obliged to remain true to the Fund’s objective and policies, and we watch to see that it does so.
36 This page is not part of the Semi-Annual Report.
Retirement and Education Accounts
Thornburg Investment Management offers retirement and education savings accounts that can help you meet a variety of planning challenges. For account applications or further information on any of the accounts below, please call 1-800-847-0200 or go to www.thornburg.com/ira. Your financial advisor can help you determine which plan is right for you.
Individual Retirement Accounts
Individual Retirement Accounts (IRAs) provide a tax-advantaged means to save money for the future. For a detailed outline of the difference between retirement accounts, see www.thornburg.com/ira. Rollovers are available. Call 1-800-847-0200 for more information.
Traditional IRAs – Contributions to Traditional IRAs are tax deductible for eligible individuals, and withdrawals are taxed as additional ordinary income. You may contribute to an IRA if you receive compensation and are under 70 1/ 2, even if you are covered by an employer retirement plan. Deductible contributions are subject to certain qualifications. Please consult your tax advisor.
Roth IRAs – Under a Roth IRA, there is no tax deduction for contributions, but there is no income tax on qualified withdrawals. For a more detailed comparison of Traditional and Roth IRAs, please see our web site at www.thornburg.com/ira.
SEP IRAs – Simplified Employee Pension (SEP) IRAs are established by employers. The employer is allowed a tax deduction for contributions made to the SEP Plan and makes contributions to each eligible employee’s SEP IRA on a discretionary basis.
SIMPLE IRAs – Savings Incentive Match Plan for Employees of Small Employers (SIMPLE) is designed to give small business owners a simplified method to establish and contribute to a retirement plan for employees. The employer is allowed a tax deduction for contributions and makes either matching or non-elective contributions to each eligible employee’s SIMPLE IRA. Employees may make salary deferral contributions.
Coverdell Education Savings Account
These savings accounts are designed to provide a way to save money for higher education expenses. In an Education Savings Account, earnings and interest grow tax-free, and qualified withdrawals used to pay for eligible higher-education expenses are tax- and penalty-free.
Funds Available
The following funds are available in the accounts listed above:
| | • | | Thornburg International Value Fund |
| | • | | Thornburg Core Growth Fund |
| | • | | Thornburg Investment Income Builder Fund |
| | • | | Thornburg Global Opportunities Fund |
| | • | | Thornburg International Growth Fund |
| | • | | Thornburg Developing World Fund |
| | • | | Thornburg Limited Term U.S. Government Fund |
| | • | | Thornburg Limited Term Income Fund |
| | • | | Thornburg Strategic Income Fund |
This page is not part of the Semi-Annual Report. 37

Thornburg Equity Funds
Thornburg’s equity research uses a fundamental and comprehensive analytical approach. Thornburg equity funds focus on a limited number of securities so that each holding can impact performance. The equity team searches for firms believed to have a promising future and seeks to buy shares of those companies at a discount to their intrinsic value.
| | • | | Thornburg International Value Fund |
| | • | | Thornburg Core Growth Fund |
| | • | | Thornburg Investment Income Builder Fund |
| | • | | Thornburg Global Opportunities Fund |
| | • | | Thornburg International Growth Fund |
| | • | | Thornburg Developing World Fund |
Thornburg Bond Funds
Thornburg Investment Management applies a disciplined philosophy to fixed-income management. Since the launch of our first fixed-income fund over 25 years ago, we have been conducting fundamental, bottom-up research in an effort to identify bonds which we believe provide the best return for a given level of risk. We are very organic in our approach, avoiding leverage or complex strategies which could backfire in periods of market uncertainty.
| | • | | Thornburg Limited Term Municipal Fund |
| | • | | Thornburg Intermediate Municipal Fund |
| | • | | Thornburg California Limited Term Municipal Fund |
| | • | | Thornburg New Mexico Intermediate Municipal Fund |
| | • | | Thornburg New York Intermediate Municipal Fund |
| | • | | Thornburg Strategic Municipal Income Fund |
| | • | | Thornburg Limited Term U.S. Government Fund |
| | • | | Thornburg Limited Term Income Fund |
| | • | | Thornburg Strategic Income Fund |
Before investing, carefully consider the Fund’s investment goals, risks, charges, and expenses. For a prospectus containing this and other information, contact your financial advisor or visit thornburg. com. Read it carefully before investing.
For additional information, please visit www.thornburg.com
Thornburg Investment Management, Inc. 2300 North Ridgetop Road, Santa Fe, NM 87506
This page is not part of the Semi-Annual Report. 39
| | | | | | |
 | | Waste not, Wait not | |  |
| | |
| | | | Get instant access to your shareholder reports. |
| | |
| | This Semi-Annual Report is submitted for the general information of shareholders of the Fund. It is not authorized for distribution to prospective investors in the Fund unless preceded or accompanied by an effective prospectus. | | By switching from your postal mailbox to your email inbox, you reduce paper clutter, improve record keeping access, and help conserve our natural resources. |
| | |

| | Investment Advisor: Thornburg Investment Management® | | Go to www.thornburg.com/edelivery and sign up to receive your shareholder reports, prospectuses, and proxy statements electronically. |
| | 800.847.0200 | | |
| | Distributor: | | |
| | Thornburg Securities Corporation® 800.847.0200 | | You invest in the future, without spending a dime. |
| | TH1663 | | |

Important Information
The information presented on the following pages was current as of March 31, 2010. The managers’ views, portfolio holdings, and sector diversification are provided for the general information of the Fund’s shareholders; they are historical and subject to change. This material should not be deemed a recommendation to buy or sell any of the securities mentioned.
Investments in the Fund carry risks, including possible loss of principal. Special risks may be associated with investments outside the United States, especially in emerging markets, including currency fluctuations, illiquidity and volatility. Investments in small capitalization companies may increase the risk of greater price fluctuations. Please see the Fund’s Prospectus for a discussion of the risks associated with an investment in the Fund. Investments in the Fund are not FDIC insured, nor are they deposits of or guaranteed by a bank or any other entity. There is no guarantee that the Fund will meet its investment objectives. Funds invested in a limited number of holdings may expose an investor to greater volatility.
Performance data given at net asset value (NAV) does not take into account the applicable sales charges. If the sales charges had been included, the performance would have been lower.
Class I, R3, R4, and R5 shares may not be available to all investors. Minimum investments for Class I shares may be higher than those for other classes.
| | | | |
Share Class | | NASDAQ Symbol | | Cusip |
Class A | | TVAFX | | 885-215-731 |
Class B | | TVBFX | | 885-215-590 |
Class C | | TVCFX | | 885-215-715 |
Class I | | TVIFX | | 885-215-632 |
Class R3 | | TVRFX | | 885-215-533 |
Class R4 | | TVIRX | | 885-215-277 |
Class R5 | | TVRRX | | 885-215-376 |
Glossary
Standard & Poor’s 500 Stock Index (S&P 500) – The S&P 500 Index is a broad measure of the U.S. stock market.
Unless otherwise noted, index returns reflect the reinvestment of income dividends and capital gains, if any, but do not reflect fees, brokerage commissions or other expenses of investing. Investors may not make direct investments into any index. The performance of any index is not indicative of the performance of any particular investment.
Beta – A measure of market-related risk. Less than one means the portfolio is less volatile than the index, while greater than one indicates more volatility than the index.
Forward P/E – Price to earnings ratio, using earnings estimates for the next four quarters.
Median Market Capitalization – Market capitalization (market cap) is the total value of a company’s stock, calculated by multiplying the number of outstanding common shares by the current share price. The company whose market cap is in the middle of the portfolio is the median market cap. Half the companies in the portfolio have values greater than the median and half have values that are less.
Price to Book Value (P/B) – A ratio used to compare a stock’s market value to its book value. It is calculated by dividing the current closing price of the stock by the latest quarter’s book value (book value is simply assets minus liabilities).
Price to Cash Flow Ratio – A measure of the market’s expectations of a firm’s future financial health. It is calculated by dividing the price per share by cash flow per share.
Price to Earnings Ratio (P/E) – A valuation ratio equaling a company’s market value per share divided by earnings per share.
This page is not part of the Semi-Annual Report. 3
Thornburg Value Fund

Left to right:
Connor Browne, CFA, and Edward Maran, CFA.
IMPORTANT
PERFORMANCE INFORMATION
Performance data shown represents past performance and is no guarantee of future results. Investment return and principal value will fluctuate so shares, when redeemed, may be worth more or less than their original cost. Current performance may be lower or higher than quoted. For performance current to the most recent month end, visit thornburg.com.
The maximum sales charge for Class A shares is 4.50%. Class A shares are subject to a 1% 30-day redemption fee. The total annual fund operating expense of Class A shares is 1.34%, as disclosed in the most recent Prospectus.
Finding Promising Companies at a Discount
The Thornburg Value Fund seeks to find promising companies at a discounted valuation. It differs from many other equity funds in two key ways. First, it focuses on a limited number of stocks, and second, it takes a more comprehensive approach to value investing.
Our team is dedicated to providing value to shareholders. We accomplish this through the application of seasoned investment principles with hands-on, company-oriented research. We use a collaborative research approach in identifying and analyzing investment ideas. Our focus is on finding promising companies available at a discount to our estimate of their intrinsic value.
In managing the Thornburg Value Fund, we take a bottom-up approach to stock selection. The Fund is not predisposed to an industry or sector. We use a combination of financial analysis, collaborative research, and business evaluation in an effort to gauge the intrinsic value of a company based on its past record and future potential. The continuum of process moves from screens and idea generation, through conventional “Wall Street” research and documentation, to company contact, the last often including on-site visits. The focus of the analysis is on what’s behind the numbers, its revenue and cash-generating model. We make an effort to get to know the company’s reputation in the industry, its people and its corporate culture.
AVERAGE ANNUAL TOTAL RETURNS
FOR PERIODS ENDED 3/31/10
| | | | | | | | | | | | | | | |
| | | 1 Yr | | | 3 Yrs | | | 5 Yrs | | | 10 Yrs | | | Since
Inception | |
A Shares (Incep: 10/2/95) | | | | | | | | | | | | | | | |
Without sales charge | | 66.02 | % | | -2.80 | % | | 5.10 | % | | 2.01 | % | | 10.10 | % |
With sales charge | | 58.58 | % | | -4.28 | % | | 4.14 | % | | 1.54 | % | | 9.76 | % |
S&P 500 Index | | | | | | | | | | | | | | | |
(Since 10/2/95) | | 49.77 | % | | -4.17 | % | | 1.92 | % | | -0.65 | % | | 6.83 | % |
4 This page is not part of the Semi-Annual Report.
The current posture is to maintain a portfolio of 40–55 companies diversified by sector, industry, market capitalization, and our three categories of stocks: Basic Value, Consistent Earners and Emerging Franchises. Because of the limited number of stocks in the portfolio, every holding counts. At the time of purchase, we set a 12–18 month price target for each stock. The target is reviewed as the fundamentals of the stock change during the course of ownership.
The bottom line? Engendering a wide-open, collegial environment fosters information flow and critical thinking intended to benefit portfolio decision making. We do not view our location in Santa Fe, New Mexico, as a disadvantage. While we have access to the best of Wall Street’s analysis, we are not ruled by it. Distance from the crowd serves to fortify independent and objective thinking.
STOCKS CONTRIBUTING AND DETRACTING
FOR THE SIX MONTHS ENDED 3/31/10
| | |
Top Contributors | | Top Detractors |
| Smith International Inc. | | Actelion Ltd. |
| United States Steel Corp. | | Swiss Reinsurance Co. |
| Boeing Co. | | ING Groep N.V. |
| DIRECTV Group, Inc. | | Leap Wireless International Inc. |
| DISH Network Corp. | | Gilead Sciences Inc. |
| |
| Source: FactSet | | |
KEY PORTFOLIO ATTRIBUTES
As of 3/31/10
| | | |
Portfolio P/E Trailing 12-months* | | | 16.4x |
| |
Portfolio Price to Cash Flow* | | | 5.7x |
| |
Portfolio Price to Book Value* | | | 1.9x |
| |
Median Market Cap* | | $ | 13.7 B |
| |
7-Year Beta (A Shares vs. S&P 500)* | | | 1.09 |
| |
Number of Companies | | | 49 |
| |
* Source: FactSet | | | |
MARKET CAPITALIZATION EXPOSURE
As of 3/31/10
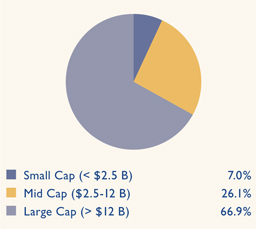
BASKET STRUCTURE
As of 3/31/10
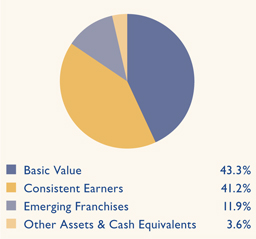
This page is not part of the Semi-Annual Report. 5

Thornburg Value Fund
March 31, 2010
This report is certified under the Sarbanes-Oxley Act of 2002, which requires that public companies, including mutual funds, affirm that the information provided in their annual and semiannual shareholder reports fully and fairly represents their financial position.
6 Certified Semi-Annual Report
Letter to Shareholders
| | |

Connor Browne, CFA Co-Portfolio Manager | | April 30, 2010 Dear Fellow Shareholder: A year ago, in our last semi-annual letter for the six months ended March 31, 2009, we wrote: As we critically examine our decisions through the downturn thus far, we are pleased overall with the actions that we have taken, and the positioning of our current portfolio. Through the last five months of this semi-annual period, and since, the portfolio has performed well in both up and down markets. While the semi-annual period ended March 31st was very challenging, we remain confident that our comprehensive approach to value investing will perform well over the market cycle, as it has in the past. |
| |

Edward E. Maran,CFA Co-Portfolio Manager | | Happily, our portfolio has performed up to our expectations over the ensuing year. The actions taken during the downturn and since, solidly positioned the portfolio for the market rally (4/1/09–3/31/10). While we would prefer not to have a repeat of the Great Recession, we are grateful for the opportunities created by the wild market volatility. In the semi-annual period reported here, from October 1, 2009 through March 31, 2010, performance remained strong, though we trailed our benchmark, the S&P 500 Index. Over the period, the Thornburg Value Fund returned 10.21% (Class A shares, without sales charge), while the S&P 500 Index returned 11.75%. We are now more than a year beyond the bottom of the stock market, and have experienced a very strong rally. While storm clouds still loom on the horizon, including risks to the European Monetary Union associated with a potential Greek default, potential inflationary pressures associated with quantitative easing by the U.S. government, and the depressing impact of increased government regulation and taxes, we generally feel confident about the footing for the U.S. and global economies. That said, it does seem that there are pockets where the market has run a bit ahead of where we perceive fundamentals to be. The retail sector stands out in this regard. Overall, our stock selection was strong during the period, though our sector positioning was a drag on relative performance. Industrials performed strongly for the S&P 500 Index – up 19% during the period. Our industrial names fared even better (Boeing in particular) – but we were well underweight versus the benchmark. Because we have the flexibility to vary widely from benchmark sector weights, the relative size of our investments in a sector can often cause short-term over- or under-performance. However, we believe that, over the long term, our bottom-up approach and basket diversification allow individual stock picking to be a more important driver of performance than sector allocation. Telecommunication services was another area where our weighting in the sector was a drag to relative performance over the six-month period. Here, we were well overweight versus the S&P 500 Index. And though our telecommunication holdings outperformed the telecom companies of the S&P 500 Index during the period (led by Crown Castle), that was a low hurdle as telecom was the worst performing sector within the S&P 500 Index. |
Certified Semi-Annual Report 7
Letter to Shareholders,
Continued
Individual contributors to strong performance included Smith International, which sells a number of products and services to energy companies including specialized drill bits and systems to help drill horizontal wells. Smith bubbled up through our research process in November 2009, and we decided we liked its prospects better than Transocean Offshore, which is an oilfield service company we held at the time. We funded our purchase of Smith International with sale proceeds from Transocean. In February 2010, Schlumberger announced they would acquire Smith. At that point, Smith reached our price target. Transocean was selling at slightly lower than where we had last sold it, and we were able to buy Transocean back at less than our sale price. Transocean has been a challenging investment since our re-purchase. We have been closely following the recent events associated with the Transocean deepwater rig, Horizon. We currently believe the costs to Transocean associated with the Horizon disaster will be materially less than the decline in the market capitalization of the company since the incident. The injuries, loss of life, and economic and environmental impacts of this incident are truly tragic. We are concerned that the companies we invest in are responsibly managed with respect to employee safety and environmental protection as well as investment returns. Our investigation to date has led us to believe that Transocean has been managed in a responsible manner. We are continuing to monitor the situation closely and our views may change if significant new information becomes available.
U.S. Steel has been a strong performer since our purchase in October 2009. The prospects for this vertically integrated steel manufacturer improved along with the global economy. Boeing reached a milestone during the period, reporting the first flight of its 787 Dreamliner aircraft on December 15th. We played the live feed of this flight on our trade desk. While we expected success, there was still an audible sigh of relief as the plane safely got off the ground. Our analyst covering Boeing, Connor Wilson, emailed the company’s Investor Relations director to congratulate him shortly after takeoff. His response was, appropriately, “it still needs to land!” Not only was the landing successful, but further flight tests have proceeded without hiccup. The 787 represents a tremendous future revenue and earnings opportunity for Boeing, and successful progress of this program, as well as the strengthening global economy rewarded shareholders smartly during the period.
Rounding out top contributors were DIRECTV Group and DISH Network. Both businesses have been relatively unaffected by higher unemployment and generate consistent, predictable cash flow streams from subscription revenues.
Weak performers during the semi-annual period included a few overseas names. Actelion, Swiss Reinsurance, and ING Groep were all among our bottom performers for the period. Swiss Re and ING were sold during the period. Both have indirect exposure to broad European sovereign debt default and were not as attractive as other investments in the portfolio at the time of sale in early February 2010. At time of sale, Swiss Re had been a spectacular performer over the trailing twelve-month period. Concerns regarding Greece, as well as Portugal, Italy, and Spain, have intensified since the end of the reporting period. We are not in a position today to judge whether the market reaction to these events is overdone, or not significant enough. Simply said, we had other opportunities in the United States with nearly as much upside, but very little of the downside associated with potential European sovereign debt problems.
Actelion, a Swiss biotechnology firm, announced disappointing results in a trial for their existing drug Tracleer in a new indication (Idiopathic Pulmonary Fibrosis). While positive results in this trial would have been great news, we continue to believe that the company looks reasonably valued on its currently approved products, with a number of very exciting pipeline treatments providing a call option.
8 Certified Semi-Annual Report
Other weak performers included Leap Wireless and Gilead Sciences. Leap stock has struggled in a very competitive environment for prepaid wireless service providers in the United States. As of this writing, it seems that the competitive environment has stabilized somewhat. If so, Leap’s low-cost provider model may again deliver growth in their legacy markets. Gilead has had good fundamental progress, with continued growing sales in the HIV market and good recent preliminary data on their next HIV treatment, the Quad pill. Even as earnings estimates have risen for the company, stock price has continued to decline. At around 10x forward earnings, Gilead Sciences looks particularly compelling today.
We believe the positioning of the portfolio today seems to leave some room for outperformance if the market has, in fact, gotten ahead of itself. As of March 31, 2010, our Basic Value basket of stocks was still larger as a percentage than our Consistent Earner basket (43.3% vs. 41.2%) – but importantly, we consider many of our Basic Value holdings to be relatively conservative. For example, we now have large weights in Exxon Mobile, Ace Insurance, and Transatlantic Holdings. Exxon is an industry leader with a stronger balance sheet and longer lived reserves than its industry peers, and the premium in its valuation is relatively modest. Ace Insurance and Transatlantic are both insurers with very strong balance sheets and conservative underwriting that should weather any environment reasonably well. These three companies are less volatile than typical Basic Value names, and if we were to include them with our Consistent Earners, the combined weight would be much larger than our Basic Value basket.
Fifth Third and Keycorp, both regional banks based in Ohio, have been good performers for us from the bottom of the market, and both approached their price targets in February. While these regional banks performed very well, the larger, safer banks tended to underperform. The result? We had the opportunity to sell Fifth Third and Keycorp and invest the proceeds in JPMorgan Chase, which we perceive as being stronger and having better growth prospects, at a lower valuation multiple. Overall, we like our investments and positioning both in an absolute sense and relative to the market.
We will continue to seek promising companies trading at a discount to their intrinsic value and believe the current environment is presenting us with many promising opportunities.
Thank you for your continued trust in the Thornburg Value Fund.
| | |
| Sincerely, | | |
| |
 | |  |
| Connor Browne,CFA | | Edward E. Maran,CFA |
| Co-Portfolio Manager | | Co-Portfolio Manager |
| Managing Director | | Managing Director |
The matters discussed in this report may constitute forward-looking statements made pursuant to the safe harbor provisions of the Securities Litigation Reform Act of 1995. These include any advisor or portfolio manager prediction, assessment, analysis or outlook for individual securities, industries, investment styles, market sectors and/or markets. These statements involve risks and uncertainties. In addition to the general risks described for each fund in its current prospectus, other factors bearing on these reports include the accuracy of the advisor’s or portfolio manager’s forecasts and predictions, the appropriateness of the investment strategies designed by the advisor or portfolio manager, and the ability of the advisor or portfolio manager to implement their strategies efficiently and successfully. Any one or more of these factors, as well as other risks affecting the securities markets generally, could cause the actual results of any fund to differ materially as compared to its benchmarks.
Certified Semi-Annual Report 9
| | |
| SCHEDULE OF INVESTMENTS | | |
| |
| Thornburg Value Fund | | March 31, 2010 (Unaudited) |
TOP TEN HOLDINGS
As of 3/31/10
| | | | | | | | |
Comcast Corp. | | 3.5 | % | | Exxon Mobil Corp. | | 3.1 | % |
Dell, Inc. | | 3.5 | % | | Ace Ltd. | | 3.1 | % |
Eli Lilly & Co. | | 3.5 | % | | JPMorgan Chase & Co. | | 3.1 | % |
Fiserv, Inc. | | 3.2 | % | | Thermo Fisher Scientific, Inc. | | 3.1 | % |
ConocoPhillips | | 3.1 | % | | Gilead Sciences, Inc. | | 3.0 | % |
SUMMARY OF INDUSTRY EXPOSURE
As of 3/31/10
| | | | | | | | |
Pharmaceuticals, Biotechnology & Life Sciences | | 13.0 | % | | Banks | | 5.0 | % |
Software & Services | | 12.7 | % | | Capital Goods | | 4.3 | % |
Energy | | 12.3 | % | | Diversified Financials | | 3.7 | % |
Media | | 7.5 | % | | Utilities | | 2.7 | % |
Insurance | | 7.4 | % | | Semiconductors & Semiconductor Equipment | | 1.3 | % |
Telecommunication Services | | 7.1 | % | | Consumer Services | | 1.2 | % |
Materials | | 6.3 | % | | Transportation | | 1.0 | % |
Technology Hardware & Equipment | | 5.4 | % | | Food & Staples Retailing | | 0.3 | % |
Health Care Equipment & Services | | 5.2 | % | | Other Assets & Cash Equivalents | | 3.6 | % |
| | | | | |
| | | Shares/
Principal Amount | | Value |
COMMON STOCK — 93.54% | | | | | |
| | |
BANKS — 5.01% | | | | | |
COMMERCIAL BANKS — 5.01% | | | | | |
Mitsubishi UFJ Financial Group, Inc. | | 16,426,201 | | $ | 86,093,042 |
U.S. Bancorp | | 4,847,633 | | | 125,456,742 |
| | | | | |
| | | | | 211,549,784 |
| | | | | |
CAPITAL GOODS — 4.30% | | | | | |
AEROSPACE & DEFENSE — 4.30% | | | | | |
Boeing Co. | | 1,351,200 | | | 98,110,632 |
Lockheed Martin Corp. | | 1,001,983 | | | 83,385,025 |
| | | | | |
| | | | | 181,495,657 |
| | | | | |
CONSUMER SERVICES — 1.16% | | | | | |
HOTELS, RESTAURANTS & LEISURE — 1.16% | | | | | |
aLife Time Fitness, Inc. | | 1,746,636 | | | 49,080,472 |
| | | | | |
| | | | | 49,080,472 |
| | | | | |
DIVERSIFIED FINANCIALS — 3.66% | | | | | |
CAPITAL MARKETS — 0.57% | | | | | |
AllianceBernstein Holding LP | | 787,430 | | | 24,142,604 |
DIVERSIFIED FINANCIAL SERVICES — 3.09% | | | | | |
JPMorgan Chase & Co. | | 2,911,100 | | | 130,271,725 |
| | | | | |
| | | | | 154,414,329 |
| | | | | |
10 Certified Semi-Annual Report
| | |
| SCHEDULE OF INVESTMENTS, CONTINUED | | |
| |
| Thornburg Value Fund | | March 31, 2010 (Unaudited) |
| | | | | |
| | | Shares/
Principal Amount | | Value |
ENERGY — 12.31% | | | | | |
ENERGY EQUIPMENT & SERVICES — 2.44% | | | | | |
aTransocean Ltd. | | 1,188,400 | | $ | 102,653,992 |
OIL, GAS & CONSUMABLE FUELS — 9.87% | | | | | |
ConocoPhillips | | 2,583,800 | | | 132,213,046 |
Exxon Mobil Corp. | | 1,972,700 | | | 132,131,446 |
Marathon Oil Corp. | | 3,641,400 | | | 115,213,896 |
aSandridge Energy, Inc. | | 4,794,658 | | | 36,918,867 |
| | | | | |
| | | | | 519,131,247 |
| | | | | |
FOOD & STAPLES RETAILING — 0.31% | | | | | |
FOOD & STAPLES RETAILING — 0.31% | | | | | |
aRite Aid Corp. | | 8,717,107 | | | 13,075,660 |
| | | | | |
| | | | | 13,075,660 |
| | | | | |
HEALTH CARE EQUIPMENT & SERVICES — 5.20% | | | | | |
HEALTH CARE EQUIPMENT & SUPPLIES — 4.04% | | | | | |
aInverness Medical Innovations, Inc. | | 2,029,900 | | | 79,064,605 |
aVarian Medical Services, Inc. | | 1,653,190 | | | 91,471,003 |
HEALTH CARE PROVIDERS & SERVICES — 1.08% | | | | | |
aCommunity Health Systems, Inc. | | 1,229,440 | | | 45,403,219 |
HEALTH CARE TECHNOLOGY — 0.08% | | | | | |
aEclipsys Corp. | | 179,492 | | | 3,568,301 |
| | | | | |
| | | | | 219,507,128 |
| | | | | |
INSURANCE — 7.42% | | | | | |
INSURANCE — 7.42% | | | | | |
Ace Ltd. | | 2,511,445 | | | 131,348,573 |
Hartford Financial Services Group, Inc. | | 2,838,659 | | | 80,674,689 |
Transatlantic Holdings, Inc. | | 1,914,600 | | | 101,090,880 |
| | | | | |
| | | | | 313,114,142 |
| | | | | |
MATERIALS — 5.64% | | | | | |
CHEMICALS — 2.16% | | | | | |
Monsanto Co. | | 1,278,400 | | | 91,303,328 |
METALS & MINING — 3.48% | | | | | |
Tokyo Steel Mfg. | | 6,865,300 | | | 85,990,655 |
United States Steel Corp. | | 953,800 | | | 60,585,376 |
| | | | | |
| | | | | 237,879,359 |
| | | | | |
MEDIA — 7.51% | | | | | |
MEDIA — 7.51% | | | | | |
Comcast Corp. | | 8,313,750 | | | 149,398,087 |
aDIRECTV Group, Inc. | | 3,117,592 | | | 105,405,786 |
Dish Network Corp. | | 2,983,838 | | | 62,123,507 |
| | | | | |
| | | | | 316,927,380 |
| | | | | |
PHARMACEUTICALS, BIOTECHNOLOGY & LIFE SCIENCES — 12.89% | | | | | |
BIOTECHNOLOGY — 4.15% | | | | | |
aActelion Ltd. | | 1,080,600 | | | 49,161,971 |
aGilead Sciences, Inc. | | 2,770,200 | | | 125,988,696 |
LIFE SCIENCES TOOLS & SERVICES — 3.07% | | | | | |
aThermo Fisher Scientific, Inc. | | 2,511,265 | | | 129,179,472 |
Certified Semi-Annual Report 11
| | |
| SCHEDULE OF INVESTMENTS, CONTINUED | | |
| |
| Thornburg Value Fund | | March 31, 2010 (Unaudited) |
| | | | | |
| | | Shares/
Principal Amount | | Value |
PHARMACEUTICALS — 5.67% | | | | | |
Eli Lilly & Co. | | 4,049,615 | | $ | 146,677,055 |
Roche Holdings AG | | 570,800 | | | 92,570,941 |
| | | | | |
| | | | | 543,578,135 |
| | | | | |
SEMICONDUCTORS & SEMICONDUCTOR EQUIPMENT — 1.33% | | | | | |
SEMICONDUCTORS & SEMICONDUCTOR EQUIPMENT — 1.33% | | | | | |
a MEMC Electronic Materials, Inc. | | 1,516,686 | | | 23,250,796 |
a ON Semiconductor Corp. | | 4,126,527 | | | 33,012,216 |
| | | | | |
| | | | | 56,263,012 |
| | | | | |
SOFTWARE & SERVICES — 12.75% | | | | | |
INFORMATION TECHNOLOGY SERVICES — 6.58% | | | | | |
a Amdocs Ltd. | | 3,023,348 | | | 91,033,008 |
a Computer Sciences Corp. | | 942,018 | | | 51,330,561 |
a Fiserv, Inc. | | 2,663,570 | | | 135,202,813 |
INTERNET SOFTWARE & SERVICES — 2.85% | | | | | |
a Google, Inc. | | 212,250 | | | 120,347,873 |
SOFTWARE — 3.32% | | | | | |
aANSYS, Inc. | | 1,395,965 | | | 60,221,930 |
Microsoft Corp. | | 2,722,100 | | | 79,675,867 |
| | | | | |
| | | | | 537,812,052 |
| | | | | |
TECHNOLOGY HARDWARE & EQUIPMENT — 5.40% | | | | | |
COMPUTERS & PERIPHERALS — 4.61% | | | | | |
a Dell, Inc. | | 9,853,600 | | | 147,902,536 |
a NCR Corp. | | 3,368,100 | | | 46,479,780 |
ELECTRONIC EQUIPMENT, INSTRUMENTS & COMPONENTS — 0.79% | | | | | |
Corning, Inc. | | 1,650,735 | | | 33,361,354 |
| | | | | |
| | | | | 227,743,670 |
| | | | | |
TELECOMMUNICATION SERVICES — 5.91% | | | | | |
DIVERSIFIED TELECOMMUNICATION SERVICES — 2.62% | | | | | |
AT&T Inc. | | 2,603,148 | | | 67,265,344 |
a Level 3 Communications, Inc. | | 26,753,956 | | | 43,341,409 |
WIRELESS TELECOMMUNICATION SERVICES — 3.29% | | | | | |
China Mobile Ltd. | | 10,238,300 | | | 98,502,883 |
a Leap Wireless International, Inc. | | 2,452,700 | | | 40,126,172 |
| | | | | |
| | | | | 249,235,808 |
| | | | | |
UTILITIES — 2.74% | | | | | |
ELECTRIC UTILITIES — 2.74% | | | | | |
Entergy Corp. | | 1,420,236 | | | 115,536,199 |
| | | | | |
| | | | | 115,536,199 |
| | | | | |
TOTAL COMMON STOCK (Cost $3,732,961,389) | | | | | 3,946,344,034 |
| | | | | |
12 Certified Semi-Annual Report
| | |
| SCHEDULE OF INVESTMENTS, CONTINUED | | |
| |
| Thornburg Value Fund | | March 31, 2010 (Unaudited) |
| | | | | | | |
| | | Shares/
Principal Amount | | Value | |
CORPORATE BONDS — 1.19% | | | | | | | |
TELECOMMUNICATION SERVICES — 1.19% | | | | | | | |
DIVERSIFIED TELECOMMUNICATION SERVICES — 1.19% | | | | | | | |
Level 3 Financing, Inc., 9.25%, 11/1/2014 | | $ | 51,489,000 | | $ | 50,201,775 | |
| | | | | | | |
TOTAL CORPORATE BONDS (Cost $44,020,158) | | | | | | 50,201,775 | |
| | | | | | | |
CONVERTIBLE BONDS — 1.69% | | | | | | | |
MATERIALS — 0.66% | | | | | | | |
METALS & MINING — 0.66% | | | | | | | |
bAnglogold Holdings Ltd., 3.50%, 5/22/2014 | | | 25,000,000 | | | 27,877,500 | |
| | | | | | | |
| | | | | | 27,877,500 | |
| | | | | | | |
TELECOMMUNICATION SERVICES — 0.05% | | | | | | | |
DIVERSIFIED TELECOMMUNICATION SERVICES — 0.05% | | | | | | | |
Level 3 Communications, Inc., 2.875%, 7/15/2010 | | | 1,854,000 | | | 1,847,047 | |
| | | | | | | |
| | | | | | 1,847,047 | |
| | | | | | | |
TRANSPORTATION — 0.98% | | | | | | | |
ROAD & RAIL — 0.98% | | | | | | | |
Hertz Global Holdings, Inc., 5.25%, 6/1/2014 | | | 29,332,000 | | | 41,431,450 | |
| | | | | | | |
| | | | | | 41,431,450 | |
| | | | | | | |
TOTAL CONVERTIBLE BONDS (Cost $56,272,555) | | | | | | 71,155,997 | |
| | | | | | | |
SHORT TERM INVESTMENTS — 4.73% | | | | | | | |
AGL Capital Corp., 0.20%, 4/1/2010 | | | 250,000 | | | 250,000 | |
Clark County School District GO, put 4/1/2010 (Insured: AGM/SPA: Bayerische | | | | | | | |
Landesbank) (daily demand notes), 0.33%, 6/15/2021 | | | 2,360,000 | | | 2,360,000 | |
JPMorgan Chase & Co., 0.01%, 4/1/2010 | | | 93,500,000 | | | 93,500,000 | |
Kansas City Power & Light, 0.22%, 4/1/2010 | | | 49,800,000 | | | 49,800,000 | |
Precision Castparts Corp., 0.20%, 4/1/2010 | | | 25,000,000 | | | 25,000,000 | |
Vulcan Materials Co., 0.25%, 4/1/2010 | | | 28,400,000 | | | 28,400,000 | |
| | | | | | | |
TOTAL SHORT TERM INVESTMENTS (Cost $199,310,000) | | | | | | 199,310,000 | |
| | | | | | | |
TOTAL INVESTMENTS — 101.15% (Cost $4,032,564,102) | | | | | $ | 4,267,011,806 | |
LIABILITIES NET OF OTHER ASSETS — (1.15)% | | | | | | (48,318,809 | ) |
| | | | | | | |
NET ASSETS — 100.00% | | | | | $ | 4,218,692,997 | |
| | | | | | | |
Footnote Legend
| b | Securities exempt from registration under Rule 144A of the Securities Act of 1933, as amended. These securities may only be resold in the ordinary course of business in transactions exempt from registration, normally to qualified institutional buyers. As of March 31, 2010, the aggregate value of these securities in the Fund’s portfolio was $27,877,500, representing 0.66% of the Fund’s net assets. |
Portfolio Abbreviations
To simplify the listings of securities, abbreviations are used per the table below:
| | |
| AGM | | Insured by Assured Guaranty Municipal Corp. |
| GO | | General Obligation |
| SPA | | Stand-by Purchase Agreement |
See notes to financial statements.
Certified Semi-Annual Report 13
| | |
| STATEMENT OF ASSETS AND LIABILITIES | | |
| |
| Thornburg Value Fund | | March 31, 2010 (Unaudited) |
| | | | |
ASSETS | | | | |
Investments at value (cost $4,032,564,102) (Note 2) | | $ | 4,267,011,806 | |
Cash | | | 104,825 | |
Receivable for fund shares sold | | | 16,371,864 | |
Unrealized appreciation on forward currency contracts (Note 7) | | | 3,786,296 | |
Dividends receivable | | | 2,625,890 | |
Dividend and interest reclaim receivable | | | 871,253 | |
Interest receivable | | | 2,823,034 | |
Prepaid expenses and other assets | | | 113,058 | |
| | | | |
Total Assets | | | 4,293,708,026 | |
| | | | |
| |
LIABILITIES | | | | |
Payable for securities purchased | | | 63,299,352 | |
Payable for fund shares redeemed | | | 7,248,335 | |
Payable to investment advisor and other affiliates (Note 3) | | | 3,570,153 | |
Accounts payable and accrued expenses | | | 878,931 | |
Dividends payable | | | 18,258 | |
| | | | |
Total Liabilities | | | 75,015,029 | |
| | | | |
| |
NET ASSETS | | $ | 4,218,692,997 | |
| | | | |
NET ASSETS CONSIST OF: | | | | |
Undistributed net investment income | | $ | 4,516,882 | |
Net unrealized appreciation on investments | | | 241,715,228 | |
Accumulated net realized gain (loss) | | | (861,638,820 | ) |
Net capital paid in on shares of beneficial interest | | | 4,834,099,707 | |
| | | | |
| | $ | 4,218,692,997 | |
| | | | |
14 Certified Semi-Annual Report
| | |
| STATEMENT OF ASSETS AND LIABILITIES , CONTINUED |
| |
| Thornburg Value Fund | | March 31, 2010 (Unaudited) |
| | | |
NET ASSET VALUE: | | | |
Class A Shares: | | | |
Net asset value and redemption price per share ($1,359,111,130 applicable to 41,761,061 shares of beneficial interest outstanding - - Note 4) | | $ | 32.54 |
Maximum sales charge, 4.50% of offering price | | | 1.53 |
| | | |
Maximum offering price per share | | $ | 34.07 |
| | | |
| |
Class B Shares: | | | |
Net asset value and offering price per share * ($30,351,020 applicable to 982,113 shares of beneficial interest outstanding - Note 4) | | $ | 30.90 |
| | | |
| |
Class C Shares: | | | |
Net asset value and offering price per share * ($381,938,840 applicable to 12,211,704 shares of beneficial interest outstanding - Note 4) | | $ | 31.28 |
| | | |
| |
Class I Shares: | �� | | |
Net asset value, offering and redemption price per share ($1,962,645,053 applicable to 59,310,268 shares of beneficial interest outstanding - Note 4) | | $ | 33.09 |
| | | |
| |
Class R3 Shares: | | | |
Net asset value, offering and redemption price per share ($195,314,520 applicable to 6,039,036 shares of beneficial interest outstanding - Note 4) | | $ | 32.34 |
| | | |
| |
Class R4 Shares: | | | |
Net asset value, offering and redemption price per share ($64,621,640 applicable to 1,988,776 shares of beneficial interest outstanding - Note 4) | | $ | 32.49 |
| | | |
| |
Class R5 Shares: | | | |
Net asset value, offering and redemption price per share ($224,710,794 applicable to 6,796,982 shares of beneficial interest outstanding - Note 4) | | $ | 33.06 |
| | | |
| * | Redemption price per share is equal to net asset value less any applicable contingent deferred sales charge. |
See notes to financial statements.
Certified Semi-Annual Report 15
| | |
| STATEMENT OF OPERATIONS | | |
| |
| Thornburg Value Fund | | Six Months Ended March 31, 2010 (Unaudited) |
| | | | |
INVESTMENT INCOME: | | | | |
Dividend income (net of foreign taxes withheld of $578,160) | | $ | 34,155,572 | |
Interest income (net of premium amortized of $17,342) | | | 10,843,059 | |
| | | | |
Total Income | | | 44,998,631 | |
| | | | |
| |
EXPENSES: | | | | |
Investment advisory fees (Note 3) | | | 14,195,879 | |
Administration fees (Note 3) | | | | |
Class A Shares | | | 786,351 | |
Class B Shares | | | 21,102 | |
Class C Shares | | | 230,081 | |
Class I Shares | | | 436,624 | |
Class R3 Shares | | | 113,618 | |
Class R4 Shares | | | 33,060 | |
Class R5 Shares | | | 48,899 | |
Distribution and service fees (Note 3) | | | | |
Class A Shares | | | 1,571,848 | |
Class B Shares | | | 168,339 | |
Class C Shares | | | 1,842,533 | |
Class R3 Shares | | | 455,259 | |
Class R4 Shares | | | 66,270 | |
Transfer agent fees | | | | |
Class A Shares | | | 766,865 | |
Class B Shares | | | 38,057 | |
Class C Shares | | | 251,473 | |
Class I Shares | | | 963,980 | |
Class R3 Shares | | | 114,877 | |
Class R4 Shares | | | 41,609 | |
Class R5 Shares | | | 172,978 | |
Registration and filing fees | | | | |
Class A Shares | | | 19,126 | |
Class B Shares | | | 7,756 | |
Class C Shares | | | 9,137 | |
Class I Shares | | | 46,605 | |
Class R3 Shares | | | 9,226 | |
Class R4 Shares | | | 9,752 | |
Class R5 Shares | | | 8,542 | |
Custodian fees (Note 3) | | | 259,478 | |
Professional fees | | | 62,940 | |
Accounting fees | | | 45,160 | |
Trustee fees | | | 49,780 | |
Other expenses | | | 208,493 | |
| | | | |
Total Expenses | | | 23,055,697 | |
Less: | | | | |
Expenses reimbursed by investment advisor (Note 3) | | | (218,622 | ) |
Fees paid indirectly (Note 3) | | | (618 | ) |
| | | | |
Net Expenses | | | 22,836,457 | |
| | | | |
Net Investment Income | | $ | 22,162,174 | |
| | | | |
16 Certified Semi-Annual Report
| | |
| STATEMENT OF OPERATIONS, CONTINUED | | |
| |
| Thornburg Value Fund | | Six Months Ended March 31, 2010 (Unaudited) |
| | | | |
REALIZED AND UNREALIZED GAIN (LOSS) | | | | |
Net realized gain (loss) from: | | | | |
Investments | | $ | 310,266,311 | |
Foreign currency transactions | | | (87,235 | ) |
| | | | |
| | | 310,179,076 | |
| | | | |
Net change in unrealized appreciation (depreciation) on: | | | | |
Investments | | | 46,239,620 | |
Forward currency contracts (Note 7) | | | 3,786,296 | |
Foreign currency translations | | | 7,059 | |
| | | | |
| | | 50,032,975 | |
| | | | |
Net Realized and Unrealized Gain | | | 360,212,051 | �� |
| | | | |
Net Increase in Net Assets Resulting From Operations | | $ | 382,374,225 | |
| | | | |
See notes to financial statements.
Certified Semi-Annual Report 17
| | |
| STATEMENTS OF CHANGES IN NET ASSETS | | |
| |
| Thornburg Value Fund | | |
| | | | | | | | |
| | | Six Months Ended
March 31, 2010* | | | Year Ended
September 30, 2009 | |
INCREASE (DECREASE) IN NET ASSETS FROM: | | | | | | | | |
| | |
OPERATIONS: | | | | | | | | |
Net investment income | | $ | 22,162,174 | | | $ | 45,726,331 | |
Net realized gain (loss) on investments and foreign currency transactions | | | 310,179,076 | | | | (886,084,841 | ) |
Increase (decrease) in unrealized appreciation (depreciation) on investments, forward currency contracts, and foreign currency translation | | | 50,032,975 | | | | 899,659,702 | |
| | | | | | | | |
| | |
Net Increase (Decrease) in Net Assets Resulting from Operations | | | 382,374,225 | | | | 59,301,192 | |
| | |
DIVIDENDS TO SHAREHOLDERS: | | | | | | | | |
From net investment income | | | | | | | | |
Class A Shares | | | (5,861,504 | ) | | | (16,118,746 | ) |
Class B Shares | | | (57,103 | ) | | | (326,779 | ) |
Class C Shares | | | (815,194 | ) | | | (2,935,911 | ) |
Class I Shares | | | (10,970,087 | ) | | | (24,133,460 | ) |
Class R3 Shares | | | (768,419 | ) | | | (2,185,830 | ) |
Class R4 Shares | | | (248,195 | ) | | | (535,872 | ) |
Class R5 Shares | | | (1,194,863 | ) | | | (2,440,948 | ) |
| | |
FUND SHARE TRANSACTIONS (NOTE 4): | | | | | | | | |
Class A Shares | | | 36,244,522 | | | | 64,047,983 | |
Class B Shares | | | (11,322,962 | ) | | | (22,207,742 | ) |
Class C Shares | | | (13,887,688 | ) | | | (43,229,232 | ) |
Class I Shares | | | 220,484,247 | | | | (326,092,244 | ) |
Class R3 Shares | | | 15,931,496 | | | | (5,811,678 | ) |
Class R4 Shares | | | 15,730,254 | | | | 11,324,512 | |
Class R5 Shares | | | 40,555,806 | | | | 21,262,560 | |
| | | | | | | | |
| | |
Net Increase (Decrease) in Net Assets | | | 666,194,535 | | | | (290,082,195 | ) |
| | |
NET ASSETS: | | | | | | | | |
Beginning of Period | | | 3,552,498,462 | | | | 3,842,580,657 | |
| | | | | | | | |
| | |
End of Period | | $ | 4,218,692,997 | | | $ | 3,552,498,462 | |
| | | | | | | | |
| | |
Undistributed net investment income | | $ | 4,516,882 | | | $ | 1,871,097 | |
See notes to financial statements.
18 Certified Semi-Annual Report
| | |
| NOTES TO FINANCIAL STATEMENTS | | |
| |
| Thornburg Value Fund | | March 31, 2010 (Unaudited) |
NOTE 1 – ORGANIZATION
Thornburg Value Fund, hereinafter referred to as the “Fund,” is a diversified series of Thornburg Investment Trust (the “Trust”). The Trust is organized as a Massachusetts business trust under a Declaration of Trust dated June 3, 1987 and is registered as a diversified, open-end management investment company under the Investment Company Act of 1940, as amended. The Fund is currently one of sixteen separate series of the Trust. Each series is considered to be a separate entity for financial reporting and tax purposes and bears expenses directly attributable to it. The Fund seeks long-term capital appreciation by investing in equity and debt securities of all types. As a secondary objective, the Fund also seeks some current income.
The Fund currently offers seven classes of shares of beneficial interest: Class A, Class B, Class C, Institutional Class (Class I), and Retirement Classes (Class R3, Class R4, and Class R5) shares. Each class of shares of the Fund represents an interest in the same portfolio of investments, except that (i) Class A shares are sold subject to a front-end sales charge collected at the time the shares are purchased and bear a service fee, (ii) Class B shares are sold at net asset value without a sales charge at the time of purchase, but are subject to a contingent deferred sales charge upon redemption and bear both a service fee and distribution fee, (iii) Class C shares are sold at net asset value without a sales charge at the time of purchase, but are subject to a contingent deferred sales charge upon redemption within one year of purchase, and bear both a service fee and a distribution fee, (iv) Class I shares are sold at net asset value without a sales charge at the time of purchase, (v) Class R3 shares are sold at net asset value without a sales charge at the time of purchase, but bear both a service fee and distribution fee, (vi) Class R4 shares are sold at net asset value without a sales charge at the time of purchase, but bear a service fee, (vii) Class R5 shares are sold at net asset value without a sales charge at the time of purchase, and (viii) the respective classes may have different reinvestment privileges and conversion rights. Additionally, the Fund may allocate among its classes certain expenses, to the extent allowable to specific classes, including transfer agent fees, government registration fees, certain printing and postage costs, and administrative and legal expenses. Currently, class specific expenses of the Fund are limited to service and distribution fees, administration fees, and certain registration and transfer agent expenses. Class B shares of the Fund outstanding for eight years will convert to Class A shares of the Fund.
NOTE 2 – SIGNIFICANT ACCOUNTING POLICIES
Significant accounting policies of the Trust are as follows:
Valuation of Investments: Portfolio securities listed or traded on a national securities exchange are valued on the valuation date at the last reported sale price on the exchange that is the primary market for the security. Portfolio securities traded on an exchange for which there has been no sale that day and other equity securities traded in the over-the-counter market are valued at the mean between the last reported bid and asked prices. Portfolio securities reported by NASDAQ are valued at the NASDAQ official closing price. Any foreign security traded on exchanges outside the United States is valued at the price of the security on the exchange that is normally the security’s primary market, as of the close of that exchange preceding the time of the Fund’s valuation.
Debt obligations held by the Fund have a primary market over the counter and are valued by an independent pricing service approved by the Trustees of the Trust. The pricing service ordinarily values debt obligations at quoted bid prices. When quotations are not available, debt obligations held by the Fund are valued at evaluated prices determined by the pricing service using methods which include consideration of yields or prices of debt obligations of comparable quality, type of issue, coupon, maturity and rating, and indications as to value from dealers and general market conditions. Short-term obligations having remaining maturities of 60 days or less are valued at amortized cost, which approximates market value.
Quotations in foreign currencies for foreign portfolio investments are converted to U.S. dollar equivalents using the foreign exchange quotation in effect at the time of valuation.
In any case where the market value of an equity security held by the Fund is not readily available, the Trust’s valuation and pricing committee determines a fair value for the security using procedures approved by the Trustees, which may include the use of a price obtained from an independent pricing service. The pricing service ordinarily values equity securities in these instances using multi-factor models to adjust market prices based upon various inputs, including exchange data, depository receipt prices, futures and index data and other data. A security’s market value is deemed not readily available whenever the exchange or market on which the security is primarily traded is closed for the entire scheduled day of trading. Additionally, a security’s market value may be deemed not readily available under other circumstances identified by the Trustees, including when developments occurring after the most recent close of the security’s primary exchange or market, but before the most recent close of trading in Fund shares, create a serious question about the reliability of the security’s market value.
Certified Semi-Annual Report 19
| | |
| NOTES TO FINANCIAL STATEMENTS, CONTINUED |
| |
| Thornburg Value Fund | | March 31, 2010 (Unaudited) |
In any case where a pricing service fails to provide a price for a debt obligation held by the Fund, the valuation and pricing committee determines a fair value for the debt obligation using procedures approved by the Trustees. Additionally, in any case where management believes that a price provided by a pricing service for a debt obligation held by the Fund may be unreliable, the valuation and pricing committee decides whether or not to use the pricing service’s valuation or to determine a fair value for the debt obligation.
In determining fair value for any portfolio security or other investment, the valuation and pricing committee seeks to determine the amount that an owner of the investment might reasonably expect to receive upon a sale of the investment. However, because fair value prices are estimated prices, the valuation and pricing committee’s determination of fair value for an investment may differ from the value that would be realized by the Fund upon a sale of the investment, and that difference could be material to the Fund’s financial statements. The valuation and pricing committee’s determination of fair value for an investment may also differ from the prices obtained by other persons (including other mutual funds) for the investment.
Valuation Measurements: Various inputs are used in determining the value of the Fund’s investments. These inputs are summarized in the three levels listed below.
Level 1: Quoted prices in active markets for identical investments.
Level 2: Other significant observable inputs (including quoted prices for similar investments, interest rates, prepayment rates, credit risk, etc.).
Level 3: Significant unobservable inputs (including the Fund’s own assumptions in determining the fair value of investments).
The following table displays a summary of the inputs used to value the Fund’s net assets as of March 31, 2010. In any instance when valuation inputs from more than one level are used to determine the fair value of a specific investment, the investment is placed in the level of the table based upon the lowest level input that is significant in determining the fair value of the investment:
| | | | | | | | | | | | |
| | | Fair Value Measurements at March 31, 2010 |
| | | Total | | Level 1 | | Level 2 | | Level 3 |
Assets | | | | | | | | | | | | |
Investments in Securities* | | | | | | | | | | | | |
Common Stock | | $ | 3,946,344,034 | | $ | 3,946,344,034 | | $ | — | | $ | — |
Corporate Bonds | | | 50,201,775 | | | — | | | 50,201,775 | | | — |
Convertible Bonds | | | 71,155,997 | | | — | | | 71,155,997 | | | — |
Short Term Investments | | | 199,310,000 | | | — | | | 199,310,000 | | | — |
| | | | | | | | | | | | |
Total Investments in Securities | | $ | 4,267,011,806 | | $ | 3,946,344,034 | | $ | 320,667,772 | | $ | — |
| | | | |
Other Financial Instruments** | | | | | | | | | | | | |
Forward Currency Contracts | | $ | 3,786,296 | | $ | — | | $ | 3,786,296 | | $ | — |
| * | See Schedule of Investments for a summary of the industry exposure as grouped according to the Global Industry Classification Standard (GICS), which is an industry taxonomy developed by Morgan Stanley Capital International (MSCI), and Standard & Poor’s (S&P). |
| ** | Other Financial Instruments include investments not reflected in the Schedule of Investments, such as futures, forwards and swap contracts, which are valued at the unrealized appreciation (depreciation) on the instrument. |
Foreign Currency Translation: Portfolio securities and other assets and liabilities denominated in foreign currencies are translated into U.S. dollars based on the exchange rate of such currencies against the U.S. dollar on the date of valuation. Purchases and sales of securities and income items denominated in foreign currencies are translated into U.S. dollars at the exchange rate in effect on the translation date. When the Fund purchases or sells foreign securities it will customarily enter into a foreign exchange contract to minimize foreign exchange risk from the trade date to the settlement date of such transactions.
20 Certified Semi-Annual Report
| | |
| NOTES TO FINANCIAL STATEMENTS, CONTINUED |
| |
| Thornburg Value Fund | | March 31, 2010 (Unaudited) |
The Fund does not separately report the effect of changes in foreign exchange rates from changes in market prices on securities held. Such changes are included in net realized and unrealized gain or loss from investments.
Reported net realized foreign exchange gains or losses arise from sales of foreign currencies, currency gains or losses realized between the trade and settlement dates on securities transactions and the difference between the amounts of dividends, interest, and foreign withholding taxes recorded on the Fund’s books, and the U.S. dollar equivalent of the amounts actually received or paid.
Net unrealized foreign exchange gains and losses arise from changes in the fair value of assets and liabilities, other than investments in securities at fiscal period end, resulting from changes in exchange rates.
Federal Income Taxes: It is the policy of the Trust to comply with the provisions of the Internal Revenue Code applicable to “regulated investment companies” and to distribute to shareholders substantially all taxable income, including any net realized gain on investments of the Fund. Therefore, no provision for federal income taxes is required.
When-Issued and Delayed Delivery Transactions: The Fund may engage in when-issued or delayed delivery transactions. To the extent the Fund engages in such transactions, it will do so for the purpose of acquiring portfolio securities consistent with the Fund’s investment objectives and not for the purpose of investment leverage or to speculate on interest rate and/or market changes. At the time the Fund makes a commitment to purchase a security on a when-issued or delayed delivery basis, the Fund will record the transaction and reflect the value in determining its net asset value. When effecting such transactions, assets of an amount sufficient to make payment for the portfolio securities to be purchased will be segregated on the Fund’s records on the trade date. Securities purchased on a when-issued or delayed delivery basis do not earn interest until the settlement date.
Dividends: Dividends to shareholders are generally paid quarterly and are reinvested in additional shares of the Fund at net asset value per share at the close of business on the dividend payment date or, at the shareholder’s option, paid in cash. Net realized capital gains, to the extent available, will be distributed at least annually. Distributions to shareholders are based on income tax regulations and therefore, their characteristics may differ for financial statement and tax purposes.
General: Securities transactions are accounted for on a trade date basis. Interest income is accrued as earned and dividend income is recorded on the ex-dividend date. Certain income from foreign securities is recognized as soon as information is available to the Fund. Realized gains and losses from the sale of securities are recorded on an identified cost basis. Net investment income (other than class specific expenses) and realized and unrealized gains and losses are allocated daily to each class of shares based upon the relative net asset value of outstanding shares of each class of shares at the beginning of the day (after adjusting for the current share activity of the respective class). Expenses common to all funds are allocated among the funds comprising the Trust based upon their relative net asset values or other appropriate allocation methods.
Guarantees and Indemnifications: Under the Trust’s organizational documents, its officers and Trustees are indemnified against certain liabilities arising out of the performance of their duties to the Fund. Additionally, in the normal course of business the Trust enters into contracts with service providers that contain general indemnification clauses. The Trust’s maximum exposure under these arrangements is unknown. However, based on experience, the Trust expects the risk of loss to be remote.
Use of Estimates: The preparation of financial statements, in conformity with generally accepted accounting principles, requires management to make estimates and assumptions that affect the reported amounts of assets and liabilities and the disclosure of contingent assets and liabilities at the date of the financial statements and the reported amounts of increases and decreases in net assets from operations during the reporting period. Actual results could differ from those estimates.
NOTE 3 – INVESTMENT ADVISORY FEE AND OTHER TRANSACTIONS WITH AFFILIATES
Pursuant to an investment advisory agreement, Thornburg Investment Management, Inc. (the “Advisor”) serves as the investment advisor and performs services to the Fund for which the fees are payable at the end of each month. For the six months ended March 31, 2010, these fees were payable at annual rates ranging from .875 of 1% to .675 of 1% per annum of the average daily net assets of the Fund depending on the Fund’s asset size. The Trust also has entered into administrative services agreements with the Advisor, whereby the Advisor will perform certain administrative services for the shareholders of each class of the Fund’s shares, and for which fees will
Certified Semi-Annual Report 21
| | |
| NOTES TO FINANCIAL STATEMENTS, CONTINUED |
| |
| Thornburg Value Fund | | March 31, 2010 (Unaudited) |
be payable at an annual rate of up to .125 of 1% per annum of the average daily net assets attributable to each class of shares. For the six months ended March 31, 2010, the Advisor voluntarily or contractually agreed to reimburse certain class specific expenses, administrative fees, and distribution fees of $168,096 for Class R3 shares, $24,857 for Class R4 Shares, and $25,669 for Class R5 shares.
The Trust has an underwriting agreement with Thornburg Securities Corporation (the “Distributor,” an affiliate of the Advisor), which acts as the distributor of the Fund’s shares. For the six months ended March 31, 2010, the Distributor has advised the Fund that it earned net commissions aggregating $48,164 from the sale of Class A shares, and collected contingent deferred sales charges aggregating $6,084 from redemptions of Class C shares of the Fund.
Pursuant to a service plan under Rule 12b-1 of the Investment Company Act of 1940, the Fund may reimburse to the Advisor an amount not to exceed .25 of 1% per annum of the average daily net assets attributable to each class of shares of the Fund for payments made by the Advisor to securities dealers and other financial institutions to obtain various shareholder and distribution related services. The Advisor may pay out of its own resources additional expenses for distribution of the Fund’s shares.
The Trust has also adopted distribution plans pursuant to Rule 12b-1, applicable only to the Fund’s Class B, Class C, and Class R3 shares, under which the Fund compensates the Distributor for services in promoting the sale of Class B, Class C, and Class R3 shares of the Fund at an annual rate of up to .75 of 1% per annum of the average daily net assets attributable to Class B, Class C, and Class R3 shares. Total fees incurred by the Distributor for each class of shares of the Fund under their respective Service and Distribution Plans for the six months ended March 31, 2010, are set forth in the Statement of Operations.
The Trust has an agreement with the custodian bank to indirectly pay a portion of the custodian’s fees through credits earned by the Fund’s cash on deposit with the bank. This deposit agreement is an alternative to overnight investments. Custodial fees have been adjusted to reflect amounts that would have been paid without this agreement, with a corresponding adjustment reflected as fees paid indirectly in the Statement of Operations. For the six months ended March 31, 2010, fees paid indirectly were $618.
Certain officers and Trustees of the Trust are also officers and/or directors of the Advisor and Distributor. The compensation of independent Trustees is borne by the Trust.
NOTE 4 – SHARES OF BENEFICIAL INTEREST
At March 31, 2010, there were an unlimited number of shares of beneficial interest authorized. Transactions in shares of beneficial interest were as follows:
| | | | | | | | | | | | | | |
| | | Six Months Ended
March 31, 2010 (Unaudited) | | | Year Ended
September 30, 2009 (Audited) | |
| | | Shares | | | Amount | | | Shares | | | Amount | |
Class A Shares | | | | | | | | | | | | | | |
Shares sold | | 5,935,597 | | | $ | 183,035,516 | | | 21,996,783 | | | $ | 495,137,300 | |
Shares issued to shareholders in reinvestment of dividends | | 151,203 | | | | 4,759,670 | | | 526,363 | | | | 12,590,999 | |
Shares repurchased | | (4,932,774 | ) | | | (151,557,516 | ) | | (20,767,504 | ) | | | (443,715,236 | ) |
Redemption fees received* | | — | | | | 6,852 | | | — | | | | 34,920 | |
| | | | | | | | | | | | | | |
| | | | |
Net Increase (Decrease) | | 1,154,026 | | | $ | 36,244,522 | | | 1,755,642 | | | $ | 64,047,983 | |
| | | | | | | | | | | | | | |
| | | | |
Class B Shares | | | | | | | | | | | | | | |
Shares sold | | 20,357 | | | $ | 601,325 | | | 123,500 | | | $ | 2,607,505 | |
Shares issued to shareholders in reinvestment of dividends | | 1,560 | | | | 46,443 | | | 12,305 | | | | 270,413 | |
Shares repurchased | | (409,251 | ) | | | (11,970,906 | ) | | (1,177,554 | ) | | | (25,087,288 | ) |
Redemption fees received* | | — | | | | 176 | | | — | | | | 1,628 | |
| | | | | | | | | | | | | | |
| | | | |
Net Increase (Decrease) | | (387,334 | ) | | $ | (11,322,962 | ) | | (1,041,749 | ) | | $ | (22,207,742 | ) |
| | | | | | | | | | | | | | |
22 Certified Semi-Annual Report
| | |
| NOTES TO FINANCIAL STATEMENTS, CONTINUED |
| |
| Thornburg Value Fund | | March 31, 2010 (Unaudited) |
| | | | | | | | | | | | | | |
| | | Six Months Ended
March 31, 2010 (Unaudited) | | | Year Ended
September 30, 2009 (Audited) | |
| | | Shares | | | Amount | | | Shares | | | Amount | |
Class C Shares | | | | | | | | | | | | | | |
Shares sold | | 697,146 | | | $ | 20,620,194 | | | 1,876,368 | | | $ | 41,683,603 | |
Shares issued to shareholders in reinvestment of dividends | | 23,191 | | | | 698,534 | | | 110,865 | | | | 2,523,300 | |
Shares repurchased | | (1,188,974 | ) | | | (35,208,399 | ) | | (4,196,286 | ) | | | (87,447,481 | ) |
Redemption fees received* | | — | | | | 1,983 | | | — | | | | 11,346 | |
| | | | | | | | | | | | | | |
| | | | |
Net Increase (Decrease) | | (468,637 | ) | | $ | (13,887,688 | ) | | (2,209,053 | ) | | $ | (43,229,232 | ) |
| | | | | | | | | | | | | | |
| | | | |
Class I Shares | | | | | | | | | | | | | | |
Shares sold | | 16,654,548 | | | $ | 523,111,175 | | | 22,175,103 | | | $ | 544,582,100 | |
Shares issued to shareholders in reinvestment of dividends | | 266,364 | | | | 8,549,002 | | | 780,762 | | | | 18,926,149 | |
Shares repurchased | | (9,860,279 | ) | | | (311,185,573 | ) | | (39,596,078 | ) | | | (889,646,618 | ) |
Redemption fees received* | | — | | | | 9,643 | | | — | | | | 46,125 | |
| | | | | | | | | | | | | | |
| | | | |
Net Increase (Decrease) | | 7,060,633 | | | $ | 220,484,247 | | | (16,640,213 | ) | | $ | (326,092,244 | ) |
| | | | | | | | | | | | | | |
| | | | |
Class R3 Shares | | | | | | | | | | | | | | |
Shares sold | | 1,707,928 | | | $ | 52,540,786 | | | 1,686,345 | | | $ | 39,658,963 | |
Shares issued to shareholders in reinvestment of dividends | | 23,800 | | | | 743,338 | | | 89,721 | | | | 2,114,046 | |
Shares repurchased | | (1,195,626 | ) | | | (37,353,644 | ) | | (2,071,335 | ) | | | (47,589,434 | ) |
Redemption fees received* | | — | | | | 1,016 | | | — | | | | 4,747 | |
| | | | | | | | | | | | | | |
| | | | |
Net Increase (Decrease) | | 536,102 | | | $ | 15,931,496 | | | (295,269 | ) | | $ | (5,811,678 | ) |
| | | | | | | | | | | | | | |
| | | | |
Class R4 Shares | | | | | | | | | | | | | | |
Shares sold | | 752,120 | | | $ | 23,356,326 | | | 808,447 | | | $ | 20,006,549 | |
Shares issued to shareholders in reinvestment of dividends | | 6,725 | | | | 211,609 | | | 18,317 | | | | 442,047 | |
Shares repurchased | | (256,999 | ) | | | (7,837,984 | ) | | (392,575 | ) | | | (9,125,077 | ) |
Redemption fees received* | | — | | | | 303 | | | — | | | | 993 | |
| | | | | | | | | | | | | | |
| | | | |
Net Increase (Decrease) | | 501,846 | | | $ | 15,730,254 | | | 434,189 | | | $ | 11,324,512 | |
| | | | | | | | | | | | | | |
| | | | |
Class R5 Shares | | | | | | | | | | | | | | |
Shares sold | | 1,726,034 | | | $ | 53,876,720 | | | 2,235,661 | | | $ | 55,055,512 | |
Shares issued to shareholders in reinvestment of dividends | | 36,797 | | | | 1,180,089 | | | 99,135 | | | | 2,411,510 | |
Shares repurchased | | (464,630 | ) | | | (14,502,086 | ) | | (1,587,441 | ) | | | (36,208,743 | ) |
Redemption fees received* | | — | | | | 1,083 | | | — | | | | 4,281 | |
| | | | | | | | | | | | | | |
| | | | |
Net Increase (Decrease) | | 1,298,201 | | | $ | 40,555,806 | | | 747,355 | | | $ | 21,262,560 | |
| | | | | | | | | | | | | | |
| * | The Fund charges a redemption fee of 1% of the Class A and Class I shares redeemed or exchanged within 30 days of purchase. Redemption fees charged to any class are allocated to all classes upon receipt of payment based on relative net asset values of each class or other appropriate allocation methods. |
Certified Semi-Annual Report 23
| | |
| NOTES TO FINANCIAL STATEMENTS, CONTINUED |
| |
| Thornburg Value Fund | | March 31, 2010 (Unaudited) |
NOTE 5 – SECURITIES TRANSACTIONS
For the six months ended March 31, 2010, the Fund had purchase and sale transactions of investment securities (excluding short-term investments) of $1,710,574,201 and $1,394,498,608, respectively.
NOTE 6 – INCOME TAXES
At March 31, 2010, information on the tax components of capital is as follows:
| | | | |
Cost of investments for tax purposes | | $ | 4,032,564,102 | |
| | | | |
Gross unrealized appreciation on a tax basis | | $ | 461,281,946 | |
Gross unrealized depreciation on a tax basis | | | (226,834,242 | ) |
| | | | |
Net unrealized appreciation (depreciation) on investments (tax basis) | | $ | 234,447,704 | |
| | | | |
At March 31, 2010, the Fund had deferred tax basis currency and capital losses occurring subsequent to October 31, 2008 of $1,484,675, and $617,127,482, respectively. For tax purposes, such losses will be reflected in the year ending September 30, 2010.
At March 31, 2010, the Fund had tax basis capital losses of $527,267,206, which may be carried forward to offset future capital gains. To the extent such carryforwards are used, capital gain distributions may be reduced to the extent provided by regulations. Such capital loss carryforwards will expire September 30, 2017.
NOTE 7 – DERIVATIVE FINANCIAL INSTRUMENTS WITH OFF-BALANCE SHEET RISK AND FOREIGN INVESTMENT RISK
The Fund may use a variety of derivative financial instruments to hedge or adjust the risks affecting its investment portfolio or to enhance investment returns. Provisions of FASB Accounting Standards Codification ASC 815-10-50, (“ASC 815”) require certain disclosures. The new requirement amends and expands disclosures related to derivative instruments to provide users of financial statements with an enhanced understanding of the use of derivative instruments by the Fund and how these derivatives affect the financial position, financial performance and cash flows of the Fund. The Fund does not designate any derivative instruments as hedging instruments under ASC 815. During the six months ended March 31, 2010, the Fund’s principal exposure to derivative financial instruments of the type addressed by ASC 815 was investment in foreign exchange contracts. A foreign exchange contract is an agreement between two parties to exchange different currencies at a specified rate of exchange at an agreed upon future date. Foreign exchange contracts involve risks to the Fund, including the risk that a contract counterparty will not meet its obligations to the Fund, the risk that a change in a contract’s value may not correlate perfectly with the currency the contract was intended to track, and the risk that the Fund’s advisor is unable to correctly implement its strategy in using a contract. In any such instance, the Fund may not achieve the intended benefit of entering into a contract, and may experience a loss.
The Fund entered into forward currency contracts during the six months ended March 31, 2010 in the normal course of pursuing its investment objectives, in anticipation of purchasing foreign investments or with the intent of reducing the risk to the value of the Fund’s foreign investments from adverse changes in the relationship between the U.S. dollar and foreign currencies. In each case these contracts have been initiated in conjunction with foreign investment transactions.
These contracts are accounted for by the Fund under ASC 815. Unrealized gains and unrealized losses on outstanding contracts are reported in the Fund’s Statement of Assets and Liabilities at the Fund’s net equity, as measured by the difference between the forward exchange rates at the reporting date and the forward exchange rates at each contract’s inception date. Net realized gain (loss) on contracts closed during the period, and changes in net unrealized appreciation (depreciation) on outstanding contracts are recognized in the Fund’s Statement of Operations.
24 Certified Semi-Annual Report
| | |
| NOTES TO FINANCIAL STATEMENTS, CONTINUED | | |
| |
| Thornburg Value Fund | | March 31, 2010 (Unaudited) |
The following table displays the outstanding forward currency contracts, at March 31, 2010:
Outstanding Forward Currency Contracts
to Buy or Sell at March 31, 2010
| | | | | | | | | | | | | | | |
Contract Description | | Buy/Sell | | Contract
Amount | | Contract
Value Date | | Value
USD | | Unrealized
Appreciation | | Unrealized
Depreciation |
Japanese Yen | | Sell | | 7,000,000,000 | | 09/02/2010 | | $ | 74,953,861 | | $ | 3,786,296 | | $ | — |
| | | | | | | | | | | | | | | |
Total | | | | | | | | | | | $ | 3,786,296 | | $ | — |
| | | | | | | | | | | | | | | |
The unrealized appreciation (depreciation) of the outstanding forward currency contracts recognized in the Fund’s Statement of Assets and Liabilities at March 31, 2010 is disclosed in the following table:
Fair Values of Derivative Financial Instruments
at March 31, 2010
| | | | | |
| Asset Derivatives | | | | |
| | | Balance Sheet Location | | Fair Value |
| | |
Foreign exchange contracts | | Assets - Unrealized appreciation on forward currency contracts | | $ | 3,786,296 |
The change in unrealized appreciation (depreciation) of outstanding forward currency contracts recognized in the Fund’s Statement of Operations for the six months ended March 31, 2010 is disclosed in the following table:
Change in Unrealized Appreciation (Depreciation)
of Derivative Financial Instruments Recognized in
Income for the Six Months Ended March 31, 2010
| | | | | | |
| | | Total | | Forward
Currency Contracts |
Foreign exchange contracts | | $ | 3,786,296 | | $ | 3,786,296 |
OTHER NOTES
Fund management believes no events have occurred between March 31, 2010 and May 20, 2010, the date of issuance of the financial statements, that require adjustment of, or disclosure in, the accompanying financial statements.
Certified Semi-Annual Report 25
FINANCIAL HIGHLIGHTS
Thornburg Value Fund
| | | | | | | | | | | | | | | | | | | | | | | | | | | | | | | | | | | | | | | | | | | | |
| | | PER SHARE PERFORMANCE (for a share outstanding throughout the period)+ | | RATIOS TO AVERAGE NET ASSETS | | | SUPPLEMENTAL DATA |
Unless
Otherwise
Noted,
Periods
are
Fiscal
Years
Ended
Sept. 30, | | Net Asset
Value
Beginning
of
Period | | Net
Investment
Income
(Loss) | | | Net
Realized
&
Unrealized
Gain (Loss)
on
Investments | | | Total from
Investment
Operations | | | Dividends
from Net
Investment
Income | | | Dividends
from Net
Realized
Gains | | | Total
Dividends | | | Net
Asset
Value
End
of
Period | | Net
Investment
Income
(Loss)
(%) | | | Expenses,
After
Expense
Reductions
(%) | | | Expenses,
After
Expense
Reductions
and
Net of
Custody
Credits
(%) | | | Expenses,
Before
Expense
Reductions
(%) | | | Total
Return
(%)(a) | | | Portfolio
Turnover
Rate (%) | | Net
Assets
at End
of Period
(Thousands) |
Class A Shares |
2010(b)(c) | | $ | 29.66 | | 0.17 | | | 2.85 | | | 3.02 | | | (0.14 | ) | | — | | | (0.14 | ) | | $ | 32.54 | | 1.08 | (d) | | 1.27 | (d) | | 1.27 | (d) | | 1.27 | (d) | | 10.21 | | | 38.15 | | $ | 1,359,111 |
2009(c) | | $ | 28.02 | | 0.37 | | | 1.67 | | | 2.04 | | | (0.40 | ) | | — | | | (0.40 | ) | | $ | 29.66 | | 1.58 | | | 1.34 | | | 1.34 | | | 1.34 | | | 7.65 | | | 83.00 | | $ | 1,204,450 |
2008(c) | | $ | 44.17 | | 0.18 | | | (12.26 | ) | | (12.08 | ) | | (0.14 | ) | | (3.93 | ) | | (4.07 | ) | | $ | 28.02 | | 0.52 | | | 1.27 | | | 1.27 | | | 1.27 | | | (29.52 | ) | | 70.65 | | $ | 1,088,766 |
2007(c) | | $ | 37.59 | | 0.29 | | | 7.86 | | | 8.15 | | | (0.27 | ) | | (1.30 | ) | | (1.57 | ) | | $ | 44.17 | | 0.70 | | | 1.27 | | | 1.27 | | | 1.27 | | | 22.23 | | | 79.29 | | $ | 1,599,976 |
2006(c) | | $ | 32.79 | | 0.35 | | | 4.76 | | | 5.11 | | | (0.31 | ) | | — | | | (0.31 | ) | | $ | 37.59 | | 1.02 | | | 1.35 | | | 1.34 | | | 1.35 | | | 15.63 | | | 51.36 | | $ | 1,121,720 |
2005(c) | | $ | 28.11 | | 0.32 | | | 4.64 | | | 4.96 | | | (0.28 | ) | | — | | | (0.28 | ) | | $ | 32.79 | | 1.05 | | | 1.40 | | | 1.40 | | | 1.40 | | | 17.70 | | | 58.90 | | $ | 972,478 |
Class B Shares |
2010(b) | | $ | 28.21 | | 0.04 | | | 2.70 | | | 2.74 | | | (0.05 | ) | | — | | | (0.05 | ) | | $ | 30.90 | | 0.25 | (d) | | 2.17 | (d) | | 2.17 | (d) | | 2.17 | (d) | | 9.72 | | | 38.15 | | $ | 30,351 |
2009 | | $ | 26.66 | | 0.16 | | | 1.58 | | | 1.74 | | | (0.19 | ) | | — | | | (0.19 | ) | | $ | 28.21 | | 0.74 | | | 2.22 | | | 2.22 | | | 2.22 | | | 6.72 | | | 83.00 | | $ | 38,630 |
2008 | | $ | 42.36 | | (0.09 | ) | | (11.68 | ) | | (11.77 | ) | | (0.00 | )(e) | | (3.93 | ) | | (3.93 | ) | | $ | 26.66 | | (0.28 | ) | | 2.05 | | | 2.05 | | | 2.05 | | | (30.05 | ) | | 70.65 | | $ | 64,287 |
2007 | | $ | 36.17 | | (0.04 | ) | | 7.55 | | | 7.51 | | | (0.02 | ) | | (1.30 | ) | | (1.32 | ) | | $ | 42.36 | | (0.09 | ) | | 2.07 | | | 2.07 | | | 2.07 | | | 21.26 | | | 79.29 | | $ | 113,299 |
2006 | | $ | 31.60 | | 0.07 | | | 4.58 | | | 4.65 | | | (0.08 | ) | | — | | | (0.08 | ) | | $ | 36.17 | | 0.21 | | | 2.15 | | | 2.14 | | | 2.15 | | | 14.71 | | | 51.36 | | $ | 96,587 |
2005 | | $ | 27.13 | | 0.08 | | | 4.47 | | | 4.55 | | | (0.08 | ) | | — | | | (0.08 | ) | | $ | 31.60 | | 0.27 | | | 2.17 | | | 2.17 | | | 2.17 | | | 16.78 | | | 58.90 | | $ | 92,410 |
Class C Shares |
2010(b) | | $ | 28.55 | | 0.05 | | | 2.75 | | | 2.80 | | | (0.07 | ) | | — | | | (0.07 | ) | | $ | 31.28 | | 0.32 | (d) | | 2.04 | (d) | | 2.04 | (d) | | 2.04 | (d) | | 9.80 | | | 38.15 | | $ | 381,939 |
2009 | | $ | 26.99 | | 0.18 | | | 1.61 | | | 1.79 | | | (0.23 | ) | | — | | | (0.23 | ) | | $ | 28.55 | | 0.81 | | | 2.12 | | | 2.12 | | | 2.12 | | | 6.83 | | | 83.00 | | $ | 361,966 |
2008 | | $ | 42.82 | | (0.08 | ) | | (11.81 | ) | | (11.89 | ) | | (0.01 | ) | | (3.93 | ) | | (3.94 | ) | | $ | 26.99 | | (0.23 | ) | | 2.02 | | | 2.01 | | | 2.02 | | | (30.03 | ) | | 70.65 | | $ | 401,880 |
2007 | | $ | 36.55 | | (0.02 | ) | | 7.62 | | | 7.60 | | | (0.03 | ) | | (1.30 | ) | | (1.33 | ) | | $ | 42.82 | | (0.05 | ) | | 2.03 | | | 2.03 | | | 2.03 | | | 21.29 | | | 79.29 | | $ | 621,687 |
2006 | | $ | 31.92 | | 0.09 | | | 4.62 | | | 4.71 | | | (0.08 | ) | | — | | | (0.08 | ) | | $ | 36.55 | | 0.27 | | | 2.09 | | | 2.09 | | | 2.09 | | | 14.77 | | | 51.36 | | $ | 490,399 |
2005 | | $ | 27.40 | | 0.09 | | | 4.51 | | | 4.60 | | | (0.08 | ) | | — | | | (0.08 | ) | | $ | 31.92 | | 0.31 | | | 2.14 | | | 2.14 | | | 2.14 | | | 16.80 | | | 58.90 | | $ | 446,567 |
Class I Shares |
2010(b) | | $ | 30.15 | | 0.22 | | | 2.91 | | | 3.13 | | | (0.19 | ) | | — | | | (0.19 | ) | | $ | 33.09 | | 1.40 | (d) | | 0.94 | (d) | | 0.94 | (d) | | 0.94 | (d) | | 10.42 | | | 38.15 | | $ | 1,962,645 |
2009 | | $ | 28.47 | | 0.46 | | | 1.70 | | | 2.16 | | | (0.48 | ) | | — | | | (0.48 | ) | | $ | 30.15 | | 1.94 | | | 0.98 | | | 0.97 | | | 1.00 | | | 8.04 | | | 83.00 | | $ | 1,575,522 |
2008 | | $ | 44.80 | | 0.32 | | | (12.45 | ) | | (12.13 | ) | | (0.27 | ) | | (3.93 | ) | | (4.20 | ) | | $ | 28.47 | | 0.92 | | | 0.91 | | | 0.90 | | | 0.91 | | | (29.24 | ) | | 70.65 | | $ | 1,961,495 |
2007 | | $ | 38.11 | | 0.44 | | | 7.96 | | | 8.40 | | | (0.41 | ) | | (1.30 | ) | | (1.71 | ) | | $ | 44.80 | | 1.05 | | | 0.93 | | | 0.92 | | | 0.93 | | | 22.62 | | | 79.29 | | $ | 2,401,473 |
2006 | | $ | 33.23 | | 0.50 | | | 4.82 | | | 5.32 | | | (0.44 | ) | | — | | | (0.44 | ) | | $ | 38.11 | | 1.41 | | | 0.98 | | | 0.97 | | | 0.98 | | | 16.10 | | | 51.36 | | $ | 1,074,492 |
2005 | | $ | 28.49 | | 0.45 | | | 4.70 | | | 5.15 | | | (0.41 | ) | | — | | | (0.41 | ) | | $ | 33.23 | | 1.44 | | | 0.99 | | | 0.98 | | | 1.00 | | | 18.16 | | | 58.90 | | $ | 457,788 |
Class R3 Shares |
2010(b) | | $ | 29.48 | | 0.15 | | | 2.84 | | | 2.99 | | | (0.13 | ) | | — | | | (0.13 | ) | | $ | 32.34 | | 0.98 | (d) | | 1.35 | (d) | | 1.35 | (d) | | 1.54 | (d) | | 10.16 | | | 38.15 | | $ | 195,315 |
2009 | | $ | 27.86 | | 0.36 | | | 1.66 | | | 2.02 | | | (0.40 | ) | | — | | | (0.40 | ) | | $ | 29.48 | | 1.57 | | | 1.35 | | | 1.35 | | | 1.72 | | | 7.62 | | | 83.00 | | $ | 162,231 |
2008 | | $ | 43.94 | | 0.17 | | | (12.19 | ) | | (12.02 | ) | | (0.13 | ) | | (3.93 | ) | | (4.06 | ) | | $ | 27.86 | | 0.50 | | | 1.35 | | | 1.35 | | | 1.66 | | | (29.54 | ) | | 70.65 | | $ | 161,517 |
2007 | | $ | 37.43 | | 0.26 | | | 7.81 | | | 8.07 | | | (0.26 | ) | | (1.30 | ) | | (1.56 | ) | | $ | 43.94 | | 0.63 | | | 1.35 | | | 1.35 | | | 1.63 | | | 22.11 | | | 79.29 | | $ | 151,260 |
2006 | | $ | 32.68 | | 0.37 | | | 4.71 | | | 5.08 | | | (0.33 | ) | | — | | | (0.33 | ) | | $ | 37.43 | | 1.05 | | | 1.36 | | | 1.35 | | | 1.69 | | | 15.60 | | | 51.36 | | $ | 48,627 |
2005 | | $ | 28.06 | | 0.33 | | | 4.60 | | | 4.93 | | | (0.31 | ) | | — | | | (0.31 | ) | | $ | 32.68 | | 1.07 | | | 1.35 | | | 1.35 | | | 1.94 | | | 17.64 | | | 58.90 | | $ | 11,661 |
Class R4 Shares |
2010(b) | | $ | 29.62 | | 0.14 | | | 2.88 | | | 3.02 | | | (0.15 | ) | | — | | | (0.15 | ) | | $ | 32.49 | | 0.89 | (d) | | 1.25 | (d) | | 1.25 | (d) | | 1.34 | (d) | | 10.21 | | | 38.15 | | $ | 64,622 |
2009 | | $ | 27.99 | | 0.39 | | | 1.67 | | | 2.06 | | | (0.43 | ) | | — | | | (0.43 | ) | | $ | 29.62 | | 1.65 | | | 1.25 | | | 1.25 | | | 1.54 | | | 7.74 | | | 83.00 | | $ | 44,037 |
2008 | | $ | 44.14 | | 0.19 | | | (12.23 | ) | | (12.04 | ) | | (0.18 | ) | | (3.93 | ) | | (4.11 | ) | | $ | 27.99 | | 0.58 | | | 1.24 | | | 1.24 | | | 1.48 | | | (29.47 | ) | | 70.65 | | $ | 29,462 |
2007(f) | | $ | 41.00 | | 0.20 | | | 3.12 | | | 3.32 | | | (0.18 | ) | | — | | | (0.18 | ) | | $ | 44.14 | | 0.70 | (d) | | 1.25 | (d) | | 1.25 | (d) | | 2.34 | (d) | | 8.09 | | | 79.29 | | $ | 7,038 |
Class R5 Shares |
2010(b) | | $ | 30.13 | | 0.22 | | | 2.90 | | | 3.12 | | | (0.19 | ) | | — | | | (0.19 | ) | | $ | 33.06 | | 1.39 | (d) | | 0.98 | (d) | | 0.98 | (d) | | 1.01 | (d) | | 10.37 | | | 38.15 | | $ | 224,711 |
2009 | | $ | 28.45 | | 0.46 | | | 1.71 | | | 2.17 | | | (0.49 | ) | | — | | | (0.49 | ) | | $ | 30.13 | | 1.93 | | | 0.98 | | | 0.98 | | | 1.18 | | | 8.05 | | | 83.00 | | $ | 165,663 |
2008 | | $ | 44.78 | | 0.32 | | | (12.47 | ) | | (12.15 | ) | | (0.25 | ) | | (3.93 | ) | | (4.18 | ) | | $ | 28.45 | | 0.92 | | | 0.98 | | | 0.98 | | | 1.03 | | | (29.30 | ) | | 70.65 | | $ | 135,173 |
2007 | | $ | 38.09 | | 0.49 | | | 7.91 | | | 8.40 | | | (0.41 | ) | | (1.30 | ) | | (1.71 | ) | | $ | 44.78 | | 1.14 | | | 0.91 | | | 0.91 | | | 0.93 | | | 22.63 | | | 79.29 | | $ | 106,906 |
2006 | | $ | 33.22 | | 0.24 | | | 5.07 | | | 5.31 | | | (0.44 | ) | | — | | | (0.44 | ) | | $ | 38.09 | | 0.64 | | | 1.00 | | | 0.98 | | | 3.24 | | | 16.07 | | | 51.36 | | $ | 10,483 |
2005(g) | | $ | 30.75 | | 0.28 | | | 2.45 | | | 2.73 | | | (0.26 | ) | | — | | | (0.26 | ) | | $ | 33.22 | | 1.31 | (d) | | 1.00 | (d) | | 0.99 | (d) | | 127.30 | (d)(h) | | 8.93 | | | 58.90 | | $ | 31 |
| (a) | Not annualized for periods less than one year. |
| (b) | Unaudited Six Month Period Ended March 31. |
| (c) | Sales loads are not reflected in computing total return. |
| (e) | Dividends from net investment income per share were less than $(0.01). |
| (f) | Effective date of this class of shares was February 1, 2007. |
| (g) | Effective date of this class of shares was February 1, 2005. |
| (h) | Due to the size of net assets and fixed expenses, ratios may appear disproportionate. |
| + | Based on weighted average shares outstanding. |
See notes to financial statements.
| | |
| 26 Certified Semi-Annual Report | | Certified Semi-Annual Report 27 |
| | |
| EXPENSE EXAMPLE | | |
| |
| Thornburg Value Fund | | March 31, 2010 (Unaudited) |
As a shareholder of the Fund, you incur two types of costs:
| | (1) | transaction costs, including |
(a) sales charges (loads) on purchase payments for Class A shares;
(b) a deferred sales charge on redemptions of any part or all of a purchase of $1 million of Class A shares within 12 months of purchase;
(c) a deferred sales charge on redemptions of Class B shares within eight years of purchase;
(d) a deferred sales charge on redemptions of Class C shares within 12 months of purchase;
(e) a 30-day redemption fee on Class A and Class I shares;
| | (2) | ongoing costs, including management fees; distribution and/or service (12b-1) fees; and other Fund expenses. |
This example is intended to help you understand your ongoing costs (in dollars) of investing in the Fund and to compare these costs with the ongoing costs of investing in other mutual funds.
The example is based on a $1,000 investment beginning on October 1, 2009, and held until March 31, 2010.
ACTUAL EXPENSES
For each class of shares, the first line of the table at right provides information about actual account values and actual expenses. You may use the information in this line, together with the amount you invested, to estimate the expenses that you paid over the period. Simply divide your account value by $1,000 (for example, an $8,600 account value divided by $1,000 = 8.6), then multiply the result by the number in the first line for your class of shares under the heading entitled “Expenses Paid During Period” to estimate the expenses you paid on your account during this period.
HYPOTHETICAL EXAMPLE FOR COMPARISON PURPOSES
For each class of shares, the second line of the table at right provides information about hypothetical account values and hypothetical expenses based on the Fund’s actual expense ratio and an assumed rate of return of 5% per year before expenses, which is not the Fund’s actual return. The hypothetical account values and expenses may not be used to estimate the actual ending account balance or expenses you paid for the period. You may use this information to compare the ongoing costs of investing in the Fund and other funds. To do so, compare this 5% hypothetical example with the 5% hypothetical examples that appear in the shareholder reports of the other funds.
| | | | | | | | | |
| | | Beginning
Account Value
10/1/09 | | Ending
Account Value
3/31/10 | | Expenses Paid
During Period†
10/1/09–3/31/10 |
Class A Shares | | | | | | | | | |
Actual | | $ | 1,000.00 | | $ | 1,102.10 | | $ | 6.67 |
Hypothetical* | | $ | 1,000.00 | | $ | 1,018.59 | | $ | 6.40 |
Class B Shares | | | | | | | | | |
Actual | | $ | 1,000.00 | | $ | 1,097.20 | | $ | 11.33 |
Hypothetical* | | $ | 1,000.00 | | $ | 1,014.13 | | $ | 10.88 |
Class C Shares | | | | | | | | | |
Actual | | $ | 1,000.00 | | $ | 1,098.00 | | $ | 10.67 |
Hypothetical* | | $ | 1,000.00 | | $ | 1,014.76 | | $ | 10.25 |
Class I Shares | | | | | | | | | |
Actual | | $ | 1,000.00 | | $ | 1,104.20 | | $ | 4.92 |
Hypothetical* | | $ | 1,000.00 | | $ | 1,020.25 | | $ | 4.73 |
Class R3 Shares | | | | | | | | | |
Actual | | $ | 1,000.00 | | $ | 1,101.60 | | $ | 7.07 |
Hypothetical* | | $ | 1,000.00 | | $ | 1,018.20 | | $ | 6.79 |
Class R4 Shares | | | | | | | | | |
Actual | | $ | 1,000.00 | | $ | 1,102.10 | | $ | 6.54 |
Hypothetical* | | $ | 1,000.00 | | $ | 1,018.71 | | $ | 6.28 |
Class R5 Shares | | | | | | | | | |
Actual | | $ | 1,000.00 | | $ | 1,103.70 | | $ | 5.15 |
Hypothetical* | | $ | 1,000.00 | | $ | 1,020.04 | | $ | 4.94 |
| † | Expenses are equal to the annualized expense ratio for each class (A: 1.27%; B: 2.17%; C: 2.04%; I: 0.94%; R3: 1.35%; R4: 1.25%; R5: 0.98%) multiplied by the average account value over the period, multiplied by 182/365 to reflect the one-half year period. |
| * | Hypothetical assumes a rate of return of 5% per year before expenses. |
Please note that the expenses shown in the table are meant to highlight your ongoing costs only and do not reflect any transactional costs, such as sales charges (loads), redemption fees, or exchange fees. Therefore, the second line of the table for each class of shares is useful in comparing ongoing costs only, and will not help you determine the relative total costs of owning different funds. In addition, if these transactional costs were included, your costs would have been higher.
28 Certified Semi-Annual Report
| | |
| INDEX COMPARISON | | |
| |
| Thornburg Value Fund | | March 31, 2010 (Unaudited) |
GROWTH OF A HYPOTHETICAL $10,000 INVESTMENT
Thornburg Value Fund versus S&P 500 Index (October 2, 1995 to March 31, 2010)
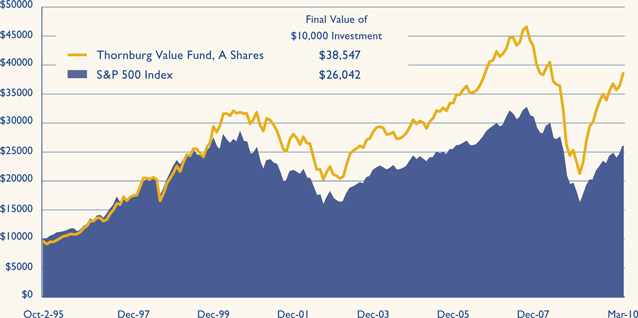
AVERAGE ANNUAL TOTAL RETURNS
For periods ended March 31, 2010 (with sales charge)
| | | | | | | | | | | | |
| | | 1 Yr | | | 5 Yrs | | | 10 Yrs | | | Since
Inception | |
A Shares (Incep: 10/2/95) | | 58.58 | % | | 4.14 | % | | 1.54 | % | | 9.76 | % |
B Shares (Incep: 4/3/00) | | 59.51 | % | | 3.91 | % | | — | | | 1.46 | % |
C Shares (Incep: 10/2/95) | | 63.73 | % | | 4.32 | % | | 1.23 | % | | 9.26 | % |
I Shares (Incep: 11/2/98) | | 66.53 | % | | 5.49 | % | | 2.41 | % | | 6.36 | % |
R3 Shares (Incep: 7/1/03) | | 65.90 | % | | 5.05 | % | | — | | | 6.39 | % |
R4 Shares (Incep: 2/1/07) | | 66.02 | % | | — | | | — | | | -3.10 | % |
R5 Shares (Incep: 2/1/05) | | 66.51 | % | | 5.46 | % | | — | | | 5.33 | % |
S&P 500 Index (Since 10/2/95) | | 49.77 | % | | 1.92 | % | | -0.65 | % | | 6.83 | % |
The S&P 500 Index, an unmanaged broad measure of the U.S. stock market, does not reflect sales charges or expenses. Investors cannot invest directly in an index.
Performance data reflects past performance, which is no guarantee of future results. The performance data and graph do not reflect the deduction of taxes that a shareholder would pay on distributions or the redemption of Fund shares. Returns reflect the reinvestment of dividends and capital gains as well as applicable sales charges. Class A shares are sold with a maximum sales charge of 4.50%. Class B shares carry a contingent deferred sales charge (CDSC) that declines from 5.00% to 0% depending upon the period of time the shares are held. Class B shares will automatically convert to Class A shares on a quarterly basis approximately eight years after purchase. Class C shares are subject to a 1% CDSC for the first year only. There is no up-front sales charge for Class I, R3, R4 and R5 shares. Class A and I shares are subject to a 1% 30-day redemption fee.
Certified Semi-Annual Report 29
| | |
| OTHER INFORMATION | | |
| |
| Thornburg Value Fund | | March 31, 2010 (Unaudited) |
PORTFOLIO PROXY VOTING
Policies and Procedures:
The Trust has delegated to Thornburg Investment Management, Inc. (the “Advisor”) voting decisions respecting proxies for the Fund’s voting securities. The Advisor makes voting decisions in accordance with its Proxy Voting Policy and Procedures. A description of the Policy and Procedures is available (i) without charge, upon request, by calling the Advisor toll-free at 1-800-847-0200, (ii) on the Thornburg web site at www.thornburg.com, and (iii) on the Securities and Exchange Commission’s web site at www.sec.gov.
Information regarding how proxies were voted is available on or before August 31 of each year for the twelve months ending the preceding June 30. This information is available (i) without charge, upon request by calling the Advisor toll-free at 1-800-847-0200, (ii) on the Thornburg web site at www.thornburg.com, and (iii) on the Securities and Exchange Commission’s web site at www.sec.gov.
AVAILABILITY OF QUARTERLY PORTFOLIO SCHEDULE
The Fund files with the Securities and Exchange Commission schedules of its portfolio holdings on Form N-Q for the first and third quarters of each fiscal year. The Fund’s Forms N-Q are available on the Commission’s web site at www.sec.gov, or may be reviewed and copied at the Commission’s Public Reference Room in Washington, D.C. Information on the operation of the Public Reference Room may be obtained by calling 1-800-SEC-0330. The Fund also makes this information available on its web site at www.thornburg. com/download or upon request by calling 1-800-847-0200.
30 Certified Semi-Annual Report
Trustees’ Statement to Shareholders
Not part of the Certified Semi-Annual Report
February 8, 2005, as readopted July 22, 2009
The Trustees are concerned that ongoing commentaries and opinions reported in the media may confuse investors in general as to the supervisory duties of trustees of mutual funds and, in particular, leave Thornburg Investment Trust shareholders uncertain regarding how we discharge our responsibilities in supervising the Funds’ investment advisor and in reviewing the advisor’s contract for renewal. We decided to spell out clearly three principal guidelines that we follow in supervising the Trust’s investment advisor on your behalf.
We begin with the premise that each shareholder selected his or her Fund because its investments are managed by the investment advisor identified in the prospectus and in accordance with the objective and policies described in the prospectus. We realize, as each of you do, that if you believe that your Fund’s stated objective and policies no longer serve your personal investment goals, you can sell your shares and leave the Fund.
Therefore, we believe that our primary supervisory task – our principal obligation to you – is to assess the nature and quality of the advisor’s services, and to confirm that the advisor actively and competently pursues the Fund’s objective, in accordance with the policies set out in the prospectus. To do this, we meet regularly with management to review your Fund’s portfolio and to discuss the advisor’s specific actions and judgments in pursuing the Fund’s objective. We do not substitute our own judgment for the advisor’s decisions in selecting investments; the advisor is paid to exercise its informed judgment on investment decisions, and we seek to confirm, in reviewing the advisor’s performance, that the advisor is doing just that.
Second, while we are conscious of costs and the effect that costs have on shareholders’ returns, we do not seek the lowest fees or expense ratio as our sole or primary objective. We try to make sure that your Fund’s fees and costs are reasonable in relationship to the services rendered and that they are generally in line with those charged by other expert investment advisors, consistent with our belief that the Fund’s investors searched for and expect that expertise and attention and have decided to pay a reasonable price for it. We do not put the management contract “out to bid” as a matter of course, and we would not do so unless we had concluded that the advisor materially had failed to pursue the Fund’s objectives in accordance with its policies, or for other equally important reasons. We believe that any other approach would be inconsistent with your interests and contrary to your expectations when you bought shares of the Fund in the first place.
Finally, because we believe that most Thornburg Fund shareholders have invested with a long-term perspective, we try not to focus too much on the fashions of the moment and on short-term performance. The market will not favor any specific investment objective or set of policies at all times and under all economic circumstances. A fund will experience periods of both high and low returns relative to other funds and other investments. Even if one of our Funds is not favored by the market at a particular time, we believe that the advisor is nonetheless obliged to remain true to the Fund’s objective and policies, and we watch to see that it does so.
This page is not part of the Semi-Annual Report. 31
This page intentionally left blank.
32 This page is not part of the Semi-Annual Report.
Retirement and Education Accounts
Thornburg Investment Management offers retirement and education savings accounts that can help you meet a variety of planning challenges. For account applications or further information on any of the accounts below, please call 1-800-847-0200 or go to www.thornburg.com/ira. Your financial advisor can help you determine which plan is right for you.
Individual Retirement Accounts
Individual Retirement Accounts (IRAs) provide a tax-advantaged means to save money for the future. For a detailed outline of the difference between retirement accounts, see www.thornburg.com/ira. Rollovers are available. Call 1-800-847-0200 for more information.
Traditional IRAs – Contributions to Traditional IRAs are tax deductible for eligible individuals, and withdrawals are taxed as additional ordinary income. You may contribute to an IRA if you receive compensation and are under 70 1/ 2, even if you are covered by an employer retirement plan. Deductible contributions are subject to certain qualifications. Please consult your tax advisor.
Roth IRAs – Under a Roth IRA, there is no tax deduction for contributions, but there is no income tax on qualified withdrawals. For a more detailed comparison of Traditional and Roth IRAs, please see our web site at www.thornburg.com/ira.
SEP IRAs – Simplified Employee Pension (SEP) IRAs are established by employers. The employer is allowed a tax deduction for contributions made to the SEP Plan and makes contributions to each eligible employee’s SEP IRA on a discretionary basis.
SIMPLE IRAs – Savings Incentive Match Plan for Employees of Small Employers (SIMPLE) is designed to give small business owners a simplified method to establish and contribute to a retirement plan for employees. The employer is allowed a tax deduction for contributions and makes either matching or non-elective contributions to each eligible employee’s SIMPLE IRA. Employees may make salary deferral contributions.
Coverdell Education Savings Account
These savings accounts are designed to provide a way to save money for higher education expenses. In an Education Savings Account, earnings and interest grow tax-free, and qualified withdrawals used to pay for eligible higher-education expenses are tax- and penalty-free.
Funds Available
The following funds are available in the accounts listed above:
| | • | | Thornburg International Value Fund |
| | • | | Thornburg Core Growth Fund |
| | • | | Thornburg Investment Income Builder Fund |
| | • | | Thornburg Global Opportunities Fund |
| | • | | Thornburg International Growth Fund |
| | • | | Thornburg Developing World Fund |
| | • | | Thornburg Limited Term U.S. Government Fund |
| | • | | Thornburg Limited Term Income Fund |
| | • | | Thornburg Strategic Income Fund |
This page is not part of the Semi-Annual Report. 33

Thornburg Equity Funds
Thornburg’s equity research uses a fundamental and comprehensive analytical approach. Thornburg equity funds focus on a limited number of securities so that each holding can impact performance. The equity team searches for firms believed to have a promising future and seeks to buy shares of those companies at a discount to their intrinsic value.
| | • | | Thornburg International Value Fund |
| | • | | Thornburg Core Growth Fund |
| | • | | Thornburg Investment Income Builder Fund |
| | • | | Thornburg Global Opportunities Fund |
| | • | | Thornburg International Growth Fund |
| | • | | Thornburg Developing World Fund |
Thornburg Bond Funds
Thornburg Investment Management applies a disciplined philosophy to fixed-income management. Since the launch of our first fixed-income fund over 25 years ago, we have been conducting fundamental, bottom-up research in an effort to identify bonds which we believe provide the best return for a given level of risk. We are very organic in our approach, avoiding leverage or complex strategies which could backfire in periods of market uncertainty.
| | • | | Thornburg Limited Term Municipal Fund |
| | • | | Thornburg Intermediate Municipal Fund |
| | • | | Thornburg California Limited Term Municipal Fund |
| | • | | Thornburg New Mexico Intermediate Municipal Fund |
| | • | | Thornburg New York Intermediate Municipal Fund |
| | • | | Thornburg Strategic Municipal Income Fund |
| | • | | Thornburg Limited Term U.S. Government Fund |
| | • | | Thornburg Limited Term Income Fund |
| | • | | Thornburg Strategic Income Fund |
Before investing, carefully consider the Fund’s investment goals, risks, charges, and expenses. For a prospectus containing this and other information, contact your financial advisor or visit thornburg. com. Read it carefully before investing.
For additional information, please visit www.thornburg.com
Thornburg Investment Management, Inc. 2300 North Ridgetop Road, Santa Fe, NM 87506
This page is not part of the Semi-Annual Report. 35
| | | | | | |
 | | Waste not, Wait not | |  |
| | |
| | | | Get instant access to your shareholder reports. |
| | |
| | This Semi-Annual Report is submitted for the general information of shareholders of the Fund. It is not authorized for distribution to prospective investors in the Fund unless preceded or accompanied by an effective prospectus. | | By switching from your postal mailbox to your email
inbox, you reduce paper clutter, improve record keeping
access, and help conserve our natural resources. |
| | |

| | Investment Advisor: Thornburg Investment Management® | | Go to www.thornburg.com/edelivery and sign up to
receive your shareholder reports, prospectuses, and
proxy statements electronically. |
| | | |
| | 800.847.0200 | | | | |
| | | |
| | Distributor: | | | | |
| | Thornburg Securities Corporation® 800.847.0200 | | You invest in the future, without spending a dime. |
| | | |
| | TH170 | | | | |

2 This page is not part of the Semi-Annual Report.
Important Information
The information presented on the following pages was current as of March 31, 2010. The managers’ views, portfolio holdings, and sector and country diversification are provided for the general information of the Fund’s shareholders; they are historical and subject to change. This material should not be deemed a recommendation to buy or sell any of the securities mentioned.
Investments in the Fund carry risks, including possible loss of principal. Special risks may be associated with investments outside the United States, especially in emerging markets, including currency fluctuations, illiquidity and volatility. Investments in small capitalization companies may increase the risk of greater price fluctuations. Please see the Fund’s Prospectus for a discussion of the risks associated with an investment in the Fund. Investments in the Fund are not FDIC insured, nor are they deposits of or guaranteed by a bank or any other entity. There is no guarantee that the Fund will meet its investment objectives. Funds invested in a limited number of holdings may expose an investor to greater volatility.
Performance data given at net asset value (NAV) does not take into account the applicable sales charges. If the sales charges had been included, the performance would have been lower.
Class I, R3, R4, and R5 shares may not be available to all investors. Minimum investments for Class I shares may be higher than those for other classes.
| | | | |
Share Class | | NASDAQ Symbol | | Cusip |
Class A | | TGVAX | | 885-215-657 |
Class B | | THGBX | | 885-215-616 |
Class C | | THGCX | | 885-215-640 |
Class I | | TGVIX | | 885-215-566 |
Class R3 | | TGVRX | | 885-215-525 |
Class R4 | | THVRX | | 885-215-269 |
Class R5 | | TIVRX | | 885-215-368 |
Glossary
MSCI EAFE (Europe, Australasia, Far East) Index – An unmanaged, market capitalization weighted index that is the common benchmark for international portfolio performance. The index is calculated with net dividends reinvested in U.S. dollars.
MSCI All Country World ex-U.S. Index – The Morgan Stanley Capital International All Country World ex-U.S. Index (MSCI ACWI ex-U.S.) is a market capitalization weighted index composed of over 1,000 companies, and is representative of the market structure of 44 developed and emerging market countries in North and South America, Europe, Africa, and the Pacific Rim, excluding securities of United States’ issuers. The index is calculated with gross dividends reinvested in U.S. dollars.
MSCI Emerging Markets Index – The MSCI Emerging Markets Index is a free float-adjusted market capitalization index that is designed to measure equity market performance of emerging markets. As of June 2009 the MSCI Emerging Markets Index consisted of the following 22 emerging market country indices: Brazil, Chile, China, Colombia, Czech Republic, Egypt, Hungary, India, Indonesia, Israel, Korea, Malaysia, Mexico, Morocco, Peru, Philippines, Poland, Russia, South Africa, Taiwan, Thailand, and Turkey.
Unless otherwise noted, index returns reflect the reinvestment of income dividends and capital gains, if any, but do not reflect fees, brokerage commissions or other expenses of investing. Investors may not make direct investments into any index. The performance of any index is not indicative of the performance of any particular investment.
Beta – A measure of market-related risk. Less than one means the portfolio is less volatile than the index, while greater than one indicates more volatility than the index.
Median Market Capitalization – Market capitalization (market cap) is the total value of a company’s stock, calculated by multiplying the number of outstanding common shares by the current share price. The company whose market cap is in the middle of the portfolio is the median market cap. Half the companies in the portfolio have values greater than the median, and half have values that are less.
Price to Book Value (P/B) – A ratio used to compare a stock’s market value to its book value. It is calculated by dividing the current closing price of the stock by the latest quarter’s book value (book value is simply assets minus liabilities).
Price to Cash Flow Ratio – A measure of the market’s expectations of a firm’s future financial health. It is calculated by dividing the price per share by cash flow per share.
Price to Earnings Ratio (P/E) – A valuation ratio equaling a company’s market value per share divided by earnings per share.
This page is not part of the Semi-Annual Report. 3
Thornburg International Value Fund

IMPORTANT PERFORMANCE INFORMATION
Performance data shown represents past performance and is no guarantee of future results. Investment return and principal value will fluctuate so shares, when redeemed, may be worth more or less than their original cost. Current performance may be lower or higher than quoted. For performance current to the most recent month end, visit thornburg.com.
The maximum sales charge for Class A shares is 4.50% . Class A shares are subject to a 1% 30-day redemption fee. The total annual fund operating expense of Class A shares is 1.34%, as disclosed in the most recent Prospectus.
Finding Promising Companies at a Discount
The Thornburg International Value Fund seeks to find value in overseas markets. It differs from many other international equity funds in two key ways. First, it focuses on a limited number of stocks, and second, it takes a more comprehensive approach to value investing.
Our team is dedicated to providing value to shareholders. We accomplish this through the application of seasoned investment principles with hands-on, company-oriented research. We use a collaborative approach in implementing our investment research process. Our focus is on finding promising companies available at a discount to our estimate of their intrinsic value, no matter where they are located outside the United States. Geographic location is secondary to individual stock merit.
In managing the Thornburg International Value Fund, we take a bottom-up approach to stock selection. The Fund is not predisposed to a particular geographic region or industry. We use a variety of valuation methods and business evaluations in an effort to gauge the intrinsic value of a company based on its past record and future potential. The continuum of process moves from screens and idea generation, through conventional “Wall Street” research and documentation, to company contact, the latter often including on-site visits. The focus of the analysis is on what’s behind the numbers:
AVERAGE ANNUAL TOTAL RETURNS
FOR PERIODS ENDED 3/31/10
| | | | | | | | | | | | | | | |
| | | 1 Yr | | | 3 Yrs | | | 5 Yrs | | | 10 Yrs | | | Since
Inception | |
A Shares (Incep: 5/28/98) | | | | | | | | | | | | | | | |
Without sales charge | | 49.73 | % | | -1.23 | % | | 7.99 | % | | 6.22 | % | | 9.18 | % |
With sales charge | | 43.00 | % | | -2.74 | % | | 7.00 | % | | 5.73 | % | | 8.75 | % |
MSCI EAFE Index (Since: 5/28/98) | | 54.44 | % | | -7.02 | % | | 3.75 | % | | 1.27 | % | | 3.49 | % |
4 This page is not part of the Semi-Annual Report.
its revenue and cash-generating model. We make an effort to get to know the company’s reputation in the industry, its people and its corporate culture.
The current posture is to maintain a portfolio of 50–70 companies diversified by country, sector, industry, market capitalization, and our three categories of stocks: Basic Value, Consistent Earners and Emerging Franchises. Because of the limited number of stocks in the portfolio, every holding counts. At the time of purchase, we set a 12–18 month price target for each stock. The target is reviewed as the fundamentals of the stock change during the course of ownership.
The bottom line? Engendering a wide-open, collegial environment fosters information flows and critical thinking intended to benefit portfolio decision making. We do not view our location in Santa Fe, NM, as a disadvantage. While we have access to the best of Wall Street’s analysis, we are not ruled by it. Distance from the crowd serves to fortify independent and objective thinking.
STOCKS CONTRIBUTING AND DETRACTING
FOR THE SIX MONTHS ENDED 3/31/10
| | |
Top Contributors | | Top Detractors |
Teva Pharmaceutical Industries Ltd. | | National Bank of Greece S.A. |
Wal-Mart de México SAB de C.V. | | Lafarge SA |
Novo Nordisk A/S | | Vestas Wind Systems A/S |
China Merchants Bank Co. Ltd | | AXA |
Sinopharm Group Co. | | Telefónica SA |
Source: FactSet | | |
KEY PORTFOLIO ATTRIBUTES
As of 3/31/10
| | | |
Portfolio P/E Trailing 12-months* | | | 18.7x |
Portfolio Price to Cash Flow* | | | 8.4x |
Portfolio Price to Book Value* | | | 2.3x |
Median Market Cap* | | $ | 35.3 B |
7-Year Beta (A Shares vs. MSCI EAFE)* | | | 0.91 |
Number of Companies | | | 64 |
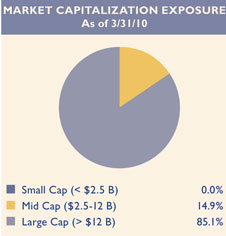
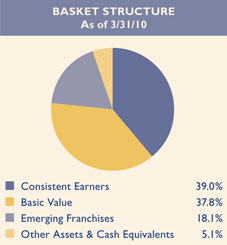
This page is not part of the Semi-Annual Report. 5

Thornburg International Value Fund
March 31, 2010
Table of Contents
This report is certified under the Sarbanes-Oxley Act of 2002, which requires that public companies, including mutual funds, affirm that the information provided in their annual and semiannual shareholder reports fully and fairly represents their financial position.
6 Certified Semi-Annual Report
Letter to Shareholders
| | |


| | April 15, 2010 Dear Fellow Shareholder: We are pleased to report encouraging results from your investment in the Thornburg International Value Fund. Last year at this time, the merit of investing in equities was being called into question by many. Over the previous decade, the majority of investors had achieved little or no return, and for many the experience was loss making. Fortunately, the significant recovery since has repaired some of the damage. While we recognize the bounce back has not been complete, with the markets and portfolio NAV (net asset value) per share still below the peak levels reached in the fall of 2007, current global business and economic trends reinforce optimism. For the six-month period ended March 31, 2010, Thornburg International Value Fund (Class A shares at NAV) returned 5.67% versus 3.06% for the MSCI EAFE Index and 5.51% for the MSCI All Country (AC) World ex-U.S. Index. Health care, consumer staples, and consumer discretionary were the Fund’s standout sectors relative to the MSCI EAFE Index, reflecting particularly effective stock selection, better sentiment on economic recovery, as well as evidence of the earnings benefits from corporate cost containment efforts. Health care holdings likely benefited from passage of U.S. health care legislation since these companies each have significant business in the United States. During these six months, our portfolio remained overweighted in health care, consumer discretionary, and consumer staples and underweighted in industrial, materials, and utilities. The stocks in the health care area that contributed the most to our good performance were: Teva Pharmaceutical, Novo Nordisk, and Sinopharm. Teva’s generic drug business benefits as insurance companies and governments are energized to minimize drug costs. Over the next several years, a number of widely used drugs will be coming off patent, providing an opportunity for Teva’s generic formulations to garner material market share. Increased potential volume growth from the near universal coverage of U.S. citizens is also perceived as a plus. Novo Nordisk continues to innovate in both product and delivery mechanisms for diabetics. Recent approval of a new treatment of Type II diabetes, Victoza, a glucagon-like peptide-1 (GLP-1), is being well received. Sinopharm is one of the leading pharmaceutical distributors in China. The industry in China is fairly fragmented, presenting an opportunity for improved effectiveness and efficiency as a nationwide system is developed. |
Certified Semi-Annual Report 7
Letter to Shareholders,
Continued
In the consumer area, leading brands like Wal-Mart de México (Walmex), Nestlé, and luxury goods designer LVMH benefited from the resumption of growth in emerging markets. Economically sensitive sector names such as China Merchants (banking), BHP Billiton (materials) and Canadian National Railway (industrials) also performed well. It is encouraging for the global economy that Canadian National is increasing car loadings. Import and export activity (grains, forest products, minerals, containers) are an important part of their business. The strong performance of Arm Holdings, a U.K. technology company with significant royalty income from mobile phone component designs, reflected the potential benefits from growth in smartphone handsets.
Emerging markets outperformed developed markets this quarter, with the MSCI Emerging Markets Index up 11.16% (vs. MSCI EAFE 5.51%) . A couple of our Chinese holdings were stand-out performers. The previously mentioned Sinopharm was one. As the largest pharmaceutical distributor in China, the company has the potential for more operating leverage as tier II and III cities are integrated into the company’s national distribution system. Baidu, the Chinese search engine company traded on the New York Stock Exchange, moved up rather dramatically as competitor Google announced curtailment of activity in China. China Merchants Bank’s positive performance was influenced by a sequential improvement in net interest margin. The bank also strengthened its capital base to support loan growth through a rights offering (share subscription for existing shareholders in which we participated). Walmex moved higher, reflecting market share gains during the downturn and an opportunistic acquisition of minority stakes in its Central American subsidiaries.
While it was a good period, not all holdings performed well. Detractors during the period were generally reflective of the continued sovereign issues across Europe, as Greece looks to refinance its debt commitments and investors grow increasingly concerned about fiscal deficits in Italy, Spain, and other European countries. National Bank of Greece and Intesa Sanpaolo, the Italian bank, were among the most disappointing. Telecommunication holdings Telefónica and Turkcell also came under pressure, in part, due to some of these same concerns, as well as a perception of a maturing revenue stream in increasingly competitive and adversely regulated markets. We have trimmed position size in National Bank of Greece to reflect the likely deteriorating operating environment for the bank coupled with the uncertainty in assessing both macro and political risks in the region. Another detractor was Lafarge, the French cement company. The company reported disappointing fourth quarter results as emerging market strength was more than offset by weak developed-market business. In time, as the global recovery progresses, we believe that the company’s results will rebound with the cyclical lift in developed markets, while maintaining its leadership position and growth in developing economies.
Given the experience of the past couple of years, we feel there is no reason to be overconfident about the direction of markets. It is encouraging that the global economy appears to have regained equilibrium and markets have established upward momentum. We believe that the pace of economic growth will likely persist at a faster pace in emerging markets than in developed regions. We appear to be at the onset stage of rebalancing global economies as evidenced by changing volatility characteristics in certain market prices, such as exchange rates and commodities. As consumers and governments of Western nations delever, the increasing importance of the Chinese economy as the engine of global growth has been reinforced. This will become
8 Certified Semi-Annual Report
even more apparent as the Chinese Yuan (RMB) resumes its value climb compared with the rest of the world’s leading currencies. This one aspect of change will likely reorder the conventional wisdoms of normal patterns of trade and finance. The implications for future economic activity are many. The most obvious aspects will relate to trade deficits in the West, which should diminish as their exports become more competitive and Chinese consumers, companies, and governments exercise growing purchasing power. There will likely be some inflationary pressure in the West and Japan from higher-priced imported Chinese goods (welcomed in Japan, where deflation and a high savings rate have been restraining economic growth). All of the ramifications from the likely revaluing of the RMB will only play out over time.
As we look forward to spring and summer, we remain hopeful that unintended consequences of these or other actions or events will not disrupt a global recovery that seems well underway. We continue to hold a portfolio that we believe can benefit from the current economic recovery and healthy equity markets. The portfolio is focused on individual businesses to provide an opportunity for competitive returns and remains sufficiently diversified for sustainability should markets disappoint in the near term.
Sincerely,
| | | | |
| | |
 | |  | |  |
| William V. Fries,CFA | | Wendy Q. Trevisani | | Lei Wang,CFA |
| Co-Portfolio Manager | | Co-Portfolio Manager | | Co-Portfolio Manager |
| Managing Director | | Managing Director | | Managing Director |
The matters discussed in this report may constitute forward-looking statements made pursuant to the safe harbor provisions of the Securities Litigation Reform Act of 1995. These include any advisor or portfolio manager prediction, assessment, analysis or outlook for individual securities, industries, investment styles, market sectors and/or markets. These statements involve risks and uncertainties. In addition to the general risks described for each fund in its current prospectus, other factors bearing on these reports include the accuracy of the advisor’s or portfolio manager’s forecasts and predictions, the appropriateness of the investment strategies designed by the advisor or portfolio manager, and the ability of the advisor or portfolio manager to implement their strategies efficiently and successfully. Any one or more of these factors, as well as other risks affecting the securities markets generally, could cause the actual results of any fund to differ materially as compared to its benchmarks.
Certified Semi-Annual Report 9
SCHEDULE OF INVESTMENTS
| | |
| Thornburg International Value Fund | | March 31, 2010 (Unaudited) |
SUMMARY OF INDUSTRY EXPOSURE
As of 3/31/10
| | | | | | | | |
Banks | | 11.7 | % | | Retailing | | 3.2 | % |
Energy | | 9.4 | % | | Software & Services | | 3.0 | % |
Pharmaceuticals, Biotechnology & Life Sciences | | 9.0 | % | | Household & Personal Products | | 2.8 | % |
Materials | | 7.1 | % | | Media | | 2.7 | % |
Diversified Financials | | 6.9 | % | | Semiconductors & Semiconductor Equipment | | 2.2 | % |
Telecommunication Services | | 6.3 | % | | Consumer Durables & Apparel | | 2.2 | % |
Food, Beverage & Tobacco | | 5.2 | % | | Consumer Services | | 2.0 | % |
Capital Goods | | 5.0 | % | | Transportation | | 1.8 | % |
Health Care Equipment & Services | | 4.9 | % | | Insurance | | 1.5 | % |
Food & Staples Retailing | | 3.9 | % | | Technology Hardware & Equipment | | 0.5 | % |
Automobiles & Components | | 3.6 | % | | Other Assets & Cash Equivalents | | 5.1 | % |
TOP TEN HOLDINGS
As of 3/31/10
| | | | | | | | |
Teva Pharmaceutical Industries Ltd. ADR | | 3.2 | % | | Deutsche Bank AG | | 2.1 | % |
Novo Nordisk A/S | | 2.2 | % | | China Merchants Bank Co. Ltd. | | 2.1 | % |
Mitsubishi UFJ Financial Group, Inc. | | 2.2 | % | | Industrial & Commercial Bank of China Ltd. | | 2.1 | % |
Tesco plc | | 2.2 | % | | Cnooc Ltd. | | 2.1 | % |
LVMH Möet Hennessy Louis Vuitton SA | | 2.2 | % | | Nestlé SA | | 2.0 | % |
SUMMARY OF COUNTRY EXPOSURE
As of 3/31/10 (percent of equity holdings)
| | | | | | | | |
United Kingdom | | 21.2 | % | | Israel | | 3.3 | % |
France | | 8.5 | % | | Australia | | 2.1 | % |
China | | 8.0 | % | | Sweden | | 2.0 | % |
Japan | | 7.5 | % | | Hong Kong | | 1.8 | % |
Switzerland | | 7.4 | % | | South Korea | | 1.5 | % |
Canada | | 7.2 | % | | Spain | | 1.5 | % |
Germany | | 6.7 | % | | Taiwan | | 1.3 | % |
Brazil | | 4.7 | % | | Ireland | | 1.0 | % |
Mexico | | 4.3 | % | | Italy | | 1.0 | % |
Netherlands | | 3.9 | % | | Greece | | 0.8 | % |
Denmark | | 3.5 | % | | Turkey | | 0.8 | % |
10 Certified Semi-Annual Report
| | |
| SCHEDULE OF INVESTMENTS, CONTINUED | | |
| |
| Thornburg International Value Fund | | March 31, 2010 (Unaudited) |
| | | | | |
| | | Shares/
Principal Amount | | Value |
COMMON STOCK — 94.39% | | | | | |
AUTOMOBILES & COMPONENTS — 3.13% | | | | | |
AUTOMOBILES — 3.13% | | | | | |
Hyundai Motor Co. | | 2,821,983 | | $ | 288,071,976 |
Toyota Motor Corp. | | 8,326,500 | | | 333,540,940 |
| | | | | |
| | | | | 621,612,916 |
| | | | | |
BANKS — 11.73% | | | | | |
COMMERCIAL BANKS — 11.73% | | | | | |
BNP Paribas SA | | 4,234,800 | | | 325,224,111 |
China Merchants Bank Co. Ltd. | | 156,250,109 | | | 422,610,335 |
Industrial & Commercial Bank of China Ltd. | | 551,287,100 | | | 421,049,361 |
aIntesa Sanpaolo | | 50,020,646 | | | 186,297,828 |
Mitsubishi UFJ Financial Group, Inc. | | 83,007,600 | | | 435,059,621 |
aNational Bank of Greece S.A. | | 7,108,223 | | | 143,050,799 |
Standard Chartered plc | | 14,640,329 | | | 399,344,917 |
| | | | | |
| | | | | 2,332,636,972 |
| | | | | |
CAPITAL GOODS — 4.98% | | | | | |
AEROSPACE & DEFENSE — 0.65% | | | | | |
Empresa Brasileira de Aeronáutica SA ADR | | 5,421,345 | | | 129,895,426 |
ELECTRICAL EQUIPMENT — 1.11% | | | | | |
aVestas Wind Systems A/S | | 4,065,826 | | | 220,928,714 |
MACHINERY — 3.22% | | | | | |
Fanuc Ltd. | | 2,369,307 | | | 251,401,492 |
Komatsu Ltd. | | 18,526,088 | | | 388,395,898 |
| | | | | |
| | | | | 990,621,530 |
| | | | | |
CONSUMER DURABLES & APPAREL — 2.15% | | | | | |
TEXTILES, APPAREL & LUXURY GOODS — 2.15% | | | | | |
LVMH Moët Hennessy Louis Vuitton SA | | 3,659,311 | | | 427,719,635 |
| | | | | |
| | | | | 427,719,635 |
| | | | | |
CONSUMER SERVICES — 1.95% | | | | | |
HOTELS, RESTAURANTS & LEISURE — 1.95% | | | | | |
Carnival plc | | 9,447,900 | | | 387,820,697 |
| | | | | |
| | | | | 387,820,697 |
| | | | | |
DIVERSIFIED FINANCIALS — 6.93% | | | | | |
CAPITAL MARKETS — 3.04% | | | | | |
Deutsche Bank AG | | 5,518,197 | | | 425,053,452 |
Julius Baer Group Ltd. | | 4,956,430 | | | 179,802,207 |
DIVERSIFIED FINANCIAL SERVICES — 3.89% | | | | | |
BM&F Bovespa SA | | 31,628,800 | | | 214,137,123 |
Hong Kong Exchanges & Clearing Ltd. | | 20,762,800 | | | 346,570,355 |
a ING Groep N.V. | | 21,385,000 | | | 213,508,017 |
| | | | | |
| | | | | 1,379,071,154 |
| | | | | |
ENERGY — 9.45% | | | | | |
ENERGY EQUIPMENT & SERVICES — 1.50% | | | | | |
Schlumberger Ltd. | | 4,712,372 | | | 299,047,127 |
Certified Semi-Annual Report 11
| | |
| SCHEDULE OF INVESTMENTS, CONTINUED | | |
| |
| Thornburg International Value Fund | | March 31, 2010 (Unaudited) |
| | | | | |
| | | Shares/
Principal Amount | | Value |
OIL, GAS & CONSUMABLE FUELS — 7.95% | | | | | |
BP plc | | 41,102,744 | | $ | 388,835,617 |
a Cairn Energy plc | | 17,559,090 | | | 111,113,412 |
Canadian Natural Resources Ltd. | | 4,270,600 | | | 316,074,437 |
Cnooc Ltd. | | 253,040,579 | | | 415,202,625 |
Petróleo Brasileiro S.A. ADR | | 7,832,570 | | | 348,471,039 |
| | | | | |
| | | | | 1,878,744,257 |
| | | | | |
FOOD & STAPLES RETAILING — 3.95% | | | | | |
FOOD & STAPLES RETAILING — 3.95% | | | | | |
Tesco plc | | 65,619,361 | | | 433,609,429 |
Wal-Mart de Mexico SAB de C.V. | | 68,531,100 | | | 351,143,074 |
| | | | | |
| | | | | 784,752,503 |
| | | | | |
FOOD, BEVERAGE & TOBACCO — 5.24% | | | | | |
BEVERAGES — 1.27% | | | | | |
Sabmiller plc | | 8,615,750 | | | 252,597,260 |
FOOD PRODUCTS — 2.01% | | | | | |
Nestlé SA | | 7,807,300 | | | 399,842,754 |
TOBACCO — 1.96% | | | | | |
British American Tobacco plc | | 11,278,625 | | | 388,774,099 |
| | | | | |
| | | | | 1,041,214,113 |
| | | | | |
HEALTH CARE EQUIPMENT & SERVICES — 4.85% | | | | | |
HEALTH CARE EQUIPMENT & SUPPLIES — 1.82% | | | | | |
Covidien plc | | 3,673,998 | | | 184,728,619 |
Smith & Nephew plc | | 17,870,272 | | | 178,030,462 |
HEALTH CARE PROVIDERS & SERVICES — 3.03% | | | | | |
Fresenius Medical Care AG & Co. | | 6,192,900 | | | 349,424,619 |
a Sinopharm Group Co. H | | 56,182,700 | | | 252,539,039 |
| | | | | |
| | | | | 964,722,739 |
| | | | | |
HOUSEHOLD & PERSONAL PRODUCTS — 2.81% | | | | | |
HOUSEHOLD PRODUCTS — 1.89% | | | | | |
Reckitt Benckiser plc | | 6,843,378 | | | 375,618,923 |
PERSONAL PRODUCTS — 0.92% | | | | | |
Natura Cosmeticos SA | | 9,051,600 | | | 183,744,910 |
| | | | | |
| | | | | 559,363,833 |
| | | | | |
INSURANCE — 1.48% | | | | | |
INSURANCE — 1.48% | | | | | |
AXA | | 13,215,350 | | | 293,978,279 |
| | | | | |
| | | | | 293,978,279 |
| | | | | |
MATERIALS — 7.14% | | | | | |
CHEMICALS — 2.71% | | | | | |
Air Liquide SA | | 2,232,413 | | | 267,991,836 |
Potash Corp. of Saskatchewan, Inc. | | 2,270,100 | | | 270,936,435 |
CONSTRUCTION MATERIALS — 1.49% | | | | | |
Lafarge SA | | 4,205,791 | | | 295,956,843 |
12 Certified Semi-Annual Report
| | |
| SCHEDULE OF INVESTMENTS, CONTINUED | | |
| |
| Thornburg International Value Fund | | March 31, 2010 (Unaudited) |
| | | | | |
| | | Shares/
Principal Amount | | Value |
METALS & MINING — 2.94% | | | | | |
BHP Billiton Ltd. | | 9,878,262 | | $ | 395,134,106 |
a Southern Copper Corp. | | 6,022,400 | | | 190,729,408 |
| | | | | |
| | | | | 1,420,748,628 |
| | | | | |
MEDIA — 2.75% | | | | | |
MEDIA — 2.75% | | | | | |
British Sky Broadcasting Group plc | | 26,620,886 | | | 243,190,957 |
Pearson plc | | 13,048,731 | | | 205,142,885 |
Thomson Reuters Corp. | | 2,682,000 | | | 97,599,291 |
| | | | | |
| | | | | 545,933,133 |
| | | | | |
PHARMACEUTICALS, BIOTECHNOLOGY & LIFE SCIENCES — 9.01% | | | | | |
PHARMACEUTICALS — 9.01% | | | | | |
Novartis AG | | 6,570,396 | | | 354,878,653 |
Novo Nordisk A/S | | 5,735,512 | | | 445,059,415 |
Roche Holding AG | | 2,246,000 | | | 364,250,759 |
Teva Pharmaceutical Industries Ltd. ADR | | 9,941,300 | | | 627,097,204 |
| | | | | |
| | | | | 1,791,286,031 |
| | | | | |
RETAILING — 3.17% | | | | | |
SPECIALTY RETAIL — 3.17% | | | | | |
Hennes & Mauritz AB | | 5,906,987 | | | 383,758,635 |
Kingfisher plc | | 75,829,417 | | | 246,712,369 |
| | | | | |
| | | | | 630,471,004 |
| | | | | |
SEMICONDUCTORS & SEMICONDUCTOR EQUIPMENT — 2.16% | | | | | |
SEMICONDUCTORS & SEMICONDUCTOR EQUIPMENT — 2.16% | | | | | |
Arm Holdings plc | | 50,986,100 | | | 184,375,946 |
Taiwan Semiconductor Manufacturing Co., Ltd. | | 126,926,000 | | | 245,794,729 |
| | | | | |
| | | | | 430,170,675 |
| | | | | |
SOFTWARE & SERVICES — 2.96% | | | | | |
INFORMATION TECHNOLOGY SERVICES — 1.00% | | | | | |
a Amdocs Ltd. | | 6,593,900 | | | 198,542,329 |
SOFTWARE — 1.96% | | | | | |
SAP AG | | 8,040,693 | | | 389,445,546 |
| | | | | |
| | | | | 587,987,875 |
| | | | | |
TECHNOLOGY HARDWARE & EQUIPMENT — 0.50% | | | | | |
COMPUTERS & PERIPHERALS — 0.50% | | | | | |
a Logitech International SA | | 6,057,621 | | | 99,677,280 |
| | | | | |
| | | | | 99,677,280 |
| | | | | |
TELECOMMUNICATION SERVICES — 6.25% | | | | | |
DIVERSIFIED TELECOMMUNICATION SERVICES — 2.56% | | | | | |
Koninklijke KPN N.V. | | 13,836,400 | | | 219,211,884 |
Telefónica SA | | 12,229,900 | | | 289,731,337 |
WIRELESS TELECOMMUNICATION SERVICES — 3.69% | | | | | |
América Móvil SAB de C.V. ADR | | 5,173,344 | | | 260,426,137 |
Rogers Communications, Inc. | | 9,424,300 | | | 321,891,367 |
Turkcell | | 25,027,800 | | | 152,533,125 |
| | | | | |
| | | | | 1,243,793,850 |
| | | | | |
Certified Semi-Annual Report 13
| | |
| SCHEDULE OF INVESTMENTS, CONTINUED | | |
| |
| Thornburg International Value Fund | | March 31, 2010 (Unaudited) |
| | | | | | |
| | | Shares/
Principal Amount | | Value |
TRANSPORTATION — 1.80% | | | | | | |
ROAD & RAIL — 1.80% | | | | | | |
Canadian National Railway Co. | | | 5,889,800 | | $ | 357,453,130 |
| | | | | | |
| | | | | | 357,453,130 |
| | | | | | |
TOTAL COMMON STOCK (Cost $16,178,146,882) | | | | | | 18,769,780,234 |
| | | | | | |
PREFERRED STOCK — 0.48% | | | | | | |
AUTOMOBILES & COMPONENTS — 0.48% | | | | | | |
AUTOMOBILES — 0.48% | | | | | | |
a Volkswagen AG Pfd | | | 1,046,232 | | | 95,991,458 |
| | | | | | |
TOTAL PREFERRED STOCK (Cost $91,239,000) | | | | | | 95,991,458 |
| | | | | | |
SHORT TERM INVESTMENTS — 4.90% | | | | | | |
AGL Capital Corp., 0.20%, 4/1/2010 | | $ | 3,000,000 | | | 3,000,000 |
California State Department of Water Resources, put 4/8/2010 (Insured: AGM/SPA: Dexia) (weekly demand notes), 0.32%, 5/1/2022 | | | 33,150,000 | | | 33,150,000 |
California State, put 4/8/2010 (LOC: Bank of America) (weekly demand notes), 0.27%, 5/1/2040 | | | 2,500,000 | | | 2,500,000 |
Chicago GO, put 4/8/2010 (Insured: AGM/SPA: Dexia) (weekly demand notes), 0.32%, 1/1/2040 | | | 71,440,000 | | | 71,440,000 |
Devon Energy Corp., 0.15%, 4/1/2010 | | | 40,000,000 | | | 40,000,000 |
Farmington PCR, put 4/1/2010 (LOC: Barclays Bank) (daily demand notes), 0.30%, 5/1/2024 | | | 8,100,000 | | | 8,100,000 |
JPMorgan Chase & Co., 0.01%, 4/1/2010 | | | 712,500,000 | | | 712,500,000 |
Mississippi State, put 4/8/2010 (Nissan; Insured: Bank of America) (weekly demand notes), 0.23%, 11/1/2028 | | | 29,800,000 | | | 29,800,000 |
New York City GO, put 4/1/2010 (Insured: AGM/SPA: Dexia) (daily demand notes), 0.29%, 11/1/2026 | | | 11,200,000 | | | 11,200,000 |
New York City Municipal Water Finance Authority, put 4/1/2010 (SPA: Dexia) (daily demand notes), 0.31%, 6/15/2033 | | | 7,000,000 | | | 7,000,000 |
New York City Municipal Water Finance, put 4/1/2010 (SPA: Landesbank Hessen- Thuringen) (daily demand notes), 0.29%, 6/15/2039 | | | 10,000,000 | | | 10,000,000 |
New York, NY, put 4/1/2010 (SPA: Dexia) (daily demand notes), 0.35%, 8/1/2028 | | | 9,300,000 | | | 9,300,000 |
Pepco Holdings, Inc., 0.30%, 4/1/2010 | | | 28,000,000 | | | 28,000,000 |
South Fulton Georgia Municipal Water & Sewer Authority, put 4/8/2010 (LOC: Bank of America) (weekly demand notes), 0.32%, 1/1/2033 | | | 7,455,000 | | | 7,455,000 |
| | | | | | |
TOTAL SHORT TERM INVESTMENTS (Cost $973,445,000) | | | | | | 973,445,000 |
| | | | | | |
TOTAL INVESTMENTS — 99.77% (Cost $17,242,830,882) | | | | | $ | 19,839,216,692 |
OTHER ASSETS LESS LIABILITIES — 0.23% | | | | | | 45,255,218 |
| | | | | | |
NET ASSETS — 100.00% | | | | | $ | 19,884,471,910 |
| | | | | | |
Footnote Legend
14 Certified Semi-Annual Report
| | |
| SCHEDULE OF INVESTMENTS, CONTINUED | | |
| |
| Thornburg International Value Fund | | March 31, 2010 (Unaudited) |
Portfolio Abbreviations
To simplify the listings of securities, abbreviations are used per the table below:
| | |
| ADR | | American Depository Receipt |
| AGM | | Insured by Assured Guaranty Municipal Corp. |
| ARM | | Adjustable Rate Mortgage |
| GO | | General Obligation |
| LOC | | Letter of Credit |
| Pfd | | Preferred Stock |
| PCR | | Pollution Control Revenue Bond |
| SPA | | Stand-by Purchase Agreement |
See notes to financial statements.
Certified Semi-Annual Report 15
| | |
| STATEMENT OF ASSETS AND LIABILITIES | | |
| |
| Thornburg International Value Fund | | March 31, 2010 (Unaudited) |
| | | | |
ASSETS | | | | |
Investments at value (cost $17,242,830,882) (Note 2) | | $ | 19,839,216,692 | |
Cash | | | 4,275,744 | |
Cash denominated in foreign currency (cost $5,898,812) | | | 5,967,427 | |
Receivable for investments sold | | | 25,805,560 | |
Receivable for fund shares sold | | | 81,900,817 | |
Unrealized appreciation on forward currency contracts (Note 7) | | | 26,544,164 | |
Dividends receivable | | | 50,815,651 | |
Dividend and interest reclaim receivable | | | 12,272,894 | |
Interest receivable | | | 37,170 | |
Prepaid expenses and other assets | | | 429,291 | |
| | | | |
Total Assets | | | 20,047,265,410 | |
| | | | |
| |
LIABILITIES | | | | |
Payable for securities purchased | | | 79,338,622 | |
Payable for fund shares redeemed | | | 27,381,692 | |
Unrealized depreciation on forward currency contracts (Note 7) | | | 35,965,570 | |
Payable to investment advisor and other affiliates (Note 3) | | | 15,780,724 | |
Accounts payable and accrued expenses | | | 4,307,315 | |
Dividends payable | | | 19,577 | |
| | | | |
Total Liabilities | | | 162,793,500 | |
| | | | |
| |
NET ASSETS | | $ | 19,884,471,910 | |
| | | | |
NET ASSETS CONSIST OF: | | | | |
Undistributed net investment income | | $ | 5,731,644 | |
Net unrealized appreciation on investments | | | 2,587,900,886 | |
Accumulated net realized gain (loss) | | | (3,248,800,446 | ) |
Net capital paid in on shares of beneficial interest | | | 20,539,639,826 | |
| | | | |
| | $ | 19,884,471,910 | |
| | | | |
16 Certified Semi-Annual Report
| | |
| STATEMENT OF ASSETS AND LIABILITIES, CONTINUED | | |
| |
| Thornburg International Value Fund | | March 31, 2010 (Unaudited) |
| | | |
NET ASSET VALUE: | | | |
Class A Shares: | | | |
Net asset value and redemption price per share ($6,036,442,354 applicable to 238,965,721 shares of beneficial interest outstanding - Note 4) | | $ | 25.26 |
Maximum sales charge, 4.50% of offering price | | | 1.19 |
| | | |
Maximum offering price per share | | $ | 26.45 |
| | | |
| |
Class B Shares: | | | |
Net asset value and offering price per share * ($79,564,009 applicable to 3,350,432 shares of beneficial interest outstanding - Note 4) | | $ | 23.75 |
| | | |
| |
Class C Shares: | | | |
Net asset value and offering price per share * ($1,660,258,934 applicable to 69,617,279 shares of beneficial interest outstanding - - Note 4) | | $ | 23.85 |
| | | |
| |
Class I Shares: | | | |
Net asset value, offering and redemption price per share ($8,221,585,866 applicable to 318,616,266 shares of beneficial interest outstanding - Note 4) | | $ | 25.80 |
| | | |
| |
Class R3 Shares: | | | |
Net asset value, offering and redemption price per share ($1,206,232,629 applicable to 47,683,805 shares of beneficial interest outstanding - Note 4) | | $ | 25.30 |
| | | |
| |
Class R4 Shares: | | | |
Net asset value, offering and redemption price per share ($709,703,891 applicable to 28,208,320 shares of beneficial interest outstanding - Note 4) | | $ | 25.16 |
| | | |
| |
Class R5 Shares: | | | |
Net asset value, offering and redemption price per share ($1,970,684,227 applicable to 76,493,729 shares of beneficial interest outstanding - Note 4) | | $ | 25.76 |
| | | |
| * | Redemption price per share is equal to net asset value less any applicable contingent deferred sales charge. |
See notes to financial statements.
Certified Semi-Annual Report 17
| | |
| STATEMENT OF OPERATIONS | | |
| |
| Thornburg International Value Fund | | Six Months Ended March 31, 2010 (Unaudited) |
| | | | |
INVESTMENT INCOME: | | | | |
Dividend income (net of foreign taxes withheld of $10,303,996) | | $ | 121,848,815 | |
Interest income | | | 737,574 | |
| | | | |
Total Income | | | 122,586,389 | |
| | | | |
| |
EXPENSES: | | | | |
Investment advisory fees (Note 3) | | | 61,891,925 | |
Administration fees (Note 3) | | | | |
Class A Shares | | | 3,519,747 | |
Class B Shares | | | 50,026 | |
Class C Shares | | | 1,000,975 | |
Class I Shares | | | 1,812,763 | |
Class R3 Shares | | | 700,737 | |
Class R4 Shares | | | 386,263 | |
Class R5 Shares | | | 416,386 | |
Distribution and service fees (Note 3) | | | | |
Class A Shares | | | 6,989,968 | |
Class B Shares | | | 399,767 | |
Class C Shares | | | 8,030,976 | |
Class R3 Shares | | | 2,804,231 | |
Class R4 Shares | | | 774,314 | |
Transfer agent fees | | | | |
Class A Shares | | | 4,581,400 | |
Class B Shares | | | 78,341 | |
Class C Shares | | | 1,189,290 | |
Class I Shares | | | 2,890,040 | |
Class R3 Shares | | | 1,025,716 | |
Class R4 Shares | | | 691,560 | |
Class R5 Shares | | | 1,424,013 | |
Registration and filing fees | | | | |
Class A Shares | | | 102,495 | |
Class B Shares | | | 8,152 | |
Class C Shares | | | 35,095 | |
Class I Shares | | | 351,889 | |
Class R3 Shares | | | 12,868 | |
Class R4 Shares | | | 12,467 | |
Class R5 Shares | | | 22,938 | |
Custodian fees (Note 3) | | | 2,968,415 | |
Professional fees | | | 178,775 | |
Accounting fees | | | 339,100 | |
Trustee fees | | | 231,120 | |
Other expenses | | | 1,158,556 | |
| | | | |
Total Expenses | | | 106,080,308 | |
Less: | | | | |
Expenses reimbursed by investment advisor (Note 3) | | | (879,411 | ) |
| | | �� | |
Net Expenses | | | 105,200,897 | |
| | | | |
Net Investment Income | | $ | 17,385,492 | |
| | | | |
18 Certified Semi-Annual Report
| | |
| STATEMENT OF OPERATIONS, CONTINUED | | |
| |
| Thornburg International Value Fund | | Six Months Ended March 31, 2010 (Unaudited) |
| | | | |
REALIZED AND UNREALIZED GAIN (LOSS) | | | | |
Net realized gain (loss) from: | | | | |
Investments | | $ | (409,779,547 | ) |
Forward currency contracts (Note 7) | | | (23,296,560 | ) |
Foreign currency transactions | | | (2,908,627 | ) |
| | | | |
| | | (435,984,734 | ) |
| | | | |
Net change in unrealized appreciation (depreciation) on: | | | | |
Investments | | | 1,434,305,879 | |
Forward currency contracts (Note 7) | | | (12,151,807 | ) |
Foreign currency translations | | | 285,230 | |
| | | | |
| | | 1,422,439,302 | |
| | | | |
Net Realized and Unrealized Gain | | | 986,454,568 | |
| | | | |
Net Increase in Net Assets Resulting From Operations | | $ | 1,003,840,060 | |
| | | | |
See notes to financial statements.
Certified Semi-Annual Report 19
STATEMENTS OF CHANGES IN NET ASSETS
Thornburg International Value Fund
| | | | | | | | |
| | | Six Months Ended
March 31, 2010* | | | Year Ended
September 30, 2009 | |
INCREASE (DECREASE) IN NET ASSETS FROM: | | | | | | | | |
| | |
OPERATIONS: | | | | | | | | |
Net investment income | | $ | 17,385,492 | | | $ | 145,886,647 | |
Net realized gain (loss) on investments, forward currency contracts, and foreign currency transactions | | | (435,984,734 | ) | | | (1,987,449,808 | ) |
Increase (decrease) in unrealized appreciation (depreciation) of investments, forward currency contracts, and foreign currency translations | | | 1,422,439,302 | | | | 2,209,400,435 | |
| | | | | | | | |
| | |
Net Increase (Decrease) in Net Assets Resulting from Operations | | | 1,003,840,060 | | | | 367,837,274 | |
| | |
DIVIDENDS TO SHAREHOLDERS: | | | | | | | | |
From net investment income | | | | | | | | |
Class A Shares | | | (1,188,776 | ) | | | (47,691,328 | ) |
Class B Shares | | | — | | | | (281,872 | ) |
Class C Shares | | | — | | | | (6,234,690 | ) |
Class I Shares | | | (16,764,119 | ) | | | (72,241,951 | ) |
Class R3 Shares | | | — | | | | (8,457,824 | ) |
Class R4 Shares | | | (367,865 | ) | | | (4,136,350 | ) |
Class R5 Shares | | | (3,362,471 | ) | | | (14,813,551 | ) |
| | |
FUND SHARE TRANSACTIONS (NOTE 4): | | | | | | | | |
Class A Shares | | | 415,988,289 | | | | (151,656,229 | ) |
Class B Shares | | | (5,443,269 | ) | | | (14,340,619 | ) |
Class C Shares | | | 26,409,414 | | | | (234,811,763 | ) |
Class I Shares | | | 1,491,940,803 | | | | 990,522,432 | |
Class R3 Shares | | | 102,871,991 | | | | 113,114,566 | |
Class R4 Shares | | | 152,492,940 | | | | 249,654,449 | |
Class R5 Shares | | | 466,954,108 | | | | 392,644,180 | |
| | | | | | | | |
Net Increase in Net Assets | | | 3,633,371,105 | | | | 1,559,106,724 | |
| | |
NET ASSETS: | | | | | | | | |
Beginning of Period | | | 16,251,100,805 | | | | 14,691,994,081 | |
| | | | | | | | |
| | |
End of Period | | $ | 19,884,471,910 | | | $ | 16,251,100,805 | |
| | | | | | | | |
| | |
Undistributed net investment income | | $ | 5,731,644 | | | $ | 10,029,383 | |
See notes to financial statements.
20 Certified Semi-Annual Report
| | |
| NOTES TO FINANCIAL STATEMENTS | | |
| |
Thornburg International Value Fund | | March 31, 2010 (Unaudited) |
NOTE 1 – ORGANIZATION
Thornburg International Value Fund, hereinafter referred to as the “Fund,” is a diversified series of Thornburg Investment Trust (the “Trust”). The Trust was organized as a Massachusetts business trust under a Declaration of Trust dated June 3, 1987 and is registered as a diversified, open-end management investment company under the Investment Company Act of 1940, as amended. The Fund is currently one of sixteen separate series of the Trust. Each series is considered to be a separate entity for financial reporting and tax purposes and bears expenses directly attributable to it. The Fund seeks long-term capital appreciation by investing in equity and debt securities of all types. As a secondary objective, the Fund also seeks some current income.
The Fund currently offers seven classes of shares of beneficial interest: Class A, Class B, Class C, Institutional Class (Class I), and Retirement Classes (Class R3, Class R4, and Class R5) shares. Each class of shares of the Fund represents an interest in the same portfolio of investments, except that (i) Class A shares are sold subject to a front-end sales charge collected at the time the shares are purchased and bear a service fee, (ii) Class B shares are sold at net asset value without a sales charge at the time of purchase, but are subject to a contingent deferred sales charge upon redemption and bear both a service fee and distribution fee, (iii) Class C shares are sold at net asset value without a sales charge at the time of purchase, but are subject to a contingent deferred sales charge upon redemption within one year of purchase, and bear both a service fee and a distribution fee, (iv) Class I shares are sold at net asset value without a sales charge at the time of purchase, (v) Class R3 shares are sold at net asset value without a sales charge at the time of purchase, but bear both a service fee and distribution fee, (vi) Class R4 shares are sold at net asset value without a sales charge at the time of purchase, but bear a service fee, (vii) Class R5 shares are sold at net asset value without a sales charge at the time of purchase, and (viii) the respective classes may have different reinvestment privileges and conversion rights. Additionally, the Fund may allocate among its classes certain expenses, to the extent allowable to specific classes, including transfer agent fees, government registration fees, certain printing and postage costs, and administrative and legal expenses. Currently, class specific expenses of the Fund are limited to service and distribution fees, administration fees, and certain registration and transfer agent expenses. Class B shares of the Fund outstanding for eight years will convert to Class A shares of the Fund.
NOTE 2 – SIGNIFICANT ACCOUNTING POLICIES
Significant accounting policies of the Trust are as follows:
Valuation of Investments: Portfolio securities listed or traded on a national securities exchange are valued on the valuation date at the last reported sale price on the exchange that is the primary market for the security. Portfolio securities traded on an exchange for which there has been no sale that day and other equity securities traded in the over-the-counter market are valued at the mean between the last reported bid and asked prices. Portfolio securities reported by NASDAQ are valued at the NASDAQ official closing price. Any foreign security traded on exchanges outside the United States is valued at the price of the security on the exchange that is normally the security’s primary market, as of the close of that exchange preceding the time of the Fund’s valuation.
Debt obligations held by the Fund have a primary market over the counter and are valued by an independent pricing service approved by the Trustees of the Trust. The pricing service ordinarily values debt obligations at quoted bid prices. When quotations are not available, debt obligations held by the Fund are valued at evaluated prices determined by the pricing service using methods which include consideration of yields or prices of debt obligations of comparable quality, type of issue, coupon, maturity and rating, and indications as to value from dealers and general market conditions. Short-term obligations having remaining maturities of 60 days or less are valued at amortized cost, which approximates market value.
Quotations in foreign currencies for foreign portfolio investments are converted to U.S. dollar equivalents using the foreign exchange quotation in effect at the time of valuation.
In any case where the market value of an equity security held by the Fund is not readily available, the Trust’s valuation and pricing committee determines a fair value for the security using procedures approved by the Trustees, which may include the use of a price obtained from an independent pricing service. The pricing service ordinarily values equity securities in these instances using multi-factor models to adjust market prices based upon various inputs, including exchange data, depository receipt prices, futures and index data and other data. A security’s market value is deemed not readily available whenever the exchange or market on which the security is primarily traded is closed for the entire scheduled day of trading. Additionally, a security’s market value may be deemed not readily available under other circumstances identified by the Trustees, including when developments occurring after the most recent close of the security’s primary exchange or market, but before the most recent close of trading in Fund shares, create a serious question about the reliability of the security’s market value.
Certified Semi-Annual Report 21
| | |
| NOTES TO FINANCIAL STATEMENTS, CONTINUED | | |
| |
| Thornburg International Value Fund | | March 31, 2010 (Unaudited) |
In any case where a pricing service fails to provide a price for a debt obligation held by the Fund, the valuation and pricing committee determines a fair value for the debt obligation using procedures approved by the Trustees. Additionally, in any case where management believes that a price provided by a pricing service for a debt obligation held by the Fund may be unreliable, the valuation and pricing committee decides whether or not to use the pricing service’s valuation or to determine a fair value for the debt obligation.
In determining fair value for any portfolio security or other investment, the valuation and pricing committee seeks to determine the amount that an owner of the investment might reasonably expect to receive upon a sale of the investment. However, because fair value prices are estimated prices, the valuation and pricing committee’s determination of fair value for an investment may differ from the value that would be realized by the Fund upon a sale of the investment, and that difference could be material to the Fund’s financial statements. The valuation and pricing committee’s determination of fair value for an investment may also differ from the prices obtained by other persons (including other mutual funds) for the investment.
Valuation Measurements: Various inputs are used in determining the value of the Fund’s investments. These inputs are summarized in the three levels listed below.
Level 1: Quoted prices in active markets for identical investments.
Level 2: Other significant observable inputs (including quoted prices for similar investments, interest rates, prepayment rates, credit risk, etc.).
Level 3: Significant unobservable inputs (including the Fund’s own assumptions in determining the fair value of investments).
The following table displays a summary of the inputs used to value the Fund’s net assets as of March 31, 2010. In any instance when valuation inputs from more than one level are used to determine the fair value of a specific investment, the investment is placed in the level of the table based upon the lowest level input that is significant in determining the fair value of the investment:
| | | | | | | | | | | | | | | |
| | | Fair Value Measurements at March 31, 2010 |
| | | Total | | | Level 1 | | | Level 2 | | | Level 3 |
Assets | | | | | | | | | | | | | | | |
Investments in Securities* | | | | | | | | | | | | | | | |
Common Stock | | $ | 18,769,780,234 | | | $ | 18,769,780,234 | | | $ | — | | | $ | — |
Preferred Stock | | | 95,991,458 | | | | 95,991,458 | | | | — | | | | — |
Short Term Investments | | | 973,445,000 | | | | — | | | | 973,445,000 | | | | — |
| | | | | | | | | | | | | | | |
Total Investments in Securities | | $ | 19,839,216,692 | | | $ | 18,865,771,692 | | | $ | 973,445,000 | | | $ | — |
Other Financial Instruments** | | | | | | | | | | | | | | | |
Forward Currency Contracts | | $ | 26,544,164 | | | $ | — | | | $ | 26,544,164 | | | $ | — |
Spot Currency | | $ | 89,960 | | | $ | 89,960 | | | $ | — | | | $ | — |
Liabilities | | | | | | | | | | | | | | | |
Other Financial Instruments** | | | | | | | | | | | | | | | |
Forward Currency Contracts | | $ | (35,965,570 | ) | | $ | — | | | $ | (35,965,570 | ) | | $ | — |
Spot Currency | | $ | (190,358 | ) | | $ | (190,358 | ) | | $ | — | | | $ | — |
| * | See Schedule of Investments for a summary of the industry exposure as grouped according to the Global Industry Classification Standard (GICS), which is an industry taxonomy developed by Morgan Stanley Capital International (MSCI), and Standard & Poor’s (S&P). |
| ** | Other Financial Instruments include investments not reflected in the Schedule of Investments, such as futures, forwards and swap contracts, which are valued at the unrealized appreciation (depreciation) on the instrument. |
22 Certified Semi-Annual Report
| | |
| NOTES TO FINANCIAL STATEMENTS, CONTINUED | | |
| |
| Thornburg International Value Fund | | March 31, 2010 (Unaudited) |
Foreign Currency Translation: Portfolio securities and other assets and liabilities denominated in foreign currencies are translated into U.S. dollars based on the exchange rate of such currencies against the U.S. dollar on the date of valuation. Purchases and sales of securities and income items denominated in foreign currencies are translated into U.S. dollars at the exchange rate in effect on the translation date. When the Fund purchases or sells foreign securities it will customarily enter into a foreign exchange contract to minimize foreign exchange risk from the trade date to the settlement date of such transactions.
The Fund does not separately report the effect of changes in foreign exchange rates from changes in market prices on securities held. Such changes are included in net realized and unrealized gain or loss from investments.
Reported net realized foreign exchange gains or losses arise from sales of foreign currencies, currency gains or losses realized between the trade and settlement dates on securities transactions and the difference between the amounts of dividends, interest, and foreign withholding taxes recorded on the Fund’s books, and the U.S. dollar equivalent of the amounts actually received or paid.
Net unrealized foreign exchange gains and losses arise from changes in the fair value of assets and liabilities, other than investments in securities at fiscal period end, resulting from changes in exchange rates.
Deferred Taxes: The Fund is subject to a tax imposed on net realized gains of securities of certain foreign issuers. The Fund records an estimated deferred tax liability for net unrealized gains on these securities as reflected in the accompanying financial statements.
Federal Income Taxes: It is the policy of the Trust to comply with the provisions of the Internal Revenue Code applicable to “regulated investment companies” and to distribute to shareholders substantially all taxable income, including any net realized gain on investments of the Fund. Therefore, no provision for federal income taxes is required.
When-Issued and Delayed Delivery Transactions: The Fund may engage in when-issued or delayed delivery transactions. To the extent the Fund engages in such transactions, it will do so for the purpose of acquiring portfolio securities consistent with the Fund’s investment objectives and not for the purpose of investment leverage or to speculate on interest rate and/or market changes. At the time the Fund makes a commitment to purchase a security on a when-issued or delayed delivery basis, the Fund will record the transaction and reflect the value in determining its net asset value. When effecting such transactions, assets of an amount sufficient to make payment for the portfolio securities to be purchased will be segregated on the Fund’s records on the trade date. Securities purchased on a when-issued or delayed delivery basis do not earn interest until the settlement date.
Dividends: Dividends to shareholders are generally paid quarterly and are reinvested in additional shares of the Fund at net asset value per share at the close of business on the dividend payment date or, at the shareholder’s option, paid in cash. Net realized capital gains, to the extent available, will be distributed at least annually. Distributions to shareholders are based on income tax regulations and therefore, their characteristics may differ for financial statement and tax purposes.
General: Securities transactions are accounted for on a trade date basis. Interest income is accrued as earned and dividend income is recorded on the ex-dividend date. Certain income from foreign securities is recognized as soon as information is available to the Fund. Realized gains and losses from the sale of securities are recorded on an identified cost basis. Net investment income (other than class specific expenses) and realized and unrealized gains and losses are allocated daily to each class of shares based upon the relative net asset value of outstanding shares of each class of shares at the beginning of the day (after adjusting for the current share activity of the respective class). Expenses common to all funds are allocated among the funds comprising the Trust based upon their relative net asset values or other appropriate allocation methods.
Guarantees and Indemnifications: Under the Trust’s organizational documents, its officers and Trustees are indemnified against certain liabilities arising out of the performance of their duties to the Fund. Additionally, in the normal course of business the Trust enters into contracts with service providers that contain general indemnification clauses. The Trust’s maximum exposure under these arrangements is unknown. However, based on experience, the Trust expects the risk of loss to be remote.
Use of Estimates: The preparation of financial statements, in conformity with generally accepted accounting principles, requires management to make estimates and assumptions that affect the reported amounts of assets and liabilities and the disclosure of contingent assets and liabilities at the date of the financial statements and the reported amounts of increases and decreases in net assets from operations during the reporting period. Actual results could differ from those estimates.
Certified Semi-Annual Report 23
| | |
| NOTES TO FINANCIAL STATEMENTS, CONTINUED | | |
| |
| Thornburg International Value Fund | | March 31, 2010 (Unaudited) |
NOTE 3 – INVESTMENT ADVISORY FEE AND OTHER TRANSACTIONS WITH AFFILIATES
Pursuant to an investment advisory agreement, Thornburg Investment Management, Inc. (the “Advisor”) serves as the investment advisor and performs services to the Fund for which the fees are payable at the end of each month. For the six months ended March 31, 2010, these fees were payable at annual rates ranging from .875 of 1% to .675 of 1% per annum of the average daily net assets of the Fund depending on the Fund’s asset size. The Trust also has entered into administrative services agreements with the Advisor, whereby the Advisor will perform certain administrative services for the shareholders of each class of the Fund’s shares, and for which fees will be payable at an annual rate of up to .125 of 1% per annum of the average daily net assets attributable to each class of shares. For the six months ended March 31, 2010, the Advisor voluntarily or contractually agreed to reimburse certain class specific expenses, administrative fees, and distribution fees of $580,934 for Class R3 shares, and $298,477 for Class R4 shares.
The Trust has an underwriting agreement with Thornburg Securities Corporation (the “Distributor,” an affiliate of the Advisor), which acts as the distributor of the Fund’s shares. For the six months ended March 31, 2010, the Distributor has advised the Fund that it earned net commissions aggregating $212,946 from the sale of Class A shares, and collected contingent deferred sales charges aggregating $59,828 from redemptions of Class C shares of the Fund.
Pursuant to a service plan under Rule 12b-1 of the Investment Company Act of 1940, the Fund may reimburse to the Advisor an amount not to exceed .25 of 1% per annum of the average daily net assets attributable to each class of shares of the Fund for payments made by the Advisor to securities dealers and other financial institutions to obtain various shareholder and distribution related services. The Advisor may pay out of its own resources additional expenses for distribution of the Fund’s shares.
The Trust has also adopted distribution plans pursuant to Rule 12b-1, applicable only to the Fund’s Class B, Class C, and Class R3 shares, under which the Fund compensates the Distributor for services in promoting the sale of Class B, Class C, and Class R3 shares of the Fund at an annual rate of up to .75 of 1% per annum of the average daily net assets attributable to Class B, Class C, and Class R3 shares. Total fees incurred by the Distributor for each class of shares of the Fund under their respective Service and Distribution Plans for the six months ended March 31, 2010, are set forth in the Statement of Operations.
The Trust has an agreement with the custodian bank to indirectly pay a portion of the custodian’s fees through credits earned by the Fund’s cash on deposit with the bank. This deposit agreement is an alternative to overnight investments. Custodial fees have been adjusted to reflect amounts that would have been paid without this agreement, with a corresponding adjustment reflected as fees paid indirectly in the Statement of Operations. For the six months ended March 31, 2010, there were no fees paid indirectly.
Certain officers and Trustees of the Trust are also officers and/or directors of the Advisor and Distributor. The compensation of independent Trustees is borne by the Trust.
NOTE 4 – SHARES OF BENEFICIAL INTEREST
At March 31, 2010, there were an unlimited number of shares of beneficial interest authorized. Transactions in shares of beneficial interest were as follows:
| | | | | | | | | | | | | | |
| | | Six Months Ended
March 31, 2010 (Unaudited) | | | Year Ended
September 30, 2009 (Audited) | |
| | | Shares | | | Amount | | | Shares | | | Amount | |
Class A Shares | | | | | | | | | | | | | | |
Shares sold | | 45,018,734 | | | $ | 1,105,159,217 | | | 94,350,075 | | | $ | 1,855,765,245 | |
Shares issued to shareholders in reinvestment of dividends | | 39,093 | | | | 980,445 | | | 1,910,696 | | | | 39,880,680 | |
Shares repurchased | | (28,188,201 | ) | | | (690,176,749 | ) | | (106,827,831 | ) | | | (2,047,398,938 | ) |
Redemption fees received* | | — | | | | 25,376 | | | — | | | | 96,784 | |
| | | | | | | | | | | | | | |
| | | | |
Net Increase (Decrease) | | 16,869,626 | | | $ | 415,988,289 | | | (10,567,060 | ) | | $ | (151,656,229 | ) |
| | | | | | | | | | | | | | |
24 Certified Semi-Annual Report
| | |
| NOTES TO FINANCIAL STATEMENTS, CONTINUED | | |
| |
| Thornburg International Value Fund | | March 31, 2010 (Unaudited) |
| | | | | | | | | | | | | | |
| | | Six Months Ended
March 31, 2010 (Unaudited) | | | Year Ended
September 30, 2009 (Audited) | |
| | | Shares | | | Amount | | | Shares | | | Amount | |
Class B Shares | | | | | | | | | | | | | | |
Shares sold | | 39,887 | | | $ | 928,840 | | | 307,132 | | | $ | 5,564,270 | |
Shares issued to shareholders in reinvestment of dividends | | — | | | | — | | | 9,713 | | | | 190,063 | |
Shares repurchased | | (275,733 | ) | | | (6,372,471 | ) | | (1,134,846 | ) | | | (20,096,620 | ) |
Redemption fees received* | | — | | | | 362 | | | — | | | | 1,668 | |
| | | | | | | | | | | | | | |
| | | | |
Net Increase (Decrease) | | (235,846 | ) | | $ | (5,443,269 | ) | | (818,001 | ) | | $ | (14,340,619 | ) |
| | | | | | | | | | | | | | |
| | | | |
Class C Shares | | | | | | | | | | | | | | |
Shares sold | | 7,535,224 | | | $ | 175,005,947 | | | 13,413,646 | | | $ | 251,623,816 | |
Shares issued to shareholders in reinvestment of dividends | | (5 | ) | | | (122 | ) | | 204,651 | | | | 4,041,962 | |
Shares repurchased | | (6,416,728 | ) | | | (148,603,637 | ) | | (27,577,857 | ) | | | (490,508,597 | ) |
Redemption fees received* | | — | | | | 7,226 | | | — | | | | 31,056 | |
| | | | | | | | | | | | | | |
Net Increase (Decrease) | | 1,118,491 | | | $ | 26,409,414 | | | (13,959,560 | ) | | $ | (234,811,763 | ) |
| | | | | | | | | | | | | | |
| | | | |
Class I Shares | | | | | | | | | | | | | | |
Shares sold | | 85,515,499 | | | $ | 2,146,563,549 | | | 135,891,137 | | | $ | 2,743,024,095 | |
Shares issued to shareholders in reinvestment of dividends | | 399,780 | | | | 10,242,357 | | | 2,218,946 | | | | 47,387,069 | |
Shares repurchased | | (26,541,041 | ) | | | (664,897,698 | ) | | (91,998,012 | ) | | | (1,799,987,899 | ) |
Redemption fees received* | | — | | | | 32,595 | | | — | | | | 99,167 | |
| | | | | | | | | | | | | | |
| | | | |
Net Increase (Decrease) | | 59,374,238 | | | $ | 1,491,940,803 | | | 46,112,071 | | | $ | 990,522,432 | |
| | | | | | | | | | | | | | |
| | | | |
Class R3 Shares | | | | | | | | | | | | | | |
Shares sold | | 10,964,475 | | | $ | 269,683,090 | | | 20,079,362 | | | $ | 393,943,531 | |
Shares issued to shareholders in reinvestment of dividends | | — | | | | — | | | 355,098 | | | | 7,415,099 | |
Shares repurchased | | (6,788,387 | ) | | | (166,816,152 | ) | | (14,936,306 | ) | | | (288,262,022 | ) |
Redemption fees received* | | — | | | | 5,053 | | | — | | | | 17,958 | |
| | | | | | | | | | | | | | |
Net Increase (Decrease) | | 4,176,088 | | | $ | 102,871,991 | | | 5,498,154 | | | $ | 113,114,566 | |
| | | | | | | | | | | | | | |
| | | | |
Class R4 Shares | | | | | | | | | | | | | | |
Shares sold | | 10,887,032 | | | $ | 265,562,969 | | | 17,358,823 | | | $ | 351,220,800 | |
Shares issued to shareholders in reinvestment of dividends | | 10,910 | | | | 272,536 | | | 137,569 | | | | 2,904,177 | |
Shares repurchased | | (4,623,118 | ) | | | (113,345,336 | ) | | (5,390,436 | ) | | | (104,476,483 | ) |
Redemption fees received* | | — | | | | 2,771 | | | — | | | | 5,955 | |
| | | | | | | | | | | | | | |
| | | | |
Net Increase (Decrease) | | 6,274,824 | | | $ | 152,492,940 | | | 12,105,956 | | | $ | 249,654,449 | |
| | | | | | | | | | | | | | |
| | | | |
Class R5 Shares | | | | | | | | | | | | | | |
Shares sold | | 24,774,976 | | | $ | 624,061,421 | | | 32,451,475 | | | $ | 662,220,472 | |
Shares issued to shareholders in reinvestment of dividends | | 122,257 | | | | 3,127,346 | | | 642,611 | | | | 13,721,112 | |
Shares repurchased | | (6,403,921 | ) | | | (160,242,074 | ) | | (14,216,177 | ) | | | (283,317,991 | ) |
Redemption fees received* | | — | | | | 7,415 | | | — | | | | 20,587 | |
| | | | | | | | | | | | | | |
| | | | |
Net Increase (Decrease) | | 18,493,312 | | | $ | 466,954,108 | | | 18,877,909 | | | $ | 392,644,180 | |
| | | | | | | | | | | | | | |
Certified Semi-Annual Report 25
| | |
| NOTES TO FINANCIAL STATEMENTS, CONTINUED | | |
| |
| Thornburg International Value Fund | | March 31, 2010 (Unaudited) |
| * | The Fund charges a redemption fee of 1% of the Class A and Class I shares redeemed or exchanged within 30 days of purchase. Redemption fees charged to any class are allocated to all classes upon receipt of payment based on relative net asset values of each class or other appropriate allocation methods. |
NOTE 5 – SECURITIES TRANSACTIONS
For the six months ended March 31, 2010, the Fund had purchase and sale transactions of investment securities (excluding short-term investments) of $4,314,462,886 and $2,143,275,413, respectively.
NOTE 6 – INCOME TAXES
At March 31, 2010, information on the tax components of capital is as follows:
| | | | |
Cost of investments for tax purposes | | $ | 17,242,830,882 | |
| | | | |
Gross unrealized appreciation on a tax basis | | $ | 3,466,219,646 | |
Gross unrealized depreciation on a tax basis | | | (869,833,836 | ) |
| | | | |
Net unrealized appreciation (depreciation) on investments (tax basis) | | $ | 2,596,385,810 | |
| | | | |
At March 31, 2010, the Fund had deferred tax basis capital losses occurring subsequent to October 31, 2008 of $1,737,786,157. For tax purposes, such losses will be reflected in the year ending September 30, 2010.
At March 31, 2010, the Fund had tax basis capital losses of $1,052,728,465, which may be carried forward to offset future capital gains. To the extent such carryforwards are used, capital gain distributions may be reduced to the extent provided by regulations. Such capital loss carryforwards will expire September 30, 2017.
NOTE 7 – DERIVATIVE FINANCIAL INSTRUMENTS WITH OFF-BALANCE SHEET RISK AND FOREIGN INVESTMENT RISK
The Fund may use a variety of derivative financial instruments to hedge or adjust the risks affecting its investment portfolio or to enhance investment returns. Provisions of FASB Accounting Standards Codification ASC 815-10-50, (“ASC 815”) require certain disclosures. The new requirement amends and expands disclosures related to derivative instruments to provide users of financial statements with an enhanced understanding of the use of derivative instruments by the Fund and how these derivatives affect the financial position, financial performance and cash flows of the Fund. The Fund does not designate any derivative instruments as hedging instruments under ASC 815. During the six months ended March 31, 2010, the Fund’s principal exposure to derivative financial instruments of the type addressed by ASC 815 was investment in foreign exchange contracts. A foreign exchange contract is an agreement between two parties to exchange different currencies at a specified rate of exchange at an agreed upon future date. Foreign exchange contracts involve risks to the Fund, including the risk that a contract counterparty will not meet its obligations to the Fund, the risk that a change in a contract’s value may not correlate perfectly with the currency the contract was intended to track, and the risk that the Fund’s advisor is unable to correctly implement its strategy in using a contract. In any such instance, the Fund may not achieve the intended benefit of entering into a contract, and may experience a loss.
The Fund entered into forward currency contracts during the six months ended March 31, 2010 in the normal course of pursuing its investment objectives, in anticipation of purchasing foreign investments or with the intent of reducing the risk to the value of the Fund’s foreign investments from adverse changes in the relationship between the U.S. dollar and foreign currencies. In each case these contracts have been initiated in conjunction with foreign investment transactions.
These contracts are accounted for by the Fund under ASC 815. Unrealized gains and unrealized losses on outstanding contracts are reported in the Fund’s Statement of Assets and Liabilities at the Fund’s net equity, as measured by the difference between the forward exchange rates at the reporting date and the forward exchange rates at each contract’s inception date. Net realized gain (loss) on contracts closed during the period, and changes in net unrealized appreciation (depreciation) on outstanding contracts are recognized in the Fund’s Statement of Operations.
26 Certified Semi-Annual Report
| | |
| NOTES TO FINANCIAL STATEMENTS, CONTINUED | | |
| |
| Thornburg International Value Fund | | March 31, 2010 (Unaudited) |
The following table displays the outstanding forward currency contracts, at March 31, 2010 :
Outstanding Forward Currency Contracts
to Buy or Sell at March 31, 2010
| | | | | | | | | | | | | | | | |
Contract Description | | Buy/Sell | | Contract
Amount | | Contract
Value Date | | Value
USD | | Unrealized
Appreciation | | Unrealized
Depreciation | |
Brazilian Dollar | | Sell | | 737,803,000 | | 05/04/2010 | | $ | 412,403,544 | | $ | — | | $ | (5,945,303 | ) |
Euro | | Sell | | 125,941,000 | | 07/26/2010 | | | 170,105,173 | | | 70,085 | | | — | |
Euro | | Sell | | 278,430,000 | | 07/26/2010 | | | 376,068,027 | | | 6,695,263 | | | — | |
Euro | | Sell | | 119,139,000 | | 07/26/2010 | | | 160,917,892 | | | 4,325,518 | | | — | |
Euro | | Sell | | 274,596,000 | | 07/26/2010 | | | 370,889,544 | | | 15,453,298 | | | — | |
Mexican Peso | | Sell | | 6,620,596,000 | | 05/28/2010 | | | 532,646,748 | | | — | | | (30,020,267 | ) |
| | | | | | | | | | | | | | | | |
Total | | | | | | | | | | | $ | 26,544,164 | | $ | (35,965,570 | ) |
| | | | | | | | | | | | | | | | |
The unrealized appreciation (depreciation) of the outstanding forward currency contracts recognized in the Fund’s Statement of Assets and Liabilities at March 31, 2010 is disclosed in the following table:
Fair Values of Derivative Financial Instruments
at March 31, 2010
| | | | | | |
Asset Derivatives | | | | | | |
| | | Balance Sheet Location | | Fair Value | |
Foreign exchange contracts | | Assets - Unrealized appreciation on forward currency contracts | | $ | 26,544,164 | |
| | |
Liability Derivatives | | | | | | |
| | | Balance Sheet Location | | Fair Value | |
Foreign exchange contracts | | Liabilities - Unrealized depreciation on forward currency contracts | | $ | (35,965,570 | ) |
The realized gains (losses) from forward currency contracts, and the change in unrealized appreciation (depreciation) of outstanding forward currency contracts recognized in the Fund’s Statement of Operations for the six months ended March 31, 2010 is disclosed in the following tables:
|
Amount of Realized Gain (Loss) on Derivative Financial Instruments Recognized in Income for the Six Months Ended March 31, 2010 |
| | | | | | | | |
| | | Total | | | Forward Currency Contracts | |
Foreign exchange contracts | | $ | (23,296,560 | ) | | $ | (23,296,560 | ) |
| | | | |
Change in Unrealized Appreciation (Depreciation) of Derivative Financial Instruments Recognized in Income for the Six Months Ended March 31, 2010 |
| | | | | | | | |
| | | Total | | | Forward Currency Contracts | |
Foreign exchange contracts | | $ | (12,151,807 | ) | | $ | (12,151,807 | ) |
OTHER NOTES
Fund management believes no events have occurred between March 31, 2010 and May 20, 2010, the date of issuance of the financial statements, that require adjustment of, or disclosure in, the accompanying financial statements.
Certified Semi-Annual Report 27
| | |
| FINANCIAL HIGHLIGHTS | | |
| |
| Thornburg International Value Fund | | |
| | | | | | | | | | | | | | | | | | | | | | | | | | | | | | | | | | | | | | | | | | | | |
| | | PER SHARE PERFORMANCE (for a share outstanding throughout the period)+ | | RATIOS TO AVERAGE NET ASSETS | | | SUPPLEMENTAL DATA |
Unless
Otherwise
Noted, Periods
are Fiscal
Years Ended
Sept. 30, | | Net Asset
Value
Beginning
of Period | | Net
Investment
Income
(Loss) | | | Net
Realized &
Unrealized
Gain
(Loss) on
Investments | | | Total from
Investment
Operations | | | Dividends
from Net
Investment
Income | | | Dividends
from Net
Realized
Gains | | | Total
Dividends | | | Net
Asset
Value
End of
Period | | Net
Investment
Income
(Loss)
(%) | | | Expenses,
After
Expense
Reductions
(%) | | | Expenses,
After
Expense
Reductions
and Net of
Custody
Credits
(%) | | | Expenses,
Before
Expense
Reductions
(%) | | | Total
Return
(%)(a) | | | Portfolio
Turnover
Rate
(%) | | Net Assets
at End of
Period
(Thousands) |
Class A Shares | | | | | | | | | | | | | | | | | | | | | | | | | | | | | | | | | | | | | | | | | | | | |
2010(b)(c) | | $ | 23.91 | | 0.01 | | | 1.35 | | | 1.36 | | | (0.01 | ) | | — | | | (0.01 | ) | | $ | 25.26 | | 0.07 | (d) | | 1.28 | (d) | | 1.28 | (d) | | 1.28 | (d) | | 5.67 | | | 12.62 | | $ | 6,036,442 |
2009(c) | | $ | 23.68 | | 0.21 | | | 0.24 | | | 0.45 | | | (0.22 | ) | | — | | | (0.22 | ) | | $ | 23.91 | | 1.09 | | | 1.34 | | | 1.34 | | | 1.34 | | | 2.05 | | | 32.76 | | $ | 5,309,704 |
2008(c) | | $ | 36.09 | | 0.37 | | | (9.59 | ) | | (9.22 | ) | | (0.31 | ) | | (2.88 | ) | | (3.19 | ) | | $ | 23.68 | | 1.23 | | | 1.28 | | | 1.28 | | | 1.28 | | | (27.77 | ) | | 27.31 | | $ | 5,510,070 |
2007(c) | | $ | 26.51 | | 0.27 | | | 10.25 | | | 10.52 | | | (0.29 | ) | | (0.65 | ) | | (0.94 | ) | | $ | 36.09 | | 0.88 | | | 1.29 | | | 1.29 | | | 1.29 | | | 40.64 | | | 64.77 | | $ | 7,111,205 |
2006(c) | | $ | 22.80 | | 0.32 | | | 4.00 | | | 4.32 | | | (0.21 | ) | | (0.40 | ) | | (0.61 | ) | | $ | 26.51 | | 1.25 | | | 1.33 | | | 1.33 | | | 1.33 | | | 19.30 | | | 36.58 | | $ | 4,261,892 |
2005(c) | | $ | 18.18 | | 0.18 | | | 4.63 | | | 4.81 | | | (0.19 | ) | | — | | | (0.19 | ) | | $ | 22.80 | | 0.87 | | | 1.44 | | | 1.44 | | | 1.44 | | | 26.51 | | | 34.17 | | $ | 2,205,924 |
Class B Shares | | | | | | | | | | | | | | | | | | | | | | | | | | | | | | | | | | | | | | | | | | | | |
2010(b) | | $ | 22.56 | | (0.09 | ) | | 1.28 | | | 1.19 | | | — | | | — | | | — | | | $ | 23.75 | | (0.77 | )(d) | | 2.08 | (d) | | 2.08 | (d) | | 2.08 | (d) | | 5.27 | | | 12.62 | | $ | 79,564 |
2009 | | $ | 22.37 | | 0.05 | | | 0.22 | | | 0.27 | | | (0.08 | ) | | — | | | (0.08 | ) | | $ | 22.56 | | 0.29 | | | 2.13 | | | 2.13 | | | 2.13 | | | 1.24 | | | 32.76 | | $ | 80,908 |
2008 | | $ | 34.33 | | 0.13 | | | (9.06 | ) | | (8.93 | ) | | (0.15 | ) | | (2.88 | ) | | (3.03 | ) | | $ | 22.37 | | 0.44 | | | 2.04 | | | 2.04 | | | 2.04 | | | (28.33 | ) | | 27.31 | | $ | 98,541 |
2007 | | $ | 25.28 | | 0.03 | | | 9.75 | | | 9.78 | | | (0.08 | ) | | (0.65 | ) | | (0.73 | ) | | $ | 34.33 | | 0.11 | | | 2.06 | | | 2.06 | | | 2.06 | | | 39.55 | | | 64.77 | | $ | 135,486 |
2006 | | $ | 21.82 | | 0.11 | | | 3.81 | | | 3.92 | | | (0.06 | ) | | (0.40 | ) | | (0.46 | ) | | $ | 25.28 | | 0.44 | | | 2.13 | | | 2.13 | | | 2.13 | | | 18.32 | | | 36.58 | | $ | 82,799 |
2005 | | $ | 17.39 | | 0.01 | | | 4.44 | | | 4.45 | | | (0.02 | ) | | — | | | (0.02 | ) | | $ | 21.82 | | 0.04 | | | 2.26 | | | 2.25 | | | 2.27 | | | 25.59 | | | 34.17 | | $ | 47,306 |
Class C Shares | | | | | | | | | | | | | | | | | | | | | | | | | | | | | | | | | | | | | | | | | | | | |
2010(b) | | $ | 22.65 | | (0.08 | ) | | 1.28 | | | 1.20 | | | — | | | — | | | — | | | $ | 23.85 | | (0.69 | )(d) | | 2.02 | (d) | | 2.02 | (d) | | 2.02 | (d) | | 5.30 | | | 12.62 | | $ | 1,660,259 |
2009 | | $ | 22.46 | | 0.06 | | | 0.22 | | | 0.28 | | | (0.09 | ) | | — | | | (0.09 | ) | | $ | 22.65 | | 0.34 | | | 2.06 | | | 2.06 | | | 2.06 | | | 1.31 | | | 32.76 | | $ | 1,551,488 |
2008 | | $ | 34.45 | | 0.15 | | | (9.10 | ) | | (8.95 | ) | | (0.16 | ) | | (2.88 | ) | | (3.04 | ) | | $ | 22.46 | | 0.50 | | | 2.00 | | | 2.00 | | | 2.00 | | | (28.28 | ) | | 27.31 | | $ | 1,852,185 |
2007 | | $ | 25.37 | | 0.05 | | | 9.78 | | | 9.83 | | | (0.10 | ) | | (0.65 | ) | | (0.75 | ) | | $ | 34.45 | | 0.17 | | | 2.01 | | | 2.01 | | | 2.01 | | | 39.63 | | | 64.77 | | $ | 2,309,487 |
2006 | | $ | 21.89 | | 0.13 | | | 3.82 | | | 3.95 | | | (0.07 | ) | | (0.40 | ) | | (0.47 | ) | | $ | 25.37 | | 0.55 | | | 2.06 | | | 2.05 | | | 2.06 | | | 18.41 | | | 36.58 | | $ | 1,290,250 |
2005 | | $ | 17.46 | | 0.03 | | | 4.45 | | | 4.48 | | | (0.05 | ) | | — | | | (0.05 | ) | | $ | 21.89 | | 0.16 | | | 2.16 | | | 2.15 | | | 2.16 | | | 25.65 | | | 34.17 | | $ | 635,833 |
Class I Shares | | | | | | | | | | | | | | | | | | | | | | | | | | | | | | | | | | | | | | | | | | | | |
2010(b) | | $ | 24.42 | | 0.06 | | | 1.37 | | | 1.43 | | | (0.05 | ) | | — | | | (0.05 | ) | | $ | 25.80 | | 0.49 | (d) | | 0.88 | (d) | | 0.88 | (d) | | 0.88 | (d) | | 5.87 | | | 12.62 | | $ | 8,221,586 |
2009 | | $ | 24.18 | | 0.31 | | | 0.24 | | | 0.55 | | | (0.31 | ) | | — | | | (0.31 | ) | | $ | 24.42 | | 1.54 | | | 0.92 | | | 0.92 | | | 0.92 | | | 2.46 | | | 32.76 | | $ | 6,330,268 |
2008 | | $ | 36.77 | | 0.51 | | | (9.79 | ) | | (9.28 | ) | | (0.43 | ) | | (2.88 | ) | | (3.31 | ) | | $ | 24.18 | | 1.64 | | | 0.89 | | | 0.89 | | | 0.89 | | | (27.45 | ) | | 27.31 | | $ | 5,152,506 |
2007 | | $ | 26.99 | | 0.41 | | | 10.42 | | | 10.83 | | | (0.40 | ) | | (0.65 | ) | | (1.05 | ) | | $ | 36.77 | | 1.32 | | | 0.90 | | | 0.90 | | | 0.90 | | | 41.17 | | | 64.77 | | $ | 5,113,109 |
2006 | | $ | 23.19 | | 0.43 | | | 4.06 | | | 4.49 | | | (0.29 | ) | | (0.40 | ) | | (0.69 | ) | | $ | 26.99 | | 1.67 | | | 0.94 | | | 0.94 | | | 0.94 | | | 19.76 | | | 36.58 | | $ | 2,034,453 |
2005 | | $ | 18.48 | | 0.28 | | | 4.72 | | | 5.00 | | | (0.29 | ) | | — | | | (0.29 | ) | | $ | 23.19 | | 1.32 | | | 0.99 | | | 0.99 | | | 1.02 | | | 27.15 | | | 34.17 | | $ | 892,216 |
Class R3 Shares | | | | | | | | | | | | | | | | | | | | | | | | | | | | | | | | | | | | | | | | | | | | |
2010(b) | | $ | 23.96 | | (0.01 | ) | | 1.35 | | | 1.34 | | | — | | | — | | | — | | | $ | 25.30 | | (0.10 | )(d) | | 1.45 | (d) | | 1.45 | (d) | | 1.55 | (d) | | 5.59 | | | 12.62 | | $ | 1,206,233 |
2009 | | $ | 23.73 | | 0.20 | | | 0.23 | | | 0.43 | | | (0.20 | ) | | — | | | (0.20 | ) | | $ | 23.96 | | 1.02 | | | 1.45 | | | 1.45 | | | 1.64 | | | 1.96 | | | 32.76 | | $ | 1,042,248 |
2008 | | $ | 36.18 | | 0.33 | | | (9.63 | ) | | (9.30 | ) | | (0.27 | ) | | (2.88 | ) | | (3.15 | ) | | $ | 23.73 | | 1.07 | | | 1.45 | | | 1.45 | | | 1.62 | | | (27.90 | ) | | 27.31 | | $ | 902,150 |
2007 | | $ | 26.58 | | 0.23 | | | 10.26 | | | 10.49 | | | (0.24 | ) | | (0.65 | ) | | (0.89 | ) | | $ | 36.18 | | 0.75 | | | 1.45 | | | 1.45 | | | 1.61 | | | 40.43 | | | 64.77 | | $ | 984,587 |
2006 | | $ | 22.88 | | 0.33 | | | 3.97 | | | 4.30 | | | (0.20 | ) | | (0.40 | ) | | (0.60 | ) | | $ | 26.58 | | 1.29 | | | 1.45 | | | 1.45 | | | 1.61 | | | 19.15 | | | 36.58 | | $ | 445,081 |
2005 | | $ | 18.28 | | 0.21 | | | 4.63 | | | 4.84 | | | (0.24 | ) | | — | | | (0.24 | ) | | $ | 22.88 | | 0.99 | | | 1.45 | | | 1.45 | | | 1.72 | | | 26.54 | | | 34.17 | | $ | 118,436 |
Class R4 Shares | | | | | | | | | | | | | | | | | | | | | | | | | | | | | | | | | | | | | | | | | | | | |
2010(b) | | $ | 23.82 | | 0.02 | | | 1.33 | | | 1.35 | | | (0.01 | ) | | — | | | (0.01 | ) | | $ | 25.16 | | 0.15 | (d) | | 1.25 | (d) | | 1.25 | (d) | | 1.35 | (d) | | 5.68 | | | 12.62 | | $ | 709,704 |
2009 | | $ | 23.60 | | 0.26 | | | 0.21 | | | 0.47 | | | (0.25 | ) | | .— | | | (0.25 | ) | | $ | 23.82 | | 1.29 | | | 1.25 | | | 1.25 | | | 1.50 | | | 2.16 | | | 32.76 | | $ | 522,363 |
2008 | | $ | 36.02 | | 0.44 | | | (9.62 | ) | | (9.18 | ) | | (0.36 | ) | | (2.88 | ) | | (3.24 | ) | | $ | 23.60 | | 1.51 | | | 1.25 | | | 1.25 | | | 1.40 | | | (27.73 | ) | | 27.31 | | $ | 231,960 |
2007(e) | | $ | 28.86 | | 0.09 | | | 7.36 | | | 7.45 | | | (0.29 | ) | | — | | | (0.29 | ) | | $ | 36.02 | | 0.42 | (d) | | 1.25 | (d) | | 1.25 | (d) | | 1.70 | (d) | | 25.90 | | | 64.77 | | $ | 39,217 |
Class R5 Shares | | | | | | | | | | | | | | | | | | | | | | | | | | | | | | | | | | | | | | | | | | | | |
2010(b) | | $ | 24.38 | | 0.05 | | | 1.37 | | | 1.42 | | | (0.04 | ) | | — | | | (0.04 | ) | | $ | 25.76 | | 0.43 | (d) | | 0.97 | (d) | | 0.97 | (d) | | 0.97 | (d) | | 5.84 | | | 12.62 | | $ | 1,970,684 |
2009 | | $ | 24.14 | | 0.30 | | | 0.23 | | | 0.53 | | | (0.29 | ) | | — | | | (0.29 | ) | | $ | 24.38 | | 1.51 | | | 0.99 | | | 0.99 | | | 1.08 | | | 2.40 | | | 32.76 | | $ | 1,414,122 |
2008 | | $ | 36.74 | | 0.50 | | | (9.81 | ) | | (9.31 | ) | | (0.41 | ) | | (2.88 | ) | | (3.29 | ) | | $ | 24.14 | | 1.65 | | | 0.99 | | | 0.99 | | | 1.01 | | | (27.54 | ) | | 27.31 | | $ | 944,582 |
2007 | | $ | 26.97 | | 0.43 | | | 10.39 | | | 10.82 | | | (0.40 | ) | | (0.65 | ) | | (1.05 | ) | | $ | 36.74 | | 1.33 | | | 0.94 | | | 0.94 | | | 0.95 | | | 41.13 | | | 64.77 | | $ | 450,944 |
2006 | | $ | 23.18 | | 0.45 | | | 4.03 | | | 4.48 | | | (0.29 | ) | | (0.40 | ) | | (0.69 | ) | | $ | 26.97 | | 1.76 | | | 0.95 | | | 0.95 | | | 0.96 | | | 19.72 | | | 36.58 | | $ | 48,699 |
2005(f) | | $ | 20.37 | | 0.16 | | | 2.84 | | | 3.00 | | | (0.19 | ) | | — | | | (0.19 | ) | | $ | 23.18 | | 1.10 | (d) | | 1.00 | (d) | | 0.99 | (d) | | 2.13 | (d) | | 14.72 | | | 34.17 | | $ | 14,458 |
| (a) | Not annualized for periods less than one year. |
| (b) | Unaudited Six Month Period Ended March 31. |
| (c) | Sales loads are not reflected in computing total return. |
| (e) | Effective date of this class of shares was February 1, 2007. |
| (f) | Effective date of this class of shares was February 1, 2005. |
| + | Based on weighted average shares outstanding. |
See notes to financial statements.
| | |
| 28 Certified Semi-Annual Report | | Certified Semi-Annual Report 29 |
| | |
EXPENSE EXAMPLE | | |
| |
Thornburg International Value Fund | | March 31, 2010 (Unaudited) |
As a shareholder of the Fund, you incur two types of costs:
| | (1) | transaction costs, including |
(a) sales charges (loads) on purchase payments for Class A shares;
(b) a deferred sales charge on redemptions of any part or all of a purchase of $1 million of Class A shares within 12 months of purchase;
(c) a deferred sales charge on redemptions of Class B shares within eight years of purchase;
(d) a deferred sales charge on redemptions of Class C shares within 12 months of purchase;
(e) a 30-day redemption fee on Class A and Class I shares;
| | (2) | ongoing costs, including management fees; distribution and/or service (12b-1) fees; and other Fund expenses. |
This example is intended to help you understand your ongoing costs (in dollars) of investing in the Fund and to compare these costs with the ongoing costs of investing in other mutual funds.
The example is based on a $1,000 investment beginning on October 1, 2009, and held until March 31, 2010.
ACTUAL EXPENSES
For each class of shares, the first line of the table at right provides information about actual account values and actual expenses. You may use the information in this line, together with the amount you invested, to estimate the expenses that you paid over the period. Simply divide your account value by $1,000 (for example, an $8,600 account value divided by $1,000 = 8.6), then multiply the result by the number in the first line for your class of shares under the heading entitled “Expenses Paid During Period” to estimate the expenses you paid on your account during this period.
HYPOTHETICAL EXAMPLE FOR COMPARISON PURPOSES
For each class of shares, the second line of the table at right provides information about hypothetical account values and hypothetical expenses based on the Fund’s actual expense ratio and an assumed rate of return of 5% per year before expenses, which is not the Fund’s actual return. The hypothetical account values and expenses may not be used to estimate the actual ending account balance or expenses you paid for the period. You may use this information to compare the ongoing costs of investing in the Fund and other funds. To do so, compare this 5% hypothetical example with the 5% hypothetical examples that appear in the shareholder reports of the other funds.
| | | | | | | | | |
| | | Beginning
Account Value
10/1/09 | | Ending
Account Value
3/31/10 | | Expenses Paid
During Period†
10/1/09–3/31/10 |
Class A Shares | | | | | | | | | |
Actual | | $ | 1,000.00 | | $ | 1,056.70 | | $ | 6.58 |
Hypothetical* | | $ | 1,000.00 | | $ | 1,018.54 | | $ | 6.46 |
Class B Shares | | | | | | | | | |
Actual | | $ | 1,000.00 | | $ | 1,052.70 | | $ | 10.66 |
Hypothetical* | | $ | 1,000.00 | | $ | 1,014.54 | | $ | 10.46 |
Class C Shares | | | | | | | | | |
Actual | | $ | 1,000.00 | | $ | 1,053.00 | | $ | 10.36 |
Hypothetical* | | $ | 1,000.00 | | $ | 1,014.84 | | $ | 10.17 |
Class I Shares | | | | | | | | | |
Actual | | $ | 1,000.00 | | $ | 1,058.70 | | $ | 4.53 |
Hypothetical* | | $ | 1,000.00 | | $ | 1,020.53 | | $ | 4.45 |
Class R3 Shares | | | | | | | | | |
Actual | | $ | 1,000.00 | | $ | 1,055.90 | | $ | 7.43 |
Hypothetical* | | $ | 1,000.00 | | $ | 1,017.70 | | $ | 7.29 |
Class R4 Shares | | | | | | | | | |
Actual | | $ | 1,000.00 | | $ | 1,056.80 | | $ | 6.41 |
Hypothetical* | | $ | 1,000.00 | | $ | 1,018.70 | | $ | 6.29 |
Class R5 Shares | | | | | | | | | |
Actual | | $ | 1,000.00 | | $ | 1,058.40 | | $ | 4.96 |
Hypothetical* | | $ | 1,000.00 | | $ | 1,020.11 | | $ | 4.87 |
| † | Expenses are equal to the annualized expense ratio for each class (A: 1.28%; B: 2.08%; C: 2.02%; I: 0.88%; R3: 1.45%; R4: 1.25%; R5: 0.97%) multiplied by the average account value over the period, multiplied by 182/365 to reflect the one-half year period. |
| * | Hypothetical assumes a rate of return of 5% per year before expenses. |
Please note that the expenses shown in the table are meant to highlight your ongoing costs only and do not reflect any transactional costs, such as sales charges (loads), redemption fees, or exchange fees. Therefore, the second line of the table for each class of shares is useful in comparing ongoing costs only, and will not help you determine the relative total costs of owning different funds. In addition, if these transactional costs were included, your costs would have been higher.
30 Certified Semi-Annual Report
| | |
| INDEX COMPARISON | | |
| |
| Thornburg International Value Fund | | March 31, 2010 (Unaudited) |
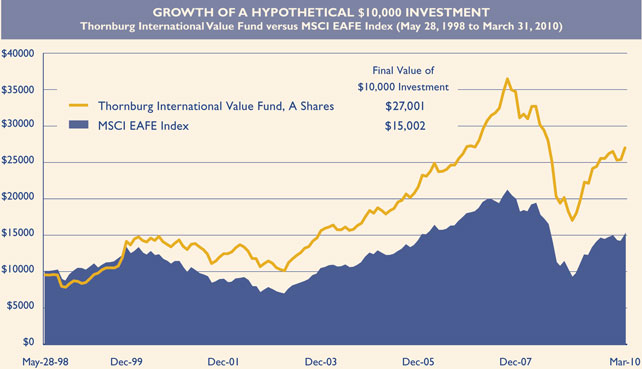
AVERAGE ANNUAL TOTAL RETURNS
For periods ended March 31, 2010 (with sales charge)
| | | | | | | | | | | | |
| | | 1 Yr | | | 5 Yrs | | | 10 Yrs | | | Since
Inception | |
A Shares (Incep: 5/28/98) | | 43.00 | % | | 7.00 | % | | 5.73 | % | | 8.75 | % |
B Shares (Incep: 4/3/00) | | 43.62 | % | | 6.85 | % | | — | | | 5.72 | % |
C Shares (Incep: 5/28/98) | | 47.69 | % | | 7.22 | % | | 5.40 | % | | 8.29 | % |
I Shares (Incep: 3/30/01) | | 50.35 | % | | 8.43 | % | | — | | | 8.90 | % |
R3 Shares (Incep: 7/1/03) | | 49.57 | % | | 7.86 | % | | — | | | 12.47 | % |
R4 Shares (Incep: 2/1/07) | | 49.87 | % | | — | | | — | | | -0.56 | % |
R5 Shares (Incep: 2/1/05) | | 50.15 | % | | 8.37 | % | | — | | | 8.48 | % |
MSCI EAFE Index (Since: 5/28/98) | | 54.44 | % | | 3.75 | % | | 1.27 | % | | 3.49 | % |
The MSCI EAFE (Europe, Australasia, Far East) Index is an unmanaged, market capitalization weighted index and is the common benchmark for international portfolio performance. The index is calculated with net dividends reinvested in U.S. dollars. Unless otherwise noted, index returns do not reflect fees, brokerage commissions or other expenses of investing. Investors may not make direct investments into any index.
Performance data reflects past performance, which is no guarantee of future results. The performance data and graph do not reflect the deduction of taxes that a shareholder would pay on distributions or the redemption of Fund shares. Returns reflect the reinvestment of dividends and capital gains as well as applicable sales charges. Class A shares are sold with a maximum sales charge of 4.50%. Class B shares carry a contingent deferred sales charge (CDSC) that declines from 5.00% to 0% depending upon the period of time the shares are held. Class B shares will automatically convert to Class A shares on a quarterly basis approximately eight years after purchase. Class C shares are subject to a 1% CDSC for the first year only. There is no up-front sales charge for Class I, R3, R4 and R5 shares. Class A and I shares are subject to a 1% 30-day redemption fee.
Certified Semi-Annual Report 31
| | |
| OTHER INFORMATION | | |
| |
| Thornburg International Value Fund | | March 31, 2010 (Unaudited) |
PORTFOLIO PROXY VOTING
Policies and Procedures:
The Trust has delegated to Thornburg Investment Management, Inc. (the “Advisor”) voting decisions respecting proxies for the Fund’s voting securities. The Advisor makes voting decisions in accordance with its Proxy Voting Policy and Procedures. A description of the Policy and Procedures is available (i) without charge, upon request, by calling the Advisor toll-free at 1-800-847-0200, (ii) on the Thornburg web site at www.thornburg.com, and (iii) on the Securities and Exchange Commission’s web site at www.sec.gov.
Information regarding how proxies were voted is available on or before August 31 of each year for the twelve months ending the preceding June 30. This information is available (i) without charge, upon request by calling the Advisor toll-free at 1-800-847-0200, (ii) on the Thornburg web site at www.thornburg.com, and (iii) on the Securities and Exchange Commission’s web site at www.sec.gov.
AVAILABILITY OF QUARTERLY PORTFOLIO SCHEDULE
The Fund files with the Securities and Exchange Commission schedules of its portfolio holdings on Form N-Q for the first and third quarters of each fiscal year. The Fund’s Forms N-Q are available on the Commission’s web site at www.sec.gov, or may be reviewed and copied at the Commission’s Public Reference Room in Washington, D.C. Information on the operation of the Public Reference Room may be obtained by calling 1-800-SEC-0330. The Fund also makes this information available on its web site at www.thornburg. com/download or upon request by calling 1-800-847-0200.
32 Certified Semi-Annual Report
Trustees’ Statement to Shareholders
Not part of the Certified Semi-Annual Report
February 8, 2005, as readopted July 22, 2009
The Trustees are concerned that ongoing commentaries and opinions reported in the media may confuse investors in general as to the supervisory duties of trustees of mutual funds and, in particular, leave Thornburg Investment Trust shareholders uncertain regarding how we discharge our responsibilities in supervising the Funds’ investment advisor and in reviewing the advisor’s contract for renewal. We decided to spell out clearly three principal guidelines that we follow in supervising the Trust’s investment advisor on your behalf.
We begin with the premise that each shareholder selected his or her Fund because its investments are managed by the investment advisor identified in the prospectus and in accordance with the objective and policies described in the prospectus. We realize, as each of you do, that if you believe that your Fund’s stated objective and policies no longer serve your personal investment goals, you can sell your shares and leave the Fund.
Therefore, we believe that our primary supervisory task – our principal obligation to you – is to assess the nature and quality of the advisor’s services, and to confirm that the advisor actively and competently pursues the Fund’s objective, in accordance with the policies set out in the prospectus. To do this, we meet regularly with management to review your Fund’s portfolio and to discuss the advisor’s specific actions and judgments in pursuing the Fund’s objective. We do not substitute our own judgment for the advisor’s decisions in selecting investments; the advisor is paid to exercise its informed judgment on investment decisions, and we seek to confirm, in reviewing the advisor’s performance, that the advisor is doing just that.
Second, while we are conscious of costs and the effect that costs have on shareholders’ returns, we do not seek the lowest fees or expense ratio as our sole or primary objective. We try to make sure that your Fund’s fees and costs are reasonable in relationship to the services rendered and that they are generally in line with those charged by other expert investment advisors, consistent with our belief that the Fund’s investors searched for and expect that expertise and attention and have decided to pay a reasonable price for it. We do not put the management contract “out to bid” as a matter of course, and we would not do so unless we had concluded that the advisor materially had failed to pursue the Fund’s objectives in accordance with its policies, or for other equally important reasons. We believe that any other approach would be inconsistent with your interests and contrary to your expectations when you bought shares of the Fund in the first place.
Finally, because we believe that most Thornburg Fund shareholders have invested with a long-term perspective, we try not to focus too much on the fashions of the moment and on short-term performance. The market will not favor any specific investment objective or set of policies at all times and under all economic circumstances. A fund will experience periods of both high and low returns relative to other funds and other investments. Even if one of our Funds is not favored by the market at a particular time, we believe that the advisor is nonetheless obliged to remain true to the Fund’s objective and policies, and we watch to see that it does so.
This page is not part of the Semi-Annual Report 33
This page intentionally left blank.
34 This page is not part of the Semi-Annual Report.
Retirement and Education Accounts
Thornburg Investment Management offers retirement and education savings accounts that can help you meet a variety of planning challenges. For account applications or further information on any of the accounts below, please call 1-800-847-0200 or go to www.thornburg.com/ira. Your financial advisor can help you determine which plan is right for you.
Individual Retirement Accounts
Individual Retirement Accounts (IRAs) provide a tax-advantaged means to save money for the future. For a detailed outline of the difference between retirement accounts, see www.thornburg.com/ira. Rollovers are available. Call 1-800-847-0200 for more information.
Traditional IRAs – Contributions to Traditional IRAs are tax deductible for eligible individuals, and withdrawals are taxed as additional ordinary income. You may contribute to an IRA if you receive compensation and are under 70 1/ 2, even if you are covered by an employer retirement plan. Deductible contributions are subject to certain qualifications. Please consult your tax advisor.
Roth IRAs – Under a Roth IRA, there is no tax deduction for contributions, but there is no income tax on qualified withdrawals. For a more detailed comparison of Traditional and Roth IRAs, please see our web site at www.thornburg.com/ira.
SEP IRAs – Simplified Employee Pension (SEP) IRAs are established by employers. The employer is allowed a tax deduction for contributions made to the SEP Plan and makes contributions to each eligible employee’s SEP IRA on a discretionary basis.
SIMPLE IRAs – Savings Incentive Match Plan for Employees of Small Employers (SIMPLE) is designed to give small business owners a simplified method to establish and contribute to a retirement plan for employees. The employer is allowed a tax deduction for contributions and makes either matching or non-elective contributions to each eligible employee’s SIMPLE IRA. Employees may make salary deferral contributions.
Coverdell Education Savings Account
These savings accounts are designed to provide a way to save money for higher education expenses. In an Education Savings Account, earnings and interest grow tax-free, and qualified withdrawals used to pay for eligible higher-education expenses are tax- and penalty-free.
Funds Available
The following funds are available in the accounts listed above:
| | • | | Thornburg International Value Fund |
| | • | | Thornburg Core Growth Fund |
| | • | | Thornburg Investment Income Builder Fund |
| | • | | Thornburg Global Opportunities Fund |
| | • | | Thornburg International Growth Fund |
| | • | | Thornburg Developing World Fund |
| | • | | Thornburg Limited Term U.S. Government Fund |
| | • | | Thornburg Limited Term Income Fund |
| | • | | Thornburg Strategic Income Fund |
This page is not part of the Semi-Annual Report. 35

36 This page is not part of the Semi-Annual Report.
Thornburg Equity Funds
Thornburg’s equity research uses a fundamental and comprehensive analytical approach. Thornburg equity funds focus on a limited number of securities so that each holding can impact performance. The equity team searches for firms believed to have a promising future and seeks to buy shares of those companies at a discount to their intrinsic value.
| | • | | Thornburg International Value Fund |
| | • | | Thornburg Core Growth Fund |
| | • | | Thornburg Investment Income Builder Fund |
| | • | | Thornburg Global Opportunities Fund |
| | • | | Thornburg International Growth Fund |
| | • | | Thornburg Developing World Fund |
Thornburg Bond Funds
Thornburg Investment Management applies a disciplined philosophy to fixed-income management. Since the launch of our first fixed-income fund over 25 years ago, we have been conducting fundamental, bottom-up research in an effort to identify bonds which we believe provide the best return for a given level of risk. We are very organic in our approach, avoiding leverage or complex strategies which could backfire in periods of market uncertainty.
| | • | | Thornburg Limited Term Municipal Fund |
| | • | | Thornburg Intermediate Municipal Fund |
| | • | | Thornburg California Limited Term Municipal Fund |
| | • | | Thornburg New Mexico Intermediate Municipal Fund |
| | • | | Thornburg New York Intermediate Municipal Fund |
| | • | | Thornburg Strategic Municipal Income Fund |
| | • | | Thornburg Limited Term U.S. Government Fund |
| | • | | Thornburg Limited Term Income Fund |
| | • | | Thornburg Strategic Income Fund |
Before investing, carefully consider the Fund’s investment goals, risks, charges, and expenses. For a prospectus containing this and other information, contact your financial advisor or visit thornburg. com. Read it carefully before investing.
For additional information, please visit www.thornburg.com
Thornburg Investment Management, Inc. 2300 North Ridgetop Road, Santa Fe, NM 87506
This page is not part of the Semi-Annual Report. 37
This page intentionally left blank.
38 This page is not part of the Semi-Annual Report.
This page intentionally left blank.
This page is not part of the Semi-Annual Report. 39
| | | | | | |
 | | Waste not, | | 
|
| | Wait not | |
| | | | Get instant access to your shareholder reports. |
| | |
| | This Semi-Annual Report is submitted for the general information of shareholders of the Fund. It is not authorized for distribution to prospective investors in the Fund unless preceded or accompanied by an effective prospectus. | | By switching from your postal mailbox to your email inbox, you reduce paper clutter, improve record keeping access, and help conserve our natural resources. |

| | Investment Advisor: | | Go to www.thornburg.com/edelivery and sign up to receive your shareholder reports, prospectuses, and proxy statements electronically. |
| | Thornburg Investment Management® 800.847.0200 | |
| | Distributor: | | |
| | Thornburg Securities Corporation® 800.847.0200 | | You invest in the future, without spending a dime. |
| | TH176 | | |

Important Information
The information presented on the following pages was current as of March 31, 2010. The managers’ views, portfolio holdings, and sector and country diversification are provided for the general information of the Fund’s shareholders; they are historical and subject to change. This material should not be deemed a recommendation to buy or sell any of the securities mentioned.
Investments in the Fund carry risks, including possible loss of principal. Special risks may be associated with investments outside the United States, especially in emerging markets, including currency fluctuations, illiquidity and volatility. Investments in small capitalization companies may increase the risk of greater price fluctuations. Please see the Fund’s Prospectus for a discussion of the risks associated with an investment in the Fund. Investments in the Fund are not FDIC insured, nor are they deposits of or guaranteed by a bank or any other entity. There is no guarantee that the Fund will meet its investment objectives. Funds invested in a limited number of holdings may expose an investor to greater volatility.
Performance data given at net asset value (NAV) does not take into account the applicable sales charges. If the sales charges had been included, the performance would have been lower.
Class I, R3, R4, and R5 shares may not be available to all investors. Minimum investments for Class I shares may be higher than those for other classes.
| | | | |
Share Class | | NASDAQ Symbol | | Cusip |
Class A | | THCGX | | 885-215-582 |
Class C | | TCGCX | | 885-215-574 |
Class I | | THIGX | | 885-215-475 |
Class R3 | | THCRX | | 885-215-517 |
Class R4 | | TCGRX | | 885-215-251 |
Class R5 | | THGRX | | 885-215-350 |
Glossary
Russell 3000 Growth Index – The Russell 3000 Growth Index (Russell 3K G) is an unmanaged index comprised of those Russell 3000 companies with higher price-to-book ratios and higher forecasted growth values.
Standard & Poor’s 500 Stock Index (S&P 500) – The S&P 500 Index is a broad measure of the U.S. stock market.
Unless otherwise noted, index returns reflect the reinvestment of income dividends and capital gains, if any, but do not reflect fees, brokerage commissions or other expenses of investing. Investors may not make direct investments into any index. The performance of any index is not indicative of the performance of any particular investment.
Basis Point (BPS) – Unit equal to 1/100th of 1%. A 1% change = 100 basis points (bps).
Beta – Beta is a measure of market-related risk. Less than one means the portfolio is less volatile than the index, while greater than one indicates more volatility than the index.
Equity Duration – A measure of the sensitivity of a stock’s price to changes in interest rates. The price of a long-duration stock has greater sensitivity to changes in interest rates compared to short-duration stocks because a greater piece of their value is derived from future profits.
Estimated EPS Growth – The estimated growth in earnings per share (EPS) over a given time period. For example, estimated EPS growth for a single year would be calculated as: [(estimated earnings for the upcoming year - current earnings) x 100] divided by current earnings.
Median Market Capitalization – Market capitalization (market cap) is the total value of a company’s stock, calculated by multiplying the number of outstanding common shares by the current share price. The company whose market cap is in the middle of the portfolio is the median market cap. Half the companies in the portfolio have values greater than the median, and half have values that are less.
Price to Book Value (P/B) – A ratio used to compare a stock’s market value to its book value. It is calculated by dividing the current closing price of the stock by the latest quarter’s book value (book value is simply assets minus liabilities).
Price to Cash Flow Ratio – A measure of the market’s expectations of a firm’s future financial health. It is calculated by dividing the price per share by cash flow per share.
Price to Earnings Ratio (P/E) – A valuation ratio equaling a company’s market value per share divided by earnings per share.
This page is not part of the Semi-Annual Report. 3
Thornburg Core Growth Fund
PORTFOLIO MANAGER

Alexander M.V. Motola, CFA
IMPORTANT PERFORMANCE
INFORMATION
Performance data shown represents past performance and is no guarantee of future results. Investment return and principal value will fluctuate so shares, when redeemed, may be worth more or less than their original cost. Current performance may be lower or higher than quoted. For performance current to the most recent month end, visit thornburg.com.
The maximum sales charge for Class A shares is 4.50%. Class A shares are subject to a 1% 30-day redemption fee. The total annual fund operating expense of Class A shares is 1.49%, as disclosed in the most recent Prospectus.
Continually Evaluating the Risk Equation
Growth stocks are often referred to as “glamour” stocks, and it is easy to understand why. Growth stocks generate excitement. These are stocks whose rapid earnings growth is expected to be followed by rapid price appreciation. Growth stocks capture the imagination, and investing in them may potentially offer considerable opportunities for reward.
But growth stocks can also be volatile. Identifying which companies will succeed takes work. It takes digging down to the nuts and bolts of companies. The management team of Thornburg Core Growth Fund understands this. They know that it is grit, not glamour, that creates a successful growth fund.
Portfolio manager Alex Motola and his team apply a rigorous stock selection process to the investments that comprise the Thornburg Core Growth Fund. This is a portfolio run on common sense, not on abstract theory. Motola’s overarching philosophy is to create a fund that generates good performance over the long term, while reducing volatility in the interim. Intensive, hands-on, independent research is the central theme. While many other growth funds rely on broad portfolio diversification to temper volatility, the Thornburg Core Growth Fund focuses on a limited number of stocks and diversifies those investments among three segments of the growth fund universe: Consistent Growth Companies, Growth Industry Leaders, and Emerging Growth Companies. By limiting the number of securities, the Fund’s managers can evaluate each stock in greater depth. We believe that diversifying among three growth baskets further mitigates risk because each of these segments typically reacts differently than the equity markets as a whole.
How does the stock selection process work? Before adding a stock to the Fund’s portfolio, Motola and his team drill down into the company and its business. The team believes that an intimate understanding of the companies in the portfolio is one of the most effective forms of risk management.
AVERAGE ANNUAL TOTAL RETURNS
FOR PERIODS ENDED 3/31/10
| | | | | | | | | | | | |
| | | 1 Yr | | | 3 Yrs | | | 5 Yrs | | | Since
Inception | |
A Shares (Incep: 12/27/00) | | | | | | | | | | | | |
Without sales charge | | 49.69 | % | | -8.32 | % | | 3.71 | % | | 2.23 | % |
With sales charge | | 43.00 | % | | -9.72 | % | | 2.75 | % | | 1.73 | % |
Russell 3000 Growth Index | | | | | | | | | | | | |
(Since: 12/21/00) | | 50.50 | % | | -0.92 | % | | 3.46 | % | | -1.08 | % |
4 This page is not part of the Semi-Annual Report.
Companies are initially screened using a variety of quantitative measures and parameters. Most are rejected and logged as a screening rejection. Only those with the most appealing opportunities to expand margins and grow earnings move on to the next step – the construction of a company-specific model. The goal is to cut to the quick and scrutinize the underlying business. The team uses SEC filings to construct proprietary income statement, balance sheet and cash flow statement models for each remaining company. From these they analyze historical data, monitor current conditions, identify red flags, and estimate future growth potential.
Motola, a former historian who has been at the Fund’s helm since its inception, is not one to go along with the crowd. He and his team are not tied to “mainstream thinking.” While they have access to the best of Wall Street’s analysis, they are not ruled by it.
The team test the strength of a company’s underlying business model against a variety of what-if screens. Besides conducting site visits and interviewing company management, they also check in with a company’s major customers, suppliers, and distributors to get a complete picture of a company before investing. Revenue and cost of goods sold are given particular attention. All data points are broken down in as many ways as possible before reaching an investment decision.
STOCKS CONTRIBUTING AND DETRACTING
FOR THE SIX MONTHS ENDED 3/31/10
| | |
Top Contributors | | Top Detractors |
Grand Canyon Education Inc. | | STEC Inc. |
Express Scripts Inc. | | Leap Wireless International Inc. |
Visa Inc. | | Actelion Ltd. |
DIRECTV Group, Inc. | | Western Union Co. |
Affiliated Managers Group Inc. | | VCA Antech Inc. |
| |
Source: FactSet | | |
KEY PORTFOLIO ATTRIBUTES
As of 3/31/10
| | | |
Portfolio P/E Trailing 12-months* | | | 20.1x |
Portfolio Price to Cash Flow* | | | 9.7x |
Portfolio Price to Book Value* | | | 3.0x |
Median Market Cap* | | $ | 5.9 B |
7-Year Beta (A Shares vs. Russell 3K G)* | | | 1.18 |
Number of Companies | | | 39 |
| |
* Source: FactSet | | | |
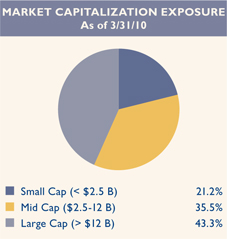
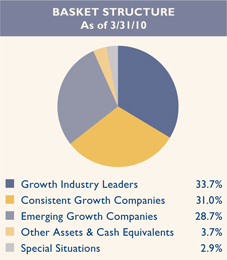
This page is not part of the Semi-Annual Report. 5

Thornburg Core Growth Fund
March 31, 2010
This report is certified under the Sarbanes-Oxley Act of 2002, which requires that public companies, including mutual funds, affirm that the information provided in their annual and semiannual shareholder reports fully and fairly represents their financial position.
6 Certified Semi-Annual Report
Letter to Shareholders
| | |
Alexander M.V. Motola, CFA Portfolio Manager | | April 18, 2010 Dear Fellow Shareholder: For the six months ended March 31, 2010, the Thornburg Core Growth Fund performance was disappointing in relative terms. The Fund’s Class A shares underperformed its benchmark with a total return of 5.80% (at NAV) compared to 12.89% for the Russell 3000 Growth Index. On March 31, 2010, the net asset value (NAV) for the Class A shares was $14.40. At the end of the last fiscal year (September 30, 2009), the Fund’s NAV was $13.61. The biggest driver of underperformance during the period was a handful of poor performing stocks that provided a drag we were unable to overcome with the rest of the portfolio. This is, of course, the risk of a portfolio invested in a more limited number of stocks. The three stocks that hurt us the most were STEC, Inc., Leap Wireless, and Actelion – three companies with nothing in common other than the fact that, during this period, worst-case scenarios for each were realized. For STEC, its growth trajectory was derailed when sell through at its largest customer flatlined, indicating much weaker end-market demand than anticipated. We thought the world was ready for solid state drives in the enterprise setting but we were wrong. For Leap Wireless, a price war among pre-paid wireless providers erupted over the summer and continued into the fall, severely impairing Leap’s ability to generate profit at expected levels. Actelion experienced a negative outcome in a phase III drug trial that battered the stock. Three stocks, three unique sets of circumstances. In each case we were well aware of the risks that eventually hurt us. The obvious question is “why take on that kind of risk?” As is the case with all of our investments, we build financial models to estimate the potential downside as well as upside. In each of these cases those downside estimates ended up being close to where the stocks would eventually trade. At the time of purchase, we were comfortable with the possible downside because the risk/ reward ratio was attractive. Each stock had enough upside potential to balance the risk of loss. Unfortunately, fundamentals deteriorated in each case and did not track to our investment case. For STEC and Leap Wireless, this was reason enough to sell. We continue to hold Actelion, as their core business continues to thrive and they have other intriguing pipeline prospects. |
Certified Semi-Annual Report 7
Letter to Shareholders,
Continued
Over the past half year, we also had our share of very strong performers. Among them was Express Scripts, a pharmaceutical benefits manager. Express Scripts has delivered strong results as it helps drive individuals in the insurance plans it manages to use generic drugs instead of branded, and to choose mail delivery over pharmacy pickup. The more success Express Scripts has influencing behavior, the more money their clients save and the higher margins Express Scripts earns. The company also closed the acquisition of a large competitor. This increased its scale, improving its drug purchasing power and competitive position.
Visa was another strong stock that was more resilient than expected through the downturn. Visa results during the period implied the beginning of a consumer rebound, or at least a stabilization. Visa makes money by processing credit card transactions, taking on no credit risk. During the last two quarters of 2009, Visa payment volumes turned strongly positive, benefitting from easy year-over-year comparisons but also growing sequentially. Visa collects a fee on transactions processed. Because of the company’s current strong competitive position, it was able to increase that fee, starting in the September quarter. The combination of an improving environment and fee increases has led to greater earnings power and an expanding valuation multiple.
During the period there was quite a bit of activity in the portfolio with eleven new stocks being added and eight being removed. Among the new stocks added was Life Time Fitness, which returns to the portfolio after having been previously held during 2004 and 2005. Life Time Fitness owns and operates fitness clubs across the United States. The credit crunch and recession provided substantial challenges for its business. Growth plans had to be put on hold and the balance sheet weakened. With the business appearing to turn the corner, we got back on the treadmill and repurchased the stock. Priceline.com was a long-time holding that we sold during the period. We held the stock for almost exactly two years and sold because we believe it had achieved fair value.
From a broader perspective, the recovery from the market lows seen in March 2009 continued, albeit at a slower pace. As it turns out, the 2008 crisis did not lead to the end of the world. A great deal of jobs were lost and wealth destroyed, but the economy continued to function. The majority of people have continued to go to work and spend and save. Companies have continued to pursue growth opportunities and strive to innovate and compete. The recession, which officially began in December 2007, ended last summer. GDP growth in the fourth quarter of 2009 was 5.6%; a number that looks good until you consider the very easy comparison to the fourth quarter of 2008 when GDP declined by a similar amount. So, perhaps we are not in a full blown recovery, but the economy seems to have stabilized and unemployment seems to have peaked. The other good news is that many U.S. companies are flush with cash after slashing spending and hoarding cash for a few years. Maintenance and growth capital expenditure cannot be neglected forever.
So what’s next? We don’t have a crystal ball, but we remain optimistic that regardless of the economic environment, our disciplined, consistent, bottom-up approach to stock research will lead us to attractive
8 Certified Semi-Annual Report
growth companies. We encourage you to learn more about your portfolio. Descriptions of each holding and links to company web sites can be found by pointing your internet browser to www.thornburg.com/funds. Thank you for investing in the Thornburg Core Growth Fund.
Sincerely,

Alexander M.V. Motola, CFA
Managing Director
Portfolio Manager
The matters discussed in this report may constitute forward-looking statements made pursuant to the safe harbor provisions of the Securities Litigation Reform Act of 1995. These include any advisor or portfolio manager prediction, assessment, analysis or outlook for individual securities, industries, investment styles, market sectors and/or markets. These statements involve risks and uncertainties. In addition to the general risks described for each fund in its current prospectus, other factors bearing on these reports include the accuracy of the advisor’s or portfolio manager’s forecasts and predictions, the appropriateness of the investment strategies designed by the advisor or portfolio manager, and the ability of the advisor or portfolio manager to implement their strategies efficiently and successfully. Any one or more of these factors, as well as other risks affecting the securities markets generally, could cause the actual results of any fund to differ materially as compared to its benchmarks.
Certified Semi-Annual Report 9
SCHEDULE OF INVESTMENTS
| | |
| Thornburg Core Growth Fund | | March 31, 2010 (Unaudited) |
TOP TEN HOLDINGS
As of 3/31/10
| | | | | | | | | | |
| Microsoft Corp. | | 4.3 | % | | | | ON Semiconductor Corp. | | 3.3 | % |
| Amdocs Ltd. | | 4.1 | % | | | | Qualcomm, Inc. | | 3.2 | % |
| Fiserv, Inc. | | 3.7 | % | | | | Express Scripts, Inc. | | 3.2 | % |
| Goldman Sachs Group, Inc. | | 3.5 | % | | | | Visa, Inc. | | 3.2 | % |
| Affiliated Managers Group, Inc. | | 3.5 | % | | | | Google, Inc. | | 3.1 | % |
SUMMARY OF INDUSTRY EXPOSURE
As of 3/31/10
| | | | | | | | | | |
| Software & Services | | 29.0 | % | | | | Energy | | 3.4 | % |
| Pharmaceuticals, Biotechnology & Life Sciences | | 10.2 | % | | | | Semiconductors & Semiconductor Equipment | | 3.3 | % |
| Diversified Financials | | 9.5 | % | | | | Technology Hardware & Equipment | | 3.2 | % |
| Consumer Services | | 8.1 | % | | | | Food, Beverage & Tobacco | | 3.1 | % |
| Health Care Equipment & Services | | 7.5 | % | | | | Retailing | | 3.0 | % |
| Materials | | 5.6 | % | | | | Banks | | 2.6 | % |
| Telecommunication Services | | 4.3 | % | | | | Other Assets & Cash Equivalents | | 3.7 | % |
| Media | | 3.5 | % | | | | | | | |
SUMMARY OF COUNTRY EXPOSURE
As of 3/31/10 (% of equity holdings)
| | | | | | | | | | |
| United States | | 85.5 | % | | | | Switzerland | | 2.7 | % |
| United Kingdom | | 6.1 | % | | | | Argentina | | 1.7 | % |
| Mexico | | 2.9 | % | | | | China | | 1.1 | % |
| | | | | |
| | | Shares/
Principal Amount | | Value |
COMMON STOCK — 96.27% | | | | | |
| | |
BANKS — 2.59% | | | | | |
COMMERCIAL BANKS — 2.59% | | | | | |
a SVB Financial Group | | 907,406 | | $ | 42,339,564 |
| | | | | |
| | | | | 42,339,564 |
| | | | | |
| | |
CONSUMER SERVICES — 8.13% | | | | | |
DIVERSIFIED CONSUMER SERVICES — 4.66% | | | | | |
a Coinstar, Inc. | | 986,840 | | | 32,072,300 |
a Grand Canyon Education, Inc. | | 1,684,600 | | | 44,035,444 |
10 Certified Semi-Annual Report
SCHEDULE OF INVESTMENTS, CONTINUED
| | |
| Thornburg Core Growth Fund | | March 31, 2010 (Unaudited) |
| | | | | |
| | | Shares/
Principal Amount | | Value |
HOTELS, RESTAURANTS & LEISURE — 3.47% | | | | | |
a Las Vegas Sands Corp. | | 1,841,305 | | $ | 38,943,601 |
a Life Time Fitness, Inc. | | 631,500 | | | 17,745,150 |
| | | | | |
| | | | | 132,796,495 |
| | | | | |
DIVERSIFIED FINANCIALS — 9.47% | | | | | |
CAPITAL MARKETS — 9.47% | | | | | |
a Affiliated Managers Group, Inc. | | 718,561 | | | 56,766,319 |
Charles Schwab Corp. | | 2,184,500 | | | 40,828,305 |
Goldman Sachs Group, Inc. | | 334,225 | | | 57,028,812 |
| | | | | |
| | | | | 154,623,436 |
| | | | | |
ENERGY — 3.44% | | | | | |
OIL, GAS & CONSUMABLE FUELS — 3.44% | | | | | |
Frontier Oil Corp. | | 1,533,161 | | | 20,697,673 |
XTO Energy, Inc. | | 750,600 | | | 35,413,308 |
| | | | | |
| | | | | 56,110,981 |
| | | | | |
FOOD, BEVERAGE & TOBACCO — 3.05% | | | | | |
BEVERAGES — 3.05% | | | | | |
a Hansen Natural Corp. | | 1,149,422 | | | 49,861,926 |
| | | | | |
| | | | | 49,861,926 |
| | | | | |
HEALTH CARE EQUIPMENT & SERVICES — 7.46% | | | | | |
HEALTH CARE EQUIPMENT & SUPPLIES — 0.40% | | | | | |
a Inverness Medical Innovations, Inc. | | 169,800 | | | 6,613,710 |
HEALTH CARE PROVIDERS & SERVICES — 7.06% | | | | | |
a Amedisys, Inc. | | 651,359 | | | 35,968,044 |
a Community Health Systems, Inc. | | 729,054 | | | 26,923,964 |
a Express Scripts, Inc. | | 514,497 | | | 52,355,215 |
| | | | | |
| | | | | 121,860,933 |
| | | | | |
MATERIALS — 5.61% | | | | | |
CHEMICALS — 5.61% | | | | | |
Ecolab, Inc. | | 954,189 | | | 41,936,606 |
Monsanto Co. | | 694,300 | | | 49,586,906 |
| | | | | |
| | | | | 91,523,512 |
| | | | | |
MEDIA — 3.54% | | | | | |
MEDIA — 3.54% | | | | | |
a Airmedia Group, Inc. ADR | | 2,685,127 | | | 16,782,044 |
a DIRECTV Group, Inc. | | 1,213,313 | | | 41,022,112 |
| | | | | |
| | | | | 57,804,156 |
| | | | | |
PHARMACEUTICALS, BIOTECHNOLOGY & LIFE SCIENCES — 10.17% | | | | | |
BIOTECHNOLOGY — 10.17% | | | | | |
a Actelion Ltd. | | 943,800 | | | 42,938,246 |
a Alexion Pharmaceuticals, Inc. | | 610,165 | | | 33,174,671 |
a Gilead Sciences, Inc. | | 1,017,760 | | | 46,287,725 |
a Talecris Biotherapeutics Holdings Corp. | | 2,196,545 | | | 43,755,176 |
| | | | | |
| | | | | 166,155,818 |
| | | | | |
Certified Semi-Annual Report 11
SCHEDULE OF INVESTMENTS, CONTINUED
| | |
| Thornburg Core Growth Fund | | March 31, 2010 (Unaudited) |
| | | | | | |
| | | Shares/
Principal Amount | | Value |
RETAILING — 2.96% | | | | | | |
MULTILINE RETAIL — 2.96% | | | | | | |
a Kohl’s Corp. | | | 882,600 | | $ | 48,348,828 |
| | | | | | |
| | | | | | 48,348,828 |
| | | | | | |
SEMICONDUCTORS & SEMICONDUCTOR EQUIPMENT — 3.27% | | | | | | |
SEMICONDUCTORS & SEMICONDUCTOR EQUIPMENT — 3.27% | | | | | | |
a ON Semiconductor Corp. | | | 6,680,698 | | | 53,445,584 |
| | | | | | |
| | |
SOFTWARE & SERVICES — 29.05% | | | | | | 53,445,584 |
| | | | | | |
INFORMATION TECHNOLOGY SERVICES — 14.34% | | | | | | |
a Amdocs Ltd. | | | 2,223,106 | | | 66,937,722 |
a Computer Sciences Corp. | | | 340,693 | | | 18,564,361 |
a Fiserv, Inc. | | | 1,196,184 | | | 60,718,300 |
Visa, Inc. | | | 573,856 | | | 52,238,112 |
Western Union Co. | | | 2,103,637 | | | 35,677,683 |
INTERNET SOFTWARE & SERVICES — 8.46% | | | | | | |
a Equinix, Inc. | | | 324,414 | | | 31,578,459 |
a Google, Inc. | | | 90,205 | | | 51,147,137 |
a MercadoLibre, Inc. | | | 550,661 | | | 26,547,367 |
a Telecity Group plc | | | 4,483,656 | | | 28,848,721 |
SOFTWARE — 6.25% | | | | | | |
Microsoft Corp. | | | 2,382,338 | | | 69,731,033 |
a Rovi Corp. | | | 872,143 | | | 32,382,670 |
| | | | | | |
| | | | | | 474,371,565 |
| | | | | | |
TECHNOLOGY HARDWARE & EQUIPMENT — 3.22% | | | | | | |
COMMUNICATIONS EQUIPMENT — 3.22% | | | | | | |
Qualcomm, Inc. | | | 1,252,900 | | | 52,609,271 |
| | | | | | |
| | | | | | 52,609,271 |
| | | | | | |
TELECOMMUNICATION SERVICES — 4.31% | | | | | | |
DIVERSIFIED TELECOMMUNICATION SERVICES — 1.48% | | | | | | |
a Neutral Tandem, Inc. | | | 1,517,000 | | | 24,241,660 |
WIRELESS TELECOMMUNICATION SERVICES — 2.83% | | | | | | |
America Movil SAB de C.V. | | | 18,344,300 | | | 46,188,096 |
| | | | | | |
| | | | | | 70,429,756 |
| | | | | | |
TOTAL COMMON STOCK (Cost $1,258,026,015) | | | | | | 1,572,281,825 |
| | | | | | |
SHORT TERM INVESTMENTS — 4.16% | | | | | | |
California State, put 4/8/2010 (LOC: Bank of America) (weekly demand notes), 0.27%, 5/1/2040 | | $ | 800,000 | | | 800,000 |
Clark County School District GO, put 4/1/2010 (Insured: AGM, SPA: Bayerische Landesbank) (daily demand notes), 0.33%, 6/15/2021 | | | 6,880,000 | | | 6,880,000 |
Kansas City Power & Light, 0.22%, 4/1/2010 | | | 15,000,000 | | | 15,000,000 |
Maryland State Health & Higher Educational Facilities, put 4/8/2010 (Univ. of Maryland Medical; LOC: Bank of America) (weekly demand notes), 0.30%, 7/1/2034 | | | 2,000,000 | | | 2,000,000 |
McCormick & Co., 0.10%, 4/1/2010 | | | 15,000,000 | | | 15,000,000 |
12 Certified Semi-Annual Report
| | |
| SCHEDULE OF INVESTMENTS, CONTINUED | | |
| |
| Thornburg Core Growth Fund | | March 31, 2010 (Unaudited) |
| | | | | | | |
| | | Shares/
Principal Amount | | Value | |
New York City Municipal Water Finance Authority, put 4/1/2010 (SPA: Dexia) (daily demand notes), 0.31%, 6/15/2033 | | $ | 3,200,000 | | $ | 3,200,000 | |
Precision Castparts Corp., 0.17%, 4/1/2010 | | | 25,000,000 | | | 25,000,000 | |
| | | | | | | |
TOTAL SHORT TERM INVESTMENTS (Cost $67,880,000) | | | | | | 67,880,000 | |
| | | | | | | |
TOTAL INVESTMENTS — 100.43% (Cost $1,325,906,015) | | | | | $ | 1,640,161,825 | |
LIABILITIES NET OF OTHER ASSETS — (0.43)% | | | | | | (6,990,791 | ) |
| | | | | | | |
NET ASSETS — 100.00% | | | | | $ | 1,633,171,034 | |
| | | | | | | |
Footnote Legend
Portfolio Abbreviations
To simplify the listings of securities, abbreviations are used per the table below:
| | |
| ADR | | American Depository Receipt |
| AGM | | Insured by Assured Guaranty Municipal Corp. |
| GO | | General Obligation |
| LOC | | Letter of Credit |
| SPA | | Stand-by Purchase Agreement |
See notes to financial statements.
Certified Semi-Annual Report 13
STATEMENT OF ASSETS AND LIABILITIES
| | |
| Thornburg Core Growth Fund | | March 31, 2010 (Unaudited) |
| | | | |
ASSETS | | | | |
Investments at value (cost $1,325,906,015) (Note 2) | | $ | 1,640,161,825 | |
Cash | | | 8,388 | |
Receivable for investments sold | | | 14,069,206 | |
Receivable for fund shares sold | | | 1,562,789 | |
Dividends receivable | | | 241,724 | |
Interest receivable | | | 2,221 | |
Prepaid expenses and other assets | | | 59,772 | |
| | | | |
Total Assets | | | 1,656,105,925 | |
| | | | |
| |
LIABILITIES | | | | |
Payable for securities purchased | | | 16,543,470 | |
Payable for fund shares redeemed | | | 3,977,767 | |
Payable to investment advisor and other affiliates (Note 3) | | | 1,643,232 | |
Accounts payable and accrued expenses | | | 770,422 | |
| | | | |
Total Liabilities | | | 22,934,891 | |
| | | | |
| |
NET ASSETS | | $ | 1,633,171,034 | |
| | | | |
NET ASSETS CONSIST OF: | | | | |
Distribution in excess of net investment income | | $ | (8,531,125 | ) |
Net unrealized appreciation on investments | | | 314,255,810 | |
Accumulated net realized gain (loss) | | | (989,477,720 | ) |
Net capital paid in on shares of beneficial interest | | | 2,316,924,069 | |
| | | | |
| | $ | 1,633,171,034 | |
| | | | |
14 Certified Semi-Annual Report
STATEMENT OF ASSETS AND LIABILITIES, CONTINUED
| | |
| Thornburg Core Growth Fund | | March 31, 2010 (Unaudited) |
| | | |
NET ASSET VALUE: | | | |
Class A Shares: | | | |
Net asset value and redemption price per share ($490,397,960 applicable to 34,065,003 shares of beneficial interest outstanding - Note 4) | | $ | 14.40 |
Maximum sales charge, 4.50% of offering price | | | 0.68 |
| | | |
Maximum offering price per share | | $ | 15.08 |
| | | |
| |
Class C Shares: | | | |
Net asset value and offering price per share * ($272,923,860 applicable to 20,459,022 shares of beneficial interest outstanding - Note 4) | | $ | 13.34 |
| | | |
| |
Class I Shares: | | | |
Net asset value, offering and redemption price per share ($208,904,007 applicable to 14,042,576 shares of beneficial interest outstanding - Note 4) | | $ | 14.88 |
| | | |
| |
Class R3 Shares: | | | |
Net asset value, offering and redemption price per share ($288,697,238 applicable to 20,048,339 shares of beneficial interest outstanding - Note 4) | | $ | 14.40 |
| | | |
| |
Class R4 Shares: | | | |
Net asset value, offering and redemption price per share ($33,423,931 applicable to 2,318,111 shares of beneficial interest outstanding - Note 4) | | $ | 14.42 |
| | | |
| |
Class R5 Shares: | | | |
Net asset value, offering and redemption price per share ($338,824,038 applicable to 22,795,570 shares of beneficial interest outstanding - Note 4) | | $ | 14.86 |
| | | |
| * | Redemption price per share is equal to net asset value less any applicable contingent deferred sales charge. |
See notes to financial statements.
Certified Semi-Annual Report 15
STATEMENT OF OPERATIONS
| | |
| Thornburg Core Growth Fund | | Six Months Ended March 31, 2010 (Unaudited) |
| | | | |
INVESTMENT INCOME: | | | | |
Dividend income | | $ | 3,147,723 | |
Interest income | | | 87,432 | |
| | | | |
Total Income | | | 3,235,155 | |
| | | | |
| |
EXPENSES: | | | | |
Investment advisory fees (Note 3) | | | 6,617,989 | |
Administration fees (Note 3) | | | | |
Class A Shares | | | 308,699 | |
Class C Shares | | | 173,677 | |
Class I Shares | | | 52,817 | |
Class R3 Shares | | | 175,182 | |
Class R4 Shares | | | 19,833 | |
Class R5 Shares | | | 81,057 | |
Distribution and service fees (Note 3) | | | | |
Class A Shares | | | 617,161 | |
Class C Shares | | | 1,394,390 | |
Class R3 Shares | | | 701,212 | |
Class R4 Shares | | | 39,650 | |
Transfer agent fees | | | | |
Class A Shares | | | 542,716 | |
Class C Shares | | | 307,630 | |
Class I Shares | | | 135,514 | |
Class R3 Shares | | | 293,917 | |
Class R4 Shares | | | 46,436 | |
Class R5 Shares | | | 348,308 | |
Registration and filing fees | | | | |
Class A Shares | | | 11,876 | |
Class C Shares | | | 10,679 | |
Class I Shares | | | 9,777 | |
Class R3 Shares | | | 8,989 | |
Class R4 Shares | | | 9,503 | |
Class R5 Shares | | | 10,292 | |
Custodian fees (Note 3) | | | 139,870 | |
Professional fees | | | 38,761 | |
Accounting fees | | | 36,185 | |
Trustee fees | | | 20,470 | |
Other expenses | | | 117,008 | |
| | | | |
Total Expenses | | | 12,269,598 | |
Less: | | | | |
Expenses reimbursed by investment advisor (Note 3) | | | (605,554 | ) |
| | | | |
Net Expenses | | | 11,664,044 | |
| | | | |
Net Investment Loss | | $ | (8,428,889 | ) |
| | | | |
16 Certified Semi-Annual Report
STATEMENT OF OPERATIONS, CONTINUED
| | |
| Thornburg Core Growth Fund | | Six Months Ended March 31, 2010 (Unaudited) |
| | | | |
REALIZED AND UNREALIZED GAIN (LOSS) | | | | |
Net realized gain (loss) from: | | | | |
Investments | | $ | 43,083,438 | |
Forward currency contracts (Note 7) | | | (156,415 | ) |
Foreign currency transactions | | | (85,472 | ) |
| | | | |
| | | 42,841,551 | |
| | | | |
Net change in unrealized appreciation (depreciation) on: | | | | |
Investments | | | 55,665,382 | |
Forward currency contracts (Note 7) | | | 43,193 | |
Foreign currency translations | | | (1,520 | ) |
| | | | |
| | | 55,707,055 | |
| | | | |
Net Realized and Unrealized Gain | | | 98,548,606 | |
| | | | |
Net Increase in Net Assets Resulting From Operations | | $ | 90,119,717 | |
| | | | |
See notes to financial statements.
Certified Semi-Annual Report 17
STATEMENTS OF CHANGES IN NET ASSETS
Thornburg Core Growth Fund
| | | | | | | | |
| | | Six Months Ended
March 31, 2010* | | | Year Ended
September 30, 2009 | |
INCREASE (DECREASE) IN NET ASSETS FROM: | | | | | | | | |
| | |
OPERATIONS: | | | | | | | | |
Net investment income (loss) | | $ | (8,428,889 | ) | | $ | (11,089,808 | ) |
Net realized gain (loss) on investments, forward currency contracts, and foreign currency transactions | | | 42,841,551 | | | | (722,672,084 | ) |
Increase (decrease) in unrealized appreciation (depreciation) on investments, forward currency contracts, and foreign currency translation | | | 55,707,055 | | | | 640,445,502 | |
| | | | | | | | |
| | |
Net Increase (Decrease) in Net Assets Resulting from Operations | | | 90,119,717 | | | | (93,316,390 | ) |
| | |
DIVIDENDS TO SHAREHOLDERS: | | | | | | | | |
| | |
FUND SHARE TRANSACTIONS (NOTE 4): | | | | | | | | |
Class A Shares | | | (47,874,499 | ) | | | (181,036,761 | ) |
Class C Shares | | | (30,644,813 | ) | | | (73,693,439 | ) |
Class I Shares | | | (21,455,968 | ) | | | (97,505,210 | ) |
Class R3 Shares | | | (5,500,397 | ) | | | (10,832,300 | ) |
Class R4 Shares | | | 783,876 | | | | 8,821,947 | |
Class R5 Shares | | | (3,561,378 | ) | | | 66,956,015 | |
| | | | | | | | |
| | |
Net Decrease in Net Assets | | | (18,133,462 | ) | | | (380,606,138 | ) |
| | |
NET ASSETS: | | | | | | | | |
Beginning of Period | | | 1,651,304,496 | | | | 2,031,910,634 | |
| | | | | | | | |
| | |
End of Period | | $ | 1,633,171,034 | | | $ | 1,651,304,496 | |
| | | | | | | | |
See notes to financial statements.
18 Certified Semi-Annual Report
NOTES TO FINANCIAL STATEMENTS
| | |
| Thornburg Core Growth Fund | | March 31, 2010 (Unaudited) |
NOTE 1 – ORGANIZATION
Thornburg Core Growth Fund, hereinafter referred to as the “Fund,” is a diversified series of Thornburg Investment Trust (the “Trust”). The Trust was organized as a Massachusetts business trust under a Declaration of Trust dated June 3, 1987 and is registered as a diversified, open-end management investment company under the Investment Company Act of 1940, as amended. The Fund is currently one of sixteen separate series of the Trust. Each series is considered to be a separate entity for financial reporting and tax purposes and bears expenses directly attributable to it. The Fund seeks long-term capital appreciation by investing in equity securities selected for their growth potential.
The Fund currently offers six classes of shares of beneficial interest: Class A, Class C, Institutional Class (Class I), and Retirement Classes (Class R3, Class R4, and Class R5) shares. Each class of shares of the Fund represents an interest in the same portfolio of investments, except that (i) Class A shares are sold subject to a front-end sales charge collected at the time the shares are purchased and bear a service fee, (ii) Class C shares are sold at net asset value without a sales charge at the time of purchase, but are subject to a contingent deferred sales charge upon redemption within one year of purchase, and bear both a service fee and a distribution fee, (iii) Class I shares are sold at net asset value without a sales charge at the time of purchase, (iv) Class R3 shares are sold at net asset value without a sales charge at the time of purchase, but bear both a service fee and distribution fee, (v) Class R4 shares are sold at net asset value without sales charge at the time of purchase, but bear a service fee, (vi) Class R5 shares are sold at net asset value without a sales charge at the time of purchase, and (vii) the respective classes may have different reinvestment privileges and conversion rights. Additionally, the Fund may allocate among its classes certain expenses, to the extent allowable to specific classes, including transfer agent fees, government registration fees, certain printing and postage costs, and administrative and legal expenses. Currently, class specific expenses of the Fund are limited to service and distribution fees, administration fees, and certain registration and transfer agent expenses.
NOTE 2 – SIGNIFICANT ACCOUNTING POLICIES
Significant accounting policies of the Trust are as follows:
Valuation of Investments: Portfolio securities listed or traded on a national securities exchange are valued on the valuation date at the last reported sale price on the exchange that is the primary market for the security. Portfolio securities traded on an exchange for which there has been no sale that day and other equity securities traded in the over-the-counter market are valued at the mean between the last reported bid and asked prices. Portfolio securities reported by NASDAQ are valued at the NASDAQ official closing price. Any foreign security traded on exchanges outside the United States is valued at the price of the security on the exchange that is normally the security’s primary market, as of the close of that exchange preceding the time of the Fund’s valuation.
Debt obligations held by the Fund have a primary market over the counter and are valued by an independent pricing service approved by the Trustees of the Trust. The pricing service ordinarily values debt obligations at quoted bid prices. When quotations are not available, debt obligations held by the Fund are valued at evaluated prices determined by the pricing service using methods which include consideration of yields or prices of debt obligations of comparable quality, type of issue, coupon, maturity and rating, and indications as to value from dealers and general market conditions. Short-term obligations having remaining maturities of 60 days or less are valued at amortized cost, which approximates market value.
Quotations in foreign currencies for foreign portfolio investments are converted to U.S. dollar equivalents using the foreign exchange quotation in effect at the time of valuation.
In any case where the market value of an equity security held by the Fund is not readily available, the Trust’s valuation and pricing committee determines a fair value for the security using procedures approved by the Trustees, which may include the use of a price obtained from an independent pricing service. The pricing service ordinarily values equity securities in these instances using multi-factor models to adjust market prices based upon various inputs, including exchange data, depository receipt prices, futures and index data and other data. A security’s market value is deemed not readily available whenever the exchange or market on which the security is primarily traded is closed for the entire scheduled day of trading. Additionally, a security’s market value may be deemed not readily available under other circumstances identified by the Trustees, including when developments occurring after the most recent close of the security’s primary exchange or market, but before the most recent close of trading in Fund shares, create a serious question about the reliability of the security’s market value.
Certified Semi-Annual Report 19
NOTES TO FINANCIAL STATEMENTS, CONTINUED
| | |
| Thornburg Core Growth Fund | | March 31, 2010 (Unaudited) |
In any case where a pricing service fails to provide a price for a debt obligation held by the Fund, the valuation and pricing committee determines a fair value for the debt obligation using procedures approved by the Trustees. Additionally, in any case where management believes that a price provided by a pricing service for a debt obligation held by the Fund may be unreliable, the valuation and pricing committee decides whether or not to use the pricing service’s valuation or to determine a fair value for the debt obligation.
In determining fair value for any portfolio security or other investment, the valuation and pricing committee seeks to determine the amount that an owner of the investment might reasonably expect to receive upon a sale of the investment. However, because fair value prices are estimated prices, the valuation and pricing committee’s determination of fair value for an investment may differ from the value that would be realized by the Fund upon a sale of the investment, and that difference could be material to the Fund’s financial statements. The valuation and pricing committee’s determination of fair value for an investment may also differ from the prices obtained by other persons (including other mutual funds) for the investment.
Valuation Measurements: Various inputs are used in determining the value of the Fund’s investments. These inputs are summarized in the three levels listed below.
Level 1: Quoted prices in active markets for identical investments.
Level 2: Other significant observable inputs (including quoted prices for similar investments, interest rates, prepayment rates, credit risk, etc.).
Level 3: Significant unobservable inputs (including the Fund’s own assumptions in determining the fair value of investments).
The following table displays a summary of the inputs used to value the Fund’s net assets as of March 31, 2010. In any instance when valuation inputs from more than one level are used to determine the fair value of a specific investment, the investment is placed in the level of the table based upon the lowest level input that is significant in determining the fair value of the investment:
| | | | | | | | | | | | |
| | | Fair Value Measurements at March 31, 2010 |
| | | Total | | Level 1 | | Level 2 | | Level 3 |
Assets | | | | | | | | | | | | |
Investments in Securities* | | | | | | | | | | | | |
Common Stock | | $ | 1,572,281,825 | | $ | 1,572,281,825 | | $ | — | | $ | — |
Short Term Investments | | | 67,880,000 | | | — | | | 67,880,000 | | | — |
| | | | | | | | | | | | |
Total Investments in Securities | | $ | 1,640,161,825 | | $ | 1,572,281,825 | | $ | 67,880,000 | | $ | — |
| * | See Schedule of Investments for a summary of the industry exposure as grouped according to the Global Industry Classification Standard (GICS), which is an industry taxonomy developed by Morgan Stanley Capital International (MSCI), and Standard & Poor’s (S&P). |
Foreign Currency Translation: Portfolio securities and other assets and liabilities denominated in foreign currencies are translated into U.S. dollars based on the exchange rate of such currencies against the U.S. dollar on the date of valuation. Purchases and sales of securities and income items denominated in foreign currencies are translated into U.S. dollars at the exchange rate in effect on the translation date. When the Fund purchases or sells foreign securities it will customarily enter into a foreign exchange contract to minimize foreign exchange risk from the trade date to the settlement date of such transactions.
The Fund does not separately report the effect of changes in foreign exchange rates from changes in market prices on securities held. Such changes are included in net realized and unrealized gain or loss from investments.
Reported net realized foreign exchange gains or losses arise from sales of foreign currencies, currency gains or losses realized between the trade and settlement dates on securities transactions and the difference between the amounts of dividends, interest, and foreign withholding taxes recorded on the Fund’s books, and the U.S. dollar equivalent of the amounts actually received or paid.
Net unrealized foreign exchange gains and losses arise from changes in the fair value of assets and liabilities, other than investments in securities at fiscal period end, resulting from changes in exchange rates.
20 Certified Semi-Annual Report
NOTES TO FINANCIAL STATEMENTS, CONTINUED
| | |
| Thornburg Core Growth Fund | | March 31, 2010 (Unaudited) |
Deferred Taxes: The Fund is subject to a tax imposed on net realized gains of securities of certain foreign issuers. The Fund records an estimated deferred tax liability for net unrealized gains on these securities as reflected in the accompanying financial statements.
Federal Income Taxes: It is the policy of the Trust to comply with the provisions of the Internal Revenue Code applicable to “regulated investment companies” and to distribute to shareholders substantially all taxable income, including any net realized gain on investments of the Fund. Therefore, no provision for federal income taxes is required.
When-Issued and Delayed Delivery Transactions: The Fund may engage in when-issued or delayed delivery transactions. To the extent the Fund engages in such transactions, it will do so for the purpose of acquiring portfolio securities consistent with the Fund’s investment objectives and not for the purpose of investment leverage or to speculate on interest rate and/or market changes. At the time the Fund makes a commitment to purchase a security on a when-issued or delayed delivery basis, the Fund will record the transaction and reflect the value in determining its net asset value. When effecting such transactions, assets of an amount sufficient to make payment for the portfolio securities to be purchased will be segregated on the Fund’s records on the trade date. Securities purchased on a when-issued or delayed delivery basis do not earn interest until the settlement date.
Dividends: Dividends to shareholders are generally paid quarterly and are reinvested in additional shares of the Fund at net asset value per share at the close of business on the dividend payment date or, at the shareholder’s option, paid in cash. Net realized capital gains, to the extent available, will be distributed at least annually. Distributions to shareholders are based on income tax regulations and therefore, their characteristics may differ for financial statement and tax purposes.
General: Securities transactions are accounted for on a trade date basis. Interest income is accrued as earned and dividend income is recorded on the ex-dividend date. Certain income from foreign securities is recognized as soon as information is available to the Fund. Realized gains and losses from the sale of securities are recorded on an identified cost basis. Net investment income (other than class specific expenses) and realized and unrealized gains and losses are allocated daily to each class of shares based upon the relative net asset value of outstanding shares of each class of shares at the beginning of the day (after adjusting for the current share activity of the respective class). Expenses common to all funds are allocated among the funds comprising the Trust based upon their relative net asset values or other appropriate allocation methods.
Guarantees and Indemnifications: Under the Trust’s organizational documents, its officers and Trustees are indemnified against certain liabilities arising out of the performance of their duties to the Fund. Additionally, in the normal course of business the Trust enters into contracts with service providers that contain general indemnification clauses. The Trust’s maximum exposure under these arrangements is unknown. However, based on experience, the Trust expects the risk of loss to be remote.
Use of Estimates: The preparation of financial statements, in conformity with generally accepted accounting principles, requires management to make estimates and assumptions that affect the reported amounts of assets and liabilities and the disclosure of contingent assets and liabilities at the date of the financial statements and the reported amounts of increases and decreases in net assets from operations during the reporting period. Actual results could differ from those estimates.
NOTE 3 – INVESTMENT ADVISORY FEE AND OTHER TRANSACTIONS WITH AFFILIATES
Pursuant to an investment advisory agreement, Thornburg Investment Management, Inc. (the “Advisor”) serves as the investment advisor and performs services to the Fund for which the fees are payable at the end of each month. For the six months ended March 31, 2010, these fees were payable at annual rates ranging from .875 of 1% to .675 of 1% per annum of the average daily net assets of the Fund depending on the Fund’s asset size. The Trust also has entered into administrative services agreements with the Advisor, whereby the Advisor will perform certain administrative services for the shareholders of each class of the Fund’s shares, and for which fees will be payable at an annual rate of up to .125 of 1% per annum of the average daily net assets attributable to each class of shares. For the six months ended March 31, 2010, the Advisor voluntarily or contractually agreed to reimburse certain class specific expenses, administrative fees, and distribution fees of $61,740 for Class I shares, $283,593 for Class R3 shares, $29,905 for Class R4 shares, and $230,316 for Class R5 shares.
The Trust has an underwriting agreement with Thornburg Securities Corporation (the “Distributor,” an affiliate of the Advisor), which acts as the distributor of the Fund’s shares. For the six months ended March 31, 2010, the Distributor has advised the Fund that it earned commissions aggregating $16,306 from the sale of Class A shares, and collected contingent deferred sales charges aggregating $8,007 from redemptions of Class C shares of the Fund.
Certified Semi-Annual Report 21
NOTES TO FINANCIAL STATEMENTS, CONTINUED
| | |
| Thornburg Core Growth Fund | | March 31, 2010 (Unaudited) |
Pursuant to a service plan under Rule 12b-1 of the Investment Company Act of 1940, the Fund may reimburse to the Advisor an amount not to exceed .25 of 1% per annum of the average daily net assets attributable to each class of shares of the Fund for payments made by the Advisor to securities dealers and other financial institutions to obtain various shareholder and distribution related services. The Advisor may pay out of its own resources additional expenses for distribution of the Fund’s shares.
The Trust has also adopted distribution plans pursuant to Rule 12b-1, applicable only to the Fund’s Class C and Class R3 shares, under which the Fund compensates the Distributor for services in promoting the sale of Class C and Class R3 shares of the Fund at an annual rate of up to .75 of 1% per annum of the average daily net assets attributable to Class C and Class R3 shares. Total fees incurred by the Distributor for each class of shares of the Fund under their respective Service and Distribution Plans for the six months ended March 31, 2010, are set forth in the Statement of Operations.
The Trust has an agreement with the custodian bank to indirectly pay a portion of the custodian’s fees through credits earned by the Fund’s cash on deposit with the bank. This deposit agreement is an alternative to overnight investments. Custodial fees have been adjusted to reflect amounts that would have been paid without this agreement, with a corresponding adjustment reflected as fees paid indirectly in the Statement of Operations. For the six months ended March 31, 2010, there were no fees paid indirectly.
Certain officers and Trustees of the Trust are also officers and/or directors of the Advisor and Distributor. The compensation of independent Trustees is borne by the Trust.
NOTE 4 – SHARES OF BENEFICIAL INTEREST
At March 31, 2010, there were an unlimited number of shares of beneficial interest authorized. Transactions in shares of beneficial interest were as follows:
| | | | | | | | | | | | | | |
| | | Six Months Ended
March 31, 2010 (Unaudited) | | | Year Ended
September 30, 2009 (Audited) | |
| | | Shares | | | Amount | | | Shares | | | Amount | |
Class A Shares | | | | | | | | | | | | | | |
Shares sold | | 2,492,259 | | | $ | 34,559,732 | | | 9,126,775 | | | $ | 96,741,227 | |
Shares issued to shareholders in reinvestment of dividends | | — | | | | — | | | — | | | | — | |
Shares repurchased | | (5,966,651 | ) | | | (82,434,671 | ) | | (26,846,401 | ) | | | (277,785,984 | ) |
Redemption fees received* | | — | | | | 440 | | | — | | | | 7,996 | |
| | | | | | | | | | | | | | |
| | | | |
Net Increase (Decrease) | | (3,474,392 | ) | | $ | (47,874,499 | ) | | (17,719,626 | ) | | $ | (181,036,761 | ) |
| | | | | | | | | | | | | | |
| | | | |
Class C Shares | | | | | | | | | | | | | | |
Shares sold | | 628,998 | | | $ | 8,053,963 | | | 2,808,141 | | | $ | 28,136,349 | |
Shares issued to shareholders in reinvestment of dividends | | — | | | | — | | | — | | | | — | |
Shares repurchased | | (3,009,576 | ) | | | (38,699,024 | ) | | (10,711,900 | ) | | | (101,834,215 | ) |
Redemption fees received* | | — | | | | 248 | | | — | | | | 4,427 | |
| | | | | | | | | | | | | | |
| | | | |
Net Increase (Decrease) | | (2,380,578 | ) | | $ | (30,644,813 | ) | | (7,903,759 | ) | | $ | (73,693,439 | ) |
| | | | | | | | | | | | | | |
22 Certified Semi-Annual Report
NOTES TO FINANCIAL STATEMENTS, CONTINUED
| | |
| Thornburg Core Growth Fund | | March 31, 2010 (Unaudited) |
| | | | | | | | | | | | | | |
| | | Six Months Ended
March 31, 2010 (Unaudited) | | | Year Ended
September 30, 2009 (Audited) | |
| | | Shares | | | Amount | | | Shares | | | Amount | |
Class I Shares | | | | | | | | | | | | | | |
Shares sold | | 1,651,285 | | | $ | 23,637,393 | | | 4,198,353 | | | $ | 47,389,356 | |
Shares issued to shareholders in reinvestment of dividends | | — | | | | — | | | — | | | | — | |
Shares repurchased | | (3,162,006 | ) | | | (45,093,550 | ) | | (13,922,964 | ) | | | (144,898,258 | ) |
Redemption fees received* | | — | | | | 189 | | | — | | | | 3,692 | |
| | | | | | | | | | | | | | |
| | | | |
Net Increase (Decrease) | | (1,510,721 | ) | | $ | (21,455,968 | ) | | (9,724,611 | ) | | $ | (97,505,210 | ) |
| | | | | | | | | | | | | | |
| | | | |
Class R3 Shares | | | | | | | | | | | | | | |
Shares sold | | 2,461,195 | | | $ | 34,111,401 | | | 6,870,209 | | | $ | 74,934,313 | |
Shares issued to shareholders in reinvestment of dividends | | — | | | | — | | | — | | | | — | |
Shares repurchased | | (2,865,379 | ) | | | (39,612,047 | ) | | (8,069,388 | ) | | | (85,770,165 | ) |
Redemption fees received* | | — | | | | 249 | | | — | | | | 3,552 | |
| | | | | | | | | | | | | | |
| | | | |
Net Increase (Decrease) | | (404,184 | ) | | $ | (5,500,397 | ) | | (1,199,179 | ) | | $ | (10,832,300 | ) |
| | | | | | | | | | | | | | |
| | | | |
Class R4 Shares | | | | | | | | | | | | | | |
Shares sold | | 328,493 | | | $ | 4,558,464 | | | 1,420,248 | | | $ | 16,469,736 | |
Shares issued to shareholders in reinvestment of dividends | | — | | | | — | | | — | | | | — | |
Shares repurchased | | (275,049 | ) | | | (3,774,616 | ) | | (729,912 | ) | | | (7,648,053 | ) |
Redemption fees received* | | — | | | | 28 | | | — | | | | 264 | |
| | | | | | | | | | | | | | |
| | | | |
Net Increase (Decrease) | | 53,444 | | | $ | 783,876 | | | 690,336 | | | $ | 8,821,947 | |
| | | | | | | | | | | | | | |
| | | | |
Class R5 Shares | | | | | | | | | | | | | | |
Shares sold | | 2,355,213 | | | $ | 33,686,550 | | | 14,249,535 | | | $ | 178,677,744 | |
Shares issued to shareholders in reinvestment of dividends | | — | | | | — | | | — | | | | — | |
Shares repurchased | | (2,611,859 | ) | | | (37,248,215 | ) | | (9,543,854 | ) | | | (111,724,983 | ) |
Redemption fees received* | | — | | | | 287 | | | — | | | | 3,254 | |
| | | | | | | | | | | | | | |
| | | | |
Net Increase (Decrease) | | (256,646 | ) | | $ | (3,561,378 | ) | | 4,705,681 | | | $ | 66,956,015 | |
| | | | | | | | | | | | | | |
| * | The Fund charges a redemption fee of 1% of the Class A and Class I shares redeemed or exchanged within 30 days of purchase. Redemption fees charged to any class are allocated to all classes upon receipt of payment based on relative net asset values of each class or other appropriate allocation methods. |
NOTE 5 – SECURITIES TRANSACTIONS
For the six months ended March 31, 2010, the Fund had purchase and sale transactions of investment securities (excluding short-term investments) of $398,330,749 and $531,707,214, respectively.
Certified Semi-Annual Report 23
NOTES TO FINANCIAL STATEMENTS, CONTINUED
| | |
| Thornburg Core Growth Fund | | March 31, 2010 (Unaudited) |
NOTE 6 – INCOME TAXES
At March 31, 2010, information on the tax components of capital is as follows:
| | | | |
Cost of investments for tax purposes | | $ | 1,325,906,015 | |
| | | | |
Gross unrealized appreciation on a tax basis | | $ | 372,240,872 | |
Gross unrealized depreciation on a tax basis | | | (57,985,062 | ) |
| | | | |
Net unrealized appreciation (depreciation) on investments (tax basis) | | $ | 314,255,810 | |
| | | | |
At March 31, 2010, the Fund had deferred tax basis currency and capital losses occurring subsequent to October 31, 2008 of $102,236 and $363,580,663, respectively. For tax purposes, such losses will be reflected in the year ending September 30, 2010.
At March 31, 2010, the Fund had tax basis capital losses, which may be carried forward to offset future capital gains. To the extent such carryforwards are used, capital gain distributions may be reduced to the extent provided by regulations.
Such capital loss carryforwards expire as follows:
| | | |
2016 | | $ | 10,083,359 |
2017 | | | 650,071,235 |
| | | |
| |
| | $ | 660,154,594 |
| | | |
NOTE 7 – DERIVATIVE FINANCIAL INSTRUMENTS WITH OFF-BALANCE SHEET RISK AND FOREIGN INVESTMENT RISK
The Fund may use a variety of derivative financial instruments to hedge or adjust the risks affecting its investment portfolio or to enhance investment returns. Provisions of FASB Accounting Standards Codification ASC 815-10-50, (“ASC 815”) require certain disclosures. The new requirement amends and expands disclosures related to derivative instruments to provide users of financial statements with an enhanced understanding of the use of derivative instruments by the Fund and how these derivatives affect the financial position, financial performance and cash flows of the Fund. The Fund does not designate any derivative instruments as hedging instruments under ASC 815. During the six months ended March 31, 2010, the Fund’s principal exposure to derivative financial instruments of the type addressed by ASC 815 was investment in foreign exchange contracts. A foreign exchange contract is an agreement between two parties to exchange different currencies at a specified rate of exchange at an agreed upon future date. Foreign exchange contracts involve risks to the Fund, including the risk that a contract counterparty will not meet its obligations to the Fund, the risk that a change in a contract’s value may not correlate perfectly with the currency the contract was intended to track, and the risk that the Fund’s advisor is unable to correctly implement its strategy in using a contract. In any such instance, the Fund may not achieve the intended benefit of entering into a contract, and may experience a loss.
The Fund entered into forward currency contracts during the six months ended March 31, 2010 in the normal course of pursuing its investment objectives, in anticipation of purchasing foreign investments or with the intent of reducing the risk to the value of the Fund’s foreign investments from adverse changes in the relationship between the U.S. dollar and foreign currencies. In each case these contracts have been initiated in conjunction with foreign investment transactions.
These contracts are accounted for by the Fund under ASC 815. Unrealized gains and unrealized losses on outstanding contracts are reported in the Fund’s Statement of Assets and Liabilities at the Fund’s net equity, as measured by the difference between the forward exchange rates at the reporting date and the forward exchange rates at each contract’s inception date. Net realized gain (loss) on contracts closed during the period, and changes in net unrealized appreciation (depreciation) on outstanding contracts are recognized in the Fund’s Statement of Operations.
24 Certified Semi-Annual Report
NOTES TO FINANCIAL STATEMENTS, CONTINUED
| | |
| Thornburg Core Growth Fund | | March 31, 2010 (Unaudited) |
There were no outstanding forward currency contracts in the Fund’s Statement of Assets and Liabilities at March 31, 2010.
The realized gains (losses) from forward currency contracts, and the change in unrealized appreciation (depreciation) of outstanding forward currency contracts recognized in the Fund’s Statement of Operations for the six months ended March 31, 2010 is disclosed in the following tables:
Amount of Realized Gain (Loss) on Derivative
Financial Instruments Recognized in Income for the
Six Months Ended March 31, 2010
| | | | | | | | |
| | | Total | | | Forward
Currency
Contracts | |
Foreign exchange contracts | | $ | (156,415 | ) | | $ | (156,415 | ) |
Change in Unrealized Appreciation (Depreciation)
of Derivative Financial Instruments Recognized in
Income for the Six Months Ended March 31, 2010
| | | | | | |
| | | Total | | Forward
Currency
Contracts |
Foreign exchange contracts | | $ | 43,193 | | $ | 43,193 |
OTHER NOTES
Fund management believes no events have occurred between March 31, 2010 and May 20, 2010, the date of issuance of the financial statements, that require adjustment of, or disclosure in, the accompanying financial statements.
Certified Semi-Annual Report 25
FINANCIAL HIGHLIGHTS
Thornburg Core Growth Fund
| | | | | | | | | | | | | | | | | | | | | | | | | | | | | | | | | | | | | | | | | | | |
| | | PER SHARE PERFORMANCE (for a share outstanding throughout the period)+ | | RATIOS TO AVERAGE NET ASSETS | | | SUPPLEMENTAL DATA |
Unless
Otherwise
Noted, Periods are Fiscal Years Ended Sept. 30, | | Net Asset
Value
Beginning
of
Period | | Net
Investment
Income
(Loss) | | | Net
Realized
&
Unrealized
Gain (Loss)
on
Investments | | | Total from
Investment
Operations | | | Dividends
from Net
Investment
Income | | Dividends
from Net
Realized
Gains | | | Total
Dividends | | | Net
Asset
Value
End
of
Period | | Net
Investment
Income
(Loss)
(%) | | | Expenses,
After
Expense
Reductions
(%) | | | Expenses,
After
Expense
Reductions
and
Net of
Custody
Credits
(%) | | | Expenses,
Before
Expense
Reductions
(%) | | | Total
Return
(%)(a) | | | Portfolio
Turnover
Rate (%) | | Net Assets
at End of
Period
(Thousands) |
Class A Shares | | | | | | | | | | | | | | | | | | | | | | | | | | | | | | | | | | | | | | | | | | | |
2010(b)(c) | | $ | 13.61 | | (0.07 | ) | | 0.86 | | | 0.79 | | | — | | — | | | — | | | $ | 14.40 | | (1.06 | )(d) | | 1.46 | (d) | | 1.46 | (d) | | 1.46 | (d) | | 5.80 | | | 26.34 | | $ | 490,398 |
2009(c) | | $ | 13.36 | | (0.09 | ) | | 0.34 | | | 0.25 | | | — | | — | | | — | | | $ | 13.61 | | (0.81 | ) | | 1.48 | | | 1.48 | | | 1.49 | | | 1.87 | | | 82.86 | | $ | 511,065 |
2008(c) | | $ | 20.72 | | (0.10 | ) | | (7.25 | ) | | (7.35 | ) | | — | | (0.01 | ) | | (0.01 | ) | | $ | 13.36 | | (0.58 | ) | | 1.38 | | | 1.38 | | | 1.38 | | | (35.48 | ) | | 79.73 | | $ | 738,457 |
2007(c) | | $ | 16.38 | | (0.15 | ) | | 4.49 | | | 4.34 | | | — | | — | | | — | | | $ | 20.72 | | (0.78 | ) | | 1.37 | | | 1.36 | | | 1.37 | | | 26.50 | | | 82.37 | | $ | 1,470,020 |
2006(c) | | $ | 14.21 | | (0.13 | ) | | 2.54 | | | 2.41 | | | — | | (0.24 | ) | | (0.24 | ) | | $ | 16.38 | | (0.86 | ) | | 1.48 | | | 1.46 | | | 1.48 | | | 17.20 | | | 98.00 | | $ | 502,345 |
2005(c) | | $ | 10.87 | | (0.14 | ) | | 3.48 | | | 3.34 | | | — | | — | | | — | | | $ | 14.21 | | (1.14 | ) | | 1.60 | | | 1.57 | | | 1.60 | | | 30.73 | | | 115.37 | | $ | 110,836 |
Class C Shares | | | | | | | | | | | | | | | | | | | | | | | | | | | | | | | | | | | | | | | | | | | |
2010(b) | | $ | 12.66 | | (0.12 | ) | | 0.80 | | | 0.68 | | | — | | — | | | — | | | $ | 13.34 | | (1.82 | )(d) | | 2.22 | (d) | | 2.22 | (d) | | 2.22 | (d) | | 5.37 | | | 26.34 | | $ | 272,924 |
2009 | | $ | 12.53 | | (0.16 | ) | | 0.29 | | | 0.13 | | | — | | — | | | — | | | $ | 12.66 | | (1.59 | ) | | 2.26 | | | 2.26 | | | 2.26 | | | 1.04 | | | 82.86 | | $ | 289,224 |
2008 | | $ | 19.57 | | (0.22 | ) | | (6.81 | ) | | (7.03 | ) | | — | | (0.01 | ) | | (0.01 | ) | | $ | 12.53 | | (1.34 | ) | | 2.13 | | | 2.13 | | | 2.13 | | | (35.93 | ) | | 79.73 | | $ | 385,110 |
2007 | | $ | 15.59 | | (0.28 | ) | | 4.26 | | | 3.98 | | | — | | — | | | — | | | $ | 19.57 | | (1.53 | ) | | 2.12 | | | 2.11 | | | 2.12 | | | 25.53 | | | 82.37 | | $ | 664,252 |
2006 | | $ | 13.63 | | (0.23 | ) | | 2.43 | | | 2.20 | | | — | | (0.24 | ) | | (0.24 | ) | | $ | 15.59 | | (1.63 | ) | | 2.25 | | | 2.23 | | | 2.25 | | | 16.38 | | | 98.00 | | $ | 187,180 |
2005 | | $ | 10.51 | | (0.23 | ) | | 3.35 | | | 3.12 | | | — | | — | | | — | | | $ | 13.63 | | (1.91 | ) | | 2.37 | | | 2.34 | | | 2.37 | | | 29.69 | | | 115.37 | | $ | 41,737 |
Class I Shares | | | | | | | | | | | | | | | | | | | | | | | | | | | | | | | | | | | | | | | | | | | |
2010(b) | | $ | 14.04 | | (0.04 | ) | | 0.88 | | | 0.84 | | | — | | — | | | — | | | $ | 14.88 | | (0.59 | )(d) | | 0.99 | (d) | | 0.99 | (d) | | 1.05 | (d) | | 5.98 | | | 26.34 | | $ | 208,904 |
2009 | | $ | 13.71 | | (0.03 | ) | | 0.36 | | | 0.33 | | | — | | — | | | — | | | $ | 14.04 | | (0.29 | ) | | 0.97 | | | 0.97 | | | 1.08 | | | 2.41 | | | 82.86 | | $ | 218,300 |
2008 | | $ | 21.16 | | (0.03 | ) | | (7.41 | ) | | (7.44 | ) | | — | | (0.01 | ) | | (0.01 | ) | | $ | 13.71 | | (0.17 | ) | | 0.96 | | | 0.96 | | | 0.96 | | | (35.17 | ) | | 79.73 | | $ | 346,497 |
2007 | | $ | 16.66 | | (0.08 | ) | | 4.58 | | | 4.50 | | | — | | — | | | — | | | $ | 21.16 | | (0.39 | ) | | 0.98 | | | 0.97 | | | 0.98 | | | 27.01 | | | 82.37 | | $ | 642,143 |
2006 | | $ | 14.37 | | (0.05 | ) | | 2.58 | | | 2.53 | | | — | | (0.24 | ) | | (0.24 | ) | | $ | 16.66 | | (0.40 | ) | | 1.01 | | | 0.99 | | | 1.10 | | | 17.85 | | | 98.00 | | $ | 188,422 |
2005 | | $ | 10.93 | | (0.07 | ) | | 3.51 | | | 3.44 | | | — | | — | | | — | | | $ | 14.37 | | (0.55 | ) | | 1.02 | | | 0.99 | | | 1.15 | | | 31.47 | | | 115.37 | | $ | 49,975 |
Class R3 Shares | | | | | | | | | | | | | | | | | | | | | | | | | | | | | | | | | | | | | | | | | | | |
2010(b) | | $ | 13.62 | | (0.08 | ) | | 0.86 | | | 0.78 | | | — | | — | | | — | | | $ | 14.40 | | (1.10 | )(d) | | 1.50 | (d) | | 1.50 | (d) | | 1.70 | (d) | | 5.73 | | | 26.34 | | $ | 288,697 |
2009 | | $ | 13.37 | | (0.09 | ) | | 0.34 | | | 0.25 | | | — | | — | | | — | | | $ | 13.62 | | (0.84 | ) | | 1.49 | | | 1.49 | | | 1.76 | | | 1.87 | | | 82.86 | | $ | 278,576 |
2008 | | $ | 20.75 | | (0.13 | ) | | (7.24 | ) | | (7.37 | ) | | — | | (0.01 | ) | | (0.01 | ) | | $ | 13.37 | | (0.74 | ) | | 1.50 | | | 1.50 | | | 1.72 | | | (35.53 | ) | | 79.73 | | $ | 289,500 |
2007 | | $ | 16.43 | | (0.18 | ) | | 4.50 | | | 4.32 | | | — | | — | | | — | | | $ | 20.75 | | (0.91 | ) | | 1.51 | | | 1.50 | | | 1.64 | | | 26.29 | | | 82.37 | | $ | 414,267 |
2006 | | $ | 14.26 | | (0.13 | ) | | 2.54 | | | 2.41 | | | — | | (0.24 | ) | | (0.24 | ) | | $ | 16.43 | | (0.90 | ) | | 1.53 | | | 1.50 | | | 1.73 | | | 17.14 | | | 98.00 | | $ | 90,167 |
2005 | | $ | 10.90 | | (0.14 | ) | | 3.50 | | | 3.36 | | | — | | — | | | — | | | $ | 14.26 | | (1.08 | ) | | 1.52 | | | 1.49 | | | 3.56 | | | 30.83 | | | 115.37 | | $ | 6,345 |
Class R4 Shares | | | | | | | | | | | | | | | | | | | | | | | | | | | | | | | | | | | | | | | | | | | |
2010(b) | | $ | 13.63 | | (0.07 | ) | | 0.86 | | | 0.79 | | | — | | — | | | — | | | $ | 14.42 | | (1.00 | )(d) | | 1.40 | (d) | | 1.40 | (d) | | 1.59 | (d) | | 5.80 | | | 26.34 | | $ | 33,424 |
2009 | | $ | 13.37 | | (0.08 | ) | | 0.34 | | | 0.26 | | | — | | — | | | — | | | $ | 13.63 | | (0.77 | ) | | 1.40 | | | 1.40 | | | 1.83 | | | 1.94 | | | 82.86 | | $ | 30,871 |
2008 | | $ | 20.73 | | (0.13 | ) | | (7.22 | ) | | (7.35 | ) | | — | | (0.01 | ) | | (0.01 | ) | | $ | 13.37 | | (0.78 | ) | | 1.40 | | | 1.40 | | | 1.73 | | | (35.47 | ) | | 79.73 | | $ | 21,047 |
2007(e) | | $ | 18.90 | | (0.12 | ) | | 1.95 | | | 1.83 | | | — | | — | | | — | | | $ | 20.73 | | (0.93 | )(d) | | 1.41 | (d) | | 1.40 | (d) | | 8.74 | (d)(f) | | 9.68 | | | 82.37 | | $ | 3,508 |
Class R5 Shares | | | | | | | | | | | | | | | | | | | | | | | | | | | | | | | | | | | | | | | | | | | |
2010(b) | | $ | 14.02 | | (0.04 | ) | | 0.88 | | | 0.84 | | | — | | — | | | — | | | $ | 14.86 | | (0.59 | )(d) | | 0.99 | (d) | | 0.99 | (d) | | 1.13 | (d) | | 5.99 | | | 26.34 | | $ | 338,824 |
2009 | | $ | 13.70 | | (0.04 | ) | | 0.36 | | | 0.32 | | | — | | — | | | — | | | $ | 14.02 | | (0.34 | ) | | 0.99 | | | 0.99 | | | 1.27 | | | 2.34 | | | 82.86 | | $ | 323,268 |
2008 | | $ | 21.15 | | (0.05 | ) | | (7.39 | ) | | (7.44 | ) | | — | | (0.01 | ) | | (0.01 | ) | | $ | 13.70 | | (0.30 | ) | | 0.99 | | | 0.99 | | | 1.18 | | | (35.19 | ) | | 79.73 | | $ | 251,299 |
2007 | | $ | 16.65 | | (0.07 | ) | | 4.57 | | | 4.50 | | | — | | — | | | — | | | $ | 21.15 | | (0.37 | ) | | 0.95 | | | 0.95 | | | 0.97 | | | 27.03 | | | 82.37 | | $ | 158,084 |
2006(g) | | $ | 14.43 | | (0.05 | ) | | 2.51 | | | 2.46 | | | — | | (0.24 | ) | | (0.24 | ) | | $ | 16.65 | | (0.38 | )(d) | | 1.01 | (d) | | 0.99 | (d) | | 176.54 | (d)(f) | | 17.29 | | | 98.00 | | $ | 45 |
| (a) | Not annualized for periods less than one year. |
| (b) | Unaudited Six Month Period Ended March 31. |
| (c) | Sales loads are not reflected in computing total return. |
| (e) | Effective date of this class of shares was February 1, 2007. |
| (f) | Due to the size of net assets and fixed expenses, ratios may appear disproportionate. |
| (g) | Effective date of this class of shares was October 3, 2005. |
| + | Based on weighted average shares outstanding. |
See notes to financial statements.
| | |
| 26 Certified Semi-Annual Report | | Certified Semi-Annual Report 27 |
EXPENSE EXAMPLE
| | |
| Thornburg Core Growth Fund | | March 31, 2010 (Unaudited) |
As a shareholder of the Fund, you incur two types of costs:
| | (1) | transaction costs, including |
(a) sales charges (loads) on purchase payments for Class A shares;
(b) a deferred sales charge on redemptions of any part or all of a purchase of $1 million of Class A shares within 12 months of purchase;
(c) a deferred sales charge on redemptions of Class C shares within 12 months of purchase;
(d) a 30-day redemption fee on Class A and Class I shares;
| | (2) | ongoing costs, including management fees; distribution and/or service (12b-1) fees; and other Fund expenses. |
This example is intended to help you understand your ongoing costs (in dollars) of investing in the Fund and to compare these costs with the ongoing costs of investing in other mutual funds.
The example is based on a $1,000 investment beginning on October 1, 2009, and held until March 31, 2010.
ACTUAL EXPENSES
For each class of shares, the first line of the table at right provides information about actual account values and actual expenses. You may use the information in this line, together with the amount you invested, to estimate the expenses that you paid over the period. Simply divide your account value by $1,000 (for example, an $8,600 account value divided by $1,000 = 8.6), then multiply the result by the number in the first line for your class of shares under the heading entitled “Expenses Paid During Period” to estimate the expenses you paid on your account during this period.
HYPOTHETICAL EXAMPLE FOR COMPARISON PURPOSES
For each class of shares, the second line of the table at right provides information about hypothetical account values and hypothetical expenses based on the Fund’s actual expense ratio and an assumed rate of return of 5% per year before expenses, which is not the Fund’s actual return. The hypothetical account values and expenses may not be used to estimate the actual ending account balance or expenses you paid for the period. You may use this information to compare the ongoing costs of investing in the Fund and other funds. To do so, compare this 5% hypothetical example with the 5% hypothetical examples that appear in the shareholder reports of the other funds.
| | | | | | | | | |
| | | Beginning
Account Value
10/1/09 | | Ending
Account Value
3/31/10 | | Expenses Paid
During Period†
10/1/09–3/31/10 |
Class A Shares | | | | | | | | | |
Actual | | $ | 1,000.00 | | $ | 1,058.00 | | $ | 7.49 |
Hypothetical* | | $ | 1,000.00 | | $ | 1,017.65 | | $ | 7.35 |
Class C Shares | | | | | | | | | |
Actual | | $ | 1,000.00 | | $ | 1,053.70 | | $ | 11.36 |
Hypothetical* | | $ | 1,000.00 | | $ | 1,013.87 | | $ | 11.14 |
Class I Shares | | | | | | | | | |
Actual | | $ | 1,000.00 | | $ | 1,059.80 | | $ | 5.08 |
Hypothetical* | | $ | 1,000.00 | | $ | 1,020.00 | | $ | 4.99 |
Class R3 Shares | | | | | | | | | |
Actual | | $ | 1,000.00 | | $ | 1,057.30 | | $ | 7.69 |
Hypothetical* | | $ | 1,000.00 | | $ | 1,017.45 | | $ | 7.54 |
Class R4 Shares | | | | | | | | | |
Actual | | $ | 1,000.00 | | $ | 1,058.00 | | $ | 7.18 |
Hypothetical* | | $ | 1,000.00 | | $ | 1,017.95 | | $ | 7.04 |
Class R5 Shares | | | | | | | | | |
Actual | | $ | 1,000.00 | | $ | 1,059.90 | | $ | 5.08 |
Hypothetical* | | $ | 1,000.00 | | $ | 1,020.00 | | $ | 4.99 |
| † | Expenses are equal to the annualized expense ratio for each class (A: 1.46%; C: 2.22%; I: 0.99%; R3: 1.50%; R4: 1.40%; R5: 0.99%) multiplied by the average account value over the period, multiplied by 182/365 to reflect the one-half year period. |
| * | Hypothetical assumes a rate of return of 5% per year before expenses. |
Please note that the expenses shown in the table are meant to highlight your ongoing costs only and do not reflect any transactional costs, such as sales charges (loads), redemption fees, or exchange fees. Therefore, the second line of the table for each class of shares is useful in comparing ongoing costs only, and will not help you determine the relative total costs of owning different funds. In addition, if these transactional costs were included, your costs would have been higher.
28 Certified Semi-Annual Report
INDEX COMPARISON
| | |
| Thornburg Core Growth Fund | | March 31, 2010 (Unaudited) |
GROWTH OF A HYPOTHETICAL $10,000 INVESTMENT
Thornburg Core Growth Fund versus Russell 3000 Growth Index (December 27, 2000 to March 31, 2010)
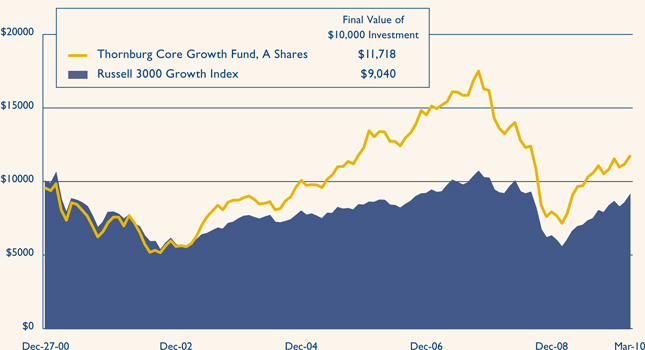
AVERAGE ANNUAL TOTAL RETURNS
For periods ended March 31, 2010 (with sales charge)
| | | | | | | | | |
| | | 1 Yr | | | 5 Yrs | | | Since
Inception | |
A Shares (Incep: 12/27/00) | | 43.00 | % | | 2.75 | % | | 1.73 | % |
C Shares (Incep: 12/27/00) | | 47.55 | % | | 2.92 | % | | 1.40 | % |
I Shares (Incep: 11/1/03) | | 50.45 | % | | 4.20 | % | | 5.30 | % |
R3 Shares (Incep: 7/1/03) | | 49.53 | % | | 3.64 | % | | 6.48 | % |
R4 Shares (Incep: 2/1/07) | | 49.74 | % | | — | | | -8.19 | % |
R5 Shares (Incep: 10/3/05) | | 50.25 | % | | — | | | 1.04 | % |
Russell 3000 Growth Index (Since: 12/27/00) | | 50.50 | % | | 3.46 | % | | -1.08 | % |
The Russell 3000 Growth Index is an unmanaged index comprised of those Russell 3000 companies with higher price-to-book ratios and higher forecasted growth values. Unless otherwise noted, index returns reflect the reinvestment of income dividends and capital gains, if any, but do not reflect fees, brokerage commissions or other expenses of investing. Investors may not make direct investments into any index. The performance of any index is not indicative of the performance of any particular investment.
Performance data reflects past performance, which is no guarantee of future results. The performance data and graph do not reflect the deduction of taxes that a shareholder would pay on distributions or the redemption of Fund shares. Returns reflect the reinvestment of dividends and capital gains as well as applicable sales charges. Class A shares are sold with a maximum sales charge of 4.50%. Class C shares are subject to a 1% contingent deferred sales charge (CDSC) for the first year only. There is no up-front sales charge for Class I, R3, R4, and R5 shares. Class A and I shares are subject to a 1% 30-day redemption fee.
Certified Semi-Annual Report 29
OTHER INFORMATION
| | |
| Thornburg Core Growth Fund | | March 31, 2010 (Unaudited) |
PORTFOLIO PROXY VOTING
Policies and Procedures:
The Trust has delegated to Thornburg Investment Management, Inc. (the “Advisor”) voting decisions respecting proxies for the Fund’s voting securities. The Advisor makes voting decisions in accordance with its Proxy Voting Policy and Procedures. A description of the Policy and Procedures is available (i) without charge, upon request, by calling the Advisor toll-free at 1-800-847-0200, (ii) on the Thornburg web site at www.thornburg.com, and (iii) on the Securities and Exchange Commission’s web site at www.sec.gov.
Information regarding how proxies were voted is available on or before August 31 of each year for the twelve months ending the preceding June 30. This information is available (i) without charge, upon request by calling the Advisor toll-free at 1-800-847-0200, (ii) on the Thornburg web site at www.thornburg.com, and (iii) on the Securities and Exchange Commission’s web site at www.sec.gov.
AVAILABILITY OF QUARTERLY PORTFOLIO SCHEDULE
The Fund files with the Securities and Exchange Commission schedules of its portfolio holdings on Form N-Q for the first and third quarters of each fiscal year. The Fund’s Forms N-Q are available on the Commission’s web site at www.sec.gov, or may be reviewed and copied at the Commission’s Public Reference Room in Washington, D.C. Information on the operation of the Public Reference Room may be obtained by calling 1-800-SEC-0330. The Fund also makes this information available on its web site at www.thornburg. com/download or upon request by calling 1-800-847-0200.
30 Certified Semi-Annual Report
Trustees’ Statement to Shareholders
Not part of the Certified Semi-Annual Report
February 8, 2005, as readopted July 22, 2009
The Trustees are concerned that ongoing commentaries and opinions reported in the media may confuse investors in general as to the supervisory duties of trustees of mutual funds and, in particular, leave Thornburg Investment Trust shareholders uncertain regarding how we discharge our responsibilities in supervising the Funds’ investment advisor and in reviewing the advisor’s contract for renewal. We decided to spell out clearly three principal guidelines that we follow in supervising the Trust’s investment advisor on your behalf.
We begin with the premise that each shareholder selected his or her Fund because its investments are managed by the investment advisor identified in the prospectus and in accordance with the objective and policies described in the prospectus. We realize, as each of you do, that if you believe that your Fund’s stated objective and policies no longer serve your personal investment goals, you can sell your shares and leave the Fund.
Therefore, we believe that our primary supervisory task – our principal obligation to you – is to assess the nature and quality of the advisor’s services, and to confirm that the advisor actively and competently pursues the Fund’s objective, in accordance with the policies set out in the prospectus. To do this, we meet regularly with management to review your Fund’s portfolio and to discuss the advisor’s specific actions and judgments in pursuing the Fund’s objective. We do not substitute our own judgment for the advisor’s decisions in selecting investments; the advisor is paid to exercise its informed judgment on investment decisions, and we seek to confirm, in reviewing the advisor’s performance, that the advisor is doing just that.
Second, while we are conscious of costs and the effect that costs have on shareholders’ returns, we do not seek the lowest fees or expense ratio as our sole or primary objective. We try to make sure that your Fund’s fees and costs are reasonable in relationship to the services rendered and that they are generally in line with those charged by other expert investment advisors, consistent with our belief that the Fund’s investors searched for and expect that expertise and attention and have decided to pay a reasonable price for it. We do not put the management contract “out to bid” as a matter of course, and we would not do so unless we had concluded that the advisor materially had failed to pursue the Fund’s objectives in accordance with its policies, or for other equally important reasons. We believe that any other approach would be inconsistent with your interests and contrary to your expectations when you bought shares of the Fund in the first place.
Finally, because we believe that most Thornburg Fund shareholders have invested with a long-term perspective, we try not to focus too much on the fashions of the moment and on short-term performance. The market will not favor any specific investment objective or set of policies at all times and under all economic circumstances. A fund will experience periods of both high and low returns relative to other funds and other investments. Even if one of our Funds is not favored by the market at a particular time, we believe that the advisor is nonetheless obliged to remain true to the Fund’s objective and policies, and we watch to see that it does so.
This page is not part of the Semi-Annual Report. 31
This page intentionally left blank.
32 This page is not part of the Semi-Annual Report.
Retirement and Education Accounts
Thornburg Investment Management offers retirement and education savings accounts that can help you meet a variety of planning challenges. For account applications or further information on any of the accounts below, please call 1-800-847-0200 or go to www.thornburg.com/ira. Your financial advisor can help you determine which plan is right for you.
Individual Retirement Accounts
Individual Retirement Accounts (IRAs) provide a tax-advantaged means to save money for the future. For a detailed outline of the difference between retirement accounts, see www.thornburg.com/ira. Rollovers are available. Call 1-800-847-0200 for more information.
Traditional IRAs – Contributions to Traditional IRAs are tax deductible for eligible individuals, and withdrawals are taxed as additional ordinary income. You may contribute to an IRA if you receive compensation and are under 70 1/ 2, even if you are covered by an employer retirement plan. Deductible contributions are subject to certain qualifications. Please consult your tax advisor.
Roth IRAs – Under a Roth IRA, there is no tax deduction for contributions, but there is no income tax on qualified withdrawals. For a more detailed comparison of Traditional and Roth IRAs, please see our web site at www.thornburg.com/ira.
SEP IRAs – Simplified Employee Pension (SEP) IRAs are established by employers. The employer is allowed a tax deduction for contributions made to the SEP Plan and makes contributions to each eligible employee’s SEP IRA on a discretionary basis.
SIMPLE IRAs – Savings Incentive Match Plan for Employees of Small Employers (SIMPLE) is designed to give small business owners a simplified method to establish and contribute to a retirement plan for employees. The employer is allowed a tax deduction for contributions and makes either matching or non-elective contributions to each eligible employee’s SIMPLE IRA. Employees may make salary deferral contributions.
Coverdell Education Savings Account
These savings accounts are designed to provide a way to save money for higher education expenses. In an Education Savings Account, earnings and interest grow tax-free, and qualified withdrawals used to pay for eligible higher-education expenses are tax- and penalty-free.
Funds Available
The following funds are available in the accounts listed above:
| | • | | Thornburg International Value Fund |
| | • | | Thornburg Core Growth Fund |
| | • | | Thornburg Investment Income Builder Fund |
| | • | | Thornburg Global Opportunities Fund |
| | • | | Thornburg International Growth Fund |
| | • | | Thornburg Developing World Fund |
| | • | | Thornburg Limited Term U.S. Government Fund |
| | • | | Thornburg Limited Term Income Fund |
| | • | | Thornburg Strategic Income Fund |
This page is not part of the Semi-Annual Report. 33

Thornburg Equity Funds
Thornburg’s equity research uses a fundamental and comprehensive analytical approach. Thornburg equity funds focus on a limited number of securities so that each holding can impact performance. The equity team searches for firms believed to have a promising future and seeks to buy shares of those companies at a discount to their intrinsic value.
| | • | | Thornburg International Value Fund |
| | • | | Thornburg Core Growth Fund |
| | • | | Thornburg Investment Income Builder Fund |
| | • | | Thornburg Global Opportunities Fund |
| | • | | Thornburg International Growth Fund |
| | • | | Thornburg Developing World Fund |
Thornburg Bond Funds
Thornburg Investment Management applies a disciplined philosophy to fixed-income management. Since the launch of our first fixed-income fund over 25 years ago, we have been conducting fundamental, bottom-up research in an effort to identify bonds which we believe provide the best return for a given level of risk. We are very organic in our approach, avoiding leverage or complex strategies which could backfire in periods of market uncertainty.
| | • | | Thornburg Limited Term Municipal Fund |
| | • | | Thornburg Intermediate Municipal Fund |
| | • | | Thornburg California Limited Term Municipal Fund |
| | • | | Thornburg New Mexico Intermediate Municipal Fund |
| | • | | Thornburg New York Intermediate Municipal Fund |
| | • | | Thornburg Strategic Municipal Income Fund |
| | • | | Thornburg Limited Term U.S. Government Fund |
| | • | | Thornburg Limited Term Income Fund |
| | • | | Thornburg Strategic Income Fund |
Before investing, carefully consider the Fund’s investment goals, risks, charges, and expenses. For a prospectus containing this and other information, contact your financial advisor or visit thornburg. com. Read it carefully before investing.
For additional information, please visit www.thornburg.com
Thornburg Investment Management, Inc. 2300 North Ridgetop Road, Santa Fe, NM 87506
This page is not part of the Semi-Annual Report. 35
| | | | | | |
 | | Waste not, Wait not | | 
|
| | Get instant access to your shareholder reports. |
| | This Semi-Annual Report is submitted for the general information of shareholders of the Fund. It is not authorized for distribution to prospective investors in the Fund unless preceded or accompanied by an effective prospectus. | | By switching from your postal mailbox to your email inbox, you reduce paper clutter, improve record keeping access, and help conserve our natural resources. |

| | Investment Advisor: Thornburg Investment Management® 800.847.0200 Distributor: Thornburg Securities Corporation® 800.847.0200 TH180 | | Go to www.thornburg.com/edelivery and sign up to receive your shareholder reports, prospectuses, and proxy statements electronically. You invest in the future, without spending a dime. |

Important Information
The information presented on the following pages was current as of March 31, 2010. The managers’ views, portfolio holdings, and sector and country diversification are provided for the general information of the Fund’s shareholders; they are historical and subject to change. This material should not be deemed a recommendation to buy or sell any of the securities mentioned.
Investments in the Fund carry risks, including possible loss of principal. Special risks may be associated with investments outside the United States, especially in emerging markets, including currency fluctuations, illiquidity and volatility. Investments in small capitalization companies may increase the risk of greater price fluctuations. Please see the Fund’s Prospectus for a discussion of the risks associated with an investment in the Fund. Investments in the Fund are not FDIC insured, nor are they deposits of or guaranteed by a bank or any other entity. There is no guarantee that the Fund will meet its investment objectives. Funds invested in a limited number of holdings may expose an investor to greater volatility.
Performance data given at net asset value (NAV) does not take into account the applicable sales charges. If the sales charges had been included, the performance would have been lower.
Class I, R3, R4, and R5 shares may not be available to all investors. Minimum investments for Class I shares may be higher than those for other classes.
From time to time, the Fund may invest in shares of companies through initial public offerings (IPOs). IPOs have the potential to produce substantial gains for the Fund. There is no assurance that the Fund will have continued access to profitable IPOs and, as the Fund’s assets grow, the impact of IPO investments may decline. Therefore, investors should not rely on these past gains as an indication of future performance.
| | | | |
Share Class | | NASDAQ Symbol | | Cusip |
Class A | | TIGAX | | 885-215-319 |
Class C | | TIGCX | | 885-215-293 |
Class I | | TINGX | | 885-215-244 |
Class R3 | | TIGVX | | 885-215-178 |
Class R4 | | TINVX | | 885-215-160 |
Class R5 | | TINFX | | 885-215-152 |
Glossary
MSCI All Country (AC) World ex-U.S. Growth Index – The Morgan Stanley Capital International All Country World ex-U.S. Growth Index is a market capitalization weighted index which includes growth companies in developed and emerging markets throughout the world, excluding the United States.
Unless otherwise noted, index returns reflect the reinvestment of income dividends and capital gains, if any, but do not reflect fees, brokerage commissions or other expenses of investing. Investors may not make direct investments into any index. The performance of any index is not indicative of the performance of any particular investment.
Basis Point (BPS) – A unit equal to 1/100th of 1%. A 1% change = 100 basis points (bps).
Median Market Capitalization – Market capitalization (market cap) is the total value of a company’s stock, calculated by multiplying the number of outstanding common shares by the current share price. The company whose market cap is in the middle of the portfolio is the median market cap. Half the companies in the portfolio have values greater than the median, and half have values that are less.
Price to Book Value (P/B) – A ratio used to compare a stock’s market value to its book value. It is calculated by dividing the current closing price of the stock by the latest quarter’s book value. Book value is simply assets minus liabilities.
Price to Cash Flow Ratio – A measure of the market’s expectations of a firm’s future financial health. It is calculated by dividing the price per share by cash flow per share.
Price to Earnings Ratio (P/E) – A valuation ratio equaling a company’s market value per share divided by earnings per share.
This page is not part of the Semi-Annual Report. 3
Thornburg International Growth Fund

Alexander M.V. Motola, CFA
IMPORTANT PERFORMANCE INFORMATION
Performance data shown represents past performance and is no guarantee of future results. Investment return and principal value will fluctuate so shares, when redeemed, may be worth more or less than their original cost. Current performance may be lower or higher than quoted. For performance current to the most recent month end, visit thornburg.com.
The maximum sales charge for Class A shares is 4.50%. Class A shares are subject to a 1% 30-day redemption fee. The total annual operating expenses of Class A shares are 1.97%. Thornburg Investment Management and Thornburg Securities Corporation have contractually agreed to waive fees and reimburse expenses through at least February 1, 2011, so that actual expenses do not exceed 1.63%.
Comprehensive International Growth Investing
A major benefit of an interconnected global economy is the ability to tap into a country or region’s comparative advantages. Some countries have abundant natural resources, while others excel at manufacturing or engineering. The ability to allocate capital across borders allows the entire globe to benefit from these advantages. In an effort to capture these opportunities, Thornburg Investment Management launched the Thornburg International Growth Fund in 2007.
The Fund’s process is centered on identifying attractively valued international growth companies from the bottom-up. The management team will leave it to others to make broad-based calls on the direction of the market. Instead, portfolio manager Alex Motola and his team will employ a comprehensive, “go-everywhere” approach to growth investing. The team classifies stocks into various growth baskets: Growth Industry Leaders, Consistent Growers, or Emerging Growth Companies. From those baskets, the team will build a portfolio of 35–50 stocks, which they believe provides the best long-term prospects for investors. While stocks are analyzed on their individual merits, their role as part of a diversified portfolio is also taken into account.
Equity investing, especially disciplines focused on growing companies, can bring volatility. The Thornburg International Growth Fund team recognizes this and strives to balance the aims of generating a strong long-term record while attempting to manage downside volatility. Portfolio construction and geographic diversification provide part of the answer, but fundamental analysis can often play a more important role. While other growth funds limit volatility by diversifying across a large number of names, the team managing the Thornburg
| | | | | | | | | |
| AVERAGE ANNUAL TOTAL RETURNS | |
| FOR PERIODS ENDED 3/31/10 | |
| | | 1 Yr | | | 3 Yr | | | Since
Incep | |
A Shares (Incep: 2/1/07) | | | | | | | | | |
Without sales charge | | 67.38 | % | | -1.35 | % | | 0.44 | % |
With sales charge | | 59.78 | % | | -2.84 | % | | -1.01 | % |
MSCI AC World ex-U.S. Growth Index | | | | | | | | | |
(Since 2/1/07) | | 56.14 | % | | -3.72 | % | | -2.78 | % |
4 This page is not part of the Semi-Annual Report.
International Growth Fund believes that a more robust understanding of a smaller number of portfolio holdings is one of the most effective forms of risk management.
Much of the research process is focused on identifying how the overall market came to price a security. Many of the ideas are sourced through a quantitative screening process of the universe of international companies. Only those with the most appealing growth and valuation characteristics pass on to the step of having a complex financial model built. Thornburg’s growth investment team scours regulatory filings, visits company management, and interviews suppliers and customers. By doing this work, they develop their own view of the intrinsic value of the company. Only if their view is materially higher than the market do they make an investment.
Others may question how the team manages a growth portfolio, especially an international one, from Santa Fe, New Mexico. At Thornburg Investment Management, we embrace our location, away from the ancillary noise of the major money centers. We have access to Wall Street research, but prefer to come to our own conclusions about the value of an investment. The investment process allows the team to take a very broad view of what an attractively valued, international growth company looks like, and invest in those few companies that they believe provide the most attractive risk-reward trade-off. The result is a portfolio which at any given time will look quite unlike the MSCI AC World ex-U.S. Growth Index or the competition. All of this is done with a goal of providing attractive, consistent returns over the long term.
| | |
| STOCKS CONTRIBUTING AND DETRACTING |
| FOR THE SIX MONTHS ENDED 3/31/10 |
| |
Top Contributors | | Top Detractors |
| YOOX S.p.A. | | Actelion Ltd. |
| Seek Ltd. | | Shanda Games Ltd. ADR |
| ARM Holdings plc | | BM&F Bovespa S/A |
| Playtech Ltd. | | Deutsche Börse AG |
| Teva Pharmaceutical | | |
| Industries Ltd. ADR | | AirMedia Group Inc. ADR |
| | | |
KEY PORTFOLIO ATTRIBUTES As of 3/31/10 |
Portfolio P/E Trailing 12-months* | | | 23.4x |
Portfolio Price to Cash Flow* | | | 11.0x |
Portfolio Price to Book Value* | | | 2.7x |
Median Market Cap* | | $ | 6.2 B |
Number of Companies | | | 36 |
| |
* Source: FactSet | | | |
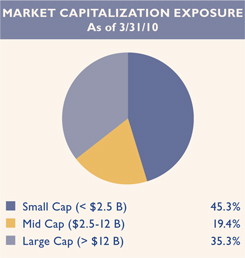
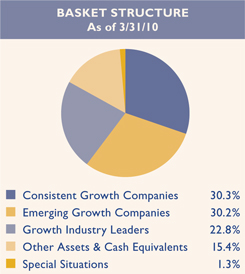
This page is not part of the Semi-Annual Report. 5

Thornburg International Growth Fund
March 31, 2010
This report is certified under the Sarbanes-Oxley Act of 2002, which requires that public companies, including mutual funds, affirm that the information provided in their annual and semiannual shareholder reports fully and fairly represents their financial position.
6 Certified Semi-Annual Report
Letter to Shareholders
| | |
Alexander M.V. Motola, CFA Portfolio Manager | | April 18, 2010 Dear Fellow Shareholder: For the six months ended March 31, 2010, the Thornburg International Growth Fund generated better performance than its benchmark. On September 30, 2009, the net asset value (NAV) for the Class A shares was $10.36. On March 31, 2010, the NAV of the Class A shares was $11.56. The Fund’s Class A shares outperformed its benchmark with a total return of 12.12% (at NAV) during this period compared to 7.43% for the MSCI AC World ex-U.S. Growth Index. |
| | The magnitude of the performance numbers is significant, especially in comparison to the average historical performance of various equity markets. Clearly, much of the move can be attributed to a strong rebound from the depressed market levels of early 2009. As the economy stabilized and then exhibited early signs of recovery, the markets moved steadily and sharply higher. As valuations increased, along with stock prices, some of our stocks approached our internally generated price targets. |
| | A good example is Solera Holdings. Solera provides software and data to the automotive insurance industry. At the heart of Solera’s business is the company’s proprietary database. For over 35 years, Solera has collected data to build a massive database of the costs to repair damaged vehicles, as well as the value of used vehicles. Insurance companies use this data to estimate the cost of various repairs and to determine when the cost of those repairs is greater than the value of the auto. It would be virtually impossible for another company to replicate the historical information contained in the database, creating a strong barrier to entry. That barrier is evident in Solera’s broad and growing customer base, strong margins, and solid free cash flow generation. |
| | One of our key risk management tools is our process of developing price targets. When we initially researched and purchased Solera in the International Growth Fund in March of 2009, we built a robust financial model that included estimates of future revenues, earnings, and cash flows. We used that model to generate an upside price target, as well as a downside estimate – how low could the stock trade under a negative scenario. As time passes and we collect new information, we incorporate it into our model and adjust our price targets accordingly. Generally, we like to see significantly more upside than downside potential in our holdings, creating a favorable risk to reward ratio. |
| |
| | However, as a stock like Solera increases, the upside potential shrinks while the downside potential increases, making it less attractive. We tend to trim a position as the risk to |
Certified Semi-Annual Report 7
Letter to Shareholders,
Continued
reward becomes less favorable. When a stock hits our price target and we can find no credible reason to raise it further, we are typically quick to sell, as we did with Solera during the period. While we may miss some further upside momentum in the near term, we believe this approach reduces risk over time.
A number of stocks in addition to Solera contributed to performance during the period, including three information technology companies: Playtech Ltd., Infineon Technologies, and ARM Holdings. Playtech, a British-based online gaming software company, benefited from the economic recovery and the subsequent return of online gaming customers, as well as a new strategic partnership with a lottery games operator. Infineon, a German semiconductor company and the Fund’s largest weight, rose on the prospect of increasing utilization of their proprietary technology used in autos and communication devices. ARM Holdings currently generates significant royalties from its mobile phone component designs; during the period the market bid the stock higher on optimism about its growth prospects.
The Fund’s strongest overall contribution came from the consumer discretionary sector where recent purchase Sony advanced. The company benefited during the period from its expanding television business, growing profits from network gaming, and a weakening Japanese Yen. Another consumer discretionary stock, YOOX S.p.A., was the strongest individual contributor to performance during the period. The Italian e-commerce retailer provides wholesale distribution opportunities to high-end fashion designers. The company benefited from rapid growth in Europe. Other contributors include Duoyuan Printing in China, Drogasil in Brazil, and Teva Pharmaceuticals in Israel.
Actelion was the single largest detractor during the six-month period. The Swiss pharmaceutical company had one of its pipeline drugs fail in clinical trials. While unfortunate, we believe that other drugs they have under development hold promise, and we remain invested. Another detractor over the period was Chinese software company Shanda Games whose most popular games have recently seen a slowdown in sales. We remain invested in Shanda as well, based on a low valuation and the company’s growing diversified portfolio of gaming offerings. Additional notable detractors to performance included BM&F Bovespa and Deutsche Börse in the financial sector, Chinese digital media network operator Airmedia, and Spanish telephone service provider Telefónica.
Expectations for GDP and corporate earnings have improved in most markets around the world between October
1, 2009 and March 31, although there are stubborn corners of resistance. Greece gets much of the publicity in this regard. While very small on its own, some investors consider the current drama in Greece to have elements of problems that are more widespread in a broad group of industrial democracies: bloated public sectors that cannot be supported by a straining private sector, high debt load, and unsustainable deficits.
We are concerned about these issues. At the same time, we can see that global consumer demand is holding up well, strongly supported by emerging economies with modest public and private debt loads and expanding private sectors. Inventories of primary, intermediate, and finished goods were drawn down significantly between late 2008 and mid-2009. The rebuilding of inventories, even as final demand expands on a global basis, is leading to a
8 Certified Semi-Annual Report
powerful industrial recovery. Since the U.S. economy came to be over-dependent on residential real estate over the last generation, certain geographies in this country that were particularly caught up in that phenomenon are still in the penalty box. It is also very challenging for those whose jobs depended in any way on the U.S. residential real estate boom to find work. Aggregate employment statistics for the United States reflect that, as we struggle to channel production and employment in other uses. To a large extent, this is not a global issue. The United States is well into its third year of trying to reorient its economy. We are beginning to see signs that the costly trip down the road of too much real estate consumption will quit being a drag on the real economy and the financial sector later this year.
The current cash balance of the Fund is higher than the historical average. While we are certainly aware of this handicap in a rising market, we prefer to hold cash rather than invest in anything other than great ideas. We plan to strategically deploy the cash as new opportunities present themselves and anticipate being back to normal levels in the near term. The cash balance is not a defensive position, nor is it indicative of our view on the markets. We run a concentrated portfolio, and the sale of two or three names can have a very meaningful impact on cash levels.
Our focus, as always, is to maximize long-term after-tax returns over time. We believe risk management is a critical component to reaching that goal. We encourage you to learn more about your portfolio. Descriptions of each holding and links to company websites can be found by pointing your Internet browser to www.thornburg. com/funds. Thank you for investing in the Thornburg International Growth Fund.
Sincerely,
|

|
| Alexander M.V. Motola, CFA |
| Managing Director |
| Portfolio Manager |
The matters discussed in this report may constitute forward-looking statements made pursuant to the safe harbor provisions of the Securities Litigation Reform Act of 1995. These include any advisor or portfolio manager prediction, assessment, analysis or outlook for individual securities, industries, investment styles, market sectors and/or markets. These statements involve risks and uncertainties. In addition to the general risks described for each fund in its current prospectus, other factors bearing on these reports include the accuracy of the advisor’s or portfolio manager’s forecasts and predictions, the appropriateness of the investment strategies designed by the advisor or portfolio manager, and the ability of the advisor or portfolio manager to implement their strategies efficiently and successfully. Any one or more of these factors, as well as other risks affecting the securities markets generally, could cause the actual results of any fund to differ materially as compared to its benchmarks.
Certified Semi-Annual Report 9
| | |
| SCHEDULE OF INVESTMENTS | | |
| |
| Thornburg International Growth Fund | | March 31, 2010 (Unaudited) |
| | | | | | | | |
TOP TEN HOLDINGS As of 3/31/10 | |
| | | |
Infineon Technologies AG | | 3.6 | % | | Teva Pharmaceutical Industries Ltd. ADR | | 3.1 | % |
Amdocs Ltd. | | 3.5 | % | | Drogasil S.A. | | 2.7 | % |
Thomson Reuters Corp. | | 3.4 | % | | Playtech Ltd. | | 2.7 | % |
Fidessa Group plc | | 3.3 | % | | Actelion Ltd. | | 2.7 | % |
YOOX S.p.A | | 3.2 | % | | Duoyaun Printing, Inc. | | 2.7 | % |
|
SUMMARY OF INDUSTRY EXPOSURE As of 3/31/10 | |
| | | |
Software & Services | | 18.3 | % | | Food & Staples Retailing | | 2.7 | % |
Pharmaceuticals, Biotechnology & Life Sciences | | 15.5 | % | | Capital Goods | | 2.7 | % |
Semiconductors & Semiconductor Equipment | | 8.3 | % | | Telecommunication Services | | 2.6 | % |
Diversified Financials | | 6.6 | % | | Health Care Equipment & Services | | 2.5 | % |
Media | | 5.3 | % | | Consumer Durables & Apparel | | 2.4 | % |
Materials | | 3.9 | % | | Food, Beverage & Tobacco | | 1.9 | % |
Commercial & Professional Services | | 3.8 | % | | Insurance | | 1.3 | % |
Energy | | 3.6 | % | | Other Assets & Cash Equivalents | | 15.4 | % |
Retailing | | 3.2 | % | | | | | |
|
SUMMARY OF COUNTRY EXPOSURE As of 3/31/10 (percent of equity holdings) | |
| | | |
United Kingdom | | 16.3 | % | | Denmark | | 3.0 | % |
Brazil | | 10.1 | % | | Argentina | | 2.8 | % |
Germany | | 10.0 | % | | Taiwan | | 2.8 | % |
China | | 8.3 | % | | United States | | 2.8 | % |
Canada | | 7.6 | % | | Ireland | | 2.7 | % |
Israel | | 6.4 | % | | Norway | | 2.6 | % |
Switzerland | | 6.1 | % | | Greece | | 2.2 | % |
Japan | | 5.4 | % | | Netherlands | | 2.2 | % |
Italy | | 3.8 | % | | Australia | | 1.8 | % |
Mexico | | 3.1 | % | | | | | |
10 Certified Semi-Annual Report
| | |
| SCHEDULE OF INVESTMENTS, CONTINUED | | |
| |
| Thornburg International Growth Fund | | March 31, 2010 (Unaudited) |
| | | | | |
| | | Shares/
Principal Amount | | Value |
COMMON STOCK — 84.61% | | | | | |
CAPITAL GOODS — 2.66% | | | | | |
MACHINERY — 2.66% | | | | | |
a Duoyaun Printing, Inc. | | 196,700 | | $ | 2,124,360 |
| | | | | |
| | | | | 2,124,360 |
| | | | | |
COMMERCIAL & PROFESSIONAL SERVICES — 3.78% | | | | | |
PROFESSIONAL SERVICES — 3.78% | | | | | |
Experian plc | | 183,100 | | | 1,801,884 |
Seek Ltd. | | 165,265 | | | 1,216,276 |
| | | | | |
| | | | | 3,018,160 |
| | | | | |
CONSUMER DURABLES & APPAREL — 2.39% | | | | | |
HOUSEHOLD DURABLES — 2.39% | | | | | |
Sony Corp. | | 49,800 | | | 1,906,985 |
| | | | | |
| | | | | 1,906,985 |
| | | | | |
DIVERSIFIED FINANCIALS — 6.57% | | | | | |
CAPITAL MARKETS — 2.46% | | | | | |
Man Group plc | | 536,600 | | | 1,966,510 |
DIVERSIFIED FINANCIAL SERVICES — 4.11% | | | | | |
Deutsche Börse AG | | 23,900 | | | 1,771,557 |
a ING Groep N.V. | | 150,700 | | | 1,504,590 |
| | | | | |
| | | | | 5,242,657 |
| | | | | |
ENERGY — 3.55% | | | | | |
OIL, GAS & CONSUMABLE FUELS — 3.55% | | | | | |
a BPZ Resources, Inc. | | 117,080 | | | 860,538 |
Canadian Natural Resources Ltd. | | 13,900 | | | 1,028,763 |
Petroleo Brasileiro S.A. ADR | | 23,850 | | | 944,221 |
| | | | | |
| | | | | 2,833,522 |
| | | | | |
FOOD & STAPLES RETAILING — 2.70% | | | | | |
FOOD & STAPLES RETAILING — 2.70% | | | | | |
Drogasil S.A. | | 134,000 | | | 2,154,278 |
| | | | | |
| | | | | 2,154,278 |
| | | | | |
FOOD, BEVERAGE & TOBACCO — 1.89% | | | | | |
BEVERAGES — 1.89% | | | | | |
Coca-Cola Hellenic Bottling Co. S.A. | | 56,021 | | | 1,510,269 |
| | | | | |
| | | | | 1,510,269 |
| | | | | |
HEALTH CARE EQUIPMENT & SERVICES — 2.51% | | | | | |
HEALTH CARE PROVIDERS & SERVICES — 2.51% | | | | | |
Diagnosticos da America SA | | 228,000 | | | 2,000,056 |
| | | | | |
| | | | | 2,000,056 |
| | | | | |
INSURANCE — 1.32% | | | | | |
INSURANCE — 1.32% | | | | | |
a Primerica, Inc. | | 70,000 | | | 1,050,000 |
| | | | | |
| | | | | 1,050,000 |
| | | | | |
Certified Semi-Annual Report 11
| | |
| SCHEDULE OF INVESTMENTS, CONTINUED | | |
| |
| Thornburg International Growth Fund | | March 31, 2010 (Unaudited) |
| | | | | |
| | | Shares/
Principal Amount | | Value |
MATERIALS — 3.95% | | | | | |
CHEMICALS — 1.77% | | | | | |
Potash Corp. of Saskatchewan, Inc. | | 11,800 | | $ | 1,408,330 |
METALS & MINING — 2.18% | | | | | |
Tokyo Steel Manufacturing Co., Ltd | | 139,100 | | | 1,742,284 |
| | | | | |
| | | | | 3,150,614 |
| | | | | |
MEDIA — 5.30% | | | | | |
MEDIA — 5.30% | | | | | |
a Airmedia Group, Inc. ADR | | 240,400 | | | 1,502,500 |
Thomson Reuters Corp. | | 74,900 | | | 2,725,648 |
| | | | | |
| | | | | 4,228,148 |
| | | | | |
PHARMACEUTICALS, BIOTECHNOLOGY & LIFE SCIENCES — 15.50% | | | | | |
BIOTECHNOLOGY — 2.66% | | | | | |
a Actelion Ltd. | | 46,700 | | | 2,124,619 |
PHARMACEUTICALS — 12.84% | | | | | |
a Bayer AG | | 30,700 | | | 2,076,566 |
Novo Nordisk A/S | | 25,900 | | | 2,009,766 |
a Pronova BioPharma AS | | 544,500 | | | 1,749,891 |
Roche Holding AG | | 12,100 | | | 1,962,348 |
Teva Pharmaceutical Industries Ltd. ADR | | 38,800 | | | 2,447,504 |
| | | | | |
| | | | | 12,370,694 |
| | | | | |
RETAILING — 3.20% | | | | | |
INTERNET & CATALOG RETAIL — 3.20% | | | | | |
a YOOX S.p.A | | 306,200 | | | 2,553,790 |
| | | | | |
| | | | | 2,553,790 |
| | | | | |
SEMICONDUCTORS & SEMICONDUCTOR EQUIPMENT — 8.31% | | | | | |
SEMICONDUCTORS & SEMICONDUCTOR EQUIPMENT — 8.31% | | | | | |
a Infineon Technologies AG | | 415,100 | | | 2,881,206 |
a Mellanox Technologies Ltd. | | 78,412 | | | 1,848,171 |
Taiwan Semiconductor Manufacturing Co., Ltd. ADR | | 181,449 | | | 1,903,400 |
| | | | | |
| | | | | 6,632,777 |
| | | | | |
SOFTWARE & SERVICES — 18.33% | | | | | |
INFORMATION TECHNOLOGY SERVICES — 3.50% | | | | | |
a Amdocs Ltd. | | 92,829 | | | 2,795,081 |
INTERNET SOFTWARE & SERVICES — 4.26% | | | | | |
a MercadoLibre, Inc. | | 39,200 | | | 1,889,832 |
a Telecity Group plc | | 234,244 | | | 1,507,172 |
SOFTWARE — 10.57% | | | | | |
Fidessa Group plc | | 129,400 | | | 2,597,901 |
Playtech Ltd. | | 260,100 | | | 2,131,388 |
a Shanda Games Ltd. ADR | | 278,600 | | | 2,005,920 |
Totvs SA | | 27,000 | | | 1,700,301 |
| | | | | |
| | | | | 14,627,595 |
| | | | | |
12 Certified Semi-Annual Report
| | |
| SCHEDULE OF INVESTMENTS, CONTINUED | | |
| |
| Thornburg International Growth Fund | | March 31, 2010 (Unaudited) |
| | | | | | |
| | | Shares/
Principal Amount | | Value |
TELECOMMUNICATION SERVICES — 2.65% | | | | | | |
WIRELESS TELECOMMUNICATION SERVICES — 2.65% | | | | | | |
America Móvil SAB de C.V. | | | 838,000 | | $ | 2,109,953 |
| | | | | | |
| | | | | | 2,109,953 |
| | | | | | |
TOTAL COMMON STOCK (Cost $61,979,575) | | | | | | 67,513,858 |
| | | | | | |
SHORT TERM INVESTMENTS — 11.03% | | | | | | |
Pepco Holdings, Inc., 0.30%, 4/1/2010 | | $ | 3,500,000 | | | 3,500,000 |
Vulcan Materials Co., 0.25%, 4/1/2010 | | | 3,300,000 | | | 3,300,000 |
Wellpoint, Inc., 0.20%, 4/1/2010 | | | 2,000,000 | | | 2,000,000 |
| | | | | | |
TOTAL SHORT TERM INVESTMENTS (Cost $8,800,000) | | | | | | 8,800,000 |
| | | | | | |
| | |
TOTAL INVESTMENTS — 95.64% (Cost $70,779,575) | | | | | $ | 76,313,858 |
| | |
OTHER ASSETS LESS LIABILITIES — 4.36% | | | | | | 3,482,164 |
| | | | | | |
| | |
NET ASSETS — 100.00% | | | | | $ | 79,796,022 |
| | | | | | |
Footnote Legend
Portfolio Abbreviations
To simplify the listings of securities, abbreviations are used per the table below:
| | |
ADR | | American Depository Receipt |
See notes to financial statements.
Certified Semi-Annual Report 13
| | |
| STATEMENT OF ASSETS AND LIABILITIES | | |
| |
| Thornburg International Growth Fund | | March 31, 2010 (Unaudited) |
| | | | |
ASSETS | | | | |
Investments at value (cost $70,779,575) (Note 2) | | $ | 76,313,858 | |
Cash | | | 251,919 | |
Cash denominated in foreign currency (cost $1,625,927) | | | 1,686,285 | |
Receivable for investments sold | | | 2,457,674 | |
Receivable for fund shares sold | | | 247,015 | |
Unrealized appreciation on forward currency contracts (Note 7) | | | 1,114,829 | |
Dividends receivable | | | 80,834 | |
Dividend and interest reclaim receivable | | | 66,262 | |
Prepaid expenses and other assets | | | 64,789 | |
| | | | |
Total Assets | | | 82,283,465 | |
| | | | |
| |
LIABILITIES | | | | |
Payable for securities purchased | | | 2,262,304 | |
Payable for fund shares redeemed | | | 72,732 | |
Unrealized depreciation on forward currency contracts (Note 7) | | | 14,552 | |
Payable to investment advisor and other affiliates (Note 3) | | | 77,320 | |
Accounts payable and accrued expenses | | | 60,535 | |
| | | | |
Total Liabilities | | | 2,487,443 | |
| | | | |
NET ASSETS | | $ | 79,796,022 | |
| | | | |
NET ASSETS CONSIST OF: | | | | |
Distribution in excess of net investment income | | $ | (13,010 | ) |
Net unrealized appreciation on investments | | | 6,694,679 | |
Accumulated net realized gain (loss) | | | (35,259,341 | ) |
Net capital paid in on shares of beneficial interest | | | 108,373,694 | |
| | | | |
| | $ | 79,796,022 | |
| | | | |
14 Certified Semi-Annual Report
| | |
| STATEMENT OF ASSETS AND LIABILITIES, CONTINUED |
| |
| Thornburg International Growth Fund | | March 31, 2010 (Unaudited) |
| | | |
NET ASSET VALUE: | | | |
Class A Shares: | | | |
Net asset value and redemption price per share ($29,132,091 applicable to 2,520,103 shares of beneficial interest outstanding - Note 4) | | $ | 11.56 |
| |
Maximum sales charge, 4.50% of offering price | | | 0.54 |
| | | |
| |
Maximum offering price per share | | $ | 12.10 |
| | | |
| |
Class C Shares: | | | |
Net asset value and offering price per share * ($21,930,837 applicable to 1,900,654 shares of beneficial interest outstanding - Note 4) | | $ | 11.54 |
| | | |
| |
Class I Shares: | | | |
Net asset value, offering and redemption price per share ($27,873,476 applicable to 2,393,907 shares of beneficial interest outstanding - Note 4) | | $ | 11.64 |
| | | |
| |
Class R3 Shares: | | | |
Net asset value, offering and redemption price per share ($846,181 applicable to 73,440 shares of beneficial interest outstanding - - Note 4) | | $ | 11.52 |
| | | |
| |
Class R4 Shares: | | | |
Net asset value, offering and redemption price per share ($2,736 applicable to 238 shares of beneficial interest outstanding - Note 4) | | $ | 11.49 |
| | | |
| |
Class R5 Shares: | | | |
Net asset value, offering and redemption price per share ($10,701 applicable to 917 shares of beneficial interest outstanding - Note 4) | | $ | 11.67 |
| | | |
| * | Redemption price per share is equal to net asset value less any applicable contingent deferred sales charge. |
See notes to financial statements.
Certified Semi-Annual Report 15
| | |
| STATEMENT OF OPERATIONS | | |
| |
| Thornburg International Growth Fund | | Six Months Ended March 31, 2010 (Unaudited) |
| | | | |
INVESTMENT INCOME: | | | | |
Dividend income (net of foreign taxes withheld of $38,573) | | $ | 625,016 | |
Interest income | | | 4,994 | |
| | | | |
Total Income | | | 630,010 | |
| | | | |
| |
EXPENSES: | | | | |
Investment advisory fees (Note 3) | | | 319,879 | |
Administration fees (Note 3) | | | | |
Class A Shares | | | 16,262 | |
Class C Shares | | | 12,602 | |
Class I Shares | | | 6,489 | |
Class R3 Shares | | | 468 | |
Class R4 Shares | | | 2 | |
Class R5 Shares | | | 55 | |
Distribution and service fees (Note 3) | | | | |
Class A Shares | | | 32,591 | |
Class C Shares | | | 101,187 | |
Class R3 Shares | | | 1,876 | |
Class R4 Shares | | | 3 | |
Transfer agent fees | | | | |
Class A Shares | | | 21,188 | |
Class C Shares | | | 20,015 | |
Class I Shares | | | 5,444 | |
Class R3 Shares | | | 1,246 | |
Class R4 Shares | | | 654 | |
Class R5 Shares | | | 741 | |
Registration and filing fees | | | | |
Class A Shares | | | 10,400 | |
Class C Shares | | | 10,226 | |
Class I Shares | | | 10,262 | |
Class R3 Shares | | | 8,101 | |
Class R4 Shares | | | 8,101 | |
Class R5 Shares | | | 8,102 | |
Custodian fees (Note 3) | | | 43,104 | |
Professional fees | | | 20,867 | |
Accounting fees | | | 1,370 | |
Trustee fees | | | 910 | |
Other expenses | | | 4,522 | |
| | | | |
Total Expenses | | | 666,667 | |
Less: | | | | |
Expenses reimbursed by investment advisor (Note 3) | | | (53,903 | ) |
Investment advisory fees waived by investment advisor (Note 3) | | | (28,011 | ) |
Fees paid indirectly (Note 3) | | | (743 | ) |
| | | | |
Net Expenses | | | 584,010 | |
| | | | |
Net Investment Income | | $ | 46,000 | |
| | | | |
16 Certified Semi-Annual Report
| | |
| STATEMENT OF OPERATIONS, CONTINUED | | |
| |
| Thornburg International Growth Fund | | Six Months Ended March 31, 2010 (Unaudited) |
| | | | |
REALIZED AND UNREALIZED GAIN (LOSS) | | | | |
Net realized gain (loss) from: | | | | |
Investments | | $ | 6,097,503 | |
Forward currency contracts (Note 7) | | | (6,140 | ) |
Foreign currency transactions | | | 26,614 | |
| | | | |
| | | 6,117,977 | |
| | | | |
Net change in unrealized appreciation (depreciation) on: | | | | |
Investments | | | 1,088,325 | |
Forward currency contracts (Note 7) | | | 1,101,841 | |
Foreign currency translations | | | 60,119 | |
| | | | |
| | | 2,250,285 | |
| | | | |
Net Realized and Unrealized Gain | | | 8,368,262 | |
| | | | |
Net Increase in Net Assets Resulting From Operations | | $ | 8,414,262 | |
| | | | |
See notes to financial statements.
Certified Semi-Annual Report 17
STATEMENTS OF CHANGES IN NET ASSETS
Thornburg International Growth Fund
| | | | | | | | |
| | | Six Months Ended
March 31, 2010* | | | Year Ended
September 30, | |
INCREASE (DECREASE) IN NET ASSETS FROM: | | | | | | | | |
| | |
OPERATIONS: | | | | | | | | |
Net investment income | | $ | 46,000 | | | $ | 300,793 | |
Net realized gain (loss) on investments, forward currency contracts, and foreign currency transactions | | | 6,117,977 | | | | (35,731,869 | ) |
Increase (decrease) in unrealized appreciation (depreciation) on investments, forward currency contracts, and foreign currency translation | | | 2,250,285 | | | | 32,322,259 | |
| | | | | | | | |
| | |
Net Increase (Decrease) in Net Assets Resulting from Operations | | | 8,414,262 | | | | (3,108,817 | ) |
| | |
DIVIDENDS TO SHAREHOLDERS: | | | | | | | | |
From net investment income | | | | | | | | |
Class A Shares | | | (129,435 | ) | | | (345,267 | ) |
Class C Shares | | | 0 | | | | (109,592 | ) |
Class I Shares | | | (222,424 | ) | | | (518,715 | ) |
Class R3 Shares | | | (4,168 | ) | | | (1,928 | ) |
Class R4 Shares | | | (16 | ) | | | (47 | ) |
Class R5 Shares | | | (83 | ) | | | (42 | ) |
| | |
FUND SHARE TRANSACTIONS (NOTE 4): | | | | | | | | |
Class A Shares | | | 2,166,208 | | | | (2,611,014 | ) |
Class C Shares | | | 435,239 | | | | (3,186,558 | ) |
Class I Shares | | | 640,010 | | | | (2,620,197 | ) |
Class R3 Shares | | | 12,008 | | | | 483,136 | |
Class R4 Shares | | | 16 | | | | 47 | |
Class R5 Shares | | | 164,176 | | | | 5,940 | |
| | | | | | | | |
| | |
Net Increase (Decrease) in Net Assets | | | 11,475,793 | | | | (12,013,054 | ) |
| | |
NET ASSETS: | | | | | | | | |
Beginning of Period | | | 68,320,229 | | | | 80,333,283 | |
| | | | | | | | |
| | |
End of Period | | $ | 79,796,022 | | | $ | 68,320,229 | |
| | | | | | | | |
| | |
Undistributed net investment income | | $ | — | | | $ | 297,117 | |
See notes to financial statements.
18 Certified Semi-Annual Report
| | |
| NOTES TO FINANCIAL STATEMENTS | | |
| |
| Thornburg International Growth Fund | | March 31, 2010 (Unaudited) |
NOTE 1 – ORGANIZATION
Thornburg International Growth Fund, hereinafter referred to as the “Fund,” is a diversified series of Thornburg Investment Trust (the “Trust”). The Fund commenced operations on February 1, 2007. The Trust was organized as a Massachusetts business trust under a Declaration of Trust dated June 3, 1987 and is registered as a diversified, open-end management investment company under the Investment Company Act of 1940, as amended. The Fund is currently one of sixteen separate series of the Trust. Each series is considered to be a separate entity for financial reporting and tax purposes and bears expenses directly attributable to it. The Fund seeks long-term capital appreciation by investing in equity securities selected for their growth potential.
The Fund currently offers six classes of shares of beneficial interest: Class A, Class C, Institutional Class (Class I), and Retirement Classes (Class R3, Class R4, and Class R5) shares. Each class of shares of the Fund represents an interest in the same portfolio of investments, except that (i) Class A shares are sold subject to a front-end sales charge collected at the time the shares are purchased and bear a service fee, (ii) Class C shares are sold at net asset value without a sales charge at the time of purchase, but are subject to a contingent deferred sales charge upon redemption within one year of purchase, and bear both a service fee and a distribution fee, (iii) Class I shares are sold at net asset value without a sales charge at the time of purchase, (iv) Class R3 shares are sold at net asset value without a sales charge at the time of purchase, but bear both a service fee and distribution fee, (v) Class R4 shares are sold at net asset value without a sales charge at the time of purchase, but bear a service fee, (vi) Class R5 shares are sold at net asset value without a sales charge at the time of purchase, and (vii) the respective classes may have different reinvestment privileges and conversion rights. Additionally, the Fund may allocate among its classes certain expenses, to the extent allowable to specific classes, including transfer agent fees, government registration fees, certain printing and postage costs, and administrative and legal expenses. Currently, class specific expenses of the Fund are limited to service and distribution fees, administration fees, and certain registration and transfer agent expenses.
NOTE 2 – SIGNIFICANT ACCOUNTING POLICIES
Significant accounting policies of the Trust are as follows:
Valuation of Investments: Portfolio securities listed or traded on a national securities exchange are valued on the valuation date at the last reported sale price on the exchange that is the primary market for the security. Portfolio securities traded on an exchange for which there has been no sale that day and other equity securities traded in the over-the-counter market are valued at the mean between the last reported bid and asked prices. Portfolio securities reported by NASDAQ are valued at the NASDAQ official closing price. Any foreign security traded on exchanges outside the United States is valued at the price of the security on the exchange that is normally the security’s primary market, as of the close of that exchange preceding the time of the Fund’s valuation.
Debt obligations held by the Fund have a primary market over the counter and are valued by an independent pricing service approved by the Trustees of the Trust. The pricing service ordinarily values debt obligations at quoted bid prices. When quotations are not available, debt obligations held by the Fund are valued at evaluated prices determined by the pricing service using methods which include consideration of yields or prices of debt obligations of comparable quality, type of issue, coupon, maturity and rating, and indications as to value from dealers and general market conditions. Short-term obligations having remaining maturities of 60 days or less are valued at amortized cost, which approximates market value.
Quotations in foreign currencies for foreign portfolio investments are converted to U.S. dollar equivalents using the foreign exchange quotation in effect at the time of valuation.
In any case where the market value of an equity security held by the Fund is not readily available, the Trust’s valuation and pricing committee determines a fair value for the security using procedures approved by the Trustees, which may include the use of a price obtained from an independent pricing service. The pricing service ordinarily values equity securities in these instances using multi-factor models to adjust market prices based upon various inputs, including exchange data, depository receipt prices, futures and index data and other data. A security’s market value is deemed not readily available whenever the exchange or market on which the security is primarily traded is closed for the entire scheduled day of trading. Additionally, a security’s market value may be deemed not readily available under other circumstances identified by the Trustees, including when developments occurring after the most recent close of the security’s primary exchange or market, but before the most recent close of trading in Fund shares, create a serious question about the reliability of the security’s market value.
Certified Semi-Annual Report 19
| | |
| NOTES TO FINANCIAL STATEMENTS, CONTINUED | | |
| |
| Thornburg International Growth Fund | | March 31, 2010 (Unaudited) |
In any case where a pricing service fails to provide a price for a debt obligation held by the Fund, the valuation and pricing committee determines a fair value for the debt obligation using procedures approved by the Trustees. Additionally, in any case where management believes that a price provided by a pricing service for a debt obligation held by the Fund may be unreliable, the valuation and pricing committee decides whether or not to use the pricing service’s valuation or to determine a fair value for the debt obligation.
In determining fair value for any portfolio security or other investment, the valuation and pricing committee seeks to determine the amount that an owner of the investment might reasonably expect to receive upon a sale of the investment. However, because fair value prices are estimated prices, the valuation and pricing committee’s determination of fair value for an investment may differ from the value that would be realized by the Fund upon a sale of the investment, and that difference could be material to the Fund’s financial statements. The valuation and pricing committee’s determination of fair value for an investment may also differ from the prices obtained by other persons (including other mutual funds) for the investment.
Valuation Measurements: Various inputs are used in determining the value of the Fund’s investments. These inputs are summarized in the three levels listed below.
Level 1: Quoted prices in active markets for identical investments.
Level 2: Other significant observable inputs (including quoted prices for similar investments, interest rates, prepayment rates, credit risk, etc.).
Level 3: Significant unobservable inputs (including the Fund’s own assumptions in determining the fair value of investments).
The following table displays a summary of the inputs used to value the Fund’s net assets as of March 31, 2010. In any instance when valuation inputs from more than one level are used to determine the fair value of a specific investment, the investment is placed in the level of the table based upon the lowest level input that is significant in determining the fair value of the investment:
| | | | | | | | | | | | | | | |
| | | Fair Value Measurements at March 31, 2010 |
| | | Total | | | Level 1 | | | Level 2 | | | Level 3 |
Assets | | | | | | | | | | | | | | | |
Investments in Securities* | | | | | | | | | | | | | | | |
Common Stock | | $ | 67,513,858 | | | $ | 67,513,858 | | | $ | — | | | $ | — |
Short Term Investments | | | 8,800,000 | | | | — | | | | 8,800,000 | | | | — |
| | | | | | | | | | | | | | | |
Total Investments in Securities | | $ | 76,313,858 | | | $ | 67,513,858 | | | $ | 8,800,000 | | | $ | — |
| | | | |
Other Financial Instruments** | | | | | | | | | | | | | | | |
Forward Currency Contracts | | $ | 1,114,829 | | | $ | — | | | $ | 1,114,829 | | | $ | — |
Spot Currency | | $ | 667 | | | $ | 667 | | | $ | — | | | $ | — |
| | | | |
Liabilities | | | | | | | | | | | | | | | |
Other Financial Instruments** | | | | | | | | | | | | | | | |
Forward Currency Contracts | | $ | (14,552 | ) | | $ | — | | | $ | (14,552 | ) | | $ | — |
Spot Currency | | $ | (30 | ) | | $ | (30 | ) | | $ | — | | | $ | — |
| * | See Schedule of Investments for a summary of the industry exposure as grouped according to the Global Industry Classification Standard (GICS), which is an industry taxonomy developed by Morgan Stanley Capital International (MSCI), and Standard & Poor’s (S&P). |
| ** | Other Financial Instruments include investments not reflected in the Schedule of Investments, such as futures, forwards and swap contracts, which are valued at the unrealized appreciation (depreciation) on the instrument. |
Foreign Currency Translation: Portfolio securities and other assets and liabilities denominated in foreign currencies are translated into U.S. dollars based on the exchange rate of such currencies against the U.S. dollar on the date of valuation. Purchases and sales of securities and income items denominated in foreign currencies are translated into U.S. dollars at the exchange rate in effect on the translation date. When the Fund purchases or sells foreign securities it will customarily enter into a foreign exchange contract to minimize foreign exchange risk from the trade date to the settlement date of such transactions.
20 Certified Semi-Annual Report
| | |
| NOTES TO FINANCIAL STATEMENTS, CONTINUED | | |
| |
| Thornburg International Growth Fund | | March 31, 2010 (Unaudited) |
The Fund does not separately report the effect of changes in foreign exchange rates from changes in market prices on securities held. Such changes are included in net realized and unrealized gain or loss from investments.
Reported net realized foreign exchange gains or losses arise from sales of foreign currencies, currency gains or losses realized between the trade and settlement dates on securities transactions and the difference between the amounts of dividends, interest, and foreign withholding taxes recorded on the Fund’s books, and the U.S. dollar equivalent of the amounts actually received or paid.
Net unrealized foreign exchange gains and losses arise from changes in the fair value of assets and liabilities, other than investments in securities at fiscal period end, resulting from changes in exchange rates.
Deferred Taxes: The Fund is subject to a tax imposed on net realized gains of securities of certain foreign issuers. The Fund records an estimated deferred tax liability for net unrealized gains on these securities as reflected in the accompanying financial statements.
Federal Income Taxes: It is the policy of the Trust to comply with the provisions of the Internal Revenue Code applicable to “regulated investment companies” and to distribute to shareholders substantially all taxable income, including any net realized gain on investments of the Fund. Therefore, no provision for federal income taxes is required.
When-Issued and Delayed Delivery Transactions: The Fund may engage in when-issued or delayed delivery transactions. To the extent the Fund engages in such transactions, it will do so for the purpose of acquiring portfolio securities consistent with the Fund’s investment objectives and not for the purpose of investment leverage or to speculate on interest rate and/or market changes. At the time the Fund makes a commitment to purchase a security on a when-issued or delayed delivery basis, the Fund will record the transaction and reflect the value in determining its net asset value. When effecting such transactions, assets of an amount sufficient to make payment for the portfolio securities to be purchased will be segregated on the Fund’s records on the trade date. Securities purchased on a when-issued or delayed delivery basis do not earn interest until the settlement date.
Dividends: Dividends to shareholders are generally paid quarterly and are reinvested in additional shares of the Fund at net asset value per share at the close of business on the dividend payment date or, at the shareholder’s option, paid in cash. Net realized capital gains, to the extent available, will be distributed at least annually. Distributions to shareholders are based on income tax regulations and therefore, their characteristics may differ for financial statement and tax purposes.
General: Securities transactions are accounted for on a trade date basis. Interest income is accrued as earned and dividend income is recorded on the ex-dividend date. Certain income from foreign securities is recognized as soon as information is available to the Fund. Realized gains and losses from the sale of securities are recorded on an identified cost basis. Net investment income (other than class specific expenses) and realized and unrealized gains and losses are allocated daily to each class of shares based upon the relative net asset value of outstanding shares of each class of shares at the beginning of the day (after adjusting for the current share activity of the respective class). Expenses common to all funds are allocated among the funds comprising the Trust based upon their relative net asset values or other appropriate allocation methods.
Guarantees and Indemnifications: Under the Trust’s organizational documents, its officers and Trustees are indemnified against certain liabilities arising out of the performance of their duties to the Fund. Additionally, in the normal course of business the Trust enters into contracts with service providers that contain general indemnification clauses. The Trust’s maximum exposure under these arrangements is unknown. However, based on experience, the Trust expects the risk of loss to be remote.
Use of Estimates: The preparation of financial statements, in conformity with generally accepted accounting principles, requires management to make estimates and assumptions that affect the reported amounts of assets and liabilities and the disclosure of contingent assets and liabilities at the date of the financial statements and the reported amounts of increases and decreases in net assets from operations during the reporting period. Actual results could differ from those estimates.
Certified Semi-Annual Report 21
| | |
| NOTES TO FINANCIAL STATEMENTS, CONTINUED | | |
| |
| Thornburg International Growth Fund | | March 31, 2010 (Unaudited) |
NOTE 3 – INVESTMENT ADVISORY FEE AND OTHER TRANSACTIONS WITH AFFILIATES
Pursuant to an investment advisory agreement, Thornburg Investment Management, Inc. (the “Advisor”) serves as the investment advisor and performs services to the Fund for which the fees are payable at the end of each month. For the six months ended March 31, 2010, these fees were payable at annual rates ranging from .875 of 1% to .675 of 1% per annum of the average daily net assets of the Fund depending on the Fund’s asset size. For the six months ended March 31, 2010, the Advisor voluntarily waived investment advisory fees of $28,011. The Trust has also entered into administrative services agreements with the Advisor, whereby the Advisor will perform certain administrative services for the shareholders of each class of the Fund’s shares, and for which fees will be payable at an annual rate of up to .125 of 1% per annum of the average daily net assets attributable to each class of shares. For the six months ended March 31, 2010, the Advisor voluntarily or contractually agreed to reimburse certain class specific expenses, administrative fees, and distribution fees of $4,286 for Class C shares, $22,196 for Class I shares, $9,783 for Class R3 shares, $8,755 for Class R4 shares, and $8,883 for Class R5 shares.
The Trust has an underwriting agreement with Thornburg Securities Corporation (the “Distributor,” an affiliate of the Advisor), which acts as the distributor of the Fund’s shares. For the six months ended March 31, 2010, the Distributor has advised the Fund that it earned commissions aggregating $5,718 from the sale of Class A shares, and collected contingent deferred sales charges aggregating $2,039 from redemptions of Class C shares of the Fund.
Pursuant to a service plan under Rule 12b-1 of the Investment Company Act of 1940, the Fund may reimburse to the Advisor an amount not to exceed .25 of 1% per annum of the average daily net assets attributable to each class of shares of the Fund for payments made by the Advisor to securities dealers and other financial institutions to obtain various shareholder and distribution related services. The Advisor may pay out of its own resources additional expenses for distribution of the Fund’s shares.
The Trust has also adopted distribution plans pursuant to Rule 12b-1, applicable only to the Fund’s Class C and Class R3 shares, under which the Fund compensates the Distributor for services in promoting the sale of Class C and Class R3 shares of the Fund at an annual rate of up to .75 of 1% per annum of the average daily net assets attributable to Class C and Class R3 shares. Total fees incurred by the Distributor for each class of shares of the Fund under their respective Service and Distribution Plans for the six months ended March 31, 2010, are set forth in the Statement of Operations.
The Trust has an agreement with the custodian bank to indirectly pay a portion of the custodian’s fees through credits earned by the Fund’s cash on deposit with the bank. This deposit agreement is an alternative to overnight investments. Custodial fees have been adjusted to reflect amounts that would have been paid without this agreement, with a corresponding adjustment reflected as fees paid indirectly in the Statement of Operations. For the six months ended March 31, 2010, fees paid indirectly were $743.
Certain officers and Trustees of the Trust are also officers and/or directors of the Advisor and Distributor. The compensation of independent Trustees is borne by the Trust.
NOTE 4 – SHARES OF BENEFICIAL INTEREST
At March 31, 2010, there were an unlimited number of shares of beneficial interest authorized. Transactions in shares of beneficial interest were as follows:
| | | | | | | | | | | | | | |
| | | Six Months Ended
March 31, 2010 (Unaudited) | | | Year Ended
September 30, 2009 (Audited) | |
| | | Shares | | | Amount | | | Shares | | | Amount | |
Class A Shares | | | | | | | | | | | | | | |
Shares sold | | 480,829 | | | $ | 5,185,520 | | | 1,521,502 | | | $ | 12,014,685 | |
Shares issued to shareholders in reinvestment of dividends | | 10,856 | | | | 117,457 | | | 42,746 | | | | 313,329 | |
Shares repurchased | | (290,226 | ) | | | (3,137,066 | ) | | (1,990,658 | ) | | | (14,939,580 | ) |
Redemption fees received* | | — | | | | 297 | | | — | | | | 552 | |
| | | | | | | | | | | | | | |
| | | | |
Net Increase (Decrease) | | 201,459 | | | $ | 2,166,208 | | | (426,410 | ) | | $ | (2,611,014 | ) |
| | | | | | | | | | | | | | |
22 Certified Semi-Annual Report
| | |
| NOTES TO FINANCIAL STATEMENTS, CONTINUED | | |
| |
| Thornburg International Growth Fund | | March 31, 2010 (Unaudited) |
| | | | | | | | | | | | | | |
| | | Six Months Ended
March 31, 2010 (Unaudited) | | | Year Ended
September 30, 2009 (Audited) | |
| | | Shares | | | Amount | | | Shares | | | Amount | |
Class C Shares | | | | | | | | | | | | | | |
Shares sold | | 273,051 | | | $ | 2,957,141 | | | 762,783 | | | $ | 5,916,858 | |
Shares issued to shareholders in reinvestment of dividends | | — | | | | — | | | 9,948 | | | | 72,723 | |
Shares repurchased | | (234,581 | ) | | | (2,522,131 | ) | | (1,222,548 | ) | | | (9,176,628 | ) |
Redemption fees received* | | — | | | | 229 | | | — | | | | 489 | |
| | | | | | | | | | | | | | |
| | | | |
Net Increase (Decrease) | | 38,470 | | | $ | 435,239 | | | (449,817 | ) | | $ | (3,186,558 | ) |
| | | | | | | | | | | | | | |
| | | | |
Class I Shares | | | | | | | | | | | | | | |
Shares sold | | 230,798 | | | $ | 2,473,760 | | | 612,383 | | | $ | 4,995,741 | |
Shares issued to shareholders in reinvestment of dividends | | 18,921 | | | | 206,051 | | | 65,869 | | | | 484,137 | |
Shares repurchased | | (184,932 | ) | | | (2,040,099 | ) | | (1,041,778 | ) | | | (8,100,654 | ) |
Redemption fees received* | | — | | | | 298 | | | — | | | | 579 | |
| | | | | | | | | | | | | | |
| | | | |
Net Increase (Decrease) | | 64,787 | | | $ | 640,010 | | | (363,526 | ) | | $ | (2,620,197 | ) |
| | | | | | | | | | | | | | |
| | | | |
Class R3 Shares | | | | | | | | | | | | | | |
Shares sold | | 12,171 | | | $ | 131,163 | | | 74,718 | | | $ | 578,635 | |
Shares issued to shareholders in reinvestment of dividends | | 386 | | | | 4,168 | | | 264 | | | | 1,928 | |
Shares repurchased | | (11,584 | ) | | | (123,332 | ) | | (13,404 | ) | | | (97,436 | ) |
Redemption fees received* | | — | | | | 9 | | | — | | | | 9 | |
| | | | | | | | | | | | | | |
| | | | |
Net Increase (Decrease) | | 973 | | | $ | 12,008 | | | 61,578 | | | $ | 483,136 | |
| | | | | | | | | | | | | | |
| | | | |
Class R4 Shares | | | | | | | | | | | | | | |
Shares sold | | — | | | $ | — | | | — | | | $ | — | |
Shares issued to shareholders in reinvestment of dividends | | 1 | | | | 16 | | | 7 | | | | 47 | |
Shares repurchased | | — | | | | — | | | — | | | | — | |
Redemption fees received* | | — | | | | — | | | — | | | | — | |
| | | | | | | | | | | | | | |
| | | | |
Net Increase (Decrease) | | 1 | | | $ | 16 | | | 7 | | | $ | 47 | |
| | | | | | | | | | | | | | |
| | | | |
Class R5 Shares | | | | | | | | | | | | | | |
Shares sold | | 600,085 | | | $ | 6,524,571 | | | 636 | | | $ | 5,903 | |
Shares issued to shareholders in reinvestment of dividends | | 7 | | | | 83 | | | 6 | | | | 42 | |
Shares repurchased | | (600,045 | ) | | | (6,360,478 | ) | | (1 | ) | | | (5 | ) |
Redemption fees received* | | — | | | | — | | | — | | | | — | |
| | | | | | | | | | | | | | |
| | | | |
Net Increase (Decrease) | | 47 | | | $ | 164,176 | | | 641 | | | $ | 5,940 | |
| | | | | | | | | | | | | | |
| * | The Fund charges a redemption fee of 1% of the Class A and Class I shares redeemed or exchanged within 30 days of purchase. Redemption fees charged to any class are allocated to all classes upon receipt of payment based on relative net asset values of each class or other appropriate allocation methods. |
NOTE 5 – SECURITIES TRANSACTIONS
For the six months ended March 31, 2010, the Fund had purchase and sale transactions of investment securities (excluding short-term investments) of $40,091,350 and $41,727,331, respectively.
Certified Semi-Annual Report 23
| | |
| NOTES TO FINANCIAL STATEMENTS, CONTINUED | | |
| |
| Thornburg International Growth Fund | | March 31, 2010 (Unaudited) |
NOTE 6 – INCOME TAXES
At March 31, 2010, information on the tax components of capital is as follows:
| | | | |
Cost of investments for tax purposes | | $ | 70,779,575 | |
| | | | |
Gross unrealized appreciation on a tax basis | | $ | 9,037,324 | |
Gross unrealized depreciation on a tax basis | | | (3,503,041 | ) |
| | | | |
Net unrealized appreciation (depreciation) on investments (tax basis) | | $ | 5,534,283 | |
| | | | |
At March 31, 2010, the Fund had deferred tax basis capital losses occurring subsequent to October 31, 2008 of $23,985,997. For tax purposes, such losses will be reflected in the year ending September 30, 2010.
At March 31, 2010, the Fund had tax basis capital losses, which may be carried forward to offset future capital gains. To the extent such carryforwards are used, capital gain distributions may be reduced to the extent provided by regulations.
Such capital loss carryforwards expire as follows:
| | | |
2016 | | $ | 4,974,731 |
2017 | | | 12,306,688 |
| | | |
| | $ | 17,281,419 |
| | | |
NOTE 7 – DERIVATIVE FINANCIAL INSTRUMENTS WITH OFF-BALANCE SHEET RISK AND FOREIGN INVESTMENT RISK
The Fund may use a variety of derivative financial instruments to hedge or adjust the risks affecting its investment portfolio or to enhance investment returns. Provisions of FASB Accounting Standards Codification ASC 815-10-50, (“ASC 815”) require certain disclosures. The new requirement amends and expands disclosures related to derivative instruments to provide users of financial statements with an enhanced understanding of the use of derivative instruments by the Fund and how these derivatives affect the financial position, financial performance and cash flows of the Fund. The Fund does not designate any derivative instruments as hedging instruments under ASC 815. During the six months ended March 31, 2010, the Fund’s principal exposure to derivative financial instruments of the type addressed by ASC 815 was investment in foreign exchange contracts. A foreign exchange contract is an agreement between two parties to exchange different currencies at a specified rate of exchange at an agreed upon future date. Foreign exchange contracts involve risks to the Fund, including the risk that a contract counterparty will not meet its obligations to the Fund, the risk that a change in a contract’s value may not correlate perfectly with the currency the contract was intended to track, and the risk that the Fund’s advisor is unable to correctly implement its strategy in using a contract. In any such instance, the Fund may not achieve the intended benefit of entering into a contract, and may experience a loss.
The Fund entered into forward currency contracts during the six months ended March 31, 2010 in the normal course of pursuing its investment objectives, in anticipation of purchasing foreign investments or with the intent of reducing the risk to the value of the Fund’s foreign investments from adverse changes in the relationship between the U.S. dollar and foreign currencies. In each case these contracts have been initiated in conjunction with foreign investment transactions.
These contracts are accounted for by the Fund under ASC 815. Unrealized gains and unrealized losses on outstanding contracts are reported in the Fund’s Statement of Assets and Liabilities at the Fund’s net equity, as measured by the difference between the forward exchange rates at the reporting date and the forward exchange rates at each contract’s inception date. Net realized gain (loss) on contracts closed during the period, and changes in net unrealized appreciation (depreciation) on outstanding contracts are recognized in the Fund’s Statement of Operations.
24 Certified Semi-Annual Report
| | |
| NOTES TO FINANCIAL STATEMENTS, CONTINUED | | |
| |
| Thornburg International Growth Fund | | March 31, 2010 (Unaudited) |
The following table displays the outstanding forward currency contracts, at March 31, 2010:
| | | | | | | | | | | | | | | | |
Outstanding Forward Currency Contracts to Buy or Sell at March 31, 2010 | |
Contract Description | | Buy/Sell | | Contract
Amount | | Contract
Value Date | | Value USD | | Unrealized
Appreciation | | Unrealized
Depreciation | |
Brazilian Dollar | | Sell | | 7,000,000 | | 05/03/2010 | | $ | 3,913,537 | | $ | 21,258 | | $ | — | |
Brazilian Dollar | | Sell | | 7,568,350 | | 05/03/2010 | | | 4,231,288 | | | — | | | (9,056 | ) |
Brazilian Dollar | | Buy | | 1,112,750 | | 05/03/2010 | | | 622,113 | | | — | | | (5,496 | ) |
Brazilian Dollar | | Buy | | 2,575,000 | | 05/03/2010 | | | 1,439,623 | | | 94,272 | | | — | |
Euro | | Sell | | 3,600,000 | | 05/03/2010 | | | 4,862,471 | | | 65,101 | | | — | |
Euro | | Sell | | 3,305,000 | | 05/03/2010 | | | 4,464,019 | | | 436,073 | | | — | |
Great Britain Pound | | Sell | | 3,036,000 | | 05/04/2010 | | | 4,606,334 | | | 416,303 | | | — | |
Japanese Yen | | Sell | | 115,800,000 | | 07/08/2010 | | | 1,239,314 | | | 47,524 | | | — | |
Japanese Yen | | Sell | | 253,000,000 | | 07/08/2010 | | | 2,707,655 | | | 34,298 | | | — | |
| | | | | | | | | | | | | | | | |
Total | | | | | | | | | | | $ | 1,114,829 | | $ | (14,552 | ) |
| | | | | | | | | | | | | | | | |
The unrealized appreciation (depreciation) of the outstanding forward currency contracts recognized in the Fund’s Statement of Assets and Liabilities at March 31, 2010 is disclosed in the following table:
| | | | | | |
Fair Values of Derivative Financial Instruments at March 31, 2010 | |
Asset Derivatives | | | | | | |
| | | Balance Sheet Location | | Fair Value | |
Foreign exchange contracts | | Assets - Unrealized appreciation on forward currency contracts | | $ | 1,114,829 | |
Liability Derivatives | | | | | | |
| | | Balance Sheet Location | | Fair Value | |
Foreign exchange contracts | | Liabilities - Unrealized depreciation on forward currency contracts | | $ | (14,552 | ) |
The realized gains (losses) from forward currency contracts, and the change in unrealized appreciation (depreciation) of outstanding forward currency contracts recognized in the Fund’s Statement of Operations for the six months ended March 31, 2010 is disclosed in the following tables:
| | | | | | | | |
Amount of Realized Gain (Loss) on Derivative Financial Instruments Recognized in Income for the Six Months Ended March 31, 2010 | |
| | |
| | | Total | | | Forward Currency Contracts | |
Foreign exchange contracts | | $ | (6,140 | ) | | $ | (6,140 | ) |
|
Change in Unrealized Appreciation (Depreciation) of Derivative Financial Instruments Recognized in Income for the Six Months Ended March 31, 2010 | |
| | | Total | | | Forward Currency Contracts | |
Foreign exchange contracts | | $ | 1,101,841 | | | $ | 1,101,841 | |
OTHER NOTES
Fund management believes no events have occurred between March 31, 2010 and May 20, 2010, the date of issuance of the financial statements, that require adjustment of, or disclosure in, the accompanying financial statements.
Certified Semi-Annual Report 25
FINANCIAL HIGHLIGHTS
Thornburg International Growth Fund
| | | | | | | | | | | | | | | | | | | | | | | | | | | | | | | | | | | | | | | | | | | | |
| | | PER SHARE PERFORMANCE (for a share outstanding throughout the period)+ | | RATIOS TO AVERAGE NET ASSETS | | | SUPPLEMENTAL DATA |
Unless
Otherwise
Noted,
Periods
are Fiscal
Years
Ended
Sept. 30, | | Net Asset
Value
Beginning
of Period | | Net
Investment
Income
(Loss) | | | Net
Realized
&
Unrealized
Gain (Loss)
on
Investments | | | Total from
Investment
Operations | | | Dividends
from Net
Investment
Income | | | Dividends
from Net
Realized
Gains | | | Total
Dividends | | | Net
Asset
Value
End
of
Period | | Net
Investment
Income
(Loss)
(%) | | | Expenses,
After
Expense
Reductions
(%) | | | Expenses,
After
Expense
Reductions
and
Net of
Custody
Credits
(%) | | | Expenses,
Before
Expense
Reductions
(%) | | | Total
Return
(%)(a) | | | Portfolio
Turnover
Rate (%) | | Net Assets
at End
of Period
(Thousands) |
Class A Shares | | | | | | | | | | | | | | | | | | | | | | | | | | | |
2010(b)(c) | | $ | 10.36 | | 0.01 | | | 1.24 | | | 1.25 | | | (0.05 | ) | | — | | | (0.05 | ) | | $ | 11.56 | | 0.13 | (d) | | 1.61 | (d) | | 1.61 | (d) | | 1.69 | (d) | | 12.12 | | | 63.24 | | $ | 29,132 |
2009(c) | | $ | 10.35 | | 0.04 | | | 0.10 | | | 0.14 | | | (0.13 | ) | | — | | | (0.13 | ) | | $ | 10.36 | | 0.52 | | | 1.62 | | | 1.61 | | | 1.95 | | | 1.89 | | | 103.57 | | $ | 24,015 |
2008(c) | | $ | 14.92 | | 0.07 | | | (4.27 | ) | | (4.20 | ) | | — | | | (0.37 | ) | | (0.37 | ) | | $ | 10.35 | | 0.53 | | | 1.56 | | | 1.55 | | | 1.63 | | | (28.98 | ) | | 54.31 | | $ | 28,414 |
2007(c)(e) | | $ | 11.94 | | (0.03 | ) | | 3.01 | | | 2.98 | | | — | | | — | | | — | | | $ | 14.92 | | (0.29 | )(d) | | 1.64 | (d) | | 1.62 | (d) | | 2.10 | (d) | | 24.96 | | | 113.34 | | $ | 25,145 |
Class C Shares | | | | | | | | | | | | | | | | | | | | | | | | | | | |
2010(b) | | $ | 10.33 | | (0.04 | ) | | 1.25 | | | 1.21 | | | — | | | — | | | — | | | $ | 11.54 | | (0.66 | )(d) | | 2.38 | (d) | | 2.38 | (d) | | 2.50 | (d) | | 11.71 | | | 63.24 | | $ | 21,931 |
2009 | | $ | 10.22 | | (0.02 | ) | | 0.18 | | | 0.16 | | | (0.05 | ) | | — | | | (0.05 | ) | | $ | 10.33 | | (0.21 | ) | | 2.37 | | | 2.37 | | | 2.72 | | | 1.76 | | | 103.57 | | $ | 19,233 |
2008 | | $ | 14.85 | | (0.03 | ) | | (4.23 | ) | | (4.26 | ) | | — | | | (0.37 | ) | | (0.37 | ) | | $ | 10.22 | | (0.23 | ) | | 2.32 | | | 2.32 | | | 2.45 | | | (29.53 | ) | | 54.31 | | $ | 23,638 |
2007(e) | | $ | 11.94 | | (0.10 | ) | | 3.01 | | | 2.91 | | | — | | | — | | | — | | | $ | 14.85 | | (1.13 | )(d) | | 2.39 | (d) | | 2.38 | (d) | | 3.23 | (d) | | 24.37 | | | 113.34 | | $ | 12,376 |
Class I Shares | | | | | | | | | | | | | | | | | | | | | | | | | | | |
2010(b) | | $ | 10.44 | | 0.04 | | | 1.25 | | | 1.29 | | | (0.09 | ) | | — | | | (0.09 | ) | | $ | 11.64 | | 0.74 | (d) | | 0.99 | (d) | | 0.99 | (d) | | 1.24 | (d) | | 12.45 | | | 63.24 | | $ | 27,873 |
2009 | | $ | 10.46 | | 0.10 | | | 0.08 | | | 0.18 | | | (0.20 | ) | | — | | | (0.20 | ) | | $ | 10.44 | | 1.17 | | | 0.99 | | | 0.99 | | | 1.42 | | | 2.56 | | | 103.57 | | $ | 24,313 |
2008 | | $ | 14.99 | | 0.14 | | | (4.30 | ) | | (4.16 | ) | | — | | | (0.37 | ) | | (0.37 | ) | | $ | 10.46 | | 1.03 | | | 1.00 | | | 0.99 | | | 1.25 | | | (28.57 | ) | | 54.31 | | $ | 28,164 |
2007(e) | | $ | 11.94 | | 0.05 | | | 3.00 | | | 3.05 | | | — | | | — | | | — | | | $ | 14.99 | | 0.52 | (d) | | 1.01 | (d) | | 0.99 | (d) | | 1.64 | (d) | | 25.54 | | | 113.34 | | $ | 27,659 |
Class R3 Shares | | | | | | | | | | | | | | | | | | | | | | | | | | | |
2010(b) | | $ | 10.33 | | 0.01 | | | 1.24 | | | 1.25 | | | (0.06 | ) | | — | | | (0.06 | ) | | $ | 11.52 | | 0.21 | (d) | | 1.50 | (d) | | 1.50 | (d) | | 4.19 | (d) | | 12.16 | | | 63.24 | | $ | 846 |
2009 | | $ | 10.36 | | 0.08 | | | 0.06 | | | 0.14 | | | (0.17 | ) | | — | | | (0.17 | ) | | $ | 10.33 | | 0.94 | | | 1.46 | | | 1.46 | | | 6.14 | (f) | | 2.09 | | | 103.57 | | $ | 748 |
2008(g) | | $ | 13.94 | | 0.09 | | | (3.67 | ) | | (3.58 | ) | | — | | | — | | | — | | | $ | 10.36 | | 1.08 | (d) | | 1.50 | (d) | | 1.49 | (d) | | 26.47 | (d)(f) | | (25.68 | ) | | 54.31 | | $ | 113 |
Class R4 Shares | | | | | | | | | | | | | | | | | | | | | | | | | | | |
2010(b) | | $ | 10.29 | | 0.02 | | | 1.25 | | | 1.27 | | | (0.07 | ) | | — | | | (0.07 | ) | | $ | 11.49 | | 0.33 | (d) | | 1.39 | (d) | | 1.39 | (d) | | 691.88 | (d)(f) | | 12.36 | | | 63.24 | | $ | 3 |
2009 | | $ | 10.36 | | 0.07 | | | 0.06 | | | 0.13 | | | (0.20 | ) | | — | | | (0.20 | ) | | $ | 10.29 | | 0.82 | | | 1.40 | | | 1.40 | | | 980.09 | (f) | | 2.10 | | | 103.57 | | $ | 2 |
2008(g) | | $ | 13.94 | | 0.10 | | | (3.68 | ) | | (3.58 | ) | | — | | | — | | | — | | | $ | 10.36 | | 1.16 | (d) | | 1.40 | (d) | | 1.40 | (d) | | 861.94 | (d)(f) | | (25.68 | ) | | 54.31 | | $ | 2 |
Class R5 Shares | | | | | | | | | | | | | | | | | | | | | | | | | | | |
2010(b) | | $ | 10.46 | | (0.05 | ) | | 1.35 | | | 1.30 | | | (0.09 | ) | | — | | | (0.09 | ) | | $ | 11.67 | | (0.91 | )(d) | | 0.99 | (d) | | 0.99 | (d) | | 9.00 | (d)(f) | | 12.52 | | | 63.24 | | $ | 11 |
2009 | | $ | 10.46 | | 0.08 | | | 0.11 | | | 0.19 | | | (0.19 | ) | | — | | | (0.19 | ) | | $ | 10.46 | | 0.92 | | | 0.97 | | | 0.97 | | | 522.27 | (f) | | 2.53 | | | 103.57 | | $ | 9 |
2008(g) | | $ | 14.03 | | 0.14 | | | (3.71 | ) | | (3.57 | ) | | — | | | — | | | — | | | $ | 10.46 | | 1.57 | (d) | | 0.96 | (d) | | 0.95 | (d) | | 851.43 | (d)(f) | | (25.45 | ) | | 54.31 | | $ | 2 |
| (a) | Not annualized for periods less than one year. |
| (b) | Unaudited Six Month Period Ended March 31. |
| (c) | Sales loads are not reflected in computing total return. |
| (e) | Fund commenced operations on February 1, 2007. |
| (f) | Due to the size of net assets and fixed expenses, ratios may appear disproportionate. |
| (g) | Effective date of this class of shares was February 1, 2008. |
| + | Based on weighted average shares outstanding. |
See notes to financial statements.
| | |
| 26 Certified Semi-Annual Report | | Certified Semi-Annual Report 27 |
| | |
| EXPENSE EXAMPLE | | |
| Thornburg International Growth Fund | | March 31, 2010 (Unaudited) |
As a shareholder of the Fund, you incur two types of costs:
| | (1) | transaction costs, including |
(a) sales charges (loads) on purchase payments for Class A shares;
(b) a deferred sales charge on redemptions of any part or all of a purchase of $1 million of Class A shares within 12 months of purchase;
(c) a deferred sales charge on redemptions of Class C shares within 12 months of purchase;
(d) a 30-day redemption fee on Class A and Class I shares;
| | (2) | ongoing costs, including management fees; distribution and/or service (12b-1) fees; and other Fund expenses. |
This example is intended to help you understand your ongoing costs (in dollars) of investing in the Fund and to compare these costs with the ongoing costs of investing in other mutual funds.
The example is based on a $1,000 investment beginning on October 1, 2009, and held until March 31, 2010.
ACTUAL EXPENSES
For each class of shares, the first line of the table at right provides information about actual account values and actual expenses. You may use the information in this line, together with the amount you invested, to estimate the expenses that you paid over the period. Simply divide your account value by $1,000 (for example, an $8,600 account value divided by $1,000 = 8.6), then multiply the result by the number in the first line for your class of shares under the heading entitled “Expenses Paid During Period” to estimate the expenses you paid on your account during this period.
HYPOTHETICAL EXAMPLE FOR COMPARISON PURPOSES
For each class of shares, the second line of the table at right provides information about hypothetical account values and hypothetical expenses based on the Fund’s actual expense ratio and an assumed rate of return of 5% per year before expenses, which is not the Fund’s actual return. The hypothetical account values and expenses may not be used to estimate the actual ending account balance or expenses you paid for the period. You may use this information to compare the ongoing costs of investing in the Fund and other funds. To do so, compare this 5% hypothetical example with the 5% hypothetical examples that appear in the shareholder reports of the other funds.
| | | | | | | | | |
| | | Beginning
Account Value
10/1/09 | | Ending
Account Value
3/31/10 | | Expenses Paid
During Period†
10/1/09–3/31/10 |
Class A Shares | | | | | | | | | |
Actual | | $ | 1,000.00 | | $ | 1,121.20 | | $ | 8.51 |
Hypothetical* | | $ | 1,000.00 | | $ | 1,016.91 | | $ | 8.09 |
Class C Shares | | | | | | | | | |
Actual | | $ | 1,000.00 | | $ | 1,117.10 | | $ | 12.54 |
Hypothetical* | | $ | 1,000.00 | | $ | 1,013.08 | | $ | 11.93 |
Class I Shares | | | | | | | | | |
Actual | | $ | 1,000.00 | | $ | 1,124.50 | | $ | 5.24 |
Hypothetical* | | $ | 1,000.00 | | $ | 1,020.00 | | $ | 4.99 |
Class R3 Shares | | | | | | | | | |
Actual | | $ | 1,000.00 | | $ | 1,121.60 | | $ | 7.93 |
Hypothetical* | | $ | 1,000.00 | | $ | 1,017.45 | | $ | 7.54 |
Class R4 Shares | | | | | | | | | |
Actual | | $ | 1,000.00 | | $ | 1,123.60 | | $ | 7.35 |
Hypothetical* | | $ | 1,000.00 | | $ | 1,018.01 | | $ | 6.99 |
Class R5 Shares | | | | | | | | | |
Actual | | $ | 1,000.00 | | $ | 1,125.20 | | $ | 5.24 |
Hypothetical* | | $ | 1,000.00 | | $ | 1,020.00 | | $ | 4.98 |
| † | Expenses are equal to the annualized expense ratio for each class (A: 1.61%; C: 2.38%; I: 0.99%; R3: 1.50%; R4: 1.39%; R5: 0.99%) multiplied by the average account value over the period, multiplied by 182/365 to reflect the one-half year period. |
| * | Hypothetical assumes a rate of return of 5% per year before expenses. |
Please note that the expenses shown in the table are meant to highlight your ongoing costs only and do not reflect any transactional costs, such as sales charges (loads), redemption fees, or exchange fees. Therefore, the second line of the table for each class of shares is useful in comparing ongoing costs only, and will not help you determine the relative total costs of owning different funds. In addition, if these transactional costs were included, your costs would have been higher.
28 Certified Semi-Annual Report
| | |
| INDEX COMPARISON | | |
| Thornburg International Growth Fund | | March 31, 2010 (Unaudited) |
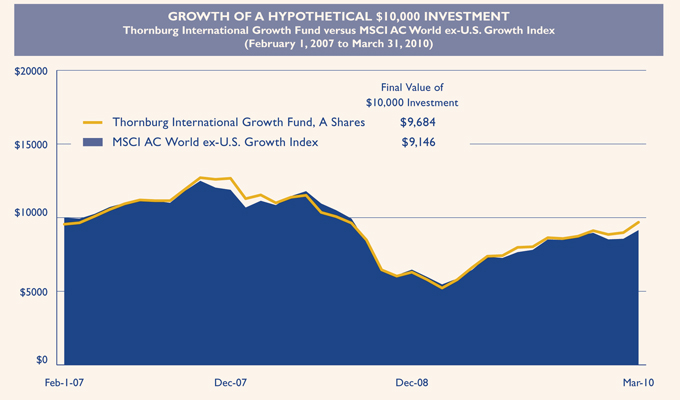
| | | | | | | | | |
AVERAGE ANNUAL TOTAL RETURNS For periods ended March 31, 2010 (with sales charge) | |
| | | |
| | | 1 Yr | | | 3 Yr | | | Since
Inception | |
| | | |
A Shares (Incep: 2/1/07) | | 59.78 | % | | -2.84 | % | | -1.01 | % |
| | | |
C Shares (Incep: 2/1/07) | | 66.00 | % | | -1.90 | % | | -0.11 | % |
| | | |
I Shares (Incep: 2/1/07) | | 68.43 | % | | -0.75 | % | | 1.07 | % |
| | | |
R3 Shares (Incep: 2/1/08) | | 67.44 | % | | — | | | -7.19 | % |
| | | |
R4 Shares (Incep: 2/1/08) | | 67.81 | % | | — | | | -7.11 | % |
| | | |
R5 Shares (Incep: 2/1/08) | | 68.38 | % | | — | | | -6.73 | % |
| | | |
MSCI AC World ex-U.S. | | | | | | | | | |
Growth Index (Since 2/1/07) | | 56.14 | % | | -3.72 | % | | -2.78 | % |
Performance data reflects past performance, which is no guarantee of future results. The performance data and graph do not reflect the deduction of taxes that a shareholder would pay on distributions or the redemption of Fund shares. Returns reflect the reinvestment of dividends and capital gains as well as applicable sales charges. Class A shares are sold with a maximum sales charge of 4.50%. Class C shares are subject to a 1% CDSC for the first year only. There is no up-front sales charge for Class I, R3, R4 and R5 shares. Class A and I shares are subject to a 1% 30-day redemption fee.
The MSCI All Country (AC) World ex-U.S. Growth Index includes growth companies in developed and emerging markets throughout the world, excluding the United States. Indices do not take into account fees and expenses. Investors cannot make direct investments in an index.
Certified Semi-Annual Report 29
| | |
| OTHER INFORMATION | | |
| Thornburg International Growth Fund | | March 31, 2010 (Unaudited) |
PORTFOLIO PROXY VOTING
Policies and Procedures:
The Trust has delegated to Thornburg Investment Management, Inc. (the “Advisor”) voting decisions respecting proxies for the Fund’s voting securities. The Advisor makes voting decisions in accordance with its Proxy Voting Policy and Procedures. A description of the Policy and Procedures is available (i) without charge, upon request, by calling the Advisor toll-free at 1-800-847-0200, (ii) on the Thornburg web site at www.thornburg.com, and (iii) on the Securities and Exchange Commission’s web site at www.sec.gov.
Information regarding how proxies were voted is available on or before August 31 of each year for the twelve months ending the preceding June 30. This information is available (i) without charge, upon request by calling the Advisor toll-free at 1-800-847-0200, (ii) on the Thornburg web site at www.thornburg.com, and (iii) on the Securities and Exchange Commission’s web site at www.sec.gov.
AVAILABILITY OF QUARTERLY PORTFOLIO SCHEDULE
The Fund files with the Securities and Exchange Commission schedules of its portfolio holdings on Form N-Q for the first and third quarters of each fiscal year. The Fund’s Forms N-Q are available on the Commission’s web site at www.sec.gov, or may be reviewed and copied at the Commission’s Public Reference Room in Washington, D.C. Information on the operation of the Public Reference Room may be obtained by calling 1-800-SEC-0330. The Fund also makes this information available on its web site at www.thornburg. com/download or upon request by calling 1-800-847-0200.
30 Certified Semi-Annual Report
Trustees’ Statement to Shareholders
Not part of the Certified Semi-Annual Report
February 8, 2005, as readopted July 22, 2009
The Trustees are concerned that ongoing commentaries and opinions reported in the media may confuse investors in general as to the supervisory duties of trustees of mutual funds and, in particular, leave Thornburg Investment Trust shareholders uncertain regarding how we discharge our responsibilities in supervising the Funds’ investment advisor and in reviewing the advisor’s contract for renewal. We decided to spell out clearly three principal guidelines that we follow in supervising the Trust’s investment advisor on your behalf.
We begin with the premise that each shareholder selected his or her Fund because its investments are managed by the investment advisor identified in the prospectus and in accordance with the objective and policies described in the prospectus. We realize, as each of you do, that if you believe that your Fund’s stated objective and policies no longer serve your personal investment goals, you can sell your shares and leave the Fund.
Therefore, we believe that our primary supervisory task – our principal obligation to you – is to assess the nature and quality of the advisor’s services, and to confirm that the advisor actively and competently pursues the Fund’s objective, in accordance with the policies set out in the prospectus. To do this, we meet regularly with management to review your Fund’s portfolio and to discuss the advisor’s specific actions and judgments in pursuing the Fund’s objective. We do not substitute our own judgment for the advisor’s decisions in selecting investments; the advisor is paid to exercise its informed judgment on investment decisions, and we seek to confirm, in reviewing the advisor’s performance, that the advisor is doing just that.
Second, while we are conscious of costs and the effect that costs have on shareholders’ returns, we do not seek the lowest fees or expense ratio as our sole or primary objective. We try to make sure that your Fund’s fees and costs are reasonable in relationship to the services rendered and that they are generally in line with those charged by other expert investment advisors, consistent with our belief that the Fund’s investors searched for and expect that expertise and attention and have decided to pay a reasonable price for it. We do not put the management contract “out to bid” as a matter of course, and we would not do so unless we had concluded that the advisor materially had failed to pursue the Fund’s objectives in accordance with its policies, or for other equally important reasons. We believe that any other approach would be inconsistent with your interests and contrary to your expectations when you bought shares of the Fund in the first place.
Finally, because we believe that most Thornburg Fund shareholders have invested with a long-term perspective, we try not to focus too much on the fashions of the moment and on short-term performance. The market will not favor any specific investment objective or set of policies at all times and under all economic circumstances. A fund will experience periods of both high and low returns relative to other funds and other investments. Even if one of our Funds is not favored by the market at a particular time, we believe that the advisor is nonetheless obliged to remain true to the Fund’s objective and policies, and we watch to see that it does so.
This page is not part of the Semi-Annual Report. 31
This page intentionally left blank.
32 This page is not part of the Semi-Annual Report.
Retirement and Education Accounts
Thornburg Investment Management offers retirement and education savings accounts that can help you meet a variety of planning challenges. For account applications or further information on any of the accounts below, please call 1-800-847-0200 or go to www.thornburg.com/ira. Your financial advisor can help you determine which plan is right for you.
Individual Retirement Accounts
Individual Retirement Accounts (IRAs) provide a tax-advantaged means to save money for the future. For a detailed outline of the difference between retirement accounts, see www.thornburg.com/ira. Rollovers are available. Call 1-800-847-0200 for more information.
Traditional IRAs – Contributions to Traditional IRAs are tax deductible for eligible individuals, and withdrawals are taxed as additional ordinary income. You may contribute to an IRA if you receive compensation and are under 70 1/ 2, even if you are covered by an employer retirement plan. Deductible contributions are subject to certain qualifications. Please consult your tax advisor.
Roth IRAs – Under a Roth IRA, there is no tax deduction for contributions, but there is no income tax on qualified withdrawals. For a more detailed comparison of Traditional and Roth IRAs, please see our web site at www.thornburg.com/ira.
SEP IRAs – Simplified Employee Pension (SEP) IRAs are established by employers. The employer is allowed a tax deduction for contributions made to the SEP Plan and makes contributions to each eligible employee’s SEP IRA on a discretionary basis.
SIMPLE IRAs – Savings Incentive Match Plan for Employees of Small Employers (SIMPLE) is designed to give small business owners a simplified method to establish and contribute to a retirement plan for employees. The employer is allowed a tax deduction for contributions and makes either matching or non-elective contributions to each eligible employee’s SIMPLE IRA. Employees may make salary deferral contributions.
Coverdell Education Savings Account
These savings accounts are designed to provide a way to save money for higher education expenses. In an Education Savings Account, earnings and interest grow tax-free, and qualified withdrawals used to pay for eligible higher-education expenses are tax- and penalty-free.
Funds Available
The following funds are available in the accounts listed above:
| | • | | Thornburg International Value Fund |
| | • | | Thornburg Core Growth Fund |
| | • | | Thornburg Investment Income Builder Fund |
| | • | | Thornburg Global Opportunities Fund |
| | • | | Thornburg International Growth Fund |
| | • | | Thornburg Developing World Fund |
| | • | | Thornburg Limited Term U.S. Government Fund |
| | • | | Thornburg Limited Term Income Fund |
| | • | | Thornburg Strategic Income Fund |
This page is not part of the Semi-Annual Report. 33

Thornburg Equity Funds
Thornburg’s equity research uses a fundamental and comprehensive analytical approach. Thornburg equity funds focus on a limited number of securities so that each holding can impact performance. The equity team searches for firms believed to have a promising future and seeks to buy shares of those companies at a discount to their intrinsic value.
| | • | | Thornburg International Value Fund |
| | • | | Thornburg Core Growth Fund |
| | • | | Thornburg Investment Income Builder Fund |
| | • | | Thornburg Global Opportunities Fund |
| | • | | Thornburg International Growth Fund |
| | • | | Thornburg Developing World Fund |
Thornburg Bond Funds
Thornburg Investment Management applies a disciplined philosophy to fixed-income management. Since the launch of our first fixed-income fund over 25 years ago, we have been conducting fundamental, bottom-up research in an effort to identify bonds which we believe provide the best return for a given level of risk. We are very organic in our approach, avoiding leverage or complex strategies which could backfire in periods of market uncertainty.
| | • | | Thornburg Limited Term Municipal Fund |
| | • | | Thornburg Intermediate Municipal Fund |
| | • | | Thornburg California Limited Term Municipal Fund |
| | • | | Thornburg New Mexico Intermediate Municipal Fund |
| | • | | Thornburg New York Intermediate Municipal Fund |
| | • | | Thornburg Strategic Municipal Income Fund |
| | • | | Thornburg Limited Term U.S. Government Fund |
| | • | | Thornburg Limited Term Income Fund |
| | • | | Thornburg Strategic Income Fund |
Before investing, carefully consider the Fund’s investment goals, risks, charges, and expenses. For a prospectus containing this and other information, contact your financial advisor or visit thornburg.com. Read it carefully before investing.
For additional information, please visit www.thornburg.com
Thornburg Investment Management, Inc. 2300 North Ridgetop Road, Santa Fe, NM 87506
This page is not part of the Semi-Annual Report. 35
| | | | | | |
 | | Waste not, Wait not | |  |
| | |
| | | | Get instant access to your shareholder reports. |
| | |
| | This Semi-Annual Report is submitted for the general information of shareholders of the Fund. It is not authorized for distribution to prospective investors in the Fund unless preceded or accompanied by an effective prospectus. | | By switching from your postal mailbox to your email inbox, you reduce paper clutter, improve record keeping access, and help conserve our natural resources. |
| | |

| | Investment Advisor: Thornburg Investment Management® | | Go to www.thornburg.com/edelivery and sign up to receive your shareholder reports, prospectuses, and proxy statements electronically. |
| | 800.847.0200 | | | | |
| | Distributor: | | | | |
| | Thornburg Securities Corporation® 800.847.0200 | | You invest in the future, without spending a dime. |
| | TH1409 | | | | |

Important Information
The information presented on the following pages was current as of March 31, 2010. The managers’ views, portfolio holdings, and sector and country diversification are provided for the general information of the Fund’s shareholders; they are historical and subject to change. This material should not be deemed a recommendation to buy or sell any of the securities mentioned.
Investments in the Fund carry risks including possible loss of principal. Investing outside the United States involves additional risks, such as currency fluctuations. Additionally, the Fund may invest a portion of the assets in small capitalization companies, which may increase the risk of greater price fluctuations. As with direct bond ownership, funds that invest in bonds are subject to certain risks including interest-rate risk, credit risk, and inflation risk. The principal value of bonds will fluctuate relative to changes in interest rates, decreasing when interest rates rise. Please see the Fund’s Prospectus for a discussion of the risks associated with an investment in the Fund. Investments in the Fund are not deposits or obligations of, or guaranteed or endorsed by, any bank, the Federal Deposit Insurance Corporation, the Federal Reserve Board or any government agency. There is no guarantee that the Fund will meet its investment objectives.
Performance data given at net asset value (NAV) does not take into account the applicable sales charges. If the sales charges had been included, the performance would have been lower.
Class I, R3, R4, and R5 shares may not be available to all investors. Minimum investments for Class I shares may be higher than those for other classes.
| | | | |
Share Class | | NASDAQ Symbol | | Cusip |
Class A | | TIBAX | | 885-215-558 |
Class C | | TIBCX | | 885-215-541 |
Class I | | TIBIX | | 885-215-467 |
Class R3 | | TIBRX | | 885-215-384 |
Class R4 | | TIBGX | | 885-215-186 |
Class R5 | | TIBMX | | 885-215-236 |
Glossary
Blended Index – The Blended Index is composed of 25% Barclays Capital Aggregate Bond Index and 75% MSCI World Index. The Barclays Capital Aggregate Bond Index is composed of approximately 8,000 publicly traded bonds including U.S. government, mortgage-backed, corporate and Yankee bonds. The index is weighted by the market value of the bonds included in the index. The index is weighted by the market value of the bonds included in the index. The Morgan Stanley Capital International (MSCI) World Index is an unmanaged market-weighted index that consists of over 1,200 securities traded in 23 of the world’s most developed countries. Securities are listed on exchanges in the U.S., Europe, Canada, Australia, New Zealand, and the Far East. The index is calculated with net dividends reinvested, in U.S. dollars.
Russell 1000 Index – Consists of the 1,000 largest securities in the Russell 3000 Index, which represents approximately 90% of the total market capitalization of the Russell 3000 Index. It is a large-cap, market-oriented index and is highly correlated with the S&P 500 Index.
Russell 2000 Index – An unmanaged index generally representative of the 2,000 smallest companies in the Russell 3000 Index, representing approximately 10% of the total market capitalization of the Russell 3000 Index.
Standard & Poor’s 500 Stock Index (S&P 500) – An unmanaged index generally representative of the U.S. stock market.
Unless otherwise noted, index returns reflect the reinvestment of income dividends and capital gains, if any, but do not reflect fees, brokerage commissions or other expenses of investing. Investors may not make direct investments into any index. The performance of any index is not indicative of the performance of any particular investment.
Duration – The weighted maturity of a bond’s cash flows. Duration measures the price sensitivity of a bond for a given change in interest rates. Bonds with longer durations experience greater price volatility than bonds with shorter durations.
Indicated Yield – The yield that a share of stock would return based on the most recent dividend payment. Indicated yield is calculated by dividing the indicated dividend by the current share price. It is usually quoted as a percentage.
Median Market Capitalization – Market capitalization (market cap) is the total value of a company’s stock, calculated by multiplying the number of outstanding common shares by the current share price. The company whose market cap is in the middle of the portfolio is the median market cap. Half the companies in the portfolio have values greater than the median, and half have values that are less.
Price to Earnings Ratio (P/E) – A valuation ratio equaling a company’s market value per share divided by earnings per share.
U.S. Treasury Securities – U.S. Treasury securities, such as bills, notes and bonds, are negotiable debt obligations of the U.S. government. These debt obligations are backed by the “full faith and credit” of the government and issued at various schedules and maturities. Income from Treasury securities is exempt from state and local, but not federal income taxes.
This page is not part of the Semi-Annual Report. 3
The Dividend Landscape
To appreciate the investment environment that Thornburg Investment Income Builder Fund operates in, you may wish to review these highlights of the “dividend landscape.”
The S&P 500 Index Payout Ratio — A Historical Perspective
The dividend payout ratio is a fraction that expresses dividend payments as a percentage of per-share earnings. As the economy slowed in the recent downturn, earnings-per-share on average have declined, causing the payout ratio to climb, even as dividends paid by the S&P 500 portfolio have themselves declined by more than 20 percent in 2009.
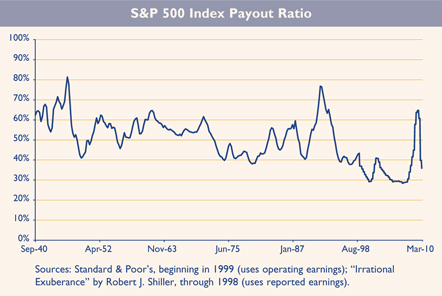
Corporate Willingness to Pay Dividends is Key to the Fund’s Investment Process
The Russell 1000 Index includes 1000 public companies that are supposed to be generally representative of corporate America. Between 1980 and 1993, at least 75% of these firms paid some dividend. Between 1994 and 2001, the percentage of Russell 1000 companies paying dividends sank to just over 50%, indicating a preference towards reinvesting retained earnings in growth initiatives. Dividends returned to fashion between 2002 and 2008, but the current recession has stalled dividend momentum.
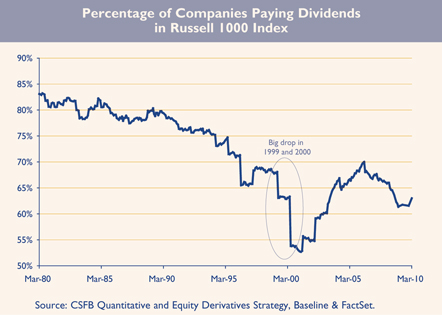
4 This page is not part of the Semi-Annual Report.
Rising Dividend Payments Despite Decreasing Dividend Yields
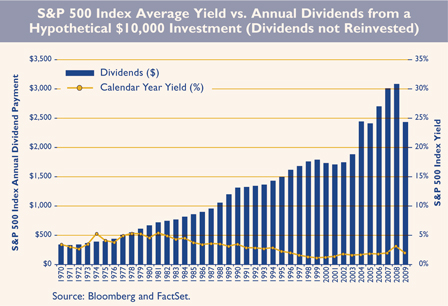
Over time, the dollar dividend per unit of the S&P 500 Index has increased. Because the price of the index itself has increased even more, the yield on the S&P 500 Index, as a percentage of the current index price, has generally decreased in recent decades. You should note, however, that the yield on the original investment made at a fixed point in time (say, 1970 or 1989) has increased, even without reinvestment of dividends.
Hypothetical chart is for illustration purposes only and is not indicative of an investment in any particular security. Investors may not invest directly in an index.
A Truly Diversified Dividend-Paying Portfolio Must Look Beyond the Obvious High Yield Stocks!
The Top 100 Dividend Yields
| | | | | | |
| | | Russell 1000
Index | | | Russell 2000
Index | |
Financials | | 41 | % | | 71 | % |
Real Estate | | 28 | % | | 43 | % |
Banks & Other | | 13 | % | | 28 | % |
Utilities | | 31 | % | | 3 | % |
Communications | | 6 | % | | 6 | % |
Consumer Staples | | 5 | % | | 2 | % |
Energy | | 4 | % | | 5 | % |
Health Care | | 4 | % | | 0 | % |
Consumer Cyclicals | | 3 | % | | 5 | % |
Materials | | 2 | % | | 1 | % |
Technology | | 2 | % | | 3 | % |
Industrials | | 2 | % | | 4 | % |
Source: FactSet, as of March 31, 2010
In the (large cap) Russell 1000 Index, 72% of the top 100 dividend payers are in the Financials and Utilities sectors. In the (small cap) Russell 2000 Index, 71% of the top 100 dividend-yielding stocks are financial companies. In order to construct a diversified portfolio of attractive yielding stocks, one must look beyond these sectors. We do!
Dividend yield is a ratio that shows how much a company pays out in dividends each year relative to its share price.
This page is not part of the Semi-Annual Report. 5
The Dividend Landscape,
Continued
Global Diversification Can Improve the Portfolio Yield
Since firms outside the U.S. tend to pay higher dividends than U.S. firms, particularly outside the real estate and utility sectors, we diversify the Thornburg Investment Income Builder Fund into foreign dividend-paying stocks to try to take advantage of these opportunities.
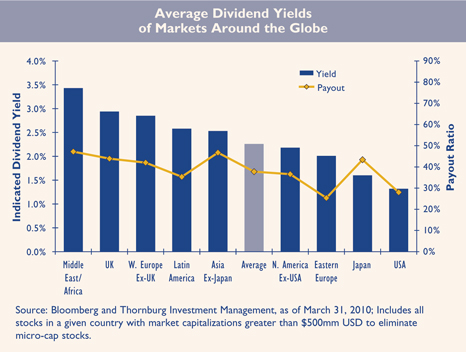
6 This page is not part of the Semi-Annual Report.
Portfolio Overview
Thornburg Investment Income Builder Fund
MANAGEMENT TEAM

IMPORTANT
PERFORMANCE INFORMATION
Performance data shown represents past performance and is no guarantee of future results. Investment return and principal value will fluctuate so shares, when redeemed, may be worth more or less than their original cost. Current performance may be lower or higher than quoted. For performance current to the most recent month end, visit thornburg.com.
The maximum sales charge for Class A shares is 4.50% . Class A shares are subject to a 1% 30-day redemption fee. The total annual fund operating expense of Class A shares is 1.30%, as disclosed in the most recent Prospectus.
We do not expect each sequential quarter’s dividend to increase over that of the prior quarter, since dividend payments outside the United States tend to be seasonal. Rather, the Fund aspires to increase the dividend paid on an annual basis.
QUARTERLY DIVIDEND HISTORY, CLASS A
| | | | | | | | | | | | | | | |
| | | Q1 | | | Q2 | | | Q3 | | | Q4 | | | Total | |
2003 | | 9.2 | ¢ | | 11.2 | ¢ | | 12.4 | ¢ | | 17.5 | ¢ | | 50.3 | ¢ |
2004 | | 10.2 | ¢ | | 12.5 | ¢ | | 15.0 | ¢ | | 21.8 | ¢ | | 59.5 | ¢ |
2005 | | 11.0 | ¢ | | 13.6 | ¢ | | 17.4 | ¢ | | 29.0 | ¢ | | 71.0 | ¢ |
2006 | | 12.5 | ¢ | | 16.0 | ¢ | | 19.2 | ¢ | | 33.0 | ¢ | | 80.7 | ¢ |
2007 | | 14.2 | ¢ | | 18.5 | ¢ | | 21.5 | ¢ | | 36.8 | ¢ | | 91.0 | ¢ |
2008 | | 17.9 | ¢ | | 21.8 | ¢ | | 26.0 | ¢ | | 36.8 | ¢ | | 102.5 | ¢ |
2009 | | 18.0 | ¢ | | 24.2 | ¢ | | 28.0 | ¢ | | 34.5 | ¢ | | 104.7 | ¢ |
2010 | | 19.8 | ¢ | | | | | | | | | | | | |
30-day SEC Yield as of March 31, 2010 (A Shares): 4.71%
KEY PORTFOLIO ATTRIBUTES
As of 3/31/10
| | | | |
Equity Statistics | | | | |
Portfolio P/E (12-mo. trailing) | | | 10.9x | |
Median Market Cap | | $ | 6.8 B | |
Equity & Pref. Equity Holdings | | | 72 | |
| |
Fixed Income Statistics | | | | |
Weighted Average Coupon | | | 6.8 | % |
Average Maturity | | | 12.25 yrs | |
Duration | | | 4.44 yrs | |
Bond Holdings | | | 202 | |
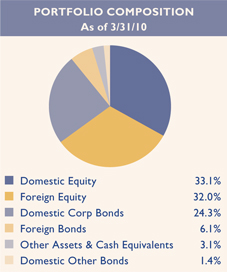
AVERAGE ANNUAL TOTAL RETURNS
FOR PERIODS ENDED 3/31/10
| | | | | | | | | | | | |
| | | 1 Yr | | | 3 Yrs | | | 5 Yrs | | | Since
Inception | |
A Shares (Incep: 12/24/02) | | | | | | | | | | | | |
Without sales charge | | 55.10 | % | | 1.99 | % | | 7.96 | % | | 12.08 | % |
With sales charge | | 48.16 | % | | 0.43 | % | | 6.97 | % | | 11.38 | % |
Blended Index* (Since 12/24/02) | | 40.12 | % | | -2.21 | % | | 3.83 | % | | 7.36 | % |
S&P 500 Index (Since 12/24/02) | | 49.77 | % | | -4.17 | % | | 1.92 | % | | 5.88 | % |
| * | Blended Index: 25% Barclays Capital Aggregate Bond Index/75% MSCI World Index |
This page is not part of the Semi-Annual Report. 7
Portfolio Overview,
Continued
The primary investment objective of Thornburg Investment Income Builder Fund is to provide a level of current income which exceeds the average yield on U.S. stocks, and which will generally grow, subject to periodic fluctuations, over the years on a per share basis. This objective remains constant over time. However, the specific investments we have used to try to reach our objective have changed over time. There is no guarantee the Fund will meet its investment objectives.
Business conditions for various industries and operating effectiveness at individual firms change over time. Investor preferences, expressed as both absolute and relative prices, also change over time. In the view of your portfolio management team, “some doors close and others open.” As shown in the tables below, the percentage industry allocations of your Fund evolve to reflect these changing conditions.
TOP TEN INDUSTRIES
As of 3/31/10
| | | |
Utilities | | 11.8 | % |
Telecommunication Services | | 11.6 | % |
Energy | | 11.5 | % |
Diversified Financials | | 10.3 | % |
Banks | | 7.9 | % |
Food, Beverage & Tobacco | | 6.1 | % |
Real Estate | | 5.9 | % |
Insurance | | 5.6 | % |
Consumer Services | | 4.4 | % |
Software & Services | | 3.3 | % |
TOP TEN INDUSTRIES
As of 12/31/09
| | | |
Energy | | 12.5 | % |
Telecommunication Services | | 12.2 | % |
Utilities | | 10.1 | % |
Diversified Financials | | 9.0 | % |
Banks | | 7.9 | % |
Real Estate | | 5.8 | % |
Insurance | | 5.1 | % |
Consumer Services | | 4.9 | % |
Food, Beverage & Tobacco | | 4.8 | % |
Software & Services | | 3.8 | % |
TOP TEN INDUSTRIES
As of 9/30/09
| | | |
Telecommunication Services | | 14.5 | % |
Energy | | 12.7 | % |
Utilities | | 11.2 | % |
Diversified Financials | | 10.1 | % |
Banks | | 8.8 | % |
Food, Beverage & Tobacco | | 6.2 | % |
Real Estate | | 5.3 | % |
Insurance | | 4.6 | % |
Consumer Services | | 4.6 | % |
Materials | | 2.9 | % |
TOP TEN INDUSTRIES
As of 6/30/09
| | | |
Telecommunication Services | | 15.2 | % |
Utilities | | 13.1 | % |
Energy | | 10.2 | % |
Banks | | 9.1 | % |
Diversified Financials | | 8.3 | % |
Food, Beverage & Tobacco | | 8.0 | % |
Insurance | | 6.2 | % |
Real Estate | | 5.7 | % |
Consumer Services | | 3.9 | % |
Pharmaceuticals, Biotechnology & Life Sciences | | 3.0 | % |
8 This page is not part of the Semi-Annual Report.

Thornburg Investment Income Builder Fund
March 31, 2010
This report is certified under the Sarbanes-Oxley Act of 2002, which requires that public companies, including mutual funds, affirm that the information provided in their annual and semi-annual shareholder reports fully and fairly represents their financial position.
Certified Semi-Annual Report 9
Letter to Shareholders
April 19, 2010
Dear Fellow Shareholder:
This letter will review the basic results of Thornburg Investment Income Builder Fund’s investment activities for the six-month fiscal period ended March 31, 2010, and comment on the overall investment landscape, which continues to evolve in important ways.
Thornburg Investment Income Builder paid ordinary quarterly dividends of 54.3¢ per class A share in the six-month period ended March 31, 2010, down marginally from 54.8¢ in the comparable six-month period of the prior fiscal year. The dividend per share was higher for I shares and lower for C shares, to account for varying class-specific expenses.
Your Fund’s net asset value increased by 98¢ per Class A share during the six-month fiscal period under review, to $18.36. As another reference point, the net asset values of the Class A and C shares one year earlier, March 31, 2009, were both $12.59. Congratulations to those shareholders who resisted the urge to join the financial asset selling frenzy of Q4 2008 and Q1 2009. Double congratulations to those who added to their Investment Income Builder Fund position at a depressed price during those months. Owners of approximately 57 million shares of Thornburg Investment Income Builder Fund sold their shares at an average price of approximately $13.39 per share between October 1, 2008, and March 31, 2009.
Your Fund outperformed its blended benchmark (75% MSCI World Index; 25% Barclays Capital Aggregate Bond Index) by 2.7% over the six-month fiscal period, and the Fund underperformed the Standard & Poor’s 500 Index by 2.9% over the same period. Performance comparisons of Investment Income Builder Fund to each of these benchmarks over various longer periods are shown on page 45 of this report. Reviewing these, you will see that the performance of your Fund has compared very well to both benchmarks over longer periods.
In assessing the performance of your Fund, it is constructive to consider the performance in U.S. dollars of the sector components of the MSCI World Index over the six months ended March 31, 2010. This comprises 75% of the Blended Index, and the entire equity portion, of our global performance benchmark:
| | 1. | Nine of ten index sectors showed positive total returns, ranging from 14% (materials) to less than 1% (telecommunication services). |
| | 2. | One sector (utilities) showed a total return of negative 1%. |
Telecommunication services and utilities happen to be the second- and fourth-highest weighted sectors in your Fund’s portfolio, and the two where your portfolio has its largest overweights, relative to the MSCI World Index.
Relative to the index weightings, Investment Income Builder Fund had relatively large portfolio allocations in telecommunication services firms, utilities, and financials. While your Fund’s investments in telecommunication stocks delivered slightly negative returns, its holdings in the financial sector performed very well, outpacing the performance of index financials by 16%. Since the Fund’s average portfolio weighting in financials was around 25%, these investments were the largest single driver of your Fund’s outperformance for the period. We continue to have large weightings in these industry sectors, where we find a relatively high concentration of cash-generative dividend-paying businesses.
Among the best contributing investments to portfolio performance from the financial sector were business development company Apollo Investment Corporation, Swiss Re Capital 6.85% notes, convertible preferred stocks from Fifth Third
10 Certified Semi-Annual Report
Bancorp and Huntington Bancshares, and KKR Financial Holdings, LLC. Apart from financial sector investments, Australia’s Seek (internet job exchange) and Macquarie Airports Group (airport operator) performed well, as did Microsoft, Dominion Resources, and McDonald’s.
Investment Income Builder Fund’s underweightings to equities in the industrials, information technology, and materials sectors detracted from portfolio performance in the period under review. In general, these sectors have fewer high dividend payers, so we expect your portfolio’s under-allocation here to persist. Performance laggards from your portfolio for the period under review were primarily European dividend-paying businesses: telecom service providers KPN, France Telecom, and Telefónica; and utilities E.ON AG and Enel. Other below-average performers included Diamond Offshore and ENI from the energy industry, financial exchange operators Bolsas y Mercados Españoles and Hong Kong Exchange & Clearing, and Greek lottery operator OPAP. A portion of the underperformance for eight of these ten stocks relates to depreciation of the Euro vis-à-vis the U.S. dollar, though we hedged some of this currency risk to mitigate the damage. Only Bolsas y Mercados had a stock price decline exceeding 20% for the period.
Within its bond portfolio, the Investment Income Builder Fund owned significantly fewer U.S. government and agency bonds than the Barclays Capital Aggregate Bond Index. This fact hurt the relative performance of your Fund’s portfolio in 2008. It has been quite helpful over the last year, as both the relative and absolute performance of corporate bonds improved significantly. Readers of this letter who are long-time shareholders of Investment Income Builder Fund will recall that the interest-bearing debt portion of the Fund’s portfolio fell well below 20% during the “yield drought” between 2004 and 2007. For most of 2009, the Investment Income Builder Fund was weighted more than 40% in interest-bearing debt, as a result of large bond purchases we made in response to material increases in non-government bond yields over the four quarters ended March 31, 2009. We have slipped below that level in the first quarter of 2010. We have allocated the great majority of new cash flow into equities, because yields on corporate bonds and other non-government debt securities have dropped to far less interesting levels. We expect this trend to continue in future quarters, probably until market interest rates increase.
The chart on the following page shows that interest-bearing investments as a percentage of your Fund’s portfolio have varied over time, ranging from less than 12% in mid-2005 to 45% at March 31, 2009. We tend to buy more bonds when bond prices are depressed, as was the case in late 2008 and early 2009.
As of March 31, 2010, your portfolio included more than 180 bonds and hybrid securities, with an average cost of approximately 84% of the maturity value of these bonds. In general, secondary market prices of these bonds increased over the six-month period ended March 31, 2010, so the average market price of these bonds on March 31, 2010, was approximately 98% of maturity value.
In the six-month fiscal period ended March 31, 2010, approximately 57% of Investment Income Builder Fund’s income was derived from stock dividends, with the remaining 43% coming from fixed income holdings. At March 31, 2010, domestic stocks, including preferred stocks, composed around 33% of your portfolio; foreign stocks around 32%, and interest bearing investments 35%.
In recent years, the dividend increases paid by Investment Income Builder have been powered primarily by dividend increases from the Fund’s equity holdings. These increases slowed significantly over the last year. We attempted to “weed” the portfolio of firms suffering significant business setbacks during the recent global recession. Some firms that we continued to hold elected to pay down debt or retain more cash to increase flexibility. Other firms that had the ability to pay increased dividends lacked the willingness to do so, sometimes for political reasons. In the period under review, companies in the Investment Income Builder portfolio lowered their per-share dividends by an average of 2.2% . Twenty-five of these companies increased their per-share stock dividends, while eighteen decreased their dividends. The others held dividends constant.
Certified Semi-Annual Report 11
Letter to Shareholders,
Continued
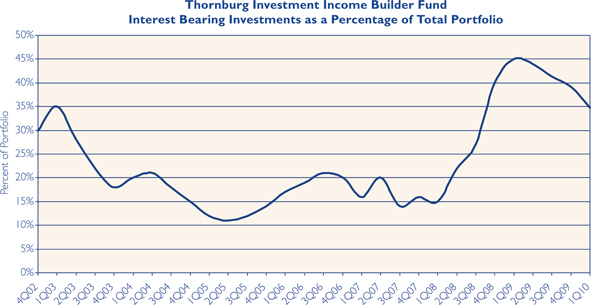
In general, the sustainability of dividends from your portfolio holdings has exceeded that of most major index portfolios, which typically showed annual declines exceeding 20% during 2009. In 2009, companies in the S&P 500 Index paid dividends totaling $196 billion, a 21% decline from the $248 billion paid in 2008. Cash dividends paid by S&P 500 companies in the first quarter of 2010 declined an additional 8% from the observed levels of the first quarter 2009.* Standard & Poor’s expects dividend payments to begin recovering slowly later this year. The general scarcity of growing dividends, plus the much reduced yields now available from bond investments, impeded our ability to increase your Fund’s dividend vs. the prior year for the period under review.
If the global economy recovers, we expect firming interest rates, better business conditions, and reduced anxiety from corporate boards about distributing retained earnings. To the extent the global economy remains sluggish, it will be very challenging for us to increase your Fund’s dividend payments on a year-over-year basis.
The average per-share earnings of companies whose stocks are in the Investment Income Builder portfolio increased by just over 9% in 2009, compared to the 15% increase in operating earnings delivered by the S&P 500 Index and the 3.5% decrease in the MSCI World Index. Of course, S&P 500 Index portfolio operating earnings declined by 40.5% in 2008, from $731 billion to $435 billion, while the average earnings of stocks held in the Investment Income Builder Fund increased by approximately 1% in 2008. Recognizing that conditions can change, we currently expect a modest percentage increase in average earnings from the companies in your Fund’s portfolio this year. We are hopeful that this will set a foundation for future annual dividend increases from our equity holdings.
Expectations for GDP and corporate earnings have improved in most markets around the world between October 1, 2009 and March 31, although there are stubborn corners of resistance. Greece gets much of the publicity in this regard. While
| * | Source: Standard & Poor’s, 5/3/2010 |
12 Certified Semi-Annual Report
very small on its own, some investors consider the current drama in Greece to have elements of problems that are more widespread in a broad group of industrial democracies: bloated public sectors that cannot be supported by a straining private sector, high debt load, and unsustainable deficits.
We are concerned about these issues. At the same time, we can see that global consumer demand is holding up well, strongly supported by emerging economies with modest public and private debt loads and expanding private sectors. Inventories of primary, intermediate, and finished goods were drawn down significantly between late 2008 and mid-2009. The rebuilding of inventories, even as final demand expands on a global basis, is leading to a powerful industrial recovery. Since the U.S. economy came to be over-dependent on residential real estate over the last generation, certain geographies in this country that were particularly caught up in that phenomenon are still in the penalty box. It is also very challenging for those whose jobs depended in any way on the U.S. residential real estate boom to find work. Aggregate employment statistics for the United States reflect that, as we struggle to channel production and employment in other uses. To a large extent, this is not a global issue. The United States is well into its third year of trying to reorient its economy. We are beginning to see signs that the costly trip down the road of too much real estate consumption will quit being a drag on the real economy and the financial sector later this year.
From mid-2007 until the end of 2009, an overwhelming majority of new investor dollars have flowed into bank deposits and money market funds. Yields on taxable and tax-exempt money funds have dropped below one-fourth of one percent, and banks have aggressively reduced yields on all deposits. It is only a matter of time before a very large pool of investor dollars will be looking for better returns elsewhere, but in sensible investment programs. This process is already underway, as evidenced by the sizable flows of investor dollars into bond funds and individual bonds. We are optimistic that the types of income-producing investments owned by the Thornburg Investment Income Builder Fund will experience sustainable popularity among investors as their intrinsic values for income production are recognized. A high percentage of investor funds belong to people over the age of 55, for whom income is an increasingly necessary and desirable attribute.
Thank you for being a shareholder of Thornburg Investment Income Builder Fund. Remember that you can review descriptions of many of the stocks in your portfolio at your leisure by going to our internet site, www.thornburg.com/funds. Best wishes for a wonderful summer.
The matters discussed in this report may constitute forward-looking statements made pursuant to the safe harbor provisions of the Securities Litigation Reform Act of 1995. These include any advisor or portfolio manager prediction, assessment, analysis or outlook for individual securities, industries, investment styles, market sectors and/or markets. These statements involve risks and uncertainties. In addition to the general risks described for each fund in its current prospectus, other factors bearing on these reports include the accuracy of the advisor’s or portfolio manager’s forecasts and predictions, the appropriateness of the investment strategies designed by the advisor or portfolio manager, and the ability of the advisor or portfolio manager to implement their strategies efficiently and successfully. Any one or more of these factors, as well as other risks affecting the securities markets generally, could cause the actual results of any fund to differ materially as compared to its benchmarks.
Certified Semi-Annual Report 13
| | |
| SCHEDULE OF INVESTMENTS | | |
| |
| Thornburg Investment Income Builder Fund | | March 31, 2010 (Unaudited) |
SUMMARY OF INDUSTRY EXPOSURE
As of 3/31/10
| | | |
Utilities | | 11.8 | % |
Telecommunication Services | | 11.6 | % |
Energy | | 11.5 | % |
Diversified Financials | | 10.3 | % |
Banks | | 7.9 | % |
Food, Beverage & Tobacco | | 6.1 | % |
Real Estate | | 5.9 | % |
Insurance | | 5.6 | % |
Consumer Services | | 4.4 | % |
Software & Services | | 3.3 | % |
Transportation | | 2.7 | % |
Materials | | 2.5 | % |
Semiconductors & Semiconductor Equipment | | 2.5 | % |
Pharmaceuticals, Biotechnology & Life Sciences | | 2.1 | % |
Food & Staples Retailing | | 1.6 | % |
Commercial & Professional Services | | 1.4 | % |
Media | | 1.1 | % |
Capital Goods | | 0.7 | % |
Miscellaneous | | 0.5 | % |
Retailing | | 0.3 | % |
Consumer Durables & Apparel | | 0.2 | % |
Industrials | | 0.2 | % |
Automobiles & Components | | 0.2 | % |
Technology Hardware & Equipment | | 0.1 | % |
Other Non-Classified Securities: | | | |
Exchange Traded Funds | | 1.1 | % |
Other Securities | | 0.6 | % |
Asset Backed Securities | | 0.4 | % |
U.S. Government Agencies | | 0.3 | % |
Municipal Bonds * | | 0.0 | % |
Other Assets & Cash Equivalents | | 3.1 | % |
| * | Percentage was less than 0.1%. |
TOP TEN HOLDINGS
As of 3/31/10
| | | |
Telstra Corp. Ltd. | | 2.5 | % |
McDonald’s Corp. | | 2.4 | % |
Philip Morris | | 2.3 | % |
Eli Lilly & Co. | | 2.0 | % |
Apollo Investment Corp. | | 2.0 | % |
E. ON AG | | 1.9 | % |
RWE AG | | 1.8 | % |
Microsoft Corp. | | 1.8 | % |
BP plc | | 1.7 | % |
Huntington Bancshares Pfd, 8.50% | | 1.7 | % |
SUMMARY OF COUNTRY EXPOSURE
As of 3/31/10
| | | |
United States | | 58.9 | % |
Australia | | 8.4 | % |
Germany | | 3.6 | % |
United Kingdom | | 3.2 | % |
France | | 3.0 | % |
Italy | | 2.9 | % |
Switzerland | | 2.9 | % |
Netherlands | | 2.3 | % |
Canada | | 1.8 | % |
Greece | | 1.4 | % |
Spain | | 1.2 | % |
China | | 1.2 | % |
Luxembourg | | 1.0 | % |
Taiwan | | 0.7 | % |
Hong Kong | | 0.7 | % |
Mexico | | 0.6 | % |
Brazil | | 0.6 | % |
Bermuda | | 0.5 | % |
Malaysia | | 0.4 | % |
South Africa | | 0.4 | % |
Norway | | 0.4 | % |
South Korea | | 0.3 | % |
Russia | | 0.2 | % |
Indonesia | | 0.1 | % |
Trinidad and Tobago | | 0.1 | % |
Cayman Islands | | 0.1 | % |
Other Assets & Cash Equivalents | | 3.1 | % |
14 Certified Semi-Annual Report
| | |
| SCHEDULE OF INVESTMENTS, CONTINUED | | |
| |
| Thornburg Investment Income Builder Fund | | March 31, 2010 (Unaudited) |
| | | | | |
| | | Shares/
Principal
Amount | | Value |
COMMON STOCK — 61.31% | | | | | |
| | |
BANKS — 3.24% | | | | | |
COMMERCIAL BANKS — 3.24% | | | | | |
Bank of Montreal | | 486,500 | | $ | 29,530,572 |
Banque Cantonale Vaudoise | | 49,619 | | | 23,153,023 |
Intesa Sanpaolo | | 5,503,994 | | | 16,484,833 |
Liechtensteinische Landesbank AG | | 1,005,353 | | | 72,989,162 |
St. Galler Kantonalbank | | 40,000 | | | 18,247,344 |
| | | | | |
| | | | | 160,404,934 |
| | | | | |
| | |
COMMERCIAL & PROFESSIONAL SERVICES — 1.34% | | | | | |
PROFESSIONAL SERVICES — 1.34% | | | | | |
Seek Ltd. | | 9,000,000 | | | 66,235,983 |
| | | | | |
| | | | | 66,235,983 |
| | | | | |
| | |
CONSUMER SERVICES — 4.21% | | | | | |
HOTELS, RESTAURANTS & LEISURE — 4.21% | | | | | |
Berjaya Sports Toto Berhad | | 14,600,000 | | | 20,051,502 |
McDonald’s Corp. | | 1,769,100 | | | 118,034,352 |
OPAP SA | | 3,096,500 | | | 70,262,459 |
| | | | | |
| | | | | 208,348,313 |
| | | | | |
| | |
DIVERSIFIED FINANCIALS — 5.93% | | | | | |
CAPITAL MARKETS — 4.27% | | | | | |
AllianceBernstein Holdings LP | | 750,000 | | | 22,995,000 |
Apollo Investment Corp. | | 7,904,600 | | | 100,625,558 |
Ares Capital Corp. | | 1,625,100 | | | 24,116,484 |
Man Group plc. | | 4,516,958 | | | 16,553,568 |
Prospect Capital Corp. | | 2,538,415 | | | 30,841,742 |
Solar Capital Ltd. | | 764,768 | | | 16,167,196 |
DIVERSIFIED FINANCIAL SERVICES — 1.66% | | | | | |
Bolsas y Mercados Españoles | | 497,300 | | | 13,312,667 |
Hong Kong Exchanges & Clearing Ltd. | | 1,422,800 | | | 23,749,220 |
KKR Financial Holdings, LLC | | 5,500,000 | | | 45,155,000 |
| | | | | |
| | | | | 293,516,435 |
| | | | | |
| | |
ENERGY — 6.98% | | | | | |
ENERGY EQUIPMENT & SERVICES — 1.41% | | | | | |
Diamond Offshore Drilling, Inc. | | 585,900 | | | 52,033,779 |
Fred Olsen Energy ASA | | 473,100 | | | 18,109,815 |
OIL, GAS & CONSUMABLE FUELS — 5.57% | | | | | |
BP plc | | 8,800,100 | | | 83,249,729 |
Canadian Oil Sands Trust | | 992,600 | | | 29,758,942 |
Eni SpA | | 3,435,100 | | | 80,590,190 |
Total SA | | 1,416,300 | | | 82,217,571 |
| | | | | |
| | | | | 345,960,026 |
| | | | | |
| | |
FOOD & STAPLES RETAILING — 1.35% | | | | | |
FOOD & STAPLES RETAILING — 1.35% | | | | | |
Metcash Ltd. | | 9,158,622 | | | 34,794,258 |
Sysco Corp. | | 1,090,000 | | | 32,155,000 |
| | | | | |
| | | | | 66,949,258 |
| | | | | |
Certified Semi-Annual Report 15
| | |
| SCHEDULE OF INVESTMENTS, CONTINUED | | |
| |
| Thornburg Investment Income Builder Fund | | March 31, 2010 (Unaudited) |
| | | | | |
| | | Shares/
Principal
Amount | | Value |
FOOD, BEVERAGE & TOBACCO — 5.41% | | | | | |
BEVERAGES — 2.21% | | | | | |
Coca Cola Co. | | 1,300,000 | | $ | 71,500,000 |
Fosters Group Ltd. | | 7,854,800 | | | 38,130,097 |
TOBACCO — 3.20% | | | | | |
Lorillard, Inc. | | 615,000 | | | 46,272,600 |
Philip Morris | | 2,150,000 | | | 112,144,000 |
| | | | | |
| | | | | 268,046,697 |
| | | | | |
| | |
INSURANCE — 1.35% | | | | | |
INSURANCE — 1.35% | | | | | |
Helvetia Holding AG | | 14,200 | | | 4,979,562 |
Mercury General Corp. | | 845,100 | | | 36,947,772 |
Zurich Financial Services AG | | 97,400 | | | 24,968,911 |
| | | | | |
| | | | | 66,896,245 |
| | | | | |
| | |
MATERIALS — 1.42% | | | | | |
CHEMICALS — 0.66% | | | | | |
E. I. du Pont de Nemours & Co. | | 878,600 | | | 32,719,064 |
METALS & MINING — 0.76% | | | | | |
Impala Platinum Holdings Ltd. | | 638,300 | | | 18,753,554 |
Southern Copper Corp. | | 589,300 | | | 18,663,131 |
| | | | | |
| | | | | 70,135,749 |
| | | | | |
| | |
PHARMACEUTICALS, BIOTECHNOLOGY & LIFE SCIENCES — 2.05% | | | | | |
PHARMACEUTICALS — 2.05% | | | | | |
Eli Lilly & Co. | | 2,800,000 | | | 101,416,000 |
| | | | | |
| | | | | 101,416,000 |
| | | | | |
| | |
REAL ESTATE — 4.91% | | | | | |
REAL ESTATE INVESTMENT TRUSTS — 4.91% | | | | | |
Annaly Capital Management, Inc. | | 3,561,600 | | | 61,188,288 |
Anworth Mtg Asset Corp. | | 2,317,800 | | | 15,621,972 |
bApollo Commercial Real Estate Finance, Inc. | | 1,000,000 | | | 18,010,000 |
Chimera Investment Corp. | | 14,242,600 | | | 55,403,714 |
bInvesco Mortgage Capital, Inc. | | 1,888,264 | | | 43,430,072 |
MFA Financial, Inc. | | 6,737,900 | | | 49,590,944 |
| | | | | |
| | | | | 243,244,990 |
| | | | | |
| | |
SEMICONDUCTORS & SEMICONDUCTOR EQUIPMENT — 1.99% | | | | | |
SEMICONDUCTORS & SEMICONDUCTOR EQUIPMENT — 1.99% | | | | | |
Intel Corp. | | 2,829,700 | | | 62,989,122 |
Taiwan Semiconductor Manufacturing Co. Ltd. | | 18,427,000 | | | 35,684,253 |
| | | | | |
| | | | | 98,673,375 |
| | | | | |
| | |
SOFTWARE & SERVICES — 3.03% | | | | | |
INFORMATION TECHNOLOGY SERVICES — 1.26% | | | | | |
Paychex, Inc. | | 2,032,700 | | | 62,403,890 |
SOFTWARE — 1.77% | | | | | |
Microsoft Corp. | | 3,000,000 | | | 87,810,000 |
| | | | | |
| | | | | 150,213,890 |
| | | | | |
16 Certified Semi-Annual Report
| | |
| SCHEDULE OF INVESTMENTS, CONTINUED | | |
| |
| Thornburg Investment Income Builder Fund | | March 31, 2010 (Unaudited) |
| | | | | |
| | | Shares/
Principal
Amount | | Value |
TELECOMMUNICATION SERVICES — 9.10% | | | | | |
DIVERSIFIED TELECOMMUNICATION SERVICES — 7.13% | | | | | |
France Telecom SA | | 2,803,800 | | $ | 67,085,887 |
Koninklijke KPN N.V. | | 4,994,100 | | | 79,122,176 |
Qwest Communications International, Inc. | | 7,000,000 | | | 36,540,000 |
Telefonica SA | | 1,941,100 | | | 45,985,453 |
Telstra Corp. Ltd. | | 45,362,481 | | | 124,464,384 |
WIRELESS TELECOMMUNICATION SERVICES — 1.97% | | | | | |
China Mobile Ltd. | | 5,720,000 | | | 55,032,231 |
Vodafone Group plc | | 18,523,900 | | | 42,727,201 |
| | | | | |
| | | | | 450,957,332 |
| | | | | |
| | |
TRANSPORTATION — 1.65% | | | | | |
TRANSPORTATION INFRASTRUCTURE — 1.65% | | | | | |
Hopewell Highway | | 15,643,500 | | | 10,678,501 |
Macquarie Airports | | 25,090,909 | | | 71,146,245 |
| | | | | |
| | | | | 81,824,746 |
| | | | | |
| | |
UTILITIES — 7.35% | | | | | |
ELECTRIC UTILITIES — 3.85% | | | | | |
E. ON AG | | 2,488,700 | | | 91,882,881 |
Enel S.p.A. | | 8,637,100 | | | 48,296,011 |
Entergy Corp. | | 624,000 | | | 50,762,400 |
INDEPENDENT POWER PRODUCERS & ENERGY TRADERS — 0.31% | | | | | |
Algonquin Power & Utilities Corp. | | 2,592,100 | | | 11,255,020 |
Algonquin Power & Utilities Corp. | | 900,000 | | | 3,907,842 |
MULTI-UTILITIES — 3.19% | | | | | |
Dominion Resources, Inc. | | 1,700,000 | | | 69,887,000 |
RWE AG | | 995,200 | | | 88,177,378 |
| | | | | |
| | | | | 364,168,532 |
| | | | | |
TOTAL COMMON STOCK (Cost $2,881,543,710) | | | | | 3,036,992,505 |
| | | | | |
| | |
PREFERRED STOCK — 3.87% | | | | | |
| | |
BANKS — 3.13% | | | | | |
COMMERCIAL BANKS — 3.13% | | | | | |
Barclays Bank plc Pfd, 7.10% | | 200,000 | | | 4,872,000 |
Fifth Third Bancorp Pfd, 8.50% | | 404,704 | | | 55,112,591 |
First Tennessee Bank Pfd, 3.75% | | 12,000 | | | 7,278,750 |
Huntington Bancshares Pfd, 8.50% | | 84,616 | | | 82,923,680 |
Sovereign REIT Pfd, 12.00% | | 4,000 | | | 4,560,000 |
| | | | | |
| | | | | 154,747,021 |
| | | | | |
| | |
DIVERSIFIED FINANCIALS — 0.53% | | | | | |
CAPITAL MARKETS — 0.05% | | | | | |
Morgan Stanley Pfd, 4.00% | | 120,000 | | | 2,547,600 |
DIVERSIFIED FINANCIAL SERVICES — 0.48% | | | | | |
Bank of America Corp. Pfd, 3.00% | | 420,000 | | | 7,484,400 |
aCitigroup Capital XII Pfd, 8.50% | | 400,000 | | | 10,268,000 |
aCitigroup, Inc. Pfd 7.50% | | 50,000 | | | 6,094,000 |
| | | | | |
| | | | | 26,394,000 |
| | | | | |
Certified Semi-Annual Report 17
| | |
| SCHEDULE OF INVESTMENTS, CONTINUED | | |
| |
| Thornburg Investment Income Builder Fund | | March 31, 2010 (Unaudited) |
| | | | | | |
| | | Shares/
Principal
Amount | | Value |
REAL ESTATE — 0.21% | | | | | | |
REAL ESTATE INVESTMENT TRUSTS — 0.21% | | | | | | |
Alexandria Real Estate Pfd, 7.00% | | | 463,500 | | $ | 10,553,895 |
| | | | | | |
| | | | | | 10,553,895 |
| | | | | | |
TOTAL PREFERRED STOCK (Cost $157,482,434) | | | | | | 191,694,916 |
| | | | | | |
| | |
EXCHANGE TRADED FUNDS — 1.11% | | | | | | |
iShares High Yield Corporate Bond | | | 625,000 | | | 55,231,250 |
| | | | | | |
TOTAL EXCHANGE TRADED FUNDS (Cost $46,047,908) | | | | | | 55,231,250 |
| | | | | | |
| | |
ASSET BACKED SECURITIES — 0.42% | | | | | | |
| | |
BANKS — 0.05% | | | | | | |
COMMERCIAL BANKS — 0.05% | | | | | | |
Wells Fargo Asset Securities Corp., Series 2005-AR2 Class B1, 2.876%, 2/25/2035 | | $ | 10,522,223 | | | 1,534,883 |
Wells Fargo Asset Securities Corp., Series 2005-AR2 Class B1, 3.507%, 3/25/2035 | | | 9,828,417 | | | 1,133,374 |
| | | | | | |
| | | | | | 2,668,257 |
| | | | | | |
| | |
DIVERSIFIED FINANCIALS — 0.11% | | | | | | |
CAPITAL MARKETS — 0.06% | | | | | | |
Bear Stearns ARM Mtg Series 2003-6 Class 2B-1, 4.803%, 8/25/2033 | | | 765,837 | | | 375,023 |
Merrill Lynch Mtg Investors Trust, 3.115%, 8/25/2034 | | | 6,436,663 | | | 2,610,391 |
DIVERSIFIED FINANCIAL SERVICES — 0.05% | | | | | | |
Banc of America Funding Corp. Series 2006-I Class SB1, 4.16%, 12/20/2036 | | | 3,298,695 | | | 276,993 |
Banc of America Mtg Securities Series 2005-A Class B1, 3.521%, 2/25/2035 | | | 5,343,425 | | | 791,410 |
Citigroup Mtg Loan Trust, Inc., 4.101%, 3/25/2034 | | | 1,775,940 | | | 702,106 |
Structured Asset Security Corp. Series 2002-27A Class B1, 2.693%, 1/25/2033 | | | 2,874,718 | | | 763,146 |
| | | | | | |
| | | | | | 5,519,069 |
| �� | | | | | |
| | |
PHARMACEUTICALS, BIOTECHNOLOGY & LIFE SCIENCES — 0.09% | | | | | | |
PHARMACEUTICALS — 0.09% | | | | | | |
cQHP PhaRMA, 10.25%, 3/15/2015 | | | 4,310,685 | | | 4,357,456 |
| | | | | | |
| | | | | | 4,357,456 |
| | | | | | |
| | |
TRANSPORTATION — 0.17% | | | | | | |
AIRLINES — 0.17% | | | | | | |
c,fAmerican Airlines Depositor Corp., 8.00%, 10/5/2010 | | | 8,700,000 | | | 8,352,000 |
| | | | | | |
| | | | | | 8,352,000 |
| | | | | | |
TOTAL ASSET BACKED SECURITIES (Cost $49,626,441) | | | | | | 20,896,782 |
| | | | | | |
| | |
CORPORATE BONDS — 25.27% | | | | | | |
| | |
AUTOMOBILES & COMPONENTS — 0.16% | | | | | | |
AUTOMOBILES — 0.16% | | | | | | |
cAmerican Honda Finance, 7.625%, 10/1/2018 | | | 7,000,000 | | | 8,160,439 |
| | | | | | |
| | | | | | 8,160,439 |
| | | | | | |
| | |
BANKS — 1.59% | | | | | | |
COMMERCIAL BANKS — 1.59% | | | | | | |
c,dAlfa Diversified, 2.257%, 3/15/2012 | | | 3,500,000 | | | 3,494,295 |
dBanco Industrial e Comercial S.A., 7.00%, 4/23/2010 | | | 500,000 | | | 498,750 |
c,dBanco Industrial e Comercial S.A., 6.25%, 1/20/2013 | | | 9,000,000 | | | 9,112,500 |
18 Certified Semi-Annual Report
| | |
| SCHEDULE OF INVESTMENTS, CONTINUED | | |
| |
| Thornburg Investment Income Builder Fund | | March 31, 2010 (Unaudited) |
| | | | | | |
| | | Shares/
Principal
Amount | | Value |
Fifth Third Bancorp, 6.25%, 5/1/2013 | | $ | 2,750,000 | | $ | 2,957,463 |
a,c,d,eLandsbanki Islands HF, 7.431%, 12/31/2049 | | | 5,000,000 | | | 500 |
National City Bank, 7.25%, 7/15/2010 | | | 5,000,000 | | | 5,062,635 |
National City Preferred Capital Trust I, 12.00%, 12/29/2049 | | | 3,250,000 | | | 3,776,338 |
PNC Financial Services Group, Inc., 8.25%, 5/29/2049 | | | 10,000,000 | | | 10,353,160 |
cPNC Preferred Funding Trust III, 8.70%, 12/31/2049 | | | 4,500,000 | | | 4,714,650 |
Provident Bank MD, 9.50%, 5/1/2018 | | | 5,600,000 | | | 5,827,998 |
dShinhan Bank, 6.819%, 9/20/2036 | | | 900,000 | | | 872,991 |
Silicon Valley Bank, 6.05%, 6/1/2017 | | | 26,713,000 | | | 25,022,281 |
Webster Capital Trust IV, 7.65%, 6/15/2037 | | | 1,950,000 | | | 1,404,000 |
Wells Fargo Capital XIII Preferred Note, 7.70%, 12/29/2049 | | | 2,500,000 | | | 2,581,250 |
Zions Bancorp, 7.75%, 9/23/2014 | | | 3,000,000 | | | 3,025,860 |
| | | | | | |
| | | | | | 78,704,671 |
| | | | | | |
| | |
CAPITAL GOODS — 0.69% | | | | | | |
INDUSTRIAL CONGLOMERATES — 0.36% | | | | | | |
Otter Tail Corp., 9.00%, 12/15/2016 | | | 17,000,000 | | | 17,595,000 |
TRADING COMPANIES & DISTRIBUTORS — 0.33% | | | | | | |
International Lease Finance Corp., 5.125%, 11/1/2010 | | | 5,000,000 | | | 5,005,915 |
cInternational Lease Finance Corp. E-Capital Trust I, 5.90%, 12/21/2065 | | | 15,000,000 | | | 11,550,000 |
| | | | | | |
| | | | | | 34,150,915 |
| | | | | | |
| | |
COMMERCIAL & PROFESSIONAL SERVICES — 0.01% | | | | | | |
COMMERCIAL SERVICES & SUPPLIES — 0.01% | | | | | | |
Allied Waste North America, Inc., 6.375%, 4/15/2011 | | | 500,000 | | | 521,747 |
Waste Management, Inc., 7.375%, 8/1/2010 | | | 175,000 | | | 178,631 |
| | | | | | |
| | | | | | 700,378 |
| | | | | | |
| | |
CONSUMER DURABLES & APPAREL — 0.23% | | | | | | |
HOUSEHOLD DURABLES — 0.23% | | | | | | |
cCorporativo Javer SA, 13.00%, 8/4/2014 | | | 10,000,000 | | | 11,425,000 |
| | | | | | |
| | | | | | 11,425,000 |
| | | | | | |
| | |
CONSUMER SERVICES — 0.14% | | | | | | |
HOTELS, RESTAURANTS & LEISURE — 0.14% | | | | | | |
NPC International, Inc., 9.50%, 5/1/2014 | | | 3,000,000 | | | 2,985,000 |
Seneca Nation of Indians Capital Improvements Authority, 6.75%, 12/1/2013 | | | 4,075,000 | | | 3,864,852 |
| | | | | | |
| | | | | | 6,849,852 |
| | | | | | |
| | |
DIVERSIFIED FINANCIALS — 2.43% | | | | | | |
CAPITAL MARKETS — 0.37% | | | | | | |
Goldman Sachs Group, Inc., 5.625%, 1/15/2017 | | | 8,000,000 | | | 8,197,632 |
dMorgan Stanley, 4.55%, 3/1/2013 | | | 4,000,000 | | | 3,516,035 |
dMorgan Stanley, 10.09%, 5/3/2017 | | | 12,560,000 | | | 6,815,531 |
CONSUMER FINANCE — 1.13% | | | | | | |
American Express Credit Co., 5.875%, 5/2/2013 | | | 5,000,000 | | | 5,416,150 |
Capital One Capital IV, 6.745%, 2/17/2037 | | | 6,400,000 | | | 5,520,000 |
Capital One Financial Corp., 6.15%, 9/1/2016 | | | 25,500,000 | | | 26,455,587 |
SLM Corp., 4.00%, 7/25/2014 | | | 2,000,000 | | | 1,691,240 |
SLM Corp., 6.00%, 12/15/2010 | | | 1,000,000 | | | 900,513 |
SLM Corp., 4.50%, 7/26/2010 | | | 11,580,000 | | | 11,633,303 |
SLM Corp. LIBOR Floating Rate Note, 0.549%, 1/27/2014 | | | 5,000,000 | | | 4,325,835 |
Certified Semi-Annual Report 19
| | |
| SCHEDULE OF INVESTMENTS, CONTINUED | | |
| |
| Thornburg Investment Income Builder Fund | | March 31, 2010 (Unaudited) |
| | | | | | |
| | | Shares/
Principal
Amount | | Value |
DIVERSIFIED FINANCIAL SERVICES — 0.93% | | | | | | |
Citigroup, Inc., 5.00%, 9/15/2014 | | $ | 16,250,000 | | $ | 16,227,104 |
dExport-Import Bank of Korea, 8.125%, 1/21/2014 | | | 2,750,000 | | | 3,190,311 |
JPMorgan Chase & Co., 7.90%, 4/29/2049 | | | 15,000,000 | | | 15,991,500 |
dKorea Development Bank, 0.391%, 4/6/2010 | | | 1,000,000 | | | 1,000,000 |
dKorea Development Bank, 5.30%, 1/17/2013 | | | 800,000 | | | 849,269 |
MBNA Corp., 6.125%, 3/1/2013 | | | 2,000,000 | | | 2,147,830 |
National Rural Utilities CFC, 10.375%, 11/1/2018 | | | 5,000,000 | | | 6,650,330 |
| | | | | | |
| | | | | | 120,528,170 |
| | | | | | |
| | |
ENERGY — 4.32% | | | | | | |
ENERGY EQUIPMENT & SERVICES — 0.49% | | | | | | |
cCalfrac Holdings LP, 7.75%, 2/15/2015 | | | 8,500,000 | | | 8,446,875 |
Nabors Industries, Inc., 9.25%, 1/15/2019 | | | 10,500,000 | | | 13,060,729 |
Seacor Holdings, Inc., 7.375%, 10/1/2019 | | | 2,000,000 | | | 2,058,706 |
Seitel, Inc., 9.75%, 2/15/2014 | | | 1,000,000 | | | 795,000 |
OIL, GAS & CONSUMABLE FUELS — 3.83% | | | | | | |
cBumi Capital PTE, Ltd., 12.00%, 11/10/2016 | | | 3,000,000 | | | 3,277,500 |
Chesapeake Energy Corp., 7.00%, 8/15/2014 | | | 1,000,000 | | | 1,013,750 |
cCloud Peak Energy, Inc., 8.25%, 12/15/2017 | | | 8,000,000 | | | 8,160,000 |
cDCP Midstream LLC, 9.75%, 3/15/2019 | | | 5,000,000 | | | 6,409,885 |
Enbridge Energy Partners LP, 9.875%, 3/1/2019 | | | 9,750,000 | | | 12,669,559 |
cEnogex LLC, 6.25%, 3/15/2020 | | | 2,500,000 | | | 2,484,738 |
Enterprise Products Operating LP, 9.75%, 1/31/2014 | | | 4,750,000 | | | 5,767,901 |
Enterprise Products Operating LP, 7.034%, 1/15/2068 | | | 5,900,000 | | | 5,612,375 |
cGaz Capital SA, 8.146%, 4/11/2018 | | | 2,000,000 | | | 2,255,000 |
a,c,eGriffin Coal Mining Ltd., 9.50%, 12/1/2016 | | | 22,000,000 | | | 14,080,000 |
GS Caltex Corp., 7.25%, 7/2/2013 | | | 7,000,000 | | | 7,700,140 |
Kinder Morgan Energy Partners, 9.00%, 2/1/2019 | | | 9,750,000 | | | 12,165,095 |
cMaritimes & Northeast Pipeline, LLC, 7.50%, 5/31/2014 | | | 7,356,750 | | | 8,047,696 |
Murphy Oil Corp., 6.375%, 5/1/2012 | | | 5,000,000 | | | 5,357,240 |
cNiska Gas Storage, 8.875%, 3/15/2018 | | | 4,500,000 | | | 4,601,250 |
NuStar Logistics, 7.65%, 4/15/2018 | | | 18,000,000 | | | 20,222,694 |
Oneok Partners LP, 8.625%, 3/1/2019 | | | 8,000,000 | | | 9,878,768 |
Oneok Partners LP, 5.90%, 4/1/2012 | | | 3,000,000 | | | 3,216,123 |
c,dPetro Co. Trinidad Tobago Ltd., 9.75%, 8/14/2019 | | | 4,000,000 | | | 4,550,000 |
c,dPetroplus Finance Ltd., 6.75%, 5/1/2014 | | | 4,000,000 | | | 3,600,000 |
Plains Exploration & Production Co., 7.625%, 6/1/2018 | | | 1,000,000 | | | 1,010,000 |
Southern Union Co., 7.20%, 11/1/2066 | | | 25,920,000 | | | 24,040,800 |
Teppco Partners LP, 7.00%, 6/1/2067 | | | 6,500,000 | | | 5,963,750 |
cWindsor Petroleum Transport Corp., 7.84%, 1/15/2021 | | | 8,839,207 | | | 8,137,180 |
cWoodside Financial Ltd., 8.125%, 3/1/2014 | | | 8,000,000 | | | 9,162,368 |
| | | | | | |
| | | | | | 213,745,122 |
| | | | | | |
| | |
FOOD & STAPLES RETAILING — 0.22% | | | | | | |
FOOD & STAPLES RETAILING — 0.22% | | | | | | |
Rite Aid Corp., 8.625%, 3/1/2015 | | | 3,000,000 | | | 2,565,000 |
Rite Aid Corp., 9.375%, 12/15/2015 | | | 9,500,000 | | | 8,170,000 |
| | | | | | |
| | | | | | 10,735,000 |
| | | | | | |
| | |
FOOD, BEVERAGE & TOBACCO — 0.57% | | | | | | |
BEVERAGES — 0.08% | | | | | | |
Anheuser Busch Cos., Inc., 4.70%, 4/15/2012 | | | 3,750,000 | | | 3,965,452 |
20 Certified Semi-Annual Report
| | |
| SCHEDULE OF INVESTMENTS, CONTINUED | | |
| |
| Thornburg Investment Income Builder Fund | | March 31, 2010 (Unaudited) |
| | | | | | |
| | | Shares/
Principal
Amount | | Value |
TOBACCO — 0.49% | | | | | | |
Altria Group, Inc., 8.50%, 11/10/2013 | | $ | 4,000,000 | | $ | 4,675,552 |
Altria Group, Inc., 9.70%, 11/10/2018 | | | 10,750,000 | | | 13,218,512 |
c,dB.A.T. International Finance, plc, 9.50%, 11/15/2018 | | | 5,000,000 | | | 6,475,130 |
| | | | | | |
| | | | | | 28,334,646 |
| | | | | | |
| | |
INDUSTRIALS — 0.18% | | | | | | |
CAPITAL GOODS — 0.18% | | | | | | |
c,fDa-Lite Screen Co., Inc., 12.50%, 4/1/2015 | | | 9,000,000 | | | 8,955,000 |
| | | | | | |
| | | | | | 8,955,000 |
| | | | | | |
| | |
INSURANCE — 4.20% | | | | | | |
INSURANCE — 4.20% | | | | | | |
American General Finance Corp., 4.875%, 7/15/2012 | | | 1,000,000 | | | 942,029 |
Hartford Financial Services Group, 8.125%, 6/15/2038 | | | 7,150,000 | | | 7,436,000 |
cLiberty Mutual Group, Inc., 5.75%, 3/15/2014 | | | 1,000,000 | | | 1,046,705 |
cMetlife Capital Trust X, 9.25%, 4/8/2068 | | | 24,000,000 | | | 27,000,000 |
Metlife, Inc. Series A, 6.817%, 8/15/2018 | | | 4,000,000 | | | 4,437,188 |
cNational Life Insurance of Vermont, 10.50%, 9/15/2039 | | | 2,000,000 | | | 2,140,782 |
Northwind Holdings, LLC Series 2007-1A Class A1, 1.032%, 12/1/2037 | | | 5,879,281 | | | 4,878,804 |
c,dOil Insurance Ltd., 7.558%, 12/29/2049 | | | 4,000,000 | | | 3,459,880 |
cPacific Life Global Funding CPI Floating Rate Note, 4.90%, 2/6/2016 | | | 2,000,000 | | | 1,892,360 |
cPrudential Holdings, LLC, 8.695%, 12/18/2023 | | | 4,500,000 | | | 5,184,090 |
cSwiss Re Capital I, LP, 6.854%, 5/29/2049 | | | 140,925,000 | | | 128,589,130 |
Transatlantic Holdings, Inc., 5.75%, 12/14/2015 | | | 14,647,000 | | | 14,944,188 |
cZFS Finance USA Trust II, 6.45%, 12/15/2065 | | | 5,000,000 | | | 4,775,000 |
cZFS Finance USA Trust V, 6.50%, 5/9/2037 | | | 1,260,000 | | | 1,190,700 |
| | | | | | |
| | | | | | 207,916,856 |
| | | | | | |
| | |
MATERIALS — 1.11% | | | | | | |
CONSTRUCTION MATERIALS — 0.31% | | | | | | |
c,dC8 Capital Ltd., 6.64%, 12/31/2049 | | | 2,000,000 | | | 1,390,680 |
CRH America, Inc., 8.125%, 7/15/2018 | | | 12,000,000 | | | 14,131,224 |
CONTAINERS & PACKAGING — 0.04% | | | | | | |
cPlastipak Holdings, Inc., 10.625%, 8/15/2019 | | | 1,750,000 | | | 1,946,875 |
METALS & MINING — 0.76% | | | | | | |
Allegheny Technologies, Inc., 9.375%, 6/1/2019 | | | 3,000,000 | | | 3,490,566 |
c,dAnglo American Capital, 9.375%, 4/8/2014 | | | 3,500,000 | | | 4,204,274 |
c,dBemax Resources Ltd., 9.375%, 7/15/2014 | | | 5,000,000 | | | 4,250,000 |
Freeport-McMoRan Copper & Gold, 8.375%, 4/1/2017 | | | 4,965,000 | | | 5,523,562 |
Freeport-McMoRan Copper & Gold, 8.25%, 4/1/2015 | | | 8,000,000 | | | 8,710,000 |
Freeport-McMoRan Corp., 6.125%, 3/15/2034 | | | 4,500,000 | | | 4,037,445 |
cGTL Trade Finance, Inc., 7.25%, 10/20/2017 | | | 7,000,000 | | | 7,507,500 |
| | | | | | |
| | | | | | 55,192,126 |
| | | | | | |
| | |
MEDIA — 0.79% | | | | | | |
MEDIA — 0.79% | | | | | | |
AOL Time Warner, Inc., 6.875%, 5/1/2012 | | | 425,000 | | | 467,481 |
CBS Corp., 8.20%, 5/15/2014 | | | 1,500,000 | | | 1,751,254 |
Comcast Cable Communications, 8.875%, 5/1/2017 | | | 5,000,000 | | | 6,047,810 |
DIRECTV Holdings LLC, 7.625%, 5/15/2016 | | | 3,000,000 | | | 3,360,000 |
DIRECTV Holdings LLC, 6.375%, 6/15/2015 | | | 5,100,000 | | | 5,297,625 |
Time Warner Cable, Inc., 8.75%, 2/14/2019 | | | 14,000,000 | | | 17,362,534 |
Certified Semi-Annual Report 21
| | |
| SCHEDULE OF INVESTMENTS, CONTINUED | | |
| |
| Thornburg Investment Income Builder Fund | | March 31, 2010 (Unaudited) |
| | | | | | |
| | | Shares/
Principal
Amount | | Value |
Time Warner Cable, Inc., 8.25%, 2/14/2014 | | $ | 4,000,000 | | $ | 4,693,644 |
| | | | | | |
| | | | | | 38,980,348 |
| | | | | | |
| | |
PHARMACEUTICALS, BIOTECHNOLOGY & LIFE SCIENCES — 0.05% | | | | | | |
BIOTECHNOLOGY — 0.05% | | | | | | |
Tiers Inflation Linked Trust Series Wyeth 2004 21 Trust Certificate CPI Floating Rate Note, 4.571%, 2/1/2014 | | | 3,000,000 | | | 2,652,210 |
| | | | | | |
| | | | | | 2,652,210 |
| | | | | | |
| | |
REAL ESTATE — 0.21% | | | | | | |
REAL ESTATE MANAGEMENT & DEVELOPMENT — 0.21% | | | | | | |
c,dAgile Property Holdings Ltd., 9.00%, 9/22/2013 | | | 10,000,000 | | | 10,600,000 |
| | | | | | |
| | | | | | 10,600,000 |
| | | | | | |
| | |
RETAILING — 0.26% | | | | | | |
INTERNET & CATALOG RETAIL — 0.03% | | | | | | |
Ticketmaster, 10.75%, 8/1/2016 | | | 1,500,000 | | | 1,672,500 |
MULTILINE RETAIL — 0.05% | | | | | | |
dParkson Retail Group, 7.125%, 5/30/2012 | | | 2,110,000 | | | 2,182,392 |
SPECIALTY RETAIL — 0.18% | | | | | | |
cAce Hardware Corp., 9.125%, 6/1/2016 | | | 4,000,000 | | | 4,290,000 |
Best Buy, Inc., 6.75%, 7/15/2013 | | | 4,000,000 | | | 4,477,100 |
| | | | | | |
| | | | | | 12,621,992 |
| | | | | | |
| | |
SEMICONDUCTORS & SEMICONDUCTOR EQUIPMENT — 0.51% | | | | | | |
SEMICONDUCTORS & SEMICONDUCTOR EQUIPMENT �� 0.51% | | | | | | |
KLA Instruments Corp., 6.90%, 5/1/2018 | | | 10,000,000 | | | 10,847,740 |
National Semiconductor Corp., 6.15%, 6/15/2012 | | | 2,000,000 | | | 2,162,774 |
National Semiconductor Corp., 0.507%, 6/15/2010 | | | 11,200,000 | | | 11,186,806 |
National Semiconductor Corp., 6.60%, 6/15/2017 | | | 1,000,000 | | | 1,085,730 |
| | | | | | |
| | | | | | 25,283,050 |
| | | | | | |
| | |
SOFTWARE & SERVICES — 0.22% | | | | | | |
INTERNET SOFTWARE & SERVICES — 0.13% | | | | | | |
fYahoo! Inc., 6.65%, 8/10/2026 | | | 7,320,845 | | | 6,442,343 |
SOFTWARE — 0.09% | | | | | | |
BMC Software, Inc., 7.25%, 6/1/2018 | | | 4,000,000 | | | 4,391,196 |
| | | | | | |
| | | | | | 10,833,539 |
| | | | | | |
| | |
TECHNOLOGY HARDWARE & EQUIPMENT — 0.12% | | | | | | |
ELECTRONIC EQUIPMENT, INSTRUMENTS & COMPONENTS — 0.12% | | | | | | |
Corning, Inc., 6.05%, 6/15/2015 | | | 6,000,000 | | | 6,032,460 |
| | | | | | |
| | | | | | 6,032,460 |
| | | | | | |
| | |
TELECOMMUNICATION SERVICES — 1.76% | | | | | | |
DIVERSIFIED TELECOMMUNICATION SERVICES — 1.72% | | | | | | |
dDeutsche Telekom International Finance B.V., 8.75%, 6/15/2030 | | | 26,150,000 | | | 33,490,567 |
c,dGlobal Crossing Ltd., 12.00%, 9/15/2015 | | | 4,000,000 | | | 4,440,000 |
Level 3 Financing, Inc., 9.25%, 11/1/2014 | | | 10,000,000 | | | 9,750,000 |
dTelecom Italia Capital SA, 5.25%, 10/1/2015 | | | 4,190,000 | | | 4,290,107 |
c,dTelemar Norte Leste SA, 9.50%, 4/23/2019 | | | 7,000,000 | | | 8,312,500 |
c,dVimpelcom, 8.25%, 5/23/2016 | | | 4,500,000 | | | 4,899,375 |
dWind Acquisition Finance SA, 11.75%, 7/15/2017 | | | 3,000,000 | | | 4,497,666 |
22 Certified Semi-Annual Report
| | |
| SCHEDULE OF INVESTMENTS, CONTINUED | | |
| |
| Thornburg Investment Income Builder Fund | | March 31, 2010 (Unaudited) |
| | | | | | |
| | | Shares/
Principal
Amount | | Value |
Windstream Corp., 8.125%, 8/1/2013 | | $ | 10,800,000 | | $ | 11,313,000 |
cZayo Group LLC, 10.25%, 3/15/2017 | | | 4,000,000 | | | 4,040,000 |
WIRELESS TELECOMMUNICATION SERVICES — 0.04% | | | | | | |
c,dDigicel SA, 12.00%, 4/1/2014 | | | 2,000,000 | | | 2,265,000 |
| | | | | | |
| | | | | | 87,298,215 |
| | | | | | |
| | |
TRANSPORTATION — 1.03% | | | | | | |
MARINE — 0.16% | | | | | | |
Commercial Barge Line Co., 12.50%, 7/15/2017 | | | 5,000,000 | | | 5,256,250 |
cUnited Maritime, LLC, 11.75%, 6/15/2015 | | | 2,500,000 | | | 2,562,500 |
TRANSPORTATION INFRASTRUCTURE — 0.87% | | | | | | |
dSouthern Cross Air Corp., 5.91%, 12/20/2016 | | | 50,958,300 | | | 43,044,318 |
| | | | | | |
| | | | | | 50,863,068 |
| | | | | | |
| | |
UTILITIES — 4.47% | | | | | | |
ELECTRIC UTILITIES — 2.13% | | | | | | |
Alabama Power Capital Trust V, 3.351%, 10/1/2042 | | | 4,000,000 | | | 4,000,000 |
Aquila, Inc., 7.95%, 2/1/2011 | | | 3,000,000 | | | 3,153,168 |
Arizona Public Service Co., 5.50%, 9/1/2035 | | | 4,000,000 | | | 3,588,972 |
Arizona Public Service Co., 8.75%, 3/1/2019 | | | 6,500,000 | | | 7,877,272 |
Comed Financing III, 6.35%, 3/15/2033 | | | 2,961,000 | | | 2,353,359 |
c,dEnel Finance International S.A., 6.25%, 9/15/2017 | | | 38,000,000 | | | 41,281,376 |
Entergy Gulf States Louisiana, LLC, 6.00%, 5/1/2018 | | | 8,000,000 | | | 8,511,008 |
FPL Group Capital, Inc., 6.65%, 6/15/2067 | | | 4,000,000 | | | 3,800,000 |
cGreat River Energy, 5.829%, 7/1/2017 | | | 2,183,938 | | | 2,411,570 |
c,dListrindo Capital BV, 9.25%, 1/29/2015 | | | 2,750,000 | | | 2,980,065 |
cMonongahela Power Co., 7.95%, 12/15/2013 | | | 2,000,000 | | | 2,337,364 |
cTexas-New Mexico Power, 9.50%, 4/1/2019 | | | 19,000,000 | | | 23,148,270 |
GAS UTILITIES — 0.23% | | | | | | |
cFerrellgas Partners LP, 9.125%, 10/1/2017 | | | 1,000,000 | | | 1,047,500 |
Southwest Gas Corp., 7.625%, 5/15/2012 | | | 9,465,000 | | | 10,301,290 |
MULTI-UTILITIES — 2.11% | | | | | | |
Amerenenergy Generating, 7.00%, 4/15/2018 | | | 9,050,000 | | | 9,659,300 |
Black Hills Corp., 9.00%, 5/15/2014 | | | 4,500,000 | | | 5,194,948 |
Dominion Resources, Inc., 8.875%, 1/15/2019 | | | 14,750,000 | | | 18,608,320 |
cEnogex LLC, 6.875%, 7/15/2014 | | | 2,000,000 | | | 2,141,740 |
Illinois Power Co., 9.75%, 11/15/2018 | | | 5,000,000 | | | 6,408,220 |
NiSource Finance Corp., 6.15%, 3/1/2013 | | | 12,237,000 | | | 13,338,403 |
NiSource Finance Corp., 6.40%, 3/15/2018 | | | 20,000,000 | | | 21,444,220 |
Sempra Energy, 9.80%, 2/15/2019 | | | 7,750,000 | | | 10,071,947 |
Sempra Energy, 8.90%, 11/15/2013 | | | 2,000,000 | | | 2,383,284 |
Union Electric Co., 6.70%, 2/1/2019 | | | 2,500,000 | | | 2,765,508 |
dVille De Montreal, 5.45%, 12/1/2019 | | | 10,000,000 | | | 10,432,236 |
Wisconsin Energy Corp., 6.25%, 5/15/2067 | | | 2,365,000 | | | 2,246,750 |
| | | | | | |
| | | | | | 221,486,090 |
| | | | | | |
TOTAL CORPORATE BONDS (Cost $1,027,411,051) | | | | | | 1,252,049,147 |
| | | | | | |
Certified Semi-Annual Report 23
| | |
| SCHEDULE OF INVESTMENTS, CONTINUED | | |
| |
| Thornburg Investment Income Builder Fund | | March 31, 2010 (Unaudited) |
| | | | | | |
| | | Shares/
Principal
Amount | | Value |
CONVERTIBLE BONDS — 3.30% | | | | | | |
| | |
COMMERCIAL & PROFESSIONAL SERVICES — 0.08% | | | | | | |
COMMERCIAL SERVICES & SUPPLIES — 0.08% | | | | | | |
Covanta Holding Corp., 1.00%, 2/1/2027 | | $ | 4,000,000 | | $ | 3,755,000 |
| | | | | | |
| | | | | | 3,755,000 |
| | | | | | |
| | |
DIVERSIFIED FINANCIALS — 1.37% | | | | | | |
DIVERSIFIED FINANCIAL SERVICES — 1.37% | | | | | | |
KKR Financial Holdings LLC, 7.50%, 1/15/2017 | | | 5,000,000 | | | 6,106,250 |
KKR Financial Holdings LLC, 7.00%, 7/15/2012 | | | 61,600,000 | | | 61,600,000 |
| | | | | | |
| | | | | | 67,706,250 |
| | | | | | |
| | |
ENERGY — 0.29% | | | | | | |
ENERGY EQUIPMENT & SERVICES — 0.12% | | | | | | |
Global Industries Ltd., 2.75%, 8/1/2027 | | | 9,000,000 | | | 5,827,500 |
OIL, GAS & CONSUMABLE FUELS — 0.17% | | | | | | |
Chesapeake Energy Corp., 2.25%, 12/15/2038 | | | 11,500,000 | | | 8,366,250 |
| | | | | | |
| | | | | | 14,193,750 |
| | | | | | |
| | |
MEDIA — 0.24% | | | | | | |
MEDIA — 0.24% | | | | | | |
cCentral European Media, 3.50%, 3/15/2013 | | | 14,000,000 | | | 12,022,500 |
| | | | | | |
| | | | | | 12,022,500 |
| | | | | | |
| | |
REAL ESTATE — 0.59% | | | | | | |
REAL ESTATE INVESTMENT TRUSTS — 0.59% | | | | | | |
cExtra Space Storage LP, 3.625%, 4/1/2027 | | | 10,000,000 | | | 9,600,000 |
cMPT Operating Partnership L.P., 6.125%, 11/15/2011 | | | 18,750,000 | | | 18,421,875 |
Washington REIT, 3.875%, 9/15/2026 | | | 1,470,000 | | | 1,457,138 |
| | | | | | |
| | | | | | 29,479,013 |
| | | | | | |
| | |
TELECOMMUNICATION SERVICES — 0.73% | | | | | | |
DIVERSIFIED TELECOMMUNICATION SERVICES — 0.28% | | | | | | |
Global Crossing Ltd., 5.00%, 5/15/2011 | | | 9,250,000 | | | 9,238,437 |
Level 3 Communications, Inc., 5.25%, 12/15/2011 | | | 5,000,000 | | | 4,868,750 |
WIRELESS TELECOMMUNICATION SERVICES — 0.45% | | | | | | |
NII Holdings, 3.125%, 6/15/2012 | | | 23,500,000 | | | 22,178,125 |
| | | | | | |
| | | | | | 36,285,312 |
| | | | | | |
TOTAL CONVERTIBLE BONDS (Cost $139,081,247) | | | | | | 163,441,825 |
| | | | | | |
| | |
MUNICIPAL BONDS — 0.03% | | | | | | |
Victor New York, 9.20%, 5/1/2014 | | | 1,445,000 | | | 1,479,998 |
| | | | | | |
TOTAL MUNICIPAL BONDS (Cost $1,508,093) | | | | | | 1,479,998 |
| | | | | | |
| | |
U.S. GOVERNMENT AGENCIES — 0.33% | | | | | | |
cAgribank FCB, 9.125%, 7/15/2019 | | | 6,750,000 | | | 7,679,205 |
Federal National Mtg Association REMIC Series 2006-B1 Class AB, 6.00%, 6/25/2016 | | | 8,091,993 | | | 8,435,251 |
| | | | | | |
TOTAL U.S. GOVERNMENT AGENCIES (Cost $14,818,821) | | | | | | 16,114,456 |
| | | | | | |
24 Certified Semi-Annual Report
| | |
| SCHEDULE OF INVESTMENTS, CONTINUED | | |
| |
| Thornburg Investment Income Builder Fund | | March 31, 2010 (Unaudited) |
| | | | | | |
| | | Shares/
Principal
Amount | | Value |
| | |
FOREIGN BONDS — 0.68% | | | | | | |
| | |
CONSUMER SERVICES — 0.01% | | | | | | |
HOTELS, RESTAURANTS & LEISURE — 0.01% | | | | | | |
a,d,eFU JI Food and Catering (HKD), 0%, 10/18/2010 | | $ | 17,500,000 | | $ | 495,659 |
| | | | | | |
| | | | | | 495,659 |
| | | | | | |
| | |
FOOD & STAPLES RETAILING — 0.04% | | | | | | |
FOOD & STAPLES RETAILING — 0.04% | | | | | | |
dWesfarmers Ltd. (AUD), 6.967%, 9/11/2014 | | | 2,000,000 | | | 1,879,300 |
| | | | | | |
| | | | | | 1,879,300 |
| | | | | | |
| | |
FOOD, BEVERAGE & TOBACCO — 0.09% | | | | | | |
BEVERAGES — 0.09% | | | | | | |
dAmbev International Finance Co., Ltd. (BRL), 9.50%, 7/24/2017 | | | 7,669,000 | | | 4,269,300 |
| | | | | | |
| | | | | | 4,269,300 |
| | | | | | |
| | |
INSURANCE — 0.04% | | | | | | |
INSURANCE — 0.04% | | | | | | |
dELM BV (AUD), 7.635%, 12/31/2049 | | | 3,000,000 | | | 2,137,280 |
| | | | | | |
| | | | | | 2,137,280 |
| | | | | | |
| | |
MEDIA — 0.04% | | | | | | |
MEDIA — 0.04% | | | | | | |
c,dCorus Entertainment (CAD), 7.25%, 2/10/2017 | | | 2,000,000 | | | 2,005,199 |
| | | | | | |
| | | | | | 2,005,199 |
| | | | | | |
| | |
MISCELLANEOUS — 0.46% | | | | | | |
MISCELLANEOUS — 0.46% | | | | | | |
dNew South Wales Treasury Corp. (AUD), 3.75%, 11/20/2020 | | | 8,500,000 | | | 8,083,947 |
dRegional Muni of York (CAD), 5.00%, 4/29/2019 | | | 4,500,000 | | | 4,612,273 |
Republic of Brazil (BRL), 12.50%, 1/5/2016 | | | 15,750,000 | | | 10,074,296 |
| | | | | | |
| | | | | | 22,770,516 |
| | | | | | |
TOTAL FOREIGN BONDS (Cost $31,873,262) | | | | | | 33,557,254 |
| | | | | | |
| | |
OTHER SECURITIES — 0.61% | | | | | | |
| | |
LOAN PARTICIPATIONS — 0.61% | | | | | | |
Crown Castle Operating Co., 1.729%, 3/6/2014 | | | 2,961,929 | | | 2,906,037 |
Mylan Laboratories, Inc., 3.50%, 10/2/2014 | | | 433,803 | | | 433,586 |
Mylan Laboratories, Inc., 3.50%, 10/2/2014 | | | 1,341,471 | | | 1,340,800 |
Mylan Laboratories, Inc., 3.563%, 10/2/2014 | | | 7,824,726 | | | 7,820,814 |
Texas Comp Electric Holdings LLC, 3.729%, 10/10/2014 | | | 7,818,182 | | | 6,414,193 |
Texas Comp Electric Holdings LLC, 3.729%, 10/10/2014 | | | 13,681,818 | | | 11,115,109 |
Texas Comp Electric Holdings LLC, 3.751%, 10/31/2014 | | | 141,414 | | | 114,885 |
Texas Comp Electric Holdings LLC, 3.751%, 10/10/2014 | | | 80,808 | | | 66,296 |
| | | | | | |
TOTAL OTHER SECURITIES (Cost $28,923,573) | | | | | | 30,211,720 |
| | | | | | |
Certified Semi-Annual Report 25
| | |
| SCHEDULE OF INVESTMENTS, CONTINUED | | |
| |
| Thornburg Investment Income Builder Fund | | March 31, 2010 (Unaudited) |
| | | | | | |
| | | Shares/
Principal
Amount | | Value |
SHORT TERM INVESTMENTS — 1.28% | | | | | | |
AGL Capital Corp., 0.22%, 4/1/2010 | | $ | 250,000 | | $ | 250,000 |
Kansas City Power & Light, 0.22%, 4/1/2010 | | | 50,200,000 | | | 50,200,000 |
Wellpoint, Inc., 0.20%, 4/1/2010 | | | 13,000,000 | | | 13,000,000 |
| | | | | | |
TOTAL SHORT TERM INVESTMENTS (Cost $63,450,000) | | | | | | 63,450,000 |
| | | | | | |
TOTAL INVESTMENTS — 98.21% (Cost $4,441,764,181) | | | | | $ | 4,865,119,853 |
OTHER ASSETS LESS LIABILITIES — 1.79% | | | | | | 88,553,999 |
| | | | | | |
NET ASSETS — 100.00% | | | | | $ | 4,953,673,852 |
| | | | | | |
Footnote Legend
| b | Investment in Affiliates - Holdings of voting securities of each portfolio company which is considered “affiliated” to the Fund under the Investment Company Act of 1940 because the Fund’s holding represented 5% or more of the company’s voting securities during the period, are shown below: |
| | | | | | | | | | | | | | |
Issuer | | Shares/Principal
September 30,
2009 | | Gross
Additions | | Gross
Reductions | | Shares/Principal
March 31,
2010 | | Market Value
March 31,
2010 | | Investment
Income |
Apollo Commercial Real | | | | | | | | | | | | | | |
Estate Finance, Inc. | | — | | 1,000,000 | | — | | 1,000,000 | | $ | 18,010,000 | | $ | 350,000 |
Invesco Mortgage Capital, Inc. | | 1,223,112 | | 745,968 | | 80,816 | | 1,888,264 | | | 43,430,072 | | | 3,540,226 |
| | | | | | | | | | | | | | |
Total non-controlled affiliated issuers - 1.24% of net assets | | | | | | $ | 61,440,072 | | $ | 3,890,226 |
| | | | | | | | | | | | | | |
| c | Securities exempt from registration under Rule 144A of the Securities Act of 1933, as amended. These securities may only be resold in the ordinary course of business in transactions exempt from registration, normally to qualified institutional buyers. As of March 31, 2010, the aggregate value of these securities in the Fund’s portfolio was $520,873,477, representing 10.51% of the Fund’s net assets. |
| d | Yankee Bond - Denominated in U.S. dollars and is publicly issued in the U.S. by foreign banks and corporations. |
| f | Security currently fair valued by the valuation and pricing committee using procedures approved by the Trustees. |
Portfolio Abbreviations
To simplify the listings of securities, abbreviations are used per the table below:
| | |
| ARM | | Adjustable Rate Mortgage |
| AUD | | Denominated in Australian Dollars |
| BRL | | Denominated in Brazilian Dollars |
| CAD | | Denominated in Canadian Dollars |
| CPI | | Consumer Price Index |
| FCB | | Farm Credit Bank |
| HKD | | Denominated in Hong Kong Dollars |
| LIBOR | | London Interbank Offered Rate |
| MFA | | Mortgage Finance Authority |
| Mtg | | Mortgage |
| Pfd | | Preferred Stock |
| REIT | | Real Estate Investment Trust |
| REMIC | | Real Estate Mortgage Investment Conduit |
See notes to financial statements.
26 Certified Semi-Annual Report
This page intentionally left blank.
Certified Semi-Annual Report 27
| | |
| STATEMENT OF ASSETS AND LIABILITIES |
| |
| Thornburg Investment Income Builder Fund | | March 31, 2010 (Unaudited) |
| | | | |
ASSETS | | | | |
Investments at value (Note 2) | | | | |
Non-affiliated issuers (cost $4,384,667,993) | | $ | 4,803,679,781 | |
Non-controlled affiliated issuers (cost $57,096,188) | | | 61,440,072 | |
Cash | | | 215,870 | |
Cash denominated in foreign currency (cost $982,634) | | | 987,646 | |
Receivable for investments sold | | | 61,684,503 | |
Receivable for fund shares sold | | | 39,545,244 | |
Unrealized appreciation on forward currency contracts (Note 7) | | | 23,053,080 | |
Dividends receivable | | | 15,844,205 | |
Dividend and interest reclaim receivable | | | 865,447 | |
Interest receivable | | | 27,319,842 | |
Prepaid expenses and other assets | | | 146,552 | |
| | | | |
Total Assets | | | 5,034,782,242 | |
| | | | |
| |
LIABILITIES | | | | |
Payable for securities purchased | | | 62,762,514 | |
Payable for fund shares redeemed | | | 9,642,600 | |
Unrealized depreciation on forward currency contracts (Note 7) | | | 1,127,810 | |
Payable to investment advisor and other affiliates (Note 3) | | | 5,071,255 | |
Accounts payable and accrued expenses | | | 742,384 | |
Dividends payable | | | 1,761,827 | |
| | | | |
Total Liabilities | | | 81,108,390 | |
| | | | |
| |
NET ASSETS | | $ | 4,953,673,852 | |
| | | | |
NET ASSETS CONSIST OF: | | | | |
Undistributed net investment income | | $ | 3,751,853 | |
Net unrealized appreciation on investments | | | 445,377,691 | |
Accumulated net realized gain (loss) | | | (772,116,258 | ) |
Net capital paid in on shares of beneficial interest | | | 5,276,660,566 | |
| | | | |
| | $ | 4,953,673,852 | |
| | | | |
28 Certified Semi-Annual Report
| | |
| STATEMENT OF ASSETS AND LIABILITIES, CONTINUED |
| |
| Thornburg Investment Income Builder Fund | | March 31, 2010 (Unaudited) |
| | | |
NET ASSET VALUE: | | | |
Class A Shares: | | | |
Net asset value and redemption price per share ($1,773,543,198 applicable to 96,615,448 shares of beneficial interest outstanding - - Note 4) | | $ | 18.36 |
Maximum sales charge, 4.50% of offering price | | | 0.87 |
| | | |
Maximum offering price per share | | $ | 19.23 |
| | | |
| |
Class C Shares: | | | |
Net asset value and offering price per share * ($1,848,728,472 applicable to 100,689,473 shares of beneficial interest outstanding - Note 4) | | $ | 18.36 |
| | | |
| |
Class I Shares: | | | |
Net asset value, offering and redemption price per share ($1,310,750,861 applicable to 70,918,265 shares of beneficial interest outstanding - Note 4) | | $ | 18.48 |
| | | |
| |
Class R3 Shares: | | | |
Net asset value, offering and redemption price per share ($18,895,706 applicable to 1,029,413 shares of beneficial interest outstanding - Note 4) | | $ | 18.36 |
| | | |
| |
Class R4 Shares: | | | |
Net asset value, offering and redemption price per share ($589,449 applicable to 32,053 shares of beneficial interest outstanding - - Note 4) | | $ | 18.39 |
| | | |
| |
Class R5 Shares: | | | |
Net asset value, offering and redemption price per share ($1,166,166 applicable to 63,100 shares of beneficial interest outstanding - Note 4) | | $ | 18.48 |
| | | |
| * | Redemption price per share is equal to net asset value less any applicable contingent deferred sales charge. |
See notes to financial statements.
Certified Semi-Annual Report 29
| | |
| STATEMENT OF OPERATIONS |
| |
| Thornburg Investment Income Builder Fund | | Six Months Ended March 31, 2010 (Unaudited) |
| | | | |
INVESTMENT INCOME: | | | | |
Dividend income | | | | |
Non-affiliated issuers (net of foreign taxes withheld of $2,176,354) | | $ | 75,469,261 | |
Non-controlled affiliated issuers | | | 3,890,226 | |
Interest income (net of premium amortized of $257,795) | | | 60,583,928 | |
| | | | |
Total Income | | | 139,943,415 | |
| | | | |
|
| EXPENSES: | |
Investment advisory fees (Note 3) | | | 15,457,288 | |
Administration fees (Note 3) | | | | |
Class A Shares | | | 964,794 | |
Class C Shares | | | 988,460 | |
Class I Shares | | | 267,021 | |
Class R3 Shares | | | 10,064 | |
Class R4 Shares | | | 268 | |
Class R5 Shares | | | 190 | |
Distribution and service fees (Note 3) | | | | |
Class A Shares | | | 1,943,125 | |
Class C Shares | | | 7,990,590 | |
Class R3 Shares | | | 40,196 | |
Class R4 Shares | | | 535 | |
Transfer agent fees | | | | |
Class A Shares | | | 642,650 | |
Class C Shares | | | 790,820 | |
Class I Shares | | | 439,595 | |
Class R3 Shares | | | 12,535 | |
Class R4 Shares | | | 972 | |
Class R5 Shares | | | 1,244 | |
Registration and filing fees | | | | |
Class A Shares | | | 47,104 | |
Class C Shares | | | 42,875 | |
Class I Shares | | | 31,401 | |
Class R3 Shares | | | 8,102 | |
Class R4 Shares | | | 8,291 | |
Class R5 Shares | | | 10,123 | |
Custodian fees (Note 3) | | | 403,480 | |
Professional fees | | | 69,650 | |
Accounting fees | | | 78,650 | |
Trustee fees | | | 51,230 | |
Other expenses | | | 219,855 | |
| | | | |
Total Expenses | | | 30,521,108 | |
Less: | | | | |
Expenses reimbursed by investment advisor (Note 3) | | | (935,440 | ) |
| | | | |
Net Expenses | | | 29,585,668 | |
| | | | |
Net Investment Income | | $ | 110,357,747 | |
| | | | |
30 Certified Semi-Annual Report
| | |
| STATEMENT OF OPERATIONS, CONTINUED |
| |
| Thornburg Investment Income Builder Fund | | Six Months Ended March 31, 2010 (Unaudited) |
| | | | |
REALIZED AND UNREALIZED GAIN (LOSS): | | | | |
Net realized gain (loss) from | | | | |
Investments | | | | |
Non-affiliated issuers | | $ | (1,910,954 | ) |
Non-controlled affiliated issuers | | | (4,498 | ) |
Forward currency contracts (Note 7) | | | (33,407,961 | ) |
Foreign currency transactions | | | 255,743 | |
| | | | |
| | | (35,067,670 | ) |
| | | | |
Net change in unrealized appreciation (depreciation) on | | | | |
Investments | | | | |
Non-affiliated issuers | | | 226,838,334 | |
Non-controlled affiliated issuers | | | 2,067,762 | |
Forward currency contracts (Note 7) | | | 57,367,165 | |
Foreign currency translations | | | (60,150 | ) |
| | | | |
| | | 286,213,111 | |
| | | | |
Net Realized and Unrealized Gain | | | 251,145,441 | |
| | | | |
Net Increase in Net Assets Resulting From Operations | | $ | 361,503,188 | |
| | | | |
See notes to financial statements.
Certified Semi-Annual Report 31
STATEMENTS OF CHANGES IN NET ASSETS
Thornburg Investment Income Builder Fund
| | | | | | | | |
| | | Six Months Ended
March 31, 2010* | | | Year Ended
September 30, 2009 | |
INCREASE (DECREASE) IN NET ASSETS FROM: | | | | | | | | |
| | |
OPERATIONS: | | | | | | | | |
Net investment income | | $ | 110,357,747 | | | $ | 196,665,498 | |
Net realized gain (loss) on investments, forward currency contracts, and foreign currency transactions | | | (35,067,670 | ) | | | (571,104,514 | ) |
Increase (decrease) in unrealized appreciation (depreciation) on investments, forward currency contracts, and foreign currency translations | | | 286,213,111 | | | | 646,925,555 | |
| | | | | | | | |
| | |
Net Increase (Decrease) in Net Assets Resulting from Operations | | | 361,503,188 | | | | 272,486,539 | |
| | |
DIVIDENDS TO SHAREHOLDERS: | | | | | | | | |
From net investment income | | | | | | | | |
Class A Shares | | | (46,306,213 | ) | | | (81,529,583 | ) |
Class C Shares | | | (42,388,211 | ) | | | (77,646,832 | ) |
Class I Shares | | | (33,422,091 | ) | | | (50,077,981 | ) |
Class R3 Shares | | | (463,559 | ) | | | (760,087 | ) |
Class R4 Shares | | | (12,126 | ) | | | (17,372 | ) |
Class R5 Shares | | | (22,341 | ) | | | (22,654 | ) |
| | |
FUND SHARE TRANSACTIONS (NOTE 4): | | | | | | | | |
Class A Shares | | | 286,065,606 | | | | (9,678,354 | ) |
Class C Shares | | | 332,654,130 | | | | 6,320,252 | |
Class I Shares | | | 341,178,984 | | | | 116,899,650 | |
Class R3 Shares | | | 3,178,838 | | | | 2,235,374 | |
Class R4 Shares | | | 518,319 | | | | (220,497 | ) |
Class R5 Shares | | | 694,326 | | | | 199,300 | |
| | | | | | | | |
| | |
Net Increase in Net Assets | | | 1,203,178,850 | | | | 178,187,755 | |
| | |
NET ASSETS: | | | | | | | | |
Beginning of Period | | | 3,750,495,002 | | | | 3,572,307,247 | |
| | | | | | | | |
| | |
End of Period | | $ | 4,953,673,852 | | | $ | 3,750,495,002 | |
| | | | | | | | |
| | |
Undistributed net investment income | | $ | 3,751,853 | | | $ | 20,577,079 | |
See notes to financial statements.
32 Certified Semi-Annual Report
| | |
| NOTES TO FINANCIAL STATEMENTS |
| |
| Thornburg Investment Income Builder Fund | | March 31, 2010 (Unaudited) |
NOTE 1 – ORGANIZATION
Thornburg Investment Income Builder Fund, hereinafter referred to as the “Fund,” is a diversified series of Thornburg Investment Trust (the “Trust”). The Trust was organized as a Massachusetts business trust under a Declaration of Trust dated June 3, 1987 and is registered as a diversified, open-end management investment company under the Investment Company Act of 1940, as amended. The Fund is currently one of sixteen separate series of the Trust. Each series is considered to be a separate entity for financial reporting and tax purposes and bears expenses directly attributable to it. The Fund’s primary investment goal is to provide a level of current income which exceeds the average yield on U.S. stocks generally, and which will generally grow, subject to periodic fluctuations, over the years on a per share basis. The Fund’s secondary investment goal is long-term capital appreciation.
The Fund currently offers six classes of shares of beneficial interest: Class A, Class C, Institutional Class (Class I), and Retirement Classes (Class R3, Class R4, and Class R5) shares. Each class of shares of the Fund represents an interest in the same portfolio of investments, except that (i) Class A shares are sold subject to a front-end sales charge collected at the time the shares are purchased and bear a service fee, (ii) Class C shares are sold at net asset value without a sales charge at the time of purchase, but are subject to a contingent deferred sales charge upon redemption within one year of purchase, and bear both a service fee and a distribution fee, (iii) Class I shares are sold at net asset value without a sales charge at the time of purchase, (iv) Class R3 shares are sold at net asset value without a sales charge at the time of purchase, but bear both a service fee and distribution fee, (v) Class R4 shares are sold at net asset value without sales charge at the time of purchase, but bear a service fee, (vi) Class R5 shares are sold at net asset value without a sales charge at the time of purchase, and (vii) the respective classes may have different reinvestment privileges and conversion rights. Additionally, the Fund may allocate among its classes certain expenses, to the extent allowable to specific classes, including transfer agent fees, government registration fees, certain printing and postage costs, and administrative and legal expenses. Currently, class specific expenses of the Fund are limited to service and distribution fees, administration fees, and certain registration and transfer agent expenses.
NOTE 2 – SIGNIFICANT ACCOUNTING POLICIES
Significant accounting policies of the Trust are as follows:
Valuation of Investments: Portfolio securities listed or traded on a national securities exchange are valued on the valuation date at the last reported sale price on the exchange that is the primary market for the security. Portfolio securities traded on an exchange for which there has been no sale that day and other equity securities traded in the over-the-counter market are valued at the mean between the last reported bid and asked prices. Portfolio securities reported by NASDAQ are valued at the NASDAQ official closing price. Any foreign security traded on exchanges outside the United States is valued at the price of the security on the exchange that is normally the security’s primary market, as of the close of that exchange preceding the time of the Fund’s valuation.
Debt obligations held by the Fund have a primary market over the counter and are valued by an independent pricing service approved by the Trustees of the Trust. The pricing service ordinarily values debt obligations at quoted bid prices. When quotations are not available, debt obligations held by the Fund are valued at evaluated prices determined by the pricing service using methods which include consideration of yields or prices of debt obligations of comparable quality, type of issue, coupon, maturity and rating, and indications as to value from dealers and general market conditions. Short-term obligations having remaining maturities of 60 days or less are valued at amortized cost, which approximates market value.
Quotations in foreign currencies for foreign portfolio investments are converted to U.S. dollar equivalents using the foreign exchange quotation in effect at the time of valuation.
In any case where the market value of an equity security held by the Fund is not readily available, the Trust’s valuation and pricing committee determines a fair value for the security using procedures approved by the Trustees, which may include the use of a price obtained from an independent pricing service. The pricing service ordinarily values equity securities in these instances using multi-factor models to adjust market prices based upon various inputs, including exchange data, depository receipt prices, futures and index data and other data. A security’s market value is deemed not readily available whenever the exchange or market on which the security is primarily traded is closed for the entire scheduled day of trading. Additionally, a security’s market value may be deemed not readily available under other circumstances identified by the Trustees, including when developments occurring after the most recent close of the security’s primary exchange or market, but before the most recent close of trading in Fund shares, create a serious question about the reliability of the security’s market value.
Certified Semi-Annual Report 33
| | |
| NOTES TO FINANCIAL STATEMENTS, CONTINUED |
| |
| Thornburg Investment Income Builder Fund | | March 31, 2010 (Unaudited) |
In any case where a pricing service fails to provide a price for a debt obligation held by the Fund, the valuation and pricing committee determines a fair value for the debt obligation using procedures approved by the Trustees. Additionally, in any case where management believes that a price provided by a pricing service for a debt obligation held by the Fund may be unreliable, the valuation and pricing committee decides whether or not to use the pricing service’s valuation or to determine a fair value for the debt obligation.
In determining fair value for any portfolio security or other investment, the valuation and pricing committee seeks to determine the amount that an owner of the investment might reasonably expect to receive upon a sale of the investment. However, because fair value prices are estimated prices, the valuation and pricing committee’s determination of fair value for an investment may differ from the value that would be realized by the Fund upon a sale of the investment, and that difference could be material to the Fund’s financial statements. The valuation and pricing committee’s determination of fair value for an investment may also differ from the prices obtained by other persons (including other mutual funds) for the investment.
Valuation Measurements: Various inputs are used in determining the value of the Fund’s investments. These inputs are summarized in the three levels listed below.
Level 1: Quoted prices in active markets for identical investments.
Level 2: Other significant observable inputs (including quoted prices for similar investments, interest rates, prepayment rates, credit risk, etc.).
Level 3: Significant unobservable inputs (including the Fund’s own assumptions in determining the fair value of investments). The following table displays a summary of the inputs used to value the Fund’s net assets as of March 31, 2010. In any instance when valuation inputs from more than one level are used to determine the fair value of a specific investment, the investment is placed in the level of the table based upon the lowest level input that is significant in determining the fair value of the investment:
| | | | | | | | | | | | | | | |
| | | Fair Value Measurements at March 31, 2010 |
| | | Total | | | Level 1 | | | Level 2 | | | Level 3 |
Assets | | | | | | | | | | | | | | | |
Investments in Securities* | | | | | | | | | | | | | | | |
Common Stock | | $ | 3,036,992,505 | | | $ | 3,036,992,505 | | | $ | — | | | $ | — |
Preferred Stock | | | 191,694,916 | | | | 179,856,166 | | | | 11,838,750 | | | | — |
Exchange Traded Funds | | | 55,231,250 | | | | 55,231,250 | | | | — | | | | — |
Asset Backed Securities | | | 20,896,782 | | | | — | | | | 20,896,782 | | | | — |
Corporate Bonds | | | 1,252,049,147 | | | | — | | | | 1,252,049,147 | | | | — |
Convertible Bonds | | | 163,441,825 | | | | — | | | | 163,441,825 | | | | — |
Municipal Bonds | | | 1,479,998 | | | | — | | | | 1,479,998 | | | | — |
U.S. Government Agencies | | | 16,114,456 | | | | — | | | | 16,114,456 | | | | — |
Foreign Bonds | | | 33,557,254 | | | | — | | | | 33,557,254 | | | | — |
Other Securities | | | 30,211,720 | | | | — | | | | 30,211,720 | | | | — |
Short Term Investments | | | 63,450,000 | | | | — | | | | 63,450,000 | | | | — |
| | | | | | | | | | | | | | | |
Total Investments in Securities | | $ | 4,865,119,853 | | | $ | 3,272,079,921 | | | $ | 1,593,039,932 | | | $ | — |
| | | | |
Other Financial Instruments** | | | | | | | | | | | | | | | |
Forward Currency Contracts | | $ | 23,053,080 | | | $ | — | | | $ | 23,053,080 | | | $ | — |
Spot Currency | | $ | 388,002 | | | $ | 388,002 | | | $ | — | | | $ | — |
| | | | |
Liabilities | | | | | | | | | | | | | | | |
Other Financial Instruments** | | | | | | | | | | | | | | | |
Forward Currency Contracts | | $ | (1,127,810 | ) | | $ | — | | | $ | (1,127,810 | ) | | $ | — |
Spot Currency | | $ | (547,458 | ) | | $ | (547,458 | ) | | $ | — | | | $ | — |
| * | See Schedule of Investments for a summary of the industry exposure as grouped according to the Global Industry Classification Standard (GICS), which is an industry taxonomy developed by Morgan Stanley Capital International (MSCI), and Standard & Poor’s (S&P). |
34 Certified Semi-Annual Report
| | |
| NOTES TO FINANCIAL STATEMENTS, CONTINUED |
| |
| Thornburg Investment Income Builder Fund | | March 31, 2010 (Unaudited) |
| ** | Other Financial Instruments include investments not reflected in the Schedule of Investments, such as futures, forwards and swap contracts, which are valued at the unrealized appreciation (depreciation) on the instrument. |
Foreign Currency Translation: Portfolio securities and other assets and liabilities denominated in foreign currencies are translated into U.S. dollars based on the exchange rate of such currencies against the U.S. dollar on the date of valuation. Purchases and sales of securities and income items denominated in foreign currencies are translated into U.S. dollars at the exchange rate in effect on the translation date. When the Fund purchases or sells foreign securities it will customarily enter into a foreign exchange contract to minimize foreign exchange risk from the trade date to the settlement date of such transactions.
The Fund does not separately report the effect of changes in foreign exchange rates from changes in market prices on securities held. Such changes are included in net realized and unrealized gain or loss from investments.
Reported net realized foreign exchange gains or losses arise from sales of foreign currencies, currency gains or losses realized between the trade and settlement dates on securities transactions and the difference between the amounts of dividends, interest, and foreign withholding taxes recorded on the Fund’s books, and the U.S. dollar equivalent of the amounts actually received or paid.
Net unrealized foreign exchange gains and losses arise from changes in the fair value of assets and liabilities, other than investments in securities at fiscal period end, resulting from changes in exchange rates.
Deferred Taxes: The Fund is subject to a tax imposed on net realized gains of securities of certain foreign issuers. The Fund records an estimated deferred tax liability for net unrealized gains on these securities as reflected in the accompanying financial statements.
Federal Income Taxes: It is the policy of the Trust to comply with the provisions of the Internal Revenue Code applicable to “regulated investment companies” and to distribute to shareholders substantially all taxable income, including any net realized gain on investments of the Fund. Therefore, no provision for federal income taxes is required.
When-Issued and Delayed Delivery Transactions: The Fund may engage in when-issued or delayed delivery transactions. To the extent the Fund engages in such transactions, it will do so for the purpose of acquiring portfolio securities consistent with the Fund’s investment objectives and not for the purpose of investment leverage or to speculate on interest rate and/or market changes. At the time the Fund makes a commitment to purchase a security on a when-issued or delayed delivery basis, the Fund will record the transaction and reflect the value in determining its net asset value. When effecting such transactions, assets of an amount sufficient to make payment for the portfolio securities to be purchased will be segregated on the Fund’s records on the trade date. Securities purchased on a when-issued or delayed delivery basis do not earn interest until the settlement date.
Dividends: Net investment income of the Fund is declared daily as a dividend on shares for which the Fund has received payment. Dividends are paid quarterly and are reinvested in additional shares of the Fund at net asset value per share at the close of business on the dividend payment date, or at the shareholder’s option, paid in cash. Net realized capital gains, to the extent available, will be distributed at least annually. Distributions to shareholders are based on income tax regulations and therefore, their characteristics may differ for financial statement and tax purposes.
General: Securities transactions are accounted for on a trade date basis. Interest income is accrued as earned and dividend income is recorded on the ex-dividend date. Certain income from foreign securities is recognized as soon as information is available to the Fund. Realized gains and losses from the sale of securities are recorded on an identified cost basis. Net investment income (other than class specific expenses) and realized and unrealized gains and losses are allocated daily to each class of shares based upon the relative net asset value of outstanding shares of each class of shares at the beginning of the day (after adjusting for the current share activity of the respective class). Expenses common to all funds are allocated among the funds comprising the Trust based upon their relative net asset values or other appropriate allocation methods.
Guarantees and Indemnifications: Under the Trust’s organizational documents, its officers and Trustees are indemnified against certain liabilities arising out of the performance of their duties to the Fund. Additionally, in the normal course of business the Trust enters into contracts with service providers that contain general indemnification clauses. The Trust’s maximum exposure under these arrangements is unknown. However, based on experience, the Trust expects the risk of loss to be remote.
Certified Semi-Annual Report 35
| | |
NOTES TO FINANCIAL STATEMENTS, CONTINUED | | |
| |
| Thornburg Investment Income Builder Fund | | March 31, 2010 (Unaudited) |
Use of Estimates: The preparation of financial statements, in conformity with generally accepted accounting principles, requires management to make estimates and assumptions that affect the reported amounts of assets and liabilities and the disclosure of contingent assets and liabilities at the date of the financial statements and the reported amounts of increases and decreases in net assets from operations during the reporting period. Actual results could differ from those estimates.
NOTE 3 – INVESTMENT ADVISORY FEE AND OTHER TRANSACTIONS WITH AFFILIATES
Pursuant to an investment advisory agreement, Thornburg Investment Management, Inc. (the “Advisor”) serves as the investment advisor and performs services to the Fund for which the fees are payable at the end of each month. For the six months ended March 31, 2010, these fees were payable at annual rates ranging from .875 of 1% to .675 of 1% per annum of the average daily net assets of the Fund depending on the Fund’s asset size. The Trust also has entered into administrative services agreements with the Advisor, whereby the Advisor will perform certain administrative services for the shareholders of each class of the Fund’s shares, and for which fees will be payable at an annual rate of up to .125 of 1% per annum of the average daily net assets attributable to each class of shares. For the six months ended March 31, 2010, the Advisor voluntarily or contractually agreed to reimburse certain class specific expenses, administrative fees, and distribution fees of $903,567 for Class C shares, $12,422 for Class R3 shares, $8,722 for Class R4 shares, and $10,729 for Class R5 shares.
The Trust has an underwriting agreement with Thornburg Securities Corporation (the “Distributor,” an affiliate of the Advisor), which acts as the distributor of the Fund’s shares. For the six months ended March 31, 2010, the Distributor has advised the Fund that it earned commissions aggregating $617,316 from the sale of Class A shares, and collected contingent deferred sales charges aggregating $46,241 from redemptions of Class C shares of the Fund.
Pursuant to a service plan under Rule 12b-1 of the Investment Company Act of 1940, the Fund may reimburse to the Advisor an amount not to exceed .25 of 1% per annum of the average daily net assets attributable to each class of shares of the Fund for payments made by the Advisor to securities dealers and other financial institutions to obtain various shareholder and distribution related services. The Advisor may pay out of its own resources additional expenses for distribution of the Fund’s shares.
The Trust has also adopted distribution plans pursuant to Rule 12b-1, applicable only to the Fund’s Class C and Class R3 shares, under which the Fund compensates the Distributor for services in promoting the sale of Class C and Class R3 shares of the Fund at an annual rate of up to .75 of 1% per annum of the average daily net assets attributable to Class C and Class R3 shares. Total fees incurred by the Distributor for each class of shares of the Fund under their respective Service and Distribution Plans for the six months ended March 31, 2010, are set forth in the Statement of Operations.
The Trust has an agreement with the custodian bank to indirectly pay a portion of the custodian’s fees through credits earned by the Fund’s cash on deposit with the bank. This deposit agreement is an alternative to overnight investments. Custodial fees have been adjusted to reflect amounts that would have been paid without this agreement, with a corresponding adjustment reflected as fees paid indirectly in the Statement of Operations. For the six months ended March 31, 2010, there were no fees paid indirectly.
Certain officers and Trustees of the Trust are also officers and/or directors of the Advisor and Distributor. The compensation of independent Trustees is borne by the Trust.
36 Certified Semi-Annual Report
| | |
NOTES TO FINANCIAL STATEMENTS, CONTINUED |
| |
| Thornburg Investment Income Builder Fund | | March 31, 2010 (Unaudited) |
NOTE 4 – SHARES OF BENEFICIAL INTEREST
At March 31, 2010, there were an unlimited number of shares of beneficial interest authorized. Transactions in shares of beneficial interest were as follows:
| | | | | | | | | | | | | | |
| | | Six Months Ended
March 31, 2010 (Unaudited) | | | Year Ended
September 30, 2009 (Audited) | |
| | | Shares | | | Amount | | | Shares | | | Amount | |
Class A Shares | | | | | | | | | | | | | | |
Shares sold | | 21,583,959 | | | $ | 384,109,126 | | | 23,619,565 | | | $ | 344,260,373 | |
Shares issued to shareholders in reinvestment of dividends | | 1,993,896 | | | | 35,792,396 | | | 4,335,112 | | | | 63,114,813 | |
Shares repurchased | | (7,535,197 | ) | | | (133,847,476 | ) | | (30,011,243 | ) | | | (417,076,271 | ) |
Redemption fees received* | | — | | | | 11,560 | | | — | | | | 22,731 | |
| | | | | | | | | | | | | | |
| | | | |
Net Increase (Decrease) | | 16,042,658 | | | $ | 286,065,606 | | | (2,056,566 | ) | | $ | (9,678,354 | ) |
| | | | | | | | | | | | | | |
| | | | |
Class C Shares | | | | | | | | | | | | | | |
Shares sold | | 23,039,925 | | | $ | 410,563,316 | | | 20,018,794 | | | $ | 292,989,819 | |
Shares issued to shareholders in reinvestment of dividends | | 1,735,157 | | | | 31,140,585 | | | 3,950,571 | | | | 57,445,432 | |
Shares repurchased | | (6,134,344 | ) | | | (109,061,646 | ) | | (24,910,649 | ) | | | (344,138,583 | ) |
Redemption fees received* | | — | | | | 11,875 | | | — | | | | 23,584 | |
| | | | | | | | | | | | | | |
| | | | |
Net Increase (Decrease) | | 18,640,738 | | | $ | 332,654,130 | | | (941,284 | ) | | $ | 6,320,252 | |
| | | | | | | | | | | | | | |
| | | | |
Class I Shares | | | | | | | | | | | | | | |
Shares sold | | 24,166,649 | | | $ | 433,074,988 | | | 25,254,006 | | | $ | 372,821,670 | |
Shares issued to shareholders in reinvestment of dividends | | 1,430,729 | | | | 25,875,749 | | | 2,665,325 | | | | 39,209,566 | |
Shares repurchased | | (6,574,158 | ) | | | (117,779,925 | ) | | (21,210,176 | ) | | | (295,144,783 | ) |
Redemption fees received* | | — | | | | 8,172 | | | — | | | | 13,197 | |
| | | | | | | | | | | | | | |
| | | | |
Net Increase (Decrease) | | 19,023,220 | | | $ | 341,178,984 | | | 6,709,155 | | | $ | 116,899,650 | |
| | | | | | | | | | | | | | |
| | | | |
Class R3 Shares | | | | | | | | | | | | | | |
Shares sold | | 341,506 | | | $ | 6,099,945 | | | 421,734 | | | $ | 6,146,795 | |
Shares issued to shareholders in reinvestment of dividends | | 24,355 | | | | 437,088 | | | 46,884 | | | | 688,297 | |
Shares repurchased | | (189,605 | ) | | | (3,358,314 | ) | | (318,696 | ) | | | (4,599,932 | ) |
Redemption fees received* | | — | | | | 119 | | | — | | | | 214 | |
| | | | | | | | | | | | | | |
| | | | |
Net Increase (Decrease) | | 176,256 | | | $ | 3,178,838 | | | 149,922 | | | $ | 2,235,374 | |
| | | | | | | | | | | | | | |
| | | | |
Class R4 Shares | | | | | | | | | | | | | | |
Shares sold | | 29,116 | | | $ | 514,644 | | | 2,542 | | | $ | 38,228 | |
Shares issued to shareholders in reinvestment of dividends | | 624 | | | | 11,236 | | | 1,173 | | | | 17,252 | |
Shares repurchased | | (420 | ) | | | (7,564 | ) | | (15,815 | ) | | | (275,982 | ) |
Redemption fees received* | | — | | | | 3 | | | — | | | | 5 | |
| | | | | | | | | | | | | | |
| | | | |
Net Increase (Decrease) | | 29,320 | | | $ | 518,319 | | | (12,100 | ) | | $ | (220,497 | ) |
| | | | | | | | | | | | | | |
Certified Semi-Annual Report 37
| | |
| NOTES TO FINANCIAL STATEMENTS, CONTINUED |
| |
| Thornburg Investment Income Builder Fund | | March 31, 2010 (Unaudited) |
| | | | | | | | | | | | | |
| | | Six Months Ended
March 31, 2010 (Unaudited) | | | Year Ended
September 30, 2009 (Audited) | |
| | | Shares | | | Amount | | | Shares | | Amount | |
Class R5 Shares | | | | | | | | | | | | | |
Shares sold | | 40,448 | | | $ | 724,867 | | | 40,091 | | $ | 600,510 | |
Shares issued to shareholders in reinvestment of dividends | | 1,236 | | | | 22,403 | | | 1,391 | | | 20,773 | |
Shares repurchased | | (2,966 | ) | | | (52,950 | ) | | (30,138) | | | (421,988 | ) |
Redemption fees received* | | — | | | | 6 | | | — | | | 5 | |
| | | | | | | | | | | | | |
| | | | |
Net Increase (Decrease) | | 38,718 | | | $ | 694,326 | | | 11,344 | | $ | 199,300 | |
| | | | | | | | | | | | | |
| * | The Fund charges a redemption fee of 1% of the Class A and Class I shares redeemed or exchanged within 30 days of purchase. Redemption fees charged to any class are allocated to all classes upon receipt of payment based on relative net asset values of each class or other appropriate allocation methods. |
NOTE 5 – SECURITIES TRANSACTIONS
For the six months ended March 31, 2010, the Fund had purchase and sale transactions of investment securities (excluding short-term investments and U. S. Government obligations) of $1,445,170,839 and $546,008,502, respectively.
NOTE 6 – INCOME TAXES
At March 31, 2010, information on the tax components of capital is as follows:
| | | | |
Cost of investments for tax purposes | | $ | 4,441,764,181 | |
| | | | |
Gross unrealized appreciation on a tax basis | | $ | 625,642,794 | |
Gross unrealized depreciation on a tax basis | | | (202,287,122 | ) |
| | | | |
Net unrealized appreciation (depreciation) on investments (tax basis) | | $ | 423,355,672 | |
| | | | |
At March 31, 2010, the Fund had deferred tax basis currency and capital losses occurring subsequent to October 31, 2008 of $4,298,828 and $493,528,843, respectively. For tax purposes, such losses will be reflected in the year ending September 30, 2010.
At March 31, 2010, the Fund had tax basis capital losses, which may be carried forward to offset future capital gains. To the extent such carryforwards are used, capital gain distributions may be reduced to the extent provided by regulations.
Such capital loss carryforwards expire as follows:
| | | |
2016 | | $ | 4,262,779 |
2017 | | | 280,451,429 |
| | | |
| | $ | 284,714,208 |
| | | |
NOTE 7 – DERIVATIVE FINANCIAL INSTRUMENTS WITH OFF-BALANCE SHEET RISK AND FOREIGN INVESTMENT RISK
The Fund may use a variety of derivative financial instruments to hedge or adjust the risks affecting its investment portfolio or to enhance investment returns. Provisions of FASB Accounting Standards Codification ASC 815-10-50, (“ASC 815”) require certain disclosures. The new requirement amends and expands disclosures related to derivative instruments to provide users of financial statements with an enhanced understanding of the use of derivative instruments by the Fund and how these derivatives affect the financial position, financial performance and cash flows of the Fund. The Fund does not designate any derivative instruments as hedging instruments under ASC 815. During the six months ended March 31, 2010, the Fund’s principal exposure to derivative financial instruments of the type
38 Certified Semi-Annual Report
| | |
| NOTES TO FINANCIAL STATEMENTS, CONTINUED |
| |
| Thornburg Investment Income Builder Fund | | March 31, 2010 (Unaudited) |
addressed by ASC 815 was investment in foreign exchange contracts. A foreign exchange contract is an agreement between two parties to exchange different currencies at a specified rate of exchange at an agreed upon future date. Foreign exchange contracts involve risks to the Fund, including the risk that a contract counterparty will not meet its obligations to the Fund, the risk that a change in a contract’s value may not correlate perfectly with the currency the contract was intended to track, and the risk that the Fund’s advisor is unable to correctly implement its strategy in using a contract. In any such instance, the Fund may not achieve the intended benefit of entering into a contract, and may experience a loss.
The Fund entered into forward currency contracts during the six months ended March 31, 2010 in the normal course of pursuing its investment objectives, in anticipation of purchasing foreign investments or with the intent of reducing the risk to the value of the Fund’s foreign investments from adverse changes in the relationship between the U.S. dollar and foreign currencies. In each case these contracts have been initiated in conjunction with foreign investment transactions.
These contracts are accounted for by the Fund under ASC 815. Unrealized gains and unrealized losses on outstanding contracts are reported in the Fund’s Statement of Assets and Liabilities at the Fund’s net equity, as measured by the difference between the forward exchange rates at the reporting date and the forward exchange rates at each contract’s inception date. Net realized gain (loss) on contracts closed during the period, and changes in net unrealized appreciation (depreciation) on outstanding contracts are recognized in the Fund’s Statement of Operations.
The following table displays the outstanding forward currency contracts, at March 31, 2010:
| | | | | | | | | | | | | | | | |
Contract Description | | Buy/Sell | | Contract
Amount | | Contract
Value Date | | Value
USD | | Unrealized
Appreciation | | Unrealized
Depreciation | |
Euro | | Buy | | 211,200,000 | | 04/06/2010 | | $ | 285,257,380 | | $ | 179,620 | | $ | — | |
Euro | | Sell | | 192,200,000 | | 04/06/2010 | | | 259,595,021 | | | 19,873,389 | | | — | |
Euro | | Sell | | 19,000,000 | | 04/06/2010 | | | 25,662,359 | | | 85,301 | | | — | |
Euro | | Sell | | 253,400,000 | | 10/06/2010 | | | 342,226,956 | | | — | | | (225,646 | ) |
Great Britain Pound | | Buy | | 12,250,000 | | 04/06/2010 | | | 18,589,363 | | | — | | | (382,825 | ) |
Great Britain Pound | | Buy | | 20,425,000 | | 04/06/2010 | | | 30,994,918 | | | 12,236 | | | — | |
Great Britain Pound | | Sell | | 4,675,000 | | 04/06/2010 | | | 7,094,308 | | | — | | | (129,446 | ) |
Great Britain Pound | | Sell | | 28,000,000 | | 04/06/2010 | | | 42,489,973 | | | 2,182,907 | | | — | |
Great Britain Pound | | Sell | | 19,200,000 | | 10/06/2010 | | | 29,105,070 | | | — | | | (11,310 | ) |
Swiss Franc | | Buy | | 52,000,000 | | 04/06/2010 | | | 49,317,147 | | | 139,920 | | | — | |
Swiss Franc | | Sell | | 42,000,000 | | 04/06/2010 | | | 39,833,080 | | | 579,707 | | | — | |
Swiss Franc | | Sell | | 10,000,000 | | 04/06/2010 | | | 9,484,067 | | | — | | | (182,606 | ) |
Swiss Franc | | Sell | | 72,600,000 | | 10/06/2010 | | | 68,964,862 | | | — | | | (195,977 | ) |
| | | | | | | | | | | | | | | | |
Total | | | | | | | | | | | $ | 23,053,080 | | $ | (1,127,810 | ) |
| | | | | | | | | | | | | | | | |
The unrealized appreciation (depreciation) of the outstanding forward currency contracts recognized in the Fund’s Statement of Assets and Liabilities at March 31, 2010 is disclosed in the following table:
| | | | |
Fair Values of Derivative Financial Instruments at March 31, 2010 |
Asset Derivatives
| | | | | |
| | | Balance Sheet Location | | Fair Value |
Foreign exchange contracts | | Assets - Unrealized appreciation on
forward currency contracts | | $ | 23,053,080 |
Liability Derivatives
| | | | | | |
| | | Balance Sheet Location | | Fair Value | |
Foreign exchange contracts | | Liabilities - Unrealized depreciation on
forward currency contracts | | $ | (1,127,810 | ) |
Certified Semi-Annual Report 39
| | |
| NOTES TO FINANCIAL STATEMENTS, CONTINUED |
| |
| Thornburg Investment Income Builder Fund | | March 31, 2010 (Unaudited) |
The realized gains (losses) from forward currency contracts, and the change in unrealized appreciation (depreciation) of outstanding forward currency contracts recognized in the Fund’s Statement of Operations for the six months ended March 31, 2010 is disclosed in the following tables:
| | | | | | | | |
Amount of Realized Gain (Loss) on Derivative Financial Instruments Recognized in Income for the Six Months Ended March 31, 2010 | |
| | | Total | | | Forward Currency Contracts | |
Foreign exchange contracts | | $ | (33,407,961 | ) | | $ | (33,407,961 | ) |
|
Change in Unrealized Appreciation (Depreciation) of Derivative Financial Instruments Recognized in Income for the Six Months Ended March 31, 2010 | |
| | | Total | | | Forward Currency Contracts | |
Foreign exchange contracts | | $ | 57,367,165 | | | $ | 57,367,165 | |
OTHER NOTES
Fund management believes no events have occurred between March 31, 2010 and May 20, 2010, the date of issuance of the financial statements, that require adjustment of, or disclosure in, the accompanying financial statements.
40 Certified Semi-Annual Report
This page intentionally left blank.
Certified Semi-Annual Report 41
| | |
| FINANCIAL HIGHLIGHTS |
| |
| Thornburg Investment Income Builder Fund | | |
| | | | | | | | | | | | | | | | | | | | | | | | | | | | | | | | | | | | | | | | | | | |
| | | PER SHARE PERFORMANCE (for a share outstanding throughout the period)+ | | RATIOS TO AVERAGE NET ASSETS | | | SUPPLEMENTAL DATA |
Unless
Otherwise
Noted,
Periods
are Fiscal
Years
Ended
Sept. 30, | | Net Asset
Value
Beginning
of
Period | | Net
Investment
Income
(Loss) | | Net
Realized
&
Unrealized
Gain (Loss)
on
Investments | | | Total from
Investment
Operations | | | Dividends
from Net
Investment
Income | | | Dividends
from Net
Realized
Gains | | | Total
Dividends | | | Net
Asset
Value
End
of
Period | | Net
Investment
Income
(Loss)
(%) | | | Expenses,
After
Expense
Reductions
(%) | | | Expenses,
After
Expense
Reductions
and
Net of
Custody
Credits
(%) | | | Expenses,
Before
Expense
Reductions
(%) | | | Total
Return
(%)(a) | | | Portfolio
Turnover
Rate (%) | | Net Assets
at End
of Period
(Thousands) |
Class A Shares | | | | | | | | | | | | | | | | | | | | | | | | | | | | | | | | | | | | | | | | |
2010(b)(c) | | $ | 17.38 | | 0.48 | | 1.04 | | | 1.52 | | | (0.54 | ) | | — | | | (0.54 | ) | | $ | 18.36 | | 5.40 | (d) | | 1.24 | (d) | | 1.24 | (d) | | 1.24 | (d) | | 8.86 | | | 13.20 | | $ | 1,773,543 |
2009(c) | | $ | 16.86 | | 1.01 | | 0.58 | | | 1.59 | | | (1.07 | ) | | — | | | (1.07 | ) | | $ | 17.38 | | 7.03 | | | 1.30 | | | 1.30 | | | 1.30 | | | 10.89 | | | 63.05 | | $ | 1,400,454 |
2008(c) | | $ | 23.35 | | 1.04 | | (6.04 | ) | | (5.00 | ) | | (1.02 | ) | | (0.47 | ) | | (1.49 | ) | | $ | 16.86 | | 5.01 | | | 1.25 | | | 1.25 | | | 1.25 | | | (22.48 | ) | | 46.07 | | $ | 1,393,268 |
2007(c) | | $ | 19.58 | | 0.93 | | 4.23 | | | 5.16 | | | (0.88 | ) | | (0.51 | ) | | (1.39 | ) | | $ | 23.35 | | 4.39 | | | 1.30 | | | 1.30 | | | 1.30 | | | 27.40 | | | 62.60 | | $ | 1,697,061 |
2006(c) | | $ | 17.93 | | 0.78 | | 1.98 | | | 2.76 | | | (0.77 | ) | | (0.34 | ) | | (1.11 | ) | | $ | 19.58 | | 4.22 | | | 1.38 | | | 1.38 | | | 1.38 | | | 16.05 | | | 55.29 | | $ | 903,347 |
2005(c) | | $ | 15.60 | | 0.73 | | 2.24 | | | 2.97 | | | (0.64 | ) | | — | | | (0.64 | ) | | $ | 17.93 | | 4.26 | | | 1.47 | | | 1.47 | | | 1.47 | | | 19.21 | | | 76.76 | | $ | 515,915 |
| | | | | | | | | | | | | | |
Class C Shares | | | | | | | | | | | | | | | | | | | | | | | | | | | | | | | | | | | | | | | | |
2010 (b) | | $ | 17.39 | | 0.42 | | 1.03 | | | 1.45 | | | (0.48 | ) | | — | | | (0.48 | ) | | $ | 18.36 | | 4.75 | (d) | | 1.90 | (d) | | 1.90 | (d) | | 2.01 | (d) | | 8.46 | | | 13.20 | | $ | 1,848,728 |
2009 | | $ | 16.87 | | 0.92 | | 0.59 | | | 1.51 | | | (0.99 | ) | | — | | | (0.99 | ) | | $ | 17.39 | | 6.44 | | | 1.90 | | | 1.90 | | | 2.08 | | | 10.27 | | | 63.05 | | $ | 1,426,613 |
2008 | | $ | 23.37 | | 0.90 | | (6.04 | ) | | (5.14 | ) | | (0.89 | ) | | (0.47 | ) | | (1.36 | ) | | $ | 16.87 | | 4.36 | | | 1.90 | | | 1.90 | | | 2.03 | | | (23.02 | ) | | 46.07 | | $ | 1,399,947 |
2007 | | $ | 19.60 | | 0.81 | | 4.22 | | | 5.03 | | | (0.75 | ) | | (0.51 | ) | | (1.26 | ) | | $ | 23.37 | | 3.79 | | | 1.90 | | | 1.89 | | | 2.06 | | | 26.64 | | | 62.60 | | $ | 1,535,532 |
2006 | | $ | 17.95 | | 0.70 | | 1.97 | | | 2.67 | | | (0.68 | ) | | (0.34 | ) | | (1.02 | ) | | $ | 19.60 | | 3.73 | | | 1.90 | | | 1.90 | | | 2.15 | | | 15.45 | | | 55.29 | | $ | 636,947 |
2005 | | $ | 15.62 | | 0.66 | | 2.24 | | | 2.90 | | | (0.57 | ) | | — | | | (0.57 | ) | | $ | 17.95 | | 3.84 | | | 1.90 | | | 1.89 | | | 2.23 | | | 18.70 | | | 76.76 | | $ | 337,489 |
| | | | | | | | | | | | | | |
Class I Shares | | | | | | | | | | | | | | | | | | | | | | | | | | | | | | | | | | | | | | | | |
2010(b) | | $ | 17.50 | | 0.51 | | 1.04 | | | 1.55 | | | (0.57 | ) | | — | | | (0.57 | ) | | $ | 18.48 | | 5.75 | (d) | | 0.91 | (d) | | 0.91 | (d) | | 0.91 | (d) | | 8.99 | | | 13.20 | | $ | 1,310,751 |
2009 | | $ | 16.97 | | 1.07 | | 0.59 | | | 1.66 | | | (1.13 | ) | | — | | | (1.13 | ) | | $ | 17.50 | | 7.39 | | | 0.97 | | | 0.97 | | | 0.97 | | | 11.29 | | | 63.05 | | $ | 908,126 |
2008 | | $ | 23.50 | | 1.10 | | (6.06 | ) | | (4.96 | ) | | (1.10 | ) | | (0.47 | ) | | (1.57 | ) | | $ | 16.97 | | 5.34 | | | 0.89 | | | 0.89 | | | 0.89 | | | (22.20 | ) | | 46.07 | | $ | 766,772 |
2007 | | $ | 19.71 | | 1.02 | | 4.24 | | | 5.26 | | | (0.96 | ) | | (0.51 | ) | | (1.47 | ) | | $ | 23.50 | | 4.74 | | | 0.95 | | | 0.94 | | | 0.95 | | | 27.80 | | | 62.60 | | $ | 644,294 |
2006 | | $ | 18.03 | | 0.88 | | 1.98 | | | 2.86 | | | (0.84 | ) | | (0.34 | ) | | (1.18 | ) | | $ | 19.71 | | 4.68 | | | 0.99 | | | 0.98 | | | 1.02 | | | 16.53 | | | 55.29 | | $ | 308,859 |
2005 | | $ | 15.64 | | 0.84 | | 2.22 | | | 3.06 | | | (0.67 | ) | | — | | | (0.67 | ) | | $ | 18.03 | | 4.86 | | | 1.00 | | | 0.99 | | | 1.09 | | | 19.73 | | | 76.76 | | $ | 129,110 |
| | | | | | | | | | | | | | |
Class R3 Shares | | | | | | | | | | | | | | | | | | | | | | | | | | | | | | | | | | | | | | | | |
2010(b) | | $ | 17.38 | | 0.45 | | 1.05 | | | 1.50 | | | (0.52 | ) | | — | | | (0.52 | ) | | $ | 18.36 | | 5.14 | (d) | | 1.50 | (d) | | 1.50 | (d) | | 1.65 | (d) | | 8.73 | | | 13.20 | | $ | 18,896 |
2009 | | $ | 16.85 | | 1.00 | | 0.58 | | | 1.58 | | | (1.05 | ) | | — | | | (1.05 | ) | | $ | 17.38 | | 6.93 | | | 1.50 | | | 1.50 | | | 1.87 | | | 10.74 | | | 63.05 | | $ | 14,828 |
2008 | | $ | 23.34 | | 1.00 | | (6.05 | ) | | (5.05 | ) | | (0.97 | ) | | (0.47 | ) | | (1.44 | ) | | $ | 16.85 | | 4.89 | | | 1.49 | | | 1.49 | | | 1.77 | | | (22.69 | ) | | 46.07 | | $ | 11,848 |
2007 | | $ | 19.58 | | 0.86 | | 4.24 | | | 5.10 | | | (0.83 | ) | | (0.51 | ) | | (1.34 | ) | | $ | 23.34 | | 4.00 | | | 1.50 | | | 1.50 | | | 2.16 | | | 27.10 | | | 62.60 | | $ | 7,544 |
2006 | | $ | 17.93 | | 0.82 | | 1.92 | | | 2.74 | | | (0.75 | ) | | (0.34 | ) | | (1.09 | ) | | $ | 19.58 | | 4.36 | | | 1.50 | | | 1.50 | | | 6.05 | | | 15.91 | | | 55.29 | | $ | 1,301 |
2005(e) | | $ | 16.98 | | 0.50 | | 0.79 | | | 1.29 | | | (0.34 | ) | | — | | | (0.34 | ) | | $ | 17.93 | | 4.27 | (d) | | 1.50 | (d) | | 1.49 | (d) | | 28.93 | (d)(f) | | 7.67 | | | 76.76 | | $ | 280 |
| | | | | | | | | | | | | | |
Class R4 Shares | | | | | | | | | | | | | | | | | | | | | | | | | | | | | | | | | | | | | | | | |
2010(b) | | $ | 17.47 | | 0.49 | | 0.96 | | | 1.45 | | | (0.53 | ) | | — | | | (0.53 | ) | | $ | 18.39 | | 5.46 | (d) | | 1.40 | (d) | | 1.40 | (d) | | 5.48 | (d)(f) | | 8.39 | | | 13.20 | | $ | 589 |
2009 | | $ | 16.94 | | 1.01 | | 0.59 | | | 1.60 | | | (1.07 | ) | | — | | | (1.07 | ) | | $ | 17.47 | | 7.02 | | | 1.40 | | | 1.40 | | | 9.54 | (f) | | 10.83 | | | 63.05 | | $ | 48 |
2008(g) | | $ | 21.22 | | 0.66 | | (4.39 | ) | | (3.73 | ) | | (0.55 | ) | | — | | | (0.55 | ) | | $ | 16.94 | | 5.28 | (d) | | 1.40 | (d) | | 1.40 | (d) | | 16.97 | (d)(f) | | (17.79 | ) | | 46.07 | | $ | 251 |
| | | | | | | | | | | | | | |
Class R5 Shares | | | | | | | | | | | | | | | | | | | | | | | | | | | | | | | | | | | | | | | | |
2010(b) | | $ | 17.50 | | 0.52 | | 1.02 | | | 1.54 | | | (0.56 | ) | | — | | | (0.56 | ) | | $ | 18.48 | | 5.82 | (d) | | 0.99 | (d) | | 0.99 | (d) | | 3.81 | (d) | | 8.95 | | | 13.20 | | $ | 1,166 |
2009 | | $ | 16.98 | | 1.04 | | 0.61 | | | 1.65 | | | (1.13 | ) | | — | | | (1.13 | ) | | $ | 17.50 | | 7.14 | | | 0.99 | | | 0.99 | | | 9.20 | (f) | | 11.19 | | | 63.05 | | $ | 427 |
2008 | | $ | 23.51 | | 1.11 | | (6.09 | ) | | (4.98 | ) | | (1.08 | ) | | (0.47 | ) | | (1.55 | ) | | $ | 16.98 | | 5.48 | | | 0.99 | | | 0.99 | | | 11.77 | (f) | | (22.27 | ) | | 46.07 | | $ | 221 |
2007(h) | | $ | 20.74 | | 0.46 | | 2.87 | | | 3.33 | | | (0.56 | ) | | — | | | (0.56 | ) | | $ | 23.51 | | 3.17 | (d) | | 0.99 | (d) | | 0.98 | (d) | | 278.77 | (d)(f) | | 16.19 | | | 62.60 | | $ | 72 |
| (a) | Not annualized for periods less than one year. |
| (b) | Unaudited Six Month Period Ended March 31. |
| (c) | Sales loads are not reflected in computing total return. |
| (e) | Effective date of this class of shares was February 1, 2005. |
| (f) | Due to the size of net assets and fixed expenses, ratios may appear disproportionate. |
| (g) | Effective date of this class of shares was February 1, 2008. |
| (h) | Effective date of this class of shares was February 1, 2007. |
| + | Based on weighted average shares outstanding. |
See notes to financial statements.
| | |
| 42 Certified Semi-Annual Report | | Certified Semi-Annual Report 43 |
| | |
| EXPENSE EXAMPLE | | |
| |
| Thornburg Investment Income Builder Fund | | March 31, 2010 (Unaudited) |
As a shareholder of the Fund, you incur two types of costs:
| | (1) | transaction costs, including |
(a) sales charges (loads) on purchase payments for Class A shares;
(b) a deferred sales charge on redemptions of any part or all of a purchase of $1 million of Class A shares within 12 months of purchase;
(c) a deferred sales charge on redemptions of Class C shares within 12 months of purchase;
(d) a 30-day redemption fee on Class A and Class I shares;
| | (2) | ongoing costs, including management fees; distribution and/or service (12b-1) fees; and other Fund expenses. |
This example is intended to help you understand your ongoing costs (in dollars) of investing in the Fund and to compare these costs with the ongoing costs of investing in other mutual funds.
The example is based on a $1,000 investment beginning on October 1, 2009, and held until March 31, 2010.
ACTUAL EXPENSES
For each class of shares, the first line of the table at right provides information about actual account values and actual expenses. You may use the information in this line, together with the amount you invested, to estimate the expenses that you paid over the period. Simply divide your account value by $1,000 (for example, an $8,600 account value divided by $1,000 = 8.6), then multiply the result by the number in the first line for your class of shares under the heading entitled “Expenses Paid During Period” to estimate the expenses you paid on your account during this period.
HYPOTHETICAL EXAMPLE FOR COMPARISON PURPOSES
For each class of shares, the second line of the table at right provides information about hypothetical account values and hypothetical expenses based on the Fund’s actual expense ratio and an assumed rate of return of 5% per year before expenses, which is not the Fund’s actual return. The hypothetical account values and expenses may not be used to estimate the actual ending account balance or expenses you paid for the period. You may use this information to compare the ongoing costs of investing in the Fund and other funds. To do so, compare this 5% hypothetical example with the 5% hypothetical examples that appear in the shareholder reports of the other funds.
| | | | | | | | | |
| | | Beginning
Account Value
10/1/09 | | Ending
Account Value
3/31/10 | | Expenses Paid
During Period†
10/1/09–3/31/10 |
Class A Shares | | | | | | | | | |
Actual | | $ | 1,000.00 | | $ | 1,088.60 | | $ | 6.45 |
Hypothetical* | | $ | 1,000.00 | | $ | 1,018.75 | | $ | 6.24 |
Class C Shares | | | | | | | | | |
Actual | | $ | 1,000.00 | | $ | 1,084.60 | | $ | 9.87 |
Hypothetical* | | $ | 1,000.00 | | $ | 1,015.46 | | $ | 9.55 |
Class I Shares | | | | | | | | | |
Actual | | $ | 1,000.00 | | $ | 1,089.90 | | $ | 4.75 |
Hypothetical* | | $ | 1,000.00 | | $ | 1,020.39 | | $ | 4.59 |
Class R3 Shares | | | | | | | | | |
Actual | | $ | 1,000.00 | | $ | 1,087.30 | | $ | 7.80 |
Hypothetical* | | $ | 1,000.00 | | $ | 1,017.45 | | $ | 7.54 |
Class R4 Shares | | | | | | | | | |
Actual | | $ | 1,000.00 | | $ | 1,083.90 | | $ | 7.28 |
Hypothetical* | | $ | 1,000.00 | | $ | 1,017.95 | | $ | 7.04 |
Class R5 Shares | | | | | | | | | |
Actual | | $ | 1,000.00 | | $ | 1,089.50 | | $ | 5.16 |
Hypothetical* | | $ | 1,000.00 | | $ | 1,020.00 | | $ | 4.99 |
| † | Expenses are equal to the annualized expense ratio for each class (A: 1.24%; C: 1.90%; I: 0.91%; R3: 1.50%; R4: 1.40%; R5: 0.99%) multiplied by the average account value over the period, multiplied by 182/365 to reflect the one-half year period. |
| * | Hypothetical assumes a rate of return of 5% per year before expenses. |
Please note that the expenses shown in the table are meant to highlight your ongoing costs only and do not reflect any transactional costs, such as sales charges (loads), redemption fees, or exchange fees. Therefore, the second line of the table for each class of shares is useful in comparing ongoing costs only, and will not help you determine the relative total costs of owning different funds. In addition, if these transactional costs were included, your costs would have been higher.
44 Certified Semi-Annual Report
| | |
| INDEX COMPARISON | | |
| |
| Thornburg Investment Income Builder Fund | | March 31, 2010 (Unaudited) |
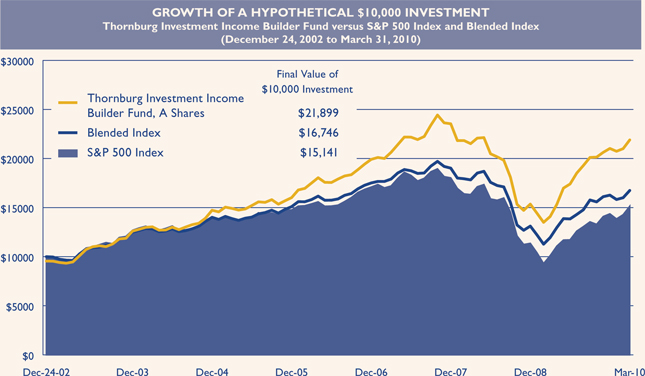
AVERAGE ANNUAL TOTAL RETURNS
For periods ended March 31, 2010 (with sales charge)
| | | | | | | | | |
| | | 1 Yr | | | 5 Yrs | | | Since
Inception | |
A Shares (Incep: 12/24/02) | | 48.16 | % | | 6.97 | % | | 11.38 | % |
C Shares (Incep: 12/24/02) | | 53.18 | % | | 7.31 | % | | 11.49 | % |
I Shares (Incep: 11/3/03) | | 55.48 | % | | 8.34 | % | | 10.43 | % |
R3 Shares (Incep: 2/1/05) | | 54.75 | % | | 7.75 | % | | 7.85 | % |
R4 Shares (Incep: 2/1/08) | | 54.42 | % | | — | | | -0.57 | % |
R5 Shares (Incep: 2/1/07) | | 55.52 | % | | — | | | 2.89 | % |
Blended Index (Since 12/24/02) | | 40.12 | % | | 3.83 | % | | 7.36 | % |
S&P 500 Index (Since 12/24/02) | | 49.77 | % | | 1.92 | % | | 5.88 | % |
Performance data reflects past performance, which is no guarantee of future results. The performance data and graph do not reflect the deduction of taxes that a shareholder would pay on distributions or the redemption of Fund shares. Returns reflect the reinvestment of dividends and capital gains as well as applicable sales charges. Class A shares are sold with a maximum sales charge of 4.50% . Class C shares are subject to a 1% CDSC for the first year only. There is no up-front sales charge for Class I, R3, R4 and R5 shares. Class A and I shares are subject to a 1% 30-day redemption fee.
The Blended Index is composed of 25% Barclays Capital Aggregate Bond Index and 75% MSCI World Index. The Barclays Capital Aggregate Bond Index is composed of approximately 8,000 publicly traded bonds including U.S. government, mortgage-backed, corporate and Yankee bonds. The index is weighted by the market value of the bonds included in the index. The index is weighted by the market value of the bonds included in the index. The Morgan Stanley Capital International (MSCI) World Index is an unmanaged market-weighted index that consists of over 1,200 securities traded in 23 of the world’s most developed countries. Securities are listed on exchanges in the U.S., Europe, Canada, Australia, New Zealand, and the Far East. The index is calculated with net dividends reinvested, in U.S. dollars. The S&P 500 Index, an unmanaged broad measure of the U.S. stock market, does not reflect sales charges or expenses. Investors cannot invest directly in an index.
Certified Semi-Annual Report 45
| | |
OTHER INFORMATION | | |
| |
| Thornburg Investment Income Builder Fund | | March 31, 2010 (Unaudited) |
PORTFOLIO PROXY VOTING
Policies and Procedures:
The Trust has delegated to Thornburg Investment Management, Inc. (the “Advisor”) voting decisions respecting proxies for the Fund’s voting securities. The Advisor makes voting decisions in accordance with its Proxy Voting Policy and Procedures. A description of the Policy and Procedures is available (i) without charge, upon request, by calling the Advisor toll-free at 1-800-847-0200, (ii) on the Thornburg web site at www.thornburg.com, and (iii) on the Securities and Exchange Commission’s web site at www.sec.gov.
Information regarding how proxies were voted is available on or before August 31 of each year for the twelve months ending the preceding June 30. This information is available (i) without charge, upon request by calling the Advisor toll-free at 1-800-847-0200, (ii) on the Thornburg web site at www.thornburg.com, and (iii) on the Securities and Exchange Commission’s web site at www.sec.gov.
AVAILABILITY OF QUARTERLY PORTFOLIO SCHEDULE
The Fund files with the Securities and Exchange Commission schedules of its portfolio holdings on Form N-Q for the first and third quarters of each fiscal year. The Fund’s Forms N-Q are available on the Commission’s web site at www.sec.gov, or may be reviewed and copied at the Commission’s Public Reference Room in Washington, D.C. Information on the operation of the Public Reference Room may be obtained by calling 1-800-SEC-0330. The Fund also makes this information available on its web site at www.thornburg. com/download or upon request by calling 1-800-847-0200.
46 Certified Semi-Annual Report
Trustees’ Statement to Shareholders
Not part of the Certified Semi-Annual Report
February 8, 2005, as readopted July 22, 2009
The Trustees are concerned that ongoing commentaries and opinions reported in the media may confuse investors in general as to the supervisory duties of trustees of mutual funds and, in particular, leave Thornburg Investment Trust shareholders uncertain regarding how we discharge our responsibilities in supervising the Funds’ investment advisor and in reviewing the advisor’s contract for renewal. We decided to spell out clearly three principal guidelines that we follow in supervising the Trust’s investment advisor on your behalf.
We begin with the premise that each shareholder selected his or her Fund because its investments are managed by the investment advisor identified in the prospectus and in accordance with the objective and policies described in the prospectus. We realize, as each of you do, that if you believe that your Fund’s stated objective and policies no longer serve your personal investment goals, you can sell your shares and leave the Fund.
Therefore, we believe that our primary supervisory task – our principal obligation to you – is to assess the nature and quality of the advisor’s services, and to confirm that the advisor actively and competently pursues the Fund’s objective, in accordance with the policies set out in the prospectus. To do this, we meet regularly with management to review your Fund’s portfolio and to discuss the advisor’s specific actions and judgments in pursuing the Fund’s objective. We do not substitute our own judgment for the advisor’s decisions in selecting investments; the advisor is paid to exercise its informed judgment on investment decisions, and we seek to confirm, in reviewing the advisor’s performance, that the advisor is doing just that.
Second, while we are conscious of costs and the effect that costs have on shareholders’ returns, we do not seek the lowest fees or expense ratio as our sole or primary objective. We try to make sure that your Fund’s fees and costs are reasonable in relationship to the services rendered and that they are generally in line with those charged by other expert investment advisors, consistent with our belief that the Fund’s investors searched for and expect that expertise and attention and have decided to pay a reasonable price for it. We do not put the management contract “out to bid” as a matter of course, and we would not do so unless we had concluded that the advisor materially had failed to pursue the Fund’s objectives in accordance with its policies, or for other equally important reasons. We believe that any other approach would be inconsistent with your interests and contrary to your expectations when you bought shares of the Fund in the first place.
Finally, because we believe that most Thornburg Fund shareholders have invested with a long-term perspective, we try not to focus too much on the fashions of the moment and on short-term performance. The market will not favor any specific investment objective or set of policies at all times and under all economic circumstances. A fund will experience periods of both high and low returns relative to other funds and other investments. Even if one of our Funds is not favored by the market at a particular time, we believe that the advisor is nonetheless obliged to remain true to the Fund’s objective and policies, and we watch to see that it does so.
This page is not part of the Semi-Annual Report. 47
This page intentionally left blank.
48 This page is not part of the Semi-Annual Report.
Retirement and Education Accounts
Thornburg Investment Management offers retirement and education savings accounts that can help you meet a variety of planning challenges. For account applications or further information on any of the accounts below, please call 1-800-847-0200 or go to www.thornburg.com/ira. Your financial advisor can help you determine which plan is right for you.
Individual Retirement Accounts
Individual Retirement Accounts (IRAs) provide a tax-advantaged means to save money for the future. For a detailed outline of the difference between retirement accounts, see www.thornburg.com/ira. Rollovers are available. Call 1-800-847-0200 for more information.
Traditional IRAs – Contributions to Traditional IRAs are tax deductible for eligible individuals, and withdrawals are taxed as additional ordinary income. You may contribute to an IRA if you receive compensation and are under 70 1/ 2, even if you are covered by an employer retirement plan. Deductible contributions are subject to certain qualifications. Please consult your tax advisor.
Roth IRAs – Under a Roth IRA, there is no tax deduction for contributions, but there is no income tax on qualified withdrawals. For a more detailed comparison of Traditional and Roth IRAs, please see our web site at www.thornburg.com/ira.
SEP IRAs – Simplified Employee Pension (SEP) IRAs are established by employers. The employer is allowed a tax deduction for contributions made to the SEP Plan and makes contributions to each eligible employee’s SEP IRA on a discretionary basis.
SIMPLE IRAs – Savings Incentive Match Plan for Employees of Small Employers (SIMPLE) is designed to give small business owners a simplified method to establish and contribute to a retirement plan for employees. The employer is allowed a tax deduction for contributions and makes either matching or non-elective contributions to each eligible employee’s SIMPLE IRA. Employees may make salary deferral contributions.
Coverdell Education Savings Account
These savings accounts are designed to provide a way to save money for higher education expenses. In an Education Savings Account, earnings and interest grow tax-free, and qualified withdrawals used to pay for eligible higher-education expenses are tax- and penalty-free.
Funds Available
The following funds are available in the accounts listed above:
| | • | | Thornburg International Value Fund |
| | • | | Thornburg Core Growth Fund |
| | • | | Thornburg Investment Income Builder Fund |
| | • | | Thornburg Global Opportunities Fund |
| | • | | Thornburg International Growth Fund |
| | • | | Thornburg Developing World Fund |
| | • | | Thornburg Limited Term U.S. Government Fund |
| | • | | Thornburg Limited Term Income Fund |
| | • | | Thornburg Strategic Income Fund |
This page is not part of the Semi-Annual Report. 49

Thornburg Equity Funds
Thornburg’s equity research uses a fundamental and comprehensive analytical approach. Thornburg equity funds focus on a limited number of securities so that each holding can impact performance. The equity team searches for firms believed to have a promising future and seeks to buy shares of those companies at a discount to their intrinsic value.
| | • | | Thornburg International Value Fund |
| | • | | Thornburg Core Growth Fund |
| | • | | Thornburg Investment Income Builder Fund |
| | • | | Thornburg Global Opportunities Fund |
| | • | | Thornburg International Growth Fund |
| | • | | Thornburg Developing World Fund |
Thornburg Bond Funds
Thornburg Investment Management applies a disciplined philosophy to fixed-income management. Since the launch of our first fixed-income fund over 25 years ago, we have been conducting fundamental, bottom-up research in an effort to identify bonds which we believe provide the best return for a given level of risk. We are very organic in our approach, avoiding leverage or complex strategies which could backfire in periods of market uncertainty.
| | • | | Thornburg Limited Term Municipal Fund |
| | • | | Thornburg Intermediate Municipal Fund |
| | • | | Thornburg California Limited Term Municipal Fund |
| | • | | Thornburg New Mexico Intermediate Municipal Fund |
| | • | | Thornburg New York Intermediate Municipal Fund |
| | • | | Thornburg Strategic Municipal Income Fund |
| | • | | Thornburg Limited Term U.S. Government Fund |
| | • | | Thornburg Limited Term Income Fund |
| | • | | Thornburg Strategic Income Fund |
Before investing, carefully consider the Fund’s investment goals, risks, charges, and expenses. For a prospectus containing this and other information, contact your financial advisor or visit thornburg. com. Read it carefully before investing.
For additional information, please visit www.thornburg.com
Thornburg Investment Management, Inc. 2300 North Ridgetop Road, Santa Fe, NM 87506
This page is not part of the Semi-Annual Report. 51
| | | | | | |

| | Waste not, Wait not | | 
|
| | |
| | | | Get instant access to your shareholder reports. |
| | |
| | This Semi-Annual Report is submitted for the general information of shareholders of the Fund. It is not authorized for distribution to prospective investors in the Fund unless preceded or accompanied by an effective prospectus. | | By switching from your postal mailbox to your email inbox, you reduce paper clutter, improve record keeping access, and help conserve our natural resources. |
| | |

| | Investment Advisor: Thornburg Investment Management® | | Go to www.thornburg.com/edelivery and sign up to receive your shareholder reports, prospectuses, and proxy statements electronically. |
| | 800.847.0200 | | | | |
| | Distributor: | | | | |
| | Thornburg Securities Corporation® 800.847.0200 | | You invest in the future, without spending a dime. |
| | TH1075 | | | | |

Important Information
The information presented on the following pages was current as of March 31, 2010. The managers’ views, portfolio holdings, and sector and country diversification are provided for the general information of the Fund’s shareholders; they are historical and subject to change. This material should not be deemed a recommendation to buy or sell any of the securities mentioned.
Investments in the Fund carry risks, including possible loss of principal. Special risks may be associated with investments outside the United States, especially in emerging markets, including currency fluctuations, illiquidity and volatility. Investments in small capitalization companies may increase the risk of greater price fluctuations. Please see the Fund’s Prospectus for a discussion of the risks associated with an investment in the Fund. Investments in the Fund are not FDIC insured, nor are they deposits of or guaranteed by a bank or any other entity. There is no guarantee that the Fund will meet its investment objectives. Funds invested in a limited number of holdings may expose an investor to greater volatility.
Performance data given at net asset value (NAV) does not take into account the applicable sales charges. If the sales charges had been included, the performance would have been lower.
Class I, R3, R4, and R5 shares may not be available to all investors. Minimum investments for Class I shares may be higher than those for other classes.
From time to time, the Fund may invest in shares of companies through initial public offerings (IPOs). IPOs have the potential to produce substantial gains for the Fund. There is no assurance that the Fund will have continued access to profitable IPOs and as the Fund’s assets grow, the impact of IPO investment may decline. Therefore, investors should not rely on these past gains as an indication of future performance.
| | | | |
Share Class | | NASDAQ Symbol | | Cusip |
| Class A | | THOAX | | 885-215-343 |
| Class C | | THOCX | | 885-215-335 |
| Class I | | THOIX | | 885-215-327 |
| Class R3 | | THORX | | 885-215-145 |
| Class R4 | | THOVX | | 885-215-137 |
| Class R5 | | THOFX | | 885-215-129 |
Glossary
MSCI All Country (AC) World Index – The Morgan Stanley Capital International All Country World Index (MSCI AC World Index) is a market capitalization weighted index composed of over 2,000 companies, and is representative of the market structure of 45 developed and emerging market countries in North and South America, Europe, Africa, and the Pacific Rim. The index is calculated with net dividends reinvested in U.S. dollars.
Unless otherwise noted, index returns reflect the reinvestment of income dividends and capital gains, if any, but do not reflect fees, brokerage commissions or other expenses of investing. Investors may not make direct investments into any index. The performance of any index is not indicative of the performance of any particular investment.
Beta – A measure of market-related risk. Less than one means the portfolio is less volatile than the index, while greater than one indicates more volatility than the index.
Earnings Per Share (EPS) – The total earnings divided by the number of shares outstanding.
Median Market Capitalization – Market capitalization (market cap) is the total value of a company’s stock, calculated by multiplying the number of outstanding common shares by the current share price. The company whose market cap is in the middle of the portfolio is the median market cap. Half the companies in the portfolio have values greater than the median, and half have values that are less.
Price to Book Value (P/B) – A ratio used to compare a stock’s market value to its book value. It is calculated by dividing the current closing price of the stock by the latest quarter’s book value (book value is simply assets minus liabilities).
Price to Cash Flow Ratio – A measure of the market’s expectations of a firm’s future financial health. It is calculated by dividing the price per share by cash flow per share.
Price to Earnings Ratio (P/E) – A valuation ratio equaling a company’s market value per share divided by earnings per share.
Gross Domestic Product (GDP) – The market value of goods and services produced by labor and property in the United States, regardless of nationality.
This page is not part of the Semi-Annual Report. 3
Thornburg Global Opportunities Fund

IMPORTANT
PERFORMANCE INFORMATION
Performance data shown represents past performance and is no guarantee of future results. Investment return and principal value will fluctuate so shares, when redeemed, may be worth more or less than their original cost. Current performance may be lower or higher than quoted. For performance current to the most recent month end, visit thornburg.com.
The maximum sales charge for Class A shares is 4.50%. Class A shares are subject to a 1% 30-day redemption fee. The total annual fund operating expense of Class A shares is 1.55%, as disclosed in the most recent Prospectus.
Investment fads come and go, and the landscape is littered with funds that generated an avalanche of interest for a brief period of time, then fell by the wayside when the market turned its attention to the next hot trend. At Thornburg Investment Management, we believe that the soundest investments over the long term are conceptually simple and grounded in common sense. It is with this mindset that we created the Thornburg Global Opportunities Fund.
The Fund was launched in 2006 to capitalize on what Thornburg Investment Management is known for – solid, bottom-up research based on a team-oriented, flexible approach to uncovering value. The goal in creating the Fund was to leverage the research of the entire Thornburg equity investment team, while employing a broad mandate to pursue companies across the globe. Once identified, a focused number of stocks are combined into a compact, yet diversified portfolio.
The philosophy of Thornburg Global Opportunities Fund is straightforward – to purchase promising companies that the team feels are trading at a discount to their intrinsic value. As the balance sheets of global companies become more complex, it is getting increasingly difficult to see how some companies actually make money. These companies are not the ones pursued in the Global Opportunities Fund. Rather, we believe that straightforward business models executed by capable management teams make the best investments.
AVERAGE ANNUAL TOTAL RETURNS
FOR PERIODS ENDED 3/31/10
| | | | | | | | | |
| | | 1 Yr | | | 3 Yr | | | Since
Incep | |
A Shares (Incep: 7/28/06) | | | | | | | | | |
Without sales charge | | 85.83 | % | | 0.30 | % | | 8.93 | % |
With sales charge | | 77.54 | % | | -1.22 | % | | 7.58 | % |
MSCI AC World Index | | | | | | | | | |
(Since: 7/28/06) | | 55.47 | % | | -4.37 | % | | 0.37 | % |
4 This page is not part of the Semi-Annual Report.
The Thornburg Global Opportunities Fund is unique in the marketplace. Currently, assets in the global stock fund universe are concentrated in a few very large funds. Based on size alone, these funds must focus on the largest capitalization stocks, or alternatively, spread their assets across many names. In fact, about 80% of category assets are concentrated in 10 funds, and the average world stock fund holds approximately 160 stocks (as of 3/31/10).
Thornburg Global Opportunities Fund is different, in that it will typically be focused in 30–50 stocks which the management team feels have the best combination of promise and discount. Each stock is analyzed on its own merits, and the team then combines them into a portfolio of stocks, with attractive long-term prospects. The result is a Fund which looks quite unlike either the MSCI AC World Index or its peers.
Thornburg Global Opportunities Fund is grounded in common sense principles, which we think resonate well with investors and make sense over the long term.
STOCKS CONTRIBUTING AND DETRACTING
FOR THE SIX MONTHS ENDED 3/31/10
| | |
| Top Contributors | | Top Detractors |
Apollo Investment Corp. | | Erste Group Bank AG |
Teva Pharmaceutical Industries Ltd | | Bachem Holding AG |
KKR Financial Holdings LLC | | Eni S.p.A. |
Spirit AeroSystems Holdings, Inc. | | Huron Consulting Group, Inc. |
Fifth Third Bancorp Pfd | | OAO Gazprom ADR |
Source: FactSet
KEY PORTFOLIO ATTRIBUTES
As of 3/31/10
| | | |
Portfolio P/E Trailing 12-months* | | | 13.8x |
Portfolio Price to Cash Flow* | | | 5.6x |
Portfolio Price to Book Value* | | | 1.4x |
Median Market Cap* | | $ | 9.1 B |
3-Year Beta (A Shares vs. MSCI AC World)* | | | 1.15 |
Number of Holdings | | | 34 |
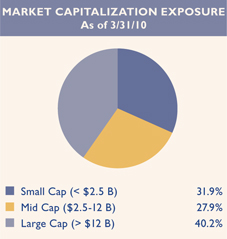
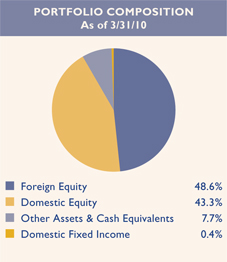
This page is not part of the Semi-Annual Report. 5

Thornburg Global Opportunities Fund
March 31, 2010
This report is certified under the Sarbanes-Oxley Act of 2002, which requires that public companies, including mutual funds, affirm that the information provided in their annual and semiannual shareholder reports fully and fairly represents their financial position.
6 Certified Semi-Annual Report
Letter to Shareholders
April 18, 2010
Dear Fellow Shareholder:
This letter will highlight the results of Thornburg Global Opportunities Fund’s investment activities for the six-month period ended March 31, 2010. In addition, we will comment on the overall investment landscape.
In the six months ended March 31, 2010, Thornburg Global Opportunities Fund’s net asset value per Class A share increased 12% from $13.10 to $14.67. The Fund also paid dividends of 6¢ per share to give a total return for the period of 12.49% (at NAV). The dividends per share were higher for Class I and R5 shares, and lower on the Class C, R3, and R4 shares, to account for varying class specific expenses.
For the six-month period, Thornburg Global Opportunities Fund outperformed the MSCI AC World Index by approximately 4.59% (per Class A share). Since its inception on July 28, 2006, Thornburg Global Opportunities Fund has outperformed the same index by an average annualized margin of 8.56%.
At March 31, 2010, the Fund had realized capital losses of approximately 70% of net assets, which may be carried forward to offset future capital gains to the extent permitted by regulations.
In assessing the performance of your Fund, it is constructive to consider the performance in U.S. dollars of the sector components of the MSCI All Country (AC) World Index over the six months ended March 31, 2010, because this is our global performance benchmark:
| | 1. | Nine sectors (financials, information technology, materials, health care, energy, telecommunications, industrials, consumer discretionary, and consumer staples) showed positive total returns, with a range of +15% (materials) to +1% (telecommunications). |
| | 2. | One sector (utilities) showed a small negative total return. |
Relative to the index weightings, Global Opportunities Fund had particularly large and productive portfolio allocations to financial and telecommunication industry firms, and no investments in the generally sluggish utilities sector. Among the Fund’s telecommunication investments, Millicom Cellular, Crown Castle International, and hybrid securities issued by Level 3 Communications were each important contributors to portfolio performance for the period. China Mobile was a slight detractor, but the Fund’s average return for the period of over 10% from its telecommunications investments compared very well to the 1% average return of the index portfolio from this sector.
Global Opportunities Fund also maintained a large investment allocation to the financial sector during the period. Your Fund’s average return from this sector was greater than 15% for the period … well above the 1.84% performance of the equities in the finance sector of the MSCI AC World Index. Among the best-
Certified Semi-Annual Report 7
Letter to Shareholders,
Continued
contributing investments to portfolio performance from the financial sector were Swiss Re Capital 6.85% notes; convertible preferred stock from Fifth Third Bancorp; business development company Apollo Investment Corp.; insurance broker Willis Group; and KKR Financial Holdings.
The strongest-performing portfolio sector during the period under review was industrials. Your portfolio’s performance from its investments in industrial firms, including Spirit AeroSystems Holdings, Trinity Industries, and Babcock & Brown Air, was strong enough to more than keep pace with the industrial sector performance of the index. Spirit, Trinity, and Babcock each serve transportation markets.
A strongly performing index sector during the period was information technology. The Fund’s holdings in this sector did not keep pace with the index, although Microsoft performed well. The Fund portfolio was significantly underweighted in the strongly performing materials sector of the index, though its investment in shares of United States Steel was productive.
The Global Opportunities Fund had no investments in the consumer discretionary sector, another strong performer during the period under review. Its investments in the energy sector, including Gazprom and Eni, lagged overall sector returns.
Expectations for GDP and corporate earnings have improved in most markets around the world, although there are stubborn corners of resistance. Greece gets much publicity in this regard. While the country itself is fairly small, some investors consider the current drama in Greece to be symptomatic of more wide-spread problems among a broad group of industrial democracies: bloated public sectors that cannot be supported by a straining private sector, high debt load, and unsustainable deficits.
We are also concerned about these issues. At the same time, we can see that global consumer demand is holding up well, strongly supported by emerging economies with modest public and private debt loads and expanding private sectors. Inventories of primary, intermediate and finished goods were drawn down significantly between late 2008 and mid-2009. The rebuilding of inventories, even as final demand expands on a global basis, is leading to a powerful industrial recovery. Since the U.S. economy came to be too dependent on residential real estate over the last generation, certain geographies in this country that were particularly caught up in that phenomenon are still in the penalty box. It is also very challenging for those whose jobs depended in any way on the U.S. residential real estate boom to find work. Aggregate employment statistics for the United States reflect this fact as we struggle to channel production and employment in other uses. To a large extent, this is not a global issue. The United States is well into its third year of reorienting its economy. We are beginning to see signs that the costly trip down the road of too much real estate consumption may quit being a drag on the real economy and the financial sector later this year.
As of March 31, 2010, domestic stocks comprised approximately 43% of your portfolio; foreign stocks around 49%; and cash and interest bearing debt the remaining 8%. The average price/earnings multiple of the 33 stocks in your portfolio was 13.75x on a trailing basis and 11.91x on an estimated forward basis, using estimates
8 Certified Semi-Annual Report
provided by FactSet and IBES. For comparative reference, both the trailing and forward price/earnings multiples of the MSCI AC World Index were approximately 16.66x and 14.49x respectively, again using estimates provided by FactSet and IBES. Industry weightings, country weightings, and the top equity holdings of Global Opportunities Fund are summarized on page 10 of this report. We remind readers that the Thornburg Global Opportunities Fund portfolio, which has generally included between 30 and 40 stocks, is highly concentrated relative to the MSCI AC World Index, which includes 2,416 stocks. We believe that our philosophy of value at a discount and a focused yet diversified Fund has the potential to help us outperform the broader index over time. The returns to date are encouraging, even though the Global Opportunities Fund does not beat the index portfolio over many shorter measurement periods.
We are pleased with the strong rebound that Thornburg Global Opportunities Fund has enjoyed since early last year. However, the volatility of the Fund during the financial crisis was unnerving to many investors, and serves as an important reminder that an equity portfolio such as Thornburg Global Opportunities Fund should be considered as a long-term investment, to be evaluated over multi-year periods. Too often, emotions and short-term thinking can thwart the benefits of a disciplined, long-term investment program. Between October 1, 2008 and March 31, 2009, owners of approximately 15 million shares of Thornburg Global Opportunities Fund sold their shares at an average price of approximately $9.05 per share. The Fund then achieved a price of $14.67 per Class A share on March 31, 2010, and paid dividends totaling 66¢ per share over the 18 months then ended.
Thank you for being a shareholder of Thornburg Global Opportunities Fund. Remember that you can review descriptions of many of the stocks in your portfolio on our internet site, www.thornburg.com, and continuing on to “Mutual Funds” and “Portfolio Holdings Commentary.” Best wishes for a wonderful summer.
Sincerely,
| | | | |
 | |  | | |
| Brian McMahon | | W. Vinson Walden,CFA | | |
| Co-Portfolio Manager | | Co-Portfolio Manager | | |
| CEO & Chief Investment Officer | | Managing Director | | |
The matters discussed in this report may constitute forward-looking statements made pursuant to the safe harbor provisions of the Securities Litigation Reform Act of 1995. These include any advisor or portfolio manager prediction, assessment, analysis or outlook for individual securities, industries, investment styles, market sectors and/or markets. These statements involve risks and uncertainties. In addition to the general risks described for each fund in its current prospectus, other factors bearing on these reports include the accuracy of the advisor’s or portfolio manager’s forecasts and predictions, the appropriateness of the investment strategies designed by the advisor or portfolio manager, and the ability of the advisor or portfolio manager to implement their strategies efficiently and successfully. Any one or more of these factors, as well as other risks affecting the securities markets generally, could cause the actual results of any fund to differ materially as compared to its benchmarks.
Certified Semi-Annual Report 9
| | |
| SCHEDULE OF INVESTMENTS | | |
| |
| Thornburg Global Opportunities Fund | | March 31, 2010 (Unaudited) |
TOP TEN HOLDINGS
As of 3/31/10
| | | |
Global Crossing Ltd. | | 5.4 | % |
Dell, Inc. | | 4.6 | % |
Fifth Third Bancorp Pfd, 8.50% | | 4.3 | % |
Willis Group Holdings plc | | 4.3 | % |
Telstra Corp. Ltd. | | 3.9 | % |
Liechtensteinische Landesbank AG | | 3.9 | % |
Hartford Financial Services Group, Inc. | | 3.6 | % |
KKR Financial Holdings LLC | | 3.5 | % |
Spirit Aerosystems Holdings, Inc. | | 3.4 | % |
ING Groep N.V. | | 3.4 | % |
SUMMARY OF INDUSTRY EXPOSURE
As of 3/31/10
| | | |
Banks | | 17.1 | % |
Telecommunication Services | | 14.5 | % |
Insurance | | 11.0 | % |
Diversified Financials | | 8.9 | % |
Capital Goods | | 8.1 | % |
Materials | | 7.2 | % |
Software & Services | | 6.8 | % |
Pharmaceuticals, Biotechnology & Life Sciences | | 5.6 | % |
Technology Hardware & Equipment | | 4.6 | % |
Energy | | 4.4 | % |
Food & Staples Retailing | | 2.1 | % |
Health Care Equipment & Services | | 2.0 | % |
Other Assets & Cash Equivalents | | 7.7 | % |
SUMMARY OF COUNTRY EXPOSURE
As of 3/31/10 (percent of equity holdings)
| | | |
United States | | 47.1 | % |
Switzerland | | 10.2 | % |
United Kingdom | | 7.4 | % |
Bermuda | | 5.9 | % |
Australia | | 4.3 | % |
China | | 4.1 | % |
Netherlands | | 3.7 | % |
Israel | | 3.6 | % |
Japan | | 2.9 | % |
Ireland | | 2.4 | % |
Italy | | 2.4 | % |
Russia | | 2.4 | % |
Austria | | 2.0 | % |
Hong Kong | | 1.6 | % |
10 Certified Semi-Annual Report
| | |
| SCHEDULE OF INVESTMENTS, CONTINUED | | |
| |
| Thornburg Global Opportunities Fund | | March 31, 2010 (Unaudited) |
| | | | | |
| | | Shares/
Principal Amount | | Value |
COMMON STOCK — 87.56% | | | | | |
| | |
BANKS — 12.83% | | | | | |
COMMERCIAL BANKS — 12.83% | | | | | |
China Merchants Bank Co., Ltd. | | 1,102,541 | | $ | 2,982,047 |
Erste Group Bank AG | | 142,000 | | | 5,964,742 |
KeyCorp | | 1,367,580 | | | 10,598,745 |
Liechtensteinische Landesbank AG | | 171,078 | | | 12,420,354 |
a SVB Financial Group | | 199,200 | | | 9,294,672 |
| | | | | |
| | | | | 41,260,560 |
| | | | | |
| | |
CAPITAL GOODS — 8.06% | | | | | |
AEROSPACE & DEFENSE — 3.43% | | | | | |
a Spirit Aerosystems Holdings, Inc. | | 471,000 | | | 11,011,980 |
MACHINERY — 2.39% | | | | | |
Trinity Industries, Inc. | | 385,521 | | | 7,694,999 |
TRADING COMPANIES & DISTRIBUTORS — 2.24% | | | | | |
Babcock & Brown Air Ltd. ADR | | 695,250 | | | 7,188,885 |
| | | | | |
| | | | | 25,895,864 |
| | | | | |
| | |
DIVERSIFIED FINANCIALS — 8.92% | | | | | |
CAPITAL MARKETS — 1.98% | | | | | |
Apollo Investment Corp. | | 500,675 | | | 6,373,593 |
DIVERSIFIED FINANCIAL SERVICES — 6.94% | | | | | |
a ING Groep N.V. | | 1,101,300 | | | 10,995,388 |
KKR Financial Holdings LLC | | 1,377,800 | | | 11,311,738 |
| | | | | |
| | | | | 28,680,719 |
| | | | | |
| | |
ENERGY — 4.38% | | | | | |
OIL, GAS & CONSUMABLE FUELS — 4.38% | | | | | |
Eni S.p.A. | | 298,200 | | | 6,996,010 |
OAO Gazprom ADR | | 301,681 | | | 7,080,453 |
| | | | | |
| | | | | 14,076,463 |
| | | | | |
| | |
FOOD & STAPLES RETAILING — 2.08% | | | | | |
FOOD & STAPLES RETAILING — 2.08% | | | | | |
Walgreen Co. | | 180,600 | | | 6,698,454 |
| | | | | |
| | | | | 6,698,454 |
| | | | | |
| | |
HEALTH CARE EQUIPMENT & SERVICES — 1.99% | | | | | |
HEALTH CARE TECHNOLOGY — 1.99% | | | | | |
a Eclipsys Corp. | | 321,627 | | | 6,393,945 |
| | | | | |
| | | | | 6,393,945 |
| | | | | |
| | |
INSURANCE — 11.03% | | | | | |
INSURANCE — 11.03% | | | | | |
Hartford Financial Services Group, Inc. | | 401,700 | | | 11,416,314 |
Swiss Re | | 209,000 | | | 10,287,462 |
Willis Group Holdings plc | | 439,800 | | | 13,761,342 |
| | | | | |
| | | | | 35,465,118 |
| | | | | |
Certified Semi-Annual Report 11
| | |
| SCHEDULE OF INVESTMENTS, CONTINUED | | |
| |
| Thornburg Global Opportunities Fund | | March 31, 2010 (Unaudited) |
| | | | | |
| | | Shares/
Principal Amount | | Value |
MATERIALS — 7.17% | | | | | |
CONSTRUCTION MATERIALS — 1.44% | | | | | |
a China Resources Cement | | 9,598,000 | | $ | 4,635,670 |
METALS & MINING — 5.73% | | | | | |
Tokyo Steel Manufacturing Co., Ltd. | | 672,700 | | | 8,425,839 |
United States Steel Corp. | | 157,034 | | | 9,974,800 |
| | | | | |
| | | | | 23,036,309 |
| | | | | |
| | |
PHARMACEUTICALS, BIOTECHNOLOGY & LIFE SCIENCES — 5.63% | | | | | |
LIFE SCIENCES TOOLS & SERVICES — 1.02% | | | | | |
Bachem Holding AG | | 49,861 | | | 3,284,187 |
PHARMACEUTICALS — 4.61% | | | | | |
Roche Holding AG | | 25,400 | | | 4,119,310 |
Teva Pharmaceutical Industries Ltd. ADR | | 169,630 | | | 10,700,260 |
| | | | | |
| | | | | 18,103,757 |
| | | | | |
SOFTWARE & SERVICES — 6.84% | | | | | |
INFORMATION TECHNOLOGY SERVICES — 2.52% | | | | | |
a Amdocs Ltd. | | 269,525 | | | 8,115,398 |
INTERNET SOFTWARE & SERVICES — 1.89% | | | | | |
a Google, Inc. | | 10,700 | | | 6,067,007 |
SOFTWARE — 2.43% | | | | | |
Microsoft Corp. | | 267,100 | | | 7,818,017 |
| | | | | |
| | | | | 22,000,422 |
| | | | | |
| | |
TECHNOLOGY HARDWARE & EQUIPMENT — 4.63% | | | | | |
COMPUTERS & PERIPHERALS — 4.63% | | | | | |
a Dell, Inc. | | 991,000 | | | 14,874,910 |
| | | | | |
| | | | | 14,874,910 |
| | | | | |
| | |
TELECOMMUNICATION SERVICES — 14.00% | | | | | |
DIVERSIFIED TELECOMMUNICATION SERVICES — 9.31% | | | | | |
a Global Crossing Ltd. | | 1,143,407 | | | 17,322,617 |
Telstra Corp. Ltd. | | 4,602,300 | | | 12,627,670 |
WIRELESS TELECOMMUNICATION SERVICES — 4.69% | | | | | |
China Mobile Ltd. | | 944,000 | | | 9,082,242 |
a Crown Castle International Corp. | | 156,600 | | | 5,986,818 |
| | | | | |
| | | | | 45,019,347 |
| | | | | |
TOTAL COMMON STOCK (Cost $242,972,323) | | | | | 281,505,868 |
| | | | | |
| | |
PREFERRED STOCK — 4.30% | | | | | |
| | |
BANKS — 4.30% | | | | | |
COMMERCIAL BANKS — 4.30% | | | | | |
Fifth Third Bancorp Pfd, 8.50% | | 101,600 | | | 13,835,888 |
| | | | | |
| | | | | 13,835,888 |
| | | | | |
| | |
TOTAL PREFERRED STOCK (Cost $2,743,464) | | | | | 13,835,888 |
| | | | | |
12 Certified Semi-Annual Report
| | |
| SCHEDULE OF INVESTMENTS, CONTINUED | | |
| |
| Thornburg Global Opportunities Fund | | March 31, 2010 (Unaudited) |
| | | | | | |
| | | Shares/
Principal Amount | | Value |
CORPORATE BONDS — 0.45% | | | | | | |
| | |
TELECOMMUNICATION SERVICES — 0.45% | | | | | | |
DIVERSIFIED TELECOMMUNICATION SERVICES — 0.45% | | | | | | |
Level 3 Communications, Inc., 3.50%, 6/15/2012 | | $ | 1,550,000 | | $ | 1,427,937 |
| | | | | | |
TOTAL CORPORATE BONDS (Cost $1,184,018) | | | | | | 1,427,937 |
| | | | | | |
| | |
SHORT TERM INVESTMENTS — 7.15% | | | | | | |
Pepco Holdings, Inc., 0.30%, 4/1/2010 | | | 3,000,000 | | | 3,000,000 |
Vulcan Materials Co., 0.25%, 4/1/2010 | | | 16,000,000 | | | 16,000,000 |
Wellpoint, Inc., 0.20%, 4/1/2010 | | | 4,000,000 | | | 4,000,000 |
| | | | | | |
TOTAL SHORT TERM INVESTMENTS (Cost $23,000,000) | | | | | | 23,000,000 |
| | | | | | |
| | |
TOTAL INVESTMENTS — 99.46% (Cost $269,899,805) | | | | | $ | 319,769,693 |
| | |
OTHER ASSETS LESS LIABILITIES — 0.54% | | | | | | 1,725,241 |
| | | | | | |
| | |
NET ASSETS — 100.00% | | | | | $ | 321,494,934 |
| | | | | | |
Footnote Legend
Portfolio Abbreviations
To simplify the listings of securities, abbreviations are used per the table below:
| | |
| ADR | | American Depository Receipt |
| Pfd | | Preferred Stock |
See notes to financial statements.
Certified Semi-Annual Report 13
| | |
| STATEMENT OF ASSETS AND LIABILITIES | | |
| |
| Thornburg Global Opportunities Fund | | March 31, 2010 (Unaudited) |
| | | | |
ASSETS | | | | |
Investments at value (cost $269,899,805) (Note 2) | | $ | 319,769,693 | |
Cash | | | 75,264 | |
Receivable for investments sold | | | 960,399 | |
Receivable for fund shares sold | | | 1,184,075 | |
Unrealized appreciation on forward currency contracts (Note 7) | | | 783,469 | |
Dividends receivable | | | 389,414 | |
Dividend and interest reclaim receivable | | | 122,205 | |
Interest receivable | | | 15,973 | |
Prepaid expenses and other assets | | | 48,068 | |
| | | | |
Total Assets | | | 323,348,560 | |
| | | | |
| |
LIABILITIES | | | | |
Payable for securities purchased | | | 851,326 | |
Payable for fund shares redeemed | | | 388,428 | |
Unrealized depreciation on forward currency contracts (Note 7) | | | 106,079 | |
Payable to investment advisor and other affiliates (Note 3) | | | 333,739 | |
Accounts payable and accrued expenses | | | 171,642 | |
Dividends payable | | | 2,412 | |
| | | | |
Total Liabilities | | | 1,853,626 | |
| | | | |
| |
NET ASSETS | | $ | 321,494,934 | |
| | | | |
NET ASSETS CONSIST OF: | | | | |
Distribution in excess of net investment income | | $ | (428,630 | ) |
Net unrealized appreciation on investments | | | 50,557,749 | |
Accumulated net realized gain (loss) | | | (227,906,436 | ) |
Net capital paid in on shares of beneficial interest | | | 499,272,251 | |
| | | | |
| | $ | 321,494,934 | |
| | | | |
14 Certified Semi-Annual Report
| | |
| STATEMENT OF ASSETS AND LIABILITIES, CONTINUED | | |
| |
| Thornburg Global Opportunities Fund | | March 31, 2010 (Unaudited) |
| | | |
NET ASSET VALUE: | | | |
Class A Shares: | | | |
Net asset value and redemption price per share ($100,621,420 applicable to 6,859,952 shares of beneficial interest outstanding - Note 4) | | $ | 14.67 |
Maximum sales charge, 4.50% of offering price | | | 0.69 |
| | | |
Maximum offering price per share | | $ | 15.36 |
| | | |
| |
Class C Shares: | | | |
Net asset value and offering price per share * ($89,518,806 applicable to 6,181,141 shares of beneficial interest outstanding - Note 4) | | $ | 14.48 |
| | | |
| |
Class I Shares: | | | |
Net asset value, offering and redemption price per share ($129,903,787 applicable to 8,824,290 shares of beneficial interest outstanding - Note 4) | | $ | 14.72 |
| | | |
| |
Class R3 Shares: | | | |
Net asset value, offering and redemption price per share ($29,192 applicable to 1,993 shares of beneficial interest outstanding - Note 4) | | $ | 14.65 |
| | | |
| |
Class R4 Shares: | | | |
Net asset value, offering and redemption price per share ($1,320,358 applicable to 90,443 shares of beneficial interest outstanding - Note 4) | | $ | 14.60 |
| | | |
| |
Class R5 Shares: | | | |
Net asset value, offering and redemption price per share ($101,371 applicable to 6,879 shares of beneficial interest outstanding - - Note 4) | | $ | 14.74 |
| | | |
| * | Redemption price per share is equal to net asset value less any applicable contingent deferred sales charge. |
See notes to financial statements.
Certified Semi-Annual Report 15
| | |
| STATEMENT OF OPERATIONS | | |
| |
| Thornburg Global Opportunities Fund | | Six Months Ended March 31, 2010 (Unaudited) |
| | | | |
INVESTMENT INCOME: | | | | |
Dividend income (net of foreign taxes withheld of $67,006) | | $ | 2,626,605 | |
Interest income | | | 886,808 | |
| | | | |
Total Income | | | 3,513,413 | |
| | | | |
| |
EXPENSES: | | | | |
Investment advisory fees (Note 3) | | | 1,250,765 | |
Administration fees (Note 3) | | | | |
Class A Shares | | | 55,089 | |
Class C Shares | | | 52,026 | |
Class I Shares | | | 28,295 | |
Class R3 Shares | | | 14 | |
Class R4 Shares | | | 755 | |
Class R5 Shares | | | 23 | |
Distribution and service fees (Note 3) | | | | |
Class A Shares | | | 110,450 | |
Class C Shares | | | 417,891 | |
Class R3 Shares | | | 42 | |
Class R4 Shares | | | 1,519 | |
Transfer agent fees | | | | |
Class A Shares | | | 45,420 | |
Class C Shares | | | 68,779 | |
Class I Shares | | | 101,674 | |
Class R3 Shares | | | 668 | |
Class R4 Shares | | | 2,017 | |
Class R5 Shares | | | 616 | |
Registration and filing fees | | | | |
Class A Shares | | | 8,541 | |
Class C Shares | | | 8,501 | |
Class I Shares | | | 8,552 | |
Class R3 Shares | | | 7,892 | |
Class R4 Shares | | | 7,995 | |
Class R5 Shares | | | 7,942 | |
Custodian fees (Note 3) | | | 49,532 | |
Professional fees | | | 25,545 | |
Accounting fees | | | 5,766 | |
Trustee fees | | | 3,325 | |
Other expenses | | | 39,610 | |
| | | | |
Total Expenses | | | 2,309,244 | |
Less: | | | | |
Expenses reimbursed by investment advisor (Note 3) | | | (149,164 | ) |
| | | | |
Net Expenses | | | 2,160,080 | |
| | | | |
Net Investment Income | | $ | 1,353,333 | |
| | | | |
16 Certified Semi-Annual Report
| | |
| STATEMENT OF OPERATIONS, CONTINUED | | |
| |
| Thornburg Global Opportunities Fund | | Six Months Ended March 31, 2010 (Unaudited) |
| | | | |
REALIZED AND UNREALIZED GAIN (LOSS) | | | | |
Net realized gain (loss) from: | | | | |
Investments | | $ | 26,471,673 | |
Forward currency contracts (Note 7) | | | (679,838 | ) |
Foreign currency transactions | | | 21,456 | |
| | | | |
| | | 25,813,291 | |
| | | | |
Net change in unrealized appreciation (depreciation) on: | | | | |
Investments | | | 5,054,530 | |
Forward currency contracts (Note 7) | | | 2,221,481 | |
Foreign currency translations | | | (1,173 | ) |
| | | | |
| | | 7,274,838 | |
| | | | |
| |
Net Realized and Unrealized Gain | | | 33,088,129 | |
| | | | |
| |
Net Increase in Net Assets Resulting From Operations | | $ | 34,441,462 | |
| | | | |
See notes to financial statements.
Certified Semi-Annual Report 17
STATEMENTS OF CHANGES IN NET ASSETS
Thornburg Global Opportunities Fund
| | | | | | | | |
| | | Six Months Ended
March 31, 2010* | | | Year Ended
September 30, 2009 | |
INCREASE (DECREASE) IN NET ASSETS FROM: | | | | | | | | |
| | |
OPERATIONS: | | | | | | | | |
Net investment income | | $ | 1,353,333 | | | $ | 7,339,482 | |
Net realized gain (loss) on investments, forward currency contracts, and foreign currency transactions | | | 25,813,291 | | | | (213,882,637 | ) |
Increase (decrease) in unrealized appreciation (depreciation) on investments, forward currency contracts, and foreign currency translation | | | 7,274,838 | | | | 170,184,097 | |
| | | | | | | | |
| | |
Net Increase (Decrease) in Net Assets Resulting from Operations | | | 34,441,462 | | | | (36,359,058 | ) |
| | |
DIVIDENDS TO SHAREHOLDERS: | | | | | | | | |
From net investment income | | | | | | | | |
Class A Shares | | | (393,911 | ) | | | (4,810,423 | ) |
Class C Shares | | | (217,599 | ) | | | (3,391,652 | ) |
Class I Shares | | | (625,556 | ) | | | (6,293,149 | ) |
Class R3 Shares | | | (98 | ) | | | (1,185 | ) |
Class R4 Shares | | | (5,736 | ) | | | (17,979 | ) |
Class R5 Shares | | | (530 | ) | | | (1,340 | ) |
| | |
FUND SHARE TRANSACTIONS (NOTE 4): | | | | | | | | |
Class A Shares | | | 8,033,020 | | | | (50,588,757 | ) |
Class C Shares | | | (1,239,217 | ) | | | (12,146,667 | ) |
Class I Shares | | | 9,433,747 | | | | (31,514,614 | ) |
Class R3 Shares | | | 5,953 | | | | (5,789 | ) |
Class R4 Shares | | | (65,561 | ) | | | 1,132,663 | |
Class R5 Shares | | | 3,661 | | | | 77,340 | |
| | | | | | | | |
| | |
Net Increase (Decrease) in Net Assets | | | 49,369,635 | | | | (143,920,610 | ) |
| | |
NET ASSETS: | | | | | | | | |
Beginning of Period | | | 272,125,299 | | | | 416,045,909 | |
| | | | | | | | |
| | |
End of Period | | $ | 321,494,934 | | | $ | 272,125,299 | |
| | | | | | | | |
See notes to financial statements.
18 Certified Semi-Annual Report
| | |
| NOTES TO FINANCIAL STATEMENTS | | |
| |
| Thornburg Global Opportunities Fund | | March 31, 2010 (Unaudited) |
NOTE 1 – ORGANIZATION
Thornburg Global Opportunities Fund, hereinafter referred to as the “Fund,” is a diversified series of Thornburg Investment Trust (the “Trust”). The Trust was organized as a Massachusetts business trust under a Declaration of Trust dated June 3, 1987 and is registered as a diversified, open-end management investment company under the Investment Company Act of 1940, as amended. The Fund is currently one of sixteen separate series of the Trust. Each series is considered to be a separate entity for financial reporting and tax purposes and bears expenses directly attributable to it. The Fund seeks long-term capital appreciation by investing in equity and debt securities of all types from issuers around the world.
The Fund currently offers six classes of shares of beneficial interest: Class A, Class C, Institutional Class (Class I), and Retirement Classes (Class R3, Class R4, and Class R5) shares. Each class of shares of the Fund represents an interest in the same portfolio of investments, except that (i) Class A shares are sold subject to a front-end sales charge collected at the time the shares are purchased and bear a service fee, (ii) Class C shares are sold at net asset value without a sales charge at the time of purchase, but are subject to a contingent deferred sales charge upon redemption within one year of purchase, and bear both a service fee and a distribution fee, (iii) Class I shares are sold at net asset value without a sales charge at the time of purchase, (iv) Class R3 shares are sold at net asset value without a sales charge at the time of purchase, but bear both a service fee and distribution fee, (v) Class R4 shares are sold at net asset value without a sales charge at the time of purchase, but bear a service fee, (vi) Class R5 shares are sold at net asset value without a sales charge at the time of purchase, and (vii) the respective classes may have different reinvestment privileges and conversion rights. Additionally, the Fund may allocate among its classes certain expenses, to the extent allowable to specific classes, including transfer agent fees, government registration fees, certain printing and postage costs, and administrative and legal expenses. Currently, class specific expenses of the Fund are limited to service and distribution fees, administration fees, and certain registration and transfer agent expenses.
NOTE 2 – SIGNIFICANT ACCOUNTING POLICIES
Significant accounting policies of the Trust are as follows:
Valuation of Investments: Portfolio securities listed or traded on a national securities exchange are valued on the valuation date at the last reported sale price on the exchange that is the primary market for the security. Portfolio securities traded on an exchange for which there has been no sale that day and other equity securities traded in the over-the-counter market are valued at the mean between the last reported bid and asked prices. Portfolio securities reported by NASDAQ are valued at the NASDAQ official closing price. Any foreign security traded on exchanges outside the United States is valued at the price of the security on the exchange that is normally the security’s primary market, as of the close of that exchange preceding the time of the Fund’s valuation.
Debt obligations held by the Fund have a primary market over the counter and are valued by an independent pricing service approved by the Trustees of the Trust. The pricing service ordinarily values debt obligations at quoted bid prices. When quotations are not available, debt obligations held by the Fund are valued at evaluated prices determined by the pricing service using methods which include consideration of yields or prices of debt obligations of comparable quality, type of issue, coupon, maturity and rating, and indications as to value from dealers and general market conditions. Short-term obligations having remaining maturities of 60 days or less are valued at amortized cost, which approximates market value.
Quotations in foreign currencies for foreign portfolio investments are converted to U.S. dollar equivalents using the foreign exchange quotation in effect at the time of valuation.
In any case where the market value of an equity security held by the Fund is not readily available, the Trust’s valuation and pricing committee determines a fair value for the security using procedures approved by the Trustees, which may include the use of a price obtained from an independent pricing service. The pricing service ordinarily values equity securities in these instances using multi-factor models to adjust market prices based upon various inputs, including exchange data, depository receipt prices, futures and index data and other data. A security’s market value is deemed not readily available whenever the exchange or market on which the security is primarily traded is closed for the entire scheduled day of trading. Additionally, a security’s market value may be deemed not readily available under other circumstances identified by the Trustees, including when developments occurring after the most recent close of the security’s primary exchange or market, but before the most recent close of trading in Fund shares, create a serious question about the reliability of the security’s market value.
Certified Semi-Annual Report 19
| | |
| NOTES TO FINANCIAL STATEMENTS, CONTINUED | | |
| |
| Thornburg Global Opportunities Fund | | March 31, 2010 (Unaudited) |
In any case where a pricing service fails to provide a price for a debt obligation held by the Fund, the valuation and pricing committee determines a fair value for the debt obligation using procedures approved by the Trustees. Additionally, in any case where management believes that a price provided by a pricing service for a debt obligation held by the Fund may be unreliable, the valuation and pricing committee decides whether or not to use the pricing service’s valuation or to determine a fair value for the debt obligation.
In determining fair value for any portfolio security or other investment, the valuation and pricing committee seeks to determine the amount that an owner of the investment might reasonably expect to receive upon a sale of the investment. However, because fair value prices are estimated prices, the valuation and pricing committee’s determination of fair value for an investment may differ from the value that would be realized by the Fund upon a sale of the investment, and that difference could be material to the Fund’s financial statements. The valuation and pricing committee’s determination of fair value for an investment may also differ from the prices obtained by other persons (including other mutual funds) for the investment.
Valuation Measurements: Various inputs are used in determining the value of the Fund’s investments. These inputs are summarized in the three levels listed below.
Level 1: Quoted prices in active markets for identical investments.
Level 2: Other significant observable inputs (including quoted prices for similar investments, interest rates, prepayment rates, credit risk, etc.).
Level 3: Significant unobservable inputs (including the Fund’s own assumptions in determining the fair value of investments).
The following table displays a summary of the inputs used to value the Fund’s net assets as of March 31, 2010. In any instance when valuation inputs from more than one level are used to determine the fair value of a specific investment, the investment is placed in the level of the table based upon the lowest level input that is significant in determining the fair value of the investment:
| | | | | | | | | | | | | | | |
| | | Fair Value Measurements at March 31, 2010 |
| | | Total | | | Level 1 | | | Level 2 | | | Level 3 |
Assets | | | | | | | | | | | | | | | |
Investments in Securities* | | | | | | | | | | | | | | | |
Common Stock | | $ | 281,505,868 | | | $ | 281,505,868 | | | $ | — | | | $ | — |
Preferred Stock | | | 13,835,888 | | | | 13,835,888 | | | | — | | | | — |
Corporate Bonds | | | 1,427,937 | | | | — | | | | 1,427,937 | | | | — |
Short Term Investments | | | 23,000,000 | | | | — | | | | 23,000,000 | | | | — |
| | | | | | | | | | | | | | | |
Total Investments in Securities | | $ | 319,769,693 | | | $ | 295,341,756 | | | $ | 24,427,937 | | | $ | — |
| | | | |
Other Financial Instruments** | | | | | | | | | | | | | | | |
Forward Currency Contracts | | $ | 783,469 | | | $ | — | | | $ | 783,469 | | | | — |
| | | | |
Liabilities | | | | | | | | | | | | | | | |
Other Financial Instruments** | | | | | | | | | | | | | | | |
Forward Currency Contracts | | $ | (106,079 | ) | | $ | — | | | $ | (106,079 | ) | | $ | — |
Spot Currency | | $ | (317 | ) | | $ | (317 | ) | | $ | — | | | $ | — |
| * | See Schedule of Investments for a summary of the industry exposure as grouped according to the Global Industry Classification Standard (GICS), which is an industry taxonomy developed by Morgan Stanley Capital International (MSCI), and Standard & Poor’s (S&P). |
| ** | Other Financial Instruments include investments not reflected in the Schedule of Investments, such as futures, forwards and swap contracts, which are valued at the unrealized appreciation (depreciation) on the instrument. |
Foreign Currency Translation: Portfolio securities and other assets and liabilities denominated in foreign currencies are translated into U.S. dollars based on the exchange rate of such currencies against the U.S. dollar on the date of valuation. Purchases and sales of securities and income items denominated in foreign currencies are translated into U.S. dollars at the exchange rate in effect on the translation date. When the Fund purchases or sells foreign securities it will customarily enter into a foreign exchange contract to minimize foreign exchange risk from the trade date to the settlement date of such transactions.
20 Certified Semi-Annual Report
| | |
| NOTES TO FINANCIAL STATEMENTS, CONTINUED | | |
| |
| Thornburg Global Opportunities Fund | | March 31, 2010 (Unaudited) |
The Fund does not separately report the effect of changes in foreign exchange rates from changes in market prices on securities held. Such changes are included in net realized and unrealized gain or loss from investments.
Reported net realized foreign exchange gains or losses arise from sales of foreign currencies, currency gains or losses realized between the trade and settlement dates on securities transactions and the difference between the amounts of dividends, interest, and foreign withholding taxes recorded on the Fund’s books, and the U.S. dollar equivalent of the amounts actually received or paid.
Net unrealized foreign exchange gains and losses arise from changes in the fair value of assets and liabilities, other than investments in securities at fiscal period end, resulting from changes in exchange rates.
Deferred Taxes: The Fund is subject to a tax imposed on net realized gains of securities of certain foreign issuers. The Fund records an estimated deferred tax liability for net unrealized gains on these securities as reflected in the accompanying financial statements.
Federal Income Taxes: It is the policy of the Trust to comply with the provisions of the Internal Revenue Code applicable to “regulated investment companies” and to distribute to shareholders substantially all taxable income, including any net realized gain on investments of the Fund. Therefore, no provision for federal income taxes is required.
When-Issued and Delayed Delivery Transactions: The Fund may engage in when-issued or delayed delivery transactions. To the extent the Fund engages in such transactions, it will do so for the purpose of acquiring portfolio securities consistent with the Fund’s investment objectives and not for the purpose of investment leverage or to speculate on interest rate and/or market changes. At the time the Fund makes a commitment to purchase a security on a when-issued or delayed delivery basis, the Fund will record the transaction and reflect the value in determining its net asset value. When effecting such transactions, assets of an amount sufficient to make payment for the portfolio securities to be purchased will be segregated on the Fund’s records on the trade date. Securities purchased on a when-issued or delayed delivery basis do not earn interest until the settlement date.
Dividends: Dividends to shareholders are generally paid quarterly and are reinvested in additional shares of the Fund at net asset value per share at the close of business on the dividend payment date or, at the shareholder’s option, paid in cash. Net realized capital gains, to the extent available, will be distributed at least annually. Distributions to shareholders are based on income tax regulations and therefore, their characteristics may differ for financial statement and tax purposes.
General: Securities transactions are accounted for on a trade date basis. Interest income is accrued as earned and dividend income is recorded on the ex-dividend date. Certain income from foreign securities is recognized as soon as information is available to the Fund. Realized gains and losses from the sale of securities are recorded on an identified cost basis. Net investment income (other than class specific expenses) and realized and unrealized gains and losses are allocated daily to each class of shares based upon the relative net asset value of outstanding shares of each class of shares at the beginning of the day (after adjusting for the current share activity of the respective class). Expenses common to all funds are allocated among the funds comprising the Trust based upon their relative net asset values or other appropriate allocation methods.
Guarantees and Indemnifications: Under the Trust’s organizational documents, its officers and Trustees are indemnified against certain liabilities arising out of the performance of their duties to the Fund. Additionally, in the normal course of business the Trust enters into contracts with service providers that contain general indemnification clauses. The Trust’s maximum exposure under these arrangements is unknown. However, based on experience, the Trust expects the risk of loss to be remote.
Use of Estimates: The preparation of financial statements, in conformity with generally accepted accounting principles, requires management to make estimates and assumptions that affect the reported amounts of assets and liabilities and the disclosure of contingent assets and liabilities at the date of the financial statements and the reported amounts of increases and decreases in net assets from operations during the reporting period. Actual results could differ from those estimates.
Certified Semi-Annual Report 21
| | |
| NOTES TO FINANCIAL STATEMENTS, CONTINUED | | |
| |
| Thornburg Global Opportunities Fund | | March 31, 2010 (Unaudited) |
NOTE 3 – INVESTMENT ADVISORY FEE AND OTHER TRANSACTIONS WITH AFFILIATES
Pursuant to an investment advisory agreement, Thornburg Investment Management, Inc. (the “Advisor”) serves as the investment advisor and performs services to the Fund for which the fees are payable at the end of each month. For the six months ended March 31, 2010, these fees were payable at annual rates ranging from .875 of 1% to .675 of 1% per annum of the average daily net assets of the Fund depending on the Fund’s asset size. The Trust also has entered into administrative services agreements with the Advisor, whereby the Advisor will perform certain administrative services for the shareholders of each class of the Fund’s shares, and for which fees will be payable at an annual rate of up to .125 of 1% per annum of the average daily net assets attributable to each class of shares. For the six months ended March 31, 2010, the Advisor voluntarily or contractually agreed to reimburse certain class specific expenses, administrative fees, and distribution fees of $122,395 for Class I shares, $8,564 for Class R3 shares, $9,637 for Class R4 shares, and $8,568 for Class R5 shares.
The Trust has an underwriting agreement with Thornburg Securities Corporation (the “Distributor,” an affiliate of the Advisor), which acts as the distributor of the Fund’s shares. For the six months ended March 31, 2010, the Distributor has advised the Fund that it earned commissions aggregating $13,883 from the sale of Class A shares, and collected contingent deferred sales charges aggregating $1,160 from redemptions of Class C shares of the Fund.
Pursuant to a service plan under Rule 12b-1 of the Investment Company Act of 1940, the Fund may reimburse to the Advisor an amount not to exceed .25 of 1% per annum of the average daily net assets attributable to each class of shares of the Fund for payments made by the Advisor to securities dealers and other financial institutions to obtain various shareholder and distribution related services. The Advisor may pay out of its own resources additional expenses for distribution of the Fund’s shares.
The Trust has also adopted distribution plans pursuant to Rule 12b-1, applicable only to the Fund’s Class C and Class R3 shares, under which the Fund compensates the Distributor for services in promoting the sale of Class C and Class R3 shares of the Fund at an annual rate of up to .75 of 1% per annum of the average daily net assets attributable to Class C and Class R3 shares. Total fees incurred by the Distributor for each class of shares of the Fund under their respective Service and Distribution Plans for the six months ended March 31, 2010, are set forth in the Statement of Operations.
The Trust has an agreement with the custodian bank to indirectly pay a portion of the custodian’s fees through credits earned by the Fund’s cash on deposit with the bank. This deposit agreement is an alternative to overnight investments. Custodial fees have been adjusted to reflect amounts that would have been paid without this agreement, with a corresponding adjustment reflected as fees paid indirectly in the Statement of Operations. For the six months ended March 31, 2010, there were no fees paid indirectly.
Certain officers and Trustees of the Trust are also officers and/or directors of the Advisor and Distributor. The compensation of independent Trustees is borne by the Trust.
NOTE 4 – SHARES OF BENEFICIAL INTEREST
At March 31, 2010, there were an unlimited number of shares of beneficial interest authorized. Transactions in shares of beneficial interest were as follows:
| | | | | | | | | | | | | | |
| | | Six Months Ended
March 31, 2010 (Unaudited) | | | Year Ended
September 30, 2009 (Audited) | |
| | | Shares | | | Amount | | | Shares | | | Amount | |
Class A Shares | | | | | | | | | | | | | | |
Shares sold | | 1,253,342 | | | $ | 17,140,864 | | | 3,316,626 | | | $ | 31,636,505 | |
Shares issued to shareholders in reinvestment of dividends | | 24,711 | | | | 332,609 | | | 427,591 | | | | 4,308,199 | |
Shares repurchased | | (700,590 | ) | | | (9,440,737 | ) | | (9,418,047 | ) | | | (86,535,753 | ) |
Redemption fees received* | | — | | | | 284 | | | — | | | | 2,292 | |
| | | | | | | | | | | | | | |
| | | | |
Net Increase (Decrease) | | 577,463 | | | $ | 8,033,020 | | | (5,673,830 | ) | | $ | (50,588,757 | ) |
| | | | | | | | | | | | | | |
22 Certified Semi-Annual Report
| | |
| NOTES TO FINANCIAL STATEMENTS, CONTINUED | | |
| |
| Thornburg Global Opportunities Fund | | March 31, 2010 (Unaudited) |
| | | | | | | | | | | | | | |
| | | Six Months Ended
March 31, 2010 (Unaudited) | | | Year Ended
September 30, 2009 (Audited) | |
| | | Shares | | | Amount | | | Shares | | | Amount | |
Class C Shares | | | | | | | | | | | | | | |
Shares sold | | 498,504 | | | $ | 6,683,882 | | | 1,742,187 | | | $ | 17,178,589 | |
Shares issued to shareholders in reinvestment of dividends | | 13,235 | | | | 176,291 | | | 270,067 | | | | 2,759,411 | |
Shares repurchased | | (604,654 | ) | | | (8,099,653 | ) | | (3,446,600 | ) | | | (32,086,524 | ) |
Redemption fees received* | | — | | | | 263 | | | — | | | | 1,857 | |
| | | | | | | | | | | | | | |
| | | | |
Net Increase (Decrease) | | (92,915 | ) | | $ | (1,239,217 | ) | | (1,434,346 | ) | | $ | (12,146,667 | ) |
| | | | | | | | | | | | | | |
| | | | |
Class I Shares | | | | | | | | | | | | | | |
Shares sold | | 1,803,003 | | | $ | 24,665,869 | | | 2,831,034 | | | $ | 30,394,273 | |
Shares issued to shareholders in reinvestment of dividends | | 41,660 | | | | 562,402 | | | 548,896 | | | | 5,653,896 | |
Shares repurchased | | (1,177,596 | ) | | | (15,794,886 | ) | | (6,680,462 | ) | | | (67,565,461 | ) |
Redemption fees received* | | — | | | | 362 | | | — | | | | 2,678 | |
| | | | | | | | | | | | | | |
| | | | |
Net Increase (Decrease) | | 667,067 | | | $ | 9,433,747 | | | (3,300,532 | ) | | $ | (31,514,614 | ) |
| | | | | | | | | | | | | | |
| | | | |
Class R3 Shares | | | | | | | | | | | | | | |
Shares sold | | 438 | | | $ | 5,895 | | | 1,290 | | | $ | 13,314 | |
Shares issued to shareholders in reinvestment of dividends | | 4 | | | | 60 | | | 120 | | | | 1,185 | |
Shares repurchased | | — | | | | (2 | ) | | (2,484 | ) | | | (20,289 | ) |
Redemption fees received* | | — | | | | — | | | — | | | | 1 | |
| | | | | | | | | | | | | | |
| | | | |
Net Increase (Decrease) | | 442 | | | $ | 5,953 | | | (1,074 | ) | | $ | (5,789 | ) |
| | | | | | | | | | | | | | |
| | | | |
Class R4 Shares | | | | | | | | | | | | | | |
Shares sold | | 3,909 | | | $ | 52,418 | | | 93,846 | | | $ | 1,114,683 | |
Shares issued to shareholders in reinvestment of dividends | | 428 | | | | 5,736 | | | 1,401 | | | | 17,979 | |
Shares repurchased | | (9,329 | ) | | | (123,719 | ) | | — | | | | — | |
Redemption fees received* | | — | | | | 4 | | | — | | | | 1 | |
| | | | | | | | | | | | | | |
| | | | |
Net Increase (Decrease) | | (4,992 | ) | | $ | (65,561 | ) | | 95,247 | | | $ | 1,132,663 | |
| | | | | | | | | | | | | | |
| | | | |
Class R5 Shares | | | | | | | | | | | | | | |
Shares sold | | 576 | | | $ | 7,618 | | | 6,281 | | | $ | 76,001 | |
Shares issued to shareholders in reinvestment of dividends | | 39 | | | | 529 | | | 106 | | | | 1,339 | |
Shares repurchased | | (303 | ) | | | (4,486 | ) | | — | | | | — | |
Redemption fees received* | | — | | | | — | | | — | | | | — | |
| | | | | | | | | | | | | | |
| | | | |
Net Increase (Decrease) | | 312 | | | $ | 3,661 | | | 6,387 | | | $ | 77,340 | |
| | | | | | | | | | | | | | |
| * | The Fund charges a redemption fee of 1% of the Class A and Class I shares redeemed or exchanged within 30 days of purchase. Redemption fees charged to any class are allocated to all classes upon receipt of payment based on relative net asset values of each class or other appropriate allocation methods. |
Certified Semi-Annual Report 23
| | |
| NOTES TO FINANCIAL STATEMENTS, CONTINUED | | |
| |
| Thornburg Global Opportunities Fund | | March 31, 2010 (Unaudited) |
NOTE 5 – SECURITIES TRANSACTIONS
For the six months ended March 31, 2010, the Fund had purchase and sale transactions of investment securities (excluding short-term investments) of $108,470,609 and $106,212,213, respectively.
NOTE 6 – INCOME TAXES
At March 31, 2010, information on the tax components of capital is as follows:
| | | | |
Cost of investments for tax purposes | | $ | 271,728,190 | |
| | | | |
Gross unrealized appreciation on a tax basis | | $ | 56,432,993 | |
Gross unrealized depreciation on a tax basis | | | (8,391,490 | ) |
| | | | |
Net unrealized appreciation (depreciation) on investments (tax basis) | | $ | 48,041,503 | |
| | | | |
At March 31, 2010, the Fund had deferred tax basis currency and capital losses occurring subsequent to October 31, 2008 of $1,464,149 and $182,214,191, respectively. For tax purposes, such losses will be reflected in the year ending September 30, 2010.
At March 31, 2010, the Fund had tax basis capital losses, which may be carried forward to offset future capital gains. To the extent such carryforwards are used, capital gain distributions may be reduced to the extent provided by regulations.
Such loss carryforwards expire as follows:
| | | |
2016 | | $ | 88,134 |
2017 | | | 68,696,690 |
| | | |
| | $ | 68,784,824 |
| | | |
NOTE 7 – DERIVATIVE FINANCIAL INSTRUMENTS WITH OFF-BALANCE SHEET RISK AND FOREIGN INVESTMENT RISK
The Fund may use a variety of derivative financial instruments to hedge or adjust the risks affecting its investment portfolio or to enhance investment returns. Provisions of FASB Accounting Standards Codification ASC 815-10-50, (“ASC 815”) require certain disclosures. The new requirement amends and expands disclosures related to derivative instruments to provide users of financial statements with an enhanced understanding of the use of derivative instruments by the Fund and how these derivatives affect the financial position, financial performance and cash flows of the Fund. The Fund does not designate any derivative instruments as hedging instruments under ASC 815. During the six months ended March 31, 2010, the Fund’s principal exposure to derivative financial instruments of the type addressed by ASC 815 was investment in foreign exchange contracts. A foreign exchange contract is an agreement between two parties to exchange different currencies at a specified rate of exchange at an agreed upon future date. Foreign exchange contracts involve risks to the Fund, including the risk that a contract counterparty will not meet its obligations to the Fund, the risk that a change in a contract’s value may not correlate perfectly with the currency the contract was intended to track, and the risk that the Fund’s advisor is unable to correctly implement its strategy in using a contract. In any such instance, the Fund may not achieve the intended benefit of entering into a contract, and may experience a loss.
The Fund entered into forward currency contracts during the six months ended March 31, 2010 in the normal course of pursuing its investment objectives, in anticipation of purchasing foreign investments or with the intent of reducing the risk to the value of the Fund’s foreign investments from adverse changes in the relationship between the U.S. dollar and foreign currencies. In each case these contracts have been initiated in conjunction with foreign investment transactions.
These contracts are accounted for by the Fund under ASC 815. Unrealized gains and unrealized losses on outstanding contracts are reported in the Fund’s Statement of Assets and Liabilities at the Fund’s net equity, as measured by the difference between the forward exchange rates at the reporting date and the forward exchange rates at each contract’s inception date. Net realized gain (loss) on contracts closed during the period, and changes in net unrealized appreciation (depreciation) on outstanding contracts are recognized in the Fund’s Statement of Operations.
24 Certified Semi-Annual Report
| | |
| NOTES TO FINANCIAL STATEMENTS, CONTINUED | | |
| |
| Thornburg Global Opportunities Fund | | March 31, 2010 (Unaudited) |
The following table displays the outstanding forward currency contracts, at March 31, 2010:
| | | | | | | | | | | | | | | | |
Outstanding Forward Currency Contracts to Buy or Sell at March 31, 2010 | |
Contract Description | | Buy/Sell | | Contract
Amount | | Contract
Value Date | | Value USD | | Unrealized
Appreciation | | Unrealized
Depreciation | |
Euro | | Sell | | 9,800,000 | | 08/23/2010 | | $ | 13,236,093 | | $ | 83,577 | | $ | — | |
Japanese Yen | | Sell | | 196,526,000 | | 06/10/2010 | | | 2,102,833 | | | 59,026 | | | — | |
Japanese Yen | | Sell | | 637,400,000 | | 06/10/2010 | | | 6,820,197 | | | 392,413 | | | — | |
Japanese Yen | | Buy | | 35,250,000 | | 06/10/2010 | | | 377,176 | | | — | | | (11,125 | ) |
Japanese Yen | | Buy | | 105,795,000 | | 06/10/2010 | | | 1,132,009 | | | — | | | (52,573 | ) |
Swiss Franc | | Sell | | 12,100,000 | | 04/06/2010 | | | 11,475,721 | | | 167,011 | | | — | |
Swiss Franc | | Sell | | 2,968,000 | | 04/06/2010 | | | 2,814,871 | | | 40,897 | | | — | |
Swiss Franc | | Sell | | 15,700,000 | | 10/06/2010 | | | 14,913,889 | | | — | | | (42,381 | ) |
Swiss Franc | | Buy | | 15,068,000 | | 04/06/2010 | | | 14,290,592 | | | 40,545 | | | — | |
| | | | | | | | | | | | | | | | |
Total | | | | | | | | | | | $ | 783,469 | | $ | (106,079 | ) |
| | | | | | | | | | | | | | | | |
The unrealized appreciation (depreciation) of the outstanding forward currency contracts recognized in the Fund’s Statement of Assets and Liabilities at March 31, 2010 is disclosed in the following table:
| | | | | | |
Fair Values of Derivative Financial Instruments at March 31, 2010 | |
| Asset Derivatives | | | | | |
| | | Balance Sheet Location | | Fair Value | |
Foreign exchange contracts | | Assets - Unrealized appreciation on forward currency contracts | | $ | 783,469 | |
| | |
| Liability Derivatives | | | | | |
| | | Balance Sheet Location | | Fair Value | |
Foreign exchange contracts | | Liabilities - Unrealized depreciation on forward currency contracts | | $ | (106,079 | ) |
The realized gains (losses) from forward currency contracts, and the change in unrealized appreciation (depreciation) of outstanding forward currency contracts recognized in the Fund’s Statement of Operations for the six months ended March 31, 2010 is disclosed in the following tables:
| | | | | | | | |
Amount of Realized Gain (Loss) on Derivative Financial Instruments Recognized in Income for the Six Months Ended March 31, 2010 | |
| | | Total | | | Forward Currency Contracts | |
Foreign exchange contracts | | $ | (679,838 | ) | | $ | (679,838 | ) |
| | | | | | |
Change in Unrealized Appreciation (Depreciation) of Derivative Financial Instruments Recognized in Income for the Six Months Ended March 31, 2010 |
| | | Total | | Forward Currency Contracts |
Foreign exchange contracts | | $ | 2,221,481 | | $ | 2,221,481 |
OTHER NOTES
Fund management believes no events have occurred between March 31, 2010 and May 20, 2010, the date of issuance of the financial statements, that require adjustment of, or disclosure in, the accompanying financial statements.
Certified Semi-Annual Report 25
FINANCIAL HIGHLIGHTS
Thornburg Global Opportunities Fund
| | | | | | | | | | | | | | | | | | | | | | | | | | | | | | | | | | | | | | | | | | | | |
| | | PER SHARE PERFORMANCE (for a share outstanding throughout the period)+ | | RATIOS TO AVERAGE NET ASSETS | | | SUPPLEMENTAL DATA |
Unless Otherwise Noted, Periods are Fiscal Years Ended Sept. 30, | | Net Asset
Value
Beginning
of
Period | | Net
Investment
Income
(Loss) | | | Net
Realized
&
Unrealized
Gain (Loss)
on
Investments | | | Total from
Investment
Operations | | | Dividends
from Net
Investment
Income | | | Dividends
from Net
Realized
Gains | | | Total
Dividends | | | Net
Asset
Value
End
of
Period | | Net
Investment
Income
(Loss)
(%) | | | Expenses,
After
Expense
Reductions
(%) | | | Expenses,
After
Expense
Reductions
and
Net of
Custody
Credits
(%) | | | Expenses,
Before
Expense
Reductions
(%) | | | Total
Return
(%)(a) | | | Portfolio
Turnover
Rate (%) | | Net Assets
at End
of Period
(Thousands) |
Class A Shares | | | | | | | | | | | | | | | | | | | | | | | | | | | | | | | | | | | | | | | |
2010(b)(c) | | $ | 13.10 | | 0.07 | | | 1.56 | | | 1.63 | | | (0.06 | ) | | — | | | (0.06 | ) | | $ | 14.67 | | 0.99 | (d) | | 1.46 | (d) | | 1.46 | (d) | | 1.46 | (d) | | 12.49 | | | 39.38 | | $ | 100,622 |
2009(c) | | $ | 13.38 | | 0.29 | | | 0.03 | | | 0.32 | | | (0.60 | ) | | — | | | (0.60 | ) | | $ | 13.10 | | 2.96 | | | 1.53 | | | 1.52 | | | 1.55 | | | 3.60 | | | 103.02 | | $ | 82,309 |
2008(c) | | $ | 20.06 | | 0.30 | | | (6.30 | ) | | (6.00 | ) | | (0.14 | ) | | (0.54 | ) | | (0.68 | ) | | $ | 13.38 | | 1.68 | | | 1.50 | | | 1.49 | | | 1.50 | | | (30.85 | ) | | 83.70 | | $ | 159,996 |
2007(c) | | $ | 12.86 | | 0.07 | | | 7.29 | | | 7.36 | | | (0.00 | )(e) | | (0.16 | ) | | (0.16 | ) | | $ | 20.06 | | 0.41 | | | 1.51 | | | 1.50 | | | 1.55 | | | 57.75 | | | 91.02 | | $ | 262,475 |
2006(c)(f) | | $ | 11.94 | | 0.01 | | | 0.91 | | | 0.92 | | | — | | | — | | | — | | | $ | 12.86 | | 0.34 | (d) | | 1.70 | (d) | | 1.63 | (d) | | 6.12 | (d)(g) | | 7.71 | | | 6.08 | | $ | 8,477 |
| | | | | | | | | | | | | |
Class C Shares | | | | | | | | | | | | | | | | | | | | | | | | | | | | | | | | | | | | | | | |
2010(b) | | $ | 12.96 | | 0.01 | | | 1.54 | | | 1.55 | | | (0.03 | ) | | — | | | (0.03 | ) | | $ | 14.48 | | 0.20 | (d) | | 2.28 | (d)�� | | 2.28 | (d) | | 2.28 | (d) | | 12.02 | | | 39.38 | | $ | 89,519 |
2009 | | $ | 13.22 | | 0.23 | | | 0.01 | | | 0.24 | | | (0.50 | ) | | — | | | (0.50 | ) | | $ | 12.96 | | 2.36 | | | 2.31 | | | 2.31 | | | 2.35 | | | 2.79 | | | 103.02 | | $ | 81,334 |
2008 | | $ | 19.87 | | 0.17 | | | (6.24 | ) | | (6.07 | ) | | (0.04 | ) | | (0.54 | ) | | (0.58 | ) | | $ | 13.22 | | 0.97 | | | 2.25 | | | 2.24 | | | 2.25 | | | (31.38 | ) | | 83.70 | | $ | 101,908 |
2007 | | $ | 12.84 | | (0.06 | ) | | 7.25 | | | 7.19 | | | — | | | (0.16 | ) | | (0.16 | ) | | $ | 19.87 | | (0.34 | ) | | 2.28 | | | 2.28 | | | 2.33 | | | 56.48 | | | 91.02 | | $ | 107,298 |
2006(f) | | $ | 11.94 | | (0.01 | ) | | 0.91 | | | 0.90 | | | — | | | — | | | — | | | $ | 12.84 | | (0.40 | )(d) | | 2.41 | (d) | | 2.35 | (d) | | 9.01 | (d)(g) | | 7.54 | | | 6.08 | | $ | 3,505 |
| | | | | | | | | | | | |
Class I Shares | | | | | | | | | | | | | | | | | | | | | | | | | | | | | | | | | | | | |
2010(b) | | $ | 13.13 | | 0.10 | | | 1.57 | | | 1.67 | | | (0.08 | ) | | — | | | (0.08 | ) | | $ | 14.72 | | 1.46 | (d) | | 0.99 | (d) | | 0.99 | (d) | | 1.21 | (d) | | 12.75 | | | 39.38 | | $ | 129,904 |
2009 | | $ | 13.45 | | 0.37 | | | (0.01 | ) | | 0.36 | | | (0.68 | ) | | — | | | (0.68 | ) | | $ | 13.13 | | 3.65 | | | 0.99 | | | 0.99 | | | 1.33 | | | 4.16 | | | 103.02 | | $ | 107,132 |
2008 | | $ | 20.16 | | 0.40 | | | (6.34 | ) | | (5.94 | ) | | (0.23 | ) | | (0.54 | ) | | (0.77 | ) | | $ | 13.45 | | 2.25 | | | 0.99 | | | 0.99 | | | 1.10 | | | (30.49 | ) | | 83.70 | | $ | 154,102 |
2007 | | $ | 12.87 | | 0.17 | | | 7.29 | | | 7.46 | | | (0.01 | ) | | (0.16 | ) | | (0.17 | ) | | $ | 20.16 | | 0.97 | | | 1.00 | | | 0.99 | | | 1.20 | | | 58.51 | | | 91.02 | | $ | 108,461 |
2006(f) | | $ | 11.94 | | 0.02 | | | 0.91 | | | 0.93 | | | — | | | — | | | — | | | $ | 12.87 | | 0.90 | (d) | | 1.04 | (d) | | 0.99 | (d) | | 2.98 | (d) | | 7.79 | | | 6.08 | | $ | 12,968 |
| | | | | | | | | | | | | |
Class R3 Shares | | | | | | | | | | | | | | | | | | | | | | | | | | | | | | | | | | | | | | | |
2010(b) | | $ | 13.08 | | 0.07 | | | 1.56 | | | 1.63 | | | (0.06 | ) | | — | | | (0.06 | ) | | $ | 14.65 | | 1.00 | (d) | | 1.40 | (d) | | 1.40 | (d) | | 76.10 | (d)(g) | | 12.51 | | | 39.38 | | $ | 29 |
2009 | | $ | 13.37 | | 0.26 | | | 0.05 | | | 0.31 | | | (0.60 | ) | | — | | | (0.60 | ) | | $ | 13.08 | | 2.57 | | | 1.50 | | | 1.49 | | | 116.95 | (g) | | 3.61 | | | 103.02 | | $ | 20 |
2008(h) | | $ | 17.91 | | 0.29 | | | (4.70 | ) | | (4.41 | ) | | (0.13 | ) | | — | | | (0.13 | ) | | $ | 13.37 | | 2.61 | (d) | | 1.49 | (d) | | 1.49 | (d) | | 67.47 | (d)(g) | | (24.78 | ) | | 83.70 | | $ | 35 |
| | | | | | | | | | | | | |
Class R4 Shares | | | | | | | | | | | | | | | | | | | | | | | | | | | | | | | | | | | | | | | |
2010(b) | | $ | 13.04 | | 0.07 | | | 1.55 | | | 1.62 | | | (0.06 | ) | | — | | | (0.06 | ) | | $ | 14.60 | | 1.09 | (d) | | 1.40 | (d) | | 1.40 | (d) | | 2.99 | (d) | | 12.49 | | | 39.38 | | $ | 1,320 |
2009 | | $ | 13.38 | | 0.40 | | | (0.08 | ) | | 0.32 | | | (0.66 | ) | | — | | | (0.66 | ) | | $ | 13.04 | | 3.19 | | | 1.40 | | | 1.40 | | | 14.73 | (g) | | 3.73 | | | 103.02 | | $ | 1,244 |
2008(h) | | $ | 17.91 | | 0.28 | | | (4.69 | ) | | (4.41 | ) | | (0.12 | ) | | — | | | (0.12 | ) | | $ | 13.38 | | 2.48 | (d) | | 1.41 | (d) | | 1.40 | (d) | | 864.00 | (d)(g) | | (24.74 | ) | | 83.70 | | $ | 3 |
| | | | | | | | | | | | | |
Class R5 Shares | | | | | | | | | | | | | | | | | | | | | | | | | | | | | | | | | | | | | | | |
2010(b) | | $ | 13.15 | | 0.10 | | | 1.57 | | | 1.67 | | | (0.08 | ) | | — | | | (0.08 | ) | | $ | 14.74 | | 1.47 | (d) | | 0.99 | (d) | | 0.99 | (d) | | 19.45 | (d)(g) | | 12.73 | | | 39.38 | | $ | 101 |
2009 | | $ | 13.46 | | 0.53 | | | (0.15 | ) | | 0.38 | | | (0.69 | ) | | — | | | (0.69 | ) | | $ | 13.15 | | 4.36 | | | 0.97 | | | 0.97 | | | 239.11 | (d)(g) | | 4.25 | | | 103.02 | | $ | 86 |
2008(h) | | $ | 17.98 | | 0.33 | | | (4.70 | ) | | (4.37 | ) | | (0.15 | ) | | — | | | (0.15 | ) | | $ | 13.46 | | 2.97 | (d) | | 0.92 | (d) | | 0.92 | (d) | | 850.59 | (d)(g) | | (24.47 | ) | | 83.70 | | $ | 2 |
| (a) | Not annualized for periods less than one year. |
| (b) | Unaudited Six Month Period Ended March 31. |
| (c) | Sales loads are not reflected in computing total return. |
| (e) | Dividends from net investment income per share were less than $(0.01). |
| (f) | Fund commenced operations on July 28, 2006. |
| (g) | Due to the size of net assets and fixed expenses, ratios may appear disproportionate. |
| (h) | Effective date of this class of shares was February 1, 2008. |
| + | Based on weighted average shares outstanding. |
See notes to financial statements.
| | |
| 26 Certified Semi-Annual Report | | Certified Semi-Annual Report 27 |
| | |
| EXPENSE EXAMPLE | | |
| |
| Thornburg Global Opportunities Fund | | March 31, 2010 (Unaudited) |
As a shareholder of the Fund, you incur two types of costs:
| | (1) | transaction costs, including |
(a) sales charges (loads) on purchase payments for Class A shares;
(b) a deferred sales charge on redemptions of any part or all of a purchase of $1 million of Class A shares within 12 months of purchase;
(c) a deferred sales charge on redemptions of Class C shares within 12 months of purchase;
(d) a 30-day redemption fee on Class A and Class I shares;
| | (2) | ongoing costs, including management fees; distribution and/or service (12b-1) fees; and other Fund expenses. |
This example is intended to help you understand your ongoing costs (in dollars) of investing in the Fund and to compare these costs with the ongoing costs of investing in other mutual funds.
The example is based on a $1,000 investment beginning on October 1, 2009, and held until March 31, 2010.
ACTUAL EXPENSES
For each class of shares, the first line of the table at right provides information about actual account values and actual expenses. You may use the information in this line, together with the amount you invested, to estimate the expenses that you paid over the period. Simply divide your account value by $1,000 (for example, an $8,600 account value divided by $1,000 = 8.6), then multiply the result by the number in the first line for your class of shares under the heading entitled “Expenses Paid During Period” to estimate the expenses you paid on your account during this period.
HYPOTHETICAL EXAMPLE FOR COMPARISON PURPOSES
For each class of shares, the second line of the table at right provides information about hypothetical account values and hypothetical expenses based on the Fund’s actual expense ratio and an assumed rate of return of 5% per year before expenses, which is not the Fund’s actual return. The hypothetical account values and expenses may not be used to estimate the actual ending account balance or expenses you paid for the period. You may use this information to compare the ongoing costs of investing in the Fund and other funds. To do so, compare this 5% hypothetical example with the 5% hypothetical examples that appear in the shareholder reports of the other funds.
| | | | | | | | | |
| | | Beginning
Account Value
10/1/09 | | Ending
Account Value
3/31/10 | | Expenses Paid
During Period†
10/1/09–3/31/10 |
Class A Shares | | | | | | | | | |
Actual | | $ | 1,000.00 | | $ | 1,124.90 | | $ | 7.73 |
Hypothetical* | | $ | 1,000.00 | | $ | 1,017.65 | | $ | 7.34 |
Class C Shares | | | | | | | | | |
Actual | | $ | 1,000.00 | | $ | 1,120.20 | | $ | 12.03 |
Hypothetical* | | $ | 1,000.00 | | $ | 1,013.58 | | $ | 11.43 |
Class I Shares | | | | | | | | | |
Actual | | $ | 1,000.00 | | $ | 1,127.50 | | $ | 5.25 |
Hypothetical* | | $ | 1,000.00 | | $ | 1,020.00 | | $ | 4.99 |
Class R3 Shares | | | | | | | | | |
Actual | | $ | 1,000.00 | | $ | 1,125.10 | | $ | 7.42 |
Hypothetical* | | $ | 1,000.00 | | $ | 1,017.95 | | $ | 7.05 |
Class R4 Shares | | | | | | | | | |
Actual | | $ | 1,000.00 | | $ | 1,124.90 | | $ | 7.42 |
Hypothetical* | | $ | 1,000.00 | | $ | 1,017.95 | | $ | 7.04 |
Class R5 Shares | | | | | | | | | |
Actual | | $ | 1,000.00 | | $ | 1,127.30 | | $ | 5.25 |
Hypothetical* | | $ | 1,000.00 | | $ | 1,020.00 | | $ | 4.98 |
| † | Expenses are equal to the annualized expense ratio for each class (A: 1.46%; C: 2.28%; I: 0.99%; R3: 1.40%; R4: 1.40%; R5: 0.99%) multiplied by the average account value over the period, multiplied by 182/365 to reflect the one-half year period. |
| * | Hypothetical assumes a rate of return of 5% per year before expenses. |
Please note that the expenses shown in the table are meant to highlight your ongoing costs only and do not reflect any transactional costs, such as sales charges (loads), redemption fees, or exchange fees. Therefore, the second line of the table for each class of shares is useful in comparing ongoing costs only, and will not help you determine the relative total costs of owning different funds. In addition, if these transactional costs were included, your costs would have been higher.
28 Certified Semi-Annual Report
| | |
| INDEX COMPARISON | | |
| |
| Thornburg Global Opportunities Fund | | March 31, 2010 (Unaudited |
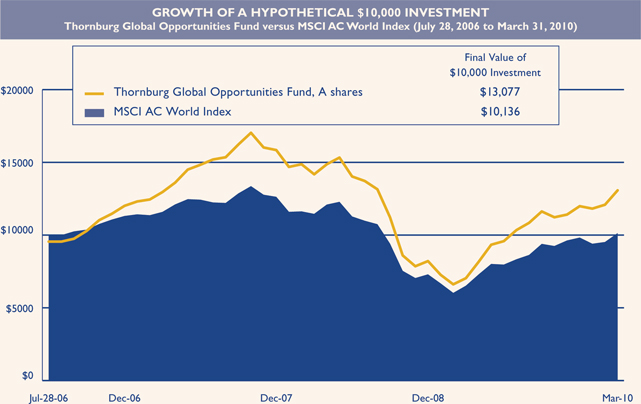
AVERAGE ANNUAL TOTAL RETURNS
For periods ended March 31, 2010 (with sales charge)
| | | | | | | | | |
| | | 1 Yr | | | 3 Yrs | | | Since
Inception | |
A Shares (Incep: 7/28/06) | | 77.54 | % | | -1.22 | % | | 7.58 | % |
C Shares (Incep: 7/28/06) | | 83.19 | % | | -0.48 | % | | 8.06 | % |
I Shares (Incep: 7/28/06) | | 86.61 | % | | 0.82 | % | | 9.48 | % |
R3 Shares (Incep: 2/1/08) | | 85.64 | % | | — | | | -5.90 | % |
R4 Shares (Incep: 2/1/08) | | 85.65 | % | | — | | | -5.83 | % |
R5 Shares (Incep: 2/1/08) | | 86.66 | % | | — | | | -5.37 | % |
MSCI AC World Index (Since: 7/28/06) | | 55.47 | % | | -4.37 | % | | 0.37 | % |
Performance data reflects past performance, which is no guarantee of future results. The performance data and graph do not reflect the deduction of taxes that a shareholder would pay on distributions or the redemption of Fund shares. Returns reflect the reinvestment of dividends and capital gains as well as applicable sales charges. Class A shares are sold with a maximum sales charge of 4.50%. Class C shares are subject to a 1% CDSC for the first year only. There is no up-front sales charge for Class I, R3, R4 and R5 shares. Class A and I shares are subject to a 1% 30-day redemption fee.
The MSCI All Country World Index (MSCI AC World Index) is a market capitalization weighted index composed of over 2,000 companies, and is representative of the market structure of 45 developed and emerging market countries in North and South America, Europe, Africa, and the Pacific Rim. The index is calculated with net dividends reinvested in U.S. dollars. Investors may not make direct investments into any index.
Certified Semi-Annual Report 29
| | |
| OTHER INFORMATION | | |
| |
| Thornburg Global Opportunities Fund | | March 31, 2010 (Unaudited) |
PORTFOLIO PROXY VOTING
Policies and Procedures:
The Trust has delegated to Thornburg Investment Management, Inc. (the “Advisor”) voting decisions respecting proxies for the Fund’s voting securities. The Advisor makes voting decisions in accordance with its Proxy Voting Policy and Procedures. A description of the Policy and Procedures is available (i) without charge, upon request, by calling the Advisor toll-free at 1-800-847-0200, (ii) on the Thornburg web site at www.thornburg.com, and (iii) on the Securities and Exchange Commission’s web site at www.sec.gov.
Information regarding how proxies were voted is available on or before August 31 of each year for the twelve months ending the preceding June 30. This information is available (i) without charge, upon request by calling the Advisor toll-free at 1-800-847-0200, (ii) on the Thornburg web site at www.thornburg.com, and (iii) on the Securities and Exchange Commission’s web site at www.sec.gov.
AVAILABILITY OF QUARTERLY PORTFOLIO SCHEDULE
The Fund files with the Securities and Exchange Commission schedules of its portfolio holdings on Form N-Q for the first and third quarters of each fiscal year. The Fund’s Forms N-Q are available on the Commission’s web site at www.sec.gov, or may be reviewed and copied at the Commission’s Public Reference Room in Washington, D.C. Information on the operation of the Public Reference Room may be obtained by calling 1-800-SEC-0330. The Fund also makes this information available on its web site at www.thornburg. com/download or upon request by calling 1-800-847-0200.
30 Certified Semi-Annual Report
Trustees’ Statement to Shareholders
Not part of the Certified Semi-Annual Report
February 8, 2005, as readopted July 22, 2009
The Trustees are concerned that ongoing commentaries and opinions reported in the media may confuse investors in general as to the supervisory duties of trustees of mutual funds and, in particular, leave Thornburg Investment Trust shareholders uncertain regarding how we discharge our responsibilities in supervising the Funds’ investment advisor and in reviewing the advisor’s contract for renewal. We decided to spell out clearly three principal guidelines that we follow in supervising the Trust’s investment advisor on your behalf.
We begin with the premise that each shareholder selected his or her Fund because its investments are managed by the investment advisor identified in the prospectus and in accordance with the objective and policies described in the prospectus. We realize, as each of you do, that if you believe that your Fund’s stated objective and policies no longer serve your personal investment goals, you can sell your shares and leave the Fund.
Therefore, we believe that our primary supervisory task – our principal obligation to you – is to assess the nature and quality of the advisor’s services, and to confirm that the advisor actively and competently pursues the Fund’s objective, in accordance with the policies set out in the prospectus. To do this, we meet regularly with management to review your Fund’s portfolio and to discuss the advisor’s specific actions and judgments in pursuing the Fund’s objective. We do not substitute our own judgment for the advisor’s decisions in selecting investments; the advisor is paid to exercise its informed judgment on investment decisions, and we seek to confirm, in reviewing the advisor’s performance, that the advisor is doing just that.
Second, while we are conscious of costs and the effect that costs have on shareholders’ returns, we do not seek the lowest fees or expense ratio as our sole or primary objective. We try to make sure that your Fund’s fees and costs are reasonable in relationship to the services rendered and that they are generally in line with those charged by other expert investment advisors, consistent with our belief that the Fund’s investors searched for and expect that expertise and attention and have decided to pay a reasonable price for it. We do not put the management contract “out to bid” as a matter of course, and we would not do so unless we had concluded that the advisor materially had failed to pursue the Fund’s objectives in accordance with its policies, or for other equally important reasons. We believe that any other approach would be inconsistent with your interests and contrary to your expectations when you bought shares of the Fund in the first place.
Finally, because we believe that most Thornburg Fund shareholders have invested with a long-term perspective, we try not to focus too much on the fashions of the moment and on short-term performance. The market will not favor any specific investment objective or set of policies at all times and under all economic circumstances. A fund will experience periods of both high and low returns relative to other funds and other investments. Even if one of our Funds is not favored by the market at a particular time, we believe that the advisor is nonetheless obliged to remain true to the Fund’s objective and policies, and we watch to see that it does so.
This page is not part of the Semi-Annual Report. 31
This page intentionally left blank.
32 This page is not part of the Semi-Annual Report.
Retirement and Education Accounts
Thornburg Investment Management offers retirement and education savings accounts that can help you meet a variety of planning challenges. For account applications or further information on any of the accounts below, please call 1-800-847-0200 or go to www.thornburg.com/ira. Your financial advisor can help you determine which plan is right for you.
Individual Retirement Accounts
Individual Retirement Accounts (IRAs) provide a tax-advantaged means to save money for the future. For a detailed outline of the difference between retirement accounts, see www.thornburg.com/ira. Rollovers are available. Call 1-800-847-0200 for more information.
Traditional IRAs – Contributions to Traditional IRAs are tax deductible for eligible individuals, and withdrawals are taxed as additional ordinary income. You may contribute to an IRA if you receive compensation and are under 70 1/ 2, even if you are covered by an employer retirement plan. Deductible contributions are subject to certain qualifications. Please consult your tax advisor.
Roth IRAs – Under a Roth IRA, there is no tax deduction for contributions, but there is no income tax on qualified withdrawals. For a more detailed comparison of Traditional and Roth IRAs, please see our web site at www.thornburg.com/ira.
SEP IRAs – Simplified Employee Pension (SEP) IRAs are established by employers. The employer is allowed a tax deduction for contributions made to the SEP Plan and makes contributions to each eligible employee’s SEP IRA on a discretionary basis.
SIMPLE IRAs – Savings Incentive Match Plan for Employees of Small Employers (SIMPLE) is designed to give small business owners a simplified method to establish and contribute to a retirement plan for employees. The employer is allowed a tax deduction for contributions and makes either matching or non-elective contributions to each eligible employee’s SIMPLE IRA. Employees may make salary deferral contributions.
Coverdell Education Savings Account
These savings accounts are designed to provide a way to save money for higher education expenses. In an Education Savings Account, earnings and interest grow tax-free, and qualified withdrawals used to pay for eligible higher-education expenses are tax- and penalty-free.
Funds Available
The following funds are available in the accounts listed above:
| | • | | Thornburg International Value Fund |
| | • | | Thornburg Core Growth Fund |
| | • | | Thornburg Investment Income Builder Fund |
| | • | | Thornburg Global Opportunities Fund |
| | • | | Thornburg International Growth Fund |
| | • | | Thornburg Developing World Fund |
| | • | | Thornburg Limited Term U.S. Government Fund |
| | • | | Thornburg Limited Term Income Fund |
| | • | | Thornburg Strategic Income Fund |
This page is not part of the Semi-Annual Report. 33

Thornburg Equity Funds
Thornburg’s equity research uses a fundamental and comprehensive analytical approach. Thornburg equity funds focus on a limited number of securities so that each holding can impact performance. The equity team searches for firms believed to have a promising future and seeks to buy shares of those companies at a discount to their intrinsic value.
| | • | | Thornburg International Value Fund |
| | • | | Thornburg Core Growth Fund |
| | • | | Thornburg Investment Income Builder Fund |
| | • | | Thornburg Global Opportunities Fund |
| | • | | Thornburg International Growth Fund |
| | • | | Thornburg Developing World Fund |
Thornburg Bond Funds
Thornburg Investment Management applies a disciplined philosophy to fixed-income management. Since the launch of our first fixed-income fund over 25 years ago, we have been conducting fundamental, bottom-up research in an effort to identify bonds which we believe provide the best return for a given level of risk. We are very organic in our approach, avoiding leverage or complex strategies which could backfire in periods of market uncertainty.
| | • | | Thornburg Limited Term Municipal Fund |
| | • | | Thornburg Intermediate Municipal Fund |
| | • | | Thornburg California Limited Term Municipal Fund |
| | • | | Thornburg New Mexico Intermediate Municipal Fund |
| | • | | Thornburg New York Intermediate Municipal Fund |
| | • | | Thornburg Strategic Municipal Income Fund |
| | • | | Thornburg Limited Term U.S. Government Fund |
| | • | | Thornburg Limited Term Income Fund |
| | • | | Thornburg Strategic Income Fund |
Before investing, carefully consider the Fund’s investment goals, risks, charges, and expenses. For a prospectus containing this and other information, contact your financial advisor or visit thornburg. com. Read it carefully before investing.
For additional information, please visit www.thornburg.com
Thornburg Investment Management, Inc. 2300 North Ridgetop Road, Santa Fe, NM 87506
This page is not part of the Semi-Annual Report. 35
| | | | | | | | |

| | | | Waste not, Wait not | |  |
| | | |
| | | | | | Get instant access to your shareholder reports. |
| | | |
| | This Semi-Annual Report is submitted for the general information of shareholders of the Fund. It is not authorized for distribution to prospective investors in the Fund unless preceded or accompanied by an effective prospectus. | | | | By switching from your postal mailbox to your email inbox, you reduce paper clutter, improve record keeping access, and help conserve our natural resources. |
| | | |
 | | Investment Advisor: Thornburg Investment Management® 800.847.0200 | | | | Go to www.thornburg.com/edelivery and sign up to receive your shareholder reports, prospectuses, and proxy statements electronically. |
| | | |
| | Distributor: Thornburg Securities Corporation® 800.847.0200 | | | | You invest in the future, without spending a dime. |
| | TH1411 | | | | |

2 This page is not part of the Semi-Annual Report.
Important Information
The information presented on the following pages was current as of March 31, 2010. The manager’s views, portfolio holdings, and sector and country diversification are provided for the general information of the Fund’s shareholders; they are historical and subject to change. This material should not be deemed a recommendation to buy or sell any of the securities mentioned.
Investments in the Fund carry risks, including possible loss of principal. Special risks may be associated with investments outside the United States, especially in developing countries, including currency fluctuations, illiquidity and volatility. Investments in small capitalization companies may increase the risk of greater price fluctuations. Please see the Fund’s Prospectus for a discussion of the risks associated with an investment in the Fund. Investments in the Fund are not FDIC insured, nor are they deposits of or guaranteed by a bank or any other entity. There is no guarantee that the Fund will meet its investment objectives. Funds invested in a limited number of holdings may expose an investor to greater volatility.
Performance data shown represents past performance and is no guarantee of future results. Investment return and principal value will fluctuate so shares, when redeemed, may be worth more or less than their original cost. Current performance may be lower or higher than quoted. For performance current to the most recent month end, visit thornburg.com.
Performance data given at net asset value (NAV) does not take into account the applicable sales charges. If the sales charges had been included, the performance would have been lower.
Minimum investments for Class I shares are higher than those for other classes. Class I shares may not be available to all investors.
| | | | |
Share Class | | NASDAQ Symbol | | Cusip |
| Class A | | THDAX | | 885-216-408 |
| Class C | | THDCX | | 885-216-507 |
| Class I | | THDIX | | 885-216-606 |
Glossary
MSCI Emerging Markets Index – The MSCI Emerging Markets Index is a free float-adjusted market capitalization index that is designed to measure equity market performance of emerging markets. As of June 2009 the MSCI Emerging Markets Index consisted of the following 22 emerging market country indices: Brazil, Chile, China, Colombia, Czech Republic, Egypt, Hungary, India, Indonesia, Israel, Korea, Malaysia, Mexico, Morocco, Peru, Philippines, Poland, Russia, South Africa, Taiwan, Thailand, and Turkey.
MSCI Country Indices (Brazil, India, and Russia) – Free float-adjusted market capitalization indices that are designed to measure equity market performance in that specific country.
MSCI China H Shares Index – The Morgan Stanley Capital International (MSCI) China H Shares Index reflects the performance of China’s H shares, which are securities of companies incorporated in the People’s Republic of China (PRC) and nominated by the Chinese Government for listing and trading on the Hong Kong Stock Exchange.
Unless otherwise noted, index returns reflect the reinvestment of income dividends and capital gains, if any, but do not reflect fees, brokerage commissions or other expenses of investing. Investors may not make direct investments into any index.
Asset to Equity Ratio – Total assets divided by shareholder equity. Asset/equity ratio is often used as a measure of leverage. For example, if a company’s assets are $1 million and its shareholder equity is $1 million, then its asset/equity ratio would be 1.
Basis Point – A unit that is equal to 1/100th of 1%. A 1% change = 100 basis points (bps).
Book Value per Share – The book value of a company divided by the number of shares outstanding.
Earnings per Share (EPS) – The total earnings divided by the number of shares outstanding.
Leverage – The amount of debt used to finance a firm’s assets. A firm with significantly more debt than equity is considered to be highly leveraged.
Loan to Deposit Ratio – The amount of a bank’s loans divided by the amount of its deposits at any given time. The higher the ratio, the more the bank is relying on borrowed funds, which are generally more costly than most types of deposits.
This page is not part of the Semi-Annual Report. 3

Thornburg Developing World Fund
March 31, 2010
Table of Contents
This report is certified under the Sarbanes-Oxley Act of 2002, which requires that public companies, including mutual funds, affirm that the information provided in their annual and semiannual shareholder reports fully and fairly represents their financial position.
4 Certified Semi-Annual Report
Letter to Shareholders
| | |
 | | April 6, 2010 |
| | Dear Fellow Shareholder: |
| | We are pleased to present the first semi-annual report for the Thornburg Developing World Fund for the period ended March 31, 2010. The net asset value of a Class A share of the Fund increased 70 cents to $12.64 since the inception date of December 16, 2009. The Class A shares of the Thornburg Developing World Fund produced a total return of 5.86% (at NAV) since the December 16, 2009 inception, compared to 4.15% for the MSCI Emerging Markets Index over the same time period. By country, MSCI Brazil is up 0.43% in U.S. dollar (USD) terms since the Fund’s inception, MSCI Russia up 5.40%, MSCI India up 8.52%, and the MSCI China H Shares Index down 2.09%. China underperformed other developing countries as the government increased reserve requirements in response to concerns about ebullient property markets and the pace of bank lending. |
| | As this is our first shareholder commentary, we thought it would be instructive to elaborate on our stock selection process and approach to risk management. As of March 31, 2010, our top ten holdings, listed on page 7, are companies that generate capital on an organic basis, with business models not predicated on financial leverage. Indeed, the non-financial companies listed are significantly free cash flow positive, while the banks listed have asset-to-equity ratios (a key measure of financial leverage) below 10x and loan-to-deposit ratios (a key indicator of liquidity) around or below 0.8x. As access to external funding in the developing world can be volatile, a portfolio of companies with stable and self-funding business models has some potential for lower business and share price volatility than the universe of developing world equities. At the same time, we believe each of the top ten companies has the potential to compound earnings per share and book value per share at above-average rates. For our top ten holdings, the average sales and earnings growth rates for 2010 are 14.9% and 19.1%, respectively, as of the writing of this commentary (source: FactSet) – despite relatively defensive business characteristics. It is our hope that our dual emphasis on upside participation and risk management will be a distinguishing characteristic of the Thornburg Developing World Fund over time. |
| |
| | Since the Fund’s inception and consistent with recent periods, currency has represented a significant component of developing country performance, as is evident in the difference between local currency and USD returns of most country indices. For example, since the Fund’s inception, the MSCI India Index has returned 8.52% in USD and 4.46% in local currency, the MSCI Brazil Index 0.43% in USD and 2.06% in local currency, and the MSCI Russia Index 5.40% in USD and 2.44% in local currency. While the disparity between local and USD returns demonstrates the recent appreciation of many developing country currencies relative to the dollar, a less well-understood phenomenon is their appreciation relative to other major developed market currencies. Since the Fund’s inception, the health of the Euro has increasingly been subject to scrutiny, due to the crisis of confidence in Greece; the outlook for the Japanese Yen has been questioned due to high |
Certified Semi-Annual Report 5
Letter to Shareholders,
Continued
| | |
| | government debt levels and export dependence; and prospects for a recovery in the Great Britain Pound continue to be tempered by high consumer and government debt levels. Developing country currency movements generally reflect a combination of macroeconomic factors such as relative interest rate movements, trade balances, and capital flows, many of which are favorable at present. Combined with broad market appetites for risk, these factors can create significant volatility for USD-denominated investors. It is important to note that the portfolio is unhedged at present, and therefore exposed to developing country currency movements in both directions. |
| |
| | In the near term, the outlook for developing country equities would appear constructive as liquidity remains ample, valuations reasonable, and cyclical recovery supportive. In addition, long-term tailwinds such as demographics, improved purchasing power, and urbanization are broadly supportive of share prices in the developing world. At the same time, developing country central banks are in the early stages of removing liquidity from the system, as is evidenced by recent interest rate increases in India and higher reserve requirements in China. Moreover, inflationary pressures loom. In general terms, tighter liquidity conditions and higher inflation are not supportive of equity valuations or stock prices. However, many developing countries are well placed to counteract such pressures via measures outside the scope of monetary policy. China in particular has introduced significant health care reform that can help to stimulate domestic consumption, and may opt to allow its currency to appreciate in an effort to counter inflation and increase domestic purchasing power. Ultimately, forecasting market movements is inherently difficult, but we take some comfort in the knowledge that most of the companies we own currently have low absolute debt levels, limited capital intensity, and healthy organic capital generation. We trust that these characteristics will allow for upside participation while providing a measure of downside protection, at least in relative terms. |
| |
| | We invite you to visit our website at www.thornburg.com, where you will find additional information about the Thornburg Developing World Fund, as well as other Thornburg investment products. We thank you for your trust and confidence. |
Sincerely,

Lewis Kaufman,CFA
Portfolio Manager
Managing Director
The matters discussed in this report may constitute forward-looking statements made pursuant to the safe harbor provisions of the Securities Litigation Reform Act of 1995. These include any advisor or portfolio manager prediction, assessment, analysis or outlook for individual securities, industries, investment styles, market sectors and/or markets. These statements involve risks and uncertainties. In addition to the general risks described for each fund in its current prospectus, other factors bearing on these reports include the accuracy of the advisor’s or portfolio manager’s forecasts and predictions, the appropriateness of the investment strategies designed by the advisor or portfolio manager, and the ability of the advisor or portfolio manager to implement their strategies efficiently and successfully. Any one or more of these factors, as well as other risks affecting the securities markets generally, could cause the actual results of any fund to differ materially as compared to its benchmarks.
6 Certified Semi-Annual Report
| | |
| SCHEDULE OF INVESTMENTS | | |
| |
| Thornburg Developing World Fund | | March 31, 2010 (Unaudited) |
SUMMARY OF INDUSTRY EXPOSURE
As of 3/31/10
| | | | | | | | |
Software & Services | | 11.2 | % | | Health Care Equipment & Services | | 4.2 | % |
Materials | | 10.7 | % | | Insurance | | 4.0 | % |
Banks | | 9.2 | % | | Transportation | | 3.9 | % |
Energy | | 9.0 | % | | Automobiles & Components | | 2.9 | % |
Food & Staples Retailing | | 8.1 | % | | Semiconductors & Semiconductor Equipment | | 2.4 | % |
Household & Personal Products | | 6.6 | % | | Retailing | | 2.2 | % |
Consumer Durables & Apparel | | 5.8 | % | | Telecommunication Services | | 1.9 | % |
Pharmaceuticals, Biotechnology & Life Sciences | | 5.5 | % | | Food, Beverage & Tobacco | | 1.0 | % |
Consumer Services | | 5.0 | % | | Other Assets & Cash Equivalents | | 6.4 | % |
TOP TEN HOLDINGS
As of 3/31/10
| | | | | | | | |
China Life Insurance Co. | | 4.0 | % | | Cielo S/A | | 2.8 | % |
Colgate Palmolive Co. | | 4.0 | % | | Turkiye Garanti Bankasi A.S. | | 2.8 | % |
New Oriental Education & Technology Group, Inc. ADR | | 3.1 | % | | Commercial International Bank | | 2.7 | % |
Hero Honda Motors Ltd. | | 2.9 | % | | PT Indocement Tunggal Prakarsa Tbk | | 2.7 | % |
Totvs S/A | | 2.9 | % | | Natura Cosmeticos SA | | 2.6 | % |
SUMMARY OF COUNTRY EXPOSURE
As of 3/31/10 (percent of equity holdings)
| | | | | | | | |
China | | 25.1 | % | | South Africa | | 2.4 | % |
Brazil | | 13.2 | % | | United Kingdom | | 2.4 | % |
Russia | | 8.1 | % | | Chile | | 2.2 | % |
India | | 7.4 | % | | South Korea | | 2.2 | % |
United States | | 6.9 | % | | Argentina | | 2.1 | % |
Turkey | | 5.7 | % | | Netherlands | | 2.0 | % |
Mexico | | 3.8 | % | | Israel | | 1.8 | % |
Egypt | | 2.9 | % | | Australia | | 1.3 | % |
Indonesia | | 2.8 | % | | France | | 1.3 | % |
Czech Republic | | 2.6 | % | | Poland | | 1.2 | % |
Taiwan | | 2.6 | % | | | | | |
Certified Semi-Annual Report 7
| | |
| SCHEDULE OF INVESTMENTS, CONTINUED | | |
| |
| Thornburg Developing World Fund | | March 31, 2010 (Unaudited) |
| | | | | |
| | | Shares/
Principal Amount | | Value |
COMMON STOCK — 93.58% | | | | | |
AUTOMOBILES & COMPONENTS — 2.89% | | | | | |
AUTOMOBILES — 2.89% | | | | | |
Hero Honda Motors Ltd. | | 7,620 | | $ | 330,786 |
| | | | | |
| | | | | 330,786 |
| | | | | |
BANKS — 9.21% | | | | | |
COMMERCIAL BANKS — 9.21% | | | | | |
Commercial International Bank | | 26,478 | | | 312,581 |
Komercni Banka A.S. | | 1,364 | | | 276,814 |
Standard Chartered plc | | 5,200 | | | 139,707 |
Turkiye Garanti Bankasi A.S. | | 69,100 | | | 323,248 |
| | | | | |
| | | | | 1,052,350 |
| | | | | |
CONSUMER DURABLES & APPAREL — 5.76% | | | | | |
HOUSEHOLD DURABLES — 2.09% | | | | | |
Woongjin Coway Co. Ltd. | | 7,710 | | | 238,840 |
TEXTILES, APPAREL & LUXURY GOODS — 3.67% | | | | | |
Li Ning Co. Ltd. | | 77,500 | | | 280,983 |
LVMH Moët Hennessy Louis Vuitton SA | | 1,188 | | | 138,860 |
| | | | | |
| | | | | 658,683 |
| | | | | |
CONSUMER SERVICES — 4.97% | | | | | |
DIVERSIFIED CONSUMER SERVICES — 3.07% | | | | | |
a New Oriental Education & Technology Group, Inc. ADR | | 4,108 | | | 351,275 |
HOTELS, RESTAURANTS & LEISURE — 1.90% | | | | | |
a Ctrip.com International Ltd. ADR | | 5,544 | | | 217,325 |
| | | | | |
| | | | | 568,600 |
| | | | | |
ENERGY — 9.03% | | | | | |
ENERGY EQUIPMENT & SERVICES — 1.91% | | | | | |
Schlumberger Ltd. | | 3,447 | | | 218,746 |
OIL, GAS & CONSUMABLE FUELS — 7.12%a Cairn India Ltd. | | 38,800 | | | 263,463 |
Cnooc Ltd. | | 177,000 | | | 290,431 |
OAO Gazprom ADR | | 11,052 | | | 259,391 |
| | | | | |
| | | | | 1,032,031 |
| | | | | |
FOOD & STAPLES RETAILING — 8.07% | | | | | |
FOOD & STAPLES RETAILING — 8.07% | | | | | |
Bim Birlesik Magazalar A.S. | | 5,410 | | | 281,594 |
Drogasil S.A. | | 11,689 | | | 187,921 |
Eurocash SA | | 20,000 | | | 133,025 |
Magnit OJCS GDR | | 10,100 | | | 187,052 |
Wal-Mart de Mexico SAB de C.V. | | 26,025 | | | 133,348 |
| | | | | |
| | | | | 922,940 |
| | | | | |
FOOD, BEVERAGE & TOBACCO — 1.01% | | | | | |
BEVERAGES — 1.01% | | | | | |
Sabmiller plc | | 3,946 | | | 115,689 |
| | | | | |
| | | | | 115,689 |
| | | | | |
8 Certified Semi-Annual Report
| | |
| SCHEDULE OF INVESTMENTS, CONTINUED | | |
| |
| Thornburg Developing World Fund | | March 31, 2010 (Unaudited) |
| | | | | |
| | | Shares/
Principal Amount | | Value |
HEALTH CARE EQUIPMENT & SERVICES — 4.23% | | | | | |
HEALTH CARE PROVIDERS & SERVICES — 4.23% | | | | | |
Diagnosticos da America SA | | 31,700 | | $ | 278,078 |
a Sinopharm Group Co. H | | 45,600 | | | 204,970 |
| | | | | |
| | | | | 483,048 |
| | | | | |
HOUSEHOLD & PERSONAL PRODUCTS — 6.60% | | | | | |
HOUSEHOLD PRODUCTS — 4.01% | | | | | |
Colgate Palmolive Co. | | 5,377 | | | 458,443 |
PERSONAL PRODUCTS — 2.59% | | | | | |
Natura Cosmeticos SA | | 14,575 | | | 295,868 |
| | | | | |
| | | | | 754,311 |
| | | | | |
INSURANCE — 4.02% | | | | | |
INSURANCE — 4.02% | | | | | |
China Life Insurance Co. | | 96,000 | | | 459,954 |
| | | | | |
| | | | | 459,954 |
| | | | | |
MATERIALS — 10.66% | | | | | |
CHEMICALS — 4.43% | | | | | |
Monsanto Co. | | 3,858 | | | 275,539 |
Sociedad Quimica Minera de Chile SA ADR | | 6,167 | | | 230,584 |
CONSTRUCTION MATERIALS — 2.67% | | | | | |
PT Indocement Tunggal Prakarsa Tbk | | 194,700 | | | 304,904 |
METALS & MINING — 3.56% | | | | | |
Newcrest Mining Ltd. | | 4,500 | | | 135,528 |
Southern Copper Corp. | | 8,593 | | | 272,140 |
| | | | | |
| | | | | 1,218,695 |
| | | | | |
PHARMACEUTICALS, BIOTECHNOLOGY & LIFE SCIENCES — 5.47% | | | | | |
PHARMACEUTICALS — 5.47% | | | | | |
China Shineway Pharmaceutical Group Ltd. | | 62,000 | | | 171,684 |
a Pharmstandard GDR | | 10,326 | | | 257,118 |
Teva Pharmaceutical Industries Ltd. ADR | | 3,112 | | | 196,305 |
| | | | | |
| | | | | 625,107 |
| | | | | |
RETAILING — 2.21% | | | | | |
SPECIALTY RETAIL — 2.21% | | | | | |
Truworths International Ltd. | | 35,100 | | | 252,031 |
| | | | | |
| | | | | 252,031 |
| | | | | |
SEMICONDUCTORS & SEMICONDUCTOR EQUIPMENT — 2.43% | | | | | |
SEMICONDUCTORS & SEMICONDUCTOR EQUIPMENT — 2.43% | | | | | |
Mediatek, Inc. | | 16,000 | | | 277,599 |
| | | | | |
| | | | | 277,599 |
| | | | | |
SOFTWARE & SERVICES — 11.15% | | | | | |
INFORMATION TECHNOLOGY SERVICES — 4.57% | | | | | |
Cielo S/A | | 34,500 | | | 324,950 |
Infosys Technologies Ltd. ADR | | 3,349 | | | 197,089 |
INTERNET SOFTWARE & SERVICES — 3.72% | | | | | |
a Mercadolibre, Inc. | | 4,697 | | | 226,442 |
Tencent Holdings Ltd. | | 9,900 | | | 198,529 |
Certified Semi-Annual Report 9
| | |
| SCHEDULE OF INVESTMENTS, CONTINUED | | |
| |
| Thornburg Developing World Fund | | March 31, 2010 (Unaudited) |
| | | | | |
| | | Shares/
Principal Amount | | Value |
SOFTWARE — 2.86% | | | | | |
Totvs S/A | | 5,191 | | $ | 326,899 |
| | | | | |
| | | | | 1,273,909 |
| | | | | |
TELECOMMUNICATION SERVICES — 1.94% | | | | | |
WIRELESS TELECOMMUNICATION SERVICES — 1.94% | | | | | |
China Mobile Ltd. | | 23,000 | | | 221,283 |
| | | | | |
| | | | | 221,283 |
| | | | | |
TRANSPORTATION — 3.93% | | | | | |
TRANSPORTATION INFRASTRUCTURE — 3.93% | | | | | |
China Merchants Holdings International Co. Ltd. | | 78,000 | | | 285,308 |
Novorossiysk Sea Trade Port GDR | | 12,000 | | | 164,401 |
| | | | | |
| | | | | 449,709 |
| | | | | |
TOTAL COMMON STOCK (Cost $10,033,203) | | | | | 10,696,725 |
| | | | | |
TOTAL INVESTMENTS — 93.58% (Cost $10,033,203) | | | | $ | 10,696,725 |
OTHER ASSETS LESS LIABILITIES — 6.42% | | | | | 734,291 |
| | | | | |
NET ASSETS — 100.00% | | | | $ | 11,431,016 |
| | | | | |
Footnote Legend
Portfolio Abbreviations
To simplify the listings of securities, abbreviations are used per the table below:
| ADR | American Depository Receipt |
| GDR | Global Depository Receipt |
See notes to financial statements.
10 Certified Semi-Annual Report
| | |
| STATEMENT OF ASSETS AND LIABILITIES | | |
| |
| Thornburg Developing World Fund | | March 31, 2010 (Unaudited) |
| | | | |
ASSETS | | | | |
Investments at value (cost $10,033,203) (Note 2) | | $ | 10,696,725 | |
Cash | | | 242,646 | |
Cash denominated in foreign currency (cost $3,881) | | | 3,888 | |
Receivable for investments sold | | | 433,954 | |
Receivable for fund shares sold | | | 55,851 | |
Receivable from investment advisor | | | 21,575 | |
Dividends receivable | | | 34,162 | |
Prepaid expenses and other assets | | | 56,469 | |
| | | | |
Total Assets | | | 11,545,270 | |
| | | | |
| |
LIABILITIES | | | | |
Payable for securities purchased | | | 102,979 | |
Deferred tax payable | | | 11,275 | |
| | | | |
Total Liabilities | | | 114,254 | |
| | | | |
| |
NET ASSETS | | $ | 11,431,016 | |
| | | | |
NET ASSETS CONSIST OF: | | | | |
Undistributed net investment income | | $ | 14,813 | |
Net unrealized appreciation on investments | | | 652,133 | |
Accumulated net realized gain (loss) | | | (22,205 | ) |
Net capital paid in on shares of beneficial interest | | | 10,786,275 | |
| | | | |
| | $ | 11,431,016 | |
| | | | |
NET ASSET VALUE: | | | | |
Class A Shares: | | | | |
Net asset value and redemption price per share
($3,797,806 applicable to 300,344 shares of beneficial interest outstanding - Note 4) | | $ | 12.64 | |
Maximum sales charge, 4.50% of offering price | | | 0.60 | |
| | | | |
Maximum offering price per share | | $ | 13.24 | |
| | | | |
| |
Class C Shares: | | | | |
Net asset value and offering price per share *
($600,060 applicable to 47,527 shares of beneficial interest outstanding - Note 4) | | $ | 12.63 | |
| | | | |
| |
Class I Shares: | | | | |
Net asset value, offering and redemption price per share
($7,033,150 applicable to 555,216 shares of beneficial interest outstanding - Note 4) | | $ | 12.67 | |
| | | | |
| * | Redemption price per share is equal to net asset value less any applicable contingent deferred sales charge. |
See notes to financial statements.
Certified Semi-Annual Report 11
| | |
| STATEMENT OF OPERATIONS | | |
| |
| Thornburg Developing World Fund | | Period Ended March 31, 2010 (Unaudited)* |
| | | | |
INVESTMENT INCOME: | | | | |
Dividend income (net of foreign taxes withheld of $1,319) | | $ | 45,325 | |
| | | | |
| |
EXPENSES: | | | | |
Investment advisory fees (Note 3) | | | 21,708 | |
Administration fees (Note 3) | | | | |
Class A Shares | | | 834 | |
Class C Shares | | | 139 | |
Class I Shares | | | 735 | |
Distribution and service fees (Note 3) | | | | |
Class A Shares | | | 1,700 | |
Class C Shares | | | 1,125 | |
Transfer agent fees | | | | |
Class A Shares | | | 536 | |
Class C Shares | | | 533 | |
Class I Shares | | | 533 | |
Registration and filing fees | | | | |
Class A Shares | | | 8,417 | |
Class C Shares | | | 8,417 | |
Class I Shares | | | 8,448 | |
Custodian fees (Note 3) | | | 8,195 | |
Professional fees | | | 10,706 | |
Accounting fees | | | 385 | |
Trustee fees | | | 106 | |
Other expenses | | | 7,361 | |
| | | | |
Total Expenses | | | 79,878 | |
Less: | | | | |
Expenses reimbursed by investment advisor (Note 3) | | | (25,759 | ) |
Investment advisory fees waived by investment advisor (Note 3) | | | (23,486 | ) |
Fees paid indirectly (Note 3) | | | (121 | ) |
| | | | |
Net Expenses | | | 30,512 | |
| | | | |
Net Investment Income | | $ | 14,813 | |
| | | | |
12 Certified Semi-Annual Report
| | |
| STATEMENT OF OPERATIONS, CONTINUED | | |
| |
| Thornburg Developing World Fund | | Period Ended March 31, 2010 (Unaudited)* |
| | | | |
REALIZED AND UNREALIZED GAIN (LOSS) | | | | |
Net realized gain (loss) from: | | | | |
Investments | | $ | 3,338 | |
Foreign currency transactions | | | (25,543 | ) |
| | | | |
| | | (22,205 | ) |
| | | | |
Net change in unrealized appreciation (depreciation) on: | | | | |
Investments (net of change in deferred taxes payable of $11,275) | | | 652,247 | |
Foreign currency translations | | | (114 | ) |
| | | | |
| | | 652,133 | |
| | | | |
Net Realized and Unrealized Gain | | | 629,928 | |
| | | | |
Net Increase in Net Assets Resulting From Operations | | $ | 644,741 | |
| | | | |
| * | For the period from commencement of operations on December 16, 2009 through March 31, 2010. |
See notes to financial statements.
Certified Semi-Annual Report 13
STATEMENT OF CHANGES IN NET ASSETS
Thornburg Developing World Fund
| | | | |
| | | Period Ended
March 31, 2010* | |
INCREASE (DECREASE) IN NET ASSETS FROM: | | | | |
| |
OPERATIONS: | | | | |
Net investment income | | $ | 14,813 | |
Net realized gain (loss) on investments and foreign currency transactions | | | (22,205 | ) |
Increase (decrease) in unrealized appreciation (depreciation) on investments, foreign currency translations, and deferred taxes | | | 652,133 | |
| | | | |
| |
Net Increase (Decrease) in Net Assets Resulting from Operations | | | 644,741 | |
| |
FUND SHARE TRANSACTIONS (NOTE 4): | | | | |
Class A Shares | | | 3,563,453 | |
Class C Shares | | | 570,538 | |
Class I Shares | | | 6,652,284 | |
| | | | |
| |
Net Increase in Net Assets | | | 11,431,016 | |
| |
NET ASSETS: | | | | |
Beginning of Period | | | — | |
| | | | |
| |
End of Period | | $ | 11,431,016 | |
| | | | |
| |
Undistributed net investment income | | $ | 14,813 | |
| * | For the unaudited period from commencement of operations on December 16, 2009 through March 31, 2010. |
See notes to financial statements.
14 Certified Semi-Annual Report
| | |
| NOTES TO FINANCIAL STATEMENTS | | |
| |
| Thornburg Developing World Fund | | March 31, 2010 (Unaudited) |
NOTE 1 – ORGANIZATION
Thornburg Developing World Fund, hereinafter referred to as the “Fund,” is a diversified series of Thornburg Investment Trust (the “Trust”). The Fund commenced operations on December 16, 2009. The Trust was organized as a Massachusetts business trust under a Declaration of Trust dated June 3, 1987 and is registered as a diversified, open-end management investment company under the Investment Company Act of 1940, as amended. The Fund is currently one of sixteen separate series of the Trust. Each series is considered to be a separate entity for financial reporting and tax purposes and bears expenses directly attributable to it. The Fund seeks long-term capital appreciation.
The Fund currently offers three classes of shares of beneficial interest: Class A, Class C, and Institutional Class (Class I shares). Each class of shares of the Fund represents an interest in the same portfolio of investments, except that (i) Class A shares are sold subject to a front-end sales charge collected at the time the shares are purchased and bear a service fee, (ii) Class C shares are sold at net asset value without a sales charge at the time of purchase, but are subject to a contingent deferred sales charge upon redemption within one year of purchase, and bear both a service fee and a distribution fee, and (iii) Class I shares are sold at net asset value without a sales charge at the time of purchase, and (iv) the respective classes may have different reinvestment privileges and conversion rights. Additionally, the Fund may allocate among its classes certain expenses, to the extent allowable to specific classes, including transfer agent fees, government registration fees, certain printing and postage costs, and administrative and legal expenses. Currently, class specific expenses of the Fund are limited to service and distribution fees, administration fees, and certain registration and transfer agent expenses.
NOTE 2 – SIGNIFICANT ACCOUNTING POLICIES
Significant accounting policies of the Trust are as follows:
Valuation of Investments: Portfolio securities listed or traded on a national securities exchange are valued on the valuation date at the last reported sale price on the exchange that is the primary market for the security. Portfolio securities traded on an exchange for which there has been no sale that day and other equity securities traded in the over-the-counter market are valued at the mean between the last reported bid and asked prices. Portfolio securities reported by NASDAQ are valued at the NASDAQ official closing price. Any foreign security traded on exchanges outside the United States is valued at the price of the security on the exchange that is normally the security’s primary market, as of the close of that exchange preceding the time of the Fund’s valuation.
Debt obligations held by the Fund have a primary market over the counter and are valued by an independent pricing service approved by the Trustees of the Trust. The pricing service ordinarily values debt obligations at quoted bid prices. When quotations are not available, debt obligations held by the Fund are valued at evaluated prices determined by the pricing service using methods which include consideration of yields or prices of debt obligations of comparable quality, type of issue, coupon, maturity and rating, and indications as to value from dealers and general market conditions. Short-term obligations having remaining maturities of 60 days or less are valued at amortized cost, which approximates market value.
Quotations in foreign currencies for foreign portfolio investments are converted to U.S. dollar equivalents using the foreign exchange quotation in effect at the time of valuation.
In any case where the market value of an equity security held by the Fund is not readily available, the Trust’s valuation and pricing committee determines a fair value for the security using procedures approved by the Trustees, which may include the use of a price obtained from an independent pricing service. The pricing service ordinarily values equity securities in these instances using multi-factor models to adjust market prices based upon various inputs, including exchange data, depository receipt prices, futures and index data and other data. A security’s market value is deemed not readily available whenever the exchange or market on which the security is primarily traded is closed for the entire scheduled day of trading. Additionally, a security’s market value may be deemed not readily available under other circumstances identified by the Trustees, including when developments occurring after the most recent close of the security’s primary exchange or market, but before the most recent close of trading in Fund shares, create a serious question about the reliability of the security’s market value.
In any case where a pricing service fails to provide a price for a debt obligation held by the Fund, the valuation and pricing committee determines a fair value for the debt obligation using procedures approved by the Trustees. Additionally, in any case where management
Certified Semi-Annual Report 15
| | |
| NOTES TO FINANCIAL STATEMENTS, CONTINUED | | |
| |
| Thornburg Developing World Fund | | March 31, 2010 (Unaudited) |
believes that a price provided by a pricing service for a debt obligation held by the Fund may be unreliable, the valuation and pricing committee decides whether or not to use the pricing service’s valuation or to determine a fair value for the debt obligation.
In determining fair value for any portfolio security or other investment, the valuation and pricing committee seeks to determine the amount that an owner of the investment might reasonably expect to receive upon a sale of the investment. However, because fair value prices are estimated prices, the valuation and pricing committee’s determination of fair value for an investment may differ from the value that would be realized by the Fund upon a sale of the investment, and that difference could be material to the Fund’s financial statements. The valuation and pricing committee’s determination of fair value for an investment may also differ from the prices obtained by other persons (including other mutual funds) for the investment.
Valuation Measurements: Various inputs are used in determining the value of the Fund’s investments. These inputs are summarized in the three levels listed below.
Level 1: Quoted prices in active markets for identical investments.
Level 2: Other significant observable inputs (including quoted prices for similar investments, interest rates, prepayment rates, credit risk, etc.).
Level 3: Significant unobservable inputs (including the Fund’s own assumptions in determining the fair value of investments).
The following table displays a summary of the inputs used to value the Fund’s net assets as of March 31, 2010. In any instance when valuation inputs from more than one level are used to determine the fair value of a specific investment, the investment is placed in the level of the table based upon the lowest level input that is significant in determining the fair value of the investment:
| | | | | | | | | | | | | | |
| | | Fair Value Measurements at March 31, 2010 |
| | | Total | | | Level 1 | | | Level 2 | | Level 3 |
Assets | | | | | | | | | | | | | | |
Investments in Securities* | | | | | | | | | | | | | | |
Common Stock | | $ | 10,696,725 | | | $ | 10,696,725 | | | $ | — | | $ | — |
| | | | | | | | | | | | | | |
Total Investments in Securities | | $ | 10,696,725 | | | $ | 10,696,725 | | | $ | — | | $ | — |
Other Financial Instruments** | | | | | | | | | | | | | | |
Spot Currency | | $ | 114 | | | $ | 114 | | | $ | — | | $ | — |
Liabilities | | | | | | | | | | | | | | |
Other Financial Instruments** | | | | | | | | | | | | | | |
Spot Currency | | $ | (3,028 | ) | | $ | (3,028 | ) | | $ | — | | $ | — |
| * | See Schedule of Investments for a summary of the industry exposure as grouped according to the Global Industry Classification Standard (GICS), which is an industry taxonomy developed by Morgan Stanley Capital International (MSCI), and Standard & Poor’s (S&P). |
| ** | Other Financial Instruments include investments not reflected in the Schedule of Investments, such as futures, forwards and swap contracts, which are valued at the unrealized appreciation (depreciation) on the instrument. |
Foreign Currency Translation: Portfolio securities and other assets and liabilities denominated in foreign currencies are translated into U.S. dollars based on the exchange rate of such currencies against the U.S. dollar on the date of valuation. Purchases and sales of securities and income items denominated in foreign currencies are translated into U.S. dollars at the exchange rate in effect on the translation date. When the Fund purchases or sells foreign securities it may enter into a foreign exchange contract to minimize foreign exchange risk from the trade date to the settlement date of such transactions.
The Fund does not separately report the effect of changes in foreign exchange rates from changes in market prices on securities held. Such changes are included in net realized and unrealized gain or loss from investments.
16 Certified Semi-Annual Report
| | |
| NOTES TO FINANCIAL STATEMENTS, CONTINUED | | |
| |
| Thornburg Developing World Fund | | March 31, 2010 (Unaudited) |
Reported net realized foreign exchange gains or losses arise from sales of foreign currencies, currency gains or losses realized between the trade and settlement dates on securities transactions and the difference between the amounts of dividends, interest, and foreign withholding taxes recorded on the Fund’s books, and the U.S. dollar equivalent of the amounts actually received or paid.
Net unrealized foreign exchange gains and losses arise from changes in the fair value of assets and liabilities, other than investments in securities at fiscal period end, resulting from changes in exchange rates.
Deferred Taxes: The Fund is subject to a tax imposed on net realized gains of securities of certain foreign issuers. The Fund records an estimated deferred tax liability for net unrealized gains on these securities as reflected in the accompanying financial statements.
Federal Income Taxes: It is the policy of the Trust to comply with the provisions of the Internal Revenue Code applicable to “regulated investment companies” and to distribute to shareholders substantially all taxable income, including any net realized gain on investments of the Fund. Therefore, no provision for federal income taxes is required.
When-Issued and Delayed Delivery Transactions: The Fund may engage in when-issued or delayed delivery transactions. To the extent the Fund engages in such transactions, it will do so for the purpose of acquiring portfolio securities consistent with the Fund’s investment objectives and not for the purpose of investment leverage or to speculate on interest rate and/or market changes. At the time the Fund makes a commitment to purchase a security on a when-issued or delayed delivery basis, the Fund will record the transaction and reflect the value in determining its net asset value. When effecting such transactions, assets of an amount sufficient to make payment for the portfolio securities to be purchased will be segregated on the Fund’s records on the trade date. Securities purchased on a when-issued or delayed delivery basis do not earn interest until the settlement date.
Dividends: Dividends to shareholders are generally paid quarterly and are reinvested in additional shares of the Fund at net asset value per share at the close of business on the dividend payment date or, at the shareholder’s option, paid in cash. Net realized capital gains, to the extent available, will be distributed at least annually. Distributions to shareholders are based on income tax regulations and therefore, their characteristics may differ for financial statement and tax purposes.
General: Securities transactions are accounted for on a trade date basis. Interest income is accrued as earned and dividend income is recorded on the ex-dividend date. Certain income from foreign securities is recognized as soon as information is available to the Fund. Realized gains and losses from the sale of securities are recorded on an identified cost basis. Net investment income (other than class specific expenses) and realized and unrealized gains and losses are allocated daily to each class of shares based upon the relative net asset value of outstanding shares of each class of shares at the beginning of the day (after adjusting for the current share activity of the respective class). Expenses common to all funds are allocated among the funds comprising the Trust based upon their relative net asset values or other appropriate allocation methods.
Guarantees and Indemnifications: Under the Trust’s organizational documents, its officers and Trustees are indemnified against certain liabilities arising out of the performance of their duties to the Fund. Additionally, in the normal course of business the Trust enters into contracts with service providers that contain general indemnification clauses. The Trust’s maximum exposure under these arrangements is unknown. However, based on experience, the Trust expects the risk of loss to be remote.
Use of Estimates: The preparation of financial statements, in conformity with generally accepted accounting principles, requires management to make estimates and assumptions that affect the reported amounts of assets and liabilities and the disclosure of contingent assets and liabilities at the date of the financial statements and the reported amounts of increases and decreases in net assets from operations during the reporting period. Actual results could differ from those estimates.
NOTE 3 – INVESTMENT ADVISORY FEE AND OTHER TRANSACTIONS WITH AFFILIATES
Pursuant to an investment advisory agreement, Thornburg Investment Management, Inc. (the “Advisor”) serves as the investment advisor and performs services to the Fund for which the fees are payable at the end of each month. For the period ended March 31, 2010, these fees were payable at annual rates ranging from .975 of 1% to .775 of 1% per annum of the average daily net assets of the Fund depending on the Fund’s asset size. For the period ended March 31, 2010, the Advisor voluntarily or contractually agreed to waive investment advisory fees of $23,486. The Trust also has entered into administrative services agreements with the Advisor, whereby the Advisor will perform certain administrative services for the shareholders of each class of the Fund’s shares, and for which fees will
Certified Semi-Annual Report 17
| | |
| NOTES TO FINANCIAL STATEMENTS, CONTINUED | | |
| |
| Thornburg Developing World Fund | | March 31, 2010 (Unaudited) |
be payable at an annual rate of up to .125 of 1% per annum of the average daily net assets attributable to each class of shares. For the period ended March 31, 2010, the Advisor voluntarily or contractually agreed to reimburse certain class specific expenses, administrative fees, and distribution fees of $7,212 for Class A shares, $8,831 for Class C shares, and $9,716 for Class I shares.
The Trust has an underwriting agreement with Thornburg Securities Corporation (the “Distributor,” an affiliate of the Advisor), which acts as the distributor of the Fund’s shares. For the period ended March 31, 2010, the Distributor has advised the Fund that it earned commissions aggregating $2,161 from the sale of Class A shares, and collected no contingent deferred sales charges from redemptions of Class C shares of the Fund.
Pursuant to a service plan under Rule 12b-1 of the Investment Company Act of 1940, the Fund may reimburse to the Advisor an amount not to exceed .25 of 1% per annum of the average daily net assets attributable to each class of shares of the Fund for payments made by the Advisor to securities dealers and other financial institutions to obtain various shareholder and distribution related services. The Advisor may pay out of its own resources additional expenses for distribution of the Fund’s shares.
The Trust has also adopted distribution plans pursuant to Rule 12b-1, applicable only to the Fund’s Class C shares under which the Fund compensates the Distributor for services in promoting the sale of Class C shares of the Fund at an annual rate of up to .75 of 1% per annum of the average daily net assets attributable to Class C shares. Total fees incurred by the Distributor for each class of shares of the Fund under their respective Service and Distribution Plans for the period ended March 31, 2010, are set forth in the Statement of Operations.
The Trust has an agreement with the custodian bank to indirectly pay a portion of the custodian’s fees through credits earned by the Fund’s cash on deposit with the bank. This deposit agreement is an alternative to overnight investments. Custodial fees have been adjusted to reflect amounts that would have been paid without this agreement, with a corresponding adjustment reflected as fees paid indirectly in the Statement of Operations. For the period ended March 31, 2010, fees paid indirectly were $121.
Certain officers and Trustees of the Trust are also officers and/or directors of the Advisor and Distributor. The compensation of independent Trustees is borne by the Trust.
NOTE 4 – SHARES OF BENEFICIAL INTEREST
At March 31, 2010, there were an unlimited number of shares of beneficial interest authorized. Transactions in shares of beneficial interest were as follows:
| | | | | | | |
| | | Period Ended*
March 31, 2010 (Unaudited) | |
| | | Shares | | | Amount | |
Class A Shares | | | | | | | |
Shares sold | | 309,900 | | | $ | 3,682,064 | |
Shares issued to shareholders in reinvestment of dividends | | — | | | | — | |
Shares repurchased | | (9,556 | ) | | | (118,638 | ) |
Redemption fees received** | | — | | | | 27 | |
| | | | | | | |
| | |
Net Increase (Decrease) | | 300,344 | | | $ | 3,563,453 | |
| | | | | | | |
| | |
Class C Shares | | | | | | | |
Shares sold | | 47,527 | | | $ | 570,533 | |
Shares issued to shareholders in reinvestment of dividends | | — | | | | — | |
Shares repurchased | | — | | | | — | |
Redemption fees received** | | — | | | | 5 | |
| | | | | | | |
| | |
Net Increase (Decrease) | | 47,527 | | | $ | 570,538 | |
| | | | | | | |
18 Certified Semi-Annual Report
| | |
| NOTES TO FINANCIAL STATEMENTS, CONTINUED | | |
| |
| Thornburg Developing World Fund | | March 31, 2010 (Unaudited) |
| | | | | | | |
| | | Period Ended*
March 31, 2010 (Unaudited) | |
| | | Shares | | | Amount | |
Class I Shares | | | | | | | |
Shares sold | | 556,039 | | | $ | 6,661,648 | |
Shares issued to shareholders in reinvestment of dividends | | — | | | | — | |
Shares repurchased | | (823 | ) | | | (9,427 | ) |
Redemption fees received** | | — | | | | 63 | |
| | | | | | | |
| | |
Net Increase (Decrease) | | 555,216 | | | $ | 6,652,284 | |
| | | | | | | |
| * | Fund commenced operations on December 16, 2009. |
| ** | The Fund charges a redemption fee of 1% of the Class A and Class I shares redeemed or exchanged within 30 days of purchase. Redemption fees charged to any class are allocated to all classes upon receipt of payment based on relative net asset values of each class or other appropriate allocation methods. |
NOTE 5 – SECURITIES TRANSACTIONS
For the period ended March 31, 2010, the Fund had purchase and sale transactions of investment securities (excluding short-term investments) of $11,970,011 and $1,940,146, respectively.
NOTE 6 – INCOME TAXES
At March 31, 2010, information on the tax components of capital is as follows:
| | | | |
Cost of investments for tax purposes | | $ | 10,033,203 | |
| | | | |
Gross unrealized appreciation on a tax basis | | $ | 739,047 | |
Gross unrealized depreciation on a tax basis | | | (75,525 | ) |
| | | | |
Net unrealized appreciation (depreciation) on investments (tax basis) | | $ | 663,522 | |
| | | | |
NOTE 7 – DERIVATIVE FINANCIAL INSTRUMENTS WITH OFF-BALANCE SHEET RISK AND FOREIGN INVESTMENT RISK
The Fund may use a variety of derivative financial instruments to hedge or adjust the risks affecting its investment portfolio or to enhance investment returns. Provisions of FASB Accounting Standards Codification ASC 815-10-50, (“ASC 815”) require certain disclosures. The new requirement amends and expands disclosures related to derivative instruments to provide users of financial statements with an enhanced understanding of the use of derivative instruments by the Fund and how these derivatives affect the financial position, financial performance and cash flows of the Fund. The Fund does not designate any derivative instruments as hedging instruments under ASC 815. During the period ended March 31, 2010, the Fund’s principal exposure to derivative financial instruments of the type addressed by ASC 815 was investment in foreign exchange contracts. A foreign exchange contract is an agreement between two parties to exchange different currencies at a specified rate of exchange at an agreed upon future date. Foreign exchange contracts involve risks to the Fund, including the risk that a contract counterparty will not meet its obligations to the Fund, the risk that a change in a contract’s value may not correlate perfectly with the currency the contract was intended to track, and the risk that the Fund’s advisor is unable to correctly implement its strategy in using a contract. In any such instance, the Fund may not achieve the intended benefit of entering into a contract, and may experience a loss.
The Fund did not enter into any forward currency contracts during the period ended March 31, 2010.
OTHER NOTES
Fund management believes no events have occurred between March 31, 2010 and May 20, 2010, the date of issuance of the financial statements, that require adjustment of, or disclosure in, the accompanying financial statements.
Certified Semi-Annual Report 19
| | |
| FINANCIAL HIGHLIGHTS | | |
| |
| Thornburg Developing World Fund | | |
| | | | | | | | | | | | | | | | | | | | | | | | | | | | | | | | | | | | | | |
| | | PER SHARE PERFORMANCE (for a share outstanding throughout the period)+ | | RATIOS TO AVERAGE NET ASSETS | | | SUPPLEMENTAL DATA |
Unless
Otherwise
Noted, Periods
are Fiscal Years
Ended Sept. 30, | | Net Asset
Value
Beginning
of Period | | Net
Investment
Income
(Loss) | | | Net
Realized
& Unrealized
Gain (Loss)
on
Investments | | Total from
Investment
Operations | | Dividends
from Net
Investment
Income | | Dividends
from Net
Realized
Gains | | Total
Dividends | | Net Asset
Value
End of
Period | | Net
Investment
Income
(Loss) (%) | | | Expenses,
After
Expense
Reductions
(%) | | | Expenses,
After
Expense
Reductions
and Net of
Custody
Credits
(%) | | | Expenses,
Before Expense
Reductions
(%) | | | Total
Return
(%)(a) | | Portfolio
Turnover
Rate (%) | | Net Assets
at End of
Period
(Thousands) |
Class A Shares | | | | | | | | | | | | | | | | | | | | | | | | | | | | | | | | | | | | | | |
2010(b)(c)(d) | | $ | 11.94 | | 0.02 | | | 0.68 | | 0.70 | | — | | — | | — | | $ | 12.64 | | 0.55 | (e) | | 1.78 | (e) | | 1.78 | (e) | | 3.91 | (e) | | 5.86 | | 24.74 | | $ | 3,798 |
Class C Shares | | | | | | | | | | | | | | | | | | | | | | | | | | | | | | | | | | | | | | |
2010(b)(c) | | $ | 11.94 | | (0.01 | ) | | 0.70 | | 0.69 | | — | | — | | — | | $ | 12.63 | | (0.37 | )(e) | | 2.39 | (e) | | 2.38 | (e) | | 11.37 | (e)(f) | | 5.78 | | 24.74 | | $ | 600 |
Class I Shares | | | | | | | | | | | | | | | | | | | | | | | | | | | | | | | | | | | | | | |
2010(b)(c) | | $ | 11.94 | | 0.03 | | | 0.70 | | 0.73 | | — | | — | | — | | $ | 12.67 | | 0.79 | (e) | | 1.10 | (e) | | 1.09 | (e) | | 2.80 | (e) | | 6.11 | | 24.74 | | $ | 7,033 |
| (a) | Not annualized for periods less than one year. |
| (b) | Fund commenced operations on December 16, 2009. |
| (c) | Unaudited Period Ended March 31. |
| (d) | Sales loads are not reflected in computing total return. |
| (f) | Due to the size of net assets and fixed expenses, ratios may appear disproportionate. |
| + | Based on weighted average shares outstanding. |
See notes to financial statements.
| | |
| 20 Certified Semi-Annual Report | | Certified Semi-Annual Report 21 |
| | |
| EXPENSE EXAMPLE | | |
| |
| Thornburg Developing World Fund | | March 31, 2010 (Unaudited) |
As a shareholder of the Fund, you incur two types of costs:
| | (1) | transaction costs, including |
(a) sales charges (loads) on purchase payments for Class A shares;
(b) a deferred sales charge on redemptions of any part or all of a purchase of $1 million of Class A shares within 12 months of purchase;
(c) a deferred sales charge on redemptions of Class C shares within 12 months of purchase;
(d) a 30-day redemption fee on Class A and Class I shares;
| | (2) | ongoing costs, including management fees; distribution and/or service (12b-1) fees; and other Fund expenses. |
This example is intended to help you understand your ongoing costs (in dollars) of investing in the Fund and to compare these costs with the ongoing costs of investing in other mutual funds.
The example is based on a $1,000 investment beginning on October 1, 2009, and held until March 31, 2010.
ACTUAL EXPENSES
For each class of shares, the first line of the table at right provides information about actual account values and actual expenses. You may use the information in this line, together with the amount you invested, to estimate the expenses that you paid over the period. Simply divide your account value by $1,000 (for example, an $8,600 account value divided by $1,000 = 8.6), then multiply the result by the number in the first line for your class of shares under the heading entitled “Expenses Paid During Period” to estimate the expenses you paid on your account during this period.
HYPOTHETICAL EXAMPLE FOR COMPARISON PURPOSES
For each class of shares, the second line of the table at right provides information about hypothetical account values and hypothetical expenses based on the Fund’s actual expense ratio and an assumed rate of return of 5% per year before expenses, which is not the Fund’s actual return. The hypothetical account values and expenses may not be used to estimate the actual ending account balance or expenses you paid for the period. You may use this information to compare the ongoing costs of investing in the Fund and other funds. To do so, compare this 5% hypothetical example with the 5% hypothetical examples that appear in the shareholder reports of the other funds.
Please note that the expenses shown in the table are meant to highlight your ongoing costs only and do not reflect any transactional costs, such as sales charges (loads), redemption fees, or exchange fees. Therefore, the second line of the table for each class of shares is useful in comparing ongoing costs only, and will not help you determine the relative total costs of owning different funds. In addition, if these transactional costs were included, your costs would have been higher.
| | | | | | | | | |
| | | Beginning
Account Value
10/1/09 | | Ending
Account Value
3/31/10 | | Expenses Paid
During Period†
10/1/09–3/31/10 |
Class A Shares | | | | | | | | | |
Actual | | $ | 1,000.00 | | $ | 1,100.62 | | $ | 9.30 |
Hypothetical* | | $ | 1,000.00 | | $ | 1,016.08 | | $ | 8.93 |
Class C Shares | | | | | | | | | |
Actual | | $ | 1,000.00 | | $ | 1,099.24 | | $ | 12.46 |
Hypothetical* | | $ | 1,000.00 | | $ | 1,013.06 | | $ | 11.94 |
Class I Shares | | | | | | | | | |
Actual | | $ | 1,000.00 | | $ | 1,052.45 | | $ | 5.72 |
Hypothetical* | | $ | 1,000.00 | | $ | 1,019.50 | | $ | 5.49 |
| † | Expenses are equal to the annualized expense ratio for each class (A: 1.78%; C: 2.38%; I: 1.09%) multiplied by the average account value over the period, multiplied by 182/365 to reflect the one-half year period. |
| * | Hypothetical assumes a rate of return of 5% per year before expenses. |
22 Certified Semi-Annual Report
| | |
| OTHER INFORMATION | | |
| |
| Thornburg Developing World Fund | | March 31, 2010 (Unaudited) |
PORTFOLIO PROXY VOTING
Policies and Procedures:
The Trust has delegated to Thornburg Investment Management, Inc. (the “Advisor”) voting decisions respecting proxies for the Fund’s voting securities. The Advisor makes voting decisions in accordance with its Proxy Voting Policy and Procedures. A description of the Policy and Procedures is available (i) without charge, upon request, by calling the Advisor toll-free at 1-800-847-0200, (ii) on the Thornburg web site at www.thornburg.com, and (iii) on the Securities and Exchange Commission’s web site at www.sec.gov.
No proxy voting information is currently available because the Fund commenced operations on December 16, 2009. The Fund expects to begin making annual proxy voting information available in accordance with applicable regulations commencing on or before August 31, 2010. This information is available (i) without charge, upon request by calling the Advisor toll-free at 1-800-847-0200, (ii) on the Thornburg web site at www.thornburg.com, and (iii) on the Securities and Exchange Commission’s web site at www.sec.gov.
AVAILABILITY OF QUARTERLY PORTFOLIO SCHEDULE
The Fund files with the Securities and Exchange Commission schedules of its portfolio holdings on Form N-Q for the first and third quarters of each fiscal year. The Fund’s Forms N-Q are available on the Commission’s web site at www.sec.gov, or may be reviewed and copied at the Commission’s Public Reference Room in Washington, D.C. Information on the operation of the Public Reference Room may be obtained by calling 1-800-SEC-0330. The Fund also makes this information available on its web site at www.thornburg. com/download or upon request by calling 1-800-847-0200.
Certified Semi-Annual Report 23
Trustees’ Statement to Shareholders
Not part of the Certified Semi-Annual Report
February 8, 2005, as readopted July 22, 2009
The Trustees are concerned that ongoing commentaries and opinions reported in the media may confuse investors in general as to the supervisory duties of trustees of mutual funds and, in particular, leave Thornburg Investment Trust shareholders uncertain regarding how we discharge our responsibilities in supervising the Funds’ investment advisor and in reviewing the advisor’s contract for renewal. We decided to spell out clearly three principal guidelines that we follow in supervising the Trust’s investment advisor on your behalf.
We begin with the premise that each shareholder selected his or her Fund because its investments are managed by the investment advisor identified in the prospectus and in accordance with the objective and policies described in the prospectus. We realize, as each of you do, that if you believe that your Fund’s stated objective and policies no longer serve your personal investment goals, you can sell your shares and leave the Fund.
Therefore, we believe that our primary supervisory task – our principal obligation to you – is to assess the nature and quality of the advisor’s services, and to confirm that the advisor actively and competently pursues the Fund’s objective, in accordance with the policies set out in the prospectus. To do this, we meet regularly with management to review your Fund’s portfolio and to discuss the advisor’s specific actions and judgments in pursuing the Fund’s objective. We do not substitute our own judgment for the advisor’s decisions in selecting investments; the advisor is paid to exercise its informed judgment on investment decisions, and we seek to confirm, in reviewing the advisor’s performance, that the advisor is doing just that.
Second, while we are conscious of costs and the effect that costs have on shareholders’ returns, we do not seek the lowest fees or expense ratio as our sole or primary objective. We try to make sure that your Fund’s fees and costs are reasonable in relationship to the services rendered and that they are generally in line with those charged by other expert investment advisors, consistent with our belief that the Fund’s investors searched for and expect that expertise and attention and have decided to pay a reasonable price for it. We do not put the management contract “out to bid” as a matter of course, and we would not do so unless we had concluded that the advisor materially had failed to pursue the Fund’s objectives in accordance with its policies, or for other equally important reasons. We believe that any other approach would be inconsistent with your interests and contrary to your expectations when you bought shares of the Fund in the first place.
Finally, because we believe that most Thornburg Fund shareholders have invested with a long-term perspective, we try not to focus too much on the fashions of the moment and on short-term performance. The market will not favor any specific investment objective or set of policies at all times and under all economic circumstances. A fund will experience periods of both high and low returns relative to other funds and other investments. Even if one of our Funds is not favored by the market at a particular time, we believe that the advisor is nonetheless obliged to remain true to the Fund’s objective and policies, and we watch to see that it does so.
24 This page is not part of the Semi-Annual Report.
Retirement and Education Accounts
Thornburg Investment Management offers retirement and education savings accounts that can help you meet a variety of planning challenges. For account applications or further information on any of the accounts below, please call 1-800-847-0200 or go to www.thornburg.com/ira. Your financial advisor can help you determine which plan is right for you.
Individual Retirement Accounts
Individual Retirement Accounts (IRAs) provide a tax-advantaged means to save money for the future. For a detailed outline of the difference between retirement accounts, see www.thornburg.com/ira. Rollovers are available. Call 1-800-847-0200 for more information.
Traditional IRAs – Contributions to Traditional IRAs are tax deductible for eligible individuals, and withdrawals are taxed as additional ordinary income. You may contribute to an IRA if you receive compensation and are under 70 1/ 2, even if you are covered by an employer retirement plan. Deductible contributions are subject to certain qualifications. Please consult your tax advisor.
Roth IRAs – Under a Roth IRA, there is no tax deduction for contributions, but there is no income tax on qualified withdrawals. For a more detailed comparison of Traditional and Roth IRAs, please see our web site at www.thornburg.com/ira.
SEP IRAs – Simplified Employee Pension (SEP) IRAs are established by employers. The employer is allowed a tax deduction for contributions made to the SEP Plan and makes contributions to each eligible employee’s SEP IRA on a discretionary basis.
SIMPLE IRAs – Savings Incentive Match Plan for Employees of Small Employers (SIMPLE) is designed to give small business owners a simplified method to establish and contribute to a retirement plan for employees. The employer is allowed a tax deduction for contributions and makes either matching or non-elective contributions to each eligible employee’s SIMPLE IRA. Employees may make salary deferral contributions.
Coverdell Education Savings Account
These savings accounts are designed to provide a way to save money for higher education expenses. In an Education Savings Account, earnings and interest grow tax-free, and qualified withdrawals used to pay for eligible higher-education expenses are tax- and penalty-free.
Funds Available
The following funds are available in the accounts listed above:
| | • | | Thornburg International Value Fund |
| | • | | Thornburg Core Growth Fund |
| | • | | Thornburg Investment Income Builder Fund |
| | • | | Thornburg Global Opportunities Fund |
| | • | | Thornburg International Growth Fund |
| | • | | Thornburg Developing World Fund |
| | • | | Thornburg Limited Term U.S. Government Fund |
| | • | | Thornburg Limited Term Income Fund |
| | • | | Thornburg Strategic Income Fund |
This page is not part of the Semi-Annual Report. 25
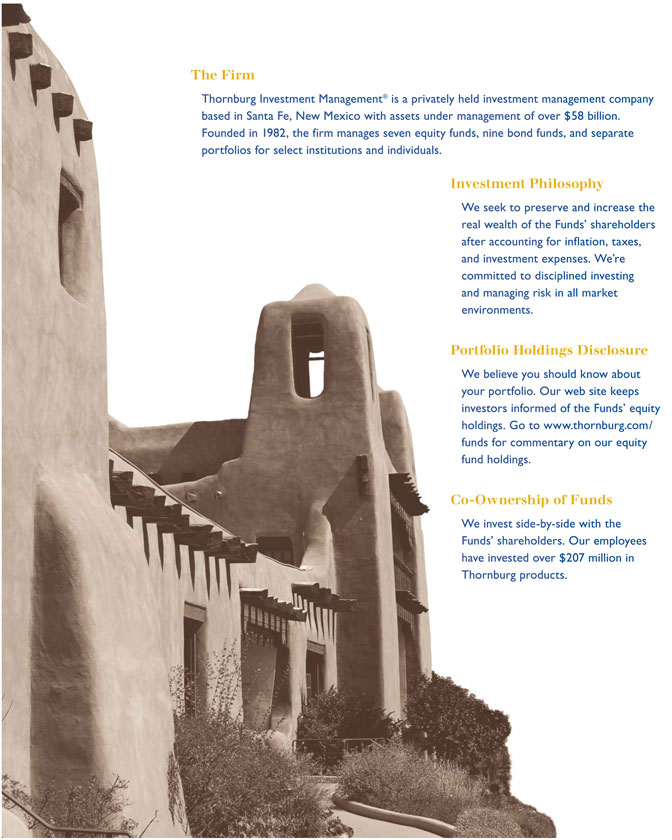
26 This page is not part of the Semi-Annual Report.
Thornburg Equity Funds
Thornburg’s equity research uses a fundamental and comprehensive analytical approach. Thornburg equity funds focus on a limited number of securities so that each holding can impact performance. The equity team searches for firms believed to have a promising future and seeks to buy shares of those companies at a discount to their intrinsic value.
| | • | | Thornburg International Value Fund |
| | • | | Thornburg Core Growth Fund |
| | • | | Thornburg Investment Income Builder Fund |
| | • | | Thornburg Global Opportunities Fund |
| | • | | Thornburg International Growth Fund |
| | • | | Thornburg Developing World Fund |
Thornburg Bond Funds
Thornburg Investment Management applies a disciplined philosophy to fixed-income management. Since the launch of our first fixed-income fund over 25 years ago, we have been conducting fundamental, bottom-up research in an effort to identify bonds which we believe provide the best return for a given level of risk. We are very organic in our approach, avoiding leverage or complex strategies which could backfire in periods of market uncertainty.
| | • | | Thornburg Limited Term Municipal Fund |
| | • | | Thornburg Intermediate Municipal Fund |
| | • | | Thornburg California Limited Term Municipal Fund |
| | • | | Thornburg New Mexico Intermediate Municipal Fund |
| | • | | Thornburg New York Intermediate Municipal Fund |
| | • | | Thornburg Strategic Municipal Income Fund |
| | • | | Thornburg Limited Term U.S. Government Fund |
| | • | | Thornburg Limited Term Income Fund |
| | • | | Thornburg Strategic Income Fund |
Before investing, carefully consider the Fund’s investment goals, risks, charges, and expenses. For a prospectus containing this and other information, contact your financial advisor or visit thornburg. com. Read it carefully before investing.
For additional information, please visit www.thornburg.com
Thornburg Investment Management, Inc. 2300 North Ridgetop Road, Santa Fe, NM 87506
This page is not part of the Semi-Annual Report. 27
| | | | | | |
 | | Waste not, | |  |
| | Wait not | |
| | | | Get instant access to your shareholder reports. |
| | |
| | This Semi-Annual Report is submitted for the general information of shareholders of the Fund. It is not authorized for distribution to prospective investors in the Fund unless preceded or accompanied by an effective prospectus. | | By switching from your postal mailbox to your email inbox, you reduce paper clutter, improve record keeping access, and help conserve our natural resources. |

| | Investment Advisor: | | Go to www.thornburg.com/edelivery and sign up to receive your shareholder reports, prospectuses, and proxy statements electronically. |
| | Thornburg Investment Management® 800.847.0200 | |
| | Distributor: | | |
| | Thornburg Securities Corporation® 800.847.0200 | | You invest in the future, without spending a dime. |
| | TH2148 | | |
Effective December 6, 2009, Thornburg Investment Trust amended its Code of Business Conduct and Ethics to prohibit contributions, or solicitations for contributions, by any officer or Trustee of the Trust who is an employee, officer or director of the Trust’s investment advisor, to any political campaign in which an independent Trustee is a candidate.
| Item 3. | Audit Committee Financial Expert |
Not applicable.
| Item 4. | Principal Accountant Fees and Services |
Not applicable.
| Item 5. | Audit Committee of Listed Registrants |
Not applicable.
| Item 6. | Schedule of Investments |
Filed as part of the reports to shareholders filed under item 1 of this Form.
| Item 7. | Disclosure of Proxy Voting Policies and Procedures for Closed-End Management Investment Companies |
Not applicable.
| Item 8. | Portfolio Managers of Closed-End Management Investment Companies |
Not applicable.
| Item 9. | Purchases of Equity Securities by Closed-End Management Investment Companies and Affiliated Purchasers. |
Not applicable.
| Item 10. | Submission of Matters to a Vote of Security Holders |
The authority to consider candidates recommended by the shareholders in accordance with the Trust’s Procedures for Shareholder Communications is committed to the Governance and Nominating Committee.
| Item 11. | Controls and Procedures |
(a) The principal executive officer and the principal financial officer have concluded that Thornburg Investment Trust’s disclosure controls and procedures provide reasonable assurance that material information relating to Thornburg Investment Trust is made known to them by the appropriate persons, based on their evaluation of these controls and procedures as of a date within 90 days prior to the filing date of this report.
(b) There was no change in Thornburg Investment Trust’s internal control over financial reporting that occurred during the registrant’s second fiscal quarter of the period covered by this report (that is, the registrant’s second fiscal quarter) that has materially affected, or is reasonably likely to materially affect, the registrant’s internal control over financial reporting.
| (a) | (1) Code of Business Conduct and Ethics, as revised to December 6, 2009. |
| (a) | (2) Certifications pursuant to Rule 30a-2(a) under the Investment Company Act of 1940 (17 CFR 70.30a-2(a)) attached hereto as Exhibit 99.CERT. |
| (b) | Certification pursuant to Section 906 of the Sarbanes-Oxley Act of 2002 and Rule 30a-2(b) under the Investment Company Act of 1940 (17 CFR 70.30a-2(b)) attached hereto as Exhibit 99.906CERT. |
SIGNATURES
Pursuant to the requirements of the Securities Exchange Act of 1934 and the Investment Company Act of 1940, the registrant has duly caused this report to be signed on its behalf by the undersigned, thereunto duly authorized.
Thornburg Investment Trust, in respect of the following Thornburg Funds: Limited Term Municipal Fund, Intermediate Municipal Fund, Strategic Municipal Income Fund, California Limited Term Municipal Fund, New Mexico Intermediate Municipal Fund, New York Intermediate Municipal Fund, Limited Term U.S. Government Fund, Limited Term Income Fund, Strategic Income Fund, Value Fund, International Value Fund, Core Growth Fund, International Growth Fund, Investment Income Builder Fund, Global Opportunities Fund, and Developing World Fund.
| | |
| By: | | /s/ BRIAN J. MCMAHON |
| | Brian J. McMahon |
| | President and principal executive officer |
| |
| Date: | | May 20, 2010 |
Pursuant to the requirements of the Securities Exchange Act of 1934 and the Investment Company Act of 1940, this report has been signed below by the following persons on behalf of the registrant and in the capacities and on the dates indicated.
| | |
By: | | /s/ BRIAN J. MCMAHON |
| | Brian J. McMahon |
| | President and principal executive officer |
| |
| Date: | | May 20, 2010 |
| |
| By: | | /s/ GEORGE T. STRICKLAND |
| | George T. Strickland |
| | Treasurer and principal financial officer |
| |
| Date: | | May 20, 2010 |
Item 12(a)(1)
Exhibit 99.ETHICS
THORNBURG INVESTMENT TRUST
CODE OF BUSINESS CONDUCT AND ETHICS
September 10, 2003
as revised to December 6, 2009
Introduction
Honesty and integrity are hallmarks of Thornburg Investment Trust (the “Trust”). We pride ourselves on maintaining the highest standards of ethics and conduct in all of our business relationships. This Code of Business Conduct and Ethics covers a wide range of business practices and procedures and applies to the officers and Trustees of the Trust in their conduct of the business and affairs of the Trust. It does not cover every issue that may arise, but it sets out basic principles to guide the officers and Trustees of the Trust in discharging their duties for the Trust. This Code has been adopted by the Trustees of the Trust with the objectives of deterring wrongdoing and promoting (1) honest and ethical conduct, including the ethical handling of actual or apparent conflicts of interest between personal and professional relationships, (2) full, fair, accurate, timely and understandable disclosure in reports and documents which the Trust files with the Securities and Exchange Commission and in other public communications made by the Trust, (3) compliance with applicable governmental laws, rules and regulations, (4) prompt internal reporting of violations of this Code, and (5) accountability for adherence to this Code.
This Code is intended as a code of ethics under Section 406 of the Sarbanes-Oxley Act of 2002 and Item 2 of Form N-CSR under the Investment Company Act of 1940, and is specifically applicable to the principal executive officer, principal financial officer, and principal accounting officer (or persons performing similar functions, whether or not as officers or employees of the Trust) of the Trust (each a “Covered Officer”).
All records and reports created or maintained pursuant to this Code are intended solely for the internal use of the Trust, are confidential, and in no event constitute an admission by any person as to any fact, circumstance or legal conclusion.
Compliance with Laws, Rules and Regulations
The Trust expects its officers and Trustees to comply with all laws, rules and regulations applicable to the Trust’s operations and business. Officers and Trustees should seek guidance whenever they are in doubt as to the applicability of any law, rule or regulation regarding any contemplated course of action. The Trust and its investment adviser hold information and training sessions to promote compliance with laws, rules and regulations, including insider-trading laws. Please consult the various guidelines and policies which the Trust has prepared in accordance with specific laws and regulations. A good guideline, if in doubt on a course of action, is “Always ask first, act later—if you are unsure of what to do in any situation, seek guidance before you act.”
As a registered investment company, we are subject to regulation by the Securities and Exchange Commission, and compliance with federal, state and local laws. The Trust and its Trustees insist on strict compliance with the spirit and the letter of these laws and regulations.
Conflicts of Interest
Each officer and Trustee of the Trust should be scrupulous in avoiding any conflict of interest or appearance of such a conflict with regard to the Trust’s interests. A “conflict of interest” occurs when an individual’s private interest interferes with the interests of the Trust. The appearance of a conflict occurs for purposes of this Code when an individual enters into a transaction, has a relationship with or receives a benefit from a third party, or engages in any other conduct, which would cause an unrelated observer to reasonably conclude that an actual conflict exists. A conflict may arise when an officer or Trustee pursues interests that prevent the individual from performing his duties to the Trust objectively and effectively. A conflict also may arise when an officer or Trustee or member of the individual’s family receives undisclosed, improper benefits as a result of the individual’s position with the Trust. The appearance of a conflict may arise when an individual or his family member has a relationship with a person who does business with the Trust or its investment adviser. Any conflict of interest that arises in a specific situation or transaction must be disclosed by the individual and resolved before taking any action.
Matters involving a conflict of interest or appearance of a conflict are prohibited as a matter of Trust policy, except when approved by the Trustees or the Trust’s audit committee for any Covered Officer or Trustee, or except when approved by the Trust’s president for any other individual. Conflicts of interest may not always be evident, and individuals should consult with higher levels of management or the Trust’s legal counsel if they are uncertain about any situation. In no event, however, shall investment in any security made in accordance with the Trust’s Policy on Personal Securities Transactions (or comparable policy or code then in effect) be considered a conflict of interest with the Trust.
Corporate Opportunities
Officers and Trustees shall not take for themselves personally opportunities that are discovered through the use of their position with the Trust, except with the approval of the Trustees or the Trust’s audit committee for any Covered Officer or Trustee, or except with the approval by the Trust’s president for any other individual. Officers and Trustees owe a duty to the Trust to advance its legitimate interests when the opportunity to do so arises. In no event, however, shall investment in any security made in accordance with the Trust’s Policy on Personal Securities Transactions (or comparable policy or code then in effect) be considered a business opportunity of the Trust.
Confidentiality
Officers and Trustees shall exercise care in maintaining the confidentiality of any confidential information respecting the Trust, except where disclosure is authorized or legally mandated. Officers and Trustees should consult with the Trust’s legal counsel if they believe they have a legal obligation to disclose confidential information. Confidential information includes non-public information of the Trust that may be helpful to competitors, or otherwise harmful to the Trust or its shareholders. The obligation to preserve confidentiality of this information continues after association with the Trust ends.
2
Fair Dealing
Officers and Trustees should endeavor to deal fairly with the Trust’s shareholders, service providers and competitors, and shall not seek unfair advantage through improper concealment, abuse of improperly acquired confidential information, misrepresentation of material facts when the other party is known by the officer or Trustee to rely justifiably on the individual to disclose those facts truthfully, or improper and unfair dealing.
Business Gifts and Entertainment
The purpose of business entertainment and gifts in a commercial setting is to create goodwill and sound working relationships, not to gain unfair advantage. No gift or entertainment should ever be offered, given, provided or accepted by any officer or Trustee in connection with the Trust’s business unless it (1) is not a cash gift, (2) is consistent with customary business practices, (3) is not excessive in value, (4) cannot be construed as a bribe, payoff or kickback and (5) does not violate any laws or regulations.
Protection and Proper Use of Trust Assets
All officers and Trustees should endeavor to protect the Trust’s assets and pursue their efficient investment in accordance with the Trust’s business purposes and declaration of trust. Any suspected incident of fraud or theft should be immediately reported for investigation.
The obligation of officers and Trustees to protect the Trust’s assets includes its proprietary information. Proprietary information includes intellectual property such as trademarks and copyrights, as well as business, marketing and service plans, databases, records, salary information and any unpublished financial data and reports. Unauthorized use or distribution of this information violates this Code.
Insider Trading
All officers and Trustees should pay particular attention to potential violations of insider trading laws. Insider trading is both unethical and illegal and will be dealt with decisively if it occurs. Officers and Trustees are expected to familiarize themselves with the Policy Statement on Insider Trading, adopted by the Trust’s investment adviser. If they have questions about these guidelines, they should consult with the Trust’s president, the investment adviser’s compliance office, or the Trust’s legal counsel.
Certain Political Contributions Proscribed
Contributions or solicitations for contributions, by any officer or Trustee of the Trust who is an employee, officer or director of the Trust’s investment advisor or distributor, to any political campaign in which an independent Trustee is a candidate, are prohibited. This prohibition does not apply to (i) a contribution by an independent Trustee to a political campaign of another independent Trustee, or (ii) a solicitation by an independent Trustee for the political campaign of another independent Trustee if the solicitation is made to an individual with whom the soliciting Trustee has some relationship, or to an individual who either has a relationship with the candidate Trustee or who would be expected to have an interest in the outcome of the campaign.
3
Reporting Illegal or Unethical Behavior
The Trustees encourage each officer to talk to senior officers, the investment adviser’s compliance officers, or the Trustees about observed illegal or unethical behavior, or when the officer is in doubt about the best course of action in a particular situation. Officers should report actual and suspected violations of laws, rules, regulations or this Code to appropriate personnel. If an individual does not believe it appropriate or is not comfortable approaching senior officers or the investment adviser’s compliance officers about their concerns, then the individual may contact any member of the Trust’s audit committee. If the individual’s concerns require confidentiality, then this confidentiality will be protected, subject to applicable law, regulation or legal proceedings. The Trust will not permit retaliation of any kind by or on behalf of the Trust or its officers and Trustees against good faith reports or complaints of violations of this Code or other illegal or unethical conduct.
Reporting and Disclosure
As a registered investment company, it is of critical importance that the Trust’s filings with the Securities and Exchange Commission contain full, fair, accurate, timely and understandable disclosure. Each officer and Trustee should become familiar with the disclosure laws and regulations applicable to the Trust, consistent with the individual’s authority and duties. Depending on the Trust, each officer and Trustee may be called upon to provide necessary information to ensure that the Trust’s public reports are complete, fair and understandable. The Trustees expect officers and Trustees to take this responsibility very seriously and to provide prompt and accurate answers to inquiries related to the Trust’s public disclosure requirements. Officers may be asked to certify as to the accuracy of all responses and information provided for inclusion in the Trust’s public reports and filings.
Recordkeeping
The Trust requires accurate recording and reporting of information in order to make responsible business decisions. The Trustees expect each of the Trust’s officers, consistent with the officer’s individual authority and duties, to maintain the Trust’s books, records, accounts and financial statements in reasonable detail, and to appropriately reflect the Trust’s transactions in conformity with applicable legal requirements and the Trust’s system of internal controls.
Accounting and Financial Reporting Concerns
The Trust seeks to comply with all applicable financial reporting and accounting regulations applicable to the Trust. Officers who have concerns or complaints regarding questionable accounting or auditing matters or procedures involving the Trust are encouraged to submit those concerns or complaints to the Trust’s audit committee which will, subject to its duties arising under applicable law, regulations and legal proceedings, treat such submissions confidentially. These submissions may be directed to the attention of the audit committee chairman, or any Trustee who is a member of the audit committee, at the principal executive offices of the Trust or at the Trustee’s residence address.
4
Waivers of the Code of Business Conduct and Ethics
Any waiver of this Code for any Covered Officer or Trustee may be made only by the Trustees or the Trust’s audit committee and will be promptly disclosed as required by law or by Securities and Exchange Commission regulations. Waivers of this Code for any other individual may be made by the president only upon the individual’s making full disclosure in advance of the transaction in question. This Code may be amended or modified at any time by the Trustees.
| History: | Approved and adopted by Trustees of Thornburg Investment Trust on September 10, 2003, effective the same date; amended effective July 20, 2005 to revise provisions respecting conflicts of interest; amended effective December 6, 2009 to add a paragraph respecting campaign contributions. |
5
Item 12(a)(2)
Exhibit 99.CERT
CERTIFICATION
I, Brian J. McMahon, certify that:
1. I have reviewed this report on Form N-CSR of Thornburg Investment Trust;
2. Based on my knowledge, this report does not contain any untrue statement of a material fact or omit to state a material fact necessary to make the statements made, in light of the circumstances under which such statements were made, not misleading with respect to the period covered by this report;
3. Based on my knowledge, the financial statements, and other financial information included in this report, fairly present in all material respects the financial condition, results of operations, changes in net assets, and cash flows (if the financial statements are required to include a statement of cash flows) of the registrant as of, and for, the periods presented in this report;
4. The registrant’s other certifying officer(s) and I are responsible for establishing and maintaining disclosure controls and procedures (as defined in Rule 30a-3(c) under the Investment Company Act of 1940) and internal control over financial reporting (as defined in Rule 30a-3(d) under the Investment Company Act of 1940) for the registrant and have:
(a) Designed such disclosure controls and procedures, or caused such disclosure controls and procedures to be designed under our supervision, to ensure that material information relating to the registrant, including its consolidated subsidiaries, is made known to us by others within those entities, particularly during the period in which this report is being prepared;
(b) Designed such internal control over financial reporting, or caused such internal control over financial reporting to be designed under our supervision, to provide reasonable assurance regarding the reliability of financial reporting and the preparation of financial statements for external purposes in accordance with generally accepted accounting principles;
(c) Evaluated the effectiveness of the registrant’s disclosure controls and procedures and presented in this report our conclusions about the effectiveness of the disclosure controls and procedures, as of a date within 90 days prior to the filing date of this report based on such evaluation; and
(d) Disclosed in this report any change in the registrant’s internal control over financial reporting that occurred during the second fiscal quarter of the period covered by this report that has materially affected, or is reasonably likely to materially affect, the registrant’s internal control over financial reporting; and
5. The registrant’s other certifying officer(s) and I have disclosed to the registrant’s auditors and the audit committee of the registrant’s board of directors (or persons performing the equivalent functions):
(a) All significant deficiencies and material weaknesses in the design or operation of internal control over financial reporting which are reasonably likely to adversely affect the registrant’s ability to record, process, summarize, and report financial information; and
(b) Any fraud, whether or not material, that involves management or other employees who have a significant role in the registrant’s internal control over financial reporting.
Dated: May 20, 2010
/s/ Brian J. McMahon
Brian J. McMahon
President and principal executive officer
Item 12(a)(2)
Exhibit 99.CERT
CERTIFICATION
I, George T. Strickland, certify that:
1. I have reviewed this report on Form N-CSR of Thornburg Investment Trust;
2. Based on my knowledge, this report does not contain any untrue statement of a material fact or omit to state a material fact necessary to make the statements made, in light of the circumstances under which such statements were made, not misleading with respect to the period covered by this report;
3. Based on my knowledge, the financial statements, and other financial information included in this report, fairly present in all material respects the financial condition, results of operations, changes in net assets, and cash flows (if the financial statements are required to include a statement of cash flows) of the registrant as of, and for, the periods presented in this report;
4. The registrant’s other certifying officer(s) and I are responsible for establishing and maintaining disclosure controls and procedures (as defined in Rule 30a-3(c) under the Investment Company Act of 1940) and internal control over financial reporting (as defined in Rule 30a-3(d) under the Investment Company Act of 1940) for the registrant and have:
(a) Designed such disclosure controls and procedures, or caused such disclosure controls and procedures to be designed under our supervision, to ensure that material information relating to the registrant, including its consolidated subsidiaries, is made known to us by others within those entities, particularly during the period in which this report is being prepared;
(b) Designed such internal control over financial reporting, or caused such internal control over financial reporting to be designed under our supervision, to provide reasonable assurance regarding the reliability of financial reporting and the preparation of financial statements for external purposes in accordance with generally accepted accounting principles;
(c) Evaluated the effectiveness of the registrant’s disclosure controls and procedures and presented in this report our conclusions about the effectiveness of the disclosure controls and procedures, as of a date within 90 days prior to the filing date of this report based on such evaluation; and
(d) Disclosed in this report any change in the registrant’s internal control over financial reporting that occurred during the second fiscal quarter of the period covered by this report that has materially affected, or is reasonably likely to materially affect, the registrant’s internal control over financial reporting; and
5. The registrant’s other certifying officer(s) and I have disclosed to the registrant’s auditors and the audit committee of the registrant’s board of directors (or persons performing the equivalent functions):
(a) All significant deficiencies and material weaknesses in the design or operation of internal control over financial reporting which are reasonably likely to adversely affect the registrant’s ability to record, process, summarize, and report financial information; and
(b) Any fraud, whether or not material, that involves management or other employees who have a significant role in the registrant’s internal control over financial reporting.
Dated: May 20, 2010
/s/ George T. Strickland
George T. Strickland
Treasurer and principal financial officer
Item 12(b)
Exhibit 99.906CERT
Certification Pursuant to Section 906 of the Sarbanes-Oxley Act of 2002 (subsections (a) and (b) of
section 1350, chapter 63 of title 18, United States Code)
In connection with the attached Report on Form N-CSR of Thornburg Investment Trust in respect of the following Thornburg Funds: Limited Term Municipal Fund, Intermediate Municipal Fund, Strategic Municipal Income Fund, California Limited Term Municipal Fund, New Mexico Intermediate Municipal Fund, New York Intermediate Municipal Fund, Limited Term U.S. Government Fund, Limited Term Income Fund, Strategic Income Fund, Value Fund, International Value Fund, Core Growth Fund, International Growth Fund, Investment Income Builder Fund, Global Opportunities Fund, and Developing World Fund (hereafter referred to as the “Funds”) to be filed with the Securities and Exchange Commission (the “Report”), each of the undersigned officers of the Trust does hereby certify pursuant to Section 906 of the Sarbanes-Oxley Act of 2002 that, to the best of such officer’s knowledge:
1. The Report fully complies with the requirements of 13(a) or 15(d) of the Securities Exchange Act of 1934; and
2. The information contained in the Report fairly presents, in all material respects, the financial condition and results of operations of Thornburg Investment Trust, in respect of the Funds as of, and for, the periods presented in the Report.
Dated: May 20, 2010
/s/ Brian J. McMahon
Brian J. McMahon
President and principal executive officer
Dated: May 20, 2010
/s/ George T. Strickland
George T. Strickland
Treasurer and principal financial officer
A signed original of this written statement required by Section 906, or other document authenticating, acknowledging, or otherwise adopting the signature that appears in typed form within the electronic version of this written statement required by Section 906, has been provided to the Trust and will be retained by the Trust and furnished to the Securities and Exchange Commission or its staff upon request.
This certification is being furnished solely pursuant to Section 906 of the Sarbanes-Oxley Act of 2002 and is not being filed as part of the Report or as a separate disclosure document.