UNITED STATES
SECURITIES AND EXCHANGE COMMISSION
Washington, D.C. 20549
FORM N-CSR
CERTIFIED SHAREHOLDER REPORT OF REGISTERED MANAGEMENT INVESTMENT COMPANIES
Investment Company Act file number 811-05201
Thornburg Investment Trust
(Exact name of registrant as specified in charter)
c/o Thornburg Investment Management, Inc.
2300 North Ridgetop Road, Santa Fe, New Mexico 87506
(Address of principal executive offices) (Zip code)
Garrett Thornburg, 2300 North Ridgetop Road, Santa Fe, New Mexico 87506
(Name and address of agent for service)
Registrant’s telephone number, including area code: 505-984-0200
Date of fiscal year end: September 30, 2011
Date of reporting period: March 31, 2011
| Item 1. | Reports to Stockholders |
The following annual reports are attached hereto, in order:
Thornburg Limited Term Municipal Fund
Thornburg Intermediate Municipal Fund
Thornburg Strategic Municipal Income Fund
Thornburg California Limited Term Municipal Fund
Thornburg New Mexico Intermediate Municipal Fund
Thornburg New York Intermediate Municipal Fund
Thornburg Limited Term Income Funds
Thornburg Strategic Income Fund
Thornburg Value Fund
Thornburg International Value Fund
Thornburg Core Growth Fund
Thornburg International Growth Fund
Thornburg Investment Income Builder Fund
Thornburg Global Opportunities Fund
Thornburg Developing World Fund

Important Information
The information presented on the following pages is current as of March 31, 2011. The managers’ views, portfolio holdings, and sector diversification are provided for the general information of the Fund’s shareholders; they are historical and subject to change. This material should not be deemed a recommendation to buy or sell any of the securities mentioned.
Investments in the Fund carry risks, including possible loss of principal. Bond funds have the same interest rate, inflation, and credit risks that are associated with the underlying bonds. The principal value of bonds will fluctuate relative to changes in interest rates, decreasing when interest rates rise. Unlike bonds, bond funds have ongoing fees and expenses. Please see the Fund’s Prospectus for a discussion of the risks associated with an investment in the Fund. Investments in the Fund are not FDIC insured, nor are they deposits of or guaranteed by a bank or any other entity. There is no guarantee that the Fund will meet its investment objectives. The laddering strategy does not assure or guarantee better performance and cannot eliminate the risk of investment losses.
Performance data given at net asset value (NAV) does not take into account applicable sales charges. If the sales charges had been included, the performance would have been lower. Minimum investments for Class I shares are higher than those for other classes. Class I shares may not be available to all investors.
| | | | |
Share Class | | NASDAQ Symbol | | Cusip |
Class A | | LTMFX | | 885-215-459 |
Class C | | LTMCX | | 885-215-442 |
Class I | | LTMIX | | 885-215-434 |
Lipper Fund Award 2011
Thornburg Limited Term Municipal Fund, Class I Shares, was granted a Lipper Fund Award for the ten-year period ended 12/31/10, among 22 Short-Intermediate Municipal Debt Funds. Lipper Fund Awards are granted annually to the fund in each Lipper classification that consistently delivered the strongest risk-adjusted performance (calculated with dividends reinvested). Awards are given for three-year, five-year, and ten-year periods. The fund did not win the awards for other time periods.
Glossary
Barclays Capital Five-Year Municipal Bond Index – A rules-based, market-value-weighted index of the tax-exempt bond market. To be included in the index, bonds must have a minimum credit rating of Baa. The approximate maturity of the municipal bonds in the index is five years.
Barclays Capital Municipal Bond Index – The Municipal Index covers the USD-denominated, investment-grade, long-term, tax-exempt bond market. The index has four main sectors: state and local general obligation bonds, revenue bonds, insured bonds, and prerefunded bonds.
Unless otherwise noted, index returns reflect the reinvestment of income dividends and capital gains, if any, but do not reflect fees, brokerage commissions or other expenses of investing. Investors may not make direct investments into any index.
Alternative Minimum Tax (AMT) – A federal tax aimed at ensuring that high-income individuals, estates, trusts, and corporations pay a minimal level income tax. For individuals, the AMT is calculated by adding tax preference items to regular taxable income.
Annualized Distribution Yield – The distribution yield is calculated by taking the sum of the month’s total distribution factors and dividing this sum by a 30-day period and annualizing to a 360-day year. The value is then divided by the ending maximum offering price per share to arrive at the annualized distribution yield. The yield is calculated on a periodic basis and is subject to change.
Basis Point (BPS) – A unit equal to 1/100th of 1%. 1% = 100 basis points (bps).
Bond Credit Ratings – A bond credit rating assesses the financial ability of a debt issuer to make timely payments of principal and interest. Ratings of AAA (the highest), AA, A, and BBB are investment-grade quality. Ratings of BB, B, CCC, CC, C, and D (the lowest) are considered below investment grade, speculative grade, or junk bonds. Unless otherwise noted, the ratings listed are from Municipal Market Data and are a combination of ratings from Standard and Poor’s, Moody’s Investors Service, and Fitch Ratings.
Build America Bonds (BAB) – Taxable municipal bonds that feature tax credits and/or federal subsidies for bondholders and state and local government bond issuers. Build America Bonds (BABs) were introduced in 2009 as part of President Obama’s American Recovery and Reinvestment Act to create jobs and stimulate the economy. BABs attempt to achieve this by lowering the cost of borrowing for state and local governments in financing new projects.
Capacity Utilization – The extent to which an enterprise or a nation actually uses its installed productive capacity. Capacity utilization reflects overall growth and demand in the economy, rising when the economy is vibrant, and falling when demand softens. High capacity utilization also exerts inflationary pressures as scarce resources are in higher demand. However, it may also lead to new capital investments, such as new plants, that promote growth in the future.
Consumer Price Index (CPI) – An index that measures prices of a fixed basket of goods bought by a typical consumer, including food, transportation, shelter, utilities, clothing, medical care, entertainment and other items. The CPI, published by the Bureau of Labor Statistics in the
This page is not part of the Semi-Annual Report. 3
Important Information, Continued
Department of Labor, is based at 100 in 1982 and is released monthly. It is widely used as a cost-of-living benchmark to adjust Social Security payments and other payment schedules, union contracts and tax brackets. The CPI is also known as the cost-of-living index.
Core CPI – Consumer Price Index minus the energy and food components.
Effective Duration – A bond’s sensitivity to interest rates, incorporating the embedded option features, such as call provisions. Bonds with longer durations experience greater price volatility than bonds with shorter durations.
Fed Funds Rate – The interest rate at which a depository institution lends immediately available funds (balances at the Federal Reserve) to another depository institution overnight.
General Obligation Bond – A municipal bond backed by the credit and “taxing power” of the issuing jurisdiction rather than the revenue from a given project.
M2 – The amount of money in circulation in notes and coin plus non-interest-bearing bank deposits, building-society deposits, and National Savings accounts.
QE2 or Quantitative Easing 2 – The second round of the Federal Reserve’s monetary policy used to stimulate the U.S. economy following the recession that began in 2007/08. QE2 was initiated in the fourth quarter of 2010 in order to jump-start the sluggish economic recovery.
SEC Yield – SEC Yield is computed in accordance with SEC standards measuring the net investment income per share over a specified 30-day period expressed as a percentage of the maximum offering price of the Fund’s shares at the end of the period.
Taylor Rule – A monetary-policy formula that provides an indication of how much the central bank would or should change the nominal interest rate in response to divergences of actual inflation rates from target inflation rates and of actual Gross Domestic Product (GDP) from potential GDP. It was first proposed by the U.S. economist John B. Taylor in 1993. The Federal Reserve Board may not use the Taylor Rule in setting monetary policy.
Treasury Inflation Protected Securities (TIPS) – Either a U.S. Treasury note or bond that offers protection from the effects of inflation. Using the Consumer Price Index as a guide, the value of the principal is adjusted to reflect the effects of inflation. A fixed interest rate is paid semi-annually on the adjusted amount. At maturity, if inflation has increased the value of the principal, the investor receives the higher value. If deflation has decreased the value, the investor receives the original face amount of the security.
4 This page is not part of the Semi-Annual Report.
Thornburg Limited Term Municipal Fund
At Thornburg, our approach to management of the Fund is based on the premise that investors in the Fund seek preservation of capital along with an attractive, relatively stable yield. While aggressive bond strategies may generate stronger returns when the market is turning a blind eye towards risk, they usually fail to stack up over longer periods of time.
We apply time-tested techniques to manage risk and provide attractive returns. These include:
| | • | | Building a laddered portfolio. Laddering has been shown over time to mitigate price and interest rate risk. |
| | • | | Investing on a cash-only basis without using leverage. While leveraged strategies may enhance returns when market conditions are favorable, they can quickly compound losses when sentiment shifts. |
| | • | | Conducting in-depth fundamental research on each issue and actively monitoring positions for subsequent credit events. |
| | • | | Diversifying among a large number of generally high-quality bonds. |
IMPORTANT PERFORMANCE INFORMATION
Performance data shown represents past performance and is no guarantee of future results. Investment return and principal value will fluctuate so shares, when redeemed, may be worth more or less than their original cost. Current performance may be lower or higher than quoted. For performance current to the most recent month end, visit thornburg.com or call 800.847.0200.
The maximum sales charge for the Fund’s Class A shares is 1.50% . The total annual fund operating expense of Class A shares is 0.78%, as disclosed in the most recent Prospectus.
AVERAGE ANNUAL TOTAL RETURNS
For periods ended March 31, 2011
| | | | | | | | | | | | | | | | | | | | |
| | | 1 Yr | | | 3 Yrs | | | 5 Yrs | | | 10 Yrs | | | Since
Inception | |
A Shares (Incep: 9/28/84) | | | | | | | | | | | | | | | | | | | | |
Without sales charge | | | 2.56 | % | | | 4.03 | % | | | 4.00 | % | | | 3.62 | % | | | 5.45 | % |
With sales charge | | | 1.04 | % | | | 3.50 | % | | | 3.69 | % | | | 3.46 | % | | | 5.39 | % |
30-DAY YIELDS, A SHARES
As of March 31, 2011
| | | | | | |
Annualized
Distribution Yield | | | SEC
Yield | |
| | 2.56 | % | | | 2.24 | % |
KEY PORTFOLIO ATTRIBUTES
As of March 31, 2011
| | | | |
Number of Bonds | | | 1,200 | |
Effective Duration | | | 4.0 Yrs | |
Average Maturity | | | 5.0 Yrs | |
See the entire portfolio in the Schedule of Investments beginning on page 10.
This page is not part of the Semi-Annual Report. 5

Thornburg Limited Term Municipal Fund
March 31, 2011
Table of Contents
This report is certified under the Sarbanes-Oxley Act of 2002, which requires that public companies, including mutual funds, affirm that the information provided in their annual and semiannual shareholder reports fully and fairly represents their financial position.
6 Certified Semi-Annual Report
Letter to Shareholders
| | |


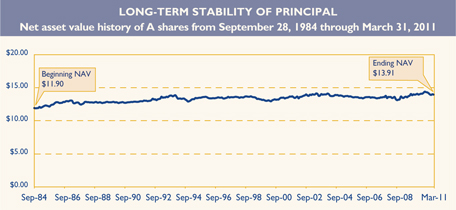
| | April 13, 2011 Dear Fellow Shareholder: We are pleased to present the semi-annual report for the Thornburg Limited Term Municipal Fund. The net asset value (NAV) of the Class A shares declined from $14.27 to $13.91 during the six months ended March 31, 2011. If you were invested with us for the entire period, you received dividends of 17.8 cents per share. If you reinvested your dividends, you received 17.9 cents per share. Dividends per share were lower for Class C shares and higher for Class I shares to account for varying class-specific expenses. The first quarter of 2011 witnessed a supply lull in the municipal bond market, delivering the lightest quarter for new deals in eleven years. It followed a huge volume of deals that were brought to market in the last quarter of 2010. In addition to the light new deal calendar in the first quarter of 2011, average daily trading volume was low, measuring $11.6 billion, down 15% from the prior year. Today, conditions in the municipal bond market are characterized by low yields for short-term bonds, combined with a steep yield curve (the difference between long- and short-term interest rates), resulting in relatively more attractive yields for intermediate- and long-term bonds. Today’s municipal yield curve is the steepest in 20 years. In the last six months, rates rose, shifting upward by 56 basis points for five-year maturities and by 81 basis points for 10-year maturities. This additional steepening of the yield curve caused longer maturity municipal bond funds to underperform shorter maturity municipal bond funds. Credit spreads are wide, relative to historical averages, with single-A municipal bonds paying on average 110 basis points more than AAA bonds at the end of March 2011. Municipal bond fund investors have been in redemption mode for the past six months, following approximately 22 months of net inflows into municipal bond funds that reversed in late November 2010. Large market outflows were prompted by default fears and falling mutual fund NAVs, but since January 2011, these concerns have abated somewhat. At this point, bond fund outflows industry wide have slowed from a peak of almost $4 billion weekly to around $500 million as this is written. Recent legislation has created both positive and negative forces for the performance of municipal bonds. The expiration of the Build America Bond program at the end of 2010 has not led to sharp growth in tax-exempt volume, as some had forecast. In 2010, Congress extended the Bush tax cuts another two years, so the top marginal tax rate remains at 35%, rather than escalating to 39.6%, which would have created yet more demand for tax-exempt income. Over the years we have seen many tax reform proposals come and go. Currently, a batch of new proposals is blanketing |
Certified Semi-Annual Report 7
| | |
| Letter to Shareholders, | | |
| |
Continued | | |
Washington, DC. If any of the proposals gain real traction, we will gauge the impact on our portfolio and seek to make appropriate adjustments.
The U.S. economic picture over the last six months has strengthened, but there remains a large degree of slack. Increased economic activity is reflected in the current 2.5% to 3.0% Gross Domestic Product (GDP) growth rate and healthy sales indicators. Unemployment remains high at 8.8%, though payroll growth was encouraging in February and March 2011, when we saw the best back-to-back increases since the recession’s official end in June 2009. Capacity utilization is still low at 76%, leaving excess capacity in the economy. Year over year, the Consumer Price Index (CPI) is currently around 2.0% to 2.5%, much higher than the core CPI rate which is only 1.1% to 1.25% . Meanwhile, the difference between 10-year TIPS yields and 10-year Treasuries is running around 2.7%, which is often viewed as a market opinion of 10-year inflation expectations. We expect QE2, the second phase of quantitative easing, to end abruptly in June 2011.
We are becoming more optimistic about the fiscal outlook for state and local governments. We have been pleased to see a rebound in revenues in most states, driven by growth in income tax and sales tax revenue. Revenues at the state and local level have seen moderate growth over the past six months, providing support for credit ratings and overall credit quality. A preliminary report from the Rockefeller Institute stated that overall state tax revenue grew 6.9% in the fourth quarter of 2010, with 41 states reporting higher revenue.
Default rates have not spiked, as was forecast last year by some, though there’s little doubt that more defaults will occur, most likely in sectors tied to real estate development, retirement communities, and health care. Some cities, particularly in the Midwest, are experiencing population declines which can undermine the tax base.
The Fed is still in super-stimulative mode with the fed funds rate at nearly 0% since December 2008, which is viewed as appropriate according to the Taylor Rule, which currently indicates the fed funds rate should be negative 1.45% . The Taylor Rule is a formula guideline for evaluating the level of the fed funds rate created by Stanford University economist John Taylor. M2, a broad measure of money and money substitutes, has grown only 4% in the last year, at the lower end of the 3% to 10% annual growth rate that has prevailed over the last decade. Velocity of M2, the degree to which money turns over (a contributor to inflation), has remained muted.
Your Fund contains a laddered portfolio of 1,200 municipal bonds. Your Fund is broadly diversified across sectors and 83% invested in bonds rated A or above by at least one of the major rating agencies. We ladder the maturity dates of our bonds so that some of the bonds are scheduled to mature during each of the coming years. Laddering short and intermediate bonds accomplishes two goals. First, the staggered bond maturities contained in a ladder reduce interest-rate risk and dampen the Fund’s price volatility. Second, laddering gives the Fund a steady cash-flow stream from maturing bonds to reinvest toward the top end of the ladder where yields are higher. The chart on the right describes the percentages of your Fund’s bond portfolio maturing in each of the coming years.
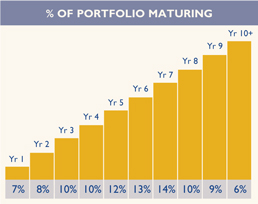
As of 3/31/11. Percentages vary over time.
Data may not add up to 100% due to rounding.
8 Certified Semi-Annual Report
The Class A shares of your Fund produced a total return of negative 1.28% at NAV for the six months ended March 31, 2011, compared to negative 0.96% for the Barclays Capital Five-Year Municipal Bond Index. The total return of the overall municipal bond market as measured by the Barclays Capital Municipal Index for the six months ended March 31, 2011 was negative 3.68% . This period included a negative 4.17% return in the fourth quarter of 2010, the worst of any quarter since 1994.
Rising interest rates were the primary driver of these negative returns. In addition, the Fund’s benchmark Barclays Capital Five-Year Municipal Bond Index consists of 4- to 6-year bonds only, while your Fund consists primarily of bonds ranging from 0 to 10 years and a few longer-term bonds. Since interest rates rose in the period, and longer-term bonds incur more price deterioration when rates rise, the index benefited relative to your Fund by having no exposure to 7- to 10-year bonds.
Historically, our practice of laddering a diversified portfolio of short- and intermediate-maturity bonds has allowed your Fund to perform consistently well in varying interest rate environments. Thank you for investing in Thornburg Limited Term Municipal Fund.
Sincerely,
| | | | |
 | |  | |  |
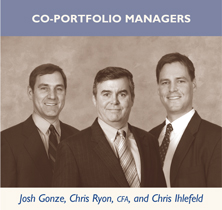
| Christopher Ihlefeld | | Christopher Ryon,CFA | | Josh Gonze |
| Co-Portfolio Manager | | Co-Portfolio Manager | | Co-Portfolio Manager |
| Managing Director | | Managing Director | | Managing Director |
The matters discussed in this report may constitute forward-looking statements made pursuant to the safe harbor provisions of the Securities Litigation Reform Act of 1995. These include any advisor or portfolio manager prediction, assessment, analysis or outlook for individual securities, industries, investment styles, market sectors and/or markets. These statements involve risks and uncertainties. In addition to the general risks described for each fund in its current prospectus, other factors bearing on these reports include the accuracy of the advisor’s or portfolio manager’s forecasts and predictions, the appropriateness of the investment strategies designed by the advisor or portfolio manager and the ability of the advisor or portfolio manager to implement their strategies efficiently and successfully. Any one or more of these factors, as well as other risks affecting the securities markets generally, could cause the actual results of any fund to differ materially as compared to its benchmarks.
Certified Semi-Annual Report 9
| | |
| SCHEDULE OF INVESTMENTS | | |
| |
| Thornburg Limited Term Municipal Fund | | March 31, 2011 (Unaudited) |
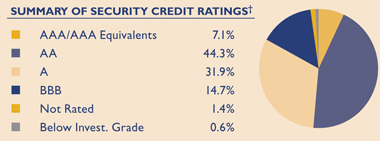
We have used ratings from Standard & Poor’s (S&P). Where S&P ratings are not available, we have used Moody’s Investors Service. Where neither rating is available, we have used ratings from Fitch Ratings. The category of investments identified as “AAA” in this graph includes investments which are pre-refunded or escrowed to maturity. Such investments are backed by an escrow or trust containing sufficient U.S. Government or U.S. Government agency securities to satisfy the timely payment of principal and interest and, therefore, are normally deemed to be equivalent to AAA-rated securities.
| | | | | | | | | | |
Issuer-Description | | Credit Rating†
S&P/ Moody’s | | Principal
Amount | | | Value | |
ALABAMA — 2.06% | | | | | | | | | | |
Alabama State Public School & College Authority, 5.00% due 5/1/2012 | | AA/Aa1 | | $ | 2,000,000 | | | $ | 2,095,700 | |
Alabama State Public School & College Authority, 5.00% due 5/1/2013 | | AA/Aa1 | | | 5,000,000 | | | | 5,419,300 | |
Alabama State Public School & College Authority, 5.00% due 5/1/2015 | | NR/Aa1 | | | 8,530,000 | | | | 9,580,896 | |
Alabama State Public School & College Authority, 5.00% due 5/1/2016 | | AA/Aa1 | | | 5,000,000 | | | | 5,662,050 | |
Birmingham GO, 5.00% due 10/1/2013 (Insured: Natl-Re) | | AA/Aa2 | | | 2,500,000 | | | | 2,699,700 | |
Birmingham GO, 5.00% due 2/1/2015 | | AA/Aa2 | | | 4,240,000 | | | | 4,622,914 | |
Birmingham GO, 4.00% due 8/1/2015 | | AA/Aa2 | | | 3,005,000 | | | | 3,177,908 | |
Birmingham GO, 5.00% due 2/1/2016 | | AA/Aa2 | | | 3,775,000 | | | | 4,120,186 | |
Birmingham GO, 4.00% due 8/1/2016 | | AA/Aa2 | | | 3,645,000 | | | | 3,815,039 | |
Birmingham GO, 5.00% due 2/1/2017 | | AA/Aa2 | | | 2,045,000 | | | | 2,222,690 | |
Birmingham GO, 4.00% due 8/1/2017 | | AA/Aa2 | | | 2,760,000 | | | | 2,846,222 | |
Birmingham GO, 5.00% due 2/1/2018 | | AA/Aa2 | | | 2,000,000 | | | | 2,199,200 | |
Courtland Solid Waste Disposal Revenue, 4.75% due 5/1/2017 (International Paper Company) | | BBB/NR | | | 5,000,000 | | | | 4,976,350 | |
Huntsville GO, 5.50% due 11/1/2014 pre-refunded 5/1/2012 | | AAA/Aaa | | | 3,425,000 | | | | 3,680,026 | |
Lake Martin Area IDA, 5.00% due 11/1/2011 (County Guaranty) | | NR/NR | | | 3,000,000 | | | | 3,039,420 | |
Mobile GO Warrants, 5.25% due 8/1/2012 (Insured: AGM) | | AA+/Aa2 | | | 1,025,000 | | | | 1,087,597 | |
Mobile GO Warrants, 4.50% due 8/15/2016 | | NR/NR | | | 1,890,000 | | | | 1,948,552 | |
Mobile GO Warrants, 5.00% due 2/15/2019 | | AA-/Aa2 | | | 2,000,000 | | | | 2,159,560 | |
Mobile Industrial Development PCR, 5.00% due 6/1/2034 put 3/19/2015 (Alabama Power Co.) | | A/A2 | | | 6,000,000 | | | | 6,552,120 | |
Montgomery Waterworks & Sanitation, 5.00% due 9/1/2016 | | AAA/Aa2 | | | 2,080,000 | | | | 2,358,762 | |
Montgomery Waterworks & Sanitation, 5.00% due 9/1/2019 | | AAA/Aa2 | | | 3,375,000 | | | | 3,720,701 | |
University of Alabama at Birmingham Hospital Revenue, 5.25% due 9/1/2017 | | A+/A1 | | | 2,500,000 | | | | 2,681,525 | |
University of Alabama at Birmingham Hospital Revenue, 5.00% due 9/1/2018 | | A+/A1 | | | 1,500,000 | | | | 1,579,650 | |
ALASKA — 0.96% | | | | | | | | | | |
Alaska Energy Power Authority, 6.00% due 7/1/2011 (Bradley Lake Hydroelectric; Insured: AGM) | | AA+/Aa2 | | | 4,040,000 | | | | 4,091,631 | |
Alaska Energy Power Authority, 6.00% due 7/1/2011 (Bradley Lake Hydroelectric; Insured: AGM) | | AA+/Aa2 | | | 955,000 | | | | 967,205 | |
Alaska Energy Power Authority, 6.00% due 7/1/2013 (Bradley Lake Hydroelectric; Insured: AGM) | | AA+/Aa2 | | | 1,600,000 | | | | 1,743,984 | |
Alaska Housing Finance Corp. GO, 5.00% due 12/1/2018 (Insured: Natl-Re) | | AA+/Aa2 | | | 2,000,000 | | | | 2,193,860 | |
Alaska Industrial Development & Export Authority GO, 5.00% due 4/1/2014 | | AA-/Aa3 | | | 2,000,000 | | | | 2,176,660 | |
Alaska Industrial Development & Export Authority GO, 5.00% due 4/1/2015 | | AA-/Aa3 | | | 1,900,000 | | | | 2,086,808 | |
Alaska Industrial Development & Export Authority GO, 5.00% due 4/1/2016 | | AA-/Aa3 | | | 1,000,000 | | | | 1,105,180 | |
Alaska Industrial Development & Export Authority GO, 5.00% due 4/1/2017 | | AA-/Aa3 | | | 3,000,000 | | | | 3,310,080 | |
Alaska Industrial Development & Export Authority GO, 5.00% due 4/1/2018 | | AA-/Aa3 | | | 2,455,000 | | | | 2,691,932 | |
Alaska Municipal Bond Bank, 5.00% due 6/1/2014 (Insured: Natl-Re) (State Aid Withholding) | | A+/Aa2 | | | 1,175,000 | | | | 1,285,979 | |
Alaska Student Loan Corp., 5.25% due 1/1/2012 (Insured: AGM) | | AA+/NR | | | 3,000,000 | | | | 3,094,050 | |
North Slope Boro GO, 5.00% due 6/30/2015 (Insured: Natl-Re) | | AA-/Aa3 | | | 3,250,000 | | | | 3,666,617 | |
North Slope Boro GO, 5.00% due 6/30/2017 (Insured: Natl-Re) | | AA-/Aa3 | | | 8,800,000 | | | | 10,000,408 | |
10 Certified Semi-Annual Report
| | |
| SCHEDULE OF INVESTMENTS, CONTINUED | | |
| |
| Thornburg Limited Term Municipal Fund | | March 31, 2011 (Unaudited) |
| | | | | | | | | | | | |
Issuer-Description | | Credit Rating†
S&P/ Moody’s | | | Principal
Amount | | | Value | |
ARIZONA — 3.78% | | | | | | | | | | | | |
Arizona Board of Regents COP, 5.00% due 7/1/2018 (Arizona State University; Insured: Natl-Re) | | | AA-/A1 | | | $ | 1,285,000 | | | $ | 1,367,497 | |
Arizona Board of Regents COP, 5.00% due 7/1/2019 (Arizona State University; Insured: Natl-Re) | | | AA-/A1 | | | | 3,735,000 | | | | 3,935,308 | |
Arizona HFA, 5.25% due 1/1/2018 (Banner Health) | | | A+/NR | | | | 3,500,000 | | | | 3,775,660 | |
Arizona HFA, 5.00% due 7/1/2018 (Catholic Health Care West) | | | A/A2 | | | | 1,470,000 | | | | 1,538,076 | |
Arizona HFA, 5.00% due 7/1/2019 (Catholic Health Care West) | | | A/A2 | | | | 1,365,000 | | | | 1,411,028 | |
Arizona HFA, 5.00% due 7/1/2020 (Catholic Health Care West) | | | A/A2 | | | | 1,290,000 | | | | 1,323,218 | |
Arizona Lottery Revenue, 5.00% due 7/1/2018 (Insured: AGM) | | | AA+/Aa3 | | | | 8,370,000 | | | | 9,137,110 | |
Arizona Lottery Revenue, 5.00% due 7/1/2020 (Insured: AGM) | | | AA+/Aa3 | | | | 8,000,000 | | | | 8,501,600 | |
Arizona Transportation Board Highway Revenue, 5.25% due 7/1/2015 | | | AAA/Aaa | | | | 3,860,000 | | | | 4,139,194 | |
Chandler Street & Highway User Revenue, 3.00% due 7/1/2013 | | | AA/Aa2 | | | | 1,905,000 | | | | 1,981,314 | |
Chandler Street & Highway User Revenue, 3.00% due 7/1/2014 | | | AA/Aa2 | | | | 2,790,000 | | | | 2,913,178 | |
Glendale IDA, 5.00% due 5/15/2015 (Midwestern University) | | | A-/NR | | | | 1,000,000 | | | | 1,083,150 | |
Glendale IDA, 5.00% due 5/15/2016 (Midwestern University) | | | A-/NR | | | | 1,325,000 | | | | 1,440,725 | |
Glendale IDA, 5.00% due 5/15/2017 (Midwestern University) | | | A-/NR | | | | 1,440,000 | | | | 1,559,707 | |
Glendale Western Loop 101 Public Facilities Corp., 6.00% due 7/1/2019 | | | AA/A2 | | | | 2,200,000 | | | | 2,317,150 | |
Maricopa County IDA Health Facilities Revenue, 4.125% due 7/1/2015 (Catholic Health Care West) | | | A/A2 | | | | 1,000,000 | | | | 1,030,820 | |
Maricopa County IDA Health Facilities Revenue, 5.00% due 7/1/2016 (Catholic Health Care West) | | | A/A2 | | | | 4,965,000 | | | | 4,969,270 | |
Maricopa County IDA Health Facilities Revenue, 5.00% due 7/1/2038 put 7/1/2014 (Catholic Health Care West) | | | A/A2 | | | | 7,500,000 | | | | 8,030,550 | |
Maricopa County Pollution Control Corp. PCR, 5.50% due 5/1/2029 put 5/1/2012 (Arizona Public Service Co.) | | | BBB-/Baa2 | | | | 10,000,000 | | | | 10,285,500 | |
Mesa Highway GO, 3.25% due 7/1/2016 | | | AA+/Aa3 | | | | 10,000,000 | | | | 10,238,800 | |
Mohave County IDA, 5.00% due 4/1/2014 (Mohave Prison LLC; Insured: Syncora) (ETM) | | | AAA/NR | | | | 3,135,000 | | | | 3,504,711 | |
Mohave County IDA, 7.25% due 5/1/2015 (Mohave Prison LLC) | | | BBB+/NR | | | | 12,100,000 | | | | 12,495,065 | |
Navajo County PCR, 5.50% due 6/1/2034 put 6/1/2014 (Arizona Public Service Co.) | | | BBB-/Baa2 | | | | 1,600,000 | | | | 1,704,448 | |
Navajo County PCR, 5.50% due 6/1/2034 put 6/1/2014 (Arizona Public Service Co.) | | | BBB-/Baa2 | | | | 2,600,000 | | | | 2,786,966 | |
Navajo County PCR, 5.75% due 6/1/2034 put 6/1/2016 (Arizona Public Service Co.) | | | BBB-/Baa2 | | | | 5,600,000 | | | | 6,090,616 | |
Northern Arizona University COP, 5.00% due 9/1/2019 (Insured: AMBAC) | | | A/A2 | | | | 3,500,000 | | | | 3,559,500 | |
Pima County IDA, 6.40% due 7/1/2013 (Arizona Charter Schools) | | | NR/Baa3 | | | | 620,000 | | | | 621,817 | |
Pima County IDA, 5.00% due 7/1/2016 (Metro Police Facility) | | | AA/Aa3 | | | | 2,500,000 | | | | 2,743,625 | |
Pima County IDA, 5.00% due 7/1/2017 (Metro Police Facility) | | | AA/Aa3 | | | | 3,000,000 | | | | 3,277,080 | |
Pima County IDA, 5.00% due 7/1/2018 (Metro Police Facility) | | | AA/Aa3 | | | | 3,285,000 | | | | 3,557,688 | |
Pima County IDA, 5.00% due 7/1/2019 (Metro Police Facility) | | | AA/Aa3 | | | | 2,000,000 | | | | 2,143,600 | |
Pima County Sewer Revenue, 4.50% due 7/1/2017 (Insured: AGM) | | | AA+/Aa3 | | | | 5,000,000 | | | | 5,417,200 | |
Pima County Sewer Revenue, 5.00% due 7/1/2018 (Insured: AGM) | | | AA+/Aa3 | | | | 5,000,000 | | | | 5,520,450 | |
Salt River Agricultural Improvement & Power District, 3.00% due 1/1/2014 | | | AA/Aa1 | | | | 11,275,000 | | | | 11,844,162 | |
Yuma Property Corp. Utility Systems Revenue, 5.00% due 7/1/2016 (Insured: Syncora) | | | A+/A1 | | | | 2,000,000 | | | | 2,200,020 | |
Yuma Property Corp. Utility Systems Revenue, 5.00% due 7/1/2018 (Insured: Syncora) | | | A+/A1 | | | | 2,130,000 | | | | 2,291,262 | |
ARKANSAS — 0.03% | | | | | | | | | | | | |
Jefferson County Hospital Improvement, 5.50% due 6/1/2011 (Jefferson Hospital Association) | | | A/NR | | | | 1,075,000 | | | | 1,082,536 | |
CALIFORNIA — 8.26% | | | | | | | | | | | | |
Alameda County COP, 5.00% due 12/1/2017 (Santa Rita Jail; Insured: AMBAC) | | | AA/NR | | | | 1,000,000 | | | | 1,100,060 | |
Anaheim Public Financing Authority, 5.25% due 10/1/2018 (Electric Systems Generation; Insured: AGM) | | | AA+/Aa3 | | | | 1,560,000 | | | | 1,642,992 | |
Calexico USD COP, 5.75% due 9/1/2013 | | | A-/NR | | | | 1,685,000 | | | | 1,778,602 | |
California Educational Facilities, 5.00% due 4/1/2017 (Pitzer College) | | | NR/A3 | | | | 1,460,000 | | | | 1,544,855 | |
California GO, 4.75% due 4/1/2018 | | | A-/A1 | | | | 1,250,000 | | | | 1,359,288 | |
Certified Semi-Annual Report 11
| | |
| SCHEDULE OF INVESTMENTS, CONTINUED | | |
| |
| Thornburg Limited Term Municipal Fund | | March 31, 2011 (Unaudited) |
| | | | | | | | | | |
Issuer-Description | | Credit Rating†
S&P/ Moody’s | | Principal
Amount | | | Value | |
California GO, 0.21% due 5/1/2034 put 4/1/2011 (LOC: Citibank N.A./California State Teachers’ Retirement System) (daily demand notes) | | A+/Aa3 | | $ | 2,970,000 | | | $ | 2,970,000 | |
California HFA, 5.50% due 2/1/2017 (Community Program; Insured: California Mortgage Insurance) | | NR/NR | | | 2,575,000 | | | | 2,731,277 | |
California HFA, 5.50% due 2/1/2018 (Community Program; Insured: California Mortgage Insurance) | | NR/NR | | | 2,715,000 | | | | 2,864,841 | |
California HFA, 5.50% due 2/1/2019 (Community Program; Insured: California Mortgage Insurance) | | NR/NR | | | 2,865,000 | | | | 2,984,786 | |
California HFA, 5.75% due 2/1/2020 (Community Program; Insured: California Mortgage Insurance) | | NR/NR | | | 1,975,000 | | | | 2,076,693 | |
California HFA, 5.75% due 2/1/2021 (Community Program; Insured: California Mortgage Insurance) | | NR/NR | | | 1,695,000 | | | | 1,768,580 | |
California HFA, 5.00% due 7/1/2027 put 7/1/2014 (Catholic Health Care West) | | A/A2 | | | 3,500,000 | | | | 3,753,225 | |
California HFA, 5.00% due 7/1/2028 put 7/1/2014 (Catholic Health Care West) | | A/A2 | | | 2,000,000 | | | | 2,144,700 | |
California State Department of Transportation COP, 5.25% due 3/1/2016 (Insured: Natl-Re) | | BBB/A2 | | | 1,000,000 | | | | 1,003,510 | |
California State Department of Water Resources Power Supply, 3.70% due 5/1/2011 (Insured: Natl-Re) | | AA-/Aa3 | | | 3,500,000 | | | | 3,509,905 | |
California State Department of Water Resources Power Supply, 5.50% due 5/1/2012 | | AA-/Aa3 | | | 2,600,000 | | | | 2,741,934 | |
California State Department of Water Resources Power Supply, 6.00% due 5/1/2013 pre-refunded 5/1/2012 | | AA-/Aa3 | | | 2,550,000 | | | | 2,729,800 | |
California State Department of Water Resources Power Supply, 5.00% due 5/1/2015 | | AA-/Aa3 | | | 5,000,000 | | | | 5,614,750 | |
California State Department of Water Resources Power Supply, 5.00% due 5/1/2016 | | AA-/Aa3 | | | 5,000,000 | | | | 5,647,650 | |
California State Economic Recovery, 5.00% due 7/1/2020 | | A+/Aa3 | | | 4,200,000 | | | | 4,560,024 | |
California State Economic Recovery GO, 5.00% due 7/1/2016 | | A+/Aa3 | | | 12,000,000 | | | | 12,116,040 | |
California State Economic Recovery GO, 5.00% due 7/1/2018 | | A+/Aa3 | | | 4,000,000 | | | | 4,469,240 | |
California State Public Works Board, 5.00% due 9/1/2016 (Regents of University of California; Insured: Natl-Re/FGIC) | | AA-/Aa2 | | | 3,000,000 | | | | 3,279,000 | |
California State Public Works Board, 5.00% due 9/1/2017 (Regents of University of California; Insured: Natl-Re/FGIC) | | AA-/Aa2 | | | 3,000,000 | | | | 3,263,010 | |
California State Public Works Board, 5.00% due 11/1/2017 (California State University Trustees) | | BBB+/Aa3 | | | 3,000,000 | | | | 3,169,890 | |
California State Public Works Board, 5.00% due 11/1/2018 (California State University Trustees) | | BBB+/Aa3 | | | 2,700,000 | | | | 2,797,227 | |
California Statewide Communities Development Authority, 5.00% due 5/15/2017 (Irvine LLC-UCI East Campus) | | NR/Baa2 | | | 2,200,000 | | | | 2,274,844 | |
California Statewide Community Development Authority, 5.00% due 6/15/2013 | | A-/A1 | | | 9,500,000 | | | | 10,116,930 | |
California Statewide Community Development Authority, 5.00% due 4/1/2019 (Kaiser Credit Group) | | A+/NR | | | 27,000,000 | | | | 28,563,840 | |
California Statewide Community Development Authority, 5.00% due 7/1/2020 (Aspire Public Schools; College for Certain LLC) | | NR/NR | | | 2,000,000 | | | | 1,871,540 | |
California Statewide Community Development Authority PCR, 4.10% due 4/1/2028 put 4/1/2013 (Southern California Edison Co.; Insured: Syncora) | | A/A1 | | | 1,000,000 | | | | 1,031,620 | |
Castaic USD GO, 0% due 5/1/2018 (Insured: Natl-Re/FGIC) | | A+/NR | | | 7,000,000 | | | | 5,063,590 | |
Centinela Valley Unified High School District GO, 4.00% due 12/1/2013 | | SP-1+/NR | | | 5,665,000 | | | | 5,883,612 | |
Central Valley Financing Authority, 5.00% due 7/1/2017 (Carson Ice) | | A+/A1 | | | 600,000 | | | | 652,590 | |
Central Valley Financing Authority, 5.00% due 7/1/2019 (Carson Ice) | | A+/A1 | | | 1,500,000 | | | | 1,599,000 | |
Chula Vista COP, 5.25% due 3/1/2018 | | A-/NR | | | 1,170,000 | | | | 1,226,429 | |
Chula Vista COP, 5.25% due 3/1/2019 | | A-/NR | | | 1,235,000 | | | | 1,278,929 | |
Clovis USD GO, 0% due 8/1/2019 (Insured: Natl-Re/FGIC) | | AA/NR | | | 2,685,000 | | | | 1,778,275 | |
Desert Sands USD COP, 5.25% due 3/1/2016 | | A+/A1 | | | 1,500,000 | | | | 1,604,985 | |
Golden State Tobacco Securitization Corp., 5.50% due 6/1/2043 pre-refunded 6/1/2013 | | AAA/Aaa | | | 2,000,000 | | | | 2,198,300 | |
Inland Valley Development Agency, 5.25% due 4/1/2013 | | A/NR | | | 2,000,000 | | | | 2,048,300 | |
Inland Valley Development Agency, 5.50% due 4/1/2014 | | A/NR | | | 2,000,000 | | | | 2,060,640 | |
Irvine Ranch Water District GO, 0.20% due 10/1/2041 put 4/1/2011 (LOC: Bank of America) (daily demand notes) | | A+/Aa3 | | | 4,200,000 | | | | 4,200,000 | |
12 Certified Semi-Annual Report
| | |
| SCHEDULE OF INVESTMENTS, CONTINUED | | |
| |
| Thornburg Limited Term Municipal Fund | | March 31, 2011 (Unaudited) |
| | | | | | | | | | |
Issuer-Description | | Credit Rating†
S&P/ Moody’s | | Principal
Amount | | | Value | |
Irvine USD, 5.25% due 9/1/2017 (Community Facilities District 86; Insured: AGM) | | AA+/NR | | $ | 5,000,000 | | | $ | 5,396,250 | |
Irvine USD, 5.25% due 9/1/2018 (Community Facilities District 86; Insured: AGM) | | AA+/NR | | | 3,000,000 | | | | 3,208,110 | |
Irvine USD, 5.25% due 9/1/2019 (Community Facilities District 86; Insured: AGM) | | AA+/NR | | | 3,000,000 | | | | 3,165,330 | |
Kern Community College District COP, 4.00% due 4/1/2014 | | SP-1+/NR | | | 2,000,000 | | | | 2,052,920 | |
Los Angeles Convention & Exhibition Center Authority, 5.00% due 8/15/2018 | | A+/A1 | | | 2,095,000 | | | | 2,179,722 | |
Los Angeles County Public Works Authority, 5.00% due 8/1/2018 (Multiple Capital Projects) | | A+/A1 | | | 4,000,000 | | | | 4,228,120 | |
Los Angeles County Public Works Authority, 5.00% due 8/1/2019 (Multiple Capital Projects) | | A+/A1 | | | 7,835,000 | | | | 8,180,132 | |
Los Angeles Department of Water & Power, 0.17% due 7/1/2034 put 4/1/2011 (SPA: Bank of America N.A.) (daily demand notes) | | AA-/Aa3 | | | 7,300,000 | | | | 7,300,000 | |
Los Angeles Department of Water & Power, 0.20% due 7/1/2035 put 4/1/2011 (Insured: U.S. Bank) (daily demand notes) | | AA/Aa2 | | | 3,100,000 | | | | 3,100,000 | |
Los Angeles USD COP, 5.00% due 10/1/2017 (Insured: AMBAC) | | A+/A1 | | | 2,445,000 | | | | 2,541,871 | |
Los Angeles USD COP, 5.50% due 12/1/2018 (Capital Projects) | | A+/A1 | | | 4,600,000 | | | | 4,854,288 | |
Los Angeles USD COP, 5.50% due 12/1/2019 | | A+/A1 | | | 7,040,000 | | | | 7,346,451 | |
Los Angeles USD GO, 5.00% due 7/1/2018 (Insured: AGM) | | AA+/Aa2 | | | 4,000,000 | | | | 4,378,640 | |
Monterey County COP, 5.00% due 8/1/2016 (Insured: AGM) | | AA+/Aa3 | | | 1,435,000 | | | | 1,542,510 | |
Monterey County COP, 5.00% due 8/1/2018 (Insured: AGM) | | AA+/Aa3 | | | 2,260,000 | | | | 2,389,182 | |
Mount San Antonio Community College GO, 0% due 8/1/2017 (Insured: Natl-Re) | | AA/Aa2 | | | 5,000,000 | | | | 3,922,300 | |
Newport Beach Revenue, 5.00% due 12/1/2038 put 2/7/2013 (Hoag Memorial Hospital) | | AA/Aa3 | | | 3,000,000 | | | | 3,199,350 | |
Northern California Power Agency Revenue, 5.00% due 7/1/2017 | | A/A2 | | | 1,000,000 | | | | 1,113,220 | |
Northern California Power Agency Revenue, 5.00% due 6/1/2018 (Lodi Energy Center) | | A-/A3 | | | 4,480,000 | | | | 4,843,194 | |
Northern California Power Agency Revenue, 5.00% due 7/1/2019 | | A/A2 | | | 1,000,000 | | | | 1,096,860 | |
Northern California Power Agency Revenue, 5.00% due 7/1/2020 | | A/A2 | | | 1,325,000 | | | | 1,414,848 | |
Orange County Public Financing Authority, 5.00% due 7/1/2017 (Insured: Natl-Re) | | A+/Aa3 | | | 1,245,000 | | | | 1,385,959 | |
Palomar Community College Capital Appreciation GO, 0% due 8/1/2021 | | AA-/Aa2 | | | 2,560,000 | | | | 1,428,224 | |
Pittsburgh Redevelopment Agency, 5.00% due 8/1/2012 (Los Medanos Community Development; Insured: Natl-Re) | | A+/Baa1 | | | 1,255,000 | | | | 1,281,744 | |
Pittsburgh Redevelopment Agency, 5.00% due 8/1/2018 (Los Medanos Community Development; Insured: Natl-Re) | | A+/Baa1 | | | 5,150,000 | | | | 5,018,623 | |
Redding Electrical Systems Revenue COP, 5.00% due 6/1/2020 (Insured: AGM) | | NR/Aa3 | | | 3,955,000 | | | | 4,165,366 | |
Sacramento Cogeneration Authority, 5.00% due 7/1/2017 (Insured: AMBAC) | | A/NR | | | 8,290,000 | | | | 8,532,482 | |
Sacramento Cogeneration Authority, 5.00% due 7/1/2017 (Procter & Gamble) | | A+/A1 | | | 750,000 | | | | 825,930 | |
Sacramento Municipal Utility District, 5.00% due 7/1/2016 (Cosumnes Project; Insured: Natl-Re) | | BBB/Baa1 | | | 4,870,000 | | | | 5,098,257 | |
Sacramento Municipal Utility District, 5.00% due 7/1/2019 (Cosumnes Project; Insured: Natl-Re) | | BBB/Baa1 | | | 5,000,000 | | | | 5,006,450 | |
Sacramento Municipal Utility District, 5.00% due 7/1/2020 (Cosumnes Project; Insured: Natl-Re) | | BBB/Baa1 | | | 8,675,000 | | | | 8,563,786 | |
San Diego USD GO, 5.50% due 7/1/2020 (Election 1998; Insured: Natl-Re) | | AA/Aa1 | | | 10,000,000 | | | | 10,895,200 | |
San Joaquin County Transportation Authority, 5.00% due 4/1/2011 | | NR/NR | | | 3,000,000 | | | | 3,000,000 | |
San Joaquin Delta Community College District GO, 0% due 8/1/2019 (Insured: AGM) | | AA+/Aa2 | | | 7,600,000 | | | | 4,992,744 | |
San Jose Redevelopment Agency Tax Allocation, 6.00% due 8/1/2015 (Insured: Natl-Re) | | BBB/A2 | | | 2,780,000 | | | | 2,930,231 | |
San Jose Redevelopment Agency Tax Allocation, 5.00% due 8/1/2020 (Insured: Natl-Re) | | BBB+/A2 | | | 1,850,000 | | | | 1,721,591 | |
San Luis & Delta-Mendota Water Authority, 4.50% due 3/1/2014 (Water Utility Improvements) | | A+/NR | | | 3,900,000 | | | | 4,099,368 | |
Santa Ana USD GO, 0% due 8/1/2019 (Insured: Natl-Re/FGIC) | | A+/NR | | | 3,425,000 | | | | 2,286,907 | |
Santa Clara County Financing Authority Lease Revenue, 4.00% due 5/15/2011 (Multiple Facilities) | | AA/Aa2 | | | 2,000,000 | | | | 2,008,300 | |
Santa Clara County Financing Authority Lease Revenue, 4.00% due 5/15/2014 (Multiple Facilities) | | AA/Aa2 | | | 4,245,000 | | | | 4,503,181 | |
Santa Clara County Financing Authority Lease Revenue, 4.00% due 5/15/2017 (Multiple Facilities) | | AA/Aa2 | | | 1,000,000 | | | | 1,048,440 | |
Solano County COP, 5.00% due 11/15/2017 | | AA-/A1 | | | 1,580,000 | | | | 1,677,186 | |
Southeast Resource Recovery Facilities Authority, 5.25% due 12/1/2017 (Insured: AMBAC) | | A+/A1 | | | 2,000,000 | | | | 2,074,640 | |
Tuolumne Wind Project Authority, 5.00% due 1/1/2018 (Tuolumne Co.) | | A+/A1 | | | 2,000,000 | | | | 2,173,860 | |
Tuolumne Wind Project Authority, 5.00% due 1/1/2019 (Tuolumne Co.) | | A+/A1 | | | 2,000,000 | | | | 2,155,520 | |
Tustin California Community Redevelopment Agency, 4.00% due 9/1/2019 (Tustin Redevelopment) | | A/NR | | | 1,010,000 | | | | 894,133 | |
Tustin California Community Redevelopment Agency, 4.00% due 9/1/2020 (Tustin Redevelopment) | | A/NR | | | 1,050,000 | | | | 905,531 | |
Twin Rivers USD GO, 0% due 4/1/2014 | | A+/NR | | | 3,490,000 | | | | 3,179,041 | |
Ventura County COP, 5.00% due 8/15/2016 | | AA/Aa3 | | | 1,520,000 | | | | 1,670,374 | |
Certified Semi-Annual Report 13
| | |
| SCHEDULE OF INVESTMENTS, CONTINUED | | |
| |
| Thornburg Limited Term Municipal Fund | | March 31, 2011 (Unaudited) |
| | | | | | | | | | |
Issuer-Description | | Credit Rating†
S&P/ Moody’s | | Principal
Amount | | | Value | |
Ventura County COP, 5.25% due 8/15/2017 | | AA/Aa3 | | $ | 1,635,000 | | | $ | 1,806,528 | |
COLORADO — 2.34% | | | | | | | | | | |
Adams County Platte Valley Medical Center, 5.00% due 2/1/2015 (Brighton Community Hospital Association; Insured: FHA/Natl-Re) | | BBB/NR | | | 1,530,000 | | | | 1,645,546 | |
Adams County Platte Valley Medical Center, 5.00% due 8/1/2015 (Brighton Community Hospital Association; Insured: FHA/Natl-Re) | | BBB/NR | | | 1,565,000 | | | | 1,692,767 | |
Beacon Point Metropolitan District, 4.375% due 12/1/2015 (LOC: Compass Bank) | | A/NR | | | 1,480,000 | | | | 1,465,614 | |
Broomfield Water Activity Enterprise, 5.30% due 12/1/2014 (Insured: Natl-Re) | | NR/Aa3 | | | 1,620,000 | | | | 1,641,173 | |
Colorado COP, 3.00% due 3/1/2013 (Colorado Penitentiary) | | AA-/Aa2 | | | 1,205,000 | | | | 1,248,139 | |
Colorado COP, 4.00% due 3/1/2014 (Colorado Penitentiary) | | AA-/Aa2 | | | 1,285,000 | | | | 1,368,885 | |
Colorado COP, 5.00% due 3/1/2016 (Colorado Penitentiary) | | AA-/Aa2 | | | 2,000,000 | | | | 2,224,060 | |
Colorado COP, 5.00% due 3/1/2017 (Colorado Penitentiary) | | AA-/Aa2 | | | 2,000,000 | | | | 2,223,120 | |
Colorado COP, 5.00% due 3/1/2018 (Colorado Penitentiary) | | AA-/Aa2 | | | 1,500,000 | | | | 1,655,430 | |
Colorado Educational & Cultural Facilities, 6.00% due 6/1/2011 (NCSL) (ETM) | | A/A3 | | | 370,000 | | | | 371,295 | |
Colorado Educational & Cultural Facilities, 4.00% due 6/1/2014 (NCSL) | | A/A3 | | | 1,300,000 | | | | 1,372,761 | |
Colorado Educational & Cultural Facilities, 5.00% due 6/1/2016 (NCSL) | | A/A3 | | | 1,475,000 | | | | 1,606,246 | |
Colorado Educational & Cultural Facilities, 5.00% due 6/1/2018 (NCSL) | | A/A3 | | | 1,625,000 | | | | 1,753,554 | |
Colorado Educational & Cultural Facilities, 5.00% due 6/1/2020 (NCSL) | | A/A3 | | | 1,805,000 | | | | 1,898,102 | |
Colorado Educational & Cultural Facilities, 5.00% due 6/1/2021 (NCSL) | | A/A3 | | | 1,000,000 | | | | 1,035,830 | |
Colorado HFA, 5.00% due 11/15/2013 (Adventist Health/Sunbelt Group) | | AA-/Aa3 | | | 2,840,000 | | | | 3,046,354 | |
Colorado HFA, 5.00% due 11/15/2015 (Adventist Health/Sunbelt Group) | | AA-/Aa3 | | | 2,365,000 | | | | 2,578,630 | |
Colorado HFA, 5.25% due 5/15/2017 (Northern Colorado Medical Center; Insured: AGM) | | AA+/NR | | | 1,185,000 | | | | 1,291,318 | |
Colorado HFA, 5.25% due 5/15/2019 (Northern Colorado Medical Center; Insured: AGM) | | AA+/NR | | | 2,225,000 | | | | 2,387,737 | |
Colorado HFA, 5.50% due 10/1/2038 put 11/12/2015 (Catholic Health Initiatives) | | AA/Aa2 | | | 1,000,000 | | | | 1,125,010 | |
Colorado HFA, 5.00% due 7/1/2039 put 11/8/2012 (Catholic Health) | | AA/Aa2 | | | 3,500,000 | | | | 3,710,770 | |
Colorado HFA, 5.00% due 7/1/2039 put 11/12/2013 (Catholic Health) | | AA/Aa2 | | | 7,255,000 | | | | 7,837,141 | |
Colorado HFA, 5.00% due 7/1/2039 put 11/11/2014 (Catholic Health) | | AA/Aa2 | | | 3,000,000 | | | | 3,277,650 | |
Denver City & County Airport System, 5.00% due 11/15/2016 (Insured: Natl-Re) | | A+/A1 | | | 1,725,000 | | | | 1,916,648 | |
Denver City & County Airport System, 5.00% due 11/15/2017 (Insured: Natl-Re) | | A+/A1 | | | 1,000,000 | | | | 1,101,910 | |
Denver City & County COP, 5.00% due 5/1/2013 (Insured: Natl-Re) | | AA+/Aa1 | | | 3,890,000 | | | | 4,183,500 | |
Denver City & County COP, 5.00% due 5/1/2014 (Insured: Natl-Re) | | AA+/Aa1 | | | 4,000,000 | | | | 4,380,560 | |
Denver City & County COP, 5.00% due 12/1/2016 (Buell Theatre/Jail Dormitory; Insured: Natl-Re) AA+/Aa1 | | | | | 3,025,000 | | | | 3,240,592 | |
Denver Convention Center Hotel Authority, 5.25% due 12/1/2014 (Insured: Syncora) | | BBB-/Baa3 | | | 3,450,000 | | | | 3,623,155 | |
Denver Convention Center Hotel Authority, 5.00% due 12/1/2019 pre-refunded 12/1/2013 (Insured: Syncora) | | NR/NR | | | 5,000,000 | | | | 5,504,050 | |
Denver Convention Center Hotel Authority, 5.00% due 12/1/2022 pre-refunded 12/1/2013 (Insured: Syncora) | | NR/NR | | | 2,000,000 | | | | 2,201,620 | |
E-470 Public Highway Authority Capital Appreciation, 0% due 9/1/2014 (Insured: Natl-Re) | | BBB/Baa1 | | | 1,910,000 | | | | 1,632,553 | |
Mesa County Residual Revenue, 0% due 12/1/2011 (ETM) | | NR/Aaa | | | 1,250,000 | | | | 1,245,350 | |
Park Creek Metropolitan District, 5.00% due 12/1/2015 (Insured: AGM) | | AA+/NR | | | 1,000,000 | | | | 1,105,720 | |
Park Creek Metropolitan District, 5.00% due 12/1/2016 (Insured: AGM) | | AA+/NR | | | 1,035,000 | | | | 1,141,750 | |
Park Creek Metropolitan District, 5.00% due 12/1/2017 (Insured: AGM) | | AA+/NR | | | 1,525,000 | | | | 1,673,779 | |
Park Creek Metropolitan District, 5.50% due 12/1/2018 (Insured: AGM) | | AA+/NR | | | 1,200,000 | | | | 1,346,724 | |
Park Creek Metropolitan District, 5.50% due 12/1/2019 (Insured: AGM) | | AA+/NR | | | 1,000,000 | | | | 1,113,000 | |
Regional Transportation District COP, 5.00% due 6/1/2018 | | A-/Aa3 | | | 1,500,000 | | | | 1,620,615 | |
Regional Transportation District COP, 5.00% due 6/1/2019 | | A-/Aa3 | | | 1,750,000 | | | | 1,870,050 | |
Regional Transportation District COP, 5.00% due 6/1/2020 | | A-/Aa3 | | | 3,655,000 | | | | 3,857,121 | |
Regional Transportation District COP, 5.50% due 6/1/2021 | | A-/Aa3 | | | 1,000,000 | | | | 1,081,160 | |
Southlands Metropolitan District GO, 6.75% due 12/1/2016 pre-refunded 12/1/2014 | | AAA/NR | | | 840,000 | | | | 957,634 | |
14 Certified Semi-Annual Report
| | |
| SCHEDULE OF INVESTMENTS, CONTINUED | | |
| |
| Thornburg Limited Term Municipal Fund | | March 31, 2011 (Unaudited) |
| | | | | | | | | | | | |
Issuer-Description | | Credit Rating†
S&P/ Moody’s | | | Principal
Amount | | | Value | |
CONNECTICUT — 0.07% | | | | | | | | | | | | |
Connecticut Development Authority PCR, 5.75% due 6/1/2026 put 2/1/2012 (United Illuminating Co.) | | | NR/Baa2 | | | $ | 1,000,000 | | | $ | 1,028,670 | |
Connecticut Health & Educational Facilities, 3.50% due 11/15/2029 put 2/1/2012 (Ascension Health) | | | AA/Aa1 | | | | 1,860,000 | | | | 1,902,817 | |
DELAWARE — 0.03% | | | | | | | | | | | | |
Delaware EDA, 6.375% due 5/1/2027 pre-refunded 5/1/2012 (Peninsula United Methodist Homes) | | | NR/NR | | | | 1,000,000 | | | | 1,070,310 | |
DISTRICT OF COLUMBIA — 1.05% | | | | | | | | | | | | |
District of Columbia Convention Center Authority, 5.00% due 10/1/2013 (Washington Convention Center; Insured: AMBAC) | | | A/A1 | | | | 3,000,000 | | | | 3,223,200 | |
District of Columbia COP, 5.25% due 1/1/2013 (Insured: AMBAC) | | | A/NR | | | | 4,065,000 | | | | 4,226,137 | |
District of Columbia COP, 5.25% due 1/1/2015 (Insured: Natl-Re/FGIC) | | | A/Aa3 | | | | 2,875,000 | | | | 3,111,181 | |
District of Columbia COP, 5.25% due 1/1/2016 (Insured: Natl-Re/FGIC) | | | A/Aa3 | | | | 4,625,000 | | | | 5,030,983 | |
District of Columbia COP, 5.00% due 1/1/2019 (Insured: Natl-Re) | | | A/Aa3 | | | | 5,000,000 | | | | 5,170,300 | |
District of Columbia GO, 6.00% due 6/1/2018 (Insured: Natl-Re) | | | A+/Aa2 | | | | 5,000,000 | | | | 5,910,750 | |
District of Columbia Revenue, 4.00% due 4/1/2015 (National Public Radio) | | | AA-/Aa3 | | | | 1,000,000 | | | | 1,064,340 | |
District of Columbia Revenue, 5.00% due 4/1/2016 (National Public Radio) | | | AA-/Aa3 | | | | 500,000 | | | | 554,560 | |
District of Columbia Revenue, 4.00% due 4/1/2017 (National Public Radio) | | | AA-/Aa3 | | | | 1,630,000 | | | | 1,721,736 | |
District of Columbia Revenue, 5.00% due 4/1/2018 (National Public Radio) | | | AA-/Aa3 | | | | 1,195,000 | | | | 1,318,933 | |
District of Columbia Revenue, 5.00% due 4/1/2019 (National Public Radio) | | | AA-/Aa3 | | | | 805,000 | | | | 880,976 | |
District of Columbia Revenue, 5.00% due 4/1/2020 (National Public Radio) | | | AA-/Aa3 | | | | 1,250,000 | | | | 1,354,313 | |
District of Columbia Tax Increment, 0% due 7/1/2011 (Mandarin Oriental; Insured: AGM) | | | AA+/Aa3 | | | | 1,990,000 | | | | 1,983,612 | |
District of Columbia Tax Increment, 0% due 7/1/2012 (Mandarin Oriental; Insured: AGM) | | | AA+/Aa3 | | | | 1,580,000 | | | | 1,550,185 | |
Metropolitan Washington Airports Authority, 0% due 10/1/2014 (Dulles Toll Road; Insured: AGM) | | | AA+/Aa3 | | | | 2,000,000 | | | | 1,786,600 | |
Metropolitan Washington Airports Authority, 0% due 10/1/2016 (Dulles Toll Road; Insured: AGM) | | | AA+/Aa3 | | | | 4,000,000 | | | | 3,195,800 | |
FLORIDA — 9.57% | | | | | | | | | | | | |
Broward County Airport Systems, 5.00% due 10/1/2014 (Insured: AMBAC) | | | A+/A1 | | | | 4,000,000 | | | | 4,345,040 | |
Broward County Port Facilities, 5.00% due 9/1/2013 | | | A-/A2 | | | | 2,000,000 | | | | 2,138,520 | |
Broward County Port Facilities, 5.00% due 9/1/2017 | | | A-/A2 | | | | 2,820,000 | | | | 3,038,635 | |
Broward County Port Facilities, 5.50% due 9/1/2018 | | | A-/A2 | | | | 3,500,000 | | | | 3,847,375 | |
Broward County Port Facilities, 5.50% due 9/1/2019 | | | A-/A2 | | | | 2,800,000 | | | | 3,046,008 | |
Broward County School Board COP, 5.25% due 7/1/2015 (Insured: AGM) | | | AA+/Aa3 | | | | 3,035,000 | | | | 3,287,148 | |
Broward County School Board COP, 5.00% due 7/1/2016 (Insured: AGM) | | | AA+/Aa3 | | | | 1,495,000 | | | | 1,602,730 | |
Broward County School Board COP, 5.25% due 7/1/2016 (Insured: AGM) | | | AA+/Aa3 | | | | 3,715,000 | | | | 4,021,339 | |
Broward County School Board COP, 5.25% due 7/1/2016 (Insured: AGM) | | | AA+/Aa3 | | | | 7,630,000 | | | | 8,259,170 | |
Broward County School Board COP, 5.00% due 7/1/2017 (Insured: Natl-Re/FGIC) | | | A/Aa3 | | | | 1,000,000 | | | | 1,065,060 | |
Capital Projects Finance Authority, 5.50% due 10/1/2012 (Insured: Natl-Re) | | | BBB/Baa1 | | | | 1,820,000 | | | | 1,824,404 | |
Capital Projects Finance Authority, 5.50% due 10/1/2015 (Insured: Natl-Re) | | | BBB/Baa1 | | | | 2,660,000 | | | | 2,599,033 | |
Collier County Special Obligation Revenue, 4.00% due 10/1/2014 | | | AA/Aa2 | | | | 1,410,000 | | | | 1,500,691 | |
Dade County Florida GO, 7.125% due 10/1/2011 (Insured: AMBAC) | | | NR/Aa2 | | | | 1,000,000 | | | | 1,032,880 | |
Escambia County HFA, 5.25% due 11/15/2014 (Ascension Health Credit) | | | AA/Aa1 | | | | 1,650,000 | | | | 1,843,182 | |
Flagler County School Board COP, 5.00% due 8/1/2014 (Insured: AGM) | | | AA+/Aa3 | | | | 1,605,000 | | | | 1,731,554 | |
Flagler County School Board COP, 5.00% due 8/1/2015 (Insured: AGM) | | | AA+/Aa3 | | | | 1,500,000 | | | | 1,624,365 | |
Florida Atlantic University Financing Corp. Capital Improvements Revenue, 5.00% due 7/1/2014 (Innovation Village) | | | A/A2 | | | | 1,950,000 | | | | 2,091,160 | |
Florida Atlantic University Financing Corp. Capital Improvements Revenue, 5.00% due 7/1/2015 (Innovation Village) | | | A/A2 | | | | 2,395,000 | | | | 2,575,272 | |
Florida Atlantic University Financing Corp. Capital Improvements Revenue, 5.00% due 7/1/2016 (Innovation Village) | | | A/A2 | | | | 2,275,000 | | | | 2,436,115 | |
Certified Semi-Annual Report 15
| | |
| SCHEDULE OF INVESTMENTS, CONTINUED | | |
| |
| Thornburg Limited Term Municipal Fund | | March 31, 2011 (Unaudited) |
| | | | | | | | | | |
Issuer-Description | | Credit Rating†
S&P/ Moody’s | | Principal
Amount | | | Value | |
Florida Board of Education Lottery Revenue, 5.50% due 7/1/2015 (Insured: AMBAC) | | AAA/A1 | | $ | 3,500,000 | | | $ | 3,575,145 | |
Florida Department of Environmental Protection, 5.00% due 7/1/2012 (Florida Forever; Insured: Natl-Re) | | AA-/Aa3 | | | 2,500,000 | | | | 2,550,850 | |
Florida Department of Management Services, 5.25% due 9/1/2016 (Insured: AGM) | | AA+/Aa2 | | | 3,500,000 | | | | 3,963,085 | |
Florida Higher Educational Facilities Financing, 4.00% due 4/1/2013 (Nova Southeastern University) | | BBB/Baa2 | | | 1,100,000 | | | | 1,123,353 | |
Florida Higher Educational Facilities Financing, 5.00% due 4/1/2014 (Nova Southeastern University) | | BBB/Baa2 | | | 2,365,000 | | | | 2,476,888 | |
Florida Higher Educational Facilities Financing, 5.00% due 4/1/2015 (Nova Southeastern University) | | BBB/Baa2 | | | 2,350,000 | | | | 2,463,505 | |
Florida Higher Educational Facilities Financing, 5.00% due 4/1/2016 (Nova Southeastern University) | | BBB/Baa2 | | | 2,345,000 | | | | 2,443,842 | |
Florida Higher Educational Facilities Financing, 5.25% due 4/1/2017 (Nova Southeastern University) | | BBB/Baa2 | | | 1,325,000 | | | | 1,377,457 | |
Florida Higher Educational Facilities Financing, 5.25% due 4/1/2018 (Nova Southeastern University) | | BBB/Baa2 | | | 2,630,000 | | | | 2,701,247 | |
Florida Higher Educational Facilities Financing, 5.50% due 4/1/2019 (Nova Southeastern University) | | BBB/Baa2 | | | 1,705,000 | | | | 1,757,241 | |
Florida Hurricane Catastrophe, 5.00% due 7/1/2014 | | AA-/Aa3 | | | 11,000,000 | | | | 11,928,180 | |
Florida Board of Education Lottery Revenue, 5.25% due 7/1/2016 (Insured: Natl-Re/FGIC) | | AAA/A1 | | | 1,000,000 | | | | 1,062,130 | |
Florida State Correctional Privatization Commission COP, 5.00% due 8/1/2015 (Insured: AMBAC) | | AA+/Aa2 | | | 2,000,000 | | | | 2,149,800 | |
Florida State Department of Children & Families COP, 5.00% due 10/1/2012 | | AA+/NR | | | 770,000 | | | | 809,416 | |
Florida State Department of Children & Families COP, 5.00% due 10/1/2014 | | AA+/NR | | | 905,000 | | | | 988,314 | |
Florida State Department of Children & Families COP, 5.00% due 10/1/2015 | | AA+/NR | | | 925,000 | | | | 1,017,463 | |
Florida State Department of Transportation GO, 5.375% due 7/1/2017 | | AAA/Aa1 | | | 4,675,000 | | | | 4,964,523 | |
Florida State Department of Transportation GO, 5.00% due 7/1/2018 | | AAA/Aa1 | | | 3,000,000 | | | | 3,376,470 | |
Florida Turnpike Authority, 5.00% due 7/1/2013 (Department of Transportation) | | AA-/Aa3 | | | 4,875,000 | | | | 5,284,939 | |
Fort Myers Florida Improvement Revenue, 5.00% due 12/1/2018 (Insured: Natl-Re) | | A+/Aa3 | | | 2,195,000 | | | | 2,324,066 | |
Gainesville Utilities Systems Revenue, 6.50% due 10/1/2013 | | AA/Aa2 | | | 4,800,000 | | | | 5,353,200 | |
Highlands County HFA, 5.00% due 11/15/2015 (Adventist Health) | | AA-/Aa3 | | | 1,000,000 | | | | 1,104,000 | |
Highlands County HFA, 5.00% due 11/15/2016 (Adventist Health/Sunbelt Group) | | AA-/Aa3 | | | 1,000,000 | | | | 1,104,370 | |
Highlands County HFA, 5.00% due 11/15/2017 (Adventist Health/Sunbelt Group) | | AA-/Aa3 | | | 3,200,000 | | | | 3,517,120 | |
Highlands County HFA, 5.00% due 11/15/2017 (Adventist Health) | | AA-/Aa3 | | | 1,000,000 | | | | 1,071,400 | |
Highlands County HFA, 5.00% due 11/15/2019 (Adventist Health/Sunbelt Group) | | AA-/Aa3 | | | 3,000,000 | | | | 3,264,750 | |
Highlands County HFA, 3.95% due 11/15/2032 put 9/1/2012 (Adventist Health/Sunbelt Group) | | AA-/Aa3 | | | 2,500,000 | | | | 2,600,075 | |
Hillsborough County Assessment, 5.00% due 3/1/2015 (Insured: Natl-Re/FGIC) | | A+/A1 | | | 5,000,000 | | | | 5,356,700 | |
Hillsborough County IDA PCR, 5.10% due 10/1/2013 (Tampa Electric Co.) | | BBB/Baa1 | | | 7,410,000 | | | | 7,722,035 | |
Hillsborough County IDA PCR, 5.00% due 12/1/2034 put 3/15/2012 (Tampa Electric Co.; Insured: AMBAC) | | BBB/Baa1 | | | 4,000,000 | | | | 4,126,800 | |
Hillsborough County Investment Tax Revenue, 5.00% due 11/1/2016 (Insured: AMBAC) | | AA+/Aa2 | | | 1,000,000 | | | | 1,112,030 | |
Hillsborough County School Board COP, 5.25% due 7/1/2017 (Insured: Natl-Re) | | AA-/Aa2 | | | 1,000,000 | | | | 1,102,790 | |
Hollywood Community Redevelopment Agency, 5.00% due 3/1/2016 (Insured: Syncora) | | NR/A3 | | | 2,000,000 | | | | 2,118,600 | |
Hollywood Community Redevelopment Agency, 5.00% due 3/1/2017 (Insured: Syncora) | | NR/A3 | | | 2,000,000 | | | | 2,103,740 | |
Hollywood Water & Sewer Revenue, 5.00% due 10/1/2014 (Insured: AGM) | | NR/Aa2 | | | 1,300,000 | | | | 1,406,561 | |
JEA, 5.25% due 10/1/2012 (St. John’s River Park Systems) | | AA-/Aa2 | | | 5,500,000 | | | | 5,623,750 | |
JEA, 5.00% due 10/1/2014 (Electric Systems) | | A+/Aa3 | | | 7,165,000 | | | | 7,817,445 | |
JEA, 4.00% due 10/1/2016 (Electric Systems) | | A+/Aa3 | | | 3,540,000 | | | | 3,739,408 | |
JEA, 5.00% due 10/1/2017 (St. John’s River Park Systems) | | AA-/Aa2 | | | 8,385,000 | | | | 8,543,225 | |
JEA, 3.50% due 10/1/2013 (Water & Sewer Systems Revenue) | | AA-/Aa2 | | | 5,565,000 | | | | 5,845,253 | |
JEA, 5.00% due 10/1/2018 (Water & Sewer Systems Revenue) | | AA-/Aa2 | | | 1,500,000 | | | | 1,666,830 | |
Kissimmee Utilities Authority Electrical Systems Revenue, 5.25% due 10/1/2016 (Insured: AGM) | | NR/Aa3 | | | 1,700,000 | | | | 1,899,461 | |
Lakeland Florida Energy System Revenue, 5.00% due 10/1/2016 (Insured: AGM) | | AA+/Aa3 | | | 9,780,000 | | | | 10,762,303 | |
Lakeland Florida Energy System Revenue, 5.00% due 10/1/2017 (Insured: AGM) | | AA+/Aa3 | | | 7,105,000 | | | | 7,749,992 | |
16 Certified Semi-Annual Report
| | |
| SCHEDULE OF INVESTMENTS, CONTINUED | | |
| |
| Thornburg Limited Term Municipal Fund | | March 31, 2011 (Unaudited) |
| | | | | | | | | | |
Issuer-Description | | Credit Rating†
S&P/ Moody’s | | Principal
Amount | | | Value | |
Lakeland Florida Energy System Revenue, 5.00% due 10/1/2019 (Insured: AGM) | | AA+/Aa3 | | $ | 5,000,000 | | | $ | 5,346,150 | |
Lakeland Florida Energy System Revenue, 5.00% due 10/1/2020 (Insured: AGM) | | AA+/Aa3 | | | 1,695,000 | | | | 1,791,073 | |
Marion County Hospital District, 5.00% due 10/1/2015 (Munroe Regional Health Systems) | | NR/A3 | | | 1,000,000 | | | | 1,056,620 | |
Miami Dade County Educational Facilities Authority GO, 5.00% due 4/1/2016 (University of Miami; Insured: AMBAC) | | A-/A3 | | | 3,000,000 | | | | 3,215,880 | |
Miami Dade County Expressway Authority, 5.00% due 7/1/2019 (Insured: Assured Guaranty) | | AA+/Aa3 | | | 6,530,000 | | | | 6,918,666 | |
Miami Dade County GO, 5.25% due 7/1/2018 (Building Better Communities) | | AA-/Aa2 | | | 4,540,000 | | | | 5,080,396 | |
Miami Dade County Professional Sports Franchise Facilities Tax, 0% due 10/1/2015 (Insured: AGM) | | AA+/Aa3 | | | 3,845,000 | | | | 3,263,098 | |
Miami Dade County Professional Sports Franchise Facilities Tax, 0% due 10/1/2016 (Insured: AGM) | | AA+/Aa3 | | | 3,535,000 | | | | 2,833,444 | |
Miami Dade County Professional Sports Franchise Facilities Tax, 0% due 10/1/2017 (Insured: AGM) | | AA+/Aa3 | | | 2,435,000 | | | | 1,824,545 | |
Miami Dade County Professional Sports Franchise Facilities Tax, 0% due 10/1/2018 (Insured: AGM) | | AA+/Aa3 | | | 5,385,000 | | | | 3,759,215 | |
Miami Dade County Professional Sports Franchise Facilities Tax, 0% due 10/1/2019 (Insured: AGM) | | AA+/Aa3 | | | 2,170,000 | | | | 1,415,513 | |
Miami Dade County School Board COP, 5.00% due 5/1/2014 (Insured: Natl-Re) | | A/A1 | | | 1,000,000 | | | | 1,055,130 | |
Miami Dade County School Board COP, 5.00% due 10/1/2015 (Insured: AMBAC) | | A/A1 | | | 1,000,000 | | | | 1,062,470 | |
Miami Dade County School Board COP, 5.00% due 5/1/2016 (Insured: Natl-Re) | | A/A1 | | | 4,015,000 | | | | 4,237,592 | |
Miami Dade County School Board COP, 5.00% due 10/1/2016 (Insured: AMBAC) | | A/A1 | | | 1,000,000 | | | | 1,055,750 | |
Miami Dade County School Board COP, 5.50% due 5/1/2030 put 5/1/2011 (Insured: Natl-Re) | | A/A1 | | | 3,010,000 | | | | 3,022,371 | |
Miami Dade County School Board COP, 5.00% due 5/1/2031 put 5/1/2011 (Insured: Natl-Re) | | A/A1 | | | 2,975,000 | | | | 2,986,007 | |
Miami Dade County School Board COP, 5.00% due 5/1/2032 put 5/1/2016 | | A/A1 | | | 6,000,000 | | | | 6,315,600 | |
Miami Dade County School District GO, 5.375% due 8/1/2015 (Insured: AGM) | | AA+/Aa3 | | | 5,000,000 | | | | 5,584,100 | |
Miami Dade County Special Housing, 5.80% due 10/1/2012 (HUD Section 8) | | NR/Baa3 | | | 1,115,000 | | | | 1,150,212 | |
Miami GO, 5.00% due 1/1/2017 (Homeland Defense/Neighborhood Capital Improvements) | | BBB+/A3 | | | 1,245,000 | | | | 1,314,210 | |
Miami GO, 5.00% due 1/1/2018 (Homeland Defense/Neighborhood Capital Improvements) | | BBB+/A3 | | | 2,040,000 | | | | 2,130,046 | |
Miami GO, 5.00% due 1/1/2019 (Homeland Defense/Neighborhood Capital Improvements) | | BBB+/A3 | | | 1,870,000 | | | | 1,926,773 | |
Miami Special Obligation, 5.00% due 1/1/2018 (Insured: Natl-Re) | | A-/A2 | | | 1,970,000 | | | | 2,144,936 | |
North Miami Educational Facilities Revenue, 5.00% due 4/1/2013 (Johnston & Wales University; Insured: Syncora) | | NR/NR | | | 1,530,000 | | | | 1,598,008 | |
Orange County HFA, 5.00% due 10/1/2014 (Orlando Health) | | A/A2 | | | 2,790,000 | | | | 2,985,105 | |
Orange County HFA, 5.00% due 10/1/2017 (Orlando Health) | | A/A2 | | | 1,980,000 | | | | 2,070,664 | |
Orange County HFA, 5.25% due 10/1/2019 (Orlando Health) | | A/A2 | | | 4,000,000 | | | | 4,173,480 | |
Orange County HFA, 6.25% due 10/1/2021 (Orlando Health; Insured: Natl-Re) | | A/A2 | | | 1,870,000 | | | | 2,021,040 | |
Orlando & Orange County Expressway Authority, 6.50% due 7/1/2011 (Insured: Natl-Re/FGIC) | | BBB/A1 | | | 3,550,000 | | | | 3,599,664 | |
Orlando & Orange County Expressway Authority, 5.00% due 7/1/2013 (Insured: AMBAC) | | A/A1 | | | 5,845,000 | | | | 6,233,517 | |
Palm Beach County Public Improvement, 5.00% due 11/1/2030 put 11/1/2011 (Convention Center; Insured: Natl-Re/FGIC) | | AA+/Aa1 | | | 3,000,000 | | | | 3,064,080 | |
Palm Beach County School Board COP, 5.375% due 8/1/2017 (Insured: AMBAC) | | AA-/Aa3 | | | 7,000,000 | | | | 7,151,760 | |
Palm Beach County School Board COP, 5.00% due 8/1/2025 put 8/1/2011 (Insured: Natl-Re/FGIC) | | AA-/NR | | | 15,040,000 | | | | 15,250,109 | |
Pelican Marsh Community Development District, 5.00% due 5/1/2011 (Insured: Radian) | | NR/NR | | | 570,000 | | | | 569,447 | |
Port Everglades Authority, 5.00% due 9/1/2016 (Insured: AGM) | | AA+/Aa3 | | | 9,990,000 | | | | 10,149,241 | |
Putnam County Development Authority PCR, 5.35% due 3/15/2042 put 5/1/2018 (Seminole Project; Insured: AMBAC) | | A-/A3 | | | 3,125,000 | | | | 3,252,531 | |
Putnam County Development Authority PCR, 5.35% due 3/15/2042 put 5/1/2018 (Seminole Project; Insured: AMBAC) | | A-/A3 | | | 10,000,000 | | | | 10,408,100 | |
South Miami HFA, 5.00% due 8/15/2016 (Baptist Health) | | AA/Aa3 | | | 1,560,000 | | | | 1,712,069 | |
South Miami HFA, 5.00% due 8/15/2017 (Baptist Health) | | AA/Aa3 | | | 4,610,000 | | | | 5,034,719 | |
St. John’s County IDA, 5.50% due 8/1/2014 (Presbyterian Retirement) | | NR/NR | | | 2,755,000 | | | | 2,867,294 | |
a Tampa Bay Regional Water Supply Authority, 5.00% due 10/1/2017 | | AA+/Aa2 | | | 5,615,000 | | | | 6,247,024 | |
a Tampa Bay Regional Water Supply Authority, 5.00% due 10/1/2018 | | AA+/Aa2 | | | 2,890,000 | | | | 3,196,484 | |
a Tampa Bay Regional Water Supply Authority, 5.00% due 10/1/2019 | | AA+/Aa2 | | | 3,000,000 | | | | 3,290,640 | |
Tampa Baycare Health Systems, 5.00% due 11/15/2016 | | NR/Aa3 | | | 2,855,000 | | | | 3,126,653 | |
Tampa Baycare Health Systems, 5.00% due 11/15/2017 | | NR/Aa3 | | | 1,215,000 | | | | 1,321,094 | |
Tampa Sports Authority Revenue, 5.75% due 10/1/2015 (Tampa Bay Arena; Insured: Natl-Re) | | BBB/Baa1 | | | 1,500,000 | | | | 1,554,135 | |
Certified Semi-Annual Report 17
| | |
| SCHEDULE OF INVESTMENTS, CONTINUED | | |
| |
| Thornburg Limited Term Municipal Fund | | March 31, 2011 (Unaudited) |
| | | | | | | | | | | | |
Issuer-Description | | Credit Rating†
S&P/ Moody’s | | | Principal
Amount | | | Value | |
University of Central Florida Athletics Association Inc. COP, 5.00% due 10/1/2016 (Insured: Natl-Re/FGIC) | | | BBB/NR | | | $ | 1,640,000 | | | $ | 1,731,463 | |
GEORGIA — 2.80% | | | | | | | | | | | | |
Atlanta Airport Passenger Facility Charge Revenue, 5.00% due 1/1/2018 | | | NR/A1 | | | | 2,100,000 | | | | 2,246,097 | |
Atlanta Airport Passenger Facility Charge Revenue, 5.00% due 1/1/2020 | | | NR/A1 | | | | 6,000,000 | | | | 6,241,020 | |
Atlanta Airport Passenger Facility Charge Revenue, 5.00% due 1/1/2021 | | | NR/A1 | | | | 7,000,000 | | | | 7,199,360 | |
Atlanta Airport Revenue, 5.00% due 1/1/2019 | | | NR/A1 | | | | 3,145,000 | | | | 3,391,725 | |
Atlanta Airport Revenue, 5.25% due 1/1/2020 | | | NR/A1 | | | | 5,000,000 | | | | 5,422,700 | |
Atlanta Airport Revenue, 5.50% due 1/1/2021 | | | NR/A1 | | | | 3,525,000 | | | | 3,870,520 | |
Atlanta Tax Allocation, 5.25% due 12/1/2016 (Atlantic Station; Insured: AGM) | | | AA+/Aa3 | | | | 3,850,000 | | | | 4,157,461 | |
Atlanta Water & Wastewater Revenue, 5.50% due 11/1/2014 (Insured: Natl-Re/FGIC) | | | A/A1 | | | | 3,000,000 | | | | 3,339,270 | |
Atlanta Water & Wastewater Revenue, 5.50% due 11/1/2015 (Insured: Natl-Re/FGIC) | | | A/A1 | | | | 4,000,000 | | | | 4,487,040 | |
Atlanta Water & Wastewater Revenue, 5.00% due 11/1/2016 (Insured: AGM) | | | AA+/Aa3 | | | | 3,215,000 | | | | 3,527,627 | |
Atlanta Water & Wastewater Revenue, 5.50% due 11/1/2016 (Insured: Natl-Re/FGIC) | | | A/A1 | | | | 8,215,000 | | | | 9,226,513 | |
Atlanta Water & Wastewater Revenue, 5.00% due 11/1/2017 (Insured: AGM) | | | AA+/Aa3 | | | | 4,745,000 | | | | 5,175,561 | |
Atlanta Water & Wastewater Revenue, 6.00% due 11/1/2019 | | | A/A1 | | | | 5,650,000 | | | | 6,448,910 | |
Burke County Development Authority PCR, 2.50% due 1/1/2040 put 3/1/2013 (Oglethorpe Power) | | | A/Baa1 | | | | 7,000,000 | | | | 6,999,510 | |
Fulton County Facilities COP, 5.00% due 11/1/2017 | | | AA-/Aa3 | | | | 8,400,000 | | | | 9,198,504 | |
Fulton County Facilities COP, 5.00% due 11/1/2019 | | | AA-/Aa3 | | | | 6,600,000 | | | | 7,073,286 | |
Gainesville Water & Sewer Revenue, 6.00% due 11/15/2012 (Insured: Natl-Re/FGIC) | | | AA-/Aa3 | | | | 1,160,000 | | | | 1,207,398 | |
Lagrange Troup County Hospital Authority, 5.00% due 7/1/2018 (West Georgia Health Foundation Inc.) | | | A+/Aa2 | | | | 2,500,000 | | | | 2,687,175 | |
Main Street Natural Gas Inc., 5.00% due 3/15/2013 (Georgia Gas) | | | A/A2 | | | | 1,500,000 | | | | 1,554,225 | |
Main Street Natural Gas Inc., 5.00% due 3/15/2014 (Georgia Gas) | | | A+/Aa3 | | | | 3,000,000 | | | | 3,168,270 | |
Main Street Natural Gas Inc., 5.00% due 3/15/2014 (Georgia Gas) | | | A/A2 | | | | 3,590,000 | | | | 3,742,144 | |
Main Street Natural Gas Inc., 5.00% due 3/15/2015 (Georgia Gas) | | | A/A2 | | | | 2,000,000 | | | | 2,074,680 | |
Main Street Natural Gas Inc., 5.00% due 3/15/2018 (Georgia Gas) | | | A/A2 | | | | 5,000,000 | | | | 5,003,350 | |
Monroe County Development Authority PCR, 6.80% due 1/1/2012 (Oglethorpe Power; Insured: Natl-Re) | | | BBB/Baa1 | | | | 1,000,000 | | | | 1,044,260 | |
Municipal Electric Authority of Georgia, 6.60% due 1/1/2018 (Insured: Natl-Re) | | | BBB/A1 | | | | 2,990,000 | | | | 3,427,258 | |
GUAM — 0.33% | | | | | | | | | | | | |
Guam Government Limited Obligation Revenue, 5.25% due 12/1/2016 | | | BBB-/NR | | | | 5,610,000 | | | | 5,933,529 | |
Guam Government Limited Obligation Revenue, 5.25% due 12/1/2017 | | | BBB-/NR | | | | 2,000,000 | | | | 2,101,660 | |
Guam Government Limited Obligation Revenue, 5.50% due 12/1/2018 | | | BBB-/NR | | | | 3,000,000 | | | | 3,134,340 | |
Guam Government Limited Obligation Revenue, 5.50% due 12/1/2019 | | | BBB-/NR | | | | 2,000,000 | | | | 2,058,580 | |
HAWAII — 0.17% | | | | | | | | | | | | |
Hawaii Department of Budget & Finance, 6.40% due 7/1/2013 (Kapiolani Health Care; Insured: Natl-Re) | | | BBB/A3 | | | | 890,000 | | | | 913,719 | |
Hawaii State Department of Budget & Finance, 4.95% due 4/1/2012 (Hawaiian Electric Company; Insured: Natl-Re) | | | BBB/Baa1 | | | | 5,850,000 | | | | 5,958,166 | |
IDAHO — 0.36% | | | | | | | | | | | | |
Twin Falls Urban Renewal Agency, 4.95% due 8/1/2014 | | | NR/NR | | | | 1,640,000 | | | | 1,652,513 | |
Twin Falls Urban Renewal Agency, 5.15% due 8/1/2017 | | | NR/NR | | | | 1,455,000 | | | | 1,428,417 | |
University of Idaho, 5.25% due 4/1/2041 put 4/1/2021 | | | A+/Aa3 | | | | 10,805,000 | | | | 11,407,271 | |
ILLINOIS — 8.01% | | | | | | | | | | | | |
Bolingbrook GO, 0% due 1/1/2016 (Insured: Natl-Re) | | | NR/Aa3 | | | | 1,500,000 | | | | 1,223,295 | |
18 Certified Semi-Annual Report
| | |
| SCHEDULE OF INVESTMENTS, CONTINUED | | |
| |
| Thornburg Limited Term Municipal Fund | | March 31, 2011 (Unaudited) |
| | | | | | | | | | |
Issuer-Description | | Credit Rating†
S&P/ Moody’s | | Principal
Amount | | | Value | |
Bolingbrook GO, 0% due 1/1/2017 (Insured: Natl-Re) | | NR/Aa3 | | $ | 2,000,000 | | | $ | 1,532,340 | |
Broadview Tax Increment Revenue, 5.375% due 7/1/2015 | | NR/NR | | | 3,400,000 | | | | 3,361,002 | |
Chicago Board of Education GO, 6.25% due 1/1/2015 (Insured: Natl-Re) | | BBB/Aa2 | | | 1,700,000 | | | | 1,828,537 | |
Chicago Board of Education GO, 5.25% due 12/1/2017 (Chicago School Reform Board; Insured: Natl-Re/FGIC) | | AA-/Aa2 | | | 4,100,000 | | | | 4,396,594 | |
Chicago Board of Education GO, 5.00% due 12/1/2018 (Insured: Natl-Re) | | AA-/Aa2 | | | 1,000,000 | | | | 1,044,120 | |
Chicago GO, 6.125% due 1/1/2012 (Insured: AMBAC) (ETM) | | A+/Aa3 | | | 775,000 | | | | 808,488 | |
Chicago GO, 6.125% due 1/1/2012 (Insured: AMBAC) | | A+/Aa3 | | | 225,000 | | | | 232,650 | |
Chicago GO, 5.375% due 1/1/2013 (Insured: Natl-Re) | | A+/Aa3 | | | 2,130,000 | | | | 2,207,426 | |
Chicago GO, 0% due 1/1/2016 (City Colleges; Insured: Natl-Re/FGIC) | | A+/Aa3 | | | 2,670,000 | | | | 2,198,772 | |
Chicago GO, 5.40% due 1/1/2018 (Insured: AGM) | | AA+/Aa3 | | | 3,000,000 | | | | 3,009,390 | |
b Chicago GO, 5.44% due 1/1/2018 (Capital Appreciation; Insured: Natl-Re) | | A+/Aa3 | | | 3,000,000 | | | | 3,187,110 | |
Chicago GO, 0.44% due 1/1/2040 put 4/7/2011 (Insured: AGM) (weekly demand notes) | | AAA/Aa3 | | | 9,440,000 | | | | 9,440,000 | |
Chicago Housing Authority Capital Program, 5.00% due 7/1/2015 (Insured: AGM) | | AA+/Aa3 | | | 8,460,000 | | | | 9,216,493 | |
Chicago Housing Authority Capital Program, 5.00% due 7/1/2016 (Insured: AGM) | | AA+/Aa3 | | | 2,000,000 | | | | 2,185,760 | |
Chicago Illinois Board of Education GO, 5.00% due 12/1/2018 | | AA-/Aa2 | | | 3,000,000 | | | | 3,132,360 | |
Chicago Illinois Board of Education GO, 5.00% due 12/1/2019 | | AA-/Aa2 | | | 2,000,000 | | | | 2,052,640 | |
Chicago Illinois Board of Education GO, 0% due 12/1/2020 (Insured: BHAC/FGIC) | | AA+/Aa1 | | | 12,000,000 | | | | 7,224,360 | |
Chicago Illinois Board of Education GO, 5.00% due 12/1/2020 | | AA-/Aa2 | | | 2,500,000 | | | | 2,530,625 | |
Chicago Illinois Park District GO, 5.00% due 1/1/2018 (Personal Property Replacement) | | AA+/Aa2 | | | 1,150,000 | | | | 1,227,188 | |
Chicago Illinois Public Building Commerce Building, 4.00% due 1/1/2012 | | NR/Aa2 | | | 1,660,000 | | | | 1,701,649 | |
Chicago Illinois Public Building Commerce Building, 4.00% due 1/1/2013 | | NR/Aa2 | | | 3,275,000 | | | | 3,401,382 | |
Chicago Midway Airport, 5.50% due 1/1/2013 (Insured: Natl-Re) | | A/A2 | | | 1,180,000 | | | | 1,245,608 | |
Chicago Tax Increment, 6.75% due 6/1/2022 (Pilsen Redevelopment) | | NR/NR | | | 5,000,000 | | | | 4,960,800 | |
Chicago Wastewater Transmission Revenue, 4.00% due 1/1/2018 | | A+/Aa3 | | | 1,475,000 | | | | 1,460,309 | |
Chicago Water Revenue, 2.00% due 11/1/2011 | | AA-/Aa3 | | | 2,360,000 | | | | 2,373,853 | |
Cicero Illinois GO, 5.25% due 1/1/2019 (Insured: Syncora) | | NR/NR | | | 6,140,000 | | | | 6,131,772 | |
Cook County Community Consolidated School District GO, 0% due 12/1/2011 (Insured: AGM) (ETM) | | NR/Aa3 | | | 2,370,000 | | | | 2,361,231 | |
Cook County Community Consolidated School District GO, 9.00% due 12/1/2016 (Tinley Park; Insured: Natl-Re/FGIC) | | NR/Aa2 | | | 2,500,000 | | | | 3,234,400 | |
Cook County Community High School District, 5.00% due 12/15/2012 (Insured: Assured Guaranty) | | AA+/NR | | | 3,180,000 | | | | 3,363,677 | |
Cook County Community High School District, 5.00% due 12/15/2013 (Insured: Assured Guaranty) | | AA+/NR | | | 6,875,000 | | | | 7,363,469 | |
Cook County Community School District GO, 9.00% due 12/1/2013 (Oak Park; Insured: Natl-Re/FGIC) | | NR/Aa2 | | | 2,250,000 | | | | 2,651,040 | |
Cook County GO, 3.25% due 11/15/2011 (ETM) | | NR/NR | | | 220,000 | | | | 223,879 | |
Cook County GO, 3.25% due 11/15/2011 | | AA/Aa2 | | | 1,030,000 | | | | 1,046,089 | |
Cook County GO, 5.00% due 11/15/2012 | | AA/Aa2 | | | 6,000,000 | | | | 6,322,200 | |
Cook County GO, 6.25% due 11/15/2013 (Insured: Natl-Re) | | AA/Aa2 | | | 3,995,000 | | | | 4,411,519 | |
De Kalb County USD GO, 0% due 1/1/2021 (Capital Appreciation) | | AA-/Aa2 | | | 6,140,000 | | | | 3,559,726 | |
Illinois Educational Facilities, 4.75% due 3/1/2030 put 3/1/2017 (Art Institute of Chicago) | | A+/A1 | | | 3,030,000 | | | | 3,168,229 | |
Illinois Educational Facilities, 5.00% due 3/1/2030 put 3/1/2017 (Art Institute of Chicago) | | NR/NR | | | 3,000,000 | | | | 3,159,960 | |
Illinois Educational Facilities, 5.25% due 3/1/2034 put 3/1/2018 (Art Institute of Chicago) | | NR/NR | | | 3,500,000 | | | | 3,727,570 | |
Illinois Educational Facilities, 3.40% due 11/1/2036 put 11/1/2017 (Medical Terminal Field Museum) | | A/NR | | | 1,300,000 | | | | 1,258,140 | |
Illinois Educational Facilities, 4.15% due 11/1/2036 put 11/1/2012 (Field Museum) | | A/A2 | | | 5,250,000 | | | | 5,435,167 | |
Illinois Educational Facilities, 4.30% due 11/1/2036 put 11/1/2013 (Field Museum) | | A/A2 | | | 3,100,000 | | | | 3,244,739 | |
Illinois Finance Authority, 4.00% due 2/15/2013 (Alexian Brothers Health Systems) | | NR/A3 | | | 1,500,000 | | | | 1,526,190 | |
Illinois Finance Authority, 5.00% due 2/15/2014 (Alexian Brothers Health Systems) | | NR/A3 | | | 3,000,000 | | | | 3,123,750 | |
Illinois Finance Authority, 5.00% due 11/1/2014 (Central Dupage Health) | | AA/NR | | | 5,000,000 | | | | 5,471,300 | |
Illinois Finance Authority, 4.00% due 4/1/2015 (Advocate Health Care) | | AA/Aa2 | | | 3,000,000 | | | | 3,160,320 | |
Illinois Finance Authority, 5.00% due 11/1/2015 (Central Dupage Health) | | AA/NR | | | 5,000,000 | | | | 5,472,900 | |
Certified Semi-Annual Report 19
| | |
| SCHEDULE OF INVESTMENTS, CONTINUED | | |
| |
| Thornburg Limited Term Municipal Fund | | March 31, 2011 (Unaudited) |
| | | | | | | | | | |
Issuer-Description | | Credit Rating†
S&P/ Moody’s | | Principal
Amount | | | Value | |
Illinois Finance Authority, 5.00% due 4/1/2016 (Advocate Health Care) | | AA/Aa2 | | $ | 1,250,000 | | | $ | 1,371,063 | |
Illinois Finance Authority, 5.00% due 11/1/2017 (Rush University Medical Center; Insured: Natl-Re) | | A-/A2 | | | 1,000,000 | | | | 1,041,820 | |
Illinois Finance Authority, 5.50% due 11/1/2018 (Advocate Health Care) | | AA/Aa2 | | | 1,000,000 | | | | 1,123,170 | |
Illinois Finance Authority, 5.00% due 4/1/2020 (Advocate Health Care) | | AA/Aa2 | | | 1,000,000 | | | | 1,061,560 | |
Illinois Finance Authority, 3.875% due 11/1/2030 put 5/1/2012 (Advocate Health Care) | | AA/Aa2 | | | 2,000,000 | | | | 2,068,780 | |
Illinois Finance Authority, 2.625% due 2/1/2033 put 8/1/2015 (Peoples Gas, Light, & Coke Co.) | | A-/A1 | | | 9,500,000 | | | | 9,270,955 | |
Illinois Finance Authority, 4.30% due 6/1/2035 put 6/1/2016 (Peoples Gas, Light, & Coke Co.; Insured: AMBAC) | | A-/A1 | | | 2,450,000 | | | | 2,471,119 | |
Illinois Finance Authority, 3.00% due 7/1/2042 put 5/6/2014 (Prairie Power; Insured: National Rural UTI) | | A/NR | | | 17,150,000 | | | | 17,248,269 | |
Illinois Finance Authority Student Housing, 5.00% due 5/1/2014 | | NR/Baa3 | | | 3,895,000 | | | | 3,996,231 | |
Illinois HFA, 5.50% due 11/15/2011 (Methodist Medical Center; Insured: Natl-Re) | | BBB/A2 | | | 3,000,000 | | | | 3,008,310 | |
Illinois HFA, 5.00% due 11/15/2013 (Northwestern Medical Facility; Insured: Natl-Re) | | NR/A2 | | | 2,470,000 | | | | 2,472,964 | |
Illinois HFA, 6.00% due 7/1/2017 (Lake Forest Hospital) | | AA+/Aa2 | | | 1,500,000 | | | | 1,555,470 | |
Illinois Sales Tax, 5.00% due 6/15/2011 | | AAA/A1 | | | 6,050,000 | | | | 6,099,670 | |
Illinois Sales Tax, 3.50% due 6/15/2012 | | AAA/A1 | | | 6,055,000 | | | | 6,195,960 | |
Illinois Sales Tax, 3.50% due 6/15/2013 | | AAA/A1 | | | 6,455,000 | | | | 6,629,737 | |
Illinois Sales Tax, 3.50% due 6/15/2014 | | AAA/A1 | | | 6,455,000 | | | | 6,624,379 | |
Illinois Sales Tax, 5.125% due 6/15/2015 pre-refunded 6/15/2013 | | AAA/A1 | | | 5,000,000 | | | | 5,471,450 | |
Illinois Sales Tax, 5.00% due 6/15/2016 | | AAA/NR | | | 3,500,000 | | | | 3,804,640 | |
Illinois Sales Tax, 5.50% due 6/15/2016 pre-refunded 6/15/2011 | | NR/NR | | | 980,000 | | | | 990,359 | |
Illinois Sales Tax, 5.50% due 6/15/2016 | | AAA/NR | | | 2,020,000 | | | | 2,029,272 | |
Illinois Sales Tax, 5.50% due 6/15/2016 pre-refunded 6/15/2011 | | AAA/A1 | | | 4,000,000 | | | | 4,042,680 | |
Illinois Toll Highway Authority, 5.50% due 1/1/2014 (Insured: AGM) | | AA+/Aa3 | | | 17,190,000 | | | | 18,480,281 | |
Illinois Toll Highway Authority, 5.50% due 1/1/2015 (Insured: AGM) | | AA+/Aa3 | | | 5,000,000 | | | | 5,421,500 | |
Kane County Forest Preservation District GO, 4.00% due 12/15/2015 (Insured: AMBAC) | | AA/NR | | | 2,295,000 | | | | 2,334,772 | |
Kane County Forest Preservation District GO, 5.00% due 12/15/2015 (Insured: Natl-Re/FGIC) | | AA/NR | | | 2,780,000 | | | | 3,093,167 | |
Kane County Waubonsee Community College District GO, 0% due 12/15/2013 (Insured: Natl-Re/FGIC) | | AA+/Aa2 | | | 3,000,000 | | | | 2,651,790 | |
Lake County Community High School District GO, 0% due 12/1/2011 (Insured: Natl-Re/FGIC) | | NR/NR | | | 3,235,000 | | | | 3,172,403 | |
McHenry & Kane Counties Community Consolidated School District GO, 0% due 1/1/2012 (Insured: Natl-Re/FGIC) | | BBB/NR | | | 2,200,000 | | | | 2,158,112 | |
McLean & Woodford Counties (USD) GO, 6.25% due 12/1/2014 (Insured: AGM) | | NR/Aa2 | | | 1,005,000 | | | | 1,039,049 | |
Melrose Park Water Revenue, 5.20% due 7/1/2018 (Insured: Natl-Re) | | BBB/Baa1 | | | 1,190,000 | | | | 1,200,139 | |
Metropolitan Pier & Exposition Authority Dedicated State Tax, 0% due 6/15/2013 pre-refunded 10/18/2010 (Insured: Natl-Re) (ETM) | | BBB/A2 | | | 485,000 | | | | 470,305 | |
Metropolitan Pier & Exposition Authority Dedicated State Tax, 0% due 6/15/2013 (Insured: Natl-Re) | | AAA/A2 | | | 560,000 | | | | 530,835 | |
Metropolitan Pier & Exposition Authority Dedicated State Tax, 0% due 6/15/2016 (McCormick Place; Insured: Natl-Re/FGIC) | | BBB/A2 | | | 11,295,000 | | | | 9,216,042 | |
Peoria, Tazewell, Etc. Counties Community College District GO, 4.25% due 12/1/2015 | | AA+/Aa2 | | | 2,360,000 | | | | 2,519,512 | |
Quincy Illinois, 5.00% due 11/15/2014 (Blessing Hospital) | | A-/A3 | | | 1,000,000 | | | | 1,042,550 | |
Quincy Illinois, 5.00% due 11/15/2016 (Blessing Hospital) | | A-/A3 | | | 1,000,000 | | | | 1,024,540 | |
Railsplitter Tobacco Settlement Authority, 5.00% due 6/1/2019 | | A/NR | | | 7,940,000 | | | | 7,897,442 | |
Regional Transportation Authority, 6.25% due 7/1/2014 (Insured: Natl-Re; GO of Authority) | | AA/Aa3 | | | 3,500,000 | | | | 3,888,780 | |
Sangamon County Community Unit School District No. 5, 5.00% due 1/1/2015 (Insured: AGM) | | AA+/NR | | | 2,210,000 | | | | 2,410,668 | |
Southwestern Illinois Development Authority, 5.125% due 8/15/2016 (Anderson Hospital) | | BBB/Baa2 | | | 1,700,000 | | | | 1,734,663 | |
University of Illinois Board of Trustees COP, 5.00% due 10/1/2019 (Insured: AGM) | | AA+/Aa2 | | | 2,000,000 | | | | 2,047,900 | |
Will County Community USD GO, 0% due 11/1/2018 (Insured: AGM) | | AA+/Aa2 | | | 3,370,000 | | | | 2,321,256 | |
INDIANA — 3.58% | | | | | | | | | | |
Allen County Economic Development, 5.00% due 12/30/2012 (Indiana Institute of Technology) | | NR/NR | | | 1,370,000 | | | | 1,400,072 | |
Allen County Jail Building Corp. First Mtg, 5.00% due 10/1/2014 (Insured: Syncora) | | NR/Aa2 | | | 1,000,000 | | | | 1,095,420 | |
20 Certified Semi-Annual Report
| | |
| SCHEDULE OF INVESTMENTS, CONTINUED | | |
| |
| Thornburg Limited Term Municipal Fund | | March 31, 2011 (Unaudited) |
| | | | | | | | | | |
Issuer-Description | | Credit Rating†
S&P/ Moody’s | | Principal
Amount | | | Value | |
Allen County Jail Building Corp. First Mtg, 5.00% due 10/1/2015 (Insured: Syncora) | | NR/Aa2 | | $ | 1,480,000 | | | $ | 1,631,774 | |
Allen County Jail Building Corp. First Mtg, 5.00% due 10/1/2016 (Insured: Syncora) | | NR/Aa2 | | | 1,520,000 | | | | 1,666,467 | |
Allen County Redevelopment District, 5.00% due 11/15/2016 | | NR/A2 | | | 1,000,000 | | | | 1,086,270 | |
Avon Community School Building Corp., 5.00% due 7/15/2017 (Insured: AMBAC) (State Aid Withholding) | | A/NR | | | 2,500,000 | | | | 2,754,825 | |
Ball State University Student Fee, 5.75% due 7/1/2012 (Insured: Natl-Re/FGIC) | | AA-/Aa3 | | | 1,000,000 | | | | 1,032,550 | |
Boonville Junior High School Building Corp., 0% due 7/1/2011 (State Aid Withholding) | | A/NR | | | 950,000 | | | | 944,870 | |
Brownsburg 1999 School Building Corp., 5.00% due 7/15/2013 (Insured: AGM) (State Aid Withholding) | | AA+/Aa3 | | | 1,000,000 | | | | 1,081,690 | |
Brownsburg 1999 School Building Corp., 5.00% due 7/15/2018 (Insured: AGM) (State Aid Withholding) | | AA+/NR | | | 3,430,000 | | | | 3,629,146 | |
Brownsburg 1999 School Building Corp., 5.00% due 8/1/2018 (Insured: AGM) (State Aid Withholding) | | AA+/Aa3 | | | 1,250,000 | | | | 1,322,763 | |
Carmel Redevelopment Authority, 0% due 2/1/2015 (Performing Arts Center) | | AA+/Aa1 | | | 1,575,000 | | | | 1,414,854 | |
Carmel Redevelopment District COP, 5.75% due 7/15/2022 | | NR/NR | | | 4,470,000 | | | | 4,160,318 | |
Clay Multiple School Building Corp., 4.00% due 7/15/2015 (State Aid Withholding) | | AA+/NR | | | 1,000,000 | | | | 1,070,170 | |
Clay Multiple School Building Corp., 5.00% due 7/15/2016 (State Aid Withholding) | | AA+/NR | | | 1,295,000 | | | | 1,447,538 | |
Clay Multiple School Building Corp., 5.00% due 1/15/2017 (State Aid Withholding) | | AA+/NR | | | 1,000,000 | | | | 1,117,510 | |
Evansville Vanderburgh, 5.00% due 7/15/2014 (Insured: AMBAC) | | A+/NR | | | 1,000,000 | | | | 1,084,490 | |
Evansville Vanderburgh, 5.00% due 7/15/2015 (Insured: AMBAC) | | A+/NR | | | 1,000,000 | | | | 1,091,300 | |
Fort Wayne Sewer Works Improvement, 4.25% due 8/1/2013 | | NR/Aa3 | | | 1,715,000 | | | | 1,803,545 | |
Fort Wayne Sewer Works Improvement, 4.25% due 8/1/2014 | | NR/Aa3 | | | 1,745,000 | | | | 1,849,037 | |
Fort Wayne Sewer Works Improvement, 4.25% due 8/1/2015 | | NR/Aa3 | | | 1,780,000 | | | | 1,884,059 | |
Franklin Township Independent School Building Corp., 5.00% due 7/5/2018 (Insured: Natl-Re/ FGIC) (State Aid Withholding) | | A/NR | | | 3,900,000 | | | | 3,936,153 | |
Hammond Multi-School Building Corp., 5.00% due 1/15/2014 (Insured: Natl-Re/FGIC) (State Aid Withholding) | | AA+/NR | | | 1,000,000 | | | | 1,095,540 | |
Indiana Bond Bank, 5.25% due 10/15/2016 (Special Gas Program) | | NR/Aa3 | | | 1,545,000 | | | | 1,654,324 | |
Indiana Bond Bank, 5.00% due 10/15/2017 | | NR/Aa3 | | | 5,000,000 | | | | 5,224,250 | |
Indiana Finance Authority, 5.00% due 5/1/2015 (Parkview Health Systems) | | A+/A1 | | | 1,500,000 | | | | 1,607,715 | |
Indiana Finance Authority, 5.00% due 5/1/2016 (Parkview Health Systems) | | A+/A1 | | | 3,090,000 | | | | 3,279,942 | |
Indiana Finance Authority, 5.00% due 5/1/2017 (Parkview Health Systems) | | A+/A1 | | | 1,000,000 | | | | 1,052,770 | |
Indiana Finance Authority Revenue, 5.00% due 7/1/2011 (Wabash Correctional Facilities) | | AA+/Aa1 | | | 1,390,000 | | | | 1,405,512 | |
Indiana Finance Authority Revenue, 4.90% due 1/1/2016 (Indianapolis Power & Light Co.) | | BBB/A3 | | | 11,650,000 | | | | 12,452,102 | |
Indiana Finance Authority Revenue, 5.00% due 7/1/2016 (Forensic & Health Science; Insured: Natl-Re) | | AA+/Aa1 | | | 1,030,000 | | | | 1,142,002 | |
Indiana Finance Authority Revenue, 5.25% due 7/1/2018 (Wabash Correctional Facilities) | | AA+/Aa1 | | | 1,000,000 | | | | 1,134,840 | |
Indiana Finance Authority Revenue, 5.25% due 7/1/2018 (Rockville Correctional Facilities) | | AA+/Aa1 | | | 2,150,000 | | | | 2,439,906 | |
Indiana Finance Authority Revenue, 5.00% due 11/1/2018 | | AA+/Aa2 | | | 2,750,000 | | | | 3,024,120 | |
Indiana Health Facilities, 5.00% due 11/1/2014 (Sisters of St. Francis) | | NR/Aa3 | | | 1,000,000 | | | | 1,097,150 | |
Indiana Health Facilities, 5.50% due 11/15/2016 (Ascension Health Credit Group) | | AA/Aa1 | | | 1,385,000 | | | | 1,482,767 | |
Indiana Health Facilities, 5.00% due 11/1/2018 (Sisters of St. Francis) | | NR/Aa3 | | | 1,250,000 | | | | 1,365,463 | |
Indiana Health Facilities, 5.75% due 11/1/2021 pre-refunded 11/1/2011 (Sisters of St. Francis) | | NR/Aa3 | | | 3,545,000 | | | | 3,689,175 | |
a Indiana Health Facilities, 5.00% due 10/1/2027 put 6/1/2017 (Ascension Health) | | NR/NR | | | 7,000,000 | | | | 7,662,830 | |
Indiana Health Facilities, 3.625% due 11/15/2036 put 8/1/2011 (Ascension Health) | | AA/Aa1 | | | 3,955,000 | | | | 3,997,714 | |
Indiana Multi-School Building Corp. First Mtg, 5.00% due 7/15/2016 (Insured: Natl-Re) | | AA/Baa1 | | | 5,000,000 | | | | 5,574,300 | |
Indianapolis Local Public Improvement Bond Bank, 6.75% due 2/1/2014 | | AA/NR | | | 1,005,000 | | | | 1,078,134 | |
Indianapolis Local Public Improvement Bond Bank, 5.00% due 1/1/2015 (Waterworks; Insured: Natl-Re) | | A+/A2 | | | 1,000,000 | | | | 1,087,430 | |
Indianapolis Local Public Improvement Bond Bank, 5.00% due 7/1/2015 (Waterworks; Insured: Natl-Re) | | A+/A2 | | | 1,000,000 | | | | 1,095,300 | |
Indianapolis Local Public Improvement Bond Bank, 5.00% due 7/1/2016 (Insured: Natl-Re/FGIC) | | AA+/Aa1 | | | 1,030,000 | | | | 1,133,608 | |
Indianapolis Multi-School Building Corp. First Mtg, 5.50% due 7/15/2015 (Insured: Natl-Re) | | AA/Baa1 | | | 1,690,000 | | | | 1,907,537 | |
Certified Semi-Annual Report 21
| | |
| SCHEDULE OF INVESTMENTS, CONTINUED | | |
| |
| Thornburg Limited Term Municipal Fund | | March 31, 2011 (Unaudited) |
| | | | | | | | | | | | |
Issuer-Description | | Credit Rating†
S&P/ Moody’s | | | Principal
Amount | | | Value | |
Ivy Tech Community College, 4.00% due 7/1/2013 | | | AA-/NR | | | $ | 1,000,000 | | | $ | 1,059,780 | |
Ivy Tech Community College, 4.00% due 7/1/2014 | | | AA-/NR | | | | 1,500,000 | | | | 1,611,555 | |
Knox Middle School Building Corp. First Mtg, 0% due 1/15/2020 (Insured: Natl-Re/ FGIC) (State Aid Withholding) | | | BBB/NR | | | | 1,295,000 | | | | 813,804 | |
Madison Schools Lydia Middleton Building Corp., 5.00% due 7/15/2014 (Insured: Natl-Re/ FGIC) (State Aid Withholding) | | | AA+/NR | | | | 1,200,000 | | | | 1,335,864 | |
Madison Schools Lydia Middleton Building Corp., 5.00% due 7/15/2015 (Insured: Natl-Re/ FGIC) (State Aid Withholding) | | | AA+/NR | | | | 1,250,000 | | | | 1,404,563 | |
Mount Vernon of Hancock County First Mtg, 5.00% due 7/15/2013 (Insured: Natl-Re) (State Aid Withholding) | | | A+/Baa1 | | | | 1,055,000 | | | | 1,130,021 | |
Mount Vernon of Hancock County First Mtg, 5.00% due 7/15/2014 (Insured: Natl-Re) (State Aid Withholding) | | | A+/Baa1 | | | | 1,135,000 | | | | 1,235,709 | |
Mount Vernon of Hancock County First Mtg, 5.00% due 7/15/2015 (Insured: Natl-Re) (State Aid Withholding) | | | A+/Baa1 | | | | 1,140,000 | | | | 1,249,349 | |
Noblesville Redevelopment Authority, 5.00% due 8/1/2016 (146th Street Extension A) | | | AA-/NR | | | | 1,660,000 | | | | 1,845,356 | |
Perry Township Multi-School Building Corp., 5.00% due 7/10/2014 (Insured: AGM) (State Aid Withholding) | | | NR/Aa2 | | | | 2,130,000 | | | | 2,338,846 | |
Plainfield Community High School Building Corp. First Mtg, 5.00% due 1/15/2015 (Insured: Natl-Re/FGIC) | | | A/NR | | | | 1,445,000 | | | | 1,565,715 | |
Rockport PCR, 6.25% due 6/1/2025 put 6/2/2014 (Indiana Michigan Power Co.) | | | BBB/Baa2 | | | | 4,100,000 | | | | 4,506,064 | |
Rockport PCR, 6.25% due 6/1/2025 put 6/2/2014 (Indiana Michigan Power Co.) | | | BBB/Baa2 | | | | 1,000,000 | | | | 1,099,040 | |
South Bend Community School Building Corp., 4.00% due 1/15/2013 (State Aid Withholding) | | | AA+/NR | | | | 1,545,000 | | | | 1,617,522 | |
South Bend Community School Building Corp., 4.00% due 1/15/2013 | | | AA+/NR | | | | 1,400,000 | | | | 1,465,716 | |
South Bend Community School Building Corp., 4.00% due 7/15/2013 (State Aid Withholding) | | | AA+/NR | | | | 1,000,000 | | | | 1,058,350 | |
South Bend Community School Building Corp., 5.00% due 7/15/2016 (Insured: Natl-Re/FGIC) (State Aid Withholding) | | | AA+/NR | | | | 1,785,000 | | | | 2,015,390 | |
Vincennes University, 3.00% due 6/1/2014 | | | NR/Aa3 | | | | 1,000,000 | | | | 1,036,730 | |
Vincennes University, 3.00% due 6/1/2015 | | | NR/Aa3 | | | | 1,000,000 | | | | 1,033,810 | |
Vincennes University, 4.00% due 6/1/2018 | | | NR/Aa3 | | | | 1,000,000 | | | | 1,047,960 | |
Vincennes University, 5.00% due 6/1/2020 | | | NR/Aa3 | | | | 1,000,000 | | | | 1,096,970 | |
Warren Township Vision 2005, 5.00% due 7/10/2015 (Insured: Natl-Re/FGIC) (State Aid Withholding) | | | AA+/NR | | | | 2,895,000 | | | | 3,167,738 | |
Wawasee Community School Corp. First Mtg, 5.50% due 7/15/2011 (State Aid Withholding) (ETM) | | | AA+/NR | | | | 560,000 | | | | 568,400 | |
West Clark School Building Corp., 5.25% due 1/15/2014 (Insured: Natl-Re) | | | AA+/Baa1 | | | | 1,335,000 | | | | 1,479,727 | |
West Clark School Building Corp. First Mtg, 5.75% due 7/15/2011 (Insured: Natl-Re/FGIC) (State Aid Withholding) | | | AA+/NR | | | | 1,075,000 | | | | 1,091,759 | |
IOWA — 0.42% | | | | | | | | | | | | |
Des Moines Limited Obligation, 4.40% due 12/1/2015 put 12/1/2011 (Des Moines Parking Associates; LOC: Wells Fargo Bank) | | | NR/NR | | | | 1,980,000 | | | | 1,984,000 | |
Dubuque Community School District, 2.75% due 7/1/2011 | | | NR/NR | | | | 450,000 | | | | 451,319 | |
Dubuque Community School District, 2.75% due 1/1/2012 | | | NR/NR | | | | 1,500,000 | | | | 1,511,670 | |
Iowa Health Facilities Revenue, 5.00% due 2/15/2014 (Iowa Health System; Insured: AGM) | | | NR/Aa3 | | | | 2,500,000 | | | | 2,690,325 | |
Iowa Health Facilities Revenue, 5.00% due 2/15/2015 (Iowa Health System; Insured: AGM) | | | NR/Aa3 | | | | 2,300,000 | | | | 2,487,473 | |
Iowa Health Facilities Revenue, 5.00% due 2/15/2016 (Iowa Health System; Insured: AGM) | | | NR/Aa3 | | | | 1,600,000 | | | | 1,734,784 | |
Iowa Health Facilities Revenue, 5.00% due 8/15/2016 (Iowa Health System; Insured: AGM) | | | NR/Aa3 | | | | 1,500,000 | | | | 1,631,310 | |
Iowa Health Facilities Revenue, 5.00% due 2/15/2017 (Iowa Health System; Insured: AGM) | | | NR/Aa3 | | | | 1,600,000 | | | | 1,727,120 | |
Iowa Health Facilities Revenue, 5.00% due 8/15/2017 (Iowa Health System; Insured: AGM) | | | NR/Aa3 | | | | 990,000 | | | | 1,069,655 | |
Iowa Health Facilities Revenue, 5.00% due 2/15/2018 (Iowa Health System; Insured: AGM) | | | NR/Aa3 | | | | 1,405,000 | | | | 1,507,649 | |
KANSAS — 0.69% | | | | | | | | | | | | |
Burlington Environmental Improvement, 5.25% due 12/1/2023 put 4/1/2013 (Kansas City Power & Light; Insured: Syncora) | | | BBB+/A3 | | | | 5,000,000 | | | | 5,294,750 | |
22 Certified Semi-Annual Report
| | |
| SCHEDULE OF INVESTMENTS, CONTINUED | | |
| |
| Thornburg Limited Term Municipal Fund | | March 31, 2011 (Unaudited) |
| | | | | | | | | | | | |
Issuer-Description | | Credit Rating†
S&P/ Moody’s | | | Principal
Amount | | | Value | |
Burlington Environmental Improvement, 5.375% due 9/1/2035 put 4/1/2013 (Kansas City Power & Light; Insured: Natl-Re/FGIC) | | | BBB/Baa2 | | | $ | 12,500,000 | | | $ | 13,267,375 | |
Johnson County USD GO, 4.50% due 10/1/2014 | | | AA/Aaa | | | | 5,750,000 | | | | 5,857,008 | |
Kansas Development Finance Authority, 5.00% due 11/1/2015 | | | AA/Aa2 | | | | 2,605,000 | | | | 2,932,943 | |
KENTUCKY — 0.40% | | | | | | | | | | | | |
Jefferson County School District, 5.25% due 1/1/2016 (Insured: AGM) | | | AA+/Aa2 | | | | 2,145,000 | | | | 2,432,237 | |
Kentucky Economic DFA, 6.50% due 10/1/2020 | | | NR/NR | | | | 3,645,000 | | | | 3,679,044 | |
Kentucky Economic DFA, 0% due 10/1/2021 (Norton Health Care; Insured: Natl-Re) | | | BBB/Baa1 | | | | 2,100,000 | | | | 1,132,887 | |
Kentucky Economic DFA, 5.00% due 5/1/2039 put 11/11/2014 (Catholic Health) | | | AA/Aa2 | | | | 5,000,000 | | | | 5,502,900 | |
Kentucky Municipal Power Agency, 4.00% due 9/1/2015 (Insured: Assured Guaranty) | | | AA+/Aa3 | | | | 2,955,000 | | | | 3,148,139 | |
LOUISIANA — 3.61% | | | | | | | | | | | | |
Bossier City Louisiana Public Improvement, 4.00% due 12/1/2018 (Insured: AGM) | | | AA+/Aa3 | | | | 2,020,000 | | | | 2,098,073 | |
Bossier City Louisiana Public Improvement, 4.50% due 12/1/2021 (Insured: AGM) | | | AA+/Aa3 | | | | 2,240,000 | | | | 2,306,326 | |
East Baton Rouge Sewer, 4.00% due 2/1/2013 | | | AA-/Aa2 | | | | 1,000,000 | | | | 1,050,950 | |
East Baton Rouge Sewer, 5.00% due 2/1/2014 | | | AA-/Aa2 | | | | 1,000,000 | | | | 1,093,820 | |
East Baton Rouge Sewer, 5.00% due 2/1/2018 (Insured: AGM) | | | AA+/Aa2 | | | | 3,000,000 | | | | 3,327,030 | |
East Baton Rouge Sewer Commission, 3.00% due 2/1/2012 | | | AA-/Aa2 | | | | 1,000,000 | | | | 1,018,680 | |
Ernest N. Morial New Orleans Exhibit Hall, 5.00% due 7/15/2013 (Insured: AMBAC) | | | BBB/NR | | | | 2,075,000 | | | | 2,170,740 | |
Jefferson Sales Tax, 5.00% due 12/1/2018 (Insured: AGM) | | | AA+/Aa3 | | | | 2,000,000 | | | | 2,226,840 | |
Lafayette Utilities Revenue, 4.00% due 11/1/2016 | | | A+/A1 | | | | 1,395,000 | | | | 1,477,975 | |
Lafayette Utilities Revenue, 4.00% due 11/1/2018 | | | A+/A1 | | | | 1,910,000 | | | | 1,966,784 | |
Lafayette Utilities Revenue, 5.00% due 11/1/2019 | | | A+/A1 | | | | 1,000,000 | | | | 1,085,330 | |
Louisiana Citizens Property Insurance Corp., 5.00% due 6/1/2015 (Insured: AMBAC) | | | A-/Baa1 | | | | 10,265,000 | | | | 10,874,228 | |
Louisiana Environmental Facilities & Community Development Authority, 5.00% due 9/1/2012 (Bellemont Apartments) | | | NR/Ba3 | | | | 280,000 | | | | 279,838 | |
Louisiana Environmental Facilities & Community Development Authority, 4.00% due 10/1/2013 (LCTCS Facilities Corp.) | | | A+/A1 | | | | 1,500,000 | | | | 1,580,580 | |
Louisiana Environmental Facilities & Community Development Authority, 4.00% due 10/1/2014 (LCTCS Facilities Corp.) | | | A+/A1 | | | | 1,500,000 | | | | 1,592,820 | |
Louisiana Environmental Facilities & Community Development Authority, 5.00% due 3/1/2015 (Independence Stadium) | | | A/NR | | | | 1,000,000 | | | | 1,074,740 | |
Louisiana Environmental Facilities & Community Development Authority, 5.00% due 3/1/2016 | | | | | | | | | | | | |
(Independence Stadium) | | | A/NR | | | | 1,000,000 | | | | 1,076,640 | |
Louisiana Environmental Facilities & Community Development Authority, 5.00% due 3/1/2017 (Independence Stadium) | | | A/NR | | | | 1,265,000 | | | | 1,357,750 | |
Louisiana Environmental Facilities & Community Development Authority, 5.00% due 3/1/2018 (Independence Stadium) | | | A/NR | | | | 1,000,000 | | | | 1,066,220 | |
Louisiana Offshore Terminal Authority, 5.00% due 10/1/2018 (Loop LLC) | | | NR/NR | | | | 22,000,000 | | | | 23,880,780 | |
Louisiana Public Facilities Authority Hospital Revenue, 5.75% due 7/1/2015 (Franciscan Missionaries; Insured: AGM) | | | AA+/Aa3 | | | | 1,325,000 | | | | 1,469,862 | |
Louisiana Public Facilities Authority Revenue, 5.00% due 8/1/2012 (Department of Public Safety; Insured: AGM) | | | AA+/Aa3 | | | | 1,250,000 | | | | 1,307,550 | |
Louisiana Public Facilities Authority Revenue, 5.00% due 8/1/2013 (Department of Public Safety; Insured: AGM) | | | AA+/Aa3 | | | | 2,500,000 | | | | 2,668,075 | |
Louisiana Public Facilities Authority Revenue, 5.00% due 5/15/2014 (Ochsner Clinic Foundation) | | | NR/Baa1 | | | | 1,000,000 | | | | 1,026,310 | |
Louisiana Public Facilities Authority Revenue, 5.00% due 5/15/2015 (Ochsner Clinic Foundation) | | | NR/Baa1 | | | | 1,825,000 | | | | 1,869,311 | |
Louisiana Public Facilities Authority Revenue, 2.875% due 11/1/2015 (Entergy Gulf States) | | | BBB+/NR | | | | 2,500,000 | | | | 2,479,900 | |
Louisiana Public Facilities Authority Revenue, 5.00% due 5/15/2016 (Ochsner Clinic Foundation) | | | NR/Baa1 | | | | 1,000,000 | | | | 1,005,460 | |
Louisiana Public Facilities Authority Revenue, 5.00% due 5/15/2017 (Ochsner Clinic Foundation) | | | NR/Baa1 | | | | 1,035,000 | | | | 1,025,592 | |
Louisiana Public Facilities Authority Revenue, 5.00% due 5/15/2018 (Ochsner Clinic Foundation) | | | NR/Baa1 | | | | 1,000,000 | | | | 977,120 | |
Certified Semi-Annual Report 23
| | |
| SCHEDULE OF INVESTMENTS, CONTINUED | | |
| |
| Thornburg Limited Term Municipal Fund | | March 31, 2011 (Unaudited) |
| | | | | | | | | | | | |
Issuer-Description | | Credit Rating†
S&P/ Moody’s | | | Principal
Amount | | | Value | |
Louisiana Public Facilities Authority Revenue, 7.00% due 12/1/2038 put 12/1/2011 (Cleco Power LLC) | | | BBB/Baa2 | | | $ | 9,000,000 | | | $ | 9,271,620 | |
Louisiana State GO, 5.00% due 8/1/2017 (Insured: Natl-Re) | | | AA-/Aa2 | | | | 4,000,000 | | | | 4,457,400 | |
Louisiana State Office Facilities Corp. Lease Revenue, 3.75% due 3/1/2015 (Capitol Complex) | | | A+/Aa3 | | | | 5,000,000 | | | | 5,162,950 | |
Louisiana State Office Facilities Corp. Lease Revenue, 5.00% due 5/1/2015 (State Capitol) | | | NR/Aa3 | | | | 2,830,000 | | | | 3,040,410 | |
Louisiana State Office Facilities Corp. Lease Revenue, 5.00% due 5/1/2016 (State Capitol) | | | NR/Aa3 | | | | 1,000,000 | | | | 1,075,050 | |
Louisiana State Office Facilities Corp. Lease Revenue, 5.00% due 5/1/2018 (State Capitol) | | | NR/Aa3 | | | | 2,500,000 | | | | 2,646,000 | |
Louisiana State Office Facilities Corp. Lease Revenue, 5.00% due 5/1/2021 (State Capitol) | | | NR/Aa3 | | | | 3,595,000 | | | | 3,664,276 | |
Monroe Sales Tax Increment Garrett Road Economic Development Area, 5.00% due 3/1/2017 pre-refunded 3/1/2015 (Insured: Radian) | | | NR/NR | | | | 1,505,000 | | | | 1,661,084 | |
Morehouse Parish PCR, 5.25% due 11/15/2013 (International Paper Co.) | | | BBB/Baa3 | | | | 2,400,000 | | | | 2,565,864 | |
Parishwide School District GO, 5.00% due 9/1/2016 (Insured: AGM) | | | AA+/Aa3 | | | | 4,500,000 | | | | 4,932,630 | |
Parishwide School District GO, 5.00% due 9/1/2018 (Insured: AGM) | | | AA+/Aa3 | | | | 4,800,000 | | | | 5,186,160 | |
Parishwide School District GO, 5.00% due 9/1/2020 (Insured: AGM) | | | AA+/Aa3 | | | | 3,840,000 | | | | 4,053,197 | |
Plaquemines Parish Law Enforcement District GO, 5.00% due 9/1/2019 | | | BBB+/NR | | | | 1,005,000 | | | | 1,031,834 | |
Plaquemines Parish Law Enforcement District GO, 5.00% due 9/1/2021 | | | BBB+/NR | | | | 1,115,000 | | | | 1,121,043 | |
Regional Transit Authority, 8.00% due 12/1/2011 (Insured: Natl-Re/FGIC) | | | BBB/NR | | | | 1,250,000 | | | | 1,299,437 | |
Regional Transit Authority, 0% due 12/1/2015 (Insured: Natl-Re/FGIC) | | | BBB/NR | | | | 3,670,000 | | | | 2,977,801 | |
Regional Transit Authority Sales Tax, 5.00% due 12/1/2017 (Insured: AGM) | | | AA+/Aa3 | | | | 755,000 | | | | 838,178 | |
Regional Transit Authority Sales Tax, 5.00% due 12/1/2019 (Insured: AGM) | | | AA+/Aa3 | | | | 1,000,000 | | | | 1,091,170 | |
Regional Transit Authority Sales Tax, 5.00% due 12/1/2021 (Insured: AGM) | | | NR/NR | | | | 1,000,000 | | | | 1,069,280 | |
Regional Transit Authority Sales Tax, 5.00% due 12/1/2022 (Insured: AGM) | | | AA+/Aa3 | | | | 1,110,000 | | | | 1,172,127 | |
St. Tammany Parish, 5.00% due 6/1/2017 (Insured: CIFG) | | | A+/NR | | | | 1,405,000 | | | | 1,534,808 | |
Terrebonne Parish Louisiana Hospital Service, 4.00% due 4/1/2014 (General Medical Center) | | | A/A2 | | | | 800,000 | | | | 826,624 | |
Terrebonne Parish Louisiana Hospital Service, 4.00% due 4/1/2015 (General Medical Center) | | | A/A2 | | | | 575,000 | | | | 592,578 | |
Terrebonne Parish Louisiana Hospital Service, 4.00% due 4/1/2017 (General Medical Center) | | | A/A2 | | | | 1,000,000 | | | | 996,730 | |
Terrebonne Parish Louisiana Hospital Service, 5.00% due 4/1/2018 (General Medical Center) | | | A/A2 | | | | 1,000,000 | | | | 1,043,770 | |
Terrebonne Parish Louisiana Hospital Service, 5.00% due 4/1/2019 (General Medical Center) | | | A/A2 | | | | 1,810,000 | | | | 1,867,540 | |
Terrebonne Parish Louisiana Hospital Service, 5.00% due 4/1/2021 (General Medical Center) | | | A/A2 | | | | 2,320,000 | | | | 2,355,287 | |
MAINE — 0.09% | | | | | | | | | | | | |
Maine Finance Authority Solid Waste Disposal, 3.80% due 11/1/2015 (Waste Management, Inc.) | | | BBB/NR | | | | 3,440,000 | | | | 3,441,342 | |
MASSACHUSETTS — 2.10% | | | | | | | | | | | | |
Berkshire Wind Power Cooperative Corp., 5.00% due 7/1/2017 | | | A-/NR | | | | 2,540,000 | | | | 2,741,879 | |
Berkshire Wind Power Cooperative Corp., 5.00% due 7/1/2018 | | | A-/NR | | | | 2,825,000 | | | | 3,020,546 | |
Berkshire Wind Power Cooperative Corp., 5.00% due 7/1/2019 | | | A-/NR | | | | 2,765,000 | | | | 2,919,674 | |
Berkshire Wind Power Cooperative Corp., 5.00% due 7/1/2020 | | | A-/NR | | | | 2,965,000 | | | | 3,089,560 | |
Massachusetts DFA, 5.625% due 1/1/2015 (Semass Partnership; Insured: Natl-Re) | | | BBB/Baa1 | | | | 1,025,000 | | | | 1,047,530 | |
Massachusetts DFA, 3.45% due 12/1/2015 (Carleton-Willard Village) | | | A-/NR | | | | 2,760,000 | | | | 2,746,586 | |
Massachusetts DFA, 5.625% due 1/1/2016 (Semass Partnership; Insured: Natl-Re) | | | BBB/Baa1 | | | | 1,970,000 | | | | 2,011,232 | |
Massachusetts Educational Financing Authority, 5.25% due 1/1/2016 | | | AA/NR | | | | 2,450,000 | | | | 2,649,356 | |
Massachusetts Educational Financing Authority, 5.50% due 1/1/2017 | | | AA/NR | | | | 1,700,000 | | | | 1,864,458 | |
Massachusetts Educational Financing Authority, 5.50% due 1/1/2018 | | | AA/NR | | | | 11,170,000 | | | | 12,124,365 | |
Massachusetts Educational Financing Authority, 5.75% due 1/1/2020 | | | AA/NR | | | | 7,500,000 | | | | 8,171,325 | |
Massachusetts GO, 0.26% due 3/1/2026 put 4/1/2011 (SPA: Bank of America N.A.) (daily demand notes) | | | AA/Aa1 | | | | 4,370,000 | | | | 4,370,000 | |
Massachusetts Health & Educational Facilities Authority, 5.00% due 10/1/2011 (Berkshire Health Systems; Insured: AGM) | | | AA+/NR | | | | 2,345,000 | | | | 2,389,532 | |
Massachusetts Health & Educational Facilities Authority, 5.375% due 5/15/2012 (New England Medical Center Hospital; Insured: Natl-Re/FGIC) (ETM) | | | NR/NR | | | | 3,415,000 | | | | 3,597,771 | |
Massachusetts Health & Educational Facilities Authority, 5.00% due 10/1/2012 (Berkshire Health Systems; Insured: AGM) | | | AA+/NR | | | | 2,330,000 | | | | 2,442,329 | |
24 Certified Semi-Annual Report
| | |
| SCHEDULE OF INVESTMENTS, CONTINUED | | |
| |
| Thornburg Limited Term Municipal Fund | | March 31, 2011 (Unaudited) |
| | | | | | | | | | |
Issuer-Description | | Credit Rating†
S&P/ Moody’s | | Principal
Amount | | | Value | |
Massachusetts Health & Educational Facilities Authority, 5.00% due 10/1/2013 (Berkshire Health Systems; Insured: AGM) | | AA+/NR | | $ | 3,215,000 | | | $ | 3,442,140 | |
Massachusetts Health & Educational Facilities Authority, 5.00% due 7/1/2014 (UMass Memorial Health Care) | | BBB+/Baa1 | | | 2,750,000 | | | | 2,900,645 | |
Massachusetts Health & Educational Facilities Authority, 5.00% due 7/1/2015 (UMass Memorial Health Care) | | BBB+/Baa1 | | | 2,625,000 | | | | 2,773,785 | |
Massachusetts Health & Educational Facilities Authority, 5.00% due 7/1/2018 (UMass Memorial Health Care) | | BBB+/Baa1 | | | 4,290,000 | | | | 4,399,781 | |
Massachusetts Health & Educational Facilities Authority, 5.00% due 10/1/2019 (Berkshire Health Systems; Insured: AGM) | | AA+/NR | | | 1,750,000 | | | | 1,801,293 | |
Massachusetts Solid Waste Disposal Revenue, 5.75% due 12/1/2042 put 5/1/2019 (Dominion Energy Brayton) | | A-/Baa2 | | | 2,000,000 | | | | 2,128,720 | |
Massachusetts Western Turnpike Revenue, 5.55% due 1/1/2017
(Insured: Natl-Re) | | A/Aa3 | | | 11,265,000 | | | | 11,313,777 | |
MICHIGAN — 6.50% | | | | | | | | | | |
Battle Creek, 5.00% due 5/1/2020 (Insured: AMBAC) | | AA-/Aa3 | | | 3,200,000 | | | | 3,305,216 | |
Byron Center Michigan Public Schools, 3.00% due 5/1/2013 (Insured: Q-SBLF) | | AA-/NR | | | 1,745,000 | | | | 1,793,912 | |
Byron Center Michigan Public Schools, 4.00% due 5/1/2015 (Insured: Q-SBLF) | | AA-/NR | | | 1,985,000 | | | | 2,099,634 | |
Byron Center Michigan Public Schools, 4.00% due 5/1/2017 (Insured: AGM/Q-SBLF) | | AA+/NR | | | 1,305,000 | | | | 1,361,833 | |
Byron Center Michigan Public Schools, 4.00% due 5/1/2018 (Insured: AGM/Q-SBLF) | | AA+/NR | | | 1,935,000 | | | | 1,988,696 | |
Byron Center Michigan Public Schools, 4.00% due 5/1/2020 (Insured: AGM/Q-SBLF) | | AA+/NR | | | 1,000,000 | | | | 985,290 | |
Detroit Sewage Disposal Revenue, 5.00% due 7/1/2013 (Insured: AGM) | | AA+/Aa3 | | | 1,590,000 | | | | 1,689,327 | |
Detroit Sewage Disposal Revenue, 5.00% due 7/1/2014 (Insured: Natl-Re) | | A/A2 | | | 2,000,000 | | | | 2,122,260 | |
Detroit Sewage Disposal Revenue, 5.50% due 7/1/2015 (Insured: AGM) | | AA+/Aa3 | | | 3,920,000 | | | | 4,317,998 | |
Detroit Sewage Disposal Revenue, 5.50% due 7/1/2016 (Insured: Natl-Re) | | A+/A1 | | | 375,000 | | | | 410,475 | |
Detroit Sewage Disposal Revenue, 5.50% due 7/1/2017 (Insured: AGM) | | AA+/Aa3 | | | 550,000 | | | | 608,960 | |
Detroit Sewage Disposal Revenue, 5.25% due 7/1/2019 (Insured: Natl-Re) | | A+/A1 | | | 3,900,000 | | | | 4,076,982 | |
Detroit Sewage Disposal Revenue, 5.25% due 7/1/2020 (Insured: Natl-Re) | | A+/A1 | | | 3,415,000 | | | | 3,515,435 | |
Detroit Sewage Disposal Revenue, 5.25% due 7/1/2020 (Insured: Natl-Re) | | A+/A1 | | | 4,305,000 | | | | 4,431,610 | |
Detroit Water Supply Systems, 5.40% due 7/1/2011 (Insured: Natl-Re) | | BBB/A1 | | | 1,000,000 | | | | 1,008,730 | |
Detroit Water Supply Systems, 6.00% due 7/1/2015 (Insured: Natl-Re) | | A+/A1 | | | 3,280,000 | | | | 3,651,690 | |
Detroit Water Supply Systems, 5.00% due 7/1/2016 (Insured: AGM) | | AA+/Aa3 | | | 2,750,000 | | | | 2,952,950 | |
Dickinson County Economic Development Corp. Environmental Impact, 5.75% due 6/1/2016 (International Paper Co.) | | BBB/Baa3 | | | 8,845,000 | | | | 8,945,214 | |
Dickinson County Health Care Systems, 5.50% due 11/1/2013 (Insured: ACA) | | NR/NR | | | 3,140,000 | | | | 3,156,234 | |
Grand Haven Electric Revenue, 5.50% due 7/1/2016 (Insured: Natl-Re) | | BBB/Baa1 | | | 3,890,000 | | | | 4,144,639 | |
Gull Lake Community School District GO, 0% due 5/1/2013 (Insured: Natl-Re/FGIC) | | BBB/NR | | | 1,480,000 | | | | 1,351,714 | |
Kalamazoo Hospital Finance Authority Facilities Revenue, 4.00% due 5/15/2015 (Bronson Hospital; Insured: AGM) | | NR/Aa3 | | | 1,735,000 | | | | 1,800,115 | |
Kalamazoo Hospital Finance Authority Facilities Revenue, 4.00% due 5/15/2016 (Bronson Hospital; Insured: AGM) | | NR/Aa3 | | | 1,850,000 | | | | 1,903,743 | |
Kalamazoo Hospital Finance Authority Facilities Revenue, 4.50% due 5/15/2017 (Bronson Hospital; Insured: AGM) | | NR/Aa3 | | | 1,830,000 | | | | 1,904,078 | |
Kalamazoo Hospital Finance Authority Facilities Revenue, 5.00% due 5/15/2018 (Bronson Hospital; Insured: AGM) | | AA+/Aa3 | | | 1,520,000 | | | | 1,607,917 | |
Kalamazoo Hospital Finance Authority Facilities Revenue, 5.00% due 5/15/2018 (Bronson Hospital; Insured: AGM) | | AA+/Aa3 | | | 2,500,000 | | | | 2,644,600 | |
Kalamazoo Hospital Finance Authority Facilities Revenue, 5.00% due 5/15/2020 (Bronson Hospital; Insured: AGM) | | NR/Aa3 | | | 1,735,000 | | | | 1,796,992 | |
Kalamazoo Hospital Finance Authority Facilities Revenue, 5.00% due 5/15/2021 (Bronson Hospital; Insured: AGM) | | NR/Aa3 | | | 2,350,000 | | | | 2,408,186 | |
Kent Hospital Finance Authority, 5.25% due 1/15/2047 put 1/15/2014 (Spectrum Health) | | AA/Aa3 | | | 5,865,000 | | | | 6,368,393 | |
Kentwood Public Schools GO, 5.00% due 5/1/2015 (Insured: Natl-Re) | | AA-/Aa2 | | | 4,050,000 | | | | 4,267,485 | |
Certified Semi-Annual Report 25
| | |
| SCHEDULE OF INVESTMENTS, CONTINUED | | |
| |
| Thornburg Limited Term Municipal Fund | | March 31, 2011 (Unaudited) |
| | | | | | | | | | |
Issuer-Description | | Credit Rating†
S&P/ Moody’s | | Principal
Amount | | | Value | |
Lansing Steam & Electric Utility Systems, 5.00% due 7/1/2016 (Insured: AMBAC) | | AA-/Aa3 | | $ | 2,000,000 | | | $ | 2,082,640 | |
Michigan Housing Development Authority Rental Housing Revenue GO, 5.00% due 4/1/2016 | | AA/NR | | | 4,645,000 | | | | 4,773,899 | |
Michigan State Building Authority, 5.25% due 10/15/2014 (Insured: AGM) | | AA+/Aa3 | | | 4,300,000 | | | | 4,660,813 | |
Michigan State Building Authority, 5.00% due 10/15/2015 (Insured: AMBAC) | | A+/Aa3 | | | 6,000,000 | | | | 6,506,100 | |
Michigan State Building Authority, 5.25% due 10/15/2015 (Insured: AGM) | | AA+/Aa3 | | | 1,305,000 | | | | 1,408,421 | |
Michigan State Building Authority, 5.50% due 10/15/2017 | | A+/Aa3 | | | 4,000,000 | | | | 4,410,320 | |
Michigan State COP, 4.25% due 9/1/2031 put 9/1/2011 (Insured: Natl-Re) | | BBB/Baa1 | | | 5,500,000 | | | | 5,542,240 | |
Michigan State COP, 5.00% due 9/1/2031 put 9/1/2011 (Insured: Natl-Re) | | BBB/Baa1 | | | 11,750,000 | | | | 11,876,547 | |
Michigan State HFA, 5.50% due 11/15/2015 (Henry Ford Health System) | | A/A1 | | | 2,300,000 | | | | 2,485,771 | |
Michigan State HFA, 5.00% due 11/15/2017 (Sparrow Memorial Hospital) | | A+/A1 | | | 1,000,000 | | | | 1,035,900 | |
Michigan State HFA, 5.50% due 11/15/2017 (Henry Ford Health System) | | A/A1 | | | 1,530,000 | | | | 1,628,501 | |
Michigan State HFA, 5.50% due 11/15/2018 (Henry Ford Health System) | | A/A1 | | | 3,500,000 | | | | 3,711,960 | |
Michigan State HFA, 5.75% due 12/1/2034 put 12/1/2015 (Trinity Health) | | AA/Aa2 | | | 10,000,000 | | | | 11,506,500 | |
Michigan State Hospital Finance Authority, 5.00% due 11/15/2013 (Sparrow Hospital) | | A+/A1 | | | 1,225,000 | | | | 1,289,876 | |
Michigan State Hospital Finance Authority, 5.00% due 7/15/2015 (Oakwood Obligation Group) | | A/A2 | | | 2,500,000 | | | | 2,648,325 | |
Michigan State Hospital Finance Authority, 5.00% due 7/15/2016 (Oakwood Hospital) | | A/A2 | | | 1,205,000 | | | | 1,261,502 | |
Michigan State Hospital Finance Authority, 5.00% due 11/15/2016 (Ascension Health) | | AA/Aa1 | | | 3,000,000 | | | | 3,322,920 | |
Michigan State Hospital Finance Authority, 5.50% due 11/1/2017 (Oakwood Obligation Group) | | A/A2 | | | 5,000,000 | | | | 5,136,650 | |
Michigan State Hospital Finance Authority, 5.00% due 7/15/2018 (Oakwood Hospital) | | A/A2 | | | 1,000,000 | | | | 1,025,950 | |
Michigan State Hospital Finance Authority, 6.00% due 12/1/2018 (Trinity Health) | | AA/Aa2 | | | 2,000,000 | | | | 2,283,280 | |
Michigan State Hospital Finance Authority, 5.00% due 7/15/2019 (Oakwood Hospital) | | A/A2 | | | 2,000,000 | | | | 2,024,060 | |
a Michigan State Hospital Finance Authority, 1.00% due 10/1/2026 put 6/1/2017 (Ascension Health) | | NR/NR | | | 12,140,000 | | | | 13,296,699 | |
Michigan State Strategic Fund, 4.75% due 8/1/2011 (NSF International) | | A-/NR | | | 2,240,000 | | | | 2,258,099 | |
Michigan State Strategic Fund, 4.75% due 8/1/2012 (NSF International) | | A-/NR | | | 2,345,000 | | | | 2,411,504 | |
Michigan State Strategic Fund, 5.00% due 10/15/2017 (Insured: AGM) | | AA+/Aa3 | | | 2,000,000 | | | | 2,135,620 | |
Michigan State Strategic Fund, 5.25% due 6/1/2018 (Clark Retirement Community) | | BB/NR | | | 1,805,000 | | | | 1,673,289 | |
Michigan State Strategic Fund, 5.25% due 10/15/2019 (Michigan House Republic Facilities; Insured: Assured Guaranty) | | AA+/Aa3 | | | 1,000,000 | | | | 1,051,000 | |
Michigan State Strategic Fund, 5.25% due 8/1/2029 put 8/1/2014 (Detroit Edison Co.) | | A/NR | | | 7,500,000 | | | | 8,116,200 | |
Michigan State Strategic Fund, 5.50% due 8/1/2029 put 8/1/2016 (Detroit Edison Co.) | | A/NR | | | 5,160,000 | | | | 5,719,292 | |
Michigan State Strategic Fund, 4.85% due 9/1/2030 put 9/1/2011 (Detroit Edison Co.; Insured: AMBAC) | | BBB+/Baa1 | | | 4,850,000 | | | | 4,905,338 | |
Michigan Strategic Fund Limited Michigan House Republic Facilities, 5.25% due 10/15/2020 (Insured: AGM) | | AA+/Aa3 | | | 4,025,000 | | | | 4,168,491 | |
Michigan Strategic Fund Solid Waste Disposal Revenue, 2.80% due 12/1/2013 (Waste Management Inc.) | | BBB/NR | | | 2,850,000 | | | | 2,868,212 | |
Rockford Public Schools GO, 4.80% due 5/1/2017 (Insured: Q-SBLF) | | AA-/Aa2 | | | 1,130,000 | | | | 1,148,995 | |
Romeo Community School District GO, 5.00% due 5/1/2018 (Insured: Natl-Re/Q-SBLF) | | AA-/Aa2 | | | 3,050,000 | | | | 3,264,171 | |
Royal Oak Hospital Finance Authority Hospital Revenue, 6.25% due 9/1/2014 (William Beaumont Hospital) | | A/A1 | | | 1,000,000 | | | | 1,083,310 | |
Royal Oak Hospital Finance Authority Hospital Revenue, 5.25% due 8/1/2017 (William Beaumont Hospital) | | A/A1 | | | 5,855,000 | | | | 6,027,313 | |
Wayne County Airport Authority, 5.00% due 12/1/2019 (Detroit Metropolitan Airport) | | A/A2 | | | 12,645,000 | | | | 12,824,433 | |
Wayne County Airport Authority, 5.50% due 12/1/2019 (Detroit Metropolitan Airport) | | A/A2 | | | 2,600,000 | | | | 2,728,180 | |
Wayne County Airport Authority, 5.50% due 12/1/2020 (Detroit Metropolitan Airport) | | A/A2 | | | 4,395,000 | | | | 4,544,826 | |
Wayne County Airport Authority, 5.50% due 12/1/2020 (Detroit Metropolitan Airport) | | A/A2 | | | 3,115,000 | | | | 3,221,190 | |
Western Townships Utilities Authority Sewage Disposal GO, 3.00% due 1/1/2012 | | AA/NR | | | 655,000 | | | | 666,148 | |
Western Townships Utilities Authority Sewage Disposal GO, 4.00% due 1/1/2013 | | AA/NR | | | 1,000,000 | | | | 1,044,780 | |
Western Townships Utilities Authority Sewage Disposal GO, 4.00% due 1/1/2014 | | AA/NR | | | 1,000,000 | | | | 1,055,980 | |
Western Townships Utilities Authority Sewage Disposal GO, 5.00% due 1/1/2015 | | AA/NR | | | 1,870,000 | | | | 2,044,004 | |
Western Townships Utilities Authority Sewage Disposal GO, 5.00% due 1/1/2016 | | AA/NR | | | 1,670,000 | | | | 1,839,305 | |
Western Townships Utilities Authority Sewage Disposal GO, 5.00% due 1/1/2017 | | AA/NR | | | 1,500,000 | | | | 1,653,960 | |
Western Townships Utilities Authority Sewage Disposal GO, 5.00% due 1/1/2018 | | AA/NR | | | 1,500,000 | | | | 1,645,485 | |
26 Certified Semi-Annual Report
| | |
| SCHEDULE OF INVESTMENTS, CONTINUED | | |
| |
| Thornburg Limited Term Municipal Fund | | March 31, 2011 (Unaudited) |
| | | | | | | | | | | | |
Issuer-Description | | Credit Rating†
S&P/ Moody’s | | | Principal
Amount | | | Value | |
Wyandotte School District GO, 4.00% due 5/1/2011 (Insured: Q-SBLF) | | | AA+/Aa2 | | | $ | 2,810,000 | | | $ | 2,817,643 | |
MINNESOTA — 1.41% | | | | | | | | | | | | |
Minneapolis St. Paul Health Care Systems, 5.25% due 12/1/2012 (HealthPartners Obligated Group) | | | BBB+/A3 | | | | 1,000,000 | | | | 1,043,710 | |
Minneapolis St. Paul Health Care Systems, 5.25% due 12/1/2013 (HealthPartners Obligated Group) | | | BBB+/A3 | | | | 2,200,000 | | | | 2,328,700 | |
Minneapolis St. Paul Metropolitan Airports, 5.00% due 1/1/2017 (Insured: AMBAC) | | | AA-/NR | | | | 8,005,000 | | | | 8,880,107 | |
Minnesota Agricultural & Economic Development Board, 4.00% due 2/15/2014 (Essential Health; Insured: Assured Guaranty) | | | AA+/NR | | | | 3,460,000 | | | | 3,650,473 | |
Minnesota Agricultural & Economic Development Board, 5.00% due 2/15/2015 (Essential Health; Insured: Assured Guaranty) | | | AA+/NR | | | | 1,335,000 | | | | 1,453,027 | |
Minnesota Agricultural & Economic Development Board, 5.00% due 2/15/2017 (Essential Health; Insured: Assured Guaranty) | | | AA+/NR | | | | 2,500,000 | | | | 2,716,625 | |
Minnesota GO, 5.00% due 8/1/2016 pre-refunded 9/29/2010 | | | AAA/Aa1 | | | | 3,200,000 | | | | 3,392,256 | |
Northern Municipal Power Agency Minnesota Electric, 5.00% due 1/1/2019 | | | A-/A2 | | | | 5,000,000 | | | | 5,357,600 | |
Northern Municipal Power Agency Minnesota Electric, 5.00% due 1/1/2020 | | | A-/A2 | | | | 3,500,000 | | | | 3,705,660 | |
St. Cloud Health Care Revenue, 5.00% due 5/1/2012 (Centracare Health Systems) | | | NR/A2 | | | | 1,000,000 | | | | 1,039,160 | |
St. Cloud Health Care Revenue, 5.00% due 5/1/2013 (Centracare Health Systems) | | | NR/A2 | | | | 1,000,000 | | | | 1,063,880 | |
St. Cloud Health Care Revenue, 5.00% due 5/1/2015 (Centracare Health Systems) | | | NR/A2 | | | | 1,000,000 | | | | 1,084,190 | |
St. Cloud Health Care Revenue, 5.00% due 5/1/2016 (Centracare Health Systems) | | | NR/A2 | | | | 1,250,000 | | | | 1,351,100 | |
St. Cloud Health Care Revenue, 5.00% due 5/1/2017 (Centracare Health Systems) | | | NR/A2 | | | | 2,920,000 | | | | 3,160,871 | |
St. Cloud Health Care Revenue, 5.00% due 5/1/2017 (Centracare Health Systems) | | | NR/A2 | | | | 1,000,000 | | | | 1,082,490 | |
b St. Cloud Health Care Revenue, 5.00% due 5/1/2018 (Centracare Health Systems) | | | NR/A2 | | | | 3,105,000 | | | | 3,306,608 | |
St. Cloud Health Care Revenue, 5.00% due 5/1/2019 (Centracare Health Systems) | | | NR/A2 | | | | 3,495,000 | | | | 3,674,328 | |
St. Cloud Health Care Revenue, 5.00% due 5/1/2020 (Centracare Health Systems) | | | NR/A2 | | | | 3,200,000 | | | | 3,352,128 | |
St. Paul Housing & Redevelopment Authority Health Care Revenue, 5.00% due 2/1/2018 (Gillette Children’s Specialty) | | | A-/NR | | | | 1,255,000 | | | | 1,308,726 | |
St. Paul Housing & Redevelopment Authority Health Care Revenue, 5.25% due 2/1/2020 (Gillette Children’s Specialty) | | | A-/NR | | | | 2,010,000 | | | | 2,082,943 | |
St. Paul Housing & Redevelopment Authority Health Care Revenue, 5.25% due 5/15/2021 (HealthPartners Obligated Group) | | | BBB+/A3 | | | | 1,070,000 | | | | 1,082,904 | |
MISSISSIPPI — 0.46% | | | | | | | | | | | | |
Gautier Utility District Systems, 5.50% due 3/1/2012 (Insured: Natl-Re/FGIC) | | | NR/NR | | | | 1,020,000 | | | | 1,054,547 | |
Medical Center Educational Building, 4.00% due 6/1/2015 (University of Mississippi Medical Center) | | | AA-/Aa2 | | | | 2,325,000 | | | | 2,474,265 | |
Medical Center Educational Building, 4.00% due 6/1/2016 (University of Mississippi Medical Center) | | | AA-/Aa2 | | | | 3,300,000 | | | | 3,504,666 | |
Mississippi Business Finance Corp., 0.21% due 11/1/2035 put 4/1/2011 (Chevron USA Inc.) (daily demand notes) | | | AA/Aa1 | | | | 4,335,000 | | | | 4,335,000 | |
Mississippi Development Bank Canton Public Improvement GO, 4.75% due 7/1/2017 | | | NR/NR | | | | 1,465,000 | | | | 1,545,223 | |
Mississippi Development Bank Special Obligation, 5.00% due 8/1/2018 (Department of Corrections) | | | AA-/NR | | | | 4,910,000 | | | | 5,355,632 | |
MISSOURI — 0.97% | | | | | | | | | | | | |
Cass County COP, 3.00% due 5/1/2012 | | | A+/NR | | | | 1,015,000 | | | | 1,033,646 | |
Cass County COP, 3.00% due 5/1/2014 | | | A+/NR | | | | 1,425,000 | | | | 1,454,127 | |
Cass County COP, 4.00% due 5/1/2015 | | | A+/NR | | | | 1,000,000 | | | | 1,045,190 | |
Cass County COP, 4.00% due 5/1/2018 | | | A+/NR | | | | 2,255,000 | | | | 2,265,170 | |
Cass County COP, 4.50% due 5/1/2019 | | | A+/NR | | | | 1,270,000 | | | | 1,287,755 | |
Cass County COP, 5.00% due 5/1/2020 | | | A+/NR | | | | 2,255,000 | | | | 2,341,118 | |
Certified Semi-Annual Report 27
| | |
| SCHEDULE OF INVESTMENTS, CONTINUED | | |
| |
| Thornburg Limited Term Municipal Fund | | March 31, 2011 (Unaudited) |
| | | | | | | | | | | | |
Issuer-Description | | Credit Rating†
S&P/ Moody’s | | | Principal
Amount | | | Value | |
Cass County COP, 5.00% due 5/1/2021 | | | A+/NR | | | $ | 1,750,000 | | | $ | 1,791,510 | |
Kansas City IDA, 4.00% due 9/1/2014 (NNSA National Security Campus) | | | NR/NR | | | | 2,500,000 | | | | 2,494,950 | |
Missouri Development Finance Board, 4.00% due 6/1/2014 (Electric Systems) | | | A-/NR | | | | 3,930,000 | | | | 4,142,416 | |
Missouri Development Finance Board, 4.00% due 6/1/2015 (Electric Systems) | | | A-/NR | | | | 1,000,000 | | | | 1,051,600 | |
Missouri Development Finance Board, 4.00% due 6/1/2016 (Electric Systems) | | | A-/NR | | | | 1,560,000 | | | | 1,636,393 | |
Missouri Development Finance Board, 5.00% due 6/1/2017 (Electric Systems) | | | A-/NR | | | | 1,525,000 | | | | 1,667,633 | |
Missouri Development Finance Board, 5.00% due 6/1/2018 (Electric Systems) | | | A-/NR | | | | 1,705,000 | | | | 1,852,500 | |
Missouri Development Finance Board, 5.00% due 6/1/2019 (Electric Systems) | | | A-/NR | | | | 1,790,000 | | | | 1,934,292 | |
Missouri Development Finance Board, 5.00% due 6/1/2020 (Electric Systems) | | | A-/NR | | | | 1,000,000 | | | | 1,065,780 | |
Missouri Development Finance Board Health Care Facilities, 4.80% due 11/1/2012 (Lutheran Home Aged; LOC: Commerce Bank) | | | NR/Aa2 | | | | 545,000 | | | | 553,497 | |
Missouri Housing Development Commission, 2.00% due 1/1/2012 | | | AA/NR | | | | 3,000,000 | | | | 3,028,440 | |
Missouri Regional Convention & Sports Complex, 5.25% due 8/15/2016 (Insured: AMBAC) | | | AA+/Aa2 | | | | 1,800,000 | | | | 1,939,482 | |
Missouri State Health & Educational Facilities Authority, 5.00% due 6/1/2011 (SSM Health Care Corp.) | | | AA-/NR | | | | 1,000,000 | | | | 1,007,640 | |
Missouri State Health & Educational Facilities Authority, 5.00% due 5/15/2017 (Children’s Mercy Hospital) | | | A+/NR | | | | 1,000,000 | | | | 1,058,570 | |
Missouri State Health & Educational Facilities Authority, 5.00% due 5/15/2019 (Children’s Mercy Hospital) | | | A+/NR | | | | 1,000,000 | | | | 1,042,360 | |
Missouri State Health & Educational Facilities Authority, 5.00% due 5/15/2020 (Children’s Mercy Hospital) | | | A+/NR | | | | 1,000,000 | | | | 1,028,850 | |
Springfield Public Utilities COP, 5.00% due 12/1/2013 (Insured: Natl-Re) | | | AA/A1 | | | | 2,000,000 | | | | 2,150,080 | |
NEBRASKA — 0.53% | | | | | | | | | | | | |
Madison County Hospital Authority, 5.50% due 7/1/2012 pre-refunded 1/1/2012 (Faith Regional Health Services; Insured: Radian) | | | NR/NR | | | | 1,625,000 | | | | 1,684,231 | |
Omaha Public Power District Electric Systems, 5.00% due 2/1/2013 | | | AA/Aa1 | | | | 5,000,000 | | | | 5,333,800 | |
Public Power Generation Agency, 5.00% due 1/1/2020 (Nebraska Whelan Energy Center; Insured: AMBAC) | | | A-/A2 | | | | 9,930,000 | | | | 10,249,448 | |
Public Power Generation Agency, 5.00% due 1/1/2021 (Nebraska Whelan Energy Center; Insured: AMBAC) | | | A-/A2 | | | | 1,860,000 | | | | 1,903,692 | |
University of Nebraska Facilities Corp., 2.00% due 7/15/2011 | | | AA/Aa1 | | | | 2,100,000 | | | | 2,110,605 | |
NEVADA — 1.63% | | | | | | | | | | | | |
Clark County GO, 4.00% due 7/1/2012 | | | AA+/Aa1 | | | | 3,570,000 | | | | 3,709,980 | |
Clark County GO, 5.00% due 11/1/2014 | | | AA+/Aa1 | | | | 4,000,000 | | | | 4,402,120 | |
Clark County GO, 5.00% due 11/1/2017 (Insured: AMBAC) | | | AA+/Aa1 | | | | 1,185,000 | | | | 1,311,949 | |
Clark County Improvement District, 5.00% due 12/1/2015 (Insured: AMBAC) | | | BBB+/NR | | | | 1,795,000 | | | | 1,878,414 | |
Clark County School District GO, 5.00% due 6/15/2015 (Insured: Natl-Re) | | | AA/Aa2 | | | | 1,000,000 | | | | 1,076,680 | |
Clark County School District GO, 5.50% due 6/15/2015 (Insured: AGM) | | | AA+/Aa2 | | | | 5,470,000 | | | | 5,901,528 | |
Las Vegas Clark County Library District GO, 5.00% due 1/1/2018 | | | AA/Aa2 | | | | 6,535,000 | | | | 7,127,659 | |
Las Vegas Clark County Library District GO, 5.00% due 1/1/2019 | | | AA/Aa2 | | | | 3,000,000 | | | | 3,243,720 | |
Las Vegas Convention & Visitors Authority, 5.25% due 7/1/2013 (Insured: AMBAC) | | | A+/A1 | | | | 1,530,000 | | | | 1,617,133 | |
Las Vegas Convention & Visitors Authority, 5.25% due 7/1/2014 (Insured: AMBAC) | | | A+/A1 | | | | 2,680,000 | | | | 2,870,441 | |
Las Vegas Convention & Visitors Authority, 5.00% due 7/1/2019 (Insured: AMBAC) | | | A+/A1 | | | | 6,000,000 | | | | 6,091,260 | |
Las Vegas COP, 5.00% due 9/1/2016 (City Hall) | | | AA-/Aa3 | | | | 4,000,000 | | | | 4,275,280 | |
Las Vegas COP, 5.00% due 9/1/2017 (City Hall) | | | AA-/Aa3 | | | | 4,300,000 | | | | 4,557,570 | |
Las Vegas COP, 5.00% due 9/1/2018 (City Hall) | | | AA-/Aa3 | | | | 4,000,000 | | | | 4,189,760 | |
Las Vegas GO, 7.00% due 4/1/2017 (Performing Arts Center) | | | AA/Aa2 | | | | 1,825,000 | | | | 2,157,278 | |
Las Vegas GO, 7.00% due 4/1/2018 (Performing Arts Center) | | | AA/Aa2 | | | | 2,095,000 | | | | 2,492,757 | |
Las Vegas Special Local Improvement District 707, 5.125% due 6/1/2011 (Insured: AGM) | | | AA+/Aa3 | | | | 1,515,000 | | | | 1,522,999 | |
Las Vegas Special Local Improvement District 707, 5.375% due 6/1/2013 (Insured: AGM) | | | AA+/Aa3 | | | | 1,050,000 | | | | 1,054,452 | |
Las Vegas Water District GO, 5.00% due 6/1/2017 | | | AA+/Aa1 | | | | 1,050,000 | | | | 1,161,594 | |
28 Certified Semi-Annual Report
| | |
| SCHEDULE OF INVESTMENTS, CONTINUED | | |
| |
| Thornburg Limited Term Municipal Fund | | March 31, 2011 (Unaudited) |
| | | | | | | | | | | | |
Issuer-Description | | Credit Rating†
S&P/ Moody’s | | | Principal
Amount | | | Value | |
Las Vegas Water District GO, 5.00% due 6/1/2019 | | | AA+/Aa1 | | | $ | 1,000,000 | | | $ | 1,089,680 | |
Reno Hospital Revenue, 5.25% due 6/1/2014 (Washoe Medical Center; Insured: AGM) | | | AA+/Aa3 | | | | 1,000,000 | | | | 1,072,390 | |
Reno Hospital Revenue, 5.25% due 6/1/2016 (Washoe Medical Center; Insured: AGM) | | | AA+/Aa3 | | | | 1,100,000 | | | | 1,179,189 | |
Reno Hospital Revenue, 5.25% due 6/1/2018 (Washoe Medical Center; Insured: AGM) | | | AA+/Aa3 | | | | 1,000,000 | | | | 1,052,640 | |
NEW HAMPSHIRE — 0.32% | | | | | | | | | | | | |
New Hampshire Business Finance Authority PCR, 5.375% due 5/1/2014 (Central Maine Power Co.) | | | BBB+/NR | | | | 1,335,000 | | | | 1,429,705 | |
New Hampshire Health & Educational Facilities, 4.50% due 8/1/2014 (Dartmouth-Hitchcock) | | | A+/NR | | | | 1,835,000 | | | | 1,949,687 | |
New Hampshire Health & Educational Facilities, 5.00% due 10/1/2016 (Southern NH Health Systems) | | | A-/NR | | | | 1,260,000 | | | | 1,327,700 | |
New Hampshire Health & Educational Facilities, 5.00% due 10/1/2017 (Southern NH Health Systems) | | | A-/NR | | | | 1,000,000 | | | | 1,045,790 | |
New Hampshire Municipal Bond Bank, 5.00% due 8/15/2016 (Insured: Natl-Re) | | | AA/A1 | | | | 2,985,000 | | | | 3,431,526 | |
New Hampshire Municipal Bond Bank, 5.00% due 8/15/2017 (Insured: Natl-Re) | | | AA/A1 | | | | 3,130,000 | | | | 3,602,724 | |
NEW JERSEY — 2.37% | | | | | | | | | | | | |
Camden County Improvement Authority, 5.00% due 7/1/2014 (Cooper Medical School) | | | A+/A2 | | | | 2,845,000 | | | | 3,049,100 | |
Camden County Improvement Authority, 5.00% due 7/1/2015 (Cooper Medical School) | | | A+/A2 | | | | 2,990,000 | | | | 3,217,539 | |
Camden County Improvement Authority, 5.00% due 7/1/2016 (Cooper Medical School) | | | A+/A2 | | | | 3,040,000 | | | | 3,274,931 | |
Hudson County COP, 7.00% due 12/1/2012 (Insured: Natl-Re) | | | BBB/Baa1 | | | | 1,610,000 | | | | 1,723,650 | |
Hudson County COP, 7.00% due 12/1/2013 (Insured: Natl-Re) | | | BBB/Baa1 | | | | 710,000 | | | | 781,341 | |
Hudson County COP, 6.25% due 12/1/2014 (Insured: Natl-Re) | | | BBB/Baa1 | | | | 1,500,000 | | | | 1,649,865 | |
Hudson County COP, 6.25% due 12/1/2016 (Insured: Natl-Re) | | | BBB/Baa1 | | | | 550,000 | | | | 610,302 | |
Hudson County Improvement Authority, 5.25% due 10/1/2011 (Hudson County Lease; Insured: AGM) | | | AA+/Aa3 | | | | 1,270,000 | | | | 1,297,254 | |
Hudson County Improvement Authority, 5.25% due 10/1/2014 (Hudson County Lease; Insured: AGM) | | | AA+/Aa3 | | | | 3,000,000 | | | | 3,302,880 | |
Hudson County Improvement Authority, 4.75% due 10/1/2015 (Hudson County Lease; Insured: AGM) | | | AA+/Aa3 | | | | 2,000,000 | | | | 2,177,060 | |
Hudson County Improvement Authority, 4.75% due 10/1/2016 (Hudson County Lease; Insured: AGM) | | | AA+/Aa3 | | | | 3,155,000 | | | | 3,421,692 | |
Hudson County Improvement Authority, 4.75% due 10/1/2017 (Hudson County Lease; Insured: AGM) | | | AA+/Aa3 | | | | 4,065,000 | | | | 4,380,160 | |
Hudson County Improvement Authority, 4.75% due 10/1/2018 (Hudson County Lease; Insured: AGM) | | | AA+/Aa3 | | | | 2,000,000 | | | | 2,134,140 | |
Hudson County Improvement Authority, 4.75% due 10/1/2019 (Hudson County Lease; Insured: AGM) | | | AA+/Aa3 | | | | 4,390,000 | | | | 4,593,081 | |
Hudson County Improvement Authority, 5.375% due 10/1/2020 (Hudson County Lease; Insured: AGM) | | | AA+/Aa3 | | | | 1,955,000 | | | | 2,108,311 | |
New Jersey EDA, 5.00% due 11/15/2011 (Seabrook Village) | | | NR/NR | | | | 1,000,000 | | | | 1,003,170 | |
New Jersey EDA, 5.00% due 11/15/2014 (Seabrook Village) | | | NR/NR | | | | 1,000,000 | | | | 989,850 | |
New Jersey EDA, 5.00% due 12/15/2016 (School Facilities Construction) | | | A+/Aa3 | | | | 10,000,000 | | | | 10,746,700 | |
New Jersey EDA, 5.50% due 12/15/2019 (School Facilities Construction; Insured: AMBAC) | | | A+/Aa3 | | | | 5,000,000 | | | | 5,366,550 | |
New Jersey EDA Cigarette Tax Revenue, 5.00% due 6/15/2012 (Insured: Natl-Re/FGIC) | | | BBB/Baa3 | | | | 7,375,000 | | | | 7,514,609 | |
New Jersey Higher Educational Assistance Authority, 5.00% due 12/1/2017 | | | AA/Aa2 | | | | 1,500,000 | | | | 1,603,050 | |
New Jersey Higher Educational Assistance Authority, 5.00% due 12/1/2018 | | | AA/Aa2 | | | | 3,000,000 | | | | 3,168,450 | |
New Jersey Higher Educational Assistance Authority, 5.25% due 12/1/2019 | | | AA/Aa2 | | | | 5,000,000 | | | | 5,285,850 | |
New Jersey State Transit Corp. COP, 5.25% due 9/15/2013 (Insured: AMBAC) | | | A/Aa3 | | | | 6,000,000 | | | | 6,432,540 | |
New Jersey State Transit Corp. COP, 5.50% due 9/15/2013 (Insured: AMBAC) | | | A/Aa3 | | | | 7,650,000 | | | | 8,246,930 | |
Passaic Valley Sewer Commissioners Sewer System GO, 5.625% due 12/1/2018 | | | NR/A2 | | | | 1,210,000 | | | | 1,321,538 | |
Passaic Valley Sewer Commissioners Sewer System GO, 5.75% due 12/1/2019 | | | NR/A2 | | | | 2,000,000 | | | | 2,178,100 | |
Passaic Valley Sewer Commissioners Sewer System GO, 5.75% due 12/1/2020 | | | NR/A2 | | | | 2,800,000 | | | | 3,017,308 | |
Certified Semi-Annual Report 29
| | |
| SCHEDULE OF INVESTMENTS, CONTINUED | | |
| |
| Thornburg Limited Term Municipal Fund | | March 31, 2011 (Unaudited) |
| | | | | | | | | | | | |
Issuer-Description | | Credit Rating†
S&P/ Moody’s | | | Principal
Amount | | | Value | |
NEW MEXICO — 1.29% | | | | | | | | | | | | |
Albuquerque Airport, 5.50% due 7/1/2013 | | | A/A1 | | | $ | 1,820,000 | | | $ | 1,955,481 | |
Gallup PCR, 5.00% due 8/15/2016 (Insured: AMBAC) | | | A/A3 | | | | 2,400,000 | | | | 2,486,328 | |
Los Alamos County Gross Receipts Tax, 5.50% due 6/1/2017 | | | AA+/Aa3 | | | | 2,365,000 | | | | 2,739,498 | |
Los Alamos County Gross Receipts Tax, 5.50% due 6/1/2018 | | | AA+/Aa3 | | | | 2,205,000 | | | | 2,560,953 | |
New Mexico Educational Assistance Foundation, 5.00% due 12/1/2018 | | | AAA/Aaa | | | | 5,000,000 | | | | 5,512,300 | |
New Mexico Educational Assistance Foundation, 5.00% due 12/1/2021 | | | AAA/Aaa | | | | 3,000,000 | | | | 3,207,840 | |
New Mexico Highway Commission Tax, 5.00% due 6/15/2011 (Insured: AMBAC) (ETM) | | | AAA/Aa1 | | | | 4,865,000 | | | | 4,911,947 | |
New Mexico Severance Tax, 5.00% due 7/1/2014 | | | AA/Aa1 | | | | 7,435,000 | | | | 8,335,304 | |
New Mexico Severance Tax, 5.00% due 7/1/2015 | | | AA/Aa1 | | | | 5,500,000 | | | | 6,248,275 | |
New Mexico Severance Tax, 5.00% due 7/1/2016 | | | AA/Aa1 | | | | 10,265,000 | | | | 11,770,157 | |
Santa Fe Gross Receipts Tax, 5.00% due 6/1/2011 | | | AA+/Aa3 | | | | 1,750,000 | | | | 1,763,073 | |
NEW YORK — 5.00% | | | | | | | | | | | | |
Amherst Development Corp., 5.00% due 10/1/2015 (Student Housing; Insured: AGM) | | | AA+/Aa3 | | | | 1,535,000 | | | | 1,666,565 | |
Erie County Individual Development Agency, 5.00% due 5/1/2011 (Buffalo School District; Insured: AGM) | | | AA+/Aa3 | | | | 8,750,000 | | | | 8,783,687 | |
Erie County Individual Development Agency, 5.00% due 5/1/2015 (Buffalo School District) | | | AA-/Aa3 | | | | 3,000,000 | | | | 3,304,200 | |
Erie County Individual Development Agency, 5.00% due 5/1/2016 (Buffalo School District) | | | AA-/Aa3 | | | | 8,795,000 | | | | 9,745,212 | |
Erie County Individual Development Agency, 5.00% due 5/1/2017 (Buffalo School District) | | | AA-/Aa3 | | | | 7,265,000 | | | | 8,039,158 | |
Erie County Individual Development Agency, 5.00% due 5/1/2018 (Buffalo School District) | | | AA-/Aa3 | | | | 5,000,000 | | | | 5,498,700 | |
Monroe County IDA, 5.375% due 6/1/2017 (St. John Fisher College; Insured: Radian) | | | NR/NR | | | | 4,405,000 | | | | 4,412,665 | |
Nassau County Industrial Development Agency, 5.25% due 3/1/2018 (NY Institute of Technology) | | | BBB+/Baa2 | | | | 1,260,000 | | | | 1,346,537 | |
Nassau County Industrial Development Agency, 5.25% due 3/1/2020 (NY Institute of Technology) | | | BBB+/Baa2 | | | | 1,715,000 | | | | 1,786,670 | |
New York City GO, 3.00% due 8/1/2011 | | | AA/Aa2 | | | | 7,400,000 | | | | 7,463,714 | |
New York City GO, 0.23% due 11/1/2026 put 4/1/2011 (Insured: AGM/SPA: Dexia) (daily demand notes) | | | AAA/Aa2 | | | | 9,200,000 | | | | 9,200,000 | |
New York City Health & Hospital Corp. GO, 5.00% due 2/15/2013 | | | A+/Aa3 | | | | 2,755,000 | | | | 2,920,741 | |
New York City Health & Hospital Corp. GO, 5.00% due 2/15/2019 | | | A+/Aa3 | | | | 2,700,000 | | | | 2,949,264 | |
New York City Health & Hospital Corp. GO, 5.00% due 2/15/2020 | | | A+/Aa3 | | | | 10,000,000 | | | | 10,810,100 | |
New York City Health & Hospital Corp. GO, 5.00% due 2/15/2021 | | | A+/Aa3 | | | | 2,615,000 | | | | 2,786,439 | |
New York City IDA, 5.25% due 6/1/2011 (Lycee Francais de New York; Insured: ACA) | | | BBB/Baa1 | | | | 2,215,000 | | | | 2,230,173 | |
New York City IDA, 5.25% due 6/1/2012 (Lycee Francais de New York; Insured: ACA) | | | BBB/Baa1 | | | | 2,330,000 | | | | 2,432,730 | |
New York City Municipal Water Financing Authority, 5.375% due 6/15/2017 | | | AAA/Aa1 | | | | 5,000,000 | | | | 5,275,750 | |
New York City Transitional Finance Authority, 5.00% due 11/1/2012 | | | AAA/Aaa | | | | 5,000,000 | | | | 5,342,850 | |
New York City Transitional Finance Authority, 4.00% due 7/15/2014 (State Aid Withholding) | | | AA-/Aa3 | | | | 2,000,000 | | | | 2,154,480 | |
New York City Transitional Finance Authority, 5.00% due 11/1/2014 | | | AAA/Aaa | | | | 2,000,000 | | | | 2,251,720 | |
New York City Transitional Finance Authority, 5.00% due 7/15/2016 (State Aid Withholding) | | | AA-/Aa3 | | | | 3,155,000 | | | | 3,525,618 | |
New York City Transitional Finance Authority, 5.00% due 1/15/2018 (State Aid Withholding) | | | AA-/Aa3 | | | | 4,865,000 | | | | 5,371,301 | |
New York City Transitional Finance Authority, 0.18% due 8/1/2031 put 4/1/2011 (SPA: Landsbank Hessen) (daily demand notes) | | | AAA/Aaa | | | | 3,200,000 | | | | 3,200,000 | |
New York State Dormitory Authority, 5.25% due 5/15/2017 (Court Facilities Lease; Insured: AMBAC) | | | AA-/Aa3 | | | | 3,585,000 | | | | 3,979,171 | |
New York State Dormitory Authority, 5.25% due 11/15/2029 put 5/15/2012 (Insured: Natl-Re/ FGIC) | | | AA-/Aa3 | | | | 1,540,000 | | | | 1,611,856 | |
New York State Dormitory Authority, 5.50% due 7/1/2012 (Winthrop South Nassau University) | | | NR/Baa1 | | | | 1,820,000 | | | | 1,895,202 | |
New York State Dormitory Authority, 5.00% due 11/1/2012 (Insured: SONYMA) | | | NR/Aa1 | | | | 1,395,000 | | | | 1,399,562 | |
New York State Dormitory Authority, 5.50% due 7/1/2013 (Winthrop South Nassau University) | | | NR/Baa1 | | | | 1,500,000 | | | | 1,593,735 | |
New York State Dormitory Authority, 5.25% due 8/15/2013 (Presbyterian Hospital; Insured: AGM/FHA) | | | AA+/Aa3 | | | | 3,650,000 | | | | 3,932,838 | |
New York State Dormitory Authority, 5.00% due 11/1/2013 (Insured: SONYMA) | | | NR/Aa1 | | | | 3,105,000 | | | | 3,114,998 | |
New York State Dormitory Authority, 3.00% due 8/15/2014 (Mental Health Services) | | | AA-/NR | | | | 2,640,000 | | | | 2,725,906 | |
New York State Dormitory Authority, 5.00% due 11/1/2014 (Insured: SONYMA) | | | NR/Aa1 | | | | 1,010,000 | | | | 1,013,192 | |
30 Certified Semi-Annual Report
| | |
| SCHEDULE OF INVESTMENTS, CONTINUED | | |
| |
| Thornburg Limited Term Municipal Fund | | March 31, 2011 (Unaudited) |
| | | | | | | | | | | | |
Issuer-Description | | Credit Rating†
S&P/ Moody’s | | | Principal
Amount | | | Value | |
New York State Dormitory Authority, 5.25% due 8/15/2015 (New York Presbyterian Hospital; Insured: AGM/FHA) | | | AA+/Aa3 | | | $ | 5,335,000 | | | $ | 5,700,608 | |
New York State Dormitory Authority, 5.50% due 7/1/2016 (Brooklyn Law School; Insured: Radian) | | | BBB+/Baa1 | | | | 1,220,000 | | | | 1,296,506 | |
New York State Dormitory Authority, 5.50% due 2/15/2017 (Mental Health Services) | | | AA-/NR | | | | 5,000,000 | | | | 5,652,450 | |
New York State Dormitory Authority, 5.50% due 7/1/2017 (Brooklyn Law School; Insured: Radian) | | | BBB+/Baa1 | | | | 2,500,000 | | | | 2,637,725 | |
New York State Dormitory Authority, 5.50% due 10/1/2017 (School Districts Financing; Insured: Natl-Re) (State Aid Withholding) | | | A+/A2 | | | | 1,570,000 | | | | 1,652,880 | |
New York State Dormitory Authority, 5.50% due 2/15/2018 (Mental Health Services) | | | AA-/NR | | | | 5,000,000 | | | | 5,640,750 | |
New York State Dormitory Authority, 5.25% due 11/15/2023 put 5/15/2012 (State University Educational Facilities) | | | AA-/Aa3 | | | | 11,515,000 | | | | 12,056,320 | |
New York State Dormitory Authority, 6.00% due 11/15/2023 put 5/15/2012 (State University Educational Facilities; Insured: CIFG) | | | AA-/Aa3 | | | | 1,000,000 | | | | 1,055,010 | |
New York State Dormitory Authority, 5.25% due 11/15/2026 put 5/15/2012 (Insured: AMBAC) | | | AA-/Aa3 | | | | 4,000,000 | | | | 4,186,640 | |
New York State Thruway Authority Service Contract, 5.50% due 4/1/2013 (Local Highway & Bridge; Insured: Syncora) | | | AA-/Aa3 | | | | 1,000,000 | | | | 1,046,290 | |
Port Authority 148th, 5.00% due 8/15/2017 (Insured: AGM; GO of Authority) | | | AA+/Aa2 | | | | 4,725,000 | | | | 5,282,597 | |
Suffolk County Industrial Development Agency Civic Facilities GO, 5.25% due 3/1/2019 (NY Institute of Technology) | | | BBB+/Baa2 | | | | 1,400,000 | | | | 1,441,006 | |
Tobacco Settlement Financing Corp. Asset Backed, 5.00% due 6/1/2011 | | | AA-/NR | | | | 1,695,000 | | | | 1,707,882 | |
Tobacco Settlement Financing Corp. Asset Backed, 5.25% due 6/1/2013 | | | AA-/Aa3 | | | | 1,145,000 | | | | 1,148,778 | |
Tobacco Settlement Financing Corp. Asset Backed, 5.25% due 6/1/2013 (Insured: Syncora) | | | AA-/Aa3 | | | | 715,000 | | | | 717,359 | |
Tobacco Settlement Financing Corp. Asset Backed, 5.50% due 6/1/2015 | | | AA-/Aa3 | | | | 3,000,000 | | | | 3,010,590 | |
United Nations Development Corp., 5.00% due 7/1/2016 | | | NR/A1 | | | | 3,400,000 | | | | 3,797,902 | |
United Nations Development Corp., 5.00% due 7/1/2017 | | | NR/A1 | | | | 3,000,000 | | | | 3,346,020 | |
United Nations Development Corp., 5.00% due 7/1/2019 | | | NR/A1 | | | | 4,000,000 | | | | 4,394,920 | |
NORTH CAROLINA — 1.29% | | | | | | | | | | | | |
Buncombe County COP, 5.00% due 4/1/2019 (Insured: Natl-Re) | | | AA/Aa2 | | | | 2,225,000 | | | | 2,396,014 | |
Charlotte Mecklenburg Hospital Authority Health Care Systems, 5.00% due 1/15/2016 (Carolinas Health Network) | | | AA-/Aa3 | | | | 3,420,000 | | | | 3,773,594 | |
Charlotte Mecklenburg Hospital Authority Health Care Systems, 5.00% due 1/15/2017 (Carolinas Health Network) | | | AA-/Aa3 | | | | 2,000,000 | | | | 2,206,560 | |
North Carolina Eastern Municipal Power Agency, 5.25% due 1/1/2012 | | | A-/Baa1 | | | | 650,000 | | | | 669,929 | |
North Carolina Eastern Municipal Power Agency, 5.50% due 1/1/2012 | | | A-/Baa1 | | | | 1,100,000 | | | | 1,135,277 | |
North Carolina Eastern Municipal Power Agency, 5.25% due 1/1/2013 | | | A-/Baa1 | | | | 1,055,000 | | | | 1,120,600 | |
North Carolina Eastern Municipal Power Agency, 7.00% due 1/1/2013 (Insured: Natl-Re/IBC) | | | BBB/Baa1 | | | | 2,990,000 | | | | 3,121,799 | |
North Carolina Eastern Municipal Power Agency, 5.00% due 1/1/2016 (Insured: AMBAC) | | | A-/NR | | | | 1,700,000 | | | | 1,881,934 | |
North Carolina Eastern Municipal Power Agency, 6.00% due 1/1/2018 (Insured: BHAC/AMBAC) | | | AA+/Aa1 | | | | 5,965,000 | | | | 6,932,106 | |
North Carolina Eastern Municipal Power Agency, 6.00% due 1/1/2018 (Insured: AMBAC) | | | NR/Baa1 | | | | 7,500,000 | | | | 8,613,225 | |
North Carolina Eastern Municipal Power Agency, 5.25% due 1/1/2019 (Insured: AGM) | | | AA+/Aa3 | | | | 3,000,000 | | | | 3,243,690 | |
North Carolina Infrastructure Finance Corp. COP, 5.00% due 2/1/2017 (Correctional Facilities) | | | AA+/Aa1 | | | | 2,400,000 | | | | 2,561,088 | |
North Carolina Medical Care Commission, 5.00% due 9/1/2013 (Rowan Regional Medical Center; Insured: AGM/FHA 242) | | | AA+/Aa3 | | | | 1,000,000 | | | | 1,068,120 | |
North Carolina Municipal Power Agency, 5.50% due 1/1/2013 (Catawba Electric) (ETM) | | | NR/NR | | | | 800,000 | | | | 866,808 | |
North Carolina Municipal Power Agency, 5.50% due 1/1/2013 (Catawba Electric) | | | NR/A2 | | | | 1,705,000 | | | | 1,830,931 | |
North Carolina Municipal Power Agency, 5.25% due 1/1/2017 (Catawba Electric) | | | A/A2 | | | | 3,100,000 | | | | 3,495,374 | |
North Carolina State Infrastructure Finance Corp. COP, 5.00% due 2/1/2016 (Correctional Facilities) | | | AA+/Aa1 | | | | 5,000,000 | | | | 5,384,500 | |
University North Carolina Pool Revenue, 5.00% due 4/1/2012 (Insured: AMBAC) | | | NR/NR | | | | 305,000 | | | | 317,703 | |
University North Carolina Pool Revenue, 5.00% due 4/1/2012 (Insured: AMBAC) | | | NR/NR | | | | 725,000 | | | | 751,919 | |
NORTH DAKOTA — 0.07% | | | | | | | | | | | | |
Ward County Health Care Facilities, 5.00% due 7/1/2011 (Trinity Obligated Group) | | | BBB+/NR | | | | 1,000,000 | | | | 1,007,400 | |
Certified Semi-Annual Report 31
| | |
| SCHEDULE OF INVESTMENTS, CONTINUED | | |
| |
| Thornburg Limited Term Municipal Fund | | March 31, 2011 (Unaudited) |
| | | | | | | | | | | | |
Issuer-Description | | Credit Rating†
S&P/ Moody’s | | | Principal
Amount | | | Value | |
Ward County Health Care Facilities, 5.00% due 7/1/2013 (Trinity Obligated Group) | | | BBB+/NR | | | $ | 1,560,000 | | | $ | 1,632,524 | |
OHIO — 3.19% | | | | | | | | | | | | |
Akron COP, 5.00% due 12/1/2013 (Insured: AGM) | | | AA+/NR | | | | 3,000,000 | | | | 3,288,780 | |
Akron COP, 5.00% due 12/1/2014 (Insured: AGM) | | | AA+/NR | | | | 2,000,000 | | | | 2,232,480 | |
Akron GO, 5.00% due 12/1/2019 | | | AA-/NR | | | | 1,685,000 | | | | 1,819,598 | |
Allen County Hospital Facilities, 5.00% due 9/1/2015 (Catholic Health Care Partners) | | | AA-/A1 | | | | 10,000,000 | | | | 10,970,100 | |
Allen County Hospital Facilities, 5.00% due 9/1/2016 (Catholic Health Care Partners) | | | AA-/A1 | | | | 10,000,000 | | | | 11,024,300 | |
American Municipal Power, 5.25% due 2/15/2018 (Hydroelectric) | | | A/A3 | | | | 5,500,000 | | | | 5,966,675 | |
American Municipal Power, 5.25% due 2/15/2019 (Hydroelectric) | | | A/A3 | | | | 5,015,000 | | | | 5,392,479 | |
Cleveland Cuyahoga County Cultural Facilities Revenue, 5.00% due 10/1/2019 (Cleveland Museum of Art) | | | AA+/NR | | | | 2,000,000 | | | | 2,162,380 | |
Cleveland GO, 5.75% due 8/1/2012 (Insured: Natl-Re) | | | AA/A1 | | | | 1,500,000 | | | | 1,592,520 | |
Garfield Heights City School Improvement GO, 5.375% due 12/15/2016 (Insured: Natl-Re) | | | NR/Aa3 | | | | 1,625,000 | | | | 1,779,765 | |
Greater Cleveland Regional Transportation Authority GO, 5.00% due 12/1/2015 (Insured: Natl-Re) | | | NR/Aa2 | | | | 1,000,000 | | | | 1,111,210 | |
Lorain County Ohio Hospital Revenue, 5.625% due 10/1/2017 (Catholic Health Care) | | | AA-/A1 | | | | 1,900,000 | | | | 1,957,817 | |
Lorain County Ohio Hospital Revenue, 5.75% due 10/1/2018 (Catholic Health Care) | | | AA-/A1 | | | | 2,565,000 | | | | 2,643,335 | |
Montgomery County, 5.25% due 10/1/2038 put 11/1/2013 (Catholic Health Initiatives) | | | AA/Aa2 | | | | 2,500,000 | | | | 2,728,550 | |
Montgomery County, 4.10% due 10/1/2041 put 11/10/2011 (Catholic Health Initiatives) | | | AA/Aa2 | | | | 2,500,000 | | | | 2,555,925 | |
Ohio State Air Quality Development Authority, 5.625% due 6/1/2018 (FirstEnergy Nuclear) | | | BBB-/Baa1 | | | | 5,000,000 | | | | 5,255,650 | |
Ohio State Air Quality Development Authority, 5.75% due 6/1/2033 put 12/1/2011 (FirstEnergy Nuclear) | | | BBB-/Baa2 | | | | 5,800,000 | | | | 6,308,138 | |
Ohio State Air Quality Development Authority, 3.375% due 1/1/2034 put 7/1/2015 (FirstEnergy Nuclear) | | | BBB-/NR | | | | 7,200,000 | | | | 7,021,872 | |
Ohio State Air Quality Development Authority, 3.875% due 12/1/2038 put 6/1/2014 (Columbus Southern Power Co.) | | | BBB/A3 | | | | 4,800,000 | | | | 4,864,848 | |
Ohio State Building Authority, 5.00% due 10/1/2015 (Insured: Natl-Re/FGIC) | | | AA/Aa2 | | | | 4,600,000 | | | | 5,139,534 | |
Ohio State Department Administrative Services COP, 5.00% due 9/1/2015 (Insured: Natl-Re) | | | AA/Aa2 | | | | 1,950,000 | | | | 2,111,811 | |
Ohio State GO, 4.00% due 10/1/2014 | | | AA-/Aa3 | | | | 2,075,000 | | | | 2,239,070 | |
Ohio State Higher Educational Facilities, 5.05% due 7/1/2037 put 7/1/2016 (Kenyon College) | | | A+/A1 | | | | 3,375,000 | | | | 3,656,543 | |
Ohio State Water Development Authority, 5.875% due 6/1/2033 put 6/1/2016 (FirstEnergy Nuclear) | | | BBB-/Baa1 | | | | 5,500,000 | | | | 5,903,205 | |
Ohio State Water Development Authority PCR, 3.375% due 1/1/2034 put 7/1/2015 (FirstEnergy Nuclear) | | | BBB-/NR | | | | 24,400,000 | | | | 23,892,480 | |
University of Akron Ohio General Receipts, 5.00% due 1/1/2018 (Insured: AGM) | | | AA+/Aa3 | | | | 3,415,000 | | | | 3,741,918 | |
OKLAHOMA — 1.86% | | | | | | | | | | | | |
Cleveland County ISD, 3.00% due 3/1/2012 | | | NR/Aa2 | | | | 4,040,000 | | | | 4,127,345 | |
Cleveland County Public Facilities Authority, 4.00% due 6/1/2013 (Norman Public Schools) | | | A+/NR | | | | 5,000,000 | | | | 5,255,000 | |
Comanche County Hospital Authority, 5.00% due 7/1/2011 (Insured: Radian) | | | BBB-/NR | | | | 1,000,000 | | | | 1,006,010 | |
Comanche County Hospital Authority, 5.25% due 7/1/2015 (Insured: Radian) | | | BBB-/NR | | | | 1,340,000 | | | | 1,406,384 | |
Oklahoma County Finance Authority Educational Facilities, 3.50% due 3/1/2012 (Putnam City Public Schools) | | | A/NR | | | | 3,825,000 | | | | 3,909,877 | |
Oklahoma County Finance Authority Educational Facilities, 4.00% due 3/1/2013 (Putnam City Public Schools) | | | A/NR | | | | 2,580,000 | | | | 2,689,572 | |
Oklahoma County Finance Authority Educational Facilities, 3.125% due 9/1/2013 (Western Heights Public Schools) | | | A+/NR | | | | 2,525,000 | | | | 2,606,179 | |
Oklahoma County Finance Authority Educational Facilities, 5.00% due 9/1/2016 (Western Heights Public Schools) | | | A+/NR | | | | 3,000,000 | | | | 3,326,310 | |
Oklahoma County Finance Authority Educational Facilities, 5.00% due 9/1/2017 (Western Heights Public Schools) | | | A+/NR | | | | 4,075,000 | | | | 4,499,819 | |
Oklahoma County Finance Authority Educational Facilities, 5.00% due 9/1/2018 (Western Heights Public Schools) | | | A+/NR | | | | 2,120,000 | | | | 2,325,640 | |
32 Certified Semi-Annual Report
| | |
| SCHEDULE OF INVESTMENTS, CONTINUED | | |
| |
| Thornburg Limited Term Municipal Fund | | March 31, 2011 (Unaudited) |
| | | | | | | | | | | | |
Issuer-Description | | Credit Rating†
S&P/ Moody’s | | | Principal
Amount | | | Value | |
Oklahoma County ISD, 3.00% due 1/1/2012 | | | A+/NR | | | $ | 3,880,000 | | | $ | 3,948,986 | |
Oklahoma County ISD, 3.00% due 1/1/2013 | | | A+/NR | | | | 3,880,000 | | | | 4,006,721 | |
Oklahoma County ISD, 3.00% due 1/1/2014 | | | A+/NR | | | | 2,880,000 | | | | 3,000,672 | |
Oklahoma DFA, 0.24% due 8/15/2033 put 4/1/2011 (Integris Health; Insured: Assured Guaranty) (daily demand notes) | | | AAA/Aa3 | | | | 13,900,000 | | | | 13,900,000 | |
Oklahoma DFA Health Facilities, 5.00% due 8/15/2017 (Integris Health) | | | AA-/Aa3 | | | | 4,375,000 | | | | 4,807,031 | |
Oklahoma DFA Health Systems, 5.25% due 12/1/2011 (Duncan Regional Hospital) | | | A-/NR | | | | 1,215,000 | | | | 1,247,368 | |
Oklahoma DFA Health Systems, 5.25% due 12/1/2012 (Duncan Regional Hospital) | | | A-/NR | | | | 1,330,000 | | | | 1,407,180 | |
Oklahoma Municipal Power Authority, 5.00% due 1/1/2013 | | | A/A2 | | | | 3,745,000 | | | | 3,990,634 | |
Oklahoma Municipal Power Authority, 5.00% due 1/1/2014 (Insured: AGM) | | | AAA/Aa3 | | | | 4,005,000 | | | | 4,360,764 | |
Oklahoma State Industrial Authority, 5.00% due 7/1/2016 (Medical Research Foundation) | | | NR/A1 | | | | 1,165,000 | | | | 1,252,130 | |
Oklahoma State Industrial Authority, 5.25% due 7/1/2017 (Medical Research Foundation) | | | NR/A1 | | | | 1,075,000 | | | | 1,158,764 | |
OREGON — 0.31% | | | | | | | | | | | | |
Clackamas County Oregon Hospital Facilities, 5.00% due 7/15/2037 put 7/15/2014 (Legacy Health Systems) | | | A+/A2 | | | | 6,000,000 | | | | 6,496,620 | |
Clackamas County Oregon Hospital Facilities, 5.00% due 7/15/2039 put 7/15/2012 (Legacy Health Systems) | | | A+/A2 | | | | 2,000,000 | | | | 2,091,740 | |
Oregon Facilities Authority Revenue, 5.00% due 3/15/2015 (Legacy Health Systems) | | | A+/A2 | | | | 1,635,000 | | | | 1,755,336 | |
Oregon Facilities Authority Revenue, 5.00% due 3/15/2016 (Legacy Health Systems) | | | A+/A2 | | | | 1,000,000 | | | | 1,066,370 | |
Oregon State Department of Administrative Services COP, 5.00% due 11/1/2014 (Insured: Natl-Re/FGIC) | | | AA/Aa2 | | | | 1,000,000 | | | | 1,117,900 | |
PENNSYLVANIA — 4.29% | | | | | | | | | | | | |
Adams County IDA, 5.00% due 8/15/2014 (Gettysburg College) | | | A/A2 | | | | 1,000,000 | | | | 1,087,540 | |
Adams County IDA, 5.00% due 8/15/2016 (Gettysburg College) | | | A/A2 | | | | 1,250,000 | | | | 1,369,763 | |
Adams County IDA, 5.00% due 8/15/2017 (Gettysburg College) | | | A/A2 | | | | 1,340,000 | | | | 1,461,538 | |
Adams County IDA, 5.00% due 8/15/2019 (Gettysburg College) | | | A/A2 | | | | 1,765,000 | | | | 1,886,979 | |
Allegheny County Hospital Development Authority, 5.00% due 6/15/2017 (UPMC Health Systems) | | | A+/Aa3 | | | | 3,000,000 | | | | 3,310,500 | |
Allegheny County Hospital Development Authority, 5.00% due 9/1/2017 (UPMC Health Systems) | | | A+/Aa3 | | | | 1,875,000 | | | | 2,075,063 | |
Allegheny County Hospital Development Authority, 5.00% due 5/15/2018 (UPMC Health Systems) | | | A+/Aa3 | | | | 5,915,000 | | | | 6,494,433 | |
Allegheny County Hospital Development Authority, 5.00% due 6/15/2018 (UPMC Health Systems) | | | A+/Aa3 | | | | 3,000,000 | | | | 3,296,490 | |
Allegheny County Redevelopment Authority, 5.10% due 7/1/2014 (Pittsburgh Mills) | | | NR/NR | | | | 1,635,000 | | | | 1,653,099 | |
Chester County School Authority, 5.00% due 4/1/2016 (Intermediate School; Insured: AMBAC) | | | A+/NR | | | | 1,915,000 | | | | 2,090,701 | |
Montgomery County IDA, 5.00% due 8/1/2016 (Regional Medical Center; Insured: FHA) | | | AA/Aa2 | | | | 1,000,000 | | | | 1,104,080 | |
Montgomery County IDA, 5.00% due 2/1/2017 (Regional Medical Center; Insured: FHA) | | | AA/Aa2 | | | | 1,000,000 | | | | 1,094,490 | |
Montgomery County IDA, 5.00% due 2/1/2020 (Regional Medical Center; Insured: FHA) | | | AA/Aa2 | | | | 1,000,000 | | | | 1,072,980 | |
b Pennsylvania EDA, 3.70% due 11/1/2021 put 5/1/2015 (Waste Management, Inc.) | | | BBB/NR | | | | 7,750,000 | | | | 7,755,657 | |
b Pennsylvania EDA, 3.00% due 12/1/2037 put 9/1/2015 (PPL Energy Supply) | | | BBB/NR | | | | 14,000,000 | | | | 13,856,780 | |
Pennsylvania EDA, 5.00% due 12/1/2042 put 6/1/2012 (Exelon Corp. Generation) | | | NR/A3 | | | | 2,550,000 | | | | 2,643,814 | |
Pennsylvania Higher Educational Facilities Authority, 5.00% due 6/1/2015 (Philadelphia University) | | | BBB/Baa2 | | | | 2,000,000 | | | | 2,086,660 | |
Pennsylvania Higher Educational Facilities Authority, 5.00% due 5/15/2019 (UPMC Health Systems) | | | A+/Aa3 | | | | 5,600,000 | | | | 6,143,536 | |
Pennsylvania Higher Educational Facilities Authority, 5.00% due 5/15/2020 (UPMC Health Systems) | | | A+/Aa3 | | | | 5,100,000 | | | | 5,535,081 | |
Pennsylvania Turnpike Commission Revenue, 0.77% due 12/1/2011 | | | A+/Aa3 | | | | 2,500,000 | | | | 2,501,950 | |
Pennsylvania Turnpike Commission Revenue, 0.87% due 12/1/2012 | | | A+/Aa3 | | | | 2,500,000 | | | | 2,500,200 | |
Philadelphia Authority for Industrial Development, 5.00% due 8/1/2020 (Mast Charter School) | | | BBB+/NR | | | | 915,000 | | | | 911,596 | |
Philadelphia Gas Works, 5.375% due 7/1/2014 (Insured: AGM) | | | AA+/Aa3 | | | | 7,280,000 | | | | 7,945,829 | |
Philadelphia Gas Works, 5.00% due 9/1/2014 (Insured: AGM) | | | AA+/Aa3 | | | | 3,000,000 | | | | 3,248,190 | |
Certified Semi-Annual Report 33
| | |
| SCHEDULE OF INVESTMENTS, CONTINUED | | |
| |
| Thornburg Limited Term Municipal Fund | | March 31, 2011 (Unaudited) |
| | | | | | | | | | | | |
Issuer-Description | | Credit Rating†
S&P/ Moody’s | | | Principal
Amount | | | Value | |
Philadelphia Gas Works, 5.00% due 10/1/2014 (Insured: AMBAC) | | | BBB+/Baa2 | | | $ | 1,825,000 | | | $ | 1,952,002 | |
Philadelphia Gas Works, 5.00% due 9/1/2015 (Insured: AGM) | | | AA+/Aa3 | | | | 3,315,000 | | | | 3,568,929 | |
Philadelphia Gas Works, 5.00% due 7/1/2011 (Insured: AGM) | | | AA+/Aa3 | | | | 2,000,000 | | | | 2,022,560 | |
Philadelphia Gas Works, 5.375% due 7/1/2012 (Insured: AGM) | | | AA+/Aa3 | | | | 2,410,000 | | | | 2,418,724 | |
Philadelphia Hospital & Higher Educational Facilities, 0.21% due 2/15/2021 put 4/1/2011 (Children’s Hospital; SPA: Bank of America) (daily demand notes) | | | AA/Aa2 | | | | 1,500,000 | | | | 1,500,000 | |
Philadelphia Parking Authority Revenue, 5.00% due 9/1/2016 | | | A-/A1 | | | | 1,500,000 | | | | 1,633,260 | |
Philadelphia Parking Authority Revenue, 5.00% due 9/1/2017 | | | A-/A1 | | | | 1,020,000 | | | | 1,104,538 | |
Philadelphia School District GO, 5.00% due 9/1/2012 (State Aid Withholding) | | | A+/Aa2 | | | | 5,000,000 | | | | 5,253,850 | |
Philadelphia School District GO, 5.00% due 9/1/2013 (State Aid Withholding) | | | A+/Aa2 | | | | 2,000,000 | | | | 2,127,460 | |
Philadelphia School District GO, 4.50% due 9/1/2017 (State Aid Withholding) | | | A+/Aa2 | | | | 2,270,000 | | | | 2,361,753 | |
Philadelphia School District GO, 5.00% due 9/1/2019 (State Aid Withholding) | | | A+/Aa2 | | | | 4,210,000 | | | | 4,414,017 | |
Philadelphia School District GO, 5.00% due 9/1/2019 (State Aid Withholding) | | | A+/Aa2 | | | | 18,000,000 | | | | 18,781,740 | |
Philadelphia School District GO, 5.25% due 9/1/2021 (State Aid Withholding) | | | A+/Aa2 | | | | 2,000,000 | | | | 2,073,140 | |
Philadelphia Water & Wastewater Revenue, 5.00% due 6/15/2013 (Insured: AGM) | | | AA+/Aa3 | | | | 7,020,000 | | | | 7,526,493 | |
Philadelphia Water & Wastewater Revenue, 5.00% due 6/15/2017 (Insured: AGM) | | | AA+/Aa3 | | | | 5,570,000 | | | | 6,132,960 | |
Pittsburgh GO, 5.00% due 9/1/2012 (Insured: Natl-Re) | | | BBB/A1 | | | | 3,415,000 | | | | 3,571,988 | |
Pittsburgh GO, 5.50% due 9/1/2014 (Insured: AMBAC) | | | BBB/A1 | | | | 1,750,000 | | | | 1,795,413 | |
Pittsburgh GO, 5.50% due 9/1/2014 (Insured: AMBAC) | | | BBB/A1 | | | | 1,405,000 | | | | 1,485,001 | |
Pittsburgh GO, 5.25% due 9/1/2016 (Insured: AGM) | | | AA+/Aa3 | | | | 3,000,000 | | | | 3,266,190 | |
Pittsburgh GO, 5.25% due 9/1/2017 (Insured: AGM) | | | AA+/Aa3 | | | | 1,910,000 | | | | 2,053,670 | |
Pittsburgh GO, 5.25% due 9/1/2018 (Insured: AGM) | | | AA+/Aa3 | | | | 3,240,000 | | | | 3,430,998 | |
Pittsburgh School District GO, 3.00% due 9/1/2011 (Insured: AGM) | | | AA+/Aa3 | | | | 1,425,000 | | | | 1,440,205 | |
Pittsburgh School District GO, 3.00% due 9/1/2012 (Insured: AGM) | | | AA+/Aa3 | | | | 1,670,000 | | | | 1,716,292 | |
Pittsburgh School District GO, 3.00% due 9/1/2013 (Insured: AGM) | | | AA+/Aa3 | | | | 2,100,000 | | | | 2,164,155 | |
Pittsburgh Water & Sewer Authority Revenue, 2.625% due 9/1/2035 put 9/1/2012 (Insured: AGM) | | | AA+/NR | | | | 2,000,000 | | | | 2,022,560 | |
Sayre HFA, 5.25% due 7/1/2011 (Latrobe Area Hospital; Insured: AMBAC) (ETM) | | | NR/NR | | | | 1,400,000 | | | | 1,416,730 | |
Sayre HFA, 5.25% due 7/1/2012 (Latrobe Area Hospital; Insured: AMBAC) (ETM) | | | NR/NR | | | | 1,000,000 | | | | 1,057,160 | |
RHODE ISLAND — 0.12% | | | | | | | | | | | | |
Providence GO, 5.50% due 1/15/2012 (Insured: Natl-Re/FGIC) | | | BBB+/A3 | | | | 1,880,000 | | | | 1,951,327 | |
Rhode Island COP, 5.00% due 10/1/2014 (Providence Plantations; Insured: Natl-Re) | | | AA-/Aa3 | | | | 1,000,000 | | | | 1,098,610 | |
Rhode Island State Health & Education Building Corp., 5.25% due 7/1/2014 (Memorial Hospital; LOC: Fleet Bank) | | | NR/NR | | | | 1,565,000 | | | | 1,654,299 | |
SOUTH CAROLINA — 1.37% | | | | | | | | | | | | |
Georgetown County Environmental Improvement, 5.70% due 4/1/2014 (International Paper Co.) | | | BBB/Baa3 | | | | 7,975,000 | | | | 8,545,771 | |
Greenville County School District, 5.25% due 12/1/2015 (Building Equity Sooner Tomorrow) | | | AA/Aa2 | | | | 1,000,000 | | | | 1,072,410 | |
Greenville County School District, 5.50% due 12/1/2016 (Building Equity Sooner Tomorrow) | | | AA/Aa2 | | | | 3,500,000 | | | | 3,986,955 | |
Greenwood County Hospital Facilities, 5.00% due 10/1/2013 (Self Regional Health Care; Insured: AGM) | | | AA+/Aa3 | | | | 2,000,000 | | | | 2,150,420 | |
Greenwood Fifty Facilities School District, 5.00% due 12/1/2015 (Insured: AGM) | | | AA+/Aa3 | | | | 1,000,000 | | | | 1,103,040 | |
Greenwood Fifty Facilities School District, 5.00% due 12/1/2016 (Insured: AGM) | | | AA+/Aa3 | | | | 1,000,000 | | | | 1,104,290 | |
Piedmont Municipal Power Agency, 6.75% due 1/1/2019 (Insured: Natl-Re/FGIC) | | | NR/Baa1 | | | | 3,205,000 | | | | 3,780,105 | |
South Carolina Jobs Economic Development, 5.00% due 8/15/2014 (Care Alliance Health Services; Insured: AGM) | | | AA+/Aa3 | | | | 4,000,000 | | | | 4,321,760 | |
South Carolina Jobs Economic Development, 5.00% due 8/15/2015 (Care Alliance Health Services; Insured: AGM) | | | AA+/Aa3 | | | | 3,000,000 | | | | 3,244,050 | |
York County PCR, 1.00% due 9/15/2024 put 9/1/2011 (North Carolina Electric) | | | A/A2 | | | | 11,000,000 | | | | 11,000,880 | |
York County PCR, 1.00% due 9/15/2024 put 9/1/2011 (North Carolina Electric) | | | A/A2 | | | | 14,400,000 | | | | 14,401,152 | |
34 Certified Semi-Annual Report
| | |
| SCHEDULE OF INVESTMENTS, CONTINUED | | |
| |
| Thornburg Limited Term Municipal Fund | | March 31, 2011 (Unaudited) |
| | | | | | | | | | | | |
Issuer-Description | | Credit Rating†
S&P/ Moody’s | | | Principal
Amount | | | Value | |
SOUTH DAKOTA — 0.27% | | | | | | | | | | | | |
South Dakota State Health & Educational Facilities Authority, 5.50% due 9/1/2011 (Rapid City Regional Hospital; Insured: Natl-Re) | | | BBB/A1 | | | $ | 1,100,000 | | | $ | 1,119,459 | |
South Dakota State Health & Educational Facilities Authority, 6.00% due 11/1/2014 (Sioux Valley Hospital & Health Systems) | | | AA-/A1 | | | | 1,015,000 | | | | 1,049,277 | |
South Dakota State Health & Educational Facilities Authority, 5.00% due 11/1/2015 (Sanford Health) | | | AA-/A1 | | �� | | 1,310,000 | | | | 1,431,948 | |
South Dakota State Health & Educational Facilities Authority, 5.00% due 4/1/2017 (Prairie Lakes Health) | | | A+/NR | | | | 2,215,000 | | | | 2,360,703 | |
South Dakota State Health & Educational Facilities Authority, 5.00% due 4/1/2018 (Prairie Lakes Health) | | | A+/NR | | | | 2,290,000 | | | | 2,419,728 | |
South Dakota State Health & Educational Facilities Authority, 5.00% due 4/1/2019 (Prairie Lakes Health) | | | A+/NR | | | | 2,440,000 | | | | 2,523,350 | |
TENNESSEE — 0.96% | | | | | | | | | | | | |
Clarksville Natural Gas Acquisition Corp., 5.00% due 12/15/2014 | | | NR/A2 | | | | 3,200,000 | | | | 3,370,752 | |
Clarksville Natural Gas Acquisition Corp., 5.00% due 12/15/2015 | | | NR/A2 | | | | 3,500,000 | | | | 3,662,645 | |
Clarksville Natural Gas Acquisition Corp., 5.00% due 12/15/2019 | | | NR/A2 | | | | 6,000,000 | | | | 5,824,020 | |
Tennessee Energy Acquisition Corp., 5.00% due 9/1/2015 | | | B/Ba3 | | | | 3,000,000 | | | | 3,089,640 | |
Tennessee Energy Acquisition Corp., 5.00% due 2/1/2017 | | | BBB/Baa3 | | | | 5,000,000 | | | | 5,081,300 | |
Tennessee Energy Acquisition Corp., 5.25% due 9/1/2017 | | | B/Ba3 | | | | 11,000,000 | | | | 11,023,210 | |
Tennessee Energy Acquisition Corp., 5.25% due 9/1/2018 | | | B/Ba3 | | | | 5,000,000 | | | | 4,949,300 | |
Tennessee Energy Acquisition Corp., 5.25% due 9/1/2020 | | | B/Ba3 | | | | 1,190,000 | | | | 1,146,886 | |
TEXAS — 8.91% | | | | | | | | | | | | |
Amarillo Health Facilities Corp., 5.50% due 1/1/2012 (Baptist St. Anthony’s Hospital Corp.; Insured: AGM) | | | NR/Aa3 | | | | 2,710,000 | | | | 2,758,102 | |
Amarillo Health Facilities Corp., 5.50% due 1/1/2015 (Baptist St. Anthony’s Hospital Corp.; Insured: AGM) | | | NR/Aa3 | | | | 1,065,000 | | | | 1,108,377 | |
Austin Community College Public Facilities Corp., 5.25% due 8/1/2017 (Round Rock Campus) | | | AA/Aa2 | | | | 1,500,000 | | | | 1,697,550 | |
Austin Electrical Utilities Systems, 5.50% due 11/15/2013 (Insured: AMBAC) | | | A+/A1 | | | | 1,000,000 | | | | 1,104,340 | |
Austin Water & Wastewater, 5.00% due 5/15/2014 (Insured: AMBAC) | | | AA/Aa2 | | | | 2,890,000 | | | | 3,222,119 | |
Austin Water & Wastewater, 5.00% due 5/15/2015 (Insured: AMBAC) | | | AA/Aa2 | | | | 1,520,000 | | | | 1,716,642 | |
Bexar Metropolitan Water District Waterworks, 4.50% due 5/1/2021 (Insured: Natl-Re) | | | A/A1 | | | | 1,200,000 | | | | 1,186,932 | |
Brazos River Authority, 4.90% due 10/1/2015 (Center Point Energy; Insured: Natl-Re) | | | BBB/Baa1 | | | | 4,275,000 | | | | 4,404,490 | |
Bryan Electric Systems, 3.00% due 7/1/2012 | | | A+/A1 | | | | 1,850,000 | | | | 1,899,599 | |
Bryan Electric Systems, 4.00% due 7/1/2014 | | | A+/A1 | | | | 1,300,000 | | | | 1,390,324 | |
Bryan Electric Systems, 4.00% due 7/1/2014 | | | A+/A1 | | | | 1,000,000 | | | | 1,007,380 | |
Bryan Electric Systems, 4.00% due 7/1/2015 | | | A+/A1 | | | | 1,110,000 | | | | 1,117,404 | |
Bryan Electric Systems, 5.00% due 7/1/2015 | | | A+/A1 | | | | 1,150,000 | | | | 1,276,224 | |
Bryan Electric Systems, 5.00% due 7/1/2016 | | | A+/A1 | | | | 1,500,000 | | | | 1,565,025 | |
Bryan Electric Systems, 5.00% due 7/1/2017 | | | A+/A1 | | | | 3,205,000 | | | | 3,332,944 | |
Bryan Electric Systems, 5.00% due 7/1/2019 | | | A+/A1 | | | | 8,000,000 | | | | 8,649,360 | |
Collin County Limited Tax Improvement GO, 5.00% due 2/15/2016 | | | AAA/Aaa | | | | 1,465,000 | | | | 1,677,923 | |
Corpus Christi Business & Job Development Corp., 5.00% due 9/1/2012 (Arena Project; Insured: AMBAC) | | | A/A2 | | | | 1,025,000 | | | | 1,074,631 | |
Dallas Convention Center Hotel Development Corp., 0% due 1/1/2018 | | | A+/A1 | | | | 5,240,000 | | | | 3,806,860 | |
Dallas Convention Center Hotel Development Corp., 5.00% due 1/1/2019 | | | A+/A1 | | | | 5,200,000 | | | | 5,564,728 | |
Dallas County Texas Utility & Reclamation District, 5.00% due 2/15/2017 (Insured: AMBAC) | | | BBB+/A3 | | | | 1,160,000 | | | | 1,239,077 | |
Dallas County Texas Utility & Reclamation District, 5.00% due 2/15/2017 (Insured: AMBAC) | | | BBB+/A3 | | | | 1,260,000 | | | | 1,345,894 | |
Dallas County Texas Utility & Reclamation District, 5.00% due 2/15/2018 (Insured: AMBAC) | | | BBB+/A3 | | | | 1,935,000 | | | | 2,028,886 | |
Dallas County Texas Utility & Reclamation District, 5.00% due 2/15/2018 (Insured: AMBAC) | | | BBB+/A3 | | | | 2,035,000 | | | | 2,133,738 | |
Certified Semi-Annual Report 35
| | |
| SCHEDULE OF INVESTMENTS, CONTINUED | | |
| |
| Thornburg Limited Term Municipal Fund | | March 31, 2011 (Unaudited) |
| | | | | | | | | | |
Issuer-Description | | Credit Rating†
S&P/ Moody’s | | Principal
Amount | | | Value | |
Dallas County Texas Utility & Reclamation District, 5.00% due 2/15/2019 (Insured: AMBAC) | | BBB+/A3 | | $ | 2,175,000 | | | $ | 2,245,187 | |
Dallas Fort Worth International Airport, 4.00% due 11/1/2012 | | A+/A1 | | | 1,000,000 | | | | 1,045,980 | |
Dallas Fort Worth International Airport, 5.00% due 11/1/2013 | | A+/A1 | | | 1,175,000 | | | | 1,272,831 | |
Dallas Fort Worth International Airport, 5.00% due 11/1/2014 | | A+/A1 | | | 1,300,000 | | | | 1,426,438 | |
Dallas/Fort Worth International Airport, 5.00% due 11/1/2015 | | A+/A1 | | | 3,370,000 | | | | 3,705,787 | |
Denton GO, 2.00% due 2/15/2012 | | AA/Aa2 | | | 3,115,000 | | | | 3,153,377 | |
Denton GO, 3.00% due 2/15/2013 | | AA/Aa2 | | | 2,710,000 | | | | 2,810,162 | |
Denton GO, 3.00% due 2/15/2014 | | AA/Aa2 | | | 3,325,000 | | | | 3,474,525 | |
Denton GO, 4.00% due 2/15/2015 | | AA/Aa2 | | | 3,445,000 | | | | 3,718,223 | |
Denton GO, 4.00% due 2/15/2016 | | AA/Aa2 | | | 3,535,000 | | | | 3,828,758 | |
Denton GO, 5.00% due 2/15/2017 | | AA/Aa2 | | | 3,675,000 | | | | 4,159,181 | |
Denton GO, 5.00% due 2/15/2018 | | AA/Aa2 | | | 3,825,000 | | | | 4,317,775 | |
Denton GO, 5.00% due 2/15/2019 | | AA/Aa2 | | | 3,990,000 | | | | 4,467,004 | |
Denton GO, 5.00% due 2/15/2020 | | AA/Aa2 | | | 4,195,000 | | | | 4,614,248 | |
Duncanville ISD GO, 0% due 2/15/2012 (Guaranty: PSF) | | AAA/Aaa | | | 1,245,000 | | | | 1,236,795 | |
Guadalupe-Blanco River Authority PCR, 5.625% due 10/1/2017 (AEP Texas Central Co.) | | BBB/Baa2 | | | 5,000,000 | | | | 5,348,850 | |
Harris County Educational Facilities Finance Corp., 5.00% due 11/15/2015 (Teco Project) | | AA/Aa3 | | | 1,450,000 | | | | 1,641,661 | |
Harris County Educational Facilities Finance Corp., 5.00% due 11/15/2018 (Teco Project) | | AA/Aa3 | | | 1,365,000 | | | | 1,539,624 | |
Harris County Educational Facilities Finance Corp., 5.00% due 11/15/2019 (Teco Project) | | AA/Aa3 | | | 1,000,000 | | | | 1,115,900 | |
Harris County Health Facilities Development Corp., 5.00% due 7/1/2016 (Christus Health; Insured: AGM) | | AA+/NR | | | 4,000,000 | | | | 4,333,160 | |
Harris County Health Facilities Development Corp. Thermal Utility, 5.00% due 11/15/2015 (Teco Project; Insured: Natl-Re) | | AA/Aa3 | | | 1,500,000 | | | | 1,579,290 | |
Harris County Hospital District Senior Lien, 5.00% due 2/15/2014 (Insured: Natl-Re) | | A/A1 | | | 1,275,000 | | | | 1,371,148 | |
Harris County Hospital District Senior Lien, 5.00% due 2/15/2017 (Insured: Natl-Re) | | A/A1 | | | 1,500,000 | | | | 1,624,650 | |
Houston Airport Systems Revenue, 5.00% due 7/1/2015 | | AA-/Aa3 | | | 2,600,000 | | | | 2,875,366 | |
Houston Airport Systems Revenue, 5.00% due 7/1/2017 | | AA-/Aa3 | | | 1,600,000 | | | | 1,777,312 | |
Houston Airport Systems Revenue, 5.00% due 7/1/2018 | | AA-/Aa3 | | | 1,000,000 | | | | 1,103,750 | |
Houston Airport Systems Revenue, 5.00% due 7/1/2019 | | AA-/Aa3 | | | 2,750,000 | | | | 2,980,835 | |
Houston ISD, 5.00% due 2/15/2014 (Limited Tax Schoolhouse) | | AA+/Aaa | | | 2,000,000 | | | | 2,217,980 | |
Houston ISD, 5.00% due 2/15/2015 (Limited Tax Schoolhouse) | | AA+/Aaa | | | 2,450,000 | | | | 2,757,083 | |
Houston ISD Public West Side, 0% due 9/15/2014 (Insured: AMBAC) | | AA/Aa2 | | | 6,190,000 | | | | 5,743,577 | |
Houston Utilities System Revenue, 5.00% due 11/15/2013 (Insured: AGM) | | AA+/Aa2 | | | 3,000,000 | | | | 3,291,750 | |
Hutto ISD GO, 0% due 8/1/2017 (Guaranty: PSF) | | AAA/NR | | | 2,170,000 | | | | 1,743,942 | |
Irving ISD GO, 0% due 2/15/2017 (Guaranty: PSF) | | AAA/Aaa | | | 1,000,000 | | | | 828,120 | |
Keller ISD GO, 0% due 8/15/2012 (Guaranty: PSF) | | AAA/Aaa | | | 1,250,000 | | | | 1,235,550 | |
Kerrville Health Facilities Development Corp. Hospital Revenue, 5.25% due 8/15/2021 (Sid Peterson Memorial Hospital) | | BBB-/NR | | | 4,000,000 | | | | 3,899,920 | |
Laredo GO, 5.00% due 2/15/2018 (Insured: Natl-Re) | | AA-/Aa2 | | | 2,000,000 | | | | 2,178,180 | |
Laredo Sports Venue Sales Refunding & Improvement, 5.00% due 3/15/2012 (Insured: AMBAC) | | A+/A1 | | | 1,660,000 | | | | 1,721,901 | |
Laredo Sports Venue Sales Refunding & Improvement, 5.00% due 3/15/2013 (Insured: AMBAC) | | A+/A1 | | | 1,745,000 | | | | 1,856,750 | |
Laredo Sports Venue Sales Refunding & Improvement, 5.00% due 3/15/2014 (Insured: AMBAC) | | A+/A1 | | | 1,835,000 | | | | 1,987,470 | |
Laredo Sports Venue Sales Refunding & Improvement, 5.00% due 3/15/2015 (Insured: AMBAC) | | A+/A1 | | | 1,930,000 | | | | 2,108,042 | |
Lower Colorado River Authority, 5.875% due 5/15/2016 (Insured: BHAC/FSA) | | NR/Aa1 | | | 2,210,000 | | | | 2,218,619 | |
Mission Economic Development Corp., 3.75% due 12/1/2018 put 5/1/2015 (Waste Management, Inc.) | | BBB/NR | | | 8,500,000 | | | | 8,470,505 | |
North Central Health Facility Development, 5.00% due 5/15/2017 (Baylor Health Care System) | | AA-/Aa2 | | | 5,000,000 | | | | 5,006,000 | |
North East ISD GO, 5.00% due 8/1/2016 (Guaranty: PSF) | | AAA/Aaa | | | 2,000,000 | | | | 2,307,840 | |
North Texas University Revenue, 5.00% due 4/15/2014 | | NR/Aa2 | | | 1,250,000 | | | | 1,388,438 | |
North Texas University Revenue, 5.00% due 4/15/2016 | | NR/Aa2 | | | 2,250,000 | | | | 2,552,130 | |
Northside ISD GO, 1.75% due 6/1/2037 put 6/1/2013 (Various School Buildings; Guaranty: PSF) | | AAA/NR | | | 20,000,000 | | | | 20,004,000 | |
Northside ISD GO, 1.50% due 8/1/2040 put 8/1/2012 (Guaranty: PSF) | | AAA/Aaa | | | 4,000,000 | | | | 4,031,600 | |
Red River Authority PCR, 5.20% due 7/1/2011 (Southwestern Public Service; Insured: AMBAC) | | A-/Baa1 | | | 7,780,000 | | | | 7,802,718 | |
36 Certified Semi-Annual Report
| | |
| SCHEDULE OF INVESTMENTS, CONTINUED | | |
| |
| Thornburg Limited Term Municipal Fund | | March 31, 2011 (Unaudited) |
| | | | | | | | | | | | |
Issuer-Description | | Credit Rating†
S&P/ Moody’s | | | Principal
Amount | | | Value | |
Richardson Refunding & Improvement GO, 5.00% due 2/15/2014 (Insured: Natl-Re) | | | AAA/Aaa | | | $ | 3,000,000 | | | $ | 3,313,050 | |
b Sam Rayburn Municipal Power Agency, 5.50% due 10/1/2012 | | | NR/Baa2 | | | | 6,000,000 | | | | 6,312,000 | |
Sam Rayburn Municipal Power Agency, 6.00% due 10/1/2021 | | | NR/Baa2 | | | | 8,400,000 | | | | 8,513,904 | |
San Antonio Electric & Gas Revenue, 1.15% due 12/1/2027 put 12/3/2012 (SPA: BNP Paribas) | | | AA-/Aa2 | | | | 15,000,000 | | | | 15,064,350 | |
San Juan Higher Education Finance Authority, 5.125% due 8/15/2020 (Idea Public Schools) | | | BBB/NR | | | | 2,000,000 | | | | 1,973,560 | |
State of Texas, 2.00% due 8/31/2011 (Tax & Revenue Anticipation Notes) | | | SP-1+/Mig1 | | | | 25,000,000 | | | | 25,178,000 | |
Tarrant County Cultural Educational Facilities, 5.00% due 8/15/2016 (Scott & White Memorial Hospital) | | | A/A1 | | | | 2,280,000 | | | | 2,418,328 | |
Tarrant County Cultural Educational Facilities, 5.00% due 8/15/2017 (Scott & White Memorial Hospital) | | | A/A1 | | | | 2,000,000 | | | | 2,109,580 | |
Texas Municipal Power Agency, 0% due 9/1/2013 (Insured: Natl-Re) | | | A+/A2 | | | | 1,000,000 | | | | 953,270 | |
Texas Municipal Power Agency, 5.00% due 9/1/2017 (Insured: AGM) | | | AA+/Aa3 | | | | 10,000,000 | | | | 11,262,400 | |
Texas Public Finance Authority Revenue, 5.00% due 7/1/2012 (Unemployment Compensation) | | | AAA/Aa1 | | | | 14,630,000 | | | | 15,451,182 | |
Texas Public Finance Authority Revenue, 5.00% due 1/1/2014 (Unemployment Compensation) | | | AAA/Aa1 | | | | 5,000,000 | | | | 5,531,000 | |
Texas Public Finance Authority Revenue, 5.00% due 7/1/2014 (Unemployment Compensation) | | | AAA/Aa1 | | | | 5,000,000 | | | | 5,603,750 | |
Texas Public Finance Authority Revenue, 5.00% due 10/15/2014 (Stephen F. Austin University; Insured: Natl-Re) | | | NR/A1 | | | | 1,305,000 | | | | 1,440,315 | |
Texas Public Finance Authority Revenue, 5.00% due 10/15/2015 (Stephen F. Austin University; Insured: Natl-Re) | | | NR/A1 | | | | 1,450,000 | | | | 1,613,314 | |
Texas Public Finance Authority Revenue, 5.00% due 7/1/2017 (Unemployment Compensation) | | | AAA/Aa1 | | | | 15,500,000 | | | | 17,291,800 | |
Uptown Development Authority, 5.00% due 9/1/2015 (Infrastructure Improvements) | | | BBB/NR | | | | 1,370,000 | | | | 1,476,052 | |
Uptown Development Authority, 5.00% due 9/1/2017 (Infrastructure Improvements) | | | BBB/NR | | | | 1,580,000 | | | | 1,656,741 | |
Uptown Development Authority, 5.00% due 9/1/2018 (Infrastructure Improvements) | | | BBB/NR | | | | 1,870,000 | | | | 1,936,684 | |
Uptown Development Authority, 5.00% due 9/1/2019 (Infrastructure Improvements) | | | BBB/NR | | | | 1,945,000 | | | | 1,989,171 | |
Waco Health Facilities Development Corp., 4.00% due 9/1/2013 (Hillcrest Health System; Insured: Natl-Re) (ETM) | | | BBB/NR | | | | 1,000,000 | | | | 1,071,520 | |
Washington County Health Facilities Development Corp., 5.75% due 6/1/2019 (Trinity Medical Center; Insured: ACA) | | | NR/NR | | | | 3,840,000 | | | | 3,552,691 | |
Weslaco GO Waterworks & Sewer System, 5.25% due 2/15/2019 (Insured: Natl-Re) | | | BBB+/A2 | | | | 2,835,000 | | | | 3,085,189 | |
West Harris County Regional Water, 5.25% due 12/15/2012 (Insured: AGM) | | | AA+/Aa3 | | | | 2,435,000 | | | | 2,594,736 | |
U.S. VIRGIN ISLANDS — 0.30% | | | | | | | | | | | | |
Virgin Islands Public Finance Authority, 6.75% due 10/1/2019 (Matching Fund Loan Diageo Project) | | | NR/Baa3 | | | | 7,690,000 | | | | 8,212,535 | |
Virgin Islands Water & Power Authority, 4.75% due 7/1/2015 | | | BBB-/Baa2 | | | | 1,000,000 | | | | 1,048,110 | |
Virgin Islands Water & Power Authority, 4.75% due 7/1/2016 | | | BBB-/Baa2 | | | | 1,225,000 | | | | 1,280,738 | |
Virgin Islands Water & Power Authority, 4.75% due 7/1/2017 | | | BBB-/Baa2 | | | | 1,300,000 | | | | 1,350,089 | |
UTAH — 0.75% | | | | | | | | | | | | |
Intermountain Power Agency Supply, 5.00% due 7/1/2012 (Insured: Natl-Re) (ETM) | | | NR/NR | | | | 4,355,000 | | | | 4,370,765 | |
Intermountain Power Agency Supply, 5.00% due 7/1/2012 | | | A+/A1 | | | | 15,000,000 | | | | 15,792,600 | |
Intermountain Power Agency Supply, 5.00% due 7/1/2013 | | | A+/A1 | | | | 5,000,000 | | | | 5,406,000 | |
Nebo School District GO, 2.50% due 7/1/2012 | | | AAA/Aaa | | | | 1,510,000 | | | | 1,547,191 | |
Salt Lake County Hospital Revenue, 5.50% due 5/15/2015 (IHC Health Services Inc.; Insured: AMBAC) | | | AA+/Aa1 | | | | 2,000,000 | | | | 2,032,640 | |
Utah Water Finance Agency Revenue, 4.90% due 10/1/2016 (Pooled Loan Financing; Insured: AMBAC) | | | NR/NR | | | | 350,000 | | | | 350,263 | |
Utah Water Finance Agency Revenue, 4.95% due 10/1/2017 (Pooled Loan Financing; Insured: AMBAC) | | | NR/NR | | | | 370,000 | | | | 370,192 | |
VERMONT — 0.47% | | | | | | | | | | | | |
Vermont Colleges Revenue GO, 4.00% due 7/1/2017 | | | A+/NR | | | | 5,375,000 | | | | 5,497,443 | |
Vermont Economic Development Authority Revenue, 5.00% due 12/15/2020 (Vermont Public Service Corp.) | | | NR/Baa1 | | | | 13,500,000 | | | | 13,345,830 | |
Certified Semi-Annual Report 37
| | |
| SCHEDULE OF INVESTMENTS, CONTINUED | | |
| |
| Thornburg Limited Term Municipal Fund | | March 31, 2011 (Unaudited) |
| | | | | | | | | | | | |
Issuer-Description | | Credit Rating†
S&P/ Moody’s | | | Principal
Amount | | | Value | |
VIRGINIA — 0.19% | | | | | | | | | | | | |
Louisa IDA PCR, 5.00% due 11/1/2035 put 12/1/2011 (Virginia Electric & Power Company) | | | A-/NR | | | $ | 3,000,000 | | | $ | 3,075,840 | |
Norton IDA Hospital Improvement, 5.75% due 12/1/2012 (Norton Community Hospital; Insured: ACA) | | | NR/NR | | | | 1,460,000 | | | | 1,463,431 | |
Suffolk Redevelopment Housing Authority, 4.85% due 7/1/2031 put 7/1/2011 (Windsor at Potomac; Collateralized: FNMA) | | | NR/Aaa | | | | 3,000,000 | | | | 3,028,320 | |
WASHINGTON — 2.27% | | | | | | | | | | | | |
Energy Northwest Washington Electric, 5.50% due 7/1/2012 (Bonneville Power Administration; Insured: Natl-Re) | | | AA/Aaa | | | | 3,000,000 | | | | 3,185,880 | |
Energy Northwest Washington Electric, 5.00% due 7/1/2014 (Wind Project; Insured: AMBAC) | | | A/A3 | | | | 2,575,000 | | | | 2,821,170 | |
Energy Northwest Washington Electric, 5.375% due 7/1/2014 pre-refunded 7/1/2011 (Columbia Generation; Insured: AGM) | | | AA+/Aaa | | | | 1,000,000 | | | | 1,022,610 | |
Energy Northwest Washington Electric, 6.00% due 7/1/2016 (Insured: AMBAC) | | | AA/Aaa | | | | 2,415,000 | | | | 2,563,498 | |
Energy Northwest Washington Electric, 5.00% due 7/1/2017 (Bonneville Power Administration) | | | AA/Aaa | | | | 5,470,000 | | | | 6,239,848 | |
Energy Northwest Washington Electric, 5.00% due 7/1/2018 (Insured: Natl-Re) | | | AA/Aaa | | | | 8,000,000 | | | | 9,105,600 | |
King County Sewer, 5.50% due 1/1/2016 (Insured: AGM) | | | AA+/Aa2 | | | | 7,205,000 | | | | 7,451,483 | |
Lewis County Public Utility District, 5.00% due 10/1/2011 (Cowlitz Falls Hydroelectric; Insured: Syncora) | | | AA/Aaa | | | | 2,000,000 | | | | 2,045,680 | |
Port Seattle Washington Revenue, 5.50% due 9/1/2018 (Insured: Natl-Re/FGIC) | | | A/A1 | | | | 5,000,000 | | | | 5,569,650 | |
Seattle Municipal Light & Power Revenue, 5.00% due 2/1/2016 | | | AA-/Aa2 | | | | 1,000,000 | | | | 1,131,860 | |
Seattle Municipal Light & Power Revenue, 5.00% due 2/1/2017 | | | AA-/Aa2 | | | | 2,000,000 | | | | 2,272,200 | |
Snohomish County Public Utilities District, 5.00% due 12/1/2015 (Insured: AGM) | | | AA+/Aa3 | | | | 5,015,000 | | | | 5,485,307 | |
Washington State GO, 0% due 1/1/2018 (Insured: Natl-Re/FGIC) | | | AA+/Aa1 | | | | 4,000,000 | | | | 3,196,440 | |
Washington State GO, 0% due 1/1/2019 (Insured: Natl-Re/FGIC) | | | AA+/Aa1 | | | | 3,000,000 | | | | 2,278,740 | |
Washington State HFA, 5.00% due 7/1/2013 (Overlake Hospital; Insured: AGM) | | | AA+/Aa3 | | | | 1,000,000 | | | | 1,067,480 | |
Washington State HFA, 5.00% due 8/15/2013 (Multicare Health Systems) | | | A+/A1 | | | | 1,250,000 | | | | 1,334,212 | |
Washington State HFA, 5.00% due 8/15/2014 (Multicare Health Systems) | | | A+/A1 | | | | 1,500,000 | | | | 1,615,620 | |
Washington State HFA, 5.625% due 10/1/2014 (Providence Health Systems; Insured: Natl-Re) | | | AA/Aa2 | | | | 3,000,000 | | | | 3,068,220 | |
Washington State HFA, 5.00% due 8/15/2015 (Multicare Health Systems) | | | A+/A1 | | | | 2,000,000 | | | | 2,167,640 | |
Washington State HFA, 5.00% due 8/15/2016 (Multicare Health Systems) | | | A+/A1 | | | | 2,075,000 | | | | 2,238,593 | |
Washington State HFA, 5.375% due 12/1/2016 (Group Health Co-op of Puget Sound; Insured: AMBAC) | | | BBB/NR | | | | 2,000,000 | | | | 2,032,580 | |
Washington State HFA, 5.00% due 7/1/2017 (Overlake Hospital Medical Center) | | | BBB+/A3 | | | | 1,245,000 | | | | 1,305,806 | |
Washington State HFA, 5.00% due 8/15/2017 (Multicare Health Systems) | | | A+/A1 | | | | 1,000,000 | | | | 1,062,880 | |
Washington State HFA, 5.25% due 8/1/2018 (Highline Medical Center; Insured: AGM 242) | | | A+/NR | | | | 8,070,000 | | | | 8,816,717 | |
Washington State HFA, 5.00% due 8/15/2018 (Multicare Health Systems) | | | A+/A1 | | | | 2,000,000 | | | | 2,105,620 | |
Washington State HFA, 5.00% due 7/1/2019 (Overlake Hospital Medical Center) | | | BBB+/A3 | | | | 1,050,000 | | | | 1,081,038 | |
Washington State HFA, 4.75% due 7/1/2020 (Overlake Hospital Medical Center) | | | BBB+/A3 | | | | 1,000,000 | | | | 1,000,670 | |
Washington State Public Power Supply Systems, 5.40% due 7/1/2012 (Insured: AGM) | | | AA+/Aaa | | | | 1,300,000 | | | | 1,378,598 | |
Washington State Public Power Supply Systems, 0% due 7/1/2013 (Insured: Natl-Re/IBC) | | | AA/Aaa | | | | 1,760,000 | | | | 1,698,013 | |
Washington State Public Power Supply Systems, 0% due 7/1/2015 (Insured: Natl-Re/IBC) | | | AA/Aaa | | | | 3,000,000 | | | | 2,710,860 | |
Yakima County School District, 5.00% due 12/1/2012 (Insured: Natl-Re) | | | NR/Aa1 | | | | 1,270,000 | | | | 1,358,621 | |
WEST VIRGINIA — 0.26% | | | | | | | | | | | | |
Kanawha, Mercer, Nicholas Counties Single Family Mortgage, 0% due 2/1/2015 pre-refunded 2/1/2014 | | | NR/Aaa | | | | 2,260,000 | | | | 1,938,176 | |
Monongalia County Community Hospital, 5.25% due 7/1/2020 (Monongalia General Hospital) | | | A-/NR | | | | 4,485,000 | | | | 4,551,109 | |
West Virginia EDA PCR, 4.85% due 5/1/2019 put 9/4/2013 (Appalachian Power Company) | | | BBB/Baa2 | | | | 1,000,000 | | | | 1,055,210 | |
West Virginia EDA PCR, 4.85% due 5/1/2019 put 9/4/2013 (Appalachian Power Company) | | | BBB/Baa2 | | | | 1,000,000 | | | | 1,055,210 | |
West Virginia University, 0% due 4/1/2013 (Insured: AMBAC) | | | A+/Aa3 | | | | 2,000,000 | | | | 1,923,300 | |
38 Certified Semi-Annual Report
| | |
| SCHEDULE OF INVESTMENTS, CONTINUED | | |
| |
| Thornburg Limited Term Municipal Fund | | March 31, 2011 (Unaudited) |
| | | | | | | | | | |
Issuer-Description | | Credit Rating†
S&P/ Moody’s | | Principal
Amount | | | Value | |
WISCONSIN — 0.98% | | | | | | | | | | |
Hudson School District GO, 4.625% due 10/1/2014 (Insured: AGM) | | AA+/Aa1 | | $ | 1,885,000 | | | $ | 1,920,589 | |
Wisconsin Clean Water Revenue, 5.00% due 6/1/2017 pre-refunded 6/1/2011 | | AA+/Aa1 | | | 2,455,000 | | | | 2,474,198 | |
Wisconsin Health & Educational Facilities Authority, 5.00% due 7/15/2014 (Aurora Health Care Inc.) | | NR/A3 | | | 4,265,000 | | | | 4,496,504 | |
Wisconsin Health & Educational Facilities Authority, 5.00% due 7/15/2015 (Aurora Health Care Inc.) | | NR/A3 | | | 4,100,000 | | | | 4,328,206 | |
Wisconsin Health & Educational Facilities Authority, 5.00% due 7/15/2016 (Aurora Health Care Inc.) | | NR/A3 | | | 3,695,000 | | | | 3,852,185 | |
Wisconsin Health & Educational Facilities Authority, 5.00% due 4/15/2017 (Aurora Health Care Inc.) | | NR/A3 | | | 1,295,000 | | | | 1,334,200 | |
Wisconsin Health & Educational Facilities Authority, 5.00% due 7/1/2017 (Agnesian Health Care Inc.) | | A-/A3 | | | 1,000,000 | | | | 1,037,670 | |
Wisconsin Health & Educational Facilities Authority, 5.00% due 7/15/2017 (Aurora Health Care Inc.) | | NR/A3 | | | 5,025,000 | | | | 5,181,780 | |
Wisconsin Health & Educational Facilities Authority, 5.00% due 7/1/2018 (Agnesian Health Care Inc.) | | A-/A3 | | | 1,855,000 | | | | 1,912,857 | |
Wisconsin Health & Educational Facilities Authority, 5.00% due 7/1/2019 (Agnesian Health Care Inc.) | | A-/A3 | | | 1,000,000 | | | | 1,011,040 | |
Wisconsin Health & Educational Facilities Authority, 5.00% due 7/1/2020 (Agnesian Health Care Inc.) | | A-/A3 | | | 2,110,000 | | | | 2,131,649 | |
Wisconsin Health & Educational Facilities Authority, 5.125% due 8/15/2027 put 8/15/2016 (Aurora Health Care Inc.) | | NR/A3 | | | 4,500,000 | | | | 4,779,900 | |
Wisconsin Petroleum, 5.00% due 7/1/2015 | | AA/Aa2 | | | 4,000,000 | | | | 4,481,280 | |
| | | | | | | | | | |
TOTAL INVESTMENTS — 99.05% (Cost $3,900,734,179) | | | | | | | | $ | 3,953,871,783 | |
OTHER ASSETS LESS LIABILITIES — 0.95% | | | | | | | | | 38,077,215 | |
| | | | | | | | | | |
NET ASSETS — 100.00% | | | | | | | | $ | 3,991,948,998 | |
| | | | | | | | | | |
Footnote Legend
| † | Credit ratings are unaudited. Rating changes may have occurred subsequent to the reporting period end. Bonds issued with a maturity of one year or less are assigned Moody’s ratings from MIG-1 to MIG-4 and Standard and Poor’s ratings from SP-1+ to SP-3 with MIG-1 and SP-1+ being the strongest ratings. |
| b | Segregated as collateral for a when-issued security. |
Certified Semi-Annual Report 39
| | |
| SCHEDULE OF INVESTMENTS, CONTINUED | | |
| |
| Thornburg Limited Term Municipal Fund | | March 31, 2011 (Unaudited) |
Portfolio Abbreviations
To simplify the listings of securities, abbreviations are used per the table below:
| | |
ACA | | Insured by American Capital Access |
AGM | | Insured by Assured Guaranty Municipal Corp. |
AMBAC | | Insured by American Municipal Bond Assurance Corp. |
BHAC | | Insured by Berkshire Hathaway Assurance Corp. |
CIFG | | CIFG Assurance North America Inc. |
COP | | Certificates of Participation |
DFA | | Development Finance Authority |
EDA | | Economic Development Authority |
ETM | | Escrowed to Maturity |
FGIC | | Insured by Financial Guaranty Insurance Co. |
FHA | | Insured by Federal Housing Administration |
FNMA | | Collateralized by Federal National Mortgage Association |
FSA | | Insured by Financial Security Assurance Co. |
GO | | General Obligation |
HFA | | Health Facilities Authority |
HUD | | Department of Housing & Urban Development |
IBC | | Insured Bond Certificate |
IDA | | Industrial Development Authority |
ISD | | Independent School District |
JEA | | Jacksonville Electric Authority |
LOC | | Letter of Credit |
Mtg | | Mortgage |
NCSL | | National Conference of State Legislature |
Natl-Re | | Insured by National Public Finance Guarantee Corp. |
PCR | | Pollution Control Revenue Bond |
PSF | | Guaranteed by Permanent School Fund |
Q-SBLF | | Qualified School Bond Loan Fund |
Radian | | Insured by Radian Asset Assurance |
SONYMA | | State of New York Mortgage Authority |
SPA | | Stand-by Purchase Agreement |
Syncora | | Insured by Syncora Guarantee Inc. |
UPMC | | University of Pittsburgh Medical Center |
USD | | Unified School District |
See notes to financial statements.
40 Certified Semi-Annual Report
| | |
| STATEMENT OF ASSETS AND LIABILITIES | | |
| |
| Thornburg Limited Term Municipal Fund | | March 31, 2011 (Unaudited) |
| | | | |
ASSETS | | | | |
Investments at value (cost $3,900,734,179) (Note 2) | | $ | 3,953,871,783 | |
Cash | | | 1,299,120 | |
Receivable for investments sold | | | 32,835,931 | |
Receivable for fund shares sold | | | 13,364,474 | |
Interest receivable | | | 49,902,333 | |
Prepaid expenses and other assets | | | 100,810 | |
| | | | |
Total Assets | | | 4,051,374,451 | |
| | | | |
| |
LIABILITIES | | | | |
Payable for securities purchased | | | 41,527,621 | |
Payable for fund shares redeemed | | | 13,955,239 | |
Payable to investment advisor and other affiliates (Note 3) | | | 1,830,406 | |
Accounts payable and accrued expenses | | | 255,656 | |
Dividends payable | | | 1,856,531 | |
| | | | |
Total Liabilities | | | 59,425,453 | |
| | | | |
| |
NET ASSETS | | $ | 3,991,948,998 | |
| | | | |
NET ASSETS CONSIST OF: | | | | |
Distribution in excess of net investment income | | $ | (1,180,592 | ) |
Net unrealized appreciation on investments | | | 53,137,604 | |
Accumulated net realized gain (loss) | | | (4,184,580 | ) |
Net capital paid in on shares of beneficial interest | | | 3,944,176,566 | |
| | | | |
| | $ | 3,991,948,998 | |
| | | | |
| |
NET ASSET VALUE: | | | | |
Class A Shares: | | | | |
Net asset value and redemption price per share ($1,548,269,259 applicable to 111,292,079 shares of beneficial interest outstanding - Note 4) | | $ | 13.91 | |
Maximum sales charge, 1.50% of offering price | | | 0.21 | |
| | | | |
Maximum offering price per share | | $ | 14.12 | |
| | | | |
| |
Class C Shares: | | | | |
Net asset value and offering price per share * ($483,505,729 applicable to 34,691,391 shares of beneficial interest outstanding - Note 4) | | $ | 13.94 | |
| | | | |
| |
Class I Shares: | | | | |
Net asset value, offering and redemption price per share ($1,960,174,010 applicable to 140,882,812 shares of beneficial interest outstanding - Note 4) | | $ | 13.91 | |
| | | | |
| * | Redemption price per share is equal to net asset value less any applicable contingent deferred sales charge. |
See notes to financial statements.
Certified Semi-Annual Report 41
| | |
| STATEMENT OF OPERATIONS | | |
| |
| Thornburg Limited Term Municipal Fund | | Six Months Ended March 31, 2011 (Unaudited) |
| | | | |
INVESTMENT INCOME: | | | | |
Interest income (net of premium amortized of $20,056,461) | | $ | 65,280,009 | |
| | | | |
| |
EXPENSES: | | | | |
Investment advisory fees (Note 3) | | | 5,856,115 | |
Administration fees (Note 3) | | | | |
Class A Shares | | | 990,278 | |
Class C Shares | | | 305,580 | |
Class I Shares | | | 478,297 | |
Distribution and service fees (Note 3) | | | | |
Class A Shares | | | 1,980,557 | |
Class C Shares | | | 1,215,987 | |
Transfer agent fees | | | | |
Class A Shares | | | 285,775 | |
Class C Shares | | | 124,605 | |
Class I Shares | | | 198,223 | |
Registration and filing fees | | | | |
Class A Shares | | | 20,721 | |
Class C Shares | | | 23,058 | |
Class I Shares | | | 66,882 | |
Custodian fees (Note 3) | | | 240,268 | |
Professional fees | | | 45,817 | |
Accounting fees | | | 59,260 | |
Trustee fees | | | 48,130 | |
Other expenses | | | 165,089 | |
| | | | |
Total Expenses | | | 12,104,642 | |
Less: | | | | |
Fees paid indirectly (Note 3) | | | (1,943 | ) |
| | | | |
Net Expenses | | | 12,102,699 | |
| | | | |
Net Investment Income | | | 53,177,310 | |
| | | | |
REALIZED AND UNREALIZED GAIN (LOSS) | | | | |
Net realized gain (loss) on investments | | | (945,491 | ) |
Net change in unrealized appreciation (depreciation) of investments | | | (102,838,425 | ) |
| | | | |
Net Realized and Unrealized Loss | | | (103,783,916 | ) |
| | | | |
Net Decrease in Net Assets Resulting from Operations | | $ | (50,606,606 | ) |
| | | | |
See notes to financial statements.
42 Certified Semi-Annual Report
STATEMENTS OF CHANGES IN NET ASSETS
Thornburg Limited Term Municipal Fund
| | | | | | | | |
| | | Six Months Ended
March 31, 2011* | | | Year Ended
September 30, 2010 | |
INCREASE (DECREASE) IN NET ASSETS FROM | | | | | | | | |
| | |
OPERATIONS: | | | | | | | | |
Net investment income | | $ | 53,177,310 | | | $ | 82,291,902 | |
Net realized gain (loss) on investments | | | (945,491 | ) | | | 425,081 | |
Increase (Decrease) in unrealized appreciation (depreciation) of investments | | | (102,838,425 | ) | | | 70,204,823 | |
| | | | | | | | |
| | |
Net Increase (Decrease) in Net Assets Resulting from Operations | | | (50,606,606 | ) | | | 152,921,806 | |
| | |
DIVIDENDS TO SHAREHOLDERS: | | | | | | | | |
From net investment income | | | | | | | | |
Class A Shares | | | (20,100,840 | ) | | | (35,403,295 | ) |
Class C Shares | | | (5,551,454 | ) | | | (8,052,710 | ) |
Class I Shares | | | (27,525,016 | ) | | | (38,835,897 | ) |
FUND SHARE TRANSACTIONS (NOTE 4): | | | | | | | | |
Class A Shares | | | (23,758,142 | ) | | | 542,169,927 | |
Class C Shares | | | 14,476,943 | | | | 265,854,064 | |
Class I Shares | | | 119,428,199 | | | | 993,524,455 | |
| | | | | | | | |
| | |
Net Increase in Net Assets | | | 6,363,084 | | | | 1,872,178,350 | |
| | |
NET ASSETS: | | | | | | | | |
Beginning of Period | | | 3,985,585,914 | | | | 2,113,407,564 | |
| | | | | | | | |
| | |
End of Period | | $ | 3,991,948,998 | | | $ | 3,985,585,914 | |
| | | | | | | | |
See notes to financial statements.
Certified Semi-Annual Report 43
| | |
| NOTES TO FINANCIAL STATEMENTS | | |
| |
| Thornburg Limited Term Municipal Fund | | March 31, 2011 (Unaudited) |
NOTE 1 – ORGANIZATION
Thornburg Limited Term Municipal Fund (the “Fund”) is a diversified series of Thornburg Investment Trust (the “Trust”). The Trust is organized as a Massachusetts business trust under a Declaration of Trust dated June 3, 1987 and is registered as a diversified, open-end management investment company under the Investment Company Act of 1940, as amended. The Fund is currently one of sixteen separate series of the Trust. Each series is considered to be a separate entity for financial reporting and tax purposes and bears expenses directly attributable to it. The Fund’s primary investment objective is to obtain as high a level of current income exempt from federal individual income taxes as is consistent, in the view of the Fund’s investment advisor, with the preservation of capital. The Fund’s secondary objective is to reduce expected changes in its share price compared to longer intermediate and long-term bond portfolios.
The Fund currently offers three classes of shares of beneficial interest: Class A, Class C, and Institutional Class (Class I). Each class of shares of the Fund represents an interest in the same portfolio of investments, except that (i) Class A shares are sold subject to a front-end sales charge collected at the time the shares are purchased and bear a service fee, (ii) Class C shares are sold at net asset value without a sales charge at the time of purchase, but are subject to a contingent deferred sales charge upon redemption within one year of purchase, and bear both a service fee and a distribution fee, (iii) Class I shares are sold at net asset value without a sales charge at the time of purchase, and (iv) the respective classes may have different reinvestment privileges and conversion rights. Additionally, the Fund may allocate among its classes certain expenses, to the extent allowable to specific classes, including transfer agent fees, government registration fees, certain printing and postage costs, and administrative and legal expenses. Currently, class specific expenses of the Fund are limited to service and distribution fees, administration fees, and certain registration and transfer agent expenses.
NOTE 2 – SIGNIFICANT ACCOUNTING POLICIES
Significant accounting policies of the Trust are as follows:
Valuation of Investments: Debt obligations have a primary market over the counter and are valued by an independent pricing service approved by the Trustees of the Trust. The pricing service ordinarily values debt obligations at quoted bid prices. When quotations are not available, debt obligations are valued at evaluated prices determined by the pricing service using methods which include consideration of yields or prices of debt obligations of comparable quality, type of issue, coupon, maturity and rating, and indications as to value from dealers and general market conditions. Short-term obligations having remaining maturities of 60 days or less are ordinarily valued at amortized cost, which approximates market value.
In any case where a pricing service fails to provide a price for a debt obligation held by the Fund, the valuation and pricing committee determines a fair value for the obligation using procedures approved by the Trustees. Additionally, in any case where management believes that a price provided by a pricing service for a debt obligation may be unreliable, the valuation and pricing committee decides whether or not to use the pricing service’s valuation or to determine a fair value for the obligation.
In determining fair value for any portfolio security or other investment, the valuation and pricing committee seeks to determine the amount that an owner of the investment might reasonably expect to receive upon a sale of the investment. However, because fair value prices are estimated prices, the valuation and pricing committee’s determination of fair value for an investment may differ from the value that would be realized by the Fund upon a sale of the investment, and that difference could be material to the Fund’s financial statements. The valuation and pricing committee’s determination of fair value for an investment may also differ from the prices obtained by other persons (including other mutual funds) for the investment.
Valuation Measurements: Various inputs are used in determining the value of the Fund’s investments. These inputs are summarized in the three levels listed below.
Level 1: Quoted prices in active markets for identical investments.
Level 2: Other significant observable inputs (including quoted prices for similar investments, interest rates, prepayment rates, credit risk, etc.).
Level 3: Significant unobservable inputs (including the Fund’s own assumptions in determining the fair value of investments).
44 Certified Semi-Annual Report
| | |
| NOTES TO FINANCIAL STATEMENTS, CONTINUED | | |
| |
| Thornburg Limited Term Municipal Fund | | March 31, 2011 (Unaudited) |
The following table displays a summary of the inputs used to value the Fund’s net assets as of March 31, 2011. In any instance when valuation inputs from more than one level are used to determine the fair value of a specific investment, the investment is placed in the level of the table based upon the lowest level input that is significant in determining the fair value of the investment:
| | | | | | | | | | | | | | | | |
| | | Fair Value Measurements at March 31, 2011 | |
| | | Total | | | Level 1 | | | Level 2 | | | Level 3 | |
Assets | | | | | | | | | | | | | | | | |
Investments in Securities Municipal Bonds | | $ | 3,953,871,783 | | | $ | — | | | $ | 3,953,871,783 | | | $ | — | |
| | | | | | | | | | | | | | | | |
Total Investments in Securities | | $ | 3,953,871,783 | | | $ | — | | | $ | 3,953,871,783 | | | $ | — | |
Other Notes: It is the policy of the Fund to recognize significant transfers between Levels 1 and 2 and to disclose those transfers at the last date of the reporting period. The Fund recognized no significant transfers into and out of Levels 1 and 2 during the six months ended March 31, 2011.
Federal Income Taxes: It is the policy of the Trust to comply with the provisions of the Internal Revenue Code applicable to “regulated investment companies” and to distribute to shareholders substantially all taxable (if any) and tax exempt income of the Fund. Therefore, no provision for federal income tax is required.
Management reviews each tax position believed to be material to the preparation of the Fund’s financial statements, to assess if it is more likely than not that the position would be sustained upon examination, based upon the technical merits of the position. As of March 31, 2011, management has not identified any such position for which a liability must be reflected in the Statement of Assets and Liabilities. The Fund’s tax returns remain subject to examination for three years after filing.
When-Issued and Delayed Delivery Transactions: The Fund may engage in when-issued or delayed delivery transactions. To the extent the Fund engages in such transactions, it will do so for the purpose of acquiring portfolio securities consistent with the Fund’s investment objectives and not for the purpose of investment leverage or to speculate on interest rate and/or market changes. At the time the Fund makes a commitment to purchase a security on a when-issued or delayed delivery basis, the Fund will record the transaction and reflect the value in determining its net asset value. When effecting such transactions, assets of an amount sufficient to make payment for the portfolio securities to be purchased will be segregated on the Fund’s records on the trade date. Securities purchased on a when-issued or delayed delivery basis do not earn interest until the settlement date.
Dividends: Net investment income of the Fund is declared daily as a dividend on shares for which the Fund has received payment. Dividends are paid monthly and are reinvested in additional shares of the Fund at net asset value per share at the close of business on the dividend payment date, or at the shareholder’s option, paid in cash. Net realized capital gains, to the extent available, will be distributed at least annually.
General: Securities transactions are accounted for on a trade date basis. Interest income is accrued as earned. Premiums and discounts on securities purchased are amortized to call dates or maturity dates of the respective securities. Realized gains and losses from the sale of securities are recorded on an identified cost basis. Net investment income (other than class specific expenses) and realized and unrealized gains and losses are allocated daily to each class of shares based upon the relative net asset value of outstanding shares (or the value of the dividend-eligible shares, as appropriate) of each class of shares at the beginning of the day (after adjusting for the current capital shares activity of the respective class). Expenses common to all Funds are allocated among the Funds comprising the Trust based upon their relative net asset values or other appropriate allocation methods.
Guarantees and Indemnifications: Under the Trust’s organizational documents, its officers and Trustees are indemnified against certain liabilities arising out of the performance of their duties to the Fund. Additionally, in the normal course of business the Trust enters into contracts with service providers that contain general indemnification clauses. The Trust’s maximum exposure under these arrangements is unknown. However, based on experience, the Trust expects the risk of loss to be remote.
Use of Estimates: The preparation of financial statements, in conformity with generally accepted accounting principles, requires management to make estimates and assumptions that affect the reported amounts of assets and liabilities and the disclosure of contingent
Certified Semi-Annual Report 45
| | |
| NOTES TO FINANCIAL STATEMENTS, CONTINUED | | |
| |
| Thornburg Limited Term Municipal Fund | | March 31, 2011 (Unaudited) |
assets and liabilities at the date of the financial statements and the reported amounts of increases and decreases in net assets from operations during the reporting period. Actual results could differ from those estimates.
NOTE 3 – INVESTMENT ADVISORY FEE AND OTHER TRANSACTIONS WITH AFFILIATES
Pursuant to an investment advisory agreement, Thornburg Investment Management, Inc. (the “Advisor”) serves as the investment advisor and performs services to the Fund for which the fees are payable at the end of each month. For the six months ended March 31, 2011, these fees were payable at annual rates ranging from .50 of 1% to .225 of 1% per annum of the average daily net assets of the Fund depending on the Fund’s asset size. The Trust also has entered into administrative services agreements with the Advisor, whereby the Advisor will perform certain administrative services for the shareholders of each class of the Fund’s shares, and for which fees will be payable at an annual rate of up to .125 of 1% per annum of the average daily net assets attributable to each class of shares.
The Trust has an underwriting agreement with Thornburg Securities Corporation (the “Distributor,” an affiliate of the Advisor), which acts as the distributor of the Fund’s shares. For the six months ended March 31, 2011, the Distributor has advised the Fund that it earned commissions aggregating $10,348 from the sale of Class A shares, and collected contingent deferred sales charges aggregating $73,264 from redemptions of Class C shares of the Fund.
Pursuant to a service plan under Rule 12b-1 of the Investment Company Act of 1940, the Fund may reimburse to the Advisor an amount not to exceed .25 of 1% per annum of the average daily net assets attributable to each class of shares of the Fund for payments made by the Advisor to securities dealers and other financial institutions to obtain various shareholder and distribution related services. For the six months ended March 31, 2011, there were no 12b-1 service plan fees charged for Class I shares. The Advisor may pay out of its own resources additional expenses for distribution of the Fund’s shares.
The Trust has also adopted a distribution plan pursuant to Rule 12b-1, applicable only to the Fund’s Class C shares under which the Fund compensates the Distributor for services in promoting the sale of Class C shares of the Fund at an annual rate of up to .25 of 1% per annum of the average daily net assets attributable to Class C shares. Total fees incurred by the Distributor for each class of shares of the Fund under their respective Service and Distribution Plans and Class C distribution fees waived by the Distributor for the six months ended March 31, 2011, are set forth in the Statement of Operations.
The Trust has an agreement with the custodian bank to indirectly pay a portion of the custodian’s fees through credits earned by the Fund’s cash on deposit with the bank. This deposit agreement is an alternative to overnight investments. Custodial fees have been adjusted to reflect amounts that would have been paid without this agreement, with a corresponding adjustment reflected as fees paid indirectly in the Statement of Operations. For the six months ended March 31, 2011, fees paid indirectly were $1,943.
Certain officers and Trustees of the Trust are also officers and/or directors of the Advisor and Distributor. The compensation of independent Trustees is borne by the Trust.
NOTE 4 – SHARES OF BENEFICIAL INTEREST
At March 31, 2011, there were an unlimited number of shares of beneficial interest authorized. Transactions in shares of beneficial interest were as follows:
| | | | | | | | | | | | | | | | |
| | | Six Months Ended
March 31, 2011 (Unaudited) | | | Year Ended
September 30, 2010 (Audited) | |
| | | Shares | | | Amount | | | Shares | | | Amount | |
Class A Shares | | | | | | | | | | | | | | | | |
Shares sold | | | 18,447,717 | | | $ | 259,006,044 | | | | 53,604,766 | | | $ | 750,685,059 | |
Shares issued to shareholders in reinvestment of dividends | | | 1,040,816 | | | | 14,568,816 | | | | 1,789,662 | | | | 25,116,212 | |
Shares repurchased | | | (21,262,401 | ) | | | (297,333,002 | ) | | | (16,674,431 | ) | | | (233,631,344 | ) |
| | | | | | | | | | | | | | | | |
| | | | |
Net Increase (Decrease) | | | (1,773,868 | ) | | $ | (23,758,142 | ) | | | 38,719,997 | | | $ | 542,169,927 | |
| | | | | | | | | | | | | | | | |
46 Certified Semi-Annual Report
| | |
| NOTES TO FINANCIAL STATEMENTS, CONTINUED | | |
| |
| Thornburg Limited Term Municipal Fund | | March 31, 2011 (Unaudited) |
| | | | | | | | | | | | | | | | |
| | | Six Months Ended
March 31, 2011 (Unaudited) | | | Year Ended
September 30, 2010 (Audited) | |
| | | Shares | | | Amount | | | Shares | | | Amount | |
Class C Shares | | | | | | | | | | | | | | | | |
Shares sold | | | 5,738,072 | | | $ | 80,924,795 | | | | 21,586,485 | | | $ | 303,022,953 | |
Shares issued to shareholders in reinvestment of dividends | | | 270,600 | | | | 3,794,018 | | | | 376,882 | | | | 5,304,297 | |
Shares repurchased | | | (5,016,273 | ) | | | (70,241,870 | ) | | | (3,022,783 | ) | | | (42,473,186 | ) |
| | | | | | | | | | | | | | | | |
Net Increase (Decrease) | | | 992,399 | | | $ | 14,476,943 | | | | 18,940,584 | | | $ | 265,854,064 | |
| | | | | | | | | | | | | | | | |
Class I Shares | | | | | | | | | | | | | | | | |
Shares sold | | | 33,559,556 | | | $ | 471,025,115 | | | | 96,757,098 | | | $ | 1,360,539,987 | |
Shares issued to shareholders in reinvestment of dividends | | | 1,637,769 | | | | 22,925,039 | | | | 2,281,105 | | | | 32,036,218 | |
Shares repurchased | | | (26,745,927 | ) | | | (374,521,955 | ) | | | (28,455,767 | ) | | | (399,051,750 | ) |
| | | | | | | | | | | | | | | | |
Net Increase (Decrease) | | | 8,451,398 | | | $ | 119,428,199 | | | | 70,582,436 | | | $ | 993,524,455 | |
| | | | | | | | | | | | | | | | |
NOTE 5 – SECURITIES TRANSACTIONS
For the six months ended March 31, 2011, the Fund had purchase and sale transactions of investment securities (excluding short-term investments) of $831,800,949 and $329,647,063, respectively.
NOTE 6 – INCOME TAXES
At March 31, 2011, information on the tax components of capital is as follows:
| | | | |
Cost of investments for tax purposes | | $ | 3,900,734,179 | |
| | | | |
Gross unrealized appreciation on a tax basis | | $ | 79,350,249 | |
Gross unrealized depreciation on a tax basis | | | (26,212,645 | ) |
| | | | |
Net unrealized appreciation (depreciation) on investments (tax basis) | | $ | 53,137,604 | |
| | | | |
At March 31, 2011 the Fund had tax basis capital losses, which may be carried forward to offset future capital gains. To the extent such carryforwards are used, capital gain distributions may be reduced to the extent provided by regulations.
Such capital loss carryforwards expire as follows:
| | | | |
2014 | | $ | 227,231 | |
2015 | | | 2,811,143 | |
2016 | | | 192,444 | |
| | | | |
| | $ | 3,230,818 | |
| | | | |
OTHER NOTES
Fund management believes no events have occurred between March 31, 2011 and May 20, 2011, the date of issuance of the financial statements, which require adjustment of, or disclosure in, the accompanying financial statements.
Certified Semi-Annual Report 47
FINANCIAL HIGHLIGHTS
Thornburg Limited Term Municipal Fund
| | | | | | | | | | | | | | | | | | | | | | | | | | | | | | | | | | | | | | | | | | | | | | | | | | | | | | | | | | | | |
| | | PER SHARE PERFORMANCE (for a share outstanding throughout the period)+ | | | RATIOS TO AVERAGE NET ASSETS | | | SUPPLEMENTAL DATA | |
Unless
Otherwise
Noted,
Periods
are
Fiscal
Years
Ended
Sept.
30, | | Net Asset
Value
Beginning
of Period | | | Net
Investment
Income
(Loss) | | | Net
Realized &
Unrealized
Gain (Loss)
on
Investments | | | Total from
Investment
Operations | | | Dividends
from
Net
Investment
Income | | | Dividends
from
Net
Realized
Gains | | | Total
Dividends | | | Net
Asset
Value
End
of
Period | | | Net
Investment
Income
(Loss) (%) | | | Expenses,
After
Expense
Reductions
(%) | | | Expenses,
After
Expense
Reductions
and Net of
Custody
Credits
(%) | | | Expenses,
Before
Expense
Reductions
(%) | | | Total
Return
(%)(a) | | | Portfolio
Turnover
Rate (%) | | | Net Assets
at End of
Period
(Thousands) | |
Class A Shares | | | | | | | | | | | | | | | | | | | | | | | | | | | | | | | | | | | | | | | | | | | | | | | | | | | | | | | | | |
2011(b)(c) | | $ | 14.27 | | | | 0.18 | | | | (0.36 | ) | | | (0.18 | ) | | | (0.18 | ) | | | — | | | | (0.18 | ) | | $ | 13.91 | | | | 2.54 | (d) | | | 0.74 | (d) | | | 0.74 | (d) | | | 0.74 | (d) | | | (1.28 | ) | | | 8.67 | | | $ | 1,548,269 | |
2010 (c) | | $ | 14.00 | | | | 0.37 | | | | 0.28 | | | | 0.65 | | | | (0.38 | ) | | | — | | | | (0.38 | ) | | $ | 14.27 | | | | 2.66 | | | | 0.78 | | | | 0.78 | | | | 0.78 | | | | 4.70 | | | | 12.57 | | | $ | 1,613,582 | |
2009(c) | | $ | 13.22 | | | | 0.47 | | | | 0.78 | | | | 1.25 | | | | (0.47 | ) | | | — | | | | (0.47 | ) | | $ | 14.00 | | | | 3.50 | | | | 0.86 | | | | 0.86 | | | | 0.86 | | | | 9.67 | | | | 12.18 | | | $ | 1,040,628 | |
2008(c) | | $ | 13.49 | | | | 0.48 | | | | (0.27 | ) | | | 0.21 | | | | (0.48 | ) | | | — | | | | (0.48 | ) | | $ | 13.22 | | | | 3.54 | | | | 0.89 | | | | 0.88 | | | | 0.89 | | | | 1.54 | | | | 17.78 | | | $ | 705,238 | |
2007(c) | | $ | 13.53 | | | | 0.46 | | | | (0.04 | ) | | | 0.42 | | | | (0.46 | ) | | | — | | | | (0.46 | ) | | $ | 13.49 | | | | 3.43 | | | | 0.90 | | | | 0.90 | | | | 0.90 | | | | 3.18 | | | | 21.35 | | | $ | 696,717 | |
2006(c) | | $ | 13.59 | | | | 0.44 | | | | (0.06 | ) | | | 0.38 | | | | (0.44 | ) | | | — | | | | (0.44 | ) | | $ | 13.53 | | | | 3.28 | | | | 0.91 | | | | 0.90 | | | | 0.91 | | | | 2.87 | | | | 23.02 | | | $ | 833,189 | |
Class C Shares | | | | | | | | | | | | | | | | | | | | | | | | | | | | | | | | | | | | | | | | | | | | | | | | | | | | | | | | | |
2011(b) | | $ | 14.30 | | | | 0.16 | | | | (0.36 | ) | | | (0.20 | ) | | | (0.16 | ) | | | — | | | | (0.16 | ) | | $ | 13.94 | | | | 2.27 | (d) | | | 1.00 | (d) | | | 1.00 | (d) | | | 1.00 | (d) | | | (1.41 | ) | | | 8.67 | | | $ | 483,506 | |
2010 | | $ | 14.02 | | | | 0.33 | | | | 0.29 | | | | 0.62 | | | | (0.34 | ) | | | — | | | | (0.34 | ) | | $ | 14.30 | | | | 2.36 | | | | 1.05 | | | | 1.05 | | | | 1.55 | | | | 4.48 | | | | 12.57 | | | $ | 481,808 | |
2009 | | $ | 13.24 | | | | 0.43 | | | | 0.79 | | | | 1.22 | | | | (0.44 | ) | | | — | | | | (0.44 | ) | | $ | 14.02 | | | | 3.21 | | | | 1.13 | | | | 1.13 | | | | 1.63 | | | | 9.37 | | | | 12.18 | | | $ | 206,952 | |
2008 | | $ | 13.51 | | | | 0.44 | | | | (0.27 | ) | | | 0.17 | | | | (0.44 | ) | | | — | | | | (0.44 | ) | | $ | 13.24 | | | | 3.26 | | | | 1.17 | | | | 1.16 | | | | 1.67 | | | | 1.26 | | | | 17.78 | | | $ | 99,972 | |
2007 | | $ | 13.55 | | | | 0.43 | | | | (0.04 | ) | | | 0.39 | | | | (0.43 | ) | | | — | | | | (0.43 | ) | | $ | 13.51 | | | | 3.15 | | | | 1.19 | | | | 1.18 | | | | 1.68 | | | | 2.90 | | | | 21.35 | | | $ | 86,564 | |
2006 | | $ | 13.62 | | | | 0.41 | | | | (0.07 | ) | | | 0.34 | | | | (0.41 | ) | | | — | | | | (0.41 | ) | | $ | 13.55 | | | | 3.00 | | | | 1.18 | | | | 1.18 | | | | 1.68 | | | | 2.52 | | | | 23.02 | | | $ | 105,436 | |
Class I Shares | | | | | | | | | | | | | | | | | | | | | | | | | | | | | | | | | | | | | | | | | | | | | | | | | | | | | | | | | |
2011(b) | | $ | 14.27 | | | | 0.20 | | | | (0.36 | ) | | | (0.16 | ) | | | (0.20 | ) | | | — | | | | (0.20 | ) | | $ | 13.91 | | | | 2.88 | (d) | | | 0.40 | (d) | | | 0.40 | (d) | | | 0.40 | (d) | | | (1.11 | ) | | | 8.67 | | | $ | 1,960,174 | |
2010 | | $ | 14.00 | | | | 0.41 | | | | 0.28 | | | | 0.69 | | | | (0.42 | ) | | | — | | | | (0.42 | ) | | $ | 14.27 | | | | 2.98 | | | | 0.44 | | | | 0.44 | | | | 0.44 | | | | 5.04 | | | | 12.57 | | | $ | 1,890,196 | |
2009 | | $ | 13.22 | | | | 0.51 | | | | 0.79 | | | | 1.30 | | | | (0.52 | ) | | | — | | | | (0.52 | ) | | $ | 14.00 | | | | 3.81 | | | | 0.53 | | | | 0.53 | | | | 0.53 | | | | 10.03 | | | | 12.18 | | | $ | 865,827 | |
2008 | | $ | 13.49 | | | | 0.52 | | | | (0.27 | ) | | | 0.25 | | | | (0.52 | ) | | | — | | | | (0.52 | ) | | $ | 13.22 | | | | 3.88 | | | | 0.55 | | | | 0.55 | | | | 0.55 | | | | 1.88 | | | | 17.78 | | | $ | 437,393 | |
2007 | | $ | 13.53 | | | | 0.51 | | | | (0.04 | ) | | | 0.47 | | | | (0.51 | ) | | | — | | | | (0.51 | ) | | $ | 13.49 | | | | 3.78 | | | | 0.57 | | | | 0.57 | | | | 0.57 | | | | 3.53 | | | | 21.35 | | | $ | 303,716 | |
2006 | | $ | 13.59 | | | | 0.49 | | | | (0.06 | ) | | | 0.43 | | | | (0.49 | ) | | | — | | | | (0.49 | ) | | $ | 13.53 | | | | 3.62 | | | | 0.57 | | | | 0.57 | | | | 0.57 | | | | 3.22 | | | | 23.02 | | | $ | 285,878 | |
| (a) | Not annualized for periods less than one year. |
| (b) | Unaudited Six Month Period Ended March 31. |
| (c) | Sales loads are not reflected in computing total return. |
| + | Based on weighted average shares outstanding. |
See notes to financial statements.
| | |
| 48 Certified Semi-Annual Report | | Certified Semi-Annual Report 49 |
| | |
| EXPENSE EXAMPLE | | |
| |
| Thornburg Limited Term Municipal Fund | | March 31, 2011 (Unaudited) |
As a shareholder of the Fund, you incur two types of costs:
| | (1) | transaction costs, including |
(a) sales charges (loads) on purchase payments, for Class A shares;
(b) a deferred sales charge on redemptions of any part or all of a purchase of $1 million of Class A shares within 12 months of purchase;
(c) a deferred sales charge on redemptions of Class C shares within 12 months of purchase;
| | (2) | ongoing costs, including management fees; distribution and/or service (12b-1) fees; and other Fund expenses. |
This example is intended to help you understand your ongoing costs (in dollars) of investing in the Fund and to compare these costs with the ongoing costs of investing in other mutual funds.
The example is based on a $1,000 investment beginning on October 1, 2010, and held until March 31, 2011.
ACTUAL EXPENSES
For each class of shares, the first line of the table at right provides information about actual account values and actual expenses. You may use the information in this line, together with the amount you invested, to estimate the expenses that you paid over the period. Simply divide your account value by $1,000 (for example, an $8,600 account value divided by $1,000 = 8.6), then multiply the result by the number in the first line for your class of shares under the heading entitled “Expenses Paid During Period” to estimate the expenses you paid on your account during this period.
HYPOTHETICAL EXAMPLE FOR COMPARISON PURPOSES
For each class of shares, the second line of the table at right provides information about hypothetical account values and hypothetical expenses based on the Fund’s actual expense ratio and an assumed rate of return of 5% per year before expenses, which is not the Fund’s actual return. The hypothetical account values and expenses may not be used to estimate the actual ending account balance or expenses you paid for the period. You may use this information to compare the ongoing costs of investing in the Fund and other funds. To do so, compare this 5% hypothetical example with the 5% hypothetical examples that appear in the shareholder reports of the other funds.
| | | | | | | | | | | | |
| | | Beginning
Account Value
10/1/10 | | | Ending
Account Value
3/31/11 | | | Expenses
Paid During
Period†
10/1/10–3/31/11 | |
Class A Shares | | | | | | | | | | | | |
Actual | | $ | 1,000.00 | | | $ | 987.20 | | | $ | 3.64 | |
Hypothetical* | | $ | 1,000.00 | | | $ | 1,021.26 | | | $ | 3.71 | |
Class C Shares | | | | | | | | | | | | |
Actual | | $ | 1,000.00 | | | $ | 985.90 | | | $ | 4.97 | |
Hypothetical* | | $ | 1,000.00 | | | $ | 1,019.92 | | | $ | 5.06 | |
Class I Shares | | | | | | | | | | | | |
Actual | | $ | 1,000.00 | | | $ | 988.90 | | | $ | 1.98 | |
Hypothetical* | | $ | 1,000.00 | | | $ | 1,022.94 | | | $ | 2.01 | |
| † | Expenses are equal to the annualized expense ratio for each class (A: 0.74%; C: 1.00%; I: 0.40%) multiplied by the average account value over the period, multiplied by 182/365 to reflect the one-half year period. |
| * | Hypothetical assumes a rate of return of 5% per year before expenses. |
Please note that the expenses shown in the table are meant to highlight your ongoing costs only and do not reflect any transactional costs, such as sales charges (loads), redemption fees, or exchange fees. Therefore, the second line of the table for each class of shares is useful in comparing ongoing costs only, and will not help you determine the relative total costs of owning different funds. In addition, if these transactional costs were included, your costs would have been higher.
50 Certified Semi-Annual Report
| | |
| OTHER INFORMATION | | |
| |
| Thornburg Limited Term Municipal Fund | | March 31, 2011 (Unaudited) |
PORTFOLIO PROXY VOTING
Policies and Procedures:
The Trust has delegated to Thornburg Investment Management, Inc. (the “Advisor”) voting decisions respecting proxies for the Fund’s voting securities. The Advisor makes voting decisions in accordance with its Proxy Voting Policy and Procedures. A description of the Policy and Procedures is available (i) without charge, upon request, by calling the Advisor toll-free at 1-800-847-0200, (ii) on the Thornburg website at www.thornburg.com, and (iii) on the Securities and Exchange Commission’s website at www.sec.gov.
Information regarding how proxies were voted is available on or before August 31 of each year for the twelve months ending the preceding June 30. This information is available (i) without charge, upon request by calling the Advisor toll-free at 1-800-847-0200, (ii) on the Thornburg website at www.thornburg.com, and (iii) on the Securities and Exchange Commission’s website at www.sec.gov.
AVAILABILITY OF QUARTERLY PORTFOLIO SCHEDULE
The Fund files with the Securities and Exchange Commission schedules of its portfolio holdings on Form N-Q for the first and third quarters of each fiscal year. The Fund’s Forms N-Q are available on the Commission’s website at www.sec.gov, or may be reviewed and copied at the Commission’s Public Reference Room in Washington, D.C. Information on the operation of the Public Reference Room may be obtained by calling 1-800-SEC-0330. The Fund also makes this information available on its website at www.thornburg.com/ download or upon request by calling 1-800-847-0200.
Certified Semi-Annual Report 51
Trustees’ Statement to Shareholders
Not part of the Certified Semi-Annual Report
February 8, 2005, as readopted September 13, 2010
The Trustees are concerned that ongoing commentaries and opinions reported in the media may confuse investors in general as to the supervisory duties of trustees of mutual funds and, in particular, leave Thornburg Investment Trust shareholders uncertain regarding how we discharge our responsibilities in supervising the Funds’ investment advisor and in reviewing the advisor’s contract for renewal. We decided to spell out clearly three principal guidelines that we follow in supervising the Trust’s investment advisor on your behalf.
We begin with the premise that each shareholder selected his or her Fund because its investments are managed by the investment advisor identified in the prospectus and in accordance with the objective and policies described in the prospectus. We realize, as each of you do, that if you believe that your Fund’s stated objective and policies no longer serve your personal investment goals, you can sell your shares and leave the Fund.
Therefore, we believe that our primary supervisory task – our principal obligation to you – is to assess the nature and quality of the advisor’s services, and to confirm that the advisor actively and competently pursues the Fund’s objective, in accordance with the policies set out in the prospectus. To do this, we meet regularly with management to review your Fund’s portfolio and to discuss the advisor’s specific actions and judgments in pursuing the Fund’s objective. We do not substitute our own judgment for the advisor’s decisions in selecting investments; the advisor is paid to exercise its informed judgment on investment decisions, and we seek to confirm, in reviewing the advisor’s performance, that the advisor is doing just that.
Second, while we are conscious of costs and the effect that costs have on shareholders’ returns, we do not seek the lowest fees or expense ratio as our sole or primary objective. We try to make sure that your Fund’s fees and costs are reasonable in relationship to the services rendered and that they are generally in line with those charged by other expert investment advisors, consistent with our belief that the Fund’s investors searched for and expect that expertise and attention and have decided to pay a reasonable price for it. We do not put the management contract “out to bid” as a matter of course, and we would not do so unless we had concluded that the advisor materially had failed to pursue the Fund’s objectives in accordance with its policies, or for other equally important reasons. We believe that any other approach would be inconsistent with your interests and contrary to your expectations when you bought shares of the Fund in the first place.
Finally, because we believe that most Thornburg Fund shareholders have invested with a long-term perspective, we try not to focus too much on the fashions of the moment and on short-term performance. The market will not favor any specific investment objective or set of policies at all times and under all economic circumstances. A fund will experience periods of both high and low returns relative to other funds and other investments. Even if one of our Funds is not favored by the market at a particular time, we believe that the advisor is nonetheless obliged to remain true to the Fund’s objective and policies, and we watch to see that it does so.
52 This page is not part of the Semi-Annual Report.
Retirement and Education Accounts
Thornburg Investment Management offers retirement and education savings accounts that can help you meet a variety of planning challenges. For account applications or further information on any of the accounts below, please call 1-800-847-0200 or go to www.thornburg.com/ira. Your financial advisor can help you determine which plan is right for you.
Individual Retirement Accounts
Individual Retirement Accounts (IRAs) provide a tax-advantaged means to save money for the future. For a detailed outline of the difference between retirement accounts, see www.thornburg.com/ira. Rollovers are available. Call 1-800-847-0200 for more information.
Traditional IRAs – Contributions to Traditional IRAs are tax deductible for eligible individuals, and withdrawals are taxed as additional ordinary income. You may contribute to an IRA if you receive compensation and are under 70 1/2, even if you are covered by an employer retirement plan. Deductible contributions are subject to certain qualifications. Please consult your tax advisor.
Roth IRAs – Under a Roth IRA, there is no tax deduction for contributions, but there is no income tax on qualified withdrawals. For a more detailed comparison of Traditional and Roth IRAs, please see our web site at www.thornburg.com/ira.
SEP IRAs – Simplified Employee Pension (SEP) IRAs are established by employers. The employer is allowed a tax deduction for contributions made to the SEP Plan and makes contributions to each eligible employee’s SEP IRA on a discretionary basis.
SIMPLE IRAs – Savings Incentive Match Plan for Employees of Small Employers (SIMPLE) is designed to give small business owners a simplified method to establish and contribute to a retirement plan for employees. The employer is allowed a tax deduction for contributions and makes either matching or non-elective contributions to each eligible employee’s SIMPLE IRA. Employees may make salary deferral contributions.
Coverdell Education Savings Account
These savings accounts are designed to provide a way to save money for higher education expenses. In an Education Savings Account, earnings and interest grow tax-free, and qualified withdrawals used to pay for eligible higher-education expenses are tax- and penalty-free.
Funds Available
The following funds are available in the accounts listed above:
| | • | | Thornburg International Value Fund |
| | • | | Thornburg Core Growth Fund |
| | • | | Thornburg Investment Income Builder Fund |
| | • | | Thornburg Global Opportunities Fund |
| | • | | Thornburg International Growth Fund |
| | • | | Thornburg Developing World Fund |
| | • | | Thornburg Limited Term U.S. Government Fund |
| | • | | Thornburg Limited Term Income Fund |
| | • | | Thornburg Strategic Income Fund |
This page is not part of the Semi-Annual Report. 53

Thornburg Equity Funds
Thornburg’s equity research uses a fundamental and comprehensive analytical approach. Thornburg equity funds focus on a limited number of securities so that each holding can impact performance. The equity team searches for firms believed to have a promising future and seeks to buy shares of those companies at a discount to their intrinsic value.
| | • | | Thornburg International Value Fund |
| | • | | Thornburg Core Growth Fund |
| | • | | Thornburg Investment Income Builder Fund |
| | • | | Thornburg Global Opportunities Fund |
| | • | | Thornburg International Growth Fund |
| | • | | Thornburg Developing World Fund |
Thornburg Bond Funds
Thornburg Investment Management applies a disciplined philosophy to fixed-income management. Since the launch of our first fixed-income fund over 25 years ago, we have been conducting fundamental, bottom-up research in an effort to identify bonds which we believe provide the best return for a given level of risk. We are very organic in our approach, avoiding leverage or complex strategies which could backfire in periods of market uncertainty.
| | • | | Thornburg Limited Term Municipal Fund |
| | • | | Thornburg Intermediate Municipal Fund |
| | • | | Thornburg California Limited Term Municipal Fund |
| | • | | Thornburg New Mexico Intermediate Municipal Fund |
| | • | | Thornburg New York Intermediate Municipal Fund |
| | • | | Thornburg Strategic Municipal Income Fund |
| | • | | Thornburg Limited Term U.S. Government Fund |
| | • | | Thornburg Limited Term Income Fund |
| | • | | Thornburg Strategic Income Fund |
Before investing, carefully consider the Fund’s investment goals, risks, charges, and expenses. For a prospectus containing this and other information, contact your financial advisor or visit thornburg.com. Read it carefully before investing.
For additional information, please visit www.thornburg.com
Thornburg Investment Management, Inc. 2300 North Ridgetop Road, Santa Fe, NM 87506
This page is not part of the Semi-Annual Report. 55
| | | | | | |
 | | Waste not, | | 
|
| | Wait not | |
| | | | Get instant access to your shareholder reports. |
| | |
| | This Semi-Annual Report is submitted for the general information of shareholders of the Fund. It is not authorized for distribution to prospective investors in the Fund unless preceded or accompanied by an effective prospectus. | | By switching from your postal mailbox to your email inbox, you reduce paper clutter, improve record keeping access, and help conserve our natural resources. |
 | | Investment Advisor: | | Go to www.thornburg.com/edelivery and sign up to receive your shareholder reports, prospectuses, and proxy statements electronically. |
| | Thornburg Investment Management® 800.847.0200 | |
| | Distributor: | | |
| | Thornburg Securities Corporation® 800.847.0200 | | You invest in the future, without spending a dime. |
| | TH1072 | | |

Important Information
The information presented on the following pages was current as of March 31, 2011. The managers’ views, portfolio holdings, and sector diversification are provided for the general information of the Fund’s shareholders; they are historical and subject to change. This material should not be deemed a recommendation to buy or sell any of the securities mentioned.
Investments in the Fund carry risks, including possible loss of principal. Bond funds have the same interest rate, inflation, and credit risks that are associated with the underlying bonds. The principal value of bonds will fluctuate relative to changes in interest rates, decreasing when interest rates rise. Unlike bonds, bond funds have ongoing fees and expenses. Please see the Fund’s Prospectus for a discussion of the risks associated with an investment in the Fund. Investments in the Fund are not FDIC insured, nor are they deposits of or guaranteed by a bank or any other entity. There is no guarantee that the Fund will meet its investment objectives. The laddering strategy does not assure or guarantee better performance and cannot eliminate the risk of investment losses.
Performance data given at net asset value (NAV) does not take into account applicable sales charges. If the sales charges had been included, the performance would have been lower.
Minimum investments for Class I shares are higher than those for other classes. Class I shares may not be available to all investors.
| | | | |
Share Class | | NASDAQ Symbol | | Cusip |
| Class A | | THIMX | | 885-215-202 |
| Class C | | THMCX | | 885-215-780 |
| Class I | | THMIX | | 885-215-673 |
Glossary
BofA Merrill Lynch 7-12 Year U.S. Municipal Securities Index – The index represents a broad measure of market performance. It is a model portfolio of municipal obligations throughout the U.S., with an average maturity which ranges from seven to twelve years.
BofA Merrill Lynch Municipal Master Index – This index tracks the performance of the investment-grade U.S. tax-exempt bond market. Qualifying bonds must have at least one year remaining term to maturity, a fixed coupon schedule, and an investment grade rating (based on average of Moody’s, S&P, and Fitch).
Unless otherwise noted, index returns reflect the reinvestment of income dividends and capital gains, if any, but do not reflect fees, brokerage commissions or other expenses of investing. Investors may not make direct investments into any index.
Alternative Minimum Tax (AMT) – A federal tax aimed at ensuring that high-income individuals, estates, trusts, and corporations pay a minimal level income tax. For individuals, the AMT is calculated by adding tax preference items to regular taxable income.
Annualized Distribution Yield – The distribution yield is calculated by taking the sum of the month’s total distribution factors and dividing this sum by a 30-day period and annualizing to a 360-day year. The value is then divided by the ending maximum offering price per share to arrive at the annualized distribution yield. The yield is calculated on a periodic basis and is subject to change.
Basis Point (BPS) – A unit equal to 1/100th of 1%. 1% = 100 basis points (bps).
Bond Credit Ratings – A bond credit rating assesses the financial ability of a debt issuer to make timely payments of principal and interest. Ratings of AAA (the highest), AA, A, and BBB are investment-grade quality. Ratings of BB, B, CCC, CC, C, and D (the lowest) are considered below investment grade, speculative grade, or junk bonds. Unless otherwise noted, the ratings listed are from Municipal Market Data and are a combination of ratings from Standard and Poor’s, Moody’s Investors Service, and Fitch Ratings.
Build America Bonds (BAB) – Taxable municipal bonds that feature tax credits and/or federal subsidies for bondholders and state and local government bond issuers. Build America Bonds (BABs) were introduced in 2009 as part of President Obama’s American Recovery and Reinvestment Act to create jobs and stimulate the economy. BABs attempt to achieve this by lowering the cost of borrowing for state and local governments in financing new projects.
Capacity Utilization – The extent to which an enterprise or a nation actually uses its installed productive capacity. Capacity utilization reflects overall growth and demand in the economy, rising when the economy is vibrant, and falling when demand softens. High capacity utilization also exerts inflationary pressures as scarce resources are in higher demand. However, it may also lead to new capital investments, such as new plants, that promote growth in the future.
This page is not part of the Semi-Annual Report. 3
Important Information , Continued
Consumer Price Index (CPI) – An index that measures prices of a fixed basket of goods bought by a typical consumer, including food, transportation, shelter, utilities, clothing, medical care, entertainment and other items. The CPI, published by the Bureau of Labor Statistics in the Department of Labor, is based at 100 in 1982 and is released monthly. It is widely used as a cost-of-living benchmark to adjust Social Security payments and other payment schedules, union contracts and tax brackets. The CPI is also known as the cost-of-living index.
Core CPI – Consumer Price Index minus the energy and food components.
Effective Duration – A bond’s sensitivity to interest rates, incorporating the embedded option features, such as call provisions. Bonds with longer durations experience greater price volatility than bonds with shorter durations.
Fed Funds Rate – The interest rate at which a depository institution lends immediately available funds (balances at the Federal Reserve) to another depository institution overnight.
M2 – The amount of money in circulation in notes and coin plus non-interest-bearing bank deposits, building-society deposits, and National Savings accounts.
QE2 or Quantitative Easing 2 – The second round of the Federal Reserve’s monetary policy used to stimulate the U.S. economy following the recession that began in 2007/08. QE2 was initiated in the fourth quarter of 2010 in order to jump-start the sluggish economic recovery.
SEC Yield – SEC Yield is computed in accordance with SEC standards measuring the net investment income per share over a specified 30-day period expressed as a percentage of the maximum offering price of the Fund’s shares at the end of the period.
Taylor Rule – A monetary-policy formula that provides an indication of how much the central bank would or should change the nominal interest rate in response to divergences of actual inflation rates from target inflation rates and of actual Gross Domestic Product (GDP) from potential GDP. It was first proposed by the U.S. economist John B. Taylor in 1993. The Federal Reserve Board may not use the Taylor Rule in setting monetary policy.
Treasury Inflation Protected Securities (TIPS) – Either a U.S. Treasury note or bond that offers protection from the effects of inflation. Using the Consumer Price Index as a guide, the value of the principal is adjusted to reflect the effects of inflation. A fixed interest rate is paid semi-annually on the adjusted amount. At maturity, if inflation has increased the value of the principal, the investor receives the higher value. If deflation has decreased the value, the investor receives the original face amount of the security.
4 This page is not part of the Semi-Annual Report.
Thornburg Intermediate Municipal Fund
At Thornburg, our approach to management of the Fund is based on the premise that investors in the Fund seek preservation of capital along with an attractive, relatively stable yield. While aggressive bond strategies may generate stronger returns when the market is turning a blind eye towards risk, they usually fail to stack up over longer periods of time.
We apply time-tested techniques to manage risk and provide attractive returns. These include:
| | • | | Building a laddered portfolio. Laddering has been shown over time to mitigate price and interest rate risk. |
| | • | | Investing on a cash-only basis without using leverage. While leveraged strategies may enhance returns when market conditions are favorable, they can quickly compound losses when sentiment shifts. |
| | • | | Conducting in-depth fundamental research on each issue and actively monitoring positions for subsequent credit events. |
| | • | | Diversifying among a large number of generally high-quality bonds. |
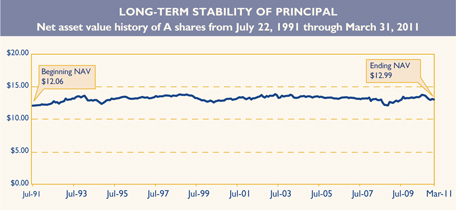
IMPORTANT PERFORMANCE INFORMATION
Performance data shown represents past performance and is no guarantee of future results. Investment return and principal value will fluctuate so shares, when redeemed, may be worth more or less than their original cost. Current performance may be lower or higher than quoted. For performance current to the most recent month end, visit thornburg.com or call 800.847.0200.
The maximum sales charge for the Fund’s Class A shares is 2.00%. The total annual fund operating expense of Class A shares is 0.97%, as disclosed in the most recent Prospectus.
AVERAGE ANNUAL TOTAL RETURNS
For periods ended March 31, 2011
| | | | | | | | | | | | | | | | | | | | |
| | | 1 Yr | | | 3 Yrs | | | 5 Yrs | | | 10 Yrs | | | Since
Inception | |
A Shares (Incep: 7/22/91) | | | | | | | | | | | | | | | | | | | | |
Without sales charge | | | 1.91 | % | | | 3.94 | % | | | 3.65 | % | | | 3.89 | % | | | 5.04 | % |
With sales charge | | | -0.13 | % | | | 3.23 | % | | | 3.23 | % | | | 3.68 | % | | | 4.93 | % |
30-DAY YIELDS, A SHARES
As of March 31, 2011
| | | | | | |
Annualized
Distribution Yield | | | SEC
Yield | |
| | 3.61 | % | | | 3.25 | % |
KEY PORTFOLIO ATTRIBUTES
As of March 31, 2011
| | | | |
Number of Bonds | | | 359 | |
Effective Duration | | | 6.2 Yrs | |
Average Maturity | | | 8.9 Yrs | |
See the entire portfolio in the Schedule of Investments beginning on page 10.
This page is not part of the Semi-Annual Report. 5

Thornburg Intermediate Municipal Fund
March 31, 2011
Table of Contents
This report is certified under the Sarbanes-Oxley Act of 2002, which requires that public companies, including mutual funds, affirm that the information provided in their annual and semiannual shareholder reports fully and fairly represents their financial position.
6 Certified Semi-Annual Report
Letter to Shareholders
| | |
 | | April 13, 2011 |
| | Dear Fellow Shareholder: |
| | We are pleased to present the semi-annual report for the Thornburg Intermediate Municipal Fund. The net asset value (NAV) of the Class A shares declined from $13.64 to $12.99 during the six months ended March 31, 2011. If you were invested with us for the entire period, you received dividends of 23.8 cents per share. If you reinvested your dividends, you received 24.0 cents per share. Dividends per share were lower for Class C shares and higher for Class I shares to account for varying class-specific expenses. |
| |


| | The first quarter of 2011 witnessed a supply lull in the municipal bond market, delivering the lightest quarter for new deals in eleven years. It followed a huge volume of deals that were brought to market in the last quarter of 2010. In addition to the light new deal calendar in the first quarter of 2011, average daily trading volume was low, measuring $11.6 billion, down 15% from the prior year. |
| | Today, conditions in the municipal bond market are characterized by low yields for short-term bonds, combined with a steep yield curve (the difference between long- and short-term interest rates), resulting in relatively more attractive yields for intermediate- and long-term bonds. Today’s municipal yield curve is the steepest in 20 years. In the last six months, rates rose, shifting upward by 56 basis points for five-year maturities, by 81 basis points for 10-year maturities, and by 86 basis points for 20-year maturities, which is the principal factor that caused negative returns on interme- diate bond indexes and funds. This additional steepening of the yield curve caused longer maturity municipal bond funds to underperform shorter maturity municipal bond funds. Credit spreads are wide, relative to historical averages, with single-A municipal bonds paying on average 110 basis points more than AAA bonds at the end of March 2011. |
| | Municipal bond fund investors have been in redemption mode for the past six months, following approximately 22 months of net inflows into municipal bond funds that reversed in late November 2010. Large market outflows were prompted by default fears and falling mutual fund NAVs, but since January 2011, these concerns have abated somewhat. At this point, bond fund outflows industry wide have slowed from a peak of almost $4 billion weekly to around $500 million as this is written. |
| | Recent legislation has created both positive and negative forces for the performance of municipal bonds. The expiration of the Build America Bond program at the end of 2010 has not led to sharp growth in tax-exempt volume, as some had forecast. In 2010, Congress extended the Bush tax cuts another two years, so the top marginal tax rate remains at 35%, rather than escalating to 39.6%, which would have created yet more demand for tax-exempt income. Over the years we have seen many tax reform proposals come and go. Currently, a batch of new proposals is blanketing |
Certified Semi-Annual Report 7
Letter to Shareholders,
Continued
Washington, DC. If any of the proposals gain real traction, we will gauge the impact on our portfolio and seek to make appropriate adjustments.
The U.S. economic picture over the last six months has strengthened, but there remains a large degree of slack. Increased economic activity is reflected in the current 2.5% to 3.0% Gross Domestic Product (GDP) growth rate and healthy sales indicators. Unemployment remains high at 8.8%, though payroll growth was encouraging in February and March 2011, when we saw the best back-to-back increases since the recession’s official end in June 2009. Capacity utilization is still low at 76%, leaving excess capacity in the economy. Year over year, the Consumer Price Index (CPI) is currently around 2.0% to 2.5%, much higher than the core CPI rate which is only 1.1% to 1.25%. Meanwhile, the difference between 10-year TIPS yields and 10-year Treasuries is running around 2.7%, and is often viewed as a market opinion of 10-year inflation expectations. We expect QE2, the second phase of quantitative easing, to end abruptly in June 2011.
We are becoming more optimistic about the fiscal outlook for state and local governments. We have been pleased to see a rebound in revenues in most states, driven by growth in income tax and sales tax revenue. Revenues at the state and local level have seen moderate growth over the past six months, providing support for credit ratings and overall credit quality. A preliminary report from the Rockefeller Institute stated that overall state tax revenue grew 6.9% in the fourth quarter of 2010, with 41 states reporting higher revenue.
Default rates have not spiked, as was forecast last year by some, though there’s little doubt that more defaults will occur, most likely in sectors tied to real estate development, retirement communities, and health care. Some cities, particularly in the Midwest, are experiencing population declines which can undermine the tax base.
The Fed is still in super-stimulative mode, with the fed funds rate at nearly 0% since December 2008, which is viewed as appropriate according to the Taylor Rule, which currently indicates the fed funds rate should be negative 1.45%. The Taylor Rule is a formula guideline for evaluating the level of the fed funds rate created by Stanford University economist John Taylor. M2, a broad measure of money and money substitutes, has grown only 4% in the last year, at the lower end of the 3% to 10% annual growth rate that has prevailed over the last decade. Velocity of M2, the degree to which money turns over (a contributor to inflation), has remained muted.
Your Fund contains a laddered portfolio of more than 350 municipal bonds. Your Fund is broadly diversified across sectors and 71% invested in bonds rated A or above by at least one of the major rating agencies. We ladder the maturity dates of our bonds so that some of the bonds are scheduled to mature during each of the coming years. Laddering short and intermediate bonds accomplishes two goals. First, the staggered bond maturities contained in a ladder reduce interest-rate risk and dampen the Fund’s price volatility. Second, laddering gives the Fund a steady cash-flow stream from maturing bonds to reinvest toward the top end of the ladder where yields are higher. The chart on the right describes the percentages of your Fund’s bond portfolio maturing in each of the coming years.

As of 3/31/11. Percentages vary over time.
Data may not add up to 100% due to rounding.
8 Certified Semi-Annual Report
The Class A shares of your Fund produced a total return of negative 3.02% at NAV for the six months ended March 31, 2011, compared to negative 2.96% for the BofA Merrill Lynch 7-12 Year Municipal Bond Index. The main contributor to this slight lag in your Fund’s performance relative to the index is that the index contains no bonds longer than 12 years to maturity, while your Fund contains bonds longer than 12 years to maturity, which depreciate more in market value when rates rise. The total return of the overall municipal bond market as measured by the BofA Merrill Lynch Municipal Master Index in the six-month period ended March 31, 2011, was negative 4.24%.
Historically, our practice of laddering a diversified portfolio of short- and intermediate-maturity bonds has allowed your Fund to perform consistently well in varying interest rate environments. Thank you for investing in Thornburg Intermediate Municipal Fund.
| | | | |
| Sincerely, | | | | |
| | |
 | |  | |  |
| Christopher Ihlefeld | | Christopher Ryon,CFA | | Josh Gonze |
| Co-Portfolio Manager | | Co-Portfolio Manager | | Co-Portfolio Manager |
| Managing Director | | Managing Director | | Managing Director |
The matters discussed in this report may constitute forward-looking statements made pursuant to the safe harbor provisions of the Securities Litigation Reform Act of 1995. These include any advisor or portfolio manager prediction, assessment, analysis or outlook for individual securities, industries, investment styles, market sectors and/or markets. These statements involve risks and uncertainties. In addition to the general risks described for each fund in its current prospectus, other factors bearing on these reports include the accuracy of the advisor’s or portfolio manager’s forecasts and predictions, the appropriateness of the investment strategies designed by the advisor or portfolio manager and the ability of the advisor or portfolio manager to implement their strategies efficiently and successfully. Any one or more of these factors, as well as other risks affecting the securities markets generally, could cause the actual results of any fund to differ materially as compared to its benchmarks.
Certified Semi-Annual Report 9
| | |
| SCHEDULE OF INVESTMENTS | | |
| |
| Thornburg Intermediate Municipal Fund | | March 31, 2011 (Unaudited) |
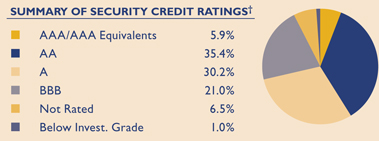
We have used ratings from Standard & Poor’s (S&P). Where S&P ratings are not available, we have used Moody’s Investors Service. Where neither rating is available, we have used ratings from Fitch Ratings. The category of investments identified as “AAA” in this graph includes investments which are pre-refunded or escrowed to maturity. Such investments are backed by an escrow or trust containing sufficient U.S. Government or U.S. Government agency securities to satisfy the timely payment of principal and interest and, therefore, are normally deemed to be equivalent to AAA-rated securities.
| | | | | | | | | | |
Issuer-Description | | Credit Rating†
S&P/Moody’s | | Principal
Amount | | | Value | |
ALABAMA — 1.37% | | | | | | | | | | |
Alabama Public School & College Authority, 5.00% due 5/1/2016 | | NR/Aa1 | | $ | 2,000,000 | | | $ | 2,264,820 | |
Montgomery Water Works & Sanitary Sewer Board, 4.00% due 9/1/2012 | | AAA/Aa2 | | | 1,120,000 | | | | 1,171,890 | |
Montgomery Water Works & Sanitary Sewer Board, 4.00% due 9/1/2014 | | AAA/Aa2 | | | 1,310,000 | | | | 1,419,529 | |
Montgomery Water Works & Sanitary Sewer Board, 5.00% due 9/1/2017 | | AAA/Aa2 | | | 2,185,000 | | | | 2,471,781 | |
University of Alabama at Birmingham Hospital Revenue, 5.25% due 9/1/2025 | | A+/A1 | | | 2,000,000 | | | | 1,999,300 | |
ALASKA — 0.43% | | | | | | | | | | |
Alaska Municipal Bond Bank, 5.00% due 10/1/2017 (Insured: Natl-Re/FGIC) | | A+/Aa2 | | | 2,470,000 | | | | 2,643,344 | |
Anchorage GO, 6.00% due 10/1/2012 (Insured: Natl-Re/FGIC) | | AA/NR | | | 270,000 | | | | 281,540 | |
ARIZONA — 3.93% | | | | | | | | | | |
Arizona Health Facilities Authority, 5.00% due 7/1/2017 (Catholic Healthcare West) | | A/A2 | | | 1,450,000 | | | | 1,525,705 | |
City of Mesa Utility System Revenue, 5.00% due 7/1/2023 (Insured: AGM) | | AA+/Aa2 | | | 5,000,000 | | | | 5,249,950 | |
Mohave County IDA, 7.25% due 5/1/2015 (Mohave Prison LLC) | | BBB+/NR | | | 4,640,000 | | | | 4,791,496 | |
Phoenix Civic Improvement Corp., 5.00% due 7/1/2017 (Insured: Natl-Re) | | AA/Aa3 | | | 1,000,000 | | | | 1,092,360 | |
Pima County IDA, 6.70% due 7/1/2021 (Arizona Charter Schools) | | NR/Baa3 | | | 2,585,000 | | | | 2,529,319 | |
Salt Verde Financial Corp. Gas Revenue, 5.25% due 12/1/2022 | | A/A3 | | | 2,000,000 | | | | 1,944,140 | |
Salt Verde Financial Corp. Gas Revenue, 5.25% due 12/1/2028 | | A/A3 | | | 735,000 | | | | 667,946 | |
State of Arizona, 5.00% due 7/1/2019 (Insured: AGM) | | AA+/Aa3 | | | 7,280,000 | | | | 7,829,203 | |
Tucson GO, 9.75% due 7/1/2012 (ETM) | | AA-/NR | | | 400,000 | | | | 445,764 | |
Tucson GO, 9.75% due 7/1/2013 (ETM) | | AA-/NR | | | 500,000 | | | | 599,675 | |
CALIFORNIA — 8.97% | | | | | | | | | | |
California Educational Facilities Authority, 5.50% due 4/1/2029 (Pitzer College) | | NR/A3 | | | 3,000,000 | | | | 2,884,080 | |
California HFA, 5.125% due 7/1/2022 (Catholic Healthcare West) | | A/A2 | | | 2,425,000 | | | | 2,479,999 | |
California HFA, 0% due 8/1/2029 (Insured: AMBAC/FHA/VA) | | A/A3 | | | 4,390,000 | | | | 1,301,942 | |
California Infrastructure & Economic Development Bank, 5.75% due 8/15/2029 (King City High School) | | A-/NR | | | 1,500,000 | | | | 1,461,735 | |
California PCR, 5.35% due 12/1/2016 (Pacific Gas & Electric; Insured: Natl-Re) (AMT) | | BBB+/A3 | | | 2,740,000 | | | | 2,800,718 | |
California PCR, 5.25% due 6/1/2023 put 12/1/2017 (Republic Services, Inc.) (AMT) | | BBB/
Baa3 | | | 2,000,000 | | | | 2,092,120 | |
California State Public Works Board Lease, 5.00% due 6/1/2017 (Regents of University of California; Insured: Natl-Re/FGIC) | | AA-/Aa2 | | | 2,000,000 | | | | 2,175,080 | |
California Statewide Community Development Authority, 6.25% due 8/15/2028 (Enloe Medical Center; Insured: CA Mtg Insurance) | | A-/NR | | | 1,050,000 | | | | 1,076,670 | |
California Statewide Community Development Authority, 6.00% due 7/1/2030 (Aspire Public Schools) | | NR/NR | | | 7,045,000 | | | | 6,395,028 | |
Carson Redevelopment Agency Tax Allocation, 6.25% due 10/1/2022 | | A-/NR | | | 1,620,000 | | | | 1,625,719 | |
Carson Redevelopment Agency Tax Allocation, 6.375% due 10/1/2024 | | A-/NR | | | 1,300,000 | | | | 1,293,149 | |
10 Certified Semi-Annual Report
| | |
| SCHEDULE OF INVESTMENTS, CONTINUED | | |
| |
| Thornburg Intermediate Municipal Fund | | March 31, 2011 (Unaudited) |
| | | | | | | | | | |
Issuer-Description | | Credit Rating†
S&P/ Moody’s | | Principal
Amount | | | Value | |
Chico Redevelopment Agency, 5.00% due 4/1/2030 (Chico Amended & Merged Redevelopment; Insured: AMBAC) | | A+/NR | | $ | 4,000,000 | | | $ | 3,316,440 | |
Corona-Norco USD COP, 5.00% due 4/15/2018 (Insured: AGM) | | AA+/Aa3 | | | 1,245,000 | | | | 1,324,319 | |
Corona-Norco USD COP, 5.00% due 4/15/2021 (Insured: AGM) | | AA+/Aa3 | | | 1,000,000 | | | | 1,019,430 | |
El Camino Hospital District, 6.25% due 8/15/2017 (Insured: AMBAC) (ETM) | | NR/NR | | | 900,000 | | | | 1,026,711 | |
Golden West Schools Financing Authority, 0% due 8/1/2018 (Insured: Natl-Re) | | BBB/Baa1 | | | 2,140,000 | | | | 1,355,027 | |
Lee Lake Water District Community Facilities, 5.75% due 9/1/2023 | | NR/NR | | | 3,000,000 | | | | 2,676,060 | |
Los Angeles Regional Airport Improvement Corp., 5.00% due 1/1/2017 (LAX Fuel Corp.; Insured: AGM) (AMT) | | AA+/Aa3 | | | 1,120,000 | | | | 1,178,094 | |
M-S-R Energy Authority, 6.125% due 11/1/2029 | | A/NR | | | 2,500,000 | | | | 2,492,975 | |
Merced Redevelopment Agency, 6.25% due 9/1/2029 (Gateways Redevelopment) | | A-/NR | | | 1,500,000 | | | | 1,442,865 | |
Mojave USD COP, 0% due 9/1/2021 (Insured: AGM) | | AA+/NR | | | 1,095,000 | | | | 601,363 | |
Mojave USD COP, 0% due 9/1/2023 (Insured: AGM) | | AA+/NR | | | 1,100,000 | | | | 505,560 | |
Monterey County COP, 5.25% due 8/1/2021 (Refinancing Project; Insured: AGM) | | AA+/Aa3 | | | 3,700,000 | | | | 3,835,457 | |
Redwood City Redevelopment Agency, 0% due 7/15/2023 (Redevelopment Area A-2; Insured: AMBAC) | | A-/NR | | | 2,060,000 | | | | 863,490 | |
San Jose Redevelopment Agency, 5.25% due 8/1/2027 (Merged Area Redevelopment Project) | | A/A1 | | | 2,400,000 | | | | 2,063,784 | |
San Jose Redevelopment Agency, 5.375% due 8/1/2028 (Merged Area Redevelopment Project) | | A/A1 | | | 1,175,000 | | | | 1,010,195 | |
San Mateo Union High School District GO Unlimited, 0% due 9/1/2019 (Capital Appreciation- Election of 2000-B; Insured: Natl-Re/FGIC) | | AA/Aa1 | | | 3,000,000 | | | | 1,975,830 | |
Southeast Resource Recovery Facilities Authority, 5.375% due 12/1/2013 (Insured: AMBAC) (AMT) | | A+/A1 | | | 1,000,000 | | | | 1,058,910 | |
Tuolumne Wind Project Authority, 5.875% due 1/1/2029 (Tuolumne Co.) | | A+/A1 | | | 3,000,000 | | | | 3,170,640 | |
Turlock Irrigation District, 5.00% due 1/1/2021 | | A+/A1 | | | 1,750,000 | | | | 1,808,748 | |
Victor Elementary School District GO, 0% due 8/1/2025 (Insured: Natl-Re/FGIC) | | A+/Aa3 | | | 1,535,000 | | | | 600,016 | |
Washington USD COP, 5.00% due 8/1/2022 (New High School; Insured: AMBAC) | | A/NR | | | 2,010,000 | | | | 1,960,815 | |
COLORADO — 3.98% | | | | | | | | | | |
Adams County, 5.00% due 8/1/2014 (Platte Valley Medical Center; Insured: Natl-Re/FHA 242) | | BBB/NR | | | 1,000,000 | | | | 1,081,280 | |
Adams County Communication Center COP, 5.75% due 12/1/2016 (Adams County Communication Center) | | NR/A1 | | | 1,265,000 | | | | 1,290,553 | |
Colorado Educational & Cultural Facilities, 5.25% due 8/15/2019 (Peak to Peak Charter School; Insured: Syncora) | | A/NR | | | 1,375,000 | | | | 1,405,608 | |
Colorado HFA, 5.75% due 1/15/2022 (Vail Valley Medical Center) | | A-/NR | | | 1,380,000 | | | | 1,384,913 | |
Denver City & County Airport, 5.50% due 11/15/2015 (Insured: Natl-Re/FGIC) (AMT) | | A+/A1 | | | 5,000,000 | | | | 5,120,550 | |
Denver City & County Housing Authority, 5.20% due 11/1/2027 (Three Towers Rehabilitation; Insured: AGM) (AMT) | | NR/Aa3 | | | 2,555,000 | | | | 2,469,484 | |
Denver Convention Center Hotel Authority, 5.25% due 12/1/2023 (Insured: Syncora) | | BBB-/Baa3 | | | 1,935,000 | | | | 1,770,390 | |
El Paso County School District GO, 7.10% due 12/1/2013 (State Aid Withholding) | | AA-/Aa2 | | | 500,000 | | | | 576,410 | |
Madre Metropolitan District GO, 5.375% due 12/1/2026 | | NR/NR | | | 2,215,000 | | | | 1,431,488 | |
North Range Metropolitan District GO, 5.00% due 12/15/2021 (Insured: ACA) | | NR/NR | | | 1,500,000 | | | | 1,230,045 | |
Northwest Parkway Public Highway Authority, 0% due 6/15/2014 (Insured: AGM) (ETM) | | AA+/Aa3 | | | 1,005,000 | | | | 1,104,294 | |
Park Creek Metropolitan District, 5.25% due 12/1/2020 (Insured: AGM) | | AA+/NR | | | 1,120,000 | | | | 1,207,248 | |
Public Authority for Colorado Energy Gas Revenue, 6.125% due 11/15/2023 | | A/A2 | | | 2,000,000 | | | | 2,072,140 | |
Regional Transportation District, 5.50% due 6/1/2022 | | A-/Aa3 | | | 3,000,000 | | | | 3,198,270 | |
Southlands Metropolitan District GO, 7.00% due 12/1/2024 pre-refunded 12/1/2014 | | AAA/NR | | | 1,370,000 | | | | 1,653,343 | |
CONNECTICUT — 0.18% | | | | | | | | | | |
Connecticut Health & Educational Facility Authority, 5.75% due 7/1/2029 (Ethel Walker School) | | BBB-/NR | | | 1,350,000 | | | | 1,252,058 | |
DISTRICT OF COLUMBIA — 2.26% | | | | | | | | | | |
District of Columbia Association of American Medical Colleges, 5.00% due 2/15/2017 (Insured: AMBAC) | | AA/Aa2 | | | 1,000,000 | | | | 1,116,900 | |
District of Columbia COP, 5.25% due 1/1/2014 (Insured: Natl-Re/FGIC) | | A/Aa3 | | | 2,000,000 | | | | 2,147,980 | |
Certified Semi-Annual Report 11
| | |
| SCHEDULE OF INVESTMENTS, CONTINUED | | |
| |
| Thornburg Intermediate Municipal Fund | | March 31, 2011 (Unaudited) |
| | | | | | | | | | |
Issuer-Description | | Credit Rating†
S&P/ Moody’s | | Principal
Amount | | | Value | |
District of Columbia COP, 5.00% due 1/1/2020 (Insured: Natl-Re/FGIC) | | A/Aa3 | | $ | 3,900,000 | | | $ | 3,992,352 | |
District of Columbia GO, 6.00% due 6/1/2015 (Insured: Natl-Re) | | A+/Aa2 | | | 3,000,000 | | | | 3,473,190 | |
Metropolitan Airports Authority, 0% due 10/1/2023 (Dulles Toll Road; Insured: AGM) | | AA+/Aa3 | | | 4,890,000 | | | | 2,365,440 | |
Metropolitan Airports Authority, 0% due 10/1/2024 (Dulles Toll Road; Insured: AGM) | | AA+/Aa3 | | | 5,000,000 | | | | 2,244,150 | |
FLORIDA — 8.77% | | | | | | | | | | |
Broward County School Board COP, 5.00% due 7/1/2020 (Insured: AGM) | | AA+/Aa3 | | | 1,000,000 | | | | 1,028,970 | |
Collier County Housing Finance Authority MFR, 4.90% due 2/15/2032 put 2/15/2012 (Goodlette Arms; Collateralized: FNMA) | | NR/Aaa | | | 1,000,000 | | | | 1,028,820 | |
Crossings at Fleming Island Community Development, 5.60% due 5/1/2012 (Insured: Natl-Re) | | BBB/Baa1 | | | 380,000 | | | | 380,783 | |
Escambia County HFA, 5.95% due 7/1/2020 (Florida Health Care Facility Loan; Insured: AMBAC) | | NR/NR | | | 2,495,000 | | | | 2,537,864 | |
Flagler County School Board COP, 5.00% due 8/1/2020 (Insured: AGM) | | AA+/Aa3 | | | 2,560,000 | | | | 2,615,194 | |
Florida Board of Education GO Capital Outlay, 9.125% due 6/1/2014 | | AAA/Aa1 | | | 535,000 | | | | 579,378 | |
Florida Housing Finance Corp., 4.80% due 1/1/2016 (Homeowner Mtg; Insured: FHA) | | AA+/Aa1 | | | 195,000 | | | | 198,808 | |
Florida Municipal Loan Council, 5.00% due 10/1/2024 (Insured: Natl-Re) | | A-/Baa1 | | | 2,235,000 | | | | 2,204,805 | |
Florida State Department of Children & Families COP, 5.00% due 10/1/2018 (South Florida Evaluation Treatment) | | AA+/NR | | | 2,090,000 | | | | 2,213,686 | |
Florida State Department of Children & Families COP, 5.00% due 10/1/2019 (South Florida Evaluation Treatment) | | AA+/NR | | | 2,255,000 | | | | 2,367,863 | |
Florida State Department of Environmental Protection, 5.00% due 7/1/2017 (Florida Forever; Insured: Natl-Re/FGIC) | | AA-/Aa3 | | | 1,000,000 | | | | 1,069,250 | |
Highlands County HFA, 5.00% due 11/15/2019 (Adventist Health Hospital) | | AA-/Aa3 | | | 1,100,000 | | | | 1,155,902 | |
Highlands County HFA, 5.00% due 11/15/2019 (Adventist Health Hospital) | | AA-/Aa3 | | | 875,000 | | | | 919,468 | |
Hillsborough County Special Assessment, 5.00% due 3/1/2017 (Insured: Natl-Re/FGIC) | | A+/A1 | | | 1,000,000 | | | | 1,058,110 | |
Hollywood Community Redevelopment Agency, 5.00% due 3/1/2021 (Insured: Syncora) | | NR/A3 | | | 3,000,000 | | | | 2,978,370 | |
Jacksonville HFA Hospital, 5.75% due 8/15/2014 pre-refunded 8/15/2011 (St. Vincent’s Medical Center) | | NR/NR | | | 1,000,000 | | | | 1,017,280 | |
Lakeland Energy System Revenue, 5.00% due 10/1/2018 (Insured: AGM) | | AA+/Aa3 | | | 2,000,000 | | | | 2,160,500 | |
Lakeland Energy System Revenue, 5.25% due 10/1/2036 | | AA-/A1 | | | 2,770,000 | | | | 2,628,425 | |
Lee County Solid Waste System, 5.625% due 10/1/2013 (Insured: Natl-Re) | | NR/A3 | | | 2,400,000 | | | | 2,440,800 | |
Manatee County, 5.00% due 10/1/2016 (Insured: AMBAC) | | AA-/Aa2 | | | 1,000,000 | | | | 1,072,690 | |
Marion County Hospital District, 5.00% due 10/1/2022 (Munroe Regional Health) | | NR/A3 | | | 1,000,000 | | | | 975,670 | |
Miami Dade County GO, 6.25% due 7/1/2026 (Building Better Communities) | | AA-/Aa2 | | | 2,130,000 | | | | 2,335,055 | |
Miami Dade County School Board COP, 5.00% due 10/1/2021 (Insured: AMBAC) | | A/A1 | | | 3,035,000 | | | | 3,082,103 | |
Miami Dade County School Board COP, 5.25% due 5/1/2022 (Insured: AGM) | | AA+/Aa3 | | | 2,600,000 | | | | 2,665,364 | |
Miami GO, 5.375% due 9/1/2015 (Insured: Natl-Re) | | A-/A1 | | | 1,000,000 | | | | 1,053,130 | |
Orange County HFA, 6.25% due 10/1/2013 (Orlando Regional Hospital; Insured: Natl-Re) | | A/A2 | | | 440,000 | | | | 472,921 | |
Orange County HFA, 5.125% due 6/1/2014 (Mayflower Retirement; Insured: Radian) | | NR/NR | | | 1,000,000 | | | | 1,000,610 | |
Orange County HFA, 6.25% due 10/1/2016 (Orlando Regional Hospital; Insured: Natl-Re) | | A/A2 | | | 2,545,000 | | | | 2,813,192 | |
Sarasota County Public Hospital Board, 3.269% due 10/1/2021 (Miles-Sarasota Memorial Hospital; Insured: Natl-Re) | | BBB/A1 | | | 2,000,000 | | | | 1,791,780 | |
South Miami HFA, 5.00% due 8/15/2022 (Baptist Health Group) | | AA/Aa3 | | | 1,500,000 | | | | 1,525,110 | |
St. Johns County IDA, 5.85% due 8/1/2024 (Presbyterian Retirement) | | NR/NR | | | 4,885,000 | | | | 4,692,433 | |
Tampa Bay Water Utilities System Revenue, 5.50% due 10/1/2022 (Insured: Natl-Re/FGIC) | | AA+/Aa2 | | | 2,750,000 | | | | 3,155,185 | |
Tampa Health Systems, 5.50% due 11/15/2013 (Catholic Health East Group; Insured: Natl-Re) | | BBB/Aa3 | | | 1,050,000 | | | | 1,136,258 | |
University of Central Florida COP Convocation Corp., 5.00% due 10/1/2019 (Insured: Natl- Re/FGIC) | | BBB/NR | | | 1,135,000 | | | | 1,157,428 | |
GEORGIA — 2.26% | | | | | | | | | | |
Atlanta Airport Passenger Facility, 5.00% due 1/1/2023 | | NR/A1 | | | 5,000,000 | | | | 5,020,700 | |
Atlanta Airport Revenue, 6.00% due 1/1/2018 (Insured: Natl-Re/FGIC) (AMT) | | A+/A1 | | | 1,000,000 | | | | 1,006,330 | |
Atlanta Water and Wastewater, 5.50% due 11/1/2022 (Insured: Natl-Re/FGIC) | | A/A1 | | | 530,000 | | | | 574,001 | |
Atlanta Water and Wastewater, 5.50% due 11/1/2024 (Insured: AGM) | | AA+/Aa3 | | | 5,000,000 | | | | 5,264,100 | |
12 Certified Semi-Annual Report
| | |
| SCHEDULE OF INVESTMENTS, CONTINUED | | |
| |
| Thornburg Intermediate Municipal Fund | | March 31, 2011 (Unaudited) |
| | | | | | | | | | |
Issuer-Description | | Credit Rating†
S&P/ Moody’s | | Principal
Amount | | | Value | |
Municipal Electric Authority of Georgia, 6.60% due 1/1/2018 (Insured: Natl-Re) | | BBB/A1 | | $ | 3,030,000 | | | $ | 3,473,107 | |
HAWAII — 0.19% | | | | | | | | | | |
Hawaii Department of Budget & Finance, 6.40% due 7/1/2013 (Kapiolani Health Care; Insured: Natl-Re) | | BBB/A3 | | | 1,270,000 | | | | 1,303,846 | |
IDAHO — 0.73% | | | | | | | | | | |
Boise City IDRB Corp., 5.00% due 5/15/2020 (Western Trailer Co.; LOC: Wells Fargo) (AMT) | | NR/Aa2 | | | 2,000,000 | | | | 2,006,160 | |
Madison County Hospital Revenue, 5.25% due 9/1/2030 | | BBB-/NR | | | 1,000,000 | | | | 831,400 | |
Madison County Hospital Revenue, 5.25% due 9/1/2037 | | BBB-/NR | | | 2,700,000 | | | | 2,150,793 | |
ILLINOIS — 7.91% | | | | | | | | | | |
Chicago Midway Airport Second Lien, 5.00% due 1/1/2019 (Insured: AMBAC) (AMT) | | A-/A3 | | | 1,210,000 | | | | 1,216,885 | |
Chicago O’Hare International Airport Revenue Second Lien, 5.75% due 1/1/2018 (Insured: AMBAC) (AMT) | | A-/A2 | | | 3,050,000 | | | | 3,078,914 | |
Chicago Tax Increment, 6.25% due 11/15/2013 (Near South Redevelopment; Insured: ACA) | | NR/NR | | | 1,550,000 | | | | 1,565,128 | |
Chicago Tax Increment, 0% due 11/15/2014 (Near South Redevelopment; Insured: ACA) | | NR/NR | | | 1,340,000 | | | | 1,055,438 | |
Chicago Tax Increment Allocation, 5.30% due 1/1/2014 (Lincoln Belmont; Insured: ACA) | | NR/NR | | | 2,285,000 | | | | 2,285,183 | |
Chicago Transit Authority, 5.00% due 12/1/2018 | | AA/Aa3 | | | 1,500,000 | | | | 1,623,435 | |
Chicago Wastewater Transmission Second Lien, 5.00% due 1/1/2014 | | A+/Aa3 | | | 1,485,000 | | | | 1,592,024 | |
Cook County GO, 5.25% due 11/15/2024 | | AA/Aa2 | | | 3,000,000 | | | | 3,071,520 | |
Cook County School District GO, 0% due 12/1/2022 (ETM) | | NR/NR | | | 2,000,000 | | | | 1,284,120 | |
Illinois Educational Facilities Authority, 5.00% due 11/1/2016 (Rush University Medical Center) | | A-/A2 | | | 1,000,000 | | | | 1,054,170 | |
Illinois Educational Facilities Authority, 5.75% due 11/1/2028 (Rush University Medical Center) | | A-/A2 | | | 1,000,000 | | | | 977,250 | |
Illinois Finance Authority, 5.00% due 11/1/2016 (Central Dupage Health) | | AA/NR | | | 2,000,000 | | | | 2,199,860 | |
Illinois Finance Authority, 5.00% due 11/1/2017 (Central Dupage Health) | | AA/NR | | | 2,000,000 | | | | 2,186,040 | |
Illinois Finance Authority, 5.00% due 8/1/2022 (Bradley University; Insured: Syncora) | | A/NR | | | 1,000,000 | | | | 1,012,490 | |
Illinois Finance Authority, 6.125% due 11/1/2023 (Advocate Health) | | AA/Aa2 | | | 5,000,000 | | | | 5,626,250 | |
Illinois Finance Authority, 5.00% due 2/1/2027 (Newman Foundation; Insured: Radian) | | NR/NR | | | 1,220,000 | | | | 1,005,878 | |
Illinois HFA, 6.00% due 7/1/2011 (Loyola University Health Systems; Insured: Natl-Re) | | BBB/Baa1 | | | 1,370,000 | | | | 1,380,741 | |
Illinois HFA, 6.00% due 7/1/2012 (Loyola University Health Systems; Insured: Natl-Re) (ETM) | | BBB/NR | | | 230,000 | | | | 245,831 | |
Illinois HFA, 5.70% due 2/20/2021 (Midwest Care Center; Collateralized: GNMA) | | NR/Aaa | | | 750,000 | | | | 764,535 | |
McHenry & Lake Counties Community Consolidated School District No. 015 GO, 0% due 1/1/2017 pre-refunded 1/1/2017 (Insured: AGM) (ETM) | | NR/Aa2 | | | 45,000 | | | | 39,209 | |
McHenry & Lake Counties Community Consolidated School District No. 015 GO, 0% due 1/1/2017 (Insured: AGM) | | NR/Aa2 | | | 955,000 | | | | 751,136 | |
Railsplitter Tobacco Settlement Authority, 5.50% due 6/1/2023 | | A-/NR | | | 4,000,000 | | | | 3,852,040 | |
Sangamon County School District COP, 5.875% due 8/15/2018 (Hay Edwards; Insured: ACA) | | NR/NR | | | 2,600,000 | | | | 2,535,416 | |
Southern Illinois University, 0% due 4/1/2014 (Insured: Natl-Re) | | BBB/A2 | | | 1,425,000 | | | | 1,289,255 | |
Southern Illinois University, 5.00% due 4/1/2014 (Housing & Auxiliary Facilities System; Insured: Natl-Re) | | A+/A2 | | | 1,350,000 | | | | 1,420,767 | |
Southern Illinois University, 5.25% due 4/1/2019 (Housing & Auxiliary Facilities System; Insured: Natl-Re) | | A+/A2 | | | 1,000,000 | | | | 1,033,630 | |
Southwestern Illinois Development Authority, 0% due 12/1/2024 (Insured: AGM) | | AA+/NR | | | 2,975,000 | | | | 1,323,012 | |
State of Illinois, 5.00% due 6/15/2018 (Build Illinois) | | AAA/NR | | | 2,000,000 | | | | 2,143,940 | |
Tazewell County School District GO, 9.00% due 12/1/2024 (Insured: Natl-Re/FGIC) | | NR/A1 | | | 1,205,000 | | | | 1,660,851 | |
University of Illinois, 0% due 4/1/2014 (Insured: Natl-Re) | | BBB/Aa2 | | | 1,590,000 | | | | 1,452,656 | |
Will County Community School District GO, 0% due 11/1/2011 (Insured: AGM) | | AA+/Aa2 | | | 2,965,000 | | | | 2,930,161 | |
INDIANA — 5.97% | | | | | | | | | | |
Allen County Economic Development, 5.80% due 12/30/2012 (Indiana Institute of Technology) | | NR/NR | | | 895,000 | | | | 899,511 | |
Allen County Economic Development, 5.75% due 12/30/2015 (Indiana Institute of Technology) | | NR/NR | | | 1,355,000 | | | | 1,385,230 | |
Allen County Jail Building Corp., 5.00% due 4/1/2018 (Insured: Syncora) | | NR/Aa2 | | | 2,495,000 | | | | 2,662,115 | |
Certified Semi-Annual Report 13
| | |
| SCHEDULE OF INVESTMENTS, CONTINUED | | |
| |
| Thornburg Intermediate Municipal Fund | | March 31, 2011 (Unaudited) |
| | | | | | | | | | |
Issuer-Description | | Credit Rating†
S&P/ Moody’s | | Principal
Amount | | | Value | |
Allen County Redevelopment District, 5.00% due 11/15/2018 | | NR/A2 | | $ | 1,560,000 | | | $ | 1,649,201 | |
Avon Community School Building Corp. First Mtg, 5.00% due 1/10/2012 (Insured: AMBAC) | | A/NR | | | 1,330,000 | | | | 1,372,055 | |
Boone County Hospital Association, 5.625% due 1/15/2015 pre-refunded 7/15/2011 (Insured: Natl-Re/FGIC) | | AA-/NR | | | 1,000,000 | | | | 1,015,360 | |
Carmel Redevelopment Authority Lease, 0% due 2/1/2016 (Performing Arts Center) | | AA+/Aa1 | | | 1,730,000 | | | | 1,484,184 | |
Carmel Redevelopment Authority Lease, 0% due 2/1/2021 (Performing Arts Center) | | AA+/Aa1 | | | 2,000,000 | | | | 1,252,200 | |
Carmel Redevelopment District, 6.50% due 7/15/2035 | | NR/NR | | | 2,730,000 | | | | 2,454,434 | |
Clay Multi-School Building Corp. First Mtg, 4.00% due 7/15/2013 (State Aid Withholding) | | AA+/NR | | | 1,290,000 | | | | 1,357,673 | |
Clay Multi-School Building Corp. First Mtg, 5.00% due 1/15/2018 (State Aid Withholding) | | AA+/NR | | | 1,735,000 | | | | 1,947,763 | |
Fort Wayne Redevelopment Authority, 5.00% due 8/1/2023 (Harrison Square; Insured: AGM) | | NR/Aa2 | | | 2,290,000 | | | | 2,383,546 | |
Hobart Building Corp. First Mtg, 6.50% due 7/15/2019 (Insured: Natl-Re; State Aid Withholding) | | AA+/NR | | | 1,000,000 | | | | 1,182,800 | |
Indiana Bond Bank, 5.25% due 4/1/2023 (Hendricks Regional; Insured: AMBAC) | | AA/NR | | | 2,000,000 | | | | 2,124,560 | |
Indiana Bond Bank Gas Program Revenue, 5.25% due 10/15/2020 | | NR/Aa3 | | | 5,340,000 | | | | 5,395,376 | |
Indiana Finance Authority, 4.10% due 11/15/2046 put 11/3/2016 (Ascension Health Credit Group) | | AA/Aa1 | | | 1,000,000 | | | | 1,058,520 | |
Indiana HFA, 5.75% due 9/1/2015 (Methodist Hospital) (ETM) | | AAA/A3 | | | 575,000 | | | | 586,701 | |
Noblesville Redevelopment Authority, 5.00% due 8/1/2017 (146th Street Extension) | | AA-/NR | | | 1,000,000 | | | | 1,092,230 | |
Noblesville Redevelopment Authority, 5.00% due 8/1/2020 (146th Street Extension) | | AA-/NR | | | 1,000,000 | | | | 1,055,020 | |
South Bend Community School Corp. First Mtg, 4.00% due 7/15/2012 (State Aid Withholding) | | AA+/NR | | | 1,510,000 | | | | 1,567,440 | |
South Bend Community School Corp. First Mtg, 4.00% due 1/15/2012 | | AA+/NR | | | 1,260,000 | | | | 1,291,576 | |
South Bend Community School Corp. First Mtg, 4.00% due 7/15/2012 | | AA+/NR | | | 1,490,000 | | | | 1,546,680 | |
Vanderburgh County Redevelopment District Tax Increment, 5.00% due 2/1/2020 | | A/NR | | | 1,000,000 | | | | 1,001,320 | |
Vincennes University, 5.375% due 6/1/2022 | | NR/Aa3 | | | 895,000 | | | | 988,107 | |
West Clark School Building Corp. First Mtg, 5.75% due 7/15/2017 (Insured: Natl-Re/FGIC; State Aid Withholding) | | AA+/NR | | | 1,685,000 | | | | 1,745,053 | |
IOWA — 0.82% | | | | | | | | | | |
Coralville COP, 5.25% due 6/1/2022 | | NR/A1 | | | 2,980,000 | | | | 3,084,449 | |
Iowa Finance Authority, 6.00% due 7/1/2012 (Trinity Regional Hospital; Insured: AGM) | | AA+/NR | | | 435,000 | | | | 449,555 | |
Iowa Finance Authority, 6.00% due 12/1/2018 (Catholic Health Initiatives) | | AA/Aa2 | | | 2,000,000 | | | | 2,008,360 | |
KANSAS — 0.17% | | | | | | | | | | |
Wyandotte County School District GO, 5.00% due 9/1/2014 (Insured: Natl-Re/FGIC) | | NR/A1 | | | 1,030,000 | | | | 1,134,514 | |
KENTUCKY — 0.84% | | | | | | | | | | |
Kentucky EDA, 5.85% due 10/1/2015 (Norton Healthcare; Insured: Natl-Re) | | BBB/Baa1 | | | 2,665,000 | | | | 2,841,743 | |
Kentucky EDA, 0% due 10/1/2024 (Norton Healthcare; Insured: Natl-Re) | | BBB/Baa1 | | | 3,130,000 | | | | 1,347,183 | |
Kentucky EDA, 5.75% due 12/1/2028 (Louisville Arena; Insured: AGM) | | AA+/Aa3 | | | 1,500,000 | | | | 1,536,105 | |
LOUISIANA — 3.16% | | | | | | | | | | |
Louisiana Local Government Environment Facilities Authority, 5.00% due 3/1/2014 (Independence Stadium) | | A/NR | | | 1,000,000 | | | | 1,069,410 | |
Louisiana Office Facilities Corp., 5.00% due 5/1/2014 (State Capitol) | | NR/Aa3 | | | 1,000,000 | | | | 1,070,250 | |
Louisiana Public Facilities Authority, 5.00% due 7/1/2022 (Black & Gold Facilities; Insured: CIFG) | | NR/Baa3 | | | 1,590,000 | | | | 1,569,028 | |
Morehouse Parish PCR, 5.25% due 11/15/2013 (International Paper Co.) | | BBB/Baa3 | | | 3,000,000 | | | | 3,207,330 | |
New Orleans Aviation Board, 5.25% due 1/1/2018 (Insured: AGM) (AMT) | | AA+/Aa3 | | | 1,000,000 | | | | 1,074,470 | |
New Orleans Aviation Board, 5.25% due 1/1/2020 (Insured: AGM) | | AA+/Aa3 | | | 2,000,000 | | | | 2,076,900 | |
Plaquemines Parish Law Enforcement District GO, 5.00% due 9/1/2023 | | BBB+/NR | | | 1,230,000 | | | | 1,197,774 | |
Plaquemines Parish Law Enforcement District GO, 5.00% due 9/1/2025 | | BBB+/NR | | | 1,350,000 | | | | 1,285,929 | |
Plaquemines Parish Law Enforcement District GO, 5.15% due 9/1/2027 | | BBB+/NR | | | 1,490,000 | | | | 1,410,896 | |
Plaquemines Parish Law Enforcement District GO, 5.30% due 9/1/2029 | | BBB+/NR | | | 1,650,000 | | | | 1,551,973 | |
Regional Transit Authority Sales Tax Revenue, 5.00% due 12/1/2023 (Insured: AGM) | | AA+/Aa3 | | | 1,000,000 | | | | 1,043,090 | |
Regional Transit Authority Sales Tax Revenue, 5.00% due 12/1/2024 (Insured AGM) | | AA+/Aa3 | | | 1,000,000 | | | | 1,032,680 | |
St. Tammany Parish Sales Tax Revenue, 5.00% due 6/1/2019 (Insured: CIFG) | | A+/NR | | | 1,300,000 | | | | 1,381,562 | |
14 Certified Semi-Annual Report
| | |
| SCHEDULE OF INVESTMENTS, CONTINUED | | |
| |
| Thornburg Intermediate Municipal Fund | | March 31, 2011 (Unaudited) |
| | | | | | | | | | |
Issuer-Description | | Credit Rating†
S&P/ Moody’s | | Principal
Amount | | | Value | |
St. Tammany Parish Sales Tax Revenue, 5.00% due 6/1/2020 (Insured: CIFG) | | A+/NR | | $ | 1,000,000 | | | $ | 1,051,770 | |
Terrebonne Parish Hospital Service District 1, 5.00% due 4/1/2028 (General Medical Center) | | A/A2 | | | 1,500,000 | | | | 1,413,105 | |
MASSACHUSETTS — 0.04% | | | | | | | | | | |
Massachusetts Housing Finance Agency, 6.125% due 12/1/2011 (Insured: Natl-Re) (AMT) | | NR/Baa1 | | | 240,000 | | | | 240,763 | |
MICHIGAN — 6.28% | | | | | | | | | | |
City of Troy Michigan GO, 5.00% due 10/1/2016 | | AAA/NR | | | 1,060,000 | | | | 1,194,917 | |
Detroit School District GO, 5.25% due 5/1/2027 (Insured: AGM/Q-SBLF) | | AA+/Aa2 | | | 1,000,000 | | | | 981,860 | |
Detroit Sewage Disposal Revenue, 5.25% due 7/1/2020 (Insured: Natl-Re) | | A+/A1 | | | 3,000,000 | | | | 3,088,230 | |
Detroit Sewage Disposal Revenue, 5.25% due 7/1/2020 (Insured: AGM) | | AA+/Aa3 | | | 7,720,000 | | | | 8,082,145 | |
Detroit Water Supply Systems, 5.00% due 7/1/2015 (Insured: AGM) | | AA+/Aa3 | | | 1,000,000 | | | | 1,072,180 | |
Detroit Water Supply Systems, 4.25% due 7/1/2016 (Insured: Natl-Re) | | BBB/A1 | | | 1,000,000 | | | | 1,038,070 | |
Kalamazoo Hospital Finance Authority, 6.25% due 6/1/2014 (Borgess Medical Center; Insured: FGIC) (ETM) | | AAA/Aaa | | | 650,000 | | | | 746,538 | |
Kalamazoo Hospital Finance Authority, 5.00% due 5/15/2019 (Bronson Hospital; Insured: AGM) | | NR/Aa3 | | | 2,000,000 | | | | 2,080,280 | |
Kalamazoo Hospital Finance Authority, 5.00% due 5/15/2022 (Bronson Hospital; Insured: AGM) | | NR/Aa3 | | | 2,470,000 | | | | 2,504,728 | |
Kent Hospital Finance Authority, 7.25% due 1/15/2013 (Butterworth Hospital; Insured: Natl- Re) (ETM) | | AA/Aa3 | | | 295,000 | | | | 312,511 | |
Michigan Public Educational Facilities Authority, 5.50% due 9/1/2022 (Black River School) | | NR/NR | | | 1,110,000 | | | | 956,942 | |
Michigan Public Educational Facilities Authority, 8.50% due 9/1/2029 (Bradford Academy) | | BBB-/NR | | | 1,500,000 | | | | 1,611,810 | |
Michigan Public School Academy, 8.00% due 8/1/2035 (Will Carleton Charter School) | | NR/NR | | | 1,000,000 | | | | 885,730 | |
Michigan State Building Authority, 5.25% due 10/15/2017 (Insured: AGM) | | AA+/Aa3 | | | 2,450,000 | | | | 2,639,753 | |
Michigan State Building Authority, 0% due 10/15/2025 (Insured: Natl-Re/FGIC) | | A+/Aa3 | | | 6,000,000 | | | | 2,484,900 | |
Michigan State Hospital Finance Authority, 5.10% due 6/1/2013 (McLaren Healthcare) | | NR/Aa3 | | | 765,000 | | | | 766,698 | |
Michigan State Hospital Finance Authority, 5.00% due 11/15/2024 (Sparrow Obligated Group) | | A+/A1 | | | 2,140,000 | | | | 2,024,483 | |
Michigan State Hospital Finance Authority, 5.00% due 7/15/2025 (Oakwood Obligated Group) | | A/A2 | | | 3,000,000 | | | | 2,821,230 | |
Michigan State Housing Development Authority, 5.05% due 10/1/2015 (Insured: Natl-Re) | | AA/Baa1 | | | 1,400,000 | | | | 1,401,134 | |
Michigan Strategic Fund, 5.25% due 10/15/2023 (Michigan House of Representatives Facilities; Insured: AGM) | | AA+/Aa3 | | | 1,000,000 | | | | 1,009,950 | |
Royal Oak Hospital Finance Authority, 5.25% due 8/1/2016 (William Beaumont Hospital) | | A/A1 | | | 2,000,000 | | | | 2,081,460 | |
Royal Oak Hospital Finance Authority, 8.00% due 9/1/2029 (William Beaumont Hospital) | | A/A1 | | | 2,540,000 | | | | 2,829,078 | |
MINNESOTA — 0.97% | | | | | | | | | | |
Minneapolis St. Paul Health, 6.00% due 12/1/2018 (Healthpartners Obligated Group) | | BBB+/A3 | | | 1,000,000 | | | | 1,038,500 | |
Minnesota Agriculture & Economic Development Board, 5.50% due 2/15/2025 (Essential Healthcare; Insured: AGM) | | AA+/NR | | | 2,500,000 | | | | 2,612,025 | |
St. Cloud Health Care Revenue, 5.00% due 5/1/2014 (Centracare Health System) | | NR/A2 | | | 835,000 | | | | 897,951 | |
St. Paul Housing & Redevelopment Authority, 5.25% due 5/15/2020 (Healthpartners Obligated Group) | | BBB+/A3 | | | 1,965,000 | | | | 2,007,031 | |
MISSISSIPPI — 1.91% | | | | | | | | | | |
Medical Center Educational Building Corp., 3.00% due 6/1/2011 (University of Mississippi Medical Center) | | AA-/Aa2 | | | 1,750,000 | | | | 1,756,965 | |
Medical Center Educational Building Corp., 4.00% due 6/1/2014 (University of Mississippi Medical Center) | | AA-/Aa2 | | | 1,240,000 | | | | 1,318,418 | |
Mississippi Development Bank Special Obligation, 5.00% due 3/1/2018 (Municipal Energy Agency Power Supply; Insured: Syncora) | | NR/Baa2 | | | 1,920,000 | | | | 1,960,992 | |
Mississippi Development Bank Special Obligation, 5.00% due 7/1/2022 (Canton Public Improvement) | | NR/NR | | | 1,935,000 | | | | 1,913,889 | |
Mississippi Development Bank Special Obligation, 5.00% due 7/1/2027 (Lowndes County Industrial Development; Insured: AGM) | | AA+/Aa3 | | | 2,500,000 | | | | 2,502,475 | |
Certified Semi-Annual Report 15
| | |
| SCHEDULE OF INVESTMENTS, CONTINUED | | |
| |
| Thornburg Intermediate Municipal Fund | | March 31, 2011 (Unaudited) |
| | | | | | | | | | |
Issuer-Description | | Credit Rating†
S&P/ Moody’s | | Principal
Amount | | | Value | |
Mississippi Development Bank Special Obligation, 5.25% due 8/1/2027 (Department of Corrections) | | AA-/NR | | $ | 3,415,000 | | | $ | 3,485,485 | |
MISSOURI — 0.82% | | | | | | | | | | |
Kansas City Tax Increment Financing Commission, 5.00% due 3/1/2012 (Maincor Project) | | NR/NR | | | 445,000 | | | | 447,674 | |
Missouri Development Finance Board, 5.00% due 4/1/2019 (Eastland Center) | | A-/NR | | | 1,000,000 | | | | 1,046,900 | |
Missouri Development Finance Board, 5.00% due 4/1/2021 (Eastland Center) | | A-/NR | | | 2,000,000 | | | | 2,046,800 | |
Missouri Development Finance Board, 5.125% due 4/1/2022 (Eastland Center) | | A-/NR | | | 2,000,000 | | | | 2,052,000 | |
NEVADA — 0.54% | | | | | | | | | | |
Clark County School District GO, 5.50% due 6/15/2016 (Insured: AGM) | | AA+/Aa2 | | | 1,000,000 | | | | 1,089,400 | |
Washoe County GO, 0% due 7/1/2011 (Reno Sparks Convention Center; Insured: AGM) | | AA+/Aa1 | | | 2,600,000 | | | | 2,594,878 | |
NEW HAMPSHIRE — 1.56% | | | | | | | | | | |
Manchester Housing & Redevelopment Authority, 0% due 1/1/2016 (Insured: Radian/ACA) | | NR/Caa1 | | | 4,990,000 | | | | 3,319,248 | |
New Hampshire Business Finance Authority, 7.125% due 7/1/2027 put 2/1/2012 (United Illuminating Co.) (AMT) | | NR/Baa2 | | | 1,000,000 | | | | 1,044,340 | |
New Hampshire Business Finance Authority PCR, 5.375% due 5/1/2014 (Central Maine Power Co.) | | BBB+/NR | | | 3,920,000 | | | | 4,198,085 | |
New Hampshire Health & Education Facilities, 5.25% due 10/1/2023 (Southern New Hampshire Medical Center) | | A-/NR | | | 1,000,000 | | | | 1,006,560 | |
New Hampshire IDA PCR, 5.90% due 8/1/2018 (CT Light & Power) (AMT) | | BBB/Baa1 | | | 1,000,000 | | | | 998,550 | |
NEW JERSEY — 0.79% | | | | | | | | | | |
New Jersey EDA, 7.50% due 12/1/2019 (Spectrum for Living Development) | | NR/NR | | | 120,000 | | | | 120,547 | |
New Jersey EDA, 5.50% due 9/1/2026 (School Facilities Construction; Insured: AMBAC) | | A+/Aa3 | | | 2,000,000 | | | | 2,043,800 | |
Passaic Valley Sewage Commissioners, 5.75% due 12/1/2022 (Sewer System; Insured: GO of Commissioners) | | NR/A2 | | | 3,000,000 | | | | 3,195,210 | |
NEW MEXICO — 1.28% | | | | | | | | | | |
Farmington PCR, 4.70% due 9/1/2024 (Arizona Public Service Co.) | | BBB-/
Baa2 | | | 3,000,000 | | | | 2,788,500 | |
Las Cruces Shared GRT Revenue, 5.00% due 6/1/2030 | | NR/Aa3 | | | 1,040,000 | | | | 1,052,907 | |
Rio Rancho Public School District No. 94, 3.00% due 8/1/2011 (State Aid Withholding) | | NR/Aa1 | | | 1,580,000 | | | | 1,594,046 | |
Rio Rancho Public School District No. 94, 5.00% due 8/1/2015 (State Aid Withholding) | | NR/Aa1 | | | 1,715,000 | | | | 1,929,855 | |
Santa Fe County Charter School Foundation, 6.50% due 1/15/2026 (ATC Foundation) | | NR/NR | | | 1,455,000 | | | | 1,305,746 | |
NEW YORK — 1.19% | | | | | | | | | | |
Erie County IDA, 5.00% due 5/1/2019 (Buffalo City School District) | | AA-/Aa3 | | | 3,000,000 | | | | 3,271,770 | |
New York City Trust Cultural Resources, 5.75% due 7/1/2015 (Museum of American Folk Art; Insured: ACA) | | NR/NR | | | 875,000 | | | | 506,468 | |
New York State Dormitory Authority, 5.625% due 7/1/2016 (City University System) | | AA-/Aa3 | | | 1,000,000 | | | | 1,097,570 | |
New York State Dormitory Authority, 5.00% due 7/1/2017 (Bishop Henry B. Hucles Nursing Home; Insured: SONYMA) | | NR/Aa1 | | | 850,000 | | | | 931,795 | |
New York State Dormitory Authority, 5.25% due 5/15/2021 (State University Educational Facilities) | | AA-/Aa3 | | | 500,000 | | | | 543,540 | |
United Nations Development Corp., 5.00% due 7/1/2025 | | NR/A1 | | | 1,700,000 | | | | 1,746,121 | |
NORTH DAKOTA — 0.36% | | | | | | | | | | |
North Dakota Building Authority, 4.25% due 12/1/2015 (Insured: Natl-Re) | | AA/Aa2 | | | 1,305,000 | | | | 1,436,270 | |
Ward County Health Care Facilities, 5.125% due 7/1/2021 (Trinity Obligated Group) | | BBB+/NR | | | 1,000,000 | | | | 995,590 | |
16 Certified Semi-Annual Report
| | |
| SCHEDULE OF INVESTMENTS, CONTINUED | | |
| |
| Thornburg Intermediate Municipal Fund | | March 31, 2011 (Unaudited) |
| | | | | | | | | | |
Issuer-Description | | Credit Rating†
S&P/ Moody’s | | Principal
Amount | | | Value | |
OHIO — 2.92% | | | | | | | | | | |
Cleveland Cuyahoga County Port Authority, 6.25% due 5/15/2016 (LOC: FifthThird Bank) | | BBB-/NR | | $ | 1,185,000 | | | $ | 1,181,824 | |
Cleveland Cuyahoga County Port Authority, 5.00% due 10/1/2021 (Cleveland Museum of Art) | | AA+/NR | | | 1,330,000 | | | | 1,409,441 | |
Deerfield Township Tax Increment, 5.00% due 12/1/2025 | | NR/A1 | | | 1,000,000 | | | | 967,630 | |
Hamilton Wastewater Systems, 5.25% due 10/1/2017 (Insured: AGM) | | NR/Aa3 | | | 1,500,000 | | | | 1,673,040 | |
Lorain County Hospital Revenue, 5.625% due 10/1/2016 (Catholic Healthcare) | | AA-/A1 | | | 1,435,000 | | | | 1,479,399 | |
Ohio State Air Quality Development Authority, 5.70% due 8/1/2020 (First Energy Generation) | | BBB-/Baa2 | | | 3,000,000 | | | | 3,076,110 | |
Ohio State Air Quality Development Authority, 4.85% due 8/1/2040 put 5/1/2012 (Columbus Southern Power; Insured: Natl-Re) (AMT) | | BBB/A3 | | | 1,500,000 | | | | 1,551,315 | |
Ohio State Air Quality Development Authority, 5.10% due 11/1/2042 put 5/1/2013 (Columbus Southern Power; Insured: Natl-Re) (AMT) | | NR/A3 | | | 3,000,000 | | | | 3,168,840 | |
Ohio State Higher Educational Facilities, 5.05% due 7/1/2037 put 7/1/2016 (Kenyon College) | | A+/A1 | | | 1,200,000 | | | | 1,300,104 | |
Ohio State Water Development Authority, 5.875% due 6/1/2033 put 6/1/2016 (First Energy Nuclear; Guaranty: First Energy Solutions) | | BBB-/Baa1 | | | 1,000,000 | | | | 1,073,310 | |
Ohio State Water Development Authority, 3.375% due 7/1/2033 put 7/1/2015 (First Energy Nuclear; Guaranty: First Energy Solutions) | | BBB-/Baa2 | | | 3,000,000 | | | | 2,937,600 | |
OKLAHOMA — 1.28% | | | | | | | | | | |
Oklahoma City Municipal Water & Sewer, 0% due 7/1/2011 (Insured: AMBAC) | | NR/NR | | | 1,125,000 | | | | 1,120,905 | |
Oklahoma City Municipal Water & Sewer, 0% due 7/1/2013 (Insured: AMBAC) | | NR/NR | | | 1,485,000 | | | | 1,410,839 | |
Oklahoma State Industries Authority, 5.50% due 7/1/2023 (Oklahoma Medical Research Foundation) | | NR/A1 | | | 3,730,000 | | | | 3,890,315 | |
Oklahoma State Power Authority, 5.00% due 1/1/2018 (Insured: AGM) | | AA+/Aa3 | | | 1,000,000 | | | | 1,115,520 | |
Tulsa IDA, 5.00% due 12/15/2024 (St. Francis Health Systems) | | AA+/Aa2 | | | 1,130,000 | | | | 1,154,657 | |
PENNSYLVANIA — 3.04% | | | | | | | | | | |
Allegheny County Hospital Development, 5.00% due 5/15/2019 (University of Pittsburgh Medical Center) | | A+/Aa3 | | | 2,500,000 | | | | 2,731,600 | |
Allegheny County IDA, 5.90% due 8/15/2026 (School Facility Development, Inc.) | | BBB-/NR | | | 1,240,000 | | | | 1,081,057 | |
Allegheny County IDA, 6.375% due 8/15/2035 (School Facility Development, Inc.) | | BBB-/NR | | | 1,130,000 | | | | 971,201 | |
Chartiers Valley Industrial & Community Development Authority, 5.75% due 12/1/2022 (Asbury Health Center) | | NR/NR | | | 900,000 | | | | 825,651 | |
Lancaster County GO, 0% due 5/1/2014 (Insured: Natl-Re/FGIC) | | NR/Aa2 | | | 795,000 | | | | 711,453 | |
Lancaster County GO, 0% due 5/1/2015 (Insured: Natl-Re/FGIC) | | NR/Aa2 | | | 800,000 | | | | 674,144 | |
Pennsylvania EDA, 4.625% due 12/1/2018 (Colver Project; Insured: AMBAC) (AMT) | | BBB-/Ba1 | | | 5,000,000 | | | | 4,500,450 | |
Pennsylvania Higher Education Facilities Authority, 0% due 7/1/2020 (Insured: AMBAC) | | NR/NR | | | 2,032,839 | | | | 1,028,434 | |
Pennsylvania Turnpike Commission, 0% due 12/1/2030 (Convertible Capital Appreciation) | | A-/A3 | | | 4,000,000 | | | | 2,858,840 | |
Philadelphia School District GO, 5.00% due 9/1/2018 (State Aid Withholding) | | A+/Aa2 | | | 5,000,000 | | | | 5,282,800 | |
RHODE ISLAND — 0.37% | | | | | | | | | | |
Rhode Island Health & Education Building Corp., 5.00% due 3/15/2014 (Salve Regina University; Insured: Radian) | | NR/NR | | | 1,065,000 | | | | 1,094,234 | |
Rhode Island Health & Education Building Corp., 5.25% due 7/1/2015 (Memorial Hospital; LOC: Fleet Bank) | | NR/NR | | | 1,325,000 | | | | 1,389,925 | |
SOUTH CAROLINA — 3.84% | | | | | | | | | | |
Berkeley County School District Installment Lease, 5.00% due 12/1/2019 | | A/A1 | | | 2,000,000 | | | | 2,081,160 | |
Charleston Educational Excellence Financing Corp., 5.25% due 12/1/2020 (Charleston County School District) | | AA-/Aa3 | | | 1,855,000 | | | | 1,939,940 | |
Greenville County School District, 5.50% due 12/1/2021 (Building Equity Sooner) | | AA/Aa2 | | | 5,000,000 | | | | 5,635,100 | |
Greenwood School Facilities, Inc., 5.00% due 12/1/2025 (Greenwood School District 50; Insured: AGM) | | AA+/Aa3 | | | 2,400,000 | | | | 2,428,320 | |
Certified Semi-Annual Report 17
| | |
| SCHEDULE OF INVESTMENTS, CONTINUED | | |
| |
| Thornburg Intermediate Municipal Fund | | March 31, 2011 (Unaudited) |
| | | | | | | | | | |
Issuer-Description | | Credit Rating†
S&P/ Moody’s | | Principal
Amount | | | Value | |
Lexington One School Facilities Corp. School District 1, 5.00% due 12/1/2019 | | NR/Aa3 | | $ | 1,000,000 | | | $ | 1,044,170 | |
Lexington One School Facilities Corp. School District 1, 5.25% due 12/1/2021 | | NR/Aa3 | | | 1,700,000 | | | | 1,768,357 | |
Scago Educational Facilities Corp., 5.00% due 12/1/2017 (Colleton School District; Insured: AGM) | | AA+/Aa3 | | | 1,000,000 | | | | 1,091,270 | |
Scago Educational Facilities Corp., 5.00% due 4/1/2019 (Spartanburg School District; Insured: AGM) | | AA+/Aa3 | | | 2,740,000 | | | | 2,873,685 | |
Scago Educational Facilities Corp., 5.00% due 4/1/2021 (Spartanburg School District; Insured: AGM) | | AA+/Aa3 | | | 1,000,000 | | | | 1,034,570 | |
South Carolina Housing Finance & Development Authority, 5.875% due 7/1/2022 (AMT) | | NR/Aa1 | | | 2,125,000 | | | | 2,181,249 | |
South Carolina Housing Finance & Development Authority, 5.30% due 7/1/2023 (AMT) | | NR/Aa1 | | | 980,000 | | | | 1,000,805 | |
Sumter School Facilities Inc. School District 2, 5.00% due 12/1/2021 (Insured: AGM) | | AA+/Aa3 | | | 2,855,000 | | | | 2,992,697 | |
SOUTH DAKOTA — 0.25% | | | | | | | | | | |
South Dakota Health & Educational Facilities Authority, 5.00% due 11/1/2024 (Sanford Health) | | AA-/A1 | | | 1,700,000 | | | | 1,720,043 | |
TENNESSEE — 1.76% | | | | | | | | | | |
Clarksville Natural Gas Acquisition Corp., 5.00% due 12/15/2014 | | NR/A2 | | | 1,000,000 | | | | 1,053,360 | |
Knox County Health, 4.90% due 6/1/2031 put 6/1/2011 (Eastowne Partners II Ltd.; Collateralized: FNMA) | | AAA/NR | | | 1,850,000 | | | | 1,862,654 | |
Tennessee Energy Acquisition Corp., 5.00% due 2/1/2023 | | BBB/Baa3 | | | 2,500,000 | | | | 2,381,675 | |
Tennessee Energy Acquisition Corp., 5.25% due 9/1/2023 | | B/Ba3 | | | 7,000,000 | | | | 6,634,320 | |
TEXAS — 10.40% | | | | | | | | | | |
Austin Community College District, 5.50% due 8/1/2023 (Round Rock Campus) | | AA/Aa2 | | | 2,180,000 | | | | 2,335,543 | |
Bexar County Health Facilities Development Corp., 6.125% due 7/1/2022 pre-refunded 7/1/2012 (Army Retirement Residence) | | NR/NR | | | 1,250,000 | | | | 1,342,850 | |
Bexar County Health Facilities Development Corp., 5.00% due 7/1/2027 (Army Retirement Residence) | | BBB/NR | | | 2,000,000 | | | | 1,775,000 | |
Bexar County Housing Finance Corp., 5.50% due 1/1/2016 (American Opportunity Housing & Colinas; Insured: Natl-Re) | | NR/Baa1 | | | 600,000 | | | | 584,322 | |
Bexar Metropolitan Water District Waterworks, 5.00% due 5/1/2021 (Insured: Syncora) | | A/A1 | | | 1,300,000 | | | | 1,324,778 | |
Bexar Metropolitan Water District Waterworks, 5.00% due 5/1/2022 (Insured: Syncora) | | A/A1 | | | 2,300,000 | | | | 2,326,818 | |
Birdville ISD GO, 0% due 2/15/2012 (Guaranty: PSF) | | AAA/Aaa | | | 2,800,000 | | | | 2,781,548 | |
Bryan Electric Systems, 2.00% due 7/1/2011 | | A+/A1 | | | 1,500,000 | | | | 1,505,805 | |
Bryan Electric Systems, 3.00% due 7/1/2013 | | A+/A1 | | | 1,000,000 | | | | 1,037,470 | |
Cedar Park Improvement District GO, 5.00% due 2/15/2016 (Insured: Natl-Re) | | AA/Aa2 | | | 1,000,000 | | | | 1,080,050 | |
Dallas County Utilities & Reclamation District, 5.15% due 2/15/2022 (Insured: AMBAC) | | BBB+/A3 | | | 3,000,000 | | | | 3,036,780 | |
Dallas/Fort Worth International Airport, 5.00% due 11/1/2015 | | A+/A1 | | | 1,000,000 | | | | 1,099,640 | |
Duncanville ISD GO, 0% due 2/15/2016 pre-refunded 2/15/2012 (Guaranty: PSF) | | AAA/Aaa | | | 2,985,000 | | | | 2,356,866 | |
Duncanville ISD GO, 0% due 2/15/2016 (Guaranty: PSF) | | AAA/Aaa | | | 15,000 | | | | 11,769 | |
Gulf Coast Center, 6.75% due 9/1/2020 (Mental Health Retardation Center) | | BBB/NR | | | 1,320,000 | | | | 1,339,734 | |
Harris County Hospital District, 5.00% due 2/15/2015 (Insured: Natl-Re) | | A/A1 | | | 2,075,000 | | | | 2,248,325 | |
Hays Consolidated ISD GO, 0% due 8/15/2013 pre-refunded 8/15/2011 (Guaranty: PSF) | | AAA/Aaa | | | 4,000,000 | | | | 3,585,800 | |
Kimble County Hospital District GO, 5.00% due 8/15/2017 | | NR/NR | | | 510,000 | | | | 532,812 | |
Kimble County Hospital District GO, 5.00% due 8/15/2018 | | NR/NR | | | 525,000 | | | | 541,154 | |
La Vernia Higher Education Finance Corp., 5.75% due 8/15/2024 (Kipp, Inc.) | | BBB/NR | | | 3,000,000 | | | | 2,966,730 | |
Laredo Sports Venue Sales Tax, 5.00% due 3/15/2018 (Insured: AMBAC) | | A+/A1 | | | 2,040,000 | | | | 2,146,386 | |
Lewisville Combination Contract Special Assessment District, 4.75% due 9/1/2012 (Insured: ACA) | | NR/NR | | | 1,080,000 | | | | 1,084,072 | |
Midtown Redevelopment Authority Tax Increment Revenue, 6.00% due 1/1/2012 (Insured: Radian) | | A-/A3 | | | 735,000 | | | | 737,477 | |
Midtown Redevelopment Authority Tax Increment Revenue, 6.00% due 1/1/2013 (Insured: Radian) | | A-/A3 | | | 500,000 | | | | 501,525 | |
Mission EDA, 6.00% due 8/1/2020 put 8/1/2013 (Waste Management, Inc.) (AMT) | | BBB/NR | | | 3,000,000 | | | | 3,225,810 | |
Northside ISD GO, 1.75% due 6/1/2037 put 6/1/2013 (Various School Buildings; Guaranty: PSF) | | AAA/NR | | | 4,300,000 | | | | 4,300,860 | |
Pharr Higher Education Finance Authority, 5.75% due 8/15/2024 (Idea Public School) | | BBB/NR | | | 5,050,000 | | | | 4,952,787 | |
18 Certified Semi-Annual Report
| | |
| SCHEDULE OF INVESTMENTS, CONTINUED | | |
| |
| Thornburg Intermediate Municipal Fund | | March 31, 2011 (Unaudited) |
| | | | | | | | | | |
Issuer-Description | | Credit Rating†
S&P/ Moody’s | | Principal
Amount | | | Value | |
Sam Rayburn Municipal Power Agency, 6.00% due 10/1/2016 | | NR/Baa2 | | $ | 3,000,000 | | | $ | 3,102,450 | |
Sam Rayburn Municipal Power Agency, 6.00% due 10/1/2021 | | NR/Baa2 | | | 2,575,000 | | | | 2,609,917 | |
San Juan Higher Education Finance Authority, 5.75% due 8/15/2024 (Idea Public Schools) | | BBB/NR | | | 1,590,000 | | | | 1,559,393 | |
Stafford Economic Development, 6.00% due 9/1/2017 (Insured: Natl-Re/FGIC) | | A+/A1 | | | 1,775,000 | | | | 2,044,445 | |
Texas City Industrial Development Corp., 7.375% due 10/1/2020 (Arco Pipe Line Company; Guaranty: Atlantic Richfield) | | A/A2 | | | 2,450,000 | | | | 2,815,760 | |
Texas Public Finance Authority Charter School Finance Corp., 6.00% due 2/15/2030 (Cosmos Foundation) | | BBB/NR | | | 1,750,000 | | | | 1,609,195 | |
Texas Public Finance Authority Charter School Finance Corp., 5.00% due 8/15/2030 (Idea Public School; Insured: ACA) | | BBB/NR | | | 2,000,000 | | | | 1,685,580 | |
Texas State Public Finance Authority, 5.00% due 8/15/2023 (Idea Public School; Insured: ACA) | | BBB/NR | | | 3,000,000 | | | | 2,733,060 | |
Uptown Development Authority, 5.25% due 9/1/2024 (Infrastructure Improvement) | | BBB/NR | | | 500,000 | | | | 482,250 | |
Uptown Development Authority, 5.50% due 9/1/2029 (Infrastructure Improvement) | | BBB/NR | | | 1,250,000 | | | | 1,201,000 | |
U.S. VIRGIN ISLANDS — 0.76% | | | | | | | | | | |
Virgin Islands Public Finance Authority, 6.625% due 10/1/2029 | | NR/Baa3 | | | 5,000,000 | | | | 5,167,750 | |
UTAH — 0.82% | | | | | | | | | | |
City of Herriman, 5.75% due 11/1/2027 (Towne Center Assessment Area) | | A/NR | | | 1,000,000 | | | | 1,014,060 | |
Salt Lake Valley Fire Services, 5.25% due 4/1/2020 | | NR/Aa2 | | | 1,250,000 | | | | 1,367,563 | |
Utah County Municipal Building Authority, 5.50% due 11/1/2016 pre-refunded 11/1/2011 (Insured: AMBAC) | | NR/NR | | | 1,000,000 | | | | 1,030,240 | |
Utah State Board of Regents, 5.00% due 8/1/2021 (University of Utah Hospital) | | AA/Aa2 | | | 1,000,000 | | | | 1,072,210 | |
Utah State Board of Regents, 5.00% due 8/1/2022 (University of Utah Hospital) | | AA/Aa2 | | | 1,015,000 | | | | 1,076,387 | |
VIRGINIA — 0.72% | | | | | | | | | | |
Fauquier County IDRB, 5.50% due 10/1/2016 (Insured: Radian) | | BBB+/NR | | | 1,000,000 | | | | 1,043,390 | |
Hanover County IDRB Medical Facilities, 6.00% due 10/1/2021 (FirstHealth Richmond Memorial Hospital) (ETM) | | BBB/NR | | | 795,000 | | | | 863,402 | |
Mecklenburg County IDA, 6.50% due 10/15/2017 (Virginia Electric and Power Company) | | NR/Baa1 | | | 2,000,000 | | | | 1,978,500 | |
Norton IDA, 6.00% due 12/1/2014 (Norton Community Hospital; Insured: ACA) | | NR/NR | | | 1,000,000 | | | | 1,000,870 | |
WASHINGTON — 2.79% | | | | | | | | | | |
Seattle Municipal Power and Light, 5.00% due 2/1/2019 | | AA-/Aa2 | | | 3,000,000 | | | | 3,387,810 | |
Skagit County Public Hospital District GO, 5.125% due 12/1/2015 (Insured: Natl-Re) | | NR/A1 | | | 1,900,000 | | | | 2,101,742 | |
Washington Economic Development Finance Authority, 1.75% due 6/1/2020 put 9/1/2011 (Guaranty: Waste Management, Inc.) | | BBB/NR | | | 1,000,000 | | | | 1,000,320 | |
Washington Health Care Facilities, 6.00% due 12/1/2014 (Catholic Health Services; Insured: Natl-Re) | | AA/Aa2 | | | 1,735,000 | | | | 1,745,809 | |
Washington Health Care Facilities, 6.00% due 12/1/2015 (Catholic Health Services; Insured: Natl-Re) | | AA/Aa2 | | | 1,945,000 | | | | 1,955,231 | |
Washington Health Care Facilities, 5.25% due 8/15/2024 (Multicare Systems; Insured: AGM) | | AA+/Aa3 | | | 1,000,000 | | | | 1,024,980 | |
Washington Health Care Facilities, 6.25% due 8/1/2028 (Highline Medical Centers; Insured: FHA 242) | | A+/NR | | | 3,985,000 | | | | 4,358,952 | |
Washington Housing Finance Commission, 5.60% due 7/1/2011 (Kline Galland Center; Insured: Radian) | | NR/NR | | | 500,000 | | | | 503,175 | |
Washington Housing Finance Commission, 6.10% due 1/1/2016 (Seattle Academy; Insured: ACA) | | NR/NR | | | 895,000 | | | | 895,501 | |
Washington Housing Finance Commission, 5.875% due 7/1/2019 (Kline Galland Center; Insured: Radian) | | NR/NR | | | 1,000,000 | | | | 1,000,840 | |
Washington Public Power Supply, 0% due 7/1/2011 | | AA/Aaa | | | 1,000,000 | | | | 998,280 | |
Certified Semi-Annual Report 19
| | |
| SCHEDULE OF INVESTMENTS, CONTINUED | | |
| |
| Thornburg Intermediate Municipal Fund | | March 31, 2011 (Unaudited) |
| | | | | | | | | | | | |
Issuer-Description | | Credit Rating†
S&P/Moody’s | | | Principal
Amount | | | Value | |
WEST VIRGINIA — 0.23% | | | | | | | | | | | | |
West Virginia Hospital Finance Authority, 5.00% due 6/1/2020 (United Hospital Center; Insured: AMBAC) | | | A+/A2 | | | $ | 1,530,000 | | | $ | 1,568,372 | |
WISCONSIN — 1.19% | | | | | | | | | | | | |
Wisconsin Health & Educational Facilities, 5.75% due 8/15/2020 (Eagle River Memorial Hospital Inc.; Insured: Radian) | | | NR/NR | | | | 1,000,000 | | | | 1,002,790 | |
Wisconsin Health & Educational Facilities Authority, 5.00% due 7/1/2021 (Agnesian Healthcare) | | | A-/A3 | | | | 2,170,000 | | | | 2,133,978 | |
Wisconsin Health & Educational Facilities Authority, 5.50% due 7/1/2025 (Agnesian Healthcare) | | | A-/A3 | | | | 5,000,000 | | | | 4,946,050 | |
| | | | | | | | | | | | |
TOTAL INVESTMENTS — 98.05% (Cost $ 667,226,576) | | | | | | | | | | $ | 665,508,222 | |
OTHER ASSETS LESS LIABILITIES — 1.95% | | | | | | | | | | | 13,203,387 | |
| | | | | | | | | | | | |
NET ASSETS — 100.00% | | | | | | | | | | $ | 678,711,609 | |
| | | | | | | | | | | | |
Footnote Legend
| † | Credit ratings are unaudited. Rating changes may have occurred subsequent to the reporting period end. Bonds issued with a maturity of one year or less are assigned Moody’s ratings from MIG-1 to MIG-4 and Standard and Poor’s ratings from SP-1+ to SP-3 with MIG-1 and SP-1+ being the strongest ratings. |
Portfolio Abbreviations
To simplify the listings of securities, abbreviations are used per the table below:
| | |
ACA | | Insured by American Capital Access |
AGM | | Insured by Assured Guaranty Municipal Corp. |
AMBAC | | Insured by American Municipal Bond Assurance Corp. |
AMT | | Alternative Minimum Tax |
CIFG | | CIFG Assurance North America Inc. |
COP | | Certificates of Participation |
EDA | | Economic Development Authority |
ETM | | Escrowed to Maturity |
FGIC | | Insured by Financial Guaranty Insurance Co. |
FHA | | Insured by Federal Housing Administration |
FNMA | | Collateralized by Federal National Mortgage Association |
GNMA | | Insured by Government National Mortgage Co. |
GO | | General Obligation |
GRT | | Gross Receipts Tax |
HFA | | Health Facilities Authority |
IDA | | Industrial Development Authority |
IDRB | | Industrial Development Revenue Bond |
ISD | | Independent School District |
LOC | | Letter of Credit |
Mtg | | Mortgage |
MFR | | Multi-Family Revenue |
Natl-Re | | Insured by National Public Finance Guarantee Corp. |
PCR | | Pollution Control Revenue Bond |
PSF | | Guaranteed by Permanent School Fund |
Q-SBLF | | Qualified School Bond Loan Fund |
Radian | | Insured by Radian Asset Assurance |
SONYMA | | State of New York Mortgage Authority |
Syncora | | Insured by Syncora Guarantee Inc. |
VA | | Veterans Affairs |
USD | | Unified School District |
See notes to financial statements.
20 Certified Semi-Annual Report
| | |
| STATEMENT OF ASSETS AND LIABILITIES | | |
| |
| Thornburg Intermediate Municipal Fund | | March 31, 2011 (Unaudited) |
| | | | |
ASSETS | | | | |
Investments at value (cost $667,226,576) (Note 2) | | $ | 665,508,222 | |
Cash | | | 530,523 | |
Receivable for investments sold | | | 4,684,302 | |
Receivable for fund shares sold | | | 1,235,797 | |
Interest receivable | | | 9,466,115 | |
Prepaid expenses and other assets | | | 34,845 | |
| | | | |
Total Assets | | | 681,459,804 | |
| | | | |
| |
LIABILITIES | | | | |
Payable for fund shares redeemed | | | 1,449,755 | |
Payable to investment advisor and other affiliates (Note 3) | | | 473,415 | |
Accounts payable and accrued expenses | | | 84,943 | |
Dividends payable | | | 740,082 | |
| | | | |
Total Liabilities | | | 2,748,195 | |
| | | | |
| |
NET ASSETS | | $ | 678,711,609 | |
| | | | |
NET ASSETS CONSIST OF: | | | | |
Distribution in excess of net investment income | | $ | (5,236 | ) |
Net unrealized depreciation on investments | | | (1,718,354 | ) |
Accumulated net realized gain (loss) | | | (6,900,548 | ) |
Net capital paid in on shares of beneficial interest | | | 687,335,747 | |
| | | | |
| | $ | 678,711,609 | |
| | | | |
| |
NET ASSET VALUE: | | | | |
Class A Shares: | | | | |
Net asset value and redemption price per share ($368,113,003 applicable to 28,339,734 shares of beneficial interest outstanding - Note 4) | | $ | 12.99 | |
Maximum sales charge, 2.00% of offering price | | | 0.27 | |
| | | | |
Maximum offering price per share | | $ | 13.26 | |
| | | | |
| |
Class C Shares: | | | | |
Net asset value and offering price per share * ($115,349,133 applicable to 8,868,943 shares of beneficial interest outstanding - Note 4) | | $ | 13.01 | |
| | | | |
| |
Class I Shares: | | | | |
Net asset value, offering and redemption price per share ($195,249,473 applicable to 15,051,340 shares of beneficial interest outstanding - Note 4) | | $ | 12.97 | |
| | | | |
| * | Redemption price per share is equal to net asset value less any applicable contingent deferred sales charge. |
See notes to financial statements.
Certified Semi-Annual Report 21
| | |
| STATEMENT OF OPERATIONS | | |
| |
| Thornburg Intermediate Municipal Fund | | Six Months Ended March 31, 2011 (Unaudited) |
| | | | |
INVESTMENT INCOME: | | | | |
Interest income (net of premium amortized of $ 1,717,404) | | $ | 16,305,395 | |
| | | | |
EXPENSES: | | | | |
Investment advisory fees (Note 3) | | | 1,729,541 | |
Administration fees (Note 3) | | | | |
Class A Shares | | | 242,332 | |
Class C Shares | | | 76,311 | |
Class I Shares | | | 50,863 | |
Distribution and service fees (Note 3) | | | | |
Class A Shares | | | 484,665 | |
Class C Shares | | | 361,157 | |
Transfer agent fees | | | | |
Class A Shares | | | 82,981 | |
Class C Shares | | | 30,591 | |
Class I Shares | | | 33,033 | |
Registration and filing fees | | | | |
Class A Shares | | | 22,988 | |
Class C Shares | | | 14,418 | |
Class I Shares | | | 15,591 | |
Custodian fees (Note 3) | | | 66,380 | |
Professional fees | | | 21,638 | |
Accounting fees | | | 10,537 | |
Trustee fees | | | 8,517 | |
Other expenses | | | 29,069 | |
| | | | |
Total Expenses | | | 3,280,612 | |
Less: | | | | |
Expenses reimbursed by investment advisor (Note 3) | | | (50,673 | ) |
Fees paid indirectly (Note 3) | | | (908 | ) |
| | | | |
Net Expenses | | | 3,229,031 | |
| | | | |
Net Investment Income | | | 13,076,364 | |
| | | | |
REALIZED AND UNREALIZED GAIN (LOSS) | | | | |
Net realized gain (loss) on investments | | | (404,923 | ) |
Net change in unrealized appreciation (depreciation) of investments | | | (35,639,572 | ) |
| | | | |
Net Realized and Unrealized Loss | | | (36,044,495 | ) |
| | | | |
Net Decrease in Net Assets Resulting from Operations | | $ | (22,968,131 | ) |
| | | | |
See notes to financial statements.
22 Certified Semi-Annual Report
| | |
| STATEMENTS OF CHANGES IN NET ASSETS | | |
| |
| Thornburg Intermediate Municipal Fund | | |
| | | | | | | | |
| | | Six Months Ended
March 31, 2011* | | | Year Ended
September 30, 2010 | |
INCREASE (DECREASE) IN NET ASSETS FROM | | | | | | | | |
| | |
OPERATIONS: | | | | | | | | |
Net investment income | | $ | 13,076,364 | | | $ | 22,874,886 | |
Net realized gain (loss) on investments | | | (404,923 | ) | | | (1,218,528 | ) |
Increase (Decrease) in unrealized appreciation (depreciation) of investments | | | (35,639,572 | ) | | | 14,346,155 | |
| | | | | | | | |
Net Increase (Decrease) in Net Assets Resulting from Operations | | | (22,968,131 | ) | | | 36,002,513 | |
| | |
DIVIDENDS TO SHAREHOLDERS: | | | | | | | | |
From net investment income | | | | | | | | |
Class A Shares | | | (7,015,656 | ) | | | (13,616,758 | ) |
Class C Shares | | | (2,037,129 | ) | | | (3,446,376 | ) |
Class I Shares | | | (4,023,579 | ) | | | (5,811,752 | ) |
| | |
FUND SHARE TRANSACTIONS (NOTE 4): | | | | | | | | |
Class A Shares | | | (22,131,419 | ) | | | 65,256,428 | |
Class C Shares | | | (6,838,985 | ) | | | 45,484,026 | |
Class I Shares | | | 2,575,021 | | | | 73,966,608 | |
| | | | | | | | |
| | |
Net Increase (Decrease) in Net Assets | | | (62,439,878 | ) | | | 197,834,689 | |
NET ASSETS: | | | | | | | | |
Beginning of Period | | | 741,151,487 | | | | 543,316,798 | |
| | | | | | | | |
| | |
End of Period | | $ | 678,711,609 | | | $ | 741,151,487 | |
| | | | | | | | |
See notes to financial statements.
Certified Semi-Annual Report 23
| | |
| NOTES TO FINANCIAL STATEMENTS | | |
| |
| Thornburg Intermediate Municipal Fund | | March 31, 2011 (Unaudited) |
NOTE 1 – ORGANIZATION
Thornburg Intermediate Municipal Fund (the “Fund”) is a diversified series of Thornburg Investment Trust (the “Trust”). The Trust is organized as a Massachusetts business trust under a Declaration of Trust dated June 3, 1987 and is registered as a diversified, open-end management investment company under the Investment Company Act of 1940, as amended. The Fund is currently one of sixteen separate series of the Trust. Each series is considered to be a separate entity for financial reporting and tax purposes and bears expenses directly attributable to it. The Fund’s primary investment objective is to obtain as high a level of current income exempt from federal individual income taxes as is consistent, in the view of the Fund’s investment advisor, with the preservation of capital. The Fund’s secondary objective is to reduce expected changes in its share price compared to long-term bond portfolios.
The Fund currently offers three classes of shares of beneficial interest: Class A, Class C, and Institutional Class (Class I). Each class of shares of the Fund represents an interest in the same portfolio of investments, except that (i) Class A shares are sold subject to a front-end sales charge collected at the time the shares are purchased and bear a service fee, (ii) Class C shares are sold at net asset value without a sales charge at the time of purchase, but are subject to a contingent deferred sales charge upon redemption within one year of purchase, and bear both a service fee and a distribution fee, (iii) Class I shares are sold at net asset value without a sales charge at the time of purchase, and (iv) the respective classes may have different reinvestment privileges and conversion rights. Additionally, the Fund may allocate among its classes certain expenses, to the extent allowable to specific classes, including transfer agent fees, government registration fees, certain printing and postage costs, and administrative and legal expenses. Currently, class specific expenses of the Fund are limited to service and distribution fees, administration fees, and certain registration and transfer agent expenses.
NOTE 2 – SIGNIFICANT ACCOUNTING POLICIES
Significant accounting policies of the Trust are as follows:
Valuation of Investments: Debt obligations have a primary market over the counter and are valued by an independent pricing service approved by the Trustees of the Trust. The pricing service ordinarily values debt obligations at quoted bid prices. When quotations are not available, debt obligations are valued at evaluated prices determined by the pricing service using methods which include consideration of yields or prices of debt obligations of comparable quality, type of issue, coupon, maturity and rating, and indications as to value from dealers and general market conditions. Short-term obligations having remaining maturities of 60 days or less are ordinarily valued at amortized cost, which approximates market value.
In any case where a pricing service fails to provide a price for a debt obligation held by the Fund, the valuation and pricing committee determines a fair value for the obligation using procedures approved by the Trustees. Additionally, in any case where management believes that a price provided by a pricing service for a debt obligation may be unreliable, the valuation and pricing committee decides whether or not to use the pricing service’s valuation or to determine a fair value for the obligation.
In determining fair value for any portfolio security or other investment, the valuation and pricing committee seeks to determine the amount that an owner of the investment might reasonably expect to receive upon a sale of the investment. However, because fair value prices are estimated prices, the valuation and pricing committee’s determination of fair value for an investment may differ from the value that would be realized by the Fund upon a sale of the investment, and that difference could be material to the Fund’s financial statements. The valuation and pricing committee’s determination of fair value for an investment may also differ from the prices obtained by other persons (including other mutual funds) for the investment.
Valuation Measurements: Various inputs are used in determining the value of the Fund’s investments. These inputs are summarized in the three levels listed below.
Level 1: Quoted prices in active markets for identical investments.
Level 2: Other significant observable inputs (including quoted prices for similar investments, interest rates, prepayment rates, credit risk, etc.).
Level 3: Significant unobservable inputs (including the Fund’s own assumptions in determining the fair value of investments).
24 Certified Semi-Annual Report
| | |
| NOTES TO FINANCIAL STATEMENTS, CONTINUED | | |
| |
| Thornburg Intermediate Municipal Fund | | March 31, 2011 (Unaudited) |
The following table displays a summary of the inputs used to value the Fund’s net assets as of March 31, 2011. In any instance when valuation inputs from more than one level are used to determine the fair value of a specific investment, the investment is placed in the level of the table based upon the lowest level input that is significant in determining the fair value of the investment:
| | | | | | | | | | | | | | | | |
| | | Fair Value Measurements at March 31, 2011 | |
| | | Total | | | Level 1 | | | Level 2 | | | Level 3 | |
Assets | | | | | | | | | | | | | | | | |
Investments in Securities | | | | | | | | | | | | | | | | |
Municipal Bonds | | $ | 665,508,222 | | | $ | — | | | $ | 665,508,222 | | | $ | — | |
| | | | | | | | | | | | | | | | |
Total Investments in Securities | | $ | 665,508,222 | | | $ | — | | | $ | 665,508,222 | | | $ | — | |
Other Notes: It is the policy of the Fund to recognize significant transfers between Levels 1 and 2 and to disclose those transfers at the last date of the reporting period. The Fund recognized no significant transfers into and out of Levels 1 and 2 during the six months ended March 31, 2011.
Federal Income Taxes: It is the policy of the Trust to comply with the provisions of the Internal Revenue Code applicable to “regulated investment companies” and to distribute to shareholders substantially all taxable (if any) and tax exempt income of the Fund. Therefore, no provision for federal income tax is required.
Management reviews each tax position believed to be material to the preparation of the Fund’s financial statements, to assess if it is more likely than not that the position would be sustained upon examination, based upon the technical merits of the position. As of March 31, 2011, management has not identified any such position for which a liability must be reflected in the Statement of Assets and Liabilities. The Fund’s tax returns remain subject to examination for three years after filing.
When-Issued and Delayed Delivery Transactions: The Fund may engage in when-issued or delayed delivery transactions. To the extent the Fund engages in such transactions, it will do so for the purpose of acquiring portfolio securities consistent with the Fund’s investment objectives and not for the purpose of investment leverage or to speculate on interest rate and/or market changes. At the time the Fund makes a commitment to purchase a security on a when-issued or delayed delivery basis, the Fund will record the transaction and reflect the value in determining its net asset value. When effecting such transactions, assets of an amount sufficient to make payment for the portfolio securities to be purchased will be segregated on the Fund’s records on the trade date. Securities purchased on a when-issued or delayed delivery basis do not earn interest until the settlement date.
Dividends: Net investment income of the Fund is declared daily as a dividend on shares for which the Fund has received payment. Dividends are paid monthly and are reinvested in additional shares of the Fund at net asset value per share at the close of business on the dividend payment date, or at the shareholder’s option, paid in cash. Net realized capital gains, to the extent available, will be distributed at least annually.
General: Securities transactions are accounted for on a trade date basis. Interest income is accrued as earned. Premiums and discounts on securities purchased are amortized to call dates or maturity dates of the respective securities. Realized gains and losses from the sale of securities are recorded on an identified cost basis. Net investment income (other than class specific expenses) and realized and unrealized gains and losses are allocated daily to each class of shares based upon the relative net asset value of outstanding shares (or the value of the dividend-eligible shares, as appropriate) of each class of shares at the beginning of the day (after adjusting for the current capital shares activity of the respective class). Expenses common to all Funds are allocated among the Funds comprising the Trust based upon their relative net asset values or other appropriate allocation methods.
Guarantees and Indemnifications: Under the Trust’s organizational documents, its officers and Trustees are indemnified against certain liabilities arising out of the performance of their duties to the Fund. Additionally, in the normal course of business the Trust enters into contracts with service providers that contain general indemnification clauses. The Trust’s maximum exposure under these arrangements is unknown. However, based on experience, the Trust expects the risk of loss to be remote.
Use of Estimates: The preparation of financial statements, in conformity with generally accepted accounting principles, requires management to make estimates and assumptions that affect the reported amounts of assets and liabilities and the disclosure of contingent
Certified Semi-Annual Report 25
| | |
| NOTES TO FINANCIAL STATEMENTS, CONTINUED | | |
| |
| Thornburg Intermediate Municipal Fund | | March 31, 2011 (Unaudited) |
assets and liabilities at the date of the financial statements and the reported amounts of increases and decreases in net assets from operations during the reporting period. Actual results could differ from those estimates.
NOTE 3 – INVESTMENT ADVISORY FEE AND OTHER TRANSACTIONS WITH AFFILIATES
Pursuant to an investment advisory agreement, Thornburg Investment Management, Inc. (the “Advisor”) serves as the investment advisor and performs services to the Fund for which the fees are payable at the end of each month. For the six months ended March 31, 2011, these fees were payable at annual rates ranging from .50 of 1% to .275 of 1% per annum of the average daily net assets of the Fund depending on the Fund’s asset size. The Trust also has entered into administrative services agreements with the Advisor, whereby the Advisor will perform certain administrative services for the shareholders of each class of the Fund’s shares, and for which fees will be payable at an annual rate of up to .125 of 1% per annum of the average daily net assets attributable to each class of shares. For the six months ended March 31, 2011, the Advisor voluntarily or contractually reimbursed certain class specific expenses and administrative fees of $1,151 for Class A shares, and $49,522 for Class C shares.
The Trust has an underwriting agreement with Thornburg Securities Corporation (the “Distributor,” an affiliate of the Advisor), which acts as the distributor of the Fund’s shares. For the six months ended March 31, 2011, the Distributor has advised the Fund that it earned net commissions aggregating $3,438 from the sale of Class A shares, and collected contingent deferred sales charges aggregating $14,309 from redemptions of Class C shares of the Fund.
Pursuant to a service plan under Rule 12b-1 of the Investment Company Act of 1940, the Fund may reimburse to the Advisor an amount not to exceed .25 of 1% per annum of the average daily net assets attributable to each class of shares of the Fund for payments made by the Advisor to securities dealers and other financial institutions to obtain various shareholder and distribution related services. For the six months ended March 31, 2011, there were no 12b-1 service plan fees charged for Class I shares. The Advisor may pay out of its own resources additional expenses for distribution of the Fund’s shares.
The Trust has also adopted a distribution plan pursuant to Rule 12b-1, applicable only to the Fund’s Class C shares, under which the Fund compensates the Distributor for services in promoting the sale of Class C shares of the Fund at an annual rate of up to .35 of 1% per annum of the average daily net assets attributable to Class C shares. Total fees incurred by the Distributor for each class of shares of the Fund under their respective Service and Distribution Plans for the six months ended March 31, 2011, are set forth in the Statement of Operations.
The Trust has an agreement with the custodian bank to indirectly pay a portion of the custodian’s fees through credits earned by the Fund’s cash on deposit with the bank. This deposit agreement is an alternative to overnight investments. Custodial fees have been adjusted to reflect amounts that would have been paid without this agreement, with a corresponding adjustment reflected as fees paid indirectly in the Statement of Operations. For the six months ended March 31, 2011, fees paid indirectly were $908.
Certain officers and Trustees of the Trust are also officers and/or directors of the Advisor and Distributor. The compensation of independent Trustees is borne by the Trust.
NOTE 4 – SHARES OF BENEFICIAL INTEREST
At March 31, 2011, there were an unlimited number of shares of beneficial interest authorized. Transactions in shares of beneficial interest were as follows:
| | | | | | | | | | | | | | | | |
| | | Six Months Ended
March 31, 2011 (Unaudited) | | | Year Ended
September 30, 2010 (Audited) | |
| | | Shares | | | Amount | | | Shares | | | Amount | |
Class A Shares | | | | | | | | | | | | | | | | |
Shares sold | | | 3,021,268 | | | $ | 40,006,896 | | | | 9,814,228 | | | $ | 131,038,400 | |
Shares issued to shareholders in reinvestment of dividends | | | 346,170 | | | | 4,547,734 | | | | 646,545 | | | | 8,623,256 | |
Shares repurchased | | | (5,085,062 | ) | | | (66,686,049 | ) | | | (5,551,397 | ) | | | (74,405,228 | ) |
| | | | | | | | | | | | | | | | |
| | | | |
Net Increase (Decrease) | | | (1,717,624 | ) | | $ | (22,131,419 | ) | | | 4,909,376 | | | $ | 65,256,428 | |
| | | | | | | | | | | | | | | | |
26 Certified Semi-Annual Report
| | |
| NOTES TO FINANCIAL STATEMENTS, CONTINUED | | |
| |
| Thornburg Intermediate Municipal Fund | | March 31, 2011 (Unaudited) |
| | | | | | | | | | | | | | | | |
| | | Six Months Ended
March 31, 2011 (Unaudited) | | | Year Ended
September 30, 2010 (Audited) | |
| | | Shares | | | Amount | | | Shares | | | Amount | |
Class C Shares | | | | | | | | | | | | | | | | |
Shares sold | | | 1,126,485 | | | $ | 14,966,345 | | | | 4,194,765 | | | $ | 56,036,321 | |
Shares issued to shareholders in reinvestment of dividends | | | 101,148 | | | | 1,330,665 | | | | 166,872 | | | | 2,229,614 | |
Shares repurchased | | | (1,766,826 | ) | | | (23,135,995 | ) | | | (957,579 | ) | | | (12,781,909 | ) |
| | | | | | | | | | | | | | | | |
| | | | |
Net Increase (Decrease) | | | (539,193 | ) | | $ | (6,838,985 | ) | | | 3,404,058 | | | $ | 45,484,026 | |
| | | | | | | | | | | | | | | | |
| | | | |
Class I Shares | | | | | | | | | | | | | | | | |
Shares sold | | | 4,173,748 | | | $ | 55,043,138 | | | | 7,702,918 | | | $ | 103,259,087 | |
Shares issued to shareholders in reinvestment of dividends | | | 202,042 | | | | 2,654,031 | | | | 314,775 | | | | 4,195,091 | |
Shares repurchased | | | (4,221,583 | ) | | | (55,122,148 | ) | | | (2,512,352 | ) | | | (33,487,570 | ) |
| | | | | | | | | | | | | | | | |
| | | | |
Net Increase (Decrease) | | | 154,207 | | | $ | 2,575,021 | | | | 5,505,341 | | | $ | 73,966,608 | |
| | | | | | | | | | | | | | | | |
NOTE 5 – SECURITIES TRANSACTIONS
For the six months ended March 31, 2011, the Fund had purchase and sale transactions of investment securities (excluding short-term investments) of $67,126,524 and $68,159,693, respectively.
NOTE 6 – INCOME TAXES
At March 31, 2011, information on the tax components of capital is as follows:
| | | | |
Cost of investments for tax purposes | | $ | 667,226,576 | |
| | | | |
Gross unrealized appreciation on a tax basis | | $ | 13,569,490 | |
Gross unrealized depreciation on a tax basis | | | (15,287,844 | ) |
| | | | |
Net unrealized appreciation (depreciation) on investments (tax basis) | | $ | (1,718,354 | ) |
| | | | |
At March 31, 2011, the Fund had deferred tax basis capital losses occurring subsequent to October 31, 2009 of $1,203,893. For tax purposes, such losses will be reflected in the year ending September 30, 2011.
At March 31, 2011 the Fund had tax basis capital losses, which may be carried forward to offset future capital gains. To the extent such carry forwards are used, capital gain distributions may be reduced to the extent provided by regulations.
Such capital loss carryforwards expire as follows:
| | | | |
2011 | | $ | 11,597 | |
2012 | | | 4,297,982 | |
2013 | | | 39,577 | |
2017 | | | 391,762 | |
2018 | | | 533,767 | |
| | | | |
| | $ | 5,274,685 | |
| | | | |
OTHER NOTES
Fund management believes no events have occurred between March 31, 2011 and May 20, 2011, the date of issuance of the financial statements, which require adjustment of, or disclosure in, the accompanying financial statements.
Certified Semi-Annual Report 27
| | |
| FINANCIAL HIGHLIGHTS | | |
| |
| Thornburg Intermediate Municipal Fund | | |
| | | | | | | | | | | | | | | | | | | | | | | | | | | | | | | | | | | | | | | | | | | | | | | | | | | | | | | | | | | | |
| | | PER SHARE PERFORMANCE (for a share outstanding
throughout the period)+ | | | RATIOS TO AVERAGE NET ASSETS | | | SUPPLEMENTAL DATA | |
Unless
Otherwise
Noted,
Periods are
Fiscal
Years Ended
Sept.
30, | | Net
Asset
Value
Beginning
of Period | | | Net
Invest-
ment
Income
(Loss) | | | Net
Realized
&
Unrealized
Gain
(Loss)
on
Investments | | | Total
from
Invest-
ment
Operations | | | Dividends
from
Net
Invest-
ment
Income | | | Dividends
from
Net
Realized
Gains | | | Total
Dividends | | | Net
Asset
Value
End of
Period | | | Net
Invest-
ment
Income
(Loss)
(%) | | | Expenses,
After
Expense
Reductions
(%) | | | Expenses,
After
Expense
Reductions
and Net of
Custody
Credits
(%) | | | Expenses,
Before
Expense
Reductions
(%) | | | Total
Return
(%)(a) | | | Portfolio
Turnover
Rate (%) | | | Net
Assets
at End
of
Period
(Thousands) | |
Class A Shares | | | | | | | | | | | | | | | | | | | | | | | | | | | | | | | | | | | | | | | | | | | | | | | | | | | | | | | | | | | | |
2011(b)(c) | | $ | 13.64 | | | | 0.24 | | | | (0.65 | ) | | | (0.41 | ) | | | (0.24 | ) | | | — | | | | (0.24 | ) | | $ | 12.99 | | | | 3.62 | (d) | | | 0.95 | (d) | | | 0.95 | (d) | | | 0.95 | (d) | | | (3.02 | ) | | | 9.65 | | | $ | 368,113 | |
2010(c) | | $ | 13.40 | | | | 0.49 | | | | 0.24 | | | | 0.73 | | | | (0.49 | ) | | | — | | | | (0.49 | ) | | $ | 13.64 | | | | 3.68 | | | | 0.97 | | | | 0.97 | | | | 0.97 | | | | 5.61 | | | | 9.87 | | | $ | 409,844 | |
2009(c) | | $ | 12.47 | | | | 0.54 | | | | 0.93 | | | | 1.47 | | | | (0.54 | ) | | | — | | | | (0.54 | ) | | $ | 13.40 | | | | 4.26 | | | | 0.98 | | | | 0.98 | | | | 0.98 | | | | 12.12 | | | | 15.15 | | | $ | 337,037 | |
2008(c) | | $ | 13.15 | | | | 0.52 | | | | (0.68 | ) | | | (0.16 | ) | | | (0.52 | ) | | | — | | | | (0.52 | ) | | $ | 12.47 | | | | 3.95 | | | | 0.96 | | | | 0.95 | | | | 0.96 | | | | (1.33 | ) | | | 22.00 | | | $ | 311,435 | |
2007(c) | | $ | 13.30 | | | | 0.51 | | | | (0.15 | ) | | | 0.36 | | | | (0.51 | ) | | | — | | | | (0.51 | ) | | $ | 13.15 | | | | 3.84 | | | | 0.99 | | | | 0.98 | | | | 0.99 | | | | 2.74 | | | | 22.55 | | | $ | 333,800 | |
2006(c) | | $ | 13.33 | | | | 0.49 | | | | (0.03 | ) | | | 0.46 | | | | (0.49 | ) | | | — | | | | (0.49 | ) | | $ | 13.30 | | | | 3.74 | | | | 0.99 | | | | 0.99 | | | | 1.00 | | | | 3.57 | | | | 18.95 | | | $ | 366,702 | |
Class C Shares | | | | | | | | | | | | | | | | | | | | | | | | | | | | | | | | | | | | | | | | | | | | | | | | | | | | | | | | | | | | |
2011(b) | | $ | 13.65 | | | | 0.22 | | | | (0.64 | ) | | | (0.42 | ) | | | (0.22 | ) | | | — | | | | (0.22 | ) | | $ | 13.01 | | | | 3.34 | (d) | | | 1.23 | (d) | | | 1.23 | (d) | | | 1.31 | (d) | | | (3.08 | ) | | | 9.65 | | | $ | 115,349 | |
2010 | | $ | 13.42 | | | | 0.45 | | | | 0.24 | | | | 0.69 | | | | (0.46 | ) | | | — | | | | (0.46 | ) | | $ | 13.65 | | | | 3.39 | | | | 1.24 | | | | 1.24 | | | | 1.73 | | | | 5.25 | | | | 9.87 | | | $ | 128,449 | |
2009 | | $ | 12.48 | | | | 0.50 | | | | 0.94 | | | | 1.44 | | | | (0.50 | ) | | | — | | | | (0.50 | ) | | $ | 13.42 | | | | 3.99 | | | | 1.24 | | | | 1.24 | | | | 1.76 | | | | 11.90 | | | | 15.15 | | | $ | 80,571 | |
2008 | | $ | 13.16 | | | | 0.48 | | | | (0.68 | ) | | | (0.20 | ) | | | (0.48 | ) | | | — | | | | (0.48 | ) | | $ | 12.48 | | | | 3.67 | | | | 1.25 | | | | 1.24 | | | | 1.75 | | | | (1.61 | ) | | | 22.00 | | | $ | 59,243 | |
2007 | | $ | 13.31 | | | | 0.47 | | | | (0.15 | ) | | | 0.32 | | | | (0.47 | ) | | | — | | | | (0.47 | ) | | $ | 13.16 | | | | 3.59 | | | | 1.24 | | | | 1.24 | | | | 1.78 | | | | 2.48 | | | | 22.55 | | | $ | 53,890 | |
2006 | | $ | 13.34 | | | | 0.46 | | | | (0.03 | ) | | | 0.43 | | | | (0.46 | ) | | | — | | | | (0.46 | ) | | $ | 13.31 | | | | 3.49 | | | | 1.24 | | | | 1.24 | | | | 1.78 | | | | 3.31 | | | | 18.95 | | | $ | 55,497 | |
Class I Shares | | | | | | | | | | | | | | | | | | | | | | | | | | | | | | | | | | | | | | | | | | | | | | | | | | | | | | | | | | | | |
2011(b) | | $ | 13.62 | | | | 0.26 | | | | (0.65 | ) | | | (0.39 | ) | | | (0.26 | ) | | | — | | | | (0.26 | ) | | $ | 12.97 | | | | 3.96 | (d) | | | 0.62 | (d) | | | 0.62 | (d) | | | 0.62 | (d) | | | (2.87 | ) | | | 9.65 | | | $ | 195,250 | |
2010 | | $ | 13.39 | | | | 0.53 | | | | 0.23 | | | | 0.76 | | | | (0.53 | ) | | | — | | | | (0.53 | ) | | $ | 13.62 | | | | 3.99 | | | | 0.65 | | | | 0.65 | | | | 0.65 | | | | 5.87 | | | | 9.87 | | | $ | 202,859 | |
2009 | | $ | 12.45 | | | | 0.57 | | | | 0.94 | | | | 1.51 | | | | (0.57 | ) | | | — | | | | (0.57 | ) | | $ | 13.39 | | | | 4.59 | | | | 0.66 | | | | 0.66 | | | | 0.68 | | | | 12.56 | | | | 15.15 | | | $ | 125,709 | |
2008 | | $ | 13.13 | | | | 0.56 | | | | (0.68 | ) | | | (0.12 | ) | | | (0.56 | ) | | | — | | | | (0.56 | ) | | $ | 12.45 | | | | 4.28 | | | | 0.64 | | | | 0.63 | | | | 0.64 | | | | (1.02 | ) | | | 22.00 | | | $ | 171,848 | |
2007 | | $ | 13.28 | | | | 0.55 | | | | (0.15 | ) | | | 0.40 | | | | (0.55 | ) | | | — | | | | (0.55 | ) | | $ | 13.13 | | | | 4.16 | | | | 0.67 | | | | 0.67 | | | | 0.73 | | | | 3.06 | | | | 22.55 | | | $ | 125,890 | |
2006 | | $ | 13.31 | | | | 0.54 | | | | (0.03 | ) | | | 0.51 | | | | (0.54 | ) | | | — | | | | (0.54 | ) | | $ | 13.28 | | | | 4.07 | | | | 0.67 | | | | 0.67 | | | | 0.75 | | | | 3.90 | | | | 18.95 | | | $ | 89,589 | |
| (a) | Not annualized for periods less than one year. |
| (b) | Unaudited Six Month Period Ended March 31. |
| (c) | Sales loads are not reflected in computing total return. |
| + | Based on weighted average shares outstanding. |
See notes to financial statements.
| | |
| 28 Certified Semi-Annual Report | | Certified Semi-Annual Report 29 |
| | |
| EXPENSE EXAMPLE | | |
| |
| Thornburg Intermediate Municipal Fund | | March 31, 2011 (Unaudited) |
As a shareholder of the Fund, you incur two types of costs:
| | (1) | transaction costs, including |
(a) sales charges (loads) on purchase payments, for Class A shares;
(b) a deferred sales charge on redemptions of any part or all of a purchase of $1 million of Class A shares within 12 months of purchase;
(c) a deferred sales charge on redemptions of Class C shares within 12 months of purchase;
| | (2) | ongoing costs, including management fees; distribution and/or service (12b-1) fees; and other Fund expenses. |
This example is intended to help you understand your ongoing costs (in dollars) of investing in the Fund and to compare these costs with the ongoing costs of investing in other mutual funds.
The example is based on a $1,000 investment beginning on October 1, 2010, and held until March 31, 2011.
ACTUAL EXPENSES
For each class of shares, the first line of the table at right provides information about actual account values and actual expenses. You may use the information in this line, together with the amount you invested, to estimate the expenses that you paid over the period. Simply divide your account value by $1,000 (for example, an $8,600 account value divided by $1,000 = 8.6), then multiply the result by the number in the first line for your class of shares under the heading entitled “Expenses Paid During Period” to estimate the expenses you paid on your account during this period.
HYPOTHETICAL EXAMPLE FOR COMPARISON PURPOSES
For each class of shares, the second line of the table at right provides information about hypothetical account values and hypothetical expenses based on the Fund’s actual expense ratio and an assumed rate of return of 5% per year before expenses, which is not the Fund’s actual return. The hypothetical account values and expenses may not be used to estimate the actual ending account balance or expenses you paid for the period. You may use this information to compare the ongoing costs of investing in the Fund and other funds. To do so, compare this 5% hypothetical example with the 5% hypothetical examples that appear in the shareholder reports of the other funds.
| | | | | | | | | | | | |
| | | Beginning
Account Value
10/1/10 | | | Ending
Account Value
3/31/11 | | | Expenses Paid
During Period†
10/1/10–3/31/11 | |
Class A Shares | | | | | | | | | | | | |
Actual | | $ | 1,000.00 | | | $ | 969.80 | | | $ | 4.67 | |
Hypothetical* | | $ | 1,000.00 | | | $ | 1,020.18 | | | $ | 4.79 | |
Class C Shares | | | | | | | | | | | | |
Actual | | $ | 1,000.00 | | | $ | 971.30 | | | $ | 6.06 | |
Hypothetical* | | $ | 1,000.00 | | | $ | 1,018.79 | | | $ | 6.20 | |
Class I Shares | | | | | | | | | | | | |
Actual | | $ | 1,000.00 | | | $ | 969.20 | | | $ | 3.05 | |
Hypothetical* | | $ | 1,000.00 | | | $ | 1,021.84 | | | $ | 3.13 | |
| † | Expenses are equal to the annualized expense ratio for each class (A: 0.95%; C: 1.23%; I: 0.62%) multiplied by the average account value over the period, multiplied by 182/365 to reflect the one-half year period. |
| * | Hypothetical assumes a rate of return of 5% per year before expenses. |
Please note that the expenses shown in the table are meant to highlight your ongoing costs only and do not reflect any transactional costs, such as sales charges (loads), redemption fees, or exchange fees. Therefore, the second line of the table for each class of shares is useful in comparing ongoing costs only, and will not help you determine the relative total costs of owning different funds. In addition, if these transactional costs were included, your costs would have been higher.
30 Certified Semi-Annual Report
| | |
| OTHER INFORMATION | | |
| |
| Thornburg Intermediate Municipal Fund | | March 31, 2011 (Unaudited) |
PORTFOLIO PROXY VOTING
Policies and Procedures:
The Trust has delegated to Thornburg Investment Management, Inc. (the “Advisor”) voting decisions respecting proxies for the Fund’s voting securities. The Advisor makes voting decisions in accordance with its Proxy Voting Policy and Procedures. A description of the Policy and Procedures is available (i) without charge, upon request, by calling the Advisor toll-free at 1-800-847-0200, (ii) on the Thornburg website at www.thornburg.com, and (iii) on the Securities and Exchange Commission’s website at www.sec.gov.
Information regarding how proxies were voted is available on or before August 31 of each year for the twelve months ending the preceding June 30. This information is available (i) without charge, upon request by calling the Advisor toll-free at 1-800-847-0200, (ii) on the Thornburg website at www.thornburg.com, and (iii) on the Securities and Exchange Commission’s website at www.sec.gov.
AVAILABILITY OF QUARTERLY PORTFOLIO SCHEDULE
The Fund files with the Securities and Exchange Commission schedules of its portfolio holdings on Form N-Q for the first and third quarters of each fiscal year. The Fund’s Forms N-Q are available on the Commission’s website at www.sec.gov, or may be reviewed and copied at the Commission’s Public Reference Room in Washington, D.C. Information on the operation of the Public Reference Room may be obtained by calling 1-800-SEC-0330. The Fund also makes this information available on its website at www.thornburg.com/ download or upon request by calling 1-800-847-0200.
Certified Semi-Annual Report 31
Trustees’ Statement to Shareholders
Not part of the Certified Semi-Annual Report
February 8, 2005, as readopted September 13, 2010
The Trustees are concerned that ongoing commentaries and opinions reported in the media may confuse investors in general as to the supervisory duties of trustees of mutual funds and, in particular, leave Thornburg Investment Trust shareholders uncertain regarding how we discharge our responsibilities in supervising the Funds’ investment advisor and in reviewing the advisor’s contract for renewal. We decided to spell out clearly three principal guidelines that we follow in supervising the Trust’s investment advisor on your behalf.
We begin with the premise that each shareholder selected his or her Fund because its investments are managed by the investment advisor identified in the prospectus and in accordance with the objective and policies described in the prospectus. We realize, as each of you do, that if you believe that your Fund’s stated objective and policies no longer serve your personal investment goals, you can sell your shares and leave the Fund.
Therefore, we believe that our primary supervisory task – our principal obligation to you – is to assess the nature and quality of the advisor’s services, and to confirm that the advisor actively and competently pursues the Fund’s objective, in accordance with the policies set out in the prospectus. To do this, we meet regularly with management to review your Fund’s portfolio and to discuss the advisor’s specific actions and judgments in pursuing the Fund’s objective. We do not substitute our own judgment for the advisor’s decisions in selecting investments; the advisor is paid to exercise its informed judgment on investment decisions, and we seek to confirm, in reviewing the advisor’s performance, that the advisor is doing just that.
Second, while we are conscious of costs and the effect that costs have on shareholders’ returns, we do not seek the lowest fees or expense ratio as our sole or primary objective. We try to make sure that your Fund’s fees and costs are reasonable in relationship to the services rendered and that they are generally in line with those charged by other expert investment advisors, consistent with our belief that the Fund’s investors searched for and expect that expertise and attention and have decided to pay a reasonable price for it. We do not put the management contract “out to bid” as a matter of course, and we would not do so unless we had concluded that the advisor materially had failed to pursue the Fund’s objectives in accordance with its policies, or for other equally important reasons. We believe that any other approach would be inconsistent with your interests and contrary to your expectations when you bought shares of the Fund in the first place.
Finally, because we believe that most Thornburg Fund shareholders have invested with a long-term perspective, we try not to focus too much on the fashions of the moment and on short-term performance. The market will not favor any specific investment objective or set of policies at all times and under all economic circumstances. A fund will experience periods of both high and low returns relative to other funds and other investments. Even if one of our Funds is not favored by the market at a particular time, we believe that the advisor is nonetheless obliged to remain true to the Fund’s objective and policies, and we watch to see that it does so.
32 This page is not part of the Semi-Annual Report.
Retirement and Education Accounts
Thornburg Investment Management offers retirement and education savings accounts that can help you meet a variety of planning challenges. For account applications or further information on any of the accounts below, please call 1-800-847-0200 or go to www.thornburg.com/ira. Your financial advisor can help you determine which plan is right for you.
Individual Retirement Accounts
Individual Retirement Accounts (IRAs) provide a tax-advantaged means to save money for the future. For a detailed outline of the difference between retirement accounts, see www.thornburg.com/ira. Rollovers are available. Call 1-800-847-0200 for more information.
Traditional IRAs – Contributions to Traditional IRAs are tax deductible for eligible individuals, and withdrawals are taxed as additional ordinary income. You may contribute to an IRA if you receive compensation and are under 70 1/2, even if you are covered by an employer retirement plan. Deductible contributions are subject to certain qualifications. Please consult your tax advisor.
Roth IRAs – Under a Roth IRA, there is no tax deduction for contributions, but there is no income tax on qualified withdrawals. For a more detailed comparison of Traditional and Roth IRAs, please see our web site at www.thornburg.com/ira.
SEP IRAs – Simplified Employee Pension (SEP) IRAs are established by employers. The employer is allowed a tax deduction for contributions made to the SEP Plan and makes contributions to each eligible employee’s SEP IRA on a discretionary basis.
SIMPLE IRAs – Savings Incentive Match Plan for Employees of Small Employers (SIMPLE) is designed to give small business owners a simplified method to establish and contribute to a retirement plan for employees. The employer is allowed a tax deduction for contributions and makes either matching or non-elective contributions to each eligible employee’s SIMPLE IRA. Employees may make salary deferral contributions.
Coverdell Education Savings Account
These savings accounts are designed to provide a way to save money for higher education expenses. In an Education Savings Account, earnings and interest grow tax-free, and qualified withdrawals used to pay for eligible higher-education expenses are tax- and penalty-free.
Funds Available
The following funds are available in the accounts listed above:
| | • | | Thornburg International Value Fund |
| | • | | Thornburg Core Growth Fund |
| | • | | Thornburg Investment Income Builder Fund |
| | • | | Thornburg Global Opportunities Fund |
| | • | | Thornburg International Growth Fund |
| | • | | Thornburg Developing World Fund |
| | • | | Thornburg Limited Term U.S. Government Fund |
| | • | | Thornburg Limited Term Income Fund |
| | • | | Thornburg Strategic Income Fund |
This page is not part of the Semi-Annual Report. 33

Thornburg Equity Funds
Thornburg’s equity research uses a fundamental and comprehensive analytical approach. Thornburg equity funds focus on a limited number of securities so that each holding can impact performance. The equity team searches for firms believed to have a promising future and seeks to buy shares of those companies at a discount to their intrinsic value.
| | • | | Thornburg International Value Fund |
| | • | | Thornburg Core Growth Fund |
| | • | | Thornburg Investment Income Builder Fund |
| | • | | Thornburg Global Opportunities Fund |
| | • | | Thornburg International Growth Fund |
| | • | | Thornburg Developing World Fund |
Thornburg Bond Funds
Thornburg Investment Management applies a disciplined philosophy to fixed-income management. Since the launch of our first fixed-income fund over 25 years ago, we have been conducting fundamental, bottom-up research in an effort to identify bonds which we believe provide the best return for a given level of risk. We are very organic in our approach, avoiding leverage or complex strategies which could backfire in periods of market uncertainty.
| | • | | Thornburg Limited Term Municipal Fund |
| | • | | Thornburg Intermediate Municipal Fund |
| | • | | Thornburg California Limited Term Municipal Fund |
| | • | | Thornburg New Mexico Intermediate Municipal Fund |
| | • | | Thornburg New York Intermediate Municipal Fund |
| | • | | Thornburg Strategic Municipal Income Fund |
| | • | | Thornburg Limited Term U.S. Government Fund |
| | • | | Thornburg Limited Term Income Fund |
| | • | | Thornburg Strategic Income Fund |
Before investing, carefully consider the Fund’s investment goals, risks, charges, and expenses. For a prospectus containing this and other information, contact your financial advisor or visit thornburg.com. Read it carefully before investing.
For additional information, please visit www.thornburg.com
Thornburg Investment Management, Inc. 2300 North Ridgetop Road, Santa Fe, NM 87506
This page is not part of the Semi-Annual Report. 35
| | | | | | |
 | | Waste not, Wait not | |  |
| | |
| | | | Get instant access to your shareholder reports. |
| | |
| | This Semi-Annual Report is submitted for the general information of shareholders of the Fund. It is not authorized for distribution to prospective investors in the Fund unless preceded or accompanied by an effective prospectus. | | By switching from your postal mailbox to your email inbox, you reduce paper clutter, improve record keeping access, and help conserve our natural resources. |
 | | Investment Advisor: | | Go to www.thornburg.com/edelivery and sign up to receive your shareholder reports, prospectuses, and proxy statements electronically. |
| | Thornburg Investment Management® 800.847.0200 | |
| | Distributor: | | |
| | Thornburg Securities Corporation® 800.847.0200 | | You invest in the future, without spending a dime. |
| | TH172 | | |

Important Information
The information presented on the following pages is current as of March 31, 2011. The managers’ views, portfolio holdings, and sector diversification are provided for the general information of the Fund’s shareholders; they are historical and subject to change. This material should not be deemed a recommendation to buy or sell any of the securities mentioned.
Investments in the Fund carry risks, including possible loss of principal. Bond funds have the same interest rate, inflation, and credit risks that are associated with the underlying bonds. The principal value of bonds will fluctuate relative to changes in interest rates, decreasing when interest rates rise. This effect is more pronounced for longer-term bonds. Unlike bonds, bond funds have ongoing fees and expenses. Investments in lower-rated and unrated bonds may be more sensitive to default, downgrades, and market volatility; these investments may also be less liquid than higher-rated bonds. Investments in derivatives are subject to the risks associated with the securities or other assets underlying the pool of securities, including illiquidity and difficulty in valuation. Please see the Fund’s Prospectus for a discussion of the risks associated with an investment in the Fund. Investments in the Fund are not FDIC insured, nor are they deposits of or guaranteed by a bank or any other entity. There is no guarantee that the Fund will meet its investment objectives.
Performance data shown represents past performance and is no guarantee of future results. Investment return and principal value will fluctuate so shares, when redeemed, may be worth more or less than their original cost. Current performance may be lower or higher than quoted. For performance current to the most recent month end, visit thornburg.com or call 800-847-0200.
Performance data given at net asset value (NAV) does not take into account applicable sales charges. If the sales charges had been included, the performance would have been lower.
Minimum investments for Class I shares are higher than those for other classes. Class I shares may not be available to all investors.
| | | | |
Share Class | | NASDAQ Symbol | | Cusip |
Class A | | TSSAX | | 885-216-101 |
Class C | | TSSCX | | 885-216-200 |
Class I | | TSSIX | | 885-216-309 |
Glossary
BofA Merrill Lynch Municipal Master Index – This index tracks the performance of the investment-grade U.S. tax-exempt bond market. Qualifying bonds must have at least one year remaining term to maturity, a fixed coupon schedule, and an investment grade rating (based on average of Moody’s, S&P, and Fitch).
Unless otherwise noted, index returns reflect the reinvestment of income dividends and capital gains, if any, but do not reflect fees, brokerage commissions or other expenses of investing. Investors may not make direct investments into any index.
Alternative Minimum Tax (AMT) – A federal tax aimed at ensuring that high-income individuals, estates, trusts, and corporations pay a minimal level income tax. For individuals, the AMT is calculated by adding tax preference items to regular taxable income.
Basis Point (BPS) – A unit equal to 1/100th of 1%. 1% = 100 basis points (bps).
Bond Credit Ratings – A bond credit rating assesses the financial ability of a debt issuer to make timely payments of principal and interest. Ratings of AAA (the highest), AA, A, and BBB are investment-grade quality. Ratings of BB, B, CCC, CC, C, and D (the lowest) are considered below investment grade, speculative grade, or junk bonds. Unless otherwise noted, the ratings listed are from Municipal Market Data and are a combination of ratings from Standard and Poor’s, Moody’s Investors Service, and Fitch Ratings.
Build America Bonds (BAB) – Taxable municipal bonds that feature tax credits and/or federal subsidies for bondholders and state and local government bond issuers. Build America Bonds (BABs) were introduced in 2009 as part of President Obama’s American Recovery and Reinvestment Act to create jobs and stimulate the economy. BABs attempt to achieve this by lowering the cost of borrowing for state and local governments in financing new projects.
Capacity Utilization – The extent to which an enterprise or a nation actually uses its installed productive capacity. Capacity utilization reflects overall growth and demand in the economy, rising when the economy is vibrant, and falling when demand softens. High capacity utilization also exerts inflationary pressures as scarce resources are in higher demand. However, it may also lead to new capital investments, such as new plants, that promote growth in the future.
Consumer Price Index (CPI) – An index that measures prices of a fixed basket of goods bought by a typical consumer, including food, transportation, shelter, utilities, clothing, medical care, entertainment and other items. The CPI, published by the Bureau of Labor Statistics in the Department of Labor, is based at 100 in 1982 and is released monthly. It is widely used as a cost-of-living benchmark to adjust Social Security payments and other payment schedules, union contracts and tax brackets. The CPI is also known as the cost-of-living index.
Core CPI – Consumer Price Index minus the energy and food components.
This page is not part of the Semi-Annual Report. 3
| | |
| Important Information, | | |
| |
| Continued | | |
Effective Duration – A bond’s sensitivity to interest rates, incorporating the embedded option features, such as call provisions. Bonds with longer durations experience greater price volatility than bonds with shorter durations.
Fed Funds Rate – The interest rate at which a depository institution lends immediately available funds (balances at the Federal Reserve) to another depository institution overnight.
M2 – The amount of money in circulation in notes and coin plus noninterest-bearing bank deposits, building-society deposits, and National Savings accounts.
QE2 or Quantitative Easing 2 – The second round of the Federal Reserve’s monetary policy used to stimulate the U.S. economy following the recession that began in 2007/08. QE2 was initiated in the fourth quarter of 2010 in order to jump-start the sluggish economic recovery.
Taylor Rule – A monetary-policy formula that provides an indication of how much the central bank would or should change the nominal interest rate in response to divergences of actual inflation rates from target inflation rates and of actual Gross Domestic Product (GDP) from potential GDP. It was first proposed by the U.S. economist John B. Taylor in 1993. The Federal Reserve Board may not use the Taylor Rule in setting monetary policy.
Treasury Inflation Protected Securities (TIPS) – Either a U.S. Treasury note or bond that offers protection from the effects of inflation. Using the Consumer Price Index as a guide, the value of the principal is adjusted to reflect the effects of inflation. A fixed interest rate is paid semi-annually on the adjusted amount. At maturity, if inflation has increased the value of the principal, the investor receives the higher value. If deflation has decreased the value, the investor receives the original face amount of the security.
4 This page is not part of the Semi-Annual Report.

Thornburg Strategic Municipal Income Fund
March 31, 2011
Table of Contents
This report is certified under the Sarbanes-Oxley Act of 2002, which requires that public companies, including mutual funds, affirm that the information provided in their annual and semiannual shareholder reports fully and fairly represents their financial position.
Certified Semi-Annual Report 5
Letter to Shareholders
| | |

Christopher Ihlefeld Co-Portfolio Manager | | April 13, 2011 Dear Fellow Shareholder: We are pleased to present the semi-annual report for the Thornburg Strategic Municipal Income Fund. The net asset value (NAV) of the Class A shares declined from $14.22 to $13.12 during the six months ended March 31, 2011. If you were invested with us for the entire period, you received dividends of 29.7 cents per share. If you reinvested your dividends, you received 30.0 cents per share. Dividends per share were lower for Class C shares and higher for Class I shares to account for varying class-specific expenses. |

Christopher Ryon, CFA Co-Portfolio Manager 
Josh Gonze Co-Portfolio Manager | | The first quarter of 2011 witnessed a supply lull in the municipal bond market, delivering the lightest quarter for new deals in eleven years. It followed a huge volume of deals that were brought to market in the last quarter of 2010. In addition to the light new deal calendar in the first quarter of 2011, average daily trading volume was low, measuring $11.6 billion, down 15% from the prior year. |
| | Today, conditions in the municipal bond market are characterized by low yields for short-term bonds, combined with a steep yield curve (the difference between long- and short-term interest rates), resulting in relatively more attractive yields for intermediate- and long-term bonds. Today’s municipal yield curve is the steepest in 20 years. In the last six months, rates rose, shifting upward by 56 basis points for five-year maturities and by 81 basis points for 10-year maturities. This additional steepening of the yield curve caused longer maturity municipal bond funds to underperform shorter maturity municipal bond funds. Credit spreads are wide, relative to historical averages, with single-A municipal bonds paying on average 110 basis points more than AAA bonds at the end of March 2011. |
| | Municipal bond fund investors have been in redemption mode for the past six months, following approximately 22 months of net inflows into municipal bond funds that reversed in late November 2010. Large market outflows were prompted by default fears and falling mutual fund NAVs, but since January 2011, these concerns have abated somewhat. At this point, bond fund outflows industry wide have slowed from a peak of almost $4 billion weekly to around $500 million as this is written. Recent legislation has created both positive and negative forces for performance of municipal bonds. The expiration of the Build America Bond program at the end of 2010 has not led to |
6 Certified Semi-Annual Report
sharp growth in tax-exempt volume, as some had forecast. In 2010, Congress extended the Bush tax cuts another two years, so the top marginal tax rate remains at 35%, rather than escalating to 39.6%, which would have created yet more demand for tax-exempt income. Over the years we have seen many tax reform proposals come and go. Currently, a batch of new proposals is blanketing Washington, DC. If any of the proposals gain real traction, we will gauge the impact on our portfolio and seek to make appropriate adjustments.
The U.S. economic picture over the last six months has strengthened, but there remains a large degree of slack. Increased economic activity is reflected in the current 2.5% to 3.0% Gross Domestic Product (GDP) growth rate and healthy sales indicators. Unemployment remains high at 8.8%, though payroll growth was encouraging in February and March 2011, when we saw the best back-to-back increases since the recession’s official end in June 2009. Capacity utilization is still low at 76%, leaving excess capacity in the economy. Year over year, the Consumer Price Index (CPI) is currently around 2.0% to 2.5%, much higher than the core CPI rate which is only 1.1% to 1.25%. Meanwhile, the difference between 10-year TIPS yields and 10-year Treasuries is running around 2.7%, and is often viewed as a market opinion of 10-year inflation expectations. We expect QE2, the second phase of quantitative easing, to end abruptly in June 2011.
We are becoming more optimistic about the fiscal outlook for state and local governments. We have been pleased to see a rebound in revenues in most states, driven by growth in income tax and sales tax revenue. Revenues at the state and local level have seen moderate growth over the past six months, providing support for credit ratings and overall credit quality. A preliminary report from the Rockefeller Institute stated that overall state tax revenue grew 6.9% in the fourth quarter of 2010, with 41 states reporting higher revenue.
Default rates have not spiked, as was forecast last year by some, though there’s little doubt that more defaults will occur, most likely in sectors tied to real estate development, retirement communities, and health care. Some cities, particularly in the Midwest, are experiencing population declines, which can undermine the tax base.
The Fed is still in super-stimulative mode, with the fed funds rate at nearly 0% since December 2008, which is viewed as appropriate according to the Taylor Rule, which currently indicates the fed funds rate should be negative 1.45%. The Taylor Rule is a formula guideline for evaluating the level of the fed funds rate created by Stanford University economist John Taylor. M2, a broad measure of money and money substitutes, has grown only 4% in the last year, at the lower end of the 3% to 10% annual growth rate that has prevailed over the last decade. Velocity of M2, the degree to which money turns over (a contributor to inflation), has remained muted.
Your Fund contains a portfolio of more than 130 municipal bonds from 31 states and territories. Your Fund is broadly diversified across sectors and 81% invested in bonds rated BBB and above by at least one of the major rating agencies. By Prospectus, we are permitted to allocate up to 50% of the portfolio to bonds that are below investment-grade in
Certified Semi-Annual Report 7
| | |
| Letter to Shareholders, | | |
| |
| Continued | | |
quality at the time of purchase, but to date we have not chosen to exercise that option because we are often able to find attractive yields on bonds in the lower ranges of the investment grade spectrum.
The Class A shares of your Fund produced a total return of negative 5.51% at NAV over the six-month period ended March 31, 2011, compared to negative 4.24% for the BofA Merrill Lynch Municipal Master Index. The Fund’s overweight toward certain sectors such as charter schools and tax allocation districts explained this lag versus the index.
Thank you for investing in Thornburg Strategic Municipal Income Fund.
Sincerely,
| | | | | | |
 | |  | |  | | |
| Christopher Ihlefeld | | Christopher Ryon,CFA | | Josh Gonze | | |
| Co-Portfolio Manager | | Co-Portfolio Manager | | Co-Portfolio Manager | | |
| Managing Director | | Managing Director | | Managing Director | | |
The matters discussed in this report may constitute forward-looking statements made pursuant to the safe harbor provisions of the Securities Litigation Reform Act of 1995. These include any advisor or portfolio manager prediction, assessment, analysis or outlook for individual securities, industries, investment styles, market sectors and/or markets. These statements involve risks and uncertainties. In addition to the general risks described for each fund in its current prospectus, other factors bearing on these reports include the accuracy of the advisor’s or portfolio manager’s forecasts and predictions, the appropriateness of the investment strategies designed by the advisor or portfolio manager and the ability of the advisor or portfolio manager to implement their strategies efficiently and successfully. Any one or more of these factors, as well as other risks affecting the securities markets generally, could cause the actual results of any fund to differ materially as compared to its benchmarks.
8 Certified Semi-Annual Report
| | |
| SCHEDULE OF INVESTMENTS | | |
| |
| Thornburg Strategic Municipal Income Fund | | March 31, 2011 (Unaudited) |
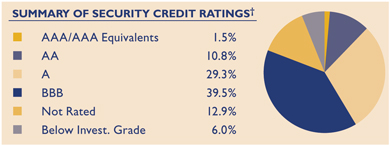
We have used ratings from Standard & Poor’s (S&P). Where S&P ratings are not available, we have used Moody’s Investors Service. Where neither rating is available, we have used ratings from Fitch Ratings. The category of investments identified as “AAA” in this graph includes investments which are pre-refunded or escrowed to maturity. Such investments are backed by an escrow or trust containing sufficient U.S. Government or U.S. Government agency securities to satisfy the timely payment of principal and interest and, therefore, are normally deemed to be equivalent to AAA-rated securities.
| | | | | | | | | | | | |
Issuer-Description | | Credit Rating†
S&P/ Moody’s | | | Principal
Amount | | | Value | |
ARIZONA — 2.02% | | | | | | | | | | | | |
Maricopa County PCR, 6.00% due 5/1/2029 put 5/1/2014 (Arizona Public Service Co.) | | | BBB-/Baa2 | | | $ | 500,000 | | | $ | 524,825 | |
Pima County Industrial Development Authority Education Revenue, 6.25% due 7/1/2013 (Arizona Charter Schools) | | | NR/Baa3 | | | | 815,000 | | | | 817,095 | |
University Medical Center Corp., 6.25% due 7/1/2029 | | | BBB+/Baa1 | | | | 100,000 | | | | 101,727 | |
University Medical Center Corp., 6.50% due 7/1/2039 | | | BBB+/Baa1 | | | | 275,000 | | | | 279,169 | |
| | | |
CALIFORNIA — 16.57% | | | | | | | | | | | | |
| | | |
California Financial Authority Revenue, 8.50% due 11/1/2039 (Harbor Regulation Control) | | | NR/Baa1 | | | | 1,000,000 | | | | 1,070,840 | |
California HFA, 6.25% due 2/1/2026 (Community Program; Insured: California Mortgage Insurance) | | | NR/NR | | | | 1,500,000 | | | | 1,535,115 | |
California HFA, 0% due 8/1/2029 (Insured: AMBAC/FHA/VA) | | | A/A3 | | | | 1,340,000 | | | | 397,404 | |
California State Public Works Board, 6.25% due 4/1/2034 | | | BBB+/A2 | | | | 100,000 | | | | 100,562 | |
California Statewide Communities Development Authority, 6.125% due 7/1/2046 (Aspire Public Schools) | | | NR/NR | | | | 1,000,000 | | | | 865,150 | |
Calipatria USD, 0% due 8/1/2025 (Capital Appreciation-Election 1995; Insured: ACA) | | | NR/NR | | | | 2,425,000 | | | | 775,952 | |
Carson Redevelopment Agency Tax Allocation, 7.00% due 10/1/2036 (Project Area 1) | | | A-/NR | | | | 500,000 | | | | 516,460 | |
Chico Redevelopment Agency, 5.00% due 4/1/2030 (Chico Amended & Merged Redevelopment; Insured: AMBAC) | | | A+/NR | | | | 1,000,000 | | | | 829,110 | |
Corona-Norco USD COP, 5.00% due 4/15/2031 (Insured: AGM) | | | AA+/Aa3 | | | | 1,750,000 | | | | 1,622,460 | |
Daly County Housing Development Finance Agency, 5.25% due 12/15/2023 (Franciscan Mobile Park) | | | A-/NR | | | | 650,000 | | | | 615,875 | |
Lee Lake Water District, 5.875% due 9/1/2027 | | | NR/NR | | | | 500,000 | | | | 429,875 | |
M-S-R Energy Authority, 6.50% due 11/1/2039 | | | A/NR | | | | 1,000,000 | | | | 1,012,970 | |
Merced Redevelopment Agency Tax Allocation, 6.50% due 9/1/2039 (Merced Gateways Redevelopment) | | | A-/NR | | | | 300,000 | | | | 283,341 | |
Oak Park USD GO, 0% due 8/1/2030 (Insured: AGM) | | | AA+/Aa3 | | | | 500,000 | | | | 143,285 | |
Pittsburg Redevelopment Agency Tax Allocation, 0% due 8/1/2027 (Los Medanos Community Development; Insured: AMBAC) | | | A+/NR | | | | 1,220,000 | | | | 361,352 | |
Redwood City Redevelopment Agency Tax Allocation, 0% due 7/15/2021 (Redevelopment Project Area 2; Insured: AMBAC) | | | A-/NR | | | | 1,285,000 | | | | 642,474 | |
Riverside County Asset Leasing Corp., 0% due 6/1/2021 (Riverside County Hospital; Insured: Natl-Re) | | | BBB/A1 | | | | 535,000 | | | | 264,632 | |
San Diego USD, 0% due 7/1/2035 (Election 2008) | | | AA/Aa1 | | | | 1,700,000 | | | | 338,266 | |
San Francisco City & County Redevelopment Financing Authority Tax Allocation, 0% due 8/1/2023 (Redevelopment Project; Insured: Natl-Re) | | | A/A1 | | | | 825,000 | | | | 367,076 | |
San Francisco City & County Redevelopment Financing Authority Tax Allocation, 6.50% due 8/1/2039 (Mission Bay North Redevelopment) | | | A-/NR | | | | 250,000 | | | | 238,790 | |
Certified Semi-Annual Report 9
| | |
| SCHEDULE OF INVESTMENTS, CONTINUED | | |
| |
| Thornburg Strategic Municipal Income Fund | | March 31, 2011 (Unaudited) |
| | | | | | | | | | |
Issuer-Description | | Credit Rating†
S&P/ Moody’s | | Principal
Amount | | | Value | |
San Francisco City & County Redevelopment Financing Authority Tax Allocation, 6.75% due 8/1/2041 (Mission Bay North Redevelopment) | | A-/NR | | $ | 500,000 | | | $ | 499,555 | |
San Jose Redevelopment Agency Tax, 5.50% due 8/1/2035 (Merged Area Redevelopment) | | A/A1 | | | 1,000,000 | | | | 832,870 | |
Sonoma County Community Redevelopment Agency Tax Allocation, 6.50% due 8/1/2034 (The Springs Redevelopment; Insured: AGM) | | AA+/NR | | | 100,000 | | | | 102,636 | |
Union Elementary School District, 0% due 9/1/2027 (Capital Appreciation - Election 1999; Insured: Natl-Re) | | AA+/NR | | | 905,000 | | | | 310,677 | |
| | | |
COLORADO — 8.55% | | | | | | | | | | |
| | | |
Colorado Educational & Cultural Facilities Authority, 5.25% due 8/15/2019 (Peak to Peak Charter School; Insured: Syncora) | | A/NR | | | 1,600,000 | | | | 1,635,616 | |
Denver Convention Center, 5.125% due 12/1/2026 (Insured: Syncora) | | BBB-/Baa3 | | | 1,000,000 | | | | 864,260 | |
Denver Convention Center, 5.00% due 12/1/2030 (Insured: Syncora) | | BBB-/Baa3 | | | 450,000 | | | | 366,597 | |
Denver Convention Center, 5.00% due 12/1/2035 (Insured: Syncora) | | BBB-/Baa3 | | | 605,000 | | | | 466,080 | |
E-470 Public Highway Authority Revenue, 0% due 9/1/2037 (Capital Appreciation) | | BBB-/Baa2 | | | 1,000,000 | | | | 127,200 | |
E-470 Public Highway Authority Revenue, 0% due 9/1/2040 (Capital Appreciation) | | BBB-/Baa2 | | | 2,000,000 | | | | 201,860 | |
Eagle Bend Metropolitan District GO, 5.00% due 12/1/2020 (Insured: Radian) | | A-/NR | | | 1,100,000 | | | | 1,079,276 | |
Eagle River Fire District, 6.625% due 12/1/2024 | | NR/NR | | | 225,000 | | | | 223,855 | |
Eagle River Fire District, 6.875% due 12/1/2030 | | NR/NR | | | 400,000 | | | | 384,760 | |
Pinery West Metropolitan District No. 2, 4.50% due 12/1/2032 (Insured: Radian) | | NR/NR | | | 500,000 | | | | 340,525 | |
Public Authority for Colorado Energy, 5.75% due 11/15/2018 (Natural Gas Purchase Revenue; Guaranty: BofA-Merrill Lynch & Co.) | | A/A2 | | | 825,000 | | | | 864,724 | |
Public Authority for Colorado Energy, 6.50% due 11/15/2038 (Natural Gas Purchase Revenue; Guaranty: BofA-Merrill Lynch & Co.) | | A/A2 | | | 250,000 | | | | 250,935 | |
Regional Transportation District COP, 5.375% due 6/1/2031 | | A-/Aa3 | | | 500,000 | | | | 498,435 | |
| | | |
CONNECTICUT — 1.07% | | | | | | | | | | |
| | | |
Connecticut Health & Educational Facilities Authority, 6.00% due 7/1/2039 (Ethel Walker School) | | BBB-/NR | | | 1,000,000 | | | | 913,990 | |
| | | |
DISTRICT OF COLUMBIA — 0.62% | | | | | | | | | | |
| | | |
Metropolitan Washington Airports Authority, 0% due 10/1/2027 (Dulles Toll Road; Insured: AGM) | | AA+/Aa3 | | | 1,500,000 | | | | 527,085 | |
| | | |
FLORIDA — 5.11% | | | | | | | | | | |
| | | |
Hollywood Community Redevelopment Agency, 5.625% due 3/1/2024 | | NR/A3 | | | 340,000 | | | | 343,876 | |
Lakeland Energy System Revenue, 5.25% due 10/1/2036 | | AA-/A1 | | | 2,000,000 | | | | 1,897,780 | |
Sarasota County Public Hospital Board, 3.269% due 10/1/2021 (Miles-Sarasota Memorial Hospital; Insured: Natl-Re) | | BBB/A1 | | | 1,000,000 | | | | 895,890 | |
St. John’s County IDA, 5.625% due 8/1/2034 (Presbyterian Retirement) | | NR/NR | | | 230,000 | | | | 197,151 | |
Tampa Sports Authority Revenue, 5.75% due 10/1/2020 (Tampa Bay Arena; Insured: Natl-Re) | | BBB/Baa1 | | | 1,000,000 | | | | 1,034,530 | |
| | | |
GEORGIA — 1.63% | | | | | | | | | | |
| | | |
Atlanta Water & Waste Water, 6.25% due 11/1/2034 | | A/A1 | | | 500,000 | | | | 524,310 | |
Main Street Natural Gas, Inc., 5.00% due 3/15/2018 (Georgia Gas) | | A+/Aa3 | | | 515,000 | | | | 531,212 | |
Main Street Natural Gas, Inc., 5.50% due 9/15/2023 (Georgia Gas) | | A/A2 | | | 350,000 | | | | 340,435 | |
| | | |
GUAM — 2.26% | | | | | | | | | | |
| | | |
Guam Government, 5.75% due 12/1/2034 (Section 30) | | BBB-/NR | | | 500,000 | | | | 471,625 | |
Guam Government Department of Education COP, 6.875% due 12/1/2040 (John F. Kennedy High School) | | B/NR | | | 1,000,000 | | | | 923,350 | |
Guam Government GO, 7.00% due 11/15/2039 | | B+/NR | | | 520,000 | | | | 533,114 | |
10 Certified Semi-Annual Report
| | |
| SCHEDULE OF INVESTMENTS, CONTINUED | | |
| |
| Thornburg Strategic Municipal Income Fund | | March 31, 2011 (Unaudited) |
| | | | | | | | | | | | |
Issuer-Description | | Credit Rating†
S&P/ Moody’s | | | Principal
Amount | | | Value | |
HAWAII — 0.34% | | | | | | | | | | | | |
Hawaii State Department of Budget & Finance, 5.45% due 11/1/2023 (Hawaiian Electric Co.; Insured: Natl-Re) (AMT) | | | NR/Baa1 | | | $ | 300,000 | | | $ | 289,140 | |
| | | |
ILLINOIS — 8.98% | | | | | | | | | | | | |
| | | |
Broadview Tax Increment Revenue, 5.25% due 7/1/2012 | | | NR/NR | | | | 515,000 | | | | 515,134 | |
Chicago Tax Increment, 4.70% due 11/15/2013 (Near South Redevelopment; Insured: AMBAC) | | | NR/NR | | | | 800,000 | | | | 801,488 | |
Chicago Tax Increment, 6.75% due 6/1/2022 (Pilsen Redevelopment) | | | NR/NR | | | | 1,000,000 | | | | 992,160 | |
Cook County GO, 5.25% due 11/15/2033 | | | AA/Aa2 | | | | 1,000,000 | | | | 974,110 | |
Illinois Finance Authority, 5.75% due 11/15/2037 (OSF Healthcare System) | | | A/A3 | | | | 330,000 | | | | 302,722 | |
Illinois Finance Authority, 6.00% due 5/15/2039 (OSF Healthcare System) | | | A/A3 | | | | 1,000,000 | | | | 951,790 | |
Melrose Park Tax Increment Revenue, 6.75% due 12/15/2021 (Insured: Natl-Re) | | | NR/Baa1 | | | | 410,000 | | | | 454,407 | |
Metropolitan Pier & Exposition Authority, 5.00% due 6/15/2050 (McCormick Place) | | | AAA/A2 | | | | 1,500,000 | | | | 1,221,195 | |
Railsplitter Tobacco Settlement Authority, 6.00% due 6/1/2028 | | | A-/NR | | | | 1,000,000 | | | | 966,660 | |
Southwestern Illinois Development Authority, 5.50% due 8/15/2020 (Southwestern Illinois Health Facilities) | | | BBB/Baa2 | | | | 500,000 | | | | 498,155 | |
| | | |
INDIANA — 1.53% | | | | | | | | | | | | |
| | | |
Carmel Redevelopment District, 6.50% due 7/15/2035 | | | NR/NR | | | | 1,000,000 | | | | 899,060 | |
Indiana Power System Revenue, 5.50% due 1/1/2017 (Insured: AMBAC) | | | A+/A1 | | | | 400,000 | | | | 411,360 | |
| | | |
KANSAS — 0.79% | | | | | | | | | | | | |
| | | |
Wichita Multi-Family Housing, 5.85% due 12/1/2025 (Brentwood Apartments) | | | B/NR | | | | 895,000 | | | | 673,684 | |
| | | |
KENTUCKY — 2.28% | | | | | | | | | | | | |
| | | |
Kentucky EDA, 0% due 10/1/2021 (Norton Healthcare, Inc.; Insured: Natl-Re) | | | BBB/Baa1 | | | | 365,000 | | | | 196,906 | |
Kentucky EDA, 0% due 10/1/2022 (Norton Healthcare, Inc.; Insured: Natl-Re) | | | BBB/Baa1 | | | | 2,490,000 | | | | 1,245,847 | |
Owen County Waterworks Systems, 6.25% due 6/1/2039 (American Water Co.) | | | BBB+/Baa2 | | | | 500,000 | | | | 507,280 | |
| | | |
LOUISIANA — 1.03% | | | | | | | | | | | | |
| | | |
Louisiana Public Facilities Authority, 5.00% due 7/1/2032 (Black & Gold Facilities; Insured: CIFG) | | | NR/Baa3 | | | | 120,000 | | | | 102,103 | |
Louisiana Public Facilities Authority, 5.375% due 5/15/2043 (Ochsner Clinic Foundation) | | | NR/Baa1 | | | | 500,000 | | | | 403,035 | |
Orleans Parish School Board GO, 0% due 2/1/2015 (Insured: FGIC) | | | NR/NR | | | | 480,000 | | | | 378,677 | |
| | | |
MASSACHUSETTS — 0.58% | | | | | | | | | | | | |
| | | |
Massachusetts Educational Financing Authority, 6.00% due 1/1/2028 | | | AA/NR | | | | 480,000 | | | | 495,101 | |
| | | |
MICHIGAN — 8.03% | | | | | | | | | | | | |
| | | |
Detroit School District, 5.25% due 5/1/2027 (Insured: AGM) | | | AA+/Aa2 | | | | 1,000,000 | | | | 981,860 | |
Dickinson County Healthcare Systems, 5.80% due 11/1/2024 (Insured: ACA) | | | NR/NR | | | | 270,000 | | | | 271,882 | |
Dickinson County Healthcare Systems, 5.80% due 11/1/2024 | | | NR/Baa3 | | | | 1,000,000 | | | | 1,006,970 | |
Kalamazoo Hospital Finance Authority, 5.00% due 5/15/2036 (Bronson Methodist Hospital) | | | NR/A2 | | | | 1,000,000 | | | | 875,690 | |
Michigan Public Educational Facilities Authority, 8.75% due 9/1/2039 (Bradford Academy) | | | BBB-/NR | | | | 500,000 | | | | 535,450 | |
Michigan Public School Academy, 8.00% due 8/1/2035 (Will Carleton Charter School) | | | NR/NR | | | | 1,100,000 | | | | 974,303 | |
Michigan State Hospital Finance Authority, 5.00% due 7/15/2025 (Oakwood Obligated Group) | | | A/A2 | | | | 650,000 | | | | 611,266 | |
Michigan State Hospital Finance Authority, 5.75% due 4/1/2032 (Oakwood Obligated Group) | | | A/A2 | | | | 150,000 | | | | 143,831 | |
Michigan State Hospital Finance Authority Revenue, 5.75% due 11/15/2039 | | | A/A1 | | | | 1,000,000 | | | | 917,530 | |
Michigan State Strategic Fund, 5.00% due 8/1/2013 (NSF International) | | | A-/NR | | | | 300,000 | | | | 313,344 | |
Certified Semi-Annual Report 11
| | |
| SCHEDULE OF INVESTMENTS, CONTINUED | | |
| |
| Thornburg Strategic Municipal Income Fund | | March 31, 2011 (Unaudited) |
| | | | | | | | | | |
Issuer-Description | | Credit Rating†
S&P/ Moody’s | | Principal
Amount | | | Value | |
Michigan Strategic Fund, 7.00% due 5/1/2021 (The Detroit Edison Company; Insured: Natl-Re/ AMBAC) | | NR/NR | | $ | 200,000 | | | $ | 229,214 | |
| | | |
MINNESOTA — 0.51% | | | | | | | | | | |
| | | |
St. Paul Housing & Redevelopment Authority, 5.25% due 5/15/2023 (Healthpartners Obligated Group) | | BBB+/A3 | | | 100,000 | | | | 99,994 | |
Washington County Housing Redevelopment Authority, 5.625% due 6/1/2037 (Birchwood & Woodbury) | | NR/NR | | | 415,000 | | | | 336,158 | |
| | | |
NEVADA — 0.61% | | | | | | | | | | |
| | | |
Mesquite Redevelopment Agency Tax Increment Revenue, 7.375% due 6/1/2024 | | A-/NR | | | 500,000 | | | | 520,200 | |
| | | |
NEW MEXICO — 1.85% | | | | | | | | | | |
| | | |
Farmington PCR, 4.70% due 9/1/2024 (Arizona Public Service Co.) | | BBB-/Baa2 | | | 1,000,000 | | | | 929,500 | |
Santa Fe County Charter School Foundation, 6.625% due 1/15/2036 (ATC Foundation) | | NR/NR | | | 485,000 | | | | 411,750 | |
Santa Fe Educational Facilities, 5.50% due 3/1/2024 (St. John’s College) | | NR/NR | | | 265,000 | | | | 238,418 | |
| | | |
NEW YORK — 2.34% | | | | | | | | | | |
| | | |
New York City Transitional Finance Authority, 0.18% due 8/1/2031 put 4/1/2011 (SPA: Landsbank Hessen) (daily demand notes) | | AAA/Aaa | | | 2,000,000 | | | | 2,000,000 | |
| | | |
OHIO — 4.98% | | | | | | | | | | |
| | | |
Buckeye Tobacco Settlement Financing Authority, 6.50% due 6/1/2047 | | BB-/Baa3 | | | 590,000 | | | | 430,907 | |
Cleveland Cuyahoga County Port Authority, 6.25% due 5/15/2016 (LOC: FifthThird Bank) | | BBB-/NR | | | 445,000 | | | | 443,807 | |
Cleveland Cuyahoga County Port Authority, 7.00% due 5/15/2040 (Insured: City Appropriations) | | BBB-/NR | | | 1,000,000 | | | | 990,080 | |
Ohio State Water Development Authority PCR, 5.875% due 6/1/2033 put 6/1/2016 (FirstEnergy) | | BBB-/Baa1 | | | 1,000,000 | | | | 1,073,310 | |
Ohio State Water Development Authority PCR, 3.375% due 7/1/2033 put 7/1/2015 (FirstEnergy) | | BBB-/Baa2 | | | 1,350,000 | | | | 1,321,920 | |
| | | |
OREGON — 1.12% | | | | | | | | | | |
| | | |
Western Generation Agency, 5.00% due 1/1/2016 (Wauna Cogeneration; Insured: ACA) | | NR/NR | | | 1,000,000 | | | | 959,980 | |
| | | |
PENNSYLVANIA — 5.00% | | | | | | | | | | |
| | | |
Allegheny County IDA, 6.75% due 8/15/2035 (Propel Charter School) | | BB+/NR | | | 1,000,000 | | | | 872,950 | |
Pennsylvania EDA, 5.00% due 12/1/2014 (Colver Project; Insured: AMBAC) (AMT) | | BBB-/Ba1 | | | 450,000 | | | | 445,833 | |
Pennsylvania EDA, 4.625% due 12/1/2018 (Colver Project; Insured: AMBAC) (AMT) | | BBB-/Ba1 | | | 600,000 | | | | 540,054 | |
Pennsylvania Turnpike Commission, 0% due 12/1/2030 (Convertible Capital Appreciation) | | A-/A3 | | | 2,000,000 | | | | 1,429,420 | |
Philadelphia IDA, 6.00% due 8/1/2035 (Mast Charter School) | | BBB+/NR | | | 1,000,000 | | | | 982,330 | |
| | | |
RHODE ISLAND — 0.83% | | | | | | | | | | |
| | | |
Pawtucket Housing Authority Capital Funds Housing Revenue, 5.50% due 9/1/2022 | | AA/NR | | | 315,000 | | | | 336,968 | |
Pawtucket Housing Authority Capital Funds Housing Revenue, 5.50% due 9/1/2024 | | AA/NR | | | 350,000 | | | | 369,446 | |
| | | |
SOUTH DAKOTA — 0.87% | | | | | | | | | | |
| | | |
South Dakota Health & Educational Facilities Authority, 5.50% due 11/1/2040 (Sanford Health) | | AA-/A1 | | | 750,000 | | | | 740,250 | |
| | | |
TENNESSEE — 0.67% | | | | | | | | | | |
| | | |
Tennessee Energy Acquisition Corp., 5.00% due 2/1/2015 | | BBB/Baa3 | | | 100,000 | | | | 104,253 | |
Tennessee Energy Acquisition Corp., 5.25% due 9/1/2024 | | B/Ba3 | | | 500,000 | | | | 470,580 | |
12 Certified Semi-Annual Report
| | |
| SCHEDULE OF INVESTMENTS, CONTINUED | | |
| |
| Thornburg Strategic Municipal Income Fund | | March 31, 2011 (Unaudited) |
| | | | | | | | | | | | |
Issuer-Description | | Credit Rating†
S&P/ Moody’s | | | Principal
Amount | | | Value | |
TEXAS — 12.45% | | | | | | | | | | | | |
Austin Convention Enterprises, Inc., 5.25% due 1/1/2024 (Austin Convention Center; Insured: Syncora) | | | BB+/Ba1 | | | $ | 720,000 | | | $ | 590,141 | |
Austin Convention Enterprises, Inc., 5.00% due 1/1/2034 (Austin Convention Center; Insured: Syncora) | | | BB+/Ba1 | | | | 615,000 | | | | 422,001 | |
Bexar County Housing Finance Corp. MFR, 5.70% due 1/1/2021 (American Opportunity Housing; Insured: Natl-Re) | | | NR/Baa1 | | | | 1,135,000 | | | | 1,031,851 | |
Bexar County Housing Finance Corp. MFR, 5.80% due 1/1/2031 (American Opportunity Housing; Insured: Natl-Re) | | | NR/Baa1 | | | | 550,000 | | | | 454,383 | |
Clifton Higher Education Finance Corp., 9.00% due 2/15/2038 | | | BBB-/NR | | | | 1,000,000 | | | | 1,102,350 | |
Gulf Coast Waste Disposal Authority, 6.10% due 8/1/2024 (International Paper Co.) (AMT) | | | BBB/Baa3 | | | | 100,000 | | | | 100,249 | |
Kimble County Hospital District, 6.25% due 8/15/2033 | | | NR/NR | | | | 500,000 | | | | 504,490 | |
La Vernia Higher Education Finance Corp., 6.25% due 8/15/2039
(Kipp Inc.) | | | BBB/NR | | | | 1,000,000 | | | | 972,750 | |
San Antonio Energy Acquisition Public Facilities Corp., 5.50% due 8/1/2021 | | | A/A2 | | | | 40,000 | | | | 40,225 | |
San Juan Higher Education Finance Authority Revenue, 6.70% due 8/15/2040 (Idea Public School) | | | BBB/NR | | | | 1,000,000 | | | | 1,000,860 | |
Texas City Industrial Development Corp., 7.375% due 10/1/2020 (Arco Pipe Line Company; Guaranty: Atlantic Richfield) | | | A/A2 | | | | 1,000,000 | | | | 1,149,290 | |
Texas Public Finance Authority Charter School Finance Corp., 4.15% due 8/15/2016 (Idea Public School; Insured: ACA) | | | BBB/NR | | | | 100,000 | | | | 97,643 | |
Texas Public Finance Authority Charter School Finance Corp., 5.00% due 2/15/2018 (Cosmos Foundation, Inc.) | | | BBB/NR | | | | 895,000 | | | | 876,124 | |
Texas Public Finance Authority Charter School Finance Corp., 5.00% due 8/15/2023 (Idea Public School; Insured: ACA) | | | BBB/NR | | | | 155,000 | | | | 141,208 | |
Texas Public Finance Authority Charter School Finance Corp., 5.00% due 8/15/2030 (Idea | | | | | | | | | | | | |
Public School; Insured: ACA) | | | BBB/NR | | | | 1,500,000 | | | | 1,264,185 | |
Texas Public Finance Authority Charter School Finance Corp., 6.20% due 2/15/2040 (Cosmos Foundation, Inc.) | | | BBB/NR | | | | 1,000,000 | | | | 895,640 | |
| | | |
U.S. VIRGIN ISLANDS — 0.78% | | | | | | | | | | | | |
| | | |
Virgin Islands Public Finance Authority, 6.75% due 10/1/2037 | | | NR/Baa3 | | | | 500,000 | | | | 514,270 | |
Virgin Islands Water & Power Authority, 5.50% due 7/1/2017 | | | NR/Baa3 | | | | 150,000 | | | | 150,170 | |
| | | |
UTAH — 1.15% | | | | | | | | | | | | |
| | | |
Herriman Utah Special Assessment, 4.75% due 11/1/2022 (Towne Center Assessment Area) | | | A/NR | | | | 1,000,000 | | | | 985,340 | |
| | | |
VIRGINIA — 2.50% | | | | | | | | | | | | |
| | | |
Mecklenburg County IDA, 6.50% due 10/15/2017 (Virginia Electric and Power Company) | | | NR/Baa1 | | | | 1,000,000 | | | | 989,250 | |
Norton IDA, 6.00% due 12/1/2014 (Norton Community Hospital; Insured: ACA) | | | NR/NR | | | | 635,000 | | | | 635,553 | |
Virginia Small Business Financing Authority, 9.00% due 7/1/2039 (Hampton RDS Proton) | | | NR/NR | | | | 500,000 | | | | 508,400 | |
| | | |
WASHINGTON — 1.12% | | | | | | | | | | | | |
| | | |
Washington HFA, 5.70% due 7/1/2038 (Overlake Hospital Medical Center) | | | BBB+/A3 | | | | 1,000,000 | | | | 959,880 | |
| | | | | | | | | | | | |
TOTAL INVESTMENTS — 98.17% (Cost $85,767,323) | | | | | | | | | | $ | 83,893,729 | |
OTHER ASSETS LESS LIABILITIES — 1.83% | | | | | | | | | | | 1,563,170 | |
| | | | | | | | | | | | |
NET ASSETS — 100.00% | | | | | | | | | | $ | 85,456,899 | |
| | | | | | | | | | | | |
Certified Semi-Annual Report 13
| | |
| SCHEDULE OF INVESTMENTS, CONTINUED | | |
| |
| Thornburg Strategic Municipal Income Fund | | March 31, 2011 (Unaudited) |
Footnote Legend
| † | Credit ratings are unaudited. Rating changes may have occurred subsequent to the reporting period end. Bonds issued with a maturity of one year or less are assigned Moody’s ratings from MIG-1 to MIG-4 and Standard and Poor’s ratings from SP-1+ to SP-3 with MIG-1 and SP-1+ being the strongest ratings. |
Portfolio Abbreviations
To simplify the listings of securities, abbreviations are used per the table below:
| | |
| ACA | | Insured by American Capital Access |
| AGM | | Insured by Assured Guaranty Municipal Corp. |
| AMBAC | | Insured by American Municipal Bond Assurance Corp. |
| AMT | | Alternative Minimum Tax |
| CIFG | | CIFG Assurance North America Inc. |
| COP | | Certificates of Participation |
| EDA | | Economic Development Authority |
| FGIC | | Insured by Financial Guaranty Insurance Co. |
| FHA | | Insured by Federal Housing Administration |
| GO | | General Obligation |
| HFA | | Health Facilities Authority |
| IDA | | Industrial Development Authority |
| LOC | | Letter of Credit |
| MFR | | Multi-Family Revenue |
| Natl-Re | | Insured by National Public Finance Guarantee Corp. |
| PCR | | Pollution Control Revenue Bond |
| Radian | | Insured by Radian Asset Assurance |
| SPA | | Stand-by Purchase Agreement |
| Syncora | | Insured by Syncora Guarantee Inc. |
| VA | | Veterans Affairs |
| USD | | Unified School District |
See notes to financial statements.
14 Certified Semi-Annual Report
| | |
| STATEMENT OF ASSETS AND LIABILITIES | | |
| |
| Thornburg Strategic Municipal Income Fund | | March 31, 2011 (Unaudited) |
| | | | |
ASSETS | | | | |
Investments at value (cost $85,767,323) (Note 2) | | $ | 83,893,729 | |
Cash | | | 299,715 | |
Receivable for investments sold | | | 45,000 | |
Receivable for fund shares sold | | | 291,973 | |
Interest receivable | | | 1,325,233 | |
Prepaid expenses and other assets | | | 43,545 | |
| | | | |
Total Assets | | | 85,899,195 | |
| | | | |
| |
LIABILITIES | | | | |
Payable for fund shares redeemed | | | 258,172 | |
Payable to investment advisor and other affiliates (Note 3) | | | 72,185 | |
Accounts payable and accrued expenses | | | 21,457 | |
Dividends payable | | | 90,482 | |
| | | | |
Total Liabilities | | | 442,296 | |
| | | | |
| |
NET ASSETS | | $ | 85,456,899 | |
| | | | |
NET ASSETS CONSIST OF: | | | | |
Net unrealized depreciation on investments | | | (1,873,594 | ) |
Accumulated net realized gain (loss) | | | 84,020 | |
Net capital paid in on shares of beneficial interest | | | 87,246,473 | |
| | | | |
| | $ | 85,456,899 | |
| | | | |
| |
NET ASSET VALUE: | | | | |
Class A Shares: | | | | |
Net asset value and redemption price per share ($32,201,115 applicable to 2,454,237 shares of beneficial interest outstanding - Note 4) | | $ | 13.12 | |
Maximum sales charge, 2.00% of offering price | | | 0.27 | |
| | | | |
Maximum offering price per share | | $ | 13.39 | |
| | | | |
| |
Class C Shares: | | | | |
Net asset value and offering price per share * ($13,996,069 applicable to 1,065,615 shares of beneficial interest outstanding - Note 4) | | $ | 13.13 | |
| | | | |
| |
Class I Shares: | | | | |
Net asset value, offering and redemption price per share ($39,259,715 applicable to 2,989,439 shares of beneficial interest outstanding - Note 4) | | $ | 13.13 | |
| | | | |
| * | Redemption price per share is equal to net asset value less any applicable contingent deferred sales charge. |
See notes to financial statements.
Certified Semi-Annual Report 15
| | |
| STATEMENT OF OPERATIONS | | |
| |
| Thornburg Strategic Municipal Income Fund | | Six Months Ended March 31, 2011 (Unaudited) |
| | | | |
INVESTMENT INCOME: | | | | |
Interest income (net of premium amortized of $69,934) | | $ | 2,389,606 | |
| | | | |
| |
EXPENSES: | | | | |
Investment advisory fees (Note 3) | | | 315,768 | |
Administration fees (Note 3) | | | | |
Class A Shares | | | 18,693 | |
Class C Shares | | | 9,505 | |
Class I Shares | | | 9,772 | |
Distribution and service fees (Note 3) | | | | |
Class A Shares | | | 37,386 | |
Class C Shares | | | 45,818 | |
Transfer agent fees | | | | |
Class A Shares | | | 7,412 | |
Class C Shares | | | 4,554 | |
Class I Shares | | | 6,928 | |
Registration and filing fees | | | | |
Class A Shares | | | 8,977 | |
Class C Shares | | | 8,947 | |
Class I Shares | | | 9,129 | |
Custodian fees (Note 3) | | | 23,970 | |
Professional fees | | | 17,522 | |
Accounting fees | | | 1,171 | |
Trustee fees | | | 1,060 | |
Other expenses | | | 8,421 | |
| | | | |
Total Expenses | | | 535,033 | |
Less: | | | | |
Expenses reimbursed by investment advisor (Note 3) | | | (37,366 | ) |
Fees paid indirectly (Note 3) | | | (631 | ) |
| | | | |
Net Expenses | | | 497,036 | |
| | | | |
Net Investment Income | | | 1,892,570 | |
| | | | |
| |
REALIZED AND UNREALIZED GAIN (LOSS) | | | | |
Net realized gain (loss) on investments | | | 84,736 | |
Net change in unrealized appreciation (depreciation) of investments | | | (6,838,556 | ) |
| | | | |
Net Realized and Unrealized Loss | | | (6,753,820 | ) |
| | | | |
Net Decrease in Net Assets Resulting from Operations | | $ | (4,861,250 | ) |
| | | | |
See notes to financial statements.
16 Certified Semi-Annual Report
| | |
| STATEMENTS OF CHANGES IN NET ASSETS | | |
| |
| Thornburg Strategic Municipal Income Fund | | |
| | | | | | | | |
| | | Six Months Ended
March 31, 2011* | | | Year Ended
September 30, 2010 | |
INCREASE (DECREASE) IN NET ASSETS FROM | | | | | | | | |
| | |
OPERATIONS: | | | | | | | | |
Net investment income | | $ | 1,892,570 | | | $ | 2,268,325 | |
Net realized gain (loss) on investments | | | 84,736 | | | | 377,353 | |
Increase (Decrease) in unrealized appreciation (depreciation) of investments | | | (6,838,556 | ) | | | 2,052,352 | |
| | | | | | | | |
| | |
Net Increase (Decrease) in Net Assets
Resulting from Operations | | | (4,861,250 | ) | | | 4,698,030 | |
| | |
DIVIDENDS TO SHAREHOLDERS: | | | | | | | | |
From net investment income | | | | | | | | |
Class A Shares | | | (663,811 | ) | | | (779,270 | ) |
Class C Shares | | | (313,384 | ) | | | (319,620 | ) |
Class I Shares | | | (912,349 | ) | | | (1,169,435 | ) |
From realized gains | | | | | | | | |
Class A Shares | | | (48,451 | ) | | | (110,997 | ) |
Class C Shares | | | (26,448 | ) | | | (40,025 | ) |
Class I Shares | | | (67,868 | ) | | | (164,754 | ) |
| | |
FUND SHARE TRANSACTIONS (NOTE 4): | | | | | | | | |
Class A Shares | | | 6,404,702 | | | | 15,636,797 | |
Class C Shares | | | 28,238 | | | | 11,167,420 | |
Class I Shares | | | 356,792 | | | | 22,636,138 | |
| | | | | | | | |
| | |
Net Increase (Decrease) in Net Assets | | | (103,829 | ) | | | 51,554,284 | |
| | |
NET ASSETS: | | | | | | | | |
Beginning of Period | | | 85,560,728 | | | | 34,006,444 | |
| | | | | | | | |
| | |
End of Period | | $ | 85,456,899 | | | $ | 85,560,728 | |
| | | | | | | | |
See notes to financial statements.
Certified Semi-Annual Report 17
| | |
| NOTES TO FINANCIAL STATEMENTS | | |
| |
| Thornburg Strategic Municipal Income Fund | | March 31, 2011 (Unaudited) |
NOTE 1 – ORGANIZATION
Thornburg Strategic Municipal Income Fund (the “Fund”) is a diversified series of Thornburg Investment Trust (the “Trust”). The Trust is organized as a Massachusetts business trust under a Declaration of Trust dated June 3, 1987 and is registered as a diversified, open-end management investment company under the Investment Company Act of 1940, as amended. The Fund is currently one of sixteen separate series of the Trust. Each series is considered to be a separate entity for financial reporting and tax purposes and bears expenses directly attributable to it. The Fund’s primary investment objective is to seek a high level of current income exempt from federal individual income tax.
The Fund currently offers three classes of shares of beneficial interest: Class A, Class C, and Institutional Class (Class I). Each class of shares of the Fund represents an interest in the same portfolio of investments, except that (i) Class A shares are sold subject to a front-end sales charge collected at the time the shares are purchased and bear a service fee, (ii) Class C shares are sold at net asset value without a sales charge at the time of purchase, but are subject to a contingent deferred sales charge upon redemption within one year of purchase, and bear both a service fee and a distribution fee, (iii) Class I shares are sold at net asset value without a sales charge at the time of purchase, and (iv) the respective classes may have different reinvestment privileges and conversion rights. Additionally, the Fund may allocate among its classes certain expenses, to the extent allowable to specific classes, including transfer agent fees, government registration fees, certain printing and postage costs, and administrative and legal expenses. Currently, class specific expenses of the Fund are limited to service and distribution fees, administration fees, and certain registration and transfer agent expenses.
NOTE 2 – SIGNIFICANT ACCOUNTING POLICIES
Significant accounting policies of the Trust are as follows:
Valuation of Investments: Debt obligations have a primary market over the counter and are valued by an independent pricing service approved by the Trustees of the Trust. The pricing service ordinarily values debt obligations at quoted bid prices. When quotations are not available, debt obligations are valued at evaluated prices determined by the pricing service using methods which include consideration of yields or prices of debt obligations of comparable quality, type of issue, coupon, maturity and rating, and indications as to value from dealers and general market conditions. Short-term obligations having remaining maturities of 60 days or less are ordinarily valued at amortized cost, which approximates market value.
In any case where a pricing service fails to provide a price for a debt obligation held by the Fund, the valuation and pricing committee determines a fair value for the obligation using procedures approved by the Trustees. Additionally, in any case where management believes that a price provided by a pricing service for a debt obligation may be unreliable, the valuation and pricing committee decides whether or not to use the pricing service’s valuation or to determine a fair value for the obligation.
In determining fair value for any portfolio security or other investment, the valuation and pricing committee seeks to determine the amount that an owner of the investment might reasonably expect to receive upon a sale of the investment. However, because fair value prices are estimated prices, the valuation and pricing committee’s determination of fair value for an investment may differ from the value that would be realized by the Fund upon a sale of the investment, and that difference could be material to the Fund’s financial statements. The valuation and pricing committee’s determination of fair value for an investment may also differ from the prices obtained by other persons (including other mutual funds) for the investment.
Valuation Measurements: Various inputs are used in determining the value of the Fund’s investments. These inputs are summarized in the three levels listed below.
Level 1: Quoted prices in active markets for identical investments.
Level 2: Other significant observable inputs (including quoted prices for similar investments, interest rates, prepayment rates, credit risk, etc.).
Level 3: Significant unobservable inputs (including the Fund’s own assumptions in determining the fair value of investments).
18 Certified Semi-Annual Report
| | |
| NOTES TO FINANCIAL STATEMENTS, CONTINUED | | |
| |
| Thornburg Strategic Municipal Income Fund | | March 31, 2011 (Unaudited) |
The following table displays a summary of the inputs used to value the Fund’s net assets as of March 31, 2011. In any instance when valuation inputs from more than one level are used to determine the fair value of a specific investment, the investment is placed in the level of the table based upon the lowest level input that is significant in determining the fair value of the investment:
| | | | | | | | | | | | | | | | |
| | | Fair Value Measurements at March 31, 2011 | |
| | | Total | | | Level 1 | | | Level 2 | | | Level 3 | |
Assets | | | | | | | | | | | | | | | | |
Investments in Securities Municipal Bonds | | $ | 83,893,729 | | | $ | — | | | $ | 83,893,729 | | | $ | — | |
| | | | | | | | | | | | | | | | |
Total Investments in Securities | | $ | 83,893,729 | | | $ | — | | | $ | 83,893,729 | | | $ | — | |
Other Notes: It is the policy of the Fund to recognize significant transfers between Levels 1 and 2 and to disclose those transfers at the last date of the reporting period. The Fund recognized no significant transfers into and out of Levels 1 and 2 during the six months ended March 31, 2011.
Federal Income Taxes: It is the policy of the Trust to comply with the provisions of the Internal Revenue Code applicable to “regulated investment companies” and to distribute to shareholders substantially all taxable (if any) and tax exempt income of the Fund. Therefore, no provision for federal income tax is required.
Management reviews each tax position believed to be material to the preparation of the Fund’s financial statements, to assess if it is more likely than not that the position would be sustained upon examination, based upon the technical merits of the position. As of March 31, 2011, management has not identified any such position for which a liability must be reflected in the Statement of Assets and Liabilities. The Fund’s tax returns remain subject to examination for three years after filing.
When-Issued and Delayed Delivery Transactions: The Fund may engage in when-issued or delayed delivery transactions. To the extent the Fund engages in such transactions, it will do so for the purpose of acquiring portfolio securities consistent with the Fund’s investment objectives and not for the purpose of investment leverage or to speculate on interest rate and/or market changes. At the time the Fund makes a commitment to purchase a security on a when-issued or delayed delivery basis, the Fund will record the transaction and reflect the value in determining its net asset value. When effecting such transactions, assets of an amount sufficient to make payment for the portfolio securities to be purchased will be segregated on the Fund’s records on the trade date. Securities purchased on a when-issued or delayed delivery basis do not earn interest until the settlement date.
Dividends: Net investment income of the Fund is declared daily as a dividend on shares for which the Fund has received payment. Dividends are paid monthly and are reinvested in additional shares of the Fund at net asset value per share at the close of business on the dividend payment date, or at the shareholder’s option, paid in cash. Net realized capital gains, to the extent available, will be distributed at least annually.
General: Securities transactions are accounted for on a trade date basis. Interest income is accrued as earned. Premiums and discounts on securities purchased are amortized to call dates or maturity dates of the respective securities. Realized gains and losses from the sale of securities are recorded on an identified cost basis. Net investment income (other than class specific expenses) and realized and unrealized gains and losses are allocated daily to each class of shares based upon the relative net asset value of outstanding shares (or the value of the dividend-eligible shares, as appropriate) of each class of shares at the beginning of the day (after adjusting for the current capital shares activity of the respective class). Expenses common to all Funds are allocated among the Funds comprising the Trust based upon their relative net asset values or other appropriate allocation methods.
Guarantees and Indemnifications: Under the Trust’s organizational documents, its officers and Trustees are indemnified against certain liabilities arising out of the performance of their duties to the Fund. Additionally, in the normal course of business the Trust enters into contracts with service providers that contain general indemnification clauses. The Trust’s maximum exposure under these arrangements is unknown. However, based on experience, the Trust expects the risk of loss to be remote.
Use of Estimates: The preparation of financial statements, in conformity with generally accepted accounting principles, requires management to make estimates and assumptions that affect the reported amounts of assets and liabilities and the disclosure of contingent
Certified Semi-Annual Report 19
| | |
| NOTES TO FINANCIAL STATEMENTS, CONTINUED | | |
| |
| Thornburg Strategic Municipal Income Fund | | March 31, 2011 (Unaudited) |
assets and liabilities at the date of the financial statements and the reported amounts of increases and decreases in net assets from operations during the reporting period. Actual results could differ from those estimates.
NOTE 3 – INVESTMENT ADVISORY FEE AND OTHER TRANSACTIONS WITH AFFILIATES
Pursuant to an investment advisory agreement, Thornburg Investment Management, Inc. (the “Advisor”) serves as the investment advisor and performs services to the Fund for which the fees are payable at the end of each month. For the six months ended March 31, 2011, these fees were payable at annual rates ranging from .75 of 1% to .50 of 1% per annum of the average daily net assets of the Fund depending on the Fund’s asset size. The Trust also has entered into administrative services agreements with the Advisor, whereby the Advisor will perform certain administrative services for the shareholders of each class of the Fund’s shares, and for which fees will be payable at an annual rate of up to .125 of 1% per annum of the average daily net assets attributable to each class of shares. For the six months ended March 31, 2011, the Advisor contractually reimbursed certain class specific expenses and administrative fees of $16,069 for Class A shares, $17,283 for Class C shares and $4,014 for Class I shares.
The Trust has an underwriting agreement with Thornburg Securities Corporation (the “Distributor,” an affiliate of the Advisor), which acts as the distributor of the Fund’s shares. For the six months ended March 31, 2011, the Distributor has advised the Fund that it earned net commissions aggregating $855 from the sale of Class A shares, and collected contingent deferred sales charges aggregating $2,723 from redemptions of Class C shares of the Fund.
Pursuant to a service plan under Rule 12b-1 of the Investment Company Act of 1940, the Fund may reimburse to the Advisor an amount not to exceed .25 of 1% per annum of the average daily net assets attributable to each class of shares of the Fund for payments made by the Advisor to securities dealers and other financial institutions to obtain various shareholder and distribution related services. For the six months ended March 31, 2011, there were no 12b-1 service plan fees charged for Class I shares. The Advisor may pay out of its own resources additional expenses for distribution of the Fund’s shares.
The Trust has also adopted distribution plans pursuant to Rule 12b-1, applicable only to the Fund’s Class C shares, under which the Fund compensates the Distributor for services in promoting the sale of Class C shares of the Fund at an annual rate of up to .35 of 1% per annum of the average daily net assets attributable to Class C shares. Total fees incurred by the Distributor for each class of shares of the Fund under their respective Service and Distribution Plans for the six months ended March 31, 2011, are set forth in the Statement of Operations.
The Trust has an agreement with the custodian bank to indirectly pay a portion of the custodian’s fees through credits earned by the Fund’s cash on deposit with the bank. This deposit agreement is an alternative to overnight investments. Custodial fees have been adjusted to reflect amounts that would have been paid without this agreement, with a corresponding adjustment reflected as fees paid indirectly in the Statement of Operations. For the six months ended March 31, 2011, fees paid indirectly were $631.
Certain officers and Trustees of the Trust are also officers and/or directors of the Advisor and Distributor. The compensation of independent Trustees is borne by the Trust.
NOTE 4 – SHARES OF BENEFICIAL INTEREST
At March 31, 2011, there were an unlimited number of shares of beneficial interest authorized. Transactions in shares of beneficial interest were as follows:
| | | | | | | | | | | | | | | | |
| | | Six Months Ended
March 31, 2011
(Unaudited) | | | Year Ended
September 30, 2010
(Audited) | |
| | | Shares | | | Amount | | | Shares | | | Amount | |
Class A Shares | | | | | | | | | | | | | | | | |
Shares sold | | | 909,071 | | | $ | 12,194,636 | | | | 1,292,244 | | | $ | 17,833,733 | |
Shares issued to shareholders in reinvestment of dividends | | | 41,389 | | | | 554,323 | | | | 53,595 | | | | 735,252 | |
Shares repurchased | | | (477,169 | ) | | | (6,344,257 | ) | | | (213,606 | ) | | | (2,932,188 | ) |
| | | | | | | | | | | | | | | | |
| | | | |
Net Increase (Decrease) | | | 473,291 | | | $ | 6,404,702 | | | | 1,132,233 | | | $ | 15,636,797 | |
| | | | | | | | | | | | | | | | |
20 Certified Semi-Annual Report
| | |
| NOTES TO FINANCIAL STATEMENTS, CONTINUED | | |
| |
| Thornburg Strategic Municipal Income Fund | | March 31, 2011 (Unaudited) |
| | | | | | | | | | | | | | | | |
| | | Six Months Ended
March 31, 2011
(Unaudited) | | | Year Ended
September 30, 2010
(Audited) | |
| | | Shares | | | Amount | | | Shares | | | Amount | |
Class C Shares | | | | | | | | | | | | | | | | |
Shares sold | | | 360,655 | | | $ | 4,898,638 | | | | 893,854 | | | $ | 12,358,292 | |
Shares issued to shareholders in reinvestment of dividends | | | 15,333 | | | | 205,724 | | | | 16,955 | | | | 233,302 | |
Shares repurchased | | | (382,561 | ) | | | (5,076,124 | ) | | | (104,152 | ) | | | (1,424,174 | ) |
| | | | | | | | | | | | | | | | |
| | | | |
Net Increase (Decrease) | | | (6,573 | ) | | $ | 28,238 | | | | 806,657 | | | $ | 11,167,420 | |
| | | | | | | | | | | | | | | | |
| | | | |
Class I Shares | | | | | | | | | | | | | | | | |
Shares sold | | | 1,004,053 | | | $ | 13,322,492 | | | | 1,714,923 | | | $ | 23,915,174 | |
Shares issued to shareholders in reinvestment of dividends | | | 57,429 | | | | 770,272 | | | | 73,042 | | | | 1,003,621 | |
Shares repurchased | | | (1,033,247 | ) | | | (13,735,972 | ) | | | (165,161 | ) | | | (2,282,657 | ) |
| | | | | | | | | | | | | | | | |
| | | | |
Net Increase (Decrease) | | | 28,235 | | | $ | 356,792 | | | | 1,622,804 | | | $ | 22,636,138 | |
| | | | | | | | | | | | | | | | |
NOTE 5 – SECURITIES TRANSACTIONS
For the six months ended March 31, 2011, the Fund had purchase and sale transactions of investment securities (excluding short-term investments) of $25,324,373 and $12,742,189, respectively.
NOTE 6 – INCOME TAXES
At March 31, 2011, information on the tax components of capital is as follows:
| | | | |
Cost of investments for tax purposes | | $ | 85,767,323 | |
| | | | |
Gross unrealized appreciation on a tax basis | | $ | 1,514,592 | |
Gross unrealized depreciation on a tax basis | | | (3,388,186 | ) |
| | | | |
Net unrealized appreciation (depreciation) on investments (tax basis) | | $ | (1,873,594 | ) |
| | | | |
OTHER NOTES
Fund management believes no events have occurred between March 31, 2011 and May 20, 2011, the date of issuance of the financial statements, which require adjustment of, or disclosure in, the accompanying financial statements.
Certified Semi-Annual Report 21
FINANCIAL HIGHLIGHTS
Thornburg Strategic Municipal Income Fund
| | | | | | | | | | | | | | | | | | | | | | | | | | | | | | | | | | | | | | | | | | | | | | | | | | | | | | | | | | | | |
| | | PER SHARE PERFORMANCE (for a share outstanding throughout the period)+ | | | RATIOS TO AVERAGE NET ASSETS | | | SUPPLEMENTAL DATA | |
Unless
Otherwise
Noted,
Periods
are
Fiscal
Years
Ended
Sept. 30, | | Net Asset
Value
Beginning
of
Period | | | Net
Investment
Income
(Loss) | | | Net
Realized
&
Unrealized
Gain
(Loss)
on
Investments | | | Total from
Investment
Operations | | | Dividends
from Net
Investment
Income | | | Dividends
from Net
Realized
Gains | | | Total
Dividends | | | Net
Asset
Value
End
of
Period | | | Net
Investment
Income
(Loss) (%) | | | Expenses,
After
Expense
Reductions
(%) | | | Expenses,
After
Expense
Reductions
and
Net of
Custody
Credits
(%) | | | Expenses,
Before
Expense
Reductions
(%) | | | Total
Return
(%)(a) | | | Portfolio
Turnover
Rate (%) | | | Net
Assets at
End
of
Period
(Thousands) | |
Class A Shares | | | | | | | | | | | | | | | | | | | | | | | | | | | | | | | | | |
2011(b)(c) | | $ | 14.22 | | | | 0.30 | | | | (1.08 | ) | | | (0.78 | ) | | | (0.30 | ) | | | (0.02 | ) | | | (0.32 | ) | | $ | 13.12 | | | | 4.44 | (d) | | | 1.25 | (d) | | | 1.25 | (d) | | | 1.36 | (d) | | | (5.51 | ) | | | 15.69 | | | $ | 32,201 | |
2010(c) | | $ | 13.86 | | | | 0.60 | | | | 0.48 | | | | 1.08 | | | | (0.61 | ) | | | (0.11 | ) | | | (0.72 | ) | | $ | 14.22 | | | | 4.40 | | | | 1.25 | | | | 1.25 | | | | 1.50 | | | | 8.20 | | | | 16.26 | | | $ | 28,166 | |
2009(c)(e) | | $ | 11.94 | | | | 0.29 | | | | 1.91 | | | | 2.20 | | | | (0.28 | ) | | | — | | | | (0.28 | ) | | $ | 13.86 | | | | 4.71 | (d) | | | 1.25 | (d) | | | 1.25 | (d) | | | 2.92 | (d) | | | 18.65 | | | | 14.37 | | | $ | 11,761 | |
| | | | | | | |
Class C Shares | | | | | | | | | | | | | | | | | | | | | | | | | | | | | |
2011(b) | | $ | 14.23 | | | | 0.28 | | | | (1.08 | ) | | | (0.80 | ) | | | (0.28 | ) | | | (0.02 | ) | | | (0.30 | ) | | $ | 13.13 | | | | 4.12 | (d) | | | 1.55 | (d) | | | 1.55 | (d) | | | 1.78 | (d) | | | (5.65 | ) | | | 15.69 | | | $ | 13,996 | |
2010 | | $ | 13.87 | | | | 0.55 | | | | 0.49 | | | | 1.04 | | | | (0.57 | ) | | | (0.11 | ) | | | (0.68 | ) | | $ | 14.23 | | | | 4.05 | | | | 1.55 | | | | 1.55 | | | | 2.36 | | | | 7.88 | | | | 16.26 | | | $ | 15,261 | |
2009(e) | | $ | 11.94 | | | | 0.27 | | | | 1.93 | | | | 2.20 | | | | (0.27 | ) | | | — | | | | (0.27 | ) | | $ | 13.87 | | | | 4.40 | (d) | | | 1.55 | (d) | | | 1.55 | (d) | | | 6.40 | (d)(f) | | | 18.58 | | | | 14.37 | | | $ | 3,684 | |
| | | | | | | |
Class I Shares | | | | | | | | | | | | | | | | | | | | | | | | | | | | | |
2011(b) | | $ | 14.23 | | | | 0.31 | | | | (1.07 | ) | | | (0.76 | ) | | | (0.32 | ) | | | (0.02 | ) | | | (0.34 | ) | | $ | 13.13 | | | | 4.68 | (d) | | | 0.99 | (d) | | | 0.98 | (d) | | | 1.01 | (d) | | | (5.38 | ) | | | 15.69 | | | $ | 39,260 | |
2010 | | $ | 13.87 | | | | 0.64 | | | | 0.48 | | | | 1.12 | | | | (0.65 | ) | | | (0.11 | ) | | | (0.76 | ) | | $ | 14.23 | | | | 4.66 | | | | 0.99 | | | | 0.99 | | | | 1.11 | | | | 8.48 | | | | 16.26 | | | $ | 42,134 | |
2009(e) | | $ | 11.94 | | | | 0.31 | | | | 1.92 | | | | 2.23 | | | | (0.30 | ) | | | — | | | | (0.30 | ) | | $ | 13.87 | | | | 4.90 | (d) | | | 0.99 | (d) | | | 0.99 | (d) | | | 2.12 | (d) | | | 18.87 | | | | 14.37 | | | $ | 18,561 | |
| (a) | Not annualized for periods less than one year. |
| (b) | Unaudited Six Month Period Ended March 31. |
| (c) | Sales loads are not reflected in computing total return. |
| (e) | Fund commenced operations on April 1, 2009. |
| (f) | Due to the size of net assets and fixed expenses, ratios may appear disproportionate. |
| + | Based on weighted average shares outstanding. See notes to financial statements. |
| | |
| 22 Certified Semi-Annual Report | | Certified Semi-Annual Report 23 |
| | |
| EXPENSE EXAMPLE | | |
| |
| Thornburg Strategic Municipal Income Fund | | March 31, 2011 (Unaudited) |
As a shareholder of the Fund, you incur two types of costs:
| | (1) | transaction costs, including |
(a) sales charges (loads) on purchase payments, for Class A shares;
(b) a deferred sales charge on redemptions of any part or all of a purchase of $1 million of Class A shares within 12 months of purchase;
(c) a deferred sales charge on redemptions of Class C shares within 12 months of purchase;
| | (2) | ongoing costs, including management fees; distribution and/or service (12b-1) fees; and other Fund expenses. |
This example is intended to help you understand your ongoing costs (in dollars) of investing in the Fund and to compare these costs with the ongoing costs of investing in other mutual funds.
The example is based on a $1,000 investment beginning on October 1, 2010, and held until March 31, 2011.
ACTUAL EXPENSES
For each class of shares, the first line of the table at right provides information about actual account values and actual expenses. You may use the information in this line, together with the amount you invested, to estimate the expenses that you paid over the period. Simply divide your account value by $1,000 (for example, an $8,600 account value divided by $1,000 = 8.6), then multiply the result by the number in the first line for your class of shares under the heading entitled “Expenses Paid During Period” to estimate the expenses you paid on your account during this period.
HYPOTHETICAL EXAMPLE FOR COMPARISON PURPOSES
For each class of shares, the second line of the table at right provides information about hypothetical account values and hypothetical expenses based on the Fund’s actual expense ratio and an assumed rate of return of 5% per year before expenses, which is not the Fund’s actual return. The hypothetical account values and expenses may not be used to estimate the actual ending account balance or expenses you paid for the period. You may use this information to compare the ongoing costs of investing in the Fund and other funds. To do so, compare this 5% hypothetical example with the 5% hypothetical examples that appear in the shareholder reports of the other funds.
| | | | | | | | | | | | |
| | | Beginning
Account Value
10/1/10 | | | Ending
Account Value
3/31/11 | | | Expenses Paid
During Period†
10/1/10–3/31/11 | |
Class A Shares | | | | | | | | | | | | |
Actual | | $ | 1,000.00 | | | $ | 944.90 | | | $ | 6.06 | |
Hypothetical* | | $ | 1,000.00 | | | $ | 1,018.70 | | | $ | 6.29 | |
Class C Shares | | | | | | | | | | | | |
Actual | | $ | 1,000.00 | | | $ | 943.50 | | | $ | 7.51 | |
Hypothetical* | | $ | 1,000.00 | | | $ | 1,017.20 | | | $ | 7.79 | |
Class I Shares | | | | | | | | | | | | |
Actual | | $ | 1,000.00 | | | $ | 946.20 | | | $ | 4.77 | |
Hypothetical* | | $ | 1,000.00 | | | $ | 1,020.03 | | | $ | 4.95 | |
| † | Expenses are equal to the annualized expense ratio for each class (A: 1.25%; C: 1.55%; I: 0.98%) multiplied by the average account value over the period, multiplied by 182/365 to reflect the one-half year period. |
| * | Hypothetical assumes a rate of return of 5% per year before expenses. |
Please note that the expenses shown in the table are meant to highlight your ongoing costs only and do not reflect any transactional costs, such as sales charges (loads), redemption fees, or exchange fees. Therefore, the second line of the table for each class of shares is useful in comparing ongoing costs only, and will not help you determine the relative total costs of owning different funds. In addition, if these transactional costs were included, your costs would have been higher.
24 Certified Semi-Annual Report
| | |
| OTHER INFORMATION | | |
| |
| Thornburg Strategic Municipal Income Fund | | March 31, 2011 (Unaudited) |
PORTFOLIO PROXY VOTING
Policies and Procedures:
The Trust has delegated to Thornburg Investment Management, Inc. (the “Advisor”) voting decisions respecting proxies for the Fund’s voting securities. The Advisor makes voting decisions in accordance with its Proxy Voting Policy and Procedures. A description of the Policy and Procedures is available (i) without charge, upon request, by calling the Advisor toll-free at 1-800-847-0200, (ii) on the Thornburg website at www.thornburg.com, and (iii) on the Securities and Exchange Commission’s website at www.sec.gov.
Information regarding how proxies were voted is available on or before August 31 of each year for the twelve months ending the preceding June 30. This information is available (i) without charge, upon request by calling the Advisor toll-free at 1-800-847-0200, (ii) on the Thornburg website at www.thornburg.com, and (iii) on the Securities and Exchange Commission’s website at www.sec.gov.
AVAILABILITY OF QUARTERLY PORTFOLIO SCHEDULE
The Fund files with the Securities and Exchange Commission schedules of its portfolio holdings on Form N-Q for the first and third quarters of each fiscal year. The Fund’s Forms N-Q are available on the Commission’s website at www.sec.gov, or may be reviewed and copied at the Commission’s Public Reference Room in Washington, D.C. Information on the operation of the Public Reference Room may be obtained by calling 1-800-SEC-0330. The Fund also makes this information available on its website at www.thornburg.com/ download or upon request by calling 1-800-847-0200.
Certified Semi-Annual Report 25
Trustees’ Statement to Shareholders
Not part of the Certified Semi-Annual Report
February 8, 2005, as readopted September 13, 2010
The Trustees are concerned that ongoing commentaries and opinions reported in the media may confuse investors in general as to the supervisory duties of trustees of mutual funds and, in particular, leave Thornburg Investment Trust shareholders uncertain regarding how we discharge our responsibilities in supervising the Funds’ investment advisor and in reviewing the advisor’s contract for renewal. We decided to spell out clearly three principal guidelines that we follow in supervising the Trust’s investment advisor on your behalf.
We begin with the premise that each shareholder selected his or her Fund because its investments are managed by the investment advisor identified in the prospectus and in accordance with the objective and policies described in the prospectus. We realize, as each of you do, that if you believe that your Fund’s stated objective and policies no longer serve your personal investment goals, you can sell your shares and leave the Fund.
Therefore, we believe that our primary supervisory task – our principal obligation to you – is to assess the nature and quality of the advisor’s services, and to confirm that the advisor actively and competently pursues the Fund’s objective, in accordance with the policies set out in the prospectus. To do this, we meet regularly with management to review your Fund’s portfolio and to discuss the advisor’s specific actions and judgments in pursuing the Fund’s objective. We do not substitute our own judgment for the advisor’s decisions in selecting investments; the advisor is paid to exercise its informed judgment on investment decisions, and we seek to confirm, in reviewing the advisor’s performance, that the advisor is doing just that.
Second, while we are conscious of costs and the effect that costs have on shareholders’ returns, we do not seek the lowest fees or expense ratio as our sole or primary objective. We try to make sure that your Fund’s fees and costs are reasonable in relationship to the services rendered and that they are generally in line with those charged by other expert investment advisors, consistent with our belief that the Fund’s investors searched for and expect that expertise and attention and have decided to pay a reasonable price for it. We do not put the management contract “out to bid” as a matter of course, and we would not do so unless we had concluded that the advisor materially had failed to pursue the Fund’s objectives in accordance with its policies, or for other equally important reasons. We believe that any other approach would be inconsistent with your interests and contrary to your expectations when you bought shares of the Fund in the first place.
Finally, because we believe that most Thornburg Fund shareholders have invested with a long-term perspective, we try not to focus too much on the fashions of the moment and on short-term performance. The market will not favor any specific investment objective or set of policies at all times and under all economic circumstances. A fund will experience periods of both high and low returns relative to other funds and other investments. Even if one of our Funds is not favored by the market at a particular time, we believe that the advisor is nonetheless obliged to remain true to the Fund’s objective and policies, and we watch to see that it does so.
26 This page is not part of the Semi-Annual Report.
Retirement and Education Accounts
Thornburg Investment Management offers retirement and education savings accounts that can help you meet a variety of planning challenges. For account applications or further information on any of the accounts below, please call 1-800-847-0200 or go to www.thornburg.com/ira. Your financial advisor can help you determine which plan is right for you.
Individual Retirement Accounts
Individual Retirement Accounts (IRAs) provide a tax-advantaged means to save money for the future. For a detailed outline of the difference between retirement accounts, see www.thornburg.com/ira. Rollovers are available. Call 1-800-847-0200 for more information.
Traditional IRAs – Contributions to Traditional IRAs are tax deductible for eligible individuals, and withdrawals are taxed as additional ordinary income. You may contribute to an IRA if you receive compensation and are under 70 1/2, even if you are covered by an employer retirement plan. Deductible contributions are subject to certain qualifications. Please consult your tax advisor.
Roth IRAs – Under a Roth IRA, there is no tax deduction for contributions, but there is no income tax on qualified withdrawals. For a more detailed comparison of Traditional and Roth IRAs, please see our web site at www.thornburg.com/ira.
SEP IRAs – Simplified Employee Pension (SEP) IRAs are established by employers. The employer is allowed a tax deduction for contributions made to the SEP Plan and makes contributions to each eligible employee’s SEP IRA on a discretionary basis.
SIMPLE IRAs – Savings Incentive Match Plan for Employees of Small Employers (SIMPLE) is designed to give small business owners a simplified method to establish and contribute to a retirement plan for employees. The employer is allowed a tax deduction for contributions and makes either matching or non-elective contributions to each eligible employee’s SIMPLE IRA. Employees may make salary deferral contributions.
Coverdell Education Savings Account
These savings accounts are designed to provide a way to save money for higher education expenses. In an Education Savings Account, earnings and interest grow tax-free, and qualified withdrawals used to pay for eligible higher-education expenses are tax- and penalty-free.
Funds Available
The following funds are available in the accounts listed above:
| | • | | Thornburg International Value Fund |
| | • | | Thornburg Core Growth Fund |
| | • | | Thornburg Investment Income Builder Fund |
| | • | | Thornburg Global Opportunities Fund |
| | • | | Thornburg International Growth Fund |
| | • | | Thornburg Developing World Fund |
| | • | | Thornburg Limited Term U.S. Government Fund |
| | • | | Thornburg Limited Term Income Fund |
| | • | | Thornburg Strategic Income Fund |
This page is not part of the Semi-Annual Report. 27

Thornburg Equity Funds
Thornburg’s equity research uses a fundamental and comprehensive analytical approach. Thornburg equity funds focus on a limited number of securities so that each holding can impact performance. The equity team searches for firms believed to have a promising future and seeks to buy shares of those companies at a discount to their intrinsic value.
| | • | | Thornburg International Value Fund |
| | • | | Thornburg Core Growth Fund |
| | • | | Thornburg Investment Income Builder Fund |
| | • | | Thornburg Global Opportunities Fund |
| | • | | Thornburg International Growth Fund |
| | • | | Thornburg Developing World Fund |
Thornburg Bond Funds
Thornburg Investment Management applies a disciplined philosophy to fixed-income management. Since the launch of our first fixed-income fund over 25 years ago, we have been conducting fundamental, bottom-up research in an effort to identify bonds which we believe provide the best return for a given level of risk. We are very organic in our approach, avoiding leverage or complex strategies which could backfire in periods of market uncertainty.
| | • | | Thornburg Limited Term Municipal Fund |
| | • | | Thornburg Intermediate Municipal Fund |
| | • | | Thornburg California Limited Term Municipal Fund |
| | • | | Thornburg New Mexico Intermediate Municipal Fund |
| | • | | Thornburg New York Intermediate Municipal Fund |
| | • | | Thornburg Strategic Municipal Income Fund |
| | • | | Thornburg Limited Term U.S. Government Fund |
| | • | | Thornburg Limited Term Income Fund |
| | • | | Thornburg Strategic Income Fund |
Before investing, carefully consider the Fund’s investment goals, risks, charges, and expenses. For a prospectus containing this and other information, contact your financial advisor or visit thornburg.com. Read it carefully before investing.
For additional information, please visit www.thornburg.com
Thornburg Investment Management, Inc. 2300 North Ridgetop Road, Santa Fe, NM 87506
This page is not part of the Semi-Annual Report. 29
This page intentionally left blank.
30 This page is not part of the Semi-Annual Report.
This page intentionally left blank.
This page is not part of the Semi-Annual Report. 31
| | | | | | |
 | | Waste not, Wait not | |  |
| | |
| | |
| | | | Get instant access to your shareholder reports. |
| | |
| | This Semi-Annual Report is submitted for the general information of shareholders of the Fund. It is not authorized for distribution to prospective investors in the Fund unless preceded or accompanied by an effective prospectus. | | By switching from your postal mailbox to your email inbox, you reduce paper clutter, improve record keeping access, and help conserve our natural resources. |
| | |
 | | Investment Advisor: Thornburg Investment Management® 800.847.0200 | | Go to www.thornburg.com/edelivery and sign up to receive your shareholder reports, prospectuses, and proxy statements electronically. |
| | Distributor: Thornburg Securities Corporation® 800.847.0200 | | You invest in the future, without spending a dime. |
| | TH1979 | | | | |

Important Information
The information presented on the following pages is current as of March 31, 2011. The managers’ views, portfolio holdings, and sector diversification are provided for the general information of the Fund’s shareholders; they are historical and subject to change. This material should not be deemed a recommendation to buy or sell any of the securities mentioned.
Investments in the Fund carry risks, including possible loss of principal. Bond funds have the same interest rate, inflation, and credit risks that are associated with the underlying bonds. The principal value of bonds will fluctuate relative to changes in interest rates, decreasing when interest rates rise. Unlike bonds, bond funds have ongoing fees and expenses. Please see the Fund’s Prospectus for a discussion of the risks associated with an investment in the Fund. Investments in the Fund are not FDIC insured, nor are they deposits of or guaranteed by a bank or any other entity. There is no guarantee that the Fund will meet its investment objectives. The laddering strategy does not assure or guarantee better performance and cannot eliminate the risk of investment losses.
Performance data given at net asset value (NAV) does not take into account applicable sales charges. If the sales charges had been included, the performance would have been lower. Minimum investments for Class I shares are higher than those for other classes. Class I shares may not be available to all investors.
| | | | |
Share Class | | NASDAQ Symbol | | Cusip |
Class A | | LTCAX | | 885-215-426 |
Class C | | LTCCX | | 885-215-418 |
Class I | | LTCIX | | 885-215-392 |
Glossary
Barclays Capital Five-Year Municipal Bond Index – A rules-based, market-value-weighted index of the tax-exempt bond market. To be included in the index, bonds must have a minimum credit rating of Baa. The approximate maturity of the municipal bonds in the index is five years.
Barclays Capital Municipal Bond Index – The Municipal Index covers the USD-denominated, investment-grade, long-term, tax-exempt bond market. The index has four main sectors: state and local general obligation bonds, revenue bonds, insured bonds, and prerefunded bonds.
Unless otherwise noted, index returns reflect the reinvestment of income dividends and capital gains, if any, but do not reflect fees, brokerage commissions or other expenses of investing. Investors may not make direct investments into any index.
Alternative Minimum Tax (AMT) – A federal tax aimed at ensuring that high-income individuals, estates, trusts, and corporations pay a minimal level income tax. For individuals, the AMT is calculated by adding tax preference items to regular taxable income.
Annualized Distribution Yield – The distribution yield is calculated by taking the sum of the month’s total distribution factors and dividing this sum by a 30-day period and annualizing to a 360-day year. The value is then divided by the ending maximum offering price per share to arrive at the annualized distribution yield. The yield is calculated on a periodic basis and is subject to change.
Basis Point (BPS) – A unit equal to 1/100th of 1%. 1% = 100 basis points (bps).
Bond Credit Ratings – A bond credit rating assesses the financial ability of a debt issuer to make timely payments of principal and interest. Ratings of AAA (the highest), AA, A, and BBB are investment-grade quality. Ratings of BB, B, CCC, CC, C, and D (the lowest) are considered below investment grade, speculative grade, or junk bonds. Unless otherwise noted, the ratings listed are from Municipal Market Data and are a combination of ratings from Standard and Poor’s, Moody’s Investors Service, and Fitch Ratings.
Build America Bonds (BAB) – Taxable municipal bonds that feature tax credits and/or federal subsidies for bondholders and state and local government bond issuers. Build America Bonds (BABs) were introduced in 2009 as part of President Obama’s American Recovery and Reinvestment Act to create jobs and stimulate the economy. BABs attempt to achieve this by lowering the cost of borrowing for state and local governments in financing new projects.
Capacity Utilization – The extent to which an enterprise or a nation actually uses its installed productive capacity. Capacity utilization reflects overall growth and demand in the economy, rising when the economy is vibrant, and falling when demand softens. High capacity utilization also exerts inflationary pressures as scarce resources are in higher demand. However, it may also lead to new capital investments, such as new plants, that promote growth in the future.
Consumer Price Index (CPI) – An index that measures prices of a fixed basket of goods bought by a typical consumer, including food, transportation, shelter, utilities, clothing, medical care, entertainment and other items. The CPI, published by the Bureau of Labor Statistics in the
This page is not part of the Semi-Annual Report. 3
Important Information, Continued
Department of Labor, is based at 100 in 1982 and is released monthly. It is widely used as a cost-of-living benchmark to adjust Social Security payments and other payment schedules, union contracts and tax brackets. The CPI is also known as the cost-of-living index.
Core CPI – Consumer Price Index minus the energy and food components.
Effective Duration – A bond’s sensitivity to interest rates, incorporating the embedded option features, such as call provisions. Bonds with longer durations experience greater price volatility than bonds with shorter durations.
Fed Funds Rate – The interest rate at which a depository institution lends immediately available funds (balances at the Federal Reserve) to another depository institution overnight.
General Obligation Bond – A municipal bond backed by the credit and “taxing power” of the issuing jurisdiction rather than the revenue from a given project.
M2 – The amount of money in circulation in notes and coin plus non-interest-bearing bank deposits, building-society deposits, and National Savings accounts.
QE2 or Quantitative Easing 2 – The second round of the Federal Reserve’s monetary policy used to stimulate the U.S. economy following the recession that began in 2007/08. QE2 was initiated in the fourth quarter of 2010 in order to jump-start the sluggish economic recovery.
SEC Yield – SEC Yield is computed in accordance with SEC standards measuring the net investment income per share over a specified 30-day period expressed as a percentage of the maximum offering price of the Fund’s shares at the end of the period.
Taylor Rule – A monetary-policy formula that provides an indication of how much the central bank would or should change the nominal interest rate in response to divergences of actual inflation rates from target inflation rates and of actual Gross Domestic Product (GDP) from potential GDP. It was first proposed by the U.S. economist John B. Taylor in 1993. The Federal Reserve Board may not use the Taylor Rule in setting monetary policy.
Treasury Inflation Protected Securities (TIPS) – Either a U.S. Treasury note or bond that offers protection from the effects of inflation. Using the Consumer Price Index as a guide, the value of the principal is adjusted to reflect the effects of inflation. A fixed interest rate is paid semi-annually on the adjusted amount. At maturity, if inflation has increased the value of the principal, the investor receives the higher value. If deflation has decreased the value, the investor receives the original face amount of the security.
4 This page is not part of the Semi-Annual Report.
Thornburg California Limited Term Municipal Fund
At Thornburg, our approach to management of the Fund is based on the premise that investors in the Fund seek preservation of capital along with an attractive, relatively stable yield. While aggressive bond strategies may generate stronger returns when the market is turning a blind eye towards risk, they usually fail to stack up over longer periods of time.
We apply time-tested techniques to manage risk and provide attractive returns. These include:
| | • | | Building a laddered portfolio. Laddering has been shown over time to mitigate price and interest rate risk. |
| | • | | Investing on a cash-only basis without using leverage. While leveraged strategies may enhance returns when market conditions are favorable, they can quickly compound losses when sentiment shifts. |
| | • | | Conducting in-depth fundamental research on each issue and actively monitoring positions for subsequent credit events. |
| | • | | Diversifying among a large number of generally high-quality bonds. |
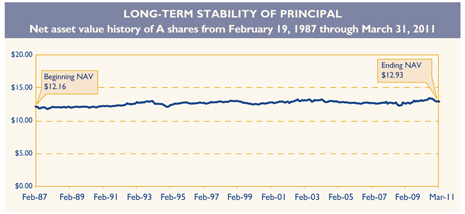
IMPORTANT
PERFORMANCE INFORMATION
Performance data shown represents past performance and is no guarantee of future results. Investment return and principal value will fluctuate so shares, when redeemed, may be worth more or less than their original cost. Current performance may be lower or higher than quoted. For performance current to the most recent month end, visit thornburg.com or call 800.847.0200.
The maximum sales charge for the Fund’s Class A shares is 1.50%. The total annual fund operating expense of Class A shares is 0.97%, as disclosed in the most recent Prospectus.
AVERAGE ANNUAL TOTAL RETURNS
For periods ended March 31, 2011
| | | | | | | | | | | | | | | | | | | | |
| | | 1 Yr | | | 3 Yrs | | | 5 Yrs | | | 10 Yrs | | | Since
Inception | |
A Shares (Incep: 2/19/87) | | | | | | | | | | | | | | | | | | | | |
Without sales charge | | | 1.94 | % | | | 3.66 | % | | | 3.68 | % | | | 3.26 | % | | | 4.66 | % |
With sales charge | | | 0.40 | % | | | 3.15 | % | | | 3.37 | % | | | 3.10 | % | | | 4.59 | % |
30-DAY YIELDS, A SHARES
As of March 31, 2011
| | |
Annualized
Distribution Yield | | SEC Yield |
2.75% | | 2.36% |
KEY PORTFOLIO ATTRIBUTES
As of March 31, 2011
| | | | |
Number of Bonds | | | 173 | |
Effective Duration | | | 3.9Yrs | |
Average Maturity | | | 5.0Yrs | |
See the entire portfolio in the Schedule of Investments beginning on page 10.
This page is not part of the Semi-Annual Report. 5

Thornburg California Limited Term Municipal Fund
March 31, 2011
This report is certified under the Sarbanes-Oxley Act of 2002, which requires that public companies, including mutual funds, affirm that the information provided in their annual and semiannual shareholder reports fully and fairly represents their financial position.
6 Certified Semi-Annual Report
Letter to Shareholders
| | |
| |
 | | April 13, 2011 Dear Shareholder: We are pleased to present the semi-annual report for the Thornburg California Limited Term Municipal Fund. The net asset value (NAV) of the Class A shares declined from $13.38 to $12.93 during the six months ended March 31, 2011. If you were invested with us for the entire period, you received dividends of 18.0 cents per share. If you reinvested your dividends, you received 18.1 cents per share. Dividends per share were lower for Class C shares and higher for Class I shares to account for varying class-specific expenses. |
| |
 | | The first quarter of 2011 witnessed a supply lull in the municipal bond market, delivering the lightest quarter for new deals in eleven years. It followed a huge volume of deals that were brought to market in the last quarter of 2010. In addition to the light new deal calendar in the first quarter of 2011, average daily trading volume was low, measuring $11.6 billion, down 15% from the prior year. |
| | Credit spreads on the California state general obligation (GO), a bellwether bond, have tightened in recent months to about 90 basis points, or 0.90%, indicating that investors’ confidence in the state’s credit has grown, despite a $19 billion current year budget deficit. The spread tightening may reflect positive news that has emerged from the office of the state controller for the period ended in March 2011 showing General Fund revenues were above budget by 1.5%, and that compared to this date in the prior year, revenues were up 7.8%. It appears that a slow, bumpy recovery is in progress, though parts of the state remain mired in sharply reduced home prices and excessive unemployment. We are still concerned that the governor and the legislature have been unable to agree on a plan to address California’s long-term challenges. |
| |
 | | Today, conditions in the municipal bond market are characterized by low yields for short-term bonds, combined with a steep yield curve (the difference between long- and short-term interest rates), resulting in relatively more attractive yields for intermediate- and long-term bonds. Today’s municipal yield curve is the steepest in 20 years. In the last six months, rates rose, shifting upward by 56 basis points for five-year maturities and by 81 basis points for ten-year maturities. This additional steepening of the yield curve caused longer maturity municipal bond funds to underperform shorter maturity municipal bond funds. Credit spreads are wide, relative to historical averages, with single-A municipal bonds paying on average 110 basis points more than AAA bonds at the end of March 2011. |
| | Municipal bond fund investors have been in redemption mode for the past six months, following approximately 22 months of net inflows into municipal bond funds that reversed in late November 2010. Large market outflows were prompted by default fears and falling mutual fund NAVs, but since January 2011, these concerns have abated somewhat. At this point, bond fund outflows industry wide have slowed from a peak of almost $4 billion weekly to around $500 million as this is written. |
Certified Semi-Annual Report 7
Letter to Shareholders,
Continued
Recent legislation has created both positive and negative forces for the performance of municipal bonds. The expiration of the Build America Bond program at the end of 2010 has not led to sharp growth in tax-exempt volume, as some had forecast. In 2010, Congress extended the Bush tax cuts another two years, so the top marginal tax rate remains at 35%, rather than escalating to 39.6%, which would have created yet more demand for tax-exempt income. Over the years we have seen many tax reform proposals come and go. Currently, a batch of new proposals is blanketing Washington, DC. If any of the proposals gain real traction, we will gauge the impact on our portfolio and seek to make appropriate adjustments.
The U.S. economic picture over the last six months has strengthened, but there remains a large degree of slack. Increased economic activity is reflected in the current 2.5% to 3.0% Gross Domestic Product (GDP) growth rate and healthy sales indicators. Unemployment remains high at 8.8%, though payroll growth was encouraging in February and March 2011, when we saw the best back-to-back increases since the recession’s official end in June 2009. Capacity utilization is still low at 76%, leaving excess capacity in the economy. Year over year, the Consumer Price Index (CPI) is currently around 2.0% to 2.5%, much higher than the core CPI rate which is only 1.1% to 1.25%. Meanwhile, the difference between 10-year TIPS yields and 10-year Treasuries is running around 2.7%, and is often viewed as a market opinion of 10-year inflation expectations. We expect QE2, the second phase of quantitative easing, to end abruptly in June 2011.
We are becoming more optimistic about the fiscal outlook for state and local governments. We have been pleased to see a rebound in revenues in California, driven by growth in income tax and sales tax revenue. California’s revenues have increased by 16.8% in the fourth quarter of 2010 compared to the fourth quarter of 2009. A preliminary report from the Rockefeller Institute stated that overall state tax revenue grew 6.9% in the fourth quarter of 2010, with 41 states reporting higher revenue.
The Fed is still in super-stimulative mode, with the fed funds rate at nearly 0% since December 2008, which is viewed as appropriate according to the Taylor Rule, which currently indicates the fed funds rate should be negative 1.45%. The Taylor Rule is a formula guideline for setting the fed funds rate created by Stanford University economist John Taylor. M2, a broad measure of money and money substitutes, has grown only 4% in the last year, at the lower end of the 3% to 10% annual growth rate that has prevailed over the last decade. Velocity of M2, the degree to which money turns over (a contributor to inflation), has remained muted.
Your Fund contains a laddered portfolio of more than 170 municipal bonds. Your Fund is broadly diversified across sectors and 83% invested in bonds rated A or above by at least one of the major rating agencies. We ladder the maturity dates of our bonds so that some of the bonds are scheduled to mature during each of the coming years. Laddering short and intermediate bonds accomplishes two goals. First, the staggered bond maturities contained in a ladder reduce interest-rate risk and dampen the Fund’s price volatility. Second, laddering gives the Fund a steady cash-flow stream from maturing bonds to reinvest toward the top end of the ladder where yields are higher. The chart on the right describes the percentages of your Fund’s bond portfolio maturing in each of the coming years.
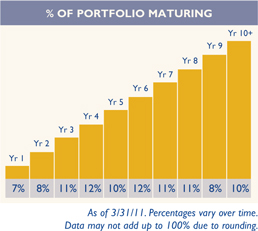
8 Certified Semi-Annual Report
The Class A shares of your Fund produced a total return of negative 2.02% at NAV for the six months ended March 31, 2011, compared to negative 0.96% for the Barclays Capital Five-Year Municipal Bond Index. The total return of the overall municipal bond market as measured by the Barclays Capital Municipal Index for the six months ended March 31, 2011 was negative 3.68%. This period included a negative 4.17% return in the fourth quarter of 2010, the worst of any quarter since 1994.
Rising interest rates were the primary driver of these negative returns. In addition, the Fund’s benchmark Barclays Capital Five-Year Municipal Bond Index consists of 4- to 6-year bonds only, while your Fund consists primarily of bonds ranging from 0 to 10 years and a few longer-term bonds. Since interest rates rose in the period, and longer-term bonds incur more price deterioration when rates rise, the index benefited relative to your Fund by having no exposure to 7- to 10-year bonds.
Historically, our practice of laddering a diversified portfolio of short- and intermediate-maturity bonds has allowed your Fund to perform consistently well in varying interest rate environments. Thank you for investing in Thornburg California Limited Term Municipal Fund.
Sincerely,
| | | | |
 | |  | |  |
| Christopher Ihlefeld | | Christopher Ryon,CFA | | Josh Gonze |
| Co-Portfolio Manager | | Co-Portfolio Manager | | Co-Portfolio Manager |
| Managing Director | | Managing Director | | Managing Director |
The matters discussed in this report may constitute forward-looking statements made pursuant to the safe harbor provisions of the Securities Litigation Reform Act of 1995. These include any advisor or portfolio manager prediction, assessment, analysis or outlook for individual securities, industries, investment styles, market sectors and/or markets. These statements involve risks and uncertainties. In addition to the general risks described for each fund in its current prospectus, other factors bearing on these reports include the accuracy of the advisor’s or portfolio manager’s forecasts and predictions, the appropriateness of the investment strategies designed by the advisor or portfolio manager and the ability of the advisor or portfolio manager to implement their strategies efficiently and successfully. Any one or more of these factors, as well as other risks affecting the securities markets generally, could cause the actual results of any fund to differ materially as compared to its benchmarks.
Certified Semi-Annual Report 9
| | |
| SCHEDULE OF INVESTMENTS | | |
| |
| Thornburg California Limited Term Municipal Fund | | March 31, 2011 (Unaudited) |
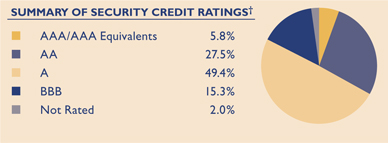
We have used ratings from Standard & Poor’s (S&P). Where S&P ratings are not available, we have used Moody’s Investors Service. Where neither rating is available, we have used ratings from Fitch Ratings. The category of investments identified as “AAA” in this graph includes investments which are pre-refunded or escrowed to maturity. Such investments are backed by an escrow or trust containing sufficient U.S. Government or U.S. Government agency securities to satisfy the timely payment of principal and interest and, therefore, are normally deemed to be equivalent to AAA-rated securities.
| | | | | | | | | | |
Issuer-Description | | Credit Rating†
S&P/ Moody’s | | Principal
Amount | | | Value | |
ABAG Finance Authority, 4.75% due 10/1/2011 (California School of Mechanical Arts) | | NR/A3 | | $ | 435,000 | | | $ | 441,273 | |
ABAG Finance Authority, 4.75% due 10/1/2012 (California School of Mechanical Arts) | | NR/A3 | | | 455,000 | | | | 465,110 | |
Alameda County COP, 5.625% due 12/1/2016 (Santa Rita Jail; Insured: AMBAC) | | AA/NR | | | 1,830,000 | | | | 2,081,094 | |
Alvord USD GO, 5.25% due 2/1/2014 (Insured: Natl-Re) | | A+/Baa1 | | | 1,150,000 | | | | 1,239,585 | |
Bay Area Toll Authority, 5.00% due 4/1/2016 (San Francisco Bay Area) | | AA/Aa3 | | | 2,075,000 | | | | 2,325,162 | |
Burbank Water & Power, 5.00% due 6/1/2015 | | AA-/A1 | | | 750,000 | | | | 837,337 | |
Burbank Water & Power, 5.00% due 6/1/2016 | | AA-/A1 | | | 500,000 | | | | 564,720 | |
Burbank Water & Power, 5.00% due 6/1/2017 | | AA-/A1 | | | 1,000,000 | | | | 1,124,670 | |
Burbank Water & Power, 5.00% due 6/1/2018 | | AA-/A1 | | | 360,000 | | | | 402,289 | |
Burbank Water & Power, 5.00% due 6/1/2020 | | AA-/A1 | | | 625,000 | | | | 685,913 | |
Calexico USD GO, 6.75% due 9/1/2017 | | A-/NR | | | 3,060,000 | | | | 3,391,367 | |
California Educational Facilities Authority, 5.00% due 4/1/2018 (Pitzer College) | | NR/A3 | | | 1,540,000 | | | | 1,608,823 | |
California Educational Facilities Authority, 0% due 10/1/2019 (Loyola Marymount University; | | | | | | | | | | |
Insured: Natl-Re) | | NR/A2 | | | 2,025,000 | | | | 1,253,819 | |
California Educational Facilities Authority, 5.00% due 4/1/2020 (Pitzer College) | | NR/A3 | | | 1,445,000 | | | | 1,462,542 | |
California Health Facilities Financing, 4.00% due 2/1/2013 (Community Program; Insured: CA | | | | | | | | | | |
Mtg Insurance) | | NR/NR | | | 1,665,000 | | | | 1,713,185 | |
California HFA, 5.00% due 11/15/2011 (Cedars-Sinai Medical Center) | | NR/A2 | | | 1,500,000 | | | | 1,534,260 | |
California HFA, 5.25% due 10/1/2013 (Providence Health) | | AA/Aa2 | | | 650,000 | | | | 710,008 | |
California HFA, 5.00% due 8/15/2014 (Cedars-Sinai Medical Center) | | NR/A2 | | | 1,500,000 | | | | 1,616,625 | |
California HFA, 6.00% due 10/1/2018 (Providence Health) | | AA/Aa2 | | | 1,000,000 | | | | 1,172,660 | |
California HFA, 5.10% due 2/1/2019 (Episcopal Home; Insured: CA Mtg Insurance) | | A-/NR | | | 1,840,000 | | | | 1,846,826 | |
California HFA, 5.00% due 7/1/2027 put 7/1/2014 (Catholic Healthcare West) | | A/A2 | | | 2,000,000 | | | | 2,144,700 | |
California HFA, 0% due 8/1/2029 (Insured: AMBAC/FHA/VA) | | A/A3 | | | 2,300,000 | | | | 682,111 | |
California Housing Finance Agency, 4.85% due 8/1/2016 (Insured: AGM) (AMT) | | AA+/Aa3 | | | 1,000,000 | | | | 1,021,180 | |
California Housing Finance Agency, 9.875% due 2/1/2017 | | A/A3 | | | 1,345,000 | | | | 1,371,053 | |
California Housing Finance Agency, 5.00% due 8/1/2017 (Insured: AGM) (AMT) | | AA+/Aa3 | | | 980,000 | | | | 992,671 | |
California Housing Finance Agency, 5.125% due 8/1/2018 (Insured: AGM) (AMT) | | AA+/Aa3 | | | 1,000,000 | | | | 984,640 | |
California Infrastructure & Economic Development Bank, 5.25% due 8/15/2020 (King City | | | | | | | | | | |
High School) | | A-/NR | | | 1,000,000 | | | | 1,028,430 | |
California Infrastructure & Economic Development Bank, 0.22% due 10/1/2023 put 4/1/2011 | | | | | | | | | | |
(J. Paul Getty Trust) (daily demand notes) | | AAA/Aaa | | | 800,000 | | | | 800,000 | |
California Mobile Home Park Financing Authority, 5.00% due 11/15/2013 (Rancho Vallecitos; | | | | | | | | | | |
Insured: ACA) | | NR/NR | | | 570,000 | | | | 577,085 | |
California Municipal Finance Authority, 1.625% due 2/1/2019 put 9/1/2011 (Waste | | | | | | | | | | |
Management, Inc.) | | BBB/NR | | | 1,000,000 | | | | 1,000,480 | |
California PCR, 5.90% due 6/1/2014 (San Diego Gas & Electric) | | A/A2 | | | 2,500,000 | | | | 2,762,700 | |
California PCR, 5.35% due 12/1/2016 (Pacific Gas & Electric; Insured: Natl-Re) (AMT) | | BBB+/A3 | | | 2,000,000 | | | | 2,044,320 | |
California PCR Solid Waste Disposal, 6.75% due 7/1/2011 (North County Recycling Center) | | | | | | | | | | |
(ETM) | | NR/Aaa | | | 500,000 | | | | 507,070 | |
California PCR Solid Waste Disposal, 5.25% due 6/1/2023 put 12/1/2017 (Republic Services, | | | | | | | | | | |
Inc.) (AMT) | | BBB/Baa3 | | | 2,620,000 | | | | 2,740,677 | |
10 Certified Semi-Annual Report
| | |
| SCHEDULE OF INVESTMENTS, CONTINUED | | |
| |
| Thornburg California Limited Term Municipal Fund | | March 31, 2011 (Unaudited) |
| | | | | | | | | | |
Issuer-Description | | Credit Rating†
S&P/ Moody’s | | Principal
Amount | | | Value | |
California State Department of Transportation COP, 5.25% due 3/1/2016 (Insured: Natl-Re) | | BBB/A2 | | $ | 2,000,000 | | | $ | 2,007,020 | |
California State Department of Water Resources Power Supply, 6.00% due 5/1/2013 pre-refunded 5/1/2012 | | AA-/Aa3 | | | 2,270,000 | | | | 2,430,058 | |
California State Department of Water Resources Power Supply, 5.00% due 5/1/2015 | | AA-/Aa3 | | | 5,000,000 | | | | 5,614,750 | |
California State Economic Recovery GO, 5.00% due 7/1/2018 | | A+/Aa3 | | | 3,000,000 | | | | 3,351,930 | |
California State GO, 5.50% due 3/1/2012 (School Improvements; Insured: FGIC) | | A-/A1 | | | 230,000 | | | | 234,336 | |
California State GO, 5.00% due 3/1/2017 (Insured: Syncora) | | A-/A1 | | | 2,860,000 | | | | 3,127,524 | |
California State GO, 0.20% due 5/1/2034 put 4/1/2011 (Various Kindergarten; LOC: Citibank N.A.) (daily demand notes) | | AAA/Aa2 | | | 600,000 | | | | 600,000 | |
California State Public Works Board Lease, 5.25% due 10/1/2013 (California State University) | | BBB+/Aa3 | | | 500,000 | | | | 501,160 | |
California State Public Works Board Lease, 5.25% due 12/1/2014 | | BBB+/A2 | | | 1,525,000 | | | | 1,527,943 | |
California State Public Works Board Lease, 5.00% due 1/1/2015 (Department of Corrections; Insured: AMBAC) | | BBB+/A2 | | | 2,000,000 | | | | 2,131,260 | |
California State Public Works Board Lease, 5.00% due 11/1/2015 (Various Universities) | | AA-/Aa2 | | | 1,000,000 | | | | 1,094,690 | |
California State Public Works Board Lease, 5.00% due 11/1/2016 (California State University) | | BBB+/Aa3 | | | 1,000,000 | | | | 1,068,180 | |
California Statewide Community Development Authority, 5.25% due 8/1/2014 (East Campus Apartments; Insured: ACA) | | NR/Baa1 | | | 1,715,000 | | | | 1,759,316 | |
California Statewide Community Development Authority, 5.50% due 8/15/2014 (Enloe Medical Center; Insured: CA Mtg Insurance) | | A-/NR | | | 750,000 | | | | 805,267 | |
California Statewide Community Development Authority, 5.00% due 5/15/2015 (Irvine LLC-UCI East Campus) | | NR/Baa2 | | | 2,300,000 | | | | 2,425,856 | |
California Statewide Community Development Authority, 5.00% due 4/1/2019 (Kaiser Credit Group) | | A+/NR | | | 3,000,000 | | | | 3,173,760 | |
California Statewide Community Development Authority, 5.00% due 7/1/2020 (Aspire Public Schools) | | NR/NR | | | 1,350,000 | | | | 1,263,289 | |
California Statewide Community Development Authority, 3.85% due 11/1/2029 put 6/1/2012 (Kaiser Credit Group) | | A+/NR | | | 975,000 | | | | 1,008,676 | |
California Statewide Community Development Authority COP, 6.50% due 8/1/2012 (Cedars- Sinai Center Hospital; Insured: Natl-Re) | | BBB/A2 | | | 300,000 | | | | 308,976 | |
California Statewide Community Development Authority PCR, 4.10% due 4/1/2028 put 4/1/2013 (Southern California Edison Co.; Insured: Syncora) | | A/A1 | | | 2,575,000 | | | | 2,656,421 | |
Calipatria USD, 0% due 8/1/2025 (Capital Appreciation-Election 1995; Insured: ACA) | | NR/NR | | | 5,000,000 | | | | 1,599,900 | |
Carson Redevelopment Agency Tax Allocation, 6.00% due 10/1/2019 (Project Area 1) | | A-/NR | | | 1,050,000 | | | | 1,066,747 | |
Castaic USD GO, 0% due 5/1/2018 (Insured: Natl-Re/FGIC) | | A+/NR | | | 3,000,000 | | | | 2,170,110 | |
Centinela Valley Unified High School District GO, 4.00% due 12/1/2013 | | SP-1+/NR | | | 3,000,000 | | | | 3,115,770 | |
Central Union High School District Imperial County, 5.00% due 8/1/2012 (Insured: Natl-Re/FGIC) | | A+/NR | | | 830,000 | | | | 856,411 | |
Central Valley Financing Authority, 5.00% due 7/1/2015 (Carson Ice) | | A+/A1 | | | 1,000,000 | | | | 1,089,420 | |
Central Valley Financing Authority, 5.25% due 7/1/2020 (Carson Ice) | | A+/A1 | | | 500,000 | | | | 535,705 | |
Cerritos Public Financing Authority Tax Allocation, 5.00% due 11/1/2014 (Insured: AMBAC) | | A-/NR | | | 1,260,000 | | | | 1,281,420 | |
Chabot-Las Positas Community College District GO, 0% due 8/1/2018 (Election 2004-B; Insured: AMBAC) | | AA-/Aa1 | | | 2,465,000 | | | | 1,746,305 | |
Chula Vista COP, 5.25% due 3/1/2020 | | A-/NR | | | 1,300,000 | | | | 1,325,818 | |
City of Folsom, 4.00% due 12/1/2014 (Community Facilities District No. 2) | | A+/NR | | | 755,000 | | | | 775,770 | |
City of Folsom, 5.00% due 12/1/2016 (Community Facilities District No. 2) | | A+/NR | | | 1,100,000 | | | | 1,159,499 | |
City of Folsom, 5.00% due 12/1/2018 (Community Facilities District No. 2) | | A+/NR | | | 965,000 | | | | 990,640 | |
Contra Costa Water District, 2.50% due 10/1/2013 | | AA+/NR | | | 2,000,000 | | | | 2,074,640 | |
Corona-Norco USD GO, 0% due 9/1/2017 (Insured: AGM) | | AA+/Aa2 | | | 1,595,000 | | | | 1,222,376 | |
County of Stanislaus, 5.75% due 5/1/2015 (Insured: Natl-Re) | | A+/Baa1 | | | 1,815,000 | | | | 1,929,291 | |
Delano Financing Authority, 5.00% due 12/1/2017 (Police Station and Capital Improvements) | | A/NR | | | 1,085,000 | | | | 1,074,334 | |
Delano Financing Authority, 5.00% due 12/1/2018 (Police Station and Capital Improvements) | | A/NR | | | 1,135,000 | | | | 1,102,982 | |
Delano Financing Authority, 5.00% due 12/1/2019 (Police Station and Capital Improvements) | | A/NR | | | 1,195,000 | | | | 1,132,920 | |
Desert Sands USD COP, 5.25% due 3/1/2014 | | A+/A1 | | | 1,745,000 | | | | 1,855,685 | |
Desert Sands USD COP, 5.00% due 3/1/2017 | | A+/A1 | | | 1,500,000 | | | | 1,578,615 | |
Certified Semi-Annual Report 11
| | |
| SCHEDULE OF INVESTMENTS, CONTINUED | | |
| |
| Thornburg California Limited Term Municipal Fund | | March 31, 2011 (Unaudited) |
| | | | | | | | | | |
Issuer-Description | | Credit Rating†
S&P/ Moody’s | | Principal
Amount | | | Value | |
Escondido USD GO, 6.10% due 11/1/2011 (Insured: Natl-Re) | | BBB/Baa1 | | $ | 500,000 | | | $ | 502,235 | |
Fillmore Public Financing Authority, 5.00% due 5/1/2016 (Water Recycling; Insured: CIFG) | | A/A2 | | | 735,000 | | | | 767,796 | |
High Desert California Memorial Health Care, 5.40% due 10/1/2011 | | NR/NR | | | 675,000 | | | | 675,068 | |
Inland Valley Development Agency, 5.25% due 4/1/2012 | | A/NR | | | 1,490,000 | | | | 1,520,828 | |
Kern Community College District COP, 4.00% due 4/1/2014 | | SP-1+/NR | | | 2,000,000 | | | | 2,052,920 | |
Kings Canyon Joint USD GO, 5.375% due 8/1/2017 pre-refunded 8/1/2011 (Insured: Natl-Re) | | AA-/NR | | | 1,000,000 | | | | 1,026,880 | |
Lindsay USD COP, 5.75% due 10/1/2017 (Insured: AGM) | | AA+/NR | | | 1,160,000 | | | | 1,207,456 | |
Lindsay USD COP, 6.00% due 10/1/2018 (Insured: AGM) | | AA+/NR | | | 680,000 | | | | 710,002 | |
Los Angeles Convention & Exhibition Center Authority, 5.00% due 8/15/2016 | | A+/A1 | | | 2,000,000 | | | | 2,123,940 | |
Los Angeles Convention & Exhibition Center Authority, 5.00% due 8/15/2017 | | A+/A1 | | | 1,410,000 | | | | 1,487,183 | |
Los Angeles COP, 5.00% due 2/1/2012 (Insured: Natl-Re) | | A+/A1 | | | 1,400,000 | | | | 1,445,444 | |
Los Angeles County Public Works Authority, 5.00% due 8/1/2018 (Multiple Capital Projects) | | A+/A1 | | | 2,060,000 | | | | 2,177,482 | |
Los Angeles County Schools, 5.00% due 6/1/2016 (Insured: Natl-Re) | | BBB/Baa1 | | | 1,000,000 | | | | 1,026,010 | |
Los Angeles County Schools, 5.00% due 6/1/2017 (Insured: Natl-Re) | | BBB/Baa1 | | | 1,010,000 | | | | 1,017,393 | |
Los Angeles Department of Airports, 5.50% due 5/15/2018 (Los Angeles International Airport) | | AA/Aa3 | | | 2,000,000 | | | | 2,206,120 | |
Los Angeles Department of Water & Power, 5.25% due 7/1/2011 (Insured: Natl-Re) | | AA-/Aa3 | | | 3,000,000 | | | | 3,036,540 | |
Los Angeles Department of Water & Power, 0.20% due 7/1/2035 put 4/1/2011 (Insured: U.S. Bank) (daily demand notes) | | AA/Aa2 | | | 900,000 | | | | 900,000 | |
Los Angeles Municipal Improvement Corporation, 5.00% due 11/1/2017 (Capital Equipment) | | A+/A2 | | | 3,235,000 | | | | 3,459,703 | |
Los Angeles Solid Waste, 4.00% due 2/1/2012 | | AA/Aa2 | | | 850,000 | | | | 874,947 | |
Los Angeles USD COP, 5.00% due 10/1/2015 (Insured: AMBAC) | | A+/A1 | | | 1,500,000 | | | | 1,592,475 | |
Los Angeles USD COP, 5.50% due 12/1/2018 (Capital Projects) | | A+/A1 | | | 2,000,000 | | | | 2,110,560 | |
Los Angeles USD GO, 5.50% due 7/1/2012 (Insured: Natl-Re) | | AA-/Aa2 | | | 2,500,000 | | | | 2,640,975 | |
Merced Redevelopment Agency Tax Allocation, 5.25% due 9/1/2020 | | A-/NR | | | 1,190,000 | | | | 1,132,428 | |
Milpitas Redevelopment Agency Tax Allocation, 5.00% due 9/1/2015 (Insured: Natl-Re) | | A/Baa1 | | | 2,000,000 | | | | 2,017,700 | |
Mojave USD COP, 0% due 9/1/2017 (Insured: AGM) | | AA+/NR | | | 1,045,000 | | | | 795,851 | |
Mojave USD COP, 0% due 9/1/2018 (Insured: AGM) | | AA+/NR | | | 1,095,000 | | | | 766,128 | |
Monterey County COP, 5.00% due 8/1/2014 (Refinancing Project; Insured: AGM) | | AA+/Aa3 | | | 2,000,000 | | | | 2,149,260 | |
Northern California Power Agency, 4.00% due 7/1/2015 | | A/A2 | | | 500,000 | | | | 522,130 | |
Northern California Power Agency, 5.00% due 7/1/2016 | | A/A2 | | | 500,000 | | | | 556,955 | |
Northern California Power Agency, 5.00% due 7/1/2018 | | A/A2 | | | 1,250,000 | | | | 1,383,925 | |
Northern California Power Agency, 5.00% due 6/1/2019 (Lodi Energy Center) | | NR/NR | | | 2,340,000 | | | | 2,503,894 | |
Norwalk Redevelopment Agency Tax Allocation, 5.00% due 10/1/2014 (Insured: Natl-Re) | | BBB/Baa1 | | | 625,000 | | | | 647,913 | |
Orange County Public Finance Authority, 5.375% due 6/1/2015 (Juvenile Justice Center; Insured: AMBAC) | | A+/Aa3 | | | 1,000,000 | | | | 1,051,010 | |
Oxnard Financing Authority Solid Waste, 5.25% due 6/1/2014 (Insured: Natl-Re/FGIC) | | A+/NR | | | 1,000,000 | | | | 1,064,790 | |
Oxnard Financing Authority Waste Water, 5.00% due 5/1/2013 (Insured: AMBAC) (AMT) | | A-/NR | | | 2,115,000 | | | | 2,195,158 | |
Palomar Pomerado Health GO, 0% due 8/1/2019 (Insured: AGM) | | AA+/Aa3 | | | 2,000,000 | | | | 1,280,180 | |
Pittsburg Redevelopment Agency Tax Allocation, 5.00% due 8/1/2020 (Los Medanos Community Development Project; Insured: Natl-Re) | | A+/Baa1 | | | 1,205,000 | | | | 1,126,603 | |
Port Oakland, 5.75% due 11/1/2012 (Port, Airport & Marina Improvements; Insured: Natl-Re/ FGIC) (AMT) | | A/A2 | | | 2,160,000 | | | | 2,166,890 | |
Port Oakland, 5.75% due 11/1/2014 (Insured: Natl-Re/FGIC) (AMT) | | A/A2 | | | 745,000 | | | | 746,654 | |
Redding Electrical Systems Revenue COP, 5.00% due 6/1/2020 (Insured: AGM) | | NR/Aa3 | | | 2,500,000 | | | | 2,632,975 | |
Richmond Joint Powers Financing Authority, 5.25% due 5/15/2013 (Lease & Gas Tax) | | A/NR | | | 300,000 | | | | 300,327 | |
Ridgecrest Redevelopment Agency, 5.00% due 6/30/2016 (Ridgecrest Redevelopment Project) | | A-/Baa1 | | | 1,055,000 | | | | 1,062,955 | |
Ridgecrest Redevelopment Agency, 5.00% due 6/30/2017 (Ridgecrest Redevelopment Project) | | A-/Baa1 | | | 1,055,000 | | | | 1,051,898 | |
Ridgecrest Redevelopment Agency, 5.25% due 6/30/2018 (Ridgecrest Redevelopment Project) | | A-/Baa1 | | | 1,050,000 | | | | 1,040,004 | |
Ridgecrest Redevelopment Agency, 5.50% due 6/30/2019 (Ridgecrest Redevelopment Project) | | A-/Baa1 | | | 1,050,000 | | | | 1,035,615 | |
Ridgecrest Redevelopment Agency, 5.50% due 6/30/2020 (Ridgecrest Redevelopment Project) | | A-/Baa1 | | | 1,040,000 | | | | 1,010,277 | |
Riverside County Palm Desert Financing Authority, 5.00% due 5/1/2013 | | AA-/A1 | | | 1,000,000 | | | | 1,050,030 | |
Roseville Natural Gas Financing Authority, 5.00% due 2/15/2017 | | A/A2 | | | 1,000,000 | | | | 1,012,930 | |
Sacramento City Financing Authority, 0% due 11/1/2014 (Insured: Natl-Re) | | BBB/Baa1 | | | 3,385,000 | | | | 2,866,520 | |
12 Certified Semi-Annual Report
| | |
| SCHEDULE OF INVESTMENTS, CONTINUED | | |
| |
| Thornburg California Limited Term Municipal Fund | | March 31, 2011 (Unaudited) |
| | | | | | | | | | |
Issuer-Description | | Credit Rating†
S&P/ Moody’s | | Principal
Amount | | | Value | |
Sacramento Cogeneration Authority, 5.00% due 7/1/2015 (Procter & Gamble) | | A+/A1 | | $ | 1,100,000 | | | $ | 1,210,418 | |
Sacramento Cogeneration Authority, 5.00% due 7/1/2019 (Procter & Gamble) | | A+/A1 | | | 625,000 | | | | 676,731 | |
Sacramento Municipal Utility District, 5.00% due 7/1/2020 (Cosumnes Project; Insured: Natl-Re) | | BBB/Baa1 | | | 3,000,000 | | | | 2,961,540 | |
San Bernardino County Community Facilities District, 5.10% due 9/1/2011 | | NR/NR | | | 190,000 | | | | 192,122 | |
San Bernardino County Community Facilities District, 5.20% due 9/1/2012 | | NR/NR | | | 205,000 | | | | 211,695 | |
San Bernardino County Community Facilities District, 5.30% due 9/1/2013 | | NR/NR | | | 300,000 | | | | 313,662 | |
San Bernardino County Multi-Family Housing, 4.75% due 12/15/2031 put 12/15/2011 (Rolling Ridge LLC; Collateralized: FNMA) | | NR/Aaa | | | 3,100,000 | | | | 3,174,555 | |
San Diego Redevelopment Agency, 5.25% due 9/1/2015 (Centre City Redevelopment; Insured: AGM) | | AA+/Aa3 | | | 1,375,000 | | | | 1,408,632 | |
San Diego Redevelopment Agency, 4.50% due 9/1/2019 (Centre City Redevelopment; Insured: AMBAC) | | NR/A2 | | | 1,240,000 | | | | 1,218,908 | |
San Diego USD GO, 5.50% due 7/1/2020 (Election 1998; Insured: Natl-Re) | | AA/Aa1 | | | 1,390,000 | | | | 1,514,433 | |
San Francisco City & County Airports Commission, 5.25% due 5/1/2013 pre-refunded 5/1/11 (Insured: Natl-Re) | | BBB/A1 | | | 425,000 | | | | 426,743 | |
San Francisco City & County Airports Commission, 5.25% due 5/1/2013 put 5/1/2011 (Insured: Natl-Re) | | A/A1 | | | 630,000 | | | | 632,583 | |
San Francisco City & County Airports Commission, 5.25% due 5/1/2016 (Insured: Syncora) | | A/A1 | | | 1,500,000 | | | | 1,581,660 | |
San Francisco City & County Redevelopment Agency, 0% due 7/1/2011 (George R. Moscone; Insured: Natl-Re) | | AA-/Aa3 | | | 1,200,000 | | | | 1,197,036 | |
San Francisco City & County Redevelopment Agency, 0% due 7/1/2013 (George R. Moscone) | | AA-/Aa3 | | | 1,200,000 | | | | 1,148,736 | |
San Joaquin County COP, 5.50% due 11/15/2013 (Capital Facilities; Insured: Natl-Re) | | BBB/Baa1 | | | 1,000,000 | | | | 1,028,140 | |
San Joaquin Delta Community College District GO, 0% due 8/1/2019 (Insured: AGM) | | AA+/Aa2 | | | 5,000,000 | | | | 3,284,700 | |
San Jose Redevelopment Agency Tax Allocation, 5.25% due 8/1/2012 (Merged Area Redevelopment; Insured: Natl-Re) | | BBB+/A2 | | | 1,000,000 | | | | 1,022,160 | |
San Jose Redevelopment Agency Tax Allocation, 5.00% due 8/1/2020 (Insured: Natl-Re) | | BBB+/A2 | | | 1,200,000 | | | | 1,116,708 | |
San Luis & Delta-Mendota Water Authority, 4.50% due 3/1/2014 (Water Utility Improvements) | | A+/NR | | | 2,000,000 | | | | 2,102,240 | |
San Mateo Flood Control District COP, 5.25% due 8/1/2017 (Colma Creek; Insured: Natl-Re) | | BBB/Baa1 | | | 1,000,000 | | | | 1,000,240 | |
San Mateo Union High School District GO Unlimited, 0% due 9/1/2019 (Capital Appreciation- Election of 2000-B; Insured: Natl-Re/FGIC) | | AA/Aa1 | | | 2,000,000 | | | | 1,317,220 | |
Santa Ana USD GO, 0% due 8/1/2020 (Election of 1999; Insured: Natl-Re/FGIC) | | A+/NR | | | 2,035,000 | | | | 1,242,347 | |
Santa Barbara County, 5.25% due 12/1/2014 (Insured: AMBAC) | | AA+/Aa3 | | | 1,145,000 | | | | 1,199,342 | |
Santa Clara County Financing Authority, 5.00% due 5/15/2012 (Multiple Facilities Projects) | | AA/Aa2 | | | 1,000,000 | | | | 1,044,760 | |
Santa Margarita/Dana Point Authority, 7.25% due 8/1/2013 (Improvement Districts 3-3A, 4-4A; Insured: Natl-Re) | | BBB/Baa1 | | | 2,000,000 | | | | 2,188,060 | |
Seal Beach Redevelopment Agency Mobile Home Park, 5.20% due 12/15/2013 (Insured: ACA) | | NR/NR | | | 470,000 | | | | 478,474 | |
Solano County COP, 5.00% due 11/15/2013 | | AA-/A1 | | | 1,780,000 | | | | 1,906,362 | |
Solano County COP, 5.00% due 11/15/2016 | | AA-/A1 | | | 1,000,000 | | | | 1,075,970 | |
Southeast Resource Recovery Facilities Authority, 5.375% due 12/1/2013 (Insured: AMBAC) (AMT) | | A+/A1 | | | 1,060,000 | | | | 1,122,445 | |
Southeast Resource Recovery Facilities Authority, 5.25% due 12/1/2017 (Insured: AMBAC) | | A+/A1 | | | 1,000,000 | | | | 1,037,320 | |
Southern California Public Power Authority, 6.75% due 7/1/2012 (Multiple Projects; Insured: AGM) | | AA+/Aa3 | | | 2,315,000 | | | | 2,483,486 | |
Southern California Public Power Authority, 5.15% due 7/1/2015 (Insured: AMBAC) | | NR/Aa3 | | | 350,000 | | | | 384,790 | |
Southern California Public Power Authority, 5.15% due 7/1/2015 (Insured: AMBAC) | | NR/Aa3 | | | 250,000 | | | | 274,900 | |
Southern California Public Power Authority, 5.00% due 7/1/2016 (Southern Transmission Project) | | AA-/NR | | | 2,000,000 | | | | 2,249,740 | |
Torrance Hospital Revenue, 6.00% due 6/1/2022 (Torrance Memorial Medical Center) | | A+/A2 | | | 2,600,000 | | | | 2,640,248 | |
Tracy Area Public Facilities Financing Agency Special Tax, 5.875% due 10/1/2019 (Community Facilities District No. 87) | | BBB/Baa1 | | | 590,000 | | | | 591,882 | |
Tuolumne Wind Project Authority, 5.00% due 1/1/2015 (Tuolumne Co.) | | A+/A1 | | | 500,000 | | | | 544,085 | |
Tuolumne Wind Project Authority, 5.00% due 1/1/2018 (Tuolumne Co.) | | A+/A1 | | | 1,690,000 | | | | 1,836,912 | |
Turlock Irrigation District, 5.00% due 1/1/2015 | | A+/A1 | | | 1,125,000 | | | | 1,210,815 | |
Turlock Irrigation District, 5.00% due 1/1/2019 | | A+/A1 | | | 1,000,000 | | | | 1,057,820 | |
Certified Semi-Annual Report 13
| | |
| SCHEDULE OF INVESTMENTS, CONTINUED | | |
| |
| Thornburg California Limited Term Municipal Fund | | March 31, 2011 (Unaudited) |
| | | | | | | | | | | | |
Issuer-Description | | Credit Rating†
S&P/ Moody’s | | | Principal
Amount | | | Value | |
Tustin Community Redevelopment Agency, 4.00% due 9/1/2017 (Tustin Redevelopment Project Area) | | | A/NR | | | $ | 935,000 | | | $ | 880,115 | |
Twin Rivers USD GO, 0% due 4/1/2014 | | | A+/NR | | | | 1,000,000 | | | | 910,900 | |
University of California, 4.00% due 5/15/2017 (Limited Project) | | | AA-/Aa2 | | | | 1,250,000 | | | | 1,346,150 | |
Upper Lake Union High School District GO, 0% due 8/1/2020 (Capital Appreciation; Insured: Natl-Re) | | | NR/Baa1 | | | | 1,050,000 | | | | 578,970 | |
Val Verde USD COP, 5.00% due 1/1/2014 (Insured: Natl-Re/FGIC) (ETM) | | | NR/NR | | | | 445,000 | | | | 492,771 | |
Washington USD COP, 5.00% due 8/1/2017 (New High School; Insured: AMBAC) | | | A/NR | | | | 725,000 | | | | 758,234 | |
Washington USD Yolo County, 5.00% due 8/1/2021 (New High School; Insured: AMBAC) | | | A/NR | | | | 910,000 | | | | 898,598 | |
Whittier Solid Waste, 5.375% due 8/1/2014 (Insured: AMBAC) | | | NR/NR | | | | 700,000 | | | | 700,665 | |
| | | | | | | | | | | | |
TOTAL INVESTMENTS — 97.84% (Cost $240,346,196) | | | | | | | | | | $ | 241,519,135 | |
OTHER ASSETS LESS LIABILITIES — 2.16% | | | | | | | | | | | 5,341,951 | |
| | | | | | | | | | | | |
NET ASSETS — 100.00% | | | | | | | | | | $ | 246,861,086 | |
| | | | | | | | | | | | |
Footnote Legend
| † | Credit ratings are unaudited. Rating changes may have occurred subsequent to the reporting period end. Bonds issued with a maturity of one year or less are assigned Moody’s ratings from MIG-1 to MIG-4 and Standard and Poor’s ratings from SP-1+ to SP-3 with MIG-1 and SP-1+ being the strongest ratings. |
Portfolio Abbreviations
To simplify the listings of securities, abbreviations are used per the table below:
| | |
| ABAG | | Association of Bay Area Governments |
| ACA | | Insured by American Capital Access |
| AGM | | Insured by Assured Guaranty Municipal Corp. |
| AMBAC | | Insured by American Municipal Bond Assurance Corp. |
| AMT | | Alternative Minimum Tax |
| CIFG | | CIFG Assurance North America Inc. |
| COP | | Certificates of Participation |
| ETM | | Escrowed to Maturity |
| FGIC | | Insured by Financial Guaranty Insurance Co. |
| FHA | | Insured by Federal Housing Administration |
| FNMA | | Collateralized by Federal National Mortgage Association |
| GO | | General Obligation |
| HFA | | Health Facilities Authority |
| LOC | | Letter of Credit |
| Mtg | | Mortgage |
| Natl-Re | | Insured by National Public Finance Guarantee Corp. |
| PCR | | Pollution Control Revenue Bond |
| Syncora | | Insured by Syncora Guarantee Inc. |
| VA | | Veterans Affairs |
| USD | | Unified School District |
See notes to financial statements.
14 Certified Semi-Annual Report
| | |
| STATEMENT OF ASSETS AND LIABILITIES | | |
| |
| Thornburg California Limited Term Municipal Fund | | March 31, 2011 (Unaudited) |
| | | | |
ASSETS | | | | |
Investments at value (cost $240,346,196) (Note 2) | | $ | 241,519,135 | |
Cash | | | 231,732 | |
Receivable for fund shares sold | | | 2,743,898 | |
Interest receivable | | | 3,069,517 | |
Prepaid expenses and other assets | | | 845 | |
| | | | |
Total Assets | | | 247,565,127 | |
| | | | |
| |
LIABILITIES | | | | |
Payable for fund shares redeemed | | | 270,923 | |
Payable to investment advisor and other affiliates (Note 3) | | | 167,307 | |
Accounts payable and accrued expenses | | | 31,327 | |
Dividends payable | | | 234,484 | |
| | | | |
Total Liabilities | | | 704,041 | |
| | | | |
| |
NET ASSETS | | $ | 246,861,086 | |
| | | | |
NET ASSETS CONSIST OF: | | | | |
Net unrealized appreciation on investments | | | 1,172,939 | |
Accumulated net realized gain (loss) | | | (123,870 | ) |
Net capital paid in on shares of beneficial interest | | | 245,812,017 | |
| | | | |
| | $ | 246,861,086 | |
| | | | |
| |
NET ASSET VALUE: | | | | |
Class A Shares: | | | | |
Net asset value and redemption price per share ($118,019,963 applicable to 9,126,995 shares of beneficial interest outstanding - Note 4) | | $ | 12.93 | |
Maximum sales charge, 1.50% of offering price | | | 0.20 | |
| | | | |
Maximum offering price per share | | $ | 13.13 | |
| | | | |
| |
Class C Shares: | | | | |
Net asset value and offering price per share * ($40,477,809 applicable to 3,127,698 shares of beneficial interest outstanding - Note 4) | | $ | 12.94 | |
| | | | |
| |
Class I Shares: | | | | |
Net asset value, offering and redemption price per share ($88,363,314 applicable to 6,826,990 shares of beneficial interest outstanding - Note 4) | | $ | 12.94 | |
| | | | |
| * | Redemption price per share is equal to net asset value less any applicable contingent deferred sales charge. |
See notes to financial statements.
Certified Semi-Annual Report 15
| | |
| STATEMENT OF OPERATIONS | | |
| |
| Thornburg California Limited Term Municipal Fund | | Six Months Ended March 31, 2011 (Unaudited) |
| | | | |
INVESTMENT INCOME: | | | | |
Interest income (net of premium amortized of $984,087) | | $ | 4,524,056 | |
| | | | |
| |
EXPENSES: | | | | |
Investment advisory fees (Note 3) | | | 608,540 | |
Administration fees (Note 3) | | | | |
Class A Shares | | | 72,559 | |
Class C Shares | | | 25,864 | |
Class I Shares | | | 21,485 | |
Distribution and service fees (Note 3) | | | | |
Class A Shares | | | 145,118 | |
Class C Shares | | | 102,358 | |
Transfer agent fees | | | | |
Class A Shares | | | 17,112 | |
Class C Shares | | | 9,933 | |
Class I Shares | | | 8,333 | |
Registration and filing fees | | | | |
Class A Shares | | | 19 | |
Class C Shares | | | 19 | |
Class I Shares | | | 19 | |
Custodian fees (Note 3) | | | 34,131 | |
Professional fees | | | 12,717 | |
Accounting fees | | | 3,338 | |
Trustee fees | | | 2,798 | |
Other expenses | | | 11,375 | |
| | | | |
Total Expenses | | | 1,075,718 | |
Less: | | | | |
Expenses reimbursed by investment advisor (Note 3) | | | (1,580 | ) |
Fees paid indirectly (Note 3) | | | (822 | ) |
| | | | |
Net Expenses | | | 1,073,316 | |
| | | | |
Net Investment Income | | | 3,450,740 | |
| | | | |
REALIZED AND UNREALIZED GAIN (LOSS) | | | | |
Net realized gain (loss) on investments | | | 99,622 | |
Net change in unrealized appreciation (depreciation) of investments | | | (8,560,527 | ) |
| | | | |
Net Realized and Unrealized Loss | | | (8,460,905 | ) |
| | | | |
Net Decrease in Net Assets Resulting from Operations | | $ | (5,010,165 | ) |
| | | | |
See notes to financial statements.
16 Certified Semi-Annual Report
STATEMENTS OF CHANGES IN NET ASSETS
Thornburg California Limited Term Municipal Fund
| | | | | | | | |
| | | Six Months Ended
March 31, 2011* | | | Year Ended
September 30, 2010 | |
INCREASE (DECREASE) IN NET ASSETS FROM | | | | | | | | |
| | |
OPERATIONS: | | | | | | | | |
Net investment income | | $ | 3,450,740 | | | $ | 5,633,467 | |
Net realized gain (loss) on investments | | | 99,622 | | | | 68,938 | |
Increase (Decrease) in unrealized appreciation (depreciation) of investments | | | (8,560,527 | ) | | | 4,863,894 | |
| | | | | | | | |
| | |
Net Increase (Decrease) in Net Assets Resulting from Operations | | | (5,010,165 | ) | | | 10,566,299 | |
| | |
DIVIDENDS TO SHAREHOLDERS: | | | | | | | | |
From net investment income | | | | | | | | |
Class A Shares | | | (1,602,337 | ) | | | (2,846,029 | ) |
Class C Shares | | | (517,298 | ) | | | (895,557 | ) |
Class I Shares | | | (1,331,105 | ) | | | (1,891,881 | ) |
| | |
FUND SHARE TRANSACTIONS (NOTE 4): | | | | | | | | |
Class A Shares | | | 7,201,337 | | | | 32,843,700 | |
Class C Shares | | | (107,708 | ) | | | 15,149,787 | |
Class I Shares | | | 12,428,210 | | | | 36,228,843 | |
| | | | | | | | |
| | |
Net Increase in Net Assets | | | 11,060,934 | | | | 89,155,162 | |
| | |
NET ASSETS: | | | | | | | | |
Beginning of Period | | | 235,800,152 | | | | 146,644,990 | |
| | | | | | | | |
| | |
End of Period | | $ | 246,861,086 | | | $ | 235,800,152 | |
| | | | | | | | |
See notes to financial statements.
Certified Semi-Annual Report 17
| | |
| NOTES TO FINANCIAL STATEMENTS | | |
| |
| Thornburg California Limited Term Municipal Fund | | March 31, 2011 (Unaudited) |
NOTE 1 – ORGANIZATION
Thornburg California Limited Term Municipal Fund (the “Fund”) is a diversified series of Thornburg Investment Trust (the “Trust”). The Trust is organized as a Massachusetts business trust under a Declaration of Trust dated June 3, 1987 and is registered as a diversified, open-end management investment company under the Investment Company Act of 1940, as amended. The Fund is currently one of sixteen separate series of the Trust. Each series is considered to be a separate entity for financial reporting and tax purposes and bears expenses directly attributable to it. The Fund’s primary investment objective is to obtain as high a level of current income exempt from federal and California state individual income tax as is consistent, in the view of the Fund’s investment advisor, with the preservation of capital. The Fund’s secondary objective is to reduce expected changes in its share price compared to longer intermediate and long-term bond portfolios.
The Fund currently offers three classes of shares of beneficial interest: Class A, Class C, and Institutional Class (Class I). Each class of shares of the Fund represents an interest in the same portfolio of investments, except that (i) Class A shares are sold subject to a front-end sales charge collected at the time the shares are purchased and bear a service fee, (ii) Class C shares are sold at net asset value without a sales charge at the time of purchase, but are subject to a contingent deferred sales charge upon redemption within one year of purchase, and bear both a service fee and a distribution fee, (iii) Class I shares are sold at net asset value without a sales charge at the time of purchase, and (iv) the respective classes may have different reinvestment privileges and conversion rights. Additionally, the Fund may allocate among its classes certain expenses, to the extent allowable to specific classes, including transfer agent fees, government registration fees, certain printing and postage costs, and administrative and legal expenses. Currently, class specific expenses of the Fund are limited to service and distribution fees, administration fees, and certain registration and transfer agent expenses.
NOTE 2 – SIGNIFICANT ACCOUNTING POLICIES
Significant accounting policies of the Trust are as follows:
Valuation of Investments: Debt obligations have a primary market over the counter and are valued by an independent pricing service approved by the Trustees of the Trust. The pricing service ordinarily values debt obligations at quoted bid prices. When quotations are not available, debt obligations are valued at evaluated prices determined by the pricing service using methods which include consideration of yields or prices of debt obligations of comparable quality, type of issue, coupon, maturity and rating, and indications as to value from dealers and general market conditions. Short-term obligations having remaining maturities of 60 days or less are ordinarily valued at amortized cost, which approximates market value.
In any case where a pricing service fails to provide a price for a debt obligation held by the Fund, the valuation and pricing committee determines a fair value for the obligation using procedures approved by the Trustees. Additionally, in any case where management believes that a price provided by a pricing service for a debt obligation may be unreliable, the valuation and pricing committee decides whether or not to use the pricing service’s valuation or to determine a fair value for the obligation.
In determining fair value for any portfolio security or other investment, the valuation and pricing committee seeks to determine the amount that an owner of the investment might reasonably expect to receive upon a sale of the investment. However, because fair value prices are estimated prices, the valuation and pricing committee’s determination of fair value for an investment may differ from the value that would be realized by the Fund upon a sale of the investment, and that difference could be material to the Fund’s financial statements. The valuation and pricing committee’s determination of fair value for an investment may also differ from the prices obtained by other persons (including other mutual funds) for the investment.
Valuation Measurements: Various inputs are used in determining the value of the Fund’s investments. These inputs are summarized in the three levels listed below.
Level 1: Quoted prices in active markets for identical investments.
Level 2: Other significant observable inputs (including quoted prices for similar investments, interest rates, prepayment rates, credit risk, etc.).
Level 3: Significant unobservable inputs (including the Fund’s own assumptions in determining the fair value of investments).
18 Certified Semi-Annual Report
| | |
| NOTES TO FINANCIAL STATEMENTS, CONTINUED | | |
| |
| Thornburg California Limited Term Municipal Fund | | March 31, 2011 (Unaudited) |
The following table displays a summary of the inputs used to value the Fund’s net assets as of March 31, 2011. In any instance when valuation inputs from more than one level are used to determine the fair value of a specific investment, the investment is placed in the level of the table based upon the lowest level input that is significant in determining the fair value of the investment:
| | | | | | | | | | | | | | | | |
| | | Fair Value Measurements at March 31, 2011 | |
| | | Total | | | Level 1 | | | Level 2 | | | Level 3 | |
Assets | | | | | | | | | | | | | | | | |
Investments in Securities
Municipal Bonds | | $ | 241,519,135 | | | $ | — | | | $ | 241,519,135 | | | $ | — | |
| | | | | | | | | | | | | | | | |
Total Investments in Securities | | $ | 241,519,135 | | | $ | — | | | $ | 241,519,135 | | | $ | — | |
Other Notes: It is the policy of the Fund to recognize significant transfers between Levels 1 and 2 and to disclose those transfers at the last date of the reporting period. The Fund recognized no significant transfers into and out of Levels 1 and 2 during the six months ended March 31, 2011.
Federal Income Taxes: It is the policy of the Trust to comply with the provisions of the Internal Revenue Code applicable to “regulated investment companies” and to distribute to shareholders substantially all taxable (if any) and tax exempt income of the Fund. Therefore, no provision for federal income tax is required.
Management reviews each tax position believed to be material to the preparation of the Fund’s financial statements, to assess if it is more likely than not that the position would be sustained upon examination, based upon the technical merits of the position. As of March 31, 2011, management has not identified any such position for which a liability must be reflected in the Statement of Assets and Liabilities. The Fund’s tax returns remain subject to examination for three years after filing.
When-Issued and Delayed Delivery Transactions: The Fund may engage in when-issued or delayed delivery transactions. To the extent the Fund engages in such transactions, it will do so for the purpose of acquiring portfolio securities consistent with the Fund’s investment objectives and not for the purpose of investment leverage or to speculate on interest rate and/or market changes. At the time the Fund makes a commitment to purchase a security on a when-issued or delayed delivery basis, the Fund will record the transaction and reflect the value in determining its net asset value. When effecting such transactions, assets of an amount sufficient to make payment for the portfolio securities to be purchased will be segregated on the Fund’s records on the trade date. Securities purchased on a when-issued or delayed delivery basis do not earn interest until the settlement date.
Dividends: Net investment income of the Fund is declared daily as a dividend on shares for which the Fund has received payment. Dividends are paid monthly and are reinvested in additional shares of the Fund at net asset value per share at the close of business on the dividend payment date, or at the shareholder’s option, paid in cash. Net realized capital gains, to the extent available, will be distributed at least annually.
General: Securities transactions are accounted for on a trade date basis. Interest income is accrued as earned. Premiums and discounts on securities purchased are amortized to call dates or maturity dates of the respective securities. Realized gains and losses from the sale of securities are recorded on an identified cost basis. Net investment income (other than class specific expenses) and realized and unrealized gains and losses are allocated daily to each class of shares based upon the relative net asset value of outstanding shares (or the value of the dividend-eligible shares, as appropriate) of each class of shares at the beginning of the day (after adjusting for the current capital shares activity of the respective class). Expenses common to all Funds are allocated among the Funds comprising the Trust based upon their relative net asset values or other appropriate allocation methods.
Guarantees and Indemnifications: Under the Trust’s organizational documents, its officers and Trustees are indemnified against certain liabilities arising out of the performance of their duties to the Fund. Additionally, in the normal course of business the Trust enters into contracts with service providers that contain general indemnification clauses. The Trust’s maximum exposure under these arrangements is unknown. However, based on experience, the Trust expects the risk of loss to be remote.
Use of Estimates: The preparation of financial statements, in conformity with generally accepted accounting principles, requires management to make estimates and assumptions that affect the reported amounts of assets and liabilities and the disclosure of contingent
Certified Semi-Annual Report 19
| | |
| NOTES TO FINANCIAL STATEMENTS, CONTINUED | | |
| |
| Thornburg California Limited Term Municipal Fund | | March 31, 2011 (Unaudited) |
assets and liabilities at the date of the financial statements and the reported amounts of increases and decreases in net assets from operations during the reporting period. Actual results could differ from those estimates.
NOTE 3 – INVESTMENT ADVISORY FEE AND OTHER TRANSACTIONS WITH AFFILIATES
Pursuant to an investment advisory agreement, Thornburg Investment Management, Inc. (the “Advisor”) serves as the investment advisor and performs services to the Fund for which the fees are payable at the end of each month. For the six months ended March 31, 2011, these fees were payable at annual rates ranging from .50 of 1% to .225 of 1% per annum of the average daily net assets of the Fund depending on the Fund’s asset size. The Trust also has entered into administrative services agreements with the Advisor, whereby the Advisor will perform certain administrative services for the shareholders of each class of the Fund’s shares, and for which fees will be payable at an annual rate of up to .125 of 1% per annum of the average daily net assets attributable to each class of shares. For the six months ended March 31, 2011, the Advisor voluntarily reimbursed certain class specific expenses and administrative fees of $1,580 for Class C shares.
The Trust has an underwriting agreement with Thornburg Securities Corporation (the “Distributor,” an affiliate of the Advisor), which acts as the distributor of the Fund’s shares. For the six months ended March 31, 2011, the Distributor has advised the Fund that it earned commissions aggregating $779 from the sale of Class A shares, and collected contingent deferred sales charges aggregating $3,769 from redemptions of Class C shares of the Fund.
Pursuant to a service plan under Rule 12b-1 of the Investment Company Act of 1940, the Fund may reimburse to the Advisor an amount not to exceed .25 of 1% per annum of the average daily net assets attributable to each class of shares of the Fund for payments made by the Advisor to securities dealers and other financial institutions to obtain various shareholder and distribution related services. For the six months ended March 31, 2011, there were no 12b-1 service plan fees charged for Class I shares. The Advisor may pay out of its own resources additional expenses for distribution of the Fund’s shares.
The Trust has also adopted a distribution plan pursuant to Rule 12b-1, applicable only to the Fund’s Class C shares, under which the Fund compensates the Distributor for services in promoting the sale of Class C shares of the Fund at an annual rate of up to .25 of 1% per annum of the average daily net assets attributable to Class C shares. Total fees incurred by the Distributor for each class of shares of the Fund under their respective Service and Distribution Plans and Class C distribution fees waived by the Distributor for the six months ended March 31, 2011, are set forth in the Statement of Operations.
The Trust has an agreement with the custodian bank to indirectly pay a portion of the custodian’s fees through credits earned by the Fund’s cash on deposit with the bank. This deposit agreement is an alternative to overnight investments. Custodial fees have been adjusted to reflect amounts that would have been paid without this agreement, with a corresponding adjustment reflected as fees paid indirectly in the Statement of Operations. For the six months ended March 31, 2011, fees paid indirectly were $822.
Certain officers and Trustees of the Trust are also officers and/or directors of the Advisor and Distributor. The compensation of independent Trustees is borne by the Trust.
NOTE 4 – SHARES OF BENEFICIAL INTEREST
At March 31, 2011, there were an unlimited number of shares of beneficial interest authorized. Transactions in shares of beneficial interest were as follows:
| | | | | | | | | | | | | | | | |
| | | Six Months Ended
March 31, 2011 (Unaudited) | | | Year Ended
September 30, 2010 (Audited) | |
| | | Shares | | | Amount | | | Shares | | | Amount | |
Class A Shares | | | | | | | | | | | | | | | | |
Shares sold | | | 1,502,091 | | | $ | 19,687,565 | | | | 3,682,819 | | | $ | 48,257,610 | |
Shares issued to shareholders in reinvestment of dividends | | | 70,622 | | | | 922,835 | | | | 120,579 | | | | 1,584,678 | |
Shares repurchased | | | (1,023,803 | ) | | | (13,409,063 | ) | | | (1,296,692 | ) | | | (16,998,588 | ) |
| | | | | | | | | | | | | | | | |
| | | | |
Net Increase (Decrease) | | | 548,910 | | | $ | 7,201,337 | | | | 2,506,706 | | | $ | 32,843,700 | |
| | | | | | | | | | | | | | | | |
20 Certified Semi-Annual Report
| | |
| NOTES TO FINANCIAL STATEMENTS, CONTINUED | | |
| |
| Thornburg California Limited Term Municipal Fund | | March 31, 2011 (Unaudited) |
| | | | | | | | | | | | | | | | |
| | | Six Months Ended
March 31, 2011 (Unaudited) | | | Year Ended
September 30, 2010 (Audited) | |
| | | Shares | | | Amount | | | Shares | | | Amount | |
Class C Shares | | | | | | | | | | | | | | | | |
Shares sold | | | 467,159 | | | $ | 6,139,234 | | | | 1,487,118 | | | $ | 19,552,458 | |
Shares issued to shareholders in reinvestment of dividends | | | 25,207 | | | | 329,778 | | | | 45,232 | | | | 595,327 | |
Shares repurchased | | | (502,890 | ) | | | (6,576,720 | ) | | | (379,476 | ) | | | (4,997,998 | ) |
| | | | | | | | | | | | | | | | |
| | | | |
Net Increase (Decrease) | | | (10,524 | ) | | $ | (107,708 | ) | | | 1,152,874 | | | $ | 15,149,787 | |
| | | | | | | | | | | | | | | | |
| | | | |
Class I Shares | | | | | | | | | | | | | | | | |
Shares sold | | | 2,185,624 | | | $ | 28,738,444 | | | | 3,723,169 | | | $ | 49,022,751 | |
Shares issued to shareholders in reinvestment of dividends | | | 52,831 | | | | 690,898 | | | | 80,780 | | | | 1,063,454 | |
Shares repurchased | | | (1,304,187 | ) | | | (17,001,132 | ) | | | (1,055,277 | ) | | | (13,857,362 | ) |
| | | | | | | | | | | | | | | | |
| | | | |
Net Increase (Decrease) | | | 934,268 | | | $ | 12,428,210 | | | | 2,748,672 | | | $ | 36,228,843 | |
| | | | | | | | | | | | | | | | |
NOTE 5 – SECURITIES TRANSACTIONS
For the six months ended March 31, 2011, the Fund had purchase and sale transactions of investment securities (excluding short-term investments) of $41,686,677 and $8,083,742, respectively.
NOTE 6 – INCOME TAXES
At March 31, 2011, information on the tax components of capital is as follows:
| | | | |
Cost of investments for tax purposes | | $ | 240,346,196 | |
| | | | |
Gross unrealized appreciation on a tax basis | | $ | 3,951,573 | |
Gross unrealized depreciation on a tax basis | | | (2,778,634 | ) |
| | | | |
Net unrealized appreciation (depreciation) on investments (tax basis) | | $ | 1,172,939 | |
| | | | |
At March 31, 2011, the Fund had deferred tax basis capital losses occurring subsequent to October 31, 2009 of $15,578. For tax purposes, such losses will be reflected in the year ending September 30, 2011.
At March 31, 2011, the Fund had tax basis capital losses of $207,914, which may be carried forward to offset future capital gains. To the extent such carryforwards are used, capital gain distributions may be reduced to the extent provided by regulations. Such capital loss carryforwards expire September 30, 2015.
OTHER NOTES
Fund management believes no events have occurred between March 31, 2011 and May 20, 2011, the date of issuance of the financial statements, which require adjustment of, or disclosure in, the accompanying financial statements.
Certified Semi-Annual Report 21
| | |
| FINANCIAL HIGHLIGHTS | | |
| |
| Thornburg California Limited Term Municipal Fund | | |
| | | | | | | | | | | | | | | | | | | | | | | | | | | | | | | | | | | | | | | | | | | | | | | | | | | | | | | | | | | | |
Unless
Otherwise
Noted,
Periods
are
Fiscal
Years
Ended
Sept. 30, | | PER SHARE PERFORMANCE (for a share outstanding throughout the period)+ | | | RATIOS TO AVERAGE NET ASSETS | | | SUPPLEMENTAL DATA | |
| | Net Asset
Value
Beginning
of
Period | | | Net
Investment
Income
(Loss) | | | Net
Realized
&
Unrealized
Gain (Loss)
on
Investments | | | Total from
Investment
Operations | | | Dividends
from Net
Investment
Income | | | Dividends
from Net
Realized
Gains | | | Total
Dividends | | | Net
Asset
Value
End
of
Period | | | Net
Investment
Income
(Loss)
(%) | | | Expenses,
After
Expense
Reductions
(%) | | | Expenses,
After
Expense
Reductions
and
Net of
Custody
Credits
(%) | | | Expenses,
Before
Expense
Reductions
(%) | | | Total
Return
(%)(a) | | | Portfolio
Turnover
Rate (%) | | | Net Assets
at End
of Period
(Thousands) | |
Class A Shares | | | | | | | | | | | | | | | | | | | | | | | | | | | | | | | | | | | | | |
2011(b)(c) | | $ | 13.38 | | | | 0.18 | | | | (0.45 | ) | | | (0.27 | ) | | | (0.18 | ) | | | — | | | | (0.18 | ) | | $ | 12.93 | | | | 2.76 | (d) | | | 0.96 | (d) | | | 0.96 | (d) | | | 0.96 | (d) | | | (2.02 | ) | | | 3.52 | | | $ | 118,020 | |
2010(c) | | $ | 13.09 | | | | 0.39 | | | | 0.29 | | | | 0.68 | | | | (0.39 | ) | | | — | | | | (0.39 | ) | | $ | 13.38 | | | | 2.94 | | | | 0.97 | | | | 0.97 | | | | 0.97 | | | | 5.29 | | | | 13.69 | | | $ | 114,813 | |
2009(c) | | $ | 12.49 | | | | 0.44 | | | | 0.60 | | | | 1.04 | | | | (0.44 | ) | | | — | | | | (0.44 | ) | | $ | 13.09 | | | | 3.48 | | | | 0.98 | | | | 0.98 | | | | 0.99 | | | | 8.50 | | | | 44.06 | | | $ | 79,455 | |
2008(c) | | $ | 12.73 | | | | 0.42 | | | | (0.24 | ) | | | 0.18 | | | | (0.42 | ) | | | — | | | | (0.42 | ) | | $ | 12.49 | | | | 3.32 | | | | 1.00 | | | | 0.98 | | | | 1.00 | | | | 1.42 | | | | 34.88 | | | $ | 66,023 | |
2007(c) | | $ | 12.77 | | | | 0.43 | | | | (0.04 | ) | | | 0.39 | | | | (0.43 | ) | | | — | | | | (0.43 | ) | | $ | 12.73 | | | | 3.37 | | | | 0.99 | | | | 0.99 | | | | 1.01 | | | | 3.10 | | | | 22.71 | | | $ | 67,183 | |
2006(c) | | $ | 12.79 | | | | 0.40 | | | | (0.02 | ) | | | 0.38 | | | | (0.40 | ) | | | — | | | | (0.40 | ) | | $ | 12.77 | | | | 3.17 | | | | 0.92 | | | | 0.87 | | | | 1.01 | | | | 3.06 | | | | 25.77 | | | $ | 80,589 | |
| | | | | | | | | |
Class C Shares | | | | | | | | | | | | | | | | | | | | | | | | | | | | | | | | | | | | | |
2011(b) | | $ | 13.40 | | | | 0.16 | | | | (0.46 | ) | | | (0.30 | ) | | | (0.16 | ) | | | — | | | | (0.16 | ) | | $ | 12.94 | | | | 2.50 | (d) | | | 1.21 | (d) | | | 1.21 | (d) | | | 1.22 | (d) | | | (2.22 | ) | | | 3.52 | | | $ | 40,478 | |
2010 | | $ | 13.10 | | | | 0.35 | | | | 0.30 | | | | 0.65 | | | | (0.35 | ) | | | — | | | | (0.35 | ) | | $ | 13.40 | | | | 2.67 | | | | 1.23 | | | | 1.23 | | | | 1.74 | | | | 5.09 | | | | 13.69 | | | $ | 42,039 | |
2009 | | $ | 12.50 | | | | 0.41 | | | | 0.60 | | | | 1.01 | | | | (0.41 | ) | | | — | | | | (0.41 | ) | | $ | 13.10 | | | | 3.23 | | | | 1.24 | | | | 1.24 | | | | 1.76 | | | | 8.22 | | | | 44.06 | | | $ | 26,004 | |
2008 | | $ | 12.74 | | | | 0.39 | | | | (0.24 | ) | | | 0.15 | | | | (0.39 | ) | | | — | | | | (0.39 | ) | | $ | 12.50 | | | | 3.06 | | | | 1.26 | | | | 1.24 | | | | 1.78 | | | | 1.16 | | | | 34.88 | | | $ | 15,963 | |
2007 | | $ | 12.78 | | | | 0.40 | | | | (0.04 | ) | | | 0.36 | | | | (0.40 | ) | | | — | | | | (0.40 | ) | | $ | 12.74 | | | | 3.13 | | | | 1.24 | | | | 1.23 | | | | 1.79 | | | | 2.85 | | | | 22.71 | | | $ | 14,449 | |
2006 | | $ | 12.80 | | | | 0.37 | | | | (0.02 | ) | | | 0.35 | | | | (0.37 | ) | | | — | | | | (0.37 | ) | | $ | 12.78 | | | | 2.92 | | | | 1.18 | | | | 1.13 | | | | 1.83 | | | | 2.80 | | | | 25.77 | | | $ | 16,801 | |
| | | | | | | | | |
Class I Shares | | | | | | | | | | | | | | | | | | | | | | | | | | | | | | | | | | | | | |
2011(b) | | $ | 13.40 | | | | 0.20 | | | | (0.46 | ) | | | (0.26 | ) | | | (0.20 | ) | | | — | | | | (0.20 | ) | | $ | 12.94 | | | | 3.10 | (d) | | | 0.62 | (d) | | | 0.62 | (d) | | | 0.62 | (d) | | | (1.93 | ) | | | 3.52 | | | $ | 88,363 | |
2010 | | $ | 13.10 | | | | 0.43 | | | | 0.30 | | | | 0.73 | | | | (0.43 | ) | | | — | | | | (0.43 | ) | | $ | 13.40 | | | | 3.27 | | | | 0.63 | | | | 0.63 | | | | 0.63 | | | | 5.72 | | | | 13.69 | | | $ | 78,948 | |
2009 | | $ | 12.50 | | | | 0.48 | | | | 0.60 | | | | 1.08 | | | | (0.48 | ) | | | — | | | | (0.48 | ) | | $ | 13.10 | | | | 3.81 | | | | 0.65 | | | | 0.65 | | | | 0.65 | | | | 8.86 | | | | 44.06 | | | $ | 41,186 | |
2008 | | $ | 12.74 | | | | 0.47 | | | | (0.24 | ) | | | 0.23 | | | | (0.47 | ) | | | — | | | | (0.47 | ) | | $ | 12.50 | | | | 3.66 | | | | 0.65 | | | | 0.63 | | | | 0.65 | | | | 1.77 | | | | 34.88 | | | $ | 41,814 | |
2007 | | $ | 12.78 | | | | 0.47 | | | | (0.04 | ) | | | 0.43 | | | | (0.47 | ) | | | — | | | | (0.47 | ) | | $ | 12.74 | | | | 3.71 | | | | 0.66 | | | | 0.65 | | | | 0.68 | | | | 3.44 | | | | 22.71 | | | $ | 31,918 | |
2006 | | $ | 12.80 | | | | 0.44 | | | | (0.02 | ) | | | 0.42 | | | | (0.44 | ) | | | — | | | | (0.44 | ) | | $ | 12.78 | | | | 3.50 | | | | 0.66 | | | | 0.55 | | | | 0.71 | | | | 3.39 | | | | 25.77 | | | $ | 28,334 | |
| (a) | Not annualized for periods less than one year. |
| (b) | Unaudited Six Month Period Ended March 31. |
| (c) | Sales loads are not reflected in computing total return. |
| + | Based on weighted average shares outstanding. |
See notes to financial statements.
| | |
| 22 Certified Semi-Annual Report | | Certified Semi-Annual Report 23 |
| | |
| EXPENSE EXAMPLE | | |
| |
| Thornburg California Limited Term Municipal Fund | | March 31, 2011 (Unaudited) |
As a shareholder of the Fund, you incur two types of costs:
| | (1) | transaction costs, including |
(a) sales charges (loads) on purchase payments, for Class A shares;
(b) a deferred sales charge on redemptions of any part or all of a purchase of $1 million of Class A shares within 12 months of purchase;
(c) a deferred sales charge on redemptions of Class C shares within 12 months of purchase;
| | (2) | ongoing costs, including management fees; distribution and/or service (12b-1) fees; and other Fund expenses. |
This example is intended to help you understand your ongoing costs (in dollars) of investing in the Fund and to compare these costs with the ongoing costs of investing in other mutual funds.
The example is based on a $1,000 investment beginning on October 1, 2010, and held until March 31, 2011.
ACTUAL EXPENSES
For each class of shares, the first line of the table at right provides information about actual account values and actual expenses. You may use the information in this line, together with the amount you invested, to estimate the expenses that you paid over the period. Simply divide your account value by $1,000 (for example, an $8,600 account value divided by $1,000 = 8.6), then multiply the result by the number in the first line for your class of shares under the heading entitled “Expenses Paid During Period” to estimate the expenses you paid on your account during this period.
HYPOTHETICAL EXAMPLE FOR COMPARISON PURPOSES
For each class of shares, the second line of the table at right provides information about hypothetical account values and hypothetical expenses based on the Fund’s actual expense ratio and an assumed rate of return of 5% per year before expenses, which is not the Fund’s actual return. The hypothetical account values and expenses may not be used to estimate the actual ending account balance or expenses you paid for the period. You may use this information to compare the ongoing costs of investing in the Fund and other funds. To do so, compare this 5% hypothetical example with the 5% hypothetical examples that appear in the shareholder reports of the other funds.
| | | | | | | | | | | | |
| | | Beginning
Account Value
10/1/10 | | | Ending
Account Value
3/31/11 | | | Expenses Paid
During Period†
10/1/10–3/31/11 | |
Class A Shares | | | | | | | | | | | | |
Actual | | $ | 1,000.00 | | | $ | 979.80 | | | $ | 4.72 | |
Hypothetical* | | $ | 1,000.00 | | | $ | 1,020.16 | | | $ | 4.82 | |
Class C Shares | | | | | | | | | | | | |
Actual | | $ | 1,000.00 | | | $ | 977.80 | | | $ | 5.98 | |
Hypothetical* | | $ | 1,000.00 | | | $ | 1,018.89 | | | $ | 6.10 | |
Class I Shares | | | | | | | | | | | | |
Actual | | $ | 1,000.00 | | | $ | 980.70 | | | $ | 3.07 | |
Hypothetical* | | $ | 1,000.00 | | | $ | 1,021.83 | | | $ | 3.13 | |
| † | Expenses are equal to the annualized expense ratio for each class (A: 0.96%; C: 1.21%; I: 0.62%) multiplied by the average account value over the period, multiplied by 182/365 to reflect the one-half year period. |
| * | Hypothetical assumes a rate of return of 5% per year before expenses. |
Please note that the expenses shown in the table are meant to highlight your ongoing costs only and do not reflect any transactional costs, such as sales charges (loads), redemption fees, or exchange fees. Therefore, the second line of the table for each class of shares is useful in comparing ongoing costs only, and will not help you determine the relative total costs of owning different funds. In addition, if these transactional costs were included, your costs would have been higher.
24 Certified Semi-Annual Report
| | |
| OTHER INFORMATION | | |
| |
| Thornburg California Limited Term Municipal Fund | | March 31, 2011 (Unaudited) |
PORTFOLIO PROXY VOTING
Policies and Procedures:
The Trust has delegated to Thornburg Investment Management, Inc. (the “Advisor”) voting decisions respecting proxies for the Fund’s voting securities. The Advisor makes voting decisions in accordance with its Proxy Voting Policy and Procedures. A description of the Policy and Procedures is available (i) without charge, upon request, by calling the Advisor toll-free at 1-800-847-0200, (ii) on the Thornburg website at www.thornburg.com, and (iii) on the Securities and Exchange Commission’s website at www.sec.gov.
Information regarding how proxies were voted is available on or before August 31 of each year for the twelve months ending the preceding June 30. This information is available (i) without charge, upon request by calling the Advisor toll-free at 1-800-847-0200, (ii) on the Thornburg website at www.thornburg.com, and (iii) on the Securities and Exchange Commission’s website at www.sec.gov.
AVAILABILITY OF QUARTERLY PORTFOLIO SCHEDULE
The Fund files with the Securities and Exchange Commission schedules of its portfolio holdings on Form N-Q for the first and third quarters of each fiscal year. The Fund’s Forms N-Q are available on the Commission’s website at www.sec.gov, or may be reviewed and copied at the Commission’s Public Reference Room in Washington, D.C. Information on the operation of the Public Reference Room may be obtained by calling 1-800-SEC-0330. The Fund also makes this information available on its website at www.thornburg.com/ download or upon request by calling 1-800-847-0200.
Certified Semi-Annual Report 25
Trustees’ Statement to Shareholders
Not part of the Certified Semi-Annual Report
February 8, 2005, as readopted September 13, 2010
The Trustees are concerned that ongoing commentaries and opinions reported in the media may confuse investors in general as to the supervisory duties of trustees of mutual funds and, in particular, leave Thornburg Investment Trust shareholders uncertain regarding how we discharge our responsibilities in supervising the Funds’ investment advisor and in reviewing the advisor’s contract for renewal. We decided to spell out clearly three principal guidelines that we follow in supervising the Trust’s investment advisor on your behalf.
We begin with the premise that each shareholder selected his or her Fund because its investments are managed by the investment advisor identified in the prospectus and in accordance with the objective and policies described in the prospectus. We realize, as each of you do, that if you believe that your Fund’s stated objective and policies no longer serve your personal investment goals, you can sell your shares and leave the Fund.
Therefore, we believe that our primary supervisory task – our principal obligation to you – is to assess the nature and quality of the advisor’s services, and to confirm that the advisor actively and competently pursues the Fund’s objective, in accordance with the policies set out in the prospectus. To do this, we meet regularly with management to review your Fund’s portfolio and to discuss the advisor’s specific actions and judgments in pursuing the Fund’s objective. We do not substitute our own judgment for the advisor’s decisions in selecting investments; the advisor is paid to exercise its informed judgment on investment decisions, and we seek to confirm, in reviewing the advisor’s performance, that the advisor is doing just that.
Second, while we are conscious of costs and the effect that costs have on shareholders’ returns, we do not seek the lowest fees or expense ratio as our sole or primary objective. We try to make sure that your Fund’s fees and costs are reasonable in relationship to the services rendered and that they are generally in line with those charged by other expert investment advisors, consistent with our belief that the Fund’s investors searched for and expect that expertise and attention and have decided to pay a reasonable price for it. We do not put the management contract “out to bid” as a matter of course, and we would not do so unless we had concluded that the advisor materially had failed to pursue the Fund’s objectives in accordance with its policies, or for other equally important reasons. We believe that any other approach would be inconsistent with your interests and contrary to your expectations when you bought shares of the Fund in the first place.
Finally, because we believe that most Thornburg Fund shareholders have invested with a long-term perspective, we try not to focus too much on the fashions of the moment and on short-term performance. The market will not favor any specific investment objective or set of policies at all times and under all economic circumstances. A fund will experience periods of both high and low returns relative to other funds and other investments. Even if one of our Funds is not favored by the market at a particular time, we believe that the advisor is nonetheless obliged to remain true to the Fund’s objective and policies, and we watch to see that it does so.
26 This page is not part of the Semi-Annual Report.
Retirement and Education Accounts
Thornburg Investment Management offers retirement and education savings accounts that can help you meet a variety of planning challenges. For account applications or further information on any of the accounts below, please call 1-800-847-0200 or go to www.thornburg.com/ira. Your financial advisor can help you determine which plan is right for you.
Individual Retirement Accounts
Individual Retirement Accounts (IRAs) provide a tax-advantaged means to save money for the future. For a detailed outline of the difference between retirement accounts, see www.thornburg.com/ira. Rollovers are available. Call 1-800-847-0200 for more information.
Traditional IRAs – Contributions to Traditional IRAs are tax deductible for eligible individuals, and withdrawals are taxed as additional ordinary income. You may contribute to an IRA if you receive compensation and are under 70 1/2, even if you are covered by an employer retirement plan. Deductible contributions are subject to certain qualifications. Please consult your tax advisor.
Roth IRAs – Under a Roth IRA, there is no tax deduction for contributions, but there is no income tax on qualified withdrawals. For a more detailed comparison of Traditional and Roth IRAs, please see our web site at www.thornburg.com/ira.
SEP IRAs – Simplified Employee Pension (SEP) IRAs are established by employers. The employer is allowed a tax deduction for contributions made to the SEP Plan and makes contributions to each eligible employee’s SEP IRA on a discretionary basis.
SIMPLE IRAs – Savings Incentive Match Plan for Employees of Small Employers (SIMPLE) is designed to give small business owners a simplified method to establish and contribute to a retirement plan for employees. The employer is allowed a tax deduction for contributions and makes either matching or non-elective contributions to each eligible employee’s SIMPLE IRA. Employees may make salary deferral contributions.
Coverdell Education Savings Account
These savings accounts are designed to provide a way to save money for higher education expenses. In an Education Savings Account, earnings and interest grow tax-free, and qualified withdrawals used to pay for eligible higher-education expenses are tax- and penalty-free.
Funds Available
The following funds are available in the accounts listed above:
| | • | | Thornburg International Value Fund |
| | • | | Thornburg Core Growth Fund |
| | • | | Thornburg Investment Income Builder Fund |
| | • | | Thornburg Global Opportunities Fund |
| | • | | Thornburg International Growth Fund |
| | • | | Thornburg Developing World Fund |
| | • | | Thornburg Limited Term U.S. Government Fund |
| | • | | Thornburg Limited Term Income Fund |
| | • | | Thornburg Strategic Income Fund |
This page is not part of the Semi-Annual Report. 27

Thornburg Equity Funds
Thornburg’s equity research uses a fundamental and comprehensive analytical approach. Thornburg equity funds focus on a limited number of securities so that each holding can impact performance. The equity team searches for firms believed to have a promising future and seeks to buy shares of those companies at a discount to their intrinsic value.
| | • | | Thornburg International Value Fund |
| | • | | Thornburg Core Growth Fund |
| | • | | Thornburg Investment Income Builder Fund |
| | • | | Thornburg Global Opportunities Fund |
| | • | | Thornburg International Growth Fund |
| | • | | Thornburg Developing World Fund |
Thornburg Bond Funds
Thornburg Investment Management applies a disciplined philosophy to fixed-income management. Since the launch of our first fixed-income fund over 25 years ago, we have been conducting fundamental, bottom-up research in an effort to identify bonds which we believe provide the best return for a given level of risk. We are very organic in our approach, avoiding leverage or complex strategies which could backfire in periods of market uncertainty.
| | • | | Thornburg Limited Term Municipal Fund |
| | • | | Thornburg Intermediate Municipal Fund |
| | • | | Thornburg California Limited Term Municipal Fund |
| | • | | Thornburg New Mexico Intermediate Municipal Fund |
| | • | | Thornburg New York Intermediate Municipal Fund |
| | • | | Thornburg Strategic Municipal Income Fund |
| | • | | Thornburg Limited Term U.S. Government Fund |
| | • | | Thornburg Limited Term Income Fund |
| | • | | Thornburg Strategic Income Fund |
Before investing, carefully consider the Fund’s investment goals, risks, charges, and expenses. For a prospectus containing this and other information, contact your financial advisor or visit thornburg.com. Read it carefully before investing.
For additional information, please visit www.thornburg.com
Thornburg Investment Management, Inc. 2300 North Ridgetop Road, Santa Fe, NM 87506
This page is not part of the Semi-Annual Report. 29
This page intentionally left blank.
30 This page is not part of the Semi-Annual Report.
This page intentionally left blank.
This page is not part of the Semi-Annual Report. 31
| | | | | | |
 | | Waste not, Wait not | |  |
| | |
| | |
| | | | Get instant access to your shareholder reports. |
| | |
| | This Semi-Annual Report is submitted for the general information of shareholders of the Fund. It is not authorized for distribution to prospective investors in the Fund unless preceded or accompanied by an effective prospectus. | | By switching from your postal mailbox to your email inbox, you reduce paper clutter, improve record keeping access, and help conserve our natural resources. |
| | |

| | Investment Advisor: Thornburg Investment Management® | | Go to www.thornburg.com/edelivery and sign up to receive your shareholder reports, prospectuses, and proxy statements electronically. |
| | 800.847.0200 | | |
| | Distributor: | | |
| | Thornburg Securities Corporation® 800.847.0200 | | You invest in the future, without spending a dime. |
| | TH1070 | | |

Important Information
The information presented on the following pages was current as of March 31, 2011. The managers’ views, portfolio holdings, and sector diversification are provided for the general information of the Fund’s shareholders; they are historical and subject to change. This material should not be deemed a recommendation to buy or sell any of the securities mentioned.
Investments in the Fund carry risks, including possible loss of principal. Bond funds have the same interest rate, inflation, and credit risks that are associated with the underlying bonds. The principal value of bonds will fluctuate relative to changes in interest rates, decreasing when interest rates rise. Unlike bonds, bond funds have ongoing fees and expenses. Please see the Fund’s Prospectus for a discussion of the risks associated with an investment in the Fund. Investments in the Fund are not FDIC insured, nor are they deposits of or guaranteed by a bank or any other entity. There is no guarantee that the Fund will meet its investment objectives. The laddering strategy does not assure or guarantee better performance and cannot eliminate the risk of investment losses.
Performance data given at net asset value (NAV) does not take into account the applicable sales charges. If the sales charges had been included, the performance would have been lower.
Minimum investments for Class I shares are higher than those for other classes. Class I shares may not be available to all investors.
| | | | |
Share Class | | NASDAQ Symbol | | Cusip |
| Class A | | THNMX | | 885-215-301 |
| Class D | | THNDX | | 885-215-624 |
| Class I | | THNIX | | 885-215-285 |
Glossary
BofA Merrill Lynch 7-12 Year U.S. Municipal Securities Index – The index represents a broad measure of market performance. It is a model portfolio of municipal obligations throughout the U.S., with an average maturity which ranges from seven to twelve years.
BofA Merrill Lynch Municipal Master Index – This index tracks the performance of the investment-grade U.S. tax-exempt bond market. Qualifying bonds must have at least one year remaining term to maturity, a fixed coupon schedule, and an investment grade rating (based on average of Moody’s, S&P, and Fitch).
Unless otherwise noted, index returns reflect the reinvestment of income dividends and capital gains, if any, but do not reflect fees, brokerage commissions or other expenses of investing. Investors may not make direct investments into any index.
Alternative Minimum Tax (AMT) – A federal tax aimed at ensuring that high-income individuals, estates, trusts, and corporations pay a minimal level income tax. For individuals, the AMT is calculated by adding tax preference items to regular taxable income.
Annualized Distribution Yield – The distribution yield is calculated by taking the sum of the month’s total distribution factors and dividing this sum by a 30-day period and annualizing to a 360-day year. The value is then divided by the ending maximum offering price per share to arrive at the annualized distribution yield. The yield is calculated on a periodic basis and is subject to change.
Basis Point (BPS) – A unit equal to 1/100th of 1%. 1% = 100 basis points (bps).
Bond Credit Ratings – A bond credit rating assesses the financial ability of a debt issuer to make timely payments of principal and interest. Ratings of AAA (the highest), AA, A, and BBB are investment-grade quality. Ratings of BB, B, CCC, CC, C, and D (the lowest) are considered below investment grade, speculative grade, or junk bonds. Unless otherwise noted, the ratings listed are from Municipal Market Data and are a combination of ratings from standard and poor’s, Moody’s Investors Service, and Fitch Ratings.
Build America Bonds (BAB) – Taxable municipal bonds that feature tax credits and/or federal subsidies for bondholders and state and local government bond issuers. Build America Bonds (BABs) were introduced in 2009 as part of President Obama’s American Recovery and Reinvestment Act to create jobs and stimulate the economy. BABs attempt to achieve this by lowering the cost of borrowing for state and local governments in financing new projects.
Capacity Utilization – The extent to which an enterprise or a nation actually uses its installed productive capacity. Capacity utilization reflects overall growth and demand in the economy, rising when the economy is vibrant, and falling when demand softens. High capacity utilization also exerts inflationary pressures as scarce resources are in higher demand. However, it may also lead to new capital investments, such as new plants, that promote growth in the future.
This page is not part of the Semi-Annual Report. 3
Important Information,
Continued
Consumer Price Index (CPI) – An index that measures prices of a fixed basket of goods bought by a typical consumer, including food, transportation, shelter, utilities, clothing, medical care, entertainment and other items. The CPI, published by the Bureau of Labor Statistics in the Department of Labor, is based at 100 in 1982 and is released monthly. It is widely used as a cost-of-living benchmark to adjust Social Security payments and other payment schedules, union contracts and tax brackets. The CPI is also known as the cost-of-living index.
Core CPI – Consumer Price Index minus the energy and food components.
Effective Duration – A bond’s sensitivity to interest rates, incorporating the embedded option features, such as call provisions. Bonds with longer durations experience greater price volatility than bonds with shorter durations.
Fed Funds Rate – The interest rate at which a depository institution lends immediately available funds (balances at the Federal Reserve) to another depository institution overnight.
M2 – The amount of money in circulation in notes and coin plus non-interest-bearing bank deposits, building-society deposits, and National Savings accounts.
QE2 or Quantitative Easing 2 – The second round of the Federal Reserve’s monetary policy used to stimulate the U.S. economy following the recession that began in 2007/08. QE2 was initiated in the fourth quarter of 2010 in order to jump-start the sluggish economic recovery.
SEC Yield – SEC Yield is computed in accordance with SEC standards measuring the net investment income per share over a specified 30-day period expressed as a percentage of the maximum offering price of the Fund’s shares at the end of the period.
Taylor Rule – A monetary-policy formula that provides an indication of how much the central bank would or should change the nominal interest rate in response to divergences of actual inflation rates from target inflation rates and of actual Gross Domestic Product (GDP) from potential GDP. It was first proposed by the U.S. economist John B. Taylor in 1993. The Federal Reserve Board may not use the Taylor Rule in setting monetary policy.
Treasury Inflation Protected Securities (TIPS) – Either a U.S. Treasury note or bond that offers protection from the effects of inflation. Using the Consumer Price Index as a guide, the value of the principal is adjusted to reflect the effects of inflation. A fixed interest rate is paid semi-annually on the adjusted amount. At maturity, if inflation has increased the value of the principal, the investor receives the higher value. If deflation has decreased the value, the investor receives the original face amount of the security.
4 This page is not part of the Semi-Annual Report.
Thornburg New Mexico Intermediate Municipal Fund
At Thornburg, our approach to management of the Fund is based on the premise that investors in the Fund seek preservation of capital along with an attractive, relatively stable yield. While aggressive bond strategies may generate stronger returns when the market is turning a blind eye towards risk, they usually fail to stack up over longer periods of time.
We apply time-tested techniques to manage risk and provide attractive returns. These include:
| | • | | Building a laddered portfolio. Laddering has been shown over time to mitigate price and interest rate risk. |
| | • | | Investing on a cash-only basis without using leverage. While leveraged strategies may enhance returns when market conditions are favorable, they can quickly compound losses when sentiment shifts. |
| | • | | Conducting in-depth fundamental research on each issue and actively monitoring positions for subsequent credit events. |
| | • | | Diversifying among a large number of generally high-quality bonds. |
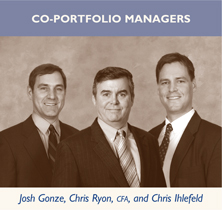
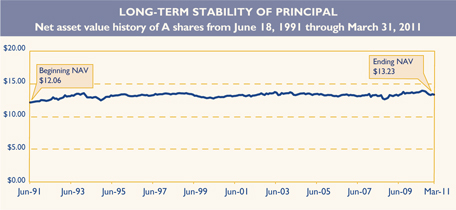
IMPORTANT PERFORMANCE INFORMATION
Performance data shown represents past performance and is no guarantee of future results. Investment return and principal value will fluctuate so shares, when redeemed, may be worth more or less than their original cost. Current performance may be lower or higher than quoted. For performance current to the most recent month end, visit thornburg.com or call 800.847.0200.
The maximum sales charge for the Fund’s Class A shares is 2.00%. The total annual fund operating expense of Class A shares is 0.96%, as disclosed in the most recent Prospectus.
AVERAGE ANNUAL TOTAL RETURNS
For periods ended March 31, 2011
| | | | | | | | | | | | | | | | | | | | |
| | | 1 Yr | | | 3 Yrs | | | 5 Yrs | | | 10 Yrs | | | Since
Inception | |
A Shares (Incep: 6/18/91) | | | | | | | | | | | | | | | | | | | | |
Without sales charge | | | 1.60 | % | | | 3.78 | % | | | 3.82 | % | | | 3.73 | % | | | 4.80 | % |
With sales charge | | | -0.40 | % | | | 3.08 | % | | | 3.39 | % | | | 3.52 | % | | | 4.69 | % |
30-DAY YIELDS, A SHARES
As of March 31, 2011
| | | | |
Annualized Distribution Yield | | SEC
Yield | |
3.18% | | | 2.40 | % |
KEY PORTFOLIO ATTRIBUTES
As of March 31, 2011
| | | | |
Number of Bonds | | | 123 | |
Effective Duration | | | 5.5 Yrs | |
Average Maturity | | | 8.6 Yrs | |
See the entire portfolio in the Schedule of Investments beginning on page 10.
This page is not part of the Semi-Annual Report. 5

Thornburg New Mexico Intermediate Municipal Fund
March 31, 2011
Table of Contents
This report is certified under the Sarbanes-Oxley Act of 2002, which requires that public companies, including mutual funds, affirm that the information provided in their annual and semiannual shareholder reports fully and fairly represents their financial position.
6 Certified Semi-Annual Report
Letter to Shareholders
| | |


| | April 13, 2011 Dear Fellow Shareholder: We are pleased to present the semi-annual report for the Thornburg New Mexico Intermediate Municipal Fund. The net asset value (NAV) of the Class A shares declined from $13.78 to $13.23 during the six months ended March 31, 2011. If you were invested with us for the entire period, you received dividends of 21.8 cents per share. If you reinvested your dividends, you received 21.9 cents per share. Dividends per share were lower for Class D shares and higher for Class I shares to account for varying class-specific expenses. The first quarter of 2011 witnessed a supply lull in the municipal bond market, delivering the lightest quarter for new deals in eleven years. It followed a huge volume of deals that were brought to market in the last quarter of 2010. In addition to the light new deal calendar in the first quarter, average daily trading volume was low, measuring $11.6 billion, down 15% from the prior year. Today, conditions in the municipal bond market are characterized by low yields for short-term bonds, combined with a steep yield curve (the difference between long- and short-term interest rates), resulting in relatively more attractive yields for intermediate- and long-term bonds. Today’s municipal yield curve is the steepest in 20 years. In the last six months, rates rose, shifting upward by 56 basis points for five-year maturities, by 81 basis points for 10-year maturities, and by 86 basis points for 20-year maturities. This additional steepening of the yield curve caused longer maturity municipal bond funds to underperform shorter maturity municipal bond funds. Credit spreads are wide, relative to historical averages, with single-A municipal bonds paying on average 110 basis points more than AAA bonds at the end of March 2011. Municipal bond fund investors have been in redemption mode for the past six months, following approximately 22 months of net inflows into municipal bond funds that reversed in late November 2010. Large market outflows were prompted by default fears and falling mutual fund NAVs, but since January 2011, these concerns have abated somewhat. At this point, bond fund outflows industry wide have slowed from a peak of almost $4 billion weekly to around $500 million as this is written. Recent legislation has created both positive and negative forces for performance of municipal bonds. The expiration of the Build America Bond program at the end of 2010 has not led to sharp growth in tax-exempt volume, as some had forecast. In 2010, Congress extended the Bush tax cuts another two years, so the top marginal tax rate remains at 35%, rather than escalating to 39.6%, which would have created yet more demand for tax-exempt income. Over the years we have seen many tax reform proposals come and go. Currently, a batch of new proposals is blanketing |
Certified Semi-Annual Report 7
Letter to Shareholders,
Continued
Washington, DC. If any of the proposals gain real traction, we’ll gauge the impact on our portfolio and seek to make appropriate adjustments.
The U.S. economic picture over the last six months has strengthened, but there remains a large degree of slack. Increased economic activity is reflected in the current 2.5% to 3.0% Gross Domestic Product (GDP) growth rate and healthy sales indicators. Unemployment remains high at 8.8%, though payroll growth was encouraging in February and March 2011, when we saw the best back-to-back increases since the recession’s official end in June 2009. Capacity utilization is still low at 76%, leaving excess capacity in the economy. Year over year, the Consumer Price Index (CPI) is currently around 2.0% to 2.5%, much higher than the core CPI rate which is only 1.1% to 1.25%. Meanwhile, the difference between 10-year TIPS yields and 10-year Treasuries is running around 2.7%, and is often viewed as a market opinion of 10-year inflation expectations. We expect QE2, the second phase of quantitative easing, to end abruptly in June 2011.
We are becoming more optimistic about the fiscal outlook for state and local governments. We have been pleased to see a rebound in revenues in most states, driven by growth in income tax and sales tax revenue. Revenues in New Mexico grew 17.7% in the fourth quarter of 2010 versus the fourth quarter of 2009. A preliminary report from the Rockefeller Institute stated that overall state tax revenue grew 6.9% in the fourth quarter of 2010, with 41 states reporting higher revenue.
New Mexico in particular, while under fiscal stress, is in relatively good condition compared with many other states. The new $5.4 billion budget signed into law for fiscal year 2011-2012 managed to cut spending and avoid a tax hike. The fiscal year 2011 ending balance was about $235 million, or 4.5% of recurring appropriations. One challenge is that the state’s two employee pension funds are substantially underfunded, at 66% for one and 78% for the other.
The Fed is still in super-stimulative mode, with the fed funds rate at nearly 0% since December 2008, which is viewed as appropriate according to the Taylor Rule, which currently indicates the fed funds rate should be negative 1.45%. The Taylor Rule is a formula guideline for evaluating the level of the fed funds rate created by Stanford University economist John Taylor. M2, a broad measure of money and money substitutes, has grown only 4% in the last year, at the lower end of the 3% to 10% annual growth rate that has prevailed over the last decade. Velocity of M2, the degree to which money turns over (a contributor to inflation), has remained muted.
Your Fund contains a laddered portfolio of more than 120 municipal bonds. Your Fund is broadly diversified across sectors and 89% invested in bonds rated A or above by at least one of the major rating agencies. We ladder the maturity dates of our bonds so that some of the bonds are scheduled to mature during each of the coming years. Laddering short and intermediate bonds accomplishes two goals. First, the staggered bond maturities contained in a ladder reduce interest-rate risk and dampen the Fund’s price volatility. Second, laddering gives the Fund a steady cash-flow stream from maturing bonds to reinvest toward the top end of the
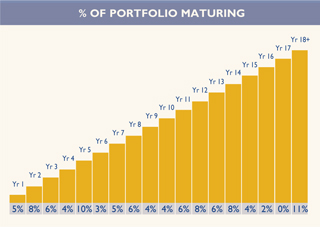
As of 3/31/11. Percentages vary over time.
Data may not add up to 100% due to rounding.
8 Certified Semi-Annual Report
ladder where yields are higher. The chart on the previous page describes the percentages of your Fund’s bond portfolio maturing in each of the coming years.
The Class A shares of your Fund produced a total return of negative 2.33% at NAV for the six months ended March 31, 2011, compared to negative 2.96% for the BofA Merrill Lynch 7-12 Year Municipal Bond Index. The main contributor to the difference in performance is that the duration of the index is longer at 6.9 years, compared to an effective duration of about 5.5 years for your Fund. Duration is a measure of a fund’s sensitivity to changes in interest rates. The total return of the overall municipal bond market as measured by the BofA Merrill Lynch Municipal Master Index in the six-month period ended March 31, 2011, was negative 4.24%.
Historically, our practice of laddering a diversified portfolio of short- and intermediate-maturity bonds has allowed your Fund to perform consistently well in varying interest rate environments. Thank you for investing in Thornburg New Mexico Intermediate Municipal Fund.
Sincerely,
| | | | | | |
 | |  | |  | | |
Christopher Ihlefeld | | Christopher Ryon,CFA | | Josh Gonze | | |
Co-Portfolio Manager | | Co-Portfolio Manager | | Co-Portfolio Manager | | |
Managing Director | | Managing Director | | Managing Director | | |
The matters discussed in this report may constitute forward-looking statements made pursuant to the safe harbor provisions of the Securities Litigation Reform Act of 1995. These include any advisor or portfolio manager prediction, assessment, analysis or outlook for individual securities, industries, investment styles, market sectors and/or markets. These statements involve risks and uncertainties. In addition to the general risks described for each fund in its current prospectus, other factors bearing on these reports include the accuracy of the advisor’s or portfolio manager’s forecasts and predictions, the appropriateness of the investment strategies designed by the advisor or portfolio manager and the ability of the advisor or portfolio manager to implement their strategies efficiently and successfully. Any one or more of these factors, as well as other risks affecting the securities markets generally, could cause the actual results of any fund to differ materially as compared to its benchmarks.
Certified Semi-Annual Report 9
| | |
| SCHEDULE OF INVESTMENTS | | |
| |
| Thornburg New Mexico Intermediate Municipal Fund | | March 31, 2011 (Unaudited) |
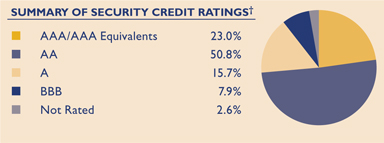
We have used ratings from Standard & Poor’s (S&P). Where S&P ratings are not available, we have used Moody’s Investors Service. Where neither rating is available, we have used ratings from Fitch Ratings. The category of investments identified as “AAA” in this graph includes investments which are pre-refunded or escrowed to maturity. Such investments are backed by an escrow or trust containing sufficient U.S. Government or U.S. Government agency securities to satisfy the timely payment of principal and interest and, therefore, are normally deemed to be equivalent to AAA-rated securities.
| | | | | | | | | | |
Issuer-Description | | Credit Rating†
S&P/ Moody’s | | Principal
Amount | | | Value | |
Albuquerque Airport, 5.50% due 7/1/2013 | | A/A1 | | $ | 4,000,000 | | | $ | 4,297,760 | |
Albuquerque GRT, 0% due 7/1/2012 pre-refunded 7/1/2011 | | AA+/Aa2 | | | 1,775,000 | | | | 1,704,692 | |
Albuquerque GRT, 0% due 7/1/2012 (Insured: AGM) | | AA+/Aa2 | | | 225,000 | | | | 215,474 | |
Albuquerque GRT, 5.00% due 7/1/2021 | | AAA/Aa2 | | | 1,340,000 | | | | 1,459,327 | |
Albuquerque GRT, 5.00% due 7/1/2021 | | AAA/Aa2 | | | 3,000,000 | | | | 3,267,150 | |
Albuquerque IDRB, 5.15% due 4/1/2016 (MCT Industries Inc.; LOC: Bank of the West) (AMT) | | NR/A1 | | | 1,000,000 | | | | 1,034,540 | |
Albuquerque IDRB, 5.25% due 4/1/2017 (MCT Industries Inc.; LOC: Bank of the West) (AMT) | | NR/A1 | | | 2,140,000 | | | | 2,199,963 | |
Albuquerque Municipal School District GO, 5.00% due 8/1/2015 | | AA/Aa1 | | | 655,000 | | | | 657,371 | |
Bernalillo County GRT, 5.25% due 10/1/2012 | | AAA/Aa2 | | | 1,000,000 | | | | 1,068,010 | |
Bernalillo County GRT, 5.00% due 4/1/2021 (Insured: Natl-Re) | | AA/Aa2 | | | 3,000,000 | | | | 3,299,700 | |
Bernalillo County GRT, 5.25% due 10/1/2022 (Insured: AMBAC) | | AAA/Aa2 | | | 3,170,000 | | | | 3,608,665 | |
Bernalillo County GRT, 5.25% due 10/1/2023 (Insured: AMBAC) | | AAA/Aa2 | | | 1,275,000 | | | | 1,442,395 | |
Bernalillo County GRT, 5.25% due 10/1/2025 (Insured: AMBAC) | | AAA/Aa2 | | | 3,850,000 | | | | 4,308,843 | |
Bernalillo County Water Utility Authority, 5.00% due 7/1/2021 | | AAA/Aa1 | | | 1,520,000 | | | | 1,687,246 | |
Bernalillo County Water Utility Authority, 5.50% due 7/1/2025 | | AAA/Aa1 | | | 1,000,000 | | | | 1,105,200 | |
Bernalillo County Water Utility Authority, 5.00% due 7/1/2026 | | AAA/Aa1 | | | 1,420,000 | | | | 1,495,729 | |
Colfax County GRT, 5.00% due 9/1/2019 | | A-/NR | | | 930,000 | | | | 962,048 | |
Colfax County GRT, 5.50% due 9/1/2029 | | A-/NR | | | 2,510,000 | | | | 2,535,125 | |
Dona Ana County Pilot Revenue, 5.50% due 12/1/2014 (County Administrative Facilities; Insured: Radian) | | A-/NR | | | 460,000 | | | | 504,997 | |
Farmington Hospital, 5.00% due 6/1/2017 (San Juan Regional Medical Center) | | NR/A3 | | | 1,035,000 | | | | 1,094,833 | |
Farmington Hospital, 5.125% due 6/1/2018 (San Juan Regional Medical Center) | | NR/A3 | | | 570,000 | | | | 586,473 | |
Farmington Hospital, 5.125% due 6/1/2019 (San Juan Regional Medical Center) | | NR/A3 | | | 645,000 | | | | 658,758 | |
Farmington Hospital, 5.00% due 6/1/2022 (San Juan Regional Medical Center) | | NR/A3 | | | 2,825,000 | | | | 2,860,990 | |
Farmington PCR, 4.70% due 9/1/2024 (Arizona Public Service Co.) | | BBB-/Baa2 | | | 4,000,000 | | | | 3,718,000 | |
Farmington PCR, 4.00% due 6/1/2032 put 8/1/2012 (El Paso Electric Co.; Insured: Natl-Re/FGIC) | | BBB/NR | | | 2,000,000 | | | | 2,009,200 | |
Farmington Utility Systems, 5.00% due 5/15/2012 (Insured: AGM) | | AA+/Aa3 | | | 6,095,000 | | | | 6,126,999 | |
Gallup PCR Tri-State Generation, 5.00% due 8/15/2011 (Insured: AMBAC) | | A/A3 | | | 500,000 | | | | 505,220 | |
Gallup PCR Tri-State Generation, 5.00% due 8/15/2012 (Insured: AMBAC) | | A/A3 | | | 3,345,000 | | | | 3,454,482 | |
Gallup PCR Tri-State Generation, 5.00% due 8/15/2013 (Insured: AMBAC) | | A/A3 | | | 2,110,000 | | | | 2,203,093 | |
Gallup PCR Tri-State Generation, 5.00% due 8/15/2017 (Insured: AMBAC) | | A/A3 | | | 3,540,000 | | | | 3,622,482 | |
Grant County Department of Health, 5.50% due 7/1/2020 (Ft. Bayard) | | AA/Aa1 | | | 1,565,000 | | | | 1,667,257 | |
Grant County Department of Health, 5.50% due 7/1/2021 (Ft. Bayard) | | AA/Aa1 | | | 1,655,000 | | | | 1,756,286 | |
Grant County Department of Health, 5.50% due 7/1/2022 (Ft. Bayard) | | AA/Aa1 | | | 1,745,000 | | | | 1,838,008 | |
Guam Government Ltd. Obligation Revenue, 5.375% due 12/1/2024 | | BBB-/NR | | | 2,000,000 | | | | 1,924,920 | |
Las Cruces Shared GRT Revenue, 5.00% due 6/1/2021 | | NR/Aa3 | | | 730,000 | | | | 800,372 | |
Las Cruces Shared GRT Revenue, 5.00% due 6/1/2022 | | NR/Aa3 | | | 765,000 | | | | 829,229 | |
Las Cruces Shared GRT Revenue, 5.00% due 6/1/2023 | | NR/Aa3 | | | 800,000 | | | | 855,960 | |
Las Cruces Shared GRT Revenue, 5.00% due 6/1/2024 | | NR/Aa3 | | | 840,000 | | | | 890,509 | |
Las Cruces Shared GRT Revenue, 5.00% due 6/1/2030 | | NR/Aa3 | | | 3,000,000 | | | | 3,037,230 | |
Las Cruces Shared GRT Revenue, 5.00% due 6/1/2037 | | NR/Aa3 | | | 5,000,000 | | | | 4,822,900 | |
10 Certified Semi-Annual Report
| | |
| SCHEDULE OF INVESTMENTS, CONTINUED | | |
| |
| Thornburg New Mexico Intermediate Municipal Fund | | March 31, 2011 (Unaudited) |
| | | | | | | | | | |
Issuer-Description | | Credit Rating†
S&P/ Moody’s | | Principal
Amount | | | Value | |
Los Alamos County GRT Improvement, 5.75% due 6/1/2016 | | AA+/Aa3 | | $ | 1,000,000 | | | $ | 1,166,860 | |
Los Alamos County GRT Improvement, 5.625% due 6/1/2023 | | AA+/Aa3 | | | 1,000,000 | | | | 1,094,650 | |
Los Alamos County GRT Improvement, 5.75% due 6/1/2024 | | AA+/Aa3 | | | 3,000,000 | | | | 3,281,130 | |
Los Alamos County GRT Improvement, 5.75% due 6/1/2025 | | AA+/Aa3 | | | 1,000,000 | | | | 1,087,010 | |
Los Alamos County Utility Systems, 5.00% due 7/1/2013 (Insured: AGM) | | AA+/Aa3 | | | 1,265,000 | | | | 1,374,321 | |
Los Alamos Public School District, 2.00% due 8/1/2011 (State Aid Withholding) | | NR/Aa1 | | | 2,150,000 | | | | 2,160,814 | |
New Mexico Educational Assistance Foundation, 4.10% due 9/1/2015 (Insured: Fitch) (AMT) | | NR/Aaa | | | 2,000,000 | | | | 2,103,020 | |
New Mexico Educational Assistance Foundation, 5.00% due 12/1/2019 | | AAA/Aaa | | | 1,000,000 | | | | 1,091,170 | |
New Mexico Educational Assistance Foundation, 5.00% due 12/1/2022 | | AAA/Aaa | | | 3,000,000 | | | | 3,167,910 | |
New Mexico Finance Authority, 5.00% due 6/15/2013 (Insured: AMBAC) | | NR/Aa3 | | | 2,280,000 | | | | 2,465,182 | |
New Mexico Finance Authority, 5.00% due 6/1/2014 (Insured: Natl-Re) | | AA+/Aa1 | | | 2,660,000 | | | | 2,869,661 | |
New Mexico Finance Authority, 5.25% due 6/1/2015 (Insured: AMBAC) | | AA+/Aa1 | | | 1,000,000 | | | | 1,106,260 | |
New Mexico Finance Authority, 5.00% due 6/15/2015 (Insured: AMBAC) | | NR/Aa3 | | | 2,360,000 | | | | 2,621,158 | |
New Mexico Finance Authority, 5.00% due 6/15/2018 (Insured: AMBAC) | | NR/Aa3 | | | 2,915,000 | | | | 3,147,063 | |
New Mexico Finance Authority, 5.00% due 6/15/2019 (Insured: Natl-Re) | | NR/Aa3 | | | 1,215,000 | | | | 1,297,535 | |
New Mexico Finance Authority, 5.00% due 6/1/2020 (Insured: AMBAC) | | AA+/Aa1 | | | 365,000 | | | | 392,835 | |
New Mexico Finance Authority, 5.00% due 6/15/2022 (Insured: Natl-Re) | | AA-/Aa3 | | | 1,300,000 | | | | 1,363,232 | |
New Mexico Finance Authority, 5.00% due 6/15/2024 (Insured: Natl-Re) | | AA-/Aa3 | | | 7,000,000 | | | | 7,230,090 | |
New Mexico Highway Commission Senior Sub Lien Tax, 5.50% due 6/15/2014 pre-refunded 6/15/2011 | | AAA/Aa1 | | | 2,000,000 | | | | 2,021,340 | |
New Mexico Hospital Equipment Loan Council, 5.75% due 8/1/2016 pre-refunded 8/1/2011 (Presbyterian Healthcare Services) | | AA-/Aa3 | | | 3,205,000 | | | | 3,295,157 | |
New Mexico Hospital Equipment Loan Council, 5.00% due 7/1/2017 pre-refunded 7/1/2015 (St. Vincent Hospital; Insured: Radian) | | NR/NR | | | 1,730,000 | | | | 1,944,918 | |
New Mexico Hospital Equipment Loan Council, 5.00% due 7/1/2019 pre-refunded 7/1/2015 (St. Vincent Hospital; Insured: Radian) | | NR/NR | | | 1,000,000 | | | | 1,124,230 | |
New Mexico Hospital Equipment Loan Council, 5.00% due 7/1/2021 pre-refunded 7/1/2015 (St. Vincent Hospital; Insured: Radian) | | NR/NR | | | 1,185,000 | | | | 1,332,213 | |
New Mexico Hospital Equipment Loan Council, 6.00% due 8/1/2023 (Presbyterian Healthcare Services) | | AA-/Aa3 | | | 6,000,000 | | | | 6,494,160 | |
New Mexico Hospital Equipment Loan Council, 5.25% due 7/1/2025 pre-refunded 7/1/2015 (St. Vincent Hospital; Insured: Radian) | | NR/NR | | | 1,000,000 | | | | 1,134,380 | |
New Mexico Hospital Equipment Loan Council, 5.00% due 8/1/2039 (Presbyterian Healthcare Services) | | AA-/Aa3 | | | 3,000,000 | | | | 2,679,300 | |
New Mexico Housing Authority MFR, 5.30% due 12/1/2022 (El Paseo Apartments; Insured: AMBAC) (AMT) | | NR/NR | | | 905,000 | | | | 792,137 | |
New Mexico MFA MFR, 6.05% due 7/1/2028 (Sandpiper Apartments; Insured: FHA) (AMT) | | AA-/NR | | | 2,335,000 | | | | 2,376,003 | |
New Mexico MFA MFR, 5.00% due 7/1/2031 put 7/1/2011 (Riverwalk Apartments; Collateralized: FNMA) | | NR/Aaa | | | 1,910,000 | | | | 1,928,642 | |
New Mexico MFA SFMR, 5.875% due 9/1/2020 (AMT) | | AAA/NR | | | 130,000 | | | | 134,424 | |
New Mexico MFA SFMR, 5.25% due 7/1/2023 (Collateralized: GNMA/FNMA/FHLMC) (AMT) | | AAA/NR | | | 1,140,000 | | | | 1,160,965 | |
New Mexico MFA SFMR, 5.375% due 7/1/2023 (Collateralized: GNMA/FNMA/FHLMC) (AMT) | | AAA/NR | | | 1,555,000 | | | | 1,605,911 | |
New Mexico MFA SFMR, 5.50% due 7/1/2028 (Collateralized: GNMA/FNMA/FHLMC) (AMT) | | AAA/NR | | | 2,495,000 | | | | 2,504,531 | |
New Mexico MFA SFMR, 5.60% due 7/1/2028 (Collateralized: GNMA/FNMA/FHLMC) (AMT) | | AAA/NR | | | 1,390,000 | | | | 1,409,349 | |
New Mexico MFA SFMR, 5.40% due 9/1/2029 (Collateralized: GNMA/FNMA/FHLMC) | | AAA/NR | | | 915,000 | | | | 925,641 | |
New Mexico Mtg Finance Authority, 1.75% due 9/1/2012 (Villa Alegre; Insured: FHA) | | AAA/NR | | | 1,000,000 | | | | 1,006,900 | |
New Mexico Severance Tax, 4.00% due 7/1/2016 pre-refunded 7/1/2012 | | AA/Aa1 | | | 500,000 | | | | 522,100 | |
New Mexico State University, 5.00% due 4/1/2013 (Insured: AGM) | | AA+/Aa2 | | | 1,000,000 | | | | 1,080,980 | |
Rio Rancho GRT, 5.00% due 6/1/2014 (Insured: Natl-Re/FGIC) | | AA-/Aa2 | | | 955,000 | | | | 1,049,535 | |
Rio Rancho GRT, 5.00% due 6/1/2016 (Insured: Natl-Re/FGIC) | | AA-/Aa2 | | | 555,000 | | | | 614,779 | |
Rio Rancho GRT, 5.00% due 6/1/2022 (Insured: Natl-Re/FGIC) | | AA-/Aa2 | | | 1,000,000 | | | | 1,046,140 | |
Rio Rancho Public School District GO, 3.00% due 8/1/2012 (State Aid Withholding) | | NR/Aa1 | | | 1,240,000 | | | | 1,278,043 | |
Rio Rancho Public School District GO, 4.00% due 8/1/2013 (State Aid Withholding) | | NR/Aa1 | | | 1,210,000 | | | | 1,292,135 | |
Certified Semi-Annual Report 11
| | |
| SCHEDULE OF INVESTMENTS, CONTINUED | | |
| |
| Thornburg New Mexico Intermediate Municipal Fund | | March 31, 2011 (Unaudited) |
| | | | | | | | | | |
Issuer-Description | | Credit Rating†
S&P/ Moody’s | | Principal
Amount | | | Value | |
Rio Rancho Public School District GO, 4.00% due 8/1/2014 (State Aid Withholding) | | NR/Aa1 | | $ | 1,715,000 | | | $ | 1,856,487 | |
San Juan County Gasoline Tax/Motor Vehicle Improvement, 5.25% due 5/15/2014 | | NR/Aa3 | | | 400,000 | | | | 419,032 | |
San Juan County Gasoline Tax/Motor Vehicle Improvement, 5.25% due 5/15/2022 | | NR/Aa3 | | | 1,725,000 | | | | 1,763,002 | |
San Juan County GRT, 5.00% due 6/15/2014 (Insured: Natl-Re) | | A+/Aa3 | | | 1,225,000 | | | | 1,343,323 | |
Sandoval County Incentive Payment, 4.00% due 6/1/2015 (Intel Corp.) | | A+/NR | | | 1,000,000 | | | | 1,024,420 | |
Sandoval County Incentive Payment, 5.00% due 6/1/2020 (Intel Corp.) | | A+/NR | | | 6,390,000 | | | | 6,682,087 | |
Sandoval County Landfill Improvement, 5.50% due 8/15/2015 | | NR/Baa2 | | | 1,420,000 | | | | 1,487,521 | |
Sandoval County Landfill Improvement, 5.75% due 8/15/2018 | | NR/Baa2 | | | 1,335,000 | | | | 1,370,204 | |
Santa Fe County, 5.50% due 5/15/2015 (El Castillo Retirement) | | BBB-/NR | | | 939,000 | | | | 939,469 | |
Santa Fe County, 5.80% due 5/15/2018 (El Castillo Retirement) | | BBB-/NR | | | 1,835,000 | | | | 1,830,633 | |
Santa Fe County, 5.625% due 5/15/2025 (El Castillo Retirement) | | BBB-/NR | | | 1,250,000 | | | | 1,098,300 | |
Santa Fe County, 7.25% due 7/1/2029 (Rancho Viejo Improvement District) | | NR/NR | | | 1,665,000 | | | | 1,531,733 | |
Santa Fe County Charter School Foundation, 6.50% due 1/15/2026 (ATC Foundation) | | NR/NR | | | 960,000 | | | | 861,523 | |
Santa Fe County Charter School Foundation, 6.625% due 1/15/2036 (ATC Foundation) | | NR/NR | | | 1,030,000 | | | | 874,439 | |
Santa Fe County Correctional Systems, 5.00% due 2/1/2018 (Insured: AGM) | | AA+/Aa3 | | | 1,000,000 | | | | 1,095,620 | |
Santa Fe County Correctional Systems, 6.00% due 2/1/2027 (Insured: AGM) | | AA+/Aa3 | | | 1,520,000 | | | | 1,700,622 | |
Santa Fe County GRT, 5.00% due 6/1/2025 | | AA+/Aa1 | | | 1,400,000 | | | | 1,456,826 | |
Santa Fe County GRT, 5.00% due 6/1/2026 | | AA+/Aa1 | | | 1,535,000 | | | | 1,588,126 | |
Santa Fe Educational Facilities, 5.40% due 3/1/2017 (St. John’s College) | | BBB+/NR | | | 870,000 | | | | 870,548 | |
Santa Fe GRT, 5.25% due 6/1/2014 pre-refunded 6/1/2012 (Insured: AMBAC) | | AA+/Aa3 | | | 1,025,000 | | | | 1,082,379 | |
Taos County GRT, 4.75% due 10/1/2012 (ETM) | | NR/A3 | | | 1,500,000 | | | | 1,592,355 | |
University of New Mexico, 5.25% due 6/1/2013 | | AA/Aa2 | | | 665,000 | | | | 697,658 | |
University of New Mexico, 5.25% due 6/1/2014 | | AA/Aa2 | | | 335,000 | | | | 350,809 | |
University of New Mexico, 5.00% due 6/1/2015 (Insured: AMBAC) | | AA/Aa2 | | | 1,590,000 | | | | 1,788,416 | |
University of New Mexico, 5.25% due 6/1/2015 | | AA/Aa2 | | | 1,195,000 | | | | 1,287,362 | |
University of New Mexico, 5.25% due 6/1/2016 | | AA/Aa2 | | | 645,000 | | | | 674,051 | |
University of New Mexico, 5.25% due 6/1/2017 | | AA/Aa2 | | | 1,730,000 | | | | 1,807,919 | |
University of New Mexico, 5.25% due 6/1/2018 | | AA/Aa2 | | | 1,825,000 | | | | 1,903,292 | |
University of New Mexico, 5.25% due 6/1/2018 | | AA/Aa2 | | | 1,200,000 | | | | 1,292,748 | |
University of New Mexico, 5.25% due 6/1/2021 | | AA/Aa2 | | | 1,000,000 | | | | 1,041,060 | |
University of New Mexico, 6.00% due 6/1/2021 | | AA/Aa2 | | | 610,000 | | | | 709,448 | |
University of New Mexico Hospital Mtg Bonds, 5.00% due 1/1/2016 (Insured: AGM/FHA) | | AA+/Aa3 | | | 2,920,000 | | | | 3,135,992 | |
University of New Mexico Hospital Mtg Bonds, 5.00% due 1/1/2017 (Insured: AGM/FHA) | | AA+/Aa3 | | | 2,000,000 | | | | 2,119,700 | |
University of New Mexico Hospital Mtg Bonds, 5.00% due 1/1/2018 (Insured: AGM/FHA) | | AA+/Aa3 | | | 2,000,000 | | | | 2,098,200 | |
University of New Mexico Hospital Mtg Bonds, 5.00% due 1/1/2019 (Insured: AGM/FHA) | | AA+/Aa3 | | | 3,000,000 | | | | 3,119,160 | |
University of New Mexico Hospital Mtg Bonds, 5.00% due 7/1/2019 (Insured: AGM/FHA) | | AA+/Aa3 | | | 3,000,000 | | | | 3,111,720 | |
University of New Mexico Hospital Mtg Bonds, 5.00% due 1/1/2020 (Insured: AGM/FHA) | | AA+/Aa3 | | | 2,310,000 | | | | 2,382,442 | |
University of New Mexico Hospital Mtg Bonds, 5.00% due 7/1/2020 (Insured: AGM/FHA) | | AA+/Aa3 | | | 500,000 | | | | 514,680 | |
Ventana West Public Improvement District Special Tax, 6.625% due 8/1/2023 | | NR/NR | | | 2,000,000 | | | | 1,851,420 | |
Virgin Islands Public Finance Authority, 6.625% due 10/1/2029 | | NR/Baa3 | | | 2,500,000 | | | | 2,583,875 | |
| | | | | | | | | | |
TOTAL INVESTMENTS — 97.91% (Cost $222,046,964) | | | | | | | | $ | 226,829,851 | |
OTHER ASSETS LESS LIABILITIES — 2.09% | | | | | | | | | 4,852,307 | |
| | | | | | | | | | |
NET ASSETS — 100.00% | | | | | | | | $ | 231,682,158 | |
| | | | | | | | | | |
12 Certified Semi-Annual Report
| | |
| SCHEDULE OF INVESTMENTS, CONTINUED | | |
| |
| Thornburg New Mexico Intermediate Municipal Fund | | March 31, 2011 (Unaudited) |
Footnote Legend
| † | Credit ratings are unaudited. Rating changes may have occurred subsequent to the reporting period end. Bonds issued with a maturity of one year or less are assigned Moody’s ratings from MIG-1 to MIG-4 and Standard and Poor’s ratings from SP-1+ to SP-3 with MIG-1 and SP-1+ being the strongest ratings. |
Portfolio Abbreviations
To simplify the listings of securities, abbreviations are used per the table below:
| | |
| AGM | | Insured by Assured Guaranty Municipal Corp. |
| AMBAC | | Insured by American Municipal Bond Assurance Corp. |
| AMT | | Alternative Minimum Tax |
| ETM | | Escrowed to Maturity |
| FGIC | | Insured by Financial Guaranty Insurance Co. |
| FHA | | Insured by Federal Housing Administration |
| FHLMC | | Insured by Federal Home Loan Mortgage Corp. |
| FNMA | | Collateralized by Federal National Mortgage Association |
| GNMA | | Insured by Government National Mortgage Co. |
| GO | | General Obligation |
| GRT | | Gross Receipts Tax |
| IDRB | | Industrial Development Revenue Bond |
| LOC | | Letter of Credit |
| MFA | | Mortgage Finance Authority |
| Mtg | | Mortgage |
| MFR | | Multi-Family Revenue |
| Natl-Re | | Insured by National Public Finance Guarantee Corp. |
| PCR | | Pollution Control Revenue Bond |
| Radian | | Insured by Radian Asset Assurance |
| SFMR | | Single Family Mortgage Revenue Bond |
See notes to financial statements.
Certified Semi-Annual Report 13
| | |
| STATEMENT OF ASSETS AND LIABILITIES | | |
| |
| Thornburg New Mexico Intermediate Municipal Fund | | March 31, 2011 (Unaudited) |
| | | | |
ASSETS | | | | |
Investments at value (cost $222,046,964) (Note 2) | | $ | 226,829,851 | |
Cash | | | 1,916,877 | |
Receivable for investments sold | | | 170,000 | |
Receivable for fund shares sold | | | 89,960 | |
Interest receivable | | | 3,330,639 | |
Prepaid expenses and other assets | | | 1,390 | |
| | | | |
Total Assets | | | 232,338,717 | |
| | | | |
LIABILITIES | | | | |
Payable for fund shares redeemed | | | 295,932 | |
Payable to investment advisor and other affiliates (Note 3) | | | 170,682 | |
Accounts payable and accrued expenses | | | 29,701 | |
Dividends payable | | | 160,244 | |
| | | | |
Total Liabilities | | | 656,559 | |
| | | | |
NET ASSETS | | $ | 231,682,158 | |
| | | | |
NET ASSETS CONSIST OF: | | | | |
Distribution in excess of net investment income | | $ | (25,824 | ) |
Net unrealized appreciation on investments | | | 4,782,887 | |
Accumulated net realized gain (loss) | | | 63,855 | |
Net capital paid in on shares of beneficial interest | | | 226,861,240 | |
| | | | |
| | $ | 231,682,158 | |
| | | | |
NET ASSET VALUE: | | | | |
Class A Shares: | | | | |
Net asset value and redemption price per share
($182,852,114 applicable to 13,822,584 shares of beneficial interest outstanding - Note 4) | | $ | 13.23 | |
Maximum sales charge, 2.00% of offering price | | | 0.27 | |
| | | | |
Maximum offering price per share | | $ | 13.50 | |
| | | | |
Class D Shares: | | | | |
Net asset value, offering and redemption price per share
($22,577,383 applicable to 1,705,990 shares of beneficial interest outstanding - Note 4) | | $ | 13.23 | |
| | | | |
Class I Shares: | | | | |
Net asset value, offering and redemption price per share
($26,252,661 applicable to 1,985,472 shares of beneficial interest outstanding - Note 4) | | $ | 13.22 | |
| | | | |
See notes to financial statements.
14 Certified Semi-Annual Report
| | |
| SCHEDULE OF OPERATIONS | | |
| |
| Thornburg New Mexico Intermediate Municipal Fund | | Six Months Ended March 31, 2011 (Unaudited) |
| | | | |
INVESTMENT INCOME: | | | | |
Interest income (net of premium amortized of $670,637) | | $ | 5,072,362 | |
| | | | |
EXPENSES: | | | | |
Investment advisory fees (Note 3) | | | 602,315 | |
Administration fees (Note 3) | | | | |
Class A Shares | | | 119,673 | |
Class D Shares | | | 14,639 | |
Class I Shares | | | 6,507 | |
Distribution and service fees (Note 3) | | | | |
Class A Shares | | | 239,347 | |
Class D Shares | | | 59,520 | |
Transfer agent fees | | | | |
Class A Shares | | | 26,778 | |
Class D Shares | | | 5,341 | |
Class I Shares | | | 1,188 | |
Registration and filing fees | | | | |
Class A Shares | | | 258 | |
Class D Shares | | | 257 | |
Class I Shares | | | 256 | |
Custodian fees (Note 3) | | | 30,878 | |
Professional fees | | | 12,580 | |
Accounting fees | | | 3,121 | |
Trustee fees | | | 3,076 | |
Other expenses | | | 10,145 | |
| | | | |
Total Expenses | | | 1,135,879 | |
Less: | | | | |
Expenses reimbursed by investment advisor (Note 3) | | | (789 | ) |
Fees paid indirectly (Note 3) | | | (1,334 | ) |
| | | | |
Net Expenses | | | 1,133,756 | |
| | | | |
Net Investment Income | | | 3,938,606 | |
| | | | |
REALIZED AND UNREALIZED GAIN (LOSS) | | | | |
Net realized gain (loss) on investments | | | 291,620 | |
Net change in unrealized appreciation (depreciation) of investments | | | (10,190,224 | ) |
| | | | |
Net Realized and Unrealized Loss | | | (9,898,604 | ) |
| | | | |
Net Decrease in Net Assets Resulting from Operations | | $ | (5,959,998 | ) |
| | | | |
| |
See notes to financial statements. | | | | |
Certified Semi-Annual Report 15
| | |
| STATEMENTS OF CHANGES IN NET ASSETS | | |
| |
| Thornburg New Mexico Intermediate Municipal Fund | | |
| | | | | | | | |
| | | Six Months Ended
March 31, 2011* | | | Year Ended
September 30, 2010 | |
INCREASE (DECREASE) IN NET ASSETS FROM | | | | | | | | |
| | |
OPERATIONS: | | | | | | | | |
Net investment income | | $ | 3,938,606 | | | $ | 7,701,095 | |
Net realized gain (loss) on investments | | | 291,620 | | | | 290,642 | |
Increase (Decrease) in unrealized appreciation (depreciation) of investments | | | (10,190,224 | ) | | | 2,643,615 | |
| | | | | | | | |
| | |
Net Increase (Decrease) in Net Assets Resulting from Operations | | | (5,959,998 | ) | | | 10,635,352 | |
| | |
DIVIDENDS TO SHAREHOLDERS: | | | | | | | | |
From net investment income | | | | | | | | |
Class A Shares | | | (3,119,486 | ) | | | (6,116,479 | ) |
Class D Shares | | | (350,034 | ) | | | (587,742 | ) |
Class I Shares | | | (469,086 | ) | | | (996,874 | ) |
From realized gains | | | | | | | | |
Class A Shares | | | (168,225 | ) | | | — | |
Class D Shares | | | (20,580 | ) | | | — | |
Class I Shares | | | (22,438 | ) | | | — | |
| | |
FUND SHARE TRANSACTIONS (NOTE 4): | | | | | | | | |
Class A Shares | | | (11,957,962 | ) | | | 12,659,410 | |
Class D Shares | | | (506,509 | ) | | | 6,475,741 | |
Class I Shares | | | 347,195 | | | | (909,152 | ) |
| | | | | | | | |
| | |
Net Increase (Decrease) in Net Assets | | | (22,227,123 | ) | | | 21,160,256 | |
| | |
NET ASSETS: | | | | | | | | |
Beginning of Period | | | 253,909,281 | | | | 232,749,025 | |
| | | | | | | | |
| | |
End of Period | | $ | 231,682,158 | | | $ | 253,909,281 | |
| | | | | | | | |
See notes to financial statements.
16 Certified Semi-Annual Report
| | |
| NOTES TO FINANCIAL STATEMENTS | | |
| |
| Thornburg New Mexico Intermediate Municipal Fund | | March 31, 2011 (Unaudited) |
NOTE 1 – ORGANIZATION
Thornburg New Mexico Intermediate Municipal Fund (the “Fund”) is a non-diversified series of Thornburg Investment Trust (the “Trust”). The Trust is organized as a Massachusetts business trust under a Declaration of Trust dated June 3, 1987 and is registered as a diversified, open-end management investment company under the Investment Company Act of 1940, as amended. The Fund is currently one of sixteen separate series of the Trust. Each series is considered to be a separate entity for financial reporting and tax purposes and bears expenses directly attributable to it. The Fund’s primary investment objective is to obtain as high a level of current income exempt from federal and New Mexico state individual income tax as is consistent, in the view of the Fund’s investment advisor, with the preservation of capital. The Fund’s secondary objective is to reduce expected changes in its share price compared to long-term bond portfolios.
The Fund currently offers three classes of shares of beneficial interest: Class A, Class D, and Institutional Class (Class I). Each class of shares of the Fund represents an interest in the same portfolio of investments, except that (i) Class A shares are sold subject to a front-end sales charge collected at the time the shares are purchased and bear a service fee, (ii) Class D shares are sold at net asset value without a sales charge at the time of purchase or redemption, and bear both a service fee and a distribution fee, (iii) Class I shares are sold at net asset value without a sales charge at the time of purchase, and (iv) the respective classes may have different reinvestment privileges and conversion rights. Additionally, the Fund may allocate among its classes certain expenses, to the extent allowable to specific classes, including transfer agent fees, government registration fees, certain printing and postage costs, and administrative and legal expenses. Currently, class specific expenses of the Fund are limited to service and distribution fees, administration fees, and certain registration and transfer agent expenses.
NOTE 2 – SIGNIFICANT ACCOUNTING POLICIES
Significant accounting policies of the Trust are as follows:
Valuation of Investments: Debt obligations have a primary market over the counter and are valued by an independent pricing service approved by the Trustees of the Trust. The pricing service ordinarily values debt obligations at quoted bid prices. When quotations are not available, debt obligations are valued at evaluated prices determined by the pricing service using methods which include consideration of yields or prices of debt obligations of comparable quality, type of issue, coupon, maturity and rating, and indications as to value from dealers and general market conditions. Short-term obligations having remaining maturities of 60 days or less are ordinarily valued at amortized cost, which approximates market value.
In any case where a pricing service fails to provide a price for a debt obligation held by the Fund, the valuation and pricing committee determines a fair value for the obligation using procedures approved by the Trustees. Additionally, in any case where management believes that a price provided by a pricing service for a debt obligation may be unreliable, the valuation and pricing committee decides whether or not to use the pricing service’s valuation or to determine a fair value for the obligation.
In determining fair value for any portfolio security or other investment, the valuation and pricing committee seeks to determine the amount that an owner of the investment might reasonably expect to receive upon a sale of the investment. However, because fair value prices are estimated prices, the valuation and pricing committee’s determination of fair value for an investment may differ from the value that would be realized by the Fund upon a sale of the investment, and that difference could be material to the Fund’s financial statements. The valuation and pricing committee’s determination of fair value for an investment may also differ from the prices obtained by other persons (including other mutual funds) for the investment.
Valuation Measurements: Various inputs are used in determining the value of the Fund’s investments. These inputs are summarized in the three levels listed below.
Level 1: Quoted prices in active markets for identical investments.
Level 2: Other significant observable inputs (including quoted prices for similar investments, interest rates, prepayment rates, credit risk, etc.).
Level 3: Significant unobservable inputs (including the Fund’s own assumptions in determining the fair value of investments).
Certified Semi-Annual Report 17
| | |
| NOTES TO FINANCIAL STATEMENTS, CONTINUED | | |
| |
| Thornburg New Mexico Intermediate Municipal Fund | | March 31, 2011 (Unaudited) |
The following table displays a summary of the inputs used to value the Fund’s net assets as of March 31, 2011. In any instance when valuation inputs from more than one level are used to determine the fair value of a specific investment, the investment is placed in the level of the table based upon the lowest level input that is significant in determining the fair value of the investment:
| | | | | | | | | | | | | | | | |
| | | Fair Value Measurements at March 31, 2011 | |
| | | Total | | | Level 1 | | | Level 2 | | | Level 3 | |
Assets | | | | | | | | | | | | | | | | |
Investments in Securities Municipal Bonds | | $ | 226,829,851 | | | $ | — | | | $ | 226,829,851 | | | $ | — | |
| | | | | | | | | | | | | | | | |
Total Investments in Securities | | $ | 226,829,851 | | | $ | — | | | $ | 226,829,851 | | | $ | — | |
Other Notes: It is the policy of the Fund to recognize significant transfers between Levels 1 and 2 and to disclose those transfers at the last date of the reporting period. The Fund recognized no significant transfers into and out of Levels 1 and 2 during the six months ended March 31, 2011.
Federal Income Taxes: It is the policy of the Trust to comply with the provisions of the Internal Revenue Code applicable to “regulated investment companies” and to distribute to shareholders substantially all taxable (if any) and tax exempt income of the Fund. Therefore, no provision for federal income tax is required.
Management reviews each tax position believed to be material to the preparation of the Fund’s financial statements, to assess if it is more likely than not that the position would be sustained upon examination, based upon the technical merits of the position. As of March 31, 2011, management has not identified any such position for which a liability must be reflected in the Statement of Assets and Liabilities. The Fund’s tax returns remain subject to examination for three years after filing.
When-Issued and Delayed Delivery Transactions: The Fund may engage in when-issued or delayed delivery transactions. To the extent the Fund engages in such transactions, it will do so for the purpose of acquiring portfolio securities consistent with the Fund’s investment objectives and not for the purpose of investment leverage or to speculate on interest rate and/or market changes. At the time the Fund makes a commitment to purchase a security on a when-issued or delayed delivery basis, the Fund will record the transaction and reflect the value in determining its net asset value. When effecting such transactions, assets of an amount sufficient to make payment for the portfolio securities to be purchased will be segregated on the Fund’s records on the trade date. Securities purchased on a when-issued or delayed delivery basis do not earn interest until the settlement date.
Dividends: Net investment income of the Fund is declared daily as a dividend on shares for which the Fund has received payment. Dividends are paid monthly and are reinvested in additional shares of the Fund at net asset value per share at the close of business on the dividend payment date, or at the shareholder’s option, paid in cash. Net realized capital gains, to the extent available, will be distributed at least annually.
General: Securities transactions are accounted for on a trade date basis. Interest income is accrued as earned. Premiums and discounts on securities purchased are amortized to call dates or maturity dates of the respective securities. Realized gains and losses from the sale of securities are recorded on an identified cost basis. Net investment income (other than class specific expenses) and realized and unrealized gains and losses are allocated daily to each class of shares based upon the relative net asset value of outstanding shares (or the value of the dividend-eligible shares, as appropriate) of each class of shares at the beginning of the day (after adjusting for the current capital shares activity of the respective class). Expenses common to all Funds are allocated among the Funds comprising the Trust based upon their relative net asset values or other appropriate allocation methods.
Guarantees and Indemnifications: Under the Trust’s organizational documents, its officers and Trustees are indemnified against certain liabilities arising out of the performance of their duties to the Fund. Additionally, in the normal course of business the Trust enters into contracts with service providers that contain general indemnification clauses. The Trust’s maximum exposure under these arrangements is unknown. However, based on experience, the Trust expects the risk of loss to be remote.
Use of Estimates: The preparation of financial statements, in conformity with generally accepted accounting principles, requires management to make estimates and assumptions that affect the reported amounts of assets and liabilities and the disclosure of contingent
18 Certified Semi-Annual Report
| | |
| NOTES TO FINANCIAL STATEMENTS, CONTINUED | | |
| |
| Thornburg New Mexico Intermediate Municipal Fund | | March 31, 2011 (Unaudited) |
assets and liabilities at the date of the financial statements and the reported amounts of increases and decreases in net assets from operations during the reporting period. Actual results could differ from those estimates.
NOTE 3 – INVESTMENT ADVISORY FEE AND OTHER TRANSACTIONS WITH AFFILIATES
Pursuant to an investment advisory agreement, Thornburg Investment Management, Inc. (the “Advisor”) serves as the investment advisor and performs services to the Fund for which the fees are payable at the end of each month. For the six months ended March 31, 2011, these fees were payable at annual rates ranging from .50 of 1% to .275 of 1% per annum of the average daily net assets of the Fund depending on the Fund’s asset size. The Trust also has entered into administrative services agreements with the Advisor, whereby the Advisor will perform certain administrative services for the shareholders of each class of the Fund’s shares, and for which fees will be payable at an annual rate of up to .125 of 1% per annum of the average daily net assets attributable to each class of shares. For the six months ended March 31, 2011, the Advisor voluntarily reimbursed certain class specific expenses and administrative fees of $789 for Class D Shares.
The Trust has an underwriting agreement with Thornburg Securities Corporation (the “Distributor,” an affiliate of the Advisor), which acts as the distributor of the Fund’s shares. For the six months ended March 31, 2011, the Distributor has advised the Fund that it earned net commissions aggregating $594 from the sale of Class A shares.
Pursuant to a service plan under Rule 12b-1 of the Investment Company Act of 1940, the Fund may reimburse to the Advisor an amount not to exceed .25 of 1% per annum of the average daily net assets attributable to each class of shares of the Fund for payments made by the Advisor to securities dealers and other financial institutions to obtain various shareholder and distribution related services. For the six months ended March 31, 2011, there were no 12b-1 service plan fees charged for Class I shares. The Advisor may pay out of its own resources additional expenses for distribution of the Fund’s shares.
The Trust has also adopted a distribution plan pursuant to Rule 12b-1, applicable only to the Fund’s Class D shares, under which the Fund compensates the Distributor for services in promoting the sale of Class D shares of the Fund at an annual rate of up to .25 of 1% per annum of the average daily net assets attributable to Class D shares. Total fees incurred by the Distributor for each class of shares of the Fund under their respective Service and Distribution Plans for the six months ended March 31, 2011, are set forth in the Statement of Operations.
The Trust has an agreement with the custodian bank to indirectly pay a portion of the custodian’s fees through credits earned by the Fund’s cash on deposit with the bank. This deposit agreement is an alternative to overnight investments. Custodial fees have been adjusted to reflect amounts that would have been paid without this agreement, with a corresponding adjustment reflected as fees paid indirectly in the Statement of Operations. For the six months ended March 31, 2011, fees paid indirectly were $1,334.
Certain officers and Trustees of the Trust are also officers and/or directors of the Advisor and Distributor. The compensation of independent Trustees is borne by the Trust.
NOTE 4 – SHARES OF BENEFICIAL INTEREST
At March 31, 2011, there were an unlimited number of shares of beneficial interest authorized. Transactions in shares of beneficial interest were as follows:
| | | | | | | | | | | | | | | | |
| | | Six Months Ended
March 31, 2011 (Unaudited) | | | Year Ended
September 30, 2010 (Audited) | |
| | | Shares | | | Amount | | | Shares | | | Amount | |
Class A Shares | | | | | | | | | | | | | | | | |
Shares sold | | | 535,424 | | | $ | 7,186,897 | | | | 2,128,410 | | | $ | 28,865,038 | |
Shares issued to shareholders in reinvestment of dividends | | | 170,489 | | | | 2,275,852 | | | | 279,226 | | | | 3,785,910 | |
Shares repurchased | | | (1,607,473 | ) | | | (21,420,711 | ) | | | (1,475,832 | ) | | | (19,991,538 | ) |
| | | | | | | | | | | | | | | | |
| | | | |
Net Increase (Decrease) | | | (901,560 | ) | | $ | (11,957,962 | ) | | | 931,804 | | | $ | 12,659,410 | |
| | | | | | | | | | | | | | | | |
Certified Semi-Annual Report 19
| | |
| NOTES TO FINANCIAL STATEMENTS, CONTINUED | | |
| |
| Thornburg New Mexico Intermediate Municipal Fund | | March 31, 2011 (Unaudited) |
| | | | | | | | | | | | | | | | |
| | | Six Months Ended
March 31, 2011 (Unaudited) | | | Year Ended
September 30, 2010 (Audited) | |
| | | Shares | | | Amount | | | Shares | | | Amount | |
Class D Shares | | | | | | | | | | | | | | | | |
Shares sold | | | 181,711 | | | $ | 2,455,923 | | | | 695,376 | | | $ | 9,431,570 | |
Shares issued to shareholders inreinvestment of dividends | | | 23,126 | | | | 308,845 | | | | 33,430 | | | | 453,643 | |
Shares repurchased | | | (244,932 | ) | | | (3,271,277 | ) | | | (251,759 | ) | | | (3,409,472 | ) |
| | | | | | | | | | | | | | | | |
| | | | |
Net Increase (Decrease) | | | (40,095 | ) | | $ | (506,509 | ) | | | 477,047 | | | $ | 6,475,741 | |
| | | | | | | | | | | | | | | | |
| | | | |
Class I Shares | | | | | | | | | | | | | | | | |
Shares sold | | | 69,614 | | | $ | 922,338 | | | | 857,456 | | | $ | 11,590,412 | |
Shares issued to shareholders inreinvestment of dividends | | | 27,807 | | | | 371,138 | | | | 53,486 | | | | 724,088 | |
Shares repurchased | | | (70,379 | ) | | | (946,281 | ) | | | (972,175 | ) | | | (13,223,652 | ) |
| | | | | | | | | | | | | | | | |
| | | | |
Net Increase (Decrease) | | | 27,042 | | | $ | 347,195 | | | | (61,233 | ) | | $ | (909,152 | ) |
| | | | | | | | | | | | | | | | |
NOTE 5 – SECURITIES TRANSACTIONS
For the six months ended March 31, 2011, the Fund had purchase and sale transactions of investment securities (excluding short-term investments) of $10,795,535 and $22,627,634, respectively.
NOTE 6 – INCOME TAXES
At March 31, 2011, information on the tax components of capital is as follows:
| | | | |
Cost of investments for tax purposes | | $ | 222,046,964 | |
| | | | |
Gross unrealized appreciation on a tax basis | | $ | 6,984,087 | |
Gross unrealized depreciation on a tax basis | | | (2,201,199 | ) |
| | | | |
Net unrealized appreciation (depreciation) on investments (tax basis) | | $ | 4,782,888 | |
| | | | |
At March 31, 2011, the Fund had $16,522 in tax basis capital losses, which may be carried forward to offset future capital gains. To the extent such carryforwards are used, capital gains distributions may be reduced to the extent provided by regulations. Such capital loss carryforwards expire September 30, 2015.
OTHER NOTES
Fund management believes no events have occurred between March 31, 2011 and May 20, 2011, the date of issuance of the financial statements, which require adjustment of, or disclosure in, the accompanying financial statements.
20 Certified Semi-Annual Report
This page intentionally left blank.
Certified Semi-Annual Report 21
| | |
| FINANCIAL HIGHLIGHTS | | |
| |
Thornburg New Mexico Intermediate Municipal Fund | | |
| | | | | | | | | | | | | | | | | | | | | | | | | | | | | | | | | | | | | | | | | | | | | | | | | | | | | | | | | | | | |
| | | PER SHARE PERFORMANCE (for a share outstanding throughout the period)+ | | | RATIOS TO AVERAGE NET ASSETS | | | SUPPLEMENTAL DATA | |
Unless Otherwise Noted, Periods are Fiscal Years Ended Sept. 30, | | Net
Asset
Value
Beginning
of Period | | | Net
Investment
Income
(Loss) | | | Net
Realized
& Unrealized
Gain (Loss)
on
Investments | | | Total
from
Investment
Operations | | | Dividends
from Net
Realized
Income | | | Dividends
from Net
Realized
Gains | | | Total
Dividends | | | Net
Asset
Value
End of
Period | | | Net Investment Income
(Loss) (%) | | | Expenses,
After
Expense
Reductions
(%) | | | Expenses,
After
Expense
Reductions
and Net of
Custody
Credits
(%) | | | Expenses,
Before
Expense
Reductions
(%) | | | Total
Return
(%)(a) | | | Portfolio
Turnover
Rate (%) | | | Net Assets
at End
of Period
(Thousands) | |
Class A Shares | | | | | | | | | | | | | | | | | | | | | | | | | | | | | | | | | | | | | | | | | | | | | | | | | |
2011(b)(c) | | $ | 13.78 | | | | 0.22 | | | | (0.54 | ) | | | (0.32 | ) | | | (0.22 | ) | | | (0.01 | ) | | | (0.23 | ) | | $ | 13.23 | | | | 3.26 | (d) | | | 0.95 | (d) | | | 0.95 | (d) | | | 0.95 | (d) | | | (2.33 | ) | | | 4.56 | | | $ | 182,852 | |
2010(c) | | $ | 13.63 | | | | 0.43 | | | | 0.15 | | | | 0.58 | | | | (0.43 | ) | | | — | | | | (0.43 | ) | | $ | 13.78 | | | | 3.19 | | | | 0.96 | | | | 0.96 | | | | 0.96 | | | | 4.38 | | | | 7.70 | | | $ | 202,870 | |
2009(c) | | $ | 12.64 | | | | 0.47 | | | | 0.99 | | | | 1.46 | | | | (0.47 | ) | | | — | | | | (0.47 | ) | | $ | 13.63 | | | | 3.62 | | | | 0.96 | | | | 0.96 | | | | 0.96 | | | | 11.79 | | | | 14.12 | | | $ | 187,940 | |
2008(c) | | $ | 13.10 | | | | 0.47 | | | | (0.46 | ) | | | 0.01 | | | | (0.47 | ) | | | — | | | | (0.47 | ) | | $ | 12.64 | | | | 3.56 | | | | 0.97 | | | | 0.95 | | | | 0.97 | | | | — | (e) | | | 13.48 | | | $ | 163,928 | |
2007(c) | | $ | 13.20 | | | | 0.47 | | | | (0.10 | ) | | | 0.37 | | | | (0.47 | ) | | | — | | | | (0.47 | ) | | $ | 13.10 | | | | 3.55 | | | | 0.98 | | | | 0.97 | | | | 0.98 | | | | 2.82 | | | | 17.38 | | | $ | 169,130 | |
2006(c) | | $ | 13.22 | | | | 0.45 | | | | (0.02 | ) | | | 0.43 | | | | (0.45 | ) | | | — | | | | (0.45 | ) | | $ | 13.20 | | | | 3.41 | | | | 0.99 | | | | 0.98 | | | | 0.99 | | | | 3.31 | | | | 11.59 | | | $ | 196,163 | |
Class D Shares | | | | | | | | | | | | | | | | | | | | | | | | | | | | | | | | | | | | | | | | | | | | | | | | | |
2011(b) | | $ | 13.78 | | | | 0.20 | | | | (0.54 | ) | | | (0.34 | ) | | | (0.20 | ) | | | (0.01 | ) | | | (0.21 | ) | | $ | 13.23 | | | | 2.99 | (d) | | | 1.22 | (d) | | | 1.22 | (d) | | | 1.23 | (d) | | | (2.46 | ) | | | 4.56 | | | $ | 22,577 | |
2010 | | $ | 13.63 | | | | 0.28 | | | | 0.27 | | | | 0.55 | | | | (0.40 | ) | | | — | | | | (0.40 | ) | | $ | 13.78 | | | | 2.92 | | | | 1.22 | | | | 1.22 | | | | 1.71 | | | | 4.11 | | | | 7.70 | | | $ | 24,068 | |
2009 | | $ | 12.64 | | | | 0.44 | | | | 0.99 | | | | 1.43 | | | | (0.44 | ) | | | — | | | | (0.44 | ) | | $ | 13.63 | | | | 3.35 | | | | 1.23 | | | | 1.23 | | | | 1.73 | | | | 11.50 | | | | 14.12 | | | $ | 17,301 | |
2008 | | $ | 13.11 | | | | 0.43 | | | | (0.47 | ) | | | (0.04 | ) | | | (0.43 | ) | | | — | | | | (0.43 | ) | | $ | 12.64 | | | | 3.29 | | | | 1.24 | | | | 1.22 | | | | 1.74 | | | | (0.35 | ) | | | 13.48 | | | $ | 15,525 | |
2007 | | $ | 13.21 | | | | 0.43 | | | | (0.10 | ) | | | 0.33 | | | | (0.43 | ) | | | — | | | | (0.43 | ) | | $ | 13.11 | | | | 3.30 | | | | 1.23 | | | | 1.23 | | | | 1.77 | | | | 2.57 | | | | 17.38 | | | $ | 13,524 | |
2006 | | $ | 13.23 | | | | 0.41 | | | | (0.02 | ) | | | 0.39 | | | | (0.41 | ) | | | — | | | | (0.41 | ) | | $ | 13.21 | | | | 3.15 | | | | 1.24 | | | | 1.24 | | | | 1.82 | | | | 3.04 | | | | 11.59 | | | $ | 14,113 | |
Class I Shares | | | | | | | | | | | | | | | | | | | | | | | | | | | | | | | | | | | | | | | | | | | | | | | | | |
2011(b) | | $ | 13.77 | | | | 0.24 | | | | (0.54 | ) | | | (0.30 | ) | | | (0.24 | ) | | | (0.01 | ) | | | (0.25 | ) | | $ | 13.22 | | | | 3.60 | (d) | | | 0.61 | (d) | | | 0.61 | (d) | | | 0.61 | (d) | | | (2.17 | ) | | | 4.56 | | | $ | 26,253 | |
2010 | | $ | 13.62 | | | | 0.67 | | | | (0.04 | ) | | | 0.63 | | | | (0.48 | ) | | | — | | | | (0.48 | ) | | $ | 13.77 | | | | 3.53 | | | | 0.61 | | | | 0.61 | | | | 0.61 | | | | 4.74 | | | | 7.70 | | | $ | 26,971 | |
2009 | | $ | 12.63 | | | | 0.52 | | | | 0.99 | | | | 1.51 | | | | (0.52 | ) | | | — | | | | (0.52 | ) | | $ | 13.62 | | | | 3.96 | | | | 0.62 | | | | 0.62 | | | | 0.62 | | | | 12.18 | | | | 14.12 | | | $ | 27,508 | |
2008 | | $ | 13.10 | | | | 0.51 | | | | (0.47 | ) | | | 0.04 | | | | (0.51 | ) | | | — | | | | (0.51 | ) | | $ | 12.63 | | | | 3.90 | | | | 0.63 | | | | 0.61 | | | | 0.63 | | | | 0.26 | | | | 13.48 | | | $ | 23,728 | |
2007(f) | | $ | 13.10 | | | | 0.34 | | | | — | | | | 0.34 | | | | (0.34 | ) | | | — | | | | (0.34 | ) | | $ | 13.10 | | | | 3.95 | (d) | | | 0.63 | (d) | | | 0.62 | (d) | | | 0.63 | (d) | | | 2.64 | | | | 17.38 | | | $ | 19,427 | |
| (a) | Not annualized for periods less than one year. |
| (b) | Unaudited Six Month Period Ended March 31. |
| (c) | Sales loads are not reflected in computing total return. |
| (e) | Total return figure was less than 0.01%. |
| (f) | Effective date of this class of shares was February 1, 2007. |
| + | Based on weighted average shares outstanding. |
See notes to financial statements.
| | |
| 22 Certified Semi-Annual Report | | Certified Semi-Annual Report 23 |
| | |
| EXPENSE EXAMPLE | | |
| |
| Thornburg New Mexico Intermediate Municipal Fund | | March 31, 2011 (Unaudited) |
As a shareholder of the Fund, you incur two types of costs:
| | (1) | transaction costs, including |
(a) sales charges (loads) on purchase payments, for Class A shares;
(b) a deferred sales charge on redemptions of any part or all of a purchase of $1 million of Class A shares within 12 months of purchase;
| | (2) | ongoing costs, including management fees; distribution and/or service (12b-1) fees; and other Fund expenses. |
This example is intended to help you understand your ongoing costs (in dollars) of investing in the Fund and to compare these costs with the ongoing costs of investing in other mutual funds.
The example is based on a $1,000 investment beginning on October 1, 2010, and held until March 31, 2011.
ACTUAL EXPENSES
For each class of shares, the first line of the table at right provides information about actual account values and actual expenses. You may use the information in this line, together with the amount you invested, to estimate the expenses that you paid over the period. Simply divide your account value by $1,000 (for example, an $8,600 account value divided by $1,000 = 8.6), then multiply the result by the number in the first line for your class of shares under the heading entitled “Expenses Paid During Period” to estimate the expenses you paid on your account during this period.
HYPOTHETICAL EXAMPLE FOR COMPARISON PURPOSES
For each class of shares, the second line of the table at right provides information about hypothetical account values and hypothetical expenses based on the Fund’s actual expense ratio and an assumed rate of return of 5% per year before expenses, which is not the Fund’s actual return. The hypothetical account values and expenses may not be used to estimate the actual ending account balance or expenses you paid for the period. You may use this information to compare the ongoing costs of investing in the Fund and other funds. To do so, compare this 5% hypothetical example with the 5% hypothetical examples that appear in the shareholder reports of the other funds.
| | | | | | | | | | | | |
| | | Beginning
Account Value
10/1/10 | | | Ending
Account Value
3/31/11 | | | Expenses Paid
During Period†
10/1/10–3/31/11 | |
Class A Shares | | | | | | | | | | | | |
Actual | | $ | 1,000.00 | | | $ | 976.70 | | | $ | 4.69 | |
Hypothetical* | | $ | 1,000.00 | | | $ | 1,020.19 | | | $ | 4.79 | |
Class D Shares | | | | | | | | | | | | |
Actual | | $ | 1,000.00 | | | $ | 975.40 | | | $ | 6.02 | |
Hypothetical* | | $ | 1,000.00 | | | $ | 1,018.83 | | | $ | 6.16 | |
Class I Shares | | | | | | | | | | | | |
Actual | | $ | 1,000.00 | | | $ | 978.30 | | | $ | 3.01 | |
Hypothetical* | | $ | 1,000.00 | | | $ | 1,021.89 | | | $ | 3.07 | |
| † | Expenses are equal to the annualized expense ratio for each class (A: 0.95%; D: 1.22%; I: 0.61%) multiplied by the average account value over the period, multiplied by 182/365 to reflect the one-half year period. |
| * | Hypothetical assumes a rate of return of 5% per year before expenses. |
Please note that the expenses shown in the table are meant to highlight your ongoing costs only and do not reflect any transactional costs, such as sales charges (loads), redemption fees, or exchange fees. Therefore, the second line of the table for each class of shares is useful in comparing ongoing costs only, and will not help you determine the relative total costs of owning different funds. In addition, if these transactional costs were included, your costs would have been higher.
24 Certified Semi-Annual Report
| | |
| OTHER INFORMATION | | |
| |
| Thornburg New Mexico Intermediate Municipal Fund | | March 31, 2011 (Unaudited) |
PORTFOLIO PROXY VOTING
Policies and Procedures:
The Trust has delegated to Thornburg Investment Management, Inc. (the “Advisor”) voting decisions respecting proxies for the Fund’s voting securities. The Advisor makes voting decisions in accordance with its Proxy Voting Policy and Procedures. A description of the Policy and Procedures is available (i) without charge, upon request, by calling the Advisor toll-free at 1-800-847-0200, (ii) on the Thornburg website at www.thornburg.com, and (iii) on the Securities and Exchange Commission’s website at www.sec.gov.
Information regarding how proxies were voted is available on or before August 31 of each year for the twelve months ending the preceding June 30. This information is available (i) without charge, upon request by calling the Advisor toll-free at 1-800-847-0200, (ii) on the Thornburg website at www.thornburg.com, and (iii) on the Securities and Exchange Commission’s website at www.sec.gov.
AVAILABILITY OF QUARTERLY PORTFOLIO SCHEDULE
The Fund files with the Securities and Exchange Commission schedules of its portfolio holdings on Form N-Q for the first and third quarters of each fiscal year. The Fund’s Forms N-Q are available on the Commission’s website at www.sec.gov, or may be reviewed and copied at the Commission’s Public Reference Room in Washington, D.C. Information on the operation of the Public Reference Room may be obtained by calling 1-800-SEC-0330. The Fund also makes this information available on its website at www.thornburg.com/ download or upon request by calling 1-800-847-0200.
Certified Semi-Annual Report 25
Trustees’ Statement to Shareholders
Not part of the Certified Semi-Annual Report
February 8, 2005, as readopted September 13, 2010
The Trustees are concerned that ongoing commentaries and opinions reported in the media may confuse investors in general as to the supervisory duties of trustees of mutual funds and, in particular, leave Thornburg Investment Trust shareholders uncertain regarding how we discharge our responsibilities in supervising the Funds’ investment advisor and in reviewing the advisor’s contract for renewal. We decided to spell out clearly three principal guidelines that we follow in supervising the Trust’s investment advisor on your behalf.
We begin with the premise that each shareholder selected his or her Fund because its investments are managed by the investment advisor identified in the prospectus and in accordance with the objective and policies described in the prospectus. We realize, as each of you do, that if you believe that your Fund’s stated objective and policies no longer serve your personal investment goals, you can sell your shares and leave the Fund.
Therefore, we believe that our primary supervisory task – our principal obligation to you – is to assess the nature and quality of the advisor’s services, and to confirm that the advisor actively and competently pursues the Fund’s objective, in accordance with the policies set out in the prospectus. To do this, we meet regularly with management to review your Fund’s portfolio and to discuss the advisor’s specific actions and judgments in pursuing the Fund’s objective. We do not substitute our own judgment for the advisor’s decisions in selecting investments; the advisor is paid to exercise its informed judgment on investment decisions, and we seek to confirm, in reviewing the advisor’s performance, that the advisor is doing just that.
Second, while we are conscious of costs and the effect that costs have on shareholders’ returns, we do not seek the lowest fees or expense ratio as our sole or primary objective. We try to make sure that your Fund’s fees and costs are reasonable in relationship to the services rendered and that they are generally in line with those charged by other expert investment advisors, consistent with our belief that the Fund’s investors searched for and expect that expertise and attention and have decided to pay a reasonable price for it. We do not put the management contract “out to bid” as a matter of course, and we would not do so unless we had concluded that the advisor materially had failed to pursue the Fund’s objectives in accordance with its policies, or for other equally important reasons. We believe that any other approach would be inconsistent with your interests and contrary to your expectations when you bought shares of the Fund in the first place.
Finally, because we believe that most Thornburg Fund shareholders have invested with a long-term perspective, we try not to focus too much on the fashions of the moment and on short-term performance. The market will not favor any specific investment objective or set of policies at all times and under all economic circumstances. A fund will experience periods of both high and low returns relative to other funds and other investments. Even if one of our Funds is not favored by the market at a particular time, we believe that the advisor is nonetheless obliged to remain true to the Fund’s objective and policies, and we watch to see that it does so.
26 This page is not part of the Semi-Annual Report.
Retirement and Education Accounts
Thornburg Investment Management offers retirement and education savings accounts that can help you meet a variety of planning challenges. For account applications or further information on any of the accounts below, please call 1-800-847-0200 or go to www.thornburg.com/ira. Your financial advisor can help you determine which plan is right for you.
Individual Retirement Accounts
Individual Retirement Accounts (IRAs) provide a tax-advantaged means to save money for the future. For a detailed outline of the difference between retirement accounts, see www.thornburg.com/ira. Rollovers are available. Call 1-800-847-0200 for more information.
Traditional IRAs – Contributions to Traditional IRAs are tax deductible for eligible individuals, and withdrawals are taxed as additional ordinary income. You may contribute to an IRA if you receive compensation and are under 70 1/2, even if you are covered by an employer retirement plan. Deductible contributions are subject to certain qualifications. Please consult your tax advisor.
Roth IRAs – Under a Roth IRA, there is no tax deduction for contributions, but there is no income tax on qualified withdrawals. For a more detailed comparison of Traditional and Roth IRAs, please see our web site at www.thornburg.com/ira.
SEP IRAs – Simplified Employee Pension (SEP) IRAs are established by employers. The employer is allowed a tax deduction for contributions made to the SEP Plan and makes contributions to each eligible employee’s SEP IRA on a discretionary basis.
SIMPLE IRAs – Savings Incentive Match Plan for Employees of Small Employers (SIMPLE) is designed to give small business owners a simplified method to establish and contribute to a retirement plan for employees. The employer is allowed a tax deduction for contributions and makes either matching or non-elective contributions to each eligible employee’s SIMPLE IRA. Employees may make salary deferral contributions.
Coverdell Education Savings Account
These savings accounts are designed to provide a way to save money for higher education expenses. In an Education Savings Account, earnings and interest grow tax-free, and qualified withdrawals used to pay for eligible higher-education expenses are tax- and penalty-free.
Funds Available
The following funds are available in the accounts listed above:
| | • | | Thornburg International Value Fund |
| | • | | Thornburg Core Growth Fund |
| | • | | Thornburg Investment Income Builder Fund |
| | • | | Thornburg Global Opportunities Fund |
| | • | | Thornburg International Growth Fund |
| | • | | Thornburg Developing World Fund |
| | • | | Thornburg Limited Term U.S. Government Fund |
| | • | | Thornburg Limited Term Income Fund |
| | • | | Thornburg Strategic Income Fund |
This page is not part of the Semi-Annual Report. 27

Thornburg Equity Funds
Thornburg’s equity research uses a fundamental and comprehensive analytical approach. Thornburg equity funds focus on a limited number of securities so that each holding can impact performance. The equity team searches for firms believed to have a promising future and seeks to buy shares of those companies at a discount to their intrinsic value.
| | • | | Thornburg International Value Fund |
| | • | | Thornburg Core Growth Fund |
| | • | | Thornburg Investment Income Builder Fund |
| | • | | Thornburg Global Opportunities Fund |
| | • | | Thornburg International Growth Fund |
| | • | | Thornburg Developing World Fund |
Thornburg Bond Funds
Thornburg Investment Management applies a disciplined philosophy to fixed-income management. Since the launch of our first fixed-income fund over 25 years ago, we have been conducting fundamental, bottom-up research in an effort to identify bonds which we believe provide the best return for a given level of risk. We are very organic in our approach, avoiding leverage or complex strategies which could backfire in periods of market uncertainty.
| | • | | Thornburg Limited Term Municipal Fund |
| | • | | Thornburg Intermediate Municipal Fund |
| | • | | Thornburg California Limited Term Municipal Fund |
| | • | | Thornburg New Mexico Intermediate Municipal Fund |
| | • | | Thornburg New York Intermediate Municipal Fund |
| | • | | Thornburg Strategic Municipal Income Fund |
| | • | | Thornburg Limited Term U.S. Government Fund |
| | • | | Thornburg Limited Term Income Fund |
| | • | | Thornburg Strategic Income Fund |
Before investing, carefully consider the Fund’s investment goals, risks, charges, and expenses. For a prospectus containing this and other information, contact your financial advisor or visit thornburg.com. Read it carefully before investing.
For additional information, please visit www.thornburg.com
Thornburg Investment Management, Inc. 2300 North Ridgetop Road, Santa Fe, NM 87506
This page is not part of the Semi-Annual Report. 29
This page intentionally left blank.
30 This page is not part of the Semi-Annual Report.
This page intentionally left blank.
This page is not part of the Semi-Annual Report. 31
| | | | | | |
 | | Waste not, Wait not | |  |
| | Get instant access to your shareholder reports. |
| | |
| | This Semi-Annual Report is submitted for the general information of shareholders of the Fund. It is not authorized for distribution to prospective investors in the Fund unless preceded or accompanied by an effective prospectus. | | By switching from your postal mailbox to your email inbox, you reduce paper clutter, improve record keeping access, and help conserve our natural resources. |
| | | | |
 | | Investment Advisor: Thornburg Investment Management® 800.847.0200 | | Go to www.thornburg.com/edelivery and sign up to receive your shareholder reports, prospectuses, and proxy statements electronically. |
| | Distributor: | | | | |
| | Thornburg Securities Corporation® 800.847.0200 | | You invest in the future, without spending a dime. |
| | TH178 | | | | |
Important Information
The information presented on the following pages is current as of March 31, 2011. The managers’ views, portfolio holdings, and sector diversification are provided for the general information of the Fund’s shareholders; they are historical and subject to change. This material should not be deemed a recommendation to buy or sell any of the securities mentioned.
Investments in the Fund carry risks, including possible loss of principal. Bond funds have the same interest rate, inflation, and credit risks that are associated with the underlying bonds. The principal value of bonds will fluctuate relative to changes in interest rates, decreasing when interest rates rise. Unlike bonds, bond funds have ongoing fees and expenses. Please see the Fund’s Prospectus for a discussion of the risks associated with an investment in the Fund. Investments in the Fund are not FDIC insured, nor are they deposits of or guaranteed by a bank or any other entity. There is no guarantee that the Fund will meet its investment objectives. The laddering strategy does not assure or guarantee better performance and cannot eliminate the risk of investment losses.
Performance data given at net asset value (NAV) does not take into account applicable sales charges. If the sales charges had been included, the performance would have been lower.
Minimum investments for Class I shares are higher than those for other classes. Class I shares may not be available to all investors.
| | | | |
Share Class | | NASDAQ Symbol | | Cusip |
Class A | | THNYX | | 885-215-665 |
Class I | | TNYIX | | 885-216-705 |
Glossary
BofA Merrill Lynch 7-12 Year U.S. Municipal Securities Index – The index represents a broad measure of market performance. It is a model portfolio of municipal obligations throughout the U.S., with an average maturity which ranges from seven to twelve years.
BofA Merrill Lynch Municipal Master Index – This index tracks the performance of the investment-grade U.S. tax-exempt bond market. Qualifying bonds must have at least one year remaining term to maturity, a fixed coupon schedule, and an investment grade rating (based on average of Moody’s, S&P, and Fitch).
Unless otherwise noted, index returns reflect the reinvestment of income dividends and capital gains, if any, but do not reflect fees, brokerage commissions or other expenses of investing. Investors may not make direct investments into any index.
Alternative Minimum Tax (AMT) – A federal tax aimed at ensuring that high-income individuals, estates, trusts, and corporations pay a minimal level income tax. For individuals, the AMT is calculated by adding tax preference items to regular taxable income.
Annualized Distribution Yield – The distribution yield is calculated by taking the sum of the month’s total distribution factors and dividing this sum by a 30-day period and annualizing to a 360-day year. The value is then divided by the ending maximum offering price per share to arrive at the annualized distribution yield. The yield is calculated on a periodic basis and is subject to change.
Basis Point (BPS) – A unit equal to 1/100th of 1%. 1% = 100 basis points (bps).
Bond Credit Ratings – A bond credit rating assesses the financial ability of a debt issuer to make timely payments of principal and interest. Ratings of AAA (the highest), AA, A, and BBB are investment-grade quality. Ratings of BB, B, CCC, CC, C, and D (the lowest) are considered below investment grade, speculative grade, or junk bonds. Unless otherwise noted, the ratings listed are from Municipal Market Data and are a combination of ratings from Standard and Poor’s, Moody’s Investors Service, and Fitch Ratings.
Build America Bonds (BAB) – Taxable municipal bonds that feature tax credits and/or federal subsidies for bondholders and state and local government bond issuers. Build America Bonds (BABs) were introduced in 2009 as part of President Obama’s American Recovery and Reinvestment Act to create jobs and stimulate the economy. BABs attempt to achieve this by lowering the cost of borrowing for state and local governments in financing new projects.
Capacity Utilization – The extent to which an enterprise or a nation actually uses its installed productive capacity. Capacity utilization reflects overall growth and demand in the economy, rising when the economy is vibrant, and falling when demand softens. High capacity utilization also exerts inflationary pressures as scarce resources are in higher demand. However, it may also lead to new capital investments, such as new plants, that promote growth in the future.
This page is not part of the Semi-Annual Report. 3
Important Information,
Continued
Consumer Price Index (CPI) – An index that measures prices of a fixed basket of goods bought by a typical consumer, including food, transportation, shelter, utilities, clothing, medical care, entertainment and other items. The CPI, published by the Bureau of Labor Statistics in the Department of Labor, is based at 100 in 1982 and is released monthly. It is widely used as a cost-of-living benchmark to adjust Social Security payments and other payment schedules, union contracts and tax brackets. The CPI is also known as the cost-of-living index.
Core CPI – Consumer Price Index minus the energy and food components.
Effective Duration – A bond’s sensitivity to interest rates, incorporating the embedded option features, such as call provisions. Bonds with longer durations experience greater price volatility than bonds with shorter durations.
Fed Funds Rate – The interest rate at which a depository institution lends immediately available funds (balances at the Federal Reserve) to another depository institution overnight.
M2 – The amount of money in circulation in notes and coin plus non-interest-bearing bank deposits, building-society deposits, and National Savings accounts.
QE2 or Quantitative Easing 2 – The second round of the Federal Reserve’s monetary policy used to stimulate the U.S. economy following the recession that began in 2007/08. QE2 was initiated in the fourth quarter of 2010 in order to jump-start the sluggish economic recovery.
SEC Yield – SEC Yield is computed in accordance with SEC standards measuring the net investment income per share over a specified 30-day period expressed as a percentage of the maximum offering price of the Fund’s shares at the end of the period.
Taylor Rule – A monetary-policy formula that provides an indication of how much the central bank would or should change the nominal interest rate in response to divergences of actual inflation rates from target inflation rates and of actual Gross Domestic Product (GDP) from potential GDP. It was first proposed by the U.S. economist John B. Taylor in 1993. The Federal Reserve Board may not use the Taylor Rule in setting monetary policy.
Treasury Inflation Protected Securities (TIPS) – Either a U.S. Treasury note or bond that offers protection from the effects of inflation. Using the Consumer Price Index as a guide, the value of the principal is adjusted to reflect the effects of inflation. A fixed interest rate is paid semi-annually on the adjusted amount. At maturity, if inflation has increased the value of the principal, the investor receives the higher value. If deflation has decreased the value, the investor receives the original face amount of the security.
4 This page is not part of the Semi-Annual Report.
Thornburg New York Intermediate Municipal Fund
At Thornburg, our approach to management of the Fund is based on the premise that investors in the Fund seek preservation of capital along with an attractive, relatively stable yield. While aggressive bond strategies may generate stronger returns when the market is turning a blind eye towards risk, they usually fail to stack up over longer periods of time.
We apply time-tested techniques to manage risk and provide attractive returns. These include:
| | • | | Building a laddered portfolio. Laddering has been shown over time to mitigate price and interest rate risk. |
| | • | | Investing on a cash-only basis without using leverage. While leveraged strategies may enhance returns when market conditions are favorable, they can quickly compound losses when sentiment shifts. |
| | • | | Conducting in-depth fundamental research on each issue and actively monitoring positions for subsequent credit events. |
| | • | | Diversifying among a large number of generally high-quality bonds. |

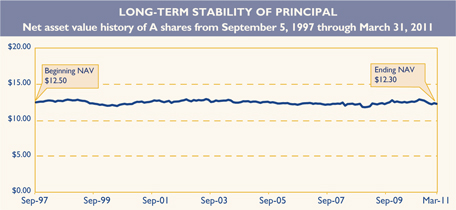
IMPORTANT
PERFORMANCE INFORMATION
Performance data shown represents past performance and is no guarantee of future results. Investment return and principal value will fluctuate so shares, when redeemed, may be worth more or less than their original cost. Current performance may be lower or higher than quoted. For performance current to the most recent month end, visit thornburg.com or call 800.847.0200.
The maximum sales charge for the Fund’s Class A shares is 2.00%. The total annual operating expenses of Class A shares are 1.07% as disclosed in the most recent Prospectus. Thornburg Investment Management and Thornburg Securities Corporation have contractually agreed to waive fees and reimburse expenses through at least February 1, 2012, so that actual expenses, for Class A shares, do not exceed 0.99%.
AVERAGE ANNUAL TOTAL RETURNS
For periods ended March 31, 2011
| | | | | | | | | | | | | | | | | | | | |
| | | 1 Yr | | | 3 Yrs | | | 5 Yrs | | | 10 Yrs | | | Since
Inception | |
A Shares (Incep: 9/5/97) | | | | | | | | | | | | | | | | | | | | |
Without sales charge | | | 1.91 | % | | | 3.66 | % | | | 3.69 | % | | | 3.51 | % | | | 4.03 | % |
With sales charge | | | -0.09 | % | | | 2.96 | % | | | 3.27 | % | | | 3.30 | % | | | 3.87 | % |
30-DAY YIELDS, A SHARES
As of March 31, 2011
| | |
Annualized
Distribution Yield | | SEC Yield |
| 3.23% | | 2.80% |
Without fee waivers and expense reimbursements, the 30-day SEC Yield would have been 2.74% and the Annualized Distribution Yield would have been 3.17%.
KEY PORTFOLIO ATTRIBUTES
As of March 31, 2011
| | | | |
Number of Bonds | | | 45 | |
Effective Duration | | | 5.9 Yrs | |
Average Maturity | | | 9.0 Yrs | |
See the entire portfolio in the Schedule of Investments beginning on page 10.
This page is not part of the Semi-Annual Report. 5

Thornburg New York Intermediate Municipal Fund
March 31, 2011
This report is certified under the Sarbanes-Oxley Act of 2002, which requires that public companies, including mutual funds, affirm that the information provided in their annual and semiannual shareholder reports fully and fairly represents their financial position.
6 Certified Semi-Annual Report
Letter to Shareholders
| | |
| |
 | | April 13, 2011 Dear Shareholder: We are pleased to present the semi-annual report for the Thornburg New York Intermediate Municipal Fund. The net asset value (NAV) of the Class A shares declined from $12.82 to $12.30 during the six months ended March 31, 2011. If you were invested with us for the entire period, you received dividends of 20.6 cents per share. If you reinvested your dividends, you received 20.8 cents per share. Dividends per share were higher for Class I shares to account for varying class-specific expenses. |
| |
 | | The first quarter of 2011 witnessed a supply lull in the municipal bond market, delivering the lightest quarter for new deals in eleven years. It followed a huge volume of deals that were brought to market in the last quarter of 2010. In addition to the light new deal calendar in the first quarter of 2011, average daily trading volume was low, measuring $11.6 billion, down 15% from the prior year. Today, conditions in the municipal bond market are characterized by low yields for short-term bonds, combined with a steep yield curve (the difference between long- and short-term interest rates), resulting in relatively more attractive yields for intermediate- and long-term bonds. Today’s municipal yield curve is the steepest in 20 years. In the last six months, rates rose, shifting upward by 56 basis points for five-year maturities, by 81 basis points for 10-year maturities, and by 86 basis points for 20-year maturities. This additional steepening of the yield curve caused longer maturity municipal bond funds to underperform shorter maturity municipal bond funds. Credit spreads are wide, relative to historical averages, with single-A municipal bonds paying on average 110 basis points more than AAA bonds at the end of March 2011. |
| |
 | | The state of New York continues to wrestle with budget deficits, though by one important measure, the political grid-lock recently gave way. The governor and legislature of New York agreed on a 2011–2012 budget that totals $132.5 billion, and if enacted, will cut the state’s year-to-year spending for the first time in more than a decade. The proposed budget imposes no new major taxes and reduces overall spending by about 2%. Municipal bond fund investors have been in redemption mode for the past six months, following approximately 22 months of net inflows into municipal bond funds that reversed in late November 2010. Large market outflows were prompted by default fears and falling mutual fund NAVs, but since January 2011, these concerns have abated somewhat. At this point, bond fund outflows industry wide have slowed from a peak of almost $4 billion weekly to around $500 million as this is written. Recent legislation has created both positive and negative forces for the performance of municipal bonds. The expiration of the Build America Bond program at the end of 2010 has not led to sharp growth in tax-exempt volume, as some had forecast. In 2010, Congress extended the Bush tax cuts |
Certified Semi-Annual Report 7
Letter to Shareholders,
Continued
another two years, so the top marginal tax rate remains at 35%, rather than escalating to 39.6%, which would have created yet more demand for tax-exempt income. Over the years we have seen many tax reform proposals come and go. Currently, a batch of new proposals is blanketing Washington, DC. If any of the proposals gain real traction, we will gauge the impact on our portfolio and seek to make appropriate adjustments.
The U.S. economic picture over the last six months has strengthened, but there remains a large degree of slack. Increased economic activity is reflected in the current 2.5% to 3.0% Gross Domestic Product (GDP) growth rate and healthy sales indicators. Unemployment remains high at 8.8%, though payroll growth was encouraging in February and March 2011, when we saw the best back-to-back increases since the recession’s official end in June 2009. Capacity utilization is still low at 76%, leaving excess capacity in the economy. Year over year, the Consumer Price Index (CPI) is currently around 2.0% to 2.5%, much higher than the core CPI rate which is only 1.1% to 1.25%. Meanwhile, the difference between 10-year TIPS yields and 10-year Treasuries is running around 2.7%, and is often viewed as a market opinion of 10-year inflation expectations. We expect QE2, the second phase of quantitative easing, to end abruptly in June 2011.
We are becoming more optimistic about the fiscal outlook for state and local governments. We have been pleased to see a rebound in revenues in New York State, driven by growth in income tax and sales tax revenue. Revenues grew in the mid-Atlantic region by 11.5% in the fourth quarter of 2010 versus the fourth quarter of 2009. The revenue growth in the mid-Atlantic region was led by New York State’s 19.0% increase in the same quarter over quarter comparison. A preliminary report from the Rockefeller Institute stated that overall state tax revenue grew 6.9% in the fourth quarter of 2010, with 41 states reporting higher revenue.
The Fed is still in super-stimulative mode, with the fed funds rate at nearly 0% since December 2008, which is viewed as appropriate according to the Taylor Rule, which currently indicates the fed funds rate should be negative 1.45%. The Taylor Rule is a formula guideline for evaluating the level of the fed funds rate created by Stanford University economist John Taylor. M2, a broad measure of money and money substitutes, has grown only 4% in the last year, at the lower end of the 3% to 10% annual growth rate that has prevailed over the last decade. Velocity of M2, the degree to which money turns over (a contributor to inflation), has remained muted.
Your Fund contains a laddered portfolio of more than 40 municipal bonds. Your Fund is broadly diversified across sectors and 77% invested in bonds rated A or above by at least one of the major rating agencies. We ladder the maturity dates of our bonds so that some of the bonds are scheduled to mature during each of the coming years. Laddering short and intermediate bonds accomplishes two goals. First, the staggered bond maturities contained in a ladder reduce interest-rate risk and dampen the Fund’s price volatility. Second, laddering gives the Fund a steady cash-flow stream from maturing bonds to reinvest toward the top end of the ladder where yields are higher. The chart on the right describes the percentages of your Fund’s bond portfolio maturing in each of the coming years.
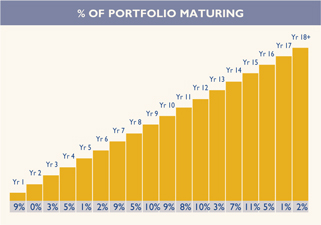
As of 3/31/11. Percentages vary over time.
Data may not add up to 100% due to rounding.
8 Certified Semi-Annual Report
The Class A shares of your Fund produced a total return of negative 2.45% at NAV for the six months ended March 31, 2011, compared to negative 2.96% for the BofA Merrill Lynch 7-12 Year Municipal Bond Index. The total return of the overall municipal bond market as measured by the BofA Merrill Lynch Municipal Master Index in the six-month period ended March 31, 2011, was negative 4.24%.
Historically, our practice of laddering a diversified portfolio of short- and intermediate-maturity bonds has allowed your Fund to perform consistently well in varying interest rate environments. Thank you for investing in Thornburg New York Intermediate Municipal Fund.
Sincerely,
| | | | |
| | |
 | |  | |  |
| Christopher Ihlefeld | | Christopher Ryon,CFA | | Josh Gonze |
| Co-Portfolio Manager | | Co-Portfolio Manager | | Co-Portfolio Manager |
| Managing Director | | Managing Director | | Managing Director |
The matters discussed in this report may constitute forward-looking statements made pursuant to the safe harbor provisions of the Securities Litigation Reform Act of 1995. These include any advisor or portfolio manager prediction, assessment, analysis or outlook for individual securities, industries, investment styles, market sectors and/or markets. These statements involve risks and uncertainties. In addition to the general risks described for each fund in its current prospectus, other factors bearing on these reports include the accuracy of the advisor’s or portfolio manager’s forecasts and predictions, the appropriateness of the investment strategies designed by the advisor or portfolio manager and the ability of the advisor or portfolio manager to implement their strategies efficiently and successfully. Any one or more of these factors, as well as other risks affecting the securities markets generally, could cause the actual results of any fund to differ materially as compared to its benchmarks.
Certified Semi-Annual Report 9
| | |
| SCHEDULE OF INVESTMENTS | | |
| |
| Thornburg New York Intermediate Municipal Fund | | March 31, 2011 (Unaudited) |
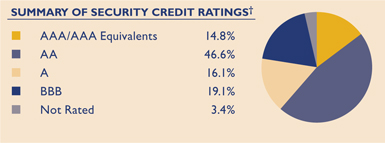
We have used ratings from Standard & Poor’s (S&P). Where S&P ratings are not available, we have used Moody’s Investors Service. Where neither rating is available, we have used ratings from Fitch Ratings. The category of investments identified as “AAA” in this graph includes investments which are pre-refunded or escrowed to maturity. Such investments are backed by an escrow or trust containing sufficient U.S. Government or U.S. Government agency securities to satisfy the timely payment of principal and interest and, therefore, are normally deemed to be equivalent to AAA-rated securities.
| | | | | | | | | | |
Issuer-Description | | Credit Rating†
S&P/ Moody’s | | Principal
Amount | | | Value | |
New York City Health & Hospital Corp. GO, 5.00% due 2/15/2025 | | A+/Aa3 | | $ | 1,000,000 | | | $ | 997,960 | |
Amherst Development Corp., 5.00% due 10/1/2020 (University at Buffalo Foundation Facility- Student Housing; Insured: AGM) | | AA+/Aa3 | | | 1,000,000 | | | | 1,041,600 | |
Amherst IDA Civic Facility, 5.75% due 4/1/2015 (Insured: ACA) | | NR/NR | | | 465,000 | | | | 475,690 | |
Brookhaven IDA Civic Facility Revenue, 4.25% due 11/1/2037 put 11/1/2011 (LOC: North Fork Bank) | | BBB+/NR | | | 1,075,000 | | | | 1,075,785 | |
Dutchess County IDA, 5.00% due 8/1/2021 (Bard College) | | NR/Baa1 | | | 1,100,000 | | | | 1,134,232 | |
Erie County IDA School Facilities Revenue, 5.25% due 5/1/2025 (Buffalo City School District) | | AA-/Aa3 | | | 1,000,000 | | | | 1,044,800 | |
Guam Government Ltd. Obligation Revenue, 5.375% due 12/1/2024 | | BBB-/NR | | | 1,000,000 | | | | 962,460 | |
Nassau County IDA, 4.75% due 3/1/2026 (NY Institute of Technology) | | BBB+/Baa2 | | | 1,000,000 | | | | 940,790 | |
New York City GO, 5.00% due 8/1/2025 | | AA/Aa2 | | | 400,000 | | | | 413,116 | |
New York City Metropolitan Transportation Authority, 6.25% due 11/15/2023 | | A/A2 | | | 1,000,000 | | | | 1,117,130 | |
New York City Municipal Water Finance Authority, 5.75% due 6/15/2013 (Insured: Natl-Re) (ETM) | | AAA/A2 | | | 1,000,000 | | | | 1,048,710 | |
New York City Transitional Finance Authority, 5.25% due 8/1/2016 pre-refunded 8/1/2012 (Insured: AMBAC) | | AA+/Aaa | | | 135,000 | | | | 143,622 | |
New York City Transitional Finance Authority, 5.00% due 1/15/2020 (State Aid Withholding) | | AA-/Aa3 | | | 1,000,000 | | | | 1,078,510 | |
New York City Transitional Finance Authority, 5.00% due 11/1/2020 | | AAA/Aaa | | | 1,000,000 | | | | 1,069,470 | |
New York City Trust Cultural Resources, 5.75% due 7/1/2014 (Museum of American Folk Art; Insured: ACA) | | NR/NR | | | 920,000 | | | | 545,082 | |
New York Convention Center Development Corp. Hotel Unit Fee, 5.00% due 11/15/2017 (Insured: AMBAC) | | NR/A1 | | | 1,000,000 | | | | 1,068,530 | |
New York Dormitory Authority, 5.25% due 7/1/2011 (D’Youville College; Insured: Radian) | | NR/NR | | | 370,000 | | | | 373,127 | |
New York Dormitory Authority, 5.00% due 2/15/2015 (Mental Health Services; Insured: AMBAC) | | AA-/NR | | | 1,000,000 | | | | 1,099,890 | |
New York Dormitory Authority, 5.00% due 7/1/2016 (Bishop Henry B. Hucles Nursing Home; Insured: SONYMA) | | NR/Aa1 | | | 600,000 | | | | 668,970 | |
New York Dormitory Authority, 5.25% due 5/15/2017 (Court Facilities Lease; Insured: AMBAC) | | AA-/Aa3 | | | 1,000,000 | | | | 1,109,950 | |
New York Dormitory Authority, 5.00% due 10/1/2018 (School District Revenue; Insured: AGM) | | AA+/Aa3 | | | 1,000,000 | | | | 1,076,800 | |
New York Dormitory Authority, 5.50% due 2/15/2019 pre-refunded 8/15/2011 (Mental Health Services; Insured: Natl-Re) | | AA-/NR | | | 585,000 | | | | 596,308 | |
New York Dormitory Authority, 5.50% due 7/1/2019 (Brooklyn Law School; Insured: Radian) | | BBB+/Baa1 | | | 1,400,000 | | | | 1,458,758 | |
New York Dormitory Authority, 6.10% due 7/1/2019 (Ryan Clinton Community Health Center; Insured: SONYMA) | | NR/Aa1 | | | 925,000 | | | | 933,075 | |
New York Dormitory Authority, 5.25% due 7/1/2022 (St. John’s University; Insured: Natl-Re) | | A-/A3 | | | 1,000,000 | | | | 1,072,420 | |
New York Dormitory Authority, 5.00% due 1/15/2023 (Municipal Health Facilities) | | AA-/A1 | | | 1,000,000 | | | | 1,031,150 | |
New York Dormitory Authority, 5.00% due 7/1/2024 (Bishop Henry B. Hucles Nursing Home; Insured: SONYMA) | | NR/Aa1 | | | 1,000,000 | | | | 1,023,310 | |
New York Dormitory Authority, 5.25% due 7/1/2027 (Health Quest Systems; Insured: AGM) | | AA+/Aa3 | | | 500,000 | | | | 502,865 | |
New York Dormitory Authority, 5.25% due 5/1/2030 (North Shore Long Island Jewish Medical) | | A-/Baa1 | | | 1,000,000 | | | | 963,770 | |
New York Dormitory Authority Personal Income Tax, 5.50% due 3/15/2012 | | AAA/Aa2 | | | 1,000,000 | | | | 1,044,110 | |
New York Dormitory Authority Personal Income Tax, 5.00% due 3/15/2019 (Insured: AGM) | | AAA/Aa3 | | | 1,000,000 | | | | 1,066,280 | |
New York Environmental Facilities Corp., 6.875% due 6/15/2014 (State Revolving Fund) | | AAA/Aaa | | | 400,000 | | | | 402,108 | |
New York State Thruway Authority Highway & Bridge Trust Fund, 5.00% due 4/1/2022 | | AA/NR | | | 1,000,000 | | | | 1,062,500 | |
10 Certified Semi-Annual Report
| | |
| SCHEDULE OF INVESTMENTS, CONTINUED | | |
| |
| Thornburg New York Intermediate Municipal Fund | | March 31, 2011 (Unaudited) |
| | | | | | | | | | | | |
Issuer-Description | | Credit Rating†
S&P/ Moody’s | | | Principal
Amount | | | Value | |
New York State Urban Development Corp., 5.25% due 1/1/2021 | | | AA-/NR | | | $ | 1,000,000 | | | $ | 1,073,570 | |
Oneida County IDA, 6.10% due 6/1/2020 (Presbyterian Home for Central NY; LOC: HSBC Bank USA) | | | NR/Aa3 | | | | 450,000 | | | | 451,571 | |
Onondaga Civic Development Corp., 5.00% due 7/1/2021 (Le Moyne College Project) | | | NR/Baa2 | | | | 1,000,000 | | | | 995,560 | |
Port Authority New York & New Jersey, 5.00% due 8/15/2022 (Insured: AGM) | | | AA+/Aa2 | | | | 1,000,000 | | | | 1,053,130 | |
Port Chester IDA, 4.75% due 7/1/2031 put 7/1/2011 (American Foundation; Collateralized: FNMA) | | | AAA/NR | | | | 750,000 | | | | 755,835 | |
Syracuse Industrial Development Agency, 5.25% due 5/1/2026 (Syracuse City School District) | | | AA-/Aa3 | | | | 2,150,000 | | | | 2,219,595 | |
Tobacco Settlement Funding Corp., 5.50% due 6/1/2021 | | | AA-/Aa3 | | | | 1,000,000 | | | | 1,041,910 | |
Triborough Bridge & Tunnel Authority, 5.00% due 11/15/2025 | | | AA-/Aa2 | | | | 1,410,000 | | | | 1,458,081 | |
United Nations Development Corp., 5.00% due 7/1/2025 | | | NR/A1 | | | | 710,000 | | | | 729,262 | |
Utica IDA, 5.375% due 7/15/2019 (Munson Williams Proctor Institute) | | | NR/A1 | | | | 525,000 | | | | 530,901 | |
Utica IDA Civic Facility, 5.25% due 7/15/2016 (Munson Williams Proctor Institute) | | | NR/A1 | | | | 210,000 | | | | 214,983 | |
Virgin Islands Water & Power Authority, 5.50% due 7/1/2017 | | | NR/Baa3 | | | | 1,350,000 | | | | 1,351,526 | |
| | | | | | | | | | | | |
TOTAL INVESTMENTS — 97.86% (Cost $ 41,147,943) | | | | | | | | | | $ | 41,518,802 | |
OTHER ASSETS LESS LIABILITIES — 2.14% | | | | | | | | | | | 906,773 | |
| | | | | | | | | | | | |
NET ASSETS — 100.00% | | | | | | | | | | $ | 42,425,575 | |
| | | | | | | | | | | | |
Footnote Legend
| † | Credit ratings are unaudited. Rating changes may have occurred subsequent to the reporting period end. Bonds issued with a maturity of one year or less are assigned Moody’s ratings from MIG-1 to MIG-4 and Standard and Poor’s ratings from SP-1+ to SP-3 with MIG-1 and SP-1+ being the strongest ratings. |
Portfolio Abbreviations
To simplify the listings of securities, abbreviations are used per the table below:
| | |
| ACA | | Insured by American Capital Access |
| AGM | | Insured by Assured Guaranty Municipal Corp. |
| AMBAC | | Insured by American Municipal Bond Assurance Corp. |
| ETM | | Escrowed to Maturity |
| FNMA | | Collateralized by Federal National Mortgage Association |
| GO | | General Obligation |
| IDA | | Industrial Development Authority |
| LOC | | Letter of Credit |
| Natl-Re | | Insured by National Public Finance Guarantee Corp. |
| Radian | | Insured by Radian Asset Assurance |
| SONYMA | | State of New York Mortgage Authority |
See notes to financial statements.
Certified Semi-Annual Report 11
| | |
| STATEMENT OF ASSETS AND LIABILITIES | | |
| |
| Thornburg New York Intermediate Municipal Fund | | March 31, 2011 (Unaudited) |
| | | | |
ASSETS | | | | |
Investments at value (cost $41,147,943) (Note 2) | | $ | 41,518,802 | |
Cash | | | 495,596 | |
Receivable for fund shares sold | | | 30,519 | |
Interest receivable | | | 590,184 | |
Prepaid expenses and other assets | | | 913 | |
| | | | |
Total Assets | | | 42,636,014 | |
| | | | |
| |
LIABILITIES | | | | |
Payable for fund shares redeemed | | | 122,042 | |
Payable to investment advisor and other affiliates (Note 3) | | | 29,638 | |
Accounts payable and accrued expenses | | | 20,665 | |
Dividends payable | | | 38,094 | |
| | | | |
Total Liabilities | | | 210,439 | |
| | | | |
| |
NET ASSETS | | $ | 42,425,575 | |
| | | | |
NET ASSETS CONSIST OF: | | | | |
Distribution in excess of net investment income | | $ | (16,847 | ) |
Net unrealized appreciation on investments | | | 370,859 | |
Accumulated net realized gain (loss) | | | 33,758 | |
Net capital paid in on shares of beneficial interest | | | 42,037,805 | |
| | | | |
| | $ | 42,425,575 | |
| | | | |
| |
NET ASSET VALUE: | | | | |
Class A Shares: | | | | |
Net asset value and redemption price per share ($41,222,621 applicable to 3,351,101 shares of beneficial interest outstanding - Note 4) | | $ | 12.30 | |
Maximum sales charge, 2.00% of offering price | | | 0.25 | |
| | | | |
Maximum offering price per share | | $ | 12.55 | |
| | | | |
| |
Class I Shares: | | | | |
Net asset value, offering and redemption price per share ($1,202,954 applicable to 97,789 shares of beneficial interest outstanding - Note 4) | | $ | 12.30 | |
| | | | |
See notes to financial statements.
12 Certified Semi-Annual Report
| | |
| STATEMENT OF OPERATIONS | | |
| |
| Thornburg New York Intermediate Municipal Fund | | Six Months Ended March 31, 2011 (Unaudited) |
| | | | |
INVESTMENT INCOME: | | | | |
Interest income (net of premium amortized of $140,682) | | $ | 1,020,547 | |
| | | | |
| |
EXPENSES: | | | | |
Investment advisory fees (Note 3) | | | 118,529 | |
Administration fees (Note 3) | | | | |
Class A Shares | | | 28,633 | |
Class I Shares | | | 400 | |
Distribution and service fees (Note 3) | | | | |
Class A Shares | | | 57,266 | |
Transfer agent fees | | | | |
Class A Shares | | | 10,425 | |
Class I Shares | | | 31 | |
Registration and filing fees | | | | |
Class A Shares | | | 146 | |
Custodian fees (Note 3) | | | 13,623 | |
Professional fees | | | 11,544 | |
Accounting fees | | | 673 | |
Trustee fees | | | 608 | |
Other expenses | | | 3,735 | |
| | | | |
Total Expenses | | | 245,613 | |
Less: | | | | |
Expenses reimbursed by investment advisor (Note 3) | | | (13,078 | ) |
Fees paid indirectly (Note 3) | | | (423 | ) |
| | | | |
Net Expenses | | | 232,112 | |
| | | | |
Net Investment Income | | | 788,435 | |
| | | | |
REALIZED AND UNREALIZED GAIN (LOSS) | | | | |
Net realized gain (loss) on investments | | | 66,588 | |
Net change in unrealized appreciation (depreciation) of investments | | | (2,146,500 | ) |
| | | | |
Net Realized and Unrealized Loss | | | (2,079,912 | ) |
| | | | |
Net Decrease in Net Assets Resulting from Operations | | $ | (1,291,477 | ) |
| | | | |
See notes to financial statements.
Certified Semi-Annual Report 13
STATEMENTS OF CHANGES IN NET ASSETS
Thornburg New York Intermediate Municipal Fund
| | | | | | | | |
| | | Six Months Ended
March 31, 2011* | | | Year Ended
September 30, 2010 | |
INCREASE (DECREASE) IN NET ASSETS FROM | | | | | | | | |
| | |
OPERATIONS: | | | | | | | | |
Net investment income | | $ | 788,435 | | | $ | 1,498,974 | |
Net realized gain (loss) on investments | | | 66,588 | | | | 6,049 | |
Increase (Decrease) in unrealized appreciation (depreciation) of investments | | | (2,146,500 | ) | | | 252,625 | |
| | | | | | | | |
| | |
Net Increase (Decrease) in Net Assets Resulting from Operations | | | (1,291,477 | ) | | | 1,757,648 | |
| | |
DIVIDENDS TO SHAREHOLDERS: | | | | | | | | |
From net investment income | | | | | | | | |
Class A Shares | | | (759,369 | ) | | | (1,473,778 | ) |
Class I Shares | | | (29,066 | ) | | | (25,196 | ) |
| | |
FUND SHARE TRANSACTIONS (NOTE 4): | | | | | | | | |
Class A Shares | | | (4,969,206 | ) | | | 7,862,026 | |
Class I Shares | | | (500,075 | ) | | | 1,738,988 | |
| | | | | | | | |
| | |
Net Increase (Decrease) in Net Assets | | | (7,549,193 | ) | | | 9,859,688 | |
| | |
NET ASSETS: | | | | | | | | |
Beginning of Period | | | 49,974,768 | | | | 40,115,080 | |
| | | | | | | | |
| | |
End of Period | | $ | 42,425,575 | | | $ | 49,974,768 | |
| | | | | | | | |
See notes to financial statements.
14 Certified Semi-Annual Report
| | |
| NOTES TO FINANCIAL STATEMENTS | | |
| |
| Thornburg New York Intermediate Municipal Fund | | March 31, 2011 (Unaudited) |
NOTE 1 – ORGANIZATION
Thornburg New York Intermediate Municipal Fund (the “Fund”) is a non-diversified series of Thornburg Investment Trust (the “Trust”). The Trust is organized as a Massachusetts business trust under a Declaration of Trust dated June 3, 1987 and is registered as a diversified, open-end management investment company under the Investment Company Act of 1940, as amended. The Fund is currently one of sixteen separate series of the Trust. Each series is considered to be a separate entity for financial reporting and tax purposes and bears expenses directly attributable to it. The Fund’s primary investment objective is to obtain as high a level of current income exempt from federal, New York State, and New York City individual income tax as is consistent, in the view of the Fund’s investment advisor, with the preservation of capital. The Fund’s secondary objective is to reduce expected changes in its share price compared to long-term bond portfolios. The Fund will invest primarily in municipal obligations within the state of New York.
The Fund currently offers two classes of shares of beneficial interest; Class A and Class I shares. Each class of shares of the Fund represents an interest in the same portfolio of investments, except that (i) Class A shares are sold subject to a front-end sales charge collected at the time the shares are purchased and bear a service fee and (ii) Class I shares are sold at net asset value without a sales charge at the time of purchase, and (iii) the respective classes may have different reinvestment privileges and conversion rights. Additionally, the Fund may allocate among its classes certain expenses, to the extent allowable to specific classes, including transfer agent fees, government registration fees, certain printing and postage costs, and administrative and legal expenses. Currently, class specific expenses of the Fund are limited to service and distribution fees, administration fees, and certain registration and transfer agent expenses.
NOTE 2 – SIGNIFICANT ACCOUNTING POLICIES
Significant accounting policies of the Trust are as follows:
Valuation of Investments: Debt obligations have a primary market over the counter and are valued by an independent pricing service approved by the Trustees of the Trust. The pricing service ordinarily values debt obligations at quoted bid prices. When quotations are not available, debt obligations are valued at evaluated prices determined by the pricing service using methods which include consideration of yields or prices of debt obligations of comparable quality, type of issue, coupon, maturity and rating, and indications as to value from dealers and general market conditions. Short-term obligations having remaining maturities of 60 days or less are ordinarily valued at amortized cost, which approximates market value.
In any case where a pricing service fails to provide a price for a debt obligation held by the Fund, the valuation and pricing committee determines a fair value for the obligation using procedures approved by the Trustees. Additionally, in any case where management believes that a price provided by a pricing service for a debt obligation may be unreliable, the valuation and pricing committee decides whether or not to use the pricing service’s valuation or to determine a fair value for the obligation.
In determining fair value for any portfolio security or other investment, the valuation and pricing committee seeks to determine the amount that an owner of the investment might reasonably expect to receive upon a sale of the investment. However, because fair value prices are estimated prices, the valuation and pricing committee’s determination of fair value for an investment may differ from the value that would be realized by the Fund upon a sale of the investment, and that difference could be material to the Fund’s financial statements. The valuation and pricing committee’s determination of fair value for an investment may also differ from the prices obtained by other persons (including other mutual funds) for the investment.
Valuation Measurements: Various inputs are used in determining the value of the Fund’s investments. These inputs are summarized in the three levels listed below.
Level 1: Quoted prices in active markets for identical investments.
Level 2: Other significant observable inputs (including quoted prices for similar investments, interest rates, prepayment rates, credit risk, etc.).
Level 3: Significant unobservable inputs (including the Fund’s own assumptions in determining the fair value of investments).
Certified Semi-Annual Report 15
| | |
| NOTES TO FINANCIAL STATEMENTS, CONTINUED | | |
| |
| Thornburg New York Intermediate Municipal Fund | | March 31, 2011 (Unaudited) |
The following table displays a summary of the inputs used to value the Fund’s net assets as of March 31, 2011. In any instance when valuation inputs from more than one level are used to determine the fair value of a specific investment, the investment is placed in the level of the table based upon the lowest level input that is significant in determining the fair value of the investment:
| | | | | | | | | | | | | | | | |
| | | Fair Value Measurements at March 31, 2011 | |
| | | Total | | | Level 1 | | | Level 2 | | | Level 3 | |
Assets | | | | | | | | | | | | | | | | |
Investments in Securities | | | | | | | | | | | | | | | | |
Municipal Bonds | | $ | 41,518,802 | | | $ | — | | | $ | 41,518,802 | | | $ | — | |
| | | | | | | | | | | | | | | | |
Total Investments in Securities | | $ | 41,518,802 | | | $ | — | | | $ | 41,518,802 | | | $ | — | |
Other Notes: It is the policy of the Fund to recognize significant transfers between Levels 1 and 2 and to disclose those transfers at the last date of the reporting period. The Fund recognized no significant transfers into and out of Levels 1 and 2 during the six months ended March 31, 2011.
Federal Income Taxes: It is the policy of the Trust to comply with the provisions of the Internal Revenue Code applicable to “regulated investment companies” and to distribute to shareholders substantially all taxable (if any) and tax exempt income of the Fund. Therefore, no provision for federal income tax is required.
Management reviews each tax position believed to be material to the preparation of the Fund’s financial statements, to assess if it is more likely than not that the position would be sustained upon examination, based upon the technical merits of the position. As of March 31, 2011, management has not identified any such position for which a liability must be reflected in the Statement of Assets and Liabilities. The Fund’s tax returns remain subject to examination for three years after filing.
When-Issued and Delayed Delivery Transactions: The Fund may engage in when-issued or delayed delivery transactions. To the extent the Fund engages in such transactions, it will do so for the purpose of acquiring portfolio securities consistent with the Fund’s investment objectives and not for the purpose of investment leverage or to speculate on interest rate and/or market changes. At the time the Fund makes a commitment to purchase a security on a when-issued or delayed delivery basis, the Fund will record the transaction and reflect the value in determining its net asset value. When effecting such transactions, assets of an amount sufficient to make payment for the portfolio securities to be purchased will be segregated on the Fund’s records on the trade date. Securities purchased on a when-issued or delayed delivery basis do not earn interest until the settlement date.
Dividends: Net investment income of the Fund is declared daily as a dividend on shares for which the Fund has received payment. Dividends are paid monthly and are reinvested in additional shares of the Fund at net asset value per share at the close of business on the dividend payment date, or at the shareholder’s option, paid in cash. Net realized capital gains, to the extent available, will be distributed at least annually.
General: Securities transactions are accounted for on a trade date basis. Interest income is accrued as earned. Premiums and discounts on securities purchased are amortized to call dates or maturity dates of the respective securities. Realized gains and losses from the sale of securities are recorded on an identified cost basis. Net investment income (other than class specific expenses) and realized and unrealized gains and losses are allocated daily to each class of shares based upon the relative net asset value of outstanding shares (or the value of the dividend-eligible shares, as appropriate) of each class of shares at the beginning of the day (after adjusting for the current capital shares activity of the respective class). Expenses common to all Funds are allocated among the Funds comprising the Trust based upon their relative net asset values or other appropriate allocation methods.
Guarantees and Indemnifications: Under the Trust’s organizational documents, its officers and Trustees are indemnified against certain liabilities arising out of the performance of their duties to the Fund. Additionally, in the normal course of business the Trust enters into contracts with service providers that contain general indemnification clauses. The Trust’s maximum exposure under these arrangements is unknown. However, based on experience, the Trust expects the risk of loss to be remote.
Use of Estimates: The preparation of financial statements, in conformity with generally accepted accounting principles, requires management to make estimates and assumptions that affect the reported amounts of assets and liabilities and the disclosure of contingent assets and liabilities at the date of the financial statements and the reported amounts of increases and decreases in net assets from operations during the reporting period. Actual results could differ from those estimates.
16 Certified Semi-Annual Report
| | |
| NOTES TO FINANCIAL STATEMENTS, CONTINUED | | |
| |
| Thornburg New York Intermediate Municipal Fund | | March 31, 2011 (Unaudited) |
NOTE 3 – INVESTMENT ADVISORY FEE AND OTHER TRANSACTIONS WITH AFFILIATES
Pursuant to an investment advisory agreement, Thornburg Investment Management, Inc. (the “Advisor”) serves as the investment advisor and performs services to the Fund for which the fees are payable at the end of each month. For the six months ended March 31, 2011, these fees were payable at annual rates ranging from .50 of 1% to .275 of 1% per annum of the average daily net assets of the Fund depending on the Fund’s asset size. The Trust also has entered into administrative services agreements with the Advisor, whereby the Advisor will perform certain administrative services for the shareholders of each class of the fund shares, and for which fees will be payable at an annual rate of up to .125 of 1% per annum of the average daily net assets attributable to each class of shares. For the six months ended March 31, 2011, the Advisor contractually reimbursed certain class specific expenses and administrative fees of $12,988 for Class A shares and $90 for Class I shares.
The Trust has an underwriting agreement with Thornburg Securities Corporation (the “Distributor,” an affiliate of the Advisor), which acts as the distributor of the Fund’s shares. For the six months ended March 31, 2011, the Distributor has advised the Fund that it earned net commissions aggregating $473 from the sale of Class A shares.
Pursuant to a service plan under Rule 12b-1 of the Investment Company Act of 1940, the Fund may reimburse to the Advisor an amount not to exceed .25 of 1% per annum of the average daily net assets attributable to each class of shares of the Fund for payments made by the Advisor to securities dealers and other financial institutions to obtain various shareholder and distribution related services. For the six months ended March 31, 2011, there were no 12b-1 service plan fees charged for Class I shares. The Advisor may pay out of its own resources additional expenses for distribution of the Fund’s shares.
The Trust has an agreement with the custodian bank to indirectly pay a portion of the custodian’s fees through credits earned by the Fund’s cash on deposit with the bank. This deposit agreement is an alternative to overnight investments. Custodial fees have been adjusted to reflect amounts that would have been paid without this agreement, with a corresponding adjustment reflected as fees paid indirectly in the Statement of Operations. For the six months ended March 31, 2011, fees paid indirectly were $423.
Certain officers and Trustees of the Trust are also officers and/or directors of the Advisor and Distributor. The compensation of independent Trustees is borne by the Trust.
NOTE 4 – SHARES OF BENEFICIAL INTEREST
At March 31, 2011, there were an unlimited number of shares of beneficial interest authorized. Transactions in shares of beneficial interest were as follows:
| | | | | | | | | | | | | | | | |
| | | Six Months Ended
March 31, 2011 (Unaudited) | | | Year Ended
September 30, 2010 (Audited) | |
| | | Shares | | | Amount | | | Shares | | | Amount | |
Class A Shares | | | | | | | | | | | | | | | | |
Shares sold | | | 298,659 | | | $ | 3,744,842 | | | | 1,220,966 | | | $ | 15,381,956 | |
Shares issued to shareholders in reinvestment of dividends | | | 41,821 | | | | 519,675 | | | | 81,263 | | | | 1,024,581 | |
Shares repurchased | | | (749,557 | ) | | | (9,233,723 | ) | | | (678,311 | ) | | | (8,544,511 | ) |
| | | | | | | | | | | | | | | | |
| | | | |
Net Increase (Decrease) | | | (409,077 | ) | | $ | (4,969,206 | ) | | | 623,918 | | | $ | 7,862,026 | |
| | | | | | | | | | | | | | | | |
| | | | |
Class I Shares* | | | | | | | | | | | | | | | | |
Shares sold | | | 11,002 | | | $ | 139,875 | | | | 137,346 | | | $ | 1,727,927 | |
Shares issued to shareholders in reinvestment of dividends | | | 1,635 | | | | 20,333 | | | | 1,412 | | | | 17,935 | |
Shares repurchased | | | (53,066 | ) | | | (660,283 | ) | | | (540 | ) | | | (6,874 | ) |
| | | | | | | | | | | | | | | | |
| | | | |
Net Increase (Decrease) | | | (40,429 | ) | | $ | (500,075 | ) | | | 138,218 | | | $ | 1,738,988 | |
| | | | | | | | | | | | | | | | |
| * | The effective date of this class of shares was February 1, 2010. |
Certified Semi-Annual Report 17
| | |
| NOTES TO FINANCIAL STATEMENTS, CONTINUED | | |
| |
| Thornburg New York Intermediate Municipal Fund | | March 31, 2011 (Unaudited) |
NOTE 5 – SECURITIES TRANSACTIONS
For the six months ended March 31, 2011, the Fund had purchase and sale transactions of investment securities (excluding short-term investments) of $8,615,135 and $4,416,266, respectively.
NOTE 6 – INCOME TAXES
At March 31, 2011, information on the tax components of capital is as follows:
| | | | |
Cost of investments for tax purposes | | $ | 41,147,943 | |
| | | | |
Gross unrealized appreciation on a tax basis | | $ | 1,017,136 | |
Gross unrealized depreciation on a tax basis | | | (646,277 | ) |
| | | | |
Net unrealized appreciation (depreciation) on investments (tax basis) | | $ | 370,859 | |
| | | | |
At March 31, 2011, the Fund had tax basis capital losses of $32,830, which may be carried forward to offset future capital gains. To the extent such carryforwards are used, capital gain distributions may be reduced to the extent provided by regulations. Such capital loss carryforwards will expire September 30, 2014.
OTHER NOTES
Fund management believes no events have occurred between March 31, 2011 and May 20, 2011, the date of issuance of the financial statements, which require adjustment of, or disclosure in, the accompanying financial statements.
18 Certified Semi-Annual Report
This page intentionally left blank.
Certified Semi-Annual Report 19
FINANCIAL HIGHLIGHTS
Thornburg New York Intermediate Municipal Fund
| | | | | | | | | | | | | | | | | | | | | | | | | | | | | | | | | | | | | | | | | | | | | | | | | | | | | | | | | | | | |
| | | PER SHARE PERFORMANCE (for a share outstanding
throughout the period)+ | | | RATIOS TO AVERAGE NET ASSETS | | | SUPPLEMENTAL DATA | |
Unless
Otherwise
Noted,
Periods
are Fiscal
Years
Ended
Sept. 30, | | Net
Asset
Value
Beginning
of
Period | | | Net
Invest-
ment
Income
(Loss) | | | Net
Realized
&
Unrealized
Gain
(Loss)
on
Investments | | | Total
from
Invest-
ment
Operations | | | Dividends
from
Net
Invest-
ment
Income | | | Dividends
from
Net
Realized
Gains | | | Total
Dividends | | | Net
Asset
Value
End
of
Period | | | Net
Invest-
ment
Income
(Loss)
(%) | | | Expenses,
After
Expense
Reductions
(%) | | | Expenses,
After
Expense
Reductions
and
Net of
Custody
Credits
(%) | | | Expenses,
Before
Expense
Reductions
(%) | | | Total
Return
(%)(a) | | | Portfolio
Turnover
Rate
(%) | | | Net
Assets
at End
of
Period
(Thousands) | |
Class A Shares | | | | | | | | | | | | | | | | | | | | | | | | | | | | | | | | | | | | | |
2011(b)(c) | | $ | 12.82 | | | | 0.21 | | | | (0.52 | ) | | | (0.31 | ) | | | (0.21 | ) | | | — | | | | (0.21 | ) | | $ | 12.30 | | | | 3.32 | (d) | | | 0.99 | (d) | | | 0.99 | (d) | | | 1.05 | (d) | | | (2.45 | ) | | | 9.55 | | | $ | 41,223 | |
2010(c) | | $ | 12.79 | | | | 0.42 | | | | 0.04 | | | | 0.46 | | | | (0.43 | ) | | | — | | | | (0.43 | ) | | $ | 12.82 | | | | 3.38 | | | | 0.99 | | | | 0.99 | | | | 1.07 | | | | 3.68 | | | | 11.79 | | | $ | 48,203 | |
2009(c) | | $ | 11.87 | | | | 0.45 | | | | 0.92 | | | | 1.37 | | | | (0.45 | ) | | | — | | | | (0.45 | ) | | $ | 12.79 | | | | 3.67 | | | | 0.99 | | | | 0.99 | | | | 1.07 | | | | 11.77 | | | | 13.00 | | | $ | 40,115 | |
2008(c) | | $ | 12.30 | | | | 0.44 | | | | (0.43 | ) | | | 0.01 | | | | (0.44 | ) | | | — | | | | (0.44 | ) | | $ | 11.87 | | | | 3.61 | | | | 1.01 | | | | 0.99 | | | | 1.08 | | | | 0.07 | | | | 13.42 | | | $ | 30,685 | |
2007(c) | | $ | 12.38 | | | | 0.46 | | | | (0.08 | ) | | | 0.38 | | | | (0.46 | ) | | | — | | | | (0.46 | ) | | $ | 12.30 | | | | 3.74 | | | | 1.01 | | | | 0.99 | | | | 1.11 | | | | 3.13 | | | | 14.91 | | | $ | 33,016 | |
2006(c) | | $ | 12.44 | | | | 0.45 | | | | (0.06 | ) | | | 0.39 | | | | (0.45 | ) | | | — | | | | (0.45 | ) | | $ | 12.38 | | | | 3.66 | | | | 1.01 | | | | 0.99 | | | | 1.11 | | | | 3.23 | | | | 15.38 | | | $ | 34,849 | |
| | | | | | | | | |
Class I Shares | | | | | | | | | | | | | | | | | | | | | | | | | | | | | | | | | | | | | |
2011(b) | | $ | 12.82 | | | | 0.23 | | | | (0.52 | ) | | | (0.29 | ) | | | (0.23 | ) | | | — | | | | (0.23 | ) | | $ | 12.30 | | | | 3.63 | (d) | | | 0.67 | (d) | | | 0.67 | (d) | | | 0.68 | (d) | | | (2.30 | ) | | | 9.55 | | | $ | 1,203 | |
2010(e) | | $ | 12.48 | | | | 0.29 | | | | 0.35 | | | | 0.64 | | | | (0.30 | ) | | | — | | | | (0.30 | ) | | $ | 12.82 | | | | 3.53 | (d) | | | 0.67 | (d) | | | 0.67 | (d) | | | 1.32 | (d) | | | 5.22 | | | | 11.79 | | | $ | 1,772 | |
| (a) | Not annualized for periods less than one year. |
| (b) | Unaudited Six Month Period Ended March 31. |
| (c) | Sales loads are not reflected in computing total return. |
| (e) | Effective date of this class of shares was February 1, 2010. |
| + | Based on weighted average shares outstanding. |
See notes to financial statements.
| | |
| 20 Certified Semi-Annual Report | | Certified Semi-Annual Report 21 |
| | |
| EXPENSE EXAMPLE | | |
| |
| Thornburg New York Intermediate Municipal Fund | | March 31, 2011 (Unaudited) |
As a shareholder of the Fund, you incur two types of costs:
| | (1) | transaction costs, including |
(a) sales charges (loads) on purchase payments, for Class A shares;
(b) a deferred sales charge on redemptions of any part or all of a purchase of $1 million of Class A shares within 12 months of purchase;
| | (2) | ongoing costs, including management fees; distribution and/or service (12b-1) fees; and other Fund expenses. |
This example is intended to help you understand your ongoing costs (in dollars) of investing in the Fund and to compare these costs with the ongoing costs of investing in other mutual funds.
The example is based on a $1,000 investment beginning on October 1, 2010, and held until March 31, 2011.
ACTUAL EXPENSES
The first line of the table at right provides information about actual account values and actual expenses. You may use the information in this line, together with the amount you invested, to estimate the expenses that you paid over the period. Simply divide your account value by $1,000 (for example, an $8,600 account value divided by $1,000 = 8.6), then multiply the result by the number in the first line under the heading entitled “Expenses Paid During Period” to estimate the expenses you paid on your account during this period.
HYPOTHETICAL EXAMPLE FOR COMPARISON PURPOSES
The second line of the table at right provides information about hypothetical account values and hypothetical expenses based on the Fund’s actual expense ratio and an assumed rate of return of 5% per year before expenses, which is not the Fund’s actual return. The hypothetical account values and expenses may not be used to estimate the actual ending account balance or expenses you paid for the period. You may use this information to compare the ongoing costs of investing in the Fund and other funds. To do so, compare this 5% hypothetical example with the 5% hypothetical examples that appear in the shareholder reports of the other funds.
| | | | | | | | | | | | |
| | | Beginning
Account Value
10/1/10 | | | Ending
Account Value
3/31/11 | | | Expenses Paid
During Period†
10/1/10–3/31/11 | |
Class A Shares | | | | | | | | | | | | |
Actual | | $ | 1,000.00 | | | $ | 975.50 | | | $ | 4.88 | |
Hypothetical* | | $ | 1,000.00 | | | $ | 1,020.00 | | | $ | 4.99 | |
Class I Shares | | | | | | | | | | | | |
Actual | | $ | 1,000.00 | | | $ | 977.00 | | | $ | 3.29 | |
Hypothetical* | | $ | 1,000.00 | | | $ | 1,021.60 | | | $ | 3.37 | |
| † | Expenses are equal to the annualized expense ratio for each class (A: 0.99%; I: 0.67%) multiplied by the average account value over the period, multiplied by 182/365 to reflect the one-half year period. |
| * | Hypothetical assumes a rate of return of 5% per year before expenses. |
Please note that the expenses shown in the table are meant to highlight your ongoing costs only and do not reflect any transactional costs, such as sales charges (loads), redemption fees, or exchange fees. Therefore, the second line of the table is useful in comparing ongoing costs only, and will not help you determine the relative total costs of owning different funds. In addition, if these transactional costs were included, your costs would have been higher.
22 Certified Semi-Annual Report
| | |
| OTHER INFORMATION | | |
| |
| Thornburg New York Intermediate Municipal Fund | | March 31, 2011 (Unaudited) |
PORTFOLIO PROXY VOTING
Policies and Procedures:
The Trust has delegated to Thornburg Investment Management, Inc. (the “Advisor”) voting decisions respecting proxies for the Fund’s voting securities. The Advisor makes voting decisions in accordance with its Proxy Voting Policy and Procedures. A description of the Policy and Procedures is available (i) without charge, upon request, by calling the Advisor toll-free at 1-800-847-0200, (ii) on the Thornburg website at www.thornburg.com, and (iii) on the Securities and Exchange Commission’s website at www.sec.gov.
Information regarding how proxies were voted is available on or before August 31 of each year for the twelve months ending the preceding June 30. This information is available (i) without charge, upon request by calling the Advisor toll-free at 1-800-847-0200, (ii) on the Thornburg website at www.thornburg.com, and (iii) on the Securities and Exchange Commission’s website at www.sec.gov.
AVAILABILITY OF QUARTERLY PORTFOLIO SCHEDULE
The Fund files with the Securities and Exchange Commission schedules of its portfolio holdings on Form N-Q for the first and third quarters of each fiscal year. The Fund’s Forms N-Q are available on the Commission’s website at www.sec.gov, or may be reviewed and copied at the Commission’s Public Reference Room in Washington, D.C. Information on the operation of the Public Reference Room may be obtained by calling 1-800-SEC-0330. The Fund also makes this information available on its website at www.thornburg.com/ download or upon request by calling 1-800-847-0200.
Certified Semi-Annual Report 23
Trustees’ Statement to Shareholders
Not part of the Certified Semi-Annual Report
February 8, 2005, as readopted September 13, 2010
The Trustees are concerned that ongoing commentaries and opinions reported in the media may confuse investors in general as to the supervisory duties of trustees of mutual funds and, in particular, leave Thornburg Investment Trust shareholders uncertain regarding how we discharge our responsibilities in supervising the Funds’ investment advisor and in reviewing the advisor’s contract for renewal. We decided to spell out clearly three principal guidelines that we follow in supervising the Trust’s investment advisor on your behalf.
We begin with the premise that each shareholder selected his or her Fund because its investments are managed by the investment advisor identified in the prospectus and in accordance with the objective and policies described in the prospectus. We realize, as each of you do, that if you believe that your Fund’s stated objective and policies no longer serve your personal investment goals, you can sell your shares and leave the Fund.
Therefore, we believe that our primary supervisory task – our principal obligation to you – is to assess the nature and quality of the advisor’s services, and to confirm that the advisor actively and competently pursues the Fund’s objective, in accordance with the policies set out in the prospectus. To do this, we meet regularly with management to review your Fund’s portfolio and to discuss the advisor’s specific actions and judgments in pursuing the Fund’s objective. We do not substitute our own judgment for the advisor’s decisions in selecting investments; the advisor is paid to exercise its informed judgment on investment decisions, and we seek to confirm, in reviewing the advisor’s performance, that the advisor is doing just that.
Second, while we are conscious of costs and the effect that costs have on shareholders’ returns, we do not seek the lowest fees or expense ratio as our sole or primary objective. We try to make sure that your Fund’s fees and costs are reasonable in relationship to the services rendered and that they are generally in line with those charged by other expert investment advisors, consistent with our belief that the Fund’s investors searched for and expect that expertise and attention and have decided to pay a reasonable price for it. We do not put the management contract “out to bid” as a matter of course, and we would not do so unless we had concluded that the advisor materially had failed to pursue the Fund’s objectives in accordance with its policies, or for other equally important reasons. We believe that any other approach would be inconsistent with your interests and contrary to your expectations when you bought shares of the Fund in the first place.
Finally, because we believe that most Thornburg Fund shareholders have invested with a long-term perspective, we try not to focus too much on the fashions of the moment and on short-term performance. The market will not favor any specific investment objective or set of policies at all times and under all economic circumstances. A fund will experience periods of both high and low returns relative to other funds and other investments. Even if one of our Funds is not favored by the market at a particular time, we believe that the advisor is nonetheless obliged to remain true to the Fund’s objective and policies, and we watch to see that it does so.
24 This page is not part of the Semi-Annual Report.
Retirement and Education Accounts
Thornburg Investment Management offers retirement and education savings accounts that can help you meet a variety of planning challenges. For account applications or further information on any of the accounts below, please call 1-800-847-0200 or go to www.thornburg.com/ira. Your financial advisor can help you determine which plan is right for you.
Individual Retirement Accounts
Individual Retirement Accounts (IRAs) provide a tax-advantaged means to save money for the future. For a detailed outline of the difference between retirement accounts, see www.thornburg.com/ira. Rollovers are available. Call 1-800-847-0200 for more information.
Traditional IRAs – Contributions to Traditional IRAs are tax deductible for eligible individuals, and withdrawals are taxed as additional ordinary income. You may contribute to an IRA if you receive compensation and are under 70 1/2, even if you are covered by an employer retirement plan. Deductible contributions are subject to certain qualifications. Please consult your tax advisor.
Roth IRAs – Under a Roth IRA, there is no tax deduction for contributions, but there is no income tax on qualified withdrawals. For a more detailed comparison of Traditional and Roth IRAs, please see our web site at www.thornburg.com/ira.
SEP IRAs – Simplified Employee Pension (SEP) IRAs are established by employers. The employer is allowed a tax deduction for contributions made to the SEP Plan and makes contributions to each eligible employee’s SEP IRA on a discretionary basis.
SIMPLE IRAs – Savings Incentive Match Plan for Employees of Small Employers (SIMPLE) is designed to give small business owners a simplified method to establish and contribute to a retirement plan for employees. The employer is allowed a tax deduction for contributions and makes either matching or non-elective contributions to each eligible employee’s SIMPLE IRA. Employees may make salary deferral contributions.
Coverdell Education Savings Account
These savings accounts are designed to provide a way to save money for higher education expenses. In an Education Savings Account, earnings and interest grow tax-free, and qualified withdrawals used to pay for eligible higher-education expenses are tax- and penalty-free.
Funds Available
The following funds are available in the accounts listed above:
| | • | | Thornburg International Value Fund |
| | • | | Thornburg Core Growth Fund |
| | • | | Thornburg Investment Income Builder Fund |
| | • | | Thornburg Global Opportunities Fund |
| | • | | Thornburg International Growth Fund |
| | • | | Thornburg Developing World Fund |
| | • | | Thornburg Limited Term U.S. Government Fund |
| | • | | Thornburg Limited Term Income Fund |
| | • | | Thornburg Strategic Income Fund |
This page is not part of the Semi-Annual Report. 25

Thornburg Equity Funds
Thornburg’s equity research uses a fundamental and comprehensive analytical approach. Thornburg equity funds focus on a limited number of securities so that each holding can impact performance. The equity team searches for firms believed to have a promising future and seeks to buy shares of those companies at a discount to their intrinsic value.
| | • | | Thornburg International Value Fund |
| | • | | Thornburg Core Growth Fund |
| | • | | Thornburg Investment Income Builder Fund |
| | • | | Thornburg Global Opportunities Fund |
| | • | | Thornburg International Growth Fund |
| | • | | Thornburg Developing World Fund |
Thornburg Bond Funds
Thornburg Investment Management applies a disciplined philosophy to fixed-income management. Since the launch of our first fixed-income fund over 25 years ago, we have been conducting fundamental, bottom-up research in an effort to identify bonds which we believe provide the best return for a given level of risk. We are very organic in our approach, avoiding leverage or complex strategies which could backfire in periods of market uncertainty.
| | • | | Thornburg Limited Term Municipal Fund |
| | • | | Thornburg Intermediate Municipal Fund |
| | • | | Thornburg California Limited Term Municipal Fund |
| | • | | Thornburg New Mexico Intermediate Municipal Fund |
| | • | | Thornburg New York Intermediate Municipal Fund |
| | • | | Thornburg Strategic Municipal Income Fund |
| | • | | Thornburg Limited Term U.S. Government Fund |
| | • | | Thornburg Limited Term Income Fund |
| | • | | Thornburg Strategic Income Fund |
Before investing, carefully consider the Fund’s investment goals, risks, charges, and expenses. For a prospectus containing this and other information, contact your financial advisor or visit thornburg.com. Read it carefully before investing.
For additional information, please visit www.thornburg.com
Thornburg Investment Management, Inc. 2300 North Ridgetop Road, Santa Fe, NM 87506
This page is not part of the Semi-Annual Report. 27
| | | | | | |
 | | Waste not, Wait not | |  |
| |
| | Get instant access to your shareholder reports. |
| | |
| | This Semi-Annual Report is submitted for the general information of shareholders of the Fund. It is not authorized for distribution to prospective investors in the Fund unless preceded or accompanied by an effective prospectus. | | By switching from your postal mailbox to your email inbox, you reduce paper clutter, improve record keeping access, and help conserve our natural resources. |
| | |

| | Investment Advisor: Thornburg Investment Management® | | Go to www.thornburg.com/edelivery and sign up to receive your shareholder reports, prospectuses, and proxy statements electronically. |
| | 800.847.0200 | | |
| | Distributor: | | |
| | Thornburg Securities Corporation® 800.847.0200 | | You invest in the future, without spending a dime. |
| | TH1069 | | |

Important Information
The information presented on the following pages was current as of March 31, 2011. The managers’ views, portfolio holdings, and sector diversification are provided for the general information of the Funds’ shareholders; they are historical and subject to change. This material should not be deemed a recommendation to buy or sell any of the securities mentioned.
Investments in the Funds carry risks, including possible loss of principal. Bond funds have the same interest rate, inflation, and credit risks that are associated with the underlying bonds. The principal value of a bond will fluctuate relative to changes in interest rates, decreasing when interest rates rise. Unlike bonds, bond funds have ongoing fees and expenses. Funds invested in mortgage backed securities may bear additional risk. Please see each Fund’s Prospectus for a discussion of the risks associated with an investment in either Fund. Investments in the Funds are not FDIC insured, nor are they deposits of or guaranteed by a bank or any other entity. There is no guarantee that the Funds will meet their investment objectives. The laddering strategy does not assure or guarantee better performance and cannot eliminate the risk of investment losses.
Performance data given at net asset value (NAV) does not take into account applicable sales charges. If the sales charges had been included, the performance would have been lower. Minimum investments for Class I shares are higher than those for other classes. Class I and R3 shares may not be available to all investors.
| | | | |
Limited Term U.S. Government Fund | | NASDAQ SYMBOLS | | CUSIPS |
Class A | | LTUSX | | 885-215-103 |
Class B | | LTUBX | | 885-215-848 |
Class C | | LTUCX | | 885-215-830 |
Class I | | LTUIX | | 885-215-699 |
Class R3 | | LTURX | | 885-215-491 |
| | |
Limited Term Income Fund | | | | |
Class A | | THIFX | | 885-215-509 |
Class C | | THICX | | 885-215-764 |
Class I | | THIIX | | 885-215-681 |
Class R3 | | THIRX | | 885-215-483 |
Lipper Fund Award 2011
Thornburg Limited Term Income Fund, Class I Shares, was granted a Lipper Fund Award for the ten-year period ended 12/31/10, among 82 Short-Intermediate Investment Grade Debt Funds. Lipper Fund Awards are granted annually to the fund in each Lipper classification that consistently delivered the strongest risk-adjusted performance (calculated with dividends reinvested). Awards are given for three-year, five-year, and ten-year periods. The fund did not win the awards for other time periods.
Glossary
The Barclays Capital Aggregate Bond Index – An unmanaged, market-weighted index composed of approximately 8,000 publicly traded bonds including U.S. government, mortgage-backed, corporate and Yankee bonds.
Barclays Capital Intermediate Government/Credit Bond Index – An unmanaged, market-weighted index generally representative of intermediate government and investment-grade corporate debt securities having maturities from one up to ten years.
Barclays Capital Intermediate Government Bond Index – An unmanaged, market-weighted index generally representative of all public obligations of the U.S. Government, its agencies and instrumentalities having maturities from one up to ten years.
Barclays Capital U.S. Corporate Index – The U.S. Corporate Index covers USD-denominated, investment-grade, fixed-rate, taxable securities sold by industrial, utility and financial issuers. It includes publicly issued U.S. corporate and foreign debentures and secured notes that meet specified maturity, liquidity, and quality requirements.
Unless otherwise noted, index returns reflect the reinvestment of income dividends and capital gains, if any, but do not reflect fees, brokerage commissions or other expenses of investing. Investors may not make direct investments into any index.
Annualized Distribution Yield – The distribution yield is calculated by taking the sum of the month’s total distribution factors and dividing this sum by a 30-day period and annualizing to a 360-day year. The value is then divided by the ending maximum offering price per share to arrive at the annualized distribution yield. The yield is calculated on a periodic basis and is subject to change.
Agency Security – A debt obligation issued by government corporations or government sponsored enterprises. Agency securities are exempt from state and local taxes. They are not guaranteed by the U.S. government.
Bond Credit Ratings – A bond credit rating assesses the financial ability of a debt issuer to make timely payments of principal and interest. Ratings of AAA (the highest), AA, A, and BBB are investment-grade quality. Ratings of BB, B, CCC, CC, C, and D (the lowest) are considered below investment grade, speculative grade, or junk bonds. Unless otherwise noted, the ratings listed are from Bloomberg Market Data and are a combination of ratings from Standard and Poor’s, Moody’s Investors Service, and/or Fitch Ratings.
Effective Duration – A bond’s sensitivity to interest rates, incorporating the embedded option features, such as call provisions. Bonds with longer durations experience greater price volatility than bonds with shorter durations.
Government Sponsored Enterprises (GSE) – Privately held corporations with public purposes created by the U.S. Congress to reduce the cost of capital for certain borrowing sectors of the economy. Members of these sectors include students, farmers, and homeowners.
Lipper Short-Intermediate Investment Grade Category – Funds that invest at least 65% of their assets in investment grade debt issues (rated in top four grades) with dollar-weighted average maturities of one to five years.
This page is not part of the Semi-Annual Report. 3
Important Information,
Continued
Lipper Short-Intermediate U.S. Government Bond Category – Funds that invest at least 65% of assets in securities issued or guaranteed by the U.S. government, its agencies, or its instrumentalities, with dollar weighted average maturities of one to five years.
SEC Yield – SEC Yield is computed in accordance with SEC standards measuring the net investment income per share over a specified 30-day period expressed as a percentage of the maximum offering price of the Fund’s shares at the end of the period.
U.S. Treasury Securities – U.S. Treasury securities, such as bills, notes and bonds, are negotiable debt obligations of the U.S. government. These debt obligations are backed by the “full faith and credit” of the government and issued at various schedules and maturities. Income from Treasury securities is exempt from state and local, but not federal income taxes.
4 This page is not part of the Semi-Annual Report.
This page intentionally left blank.
This page is not part of the Semi-Annual Report. 5
Thornburg Limited Term U.S. Government Fund
At Thornburg, our approach to management of the Fund is based on the premise that investors in the Fund seek preservation of capital along with an attractive, relatively stable yield. While aggressive bond strategies may generate stronger returns when the market is turning a blind eye towards risk, they usually fail to stack up over longer periods of time.
We apply time-tested techniques to manage risk and provide attractive returns. These include:
| | • | | Building a laddered portfolio. Laddering has been shown over time to mitigate price and interest rate risk. |
| | • | | Investing on a cash-only basis without using leverage. While leveraged strategies may enhance returns when market conditions are favorable, they can quickly compound losses when sentiment shifts. |
| | • | | Conducting careful research to invest where we see the best relative value among government and agency sectors. |
IMPORTANT PERFORMANCE INFORMATION
Performance data shown represents past performance and is no guarantee of future results. Investment return and principal value will fluctuate so shares, when redeemed, may be worth more or less than their original cost. Current performance may be lower or higher than quoted. For performance current to the most recent month end, visit thornburg.com or call 800-847-0200.
The maximum sales charge for the Limited Term U.S. Government Fund’s Class A shares is 1.50%. The total annual fund operating expense of Class A shares is 0.92%, as disclosed in the most recent Prospectus.
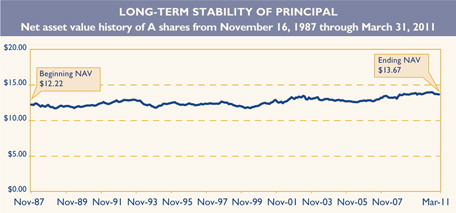
| | | | | | | | | | |
| AVERAGE ANNUAL TOTAL RETURNS |
| For periods ended March 31, 2011 |
| | | | | | | | | | | | | | | | | | | | |
| | | 1 Yr | | | 3 Yrs | | | 5 Yrs | | | 10 Yrs | | | Since
Inception | |
A Shares (Incep: 11/16/87) | | | | | | | | | | | | | | | | | | | | |
Without sales charge | | | 2.86 | % | | | 3.89 | % | | | 4.96 | % | | | 4.36 | % | | | 5.83 | % |
With sales charge | | | 1.31 | % | | | 3.38 | % | | | 4.65 | % | | | 4.21 | % | | | 5.76 | % |

| | | | |
| 30-DAY YIELDS |
| As of March 31, 2011 |
| | | | | | | | |
| | | Annualized
Distribution Yield | | | SEC
Yield | |
A Shares | | | 2.74 | % | | | 2.22 | % |
| | | | |
| KEY PORTFOLIO ATTRIBUTES |
| As of March 31, 2011 |
| | | | |
Number of Bonds | | | 161 | |
Effective Duration | | | 2.8 Yrs | |
Average Maturity | | | 3.4 Yrs | |
See the entire portfolio in the Schedule of Investments beginning on page 13.
6 This page is not part of the Semi-Annual Report.
Thornburg Limited Term Income Fund
The Thornburg Limited Term Income Fund takes the laddering strategy to the broader fixed-income market. Expanding beyond government and agency securities brings additional risks – as well as potentially higher returns. Our team addresses these uncertainties by employing a comprehensive approach to risk management. While utilizing the ladder to balance interest rate and reinvestment risk, the team also:
| | • | | Invests on a cash-only basis. While leveraged strategies may enhance returns when market conditions are favorable, they can quickly compound losses when sentiment shifts. |
| | • | | Conducts in-depth fundamental research on each credit issue under consideration. The goal of this research is identification of bonds which provide a reasonable return for their given level of risk. |
| | • | | Maintains a portfolio of high-quality bonds and diversifies among a large number of bonds to minimize the potential impact of default by any single issuer. |

Class I Shares
Ten-Year Period – Among 82
Short-Intermediate Investment
Grade Debt Funds
IMPORTANT PERFORMANCE INFORMATION
Performance data shown represents past performance and is no guarantee of future results. Investment return and principal value will fluctuate so shares, when redeemed, may be worth more or less than their original cost. Current performance may be lower or higher than quoted. For performance current to the most recent month end, visit thornburg.com or call 800-847-0200.
The maximum sales charge for the Limited Term Income Fund’s Class A shares is 1.50%. The total annual operating expenses of Class A shares are 1.01% as disclosed in the most recent Prospectus. Thornburg Investment Management and Thornburg Securities Corporation have contractually agreed to waive fees and reimburse expenses through at least February 1, 2012, so that actual expenses, for Class A shares, do not exceed 0.99%.
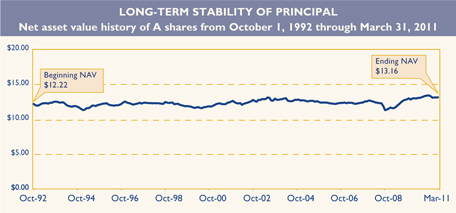
| | | | | | | | | | |
| AVERAGE ANNUAL TOTAL RETURNS |
| For periods ended March 31, 2011 |
| | | | | | | | | | | | | | | | | | | | |
| | | 1 Yr | | | 3 Yrs | | | 5 Yrs | | | 10 Yrs | | | Since
Inception | |
A Shares (Incep: 10/1/92) | | | | | | | | | | | | | | | | | | | | |
Without sales charge | | | 5.41 | % | | | 6.10 | % | | | 5.84 | % | | | 5.04 | % | | | 5.65 | % |
With sales charge | | | 3.82 | % | | | 5.58 | % | | | 5.52 | % | | | 4.88 | % | | | 5.56 | % |
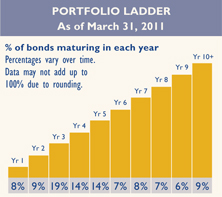
| | | | |
| 30-DAY YIELDS |
| As of March 31, 2011 |
| | | | | | | | |
| | | Annualized
Distribution Yield | | | SEC
Yield | |
A Shares | | | 3.39 | % | | | 2.69 | % |
| | |
| KEY PORTFOLIO ATTRIBUTES |
| As of March 31, 2011 |
| | | | |
Number of Bonds | | | 367 | |
Effective Duration | | | 3.3 Yrs | |
Average Maturity | | | 4.9 Yrs | |
See the entire portfolio in the Schedule of Investments beginning on page 17.
This page is not part of the Semi-Annual Report. 7

Thornburg Limited Term Income Funds
March 31, 2011
Table of Contents
This report is certified under the Sarbanes-Oxley Act of 2002, which requires that public companies, including mutual funds, affirm that the information provided in their annual and semiannual shareholder reports fully and fairly represents their financial position.
8 Certified Semi-Annual Report
Letter to Shareholders
| | |
| | | April 17, 2011 |
| |
| | Dear Fellow Shareholder: |
| |

Jason Brady,CFA Portfolio Manager, Thornburg Limited Term U.S. Government Fund Co-Portfolio Manager Thornburg Limited Term Income Fund | | We are pleased to present the Semi-Annual Report for the Thornburg Limited Term U.S. Government Fund and the Thornburg Limited Term Income Fund for the period ended March 31, 2011. The net asset value (NAV) of a Class A share of the Thornburg Limited Term U.S. Government Fund decreased 27 cents in the period to $13.67. If you were invested for the entire period, you received dividends of 21.4 cents per share. If you reinvested your dividends, you received 21.5 cents per share. Dividends per share were lower for Class B and C shares and higher for Class I and R3 shares to account for varying class-specific expenses. The NAV of a Class A share of the Thornburg Limited Term Income Fund decreased 25 cents in the period to $13.16. If you were invested for the entire period, you received dividends of 24.2 cents per share. If you reinvested your dividends, you received 24.4 cents per share. Dividends per share were lower for Class C shares and higher for Class I and R3 shares to account for varying class-specific expenses. Please examine the accompanying financial statements for more detailed information. |
| |

Lon Erickson,CFA Co-Portfolio Manager Thornburg Limited Term Income Fund | | The yields on U.S. Treasuries were somewhat volatile over the course of the past year, with general price appreciation in U.S. Treasuries driving returns in that sector. Volatility in credit spreads (the additional yield the market requires for investing in risky securities versus credit risk-less U.S. Treasuries) on all non-Treasury bond asset classes was notably lower than in previous years. The two-year U.S. Treasury moved from a 1.02% yield to a 0.83% yield over the course of the past year (with an interim low of 0.33%), while the ten-year U.S. Treasury moved from a 3.83% yield to a 3.47% yield (with an interim low of 2.39%). Credit spreads were tame compared with the previous three years, though in the context of a much longer history, they remained volatile. The Barclays Corporate Credit Index Option Adjusted Spread (OAS) (or the difference between Treasuries and the average investment grade corporate bond) moved from 1.50% on March 31, 2010 to 1.42% on March 31, 2011. The twelve-month high of 1.98% was reached in June of 2010. In contrast, two years ago on March 31, 2009, the OAS of the index stood at 5.43%. The 30-year average of this index is 1.27%, to put these levels in perspective. We believe that in most years, the movements of benchmark U.S. Treasury rates are a larger factor in the year-to-year returns of high quality bond funds such as the Thornburg Limited Term U.S. Government and the Thornburg Limited Term Income Funds. Over an entire cycle, both benchmark U.S. Treasury rates and credit spreads matter about equally, but the effect of credit spread movements is more often felt in shorter periods of market stress (1991, 1997, 2002, 2008), while the additional income from these investments has a less dramatic, but important, quiet compounding effect over longer periods. The credit spread movements of cor- |
Certified Semi-Annual Report 9
Letter to Shareholders,
Continued
porate bonds, agency debentures, mortgages (both agency and non-agency), and other asset-backed sectors dominated the investment landscape in 2008 and 2009. More recently, as evidenced above, the movements of underlying “risk-free” U.S. Treasury rates is beginning to dominate price volatility. As such it is perhaps useful to remember why our “Limited Term” funds are loath to invest notably further out the curve into longer duration securities.
While “Limited Term” refers to a ten-year and shorter investment universe, the longer end of the curve (more than ten years) is only 11.2% of the Barclays Capital Aggregate Bond Index. As a result, we are capturing the vast majority of the various opportunities available in the marketplace. In addition, the movements of interest rates in the latter part of 2010 and the beginning of 2011 serve to illustrate the additional volatility that investing in very long duration securities adds to a portfolio. The movement in 30-year Treasuries from 8/31/10 to 2/8/11 (the low in yield of the past year at 3.52% and the high in yield of 4.77%, respectively) was 1.25% in yield (simple subtraction). But because the duration of the 30-year Treasury is so long, the corresponding price movement was a loss in price of approximately 20%. The movement in two-year Treasuries from 11/3/10 to 2/8/11 (the low in yield of the past year of 0.33% and the high in yield of 0.85%, respectively) was 0.52%, or a loss of slightly less than 1% in price. Even if the two-year Treasury had moved 1.25%, the corresponding price loss would have been less than 2.5%. Though the yield curve is steep and therefore the promised yield on the 30-year Treasury is quite high relative to the two-year Treasury, we don’t think that over time the additional volatility that investors must endure to achieve this higher yield is worth it. (Not to mention the opportunity cost of foregoing future investment opportunities that will likely crop up somewhere between two and 30 years time). We will continue to invest shareholder funds in accordance with our mandate of a good risk-reward balance and muted NAV volatility.
We discussed in previous letters that the nearly uninterrupted recovery from early 2009 through 2010 was a boon to the Fund’s shareholders. We moved the Limited Term Income Fund’s credit allocation (along with other Thornburg Funds) to take advantage of unprecedented spread levels during the late 2008/early 2009 blowout. The Fund reached its Prospectus maximum in BBB securities (35%) at about this time, and many of those holdings continue to provide significant income for our shareholders. Even in the Thornburg Limited Term Government Fund, with its more restrictive purview, we took advantage of spread widening by significantly increasing the proportion of Government Sponsored Entity (GSE) mortgage debt which was trading at levels that provided a notable income advantage versus U.S. Treasuries.
We believe that the Federal Reserve’s (the Fed’s) extraordinarily accommodative policy has been a key driver to the return of risk in the marketplace, and the first step of the removal of that policy is set to begin at the end of June 2011. Whether the U.S. economy is strong enough to stand on its own without that accommodation is an open question, as is the Fed’s reaction in the case of another dip in activity. This combination of “known unknowns”, as well as the ever-present “unknown unknowns”, leads us to believe that the benign market environment of the past six months is unlikely to persist. With the dramatic recovery in prices of all bonds in the face of these issues, we are becoming more defensive. We are actively moving to make the portfolios higher quality
10 Certified Semi-Annual Report
and more nimble, to protect liquidity in the face of possible price losses from either credit spread movements or interest rate movements.
Putting income and change in price together, the Class A shares of the Thornburg Limited Term U.S. Government Fund produced a total return of negative 0.40% over the six-month period, assuming a beginning-of-period investment at the NAV. The Barclays Capital Intermediate Government Bond Index produced a negative 1.53% total return over the same time period. The average return for the Lipper Short-Intermediate U.S. Government Bond Category was negative 0.53%. The Class A shares of the Thornburg Limited Term Income Fund produced a total return of 0.25% over the six-month period, assuming a beginning-of-period investment at the NAV. The Barclays Capital Intermediate Government/Credit Bond Index produced a negative 1.11% total return over the same time period. The average return for the Lipper Short-Intermediate Investment Grade Category was negative 0.10%. The Barclays indices reflect no deduction for fees, expenses, or taxes.
Thornburg Investment Management will continue to strive to give you, the bond investor, a consistent income stream and a set of Funds which are not highly correlated to equity markets’ returns. The broad distribution of fund returns in the past three, five, and ten years shows that those who reached for yield by taking incremental risk for which they were not compensated have suffered, while those not nimble enough to take advantage of opportunities in the market did not benefit from a market recovery. In many cases investors have been surprised by their fixed income allocation’s performance. We believe that the store of value in your bond portfolio should benefit you through economic cycles and we strive to invest with that in mind. In this environment, though low quality fixed income can move in tandem with equities, the risk of holding extremely high quality cash instruments or U.S. Treasuries alone is also present, especially when one considers potential erosion of purchasing power due to potential long-run inflation. As a result, we continue to try to place capital preservation (in all senses of the term) at the top of the list of priorities for these core Funds. While we do not believe that yields will rise dramatically in the near term, given an outlook for slow economic growth trends, rest assured that we at Thornburg are very cognizant of that longer term risk and believe that we are preparing the portfolios accordingly.
No matter the direction of interest rates or credit spreads in the near term, we believe your Funds are well positioned to achieve their longer term goals of principal stability and reasonable income. The Thornburg Limited Term U.S. Government Fund and the Thornburg Limited Term Income Fund are laddered portfolios of short-to-intermediate bonds. This balances duration and yield in a way which is designed to provide the best risk-adjusted bond returns over time.
One final note: S&P has recently placed the rating of U.S. Treasuries on negative outlook. While we believe that the likelihood of a downgrade is low, we are serious about our analysis of all securities, including the credit risk of supposedly “risk-free” Treasuries. The last time a rating agency placed the United States on negative outlook was occasioned by Moody’s in 1996. Subsequently the finances of the United States improved to a degree that by 2000 the market was actively discussing the possibility of the end of U.S. Treasury borrowing altogether. While we do not believe that such a rosy scenario is on offer, we do hope that this action will help to motivate
Certified Semi-Annual Report 11
Letter to Shareholders,
Continued
legislators and voters to consider the ramifications of poor fiscal policy over a longer time frame than the next election cycle.
Thank you very much for investing in our Funds. We feel that the Thornburg Limited Term U.S. Government Fund and the Thornburg Limited Term Income Fund are appropriate investments for those looking for core bond investments. While we of course can not guarantee future performance, Thornburg Investment Management will continue to strive to chart a steady course in what continues to be a volatile marketplace.
Sincerely,
| | | | |
 | |  | | |
| | |
Jason H. Brady,CFA Co-PortfolioManager Managing Director | | Lon R. Erickson,CFA Co-PortfolioManager Managing Director | | |
The matters discussed in this report may constitute forward-looking statements made pursuant to the safe harbor provisions of the Securities Litigation Reform Act of 1995. These include any advisor or portfolio manager prediction, assessment, analysis or outlook for individual securities, industries, investment styles, market sectors and/or markets. These statements involve risks and uncertainties. In addition to the general risks described for each fund in its current prospectus, other factors bearing on these reports include the accuracy of the advisor’s or portfolio manager’s forecasts and predictions, the appropriateness of the investment strategies designed by the advisor or portfolio manager and the ability of the advisor or portfolio manager to implement their strategies efficiently and successfully. Any one or more of these factors, as well as other risks affecting the securities markets generally, could cause the actual results of any fund to differ materially as compared to its benchmarks.
12 Certified Semi-Annual Report
SCHEDULE OF INVESTMENTS
| | |
Thornburg Limited Term U.S. Government Fund | | March 31, 2011 (Unaudited) |
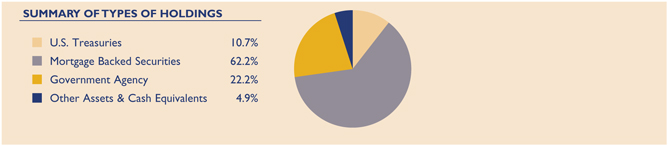
| | | | | | | | |
Issuer-Description | | Principal
Amount | | | Value | |
U.S. TREASURY SECURITIES — 10.67% | | | | | | | | |
United States Treasury Notes, 4.625%, 10/31/2011 | | $ | 2,000,000 | | | $ | 2,051,289 | |
United States Treasury Notes, 4.875%, 6/30/2012 | | | 4,000,000 | | | | 4,221,953 | |
United States Treasury Notes, 2.625%, 2/29/2016 | | | 2,000,000 | | | | 2,041,172 | |
United States Treasury Notes, 4.875%, 8/15/2016 | | | 5,000,000 | | | | 5,645,313 | |
United States Treasury Notes, 4.625%, 2/15/2017 | | | 4,000,000 | | | | 4,459,375 | |
United States Treasury Notes, 2.25%, 11/30/2017 | | | 3,500,000 | | | | 3,381,328 | |
United States Treasury Notes, 3.625%, 2/15/2020 | | | 1,000,000 | | | | 1,027,305 | |
United States Treasury Notes Inflationary Index, 2.00%, 7/15/2014 | | | 2,336,260 | | | | 2,563,315 | |
United States Treasury Notes Inflationary Index, 1.875%, 7/15/2015 | | | 4,528,080 | | | | 4,982,303 | |
United States Treasury Notes Inflationary Index, 2.00%, 1/15/2016 | | | 5,546,950 | | | | 6,124,180 | |
| | | | | | | | |
TOTAL U.S. TREASURY SECURITIES (Cost $34,155,862) | | | | | | | 36,497,533 | |
| | | | | | | | |
U.S. GOVERNMENT AGENCIES — 22.24% | | | | | | | | |
EJM Airport LLC Lease Revenue Bond, 6.271%, 5/15/2020 | | | 2,503,189 | | | | 2,738,088 | |
Federal Agricultural Mtg Corp., 6.71%, 7/28/2014 | | | 200,000 | | | | 229,841 | |
Federal Farm Credit Bank, 6.06%, 5/28/2013 | | | 240,000 | | | | 266,496 | |
Federal Farm Credit Bank, 3.98%, 1/22/2015 | | | 1,000,000 | | | | 1,076,420 | |
Federal Home Loan Bank, 5.375%, 6/13/2014 | | | 2,000,000 | | | | 2,239,139 | |
Federal Home Loan Bank, 5.00%, 12/8/2017 | | | 3,000,000 | | | | 3,354,872 | |
Federal Home Loan Bank, 2.25%, 3/26/2018 | | | 3,000,000 | | | | 3,048,913 | |
Federal Home Loan Bank, 2.00%, 2/9/2021 | | | 3,000,000 | | | | 2,980,067 | |
Federal Home Loan Bank, 3.00%, 3/23/2021 | | | 2,950,000 | | | | 2,950,138 | |
Federal Home Loan Mtg Corp., 4.50%, 1/15/2015 | | | 5,000,000 | | | | 5,481,887 | |
Federal Home Loan Mtg Corp., 4.875%, 6/13/2018 | | | 3,000,000 | | | | 3,328,601 | |
Federal National Mtg Assoc., 4.40%, 2/19/2015 | | | 1,585,000 | | | | 1,732,237 | |
Federal National Mtg Assoc., 2.00%, 3/26/2015 | | | 3,000,000 | | | | 3,045,436 | |
New Valley Generation I, Tennessee Valley Authority, 7.299%, 3/15/2019 | | | 3,069,642 | | | | 3,608,389 | |
aOverseas Private Investment Corp., 4.10%, 11/15/2014 | | | 1,003,200 | | | | 1,048,344 | |
Private Export Funding Corp., 5.685%, 5/15/2012 | | | 5,000,000 | | | | 5,294,095 | |
Private Export Funding Corp., 4.974%, 8/15/2013 | | | 2,700,000 | | | | 2,942,330 | |
Private Export Funding Corp., 5.45%, 9/15/2017 | | | 3,000,000 | | | | 3,434,688 | |
Small Business Administration Participation Certificates, Series 2002-20A Class 1, 6.14%, 1/1/2022 | | | 2,165,175 | | | | 2,372,319 | |
Small Business Administration Participation Certificates, Series 2002-20K Class 1, 5.08%, 11/1/2022 | | | 2,001,590 | | | | 2,128,820 | |
Small Business Administration Participation Certificates, Series 2005-20H Class 1, 5.11%, 8/1/2025 | | | 1,094,313 | | | | 1,165,420 | |
Small Business Administration Participation Certificates, Series 2007-20D Class 1, 5.32%, 4/1/2027 | | | 2,064,699 | | | | 2,209,014 | |
Small Business Administration Participation Certificates, Series 2007-20F Class 1, 5.71%, 6/1/2027 | | | 804,464 | | | | 865,915 | |
Small Business Administration Participation Certificates, Series 2007-20I Class 1, 5.56%, 9/1/2027 | | | 3,721,061 | | | | 4,026,510 | |
Small Business Administration Participation Certificates, Series 2007-20K Class 1, 5.51%, 11/1/2027 | | | 2,270,230 | | | | 2,449,656 | |
Small Business Administration Participation Certificates, Series 2008-20G Class 1, 5.87%, 7/1/2028 | | | 5,586,460 | | | | 6,057,578 | |
Certified Semi-Annual Report 13
| | |
| SCHEDULE OF INVESTMENTS, CONTINUED | | |
| |
| Thornburg Limited Term U.S. Government Fund | | March 31, 2011 (Unaudited) |
| | | | | | | | |
Issuer-Description | | Principal
Amount | | | Value | |
Tennessee Valley Authority, 4.75%, 8/1/2013 | | $ | 3,000,000 | | | $ | 3,252,030 | |
a,bU.S. Department of Transportation Headquarters, Series 2004 Class A-2, 5.594%, 12/7/2021 | | | 2,647,242 | | | | 2,753,132 | |
| | | | | | | | |
TOTAL U.S. GOVERNMENT AGENCIES (Cost $73,531,069) | | | | | | | 76,080,375 | |
| | | | | | | | |
MORTGAGE BACKED — 62.21% | | | | | | | | |
Federal Home Loan Mtg Assoc., CMO Series 3684 Class CM, 2.50%, 8/15/2024 | | | 2,768,852 | | | | 2,800,780 | |
Federal Home Loan Mtg Corp., CMO Series 1321 Class TE, 7.00%, 8/15/2022 | | | 478,791 | | | | 527,982 | |
Federal Home Loan Mtg Corp., CMO Series 2420 Class MC, 6.00%, 2/15/2017 | | | 723,906 | | | | 776,765 | |
Federal Home Loan Mtg Corp., CMO Series 2509 Class TV, 5.50%, 4/15/2022 | | | 2,292,243 | | | | 2,381,353 | |
Federal Home Loan Mtg Corp., CMO Series 2527 Class BP, 5.00%, 11/15/2017 | | | 1,803,551 | | | | 1,920,845 | |
Federal Home Loan Mtg Corp., CMO Series 2529 Class MB, 5.00%, 11/15/2017 | | | 1,594,503 | | | | 1,703,999 | |
Federal Home Loan Mtg Corp., CMO Series 2553 Class GB, 5.00%, 1/15/2018 | | | 1,000,000 | | | | 1,073,107 | |
Federal Home Loan Mtg Corp., CMO Series 2558 Class BD, 5.00%, 1/15/2018 | | | 4,185,535 | | | | 4,518,526 | |
Federal Home Loan Mtg Corp., CMO Series 2622 Class PE, 4.50%, 5/15/2018 | | | 2,500,000 | | | | 2,645,894 | |
Federal Home Loan Mtg Corp., CMO Series 2628 Class AB, 4.50%, 6/15/2018 | | | 668,373 | | | | 699,598 | |
Federal Home Loan Mtg Corp., CMO Series 2628 Class DQ, 3.00%, 11/15/2017 | | | 335,277 | | | | 343,408 | |
Federal Home Loan Mtg Corp., CMO Series 2641 Class WE, 4.50%, 1/15/2033 | | | 520,079 | | | | 545,496 | |
Federal Home Loan Mtg Corp., CMO Series 2642 Class JE, 5.00%, 9/15/2032 | | | 2,000,000 | | | | 2,143,016 | |
Federal Home Loan Mtg Corp., CMO Series 2649 Class QH, 4.50%, 7/15/2018 | | | 1,000,000 | | | | 1,064,683 | |
Federal Home Loan Mtg Corp., CMO Series 2692 Class QD, 5.00%, 12/15/2022 | | | 2,575,000 | | | | 2,728,779 | |
Federal Home Loan Mtg Corp., CMO Series 2731 Class Vl, 5.50%, 12/15/2014 | | | 1,812,727 | | | | 1,931,751 | |
Federal Home Loan Mtg Corp., CMO Series 2744 Class JG, 5.00%, 8/15/2032 | | | 1,500,000 | | | | 1,587,214 | |
Federal Home Loan Mtg Corp., CMO Series 2770 Class UD, 4.50%, 5/15/2017 | | | 2,290,290 | | | | 2,371,285 | |
Federal Home Loan Mtg Corp., CMO Series 2808 Class VA, 5.50%, 5/15/2015 | | | 5,315,776 | | | | 5,701,989 | |
Federal Home Loan Mtg Corp., CMO Series 2814 Class GB, 5.00%, 6/15/2019 | | | 621,897 | | | | 655,281 | |
Federal Home Loan Mtg Corp., CMO Series 2825 Class VP, 5.50%, 6/15/2015 | | | 3,623,935 | | | | 3,875,267 | |
Federal Home Loan Mtg Corp., CMO Series 2827 Class BU, 3.50%, 7/15/2019 | | | 2,500,000 | | | | 2,562,003 | |
Federal Home Loan Mtg Corp., CMO Series 3020 Class VA, 5.50%, 11/15/2014 | | | 910,299 | | | | 953,160 | |
Federal Home Loan Mtg Corp., CMO Series 3054 Class DW, 5.50%, 5/15/2034 | | | 1,328,590 | | | | 1,405,097 | |
Federal Home Loan Mtg Corp., CMO Series 3067 Class PJ, 5.50%, 7/15/2031 | | | 3,000,000 | | | | 3,118,915 | |
Federal Home Loan Mtg Corp., CMO Series 3068 Class VA, 5.50%, 10/15/2016 | | | 1,169,416 | | | | 1,188,244 | |
Federal Home Loan Mtg Corp., CMO Series 3078 Class PC, 5.50%, 11/15/2030 | | | 2,250,000 | | | | 2,346,857 | |
Federal Home Loan Mtg Corp., CMO Series 3178 Class MC, 6.00%, 4/15/2032 | | | 5,275,000 | | | | 5,389,822 | |
Federal Home Loan Mtg Corp., CMO Series 3184 Class PC, 5.50%, 8/15/2032 | | | 4,794,546 | | | | 4,890,017 | |
Federal Home Loan Mtg Corp., CMO Series 3187 Class LA, 5.50%, 4/15/2031 | | | 678,245 | | | | 685,593 | |
Federal Home Loan Mtg Corp., CMO Series 3192 Class GB, 6.00%, 1/15/2031 | | | 458,586 | | | | 461,969 | |
Federal Home Loan Mtg Corp., CMO Series 3228 Class PC, 5.50%, 7/15/2030 | | | 366,523 | | | | 366,109 | |
Federal Home Loan Mtg Corp., CMO Series 3271 Class LU, 5.50%, 1/15/2018 | | | 2,264,346 | | | | 2,394,515 | |
Federal Home Loan Mtg Corp., CMO Series 3319 Class PA, 5.50%, 8/15/2030 | | | 357,987 | | | | 363,492 | |
Federal Home Loan Mtg Corp., CMO Series 3320 Class TC, 5.50%, 10/15/2032 | | | 2,000,000 | | | | 2,067,615 | |
Federal Home Loan Mtg Corp., CMO Series 3331 Class PB, 6.00%, 1/15/2031 | | | 2,000,000 | | | | 2,070,553 | |
Federal Home Loan Mtg Corp., CMO Series 3351 Class PK, 5.50%, 1/15/2032 | | | 2,456,005 | | | | 2,516,896 | |
Federal Home Loan Mtg Corp., CMO Series 3456 Class KV, 5.50%, 9/15/2017 | | | 2,257,465 | | | | 2,401,536 | |
Federal Home Loan Mtg Corp., CMO Series 3477, Class VA, 5.50%, 7/15/2019 | | | 4,069,270 | | | | 4,371,547 | |
Federal Home Loan Mtg Corp., CMO Series 3480 Class VA, 6.00%, 6/15/2019 | | | 2,449,016 | | | | 2,669,629 | |
Federal Home Loan Mtg Corp., CMO Series 3563 Class BC, 4.00%, 6/15/2022 | | | 1,111,330 | | | | 1,159,714 | |
Federal Home Loan Mtg Corp., CMO Series 3589 Class CA, 4.00%, 10/15/2021 | | | 1,613,342 | | | | 1,688,871 | |
Federal Home Loan Mtg Corp., CMO Series 3640 Class EL, 4.00%, 3/15/2020 | | | 3,269,740 | | | | 3,418,494 | |
Federal Home Loan Mtg Corp., CMO Series 3678 Class AL, 4.50%, 10/15/2027 | | | 2,454,039 | | | | 2,581,539 | |
Federal Home Loan Mtg Corp., CMO Series 3704 Class DC, 4.00%, 11/15/2036 | | | 1,060,799 | | | | 1,074,175 | |
Federal Home Loan Mtg Corp., CMO Series R003 Class VA, 5.50%, 8/15/2016 | | | 1,011,457 | | | | 1,069,613 | |
Federal Home Loan Mtg Corp., CMO Series R012 Class AB, 5.50%, 12/15/2020 | | | 951,539 | | | | 978,417 | |
14 Certified Semi-Annual Report
| | |
| SCHEDULE OF INVESTMENTS, CONTINUED | | |
| |
| Thornburg Limited Term U.S. Government Fund | | March 31, 2011 (Unaudited) |
| | | | | | | | |
Issuer-Description | | Principal
Amount | | | Value | |
Federal Home Loan Mtg Corp., Pool 1N1736, 5.355%, 4/1/2037 | | $ | 484,688 | | | $ | 514,375 | |
Federal Home Loan Mtg Corp., Pool B14155, 3.50%, 5/1/2019 | | | 932,794 | | | | 958,592 | |
Federal Home Loan Mtg Corp., Pool C90041, 6.50%, 11/1/2013 | | | 7,516 | | | | 7,903 | |
Federal Home Loan Mtg Corp., Pool D37120, 7.00%, 7/1/2023 | | | 14,293 | | | | 16,264 | |
Federal Home Loan Mtg Corp., Pool E96575, 4.50%, 6/1/2018 | | | 2,940,359 | | | | 3,104,595 | |
Federal Home Loan Mtg Corp., Pool G12140, 4.00%, 2/1/2020 | | | 738,866 | | | | 772,693 | |
Federal Home Loan Mtg Corp., Pool G13517, 4.00%, 5/1/2024 | | | 2,132,183 | | | | 2,193,817 | |
Federal Home Loan Mtg Corp., Pool J11371, 4.50%, 12/1/2024 | | | 3,813,526 | | | | 3,995,264 | |
Federal Home Loan Mtg Corp., REMIC Series 3626 Class AV, 5.50%, 10/15/2020 | | | 2,753,121 | | | | 2,923,634 | |
Federal National Mtg Assoc., CMO Series 1993-32 Class H, 6.00%, 3/25/2023 | | | 57,388 | | | | 62,478 | |
Federal National Mtg Assoc., CMO Series 2002-18 Class PC, 5.50%, 4/25/2017 | | | 733,930 | | | | 764,352 | |
Federal National Mtg Assoc., CMO Series 2003-15 Class CY, 5.00%, 3/25/2018 | | | 1,017,000 | | | | 1,083,242 | |
Federal National Mtg Assoc., CMO Series 2003-4 Class PE, 5.00%, 2/25/2018 | | | 2,330,000 | | | | 2,483,292 | |
Federal National Mtg Assoc., CMO Series 2003-44 Class CB, 4.25%, 3/25/2033 | | | 1,396,924 | | | | 1,460,529 | |
Federal National Mtg Assoc., CMO Series 2003-49 Class YD, 5.50%, 6/25/2023 | | | 998,667 | | | | 1,070,305 | |
Federal National Mtg Assoc., CMO Series 2003-66 Class PA, 3.50%, 2/25/2033 | | | 442,773 | | | | 456,384 | |
Federal National Mtg Assoc., CMO Series 2003-89 Class XC, 6.00%, 9/25/2014 | | | 895,344 | | | | 949,289 | |
Federal National Mtg Assoc., CMO Series 2003-9 Class DB, 5.00%, 2/25/2018 | | | 1,000,000 | | | | 1,071,504 | |
Federal National Mtg Assoc., CMO Series 2003-92 Class KH, 5.00%, 3/25/2032 | | | 2,000,000 | | | | 2,111,090 | |
Federal National Mtg Assoc., CMO Series 2004-2 Class QL, 4.00%, 2/25/2019 | | | 2,000,000 | | | | 2,079,008 | |
Federal National Mtg Assoc., CMO Series 2004-33 Class MW, 4.50%, 1/25/2030 | | | 2,897,000 | | | | 3,050,354 | |
Federal National Mtg Assoc., CMO Series 2004-35 Class CA, 4.00%, 12/25/2017 | | | 659,664 | | | | 682,202 | |
Federal National Mtg Assoc., CMO Series 2005-26 Class G, 5.00%, 6/25/2032 | | | 2,187,878 | | | | 2,296,879 | |
Federal National Mtg Assoc., CMO Series 2005-99 Class VA, 5.50%, 11/25/2016 | | | 1,368,550 | | | | 1,475,775 | |
Federal National Mtg Assoc., CMO Series 2006-121 Class VA, 5.50%, 3/25/2017 | | | 963,117 | | | | 1,024,439 | |
Federal National Mtg Assoc., CMO Series 2006-78 Class MB, 5.50%, 7/25/2034 | | | 3,000,000 | | | | 3,246,994 | |
Federal National Mtg Assoc., CMO Series 2007-42 Class YA, 5.50%, 1/25/2036 | | | 1,470,761 | | | | 1,530,833 | |
Federal National Mtg Assoc., CMO Series 2007-60 Class VA, 6.00%, 12/25/2017 | | | 3,532,137 | | | | 3,753,477 | |
Federal National Mtg Assoc., CMO Series 2007-65 Class PB, 6.00%, 10/25/2032 | | | 2,916,000 | | | | 3,004,151 | |
Federal National Mtg Assoc., CMO Series 2007-79 Class MB, 5.50%, 12/25/2030 | | | 1,000,000 | | | | 1,027,793 | |
Federal National Mtg Assoc., CMO Series 2007-83 Class PA, 6.00%, 3/25/2029 | | | 220,118 | | | | 219,974 | |
Federal National Mtg Assoc., CMO Series 2008-54 Class EA, 5.00%, 7/25/2019 | | | 2,392,305 | | | | 2,542,598 | |
Federal National Mtg Assoc., CMO Series 2008-55 Class VA, 5.00%, 7/25/2019 | | | 1,195,985 | | | | 1,265,966 | |
Federal National Mtg Assoc., CMO Series 2008-77 Class VA, 6.00%, 7/25/2019 | | | 3,301,151 | | | | 3,582,789 | |
Federal National Mtg Assoc., CMO Series 2009-111 Class VB, 4.50%, 2/25/2021 | | | 1,819,640 | | | | 1,913,861 | |
Federal National Mtg Assoc., CMO Series 2009-17 Class AH, 3.657%, 3/25/2039 | | | 2,542,859 | | | | 2,325,028 | |
Federal National Mtg Assoc., CMO Series 2009-49 Class KA, 5.00%, 2/25/2024 | | | 844,254 | | | | 896,190 | |
Federal National Mtg Assoc., CMO Series 2009-52 Class AJ, 4.00%, 7/25/2024 | | | 1,882,839 | | | | 1,965,511 | |
Federal National Mtg Assoc., CMO Series 2009-70 Class NK, 4.50%, 8/25/2019 | | | 1,252,877 | | | | 1,319,295 | |
Federal National Mtg Assoc., CMO Series 2009-78 Class A, 4.50%, 8/25/2019 | | | 1,822,215 | | | | 1,919,372 | |
Federal National Mtg Assoc., CMO Series 2010-46 Class VM, 5.00%, 5/25/2021 | | | 2,806,675 | | | | 3,007,590 | |
Federal National Mtg Assoc., CMO Series 2010-69 Class EJ, 2.50%, 7/25/2024 | | | 3,565,654 | | | | 3,592,991 | |
Federal National Mtg Assoc., Pool 044003, 8.00%, 6/1/2017 | | | 12,450 | | | | 13,752 | |
Federal National Mtg Assoc., Pool 050811, 7.50%, 12/1/2012 | | | 6,434 | | | | 6,679 | |
Federal National Mtg Assoc., Pool 050832, 7.50%, 6/1/2013 | | | 3,701 | | | | 3,855 | |
Federal National Mtg Assoc., Pool 076388, 9.25%, 9/1/2018 | | | 46,710 | | | | 51,985 | |
Federal National Mtg Assoc., Pool 190555, 7.00%, 1/1/2014 | | | 7,545 | | | | 7,965 | |
Federal National Mtg Assoc., Pool 251759, 6.00%, 5/1/2013 | | | 11,111 | | | | 12,115 | |
Federal National Mtg Assoc., Pool 252648, 6.50%, 5/1/2022 | | | 84,634 | | | | 94,727 | |
Federal National Mtg Assoc., Pool 342947, 7.25%, 4/1/2024 | | | 163,655 | | | | 184,694 | |
Federal National Mtg Assoc., Pool 384243, 6.10%, 10/1/2011 | | | 567,661 | | | | 574,047 | |
Federal National Mtg Assoc., Pool 406384, 8.25%, 12/1/2024 | | | 89,497 | | | | 99,152 | |
Certified Semi-Annual Report 15
| | |
| SCHEDULE OF INVESTMENTS, CONTINUED | | |
| |
| Thornburg Limited Term U.S. Government Fund | | March 31, 2011 (Unaudited) |
| | | | | | | | |
Issuer-Description | | Principal
Amount | | | Value | |
Federal National Mtg Assoc., Pool 443909, 6.50%, 9/1/2018 | | $ | 43,768 | | | $ | 48,413 | |
Federal National Mtg Assoc., Pool 555207, 7.00%, 11/1/2017 | | | 16,935 | | | | 19,173 | |
Federal National Mtg Assoc., Pool 725863, 6.00%, 10/1/2034 | | | 1,355,651 | | | | 1,486,556 | |
Federal National Mtg Assoc., Pool 726308, 4.00%, 7/1/2018 | | | 1,463,642 | | | | 1,528,224 | |
Federal National Mtg Assoc., Pool 895572, 5.701%, 6/1/2036 | | | 973,829 | | | | 1,015,373 | |
Federal National Mtg Assoc., Pool 930986, 4.50%, 4/1/2019 | | | 2,765,001 | | | | 2,919,993 | |
Federal National Mtg Assoc., Pool AD8191, 4.00%, 9/1/2025 | | | 2,898,923 | | | | 2,988,156 | |
Federal National Mtg Assoc., Pool MA0045, 4.00%, 4/1/2019 | | | 2,112,824 | | | | 2,206,911 | |
Federal National Mtg Assoc., Pool MA0071, 4.50%, 5/1/2019 | | | 1,630,131 | | | | 1,721,508 | |
Federal National Mtg Assoc., Pool MA0125, 4.50%, 7/1/2019 | | | 1,026,915 | | | | 1,084,479 | |
Federal National Mtg Assoc., Pool MA0380, 4.00%, 4/1/2020 | | | 2,524,213 | | | | 2,636,619 | |
Federal National Mtg Assoc., REMIC Series 2002-59 Class B, 5.50%, 9/25/2017 | | | 1,118,643 | | | | 1,196,694 | |
Federal National Mtg Assoc., REMIC Series 2006-B1 Class AB, 6.00%, 6/25/2016 | | | 519,383 | | | | 530,830 | |
Government National Mtg Assoc., CMO Series 2008-56 Class CH, 5.00%, 5/20/2035 | | | 2,595,645 | | | | 2,626,373 | |
Government National Mtg Assoc., CMO Series 2009-92 Class VA, 5.00%, 10/20/2020 | | | 1,415,570 | | | | 1,519,641 | |
Government National Mtg Assoc., Pool 000623, 8.00%, 9/20/2016 | | | 18,246 | | | | 19,961 | |
Government National Mtg Assoc., Pool 003550, 5.00%, 5/20/2019 | | | 887,640 | | | | 957,368 | |
Government National Mtg Assoc., Pool 430150, 7.25%, 12/15/2026 | | | 27,706 | | | | 31,702 | |
Government National Mtg Assoc., Pool 453928, 7.00%, 7/15/2017 | | | 17,388 | | | | 18,846 | |
Government National Mtg Assoc., Pool 731491, 5.156%, 12/20/2060 | | | 4,211,435 | | | | 4,464,998 | |
Government National Mtg Assoc., Pool 751388, 5.307%, 1/20/2061 | | | 3,471,739 | | | | 3,710,588 | |
Government National Mtg Assoc., Pool 757313, 4.307%, 12/20/2060 | | | 5,874,336 | | | | 6,057,046 | |
Government National Mtg Assoc., Pool 780448, 6.50%, 8/15/2011 | | | 836 | | | | 835 | |
Government National Mtg Assoc., Pool 894205, 4.00%, 8/20/2039 | | | 2,965,571 | | | | 3,100,651 | |
| | | | | | | | |
TOTAL MORTGAGE BACKED (Cost $210,312,575) | | | | | | | 212,853,991 | |
| | | | | | | | |
TOTAL INVESTMENTS — 95.12% (Cost $317,999,506) | | | | | | $ | 325,431,899 | |
OTHER ASSETS LESS LIABILITIES — 4.88% | | | | | | | 16,707,741 | |
| | | | | | | | |
NET ASSETS — 100.00% | | | | | | $ | 342,139,640 | |
| | | | | | | | |
Footnote Legend
| a | Security currently fair valued by the valuation and pricing committee using procedures approved by the Trustees. |
| b | Securities exempt from registration under Rule 144A of the Securities Act of 1933, as amended. These securities may only be resold in the ordinary course of business in transactions exempt from registration, normally to qualified institutional buyers. As of March 31, 2011, the aggregate value of these securities in the Fund’s portfolio was $2,753,132, representing 0.80% of the Fund’s net assets. |
Portfolio Abbreviations
To simplify the listings of securities, abbreviations are used per the table below:
| CMO | Collateralized Mortgage Obligation |
| REMIC | Real Estate Mortgage Investment Conduit |
See notes to financial statements.
16 Certified Semi-Annual Report
| | |
| SCHEDULE OF INVESTMENTS | | |
| |
| Thornburg Limited Term Income Fund | | March 31, 2011 (Unaudited) |
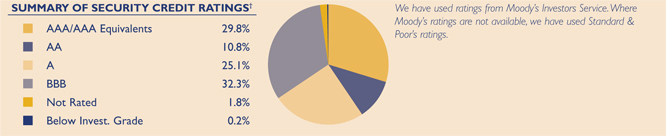
| | | | | | | | | | |
Issuer-Description | | Credit Rating†
S&P/Moody’s | | Principal
Amount | | | Value | |
U.S. TREASURY SECURITIES — 1.58% | | | | | | | | | | |
United States Treasury Notes, 1.00% due 4/30/2012 | | AAA/Aaa | | $ | 2,500,000 | | | $ | 2,517,481 | |
United States Treasury Notes, 1.75% due 4/15/2013 | | AAA/Aaa | | | 2,500,000 | | | | 2,547,461 | |
United States Treasury Notes, 2.50% due 3/31/2015 | | AAA/Aaa | | | 6,500,000 | | | | 6,686,367 | |
United States Treasury Notes, 5.125% due 5/15/2016 | | AAA/Aaa | | | 1,000,000 | | | | 1,139,531 | |
United States Treasury Notes, 4.875% due 8/15/2016 | | AAA/Aaa | | | 2,000,000 | | | | 2,258,125 | |
United States Treasury Notes, 3.00% due 2/28/2017 | | AAA/Aaa | | | 2,000,000 | | | | 2,046,641 | |
| | | | | | | | | | |
TOTAL U.S. TREASURY SECURITIES (Cost $16,594,424) | | | | | | | | | 17,195,606 | |
| | | | | | | | | | |
U.S. GOVERNMENT AGENCIES — 3.42% | | | | | | | | | | |
Agfirst Farm Credit Bank, 8.393% due 12/15/2016 | | A/NR | | | 5,000,000 | | | | 5,200,000 | |
aAgribank FCB, 9.125% due 7/15/2019 | | A/NR | | | 8,060,000 | | | | 9,622,681 | |
EJM Airport LLC GSA Lease Revenue Bond, 6.271% due 5/15/2020 (Guaranty: United States of America) | | NR/NR | | | 6,257,973 | | | | 6,845,221 | |
Federal National Mtg Assoc., 7.491% due 8/1/2014 | | AAA/Aaa | | | 17,516 | | | | 17,516 | |
Federal National Mtg Assoc., 2.00% due 3/26/2015 | | AAA/Aaa | | | 3,000,000 | | | | 3,045,436 | |
Private Export Funding Corp., 5.45% due 9/15/2017 | | AA+/Aaa | | | 3,000,000 | | | | 3,434,688 | |
Small Business Administration Participation Certificates, Series 2001-20J Class 1, 5.76% due 10/1/2021 | | NR/Aaa | | | 2,239,589 | | | | 2,404,425 | |
Small Business Administration Participation Certificates, Series 2008-20D Class 1, 5.37% due 4/1/2028 | | NR/NR | | | 3,135,182 | | | | 3,354,522 | |
Small Business Administration, Series 2005-P10A Class 1, 4.638% due 2/10/2015 | | NR/NR | | | 785,541 | | | | 821,356 | |
a,bU.S. Department of Transportation Headquarters, Series 2004 Class A-2, 5.594% due 12/7/2021 | | A-/NR | | | 2,426,639 | | | | 2,523,704 | |
| | | | | | | | | | |
TOTAL U.S. GOVERNMENT AGENCIES (Cost $35,999,485) | | | | | | | | | 37,269,549 | |
| | | | | | | | | | |
OTHER GOVERNMENT — 2.29% | | | | | | | | | | |
a,cEmirate of Abu Dhabi, 5.50% due 4/8/2014 | | AA/Aa2 | | | 1,000,000 | | | | 1,092,500 | |
cExport-Import Bank of Korea, 8.125% due 1/21/2014 | | A/A1 | | | 1,250,000 | | | | 1,432,906 | |
cExport-Import Bank of Korea, 5.875% due 1/14/2015 | | A/A1 | | | 3,000,000 | | | | 3,285,186 | |
bGovernment of Aruba, 6.80% due 4/2/2014 | | NR/NR | | | 5,616,000 | | | | 6,009,120 | |
a,cGovernment of Bermuda, 5.603% due 7/20/2020 | | AA/Aa2 | | | 3,000,000 | | | | 3,172,500 | |
a,cNorthern Rock Asset Management, 5.625% due 6/22/2017 (Guaranty: Northern Rock | | | | | | | | | | |
Covered Bond, LLP, United Kingdom) | | AAA/Aaa | | | 5,000,000 | | | | 5,136,565 | |
cNova Scotia Province Canada, 5.75% due 2/27/2012 | | A+/Aa2 | | | 500,000 | | | | 523,390 | |
cProvince of Ontario Canada, 4.10% due 6/16/2014 | | AA-/Aa1 | | | 4,000,000 | | | | 4,284,232 | |
| | | | | | | | | | |
TOTAL OTHER GOVERNMENT (Cost $24,019,574) | | | | | | | | | 24,936,399 | |
| | | | | | | | | | |
MORTGAGE BACKED — 12.82% | | | | | | | | | | |
aDBUBS Mortgage Trust CMO Series 2011-LC1A Class A1, 3.742% due 6/1/2017 | | NR/Aaa | | | 3,492,261 | | | | 3,520,233 | |
Federal Home Loan Mtg Corp., CMO Series 2528 Class HN, 5.00% due 11/15/2017 | | AAA/Aaa | | | 1,080,964 | | | | 1,145,346 | |
Federal Home Loan Mtg Corp., CMO Series 2627 Class GY, 4.50% due 6/15/2018 | | AAA/Aaa | | | 5,000,000 | | | | 5,278,198 | |
Certified Semi-Annual Report 17
| | |
| SCHEDULE OF INVESTMENTS, CONTINUED | | |
| |
| Thornburg Limited Term Income Fund | | March 31, 2011 (Unaudited) |
| | | | | | | | | | |
Issuer-Description | | Credit Rating†
S&P/Moody’s | | Principal
Amount | | | Value | |
Federal Home Loan Mtg Corp., CMO Series 2628 Class AB, 4.50% due 6/15/2018 | | AAA/Aaa | | $ | 1,002,559 | | | $ | 1,049,396 | |
Federal Home Loan Mtg Corp., CMO Series 2640 Class G, 4.50% due 7/15/2018 | | AAA/Aaa | | | 2,071,942 | | | | 2,157,746 | |
Federal Home Loan Mtg Corp., CMO Series 2654 Class OG, 5.00% due 2/15/2032 | | AAA/Aaa | | | 1,000,000 | | | | 1,052,040 | |
Federal Home Loan Mtg Corp., CMO Series 2682 Class JG, 4.50% due 10/15/2023 | | AAA/Aaa | | | 4,681,311 | | | | 4,915,902 | |
Federal Home Loan Mtg Corp., CMO Series 2778 Class JD, 5.00% due 12/15/2032 | | AAA/Aaa | | | 4,000,000 | | | | 4,219,446 | |
Federal Home Loan Mtg Corp., CMO Series 2780 Class VJ, 5.00% due 4/15/2015 | | AAA/Aaa | | | 1,087,892 | | | | 1,134,980 | |
Federal Home Loan Mtg Corp., CMO Series 2808 Class VA, 5.50% due 5/15/2015 | | AAA/Aaa | | | 2,388,254 | | | | 2,561,770 | |
Federal Home Loan Mtg Corp., CMO Series 2814 Class GB, 5.00% due 6/15/2019 | | AAA/Aaa | | | 621,897 | | | | 655,281 | |
Federal Home Loan Mtg Corp., CMO Series 2825 Class VP, 5.50% due 6/15/2015 | | AAA/Aaa | | | 2,677,660 | | | | 2,863,364 | |
Federal Home Loan Mtg Corp., CMO Series 2827 Class BU, 3.50% due 7/15/2019 | | AAA/Aaa | | | 3,000,000 | | | | 3,074,403 | |
Federal Home Loan Mtg Corp., CMO Series 2943 Class BV, 5.00% due 3/15/2016 | | AAA/Aaa | | | 2,556,487 | | | | 2,720,071 | |
Federal Home Loan Mtg Corp., CMO Series 3054 Class DW, 5.50% due 5/15/2034 | | AAA/Aaa | | | 848,939 | | | | 897,826 | |
Federal Home Loan Mtg Corp., CMO Series 3083 Class U, 4.50% due 1/15/2017 | | AAA/Aaa | | | 2,926,879 | | | | 3,069,967 | |
Federal Home Loan Mtg Corp., CMO Series 3138 Class PC, 5.50% due 6/15/2032 | | AAA/Aaa | | | 5,000,000 | | | | 5,156,132 | |
Federal Home Loan Mtg Corp., CMO Series 3192 Class GB, 6.00% due 1/15/2031 | | AAA/Aaa | | | 917,172 | | | | 923,938 | |
Federal Home Loan Mtg Corp., CMO Series 3195 Class PD, 6.50% due 7/15/2036 | | NR/NR | | | 5,300,000 | | | | 5,827,441 | |
Federal Home Loan Mtg Corp., CMO Series 3255 Class QB, 5.50% due 5/15/2029 | | AAA/Aaa | | | 479,508 | | | | 479,633 | |
Federal Home Loan Mtg Corp., CMO Series 3504 Class PC, 4.00% due 1/15/2039 | | AAA/Aaa | | | 1,479,831 | | | | 1,528,780 | |
Federal Home Loan Mtg Corp., CMO Series 3563 Class BC, 4.00% due 6/15/2022 | | AAA/Aaa | | | 2,222,660 | | | | 2,319,428 | |
Federal Home Loan Mtg Corp., CMO Series 3589 Class CA, 4.00% due 10/15/2021 | | AAA/Aaa | | | 2,420,012 | | | | 2,533,306 | |
Federal Home Loan Mtg Corp., Pool P10039, 5.00% due 4/1/2013 | | AAA/Aaa | | | 821,718 | | | | 844,387 | |
Federal Home Loan Mtg Corp., REMIC Series 3626 Class AV, 5.50% due 10/15/2020 | | AAA/Aaa | | | 4,588,534 | | | | 4,872,724 | |
Federal National Mtg Assoc., CMO Series 2003-4 Class PE, 5.00% due 2/25/2018 | | AAA/Aaa | | | 2,348,000 | | | | 2,502,476 | |
Federal National Mtg Assoc., CMO Series 2003-74 Class KN, 4.50% due 8/25/2018 | | AAA/Aaa | | | 1,206,404 | | | | 1,261,149 | |
Federal National Mtg Assoc., CMO Series 2003-92 Class VG, 5.00% due 9/25/2014 | | AAA/Aaa | | | 731,698 | | | | 771,714 | |
Federal National Mtg Assoc., CMO Series 2004-33 Class MW, 4.50% due 1/25/2030 | | AAA/Aaa | | | 3,000,000 | | | | 3,158,806 | |
Federal National Mtg Assoc., CMO Series 2005-35 VG, 5.00% due 4/25/2016 | | AAA/Aaa | | | 1,123,707 | | | | 1,180,917 | |
Federal National Mtg Assoc., CMO Series 2005-48 Class AR, 5.50% due 2/25/2035 | | AAA/Aaa | | | 1,886,473 | | | | 2,033,201 | |
Federal National Mtg Assoc., CMO Series 2007-26 Class VH, 5.50% due 2/25/2018 | | AAA/Aaa | | | 4,396,718 | | | | 4,724,132 | |
Federal National Mtg Assoc., CMO Series 2007-42 Class PA, 5.50% due 4/25/2037 | | AAA/Aaa | | | 3,090,820 | | | | 3,251,770 | |
Federal National Mtg Assoc., CMO Series 2007-65 Class PB, 6.00% due 10/25/2032 | | AAA/Aaa | | | 3,000,000 | | | | 3,090,690 | |
Federal National Mtg Assoc., CMO Series 2008-54 Class EA, 5.00% due 7/25/2019 | | AAA/Aaa | | | 3,189,740 | | | | 3,417,640 | |
Federal National Mtg Assoc., CMO Series 2008-55 Class VA, 5.00% due 7/25/2019 | | AAA/Aaa | | | 2,790,631 | | | | 2,953,921 | |
Federal National Mtg Assoc., CMO Series 2009-111 Class VB, 4.50% due 2/25/2021 | | AAA/Aaa | | | 1,819,640 | | | | 1,916,787 | |
Federal National Mtg Assoc., CMO Series 2009-17 Class AH, 3.657% due 3/25/2039 | | AAA/Aaa | | | 4,238,098 | | | | 3,875,047 | |
Federal National Mtg Assoc., CMO Series 2009-49 Class KA, 5.00% due 2/25/2024 | | AAA/Aaa | | | 1,969,926 | | | | 2,091,111 | |
Federal National Mtg Assoc., CMO Series 2009-5 Class A, 4.50% due 12/25/2023 | | AAA/Aaa | | | 5,642,130 | | | | 5,955,168 | |
Federal National Mtg Assoc., CMO Series 2009-52 Class AJ, 4.00% due 7/25/2024 | | AAA/Aaa | | | 3,138,065 | | | | 3,275,851 | |
Federal National Mtg Assoc., CMO Series 2009-65 Class GA, 4.50% due 11/25/2023 | | AAA/Aaa | | | 1,631,726 | | | | 1,725,370 | |
Federal National Mtg Assoc., CMO Series 2009-70 Class NK, 4.50% due 8/25/2019 | | AAA/Aaa | | | 3,132,192 | | | | 3,313,761 | |
Federal National Mtg Assoc., CMO Series 2009-70 Class PA, 5.00% due 8/25/2035 | | AAA/Aaa | | | 2,730,258 | | | | 2,857,446 | |
Federal National Mtg Assoc., CMO Series 2009-89 Class BV, 4.50% due 12/25/2020 | | AAA/Aaa | | | 2,692,230 | | | | 2,835,548 | |
Federal National Mtg Assoc., Pool 357384, 4.50% due 5/1/2018 | | AAA/Aaa | | | 833,617 | | | | 879,306 | |
Government National Mtg Assoc., CMO Series 2009-35 Series KV, 4.50% due 6/20/2020 | | AAA/Aaa | | | 4,331,315 | | | | 4,564,240 | |
Government National Mtg Assoc., CMO Series 2009-68 Class DP, 4.50% due 11/16/2038 | | AAA/Aaa | | | 3,038,584 | | | | 3,170,049 | |
Government National Mtg Assoc., Pool 003007, 8.50% due 11/20/2015 | | AAA/Aaa | | | 15,444 | | | | 16,871 | |
Government National Mtg Assoc., Pool 731491, 5.156% due 12/20/2060 | | AAA/Aaa | | | 4,033,099 | | | | 4,275,925 | |
Government National Mtg Assoc., Pool 751388, 5.307% due 1/20/2061 | | AAA/Aaa | | | 5,455,590 | | | | 5,839,194 | |
Government National Mtg Assoc., Pool 827148, 3.375% due 2/20/2024 | | AAA/Aaa | | | 32,168 | | | | 33,031 | |
| | | | | | | | | | |
TOTAL MORTGAGE BACKED (Cost $139,356,569) | | | | | | | | | 139,772,859 | |
| | | | | | | | | | |
18 Certified Semi-Annual Report
| | |
| SCHEDULE OF INVESTMENTS, CONTINUED | | |
| |
| Thornburg Limited Term Income Fund | | March 31, 2011 (Unaudited) |
| | | | | | | | | | |
Issuer-Description | | Credit Rating†
S&P/Moody’s | | Principal
Amount | | | Value | |
ASSET BACKED SECURITIES — 8.08% | | | | | | | | | | |
BANKS — 0.04% | | | | | | | | | | |
COMMERCIAL BANKS — 0.04% | | | | | | | | | | |
Wells Fargo Asset Securities Corp., Series 2005-AR2 Class B1, 2.744% due 2/25/2035 | | B-/C | | $ | 964,761 | | | $ | 191,194 | |
Wells Fargo Asset Securities Corp., Series 2005-AR2 Class B1, 3.483% due 3/25/2035 | | NR/NR | | | 1,040,966 | | | | 207,989 | |
| | | | | | | | | | |
| | | | | | | | | 399,183 | |
| | | | | | | | | | |
DIVERSIFIED FINANCIALS — 7.66% | | | | | | | | | | |
CAPITAL MARKETS — 5.59% | | | | | | | | | | |
aAHMAT Mtg Advance Trust, Series 2010-ADV1 Class A1, 3.968% due 8/6/2022 | | AAA/NR | | | 2,000,000 | | | | 2,005,000 | |
aAHMAT Mtg Advance Trust, Series 2010-ADV2 Class A1, 4.21% due 5/10/2011 | | AAA/NR | | | 4,000,000 | | | | 4,010,000 | |
Banc America Mtg Securities, Inc., Series 2005 A Class B1 Floating Rate Note, 3.236% due 2/25/2035 | | NR/NR | | | 2,804,014 | | | | 1,261,070 | |
Banc of America Commercial Mtg Inc., Series 2002-PB2 Class C, 6.349% due 6/11/2035 | | AAA/Aa1 | | | 3,045,000 | | | | 3,086,335 | |
Banc of America Commercial Mtg Inc., Series 2006-6 Class A3, 5.369% due 10/10/2045 | | NR/NR | | | 3,000,000 | | | | 3,088,706 | |
Bear Stearns Mtg, Series 2004-3 Class 1-A2, 2.954% due 7/25/2034 | | A+/Aa3 | | | 325,676 | | | | 278,269 | |
a,cCie Financement Foncier, 2.50% due 9/16/2015 | | AAA/Aaa | | | 6,000,000 | | | | 5,809,920 | |
Citigroup Commercial Mtg Trust, Series 2004-HYB2 Class B1, 2.886% due 3/25/2034 | | AA/A1 | | | 423,447 | | | | 354,356 | |
Countrywide Home Loan, Series 2004 Class 1-A, 2.748% due 7/20/2034 | | AAA/Aa3 | | | 493,911 | | | | 433,147 | |
Credit Suisse Commercial Mtg Capital Certificates, Series 2007-C2 Class A2, 5.448% due 1/15/2049 | | AAA/Aaa | | | 2,990,821 | | | | 3,034,003 | |
Greenwich Capital Commercial Funding Corp., Series 2004-GG1 Class A5, 4.883% due 6/10/2036 | | AAA/Aaa | | | 327,521 | | | | 332,284 | |
aGS Mtg Securities Corp. II, Series 2007-EOP Class A1, 1.143% due 3/6/2020 | | AAA/Aaa | | | 4,902,411 | | | | 4,902,356 | |
Home Equity Asset Trust Series 2006-3 Class 2A, 0.43% due 7/25/2036 | | AAA/A1 | | | 3,535,129 | | | | 3,412,156 | |
JPMorgan Chase Commercial Mtg, Series 2004-C3 Class A-5, 4.878% due 1/15/2042 | | NR/Aaa | | | 5,000,000 | | | | 5,268,664 | |
Merrill Lynch Mtg Investors, Series 2003 E Class B3, 1.75% due 10/25/2028 | | A+/A2 | | | 1,162,154 | | | | 700,118 | |
Merrill Lynch Mtg Investors, Series 2004 A4 Class M1, 2.787% due 8/25/2034 | | AA/NR | | | 848,766 | | | | 705,943 | |
New York Mtg Trust, Series 2005-3 Class A, 0.49% due 2/25/2036 | | AAA/A2 | | | 6,170,154 | | | | 5,061,902 | |
Nomura Asset Securities Corp., Series 1998-D6 Class A2, 6.553% due 3/15/2030 | | AAA/Aaa | | | 5,683,000 | | | | 6,192,034 | |
Option One Mtg Loan Trust, Series 2005-5 Class A3 Floating Rate Note, 0.46% due 12/25/2035 | | AAA/Baa2 | | | 2,294,627 | | | | 2,021,470 | |
aSilverstone Master Issuer, Series 2010-1A Class A1 Floating Rate Note, 1.703% due 1/21/2055 | | AAA/NR | | | 5,000,000 | | | | 5,010,087 | |
Wachovia Bank Commercial Mtg Trust, Series 2004-C10 Class C, 4.842% due 2/15/2041 | | AA+/Aaa | | | 4,000,000 | | | | 4,039,995 | |
CONSUMER FINANCE — 1.98% | | | | | | | | | | |
aFirst Financial Bank USA, Series 2010-C Class B, 5.19% due 9/17/2018 | | AA/NR | | | 2,000,000 | | | | 1,977,359 | |
aFirst Financial Bank USA, Series 2010-D Class A, 3.72% due 6/17/2019 | | AAA/NR | | | 5,000,000 | | | | 4,996,737 | |
bGSAF Series 2011-1A Class A, 3.72% due 2/15/2023 | | NR/NR | | | 3,000,000 | | | | 3,007,500 | |
SLM Student Loan Trust Series 2003-C Class A2 Floating Rate Bond, 0.70% due 9/15/2020 | | AA-/Aaa | | | 4,553,149 | | | | 4,330,792 | |
SLM Student Loan Trust Series 2006-B Class A3 Floating Rate Bond, 0.45% due 12/15/2022 | | A/Aaa | | | 4,275,000 | | | | 4,184,138 | |
Structured Asset Securities Corp. Series 2004-3 Class 3-A1, 5.50% due 3/25/2019 | | AAA/Baa2 | | | 2,994,305 | | | | 3,105,845 | |
DIVERSIFIED FINANCIAL SERVICES — 0.09% | | | | | | | | | | |
FNBC Trust, Series 1993 A, 8.08% due 1/5/2018 | | AA-/Aa1 | | | 921,442 | | | | 984,158 | |
| | | | | | | | | | |
| | | | | | | | | 83,594,344 | |
| | | | | | | | | | |
INSURANCE — 0.38% | | | | | | | | | | |
INSURANCE — 0.38% | | | | | | | | | | |
aNorthwind Holdings LLC, Series 2007-1A Class A1 Floating Rate Bond, 1.091% due 12/1/2037 (Insured: MBIA) | | NR/NR | | | 5,360,911 | | | | 4,099,918 | |
| | | | | | | | | | |
| | | | | | | | | 4,099,918 | |
| | | | | | | | | | |
TOTAL ASSET BACKED SECURITIES (Cost $92,036,901) | | | | | | | | | 88,093,445 | |
| | | | | | | | | | |
Certified Semi-Annual Report 19
| | |
| SCHEDULE OF INVESTMENTS, CONTINUED | | |
| |
| Thornburg Limited Term Income Fund | | March 31, 2011 (Unaudited) |
| | | | | | | | | | |
Issuer-Description | | Credit Rating†
S&P/Moody’s | | Principal
Amount | | | Value | |
CORPORATE BONDS — 54.31% | | | | | | | | | | |
AUTOMOBILES & COMPONENTS — 1.15% | | | | | | | | | | |
AUTOMOBILES — 1.15% | | | | | | | | | | |
aAmerican Honda Finance, 2.658% due 6/29/2011 | | A+/A1 | | $ | 3,500,000 | | | $ | 3,518,011 | |
aHarley-Davidson Funding Corp., 5.25% due 12/15/2012 | | BBB/Baa1 | | | 3,000,000 | | | | 3,130,578 | |
aHyundai Capital America, 3.75% due 4/6/2016 | | BBB/Baa2 | | | 500,000 | | | | 492,578 | |
a,cHyundai Capital Services, Inc., 6.00% due 5/5/2015 | | BBB+/Baa2 | | | 5,000,000 | | | | 5,367,060 | |
| | | | | | | | | | |
| | | | | | | | | 12,508,227 | |
| | | | | | | | | | |
BANKS — 10.07% | | | | | | | | | | |
COMMERCIAL BANKS — 10.07% | | | | | | | | | | |
a,cANZ National International, 6.20% due 7/19/2013 | | AA/Aa2 | | | 1,000,000 | | | | 1,091,001 | |
a,cANZ National International Ltd., 3.125% due 8/10/2015 | | AA/Aa2 | | | 4,000,000 | | | | 3,966,796 | |
Associated Banc Corp., 5.125% due 3/28/2016 | | BB-/Baa1 | | | 5,000,000 | | | | 5,018,975 | |
a,cBarclays Bank plc, 2.50% due 9/21/2015 | | AAA/Aaa | | | 5,000,000 | | | | 4,849,830 | |
a,cBNP Paribas Home Loan Covered Bonds SA, 2.20% due 11/2/2015 | | AAA/Aaa | | | 10,000,000 | | | | 9,610,060 | |
Charter One Bank NA, 5.50% due 4/26/2011 | | A-/A2 | | | 1,750,000 | | | | 1,754,943 | |
cCorp Andina de Fomento, 3.75% due 1/15/2016 | | A+/A1 | | | 6,000,000 | | | | 5,937,390 | |
a,cCredit Agricole London, 1.753% due 1/21/2014 | | AA-/Aa1 | | | 7,000,000 | | | | 7,105,658 | |
a,cDanske Bank A/S, 3.75% due 4/1/2015 | | A/A1 | | | 4,000,000 | | | | 4,077,100 | |
a,cHSBC Bank plc, 3.50% due 6/28/2015 | | AA/Aa2 | | | 2,000,000 | | | | 2,025,970 | |
HSBC Bank USA, N.A., 4.875% due 8/24/2020 | | AA-/A1 | | | 1,000,000 | | | | 978,946 | |
a,cKookmin Bank, 7.25% due 5/14/2014 | | AA/Aa1 | | | 5,000,000 | | | | 5,641,035 | |
National City Bank Floating Rate Note, 0.68% due 6/7/2017 | | A/A3 | | | 4,000,000 | | | | 3,770,416 | |
Nations Bank Corp., 7.23% due 8/15/2012 | | A/A2 | | | 250,000 | | | | 264,826 | |
North Fork Bancorp, Inc., 5.875% due 8/15/2012 | | BBB-/Baa2 | | | 2,000,000 | | | | 2,093,130 | |
cRoyal Bank of Scotland plc, 3.40% due 8/23/2013 | | A+/Aa3 | | | 1,000,000 | | | | 1,022,896 | |
cRoyal Bank of Scotland plc, 3.95% due 9/21/2015 | | A+/Aa3 | | | 4,000,000 | | | | 4,003,028 | |
cRoyal Bank of Scotland plc, 4.875% due 3/16/2015 | | A+/Aa3 | | | 1,600,000 | | | | 1,662,998 | |
a,cSantander Issuances, 6.50% due 8/11/2019 | | AA-/Aa3 | | | 5,000,000 | | | | 5,035,090 | |
Silicon Valley Bank, 5.70% due 6/1/2012 | | A-/A2 | | | 3,500,000 | | | | 3,590,272 | |
Silicon Valley Bank, 6.05% due 6/1/2017 | | BBB+/A3 | | | 1,500,000 | | | | 1,571,966 | |
a,cSociete Generale, 3.10% due 9/14/2015 | | A+/Aa2 | | | 6,000,000 | | | | 5,906,592 | |
Sovereign Bank, 5.125% due 3/15/2013 | | A-/Baa1 | | | 4,000,000 | | | | 4,123,736 | |
a,bSovereign Bank Lease Pass-Through Trust, 12.18% due 6/30/2020 | | A/A3 | | | 4,933,670 | | | | 6,537,113 | |
a,cToronto-Dominion Bank, 2.20% due 7/29/2015 | | NR/Aaa | | | 3,000,000 | | | | 2,964,432 | |
aWebster Bank, 5.875% due 1/15/2013 | | BBB-/Baa1 | | | 3,000,000 | | | | 3,006,396 | |
cWestpac Banking Corp., 3.00% due 8/4/2015 | | AA/Aa1 | | | 2,000,000 | | | | 1,995,036 | |
Whitney National Bank, 5.875% due 4/1/2017 | | BB/Baa1 | | | 4,000,000 | | | | 3,964,440 | |
a,cWoori Bank, 4.75% due 1/20/2016 | | A-/A1 | | | 5,000,000 | | | | 5,128,588 | |
Zions Bancorp, 7.75% due 9/23/2014 | | BBB-/NR | | | 1,000,000 | | | | 1,086,016 | |
| | | | | | | | | | |
| | | | | | | | | 109,784,675 | |
| | | | | | | | | | |
CAPITAL GOODS — 3.15% | | | | | | | | | | |
AEROSPACE & DEFENSE — 0.15% | | | | | | | | | | |
Boeing Co., 5.00% due 3/15/2014 | | A/A2 | | | 1,500,000 | | | | 1,638,915 | |
ELECTRICAL EQUIPMENT — 0.08% | | | | | | | | | | |
Emerson Electric Co., 5.75% due 11/1/2011 | | A/A2 | | | 800,000 | | | | 824,277 | |
INDUSTRIAL CONGLOMERATES — 1.66% | | | | | | | | | | |
General Electric Capital Corp. Floating Rate Note, 0.449% due 6/20/2014 | | AA+/Aa2 | | | 4,000,000 | | | | 3,874,688 | |
General Electric Co., 5.25% due 12/6/2017 | | AA+/Aa2 | | | 2,500,000 | | | | 2,722,497 | |
20 Certified Semi-Annual Report
| | |
| SCHEDULE OF INVESTMENTS, CONTINUED | | |
| |
| Thornburg Limited Term Income Funds | | March 31, 2011 (Unaudited) |
| | | | | | | | | | |
Issuer-Description | | Credit Rating†
S&P/Moody’s | | Principal
Amount | | | Value | |
a,cSmiths Group plc, 6.05% due 5/15/2014 | | BBB+/Baa2 | | $ | 2,500,000 | | | $ | 2,681,610 | |
a,cSmiths Group plc, 7.20% due 5/15/2019 | | BBB+/Baa2 | | | 3,000,000 | | | | 3,339,417 | |
Textron, Inc., 6.20% due 3/15/2015 | | BBB-/Baa3 | | | 5,000,000 | | | | 5,457,000 | |
MACHINERY — 1.26% | | | | | | | | | | |
Caterpillar Financial Services Corp. Floating Rate Note, 1.059% due 6/24/2011 | | A/A2 | | | 3,200,000 | | | | 3,205,811 | |
cIngersoll-Rand Global Holding Co., 9.50% due 4/15/2014 | | BBB+/Baa1 | | | 500,000 | | | | 600,092 | |
aITW CUPIDS Finance Trust I, 6.55% due 12/31/2011 | | NR/A1 | | | 5,000,000 | | | | 4,978,805 | |
John Deere Capital Corp., 5.25% due 10/1/2012 | | A/A2 | | | 1,600,000 | | | | 1,700,624 | |
a,cVolvo Treasury AB, 5.95% due 4/1/2015 | | BBB-/Baa2 | | | 3,000,000 | | | | 3,298,260 | |
| | | | | | | | | | |
| | | | | | | | | 34,321,996 | |
| | | | | | | | | | |
COMMERCIAL & PROFESSIONAL SERVICES — 0.50% | | | | | | | | | | |
COMMERCIAL SERVICES & SUPPLIES — 0.50% | | | | | | | | | | |
Allied Waste North America, Inc., 6.875% due 6/1/2017 | | BBB/Baa3 | | | 4,000,000 | | | | 4,360,000 | |
Science Applications International Corp., 6.25% due 7/1/2012 | | A-/A3 | | | 1,000,000 | | | | 1,061,090 | |
| | | | | | | | | | |
| | | | | | | | | 5,421,090 | |
| | | | | | | | | | |
CONSUMER DURABLES & APPAREL — 0.53% | | | | | | | | | | |
HOUSEHOLD DURABLES — 0.30% | | | | | | | | | | |
Fortune Brands, Inc., 6.375% due 6/15/2014 | | BBB-/Baa3 | | | 3,000,000 | | | | 3,290,046 | |
TEXTILES, APPAREL & LUXURY GOODS — 0.23% | | | | | | | | | | |
Nike, Inc., 5.15% due 10/15/2015 | | A+/A1 | | | 2,315,000 | | | | 2,551,033 | |
| | | | | | | | | | |
| | | | | | | | | 5,841,079 | |
| | | | | | | | | | |
CONSUMER SERVICES — 0.68% | | | | | | | | | | |
HOTELS, RESTAURANTS & LEISURE — 0.68% | | | | | | | | | | |
International Game Technology, 7.50% due 6/15/2019 | | BBB/Baa2 | | | 6,515,000 | | | | 7,396,740 | |
| | | | | | | | | | |
| | | | | | | | | 7,396,740 | |
| | | | | | | | | | |
DIVERSIFIED FINANCIALS — 7.50% | | | | | | | | | | |
CAPITAL MARKETS — 3.92% | | | | | | | | | | |
cAMVESCAP plc, 5.375% due 2/27/2013 | | A-/A3 | | | 5,606,000 | | | | 5,959,054 | |
a,cCDP Financial, Inc., 3.00% due 11/25/2014 | | AAA/Aaa | | | 4,000,000 | | | | 4,077,332 | |
aFMR LLC, 4.75% due 3/1/2013 | | A+/A2 | | | 5,000,000 | | | | 5,215,580 | |
Goldman Sachs Group, Inc. Floating Rate Note, 1.311% due 2/7/2014 | | A/A1 | | | 3,000,000 | | | | 3,021,810 | |
aIPIC GMTN Ltd., 3.125% due 11/15/2015 | | AA/Aa3 | | | 1,000,000 | | | | 975,000 | |
aIPIC GMTN Ltd., 5.00% due 11/15/2020 | | AA/Aa3 | | | 1,000,000 | | | | 970,000 | |
a,cMacquarie Group Ltd., 7.30% due 8/1/2014 | | A-/A2 | | | 3,000,000 | | | | 3,328,449 | |
a,cMacquarie Group Ltd., 4.875% due 8/10/2017 | | A-/A2 | | | 3,000,000 | | | | 3,015,099 | |
a,cMacquarie Group Ltd., 7.625% due 8/13/2019 | | NR/NR | | | 1,000,000 | | | | 1,108,642 | |
a,cMacquarie Group Ltd., 6.00% due 1/14/2020 | | A-/A2 | | | 1,000,000 | | | | 1,006,394 | |
cMan Group plc, 6.50% due 8/1/2013 | | NR/Baa2 | | | 5,000,000 | | | | 5,178,035 | |
Merrill Lynch & Co., Inc., 6.875% due 4/25/2018 | | A/A2 | | | 2,000,000 | | | | 2,221,384 | |
Morgan Stanley Floating Rate Note, 2.812% due 5/14/2013 | | NR/A2 | | | 5,000,000 | | | | 5,176,215 | |
cNomura Holdings, Inc., 5.00% due 3/4/2015 | | BBB+/Baa2 | | | 1,500,000 | | | | 1,553,190 | |
CONSUMER FINANCE — 1.06% | | | | | | | | | | |
American Express Credit Co., 5.125% due 8/25/2014 | | BBB+/A2 | | | 3,000,000 | | | | 3,236,094 | |
a,cBanque PSA Finance, 2.207% due 4/4/2014 | | NR/NR | | | 7,000,000 | | | | 6,979,784 | |
Capital One Bank, 6.50% due 6/13/2013 | | BBB/Baa1 | | | 300,000 | | | | 326,358 | |
Capital One Financial Corp., 5.70% due 9/15/2011 | | BBB/Baa1 | | | 950,000 | | | | 971,047 | |
DIVERSIFIED FINANCIAL SERVICES — 2.52% | | | | | | | | | | |
Bank of America Corp., 5.875% due 1/5/2021 | | A/A2 | | | 2,000,000 | | | | 2,088,356 | |
Certified Semi-Annual Report 21
| | |
| SCHEDULE OF INVESTMENTS, CONTINUED | | |
| |
| Thornburg Limited Term Income Funds | | March 31, 2011 (Unaudited) |
| | | | | | | | | | |
Issuer-Description | | Credit Rating†
S&P/Moody’s | | Principal
Amount | | | Value | |
Bank of America Corp., 4.50% due 4/1/2015 | | A/A2 | | $ | 1,000,000 | | | $ | 1,038,409 | |
aBank of America Covered Bond Issuer, 5.50% due 6/14/2012 | | AA/Aa2 | | | 3,000,000 | | | | 3,132,030 | |
a,cBM&F Bovespa SA, 5.50% due 7/16/2020 | | BBB+/Baa2 | | | 1,000,000 | | | | 1,022,961 | |
Citigroup, Inc., 6.50% due 8/19/2013 | | A/A3 | | | 1,000,000 | | | | 1,093,355 | |
Citigroup, Inc., 5.00% due 9/15/2014 | | A-/Baa1 | | | 3,000,000 | | | | 3,132,609 | |
Citigroup, Inc., 6.00% due 12/13/2013 | | A/A3 | | | 2,000,000 | | | | 2,174,652 | |
aCME Group Index Services, 4.40% due 3/15/2018 | | AA/Aa3 | | | 4,000,000 | | | | 4,090,448 | |
cKorea Development Bank, 8.00% due 1/23/2014 | | A/A1 | | | 3,000,000 | | | | 3,423,999 | |
MBNA Corp., 6.125% due 3/1/2013 | | A/A2 | | | 1,305,000 | | | | 1,396,157 | |
a,cNational Agricultural Cooperative Federation, 5.00% due 9/30/2014 | | A/A1 | | | 2,000,000 | | | | 2,110,754 | |
National Rural Utilities CFC, 10.375% due 11/1/2018 | | A+/A1 | | | 2,000,000 | | | | 2,730,750 | |
| | | | | | | | | | |
| | | | | | | | | 81,753,947 | |
| | | | | | | | | | |
ENERGY — 5.25% | | | | | | | | | | |
ENERGY EQUIPMENT & SERVICES — 1.43% | | | | | | | | | | |
Detroit Edison Corporate Senior Note Series D, 5.40% due 8/1/2014 | | A/A2 | | | 2,000,000 | | | | 2,206,528 | |
Nabors Industries, Inc., 9.25% due 1/15/2019 | | BBB/Baa2 | | | 4,000,000 | | | | 5,042,204 | |
Rowan Companies, Inc., 7.875% due 8/1/2019 | | BBB-/Baa3 | | | 7,000,000 | | | | 8,303,232 | |
OIL, GAS & CONSUMABLE FUELS — 3.82% | | | | | | | | | | |
cBP Capital Markets plc, 3.875% due 3/10/2015 | | A/A2 | | | 2,000,000 | | | | 2,076,738 | |
ConocoPhillips, 4.75% due 2/1/2014 | | A/A1 | | | 1,000,000 | | | | 1,085,380 | |
aDCP Midstream LLC, 9.75% due 3/15/2019 | | BBB/Baa2 | | | 1,500,000 | | | | 1,933,356 | |
cEnbridge, Inc., 5.80% due 6/15/2014 | | A-/Baa1 | | | 2,000,000 | | | | 2,216,872 | |
Energy Transfer Partners LP, 6.00% due 7/1/2013 | | BBB-/Baa3 | | | 1,000,000 | | | | 1,086,398 | |
Enterprise Products Partners LP, 5.20% due 9/1/2020 | | BBB-/Baa3 | | | 1,000,000 | | | | 1,031,473 | |
Enterprise Products Partners LP, 3.70% due 6/1/2015 | | BBB-/Baa3 | | | 1,000,000 | | | | 1,030,288 | |
aFlorida Gas Transmission, 4.00% due 7/15/2015 | | BBB/Baa2 | | | 2,000,000 | | | | 2,044,116 | |
a,cLukoil International Finance BV, 6.125% due 11/9/2020 | | BBB-/Baa2 | | | 5,000,000 | | | | 5,100,000 | |
Murphy Oil Corp., 6.375% due 5/1/2012 | | BBB/Baa3 | | | 750,000 | | | | 788,573 | |
cNorsk Hydro A/S, 6.70% due 1/15/2018 | | AA-/Aa2 | | | 1,000,000 | | | | 1,171,518 | |
aNorthern Natural Gas Co., 5.75% due 7/15/2018 | | A/A2 | | | 50,000 | | | | 55,963 | |
NuStar Logistics, 7.65% due 4/15/2018 | | BBB-/Baa3 | | | 3,000,000 | | | | 3,502,515 | |
aSemco Energy, Inc., 5.15% due 4/21/2020 | | BBB+/A3 | | | 3,000,000 | | | | 3,064,311 | |
cShell International Finance, 3.10% due 6/28/2015 | | AA/Aa1 | | | 3,000,000 | | | | 3,074,073 | |
Sunoco Logistics Partner, 8.75% due 2/15/2014 | | NR/Baa2 | | | 5,000,000 | | | | 5,668,960 | |
Valero Logistics, 6.875% due 7/15/2012 | | BBB-/Baa3 | | | 2,700,000 | | | | 2,859,454 | |
a,cWoodside Finance Ltd., 8.125% due 3/1/2014 | | BBB+/Baa1 | | | 2,000,000 | | | | 2,297,480 | |
a,cWoodside Finance Ltd., 4.50% due 11/10/2014 | | BBB+/Baa1 | | | 1,500,000 | | | | 1,588,707 | |
| | | | | | | | | | |
| | | | | | | | | 57,228,139 | |
| | | | | | | | | | |
FOOD, BEVERAGE & TOBACCO — 1.75% | | | | | | | | | | |
BEVERAGES — 0.46% | | | | | | | | | | |
Anheuser-Busch Cos., Inc., 4.70% due 4/15/2012 | | BBB+/Baa1 | | | 1,000,000 | | | | 1,039,785 | |
Anheuser-Busch Cos., Inc., 4.375% due 1/15/2013 | | BBB+/Baa1 | | | 2,000,000 | | | | 2,101,548 | |
a,cBacardi Ltd., 8.20% due 4/1/2019 | | BBB/Baa1 | | | 1,500,000 | | | | 1,874,245 | |
FOOD PRODUCTS — 0.19% | | | | | | | | | | |
Corn Products International, Inc., 3.20% due 11/1/2015 | | BBB/Baa2 | | | 1,000,000 | | | | 998,288 | |
Kraft Foods, Inc., 6.00% due 2/11/2013 | | BBB-/Baa2 | | | 1,000,000 | | | | 1,081,976 | |
TOBACCO — 1.10% | | | | | | | | | | |
Altria Group, Inc., 8.50% due 11/10/2013 | | BBB/Baa1 | | | 1,000,000 | | | | 1,166,210 | |
Altria Group, Inc., 9.70% due 11/10/2018 | | BBB/Baa1 | | | 3,000,000 | | | | 3,945,351 | |
Lorillard Tobacco Co., 8.125% due 6/23/2019 | | BBB-/Baa2 | | | 5,000,000 | | | | 5,821,730 | |
22 Certified Semi-Annual Report
| | |
| SCHEDULE OF INVESTMENTS, CONTINUED | | |
| |
| Thornburg Limited Term Income Funds | | March 31, 2011 (Unaudited) |
| | | | | | | | | | |
Issuer-Description | | Credit Rating†
S&P/Moody’s | | Principal
Amount | | | Value | |
UST, Inc., 5.75% due 3/1/2018 | | BBB/NR | | $ | 1,000,000 | | | $ | 1,062,084 | |
| | | | | | | | | | |
| | | | | | | | | 19,091,217 | |
| | | | | | | | | | |
HEALTH CARE EQUIPMENT & SERVICES — 0.20% | | | | | | | | | | |
HEALTH CARE PROVIDERS & SERVICES — 0.20% | | | | | | | | | | |
McKesson Corp., 6.50% due 2/15/2014 | | A-/Baa2 | | | 1,000,000 | | | | 1,121,230 | |
Wellpoint, Inc., 6.00% due 2/15/2014 | | A-/Baa1 | | | 1,000,000 | | | | 1,108,303 | |
| | | | | | | | | | |
| | | | | | | | | 2,229,533 | |
| | | | | | | | | | |
HOTELS RESTAURANTS & LEISURE — 0.44% | | | | | | | | | | |
HOTELS, RESTAURANTS & LEISURE — 0.44% | | | | | | | | | | |
aHyatt Hotels Corps., 5.75% due 8/15/2015 | | BBB/Baa2 | | | 2,500,000 | | | | 2,588,313 | |
a,cTDIC Finance Ltd., 6.50% due 7/2/2014 | | AA/A1 | | | 2,000,000 | | | | 2,185,000 | |
| | | | | | | | | | |
| | | | | | | | | 4,773,313 | |
| | | | | | | | | | |
INSURANCE — 4.99% | | | | | | | | | | |
INSURANCE — 4.99% | | | | | | | | | | |
Aflac, Inc., 8.50% due 5/15/2019 | | A-/A2 | | | 3,000,000 | | | | 3,626,613 | |
Alterra Finance LLC, 6.25% due 9/30/2020 | | BBB/Baa2 | | | 3,000,000 | | | | 3,028,623 | |
Aon Corp., 3.50% due 9/30/2015 | | BBB+/Baa2 | | | 1,000,000 | | | | 1,003,502 | |
CNA Financial Corp., 6.50% due 8/15/2016 | | BBB-/Baa3 | | | 2,035,000 | | | | 2,220,914 | |
Fidelity National Financial, 6.60% due 5/15/2017 | | BBB-/Baa3 | | | 6,000,000 | | | | 6,207,024 | |
aGenworth Life Institutional Fund, 5.875% due 5/3/2013 | | A/A2 | | | 1,000,000 | | | | 1,058,005 | |
Hartford Financial Services Group, Inc., 4.625% due 7/15/2013 | | BBB/Baa3 | | | 1,000,000 | | | | 1,043,115 | |
aLiberty Mutual Group, Inc., 5.75% due 3/15/2014 | | BBB-/Baa2 | | | 1,000,000 | | | | 1,049,762 | |
Lincoln National Corp., 4.75% due 2/15/2014 | | A-/Baa2 | | | 1,000,000 | | | | 1,050,764 | |
aMet Life Global Funding I, 1.053% due 1/10/2014 | | AA-/Aa3 | | | 6,000,000 | | | | 6,032,742 | |
cMontpelier Re Holdings Ltd., 6.125% due 8/15/2013 | | BBB/NR | | | 7,035,000 | | | | 7,209,756 | |
aOhio National Financial Services, 6.375% due 4/30/2020 | | A/Baa1 | | | 1,000,000 | | | | 1,054,477 | |
aPacific Life Global Funding CPI Floating Rate Note, 3.68% due 2/6/2016 | | A+/A1 | | | 8,000,000 | | | | 8,082,960 | |
a,cQBE Insurance Group Ltd., 5.647% due 7/1/2023 | | BBB+/Baa1 | | | 7,000,000 | | | | 6,509,419 | |
Unitrin, Inc., 6.00% due 11/30/2015 | | BBB-/Baa3 | | | 5,000,000 | | | | 5,228,730 | |
| | | | | | | | | | |
| | | | | | | | | 54,406,406 | |
| | | | | | | | | | |
MATERIALS — 1.65% | | | | | | | | | | |
CHEMICALS — 0.82% | | | | | | | | | | |
aChevron Phillips Chemical, 7.00% due 6/15/2014 | | BBB/Baa1 | | | 5,000,000 | | | | 5,603,630 | |
E.I. du Pont de Nemours & Co., 4.125% due 3/6/2013 | | A/A2 | | | 325,000 | | | | 341,498 | |
aIncitec Pivot Ltd., 4.00% due 12/7/2015 | | NR/NR | | | 3,000,000 | | | | 3,002,274 | |
CONSTRUCTION MATERIALS — 0.45% | | | | | | | | | | |
CRH America, Inc., 8.125% due 7/15/2018 | | BBB+/Baa1 | | | 4,150,000 | | | | 4,884,322 | |
METALS & MINING — 0.38% | | | | | | | | | | |
a,cAnglo American Capital, 9.375% due 4/8/2014 | | BBB/Baa1 | | | 1,000,000 | | | | 1,196,080 | |
cArcelormittal, 3.75% due 8/5/2015 | | BBB-/Baa3 | | | 3,000,000 | | | | 3,029,685 | |
| | | | | | | | | | |
| | | | | | | | | 18,057,489 | |
| | | | | | | | | | |
MEDIA — 0.97% | | | | | | | | | | |
MEDIA — 0.97% | | | | | | | | | | |
DIRECTV Holdings LLC/DIRECTV Financing Co., Inc., 7.625% due 5/15/2016 | | BBB/Baa2 | | | 5,000,000 | | | | 5,512,500 | |
Time Warner Cable, Inc., 5.40% due 7/2/2012 | | BBB/Baa2 | | | 3,000,000 | | | | 3,154,578 | |
Time Warner Cable, Inc., 7.50% due 4/1/2014 | | BBB/Baa2 | | | 1,500,000 | | | | 1,719,321 | |
Certified Semi-Annual Report 23
| | |
| SCHEDULE OF INVESTMENTS, CONTINUED | | |
| |
| Thornburg Limited Term Income Funds | | March 31, 2011 (Unaudited) |
| | | | | | | | | | | | |
Issuer-Description | | Credit Rating†
S&P/Moody’s | | | Principal
Amount | | | Value | |
Time Warner Co., Inc., 8.05% due 1/15/2016 | | | BBB/Baa2 | | | $ | 200,000 | | | $ | 233,462 | |
| | | | | | | | | | | | |
| | | | | | | | | | | 10,619,861 | |
| | | | | | | | | | | | |
PHARMACEUTICALS, BIOTECHNOLOGY & LIFE SCIENCES — 1.60% | | | | | | | | | | | | |
BIOTECHNOLOGY — 1.42% | | | | | | | | | | | | |
Biogen Idec, Inc., 6.875% due 3/1/2018 | | | BBB+/Baa3 | | | | 10,000,000 | | | | 11,328,340 | |
Genzyme Corp., 3.625% due 6/15/2015 | | | A-/Baa2 | | | | 3,000,000 | | | | 3,116,520 | |
Genzyme Corp., 5.00% due 6/15/2020 | | | A-/Baa2 | | | | 1,000,000 | | | | 1,062,005 | |
PHARMACEUTICALS — 0.18% | | | | | | | | | | | | |
Tiers Inflation Linked Trust Series Wyeth 2004-21 Trust Certificate CPI Floating Rate Note, 3.346% due 2/1/2014 | | | AA/A1 | | | | 2,000,000 | | | | 1,938,780 | |
| | | | | | | | | | | | |
| | | | | | | | | | | 17,445,645 | |
| | | | | | | | | | | | |
REAL ESTATE — 0.39% | | | | | | | | | | | | |
REAL ESTATE INVESTMENT TRUSTS — 0.39% | | | | | | | | | | | | |
Commonwealth REIT (HRPT Properties), 6.25% due 6/15/2017 | | | BBB/Baa2 | | | | 4,000,000 | | | | 4,276,192 | |
| | | | | | | | | | | | |
| | | | | | | | | | | 4,276,192 | |
| | | | | | | | | | | | |
RETAILING — 0.87% | | | | | | | | | | | | |
SPECIALTY RETAIL — 0.87% | | | | | | | | | | | | |
Best Buy Co., Inc., 3.75% due 3/15/2016 | | | BBB-/Baa2 | | | | 3,000,000 | | | | 2,961,282 | |
Best Buy Co., Inc., 6.75% due 7/15/2013 | | | BBB-/Baa2 | | | | 2,500,000 | | | | 2,733,320 | |
Staples, Inc., 9.75% due 1/15/2014 | | | BBB/Baa2 | | | | 1,500,000 | | | | 1,800,849 | |
Staples, Inc., 7.75% due 4/1/2011 | | | BBB/Baa2 | | | | 2,000,000 | | | | 2,000,000 | |
| | | | | | | | | | | | |
| | | | | | | | | | | 9,495,451 | |
| | | | | | | | | | | | |
SEMICONDUCTORS & SEMICONDUCTOR EQUIPMENT — 1.01% | | | | | | | | | | | | |
SEMICONDUCTORS & SEMICONDUCTOR EQUIPMENT — 1.01% | | | | | | | | | | | | |
KLA Tencor Corp., 6.90% due 5/1/2018 | | | BBB/Baa1 | | | | 10,000,000 | | | | 11,028,740 | |
| | | | | | | | | | | | |
| | | | | | | | | | | 11,028,740 | |
| | | | | | | | | | | | |
SOFTWARE & SERVICES — 1.50% | | | | | | | | | | | | |
INFORMATION TECHNOLOGY SERVICES — 1.08% | | | | | | | | | | | | |
Computer Sciences Corp., 5.50% due 3/15/2013 | | | A-/Baa1 | | | | 1,000,000 | | | | 1,063,703 | |
Computer Sciences Corp., 6.50% due 3/15/2018 | | | A-/Baa1 | | | | 6,000,000 | | | | 6,519,606 | |
Electronic Data Systems Corp., 6.00% due 8/1/2013 | | | A/A2 | | | | 1,000,000 | | | | 1,101,447 | |
aSAIC, Inc., 4.45% due 12/1/2020 | | | A-/A3 | | | | 2,000,000 | | | | 2,012,422 | |
Western Union Co., 6.50% due 2/26/2014 | | | A-/A3 | | | | 1,000,000 | | | | 1,111,884 | |
SOFTWARE — 0.42% | | | | | | | | | | | | |
BMC Software, Inc., 7.25% due 6/1/2018 | | | BBB+/Baa2 | | | | 4,000,000 | | | | 4,550,832 | |
| | | | | | | | | | | | |
| | | | | | | | | | | 16,359,894 | |
| | | | | | | | | | | | |
TECHNOLOGY HARDWARE & EQUIPMENT — 0.05% | | | | | | | | | | | | |
COMPUTERS & PERIPHERALS — 0.05% | | | | | | | | | | | | |
Dell, Inc., 5.625% due 4/15/2014 | | | A-/A2 | | | | 500,000 | | | | 551,696 | |
| | | | | | | | | | | | |
| | | | | | | | | | | 551,696 | |
| | | | | | | | | | | | |
TELECOMMUNICATION SERVICES — 2.32% | | | | | | | | | | | | |
DIVERSIFIED TELECOMMUNICATION SERVICES — 2.08% | | | | | | | | | | | | |
AT&T, Inc., 4.85% due 2/15/2014 | | | A-/A2 | | | | 1,000,000 | | | | 1,081,429 | |
Cellco Partnership, 3.75% due 5/20/2011 | | | A-/A2 | | | | 1,000,000 | | | | 1,004,222 | |
24 Certified Semi-Annual Report
| | |
| SCHEDULE OF INVESTMENTS, CONTINUED | | |
| |
| Thornburg Limited Term Income Funds | | March 31, 2011 (Unaudited) |
| | | | | | | | | | |
Issuer-Description | | Credit Rating†
S&P/Moody’s | | Principal
Amount | | | Value | |
Cellco Partnership Floating Rate Note, 2.914% due 5/20/2011 | | A-/A2 | | $ | 2,000,000 | | | $ | 2,006,546 | |
a,bHidden Ridge Facility, 5.65% due 1/1/2022 | | NR/Baa1 | | | 4,472,178 | | | | 4,752,848 | |
Michigan Bell Telephone Co., 7.85% due 1/15/2022 | | A-/NR | | | 3,000,000 | | | | 3,460,236 | |
a,cQtel International Finance Ltd., 6.50% due 6/10/2014 | | A/A2 | | | 1,000,000 | | | | 1,096,250 | |
a,cQtel International Finance Ltd., 3.375% due 10/14/2016 | | A/A2 | | | 500,000 | | | | 482,500 | |
cTelecom Italia Capital SA, 6.175% due 6/18/2014 | | BBB/Baa2 | | | 3,000,000 | | | | 3,221,088 | |
cTelefonica Emisiones SAU, 6.421% due 6/20/2016 | | A-/Baa1 | | | 5,000,000 | | | | 5,555,990 | |
WIRELESS TELECOMMUNICATION SERVICES — 0.24% | | | | | | | | | | |
a,bRichland Towers, 4.606% due 3/15/2016 | | NR/NR | | | 2,750,000 | | | | 2,653,750 | |
| | | | | | | | | | |
| | | | | | | | | 25,314,859 | |
| | | | | | | | | | |
TRANSPORTATION — 0.84% | | | | | | | | | | |
AIR FREIGHT & LOGISTICS — 0.04% | | | | | | | | | | |
FedEx Corp., 8.76% due 5/22/2015 | | BBB/Baa1 | | | 397,958 | | | | 438,727 | |
AIRLINES — 0.52% | | | | | | | | | | |
aAviation Capital Group, 6.75% due 4/6/2021 | | NR/NR | | | 3,000,000 | | | | 3,000,000 | |
Continental Airlines Series 1997-4 Class 4-A, 6.90% due 1/2/2018 | | BBB+/Baa2 | | | 132,891 | | | | 141,196 | |
Delta Air Lines, Inc., 6.20% due 7/2/2018 | | A-/Baa2 | | | 2,470,730 | | | | 2,563,383 | |
ROAD & RAIL — 0.28% | | | | | | | | | | |
a,cAsciano Finance, 4.625% due 9/23/2020 | | BBB-/Baa3 | | | 2,000,000 | | | | 1,989,160 | |
GATX Corp., 4.75% due 5/15/2015 | | BBB/Baa1 | | | 1,000,000 | | | | 1,043,935 | |
| | | | | | | | | | |
| | | | | | | | | 9,176,401 | |
| | | | | | | | | | |
UTILITIES — 6.90% | | | | | | | | | | |
ELECTRIC UTILITIES — 4.32% | | | | | | | | | | |
Centerpoint Energy, 7.00% due 3/1/2014 | | BBB+/A3 | | | 2,000,000 | | | | 2,268,052 | |
Commonwealth Edison Co., 6.15% due 3/15/2012 | | A-/Baa1 | | | 910,000 | | | | 955,258 | |
a,cE. ON International Finance BV, 5.80% due 4/30/2018 | | A/A2 | | | 2,000,000 | | | | 2,224,400 | |
a,cElectricite de France SA, 5.50% due 1/26/2014 | | A+/Aa3 | | | 1,250,000 | | | | 1,369,544 | |
Empire District Electric Co., 4.65% due 5/28/2020 | | BBB+/A3 | | | 3,000,000 | | | | 2,987,886 | |
Entergy Louisiana LLC, 4.80% due 5/1/2021 | | A-/A3 | | | 4,300,000 | | | | 4,247,828 | |
Entergy Texas, Inc., 7.125% due 2/1/2019 | | BBB+/Baa2 | | | 2,000,000 | | | | 2,329,306 | |
Entergy Texas, Inc., 3.60% due 6/1/2015 | | BBB+/Baa2 | | | 3,000,000 | | | | 3,036,801 | |
aGreat River Energy Series 2007-A, 5.829% due 7/1/2017 (Insured: Natl-Re) | | A-/A3 | | | 3,245,677 | | | | 3,541,747 | |
Gulf Power Co., 4.35% due 7/15/2013 | | A/A3 | | | 925,000 | | | | 969,869 | |
a,cIberdrola Finance Ireland Ltd., 3.80% due 9/11/2014 | | A-/A3 | | | 6,000,000 | | | | 6,090,474 | |
Idaho Power Corp., 6.025% due 7/15/2018 | | A-/A2 | | | 1,000,000 | | | | 1,135,433 | |
a,cKorea Southern Power Co., 5.375% due 4/18/2013 | | A/A1 | | | 1,000,000 | | | | 1,054,460 | |
Metropolitan Edison Co., 7.70% due 1/15/2019 | | BBB-/Baa2 | | | 2,250,000 | | | | 2,660,485 | |
aMonongahela Power Co., 5.70% due 3/15/2017 | | BBB+/Baa1 | | | 2,200,000 | | | | 2,356,299 | |
MP Environmental, 4.982% due 7/1/2014 | | AAA/Aaa | | | 2,548,051 | | | | 2,606,414 | |
aSteelriver Transmission Co., LLC, 4.71% due 6/30/2017 | | NR/Baa2 | | | 4,000,000 | | | | 3,951,280 | |
Toledo Edison Co., 7.25% due 5/1/2020 | | BBB/Baa1 | | | 1,000,000 | | | | 1,182,157 | |
cTransAlta Corp., 4.75% due 1/15/2015 | | BBB/Baa2 | | | 2,000,000 | | | | 2,125,438 | |
GAS UTILITIES — 0.19% | | | | | | | | | | |
aMaritimes & North East Pipeline, 7.50% due 5/31/2014 | | BBB/Baa3 | | | 1,877,800 | | | | 2,031,104 | |
MULTI-UTILITIES — 2.39% | | | | | | | | | | |
Ameren Energy Generating Co., 7.00% due 4/15/2018 | | BBB-/Ba1 | | | 2,000,000 | | | | 2,027,110 | |
Black Hills Corp., 5.875% due 7/15/2020 | | BBB-/Baa3 | | | 5,000,000 | | | | 5,132,885 | |
Dominion Resources, Inc., 8.875% due 1/15/2019 | | A-/Baa2 | | | 1,000,000 | | | | 1,276,457 | |
aEnogex LLC, 6.875% due 7/15/2014 | | BBB+/Baa3 | | | 4,000,000 | | | | 4,380,448 | |
aEnogex LLC, 6.25% due 3/15/2020 | | BBB+/Baa3 | | | 2,500,000 | | | | 2,685,028 | |
aPower Receivables Financing LLC, 6.29% due 1/1/2012 | | NR/NR | | | 1,920,022 | | | | 1,921,174 | |
Certified Semi-Annual Report 25
| | |
| SCHEDULE OF INVESTMENTS, CONTINUED | | |
| |
| Thornburg Limited Term Income Funds | | March 31, 2011 (Unaudited) |
| | | | | | | | | | |
Issuer-Description | | Credit Rating†
S&P/Moody’s | | Principal
Amount | | | Value | |
a,cTaqa Abu Dhabi National Energy Co., 6.60% due 8/1/2013 | | NR/A3 | | $ | 5,000,000 | | | $ | 5,356,250 | |
Union Electric Co., 4.65% due 10/1/2013 | | BBB+/A3 | | | 2,000,000 | | | | 2,140,398 | |
Wisconsin Public Service Corp., 6.125% due 8/1/2011 | | A/Aa3 | | | 1,150,000 | | | | 1,170,234 | |
| | | | | | | | | | |
| | | | | | | | | 75,214,219 | |
| | | | | | | | | | |
TOTAL CORPORATE BONDS (Cost $569,283,144) | | | | | | | | | 592,296,809 | |
| | | | | | | | | | |
CONVERTIBLE BONDS — 1.32% | | | | | | | | | | |
DIVERSIFIED FINANCIALS — 1.32% | | | | | | | | | | |
CAPITAL MARKETS — 1.32% | | | | | | | | | | |
aProspect Capital Corp., 6.25% due 12/15/2015 | | BBB/NR | | | 5,000,000 | | | | 5,481,250 | |
aApollo Investment Corp., 5.75% due 1/15/2016 | | BBB/NR | | | 8,500,000 | | | | 8,925,000 | |
| | | | | | | | | | |
TOTAL CONVERTIBLE BONDS (Cost $13,376,571) | | | | | | | | | 14,406,250 | |
| | | | | | | | | | |
MUNICIPAL BONDS — 11.74% | | | | | | | | | | |
American Campus Properties Student Housing, 7.38% due 9/1/2012 (Insured: Natl-Re) | | BBB/Baa1 | | | 1,270,000 | | | | 1,276,553 | |
American Fork City Utah Sales, 5.07% due 3/1/2013 (Insured: AGM) | | AA+/Aa3 | | | 120,000 | | | | 125,879 | |
American Municipal Power Ohio, Inc., 5.072% due 2/15/2018 | | A/A3 | | | 5,000,000 | | | | 4,981,350 | |
Anaheim California Public Financing Authority, 5.316% due 9/1/2017 (Insured: Natl Re/FGIC) | | A/A1 | | | 2,340,000 | | | | 2,249,582 | |
Anaheim California Public Financing Authority, 5.486% due 9/1/2020 (Insured: Natl-Re/FGIC) | | A/A1 | | | 3,270,000 | | | | 3,047,705 | |
Brentwood California Infrastructure Financing Authority, 6.16% due 10/1/2019 | | AA-/NR | | | 2,110,000 | | | | 2,177,541 | |
California Health Facilities Financing Authority, 6.76% due 2/1/2019 | | NR/NR | | | 3,905,000 | | | | 3,953,930 | |
California School Finance Authority, 5.041% due 7/1/2020 (LOC: City National Bank) | | AAA/NR | | | 4,000,000 | | | | 3,867,920 | |
Camden County New Jersey, 5.47% due 7/1/2018 | | A+/A2 | | | 2,140,000 | | | | 2,070,364 | |
Camden County, New Jersey, 5.62% due 7/1/2019 | | A+/A2 | | | 3,025,000 | | | | 2,943,083 | |
Carson California Redevelopment Agency, 4.511% due 10/1/2016 | | A-/NR | | | 5,000,000 | | | | 4,788,350 | |
Chicago Illinois Board of Education GO, 3.40% due 12/1/2015 | | AA-/Aa2 | | | 1,500,000 | | | | 1,434,405 | |
Cleveland Cuyahoga County Ohio, 6.10% due 5/15/2013 | | BBB-/NR | | | 555,000 | | | | 556,010 | |
Connecticut Housing Finance Authority, 5.071% due 11/15/2019 | | AAA/Aaa | | | 3,935,000 | | | | 3,921,346 | |
Cook County Illinois School District 083, 4.875% due 12/1/2011 (Insured: AGM) | | NR/Aa3 | | | 150,000 | | | | 154,109 | |
Florida State Board of Education, 3.60% due 6/1/2015 | | AAA/NR | | | 3,000,000 | | | | 3,113,580 | |
Fort Collins Colorado Electric Utility, 4.92% due 12/1/2020 | | AA-/NR | | | 2,250,000 | | | | 2,172,623 | |
George Washington University, 4.411% due 9/15/2017 | | A+/A1 | | | 1,750,000 | | | | 1,744,225 | |
Green Bay Wisconsin, 4.875% due 4/1/2011 (Insured: Natl-Re) | | NR/Aa1 | | | 365,000 | | | | 365,000 | |
Hancock County Mississippi, 4.90% due 8/1/2011 (Insured: Natl-Re) | | NR/A1 | | | 315,000 | | | | 317,822 | |
Hanover Pennsylvania Area School District Notes, 4.47% due 3/15/2013 (Insured: AGM) | | AA+/Aa3 | | | 1,385,000 | | | | 1,457,463 | |
Illinois Finance Authority Revenue Bonds, 5.629% due 7/1/2016 (Insured: Syncora) | | A+/NR | | | 2,030,000 | | | | 2,047,783 | |
Los Angeles California Department of Airports, 5.175% due 5/15/2017 | | AA-/A1 | | | 4,000,000 | | | | 4,043,600 | |
Los Angeles California Municipal Improvement Corp., 6.165% due 11/1/2020 | | A+/A2 | | | 10,000,000 | | | | 9,523,700 | |
Los Angeles County California Public Works Financing Authority, 5.591% due 8/1/2020 | | A+/A1 | | | 3,000,000 | | | | 2,847,270 | |
Louisiana Public Facilities Authority, 5.72% due 7/1/2015 (Insured: CIFG) | | NR/Baa3 | | | 2,120,000 | | | | 2,017,731 | |
Maine Finance Authority Waste Motor Oil, 4.55% due 10/1/2014 | | A/NR | | | 1,495,000 | | | | 1,540,822 | |
Menomonee Falls Wisconsin GO, 4.25% due 11/1/2014 | | NR/Aa2 | | | 3,350,000 | | | | 3,492,308 | |
aMidwest Family Housing, 5.168% due 7/1/2016 (Insured: CIFG) | | NR/NR | | | 1,325,000 | | | | 1,272,106 | |
Mississippi Development Bank Special Obligation, 5.21% due 7/1/2013 (Insured: AGM) | | AA+/NR | | | 1,200,000 | | | | 1,282,656 | |
New Jersey Health Care Facilities Financing, 7.70% due 7/1/2011 (Insured: Connie Lee) | | NR/NR | | | 25,000 | | | | 25,296 | |
New Rochelle New York Industrial Development Agency, 7.15% due 10/1/2014 (LOC: Bank of New York) | | NR/Aaa | | | 230,000 | | | | 239,159 | |
New York City Transitional Finance Authority Revenue, 4.075% due 11/1/2020 | | AAA/Aa1 | | | 2,500,000 | | | | 2,446,525 | |
New York State Urban Development Corp., 4.75% due 12/15/2011 | | AAA/NR | | | 1,400,000 | | | | 1,427,286 | |
Newark New Jersey, 4.70% due 4/1/2011 (Insured: Natl-Re) | | NR/Aa3 | | | 845,000 | | | | 845,000 | |
North Carolina Eastern Municipal Power, 4.43% due 1/1/2014 | | A-/Baa1 | | | 2,000,000 | | | | 2,050,380 | |
26 Certified Semi-Annual Report
| | |
| SCHEDULE OF INVESTMENTS, CONTINUED | | |
| |
| Thornburg Limited Term Income Funds | | March 31, 2011 (Unaudited) |
| | | | | | | | | | | | |
Issuer-Description | | Credit Rating†
S&P/Moody’s | | | Principal
Amount | | | Value | |
Oakland California Redevelopment Agency, 8.00% due 9/1/2016 | | | A-/NR | | | $ | 4,200,000 | | | $ | 4,335,450 | |
Ohio Housing Financing Agency Mtg, 5.20% due 9/1/2014 (GNMA/FNMA) | | | NR/Aaa | | | | 2,395,000 | | | | 2,525,527 | |
Ohio State Taxable Development Assistance, 4.88% due 10/1/2011 (Insured: Natl-Re) | | | AA/Aa2 | | | | 550,000 | | | | 559,114 | |
Oklahoma Development Finance Authority, 8.00% due 5/1/2020 | | | NR/NR | | | | 8,500,000 | | | | 8,352,355 | |
Port St. Lucie Florida Lease Revenue, 4.457% due 9/1/2014 (Wyndcrest) | | | A/Aa3 | | | | 1,470,000 | | | | 1,471,661 | |
Redlands California Redevelopment Agency, 5.818% due 8/1/2022 (Insured: AMBAC) | | | A-/NR | | | | 2,570,000 | | | | 2,338,469 | |
Riverside California Sewer Revenue, 5.61% due 8/1/2017 | | | AA/Aa2 | | | | 2,000,000 | | | | 2,112,340 | |
San Bernardino County California San Sevaine Redevelopment Agency, 7.135% due 9/1/2020 | | | BBB/NR | | | | 2,165,000 | | | | 2,060,344 | |
San Francisco California City and County Redevelopment Financing Authority, 8.00% due 8/1/2019 | | | A/A1 | | | | 6,500,000 | | | | 6,974,825 | |
San Jose California Redevelopment Agency Tax Allocation, 3.447% due 8/1/2013 | | | A/A1 | | | | 1,000,000 | | | | 996,350 | |
San Jose California Redevelopment Agency Tax Allocation, 4.281% due 8/1/2014 | | | A/A1 | | | | 750,000 | | | | 746,235 | |
San Luis Obispo County California, 7.45% due 9/1/2019 | | | AA-/NR | | | | 3,950,000 | | | | 4,403,973 | |
San Marcos California Redevelopment Agency, 6.125% due 10/1/2018 | | | AA-/NR | | | | 5,000,000 | | | | 4,854,100 | |
Springfield Ohio City School District Tax Anticipation Notes, 6.40% due 12/1/2011 (Insured: AMBAC) | | | NR/NR | | | | 1,500,000 | | | | 1,531,530 | |
Tazewell County Illinois Community High School, 5.20% due 12/1/2011 (Insured: AGM) | | | NR/Aa3 | | | | 355,000 | | | | 364,379 | |
Victor New York, 9.20% due 5/1/2014 | | | NR/NR | | | | 710,000 | | | | 730,015 | |
Wisconsin State Health and Educational Facilities, 7.08% due 6/1/2016 (Insured: ACA) | | | NR/NR | | | | 2,010,000 | | | | 1,823,251 | |
| | | | | | | | | | | | |
TOTAL MUNICIPAL BONDS (Cost $128,929,301) | | | | | | | | | | | 128,000,380 | |
| | | | | | | | | | | | |
SHORT TERM INVESTMENTS — 3.27% | | | | | | | | | | | | |
Chicago GO, 0.35% due 1/1/2040 put 4/7/2011 (Insured: AGM) (weekly demand notes) | | | AAA/Aa3 | | | | 6,000,000 | | | | 6,000,000 | |
Wellpoint, Inc., 0.20% due 4/1/2011 | | | NR/NR | | | | 29,700,000 | | | | 29,700,000 | |
| | | | | | | | | | | | |
TOTAL SHORT TERM INVESTMENTS (Cost $35,700,000) | | | | | | | | | | | 35,700,000 | |
| | | | | | | | | | | | |
TOTAL INVESTMENTS — 98.83% (Cost $1,055,295,969) | | | | | | | | | | $ | 1,077,671,297 | |
OTHER ASSETS LESS LIABILITIES — 1.17% | | | | | | | | | | | 12,796,714 | |
| | | | | | | | | | | | |
NET ASSETS — 100.00% | | | | | | | | | | $ | 1,090,468,011 | |
| | | | | | | | | | | | |
Footnote Legend
| a | Securities exempt from registration under Rule 144A of the Securities Act of 1933, as amended. These securities may only be resold in the ordinary course of business in transactions exempt from registration, normally to qualified institutional buyers. As of March 31, 2011, the aggregate value of these securities in the Fund’s portfolio was $313,612,347, representing 28.76% of the Fund’s net assets. |
| b | Security currently fair valued by the valuation and pricing committee using procedures approved by the Trustees. |
| c | Yankee Bond – Denominated in U.S. dollars and is issued in the U.S. by foreign banks and corporations. |
Certified Semi-Annual Report 27
| | |
| SCHEDULE OF INVESTMENTS, CONTINUED | | |
| |
| Thornburg Limited Term Income Funds | | March 31, 2011 (Unaudited) |
Portfolio Abbreviations
To simplify the listings of securities, abbreviations are used per the table below:
| | |
| ACA | | Insured by American Capital Access |
| AGM | | Insured by Assured Guaranty Municipal Corp. |
| AMBAC | | Insured by American Municipal Bond Assurance Corp. |
| CIFG | | CIFG Assurance North America Inc. |
| CMO | | Collateralized Mortgage Obligation |
| CPI | | Consumer Price Index |
| Cupids | | Cumulative Undivided Preferred Interests In Debt Securities |
| FCB | | Farm Credit Bank |
| FGIC | | Insured by Financial Guaranty Insurance Co. |
| FNMA | | Collateralized by Federal National Mortgage Association |
| GNMA | | Insured by Government National Mortgage Co. |
| GO | | General Obligation |
| LOC | | Letter of Credit |
| MBIA | | Insured by Municipal Bond Investors Assurance |
| Mtg | | Mortgage |
| Natl-Re | | Insured by National Public Finance Guarantee Corp. |
| REIT | | Real Estate Investment Trust |
| REMIC | | Real Estate Mortgage Investment Conduit |
| Syncora | | Insured by Syncora Guarantee Inc. |
| VA | | Veterans Affairs |
See notes to financial statements.
28 Certified Semi-Annual Report
This page intentionally left blank.
Certified Semi-Annual Report 29
| | |
| STATEMENTS OF ASSETS AND LIABILITIES | | |
| |
| Thornburg Limited Term Income Funds | | March 31, 2011 (Unaudited) |
| | | | | | | | |
| | | Thornburg Limited
Term U.S.
Government Fund | | | Thornburg Limited
Term Income
Fund | |
ASSETS | | | | | | | | |
Investments at value (cost $317,999,506 and $1,055,295,969) (Note 2) | | $ | 325,431,899 | | | $ | 1,077,671,297 | |
Cash | | | 11,706,979 | | | | 426,139 | |
Receivable for investments sold | | | — | | | | 18,680,957 | |
Receivable for fund shares sold | | | 4,133,241 | | | | 5,282,248 | |
Interest receivable | | | 1,826,265 | | | | 11,082,372 | |
Prepaid expenses and other assets | | | 433,984 | | | | 53,659 | |
| | | | | | | | |
Total Assets | | | 343,532,368 | | | | 1,113,196,672 | |
| | | | | | | | |
| | |
LIABILITIES | | | | | | | | |
Payable for securities purchased | | | — | | | | 17,758,211 | |
Payable for fund shares redeemed | | | 976,322 | | | | 3,450,014 | |
Payable to investment advisor and other affiliates (Note 3) | | | 226,138 | | | | 744,516 | |
Accounts payable and accrued expenses | | | — | | | | 86,926 | |
Dividends payable | | | 190,268 | | | | 688,994 | |
| | | | | | | | |
Total Liabilities | | | 1,392,728 | | | | 22,728,661 | |
| | | | | | | | |
| | |
NET ASSETS | | $ | 342,139,640 | | | $ | 1,090,468,011 | |
| | | | | | | | |
NET ASSETS CONSIST OF: | | | | | | | | |
Undistributed (distribution in excess of) net investment income | | $ | (443,099 | ) | | $ | 108,590 | |
Net unrealized appreciation on investments | | | 7,432,393 | | | | 22,375,328 | |
Accumulated net realized gain (loss) | | | 328,780 | | | | 6,919,657 | |
Net capital paid in on shares of beneficial interest | | | 334,821,566 | | | | 1,061,064,436 | |
| | | | | | | | |
| | $ | 342,139,640 | | | $ | 1,090,468,011 | |
| | | | | | | | |
30 Certified Semi-Annual Report
| | |
| STATEMENTS OF ASSETS AND LIABILITIES, CONTINUED | | |
| |
| Thornburg Limited Term Income Funds | | March 31, 2011 (Unaudited) |
| | | | | | | | |
| | | Thornburg Limited
Term U.S.
Government Fund | | | Thornburg Limited
Term Income
Fund | |
NET ASSET VALUE: | | | | | | | | |
Class A Shares: | | | | | | | | |
Net asset value and redemption price per share ($183,827,515 and $454,631,022 applicable to 13,445,270 and 34,543,332 shares of beneficial interest outstanding - Note 4) | | $ | 13.67 | | | $ | 13.16 | |
Maximum sales charge, 1.50% of offering price | | | 0.21 | | | | 0.20 | |
| | | | | | | | |
Maximum offering price per share | | $ | 13.88 | | | $ | 13.36 | |
| | | | | | | | |
| | |
Class B Shares: | | | | | | | | |
Net asset value and offering price per share * ($3,972,253 applicable to 291,188 shares of beneficial interest outstanding - Note 4) | | $ | 13.64 | | | $ | — | |
| | | | | | | | |
| | |
Class C Shares: | | | | | | | | |
Net asset value and offering price per share * ($91,451,012 and $288,928,049 applicable to 6,648,364 and 21,988,621 shares of beneficial interest outstanding - Note 4) | | $ | 13.76 | | | $ | 13.14 | |
| | | | | | | | |
| | |
Class I Shares: | | | | | | | | |
Net asset value, offering and redemption price per share ($50,656,145 and $324,198,721 applicable to 3,705,365 and 24,628,500 shares of beneficial interest outstanding - Note 4) | | $ | 13.67 | | | $ | 13.16 | |
| | | | | | | | |
Class R3 Shares: | | | | | | | | |
Net asset value, offering and redemption price per share ($12,232,715 and $22,710,219 applicable to 894,191 and 1,724,374 shares of beneficial interest outstanding - Note 4) | | $ | 13.68 | | | $ | 13.17 | |
| | | | | | | | |
| * | Redemption price per share is equal to net asset value less any applicable contingent deferred sales charge. |
See notes to financial statements.
Certified Semi-Annual Report 31
| | |
| STATEMENTS OF OPERATIONS |
| |
| Thornburg Limited Term Income Funds | | Six Months Ended March 31, 2011 (Unaudited) |
| | | | | | | | |
| | | Thornburg Limited
Term U.S.
Government Fund | | | Thornburg Limited
Term Income
Fund | |
INVESTMENT INCOME: | | | | | | | | |
Interest income (net of premium amortized of $678,158 and $1,724,250) | | $ | 6,060,144 | | | $ | 24,135,349 | |
| | | | | | | | |
| | |
EXPENSES: | | | | | | | | |
Investment advisory fees (Note 3) | | | 656,005 | | | | 2,487,458 | |
Administration fees (Note 3) | | | | | | | | |
Class A Shares | | | 114,555 | | | | 284,856 | |
Class B Shares | | | 2,868 | | | | — | |
Class C Shares | | | 60,512 | | | | 170,407 | |
Class I Shares | | | 13,207 | | | | 77,103 | |
Class R3 Shares | | | 7,717 | | | | 12,443 | |
Distribution and service fees (Note 3) | | | | | | | | |
Class A Shares | | | 229,109 | | | | 569,713 | |
Class B Shares | | | 22,563 | | | | — | |
Class C Shares | | | 240,719 | | | | 681,818 | |
Class R3 Shares | | | 30,837 | | | | 49,865 | |
Transfer agent fees | | | | | | | | |
Class A Shares | | | 78,994 | | | | 196,004 | |
Class B Shares | | | 5,118 | | | | — | |
Class C Shares | | | 48,806 | | | | 123,042 | |
Class I Shares | | | 17,291 | | | | 88,236 | |
Class R3 Shares | | | 5,279 | | | | 6,431 | |
Registration and filing fees | | | | | | | | |
Class A Shares | | | 10,134 | | | | 17,624 | |
Class B Shares | | | 9,148 | | | | — | |
Class C Shares | | | 10,648 | | | | 13,934 | |
Class I Shares | | | 11,611 | | | | 17,621 | |
Class R3 Shares | | | 9,704 | | | | 10,551 | |
Custodian fees (Note 3) | | | 48,554 | | | | 73,466 | |
Professional fees | | | 17,360 | | | | 22,792 | |
Accounting fees | | | 5,230 | | | | 15,585 | |
Trustee fees | | | 3,858 | | | | 12,780 | |
Other expenses | | | 18,641 | | | | 56,814 | |
| | | | | | | | |
Total Expenses | | | 1,678,468 | | | | 4,988,543 | |
Less: | | | | | | | | |
Expenses reimbursed by investment advisor (Note 3) | | | (18,132 | ) | | | (66,846 | ) |
Fees paid indirectly (Note 3) | | | (21,381 | ) | | | (1,647 | ) |
| | | | | | | | |
Net Expenses | | | 1,638,955 | | | | 4,920,050 | |
| | | | | | | | |
Net Investment Income | | $ | 4,421,189 | | | $ | 19,215,299 | |
| | | | | | | | |
32 Certified Semi-Annual Report
| | |
| STATEMENTS OF OPERATIONS, CONTINUED | | |
| |
| Thornburg Limited Term Income Funds | | Six Months Ended March 31, 2011 (Unaudited) |
| | | | | | | | |
| | | Thornburg Limited
Term U.S.
Government Fund | | | Thornburg Limited
Term Income
Fund | |
REALIZED AND UNREALIZED GAIN (LOSS) | | | | | | | | |
Net realized gain (loss) on investments | | $ | 599,493 | | | $ | 7,578,004 | |
Net change in unrealized appreciation (depreciation) of investments | | | (6,638,571 | ) | | | (24,051,430 | ) |
| | | | | | | | |
Net Realized and Unrealized Loss | | | (6,039,078 | ) | | | (16,473,426 | ) |
| | | | | | | | |
Net Increase (Decrease) in Net Assets Resulting from Operations | | $ | (1,617,889 | ) | | $ | 2,741,873 | |
| | | | | | | | |
See notes to financial statements.
Certified Semi-Annual Report 33
| | |
| STATEMENTS OF CHANGES IN NET ASSETS | | |
| |
| Thornburg Limited Term U.S. Government Fund | | |
| | | | | | | | |
| | | Six Months Ended
March 31, 2011* | | | Year Ended
September 30, 2010 | |
INCREASE (DECREASE) IN NET ASSETS FROM | | | | | | | | |
| | |
OPERATIONS: | | | | | | | | |
Net investment income | | $ | 4,421,189 | | | $ | 8,134,424 | |
Net realized gain (loss) on investments | | | 599,493 | | | | 399,593 | |
Increase (Decrease) in unrealized appreciation (depreciation) of investments | | | (6,638,571 | ) | | | 4,944,595 | |
| | | | | | | | |
| | |
Net Increase (Decrease) in Net Assets Resulting from Operations | | | (1,617,889 | ) | | | 13,478,612 | |
| | |
DIVIDENDS TO SHAREHOLDERS: | | | | | | | | |
From net investment income | | | | | | | | |
Class A Shares | | | (2,856,075 | ) | | | (4,787,505 | ) |
Class B Shares | | | (42,710 | ) | | | (93,775 | ) |
Class C Shares | | | (1,379,110 | ) | | | (2,336,691 | ) |
Class I Shares | | | (905,402 | ) | | | (1,098,052 | ) |
Class R3 Shares | | | (186,467 | ) | | | (281,351 | ) |
From realized gains | | | | | | | | |
Class A Shares | | | — | | | | (656,646 | ) |
Class B Shares | | | — | | | | (24,928 | ) |
Class C Shares | | | — | | | | (362,681 | ) |
Class I Shares | | | — | | | | (121,390 | ) |
Class R3 Shares | | | — | | | | (36,511 | ) |
| | |
FUND SHARE TRANSACTIONS (NOTE 4): | | | | | | | | |
Class A Shares | | | (1,987,129 | ) | | | 44,591,116 | |
Class B Shares | | | (1,151,452 | ) | | | (791,168 | ) |
Class C Shares | | | (6,021,552 | ) | | | 18,334,888 | |
Class I Shares | | | (3,695,741 | ) | | | 30,071,156 | |
Class R3 Shares | | | (155,687 | ) | | | 4,880,471 | |
| | | | | | | | |
| | |
Net Increase (Decrease) in Net Assets | | | (19,999,214 | ) | | | 100,765,545 | |
| | |
NET ASSETS: | | | | | | | | |
Beginning of Period | | | 362,138,854 | | | | 261,373,309 | |
| | | | | | | | |
| | |
End of Period | | $ | 342,139,640 | | | $ | 362,138,854 | |
| | | | | | | | |
| | |
Undistributed net investment income | | $ | — | | | $ | 505,476 | |
See notes to financial statements.
34 Certified Semi-Annual Report
| | |
| STATEMENTS OF CHANGES IN NET ASSETS | | |
| |
| Thornburg Limited Term Income Fund | | |
| | | | | | | | |
| | | Six Months Ended
March 31, 2011* | | | Year Ended
September 30, 2010 | |
INCREASE (DECREASE) IN NET ASSETS FROM | | | | | | | | |
| | |
OPERATIONS: | | | | | | | | |
Net investment income | | $ | 19,215,299 | | | $ | 29,111,142 | |
Net realized gain (loss) on investments | | | 7,578,004 | | | | 6,846,697 | |
Increase (Decrease) in unrealized appreciation (depreciation) of investments | | | (24,051,430 | ) | | | 29,472,905 | |
| | | | | | | | |
| | |
Net Increase (Decrease) in Net Assets Resulting from Operations | | | 2,741,873 | | | | 65,430,744 | |
| | |
DIVIDENDS TO SHAREHOLDERS: | | | | | | | | |
From net investment income | | | | | | | | |
Class A Shares | | | (8,361,437 | ) | | | (13,393,395 | ) |
Class C Shares | | | (4,663,978 | ) | | | (6,421,751 | ) |
Class I Shares | | | (6,187,910 | ) | | | (8,976,616 | ) |
Class R3 Shares | | | (362,918 | ) | | | (570,120 | ) |
From realized gains | | | | | | | | |
Class A Shares | | | (1,414,228 | ) | | | — | |
Class C Shares | | | (830,699 | ) | | | — | |
Class I Shares | | | (945,122 | ) | | | — | |
Class R3 Shares | | | (55,975 | ) | | | — | |
| | |
FUND SHARE TRANSACTIONS (NOTE 4): | | | | | | | | |
Class A Shares | | | 3,872,860 | | | | 199,893,182 | |
Class C Shares | | | 36,183,867 | | | | 131,265,249 | |
Class I Shares | | | 34,623,857 | | | | 139,106,146 | |
Class R3 Shares | | | 4,267,259 | | | | 7,986,395 | |
| | | | | | | | |
| | |
Net Increase in Net Assets | | | 58,867,449 | | | | 514,319,834 | |
| | |
NET ASSETS: | | | | | | | | |
Beginning of Period | | | 1,031,600,562 | | | | 517,280,728 | |
| | | | | | | | |
| | |
End of Period | | $ | 1,090,468,011 | | | $ | 1,031,600,562 | |
| | | | | | | | |
| | |
Undistributed net investment income | | $ | 108,590 | | | $ | 469,534 | |
See notes to financial statements.
Certified Semi-Annual Report 35
| | |
| NOTES TO FINANCIAL STATEMENTS | | |
| |
| Thornburg Limited Term Income Funds | | March 31, 2011 (Unaudited) |
NOTE 1 – ORGANIZATION
Thornburg Limited Term U.S. Government Fund (the “Government Fund”) and Thornburg Limited Term Income Fund (the “Income Fund”), hereafter referred to collectively as the “Funds,” are diversified series of Thornburg Investment Trust (the “Trust”). The Trust is organized as a Massachusetts business trust under a Declaration of Trust dated June 3, 1987 and is registered as a diversified, open-end management investment company under the Investment Company Act of 1940, as amended. The Funds are currently two of sixteen separate series of the Trust. Each series is considered to be a separate entity for financial reporting and tax purposes and bears expenses directly attributable to it. The Funds’ primary objectives are to obtain as high a level of current income as is consistent, in the view of the Funds’ investment advisor, with the safety of capital. As a secondary objective, the Funds seek to reduce changes in their share prices compared to longer term portfolios.
The Government Fund currently has five classes of shares of beneficial interest outstanding: Class A, Class B, Class C, Institutional Class (Class I), and Retirement Class (Class R3). The Government Fund no longer offers Class B shares for sale. The Income Fund currently offers four classes of shares of beneficial interest, Class A, Class C, Institutional Class (Class I), and Retirement Class (Class R3) shares. Each class of shares of the Funds represents an interest in the same portfolio of investments, except that (i) Class A shares are sold subject to a front-end sales charge collected at the time the shares are purchased and bear a service fee, (ii) Class B shares are sold at net asset value without a sales charge at the time of purchase, but are subject to a contingent deferred sales charge upon redemption and bear both a service fee and distribution fee, (iii) Class C shares are sold at net asset value without a sales charge at the time of purchase, but are subject to a contingent deferred sales charge upon redemption within one year of purchase, and bear both a service fee and a distribution fee, (iv) Class I shares are sold at net asset value without a sales charge at the time of purchase, (v) Class R3 shares are sold at net asset value without a sales charge, but bear both a service fee and a distribution fee, and (vi) the respective classes may have different reinvestment privileges and conversion rights. Additionally, each Fund may allocate among its classes certain expenses, to the extent allowable to specific classes, including transfer agent fees, government registration fees, certain printing and postage costs, and administrative and legal expenses. Currently, class specific expenses of the Funds are limited to distribution and service fees, administration fees, and certain registration and transfer agent expenses. Class B shares of the Government Fund outstanding for eight years will convert to Class A shares of the Government Fund.
NOTE 2 – SIGNIFICANT ACCOUNTING POLICIES
Significant accounting policies of the Trust are as follows:
Valuation of Investments: Debt obligations have a primary market over the counter and are valued by an independent pricing service approved by the Trustees of the Trust. The pricing service ordinarily values debt obligations at quoted bid prices. Quotations for any foreign debt obligations in foreign currencies are converted to U.S. dollar equivalents using the foreign exchange quotation in effect at the time of valuation. When quotations are not available, debt obligations are valued at evaluated prices determined by the pricing service using methods which include consideration of yields or prices of debt obligations of comparable quality, type of issue, coupon, maturity and rating, and indications as to value from dealers and general market conditions. Short-term obligations having remaining maturities of 60 days or less are ordinarily valued at amortized cost, which approximates market value.
In any case where a pricing service fails to provide a price for a debt obligation held by the Funds, the valuation and pricing committee determines a fair value for the obligation using procedures approved by the Trustees. Additionally, in any case where management believes that a price provided by a pricing service for a debt obligation may be unreliable, the valuation and pricing committee decides whether or not to use the pricing service’s valuation or to determine a fair value for the obligation.
In determining fair value for any portfolio security or other investment, the valuation and pricing committee seeks to determine the amount that an owner of the investment might reasonably expect to receive upon a sale of the investment. However, because fair value prices are estimated prices, the valuation and pricing committee’s determination of fair value for an investment may differ from the value that would be realized by a Fund upon a sale of the investment, and that difference could be material to the Fund’s financial statements. The valuation and pricing committee’s determination of fair value for an investment may also differ from the prices obtained by other persons (including other mutual funds) for the investment.
Valuation Measurements: Various inputs are used in determining the value of each Fund’s investments. These inputs are summarized in the three levels listed below.
36 Certified Semi-Annual Report
| | |
| NOTES TO FINANCIAL STATEMENTS, CONTINUED | | |
| |
| Thornburg Limited Term Income Funds | | March 31, 2011 (Unaudited) |
Level 1: Quoted prices in active markets for identical investments.
Level 2: Other significant observable inputs (including quoted prices for similar investments, interest rates, prepayment rates, credit risk, etc.).
Level 3: Significant unobservable inputs (including each Fund’s own assumptions in determining the fair value of investments).
GOVERNMENT FUND
The following table displays a summary of the inputs used to value the Fund’s net assets as of March 31, 2011. In any instance when valuation inputs from more than one level are used to determine the fair value of a specific investment, the investment is placed in the level of the table based upon the lowest level input that is significant in determining the fair value of the investment:
| | | | | | | | | | | | | | | | |
| | | Fair Value Measurements at March 31, 2011 | |
| | | Total | | | Level 1 | | | Level 2 | | | Level 3 | |
Assets | | | | | | | | | | | | | | | | |
Investments in Securities | | | | | | | | | | | | | | | | |
U.S. Treasury Securities | | $ | 36,497,533 | | | $ | 36,497,533 | | | $ | — | | | $ | — | |
U.S. Government Agencies | | | 76,080,375 | | | | — | | | | 72,278,899 | | | | 3,801,476 | |
Mortgage Backed | | | 212,853,991 | | | | — | | | | 212,853,991 | | | | — | |
| | | | | | | | | | | | | | | | |
Total Investments in Securities | | $ | 325,431,899 | | | $ | 36,497,533 | | | $ | 285,132,890 | | | $ | 3,801,476 | |
A rollforward of fair value measurements using significant unobservable inputs (Level 3) for the six months ended March 31, 2011, was as follows:
| | | | | | | | | | | | | | | | | | | | | | | | | | | | |
| | | Beginning
Balance
9/30/2010 | | | Gross
Purchases | | | Gross
Sales | | | Net Realized
Gain/(Loss) | | | Net Unrealized
Appreciation/
(Depreciation) | | | Net Transfers
in/(out) of
Level 3(b) | | | Ending
Balance
3/31/2011 | |
Investments in Securities(a) | | $ | 7,171,456 | | | $ | — | | | $ | (172,098 | ) | | $ | (528 | ) | | $ | (208,997 | ) | | $ | (2,988,357 | ) | | $ | 3,801,476 | |
(a) Level 3 Securities represent 1.11% of Total Net Assets at the period ended March 31, 2011.
(b) Net transfers out of Level 3 were to Level 2, and were due to a change in other significant observable inputs existing during the six months ended March 31, 2011. Transfers into or out of Level 3 are based on the beginning market value of the year in which they occurred.
INCOME FUND
The following table displays a summary of the inputs used to value the Fund’s net assets as of March 31, 2011. In any instance when valuation inputs from more than one level are used to determine the fair value of a specific investment, the investment is placed in the level of the table based upon the lowest level input that is significant in determining the fair value of the invest
| | | | | | | | | | | | | | | | |
| | | Fair Value Measurements at March 31, 2011 | |
| | | Total | | | Level 1 | | | Level 2 | | | Level 3 | |
Assets | | | | | | | | | | | | | | | | |
Investments in Securities | | | | | | | | | | | | | | | | |
U.S. Treasury Securities | | $ | 17,195,606 | | | $ | 17,195,606 | | | $ | — | | | $ | — | |
U.S. Government Agencies | | | 37,269,549 | | | | — | | | | 34,745,845 | | | | 2,523,704 | |
Other Government | | | 24,936,399 | | | | — | | | | 18,927,279 | | | | 6,009,120 | |
Mortgage Backed | | | 139,772,859 | | | | — | | | | 139,772,859 | | | | — | |
Asset Backed Securities | | | 88,093,445 | | | | — | | | | 85,085,945 | | | | 3,007,500 | |
Corporate Bonds | | | 592,296,809 | | | | — | | | | 578,353,098 | | | | 13,943,711 | |
Convertible Bonds | | | 14,406,250 | | | | — | | | | 14,406,250 | | | | — | |
Municipal Bonds | | | 128,000,380 | | | | — | | | | 128,000,380 | | | | — | |
Short Term Investments | | | 35,700,000 | | | | — | | | | 35,700,000 | | | | — | |
| | | | | | | | | | | | | | | | |
Total Investments in Securities | | $ | 1,077,671,297 | | | $ | 17,195,606 | | | $ | 1,034,991,656 | | | $ | 25,484,035 | |
Certified Semi-Annual Report 37
| | |
| NOTES TO FINANCIAL STATEMENTS, CONTINUED | | |
| |
| Thornburg Limited Term Income Funds | | March 31, 2011 (Unaudited) |
A rollforward of fair value measurements using significant unobservable inputs (Level 3) for the period ended March 31, 2011, was as follows:
| | | | | | | | | | | | | | | | | | | | | | | | | | | | |
| | | Beginning
Balance
9/30/2010 | | | Gross
Purchases | | | Gross
Sales | | | Net Realized
Gain/(Loss) | | | Net Unrealized
Appreciation/
(Depreciation) | | | Net Transfers
in/(out) of
Level 3(b) | | | Ending
Balance
3/31/2011 | |
Investments in Securities(a) | | $ | 15,214,529 | | | $ | 18,542,361 | | | $ | (572,928 | ) | | $ | 786 | | | $ | (229,821 | ) | | $ | (7,470,892 | ) | | $ | 25,484,035 | |
(a) Level 3 Securities represent 2.34% of Total Net Assets at the period ended March 31, 2011.
(b) Net transfers out of Level 3 were to Level 2, and were due to a change in other significant observable inputs existing during the six months ended March 31, 2011. Transfers into or out of Level 3 are based on the beginning market value of the year in which they occurred.
Other Notes: It is the policy of the Funds to recognize significant transfers between Levels 1 and 2 and to disclose those transfers at the last date of the reporting period. The Funds recognized no significant transfers into and out of Levels 1 and 2 during the six months ended March 31, 2011.
Federal Income Taxes: It is the policy of the Trust to comply with the provisions of the Internal Revenue Code applicable to “regulated investment companies” and to distribute to shareholders substantially all taxable income, including any net realized gain on investments of the Funds. Therefore, no provision for federal income taxes is required.
Management reviews each tax position believed to be material to the preparation of each Funds financial statements, to assess if it is more likely than not that the position would be sustained upon examination, based upon the technical merits of the position. As of March 31, 2011, management has not identified any such position for which a liability must be reflected in the Statement of Assets and Liabilities. The Funds tax returns remain subject to examination for three years after filing.
When-Issued and Delayed Delivery Transactions: The Funds may engage in when-issued or delayed delivery transactions. To the extent a Fund engages in such transactions, they will do so for the purpose of acquiring portfolio securities consistent with the Fund’s investment objectives and not for the purpose of investment leverage or to speculate on interest rate and/or market changes. At the time a Fund makes a commitment to purchase a security on a when-issued or delayed delivery basis, the Fund will record the transaction and reflect the value in determining the Fund’s net asset value. When effecting such transactions, assets of an amount sufficient to make payment for the portfolio securities to be purchased will be segregated on each Fund’s records at the trade date. Securities purchased on a when-issued or delayed delivery basis do not earn interest until the settlement date.
Dividends: Net investment income of each Fund is declared daily as a dividend on shares for which the Fund has received payment. Dividends are paid monthly and are reinvested in additional shares of the Funds at net asset value per share at the close of business on the dividend payment date, or at the shareholder’s option, paid in cash. Net realized capital gains, to the extent available, will be distributed at least annually.
General: Securities transactions are accounted for on a trade date basis. Interest income is accrued as earned. Premiums and discounts on securities purchased are amortized over the life of the respective securities. Realized gains and losses from the sale of securities are recorded on an identified cost basis. The Funds invest in various mortgage-backed securities. Such securities pay interest and a portion of principal each month, which is then available for investment in securities at prevailing prices. Paydown gains and losses on these securities are included in interest income. Net investment income (other than class specific expenses) and realized and unrealized gains and losses are allocated daily to each class of shares based upon the relative net asset value of outstanding shares (or the value of the dividend-eligible shares, as appropriate) of each class of shares at the beginning of the day (after adjusting for the current share activity of the respective class). Expenses common to all Funds are allocated among the Funds comprising the Trust based upon their relative net asset values or other appropriate allocation methods.
Foreign Currency Translation: With respect to the Income Fund, portfolio securities and other assets and liabilities denominated in foreign currencies are translated into U.S. dollars based on the rate of exchange of such currencies against U.S. dollars on the date of valuation. Purchases and sales of portfolio securities and interest denominated in foreign currencies are translated into U.S. dollar amounts on the respective dates of such transactions.
38 Certified Semi-Annual Report
| | |
| NOTES TO FINANCIAL STATEMENTS, CONTINUED | | |
| |
| Thornburg Limited Term Income Funds | | March 31, 2011 (Unaudited) |
The Income Fund does not isolate that portion of the results of operations resulting from changes in foreign exchange rates on investments from the fluctuations arising from changes in market prices of securities held. Such fluctuations are included with the net realized and unrealized gain or loss from investments.
Reported net realized foreign exchange gains or losses arise from sales of foreign currencies, currency gains or losses realized between the trade and settlement dates on securities transactions, and the difference between the amount of interest recorded on the Income Fund’s books and the U.S. dollar equivalent of the amounts actually received or paid.
Guarantees and Indemnifications: Under the Trust’s organizational documents, its officers and Trustees are indemnified against certain liabilities arising out of the performance of their duties to the Funds. Additionally, in the normal course of business the Trust enters into contracts with service providers that contain general indemnification clauses. The Trust’s maximum exposure under these arrangements is unknown. However, based on experience, the Trust expects the risk of loss to be remote.
Use of Estimates: The preparation of financial statements, in conformity with generally accepted accounting principles, requires management to make estimates and assumptions that affect the reported amounts of assets and liabilities and the disclosure of contingent assets and liabilities at the date of the financial statements and the reported amounts of increases and decreases in net assets from operations during the reporting period. Actual results could differ from those estimates.
NOTE 3 – INVESTMENT ADVISORY FEE AND OTHER TRANSACTIONS WITH AFFILIATES
Pursuant to an investment advisory agreement, Thornburg Investment Management, Inc. (the “Advisor”) serves as the investment advisor and performs services to the Funds for which the fees are payable at the end of each month. For the six months ended March 31, 2011, these fees were payable at annual rates ranging from .375 of 1% to .275 of 1% per annum of the average daily net assets of the Government Fund and .50 of 1% to .275 of 1% per annum of the average daily net assets of the Income Fund depending on each Fund’s asset size. The Trust also has entered into administrative services agreements with the Advisor, whereby the Advisor will perform certain administrative services for the shareholders of each class of each Fund’s shares, and for which fees will be payable at an annual rate of up to .125 of 1% per annum of the average daily net assets attributable to Class A, Class B, Class C, and Class R3 shares, and up to .05 of 1% per annum of the average daily net assets attributable to Class I shares. For the six months ended March 31, 2011, the Advisor voluntarily or contractually reimbursed certain class specific expenses and administrative fees of $18,132 for the Class R3 shares, of the Government Fund and $15,384, $20,249, $213 and $31,000 for the Class A, C, I and R3 shares, respectively, of the Income Fund.
The Trust has an underwriting agreement with Thornburg Securities Corporation (the “Distributor,” an affiliate of the Advisor), which acts as the distributor of each Fund’s shares. For the six months ended March 31, 2011, the Distributor has advised the Funds that they earned net commissions aggregating $1,010 from the sale of Class A shares of the Government Fund, $1,937 from the sale of Class A shares of the Income Fund, and collected contingent deferred sales charges aggregating $8,582 and $30,861 from redemptions of Class C shares of the Government Fund and Income Fund, respectively.
Pursuant to a service plan under Rule 12b-1 of the Investment Company Act of 1940, the Funds may reimburse to the Advisor an amount not to exceed .25 of 1% per annum of the average daily net assets attributable to the Class A, Class B, Class C, Class I, and Class R3 shares of the Funds for payments made by the Advisor to securities dealers and other financial institutions to obtain various shareholder and distribution related services. For the six months ended March 31, 2011, there were no 12b-1 service plan fees charged for Class I shares. The Advisor may pay out of its own resources additional expenses for distribution of each Fund’s shares.
The Trust has also adopted distribution plans pursuant to Rule 12b-1, applicable to each Fund’s Class C and Class R3 shares, and also applicable to Government Fund’s Class B shares, under which the Funds compensate the Distributor for services in promoting the sale of Class B, C, and R3 shares of the Funds at an annual rate of up to .75 of 1% per annum of the average daily net assets attributable to Class B shares, and an annual rate of up to .25 of 1% per annum of the average daily net assets attributable to Class C and Class R3 shares. Total fees incurred by the Distributor for each class of shares of the Funds under their respective Service and Distribution Plans for the six months ended March 31, 2011, are set forth in the Statements of Operations.
The Trust has an agreement with the custodian bank to indirectly pay a portion of the custodian’s fees through credits earned by each Fund’s cash on deposit with the bank. This deposit agreement is an alternative to overnight investments. Custodial fees have been
Certified Semi-Annual Report 39
| | |
| NOTES TO FINANCIAL STATEMENTS, CONTINUED | | |
| |
| Thornburg Limited Term Income Funds | | March 31, 2011 (Unaudited) |
adjusted to reflect amounts that would have been paid without this agreement, with a corresponding adjustment reflected as fees paid indirectly in the Statements of Operations. For the six months ended March 31, 2011, fees paid indirectly were $21,381 for the Government Fund and $1,647 for the Income Fund.
Certain officers and Trustees of the Trust are also officers and/or directors of the Advisor and Distributor. The compensation of independent Trustees is borne by the Trust.
NOTE 4 – SHARES OF BENEFICIAL INTEREST
At March 31, 2011, there were an unlimited number of shares of beneficial interest authorized. Transactions in shares of beneficial interest were as follows:
GOVERNMENT FUND
| | | | | | | | | | | | | | | | |
| | | Six Months Ended | | | Year Ended | |
| | | March 31, 2011 (Unaudited) | | | September 30, 2010 (Audited) | |
| | | Shares | | | Amount | | | Shares | | | Amount | |
Class A Shares | | | | | | | | | | | | | | | | |
Shares sold | | | 2,768,789 | | | $ | 38,097,309 | | | | 6,863,872 | | | $ | 94,820,720 | |
Shares issued to shareholders in reinvestment of dividends | | | 158,473 | | | | 2,183,410 | | | | 312,811 | | | | 4,320,057 | |
Shares repurchased | | | (3,070,333 | ) | | | (42,267,848 | ) | | | (3,954,815 | ) | | | (54,549,661 | ) |
| | | | | | | | | | | | | | | | |
| | | | |
Net Increase (Decrease) | | | (143,071 | ) | | $ | (1,987,129 | ) | | | 3,221,868 | | | $ | 44,591,116 | |
| | | | | | | | | | | | | | | | |
Class B Shares | | | | | | | | | | | | | | | | |
Shares sold | | | 10,794 | | | $ | 148,558 | | | | 112,354 | | | $ | 1,549,558 | |
Shares issued to shareholders in reinvestment of dividends | | | 2,710 | | | | 37,272 | | | | 7,093 | | | | 97,704 | |
Shares repurchased | | | (97,186 | ) | | | (1,337,282 | ) | | | (177,244 | ) | | | (2,438,430 | ) |
| | | | | | | | | | | | | | | | |
| | | | |
Net Increase (Decrease) | | | (83,682 | ) | | $ | (1,151,452 | ) | | | (57,797 | ) | | $ | (791,168 | ) |
| | | | | | | | | | | | | | | | |
Class C Shares | | | | | | | | | | | | | | | | |
Shares sold | | | 1,174,625 | | | $ | 16,322,933 | | | | 3,854,657 | | | $ | 53,551,771 | |
Shares issued to shareholders in reinvestment of dividends | | | 71,705 | | | | 993,778 | | | | 140,523 | | | | 1,952,489 | |
Shares repurchased | | | (1,686,053 | ) | | | (23,338,263 | ) | | | (2,679,800 | ) | | | (37,169,372 | ) |
| | | | | | | | | | | | | | | | |
| | | | |
Net Increase (Decrease) | | | (439,723 | ) | | $ | (6,021,552 | ) | | | 1,315,380 | | | $ | 18,334,888 | |
| | | | | | | | | | | | | | | | |
Class I Shares | | | | | | | | | | | | | | | | |
Shares sold | | | 633,840 | | | $ | 8,728,316 | | | | 3,198,552 | | | $ | 44,258,618 | |
Shares issued to shareholders in reinvestment of dividends | | | 49,335 | | | | 679,467 | | | | 56,148 | | | | 776,441 | |
Shares repurchased | | | (951,296 | ) | | | (13,103,524 | ) | | | (1,087,186 | ) | | | (14,963,903 | ) |
| | | | | | | | | | | | | | | | |
| | | | |
Net Increase (Decrease) | | | (268,121 | ) | | $ | (3,695,741 | ) | | | 2,167,514 | | | $ | 30,071,156 | |
| | | | | | | | | | | | | | | | |
Class R3 Shares | | | | | | | | | | | | | | | | |
Shares sold | | | 158,227 | | | $ | 2,174,839 | | | | 565,861 | | | $ | 7,827,234 | |
Shares issued to shareholders in reinvestment of dividends | | | 13,062 | | | | 179,999 | | | | 22,746 | | | | 314,344 | |
Shares repurchased | | | (182,488 | ) | | | (2,510,525 | ) | | | (236,222 | ) | | | (3,261,107 | ) |
| | | | | | | | | | | | | | | | |
| | | | |
Net Increase (Decrease) | | | (11,199 | ) | | $ | (155,687 | ) | | | 352,385 | | | $ | 4,880,471 | |
| | | | | | | | | | | | | | | | |
40 Certified Semi-Annual Report
| | |
| NOTES TO FINANCIAL STATEMENTS, CONTINUED | | |
| |
| Thornburg Limited Term Income Funds | | March 31, 2011 (Unaudited) |
INCOME FUND
| | | | | | | | | | | | | | | | |
| | | Six Months Ended
March 31, 2011 (Unaudited) | | | Year Ended
September 30, 2010 (Audited) | |
| | | Shares | | | Amount | | | Shares | | | Amount | |
Class A Shares | | | | | | | | | | | | | | | | |
Shares sold | | | 7,716,232 | | | $ | 102,201,482 | | | | 21,879,703 | | | $ | 285,979,591 | |
Shares issued to shareholders in reinvestment of dividends | | | 601,713 | | | | 7,959,677 | | | | 831,439 | | | | 10,905,086 | |
Shares repurchased | | | (8,045,695 | ) | | | (106,288,299 | ) | | | (7,414,765 | ) | | | (96,991,495 | ) |
| | | | | | | | | | | | | | | | |
| | | | |
Net Increase (Decrease) | | | 272,250 | | | $ | 3,872,860 | | | | 15,296,377 | | | $ | 199,893,182 | |
| | | | | | | | | | | | | | | | |
Class C Shares | | | | | | | | | | | | | | | | |
Shares sold | | | 5,518,483 | | | $ | 72,946,862 | | | | 12,001,955 | | | $ | 156,815,343 | |
Shares issued to shareholders in reinvestment of dividends | | | 293,978 | | | | 3,882,006 | | | | 339,961 | | | | 4,453,016 | |
Shares repurchased | | | (3,086,241 | ) | | | (40,645,001 | ) | | | (2,299,042 | ) | | | (30,003,110 | ) |
| | | | | | | | | | | | | | | | |
| | | | |
Net Increase (Decrease) | | | 2,726,220 | | | $ | 36,183,867 | | | | 10,042,874 | | | $ | 131,265,249 | |
| | | | | | | | | | | | | | | | |
Class I Shares | | | | | | | | | | | | | | | | |
Shares sold | | | 8,034,983 | | | $ | 106,248,513 | | | | 15,971,676 | | | $ | 209,108,311 | |
Shares issued to shareholders in reinvestment of dividends | | | 435,020 | | | | 5,753,851 | | | | 538,856 | | | | 7,069,519 | |
Shares repurchased | | | (5,870,450 | ) | | | (77,378,507 | ) | | | (5,881,124 | ) | | | (77,071,684 | ) |
| | | | | | | | | | | | | | | | |
| | | | |
Net Increase (Decrease) | | | 2,599,553 | | | $ | 34,623,857 | | | | 10,629,408 | | | $ | 139,106,146 | |
| | | | | | | | | | | | | | | | |
Class R3 Shares | | | | | | | | | | | | | | | | |
Shares sold | | | 725,120 | | | $ | 9,552,327 | | | | 1,088,310 | | | $ | 14,252,821 | |
Shares issued to shareholders in reinvestment of dividends | | | 30,008 | | | | 397,090 | | | | 41,086 | | | | 538,934 | |
Shares repurchased | | | (429,392 | ) | | | (5,682,158 | ) | | | (517,688 | ) | | | (6,805,360 | ) |
| | | | | | | | | | | | | | | | |
| | | | |
Net Increase (Decrease) | | | 325,736 | | | $ | 4,267,259 | | | | 611,708 | | | $ | 7,986,395 | |
| | | | | | | | | | | | | | | | |
NOTE 5 – SECURITIES TRANSACTIONS
For the six months ended March 31, 2011, the Government Fund had purchase and sale transactions of investment securities (excluding short-term investments) of $56,621,371 and $23,706,105, respectively, while the Income Fund had purchase and sale transactions of investment securities (excluding short-term investments and U.S. Government obligations) of $277,962,329 and $154,199,517, respectively.
NOTE 6 – INCOME TAXES
At March 31, 2011, information on the tax components of capital is as follows:
| | | | | | | | |
| | | Government Fund | | | Income Fund | |
Cost of investments for tax purposes | | $ | 317,999,506 | | | $ | 1,055,295,969 | |
| | | | | | | | |
Gross unrealized appreciation on a tax basis | | $ | 8,780,771 | | | $ | 32,343,951 | |
Gross unrealized depreciation on a tax basis | | | (1,348,378 | ) | | | (9,968,623 | ) |
| | | | | | | | |
Net unrealized appreciation (depreciation) on investments (tax basis) | | $ | 7,432,393 | | | $ | 22,375,328 | |
| | | | | | | | |
Certified Semi-Annual Report 41
| | |
| NOTES TO FINANCIAL STATEMENTS, CONTINUED | | |
| |
| Thornburg Limited Term Income Funds | | March 31, 2011 (Unaudited) |
At March 31, 2011, the Government Fund had deferred tax basis capital losses occurring subsequent to October 31, 2009 of $253,397. For tax purposes, such losses will be reflected in the year ending September 30, 2011.
At March 31, 2011, the Government Fund had tax basis capital losses of $17,316, which may be carried forward to offset future capital gains. To the extent such carryforwards are used, capital gain distributions may be reduced to the extent provided by regulations. Such capital loss carryforwards will expire September 30, 2018.
OTHER NOTES
Fund management believes no events have occurred between March 31, 2011 and May 20, 2011, the date of issuance of the financial statements, which require adjustment of, or disclosure in, the accompanying financial statements.
42 Certified Semi-Annual Report
This page intentionally left blank.
Certified Semi-Annual Report 43
| | |
| FINANCIAL HIGHLIGHTS | | |
| |
| Thornburg Limited Term U.S. Government Fund | | |
| | | | | | | | | | | | | | | | | | | | | | | | | | | | | | | | | | | | | | | | | | | | | | | | | | | | | | | | | | | | |
| | | PER SHARE PERFORMANCE (for a share outstanding throughout the period)+ | | | RATIOS TO AVERAGE NET ASSETS | | | SUPPLEMENTAL DATA | |
Unless
Otherwise
Noted, Periods
are Fiscal Years
Ended Sept. 30, | | Net
Asset
Value
Beginning
of Period | | | Net
Investment
Income
(Loss) | | | Net
Realized
& Unrealized
Gain (Loss)
on
Investments | | | Total
from
Investment
Operations | | | Dividends
from Net
Investment
Income | | | Dividends
from Net
Realized
Gains | | | Total
Dividends | | | Net
Asset
Value
End of
Period | | | Net
Investment
Income
(Loss) (%) | | | Expenses,
After
Expense
Reductions
(%) | | | Expenses,
After
Expense
Reductions
and Net of
Custody
Credits
(%) | | | Expenses,
Before
Expense
Reductions
(%) | | | Total
Return
(%)(a) | | | Portfolio
Turnover
Rate (%) | | | Net Assets
at End
of Period
(Thousands) | |
Class A Shares | | | | | | | | | | | | | | | | | | | | | | | | | | | | | | | | | | | | | | | | | | | | | | | | | | | | | | | | | | | | |
2011(b)(c) | | $ | 13.94 | | | | 0.18 | | | | (0.24 | ) | | | (0.06 | ) | | | (0.21 | ) | | | — | | | | (0.21 | ) | | $ | 13.67 | | | | 2.58 | (d) | | | 0.90 | (d) | | | 0.89 | (d) | | | 0.90 | (d) | | | (0.40 | ) | | | 7.33 | | | $ | 183,828 | |
2010(c) | | $ | 13.78 | | | | 0.39 | | | | 0.80 | | | | 1.19 | | | | (0.41 | ) | | | (0.62 | ) | | | (1.03 | ) | | $ | 13.94 | | | | 2.81 | | | | 0.93 | | | | 0.92 | | | | 0.93 | | | | 4.69 | | | | 16.01 | | | $ | 189,465 | |
2009(c) | | $ | 13.26 | | | | 0.41 | | | | 0.54 | | | | 0.95 | | | | (0.43 | ) | | | — | | | | (0.43 | ) | | $ | 13.78 | | | | 3.04 | | | | 0.94 | | | | 0.93 | | | | 0.94 | | | | 7.21 | | | | 39.42 | | | $ | 142,872 | |
2008(c) | | $ | 12.97 | | | | 0.45 | | | | 0.29 | | | | 0.74 | | | | (0.45 | ) | | | — | | | | (0.45 | ) | | $ | 13.26 | | | | 3.39 | | | | 0.95 | | | | 0.93 | | | | 0.95 | | | | 5.75 | | | | 19.61 | | | $ | 123,625 | |
2007(c) | | $ | 12.75 | | | | 0.40 | | | | 0.23 | | | | 0.63 | | | | (0.41 | ) | | | — | | | | (0.41 | ) | | $ | 12.97 | | | | 3.13 | | | | 0.98 | | | | 0.97 | | | | 0.99 | | | | 5.03 | | | | 43.35 | | | $ | 91,561 | |
2006(c) | | $ | 12.76 | | | | 0.37 | | | | (0.01 | ) | | | 0.36 | | | | (0.37 | ) | | | — | | | | (0.37 | ) | | $ | 12.75 | | | | 2.90 | | | | 0.99 | | | | 0.96 | | | | 0.99 | | | | 2.87 | | | | 7.47 | | | $ | 106,913 | |
Class B Shares | | | | | | | | | | | | | | | | | | | | | | | | | | | | | | | | | | | | | | | | | | | | | | | | | | | | | | | | | | | | |
2011(b) | | $ | 13.91 | | | | 0.09 | | | | (0.23 | ) | | | (0.14 | ) | | | (0.13 | ) | | | — | | | | (0.13 | ) | | $ | 13.64 | | | | 1.31 | (d) | | | 2.16 | (d) | | | 2.15 | (d) | | | 2.16 | (d) | | | (1.03 | ) | | | 7.33 | | | $ | 3,972 | |
2010 | | $ | 13.75 | | | | 0.23 | | | | 0.80 | | | | 1.03 | | | | (0.25 | ) | | | (0.62 | ) | | | (0.87 | ) | | $ | 13.91 | | | | 1.65 | | | | 2.11 | | | | 2.11 | | | | 2.11 | | | | 3.46 | | | | 16.01 | | | $ | 5,215 | |
2009 | | $ | 13.23 | | | | 0.27 | | | | 0.53 | | | | 0.80 | | | | (0.28 | ) | | | — | | | | (0.28 | ) | | $ | 13.75 | | | | 1.96 | | | | 2.01 | | | | 2.01 | | | | 2.04 | | | | 6.08 | | | | 39.42 | | | $ | 5,950 | |
2008 | | $ | 12.94 | | | | 0.28 | | | | 0.28 | | | | 0.56 | | | | (0.27 | ) | | | — | | | | (0.27 | ) | | $ | 13.23 | | | | 2.08 | | | | 2.26 | | | | 2.25 | | | | 2.26 | | | | 4.37 | | | | 19.61 | | | $ | 5,147 | |
2007 | | $ | 12.72 | | | | 0.22 | | | | 0.23 | | | | 0.45 | | | | (0.23 | ) | | | — | | | | (0.23 | ) | | $ | 12.94 | | | | 1.73 | | | | 2.40 | | | | 2.39 | | | | 2.63 | | | | 3.55 | | | | 43.35 | | | $ | 2,586 | |
2006 | | $ | 12.73 | | | | 0.18 | | | | (0.01 | ) | | | 0.17 | | | | (0.18 | ) | | | — | | | | (0.18 | ) | | $ | 12.72 | | | | 1.41 | | | | 2.51 | | | | 2.48 | | | | 3.21 | | | | 1.32 | | | | 7.47 | | | $ | 2,476 | |
Class C Shares | | | | | | | | | | | | | | | | | | | | | | | | | | | | | | | | | | | | | | | | | | | | | | | | | | | | | | | | | | | | |
2011(b) | | $ | 14.03 | | | | 0.16 | | | | (0.23 | ) | | | (0.07 | ) | | | (0.20 | ) | | | — | | | | (0.20 | ) | | $ | 13.76 | | | | 2.30 | (d) | | | 1.17 | (d) | | | 1.16 | (d) | | | 1.17 | (d) | | | (0.52 | ) | | | 7.33 | | | $ | 91,451 | |
2010 | | $ | 13.87 | | | | 0.35 | | | | 0.81 | | | | 1.16 | | | | (0.38 | ) | | | (0.62 | ) | | | (1.00 | ) | | $ | 14.03 | | | | 2.53 | | | | 1.21 | | | | 1.20 | | | | 1.71 | | | | 4.39 | | | | 16.01 | | | $ | 99,430 | |
2009 | | $ | 13.34 | | | | 0.37 | | | | 0.55 | | | | 0.92 | | | | (0.39 | ) | | | — | | | | (0.39 | ) | | $ | 13.87 | | | | 2.74 | | | | 1.22 | | | | 1.21 | | | | 1.72 | | | | 6.97 | | | | 39.42 | | | $ | 80,039 | |
2008 | | $ | 13.04 | | | | 0.41 | | | | 0.30 | | | | 0.71 | | | | (0.41 | ) | | | — | | | | (0.41 | ) | | $ | 13.34 | | | | 3.10 | | | | 1.24 | | | | 1.22 | | | | 1.75 | | | | 5.51 | | | | 19.61 | | | $ | 63,998 | |
2007 | | $ | 12.83 | | | | 0.37 | | | | 0.22 | | | | 0.59 | | | | (0.38 | ) | | | — | | | | (0.38 | ) | | $ | 13.04 | | | | 2.88 | | | | 1.25 | | | | 1.24 | | | | 1.80 | | | | 4.66 | | | | 43.35 | | | $ | 25,566 | |
2006 | | $ | 12.84 | | | | 0.34 | | | | (0.01 | ) | | | 0.33 | | | | (0.34 | ) | | | — | | | | (0.34 | ) | | $ | 12.83 | | | | 2.63 | | | | 1.26 | | | | 1.23 | | | | 1.79 | | | | 2.60 | | | | 7.47 | | | $ | 25,132 | |
Class I Shares | | | | | | | | | | | | | | | | | | | | | | | | | | | | | | | | | | | | | | | | | | | | | | | | | | | | | | | | | | | | |
2011(b) | | $ | 13.94 | | | | 0.20 | | | | (0.23 | ) | | | (0.03 | ) | | | (0.24 | ) | | | — | | | | (0.24 | ) | | $ | 13.67 | | | | 2.89 | (d) | | | 0.59 | (d) | | | 0.58 | (d) | | | 0.59 | (d) | | | (0.25 | ) | | | 7.33 | | | $ | 50,656 | |
2010 | | $ | 13.78 | | | | 0.42 | | | | 0.82 | | | | 1.24 | | | | (0.46 | ) | | | (0.62 | ) | | | (1.08 | ) | | $ | 13.94 | | | | 3.09 | | | | 0.60 | | | | 0.59 | | | | 0.60 | | | | 5.03 | | | | 16.01 | | | $ | 55,398 | |
2009 | | $ | 13.26 | | | | 0.45 | | | | 0.53 | | | | 0.98 | | | | (0.46 | ) | | | — | | | | (0.46 | ) | | $ | 13.78 | | | | 3.31 | | | | 0.66 | | | | 0.66 | | | | 0.67 | | | | 7.51 | | | | 39.42 | | | $ | 24,887 | |
2008 | | $ | 12.97 | | | | 0.49 | | | | 0.29 | | | | 0.78 | | | | (0.49 | ) | | | — | | | | (0.49 | ) | | $ | 13.26 | | | | 3.68 | | | | 0.66 | | | | 0.64 | | | | 0.67 | | | | 6.06 | | | | 19.61 | | | $ | 21,275 | |
2007 | | $ | 12.75 | | | | 0.44 | | | | 0.23 | | | | 0.67 | | | | (0.45 | ) | | | — | | | | (0.45 | ) | | $ | 12.97 | | | | 3.45 | | | | 0.68 | | | | 0.67 | | | | 0.74 | | | | 5.35 | | | | 43.35 | | | $ | 15,963 | |
2006 | | $ | 12.76 | | | | 0.41 | | | | (0.01 | ) | | | 0.40 | | | | (0.41 | ) | | | — | | | | (0.41 | ) | | $ | 12.75 | | | | 3.22 | | | | 0.68 | | | | 0.65 | | | | 0.78 | | | | 3.19 | | | | 7.47 | | | $ | 14,900 | |
Class R3 Shares | | | | | | | | | | | | | | | | | | | | | | | | | | | | | | | | | | | | | | | | | | | | | | | | | | | | | | | | | | | | |
2011(b) | | $ | 13.95 | | | | 0.17 | | | | (0.23 | ) | | | (0.06 | ) | | | (0.21 | ) | | | — | | | | (0.21 | ) | | $ | 13.68 | | | | 2.48 | (d) | | | 1.00 | (d) | | | 0.99 | (d) | | | 1.30 | (d) | | | (0.45 | ) | | | 7.33 | | | $ | 12,233 | |
2010 | | $ | 13.79 | | | | 0.38 | | | | 0.80 | | | | 1.18 | | | | (0.40 | ) | | | (0.62 | ) | | | (1.02 | ) | | $ | 13.95 | | | | 2.73 | | | | 0.99 | | | | 0.99 | | | | 1.31 | | | | 4.62 | | | | 16.01 | | | $ | 12,631 | |
2009 | | $ | 13.27 | | | | 0.41 | | | | 0.53 | | | | 0.94 | | | | (0.42 | ) | | | — | | | | (0.42 | ) | | $ | 13.79 | | | | 3.00 | | | | 1.00 | | | | 0.99 | | | | 1.40 | | | | 7.15 | | | | 39.42 | | | $ | 7,625 | |
2008 | | $ | 12.97 | | | | 0.44 | | | | 0.30 | | | | 0.74 | | | | (0.44 | ) | | | — | | | | (0.44 | ) | | $ | 13.27 | | | | 3.33 | | | | 1.01 | | | | 0.99 | | | | 1.47 | | | | 5.77 | | | | 19.61 | | | $ | 6,367 | |
2007 | | $ | 12.76 | | | | 0.40 | | | | 0.22 | | | | 0.62 | | | | (0.41 | ) | | | — | | | | (0.41 | ) | | $ | 12.97 | | | | 3.15 | | | | 1.00 | | | | 0.99 | | | | 1.64 | | | | 4.93 | | | | 43.35 | | | $ | 4,398 | |
2006 | | $ | 12.77 | | | | 0.37 | | | | (0.01 | ) | | | 0.36 | | | | (0.37 | ) | | | — | | | | (0.37 | ) | | $ | 12.76 | | | | 2.90 | | | | 1.00 | | | | 0.97 | | | | 1.55 | | | | 2.86 | | | | 7.47 | | | $ | 3,591 | |
| (a) | Not annualized for periods less than one year. |
| (b) | Unaudited Six Month Period Ended March 31. |
| (c) | Sales loads are not reflected in computing total return. |
| + | Based on weighted average shares outstanding. |
See notes to financial statements.
| | |
| 44 Certified Semi-Annual Report | | Certified Semi-Annual Report 45 |
| | |
| FINANCIAL HIGHLIGHTS | | |
| |
| Thornburg Limited Term Income Fund | | |
| | | | | | | | | | | | | | | | | | | | | | | | | | | | | | | | | | | | | | | | | | | | | | | | | | | | | | | | | | | | |
| | | PER SHARE PERFORMANCE (for a share outstanding throughout the period)+ | | | RATIOS TO AVERAGE NET ASSETS | | | SUPPLEMENTAL DATA | |
Unless
Otherwise
Noted, Periods
are Fiscal Years
Ended Sept. 30, | | Net
Asset
Value
Beginning
of Period | | | Net
Investment
Income
(Loss) | | | Net
Realized
& Unrealized
Gain (Loss)
on
Investments | | | Total
from
Investment
Operations | | | Dividends
from Net
Investment
Income | | | Dividends
from Net
Realized
Gains | | | Total
Dividends | | | Net
Asset
Value
End of
Period | | | Net
Investment
Income
(Loss) (%) | | | Expenses,
After
Expense
Reductions
(%) | | | Expenses,
After
Expense
Reductions
and Net of
Custody
Credits
(%) | | | Expenses,
Before
Expense
Reductions
(%) | | | Total
Return
(%)(a) | | | Portfolio
Turnover
Rate (%) | | | Net Assets
at End
of Period
(Thousands) | |
Class A Shares | | | | | | | | | | | | | | | | | | | | | | | | | | | | | | | | | | | | | | | | | | | | | | | | | | | | | | | | | | | | |
2011(b)(c) | | $ | 13.41 | | | | 0.24 | | | | (0.21 | ) | | | 0.03 | | | | (0.24 | ) | | | (0.04 | ) | | | (0.28 | ) | | $ | 13.16 | | | | 3.60 | (d) | | | 0.97 | (d) | | | 0.97 | (d) | | | 0.97 | (d) | | | 0.25 | | | | 16.99 | | | $ | 454,631 | |
2010(c) | | $ | 12.81 | | | | 0.51 | | | | 0.61 | | | | 1.12 | | | | (0.52 | ) | | | — | | | | (0.52 | ) | | $ | 13.41 | | | | 3.88 | | | | 0.99 | | | | 0.99 | | | | 1.01 | | | | 8.91 | | | | 16.35 | | | $ | 459,531 | |
2009(c) | | $ | 11.92 | | | | 0.60 | | | | 0.90 | | | | 1.50 | | | | (0.61 | ) | | | — | | | | (0.61 | ) | | $ | 12.81 | | | | 5.04 | | | | 0.99 | | | | 0.99 | | | | 1.04 | | | | 13.05 | | | | 45.31 | | | $ | 243,141 | |
2008(c) | | $ | 12.40 | | | | 0.55 | | | | (0.48 | ) | | | 0.07 | | | | (0.55 | ) | | | — | | | | (0.55 | ) | | $ | 11.92 | | | | 4.38 | | | | 0.99 | | | | 0.99 | | | | 1.03 | | | | 0.44 | | | | 42.84 | | | $ | 134,372 | |
2007(c) | | $ | 12.37 | | | | 0.50 | | | | 0.04 | | | | 0.54 | | | | (0.51 | ) | | | — | | | | (0.51 | ) | | $ | 12.40 | | | | 4.07 | | | | 1.00 | | | | 0.99 | | | | 1.08 | | | | 4.43 | | | | 41.55 | | | $ | 155,021 | |
2006(c) | | $ | 12.51 | | | | 0.50 | | | | (0.14 | ) | | | 0.36 | | | | (0.50 | ) | | | — | | | | (0.50 | ) | | $ | 12.37 | | | | 4.05 | | | | 1.00 | | | | 0.99 | | | | 1.09 | | | | 2.96 | | | | 6.77 | | | $ | 190,670 | |
Class C Shares | | | | | | | | | | | | | | | | | | | | | | | | | | | | | | | | | | | | | | | | | | | | | | | | | | | | | | | | | | | | |
2011(b) | | $ | 13.39 | | | | 0.22 | | | | (0.20 | ) | | | 0.02 | | | | (0.23 | ) | | | (0.04 | ) | | | (0.27 | ) | | $ | 13.14 | | | | 3.35 | (d) | | | 1.22 | (d) | | | 1.22 | (d) | | | 1.23 | (d) | | | 0.12 | | | | 16.99 | | | $ | 288,928 | |
2010 | | $ | 12.79 | | | | 0.47 | | | | 0.61 | | | | 1.08 | | | | (0.48 | ) | | | — | | | | (0.48 | ) | | $ | 13.39 | | | | 3.62 | | | | 1.24 | | | | 1.24 | | | | 1.77 | | | | 8.64 | | | | 16.35 | | | $ | 257,869 | |
2009 | | $ | 11.90 | | | | 0.57 | | | | 0.90 | | | | 1.47 | | | | (0.58 | ) | | | — | | | | (0.58 | ) | | $ | 12.79 | | | | 4.79 | | | | 1.24 | | | | 1.24 | | | | 1.82 | | | | 12.78 | | | | 45.31 | | | $ | 117,950 | |
2008 | | $ | 12.38 | | | | 0.52 | | | | (0.49 | ) | | | 0.03 | | | | (0.51 | ) | | | — | | | | (0.51 | ) | | $ | 11.90 | | | | 4.15 | | | | 1.24 | | | | 1.24 | | | | 1.83 | | | | 0.18 | | | | 42.84 | | | $ | 57,114 | |
2007 | | $ | 12.35 | | | | 0.47 | | | | 0.03 | | | | 0.50 | | | | (0.47 | ) | | | — | | | | (0.47 | ) | | $ | 12.38 | | | | 3.82 | | | | 1.24 | | | | 1.24 | | | | 1.89 | | | | 4.17 | | | | 41.55 | | | $ | 40,769 | |
2006 | | $ | 12.49 | | | | 0.47 | | | | (0.14 | ) | | | 0.33 | | | | (0.47 | ) | | | — | | | | (0.47 | ) | | $ | 12.35 | | | | 3.79 | | | | 1.25 | | | | 1.24 | | | | 1.87 | | | | 2.71 | | | | 6.77 | | | $ | 44,361 | |
Class I Shares | | | | | | | | | | | | | | | | | | | | | | | | | | | | | | | | | | | | | | | | | | | | | | | | | | | | | | | | | | | | |
2011(b) | | $ | 13.41 | | | | 0.26 | | | | (0.21 | ) | | | 0.05 | | | | (0.26 | ) | | | (0.04 | ) | | | (0.30 | ) | | $ | 13.16 | | | | 3.95 | (d) | | | 0.62 | (d) | | | 0.62 | (d) | | | 0.62 | (d) | | | 0.42 | | | | 16.99 | | | $ | 324,199 | |
2010 | | $ | 12.82 | | | | 0.55 | | | | 0.60 | | | | 1.15 | | | | (0.56 | ) | | | — | | | | (0.56 | ) | | $ | 13.41 | | | | 4.22 | | | | 0.64 | | | | 0.64 | | | | 0.64 | | | | 9.20 | | | | 16.35 | | | $ | 295,433 | |
2009 | | $ | 11.92 | | | | 0.64 | | | | 0.90 | | | | 1.54 | | | | (0.64 | ) | | | — | | | | (0.64 | ) | | $ | 12.82 | | | | 5.39 | | | | 0.66 | | | | 0.66 | | | | 0.68 | | | | 13.50 | | | | 45.31 | | | $ | 146,099 | |
2008 | | $ | 12.40 | | | | 0.59 | | | | (0.48 | ) | | | 0.11 | | | | (0.59 | ) | | | — | | | | (0.59 | ) | | $ | 11.92 | | | | 4.72 | | | | 0.66 | | | | 0.66 | | | | 0.67 | | | | 0.77 | | | | 42.84 | | | $ | 118,222 | |
2007 | | $ | 12.37 | | | | 0.54 | | | | 0.04 | | | | 0.58 | | | | (0.55 | ) | | | — | | | | (0.55 | ) | | $ | 12.40 | | | | 4.39 | | | | 0.67 | | | | 0.67 | | | | 0.72 | | | | 4.76 | | | | 41.55 | | | $ | 103,530 | |
2006 | | $ | 12.51 | | | | 0.54 | | | | (0.14 | ) | | | 0.40 | | | | (0.54 | ) | | | — | | | | (0.54 | ) | | $ | 12.37 | | | | 4.38 | | | | 0.68 | | | | 0.67 | | | | 0.72 | | | | 3.30 | | | | 6.77 | | | $ | 111,535 | |
Class R3 Shares | | | | | | | | | | | | | | | | | | | | | | | | | | | | | | | | | | | | | | | | | | | | | | | | | | | | | | | | | | | | |
2011(b) | | $ | 13.42 | | | | 0.24 | | | | (0.21 | ) | | | 0.03 | | | | (0.24 | ) | | | (0.04 | ) | | | (0.28 | ) | | $ | 13.17 | | | | 3.58 | (d) | | | 0.99 | (d) | | | 0.99 | (d) | | | 1.30 | (d) | | | 0.24 | | | | 16.99 | | | $ | 22,710 | |
2010 | | $ | 12.82 | | | | 0.51 | | | | 0.61 | | | | 1.12 | | | | (0.52 | ) | | | — | | | | (0.52 | ) | | $ | 13.42 | | | | 3.89 | | | | 0.99 | | | | 0.99 | | | | 1.35 | | | | 8.90 | | | | 16.35 | | | $ | 18,767 | |
2009 | | $ | 11.92 | | | | 0.61 | | | | 0.90 | | | | 1.51 | | | | (0.61 | ) | | | — | | | | (0.61 | ) | | $ | 12.82 | | | | 5.08 | | | | 0.99 | | | | 0.99 | | | | 1.48 | | | | 13.13 | | | | 45.31 | | | $ | 10,091 | |
2008 | | $ | 12.40 | | | | 0.55 | | | | (0.48 | ) | | | 0.07 | | | | (0.55 | ) | | | — | | | | (0.55 | ) | | $ | 11.92 | | | | 4.42 | | | | 0.99 | | | | 0.99 | | | | 1.52 | | | | 0.44 | | | | 42.84 | | | $ | 9,712 | |
2007 | | $ | 12.38 | | | | 0.50 | | | | 0.03 | | | | 0.53 | | | | (0.51 | ) | | | — | | | | (0.51 | ) | | $ | 12.40 | | | | 4.09 | | | | 0.99 | | | | 0.99 | | | | 1.71 | | | | 4.34 | | | | 41.55 | | | $ | 6,191 | |
2006 | | $ | 12.52 | | | | 0.50 | | | | (0.14 | ) | | | 0.36 | | | | (0.50 | ) | | | — | | | | (0.50 | ) | | $ | 12.38 | | | | 4.07 | | | | 1.00 | | | | 0.99 | | | | 1.79 | | | | 2.97 | | | | 6.77 | | | $ | 3,331 | |
| (a) | Not annualized for periods less than one year. |
| (b) | Unaudited Six Month Period Ended March 31. |
| (c) | Sales loads are not reflected in computing total return. |
| + | Based on weighted average shares outstanding. |
See notes to financial statements.
| | |
| 46 Certified Semi-Annual Report | | Certified Semi-Annual Report 47 |
| | |
| EXPENSE EXAMPLE | | |
| |
| Thornburg Limited Term Income Funds | | March 31, 2011 (Unaudited) |
As a shareholder of the Funds, you incur two types of costs:
| | (1) | transaction costs, including |
(a) sales charges (loads) on purchase payments, for Class A shares;
(b) a deferred sales charge on redemptions of any part or all of a purchase of $1 million of Class A shares within 12 months of purchase;
(c) a deferred sales charge on redemptions of Class B shares within eight years of purchase;
(d) a deferred sales charge on redemptions of Class C shares within 12 months of purchase;
| | (2) | ongoing costs, including management fees; distribution and/ or service (12b-1) fees; and other Fund expenses. |
This example is intended to help you understand your ongoing costs (in dollars) of investing in the Funds and to compare these costs with the ongoing costs of investing in other mutual funds.
The example is based on a $1,000 investment beginning on October 1, 2010, and held until March 31, 2011.
ACTUAL EXPENSES
For each class of shares, the first line of the table at right provides information about actual account values and actual expenses. You may use the information in this line, together with the amount you invested, to estimate the expenses that you paid over the period. Simply divide your account value by $1,000 (for example, an $8,600 account value divided by $1,000 = 8.6), then multiply the result by the number in the first line for your class of shares under the heading entitled “Expenses Paid During Period” to estimate the expenses you paid on your account during this period.
HYPOTHETICAL EXAMPLE FOR COMPARISON PURPOSES
For each class of shares, the second line of the table at right provides information about hypothetical account values and hypothetical expenses based on the Funds’ actual expense ratio and an assumed rate of return of 5% per year before expenses, which is not the Funds’ actual return. The hypothetical account values and expenses may not be used to estimate the actual ending account balance or expenses you paid for the period. You may use this information to compare the ongoing costs of investing in the Funds and other funds. To do so, compare this 5% hypothetical example with the 5% hypothetical examples that appear in the shareholder reports of the other funds.
Please note that the expenses shown in the table are meant to highlight your ongoing costs only and do not reflect any transactional costs, such as sales charges (loads), redemption fees, or exchange fees. Therefore, the second line of the table for each class of shares is useful in comparing ongoing costs only, and will not help you determine the relative total costs of owning different funds. In addition, if these transactional costs were included, your costs would have been higher.
| | | | | | | | | | | | |
| | | Beginning
Account Value
10/1/10 | | | Ending
Account Value
3/31/11 | | | Expenses Paid
During Period†
10/1/10–3/31/11 | |
| Limited Term U.S. Government Fund | |
Class A Shares | | | | | | | | | | | | |
Actual | | $ | 1,000.00 | | | $ | 996.00 | | | $ | 4.42 | |
Hypothetical* | | $ | 1,000.00 | | | $ | 1,020.50 | | | $ | 4.48 | |
Class B Shares | | | | | | | | | | | | |
Actual | | $ | 1,000.00 | | | $ | 989.70 | | | $ | 10.65 | |
Hypothetical* | | $ | 1,000.00 | | | $ | 1,014.23 | | | $ | 10.78 | |
Class C Shares | | | | | | | | | | | | |
Actual | | $ | 1,000.00 | | | $ | 994.80 | | | $ | 5.78 | |
Hypothetical* | | $ | 1,000.00 | | | $ | 1,019.14 | | | $ | 5.85 | |
Class I Shares | | | | | | | | | | | | |
Actual | | $ | 1,000.00 | | | $ | 997.50 | | | $ | 2.87 | |
Hypothetical* | | $ | 1,000.00 | | | $ | 1,022.06 | | | $ | 2.90 | |
Class R3 Shares | | | | | | | | | | | | |
Actual | | $ | 1,000.00 | | | $ | 995.50 | | | $ | 4.92 | |
Hypothetical* | | $ | 1,000.00 | | | $ | 1,020.00 | | | $ | 4.98 | |
|
| Limited Term Income Fund | |
Class A Shares | | | | | | | | | | | | |
Actual | | $ | 1,000.00 | | | $ | 1,002.50 | | | $ | 4.83 | |
Hypothetical* | | $ | 1,000.00 | | | $ | 1,020.11 | | | $ | 4.87 | |
Class C Shares | | | | | | | | | | | | |
Actual | | $ | 1,000.00 | | | $ | 1,001.20 | | | $ | 6.06 | |
Hypothetical* | | $ | 1,000.00 | | | $ | 1,018.87 | | | $ | 6.12 | |
Class I Shares | | | | | | | | | | | | |
Actual | | $ | 1,000.00 | | | $ | 1,004.20 | | | $ | 3.11 | |
Hypothetical* | | $ | 1,000.00 | | | $ | 1,021.82 | | | $ | 3.14 | |
Class R3 Shares | | | | | | | | | | | | |
Actual | | $ | 1,000.00 | | | $ | 1,002.40 | | | $ | 4.94 | |
Hypothetical* | | $ | 1,000.00 | | | $ | 1,020.00 | | | $ | 4.99 | |
| † | Thornburg Limited Term U.S. Government Fund expenses are equal to the annualized expense ratio for each class (A: 0.89%; B: 2.15%; C: 1.16%; I: 0.58%; R3: 0.99%) multiplied by the average account value over the period, multiplied by 182/365 to reflect the one-half year period. |
| † | Thornburg Limited Term Income Fund expenses are equal to the annualized expense ratio for each class (A: 0.97%; C: 1.22%; I: 0.62%; R3: 0.99%) multiplied by the average account value over the period, multiplied by 182/365 to reflect the one-half year period. |
| * | Hypothetical assumes a rate of return of 5% per year before expenses. |
48 Certified Semi-Annual Report
OTHER INFORMATION
| | |
| |
| Thornburg Limited Term Income Funds | | March 31, 2011 (Unaudited) |
PORTFOLIO PROXY VOTING
Policies and Procedures:
The Trust has delegated to Thornburg Investment Management, Inc. (the “Advisor”) voting decisions respecting proxies for each of the Fund’s voting securities. The Advisor makes voting decisions in accordance with its Proxy Voting Policy and Procedures. A description of the Policy and Procedures is available (i) without charge, upon request, by calling the Advisor toll-free at 1-800-847-0200, (ii) on the Thornburg website at www.thornburg.com, and (iii) on the Securities and Exchange Commission’s website at www.sec.gov.
Information regarding how proxies were voted is available on or before August 31 of each year for the twelve months ending the preceding June 30. This information is available (i) without charge, upon request by calling the Advisor toll-free at 1-800-847-0200, (ii) on the Thornburg website at www.thornburg.com, and (iii) on the Securities and Exchange Commission’s website at www.sec.gov.
AVAILABILITY OF QUARTERLY PORTFOLIO SCHEDULE
The Funds file with the Securities and Exchange Commission schedules of their portfolio holdings on Form N-Q for the first and third quarters of each fiscal year. The Funds’ Forms N-Q are available on the Commission’s website at www.sec.gov, or may be reviewed and copied at the Commission’s Public Reference Room in Washington, D.C. Information on the operation of the Public Reference Room may be obtained by calling 1-800-SEC-0330. The Funds also make this information available on their website at www.thornburg.com/download or upon request by calling 1-800-847-0200.
Certified Semi-Annual Report 49
Trustees’ Statement to Shareholders
Not part of the Certified Semi-Annual Report
February 8, 2005, as readopted September 13, 2010
The Trustees are concerned that ongoing commentaries and opinions reported in the media may confuse investors in general as to the supervisory duties of trustees of mutual funds and, in particular, leave Thornburg Investment Trust shareholders uncertain regarding how we discharge our responsibilities in supervising the Funds’ investment advisor and in reviewing the advisor’s contract for renewal. We decided to spell out clearly three principal guidelines that we follow in supervising the Trust’s investment advisor on your behalf.
We begin with the premise that each shareholder selected his or her Fund because its investments are managed by the investment advisor identified in the prospectus and in accordance with the objective and policies described in the prospectus. We realize, as each of you do, that if you believe that your Fund’s stated objective and policies no longer serve your personal investment goals, you can sell your shares and leave the Fund.
Therefore, we believe that our primary supervisory task – our principal obligation to you – is to assess the nature and quality of the advisor’s services, and to confirm that the advisor actively and competently pursues the Fund’s objective, in accordance with the policies set out in the prospectus. To do this, we meet regularly with management to review your Fund’s portfolio and to discuss the advisor’s specific actions and judgments in pursuing the Fund’s objective. We do not substitute our own judgment for the advisor’s decisions in selecting investments; the advisor is paid to exercise its informed judgment on investment decisions, and we seek to confirm, in reviewing the advisor’s performance, that the advisor is doing just that.
Second, while we are conscious of costs and the effect that costs have on shareholders’ returns, we do not seek the lowest fees or expense ratio as our sole or primary objective. We try to make sure that your Fund’s fees and costs are reasonable in relationship to the services rendered and that they are generally in line with those charged by other expert investment advisors, consistent with our belief that the Fund’s investors searched for and expect that expertise and attention and have decided to pay a reasonable price for it. We do not put the management contract “out to bid” as a matter of course, and we would not do so unless we had concluded that the advisor materially had failed to pursue the Fund’s objectives in accordance with its policies, or for other equally important reasons. We believe that any other approach would be inconsistent with your interests and contrary to your expectations when you bought shares of the Fund in the first place.
Finally, because we believe that most Thornburg Fund shareholders have invested with a long-term perspective, we try not to focus too much on the fashions of the moment and on short-term performance. The market will not favor any specific investment objective or set of policies at all times and under all economic circumstances. A fund will experience periods of both high and low returns relative to other funds and other investments. Even if one of our Funds is not favored by the market at a particular time, we believe that the advisor is nonetheless obliged to remain true to the Fund’s objective and policies, and we watch to see that it does so.
50 This page is not part of the Semi-Annual Report.
Retirement and Education Accounts
Thornburg Investment Management offers retirement and education savings accounts that can help you meet a variety of planning challenges. For account applications or further information on any of the accounts below, please call 1-800-847-0200 or go to www.thornburg.com/ira. Your financial advisor can help you determine which plan is right for you.
Individual Retirement Accounts
Individual Retirement Accounts (IRAs) provide a tax-advantaged means to save money for the future. For a detailed outline of the difference between retirement accounts, see www.thornburg.com/ira. Rollovers are available. Call 1-800-847-0200 for more information.
Traditional IRAs – Contributions to Traditional IRAs are tax deductible for eligible individuals, and withdrawals are taxed as additional ordinary income. You may contribute to an IRA if you receive compensation and are under 70 1/2, even if you are covered by an employer retirement plan. Deductible contributions are subject to certain qualifications. Please consult your tax advisor.
Roth IRAs – Under a Roth IRA, there is no tax deduction for contributions, but there is no income tax on qualified withdrawals. For a more detailed comparison of Traditional and Roth IRAs, please see our web site at www.thornburg.com/ira.
SEP IRAs – Simplified Employee Pension (SEP) IRAs are established by employers. The employer is allowed a tax deduction for contributions made to the SEP Plan and makes contributions to each eligible employee’s SEP IRA on a discretionary basis.
SIMPLE IRAs – Savings Incentive Match Plan for Employees of Small Employers (SIMPLE) is designed to give small business owners a simplified method to establish and contribute to a retirement plan for employees. The employer is allowed a tax deduction for contributions and makes either matching or non-elective contributions to each eligible employee’s SIMPLE IRA. Employees may make salary deferral contributions.
Coverdell Education Savings Account
These savings accounts are designed to provide a way to save money for higher education expenses. In an Education Savings Account, earnings and interest grow tax-free, and qualified withdrawals used to pay for eligible higher-education expenses are tax- and penalty-free.
Funds Available
The following funds are available in the accounts listed above:
| | • | | Thornburg International Value Fund |
| | • | | Thornburg Core Growth Fund |
| | • | | Thornburg Investment Income Builder Fund |
| | • | | Thornburg Global Opportunities Fund |
| | • | | Thornburg International Growth Fund |
| | • | | Thornburg Developing World Fund |
| | • | | Thornburg Limited Term U.S. Government Fund |
| | • | | Thornburg Limited Term Income Fund |
| | • | | Thornburg Strategic Income Fund |
This page is not part of the Semi-Annual Report. 51

Thornburg Equity Funds
Thornburg’s equity research uses a fundamental and comprehensive analytical approach. Thornburg equity funds focus on a limited number of securities so that each holding can impact performance. The equity team searches for firms believed to have a promising future and seeks to buy shares of those companies at a discount to their intrinsic value.
| | • | | Thornburg International Value Fund |
| | • | | Thornburg Core Growth Fund |
| | • | | Thornburg Investment Income Builder Fund |
| | • | | Thornburg Global Opportunities Fund |
| | • | | Thornburg International Growth Fund |
| | • | | Thornburg Developing World Fund |
Thornburg Bond Funds
Thornburg Investment Management applies a disciplined philosophy to fixed-income management. Since the launch of our first fixed-income fund over 25 years ago, we have been conducting fundamental, bottom-up research in an effort to identify bonds which we believe provide the best return for a given level of risk. We are very organic in our approach, avoiding leverage or complex strategies which could backfire in periods of market uncertainty.
| | • | | Thornburg Limited Term Municipal Fund |
| | • | | Thornburg Intermediate Municipal Fund |
| | • | | Thornburg California Limited Term Municipal Fund |
| | • | | Thornburg New Mexico Intermediate Municipal Fund |
| | • | | Thornburg New York Intermediate Municipal Fund |
| | • | | Thornburg Strategic Municipal Income Fund |
| | • | | Thornburg Limited Term U.S. Government Fund |
| | • | | Thornburg Limited Term Income Fund |
| | • | | Thornburg Strategic Income Fund |
Before investing, carefully consider the Fund’s investment goals, risks, charges, and expenses. For a prospectus containing this and other information, contact your financial advisor or visit thornburg.com. Read it carefully before investing.
For additional information, please visit www.thornburg.com
Thornburg Investment Management, Inc. 2300 North Ridgetop Road, Santa Fe, NM 87506
This page is not part of the Semi-Annual Report. 53
This page intentionally left blank.
54 This page is not part of the Semi-Annual Report.
This page intentionally left blank.
This page is not part of the Semi-Annual Report. 55
| | | | | | |
 | | Waste not, | |  |
| | Wait not | |
| | | | Get instant access to your shareholder reports. |
| | |
| | This Semi-Annual Report is submitted for the general information of shareholders of the Fund. It is not authorized for distribution to prospective investors in the Fund unless preceded or accompanied by an effective prospectus. | | By switching from your postal mailbox to your email inbox, you reduce paper clutter, improve record keeping access, and help conserve our natural resources. |
| | |

| | Investment Advisor: Thornburg Investment Management® 800.847.0200 Distributor: Thornburg Securities Corporation® 800.847.0200 TH174 | | Go to www.thornburg.com/edelivery and sign up to receive your shareholder reports, prospectuses, and proxy statements electronically. You invest in the future, without spending a dime. |
| | |
| | | | |

Important Information
The information presented on the following pages was current as of March 31, 2011. The managers’ views, portfolio holdings, and sector and country diversification are provided for the general information of the Fund’s shareholders; they are historical and subject to change. This material should not be deemed a recommendation to buy or sell any of the securities mentioned.
Investments in the Fund carry risks, including possible loss of principal. Bond funds have the same interest rate, inflation, and credit risks that are associated with the underlying bonds. The principal value of bonds will fluctuate relative to changes in interest rates, decreasing when interest rates rise. Unlike bonds, bond funds have ongoing fees and expenses. Funds invested in mortgage-backed securities may bear additional risk. Investments in lower-rated and unrated bonds may be more sensitive to default, downgrades, and market volatility; these investments may also be less liquid than higher-rated bonds. Investments in structured finance arrangements and other types of derivatives are subject to the risks associated with the securities or other assets underlying the pool of securities including illiquidity and difficulty in valuation. Investments in equity securities are subject to additional risks, such as greater market fluctuations. Special risks may be associated with investments outside the United States, especially in emerging markets, including currency fluctuations, illiquidity and volatility. Please see the Fund’s Prospectus for a discussion of the risks associated with an investment in the Fund. Investments in the Fund are not FDIC insured, nor are they deposits of or guaranteed by a bank or any other entity. There is no guarantee that the Fund will meet its investment objectives.
Performance data given at net asset value (NAV) does not take into account the applicable sales charges. If the sales charges had been included, the performance would have been lower.
Class I shares may not be available to all investors. Minimum investments for Class I shares may be higher than those for other classes.
| | | | |
Share Class | | NASDAQ Symbol | | Cusip |
Class A | | TSIAX | | 885-215-228 |
Class C | | TSICX | | 885-215-210 |
Class I | | TSIIX | | 885-215-194 |
Glossary
Blended Index – The Blended Index is composed of 80% Barclays Capital Aggregate Bond Index and 20% MSCI World Index. The Barclays Capital Aggregate Bond Index is composed of approximately 8,000 publicly traded bonds including U.S. government, mortgage-backed, corporate and Yankee bonds. The index is weighted by the market value of the bonds included in the index. The MSCI World Index is an unmanaged market-weighted index that consists of securities traded in 24 of the world’s most developed countries. Securities are listed on exchanges in the U.S., Europe, Canada, Australia, New Zealand, and the Far East. The index is calculated with net dividends reinvested, in U.S. dollars.
Barclays Capital U.S. Corporate High Yield Index – Index covering the USD-denominated, non-investment grade, fixed-rate, taxable corporate bond market. Securities are classified as high-yield if the middle rating of Moody’s, Fitch, and S&P is Ba1/BB+ or below.
Barclays Capital U.S. Universal Index – Represents the union of the U.S. Aggregate Index, U.S. Corporate High-Yield Index, Investment-Grade 144A Index, Eurodollar Index, U.S. Emerging Markets Index, and the non-ERISA eligible portion of the CMBS Index. The index covers USD-denominated, taxable bonds that are rated either investment-grade or below investment-grade.
Unless otherwise noted, index returns reflect the reinvestment of income dividends and capital gains, if any, but do not reflect fees, brokerage commissions or other expenses of investing. Investors may not make direct investments into any index. The performance of any index is not indicative of the performance of any particular investment.
Bond Credit Ratings – A bond credit rating assesses the financial ability of a debt issuer to make timely payments of principal and interest. Ratings of AAA (the highest), AA, A, and BBB are investment-grade quality. Ratings of BB, B, CCC, CC, C, and D (the lowest) are considered below investment grade, speculative grade, or junk bonds. Unless otherwise noted, the ratings listed are from Bloomberg Market Data and are a combination of ratings from Standard and Poor’s, Moody’s Investors Service, and Fitch Ratings.
Coupon – The interest rate stated on a bond when it’s issued. The coupon is typically paid semi-annually.
Effective Duration – A bond’s sensitivity to interest rates, incorporating the embedded option features, such as call provisions. Bonds with longer durations experience greater price volatility than bonds with shorter durations.
Leverage – The amount of debt used to finance a firm’s assets. A firm with significantly more debt than equity is considered to be highly leveraged.
Median Market Capitalization – Market capitalization (market cap) is the total value of a company’s stock, calculated by multiplying the number of outstanding common shares by the current share price. The company whose market cap is in the middle of the portfolio is the median market cap. Half the companies in the portfolio have values greater than the median and half have values that are less.
Price to Earnings Ratio (P/E) – A valuation ratio equaling a company’s market value per share divided by earnings per share.
QE2 or Quantitative Easing 2 – The second round of the Federal Reserve’s monetary policy used to stimulate the U.S. economy following the recession that began in 2007/08. QE2 was initiated in the fourth quarter of 2010 in order to jump-start the sluggish economic recovery.
U.S. Treasury Securities – U.S. Treasury securities, such as bills, notes and bonds, are negotiable debt obligations of the U.S. government. These debt obligations are backed by the “full faith and credit” of the government and issued at various schedules and maturities. Income from Treasury securities is exempt from state and local, but not federal income taxes.
This page is not part of the Semi-Annual Report. 3
Portfolio Overview
Thornburg Strategic Income Fund

Many investors are in need of significant income and typically turn to “high yield” funds to find notable dividends. The simple yield statistic is potentially quite misleading. At Thornburg Investment Management, we believe we have a better income-generation mousetrap in the form of our Strategic Income Fund, which has a goal of high but sustainable income, without resorting solely to the below investment grade portion of the taxable fixed income universe.
The idea behind this fund is that “high yield,” in the context of a fund type, is not an investment goal but an asset type. Most taxable high-yield funds are solely focused on below investment grade corporate bonds. This focus ultimately makes these funds less flexible and correspondingly less capable of succeeding in multiple investment climates. Below investment grade corporate bonds represent less than 2% of the total taxable investment universe. There is no reason to ignore huge chunks of the market merely because they
IMPORTANT
PERFORMANCE INFORMATION
Performance data shown represents past performance and is no guarantee of future results. Investment return and principal value will fluctuate so shares, when redeemed, may be worth more or less than their original cost. Current performance may be lower or higher than quoted. For performance current to the most recent month end, visit thornburg. com or call 800-847-0200.
The maximum sales charge for Class A shares is 4.50%. The total annual fund operating expense of Class A shares is 1.35%, as disclosed in the most recent Prospectus. Thornburg Investment Management and Thornburg Securities Corporation have contractually agreed to waive fees and reimburse expenses through at least February 1, 2012, so that actual expenses, for Class A shares, do not exceed 1.25%.
QUARTERLY DIVIDEND HISTORY
Class A
| | | | | | | | | | | | | | | | | | | | |
Year | | Q1 | | | Q2 | | | Q3 | | | Q4 | | | Total | |
2008 | | | 15.2 | ¢ | | | 18.3 | ¢ | | | 19.0 | ¢ | | | 20.5 | ¢ | | | 73.0 | ¢ |
2009 | | | 17.0 | ¢ | | | 19.0 | ¢ | | | 20.8 | ¢ | | | 22.0 | ¢ | | | 78.8 | ¢ |
2010 | | | 18.8 | ¢ | | | 20.5 | ¢ | | | 19.8 | ¢ | | | 22.0 | ¢ | | | 81.1 | ¢ |
2011 | | | 17.8 | ¢ | | | | | | | | | | | | | | | | |
30-DAY YIELDS, Class A
As of 3/31/11
| | | | |
SEC Yield | | | 4.92 | % |
Annualized Distribution Yield | | | 5.54 | % |
Without fee waivers and expense reimbursements, the 30-day SEC Yield would have been 4.89% and the Annualized Distribution Yield would have been 5.51%.
AVERAGE ANNUAL TOTAL RETURNS
FOR PERIODS ENDED 3/31/11
| | | | | | | | | | | | |
| | | 1 Yr | | | 3 Yrs | | | Since
Inception | |
A Shares (Incep: 12/19/07) | | | | | | | | | | | | |
Without sales charge | | | 12.33 | % | | | 9.34 | % | | | 9.11 | % |
With sales charge | | | 7.25 | % | | | 7.68 | % | | | 7.59 | % |
Barclays U.S. Universal Index (Since 12/19/07) | | | 5.73 | % | | | 5.67 | % | | | 5.82 | % |
Blended Index (Since 12/19/07) | | | 7.07 | % | | | 4.61 | % | | | 4.42 | % |
Blended Index: 80% Barclays Capital Aggregate Bond Index/20% MSCI World Index | | | | | | | | | | | | |
4 This page is not part of the Semi-Annual Report.
do not have a very low credit quality, in fact, quite the opposite. By constantly sifting through the available choices across many sub-asset classes, we are able to generate an interesting income stream from a variety of different sources. We believe this is likely to lead to a more stable fund with a robust yield.
This is the reason that our Strategic Income Fund has a much larger purview than a typical “high yield” fund. Though we are currently focused on corporate bonds, that focus is a result of our belief that corporate balance sheets are currently the most attractive bond investment. Given the choice between government bonds, asset-backed bonds (mortgages, commercial mortgage, auto loans, etc.) and corporate bonds, we’re skewing towards corporates.
The Thornburg Strategic Income Fund even has a small allocation to equity securities. As such, the occasional “bond-like equity,” which typically exhibits little growth but potentially terrific income generation, is attractive. While adding equities to what is primarily a bond fund can add volatility (which we work hard to mitigate), we can find no good reason why we should ignore an asset class that can potentially be another diverse source of income for the Fund. Thornburg Investment Management has always tried to “go where the value is.” It is a mantra of ours across our funds, regardless of the asset classes in which we invest.
KEY PORTFOLIO ATTRIBUTES
As of 3/31/11
| | | | | | | | | | |
| Fixed Income Statistics | | | | | | Equity Statistics | | | | |
| Weighted Average Coupon | | | 7.5 | % | | Portfolio P/E (12-mo. trailing) | | | 9.61 | |
| Average Maturity | | | 7.8 yrs | | | Median Market Cap | | $ | 5.5 B | |
| Effective Duration | | | 3.4 yrs | | | Equity & Pref. Equity Holdings | | | 25 | |
| Bond Holdings | | | 216 | | | | | | | |

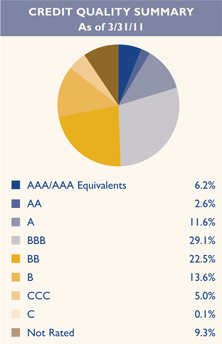
We have used ratings from Moody’s Investors Service. Where Moody’s ratings are not available, we have used Standard & Poor’s ratings.
This page is not part of the Semi-Annual Report. 5

Thornburg Strategic Income Fund
March 31, 2011
This report is certified under the Sarbanes-Oxley Act of 2002, which requires that public companies, including mutual funds, affirm that the information provided in their annual and semiannual shareholder reports fully and fairly represents their financial position.
6 Certified Semi-Annual Report
Letter to Shareholders
| | |

| | April 17, 2011 Dear Fellow Shareholder: We are very pleased to present the Semi-Annual Report for the Thornburg Strategic Income Fund for the six months ended March 31, 2011. The net asset value (NAV) of a Class A share of the Fund increased 3 cents to $12.38 since September 30, 2010. If you were invested for the entire period, you received dividends of 39.8 cents per share. If you reinvested your dividends, you received 40.1 cents per share. Dividends per share were lower for Class C and higher for Class I shares to account for varying class-specific expenses. Please examine the accompanying exhibits for more detailed information. |
| |

| | Putting income and price change together, the Class A shares of the Thornburg Strategic Income Fund produced a total return of 5.93% (at NAV) since September 30, 2010. The Blended Index of 80% of the Barclays Capital Aggregate Bond Index and 20% of the MSCI World Index produced a 2.04% total return and the Barclays Capital U.S. Universal Index produced a negative 0.37% in total return over the same time period. These indices reflect no deduction for fees, expenses, or taxes. |
| | We continue to navigate a volatile environment in both the global fixed income and equity markets. While we believe we are well positioned to continue to pursue the Fund’s primary goal, which is a relatively high income stream, the market price environment has changed quite dramatically from even 12 months ago. As a result, our posture with regard to the marketplace continues to change as detailed below. Though we do not believe that the past year’s returns are available in many markets for 2011, we remain focused on achieving the best income returns possible for a reasonable level of risk. |
| | The various markets in which we participate have continued to appreciate in price and depreciate in available yield. With our mandate of strong and sustainable income, we are finding opportunities notably fewer and further between. In addition, we are increasingly aware of other market participants engaging in risky behavior without regard to the consequence. In fact, with default rates on below investment grade bonds (as one example) approaching all time lows, it isn’t surprising that yields on those same securities are also approaching all time lows. That said, investing is a forward looking activity (or should be). We believe that a large driver of lower default rates is the easy money policy of the Federal Reserve (the Fed), which is pumping large amounts of liquidity (money at zero percent interest rates) into the global economy. The United |
Certified Semi-Annual Report 7
Letter to Shareholders,
Continued
States continues to drag along with a legacy of large consumer debt and growing government debt. Housing prices are falling and the overall level of employment is bumping along the bottom. It is an open question whether the Fed will blink in the face of a renewed slowdown in U.S. economic activity as it did toward the end of 2010. On the other hand, perhaps the U.S. economy is healthy enough to justify the optimism indicated by market prices and will take the “handoff” from the Fed at the end of QE2 and continue to run. We remain cautious.
With regard to market movements, we are pleased to have participated in a good portion of the “risk on” market rally of the past several years. We feel as though our individual asset selection has also been a significant benefit to shareholders. Going forward, the environment for total returns is not as favorable, yet we believe that our asset selection, as well as our portfolio positioning, will continue to allow us to provide our shareholders with a strong and sustainable income stream with a good balance of risk and reward. We have been moving the portfolio to a more liquid position with a shorter duration to be better able to take advantage of interesting opportunities in the future. At the same time, though the Fed’s injection of liquidity has revved all risk markets to very hot levels, we still feel that deep security analysis and a disdain for what investors “have” to do allows us to invest well and appropriately within our mandate. We are unlikely to be the highest-yielding portfolio, but our broad purview certainly comes in handy in finding the best risk-reward in the marketplace. We continue to find what we believe are good stories and interesting risk-reward in various pockets of the marketplace. This has always been the investment style of Thornburg Investment Management, and this Fund is a great beneficiary of that legacy.
As we said in our last letter, we expect consumer spending to remain muted as leverage comes down and savings rates climb. This is healthy in the long term, but a headwind in the short term. Despite recent actions in government and the return of risk-seeking behavior by corporations, we expect leverage in general, for the investment community, corporations, and individuals, to decline. Again, this is healthy in the sense that it makes the “system” more robust, but it also hampers returns relative to the past decade. We believe generally this is to the advantage of shareholders of the Strategic Income Fund.
For these reasons, we believe that remaining invested in income producing assets is crucial. While many market participants are caught between running for the safety of U.S. Treasuries in bad times and swapping out for notably riskier assets in good times, this portfolio should enjoy continued compounding of interesting yields. The Fund could certainly print a higher yield, but we aim for a sustainable income stream. The default environment is favorable, but the speculative fervor of the market makes us wary of a heavier weighting in speculative grade corporates and a downgrading of the credit quality of the portfolio. Instead, selectively investing in good quality assets and keeping an eye on income production is this Fund’s goal. It is a mindset which we believe will serve our shareholders over time and across many different environments.
Thank you very much for investing in our Fund. We believe that the Thornburg Strategic Income Fund continues to be an appropriate investment for those looking for an attractive, sustainable yield from a variety
8 Certified Semi-Annual Report
of instruments. While future performance cannot be guaranteed, Thornburg Investment Management will continue to strive to chart a steady course in what continues to be a volatile marketplace.
Regards,
| | | | |
| | |
 | |  | | |
| | |
| Jason H. Brady,CFA | | George Strickland | | |
| Co-Portfolio Manager | | Co-Portfolio Manager | | |
| Managing Director | | Managing Director | | |
The matters discussed in this report may constitute forward-looking statements made pursuant to the safe harbor provisions of the Securities Litigation Reform Act of 1995. These include any advisor or portfolio manager prediction, assessment, analysis or outlook for individual securities, industries, investment styles, market sectors and/or markets. These statements involve risks and uncertainties. In addition to the general risks described for each fund in its current prospectus, other factors bearing on these reports include the accuracy of the advisor’s or portfolio manager’s forecasts and predictions, the appropriateness of the investment strategies designed by the advisor or portfolio manager, and the ability of the advisor or portfolio manager to implement their strategies efficiently and successfully. Any one or more of these factors, as well as other risks affecting the securities markets generally, could cause the actual results of any fund to differ materially as compared to its benchmarks.
Certified Semi-Annual Report 9
| | |
| SCHEDULE OF INVESTMENTS | | |
| |
| Thornburg Strategic Income Fund | | March 31, 2011 (Unaudited) |
SUMMARY OF INDUSTRY EXPOSURE
As of 3/31/11
| | | | | | | | | | |
| Utilities | | | 10.5 | % | | Health Care Equipment & Services | | | 1.2 | % |
| Energy | | | 9.1 | % | | Consumer Services | | | 0.9 | % |
| Banks | | | 8.7 | % | | Retailing | | | 0.8 | % |
| Insurance | | | 8.4 | % | | Consumer Durables & Apparel | | | 0.8 | % |
| Transportation | | | 7.8 | % | | Food & Staples Retailing | | | 0.5 | % |
| Diversified Financials | | | 6.6 | % | | Industrials | | | 0.4 | % |
| Telecommunication Services | | | 6.0 | % | | Semiconductors & Semiconductor Equipment | | | 0.4 | % |
| Capital Goods | | | 5.8 | % | | Commercial & Professional Services | | | 0.4 | % |
| Food, Beverage & Tobacco | | | 3.2 | % | | Automobiles & Components | | | 0.2 | % |
| Media | | | 2.7 | % | | Other Non-Classified Securities: | | | | |
| Real Estate | | | 2.5 | % | | Municipal Bonds | | | 4.7 | % |
| Miscellaneous | | | 2.1 | % | | Asset Backed Securities | | | 3.6 | % |
| Technology Hardware & Equipment | | | 2.0 | % | | U.S. Treasury Securities | | | 0.8 | % |
| Software & Services | | | 1.7 | % | | Other Securities | | | 0.7 | % |
| Materials | | | 1.6 | % | | U.S. Government Agencies | | | 0.5 | % |
| Pharmaceuticals, Biotechnology & Life Sciences | | | 1.4 | % | | Other Assets & Cash Equivalents | | | 4.0 | % |
SUMMARY OF COUNTRY EXPOSURE
As of 3/31/11
| | | | | | | | | | |
| United States | | | 71.1 | % | | Czech Republic | | | 0.6 | % |
| Australia | | | 4.0 | % | | Germany | | | 0.5 | % |
| Bermuda | | | 3.2 | % | | Trinidad and Tobago | | | 0.5 | % |
| Canada | | | 3.1 | % | | Indonesia | | | 0.5 | % |
| Norway | | | 1.3 | % | | Mexico | | | 0.4 | % |
| Brazil | | | 1.3 | % | | France | | | 0.2 | % |
| Cayman Islands | | | 1.2 | % | | Ireland | | | 0.2 | % |
| Japan | | | 1.1 | % | | Belgium | | | 0.2 | % |
| Spain | | | 1.0 | % | | Switzerland | | | 0.1 | % |
| United Kingdom | | | 0.9 | % | | Chile | | | 0.1 | % |
| South Korea | | | 0.9 | % | | Singapore | | | 0.1 | % |
| United Arab Emirates | | | 0.8 | % | | Greece | | | 0.1 | % |
| Italy | | | 0.8 | % | | Iceland* | | | 0.0 | % |
| Russia | | | 0.6 | % | | China* | | | 0.0 | % |
| Netherlands | | | 0.6 | % | | Other Assets & Cash Equivalents | | | 4.0 | % |
| Luxembourg | | | 0.6 | % | | * Country percentage was less than 0.1%. | | | | |
10 Certified Semi-Annual Report
| | |
| SCHEDULE OF INVESTMENTS, CONTINUED | | |
| |
| Thornburg Strategic Income Fund | | March 31, 2011 (Unaudited) |
| | | | | | | | |
| | | Shares/
Principal Amount | | | Value | |
COMMON STOCK — 5.15% | | | | | | | | |
| | |
CONSUMER SERVICES — 0.07% | | | | | | | | |
HOTELS, RESTAURANTS & LEISURE — 0.07% | | | | | | | | |
OPAP SA | | | 8,300 | | | $ | 177,735 | |
| | | | | | | | |
| | | | | | | 177,735 | |
| | | | | | | | |
| | |
DIVERSIFIED FINANCIALS — 1.06% | | | | | | | | |
CAPITAL MARKETS — 0.78% | | | | | | | | |
Apollo Investment Corp. | | | 168,060 | | | | 2,026,804 | |
DIVERSIFIED FINANCIAL SERVICES — 0.28% | | | | | | | | |
KKR Financial Holdings LLC | | | 73,000 | | | | 714,670 | |
| | | | | | | | |
| | | | | | | 2,741,474 | |
| | | | | | | | |
| | |
ENERGY — 1.20% | | | | | | | | |
ENERGY EQUIPMENT & SERVICES — 0.64% | | | | | | | | |
Seadrill Ltd. | | | 46,100 | | | | 1,667,194 | |
OIL, GAS & CONSUMABLE FUELS — 0.56% | | | | | | | | |
Eni S.p.A. | | | 58,500 | | | | 1,436,764 | |
| | | | | | | | |
| | | | | | | 3,103,958 | |
| | | | | | | | |
| | |
INSURANCE — 0.10% | | | | | | | | |
INSURANCE — 0.10% | | | | | | | | |
Swiss Re | | | 4,400 | | | | 251,736 | |
| | | | | | | | |
| | | | | | | 251,736 | |
| | | | | | | | |
| | |
REAL ESTATE — 1.18% | | | | | | | | |
REAL ESTATE INVESTMENT TRUSTS — 1.18% | | | | | | | | |
Annaly Capital Management, Inc. | | | 101,900 | | | | 1,778,155 | |
Chimera Investment Corp. | | | 165,900 | | | | 656,964 | |
Invesco Mortgage Capital, Inc. | | | 29,000 | | | | 633,650 | |
| | | | | | | | |
| | | | | | | 3,068,769 | |
| | | | | | | | |
| | |
TELECOMMUNICATION SERVICES — 1.17% | | | | | | | | |
DIVERSIFIED TELECOMMUNICATION SERVICES — 0.98% | | | | | | | | |
France Telecom SA | | | 26,900 | | | | 602,719 | |
Telefonica SA | | | 21,500 | | | | 538,249 | |
Telstra Corp. Ltd. | | | 483,000 | | | | 1,408,846 | |
WIRELESS TELECOMMUNICATION SERVICES — 0.19% | | | | | | | | |
Mobistar SA | | | 7,000 | | | | 485,306 | |
| | | | | | | | |
| | | | | | | 3,035,120 | |
| | | | | | | | |
| | |
UTILITIES — 0.37% | | | | | | | | |
ELECTRIC UTILITIES — 0.37% | | | | | | | | |
E. ON AG | | | 13,100 | | | | 400,083 | |
Enel S.p.A. | | | 87,856 | | | | 553,818 | |
| | | | | | | | |
| | | | | | | 953,901 | |
| | | | | | | | |
TOTAL COMMON STOCK (Cost $12,130,645) | | | | | | | 13,332,693 | |
| | | | | | | | |
Certified Semi-Annual Report 11
| | |
| SCHEDULE OF INVESTMENTS, CONTINUED | | |
| |
| Thornburg Strategic Income Fund | | March 31, 2011 (Unaudited) |
| | | | | | | | |
| | | Shares/
Principal Amount | | | Value | |
| | |
PREFERRED STOCK — 4.61% | | | | | | | | |
| | |
BANKS — 2.04% | | | | | | | | |
COMMERCIAL BANKS — 0.79% | | | | | | | | |
Huntington Bancshares Pfd, 8.50% | | | 750 | | | $ | 871,875 | |
a Sovereign REIT Pfd 12.00% | | | 1,000 | | | | 1,160,000 | |
Webster Financial Corp. Pfd Series A, 8.50% | | | 15 | | | | 16,013 | |
THRIFTS & MORTGAGE FINANCE — 1.25% | | | | | | | | |
a Falcons Funding Trust I Pfd, 8.875% | | | 3,000 | | | | 3,240,937 | |
| | | | | | | | |
| | | | | | | 5,288,825 | |
| | | | | | | | |
FOOD, BEVERAGE & TOBACCO — 0.21% | | | | | | | | |
FOOD PRODUCTS — 0.21% | | | | | | | | |
a H.J. Heinz Finance Co. Pfd, 8.00% | | | 5 | | | | 537,500 | |
| | | | | | | | |
| | | | | | | 537,500 | |
| | | | | | | | |
INSURANCE — 0.39% | | | | | | | | |
INSURANCE — 0.39% | | | | | | | | |
Genworth Financial, Inc. Pfd Series A, 5.25% | | | 20,000 | | | | 1,007,500 | |
| | | | | | | | |
| | | | | | | 1,007,500 | |
| | | | | | | | |
MISCELLANEOUS — 0.43% | | | | | | | | |
U.S. GOVERNMENT AGENCIES — 0.43% | | | | | | | | |
Farm Credit Bank of Texas Pfd, 10.00% | | | 1,000 | | | | 1,120,625 | |
| | | | | | | | |
| | | | | | | 1,120,625 | |
| | | | | | | | |
REAL ESTATE — 0.49% | | | | | | | | |
REAL ESTATE INVESTMENT TRUSTS — 0.49% | | | | | | | | |
Alexandria Real Estate Pfd, 7.00% | | | 50,000 | | | | 1,285,000 | |
| | | | | | | | |
| | | | | | | 1,285,000 | |
| | | | | | | | |
TECHNOLOGY HARDWARE & EQUIPMENT — 0.38% | | | | | | | | |
COMMUNICATIONS EQUIPMENT — 0.38% | | | | | | | | |
Lucent Technologies Capital Trust I Pfd, 7.75% | | | 1,000 | | | | 980,000 | |
| | | | | | | | |
| | | | | | | 980,000 | |
| | | | | | | | |
UTILITIES — 0.67% | | | | | | | | |
MULTI-UTILITIES — 0.67% | | | | | | | | |
Centerpoint Energy, Inc. Pfd, 7.5% | | | 50,000 | | | | 1,728,125 | |
| | | | | | | | |
| | | | | | | 1,728,125 | |
| | | | | | | | |
TOTAL PREFERRED STOCK (Cost $10,891,575) | | | | | | | 11,947,575 | |
| | | | | | | | |
| | |
ASSET BACKED SECURITIES — 3.59% | | | | | | | | |
BANKS — 0.06% | | | | | | | | |
COMMERCIAL BANKS — 0.06% | | | | | | | | |
Wells Fargo Asset Securities Corp. Series 2005-AR1 Class B1, 2.744%, 2/25/2035 | | $ | 385,905 | | | | 76,478 | |
Wells Fargo Asset Securities Corp. Series 2005-AR2 Class B1, 3.483%, 3/25/2035 | | | 385,543 | | | | 77,033 | |
| | | | | | | | |
| | | | | | | 153,511 | |
| | | | | | | | |
DIVERSIFIED FINANCIALS — 2.58% | | | | | | | | |
CAPITAL MARKETS — 1.51% | | | | | | | | |
Bear Stearns ARM Mtg Series 2003-6 Class 2B-1, 2.803%, 8/25/2033 | | | 606,247 | | | | 441,706 | |
12 Certified Semi-Annual Report
| | |
| SCHEDULE OF INVESTMENTS, CONTINUED | | |
| |
| Thornburg Strategic Income Fund | | March 31, 2011 (Unaudited) |
| | | | | | | | |
| | | Shares/
Principal Amount | | | Value | |
Bear Stearns Commercial Mtg Securities Series 2007-T26 Class A1, 5.145%, 1/12/2045 | | $ | 26,127 | | | $ | 26,633 | |
Bear Stearns Commercial Mtg Securities Series 2007-T28 Class A1, 5.422%, 9/11/2042 | | | 13,198 | | | | 13,412 | |
GS Mtg Securities Corp. II Series 2007-GG10 Class A1, 5.69%, 8/10/2045 | | | 4,008 | | | | 4,056 | |
LB-UBS Commercial Mtg Trust Series 2007-C1 Class A1, 5.391%, 2/15/2040 | | | 7,363 | | | | 7,458 | |
Merrill Lynch Mtg Investors Trust, 2.787%, 8/25/2034 | | | 339,506 | | | | 282,377 | |
Merrill Lynch Mtg Trust, 5.211%, 11/12/2037 | | | 130,431 | | | | 130,857 | |
Merrill Lynch/Countrywide Commercial Mtg Trust Series 2007-6 Class A1, 5.175%, 3/12/2051 | | | 4,974 | | | | 5,016 | |
Morgan Stanley Capital I Series 2007-HQ11 Class A1, 5.246%, 2/20/2044 | | | 6,596 | | | | 6,641 | |
Morgan Stanley Capital I Series 2007-IQ13 Class A1, 5.05%, 3/15/2044 | | | 13,910 | | | | 14,033 | |
Morgan Stanley Capital I Series 2007-T25 Class A1, 5.391%, 11/12/2049 | | | 26,574 | | | | 26,957 | |
Morgan Stanley Capital, Inc. Series 2005-HE7 Class A2C, 0.57%, 11/25/2035 | | | 1,957,933 | | | | 1,687,440 | |
New York Mtg Trust 2005-3 Class A Floating Rate Note, 0.49%, 2/25/2036 | | | 1,542,539 | | | | 1,265,476 | |
DIVERSIFIED FINANCIAL SERVICES — 1.07% | | | | | | | | |
Banc of America Funding Corp. Series 2006-I Class SB1, 3.407%, 12/20/2036 | | | 966,016 | | | | 200,034 | |
Banc of America Mtg Services Series 2005-A Class B1, 3.236%, 2/25/2035 | | | 934,671 | | | | 420,357 | |
Citigroup Commercial Mtg Trust Series 2004-HYB2 Class B1, 2.886%, 3/25/2034 | | | 190,742 | | | | 159,620 | |
Citigroup Commercial Mtg Trust Series 2007-C6 Class A1, 5.622%, 12/10/2049 | | | 58,454 | | | | 58,520 | |
Countrywide Series 2005-11 Class AF3, 4.778%, 2/25/2036 | | | 978,704 | | | | 852,625 | |
Countrywide Series 2006-15 Class A6, 5.826%, 10/25/2046 | | | 404,752 | | | | 315,229 | |
JPMorgan Chase Commercial Mtg Securities Corp. Series 2006-LDP9 Class A1, 5.17%, 5/15/2047 | | | 6,941 | | | | 6,972 | |
JPMorgan Chase Commercial Mtg Securities Corp. Series 2007-LDPX Class A1, 5.122%, 1/15/2049 | | | 1,781 | | | | 1,787 | |
JPMorgan Series 2007-CH5 Class A2, 0.30%, 5/25/2037 | | | 793,792 | | | | 764,860 | |
| | | | | | | | |
| | | | | | | 6,692,066 | |
| | | | | | | | |
| | |
PHARMACEUTICALS, BIOTECHNOLOGY & LIFE SCIENCES — 0.36% | | | | | | | | |
PHARMACEUTICALS — 0.36% | | | | | | | | |
a QHP PhaRMA, 10.25%, 3/15/2015 | | | 919,797 | | | | 937,346 | |
| | | | | | | | |
| | | | | | | 937,346 | |
| | | | | | | | |
| | |
TRANSPORTATION — 0.59% | | | | | | | | |
AIRLINES — 0.59% | | | | | | | | |
United Airlines 2000 Pass-Through Trust Series 1-B, 8.03%, 1/1/2013 | | | 1,498,727 | | | | 1,521,208 | |
| | | | | | | | |
| | | | | | | 1,521,208 | |
| | | | | | | | |
TOTAL ASSET BACKED SECURITIES (Cost $10,681,022) | | | | | | | 9,304,131 | |
| | | | | | | | |
| | |
CORPORATE BONDS — 60.89% | | | | | | | | |
| | |
AUTOMOBILES & COMPONENTS — 0.19% | | | | | | | | |
AUTOMOBILES — 0.19% | | | | | | | | |
a American Honda Finance, 2.658%, 6/29/2011 | | | 500,000 | | | | 502,573 | |
| | | | | | | | |
| | | | | | | 502,573 | |
| | | | | | | | |
| | |
BANKS — 5.75% | | | | | | | | |
COMMERCIAL BANKS — 5.75% | | | | | | | | |
a,b Banco Industrial e Comercial S.A., 6.25%, 1/20/2013 | | | 1,000,000 | | | | 1,030,000 | |
a,b Banco Pine SA, 8.75%, 1/6/2017 | | | 1,000,000 | | | | 1,016,250 | |
Charter One Bank NA, 5.50%, 4/26/2011 | | | 250,000 | | | | 250,706 | |
a,b DBS Bank Ltd., 5.125%, 5/16/2017 | | | 200,000 | | | | 206,948 | |
a,b,c,d Islandsbanki, 4.41%, 10/15/2008 | | | 60,000 | | | | 18,300 | |
a,b,c,d LandsBanki Islands HF, 5.73%, 8/25/2009 | | | 175,000 | | | | 14,000 | |
National City Bank Floating Rate Note, 0.68%, 6/7/2017 | | | 1,000,000 | | | | 942,604 | |
a PNC Preferred Funding Trust III Floating Rate Note, 8.70%, 12/31/2049 | | | 500,000 | | | | 534,710 | |
Provident Bank of Maryland, 9.50%, 5/1/2018 | | | 1,500,000 | | | | 1,656,664 | |
Certified Semi-Annual Report 13
| | |
| SCHEDULE OF INVESTMENTS, CONTINUED | | |
| |
| Thornburg Strategic Income Fund | | March 31, 2011 (Unaudited) |
| | | | | | | | |
| | | Shares/
Principal Amount | | | Value | |
a,b Santander Issuances, 6.50%, 8/11/2019 | | $ | 1,000,000 | | | $ | 1,007,018 | |
b Shinhan Bank, 6.819%, 9/20/2036 | | | 100,000 | | | | 104,045 | |
Silicon Valley Bank, 6.05%, 6/1/2017 | | | 1,000,000 | | | | 1,047,977 | |
Sovereign Bank, 5.125%, 3/15/2013 | | | 100,000 | | | | 103,093 | |
a,e Sovereign Bank Lease Pass-Through Trust, 12.18%, 6/30/2020 | | | 986,734 | | | | 1,307,423 | |
Susquehanna Capital II, 11.00%, 3/23/2040 | | | 1,000,000 | | | | 1,075,000 | |
a Webster Bank, 5.875%, 1/15/2013 | | | 2,000,000 | | | | 2,004,264 | |
Wells Fargo Capital XIII Preferred Note, 7.70%, 12/29/2049 | | | 500,000 | | | | 515,000 | |
Whitney National Bank, 5.875%, 4/1/2017 | | | 1,000,000 | | | | 991,110 | |
Zions Bancorp, 7.75%, 9/23/2014 | | | 1,000,000 | | | | 1,086,016 | |
| | | | | | | | |
| | | | | | | 14,911,128 | |
| | | | | | | | |
| | |
CAPITAL GOODS — 5.83% | | | | | | | | |
BUILDING PRODUCTS — 0.46% | | | | | | | | |
Owens Corning, Inc., 9.00%, 6/15/2019 | | | 1,000,000 | | | | 1,181,861 | |
INDUSTRIAL CONGLOMERATES — 2.68% | | | | | | | | |
General Electric Capital Corp., 0.449%, 6/20/2014 | | | 1,000,000 | | | | 968,672 | |
a,b Hutchison Whampoa International (10) Ltd., 6.00%, 12/29/2049 | | | 2,000,000 | | | | 2,032,500 | |
Otter Tail Corp., 9.00%, 12/15/2016 | | | 3,000,000 | | | | 3,397,500 | |
a,b Smiths Group plc, 6.05%, 5/15/2014 | | | 500,000 | | | | 536,322 | |
MACHINERY — 1.49% | | | | | | | | |
Case New Holland, Inc., 7.75%, 9/1/2013 | | | 1,000,000 | | | | 1,088,750 | |
Ingersoll-Rand Co., 9.50%, 4/15/2014 | | | 500,000 | | | | 600,091 | |
a SPX Corp., 6.875%, 9/1/2017 | | | 1,000,000 | | | | 1,075,000 | |
Timken Co., 6.00%, 9/15/2014 | | | 1,000,000 | | | | 1,103,045 | |
TRADING COMPANIES & DISTRIBUTORS — 1.20% | | | | | | | | |
a,f Aviation Capital Group, 6.75%, 4/6/2021 | | | 2,000,000 | | | | 2,000,000 | |
a,b Noble Group Ltd., 8.50%, 5/30/2013 | | | 1,000,000 | | | | 1,117,500 | |
| | | | | | | | |
| | | | | | | 15,101,241 | |
| | | | | | | | |
| | |
COMMERCIAL & PROFESSIONAL SERVICES — 0.39% | | | | | | | | |
COMMERCIAL SERVICES & SUPPLIES — 0.39% | | | | | | | | |
Corrections Corp. of America, 6.25%, 3/15/2013 | | | 1,000,000 | | | | 1,000,000 | |
| | | | | | | | |
| | | | | | | 1,000,000 | |
| | | | | | | | |
| | |
CONSUMER DURABLES & APPAREL — 0.82% | | | | | | | | |
HOUSEHOLD DURABLES — 0.82% | | | | | | | | |
FGI Operating Co., Inc., 10.25%, 8/1/2015 | | | 2,000,000 | | | | 2,132,500 | |
| | | | | | | | |
| | | | | | | 2,132,500 | |
| | | | | | | | |
| | |
DIVERSIFIED FINANCIALS — 2.62% | | | | | | | | |
CAPITAL MARKETS — 0.43% | | | | | | | | |
a,b Macquarie Group Ltd., 7.30%, 8/1/2014 | | | 1,000,000 | | | | 1,109,483 | |
CONSUMER FINANCE — 1.23% | | | | | | | | |
North Fork Bancorp, Inc., 5.875%, 8/15/2012 | | | 1,000,000 | | | | 1,046,565 | |
SLM Corp., 6.25%, 1/25/2016 | | | 1,000,000 | | | | 1,042,500 | |
a TMX Finance LLC/TitleMax Finance Corp., 13.25%, 7/15/2015 | | | 1,000,000 | | | | 1,110,000 | |
DIVERSIFIED FINANCIAL SERVICES — 0.96% | | | | | | | | |
a Citicorp Series 1999-1 Class 2, 8.04%, 12/15/2019 | | | 250,000 | | | | 286,425 | |
Citigroup, Inc., 5.00%, 9/15/2014 | | | 750,000 | | | | 783,152 | |
14 Certified Semi-Annual Report
| | |
| SCHEDULE OF INVESTMENTS, CONTINUED | | |
| |
| Thornburg Strategic Income Fund | | March 31, 2011 (Unaudited) |
| | | | | | | | |
| | | Shares/
Principal Amount | | | Value | |
e Counts Series 1998 II-A, 6.67%, 2/15/2018 | | $ | 201,200 | | | $ | 192,649 | |
b Korea Development Bank, 5.30%, 1/17/2013 | | | 200,000 | | | | 211,120 | |
a SquareTwo Financial Corp., 11.625%, 4/1/2017 | | | 1,000,000 | | | | 1,015,000 | |
| | | | | | | | |
| | | | | | | 6,796,894 | |
| | | | | | | | |
| | |
ENERGY — 7.89% | | | | | | | | |
ENERGY EQUIPMENT & SERVICES — 0.83% | | | | | | | | |
a,b RDS Ultra-Deepwater Ltd., 11.875%, 3/15/2017 | | | 1,000,000 | | | | 1,095,000 | |
Seacor Holdings, Inc., 7.375%, 10/1/2019 | | | 1,000,000 | | | | 1,063,761 | |
OIL, GAS & CONSUMABLE FUELS — 7.06% | | | | | | | | |
Black Elk Energy Offshore, 13.75%, 12/1/2015 | | | 2,000,000 | | | | 2,040,000 | |
a,b Bumi Capital PTE Ltd., 12.00%, 11/10/2016 | | | 1,000,000 | | | | 1,167,500 | |
a DCP Midstream LLC, 9.75%, 3/15/2019 | | | 500,000 | | | | 644,452 | |
Energy Transfer Partners LP, 8.50%, 4/15/2014 | | | 500,000 | | | | 584,253 | |
Enterprise Products Operating LP, 7.034%, 1/15/2068 | | | 2,000,000 | | | | 2,075,000 | |
a,b Gaz Capital SA, 7.51%, 7/31/2013 | | | 1,000,000 | | | | 1,111,460 | |
a Maritimes & Northeast Pipeline LLC, 7.50%, 5/31/2014 | | | 938,900 | | | | 1,015,552 | |
Niska Gas Storage, 8.875%, 3/15/2018 | | | 2,000,000 | | | | 2,175,000 | |
a Northern Tier Energy LLC, 10.50%, 12/1/2017 | | | 1,500,000 | | | | 1,698,750 | |
a,b Petro Co. Trinidad Tobago Ltd., 9.75%, 8/14/2019 | | | 1,000,000 | | | | 1,212,500 | |
Plains All American Pipeline LP, 8.75%, 5/1/2019 | | | 1,000,000 | | | | 1,251,050 | |
a Raam Global Energy Co., 12.50%, 10/1/2015 | | | 2,000,000 | | | | 2,100,000 | |
Tennessee Gas Pipeline Co., 8.00%, 2/1/2016 | | | 1,000,000 | | | | 1,206,342 | |
| | | | | | | | |
| | | | | | | 20,440,620 | |
| | | | | | | | |
| | |
FOOD, BEVERAGE & TOBACCO — 1.02% | | | | | | | | |
BEVERAGES — 0.44% | | | | | | | | |
a,b Bacardi Ltd., 7.45%, 4/1/2014 | | | 500,000 | | | | 575,358 | |
Constellation Brands, Inc., 8.375%, 12/15/2014 | | | 500,000 | | | | 566,250 | |
FOOD PRODUCTS — 0.13% | | | | | | | | |
Bunge Ltd. Finance Co., 5.10%, 7/15/2015 | | | 321,000 | | | | 334,912 | |
TOBACCO — 0.45% | | | | | | | | |
Lorillard Tobacco Co, 8.125%, 6/23/2019 | | | 1,000,000 | | | | 1,164,346 | |
| | | | | | | | |
| | | | | | | 2,640,866 | |
| | | | | | | | |
| | |
HEALTH CARE EQUIPMENT & SERVICES — 1.23% | | | | | | | | |
HEALTH CARE EQUIPMENT & SUPPLIES — 0.21% | | | | | | | | |
Beckman Coulter, Inc., 6.00%, 6/1/2015 | | | 500,000 | | | | 546,107 | |
HEALTH CARE PROVIDERS & SERVICES — 0.40% | | | | | | | | |
a Aurora Diagnostics Holdings LLC, 10.75%, 1/15/2018 | | | 1,000,000 | | | | 1,030,000 | |
HEALTH CARE TECHNOLOGY — 0.62% | | | | | | | | |
Merge Healthcare, Inc., 11.75%, 5/1/2015 | | | 1,500,000 | | | | 1,620,000 | |
| | | | | | | | |
| | | | | | | 3,196,107 | |
| | | | | | | | |
| | |
INDUSTRIALS — 0.43% | | | | | | | | |
CAPITAL GOODS — 0.43% | | | | | | | | |
g Da-Lite Screen Co., Inc., 12.50%, 4/1/2015 | | | 1,000,000 | | | | 1,128,750 | |
| | | | | | | | |
| | | | | | | 1,128,750 | |
| | | | | | | | |
| | |
INSURANCE — 7.27% | | | | | | | | |
INSURANCE — 7.27% | | | | | | | | |
a,b Dai-Ichi Mutual Life, 7.25%, 12/31/2049 | | | 2,000,000 | | | | 1,977,108 | |
Certified Semi-Annual Report 15
| | |
| SCHEDULE OF INVESTMENTS, CONTINUED | | |
| |
| Thornburg Strategic Income Fund | | March 31, 2011 (Unaudited) |
| | | | | | | | |
| | | Shares/
Principal Amount | | | Value | |
a International Lease Finance Corp., 6.50%, 9/1/2014 | | $ | 2,000,000 | | | $ | 2,135,000 | |
a National Life Insurance of Vermont, 10.50%, 9/15/2039 | | | 1,000,000 | | | | 1,256,115 | |
Northwind Holdings LLC Series 2007-1A Class A1, 1.091%, 12/1/2037 | | | 1,531,689 | | | | 1,171,405 | |
a,b,e Oil Casualty Insurance, 8.00%, 9/15/2034 | | | 1,934,000 | | | | 1,817,960 | |
a Oil Insurance Ltd., 7.558%, 12/29/2049 | | | 1,000,000 | | | | 948,860 | |
a Prudential Holdings LLC, 8.695%, 12/18/2023 | | | 585,000 | | | | 716,058 | |
a,b QBE Insurance Group Ltd., 5.647%, 7/1/2023 | | | 2,500,000 | | | | 2,324,792 | |
a,b QBE Insurance Group Ltd., 9.75%, 3/14/2014 | | | 780,000 | | | | 902,073 | |
a,b Swiss Re Capital I LP, 6.854%, 5/29/2049 | | | 2,000,000 | | | | 1,957,080 | |
Unum Group, 7.125%, 9/30/2016 | | | 500,000 | | | | 563,667 | |
a,b White Mountains RE Group, 7.506%, 5/29/2049 | | | 1,000,000 | | | | 956,620 | |
Willis North America, Inc., 7.00%, 9/29/2019 | | | 1,000,000 | | | | 1,082,969 | |
a ZFS Finance USA Trust II, 6.45%, 12/15/2065 | | | 1,000,000 | | | | 1,020,000 | |
| | | | | | | | |
| | | | | | | 18,829,707 | |
| | | | | | | | |
| | |
MATERIALS — 0.97% | | | | | | | | |
METALS & MINING — 0.74% | | | | | | | | |
Allegheny Technologies, Inc., 9.375%, 6/1/2019 | | | 1,000,000 | | | | 1,266,886 | |
a,b Posco, 8.75%, 3/26/2014 | | | 500,000 | | | | 585,740 | |
b Rio Tinto Alcan, Inc., 5.00%, 6/1/2015 | | | 50,000 | | | | 54,101 | |
MISCELLANEOUS — 0.23% | | | | | | | | |
a,b Anglo American Capital, 9.375%, 4/8/2014 | | | 500,000 | | | | 598,040 | |
| | | | | | | | |
| | | | | | | 2,504,767 | |
| | | | | | | | |
| | |
MEDIA — 1.67% | | | | | | | | |
MEDIA — 1.67% | | | | | | | | |
a Friendfinder Networks, 14.00%, 9/30/2013 | | | 715,102 | | | | 761,583 | |
a Proquest LLC, 9.00%, 10/15/2018 | | | 2,000,000 | | | | 2,060,000 | |
Washington Post Co., 7.25%, 2/1/2019 | | | 500,000 | | | | 570,107 | |
a,e Yahoo!, Inc., 6.65%, 8/10/2026 | | | 962,400 | | | | 943,152 | |
| | | | | | | | |
| | | | | | | 4,334,842 | |
| | | | | | | | |
| | |
PHARMACEUTICALS, BIOTECHNOLOGY & LIFE SCIENCES — 1.45% | | | | | | | | |
BIOTECHNOLOGY — 1.02% | | | | | | | | |
a,e JPR Royalty LLC, 14.00%, 12/1/2020 | | | 2,000,000 | | | | 2,000,000 | |
a,b Novasep Holding SAS, 9.75%, 12/15/2016 | | | 1,000,000 | | | | 640,000 | |
PHARMACEUTICALS — 0.43% | | | | | | | | |
Axcan Intermediate Holdings, Inc., 12.75%, 3/1/2016 | | | 1,000,000 | | | | 1,112,500 | |
| | | | | | | | |
| | | | | | | 3,752,500 | |
| | | | | | | | |
| | |
RETAILING — 0.84% | | | | | | | | |
INTERNET & CATALOG RETAIL — 0.21% | | | | | | | | |
Ticketmaster, 10.75%, 8/1/2016 | | | 500,000 | | | | 546,250 | |
MULTILINE RETAIL — 0.42% | | | | | | | | |
a,b Grupo Famsa S.A.B. de C.V., 11.00%, 7/20/2015 | | | 1,000,000 | | | | 1,072,500 | |
SPECIALTY RETAIL — 0.21% | | | | | | | | |
Best Buy, Inc., 6.75%, 7/15/2013 | | | 500,000 | | | | 546,664 | |
| | | | | | | | |
| | | | | | | 2,165,414 | |
| | | | | | | | |
16 Certified Semi-Annual Report
| | |
| SCHEDULE OF INVESTMENTS, CONTINUED | | |
| |
| Thornburg Strategic Income Fund | | March 31, 2011 (Unaudited) |
| | | | | | | | |
| | | Shares/
Principal Amount | | | Value | |
SEMICONDUCTORS & SEMICONDUCTOR EQUIPMENT — 0.43% | | | | | | | | |
SEMICONDUCTORS & SEMICONDUCTOR EQUIPMENT — 0.43% | | | | | | | | |
KLA Instruments Corp., 6.90%, 5/1/2018 | | $ | 1,000,000 | | | $ | 1,102,874 | |
| | | | | | | | |
| | | | | | | 1,102,874 | |
| | | | | | | | |
SOFTWARE & SERVICES — 1.23% | | | | | | | | |
INTERNET SOFTWARE & SERVICES — 0.82% | | | | | | | | |
a,b,f EAccess Ltd., 8.25%, 4/1/2018 | | | 1,000,000 | | | | 1,000,000 | |
SSI Investment II/CP-ISSR LLC, 11.125%, 6/1/2018 | | | 1,000,000 | | | | 1,120,000 | |
SOFTWARE — 0.41% | | | | | | | | |
a Aspect Software, Inc., 10.625%, 5/15/2017 | | | 1,000,000 | | | | 1,070,000 | |
| | | | | | | | |
| | | | | | | 3,190,000 | |
| | | | | | | | |
TECHNOLOGY HARDWARE & EQUIPMENT — 1.58% | | | | | | | | |
COMMUNICATIONS EQUIPMENT — 1.18% | | | | | | | | |
a Brightstar Corp., 9.50%, 12/1/2016 | | | 1,000,000 | | | | 1,073,750 | |
a,e Richland Towers, 7.87%, 3/15/2041 | | | 2,000,000 | | | | 1,990,000 | |
ELECTRONIC EQUIPMENT, INSTRUMENTS & COMPONENTS — 0.40% | | | | | | | | |
Avnet, Inc., 5.875%, 6/15/2020 | | | 1,000,000 | | | | 1,022,341 | |
| | | | | | | | |
| | | | | | | 4,086,091 | |
| | | | | | | | |
TELECOMMUNICATION SERVICES — 3.87% | | | | | | | | |
DIVERSIFIED TELECOMMUNICATION SERVICES — 1.89% | | | | | | | | |
Frontier Communications, 8.25%, 4/15/2017 | | | 1,000,000 | | | | 1,080,000 | |
Global Crossing Ltd., 12.00%, 9/15/2015 | | | 1,000,000 | | | | 1,140,000 | |
Level 3 Financing, Inc., 9.25%, 11/1/2014 | | | 452,000 | | | | 462,170 | |
Qwest Corp., 8.875%, 3/15/2012 | | | 1,000,000 | | | | 1,070,000 | |
Qwest Corp., 8.375%, 5/1/2016 | | | 500,000 | | | | 595,000 | |
b Telecom Italia Capital, 0.913%, 7/18/2011 | | | 550,000 | | | | 550,070 | |
WIRELESS TELECOMMUNICATION SERVICES — 1.98% | | | | | | | | |
a CC Holdings GS V LLC / Crown Castle Intl. Corp., 7.75%, 5/1/2017 | | | 1,500,000 | | | | 1,635,000 | |
a,b Digicel Group Ltd., 10.50%, 4/15/2018 | | | 1,600,000 | | | | 1,832,000 | |
a,b Digicel SA, 12.00%, 4/1/2014 | | | 500,000 | | | | 586,250 | |
a,b Vimpelcom, 8.25%, 5/23/2016 | | | 500,000 | | | | 553,750 | |
a,b Vimplecom, 6.493%, 2/2/2016 | | | 500,000 | | | | 517,500 | |
| | | | | | | | |
| | | | | | | 10,021,740 | |
| | | | | | | | |
TRANSPORTATION — 6.34% | | | | | | | | |
AIR FREIGHT & LOGISTICS — 0.17% | | | | | | | | |
FedEx Corp., 8.76%, 5/22/2015 | | | 397,958 | | | | 438,727 | |
AIRLINES — 5.44% | | | | | | | | |
a,b Air Canada, 9.25%, 8/1/2015 | | | 2,000,000 | | | | 2,085,000 | |
American Airlines, Inc., 10.50%, 10/15/2012 | | | 2,000,000 | | | | 2,175,000 | |
American Airlines, Inc., 13.00%, 8/1/2016 | | | 806,158 | | | | 946,228 | |
Continental Airlines, 7.02%, 5/1/2017 | | | 1,651,030 | | | | 1,651,030 | |
Continental Airlines, 6.90%, 7/2/2018 | | | 1,488,087 | | | | 1,484,367 | |
a Jet Equipment Trust, 9.41%, 12/15/2013 | | | 1,536,732 | | | | 1,475,263 | |
JetBlue Airways Corp., 0.533%, 1/2/2014 | | | 2,000,000 | | | | 1,840,000 | |
a United Airlines, Inc., 9.875%, 8/1/2013 | | | 1,800,000 | | | | 1,901,250 | |
United Airlines, Inc., 12.75%, 7/15/2012 | | | 491,040 | | | | 541,371 | |
Certified Semi-Annual Report 17
| | |
| SCHEDULE OF INVESTMENTS, CONTINUED | | |
| |
| Thornburg Strategic Income Fund | | March 31, 2011 (Unaudited) |
| | | | | | | | |
| | | Shares/
Principal Amount | | | Value | |
MARINE — 0.73% | | | | | | | | |
United Maritime LLC, 11.75%, 6/15/2015 | | $ | 1,000,000 | | | $ | 1,037,500 | |
a Windsor Petroleum Transport Corp., 7.84%, 1/15/2021 | | | 956,943 | | | | 866,713 | |
| | | | | | | | |
| | | | | | | 16,442,449 | |
| | | | | | | | |
| | |
UTILITIES — 9.07% | | | | | | | | |
ELECTRIC UTILITIES — 3.93% | | | | | | | | |
Alabama Power Capital Trust V, 3.403%, 10/1/2042 | | | 700,000 | | | | 684,096 | |
Comed Financing III, 6.35%, 3/15/2033 | | | 1,500,000 | | | | 1,270,590 | |
Commonwealth Edison, 6.15%, 3/15/2012 | | | 300,000 | | | | 314,920 | |
a,b Dubai Electricity & Water, 6.375%, 10/21/2016 | | | 1,000,000 | | | | 1,007,500 | |
a Duquesne Light Holdings, 6.40%, 9/15/2020 | | | 2,000,000 | | | | 2,034,750 | |
Metropolitan Edison, 7.70%, 1/15/2019 | | | 250,000 | | | | 295,610 | |
Public Service Co. of New Mexico, 7.95%, 5/15/2018 | | | 1,325,000 | | | | 1,488,627 | |
a Puget Energy, Inc., 6.50%, 12/15/2020 | | | 2,000,000 | | | | 2,005,460 | |
a,b Taqa Abu Dhabi National Energy Co., 6.60%, 8/1/2013 | | | 1,000,000 | | | | 1,071,250 | |
GAS UTILITIES — 1.12% | | | | | | | | |
a Source Gas LLC., 5.90%, 4/1/2017 | | | 1,000,000 | | | | 986,019 | |
Southern Union Co., 7.20%, 11/1/2066 | | | 2,000,000 | | | | 1,910,000 | |
INDEPENDENT POWER PRODUCERS & ENERGY TRADERS — 0.96% | | | | | | | | |
a,b,f Inkia Energy Ltd., 8.375%, 4/4/2021 | | | 2,000,000 | | | | 1,983,380 | |
RRI Energy, Inc., 7.625%, 6/15/2014 | | | 500,000 | | | | 517,500 | |
MULTI-UTILITIES — 3.06% | | | | | | | | |
Amerenenergy Generating Co., 7.00%, 4/15/2018 | | | 1,000,000 | | | | 1,013,555 | |
Black Hills Corp., 9.00%, 5/15/2014 | | | 500,000 | | | | 568,321 | |
CMS Energy Corp., 8.75%, 6/15/2019 | | | 2,000,000 | | | | 2,386,854 | |
a Enogex LLC, 6.875%, 7/15/2014 | | | 1,000,000 | | | | 1,095,112 | |
NiSource Finance Corp., 6.40%, 3/15/2018 | | | 1,130,000 | | | | 1,264,206 | |
Sempra Energy, 9.80%, 2/15/2019 | | | 250,000 | | | | 331,916 | |
a Texas-New Mexico Power, 9.50%, 4/1/2019 | | | 1,000,000 | | | | 1,268,869 | |
| | | | | | | | |
| | | | | | | 23,498,535 | |
| | | | | | | | |
TOTAL CORPORATE BONDS (Cost $143,329,677) | | | | | | | 157,779,598 | |
| | | | | | | | |
| | |
CONVERTIBLE BONDS — 5.88% | | | | | | | | |
| | |
CONSUMER SERVICES — 0.79% | | | | | | | | |
HOTELS, RESTAURANTS & LEISURE — 0.79% | | | | | | | | |
a ICAHN Enterprise LP, 4.00%, 8/15/2013 | | | 2,000,000 | | | | 2,040,000 | |
| | | | | | | | |
| | | | | | | 2,040,000 | |
| | | | | | | | |
| | |
DIVERSIFIED FINANCIALS — 1.66% | | | | | | | | |
CAPITAL MARKETS — 1.46% | | | | | | | | |
a Apollo Investment Corp., 5.75%, 1/15/2016 | | | 1,500,000 | | | | 1,575,000 | |
a,g Prospect Capital Corp., 6.25%, 12/15/2015 | | | 2,000,000 | | | | 2,192,500 | |
DIVERSIFIED FINANCIAL SERVICES — 0.20% | | | | | | | | |
KKR Financial Holdings LLC, 7.00%, 7/15/2012 | | | 505,000 | | | | 526,463 | |
| | | | | | | | |
| | | | | | | 4,293,963 | |
| | | | | | | | |
18 Certified Semi-Annual Report
| | |
| SCHEDULE OF INVESTMENTS, CONTINUED | | |
| |
| Thornburg Strategic Income Fund | | March 31, 2011 (Unaudited) |
| | | | | | | | |
| | | Shares/
Principal Amount | | | Value | |
FOOD, BEVERAGE & TOBACCO — 0.33% | | | | | | | | |
BEVERAGES — 0.33% | | | | | | | | |
Central European Distribution Corp., 3.00%, 3/15/2013 | | $ | 1,000,000 | | | $ | 868,750 | |
| | | | | | | | |
| | | | | | | 868,750 | |
| | | | | | | | |
| | |
MATERIALS — 0.68% | | | | | | | | |
METALS & MINING — 0.68% | | | | | | | | |
a,b Jaguar Mining, Inc., 4.50%, 11/1/2014 | | | 2,000,000 | | | | 1,765,000 | |
| | | | | | | | |
| | | | | | | 1,765,000 | |
| | | | | | | | |
| | |
REAL ESTATE — 0.82% | | | | | | | | |
REAL ESTATE MANAGEMENT & DEVELOPMENT — 0.82% | | | | | | | | |
g Avatar Holdings, Inc., 7.50%, 2/15/2016 | | | 2,000,000 | | | | 2,117,500 | |
| | | | | | | | |
| | | | | | | 2,117,500 | |
| | | | | | | | |
| | |
SOFTWARE & SERVICES — 0.45% | | | | | | | | |
SOFTWARE — 0.45% | | | | | | | | |
a,b Telvent Git SA, 5.50%, 4/15/2015 | | | 1,000,000 | | | | 1,162,500 | |
| | | | | | | | |
| | | | | | | 1,162,500 | |
| | | | | | | | |
| | |
TELECOMMUNICATION SERVICES — 0.77% | | | | | | | | |
WIRELESS TELECOMMUNICATION SERVICES — 0.77% | | | | | | | | |
NII Holdings, Inc., 3.125%, 6/15/2012 | | | 2,000,000 | | | | 2,010,000 | |
| | | | | | | | |
| | | | | | | 2,010,000 | |
| | | | | | | | |
| | |
TRANSPORTATION — 0.38% | | | | | | | | |
MARINE — 0.38% | | | | | | | | |
a Ultrapetrol (Bahamas) Ltd., 7.25%, 1/15/2017 | | | 1,000,000 | | | | 975,000 | |
| | | | | | | | |
| | | | | | | 975,000 | |
| | | | | | | | |
TOTAL CONVERTIBLE BONDS (Cost $14,327,687) | | | | | | | 15,232,713 | |
| | | | | | | | |
| | |
MUNICIPAL BONDS — 4.72% | | | | | | | | |
California Health Facilities Financing Authority (Developmental Disabilities-B), 7.875%, 2/1/2026 | | | 1,940,000 | | | | 1,957,479 | |
Los Angeles California Municipal Improvement Corp. Lease Revenue (Build America Bonds), 6.165%, 11/1/2020 | | | 1,885,000 | | | | 1,795,217 | |
Louisiana Public Facilities Authority Revenue (Black & Gold Facilities Project C), 5.15%, 4/1/2012 | | | 90,000 | | | | 89,888 | |
a Midwest Family Housing, 5.168%, 7/1/2016 | | | 860,000 | | | | 825,669 | |
Oakland California Redevelopment Agency, 8.00%, 9/1/2016 | | | 1,000,000 | | | | 1,032,250 | |
Ohio State Solid Waste (Republic Services Project), 4.25%, 4/1/2033 | | | 900,000 | | | | 917,676 | |
Oklahoma Development Finance Authority, 8.00%, 5/1/2020 | | | 1,500,000 | | | | 1,473,945 | |
San Bernardino County California Redevelopment Agency (San Sevaine), 8.45%, 9/1/2030 | | | 2,000,000 | | | | 1,919,040 | |
San Marcos California Redevelopment Agency Tax Allocation, 6.125%, 10/1/2018 | | | 1,000,000 | | | | 970,820 | |
Texas State Public Finance Authority Charter School Finance Corp. (ED-New Frontiers Series Q), 8.75%, 8/15/2027 | | | 750,000 | | | | 738,997 | |
Wisconsin State Health & Educational Facilities (Richland Hospital), 7.08%, 6/1/2016 | | | 565,000 | | | | 512,506 | |
| | | | | | | | |
TOTAL MUNICIPAL BONDS (Cost $12,100,637) | | | | | | | 12,233,487 | |
| | | | | | | | |
| | |
U.S. TREASURY SECURITIES — 0.79% | | | | | | | | |
U.S. Treasury, 2.25%, 1/31/2015 | | | 2,000,000 | | | | 2,041,562 | |
| | | | | | | | |
TOTAL U.S. TREASURY SECURITIES (Cost $1,993,452) | | | | | | | 2,041,562 | |
| | | | | | | | |
Certified Semi-Annual Report 19
| | |
| SCHEDULE OF INVESTMENTS, CONTINUED | | |
| |
| Thornburg Strategic Income Fund | | March 31, 2011 (Unaudited) |
| | | | | | | | |
| | | Shares/
Principal Amount | | | Value | |
U.S. GOVERNMENT AGENCIES — 0.46% | | | | | | | | |
a Agribank FCB, 9.125%, 7/15/2019 | | $ | 1,000,000 | | | $ | 1,193,881 | |
| | | | | | | | |
TOTAL U.S. GOVERNMENT AGENCIES (Cost $1,045,400) | | | | | | | 1,193,881 | |
| | | | | | | | |
| | |
MORTGAGE BACKED — 0.00% | | | | | | | | |
Federal National Mtg Assoc. CMO Series 1994-37 Class L, 6.50%, 3/25/2024 | | | 10,700 | | | | 11,802 | |
| | | | | | | | |
TOTAL MORTGAGE BACKED (Cost $10,743) | | | | | | | 11,802 | |
| | | | | | | | |
FOREIGN BONDS — 9.22% | | | | | | | | |
| | |
BANKS — 0.85% | | | | | | | | |
COMMERCIAL BANKS — 0.85% | | | | | | | | |
a Banco Santander Chile (CHL), 6.50%, 9/22/2020 | | | 125,000,000 | | | | 240,762 | |
NRW Bank (NOK), 3.50%, 5/21/2013 | | | 5,000,000 | | | | 902,508 | |
Royal Bank of Scotland Group plc (CAD), 5.875%, 5/12/2016 | | | 1,000,000 | | | | 1,051,367 | |
| | | | | | | | |
| | | | | | | 2,194,637 | |
| | | | | | | | |
CONSUMER SERVICES — 0.00 —% | | | | | | | | |
HOTELS, RESTAURANTS & LEISURE — 0.00% | | | | | | | | |
c,d,e FU JI Food (HKD), 0%, 10/18/2010 | | | 7,000,000 | | | | 0 | |
| | | | | | | | |
| | | | | | | 0 | |
| | | | | | | | |
DIVERSIFIED FINANCIALS — 1.25% | | | | | | | | |
CAPITAL MARKETS — 0.84% | | | | | | | | |
Morgan Stanley (AUD), 5.37%, 3/1/2013 | | | 1,000,000 | | | | 1,012,620 | |
a Morgan Stanley (BRL), 10.09%, 5/3/2017 | | | 2,000,000 | | | | 1,169,877 | |
DIVERSIFIED FINANCIAL SERVICES — 0.41% | | | | | | | | |
e Bank of America Corp. (BRL), 10.00%, 11/19/2014 | | | 1,750,000 | | | | 1,055,799 | |
| | | | | | | | |
| | | | | | | 3,238,296 | |
| | | | | | | | |
FOOD & STAPLES RETAILING — 0.54% | | | | | | | | |
FOOD & STAPLES RETAILING — 0.54% | | | | | | | | |
Wesfarmers Ltd. (AUD), 7.68%, 9/11/2014 | | | 1,300,000 | | | | 1,393,010 | |
| | | | | | | | |
| | | | | | | 1,393,010 | |
| | | | | | | | |
FOOD, BEVERAGE & TOBACCO — 1.60% | | | | | | | | |
BEVERAGES — 0.95% | | | | | | | | |
Anheuser-Busch InBev (BRL), 1.00%, 11/17/2015 | | | 2,000,000 | | | | 1,258,690 | |
Ambev International Finance Co., Ltd. (BRL), 9.50%, 7/24/2017 | | | 2,000,000 | | | | 1,212,752 | |
FOOD PRODUCTS — 0.65% | | | | | | | | |
Viterra, Inc. (CAD), 8.50%, 8/1/2017 | | | 1,500,000 | | | | 1,690,304 | |
| | | | | | | | |
| | | | | | | 4,161,746 | |
| | | | | | | | |
INSURANCE — 0.64% | | | | | | | | |
INSURANCE — 0.64% | | | | | | | | |
ELM BV (AUD), 6.458%, 12/27/2049 | | | 1,000,000 | | | | 798,466 | |
ELM BV (AUD), 7.635%, 12/31/2049 | | | 1,000,000 | | | | 858,304 | |
| | | | | | | | |
| | | | | | | 1,656,770 | |
| | | | | | | | |
20 Certified Semi-Annual Report
| | |
| SCHEDULE OF INVESTMENTS, CONTINUED | | |
| |
| Thornburg Strategic Income Fund | | March 31, 2011 (Unaudited) |
| | | | | | | | |
| | | Shares/
Principal Amount | | | Value | |
| | |
MEDIA — 1.02% | | | | | | | | |
MEDIA — 1.02% | | | | | | | | |
CET 21 SPOL S.R.O. (EUR), 9.00%, 11/1/2017 | | $ | 1,000,000 | | | $ | 1,544,747 | |
a Corus Entertainment (CAD), 7.25%, 2/10/2017 | | | 1,000,000 | | | | 1,101,083 | |
| | | | | | | | |
| | | | | | | 2,645,830 | |
| | | | | | | | |
| | |
MISCELLANEOUS — 2.19% | | | | | | | | |
MISCELLANEOUS — 2.19% | | | | | | | | |
BK Nederlandse Gemeenten N.V. (NOK), 4.00%, 5/15/2015 | | | 5,000,000 | | | | 904,395 | |
International Finance Corp. (KRW), 1.75%, 8/23/2013 | | | 1,450,000,000 | | | | 1,311,209 | |
Kommunalbanken AS (NOK), 4.00%, 1/26/2015 | | | 5,000,000 | | | | 906,111 | |
New South Wales Treasury Corp. (AUD), 3.75%, 11/20/2020 | | | 1,000,000 | | | | 1,144,601 | |
Republic of Brazil (BRL), 12.50%, 1/5/2016 | | | 2,025,000 | | | | 1,407,757 | |
| | | | | | | | |
| | | | | | | 5,674,073 | |
| | | | | | | | |
| | |
TELECOMMUNICATION SERVICES — 0.16% | | | | | | | | |
DIVERSIFIED TELECOMMUNICATION SERVICES — 0.16% | | | | | | | | |
Wind Acquisition Finance SA (EUR), 11.75%, 7/15/2017 | | | 250,000 | | | | 410,102 | |
| | | | | | | | |
| | | | | | | 410,102 | |
| | | | | | | | |
| | |
TRANSPORTATION — 0.58% | | | | | | | | |
AIR FREIGHT & LOGISTICS — 0.58% | | | | | | | | |
Livingston International (CAD) | | | 1,500,000 | | | | 1,516,911 | |
| | | | | | | | |
| | | | | | | 1,516,911 | |
| | | | | | | | |
| | |
UTILITIES — 0.39% | | | | | | | | |
INDUSTRIAL POWER PRODUCTION / ENERGY TRADING — 0.39% | | | | | | | | |
Alinta Networks Holdings (AUD), 5.24%, 9/21/2012 | | | 1,000,000 | | | | 1,000,446 | |
| | | | | | | | |
| | | | | | | 1,000,446 | |
| | | | | | | | |
TOTAL FOREIGN BONDS (Cost $21,847,154) | | | | | | | 23,891,821 | |
| | | | | | | | |
| | |
OTHER SECURITIES — 0.70% | | | | | | | | |
LOAN PARTICIPATIONS — 0.70% | | | | | | | | |
e Merisant Co. Term Loan B, 7.50%, 1/31/2014 | | | 1,822,496 | | | | 1,808,828 | |
| | | | | | | | |
TOTAL OTHER SECURITIES (Cost $1,724,429) | | | | | | | 1,808,828 | |
| | | | | | | | |
| | |
SHORT TERM INVESTMENTS — 3.74% | | | | | | | | |
Wellpoint, Inc., 0.20%, 4/1/2011 | | | 9,700,000 | | | | 9,700,000 | |
| | | | | | | | |
TOTAL SHORT TERM INVESTMENTS (Cost $9,700,000) | | | | | | | 9,700,000 | |
| | | | | | | | |
TOTAL INVESTMENTS — 99.75% (Cost $239,782,421) | | | | | | $ | 258,478,091 | |
OTHER ASSETS LESS LIABILITIES — 0.25% | | | | | | | 645,173 | |
| | | | | | | | |
NET ASSETS — 100.00% | | | | | | $ | 259,123,264 | |
| | | | | | | | |
Certified Semi-Annual Report 21
| | |
| SCHEDULE OF INVESTMENTS, CONTINUED | | |
| |
| Thornburg Strategic Income Fund | | March 31, 2011 (Unaudited) |
Footnote Legend
| a | Securities exempt from registration under Rule 144A of the Securities Act of 1933, as amended. These securities may only be resold in the ordinary course of business in transactions exempt from registration, normally to qualified institutional buyers. As of March 31, 2011, the aggregate value of these securities in the Fund’s portfolio was $102,402,840, representing 39.52% of the Fund’s net assets. |
| b | Yankee Bond - Denominated in U.S. dollars and is issued in the U.S. by foreign banks and corporations. |
| e | Security currently fair valued by the valuation and pricing committee using procedures approved by the Trustees. |
| g | Segregated as collateral for a when-issued security. |
Portfolio Abbreviations
To simplify the listings of securities, abbreviations are used per the table below:
| | |
ARM | | Adjustable Rate Mortgage |
AUD | | Denominated in Australian Dollars |
BRL | | Denominated in Brazilian Real |
CAD | | Denominated in Canadian Dollars |
CHL | | Denominated in Chilean Peso |
CMO | | Collateralized Mortgage Obligation |
EUR | | Denominated in Euros |
FCB | | Farm Credit Bank |
HKD | | Denominated in Hong Kong Dollars |
KRW | | Denominated in Korean Won |
Mtg | | Mortgage |
NOK | | Denominated in Norwegian Krone |
Pfd | | Preferred Stock |
REIT | | Real Estate Investment Trust |
See notes to financial statements.
22 Certified Semi-Annual Report
This page intentionally left blank.
Certified Semi-Annual Report 23
| | |
| STATEMENT OF ASSETS AND LIABILITIES | | |
| |
| Thornburg Strategic Income Fund | | March 31, 2011 (Unaudited) |
| | | | |
ASSETS | | | | |
Investments at value (cost $239,782,421) (Note 2) | | $ | 258,478,091 | |
Cash | | | 522,525 | |
Receivable for investments sold | | | 354,219 | |
Receivable for fund shares sold | | | 1,670,797 | |
Dividends receivable | | | 200,409 | |
Dividend and interest reclaim receivable | | | 823 | |
Interest receivable | | | 3,962,513 | |
Prepaid expenses and other assets | | | 34,881 | |
| | | | |
Total Assets | | | 265,224,258 | |
| | | | |
| |
LIABILITIES | | | | |
Payable for securities purchased | | | 5,234,589 | |
Payable for fund shares redeemed | | | 273,832 | |
Unrealized depreciation on forward currency contracts (Note 7) | | | 103,585 | |
Payable to investment advisor and other affiliates (Note 3) | | | 258,222 | |
Accounts payable and accrued expenses | | | 64,807 | |
Dividends payable | | | 165,959 | |
| | | | |
Total Liabilities | | | 6,100,994 | |
| | | | |
| |
NET ASSETS | | $ | 259,123,264 | |
| | | | |
NET ASSETS CONSIST OF: | | | | |
Undistributed net investment income | | $ | 81,999 | |
Net unrealized appreciation on investments | | | 18,607,953 | |
Accumulated net realized gain (loss) | | | 5,411,836 | |
Net capital paid in on shares of beneficial interest | | | 235,021,476 | |
| | | | |
| | $ | 259,123,264 | |
| | | | |
24 Certified Semi-Annual Report
| | |
| STATEMENT OF ASSETS AND LIABILITIES, CONTINUED | | |
| |
| Thornburg Strategic Income Fund | | March 31, 2011 (Unaudited) |
| | | | |
NET ASSET VALUE: | | | | |
Class A Shares: | | | | |
Net asset value and redemption price per share ($92,082,204 applicable to 7,436,458 shares of beneficial interest outstanding - Note 4) | | $ | 12.38 | |
Maximum sales charge, 4.50% of offering price | | | 0.58 | |
| | | | |
Maximum offering price per share | | $ | 12.96 | |
| | | | |
| |
Class C Shares: | | | | |
Net asset value and offering price per share * ($91,279,520 applicable to 7,379,743 shares of beneficial interest outstanding - Note 4) | | $ | 12.37 | |
| | | | |
| |
Class I Shares: | | | | |
Net asset value, offering and redemption price per share ($75,761,540 applicable to 6,122,916 shares of beneficial interest outstanding - Note 4) | | $ | 12.37 | |
| | | | |
| * | Redemption price per share is equal to net asset value less any applicable contingent deferred sales charge. |
See notes to financial statements.
Certified Semi-Annual Report 25
| | |
| STATEMENT OF OPERATIONS | | |
| |
| Thornburg Strategic Income Fund | | Six Months Ended March 31, 2011 (Unaudited) |
| | | | |
INVESTMENT INCOME: | | | | |
Dividend income (net of foreign taxes withheld of $4,709) | | $ | 973,041 | |
Interest income (net of premium amortized of $189,455) | | | 8,119,125 | |
Other income | | | 182,171 | |
| | | | |
Total Income | | | 9,274,337 | |
| | | | |
| |
EXPENSES: | | | | |
Investment advisory fees (Note 3) | | | 907,456 | |
Administration fees (Note 3) | | | | |
Class A Shares | | | 53,230 | |
Class C Shares | | | 53,362 | |
Class I Shares | | | 17,860 | |
Distribution and service fees (Note 3) | | | | |
Class A Shares | | | 106,792 | |
Class C Shares | | | 426,032 | |
Transfer agent fees | | | | |
Class A Shares | | | 35,968 | |
Class C Shares | | | 41,428 | |
Class I Shares | | | 17,608 | |
Registration and filing fees | | | | |
Class A Shares | | | 11,115 | |
Class C Shares | | | 11,951 | |
Class I Shares | | | 21,242 | |
Custodian fees (Note 3) | | | 40,465 | |
Professional fees | | | 27,774 | |
Accounting fees | | | 3,435 | |
Trustee fees | | | 2,859 | |
Other expenses | | | 18,848 | |
| | | | |
Total Expenses | | | 1,797,425 | |
Less: | | | | |
Expenses reimbursed by investment advisor (Note 3) | | | (156,276 | ) |
Fees paid indirectly (Note 3) | | | (145 | ) |
| | | | |
Net Expenses | | | 1,641,004 | |
| | | | |
Net Investment Income | | $ | 7,633,333 | |
| | | | |
26 Certified Semi-Annual Report
| | |
| STATEMENT OF OPERATIONS, CONTINUED | | |
| |
| Thornburg Strategic Income Fund | | Six Months Ended March 31, 2011 (Unaudited) |
| | | | |
REALIZED AND UNREALIZED GAIN (LOSS) | | | | |
Net realized gain (loss) from: | | | | |
Investments | | $ | 5,464,618 | |
Forward currency contracts (Note 7) | | | (88,173 | ) |
Foreign currency transactions | | | 25,614 | |
| | | | |
| | | 5,402,059 | |
| | | | |
Net change in unrealized appreciation (depreciation) on: | | | | |
Investments | | | 980,887 | |
Forward currency contracts (Note 7) | | | 2,965 | |
Foreign currency translations | | | 2,179 | |
| | | | |
| | | 986,031 | |
| | | | |
Net Realized and Unrealized Gain | | | 6,388,090 | |
| | | | |
Net Increase in Net Assets Resulting from Operations | | $ | 14,021,423 | |
| | | | |
See notes to financial statements.
Certified Semi-Annual Report 27
STATEMENTS OF CHANGES IN NET ASSETS
Thornburg Strategic Income Fund
| | | | | | | | |
| | | Six Months Ended
March 31, 2011* | | | Year Ended
September 30, 2010 | |
INCREASE (DECREASE) IN NET ASSETS FROM | | | | | | | | |
| | |
OPERATIONS: | | | | | | | | |
Net investment income | | $ | 7,633,333 | | | $ | 12,599,926 | |
Net realized gain (loss) on investments, forward currency contracts and foreign currency transactions | | | 5,402,059 | | | | 5,885,277 | |
Increase (Decrease) in unrealized appreciation (depreciation) on investments, forward currency contracts and foreign currency translations | | | 986,031 | | | | 6,866,540 | |
| | | | | | | | |
| | |
Net Increase (Decrease) in Net Assets Resulting from Operations | | | 14,021,423 | | | | 25,351,743 | |
| | |
DIVIDENDS TO SHAREHOLDERS: | | | | | | | | |
From net investment income | | | | | | | | |
Class A Shares | | | (2,754,769 | ) | | | (4,807,279 | ) |
Class C Shares | | | (2,533,882 | ) | | | (4,024,693 | ) |
Class I Shares | | | (2,505,232 | ) | | | (3,652,715 | ) |
From realized gains | | | | | | | | |
Class A Shares | | | (1,920,858 | ) | | | (274,801 | ) |
Class C Shares | | | (1,933,399 | ) | | | (238,982 | ) |
Class I Shares | | | (1,595,561 | ) | | | (197,906 | ) |
| | |
FUND SHARE TRANSACTIONS (NOTE 4): | | | | | | | | |
Class A Shares | | | 7,950,938 | | | | 21,481,084 | |
Class C Shares | | | 9,160,721 | | | | 25,873,288 | |
Class I Shares | | | 2,559,394 | | | | 25,203,621 | |
| | | | | | | | |
| | |
Net Increase in Net Assets | | | 20,448,775 | | | | 84,713,360 | |
| | |
NET ASSETS: | | | | | | | | |
Beginning of Period | | | 238,674,489 | | | | 153,961,129 | |
| | | | | | | | |
| | |
End of Period | | $ | 259,123,264 | | | $ | 238,674,489 | |
| | | | | | | | |
| | |
Undistributed net investment income | | $ | 81,999 | | | $ | 257,757 | |
See notes to financial statements.
28 Certified Semi-Annual Report
| | |
| NOTES TO FINANCIAL STATEMENTS | | |
| |
| Thornburg Strategic Income Fund | | March 31, 2011 (Unaudited) |
NOTE 1 – ORGANIZATION
Thornburg Strategic Income Fund, hereinafter referred to as the “Fund,” is a diversified series of Thornburg Investment Trust (the “Trust”). The Fund commenced operations on December 19, 2007. The Trust was organized as a Massachusetts business trust under a Declaration of Trust dated June 3, 1987 and is registered as a diversified, open-end management investment company under the Investment Company Act of 1940, as amended. The Fund is currently one of sixteen separate series of the Trust. Each series is considered to be a separate entity for financial reporting and tax purposes and bears expenses directly attributable to it. The Fund’s primary investment goal is to seek a high level of current income. The Fund’s secondary investment goal is some long-term capital appreciation.
The Fund currently offers three classes of shares of beneficial interest: Class A, Class C, and Institutional Class (Class I). Each class of shares of the Fund represents an interest in the same portfolio of investments, except that (i) Class A shares are sold subject to a front-end sales charge collected at the time the shares are purchased and bear a service fee, (ii) Class C shares are sold at net asset value without a sales charge at the time of purchase, but are subject to a contingent deferred sales charge upon redemption within one year of purchase, and bear both a service fee and a distribution fee, (iii) Class I shares are sold at net asset value without a sales charge at the time of purchase, and (iv) the respective classes may have different reinvestment privileges and conversion rights. Additionally, the Fund may allocate among its classes certain expenses, to the extent allowable to specific classes, including transfer agent fees, government registration fees, certain printing and postage costs, and administrative and legal expenses. Currently, class specific expenses of the Fund are limited to service and distribution fees, administration fees, and certain registration and transfer agent expenses.
NOTE 2 – SIGNIFICANT ACCOUNTING POLICIES
Significant accounting policies of the Trust are as follows:
Valuation of Investments: Portfolio securities listed or traded on a national securities exchange are valued on the valuation date at the last reported sale price on the exchange that is the primary market for the security. Portfolio securities traded on an exchange for which there has been no sale that day and other equity securities traded in the over-the-counter market are valued at the mean between the last reported bid and asked prices. Portfolio securities reported by NASDAQ are valued at the NASDAQ official closing price. Any foreign security traded on exchanges outside the United States is valued at the price of the security on the exchange that is normally the security’s primary market, as of the close of that exchange preceding the time of the Fund’s valuation.
Debt obligations held by the Fund have a primary market over the counter and are valued by an independent pricing service approved by the Trustees of the Trust. The pricing service ordinarily values debt obligations at quoted bid prices. When quotations are not available, debt obligations held by the Fund are valued at evaluated prices determined by the pricing service using methods which include consideration of yields or prices of debt obligations of comparable quality, type of issue, coupon, maturity and rating, and indications as to value from dealers and general market conditions. Short-term obligations having remaining maturities of 60 days or less are ordinarily valued at amortized cost, which approximates market value.
Quotations in foreign currencies for foreign portfolio investments are converted to U.S. dollar equivalents using the foreign exchange quotation in effect at the time of valuation.
In any case where the market value of an equity security held by the Fund is not readily available, the Trust’s valuation and pricing committee determines a fair value for the security using procedures approved by the Trustees, which may include the use of a price obtained from an independent pricing service. The pricing service ordinarily values equity securities in these instances using multi-factor models to adjust market prices based upon various inputs, including exchange data, depository receipt prices, futures and index data and other data. A security’s market value is deemed not readily available whenever the exchange or market on which the security is primarily traded is closed for the entire scheduled day of trading. Additionally, a security’s market value may be deemed not readily available under other circumstances identified by the Trustees, including when developments occurring after the most recent close of the security’s primary exchange or market, but before the most recent close of trading in Fund shares, create a serious question about the reliability of the security’s market value.
In any case where a pricing service fails to provide a price for a debt obligation held by the Fund, the valuation and pricing committee determines a fair value for the debt obligation using procedures approved by the Trustees. Additionally, in any case where management believes that a price provided by a pricing service for a debt obligation held by the Fund may be unreliable, the valuation and pricing committee decides whether or not to use the pricing service’s valuation or to determine a fair value for the debt obligation.
Certified Semi-Annual Report 29
| | |
| NOTES TO FINANCIAL STATEMENTS, CONTINUED | | |
| |
| Thornburg Strategic Income Fund | | March 31, 2011 (Unaudited) |
In determining fair value for any portfolio security or other investment, the valuation and pricing committee seeks to determine the amount that an owner of the investment might reasonably expect to receive upon a sale of the investment. However, because fair value prices are estimated prices, the valuation and pricing committee’s determination of fair value for an investment may differ from the value that would be realized by the Fund upon a sale of the investment, and that difference could be material to the Fund’s financial statements. The valuation and pricing committee’s determination of fair value for an investment may also differ from the prices obtained by other persons (including other mutual funds) for the investment.
Valuation Measurements: Various inputs are used in determining the value of the Fund’s investments. These inputs are summarized in the three levels listed below.
Level 1: Quoted prices in active markets for identical investments.
Level 2: Other significant observable inputs (including quoted prices for similar investments, interest rates, prepayment rates, credit risk, etc.).
Level 3: Significant unobservable inputs (including the Fund’s own assumptions in determining the fair value of investments).
The following table displays a summary of the inputs used to value the Fund’s net assets as of March 31, 2011. In any instance when valuation inputs from more than one level are used to determine the fair value of a specific investment, the investment is placed in the level of the table based upon the lowest level input that is significant in determining the fair value of the investment:
| | | | | | | | | | | | | | | | |
| | | Fair Value Measurements at March 31, 2011 | |
| | | Total | | | Level 1 | | | Level 2 | | | Level 3 | |
Assets | | | | | | | | | | | | | | | | |
Investments in Securities* | | | | | | | | | | | | | | | | |
Common Stock | | $ | 13,332,693 | | | $ | 13,332,693 | | | $ | — | | | $ | — | |
Preferred Stock(a) | | | 11,947,575 | | | | 9,226,562 | | | | 2,721,013 | | | | — | |
Asset Backed Securities | | | 9,304,131 | | | | — | | | | 9,304,131 | | | | — | |
Corporate Bonds | | | 157,779,598 | | | | — | | | | 149,528,414 | | | | 8,251,184 | |
Convertible Bonds | | | 15,232,713 | | | | — | | | | 15,232,713 | | | | — | |
Municipal Bonds | | | 12,233,487 | | | | — | | | | 12,233,487 | | | | — | |
U.S. Treasury Securities | | | 2,041,562 | | | | 2,041,562 | | | | — | | | | — | |
U.S. Government Agencies | | | 1,193,881 | | | | — | | | | 1,193,881 | | | | — | |
Mortgage Backed | | | 11,802 | | | | — | | | | 11,802 | | | | — | |
Foreign Bonds | | | 23,891,821 | | | | — | | | | 22,836,022 | | | | 1,055,799 | |
Other Securities | | | 1,808,828 | | | | — | | | | — | | | | 1,808,828 | |
Short Term Investments | | | 9,700,000 | | | | — | | | | 9,700,000 | | | | — | |
| | | | | | | | | | | | | | | | |
Total Investments in Securities | | $ | 258,478,091 | | | $ | 24,600,817 | | | $ | 222,761,463 | | | $ | 11,115,811 | |
Liabilities | | | | | | | | | | | | | | | | |
Other Financial Instruments** | | | | | | | | | | | | | | | | |
Forward Currency Contracts | | $ | (103,585 | ) | | $ | — | | | $ | (103,585 | ) | | $ | — | |
| (a) | Industry classifications for Preferred Stock in Level 2 consisted of $1,176,013 in Banks, $537,500 in Food, Beverage & Tobacco, and $1,007,500 in Insurance at March 31, 2011. |
| * | See Schedule of Investments for a summary of the industry exposure as grouped according to the Global Industry Classification Standard (GICS), which is an industry taxonomy developed by MSCI Barra and Standard & Poor’s (S&P). |
| ** | Other Financial Instruments include investments not reflected in the Schedule of Investments, such as futures, forwards and swap contracts, which are valued at the unrealized appreciation (depreciation) on the investment. |
30 Certified Semi-Annual Report
| | |
| NOTES TO FINANCIAL STATEMENTS, CONTINUED | | |
| |
| Thornburg Strategic Income Fund | | March 31, 2011 (Unaudited) |
A rollforward of fair value measurements using significant unobservable inputs (Level 3) for the six months ended March 31, 2011, was as follows:
| | | | | | | | | | | | | | | | | | | | | | | | | | | | |
| | | Beginning
Balance
9/30/2010 | | | Gross
Purchases | | | Gross
Sales | | | Net Realized
Gain/(Loss) | | | Net Unrealized
Appreciation/
(Depreciation) | | | Net Transfers
in/(out) of
Level 3(b) | | | Ending
Balance
3/31/2011 | |
Investments in Securities(a) | | $ | 9,712,956 | | | $ | 5,340,955 | | | $ | (199,967 | ) | | $ | 10,644 | | | $ | (195,906 | ) | | $ | (3,552,871 | ) | | $ | 11,115,811 | |
| (a) | Level 3 Securities represent 4.29% of Total Net Assets at the period ended March 31, 2011. |
| (b) | Net transfers out of Level 3 were to Level 2, and were due to changes in other significant observable inputs existing during the six months ended March 31, 2011. Transfers into or out of Level 3 are based on the beginning market value of the period in which they occurred. |
Other Notes: It is the policy of the Fund to recognize significant transfers between Levels 1 and 2 and to disclose those transfers at the last date of the reporting period. The Fund recognized no significant transfers into and out of Levels 1 and 2 during the six months ended March 31, 2011.
Foreign Currency Translation: Portfolio securities and other assets and liabilities denominated in foreign currencies are translated into U.S. dollars based on the exchange rate of such currencies against the U.S. dollar on the date of valuation. Purchases and sales of securities and income items denominated in foreign currencies are translated into U.S. dollars at the exchange rate in effect on the translation date. When the Fund purchases or sells foreign securities, it will customarily enter into a foreign exchange contract to minimize foreign exchange risk from the trade date to the settlement date of such transactions.
The Fund does not separately report the effect of changes in foreign exchange rates from changes in market prices on securities held. Such changes are included in net realized and unrealized gain or loss from investments.
Reported net realized foreign exchange gains or losses arise from sales of foreign currencies, currency gains or losses realized between the trade and settlement dates on securities transactions and the difference between the amounts of dividends, interest, and foreign withholding taxes recorded on the Fund’s books, and the U.S. dollar equivalent of the amounts actually received or paid.
Net unrealized foreign exchange gains and losses arise from changes in the fair value of assets and liabilities, other than investments in securities at fiscal period end, resulting from changes in exchange rates.
Deferred Taxes: The Fund is subject to a tax imposed on net realized gains of securities of certain foreign countries. The Fund records an estimated deferred tax liability for net unrealized gains on these securities as reflected in the accompanying financial statements.
Federal Income Taxes: It is the policy of the Trust to comply with the provisions of the Internal Revenue Code applicable to “regulated investment companies” and to distribute to shareholders substantially all taxable income, including any net realized gain on investments of the Fund. Therefore, no provision for federal income taxes is required.
Management reviews each tax position believed to be material to the preparation of the Fund’s financial statements, to assess if it is more likely than not that the position would be sustained upon examination, based upon the technical merits of the position. As of March 31, 2011, management has not identified any such position for which a liability must be reflected in the Statement of Assets and Liabilities. The Fund’s tax returns remain subject to examination for three years after filing.
When-Issued and Delayed Delivery Transactions: The Fund may engage in when-issued or delayed delivery transactions. To the extent the Fund engages in such transactions, it will do so for the purpose of acquiring portfolio securities consistent with the Fund’s investment objectives and not for the purpose of investment leverage or to speculate on interest rate and/or market changes. At the time the Fund makes a commitment to purchase a security on a when-issued or delayed delivery basis, the Fund will record the transaction and reflect the value in determining its net asset value. When effecting such transactions, assets of an amount sufficient to make payment for the portfolio securities to be purchased will be segregated on the Fund’s records on the trade date. Securities purchased on a when-issued or delayed delivery basis do not earn interest until the settlement date.
Certified Semi-Annual Report 31
| | |
| NOTES TO FINANCIAL STATEMENTS, CONTINUED | | |
| |
| Thornburg Strategic Income Fund | | March 31, 2011 (Unaudited) |
Dividends: Dividends to shareholders, if any, are generally paid quarterly and are reinvested in additional shares of the Fund at net asset value per share at the close of business on the dividend payment date or, at the shareholder’s option, paid in cash. Net realized capital gains, to the extent available, will be distributed at least annually. Distributions to shareholders are based on income tax regulations and therefore, their characteristics may differ for financial statement and tax purposes.
General: Securities transactions are accounted for on a trade date basis. Interest income is accrued as earned and dividend income is recorded on the ex-dividend date. Certain income from foreign securities is recognized as soon as information is available to the Fund. Realized gains and losses from the sale of securities are recorded on an identified cost basis. Net investment income (other than class specific expenses) and realized and unrealized gains and losses are allocated daily to each class of shares based upon the relative net asset value of outstanding shares of each class of shares at the beginning of the day (after adjusting for the current share activity of the respective class). Expenses common to all Funds are allocated among the Funds comprising the Trust based upon their relative net asset values or other appropriate allocation methods.
Guarantees and Indemnifications: Under the Trust’s organizational documents, its officers and Trustees are indemnified against certain liabilities arising out of the performance of their duties to the Fund. Additionally, in the normal course of business the Trust enters into contracts with service providers that contain general indemnification clauses. The Trust’s maximum exposure under these arrangements is unknown. However, based on experience, the Trust expects the risk of loss to be remote.
Use of Estimates: The preparation of financial statements, in conformity with generally accepted accounting principles, requires management to make estimates and assumptions that affect the reported amounts of assets and liabilities and the disclosure of contingent assets and liabilities at the date of the financial statements and the reported amounts of increases and decreases in net assets from operations during the reporting period. Actual results could differ from those estimates.
NOTE 3 – INVESTMENT ADVISORY FEE AND OTHER TRANSACTIONS WITH AFFILIATES
Pursuant to an investment advisory agreement, Thornburg Investment Management, Inc. (the “Advisor”) serves as the investment advisor and performs services to the Fund for which the fees are payable at the end of each month. For the six months ended March 31, 2011, these fees were payable at annual rates ranging from .75 of 1% to .50 of 1% per annum of the average daily net assets of the Fund depending on the Fund’s asset size. The Trust also has entered into administrative services agreements with the Advisor, whereby the Advisor will perform certain administrative services for the shareholders of each class of the Fund’s shares, and for which fees will be payable at an annual rate of up to .125 of 1% per annum of the average daily net assets attributable to each class of shares. For the six months ended March 31, 2011, the Advisor contractually reimbursed certain class specific expenses, administrative fees, and distribution fees of $27,004 for Class A shares, $118,866 for Class C shares, and $10,406 for Class I shares.
The Trust has an underwriting agreement with Thornburg Securities Corporation (the “Distributor,” an affiliate of the Advisor), which acts as the distributor of the Fund’s shares. For the six months ended March 31, 2011, the Distributor has advised the Fund that it earned commissions aggregating $25,073 from the sale of Class A shares, and collected contingent deferred sales charges aggregating $2,818 from redemptions of Class C shares of the Fund.
Pursuant to a service plan under Rule 12b-1 of the Investment Company Act of 1940, the Fund may reimburse to the Advisor an amount not to exceed .25 of 1% per annum of the average daily net assets attributable to each class of shares of the Fund for payments made by the Advisor to securities dealers and other financial institutions to obtain various shareholder and distribution related services. For the six months ended March 31, 2011, there were no 12b-1 service plan fees charged for Class I shares. The Advisor may pay out of its own resources additional expenses for distribution of the Fund’s shares.
The Trust has also adopted a distribution plan pursuant to Rule 12b-1, applicable only to the Fund’s Class C shares, under which the Fund compensates the Distributor for services in promoting the sale of Class C shares of the Fund at an annual rate of up to .75 of 1% per annum of the average daily net assets attributable to Class C shares. Total fees incurred by the Distributor for each class of shares of the Fund under their respective Service and Distribution Plans for the six months ended March 31, 2011, are set forth in the Statement of Operations.
32 Certified Semi-Annual Report
| | |
| NOTES TO FINANCIAL STATEMENTS, CONTINUED | | |
| |
| Thornburg Strategic Income Fund | | March 31, 2011 (Unaudited) |
The Trust has an agreement with the custodian bank to indirectly pay a portion of the custodian’s fees through credits earned by the Fund’s cash on deposit with the bank. This deposit agreement is an alternative to overnight investments. Custodial fees have been adjusted to reflect amounts that would have been paid without this agreement, with a corresponding adjustment reflected as fees paid indirectly in the Statement of Operations. For the six months ended March 31, 2011, fees paid indirectly were $145.
Certain officers and Trustees of the Trust are also officers and/or directors of the Advisor and Distributor. The compensation of independent Trustees is borne by the Trust.
NOTE 4 – SHARES OF BENEFICIAL INTEREST
At March 31, 2011, there were an unlimited number of shares of beneficial interest authorized. Transactions in shares of beneficial interest were as follows:
| | | | | | | | | | | | | | | | |
| | | Six Months Ended
March 31, 2011 (Unaudited) | | | Year Ended
September 30, 2010 (Audited) | |
| | | Shares | | | Amount | | | Shares | | | Amount | |
Class A Shares | | | | | | | | | | | | | | | | |
Shares sold | | | 2,084,072 | | | $ | 25,599,280 | | | | 3,856,708 | | | $ | 45,792,994 | |
Shares issued to shareholders in reinvestment of dividends | | | 269,009 | | | | 3,278,959 | | | | 293,662 | | | | 3,506,242 | |
Shares repurchased | | | (1,705,326 | ) | | | (20,927,301 | ) | | | (2,334,960 | ) | | | (27,818,152 | ) |
| | | | | | | | | | | | | | | | |
| | | | |
Net Increase (Decrease) | | | 647,755 | | | $ | 7,950,938 | | | | 1,815,410 | | | $ | 21,481,084 | |
| | | | | | | | | | | | | | | | |
| | | | |
Class C Shares | | | | | | | | | | | | | | | | |
Shares sold | | | 1,506,340 | | | $ | 18,507,565 | | | | 2,960,710 | | | $ | 35,190,787 | |
Shares issued to shareholders in reinvestment of dividends | | | 246,650 | | | | 3,003,257 | | | | 231,359 | | | | 2,762,178 | |
Shares repurchased | | | (1,007,848 | ) | | | (12,350,101 | ) | | | (1,013,608 | ) | | | (12,079,677 | ) |
| | | | | | | | | | | | | | | | |
| | | | |
Net Increase (Decrease) | | | 745,142 | | | $ | 9,160,721 | | | | 2,178,461 | | | $ | 25,873,288 | |
| | | | | | | | | | | | | | | | |
| | | | |
Class I Shares | | | | | | | | | | | | | | | | |
Shares sold | | | 1,788,906 | | | $ | 21,951,391 | | | | 3,284,125 | | | $ | 39,301,651 | |
Shares issued to shareholders in reinvestment of dividends | | | 273,788 | | | | 3,339,006 | | | | 258,669 | | | | 3,095,659 | |
Shares repurchased | | | (1,849,559 | ) | | | (22,731,003 | ) | | | (1,441,646 | ) | | | (17,193,689 | ) |
| | | | | | | | | | | | | | | | |
| | | | |
Net Increase (Decrease) | | | 213,135 | | | $ | 2,559,394 | | | | 2,101,148 | | | $ | 25,203,621 | |
| | | | | | | | | | | | | | | | |
NOTE 5 – SECURITIES TRANSACTIONS
For the six months ended March 31, 2011, the Fund had purchase and sale transactions of investment securities (excluding short-term investments and U.S. Government obligations) of $79,531,598 and $65,908,675, respectively.
Certified Semi-Annual Report 33
| | |
| NOTES TO FINANCIAL STATEMENTS, CONTINUED | | |
| |
| Thornburg Strategic Income Fund | | March 31, 2011 (Unaudited) |
NOTE 6 – INCOME TAXES
At March 31, 2011, information on the tax components of capital is as follows:
| | | | |
Cost of investments for tax purposes | | $ | 239,782,421 | |
| | | | |
Gross unrealized appreciation on a tax basis | | $ | 23,030,214 | |
Gross unrealized depreciation on a tax basis | | | (4,334,544 | ) |
| | | | |
Net unrealized appreciation (depreciation) on investments (tax basis) | | $ | 18,695,670 | |
| | | | |
NOTE 7 – DERIVATIVE FINANCIAL INSTRUMENTS WITH OFF-BALANCE SHEET RISK AND FOREIGN INVESTMENT RISK
The Fund may use a variety of derivative financial instruments to hedge or adjust the risks affecting its investment portfolio or to enhance investment returns. Provisions of FASB Accounting Standards Codification ASC 815-10-50 (“ASC 815”), require certain disclosures. The disclosures are intended to provide users of financial statements with an understanding of the use of derivative instruments by the Fund and how these derivatives affect the financial position, financial performance and cash flows of the Fund. The Fund does not designate any derivative instruments as hedging instruments under ASC 815. During the six months ended March 31, 2011, the Fund’s principal exposure to derivative financial instruments of the type addressed by ASC 815 was investment in foreign exchange contracts. A foreign exchange contract is an agreement between two parties to exchange different currencies at a specified rate of exchange at an agreed upon future date. Foreign exchange contracts involve risks to the Fund, including the risk that a contract counterparty will not meet its obligations to the Fund, the risk that a change in a contract’s value may not correlate perfectly with the currency the contract was intended to track, and the risk that the Fund’s advisor is unable to correctly implement its strategy in using a contract. In any such instance, the Fund may not achieve the intended benefit of entering into a contract, and may experience a loss.
The Fund entered into forward currency contracts during the six months ended March 31, 2011 in the normal course of pursuing its investment objectives, in anticipation of purchasing foreign investments or with the intent of reducing the risk to the value of the Fund’s foreign investments from adverse changes in the relationship between the U.S. dollar and foreign currencies. In each case these contracts have been initiated in conjunction with foreign investment transactions.
These contracts are accounted for by the Fund under ASC 815. Unrealized gains and unrealized losses on outstanding contracts are reported in the Fund’s Statement of Assets and Liabilities at the Fund’s net equity, as measured by the difference between the forward exchange rates at the reporting date and the forward exchange rates at each contract’s inception date. Net realized gain (loss) on contracts closed during the period, and changes in net unrealized appreciation (depreciation) on outstanding contracts are recognized in the Fund’s Statement of Operations.
The following table displays the outstanding forward currency contracts, at March 31, 2011:
Outstanding Forward Currency Contracts
to Buy or Sell at March 31, 2011
| | | | | | | | | | | | | | | | | | | | | | | | |
Contract Description | | Buy/Sell | | | Contract
Amount | | | Contract
Value Date | | | Value
USD | | | Unrealized
Appreciation | | | Unrealized
Depreciation | |
Euro | | | Sell | | | | 1,525,600 | | | | 08/18/2011 | | | | 2,155,623 | | | $ | — | | | $ | (103,585 | ) |
| | | | | | | | | | | | | | | | | | | | | | | | |
Total | | | | | | | | | | | | | | | | | | $ | — | | | $ | (103,585 | ) |
| | | | | | | | | | | | | | | | | | | | | | | | |
34 Certified Semi-Annual Report
| | |
| NOTES TO FINANCIAL STATEMENTS, CONTINUED | | |
| |
| Thornburg Strategic Income Fund | | March 31, 2011 (Unaudited) |
The unrealized appreciation (depreciation) of the outstanding forward currency contracts recognized in the Fund’s Statement of Assets and Liabilities at March 31, 2011 is disclosed in the following table:
Fair Values of Derivative Financial Instruments
at March 31, 2011
| | | | | | |
Liability Derivatives | | Balance Sheet Location | | Fair Value | |
Foreign exchange contracts | | Liabilities - Unrealized depreciation on forward currency contracts | | $ | (103,585 | ) |
The realized gains (losses) from forward currency contracts, and the change in unrealized appreciation (depreciation) of outstanding forward currency contracts recognized in the Fund’s Statement of Operations for the six months ended March 31, 2011 are disclosed in the following tables:
Amount of Realized Gain (Loss) on Derivative
Financial Instruments Recognized in Income for the
Six Months Ended March 31, 2011
| | | | | | | | |
| | | Total | | | Forward
currency
contracts | |
Foreign exchange contracts | | $ | (88,173 | ) | | $ | (88,173 | ) |
Change in Unrealized Appreciation (Depreciation)
of Derivative Financial Instruments Recognized in
Income for the Six Months Ended March 31, 2011
| | | | | | | | |
| | | Total | | | Forward
currency
contracts | |
Foreign exchange contracts | | $ | 2,965 | | | $ | 2,965 | |
OTHER NOTES
Fund management believes no events have occurred between March 31, 2011 and May 20, 2011, the date of issuance of the financial statements, which require adjustment of, or disclosure in, the accompanying financial statements.
Certified Semi-Annual Report 35
| | |
| FINANCIAL HIGHLIGHTS | | |
| |
| Thornburg Strategic Income Fund | | |
| | | | | | | | | | | | | | | | | | | | | | | | | | | | | | | | | | | | | | | | | | | | | | | | | | | | | | | | | | | | |
| | | PER SHARE PERFORMANCE (for a share outstanding throughout the period)+ | | | RATIOS TO AVERAGE NET ASSETS | | | SUPPLEMENTAL DATA | |
Unless
Otherwise
Noted,
Periods
are
Fiscal
Years
Ended
Sept. 30, | | Net Asset
Value
Beginning
of
Period | | | Net
Investment
Income
(Loss) | | | Net
Realized
&
Unrealized
Gain (Loss)
on
Investments | | | Total from
Investment
Operations | | | Dividends
from Net
Investment
Income | | | Dividends
from Net
Realized
Gains | | | Total
Dividends | | | Net
Asset
Value
End
of
Period | | | Net
Investment
Income
(Loss)
(%) | | | Expenses,
After
Expense
Reductions
(%) | | | Expenses,
After
Expense
Reductions
and
Net of
Custody
Credits
(%) | | | Expenses,
Before
Expense
Reductions
(%) | | | Total
Return
(%)(a) | | | Portfolio
Turnover
Rate (%) | | | Net Assets
at End of
Period
(Thousands) | |
Class A Shares | |
2011(b)(c) | | $ | 12.35 | | | | 0.39 | | | | 0.32 | | | | 0.71 | | | | (0.40 | ) | | | (0.28 | ) | | | (0.68 | ) | | $ | 12.38 | | | | 6.42 | (d) | | | 1.25 | (d) | | | 1.25 | (d) | | | 1.31 | (d) | | | 5.93 | | | | 28.07 | | | $ | 92,082 | |
2010(c) | | $ | 11.63 | | | | 0.81 | | | | 0.77 | | | | 1.58 | | | | (0.81 | ) | | | (0.05 | ) | | | (0.86 | ) | | $ | 12.35 | | | | 6.86 | | | | 1.25 | | | | 1.25 | | | | 1.35 | | | | 14.07 | | | | 38.87 | | | $ | 83,822 | |
2009(c) | | $ | 10.57 | | | | 0.78 | | | | 1.06 | | | | 1.84 | | | | (0.78 | ) | | | — | | | | (0.78 | ) | | $ | 11.63 | | | | 7.66 | | | | 1.25 | | | | 1.25 | | | | 1.49 | | | | 18.67 | | | | 47.88 | | | $ | 57,853 | |
2008(c)(e) | | $ | 11.94 | | | | 0.59 | | | | (1.41 | ) | | | (0.82 | ) | | | (0.55 | ) | | | — | | | | (0.55 | ) | | $ | 10.57 | | | | 6.51 | (d) | | | 1.27 | (d) | | | 1.25 | (d) | | | 1.79 | (d) | | | (7.18 | ) | | | 36.22 | | | $ | 18,538 | |
|
Class C Shares | |
2011(b) | | $ | 12.34 | | | | 0.36 | | | | 0.31 | | | | 0.67 | | | | (0.36 | ) | | | (0.28 | ) | | | (0.64 | ) | | $ | 12.37 | | | | 5.87 | (d) | | | 1.80 | (d) | | | 1.80 | (d) | | | 2.08 | (d) | | | 5.66 | | | | 28.07 | | | $ | 91,280 | |
2010 | | $ | 11.62 | | | | 0.75 | | | | 0.77 | | | | 1.52 | | | | (0.75 | ) | | | (0.05 | ) | | | (0.80 | ) | | $ | 12.34 | | | | 6.31 | | | | 1.80 | | | | 1.80 | | | | 2.12 | | | | 13.48 | | | | 38.87 | | | $ | 81,841 | |
2009 | | $ | 10.57 | | | | 0.73 | | | | 1.04 | | | | 1.77 | | | | (0.72 | ) | | | — | | | | (0.72 | ) | | $ | 11.62 | | | | 7.13 | | | | 1.79 | | | | 1.79 | | | | 2.29 | | | | 17.95 | | | | 47.88 | | | $ | 51,789 | |
2008(e) | | $ | 11.94 | | | | 0.55 | | | | (1.42 | ) | | | (0.87 | ) | | | (0.50 | ) | | | — | | | | (0.50 | ) | | $ | 10.57 | | | | 5.96 | (d) | | | 1.82 | (d) | | | 1.80 | (d) | | | 2.65 | (d) | | | (7.57 | ) | | | 36.22 | | | $ | 13,829 | |
|
Class I Shares | |
2011(b) | | $ | 12.35 | | | | 0.41 | | | | 0.32 | | | | 0.73 | | | | (0.43 | ) | | | (0.28 | ) | | | (0.71 | ) | | $ | 12.37 | | | | 6.71 | (d) | | | 0.96 | (d) | | | 0.96 | (d) | | | 0.99 | (d) | | | 6.13 | | | | 28.07 | | | $ | 75,761 | |
2010 | | $ | 11.64 | | | | 0.85 | | | | 0.75 | | | | 1.60 | | | | (0.84 | ) | | | (0.05 | ) | | | (0.89 | ) | | $ | 12.35 | | | | 7.13 | | | | 0.98 | | | | 0.98 | | | | 1.00 | | | | 14.27 | | | | 38.87 | | | $ | 73,011 | |
2009 | | $ | 10.58 | | | | 0.81 | | | | 1.05 | | | | 1.86 | | | | (0.80 | ) | | | — | | | | (0.80 | ) | | $ | 11.64 | | | | 7.94 | | | | 0.99 | | | | 0.99 | | | | 1.12 | | | | 18.95 | | | | 47.88 | | | $ | 44,319 | |
2008(e) | | $ | 11.94 | | | | 0.63 | | | | (1.42 | ) | | | (0.79 | ) | | | (0.57 | ) | | | — | | | | (0.57 | ) | | $ | 10.58 | | | | 6.81 | (d) | | | 1.01 | (d) | | | 0.99 | (d) | | | 1.44 | (d) | | | (6.90 | ) | | | 36.22 | | | $ | 15,145 | |
| (a) | Not annualized for periods less than one year. |
| (b) | Unaudited Six Month Period Ended March 31. |
| (c) | Sales loads are not reflected in computing total return. |
| (e) | Fund commenced operations on December 19, 2007. |
| + | Based on weighted average shares outstanding. |
See notes to financial statements.
| | |
| 36 Certified Semi-Annual Report | | Certified Semi-Annual Report 37 |
| | |
| EXPENSE EXAMPLE | | |
| |
| Thornburg Strategic Income Fund | | March 31, 2011 (Unaudited) |
As a shareholder of the Fund, you incur two types of costs:
| | (1) | transaction costs, including |
(a) sales charges (loads) on purchase payments for Class A shares;
(b) a deferred sales charge on redemptions of any part or all of a purchase of $1 million of Class A shares within 12 months of purchase;
(c) a deferred sales charge on redemptions of Class C shares within 12 months of purchase;
| | (2) | ongoing costs, including management fees; distribution and/or service (12b-1) fees; and other Fund expenses. |
This example is intended to help you understand your ongoing costs (in dollars) of investing in the Fund and to compare these costs with the ongoing costs of investing in other mutual funds.
The example is based on a $1,000 investment beginning on October 1, 2010, and held until March 31, 2011.
ACTUAL EXPENSES
For each class of shares, the first line of the table at right provides information about actual account values and actual expenses. You may use the information in this line, together with the amount you invested, to estimate the expenses that you paid over the period. Simply divide your account value by $1,000 (for example, an $8,600 account value divided by $1,000 = 8.6), then multiply the result by the number in the first line for your class of shares under the heading entitled “Expenses Paid During Period” to estimate the expenses you paid on your account during this period.
HYPOTHETICAL EXAMPLE FOR COMPARISON PURPOSES
For each class of shares, the second line of the table at right provides information about hypothetical account values and hypothetical expenses based on the Fund’s actual expense ratio and an assumed rate of return of 5% per year before expenses, which is not the Fund’s actual return. The hypothetical account values and expenses may not be used to estimate the actual ending account balance or expenses you paid for the period. You may use this information to compare the ongoing costs of investing in the Fund and other funds. To do so, compare this 5% hypothetical example with the 5% hypothetical examples that appear in the shareholder reports of the other funds.
| | | | | | | | | | | | |
| | | Beginning
Account Value
10/1/10 | | | Ending
Account Value
3/31/11 | | | Expenses Paid
During Period†
10/1/10–3/31/11 | |
Class A Shares | | | | | | | | | | | | |
Actual | | $ | 1,000.00 | | | $ | 1,059.30 | | | $ | 6.42 | |
Hypothetical* | | $ | 1,000.00 | | | $ | 1,018.70 | | | $ | 6.29 | |
Class C Shares | | | | | | | | | | | | |
Actual | | $ | 1,000.00 | | | $ | 1,056.60 | | | $ | 9.21 | |
Hypothetical* | | $ | 1,000.00 | | | $ | 1,015.97 | | | $ | 9.03 | |
Class I Shares | | | | | | | | | | | | |
Actual | | $ | 1,000.00 | | | $ | 1,061.30 | | | $ | 4.92 | |
Hypothetical* | | $ | 1,000.00 | | | $ | 1,020.16 | | | $ | 4.82 | |
| † | Expenses are equal to the annualized expense ratio for each class (A: 1.25%; C: 1.80%; I: 0.96%) multiplied by the average account value over the period, multiplied by 182/365 to reflect the one-half year period. |
| * | Hypothetical assumes a rate of return of 5% per year before expenses. |
Please note that the expenses shown in the table are meant to highlight your ongoing costs only and do not reflect any transactional costs, such as sales charges (loads), redemption fees, or exchange fees. Therefore, the second line of the table for each class of shares is useful in comparing ongoing costs only, and will not help you determine the relative total costs of owning different funds. In addition, if these transactional costs were included, your costs would have been higher.
38 Certified Semi-Annual Report
| | |
| OTHER INFORMATION | | |
| |
| Thornburg Strategic Income Fund | | March 31, 2011 (Unaudited) |
PORTFOLIO PROXY VOTING Policies and Procedures:
The Trust has delegated to Thornburg Investment Management, Inc. (the “Advisor”) voting decisions respecting proxies for the Fund’s voting securities. The Advisor makes voting decisions in accordance with its Proxy Voting Policy and Procedures. A description of the Policy and Procedures is available (i) without charge, upon request, by calling the Advisor toll-free at 1-800-847-0200, (ii) on the Thornburg web site at www.thornburg.com, and (iii) on the Securities and Exchange Commission’s web site at www.sec.gov.
Information regarding how proxies were voted is available on or before August 31 of each year for the twelve months ending the preceding June 30. This information is available (i) without charge, upon request by calling the Advisor toll-free at 1-800-847-0200, (ii) on the Thornburg web site at www.thornburg.com, and (iii) on the Securities and Exchange Commission’s web site at www.sec.gov.
AVAILABILITY OF QUARTERLY PORTFOLIO SCHEDULE
The Fund files with the Securities and Exchange Commission schedules of its portfolio holdings on Form N-Q for the first and third quarters of each fiscal year. The Fund’s Forms N-Q are available on the Commission’s web site at www.sec.gov, or may be reviewed and copied at the Commission’s Public Reference Room in Washington, D.C. Information on the operation of the Public Reference Room may be obtained by calling 1-800-SEC-0330. The Fund also makes this information available on its web site at www.thornburg. com/download or upon request by calling 1-800-847-0200.
Certified Semi-Annual Report 39
Trustees’ Statement to Shareholders
Not part of the Certified Semi-Annual Report
February 8, 2005, as readopted September 13, 2010
The Trustees are concerned that ongoing commentaries and opinions reported in the media may confuse investors in general as to the supervisory duties of trustees of mutual funds and, in particular, leave Thornburg Investment Trust shareholders uncertain regarding how we discharge our responsibilities in supervising the Funds’ investment advisor and in reviewing the advisor’s contract for renewal. We decided to spell out clearly three principal guidelines that we follow in supervising the Trust’s investment advisor on your behalf.
We begin with the premise that each shareholder selected his or her Fund because its investments are managed by the investment advisor identified in the prospectus and in accordance with the objective and policies described in the prospectus. We realize, as each of you do, that if you believe that your Fund’s stated objective and policies no longer serve your personal investment goals, you can sell your shares and leave the Fund.
Therefore, we believe that our primary supervisory task – our principal obligation to you – is to assess the nature and quality of the advisor’s services, and to confirm that the advisor actively and competently pursues the Fund’s objective, in accordance with the policies set out in the prospectus. To do this, we meet regularly with management to review your Fund’s portfolio and to discuss the advisor’s specific actions and judgments in pursuing the Fund’s objective. We do not substitute our own judgment for the advisor’s decisions in selecting investments; the advisor is paid to exercise its informed judgment on investment decisions, and we seek to confirm, in reviewing the advisor’s performance, that the advisor is doing just that.
Second, while we are conscious of costs and the effect that costs have on shareholders’ returns, we do not seek the lowest fees or expense ratio as our sole or primary objective. We try to make sure that your Fund’s fees and costs are reasonable in relationship to the services rendered and that they are generally in line with those charged by other expert investment advisors, consistent with our belief that the Fund’s investors searched for and expect that expertise and attention and have decided to pay a reasonable price for it. We do not put the management contract “out to bid” as a matter of course, and we would not do so unless we had concluded that the advisor materially had failed to pursue the Fund’s objectives in accordance with its policies, or for other equally important reasons. We believe that any other approach would be inconsistent with your interests and contrary to your expectations when you bought shares of the Fund in the first place.
Finally, because we believe that most Thornburg Fund shareholders have invested with a long-term perspective, we try not to focus too much on the fashions of the moment and on short-term performance. The market will not favor any specific investment objective or set of policies at all times and under all economic circumstances. A fund will experience periods of both high and low returns relative to other funds and other investments. Even if one of our Funds is not favored by the market at a particular time, we believe that the advisor is nonetheless obliged to remain true to the Fund’s objective and policies, and we watch to see that it does so.
40 This page is not part of the Semi-Annual Report.
Retirement and Education Accounts
Thornburg Investment Management offers retirement and education savings accounts that can help you meet a variety of planning challenges. For account applications or further information on any of the accounts below, please call 1-800-847-0200 or go to www.thornburg.com/ira. Your financial advisor can help you determine which plan is right for you.
Individual Retirement Accounts
Individual Retirement Accounts (IRAs) provide a tax-advantaged means to save money for the future. For a detailed outline of the difference between retirement accounts, see www.thornburg.com/ira. Rollovers are available. Call 1-800-847-0200 for more information.
Traditional IRAs – Contributions to Traditional IRAs are tax deductible for eligible individuals, and withdrawals are taxed as additional ordinary income. You may contribute to an IRA if you receive compensation and are under 70 1/2, even if you are covered by an employer retirement plan. Deductible contributions are subject to certain qualifications. Please consult your tax advisor.
Roth IRAs – Under a Roth IRA, there is no tax deduction for contributions, but there is no income tax on qualified withdrawals. For a more detailed comparison of Traditional and Roth IRAs, please see our web site at www.thornburg.com/ira.
SEP IRAs – Simplified Employee Pension (SEP) IRAs are established by employers. The employer is allowed a tax deduction for contributions made to the SEP Plan and makes contributions to each eligible employee’s SEP IRA on a discretionary basis.
SIMPLE IRAs – Savings Incentive Match Plan for Employees of Small Employers (SIMPLE) is designed to give small business owners a simplified method to establish and contribute to a retirement plan for employees. The employer is allowed a tax deduction for contributions and makes either matching or non-elective contributions to each eligible employee’s SIMPLE IRA. Employees may make salary deferral contributions.
Coverdell Education Savings Account
These savings accounts are designed to provide a way to save money for higher education expenses. In an Education Savings Account, earnings and interest grow tax-free, and qualified withdrawals used to pay for eligible higher-education expenses are tax- and penalty-free.
Funds Available
The following funds are available in the accounts listed above:
| | • | | Thornburg International Value Fund |
| | • | | Thornburg Core Growth Fund |
| | • | | Thornburg Instment Income Builder Fund |
| | • | | Thornburg Global Opportunities Fund |
| | • | | Thornburg International Growth Fund |
| | • | | Thornburg Developing World Fund |
| | • | | Thornburg Limited Term U.S. Government Fund |
| | • | | Thornburg Limited Term Income Fund |
| | • | | Thornburg Strategic Income Fund |
This page is not part of the Semi-Annual Report. 41

Thornburg Equity Funds
Thornburg’s equity research uses a fundamental and comprehensive analytical approach. Thornburg equity funds focus on a limited number of securities so that each holding can impact performance. The equity team searches for firms believed to have a promising future and seeks to buy shares of those companies at a discount to their intrinsic value.
| | • | | Thornburg International Value Fund |
| | • | | Thornburg Core Growth Fund |
| | • | | Thornburg Investment Income Builder Fund |
| | • | | Thornburg Global Opportunities Fund |
| | • | | Thornburg International Growth Fund |
| | • | | Thornburg Developing World Fund |
Thornburg Bond Funds
Thornburg Investment Management applies a disciplined philosophy to fixed-income management. Since the launch of our first fixed-income fund over 25 years ago, we have been conducting fundamental, bottom-up research in an effort to identify bonds which we believe provide the best return for a given level of risk. We are very organic in our approach, avoiding leverage or complex strategies which could backfire in periods of market uncertainty.
| | • | | Thornburg Limited Term Municipal Fund |
| | • | | Thornburg Intermediate Municipal Fund |
| | • | | Thornburg California Limited Term Municipal Fund |
| | • | | Thornburg New Mexico Intermediate Municipal Fund |
| | • | | Thornburg New York Intermediate Municipal Fund |
| | • | | Thornburg Strategic Municipal Income Fund |
| | • | | Thornburg Limited Term U.S. Government Fund |
| | • | | Thornburg Limited Term Income Fund |
| | • | | Thornburg Strategic Income Fund |
Before investing, carefully consider the Fund’s investment goals, risks, charges, and expenses. For a prospectus containing this and other information, contact your financial advisor or visit thornburg. com. Read it carefully before investing.
For additional information, please visit www.thornburg.com
Thornburg Investment Management, Inc. 2300 North Ridgetop Road, Santa Fe, NM 87506
This page is not part of the Semi-Annual Report. 43
| | | | | | |
 | | Waste not, Wait not | |  |
| | |
| | | | Get instant access to your shareholder reports. |
| | |
| | This Semi-Annual Report is submitted for the general information of shareholders of the Fund. It is not authorized for distribution to prospective investors in the Fund unless preceded or accompanied by an effective prospectus. | | By switching from your postal mailbox to your email inbox, you reduce paper clutter, improve record keeping access, and help conserve our natural resources. |
| | |
 | | Investment Advisor: Thornburg Investment Management® 800.847.0200 | | Go to www.thornburg.com/edelivery and sign up to receive your shareholder reports, prospectuses, and proxy statements electronically. |
| | | | |
| | Distributor: | | |
| | Thornburg Securities Corporation® 800.847.0200 | | You invest in the future, without spending a dime. |
| | TH1663 | | |

Important Information
The information presented on the following pages was current as of March 31, 2011. The managers’ views, portfolio holdings, and sector diversification are provided for the general information of the Fund’s shareholders; they are historical and subject to change. This material should not be deemed a recommendation to buy or sell any of the securities mentioned.
Investments in the Fund carry risks, including possible loss of principal. Special risks may be associated with investments outside the United States, especially in emerging markets, including currency fluctuations, illiquidity and volatility. Investments in small capitalization companies may increase the risk of greater price fluctuations. Please see the Fund’s Prospectus for a discussion of the risks associated with an investment in the Fund. Investments in the Fund are not FDIC insured, nor are they deposits of or guaranteed by a bank or any other entity. There is no guarantee that the Fund will meet its investment objectives. Funds invested in a limited number of holdings may expose an investor to greater volatility.
Performance data given at net asset value (NAV) does not take into account the applicable sales charges. If the sales charges had been included, the performance would have been lower.
Class I, R3, R4, and R5 shares may not be available to all investors. Minimum investments for Class I shares may be higher than those for other classes.
| | | | |
Share Class | | NASDAQ Symbol | | Cusip |
Class A | | TVAFX | | 885-215-731 |
Class B | | TVBFX | | 885-215-590 |
Class C | | TVCFX | | 885-215-715 |
Class I | | TVIFX | | 885-215-632 |
Class R3 | | TVRFX | | 885-215-533 |
Class R4 | | TVIRX | | 885-215-277 |
Class R5 | | TVRRX | | 885-215-376 |
Morningstar rankings: © 2011 Morningstar, Inc. All Rights Reserved. The information contained herein: (1) is proprietary to Morningstar and/or its content providers; (2) may not be copied or distributed; and (3) is not warranted to be accurate, complete or timely. Neither Morningstar nor its content providers are responsible for any damages or losses arising from any use of this information.
Glossary
S&P 500 Index – The S&P 500 Index is a broad measure of the U.S. stock market.
Unless otherwise noted, index returns reflect the reinvestment of income dividends and capital gains, if any, but do not reflect fees, brokerage commissions or other expenses of investing. Investors may not make direct investments into any index. The performance of any index is not indicative of the performance of any particular investment.
Alpha – A measure of the difference between a fund’s actual returns and its expected performance, given its level of risk as measured by beta.
Beta – A measure of market-related risk. Less than one means the portfolio is less volatile than the index, while greater than one indicates more volatility than the index.
Forward P/E – Price to earnings ratio, using earnings estimates for the next four quarters.
Median Market Capitalization – Market capitalization (market cap) is the total value of a company’s stock, calculated by multiplying the number of outstanding common shares by the current share price. The company whose market cap is in the middle of the portfolio is the median market cap. Half the companies in the portfolio have values greater than the median and half have values that are less.
Price to Book Value (P/B) – A ratio used to compare a stock’s market value to its book value. It is calculated by dividing the current closing price of the stock by the latest quarter’s book value (book value is simply assets minus liabilities).
Price to Cash Flow Ratio – A measure of the market’s expectations of a firm’s future financial health. It is calculated by dividing the price per share by cash flow per share.
Price to Earnings Ratio (P/E) – A valuation ratio equaling a company’s market value per share divided by earnings per share.
This page is not part of the Semi-Annual Report. 3
Thornburg Value Fund

IMPORTANT
PERFORMANCE INFORMATION
Performance data shown represents past performance and is no guarantee of future results. Investment return and principal value will fluctuate so shares, when redeemed, may be worth more or less than their original cost. Current performance may be lower or higher than quoted. For performance current to the most recent month end, visit thornburg.com or call 800.847.0200.
The maximum sales charge for Class A shares is 4.50%. Class A shares are subject to a 1% 30-day redemption fee. The total annual fund operating expense of Class A shares is 1.31%, as disclosed in the most recent Prospectus.
Finding Promising Companies at a Discount
The Thornburg Value Fund seeks to find promising companies at a discounted valuation. It differs from many other equity funds in two key ways. First, it focuses on a limited number of stocks, and second, it takes a more comprehensive approach to value investing.
Our team is dedicated to providing value to shareholders. We accomplish this through the application of seasoned investment principles with hands-on, company-oriented research. We use a collaborative research approach in identifying and analyzing investment ideas. Our focus is on finding promising companies available at a discount to our estimate of their intrinsic value.
In managing the Thornburg Value Fund, we take a bottom-up approach to stock selection. The Fund is not predisposed to an industry or sector. We use a combination of financial analysis, collaborative research, and business evaluation in an effort to gauge the intrinsic value of a company based on its past record and future potential. The continuum of process moves from screens and idea generation, through conventional “Wall Street” research and documentation, to company contact, the last often including on-site visits. The focus of the analysis is on what’s behind the numbers, its revenue and cash-generating model. We make an effort to get to know the company’s reputation in the industry, its people and its corporate culture.
AVERAGE ANNUAL TOTAL RETURNS
FOR PERIODS ENDED 3/31/11
| | | | | | | | | | | | | | | | | | | | |
| | | 1 Yr | | | 3 Yrs | | | 5 Yrs | | | 10 Yrs | | | Since
Inception | |
A Shares (Incep: 10/2/95) | | | | | | | | | | | | | | | | | | | | |
Without sales charge | | | 13.55 | % | | | 4.55 | % | | | 4.14 | % | | | 4.34 | % | | | 10.32 | % |
With sales charge | | | 8.45 | % | | | 2.96 | % | | | 3.18 | % | | | 3.86 | % | | | 10.00 | % |
S&P 500 Index | | | | | | | | | | | | | | | | | | | | |
(Since 10/2/95) | | | 15.65 | % | | | 2.35 | % | | | 2.62 | % | | | 3.29 | % | | | 7.37 | % |
4 This page is not part of the Semi-Annual Report.
The current posture is to maintain a portfolio of 40–55 companies diversified by sector, industry, market capitalization, and our three categories of stocks: Basic Value, Consistent Earners and Emerging Franchises. Because of the limited number of stocks in the portfolio, every holding counts. At the time of purchase, we set a 12–18 month price target for each stock. The target is reviewed as the fundamentals of the stock change during the course of ownership.
The bottom line? Engendering a wide-open, collegial environment fosters information flow and critical thinking intended to benefit portfolio decision making. We do not view our location in Santa Fe, New Mexico, as a disadvantage. While we have access to the best of Wall Street’s analysis, we are not ruled by it. Distance from the crowd serves to fortify independent and objective thinking.
STOCKS CONTRIBUTING AND DETRACTING
FOR THE SIX MONTHS ENDED 3/31/11
| | |
Top Contributors | | Top Detractors |
| Inpex Corp. | | Bank of America Corp. |
| SandRidge Energy, Inc. | | Best Buy Co., Inc. |
| Baker Hughes, Inc. | | China Mobile Ltd. |
| Monsanto Co. | | AllianceBernstein Holding L.P. |
| OAO Gazprom ADR | | Yahoo!, Inc. |
| |
| Source: FactSet | | |
KEY PORTFOLIO ATTRIBUTES
As of 3/31/11
| | | | |
Portfolio P/E Trailing 12-months* | | | 14.2x | |
| |
Portfolio Price to Cash Flow* | | | 7.2x | |
| |
Portfolio Price to Book Value* | | | 1.6x | |
| |
Median Market Cap* | | $ | 19.6 B | |
| |
7-Year Beta (A Shares vs. S&P 500)* | | | 1.09 | |
| |
Number of Companies | | | 48 | |
| |
* Source: FactSet | | | | |
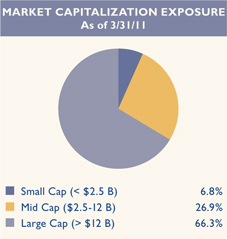
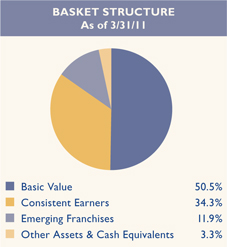
This page is not part of the Semi-Annual Report. 5

Thornburg Value Fund
March 31, 2011
This report is certified under the Sarbanes-Oxley Act of 2002, which requires that public companies, including mutual funds, affirm that the information provided in their annual and semiannual shareholder reports fully and fairly represents their financial position.
6 Certified Semi-Annual Report
Letter to Shareholders
| | |


| | April 19, 2011 |
| | Dear Fellow Shareholders, |
| | We are happy to report that the first half of fiscal 2011 was good from both an absolute and relative return perspective. From September 30, 2010 through March 31, 2011, the Thornburg Value Fund was up 21.25% (Class A shares, without sales charge), better than the S&P 500 Index during the same period, which was up 17.31%. In our most recent annual letter we wrote, “Most of the investments that have been a drag on our performance this year are sound businesses with good growth prospects and attractive valuations.” While the portfolio has not changed materially since the end of our last fiscal year, the market’s perception of our holdings has improved dramatically. |
| | The equity market has been resilient in the face of major shocks. Political turmoil in the Middle East has helped drive the price of oil above $100 per barrel. The problems of the peripheral countries in Europe threaten the European banking system and European growth in general. The earthquake and tsunami in Japan have shaken the world’s third largest economy. We attribute the resilience of the stock market to the supportive combination of expansionary monetary policy and fiscal policy, cyclical recovery in companies’ earnings, and attractive valuations. Looking forward, we expect less supportive monetary and fiscal policies and less benefit from cyclical recovery. The uncertainty created by the shocks described above may resolve itself in a benign fashion, which would be bullish for equities. On the other hand, major weakness in Europe or another large upward move in oil prices could be more damaging to share prices because the current macro backdrop is less supportive. Overall, our performance was driven by stock selection during the period, rather than by sector positioning. In particular, stocks within the energy sector were our best performing. Inpex, Sandridge Energy, and Baker Hughes led the way within the energy sector. Japan’s leading oil company, Inpex, has a major liquefied natural gas (LNG) project called Ichthys. Prior to our investment in the company, Inpex announced a delay in Ichthys and then issued equity to fund the project. Investors were angry about the mixed signals and the share price was almost cut in half between April and August of 2010. We used the share price weakness to establish a position in Inpex because we believed management’s actions were reasonable and Ichthys was likely to benefit prospectively. The share price has recovered sharply as more investors have become comfortable with Ichthys. Sandridge Energy made an impressive transition from being a nearly pure play on natural gas to becoming a company whose earnings and reserves were primarily oil and whose oil production growth rate was impressive. Investors were skeptical as Sandridge made multiple strategic moves and the |
Certified Semi-Annual Report 7
Letter to Shareholders,
Continued
share price has been extraordinarily volatile, but we believe the strategy is showing clear signs of success. Baker Hughes is one of the three leading global oilfield service companies. Investors were discouraged by the lack of activity in the Gulf of Mexico, but the global oilfield service market is experiencing strong growth that appears to be sustainable for a number of years, and we believe Baker Hughes may have more operating leverage than its peers during this up cycle.
Monsanto rebounded strongly after weak performance last year. Corn prices have risen dramatically, and Monsanto’s yield-improving seeds are in high demand. For the time being, Monsanto is not charging as high a price as it could for its current generation of seeds, given the very high corn prices. This should lead to market share gains. Comcast was also a strong performer during the period, reached its price target, and was sold. Comcast has been a Value Fund holding for a long time; in a way, we’re sad to see it go. That said, it appears that video piracy over the Internet is becoming easier all the time, and the sale of Comcast (at a great price, no less) helps to reduce our portfolio risk to this phenomenon. We continue to own satellite provider Dish Network in the Fund.
A few holdings were weak during the period, including China Mobile, Eli Lilly, Exxon Mobil, Tokyo Steel and Best Buy. China Mobile and Eli Lilly have both recently been sold from the portfolio. China Mobile has an impressive balance sheet and market share in what should be a large and rapidly growing market, but we became convinced that the Chinese government was directing China Mobile to lose market share and preventing China Mobile from pursuing profitable opportunities. Eli Lilly’s drug pipeline is interesting, but their patent cliff issues are severe, and we have become concerned about the efficacy of their research and development spending.
Best Buy and Exxon Mobil were both purchased during the quarter. Unlike its peers, Exxon continued investing through the downturn in oil prices and we expect those investments to generate growth and high returns for the company. We became interested in Best Buy through our work on Best Buy Mobile, which is the leading independent seller of Smartphones in the United States. While the company faces some challenges, we are encouraged by growth in their high-margin Best Buy Mobile division and what we believe is an attractive valuation.
For Tokyo Steel, startup delays at its new steel plant in Tahara have impacted near-term output, but we expect plant production to ramp up this year. The company will supply steel to help Japan rebuild after the devastating earthquake and tsunami.
The Fund purchased shares of Yahoo! during the period. Yahoo! owns a collection of Asian assets that we believe justify the entire enterprise value of the company. This creates a “free” call option on the company’s U.S. search-and-display advertising businesses. The Asian assets include stakes in publicly traded Yahoo! Japan and Alibaba.com, but also a holding in the private company Alibaba Group. Alibaba Group has a leading share in China markets that are served by Amazon.com, Ebay.com and Paypal in the United States. These businesses are growing dramatically and have very exciting prospects. Yahoo!’s U.S. operation is not the growth business it
8 Certified Semi-Annual Report
once was, but it generates a lot of cash flow ($526 million of free cash flow in 2010) and some of that cash is being returned to shareholders (Yahoo! bought back 7% of outstanding shares in 2010).
During the semi-annual period your co-managers celebrated five years at the helm of the Thornburg Value Fund (Ed and Connor were named co-managers in February 2006, first with Bill Fries, who concluded his service as portfolio manager of the Fund in January 2010). We are happy to report that in the five years through February 28, 2011, the Thornburg Value Fund (Class A shares) was in the top 9th percentile among 1,458 Large Blend funds, ranked by total returns (without sales charge) according to Morningstar.1 While we are pleased with these results, we will of course work to do even better over the next five years.
Thank you for your continued trust,
| | |
Sincerely, | | |
| |

| |  |
| |
Connor Browne, CFA | | Edward E. Maran, CFA |
Co-Portfolio Manager | | Co-Portfolio Manager |
Managing Director | | Managing Director |
1 As of 3/31/11, the Thornburg Value Fund was ranked in the top 23% among 816 funds for the ten-year period, 13% among 1,471 over five years, 12% among 1,757 funds over three years, and 66% among 1,983 funds over one year. Past performance does not guarantee future results.
The matters discussed in this report may constitute forward-looking statements made pursuant to the safe harbor provisions of the Securities Litigation Reform Act of 1995. These include any advisor or portfolio manager prediction, assessment, analysis or outlook for individual securities, industries, investment styles, market sectors and/or markets. These statements involve risks and uncertainties. In addition to the general risks described for each fund in its current prospectus, other factors bearing on these reports include the accuracy of the advisor’s or portfolio manager’s forecasts and predictions, the appropriateness of the investment strategies designed by the advisor or portfolio manager, and the ability of the advisor or portfolio manager to implement their strategies efficiently and successfully. Any one or more of these factors, as well as other risks affecting the securities markets generally, could cause the actual results of any fund to differ materially as compared to its benchmarks.
Certified Semi-Annual Report 9
| | |
| SCHEDULE OF INVESTMENTS | | |
| |
| Thornburg Value Fund | | March 31, 2011 (Unaudited) |
TOP TEN HOLDINGS
As of 3/31/11
| | | | | | | | | | |
Inpex Corp. | | | 4.4 | % | | Fiserv, Inc. | | | 3.5 | % |
Google, Inc. | | | 4.2 | % | | Exxon Mobil Corp. | | | 3.3 | % |
Gilead Sciences, Inc. | | | 4.2 | % | | ING Groep N.V. | | | 3.2 | % |
Transocean Ltd. | | | 3.9 | % | | Baker Hughes, Inc. | | | 3.0 | % |
Dell, Inc. | | | 3.5 | % | | General Electric Co. | | | 2.8 | % |
SUMMARY OF INDUSTRY EXPOSURE
As of 3/31/11
| | | | | | | | | | |
Energy | | | 21.5 | % | | Retailing | | | 3.6 | % |
Software & Services | | | 14.8 | % | | Telecommunication Services | | | 3.5 | % |
Pharmaceuticals, Biotechnology & Life Sciences | | | 10.5 | % | | Capital Goods | | | 2.8 | % |
Materials | | | 7.2 | % | | Semiconductors & Semiconductor Equipment | | | 2.6 | % |
Diversified Financials | | | 6.9 | % | | Media | | | 1.5 | % |
Banks | | | 6.5 | % | | Consumer Services | | | 1.3 | % |
Technology Hardware & Equipment | | | 4.9 | % | | Consumer Durables & Apparel | | | 1.1 | % |
Health Care Equipment & Services | | | 4.2 | % | | Food & Staples Retailing | | | 0.2 | % |
Insurance | | | 3.6 | % | | Other Assets & Cash Equivalents | | | 3.3 | % |
| | | | | | | | |
| | | Shares/
Principal Amount | | | Value | |
COMMON STOCK — 95.70% | | | | | | | | |
| | |
BANKS — 6.52% | | | | | | | | |
COMMERCIAL BANKS — 6.52% | | | | | | | | |
Mitsubishi UFJ Financial Group, Inc. | | | 25,156,610 | | | $ | 116,135,348 | |
aSterling Financial Corp. | | | 2,272,729 | | | | 38,068,211 | |
Turkiye Garanti Bankasi A.S. | | | 20,567,300 | | | | 96,172,990 | |
U.S. Bancorp | | | 2,458,058 | | | | 64,966,473 | |
| | | | | | | | |
| | | | | | | 315,343,022 | |
| | | | | | | | |
CAPITAL GOODS — 2.83% | | | | | | | | |
INDUSTRIAL CONGLOMERATES — 2.83% | | | | | | | | |
General Electric Co. | | | 6,817,500 | | | | 136,690,875 | |
| | | | | | | | |
| | | | | | | 136,690,875 | |
| | | | | | | | |
CONSUMER DURABLES & APPAREL — 1.10% | | | | | | | | |
HOUSEHOLD DURABLES — 1.10% | | | 7,196,300 | | | | 53,252,620 | |
| | | | | | | | |
aPulte Group, Inc. | | | | | | | 53,252,620 | |
| | | | | | | | |
CONSUMER SERVICES — 1.35% | | | | | | | | |
HOTELS, RESTAURANTS & LEISURE — 1.35% | | | 1,746,636 | | | | 65,166,989 | |
| | | | | | | | |
aLife Time Fitness, Inc. | | | | | | | 65,166,989 | |
| | | | | | | | |
10 Certified Semi-Annual Report
| | |
| SCHEDULE OF INVESTMENTS, CONTINUED | | |
| |
| Thornburg Value Fund | | March 31, 2011 (Unaudited) |
| | | | | | | | |
| | | Shares/
Principal Amount | | | Value | |
DIVERSIFIED FINANCIALS — 6.95% | | | | | | | | |
CAPITAL MARKETS — 0.49% | | | | | | | | |
AllianceBernstein Holding LP | | | 1,079,195 | | | $ | 23,526,451 | |
DIVERSIFIED FINANCIAL SERVICES — 6.46% | | | | | | | | |
Bank of America Corp. | | | 6,210,400 | | | | 82,784,632 | |
aING Groep N.V. | | | 12,280,200 | | | | 155,430,589 | |
JPMorgan Chase & Co. | | | 1,614,625 | | | | 74,434,213 | |
| | | | | | | | |
| | | | | | | 336,175,885 | |
| | | | | | | | |
ENERGY — 21.45% | | | | | | | | |
ENERGY EQUIPMENT & SERVICES — 6.89% | | | | | | | | |
Baker Hughes, Inc. | | | 1,989,031 | | | | 146,054,547 | |
aTransocean Ltd. | | | 2,402,100 | | | | 187,243,695 | |
OIL, GAS & CONSUMABLE FUELS — 14.56% | | | | | | | | |
ConocoPhillips | | | 1,041,475 | | | | 83,172,193 | |
Exxon Mobil Corp. | | | 1,892,600 | | | | 159,224,438 | |
Inpex Corp. | | | 28,160 | | | | 213,620,582 | |
OAO Gazprom ADR | | | 3,869,420 | | | | 125,137,043 | |
aSandridge Energy, Inc. | | | 9,646,365 | | | | 123,473,472 | |
| | | | | | | | |
| | | | | | | 1,037,925,970 | |
| | | | | | | | |
FOOD & STAPLES RETAILING — 0.19% | | | | | | | | |
FOOD & STAPLES RETAILING — 0.19% | | | 8,717,107 | | | | 9,240,133 | |
| | | | | | | | |
aRite Aid Corp. | | | | | | | 9,240,133 | |
| | | | | | | | |
HEALTH CARE EQUIPMENT & SERVICES — 4.25% | | | | | | | | |
HEALTH CARE EQUIPMENT & SUPPLIES — 3.67% | | | | | | | | |
aAlere, Inc. | | | 2,029,900 | | | | 79,450,286 | |
aVarian Medical Systems, Inc. | | | 1,449,090 | | | | 98,016,447 | |
HEALTH CARE PROVIDERS & SERVICES — 0.58% | | | | | | | | |
aCommunity Health Systems, Inc. | | | 706,024 | | | | 28,233,900 | |
| | | | | | | | |
| | | | | | | 205,700,633 | |
| | | | | | | | |
INSURANCE — 3.59% | | | | | | | | |
INSURANCE — 3.59% | | | | | | | | |
aGenworth Financial, Inc. | | | 7,491,600 | | | | 100,836,936 | |
Hartford Financial Services Group, Inc. | | | 2,700,540 | | | | 72,725,542 | |
| | | | | | | | |
| | | | | | | 173,562,478 | |
| | | | | | | | |
MATERIALS — 6.61% | | | | | | | | |
CHEMICALS — 2.02% | | | | | | | | |
Monsanto Co. | | | 1,348,800 | | | | 97,464,288 | |
METALS & MINING — 4.59% | | | | | | | | |
bTokyo Steel Mfg. | | | 10,310,300 | | | | 120,357,073 | |
United States Steel Corp. | | | 1,888,600 | | | | 101,871,084 | |
| | | | | | | | |
| | | | | | | 319,692,445 | |
| | | | | | | | |
MEDIA — 1.50% | | | | | | | | |
MEDIA — 1.50% | | | 2,983,838 | | | | 72,686,294 | |
| | | | | | | | |
aDish Network Corp. | | | | | | | 72,686,294 | |
| | | | | | | | |
Certified Semi-Annual Report 11
| | |
| SCHEDULE OF INVESTMENTS, CONTINUED | | |
| |
| Thornburg Value Fund | | March 31, 2011 (Unaudited) |
| | | | | | | | |
| | | Shares/
Principal Amount | | | Value | |
PHARMACEUTICALS, BIOTECHNOLOGY & LIFE SCIENCES — 10.45% | | | | | | | | |
BIOTECHNOLOGY — 4.21% | | | | | | | | |
aGilead Sciences, Inc. | | | 4,797,905 | | | $ | 203,623,088 | |
LIFE SCIENCES TOOLS & SERVICES — 2.45% | | | | | | | | |
aThermo Fisher Scientific, Inc. | | | 2,139,665 | | | | 118,858,391 | |
PHARMACEUTICALS — 3.79% | | | | | | | | |
Eli Lilly & Co. | | | 3,167,730 | | | | 111,409,064 | |
Roche Holdings AG | | | 502,800 | | | | 71,820,751 | |
| | | | | | | | |
| | | | | | | 505,711,294 | |
| | | | | | | | |
RETAILING — 3.57% | | | | | | | | |
SPECIALTY RETAIL — 3.57% | | | | | | | | |
Best Buy Co., Inc. | | | 2,609,300 | | | | 74,939,096 | |
The Gap, Inc. | | | 4,315,100 | | | | 97,780,166 | |
| | | | | | | | |
| | | | | | | 172,719,262 | |
| | | | | | | | |
SEMICONDUCTORS & SEMICONDUCTOR EQUIPMENT — 2.57% | | | | | | | | |
SEMICONDUCTORS & SEMICONDUCTOR EQUIPMENT — 2.57% | | | | | | | | |
aMEMC Electronic Materials, Inc. | | | 6,469,851 | | | | 83,849,269 | |
aON Semiconductor Corp. | | | 4,126,527 | | | | 40,728,822 | |
| | | | | | | | |
| | | | | | | 124,578,091 | |
| | | | | | | | |
SOFTWARE & SERVICES — 14.82% | | | | | | | | |
INFORMATION TECHNOLOGY SERVICES — 5.39% | | | | | | | | |
aAmdocs Ltd. | | | 3,245,948 | | | | 93,645,600 | |
aFiserv, Inc. | | | 2,663,570 | | | | 167,059,110 | |
INTERNET SOFTWARE & SERVICES — 6.22% | | | | | | | | |
aGoogle, Inc. | | | 349,419 | | | | 204,832,912 | |
aYahoo!, Inc. | | | 5,770,600 | | | | 96,080,490 | |
SOFTWARE — 3.21% | | | | | | | | |
aANSYS, Inc. | | | 455,593 | | | | 24,688,585 | |
Microsoft Corp. | | | 5,160,500 | | | | 130,870,280 | |
| | | | | | | | |
| | | | | | | 717,176,977 | |
| | | | | | | | |
TECHNOLOGY HARDWARE & EQUIPMENT — 4.86% | | | | | | | | |
COMPUTERS & PERIPHERALS — 4.16% | | | | | | | | |
aDell, Inc. | | | 11,801,700 | | | | 171,242,667 | |
aNCR Corp. | | | 1,593,964 | | | | 30,030,282 | |
ELECTRONIC EQUIPMENT, INSTRUMENTS & COMPONENTS — 0.70% | | | | | | | | |
Corning, Inc. | | | 1,650,735 | | | | 34,054,663 | |
| | | | | | | | |
| | | | | | | 235,327,612 | |
| | | | | | | | |
TELECOMMUNICATION SERVICES — 3.09% | | | | | | | | |
DIVERSIFIED TELECOMMUNICATION SERVICES — 1.20% | | | | | | | | |
aLevel 3 Communications, Inc. | | | 39,653,356 | | | | 58,290,433 | |
WIRELESS TELECOMMUNICATION SERVICES — 1.89% | | | | | | | | |
KDDI Corp. | | | 14,762 | | | | 91,397,331 | |
| | | | | | | | |
| | | | | | | 149,687,764 | |
| | | | | | | | |
TOTAL COMMON STOCK (Cost $4,080,782,360) | | | | | | | 4,630,638,344 | |
| | | | | | | | |
12 Certified Semi-Annual Report
| | |
| SCHEDULE OF INVESTMENTS, CONTINUED | | |
| |
| Thornburg Value Fund | | March 31, 2011 (Unaudited) |
| | | | | | | | |
| | | Shares/
Principal Amount | | | Value | |
CONVERTIBLE BONDS — 1.00% | | | | | | | | |
MATERIALS — 0.63% | | | | | | | | |
METALS & MINING — 0.63% | | | | | | | | |
cAnglogold Holdings Ltd., 3.50%, 5/22/2014 | | $ | 25,000,000 | | | $ | 30,687,500 | |
| | | | | | | | |
| | | | | | | 30,687,500 | |
| | | | | | | | |
TELECOMMUNICATION SERVICES — 0.37% | | | | | | | | |
DIVERSIFIED TELECOMMUNICATION SERVICES — 0.37% | | | | | | | | |
Level 3 Communications, Inc., 6.50%, 10/1/2016 | | | 12,049,000 | | | | 17,636,724 | |
| | | | | | | | |
| | | | | | | 17,636,724 | |
| | | | | | | | |
TOTAL CONVERTIBLE BONDS (Cost $37,041,211) | | | | | | | 48,324,224 | |
| | | | | | | | |
SHORT TERM INVESTMENTS — 1.96% | | | | | | | | |
DCP Midstream LLC, 0.30%, 4/1/2011 | | | 50,000,000 | | | | 50,000,000 | |
Wellpoint, Inc., 0.20%, 4/1/2011 | | | 45,000,000 | | | | 45,000,000 | |
| | | | | | | | |
TOTAL SHORT TERM INVESTMENTS (Cost $95,000,000) | | | | | | | 95,000,000 | |
| | | | | | | | |
TOTAL INVESTMENTS — 98.66% (Cost $4,212,823,571) | | | | | | $ | 4,773,962,568 | |
OTHER ASSETS LESS LIABILITIES — 1.34% | | | | | | | 64,810,562 | |
| | | | | | | | |
NET ASSETS — 100.00% | | | | | | $ | 4,838,773,130 | |
| | | | | | | | |
Footnote Legend
| b | Investment in Affiliates - Holdings of voting securities of each portfolio company which is considered “affiliated” to the Fund under the Investment Company Act of 1940 because the Fund’s holding represented 5% or more of the company’s voting securities during the period, are shown below: |
| | | | | | | | | | | | | | | | | | | | | | | | |
Issuer | | Shares/Principal
September 30,
2010 | | | Gross
Additions | | | Gross
Reductions | | | Shares/Principal
March 31,
2011 | | | Market Value
March 31,
2011 | | | Investment
Income | |
Tokyo Steel Mfg.* | | | 7,435,600 | | | | 2,874,700 | | | | — | | | | 10,310,300 | | | $ | 120,357,073 | | | $ | 760,834 | |
| | | | | | | | | | | | | | | | | | | | | | | | |
Total non-controlled affiliated issuers – 2.49% of net assets | | | | | | | | | | | $ | 120,357,073 | | | $ | 760,834 | |
| | | | | | | | | | | | | | | | | | | | | | | | |
| * | Issuer not affiliated at September 30, 2010. |
| c | Securities exempt from registration under Rule 144A of the Securities Act of 1933, as amended. These securities may only be resold in the ordinary course of business in transactions exempt from registration, normally to qualified institutional buyers. As of March 31, 2011, the aggregate value of these securities in the Fund’s portfolio was $30,687,500, representing 0.63% of the Fund’s net assets. |
Portfolio Abbreviations
To simplify the listings of securities, abbreviations are used per the table below:
| | |
| ADR | | American Depository Receipt |
See notes to financial statements.
Certified Semi-Annual Report 13
| | |
| STATEMENT OF ASSETS AND LIABILITIES | | |
| |
| Thornburg Value Fund | | March 31, 2011 (Unaudited) |
| | | | |
ASSETS | | | | |
Investments at value | | | | |
Non-affiliated issuers (cost $4,089,187,585) (Note 2) | | $ | 4,653,605,495 | |
Non-controlled affiliated issuers (cost $123,635,986) (Note 2) | | | 120,357,073 | |
Cash | | | 1,366,523 | |
Receivable for investments sold | | | 80,643,971 | |
Receivable for fund shares sold | | | 13,217,293 | |
Unrealized appreciation on forward currency contracts (Note 7) | | | 5,382,962 | |
Dividends receivable | | | 6,256,680 | |
Dividend and interest reclaim receivable | | | 1,350,194 | |
Interest receivable | | | 715,044 | |
Prepaid expenses and other assets | | | 108,527 | |
| | | | |
Total Assets | | | 4,883,003,762 | |
| | | | |
| |
LIABILITIES | | | | |
Payable for securities purchased | | | 32,048,773 | |
Payable for fund shares redeemed | | | 6,361,975 | |
Unrealized depreciation on forward currency contracts (Note 7) | | | 235,256 | |
Payable to investment advisor and other affiliates (Note 3) | | | 3,931,263 | |
Accounts payable and accrued expenses | | | 1,635,110 | |
Dividends payable | | | 18,255 | |
| | | | |
Total Liabilities | | | 44,230,632 | |
| | | | |
| |
NET ASSETS | | $ | 4,838,773,130 | |
| | | | |
NET ASSETS CONSIST OF: | | | | |
Undistributed net investment income | | $ | 1,947,755 | |
Net unrealized appreciation on investments | | | 566,361,944 | |
Accumulated net realized gain (loss) | | | (618,125,376 | ) |
Net capital paid in on shares of beneficial interest | | | 4,888,588,807 | |
| | | | |
| | $ | 4,838,773,130 | |
| | | | |
14 Certified Semi-Annual Report
| | |
| STATEMENT OF ASSETS AND LIABILITIES, CONTINUED | | |
| |
| Thornburg Value Fund | | March 31, 2011 (Unaudited) |
| | | | |
NET ASSET VALUE: | | | | |
Class A Shares: | | | | |
Net asset value and redemption price per share ($1,245,745,338 applicable to 33,753,326 shares of beneficial interest outstanding - Note 4) | | $ | 36.91 | |
Maximum sales charge, 4.50% of offering price | | | 1.74 | |
| | | | |
Maximum offering price per share | | $ | 38.65 | |
| | | | |
| |
Class B Shares: | | | | |
Net asset value and offering price per share * ($22,608,914 applicable to 650,036 shares of beneficial interest outstanding - Note 4) | | $ | 34.78 | |
| | | | |
| |
Class C Shares: | | | | |
Net asset value and offering price per share * ($366,953,213 applicable to 10,411,088 shares of beneficial interest outstanding - Note 4) | | $ | 35.25 | |
| | | | |
| |
Class I Shares: | | | | |
Net asset value, offering and redemption price per share ($2,605,300,045 applicable to 69,331,340 shares of beneficial interest outstanding - Note 4) | | $ | 37.58 | |
| | | | |
| |
Class R3 Shares: | | | | |
Net asset value, offering and redemption price per share ($238,464,005 applicable to 6,505,191 shares of beneficial interest outstanding - Note 4) | | $ | 36.66 | |
| | | | |
| |
Class R4 Shares: | | | | |
Net asset value, offering and redemption price per share ($68,701,287 applicable to 1,863,990 shares of beneficial interest outstanding - Note 4) | | $ | 36.86 | |
| | | | |
| |
Class R5 Shares: | | | | |
Net asset value, offering and redemption price per share ($291,000,328 applicable to 7,753,500 shares of beneficial interest outstanding - Note 4) | | $ | 37.53 | |
| | | | |
| * | Redemption price per share is equal to net asset value less any applicable contingent deferred sales charge. |
See notes to financial statements.
Certified Semi-Annual Report 15
| | |
| STATEMENT OF OPERATIONS | | |
| |
| Thornburg Value Fund | | Six Months Ended March 31, 2011 (Unaudited) |
| | | | |
INVESTMENT INCOME: | | | | |
Dividend income | | | | |
Non-affiliated issuers (net of foreign taxes withheld of $834,103) | | $ | 22,334,665 | |
Non-controlled affiliated issuers (net of foreign taxes withheld $26,265) | | | 348,951 | |
Interest income | | | 3,754,819 | |
| | | | |
Total Income | | | 26,438,435 | |
| | | | |
| |
EXPENSES: | | | | |
Investment advisory fees (Note 3) | | | 16,286,964 | |
Administration fees (Note 3) | | | | |
Class A Shares | | | 741,367 | |
Class B Shares | | | 13,957 | |
Class C Shares | | | 218,244 | |
Class I Shares | | | 588,565 | |
Class R3 Shares | | | 138,920 | |
Class R4 Shares | | | 37,952 | |
Class R5 Shares | | | 65,362 | |
Distribution and service fees (Note 3) | | | | |
Class A Shares | | | 1,481,634 | |
Class B Shares | | | 111,523 | |
Class C Shares | | | 1,736,947 | |
Class R3 Shares | | | 556,229 | |
Class R4 Shares | | | 75,733 | |
Transfer agent fees | | | | |
Class A Shares | | | 791,130 | |
Class B Shares | | | 22,168 | |
Class C Shares | | | 239,876 | |
Class I Shares | | | 1,056,750 | |
Class R3 Shares | | | 232,751 | |
Class R4 Shares | | | 88,961 | |
Class R5 Shares | | | 308,484 | |
Registration and filing fees | | | | |
Class A Shares | | | 13,331 | |
Class B Shares | | | 8,925 | |
Class C Shares | | | 10,531 | |
Class I Shares | | | 28,811 | |
Class R3 Shares | | | 10,080 | |
Class R4 Shares | | | 11,266 | |
Class R5 Shares | | | 10,237 | |
Custodian fees (Note 3) | | | 296,410 | |
Professional fees | | | 57,750 | |
Accounting fees | | | 53,720 | |
Trustee fees | | | 50,223 | |
Other expenses | | | 227,871 | |
| | | | |
Total Expenses | | | 25,572,672 | |
Less: | | | | |
Expenses reimbursed by investment advisor (Note 3) | | | (448,721 | ) |
| | | | |
Net Expenses | | | 25,123,951 | |
| | | | |
Net Investment Income | | $ | 1,314,484 | |
| | | | |
16 Certified Semi-Annual Report
| | |
| STATEMENT OF OPERATIONS, CONTINUED | | |
| |
| Thornburg Value Fund | | Six Months Ended March 31, 2011 (Unaudited) |
| | | | |
REALIZED AND UNREALIZED GAIN (LOSS) | | | | |
Net realized gain (loss) from: | | | | |
Investments | | $ | 174,144,271 | |
Forward currency contracts (Note 7) | | | (16,326,450 | ) |
Foreign currency transactions | | | (129,952 | ) |
| | | | |
| | | 157,687,869 | |
| | | | |
Net change in unrealized appreciation (depreciation) on: | | | | |
Investments | | | | |
Non-affiliated issuers | | | 670,594,839 | |
Non-controlled affiliated issuers | | | 2,057,207 | |
Forward currency contracts (Note 7) | | | 20,904,573 | |
Foreign currency translations | | | 76 | |
| | | | |
| | | 693,556,695 | |
| | | | |
Net Realized and Unrealized Gain | | | 851,244,564 | |
| | | | |
Net Increase in Net Assets Resulting from Operations | | $ | 852,559,048 | |
| | | | |
See notes to financial statements.
Certified Semi-Annual Report 17
| | |
| STATEMENTS OF CHANGES IN NET ASSETS | | |
| |
| Thornburg Value Fund | | |
| | | | | | | | |
| | | Six Months Ended
March 31, 2011* | | | Year Ended
September 30, 2010 | |
INCREASE (DECREASE) IN NET ASSETS FROM | | | | | | | | |
| | |
OPERATIONS: | | | | | | | | |
Net investment income | | $ | 1,314,484 | | | $ | 29,268,526 | |
Net realized gain (loss) on investments, forward currency contracts and foreign currency transactions | | | 157,687,869 | | | | 394,072,848 | |
Increase (Decrease) in unrealized appreciation (depreciation) on investments, forward currency contracts and foreign currency translations | | | 693,556,695 | | | | (318,877,004 | ) |
| | | | | | | | |
| | |
Net Increase (Decrease) in Net Assets Resulting from Operations | | | 852,559,048 | | | | 104,464,370 | |
| | |
DIVIDENDS TO SHAREHOLDERS: | | | | | | | | |
From net investment income | | | | | | | | |
Class A Shares | | | — | | | | (7,120,379 | ) |
Class B Shares | | | — | | | | (57,103 | ) |
Class C Shares | | | — | | | | (815,194 | ) |
Class I Shares | | | (1,083,639 | ) | | | (17,633,649 | ) |
Class R3 Shares | | | — | | | | (1,025,249 | ) |
Class R4 Shares | | | — | | | | (339,423 | ) |
Class R5 Shares | | | (98,243 | ) | | | (1,893,225 | ) |
| | |
FUND SHARE TRANSACTIONS (NOTE 4): | | | | | | | | |
Class A Shares | | | (112,580,123 | ) | | | (100,540,665 | ) |
Class B Shares | | | (3,634,796 | ) | | | (17,635,969 | ) |
Class C Shares | | | (28,369,372 | ) | | | (40,055,751 | ) |
Class I Shares | | | 66,722,947 | | | | 479,233,524 | |
Class R3 Shares | | | (4,123,914 | ) | | | 34,129,445 | |
Class R4 Shares | | | 2,672,020 | | | | 10,529,029 | |
Class R5 Shares | | | 12,347,347 | | | | 60,623,632 | |
| | | | | | | | |
| | |
Net Increase in Net Assets | | | 784,411,275 | | | | 501,863,393 | |
| | |
NET ASSETS: | | | | | | | | |
Beginning of Period | | | 4,054,361,855 | | | | 3,552,498,462 | |
| | | | | | | | |
| | |
End of Period | | $ | 4,838,773,130 | | | $ | 4,054,361,855 | |
| | | | | | | | |
| | |
Undistributed net investment income | | $ | 1,947,755 | | | $ | 1,815,153 | |
See notes to financial statements.
18 Certified Semi-Annual Report
| | |
| NOTES TO FINANCIAL STATEMENTS | | |
| |
| Thornburg Value Fund | | March 31, 2011 (Unaudited) |
NOTE 1 – ORGANIZATION
Thornburg Value Fund, hereinafter referred to as the “Fund,” is a diversified series of Thornburg Investment Trust (the “Trust”). The Trust is organized as a Massachusetts business trust under a Declaration of Trust dated June 3, 1987 and is registered as a diversified, open-end management investment company under the Investment Company Act of 1940, as amended. The Fund is currently one of sixteen separate series of the Trust. Each series is considered to be a separate entity for financial reporting and tax purposes and bears expenses directly attributable to it. The Fund seeks long-term capital appreciation by investing in equity and debt securities of all types. As a secondary non-fundamental goal, the Fund also seeks some current income.
The Fund currently has seven classes of shares of beneficial interest outstanding: Class A, Class B, Class C, Institutional Class (Class I), and Retirement Classes (Class R3, Class R4, and Class R5) The Fund no longer offers Class B shares for sale. Each class of shares of the Fund represents an interest in the same portfolio of investments, except that (i) Class A shares are sold subject to a front-end sales charge collected at the time the shares are purchased and bear a service fee, (ii) Class B shares are sold at net asset value without a sales charge at the time of purchase, but are subject to a contingent deferred sales charge upon redemption and bear both a service fee and distribution fee, (iii) Class C shares are sold at net asset value without a sales charge at the time of purchase, but are subject to a contingent deferred sales charge upon redemption within one year of purchase, and bear both a service fee and a distribution fee, (iv) Class I shares are sold at net asset value without a sales charge at the time of purchase, (v) Class R3 shares are sold at net asset value without a sales charge at the time of purchase, but bear both a service fee and distribution fee, (vi) Class R4 shares are sold at net asset value without a sales charge at the time of purchase, but bear a service fee, (vii) Class R5 shares are sold at net asset value without a sales charge at the time of purchase, and (viii) the respective classes may have different reinvestment privileges and conversion rights. Additionally, the Fund may allocate among its classes certain expenses, to the extent allowable to specific classes, including transfer agent fees, government registration fees, certain printing and postage costs, and administrative and legal expenses. Currently, class specific expenses of the Fund are limited to service and distribution fees, administration fees, and certain registration and transfer agent expenses. Class B shares of the Fund outstanding for eight years will convert to Class A shares of the Fund.
NOTE 2 – SIGNIFICANT ACCOUNTING POLICIES
Significant accounting policies of the Trust are as follows:
Valuation of Investments: Portfolio securities listed or traded on a national securities exchange are valued on the valuation date at the last reported sale price on the exchange that is the primary market for the security. Portfolio securities traded on an exchange for which there has been no sale that day and other equity securities traded in the over-the-counter market are valued at the mean between the last reported bid and asked prices. Portfolio securities reported by NASDAQ are valued at the NASDAQ official closing price. Any foreign security traded on exchanges outside the United States is valued at the price of the security on the exchange that is normally the security’s primary market, as of the close of that exchange preceding the time of the Fund’s valuation.
Debt obligations held by the Fund have a primary market over the counter and are valued by an independent pricing service approved by the Trustees of the Trust. The pricing service ordinarily values debt obligations at quoted bid prices. When quotations are not available, debt obligations held by the Fund are valued at evaluated prices determined by the pricing service using methods which include consideration of yields or prices of debt obligations of comparable quality, type of issue, coupon, maturity and rating, and indications as to value from dealers and general market conditions. Short-term obligations having remaining maturities of 60 days or less are ordinarily valued at amortized cost, which approximates market value.
Quotations in foreign currencies for foreign portfolio investments are converted to U.S. dollar equivalents using the foreign exchange quotation in effect at the time of valuation.
In any case where the market value of an equity security held by the Fund is not readily available, the Trust’s valuation and pricing committee determines a fair value for the security using procedures approved by the Trustees, which may include the use of a price obtained from an independent pricing service. The pricing service ordinarily values equity securities in these instances using multi-factor models to adjust market prices based upon various inputs, including exchange data, depository receipt prices, futures and index data and other data. A security’s market value is deemed not readily available whenever the exchange or market on which the security is primarily traded is closed for the entire scheduled day of trading. Additionally, a security’s market value may be deemed not readily available under other circumstances identified by the Trustees, including when developments occurring after the most recent close of
Certified Semi-Annual Report 19
| | |
| NOTES TO FINANCIAL STATEMENTS, CONTINUED | | |
| |
| Thornburg Value Fund | | March 31, 2011 (Unaudited) |
the security’s primary exchange or market, but before the most recent close of trading in Fund shares, create a serious question about the reliability of the security’s market value.
In any case where a pricing service fails to provide a price for a debt obligation held by the Fund, the valuation and pricing committee determines a fair value for the debt obligation using procedures approved by the Trustees. Additionally, in any case where management believes that a price provided by a pricing service for a debt obligation held by the Fund may be unreliable, the valuation and pricing committee decides whether or not to use the pricing service’s valuation or to determine a fair value for the debt obligation.
In determining fair value for any portfolio security or other investment, the valuation and pricing committee seeks to determine the amount that an owner of the investment might reasonably expect to receive upon a sale of the investment. However, because fair value prices are estimated prices, the valuation and pricing committee’s determination of fair value for an investment may differ from the value that would be realized by the Fund upon a sale of the investment, and that difference could be material to the Fund’s financial statements. The valuation and pricing committee’s determination of fair value for an investment may also differ from the prices obtained by other persons (including other mutual funds) for the investment.
Valuation Measurements: Various inputs are used in determining the value of the Fund’s investments. These inputs are summarized in the three levels listed below.
Level 1: Quoted prices in active markets for identical investments.
Level 2: Other significant observable inputs (including quoted prices for similar investments, interest rates, prepayment rates, credit risk, etc.).
Level 3: Significant unobservable inputs (including the Fund’s own assumptions in determining the fair value of investments).
The following table displays a summary of the inputs used to value the Fund’s net assets as of March 31, 2011. In any instance when valuation inputs from more than one level are used to determine the fair value of a specific investment, the investment is placed in the level of the table based upon the lowest level input that is significant in determining the fair value of the investment:
| | | | | | | | | | | | | | | | |
| | | Fair Value Measurements at March 31, 2011 | |
| | | Total | | | Level 1 | | | Level 2 | | | Level 3 | |
Assets | | | | | | | | | | | | | | | | |
Investments in Securities* | | | | | | | | | | | | | | | | |
Common Stock | | $ | 4,630,638,344 | | | $ | 4,630,638,344 | | | $ | — | | | $ | — | |
Convertible Bonds | | | 48,324,224 | | | | — | | | | 48,324,224 | | | | — | |
Short Term Investments | | | 95,000,000 | | | | — | | | | 95,000,000 | | | | — | |
| | | | | | | | | | | | | | | | |
Total Investments in Securities | | $ | 4,773,962,568 | | | $ | 4,630,638,344 | | | $ | 143,324,224 | | | $ | — | |
| | | | |
Other Financial Instruments** | | | | | | | | | | | | | | | | |
Forward Currency Contracts | | $ | 5,382,962 | | | $ | — | | | $ | 5,382,962 | | | $ | — | |
| | | | |
Liabilities | | | | | | | | | | | | | | | | |
Other Financial Instruments** | | | | | | | | | | | | | | | | |
Forward Currency Contracts | | $ | (235,256 | ) | | $ | — | | | $ | (235,256 | ) | | $ | — | |
| * | See Schedule of Investments for a summary of the industry exposure as grouped according to the Global Industry Classification Standard (GICS), which is an industry taxonomy developed by MSCI Barra and Standard & Poor’s (S&P). |
| ** | Other Financial Instruments include investments not reflected in the Schedule of Investments, such as futures, forwards and swap contracts, which are valued at the unrealized appreciation (depreciation) on the investment. |
20 Certified Semi-Annual Report
| | |
| NOTES TO FINANCIAL STATEMENTS, CONTINUED | | |
| |
| Thornburg Value Fund | | March 31, 2011 (Unaudited) |
A rollforward of fair value measurements using significant unobservable inputs (Level 3) for the six months ended March 31, 2011, was as follows:
| | | | | | | | | | | | | | | | | | | | | | | | | | | | |
| | | Beginning
Balance
9/30/2010 | | | Gross
Purchases | | | Gross
Sales | | | Net Realized
Gain/(Loss) | | | Net Unrealized
Appreciation/
(Depreciation) | | | Net Transfers
in/(out) of
Level 3(a) | | | Ending
Balance
3/31/11 | |
Investments in Securities | | $ | 30,000,000 | | | $ | — | | | $ | — | | | $ | — | | | $ | — | | | $ | (30,000,000 | ) | | $ | — | |
| (a) | Net transfers out of Level 3 were to Level 1, and were due to changes in quoted prices in active markets for identical investments existing during the six months ended March 31, 2011. Transfers into or out of Level 3 are based on the beginning market value of the period in which they occurred. |
Other Notes: It is the policy of the Fund to recognize significant transfers between Levels 1 and 2 and to disclose those transfers at the last date of the reporting period. The Fund recognized no significant transfers into and out of Levels 1 and 2 during the six months ended March 31, 2011.
Foreign Currency Translation: Portfolio securities and other assets and liabilities denominated in foreign currencies are translated into U.S. dollars based on the exchange rate of such currencies against the U.S. dollar on the date of valuation. Purchases and sales of securities and income items denominated in foreign currencies are translated into U.S. dollars at the exchange rate in effect on the translation date. When the Fund purchases or sells foreign securities, it will customarily enter into a foreign exchange contract to minimize foreign exchange risk from the trade date to the settlement date of such transactions.
The Fund does not separately report the effect of changes in foreign exchange rates from changes in market prices on securities held. Such changes are included in net realized and unrealized gain or loss from investments.
Reported net realized foreign exchange gains or losses arise from sales of foreign currencies, currency gains or losses realized between the trade and settlement dates on securities transactions and the difference between the amounts of dividends, interest, and foreign withholding taxes recorded on the Fund’s books, and the U.S. dollar equivalent of the amounts actually received or paid.
Net unrealized foreign exchange gains and losses arise from changes in the fair value of assets and liabilities, other than investments in securities at fiscal period end, resulting from changes in exchange rates.
Federal Income Taxes: It is the policy of the Trust to comply with the provisions of the Internal Revenue Code applicable to “regulated investment companies” and to distribute to shareholders substantially all taxable income, including any net realized gain on investments of the Fund. Therefore, no provision for federal income taxes is required.
Management reviews each tax position believed to be material to the preparation of the Fund’s financial statements, to assess if it is more likely than not that the position would be sustained upon examination, based upon the technical merits of the position. As of March 31, 2011, management has not identified any such position for which a liability must be reflected in the Statement of Assets and Liabilities. The Fund’s tax returns remain subject to examination for three years after filing.
When-Issued and Delayed Delivery Transactions: The Fund may engage in when-issued or delayed delivery transactions. To the extent the Fund engages in such transactions, it will do so for the purpose of acquiring portfolio securities consistent with the Fund’s investment objectives and not for the purpose of investment leverage or to speculate on interest rate and/or market changes. At the time the Fund makes a commitment to purchase a security on a when-issued or delayed delivery basis, the Fund will record the transaction and reflect the value in determining its net asset value. When effecting such transactions, assets of an amount sufficient to make payment for the portfolio securities to be purchased will be segregated on the Fund’s records on the trade date. Securities purchased on a when-issued or delayed delivery basis do not earn interest until the settlement date.
Dividends: Dividends to shareholders, if any, are generally paid quarterly and are reinvested in additional shares of the Fund at net asset value per share at the close of business on the dividend payment date or, at the shareholder’s option, paid in cash. Net realized capital gains, to the extent available, will be distributed at least annually. Distributions to shareholders are based on income tax regulations and therefore, their characteristics may differ for financial statement and tax purposes.
Certified Semi-Annual Report 21
| | |
| NOTES TO FINANCIAL STATEMENTS, CONTINUED | | |
| |
| Thornburg Value Fund | | March 31, 2011 (Unaudited) |
General: Securities transactions are accounted for on a trade date basis. Interest income is accrued as earned and dividend income is recorded on the ex-dividend date. Certain income from foreign securities is recognized as soon as information is available to the Fund. Realized gains and losses from the sale of securities are recorded on an identified cost basis. Net investment income (other than class specific expenses) and realized and unrealized gains and losses are allocated daily to each class of shares based upon the relative net asset value of outstanding shares of each class of shares at the beginning of the day (after adjusting for the current share activity of the respective class). Expenses common to all Funds are allocated among the Funds comprising the Trust based upon their relative net asset values or other appropriate allocation methods.
Guarantees and Indemnifications: Under the Trust’s organizational documents, its officers and Trustees are indemnified against certain liabilities arising out of the performance of their duties to the Fund. Additionally, in the normal course of business the Trust enters into contracts with service providers that contain general indemnification clauses. The Trust’s maximum exposure under these arrangements is unknown. However, based on experience, the Trust expects the risk of loss to be remote.
Use of Estimates: The preparation of financial statements, in conformity with generally accepted accounting principles, requires management to make estimates and assumptions that affect the reported amounts of assets and liabilities and the disclosure of contingent assets and liabilities at the date of the financial statements and the reported amounts of increases and decreases in net assets from operations during the reporting period. Actual results could differ from those estimates.
NOTE 3 – INVESTMENT ADVISORY FEE AND OTHER TRANSACTIONS WITH AFFILIATES
Pursuant to an investment advisory agreement, Thornburg Investment Management, Inc. (the “Advisor”) serves as the investment advisor and performs services to the Fund for which the fees are payable at the end of each month. For the six months ended March 31, 2011, these fees were payable at annual rates ranging from .875 of 1% to .675 of 1% per annum of the average daily net assets of the Fund depending on the Fund’s asset size. The Trust also has entered into administrative services agreements with the Advisor, whereby the Advisor will perform certain administrative services for the shareholders of each class of the Fund’s shares, and for which fees will be payable at an annual rate of up to .125 of 1% per annum of the average daily net assets attributable to each class of shares. For the six months ended March 31, 2011, the Advisor contractually reimbursed certain class specific expenses, administrative fees, and distribution fees of $284,616 for Class R3 shares, $66,101 for Class R4 Shares, and $98,004 for Class R5 shares.
The Trust has an underwriting agreement with Thornburg Securities Corporation (the “Distributor,” an affiliate of the Advisor), which acts as the distributor of the Fund’s shares. For the six months ended March 31, 2011, the Distributor has advised the Fund that it earned net commissions aggregating $21,769 from the sale of Class A shares, and collected contingent deferred sales charges aggregating $8,306 from redemptions of Class C shares of the Fund.
Pursuant to a service plan under Rule 12b-1 of the Investment Company Act of 1940, the Fund may reimburse to the Advisor an amount not to exceed .25 of 1% per annum of the average daily net assets attributable to each class of shares of the Fund for payments made by the Advisor to securities dealers and other financial institutions to obtain various shareholder and distribution related services. For the six months ended March 31, 2011, there were no 12b-1 service plan fees charged for Class I shares. The Advisor may pay out of its own resources additional expenses for distribution of the Fund’s shares.
The Trust has also adopted distribution plans pursuant to Rule 12b-1, applicable only to the Fund’s Class B, Class C, and Class R3 shares, under which the Fund compensates the Distributor for services in promoting the sale of Class B, Class C, and Class R3 shares of the Fund at an annual rate of up to .75 of 1% per annum of the average daily net assets attributable to Class B and Class C shares, and an annual rate of up to .25 of 1% per annum of the average daily net assets attributable to Class R3 shares. Total fees incurred by the Distributor for each class of shares of the Fund under their respective Service and Distribution Plans for the six months ended March 31, 2011, are set forth in the Statement of Operations.
The Trust has an agreement with the custodian bank to indirectly pay a portion of the custodian’s fees through credits earned by the Fund’s cash on deposit with the bank. This deposit agreement is an alternative to overnight investments. Custodial fees have been adjusted to reflect amounts that would have been paid without this agreement, with a corresponding adjustment reflected as fees paid indirectly in the Statement of Operations. For the six months ended March 31, 2011, there were no fees paid indirectly.
22 Certified Semi-Annual Report
| | |
| NOTES TO FINANCIAL STATEMENTS, CONTINUED | | |
| |
| Thornburg Value Fund | | March 31, 2011 (Unaudited) |
Certain officers and Trustees of the Trust are also officers and/or directors of the Advisor and Distributor. The compensation of independent Trustees is borne by the Trust.
NOTE 4 – SHARES OF BENEFICIAL INTEREST
At March 31, 2011, there were an unlimited number of shares of beneficial interest authorized. Transactions in shares of beneficial interest were as follows:
| | | | | | | | | | | | | | | | |
| | | Six Months Ended (Unaudited)
March 31, 2011 | | | Year Ended (Audited)
September 30, 2010 | |
| | | Shares | | | Amount | | | Shares | | | Amount | |
Class A Shares | | | | | | | | | | | | | | | | |
Shares sold | | | 2,314,442 | | | $ | 80,835,993 | | | | 8,919,655 | | | $ | 275,295,386 | |
Shares issued to shareholders in reinvestment of dividends | | | — | | | | (2 | ) | | | 185,067 | | | | 5,782,360 | |
Shares repurchased | | | (5,737,146 | ) | | | (193,420,190 | ) | | | (12,535,727 | ) | | | (381,632,085 | ) |
Redemption fees received* | | | — | | | | 4,076 | | | | — | | | | 13,674 | |
| | | | | | | | | | | | | | | | |
| | | | |
Net Increase (Decrease) | | | (3,422,704 | ) | | $ | (112,580,123 | ) | | | (3,431,005 | ) | | $ | (100,540,665 | ) |
| | | | | | | | | | | | | | | | |
| | | | |
Class B Shares | | | | | | | | | | | | | | | | |
Shares sold | | | 15,888 | | | $ | 514,158 | | | | 33,963 | | | $ | 1,007,852 | |
Shares issued to shareholders in reinvestment of dividends | | | — | | | | — | | | | 1,560 | | | | 46,442 | |
Shares repurchased | | | (130,679 | ) | | | (4,149,033 | ) | | | (640,143 | ) | | | (18,690,579 | ) |
Redemption fees received* | | | — | | | | 79 | | | | — | | | | 316 | |
| | | | | | | | | | | | | | | | |
| | | | |
Net Increase (Decrease) | | | (114,791 | ) | | $ | (3,634,796 | ) | | | (604,620 | ) | | $ | (17,635,969 | ) |
| | | | | | | | | | | | | | | | |
| | | | |
Class C Shares | | | | | | | | | | | | | | | | |
Shares sold | | | 389,007 | | | $ | 12,932,339 | | | | 1,160,118 | | | $ | 34,417,962 | |
Shares issued to shareholders in reinvestment of dividends | | | — | | | | — | | | | 23,192 | | | | 698,534 | |
Shares repurchased | | | (1,279,691 | ) | | | (41,302,909 | ) | | | (2,561,879 | ) | | | (75,176,179 | ) |
Redemption fees received* | | | — | | | | 1,198 | | | | — | | | | 3,932 | |
| | | | | | | | | | | | | | | | |
| | | | |
Net Increase (Decrease) | | | (890,684 | ) | | $ | (28,369,372 | ) | | | (1,378,569 | ) | | $ | (40,055,751 | ) |
| | | | | | | | | | | | | | | | |
| | | | |
Class I Shares | | | | | | | | | | | | | | | | |
Shares sold | | | 11,607,571 | | | $ | 405,472,681 | | | | 33,481,948 | | | $ | 1,049,288,699 | |
Shares issued to shareholders in reinvestment of dividends | | | 22,978 | | | | 860,513 | | | | 436,183 | | | | 13,744,602 | |
Shares repurchased | | | (9,748,378 | ) | | | (339,618,076 | ) | | | (18,718,597 | ) | | | (583,820,763 | ) |
Redemption fees received* | | | — | | | | 7,829 | | | | — | | | | 20,986 | |
| | | | | | | | | | | | | | | | |
| | | | |
Net Increase (Decrease) | | | 1,882,171 | | | $ | 66,722,947 | | | | 15,199,534 | | | $ | 479,233,524 | |
| | | | | | | | | | | | | | | | |
| | | | |
Class R3 Shares | | | | | | | | | | | | | | | | |
Shares sold | | | 828,453 | | | $ | 27,995,540 | | | | 3,017,720 | | | $ | 92,556,011 | |
Shares issued to shareholders in reinvestment of dividends | | | — | | | | — | | | | 31,966 | | | | 989,285 | |
Shares repurchased | | | (948,119 | ) | | | (32,120,201 | ) | | | (1,927,763 | ) | | | (59,417,965 | ) |
Redemption fees received* | | | — | | | | 747 | | | | — | | | | 2,114 | |
| | | | | | | | | | | | | | | | |
| | | | |
Net Increase (Decrease) | | | (119,666 | ) | | $ | (4,123,914 | ) | | | 1,121,923 | | | $ | 34,129,445 | |
| | | | | | | | | | | | | | | | |
Certified Semi-Annual Report 23
| | |
| NOTES TO FINANCIAL STATEMENTS, CONTINUED | | |
| |
| Thornburg Value Fund | | March 31, 2011 (Unaudited) |
| | | | | | | | | | | | | | | | |
| | | Six Months Ended (Unaudited)
March 31, 2011 | | | Year Ended (Audited)
September 30, 2010 | |
| | | Shares | | | Amount | | | Shares | | | Amount | |
Class R4 Shares | | | | | | | | | | | | | | | | |
Shares sold | | | 413,519 | | | $ | 14,272,955 | | | | 1,194,182 | | | $ | 37,191,449 | |
Shares issued to shareholders in reinvestment of dividends | | | — | | | | — | | | | 9,282 | | | | 288,552 | |
Shares repurchased | | | (341,410 | ) | | | (11,601,139 | ) | | | (898,513 | ) | | | (26,951,640 | ) |
Redemption fees received* | | | — | | | | 204 | | | | — | | | | 668 | |
| | | | | | | | | | | | | | | | |
| | | | |
Net Increase (Decrease) | | | 72,109 | | | $ | 2,672,020 | | | | 304,951 | | | $ | 10,529,029 | |
| | | | | | | | | | | | | | | | |
| | | | |
Class R5 Shares | | | | | | | | | | | | | | | | |
Shares sold | | | 1,349,012 | | | $ | 47,086,420 | | | | 3,281,252 | | | $ | 103,225,130 | |
Shares issued to shareholders in reinvestment of dividends | | | 2,591 | | | | 96,926 | | | | 59,336 | | | | 1,869,704 | |
Shares repurchased | | | (997,119 | ) | | | (34,836,865 | ) | | | (1,440,353 | ) | | | (44,473,586 | ) |
Redemption fees received* | | | — | | | | 866 | | | | — | | | | 2,384 | |
| | | | | | | | | | | | | | | | |
| | | | |
Net Increase (Decrease) | | | 354,484 | | | $ | 12,347,347 | | | | 1,900,235 | | | $ | 60,623,632 | |
| | | | | | | | | | | | | | | | |
| * | The Fund charges a redemption fee of 1% of the Class A and Class I shares redeemed or exchanged within 30 days of purchase. Redemption fees charged to any class are allocated to all classes upon receipt of payment based on relative net asset values of each class or other appropriate allocation methods. |
NOTE 5 – SECURITIES TRANSACTIONS
For the six months ended March 31, 2011, the Fund had purchase and sale transactions of investment securities (excluding short-term investments) of $1,349,121,570 and $1,543,797,372, respectively.
NOTE 6 – INCOME TAXES
At March 31, 2011, information on the tax components of capital is as follows:
| | | | |
Cost of investments for tax purposes | | $ | 4,212,823,571 | |
| | | | |
Gross unrealized appreciation on a tax basis | | $ | 745,277,739 | |
Gross unrealized depreciation on a tax basis | | | (184,138,742 | ) |
| | | | |
Net unrealized appreciation (depreciation)on investments (tax basis) | | $ | 561,138,997 | |
| | | | |
At March 31, 2011, the Fund had deferred tax basis currency losses occurring subsequent to October 31, 2009 of $840,449. For tax purposes, such losses will be reflected in the year ending September 30, 2011.
At March 31, 2011 the Fund had tax basis capital losses, which may be carried forward to offset future capital gains. To the extent such carry forwards are used, capital gain distributions may be reduced to the extent provided by regulations.
Such capital loss carryforwards expire as follows:
| | | | |
2017 | | $ | 527,267,206 | |
2018 | | | 242,353,997 | |
| | | | |
| | $ | 769,621,203 | |
| | | | |
24 Certified Semi-Annual Report
| | |
| NOTES TO FINANCIAL STATEMENTS, CONTINUED | | |
| |
| Thornburg Value Fund | | March 31, 2011 (Unaudited) |
NOTE 7 – DERIVATIVE FINANCIAL INSTRUMENTS WITH OFF-BALANCE SHEET RISK AND FOREIGN INVESTMENT RISK
The Fund may use a variety of derivative financial instruments to hedge or adjust the risks affecting its investment portfolio or to enhance investment returns. Provisions of FASB Accounting Standards Codification ASC 815-10-50 (“ASC 815”), require certain disclosures. The disclosures are intended to provide users of financial statements with an understanding of the use of derivative instruments by the Fund and how these derivatives affect the financial position, financial performance and cash flows of the Fund. The Fund does not designate any derivative instruments as hedging instruments under ASC 815. During the six months ended March 31, 2011, the Fund’s principal exposure to derivative financial instruments of the type addressed by ASC 815 was investment in foreign exchange contracts. A foreign exchange contract is an agreement between two parties to exchange different currencies at a specified rate of exchange at an agreed upon future date. Foreign exchange contracts involve risks to the Fund, including the risk that a contract counterparty will not meet its obligations to the Fund, the risk that a change in a contract’s value may not correlate perfectly with the currency the contract was intended to track, and the risk that the Fund’s advisor is unable to correctly implement its strategy in using a contract. In any such instance, the Fund may not achieve the intended benefit of entering into a contract, and may experience a loss.
The Fund entered into forward currency contracts during the six months ended March 31, 2011 in the normal course of pursuing its investment objectives, in anticipation of purchasing foreign investments or with the intent of reducing the risk to the value of the Fund’s foreign investments from adverse changes in the relationship between the U.S. dollar and foreign currencies. In each case these contracts have been initiated in conjunction with foreign investment transactions.
These contracts are accounted for by the Fund under ASC 815. Unrealized gains and unrealized losses on outstanding contracts are reported in the Fund’s Statement of Assets and Liabilities at the Fund’s net equity, as measured by the difference between the forward exchange rates at the reporting date and the forward exchange rates at each contract’s inception date. Net realized gain (loss) on contracts closed during the period, and changes in net unrealized appreciation (depreciation) on outstanding contracts are recognized in the Fund’s Statement of Operations.
The following table displays the outstanding forward currency contracts, at March 31, 2011:
Outstanding Forward Currency Contracts
to Buy or Sell at March 31, 2011
| | | | | | | | | | | | | | | | | | | | | | | | |
Contract Description | | Buy/Sell | | | Contract
Amount | | | Contract
Value Date | | | Value
USD | | | Unrealized
Appreciation | | | Unrealized
Depreciation | |
Japanese Yen | | | Sell | | | | 18,875,000,000 | | | | 05/23/2011 | | | | 226,981,021 | | | $ | 200,068 | | | $ | — | |
Japanese Yen | | | Sell | | | | 4,320,228,100 | | | | 05/23/2011 | | | | 51,952,836 | | | | — | | | | (235,256 | ) |
Japanese Yen | | | Sell | | | | 15,024,754,500 | | | | 08/31/2011 | | | | 180,850,993 | | | | 3,145,119 | | | | — | |
Japanese Yen | | | Sell | | | | 6,966,190,300 | | | | 08/31/2011 | | | | 83,851,116 | | | | 2,037,775 | | | | — | |
| | | | | | | | | | | | | | | | | | | | | | | | |
Total | | | | | | | | | | | | | | | | | | $ | 5,382,962 | | | $ | (235,256 | ) |
| | | | | | | | | | | | | | | | | | | | | | | | |
The unrealized appreciation (depreciation) of the outstanding forward currency contracts recognized in the Fund’s Statement of Assets and Liabilities at March 31, 2011 is disclosed in the following table:
Fair Values of Derivative Financial Instruments
at March 31, 2011
| | | | | | |
Asset Derivatives | | Balance Sheet Location | | Fair Value | |
Foreign exchange contracts | | Assets - Unrealized appreciation on forward currency contracts | | $ | 5,382,962 | |
| | |
Liability Derivatives | | Balance Sheet Location | | Fair Value | |
Foreign exchange contracts | | Liabilities - Unrealized depreciation on forward currency contracts | | $ | (235,256 | ) |
Certified Semi-Annual Report 25
| | |
| NOTES TO FINANCIAL STATEMENTS, CONTINUED | | |
| |
| Thornburg Value Fund | | March 31, 2011 (Unaudited) |
The realized gains (losses) from forward currency contracts, and the change in unrealized appreciation (depreciation) of outstanding forward currency contracts recognized in the Fund’s Statement of Operations for the six months ended March 31, 2011 are disclosed in the following tables:
Amount of Realized Gain (Loss) on Derivative Financial Instruments
Recognized in Income for the Six Months Ended March 31, 2011
| | | | | | | | |
| | | Total | | | Forward
Currency Contracts | |
Foreign exchange contracts | | $ | (16,326,450 | ) | | $ | (16,326,450 | ) |
Change in Unrealized Appreciation (Depreciation)
of Derivative Financial Instruments Recognized in
Income for the Six Months Ended March 31, 2011
| | | | | | | | |
| | | Total | | | Forward
Currency Contracts | |
Foreign exchange contracts | | $ | 20,904,573 | | | $ | 20,904,573 | |
OTHER NOTES
Fund management believes no events have occurred between March 31, 2011 and May 20, 2011, the date of issuance of the financial statements, which require adjustment of, or disclosure in, the accompanying financial statements.
26 Certified Semi-Annual Report
This page intentionally left blank.
Certified Semi-Annual Report 27
FINANCIAL HIGHLIGHTS
Thornburg Value Fund
| | | | | | | | | | | | | | | | | | | | | | | | | | | | | | | | | | | | | | | | | | | | | | | | | | | | | | | | | | | | |
| | | PER SHARE PERFORMANCE (for a share outstanding throughout the period)+ | | | RATIOS TO AVERAGE NET ASSETS | | | SUPPLEMENTAL DATA | |
Unless
Otherwise
Noted, Periods
are Fiscal Years
Ended Sept. 30, | | Net
Asset
Value
Beginning
of Period | | | Net
Investment
Income
(Loss) | | | Net
Realized
& Unrealized
Gain
(Loss) on
Investments | | | Total
from
Investment
Operations | | | Dividends
from
Net
Investment
Income | | | Dividends
from
Net
Realized
Gains | | | Total
Dividends | | | Net
Asset
Value
End of
Period | | | Net
Investment
Income
(Loss)
(%) | | | Expenses,
After
Expense
Reductions
(%) | | | Expenses,
After
Expense
Reductions
and Net of
Custody
Credits
(%) | | | Expenses,
Before
Expense
Reductions
(%) | | | Total
Return
(%)(a) | | | Portfolio
Turnover
Rate
(%) | | | Net
Assets at
End of
Period
(Thousands) | |
Class A Shares | |
2011(b)(c) | | $ | 30.44 | | | | (0.02 | ) | | | 6.49 | | | | 6.47 | | | | — | | | | — | | | | — | | | $ | 36.91 | | | | (0.09 | )(d) | | | 1.27 | (d) | | | 1.27 | (d) | | | 1.27 | (d) | | | 21.25 | | | | 30.77 | | | $ | 1,245,746 | |
2010 (c) | | $ | 29.66 | | | | 0.20 | | | | 0.76 | | | | 0.96 | | | | (0.18 | ) | | | — | | | | (0.18 | ) | | $ | 30.44 | | | | 0.65 | | | | 1.31 | | | | 1.31 | | | | 1.31 | | | | 3.21 | | | | 72.75 | | | $ | 1,131,594 | |
2009(c) | | $ | 28.02 | | | | 0.37 | | | | 1.67 | | | | 2.04 | | | | (0.40 | ) | | | — | | | | (0.40 | ) | | $ | 29.66 | | | | 1.58 | | | | 1.34 | | | | 1.34 | | | | 1.34 | | | | 7.65 | | | | 83.00 | | | $ | 1,204,450 | |
2008(c) | | $ | 44.17 | | | | 0.18 | | | | (12.26 | ) | | | (12.08 | ) | | | (0.14 | ) | | | (3.93 | ) | | | (4.07 | ) | | $ | 28.02 | | | | 0.52 | | | | 1.27 | | | | 1.27 | | | | 1.27 | | | | (29.52 | ) | | | 70.65 | | | $ | 1,088,766 | |
2007(c) | | $ | 37.59 | | | | 0.29 | | | | 7.86 | | | | 8.15 | | | | (0.27 | ) | | | (1.30 | ) | | | (1.57 | ) | | $ | 44.17 | | | | 0.70 | | | | 1.27 | | | | 1.27 | | | | 1.27 | | | | 22.23 | | | | 79.29 | | | $ | 1,599,976 | |
2006(c) | | $ | 32.79 | | | | 0.35 | | | | 4.76 | | | | 5.11 | | | | (0.31 | ) | | | — | | | | (0.31 | ) | | $ | 37.59 | | | | 1.02 | | | | 1.35 | | | | 1.34 | | | | 1.35 | | | | 15.63 | | | | 51.36 | | | $ | 1,121,720 | |
Class B Shares | |
2011(b) | | $ | 28.81 | | | | (0.16 | ) | | | 6.13 | | | | 5.97 | | | | — | | | | — | | | | — | | | $ | 34.78 | | | | (0.99 | )(d) | | | 2.16 | (d) | | | 2.16 | (d) | | | 2.16 | (d) | | | 20.72 | | | | 30.77 | | | $ | 22,609 | |
2010 | | $ | 28.21 | | | | (0.04 | ) | | | 0.69 | | | | 0.65 | | | | (0.05 | ) | | | — | | | | (0.05 | ) | | $ | 28.81 | | | | (0.13 | ) | | | 2.18 | | | | 2.18 | | | | 2.18 | | | | 2.29 | | | | 72.75 | | | $ | 22,036 | |
2009 | | $ | 26.66 | | | | 0.16 | | | | 1.58 | | | | 1.74 | | | | (0.19 | ) | | | — | | | | (0.19 | ) | | $ | 28.21 | | | | 0.74 | | | | 2.22 | | | | 2.22 | | | | 2.22 | | | | 6.72 | | | | 83.00 | | | $ | 38,630 | |
2008 | | $ | 42.36 | | | | (0.09 | ) | | | (11.68 | ) | | | (11.77 | ) | | | — | (e) | | | (3.93 | ) | | | (3.93 | ) | | $ | 26.66 | | | | (0.28 | ) | | | 2.05 | | | | 2.05 | | | | 2.05 | | | | (30.05 | ) | | | 70.65 | | | $ | 64,287 | |
2007 | | $ | 36.17 | | | | (0.04 | ) | | | 7.55 | | | | 7.51 | | | | (0.02 | ) | | | (1.30 | ) | | | (1.32 | ) | | $ | 42.36 | | | | (0.09 | ) | | | 2.07 | | | | 2.07 | | | | 2.07 | | | | 21.26 | | | | 79.29 | | | $ | 113,299 | |
2006 | | $ | 31.60 | | | | 0.07 | | | | 4.58 | | | | 4.65 | | | | (0.08 | ) | | | — | | | | (0.08 | ) | | $ | 36.17 | | | | 0.21 | | | | 2.15 | | | | 2.14 | | | | 2.15 | | | | 14.71 | | | | 51.36 | | | $ | 96,587 | |
Class C Shares | |
2011(b) | | $ | 29.18 | | | | (0.14 | ) | | | 6.21 | | | | 6.07 | | | | — | | | | — | | | | — | | | $ | 35.25 | | | | (0.84 | )(d) | | | 2.02 | (d) | | | 2.03 | (d) | | | 2.02 | (d) | | | 20.80 | | | | 30.77 | | | $ | 366,953 | |
2010 | | $ | 28.55 | | | | (0.03 | ) | | | 0.73 | | | | 0.70 | | | | (0.07 | ) | | | — | | | | (0.07 | ) | | $ | 29.18 | | | | (0.09 | ) | | | 2.06 | | | | 2.06 | | | | 2.06 | | | | 2.43 | | | | 72.75 | | | $ | 329,761 | |
2009 | | $ | 26.99 | | | | 0.18 | | | | 1.61 | | | | 1.79 | | | | (0.23 | ) | | | — | | | | (0.23 | ) | | $ | 28.55 | | | | 0.81 | | | | 2.12 | | | | 2.12 | | | | 2.12 | | | | 6.83 | | | | 83.00 | | | $ | 361,966 | |
2008 | | $ | 42.82 | | | | (0.08 | ) | | | (11.81 | ) | | | (11.89 | ) | | | (0.01 | ) | | | (3.93 | ) | | | (3.94 | ) | | $ | 26.99 | | | | (0.23 | ) | | | 2.02 | | | | 2.01 | | | | 2.02 | | | | (30.03 | ) | | | 70.65 | | | $ | 401,880 | |
2007 | | $ | 36.55 | | | | (0.02 | ) | | | 7.62 | | | | 7.60 | | | | (0.03 | ) | | | (1.30 | ) | | | (1.33 | ) | | $ | 42.82 | | | | (0.05 | ) | | | 2.03 | | | | 2.03 | | | | 2.03 | | | | 21.29 | | | | 79.29 | | | $ | 621,687 | |
2006 | | $ | 31.92 | | | | 0.09 | | | | 4.62 | | | | 4.71 | | | | (0.08 | ) | | | — | | | | (0.08 | ) | | $ | 36.55 | | | | 0.27 | | | | 2.09 | | | | 2.09 | | | | 2.09 | | | | 14.77 | | | | 51.36 | | | $ | 490,399 | |
Class I Shares | |
2011(b) | | $ | 30.95 | | | | 0.05 | | | | 6.60 | | | | 6.65 | | | | (0.02 | ) | | | — | | | | (0.02 | ) | | $ | 37.58 | | | | 0.29 | (d) | | | 0.90 | (d) | | | 0.90 | (d) | | | 0.90 | (d) | | | 21.47 | | | | 30.77 | | | $ | 2,605,300 | |
2010 | | $ | 30.15 | | | | 0.30 | | | | 0.80 | | | | 1.10 | | | | (0.30 | ) | | | — | | | | (0.30 | ) | | $ | 30.95 | | | | 0.97 | | | | 0.94 | | | | 0.94 | | | | 0.94 | | | | 3.62 | | | | 72.75 | | | $ | 2,087,380 | |
2009 | | $ | 28.47 | | | | 0.46 | | | | 1.70 | | | | 2.16 | | | | (0.48 | ) | | | — | | | | (0.48 | ) | | $ | 30.15 | | | | 1.94 | | | | 0.98 | | | | 0.97 | | | | 1.00 | | | | 8.04 | | | | 83.00 | | | $ | 1,575,522 | |
2008 | | $ | 44.80 | | | | 0.32 | | | | (12.45 | ) | | | (12.13 | ) | | | (0.27 | ) | | | (3.93 | ) | | | (4.20 | ) | | $ | 28.47 | | | | 0.92 | | | | 0.91 | | | | 0.90 | | | | 0.91 | | | | (29.24 | ) | | | 70.65 | | | $ | 1,961,495 | |
2007 | | $ | 38.11 | | | | 0.44 | | | | 7.96 | | | | 8.40 | | | | (0.41 | ) | | | (1.30 | ) | | | (1.71 | ) | | $ | 44.80 | | | | 1.05 | | | | 0.93 | | | | 0.92 | | | | 0.93 | | | | 22.62 | | | | 79.29 | | | $ | 2,401,473 | |
2006 | | $ | 33.23 | | | | 0.50 | | | | 4.82 | | | | 5.32 | | | | (0.44 | ) | | | — | | | | (0.44 | ) | | $ | 38.11 | | | | 1.41 | | | | 0.98 | | | | 0.97 | | | | 0.98 | | | | 16.10 | | | | 51.36 | | | $ | 1,074,492 | |
Class R3 Shares | |
2011(b) | | $ | 30.24 | | | | (0.03 | ) | | | 6.45 | | | | 6.42 | | | | — | | | | — | | | | — | | | $ | 36.66 | | | | (0.16 | )(d) | | | 1.35 | (d) | | | 1.35 | (d) | | | 1.60 | (d) | | | 21.23 | | | | 30.77 | | | $ | 238,464 | |
2010 | | $ | 29.48 | | | | 0.17 | | | | 0.76 | | | | 0.93 | | | | (0.17 | ) | | | — | | | | (0.17 | ) | | $ | 30.24 | | | | 0.57 | | | | 1.35 | | | | 1.35 | | | | 1.66 | | | | 3.14 | | | | 72.75 | | | $ | 200,362 | |
2009 | | $ | 27.86 | | | | 0.36 | | | | 1.66 | | | | 2.02 | | | | (0.40 | ) | | | — | | | | (0.40 | ) | | $ | 29.48 | | | | 1.57 | | | | 1.35 | | | | 1.35 | | | | 1.72 | | | | 7.62 | | | | 83.00 | | | $ | 162,231 | |
2008 | | $ | 43.94 | | | | 0.17 | | | | (12.19 | ) | | | (12.02 | ) | | | (0.13 | ) | | | (3.93 | ) | | | (4.06 | ) | | $ | 27.86 | | | | 0.50 | | | | 1.35 | | | | 1.35 | | | | 1.66 | | | | (29.54 | ) | | | 70.65 | | | $ | 161,517 | |
2007 | | $ | 37.43 | | | | 0.26 | | | | 7.81 | | | | 8.07 | | | | (0.26 | ) | | | (1.30 | ) | | | (1.56 | ) | | $ | 43.94 | | | | 0.63 | | | | 1.35 | | | | 1.35 | | | | 1.63 | | | | 22.11 | | | | 79.29 | | | $ | 151,260 | |
2006 | | $ | 32.68 | | | | 0.37 | | | | 4.71 | | | | 5.08 | | | | (0.33 | ) | | | — | | | | (0.33 | ) | | $ | 37.43 | | | | 1.05 | | | | 1.36 | | | | 1.35 | | | | 1.69 | | | | 15.60 | | | | 51.36 | | | $ | 48,627 | |
Class R4 Shares | |
2011(b) | | $ | 30.39 | | | | (0.01 | ) | | | 6.48 | | | | 6.47 | | | | — | | | | — | | | | — | | | $ | 36.86 | | | | (0.06 | )(d) | | | 1.25 | (d) | | | 1.25 | (d) | | | 1.47 | (d) | | | 21.29 | | | | 30.77 | | | $ | 68,701 | |
2010 | | $ | 29.62 | | | | 0.19 | | | | 0.78 | | | | 0.97 | | | | (0.20 | ) | | | — | | | | (0.20 | ) | | $ | 30.39 | | | | 0.63 | | | | 1.25 | | | | 1.25 | | | | 1.49 | | | | 3.25 | | | | 72.75 | | | $ | 54,461 | |
2009 | | $ | 27.99 | | | | 0.39 | | | | 1.67 | | | | 2.06 | | | | (0.43 | ) | | | — | | | | (0.43 | ) | | $ | 29.62 | | | | 1.65 | | | | 1.25 | | | | 1.25 | | | | 1.54 | | | | 7.74 | | | | 83.00 | | | $ | 44,037 | |
2008 | | $ | 44.14 | | | | 0.19 | | | | (12.23 | ) | | | (12.04 | ) | | | (0.18 | ) | | | (3.93 | ) | | | (4.11 | ) | | $ | 27.99 | | | | 0.58 | | | | 1.24 | | | | 1.24 | | | | 1.48 | | | | (29.47 | ) | | | 70.65 | | | $ | 29,462 | |
2007(f) | | $ | 41.00 | | | | 0.20 | | | | 3.12 | | | | 3.32 | | | | (0.18 | ) | | | — | | | | (0.18 | ) | | $ | 44.14 | | | | 0.70 | (d) | | | 1.25 | (d) | | | 1.25 | (d) | | | 2.34 | (d) | | | 8.09 | | | | 79.29 | | | $ | 7,038 | |
Class R5 Shares | |
2011(b) | | $ | 30.92 | | | | 0.04 | | | | 6.58 | | | | 6.62 | | | | (0.01 | ) | | | — | | | | (0.01 | ) | | $ | 37.53 | | | | 0.21 | (d) | | | 0.98 | (d) | | | 0.98 | (d) | | | 1.05 | (d) | | | 21.42 | | | | 30.77 | | | $ | 291,000 | |
2010 | | $ | 30.13 | | | | 0.28 | | | | 0.79 | | | | 1.07 | | | | (0.28 | ) | | | — | | | | (0.28 | ) | | $ | 30.92 | | | | 0.91 | | | | 0.99 | | | | 0.99 | | | | 1.12 | | | | 3.54 | | | | 72.75 | | | $ | 228,768 | |
2009 | | $ | 28.45 | | | | 0.46 | | | | 1.71 | | | | 2.17 | | | | (0.49 | ) | | | — | | | | (0.49 | ) | | $ | 30.13 | | | | 1.93 | | | | 0.98 | | | | 0.98 | | | | 1.18 | | | | 8.05 | | | | 83.00 | | | $ | 165,663 | |
2008 | | $ | 44.78 | | | | 0.32 | | | | (12.47 | ) | | | (12.15 | ) | | | (0.25 | ) | | | (3.93 | ) | | | (4.18 | ) | | $ | 28.45 | | | | 0.92 | | | | 0.98 | | | | 0.98 | | | | 1.03 | | | | (29.30 | ) | | | 70.65 | | | $ | 135,173 | |
2007 | | $ | 38.09 | | | | 0.49 | | | | 7.91 | | | | 8.40 | | | | (0.41 | ) | | | (1.30 | ) | | | (1.71 | ) | | $ | 44.78 | | | | 1.14 | | | | 0.91 | | | | 0.91 | | | | 0.93 | | | | 22.63 | | | | 79.29 | | | $ | 106,906 | |
2006 | | $ | 33.22 | | | | 0.24 | | | | 5.07 | | | | 5.31 | | | | (0.44 | ) | | | — | | | | (0.44 | ) | | $ | 38.09 | | | | 0.64 | | | | 1.00 | | | | 0.98 | | | | 3.24 | | | | 16.07 | | | | 51.36 | | | $ | 10,483 | |
| (a) | Not annualized for periods less than one year. |
| (b) | Unaudited Six Month Period Ended March 31. |
| (c) | Sales loads are not reflected in computing total return. |
| (e) | Dividends from net investment income per share were less than $(0.01). |
| (f) | Effective date of this class of shares was February 1, 2007. |
| + | Based on weighted average shares outstanding. |
See notes to financial statements.
| | |
| 28 Certified Semi-Annual Report | | Certified Semi-Annual Report 29 |
| | |
| EXPENSE EXAMPLE | | |
| |
| Thornburg Value Fund | | March 31, 2011 (Unaudited) |
As a shareholder of the Fund, you incur two types of costs:
| | (1) | transaction costs, including |
(a) sales charges (loads) on purchase payments for Class A shares;
(b) a deferred sales charge on redemptions of any part or all of a purchase of $1 million of Class A shares within 12 months of purchase;
(c) a deferred sales charge on redemptions of Class B shares within eight years of purchase;
(d) a deferred sales charge on redemptions of Class C shares within 12 months of purchase;
(e) a 30-day redemption fee on Class A and Class I shares;
| | (2) | ongoing costs, including management fees; distribution and/or service (12b-1) fees; and other Fund expenses. |
This example is intended to help you understand your ongoing costs (in dollars) of investing in the Fund and to compare these costs with the ongoing costs of investing in other mutual funds.
The example is based on a $1,000 investment beginning on October 1, 2010, and held until March 31, 2011.
ACTUAL EXPENSES
For each class of shares, the first line of the table at right provides information about actual account values and actual expenses. You may use the information in this line, together with the amount you invested, to estimate the expenses that you paid over the period. Simply divide your account value by $1,000 (for example, an $8,600 account value divided by $1,000 = 8.6), then multiply the result by the number in the first line for your class of shares under the heading entitled “Expenses Paid During Period” to estimate the expenses you paid on your account during this period.
HYPOTHETICAL EXAMPLE FOR COMPARISON PURPOSES
For each class of shares, the second line of the table at right provides information about hypothetical account values and hypothetical expenses based on the Fund’s actual expense ratio and an assumed rate of return of 5% per year before expenses, which is not the Fund’s actual return. The hypothetical account values and expenses may not be used to estimate the actual ending account balance or expenses you paid for the period. You may use this information to compare the ongoing costs of investing in the Fund and other funds. To do so, compare this 5% hypothetical example with the 5% hypothetical examples that appear in the shareholder reports of the other funds.
| | | | | | | | | | | | |
| | | Beginning
Account Value
10/1/10 | | | Ending
Account Value
3/31/11 | | | Expenses Paid
During Period†
10/1/10–3/31/11 | |
Class A Shares | | | | | | | | | | | | |
Actual | | $ | 1,000.00 | | | $ | 1,212.50 | | | $ | 7.02 | |
Hypothetical* | | $ | 1,000.00 | | | $ | 1,018.59 | | | $ | 6.40 | |
Class B Shares | | | | | | | | | | | | |
Actual | | $ | 1,000.00 | | | $ | 1,207.20 | | | $ | 11.91 | |
Hypothetical* | | $ | 1,000.00 | | | $ | 1,014.14 | | | $ | 10.87 | |
Class C Shares | | | | | | | | | | | | |
Actual | | $ | 1,000.00 | | | $ | 1,208.00 | | | $ | 11.15 | |
Hypothetical* | | $ | 1,000.00 | | | $ | 1,014.83 | | | $ | 10.17 | |
Class I Shares | | | | | | | | | | | | |
Actual | | $ | 1,000.00 | | | $ | 1,214.70 | | | $ | 4.99 | |
Hypothetical* | | $ | 1,000.00 | | | $ | 1,020.42 | | | $ | 4.55 | |
Class R3 Shares | | | | | | | | | | | | |
Actual | | $ | 1,000.00 | | | $ | 1,212.30 | | | $ | 7.44 | |
Hypothetical* | | $ | 1,000.00 | | | $ | 1,018.20 | | | $ | 6.79 | |
Class R4 Shares | | | | | | | | | | | | |
Actual | | $ | 1,000.00 | | | $ | 1,212.90 | | | $ | 6.89 | |
Hypothetical* | | $ | 1,000.00 | | | $ | 1,018.71 | | | $ | 6.28 | |
Class R5 Shares | | | | | | | | | | | | |
Actual | | $ | 1,000.00 | | | $ | 1,214.20 | | | $ | 5.41 | |
Hypothetical* | | $ | 1,000.00 | | | $ | 1,020.04 | | | $ | 4.94 | |
| † | Expenses are equal to the annualized expense ratio for each class (A: 1.27%; B: 2.16%; C: 2.03%; I: 0.90%; R3: 1.35%; R4: 1.25%; R5: 0.98%) multiplied by the average account value over the period, multiplied by 182/365 to reflect the one-half year period. |
| * | Hypothetical assumes a rate of return of 5% per year before expenses. |
Please note that the expenses shown in the table are meant to highlight your ongoing costs only and do not reflect any transactional costs, such as sales charges (loads), redemption fees, or exchange fees. Therefore, the second line of the table for each class of shares is useful in comparing ongoing costs only, and will not help you determine the relative total costs of owning different funds. In addition, if these transactional costs were included, your costs would have been higher.
30 Certified Semi-Annual Report
| | |
| INDEX COMPARISON | | |
| |
| Thornburg Value Fund | | March 31, 2011 (Unaudited) |
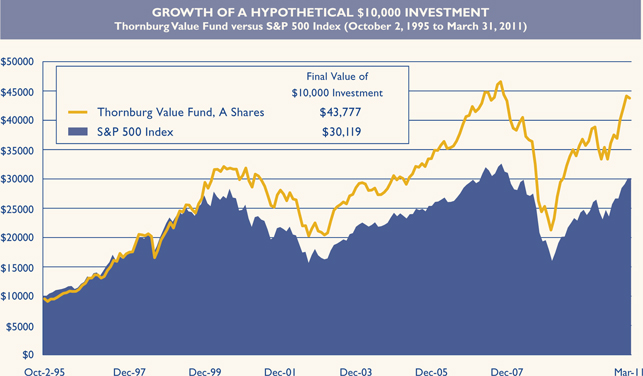
AVERAGE ANNUAL TOTAL RETURNS
For periods ended March 31, 2011 (with sales charge)
| | | | | | | | | | | | | | | | |
| | | 1 Yr | | | 5 Yrs | | | 10 Yrs | | | Since
Inception | |
A Shares (Incep: 10/2/95) | | | 8.45 | % | | | 3.18 | % | | | 3.86 | % | | | 10.00 | % |
B Shares (Incep: 4/3/00) | | | 7.56 | % | | | 2.92 | % | | | 3.66 | % | | | 2.43 | % |
C Shares (Incep: 10/2/95) | | | 11.69 | % | | | 3.35 | % | | | 3.55 | % | | | 9.48 | % |
I Shares (Incep: 11/2/98) | | | 13.99 | % | | | 4.52 | % | | | 4.75 | % | | | 6.96 | % |
R3 Shares (Incep: 7/1/03) | | | 13.50 | % | | | 4.08 | % | | | — | | | | 7.28 | % |
R4 Shares (Incep: 2/1/07) | | | 13.63 | % | | | — | | | | — | | | | 0.68 | % |
R5 Shares (Incep: 2/1/05) | | | 13.90 | % | | | 4.48 | % | | | — | | | | 6.68 | % |
S&P 500 Index (Since 10/2/95) | | | 15.65 | % | | | 2.62 | % | | | 3.29 | % | | | 7.37 | % |
Performance data shown represents past performance and is no guarantee of future results. Investment return and principal value will fluctuate so shares, when redeemed, may be worth more or less than their original cost. Current performance may be lower or higher than quoted. For performance current to the most recent month end, visit thornburg.com or call 800-847-0200. The performance data and graph do not reflect the deduction of taxes that a shareholder would pay on distributions or the redemption of Fund shares. Returns reflect the reinvestment of dividends and capital gains as well as applicable sales charges. Class A shares are sold with a maximum sales charge of 4.50%. Class B shares carry a contingent deferred sales charge (CDSC) that declines from 5.00% to 0% depending upon the period of time the shares are held. Class B shares will automatically convert to Class A shares on a quarterly basis approximately eight years after purchase. Class C shares are subject to a 1% CDSC for the first year only. There is no up-front sales charge for Class I, R3, R4 and R5 shares. Class A and I shares are subject to a 1% 30-day redemption fee.
Certified Semi-Annual Report 31
| | |
| OTHER INFORMATION | | |
| |
| Thornburg Value Fund | | March 31, 2011 (Unaudited) |
PORTFOLIO PROXY VOTING
Policies and Procedures:
The Trust has delegated to Thornburg Investment Management, Inc. (the “Advisor”) voting decisions respecting proxies for the Fund’s voting securities. The Advisor makes voting decisions in accordance with its Proxy Voting Policy and Procedures. A description of the Policy and Procedures is available (i) without charge, upon request, by calling the Advisor toll-free at 1-800-847-0200, (ii) on the Thornburg web site at www.thornburg.com, and (iii) on the Securities and Exchange Commission’s web site at www.sec.gov.
Information regarding how proxies were voted is available on or before August 31 of each year for the twelve months ending the preceding June 30. This information is available (i) without charge, upon request by calling the Advisor toll-free at 1-800-847-0200, (ii) on the Thornburg web site at www.thornburg.com, and (iii) on the Securities and Exchange Commission’s web site at www.sec.gov.
AVAILABILITY OF QUARTERLY PORTFOLIO SCHEDULE
The Fund files with the Securities and Exchange Commission schedules of its portfolio holdings on Form N-Q for the first and third quarters of each fiscal year. The Fund’s Forms N-Q are available on the Commission’s web site at www.sec.gov, or may be reviewed and copied at the Commission’s Public Reference Room in Washington, D.C. Information on the operation of the Public Reference Room may be obtained by calling 1-800-SEC-0330. The Fund also makes this information available on its web site at www.thornburg. com/download or upon request by calling 1-800-847-0200.
32 Certified Semi-Annual Report
Trustees’ Statement to Shareholders
Not part of the Certified Semi-Annual Report
February 8, 2005, as readopted September 13, 2010
The Trustees are concerned that ongoing commentaries and opinions reported in the media may confuse investors in general as to the supervisory duties of trustees of mutual funds and, in particular, leave Thornburg Investment Trust shareholders uncertain regarding how we discharge our responsibilities in supervising the Funds’ investment advisor and in reviewing the advisor’s contract for renewal. We decided to spell out clearly three principal guidelines that we follow in supervising the Trust’s investment advisor on your behalf.
We begin with the premise that each shareholder selected his or her Fund because its investments are managed by the investment advisor identified in the prospectus and in accordance with the objective and policies described in the prospectus. We realize, as each of you do, that if you believe that your Fund’s stated objective and policies no longer serve your personal investment goals, you can sell your shares and leave the Fund.
Therefore, we believe that our primary supervisory task – our principal obligation to you – is to assess the nature and quality of the advisor’s services, and to confirm that the advisor actively and competently pursues the Fund’s objective, in accordance with the policies set out in the prospectus. To do this, we meet regularly with management to review your Fund’s portfolio and to discuss the advisor’s specific actions and judgments in pursuing the Fund’s objective. We do not substitute our own judgment for the advisor’s decisions in selecting investments; the advisor is paid to exercise its informed judgment on investment decisions, and we seek to confirm, in reviewing the advisor’s performance, that the advisor is doing just that.
Second, while we are conscious of costs and the effect that costs have on shareholders’ returns, we do not seek the lowest fees or expense ratio as our sole or primary objective. We try to make sure that your Fund’s fees and costs are reasonable in relationship to the services rendered and that they are generally in line with those charged by other expert investment advisors, consistent with our belief that the Fund’s investors searched for and expect that expertise and attention and have decided to pay a reasonable price for it. We do not put the management contract “out to bid” as a matter of course, and we would not do so unless we had concluded that the advisor materially had failed to pursue the Fund’s objectives in accordance with its policies, or for other equally important reasons. We believe that any other approach would be inconsistent with your interests and contrary to your expectations when you bought shares of the Fund in the first place.
Finally, because we believe that most Thornburg Fund shareholders have invested with a long-term perspective, we try not to focus too much on the fashions of the moment and on short-term performance. The market will not favor any specific investment objective or set of policies at all times and under all economic circumstances. A fund will experience periods of both high and low returns relative to other funds and other investments. Even if one of our Funds is not favored by the market at a particular time, we believe that the advisor is nonetheless obliged to remain true to the Fund’s objective and policies, and we watch to see that it does so.
This page is not part of the Semi-Annual Report. 33
This page intentionally left blank.
34 This page is not part of the Semi-Annual Report.
Retirement and Education Accounts
Thornburg Investment Management offers retirement and education savings accounts that can help you meet a variety of planning challenges. For account applications or further information on any of the accounts below, please call 1-800-847-0200 or go to www.thornburg.com/ira. Your financial advisor can help you determine which plan is right for you.
Individual Retirement Accounts
Individual Retirement Accounts (IRAs) provide a tax-advantaged means to save money for the future. For a detailed outline of the difference between retirement accounts, see www.thornburg.com/ira. Rollovers are available. Call 1-800-847-0200 for more information.
Traditional IRAs – Contributions to Traditional IRAs are tax deductible for eligible individuals, and withdrawals are taxed as additional ordinary income. You may contribute to an IRA if you receive compensation and are under 70 1/2, even if you are covered by an employer retirement plan. Deductible contributions are subject to certain qualifications. Please consult your tax advisor.
Roth IRAs – Under a Roth IRA, there is no tax deduction for contributions, but there is no income tax on qualified withdrawals. For a more detailed comparison of Traditional and Roth IRAs, please see our web site at www.thornburg.com/ira.
SEP IRAs – Simplified Employee Pension (SEP) IRAs are established by employers. The employer is allowed a tax deduction for contributions made to the SEP Plan and makes contributions to each eligible employee’s SEP IRA on a discretionary basis.
SIMPLE IRAs – Savings Incentive Match Plan for Employees of Small Employers (SIMPLE) is designed to give small business owners a simplified method to establish and contribute to a retirement plan for employees. The employer is allowed a tax deduction for contributions and makes either matching or non-elective contributions to each eligible employee’s SIMPLE IRA. Employees may make salary deferral contributions.
Coverdell Education Savings Account
These savings accounts are designed to provide a way to save money for higher education expenses. In an Education Savings Account, earnings and interest grow tax-free, and qualified withdrawals used to pay for eligible higher-education expenses are tax- and penalty-free.
Funds Available
The following funds are available in the accounts listed above:
| | • | | Thornburg International Value Fund |
| | • | | Thornburg Core Growth Fund |
| | • | | Thornburg Investment Income Builder Fund |
| | • | | Thornburg Global Opportunities Fund |
| | • | | Thornburg International Growth Fund |
| | • | | Thornburg Developing World Fund |
| | • | | Thornburg Limited Term U.S. Government Fund |
| | • | | Thornburg Limited Term Income Fund |
| | • | | Thornburg Strategic Income Fund |
This page is not part of the Semi-Annual Report. 35

Thornburg Equity Funds
Thornburg’s equity research uses a fundamental and comprehensive analytical approach. Thornburg equity funds focus on a limited number of securities so that each holding can impact performance. The equity team searches for firms believed to have a promising future and seeks to buy shares of those companies at a discount to their intrinsic value.
| | • | | Thornburg International Value Fund |
| | • | | Thornburg Core Growth Fund |
| | • | | Thornburg Investment Income Builder Fund |
| | • | | Thornburg Global Opportunities Fund |
| | • | | Thornburg International Growth Fund |
| | • | | Thornburg Developing World Fund |
Thornburg Bond Funds
Thornburg Investment Management applies a disciplined philosophy to fixed-income management. Since the launch of our first fixed-income fund over 25 years ago, we have been conducting fundamental, bottom-up research in an effort to identify bonds which we believe provide the best return for a given level of risk. We are very organic in our approach, avoiding leverage or complex strategies which could backfire in periods of market uncertainty.
| | • | | Thornburg Limited Term Municipal Fund |
| | • | | Thornburg Intermediate Municipal Fund |
| | • | | Thornburg California Limited Term Municipal Fund |
| | • | | Thornburg New Mexico Intermediate Municipal Fund |
| | • | | Thornburg New York Intermediate Municipal Fund |
| | • | | Thornburg Strategic Municipal Income Fund |
| | • | | Thornburg Limited Term U.S. Government Fund |
| | • | | Thornburg Limited Term Income Fund |
| | • | | Thornburg Strategic Income Fund |
Before investing, carefully consider the Fund’s investment goals, risks, charges, and expenses. For a prospectus containing this and other information, contact your financial advisor or visit thornburg. com. Read it carefully before investing.
For additional information, please visit www.thornburg.com
Thornburg Investment Management, Inc. 2300 North Ridgetop Road, Santa Fe, NM 87506
This page is not part of the Semi-Annual Report. 37
This page intentionally left blank.
38 This page is not part of the Semi-Annual Report.
This page intentionally left blank.
This page is not part of the Semi-Annual Report. 39
| | | | | | |
 | | Waste not, Wait not | |  |
| | |
| | | | Get instant access to your shareholder reports. |
| | |
| | This Semi-Annual Report is submitted for the general information of shareholders of the Fund. It is not authorized for distribution to prospective investors in the Fund unless preceded or accompanied by an effective prospectus. | | By switching from your postal mailbox to your email inbox, you reduce paper clutter, improve record keeping access, and help conserve our natural resources. |
| | |
 | | Investment Advisor: Thornburg Investment Management® 800.847.0200 | | Go to www.thornburg.com/edelivery and sign up to receive your shareholder reports, prospectuses, and proxy statements electronically. |
| | Distributor: | | |
| | Thornburg Securities Corporation® 800.847.0200 | | You invest in the future, without spending a dime. |
| | TH170 | | | | |

Important Information
The information presented on the following pages was current as of March 31, 2011. The managers’ views, portfolio holdings, and sector and country diversification are provided for the general information of the Fund’s shareholders; they are historical and subject to change. This material should not be deemed a recommendation to buy or sell any of the securities mentioned.
Investments in the Fund carry risks, including possible loss of principal. Special risks may be associated with investments outside the United States, especially in emerging markets, including currency fluctuations, illiquidity and volatility. Investments in small capitalization companies may increase the risk of greater price fluctuations. Please see the Fund’s Prospectus for a discussion of the risks associated with an investment in the Fund. Investments in the Fund are not FDIC insured, nor are they deposits of or guaranteed by a bank or any other entity. There is no guarantee that the Fund will meet its investment objectives. Funds invested in a limited number of holdings may expose an investor to greater volatility.
Performance data given at net asset value (NAV) does not take into account the applicable sales charges. If the sales charges had been included, the performance would have been lower.
Class I, R3, R4, and R5 shares may not be available to all investors. Minimum investments for Class I shares may be higher than those for other classes.
| | | | |
Share Class | | NASDAQ Symbol | | Cusip |
Class A | | TGVAX | | 885-215-657 |
Class B | | THGBX | | 885-215-616 |
Class C | | THGCX | | 885-215-640 |
Class I | | TGVIX | | 885-215-566 |
Class R3 | | TGVRX | | 885-215-525 |
Class R4 | | THVRX | | 885-215-269 |
Class R5 | | TIVRX | | 885-215-368 |
Glossary
MSCI EAFE (Europe, Australasia, Far East) Index – An unmanaged, market capitalization weighted index that is the common benchmark for international portfolio performance. The index is calculated with net dividends reinvested in U.S. dollars.
MSCI All Country (AC) World ex-U.S. Index – A market capitalization weighted index representative of the market structure of 44 developed and emerging market countries in North and South America, Europe, Africa, and the Pacific Rim, excluding securities of United States’ issuers. The index is calculated with gross dividends reinvested in U.S. dollars.
Unless otherwise noted, index returns reflect the reinvestment of income dividends and capital gains, if any, but do not reflect fees, brokerage commissions or other expenses of investing. Investors may not make direct investments into any index. The performance of any index is not indicative of the performance of any particular investment.
Beta – A measure of market-related risk. Less than one means the portfolio is less volatile than the index, while greater than one indicates more volatility than the index.
Median Market Capitalization – Market capitalization (market cap) is the total value of a company’s stock, calculated by multiplying the number of outstanding common shares by the current share price. The company whose market cap is in the middle of the portfolio is the median market cap. Half the companies in the portfolio have values greater than the median, and half have values that are less.
Price to Book Value (P/B) – A ratio used to compare a stock’s market value to its book value. It is calculated by dividing the current closing price of the stock by the latest quarter’s book value (book value is simply assets minus liabilities).
Price to Cash Flow Ratio – A measure of the market’s expectations of a firm’s future financial health. It is calculated by dividing the price per share by cash flow per share.
Price to Earnings Ratio (P/E) – A valuation ratio equaling a company’s market value per share divided by earnings per share.
This page is not part of the Semi-Annual Report. 3
Thornburg International Value Fund

IMPORTANT PERFORMANCE INFORMATION
Performance data shown represents past performance and is no guarantee of future results. Investment return and principal value will fluctuate so shares, when redeemed, may be worth more or less than their original cost. Current performance may be lower or higher than quoted. For performance current to the most recent month end, visit thornburg.com or call 800.847.0200.
The maximum sales charge for Class A shares is 4.50%. Class A shares are subject to a 1% 30-day redemption fee. The total annual fund operating expense of Class A shares is 1.33%, as disclosed in the most recent Prospectus.
Finding Promising Companies at a Discount
The Thornburg International Value Fund seeks to find value in overseas markets. It differs from many other international equity funds in two key ways. First, it focuses on a limited number of stocks, and second, it takes a more comprehensive approach to value investing.
Our team is dedicated to providing value to shareholders. We accomplish this through the application of seasoned investment principles with hands-on, company-oriented research. We use a collaborative approach in implementing our investment research process. Our focus is on finding promising companies available at a discount to our estimate of their intrinsic value, no matter where they are located outside the United States. Geographic location is secondary to individual stock merit.
In managing the Thornburg International Value Fund, we take a bottom-up approach to stock selection. The Fund is not predisposed to a particular geographic region or industry. We use a variety of valuation methods and business evaluations in an effort to gauge the intrinsic value of a company based on its past record and future potential. The continuum of process moves from screens and idea generation, through conventional “Wall Street” research and documentation, to company contact, the latter often including on-site visits. The focus of the analysis is on what’s behind the numbers:
AVERAGE ANNUAL TOTAL RETURNS
FOR PERIODS ENDED 3/31/11
| | | | | | | | | | | | | | | | | | | | |
| | | 1 Yr | | | 3 Yrs | | | 5 Yrs | | | 10 Yrs | | | Since
Inception | |
A Shares (Incep: 5/28/98) | | | | | | | | | | | | | | | | | | | | |
Without sales charge | | | 16.45 | % | | | 0.48 | % | | | 5.75 | % | | | 9.20 | % | | | 9.73 | % |
With sales charge | | | 11.22 | % | | | -1.05 | % | | | 4.78 | % | | | 8.70 | % | | | 9.33 | % |
MSCI EAFE Index (Since: 5/28/98) | | | 10.42 | % | | | -3.01 | % | | | 1.30 | % | | | 5.39 | % | | | 4.02 | % |
4 This page is not part of the Semi-Annual Report.
its revenue and cash-generating model. We make an effort to get to know the company’s reputation in the industry, its people and its corporate culture.
The current posture is to maintain a portfolio of 50–75 companies diversified by country, sector, industry, market capitalization, and our three categories of stocks: Basic Value, Consistent Earners and Emerging Franchises. Because of the limited number of stocks in the portfolio, every holding counts. At the time of purchase, we set a 12–18 month price target for each stock. The target is reviewed as the fundamentals of the stock change during the course of ownership.
The bottom line? Engendering a wide-open, collegial environment fosters information flows and critical thinking intended to benefit portfolio decision making. We do not view our location in Santa Fe, NM, as a disadvantage. While we have access to the best of Wall Street’s analysis, we are not ruled by it. Distance from the crowd serves to fortify independent and objective thinking.
STOCKS CONTRIBUTING AND DETRACTING
FOR THE SIX MONTHS ENDED 3/31/11
| | |
| Top Contributors | | Top Detractors |
HTC Corp. | | Turkiye Garanti Bankasi A.S. |
Komatsu Ltd. | | Sinopharm Group Co. Ltd. |
Volkswagen AG Pfd | | Intesa Sanpaolo S.p.A. |
Schlumberger Ltd. | | Tesco plc |
Novo Nordisk A/S | | Hennes & Mauritz AB |
Source: FactSet | | |
KEY PORTFOLIO ATTRIBUTES
As of 3/31/11
| | | | |
Portfolio P/E Trailing 12-months* | | | 15.3x | |
Portfolio Price to Cash Flow* | | | 8.3x | |
Portfolio Price to Book Value* | | | 2.1x | |
Median Market Cap* | | $ | 39.3 B | |
7-Year Beta (A Shares vs. MSCI EAFE)* | | | 0.89 | |
Number of Companies | | | 66 | |
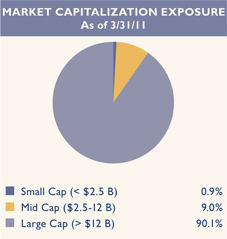
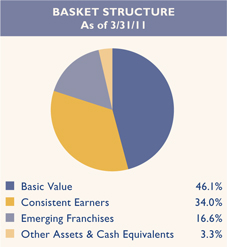
This page is not part of the Semi-Annual Report. 5

Thornburg International Value Fund
March 31, 2011
Table of Contents
This report is certified under the Sarbanes-Oxley Act of 2002, which requires that public companies, including mutual funds, affirm that the information provided in their annual and semiannual shareholder reports fully and fairly represents their financial position.
6 Certified Semi-Annual Report
Letter to Shareholders
| | |


| | April 15, 2011 Dear Fellow Shareholder: Once again, we are pleased to report encouraging results regarding your investment in the Thornburg International Value Fund. For the six-month period ended March 31, 2011, the Thornburg International Value Fund (Class A shares at NAV) total return was 12.45% compared with 10.20% and 10.99% for the benchmarks MSCI EAFE Index and MSCI All Country World ex-U.S. Index, respectively. Against a backdrop of a sovereign debt crisis in Europe, inflation concerns in the emerging markets, political turmoil in the Middle East and Africa, and the devastating earthquake and tsunami in Japan, markets were surprisingly resilient during the period. The continued global economic rebound from the 2008 financial crisis has helped to restore business and consumer confidence in the face of a challenging environment. Earnings continue to be in recovery mode in many industries and most regions around the globe, a positive signal as this is the ultimate driver of stock prices. Stocks in the energy, automotive, and technology sectors led performance during the period. Though a concern on the economic and inflation front, higher oil prices boosted the profit potential of our oil and gas production and service companies. Schlumberger, a leading oil service company, was the outstanding performer in the sector, while Canadian Natural Resources, BG Group, and CNOOC contributed positively in the production segment. Two of our automobile holdings, Hyundai and Volkswagen, rose on the strength of emerging market exposure and continuation of the economic rebound in Europe and the United States. In technology, stock selection was key in what was generally a weak sector. HTC (Taiwan handsets) and Arm Holdings (U.K. semiconductor microprocessors) were exceptional performers due to their exposure to the explosive growth in smartphones. Other notable positive performance came from Komatsu (Japan construction and mining equipment) and Novo Nordisk (Danish pharmaceutical company focused on diabetes). |
Certified Semi-Annual Report 7
Letter to Shareholders,
Continued
While the rise in oil and other commodity prices lifted some holdings, concerns about inflation, interest rates and overheating economies in emerging markets pressured others. The disappointing performance of Turkiye Garanti Bank, Sinopharm (Chinese pharmaceutical distributor) and BM&F Bovespa (Brazilian securities exchange) reflect these influences. A number of consumer related issues were also impacted by inflationary cost pressures such as Tesco (U.K. retailer), Hennes & Mauritz (Swedish apparel chain), and Reckitt Benckiser (U.K. manufacturer of household products). The rebound of financial service stocks also lost traction as well, as Standard Chartered and BNP Paribas retraced earlier good performance. While we were underweight Japan during the period (approximately 10% total portfolio exposure), Canon and Mitsubishi UFJ (bank) suffered due to perceived ramifications of the natural disaster.
Portfolio activity during the period included the elimination of eleven names and the addition of nine new holdings. Other activity revolved around opportunistic additions and trims to existing positions. Sales in the portfolio included Petrobras, KPN, Taiwan Semiconductor, Cairn Energy, Intesa Sanpaola, Smith & Nephew, British Sky Broadcasting, Amdocs, and Thomson Reuters. British Sky and Smith & Nephew were sold after appreciation on acquisition rumors. Others were eliminated to make room for what we consider more promising opportunities. New names included three energy related issues: Seadrill, Coal India, and Cenovus Energy; two insurance companies: Allianz and China Life, (the latter repurchased after a retracement); and a mix of others including Siemens, adidas, Credit Suisse Group, and KDDI, all of which we believe to hold strong value propositions.
It is only natural that current equity investor enthusiasm be tempered by the impact of the economic disruption in Japan, unrest in the Middle East and sovereign debt issues in Europe. While the earthquake-affected areas of Northeastern Japan are believed to only account for about 2% of Japanese Gross Domestic Product (GDP), the disruptions to production, radiation leaks from the Fukushima nuclear plant, and continuing power shortages are having a broader impact than originally anticipated. Near-term production in industries such as electronics and automobiles will be challenged for the many companies dependent on Japanese parts suppliers. Thus far, most of our Japanese holdings have held up relatively well, and compared with the benchmarks, our exposure to Japan remains modest. Despite the current challenges, we expect our Japanese holdings to return to normal operations in short order. Our longer-term investment theses for these stocks remain intact.
Additionally, there is considerable uncertainty associated with the political events in the Middle East. From an investment prospective, the concern mainly surrounds the potential for an oil price-driven inflation shock, harming economies dependent on imported oil. Efforts to contain the inflationary impact in countries that have been global growth drivers could undermine the progress of economic recovery. While this may not encourage risk taking, it does create opportunities for investors with time horizons beyond the next few weeks or months. We are never complacent, but we believe our approach to diversification, inclusive of “Basic Value”,
8 Certified Semi-Annual Report
“Consistent Earner” and “Emerging Franchise” stocks, in a portfolio focused on the merits and valuations of individual holdings can yield successful investment returns over time.
Thank you for your trust and confidence. To learn more about your portfolio’s holdings, please visit www. thornburg.com/funds.
Sincerely,
| | | | |

| | 
| | 
|
| William V. Fries, CFA | | Wendy Q. Trevisani | | Lei Wang, CFA |
| Co-Portfolio Manager | | Co-Portfolio Manager | | Co-Portfolio Manager |
| Managing Director | | Managing Director | | Managing Director |
The matters discussed in this report may constitute forward-looking statements made pursuant to the safe harbor provisions of the Securities Litigation Reform Act of 1995. These include any advisor or portfolio manager prediction, assessment, analysis or outlook for individual securities, industries, investment styles, market sectors and/or markets. These statements involve risks and uncertainties. In addition to the general risks described for each fund in its current prospectus, other factors bearing on these reports include the accuracy of the advisor’s or portfolio manager’s forecasts and predictions, the appropriateness of the investment strategies designed by the advisor or portfolio manager, and the ability of the advisor or portfolio manager to implement their strategies efficiently and successfully. Any one or more of these factors, as well as other risks affecting the securities markets generally, could cause the actual results of any fund to differ materially as compared to its benchmarks.
Certified Semi-Annual Report 9
SCHEDULE OF INVESTMENTS
| | |
| Thornburg International Value Fund | | March 31, 2011(Unaudited) |
TOP TEN HOLDINGS
As of 3/31/11
| | | | | | | | | | |
Komatsu Ltd. | | | 2.7 | % | | SAP AG | | | 2.2 | % |
HTC Corp. | | | 2.5 | % | | LVMH Moët Hennessy Louis Vuitton SA | | | 2.2 | % |
Novo Nordisk A/S | | | 2.5 | % | | Siemens AG | | | 2.1 | % |
Volkswagen AG Pfd | | | 2.5 | % | | Teva Pharmaceutical Industries Ltd. ADR | | | 2.1 | % |
CNOOC Ltd. | | | 2.3 | % | | BG Group plc | | | 2.1 | % |
SUMMARY OF INDUSTRY EXPOSURE
As of 3/31/11
| | | | | | | | | | |
Energy | | | 10.5 | % | | Consumer Durables & Apparel | | | 3.1 | % |
Banks | | | 9.6 | % | | Insurance | | | 2.9 | % |
Materials | | | 8.5 | % | | Retailing | | | 2.9 | % |
Diversified Financials | | | 8.2 | % | | Household & Personal Products | | | 2.5 | % |
Capital Goods | | | 7.2 | % | | Media | | | 2.5 | % |
Pharmaceuticals, Biotechnology & Life Sciences | | | 6.6 | % | | Software & Services | | | 2.2 | % |
Automobiles & Components | | | 6.2 | % | | Consumer Services | | | 1.6 | % |
Food, Beverage & Tobacco | | | 4.9 | % | | Transportation | | | 1.5 | % |
Technology Hardware & Equipment | | | 4.1 | % | | Semiconductors & Semiconductor Equipment | | | 1.0 | % |
Food & Staples Retailing | | | 3.4 | % | | Other Non-Classified Securities: | | | | |
Health Care Equipment & Services | | | 3.4 | % | | Exchange Traded Funds | | | 0.5 | % |
Telecommunication Services | | | 3.4 | % | | Other Assets & Cash Equivalents | | | 3.3 | % |
SUMMARY OF COUNTRY EXPOSURE
As of 3/31/11 (percent of equity holdings)
| | | | | | | | | | |
United Kingdom | | | 15.8 | % | | Taiwan | | | 2.6 | % |
Germany | | | 12.7 | % | | Israel | | | 2.2 | % |
Japan | | | 10.8 | % | | Hong Kong | | | 2.1 | % |
France | | | 9.0 | % | | Spain | | | 1.9 | % |
China | | | 7.2 | % | | South Korea | | | 1.9 | % |
Switzerland | | | 6.6 | % | | Australia | | | 1.8 | % |
Netherlands | | | 5.3 | % | | Sweden | | | 1.6 | % |
Canada | | | 5.1 | % | | Ireland | | | 1.1 | % |
Mexico | | | 3.3 | % | | Turkey | | | 1.0 | % |
Denmark | | | 3.2 | % | | Norway | | | 1.0 | % |
Brazil | | | 2.9 | % | | India | | | 0.9 | % |
10 Certified Semi-Annual Report
| | |
| SCHEDULE OF INVESTMENTS, CONTINUED | | |
| |
| Thornburg International Value Fund | | March 31, 2011 (Unaudited) |
| | | | | | | | |
| | | Shares/
Principal Amount | | | Value | |
COMMON STOCK — 93.66% | | | | | | | | |
AUTOMOBILES & COMPONENTS — 3.71% | | | | | | | | |
AUTOMOBILES — 3.71% | | | | | | | | |
Hyundai Motor Co. | | | 2,820,953 | | | $ | 522,041,532 | |
Toyota Motor Corp. | | | 13,438,126 | | | | 541,208,489 | |
| | | | | | | | |
| | | | | | | 1,063,250,021 | |
| | | | | | | | |
BANKS — 9.58% | | | | | | | | |
COMMERCIAL BANKS — 9.58% | | | | | | | | |
BNP Paribas SA | | | 7,573,758 | | | | 553,957,247 | |
China Merchants Bank Co. Ltd. | | | 155,470,732 | | | | 430,722,214 | |
Industrial & Commercial Bank of China Ltd. | | | 578,452,100 | | | | 480,398,090 | |
Mitsubishi UFJ Financial Group, Inc. | | | 107,819,900 | | | | 497,749,959 | |
Standard Chartered plc | | | 19,238,545 | | | | 499,045,939 | |
Turkiye Garanti Bankasi A.S. | | | 60,683,568 | | | | 283,757,236 | |
| | | | | | | | |
| | | | | | | 2,745,630,685 | |
| | | | | | | | |
CAPITAL GOODS — 7.20% | | | | | | | | |
AEROSPACE & DEFENSE — 0.64% | | | | | | | | |
Embraer S.A. | | | 5,421,345 | | | | 182,699,326 | |
ELECTRICAL EQUIPMENT — 0.61% | | | | | | | | |
a Vestas Wind Systems A/S | | | 4,065,826 | | | | 176,351,686 | |
INDUSTRIAL CONGLOMERATES — 2.13% | | | | | | | | |
Siemens AG | | | 4,456,900 | | | | 610,850,928 | |
MACHINERY — 3.82% | | | | | | | | |
Fanuc Ltd. | | | 2,157,007 | | | | 326,481,343 | |
Komatsu Ltd. | | | 22,586,693 | | | | 767,100,358 | |
| | | | | | | | |
| | | | | | | 2,063,483,641 | |
| | | | | | | | |
CONSUMER DURABLES & APPAREL — 3.11% | | | | | | | | |
TEXTILES, APPAREL & LUXURY GOODS — 3.11% | | | | | | | | |
adidas AG | | | 4,248,300 | | | | 267,649,698 | |
LVMH Moët Hennessy Louis Vuitton SA | | | 3,940,056 | | | | 623,715,493 | |
| | | | | | | | |
| | | | | | | 891,365,191 | |
| | | | | | | | |
CONSUMER SERVICES — 1.56% | | | | | | | | |
HOTELS, RESTAURANTS & LEISURE — 1.56% | | | | | | | | |
b Carnival plc | | | 11,352,925 | | | | 446,566,887 | |
| | | | | | | | |
| | | | | | | 446,566,887 | |
| | | | | | | | |
DIVERSIFIED FINANCIALS — 8.19% | | | | | | | | |
CAPITAL MARKETS — 3.85% | | | | | | | | |
Credit Suisse Group AG | | | 9,840,338 | | | | 418,147,406 | |
Deutsche Bank AG | | | 7,376,911 | | | | 433,707,171 | |
Julius Baer Group Ltd. | | | 5,777,758 | | | | 250,736,455 | |
DIVERSIFIED FINANCIAL SERVICES — 4.34% | | | | | | | | |
BM&F Bovespa SA | | | 40,721,200 | | | | 295,560,114 | |
Hong Kong Exchanges & Clearing Ltd. | | | 26,157,400 | | | | 567,297,681 | |
a ING Groep N.V. | | | 30,088,400 | | | | 380,829,119 | |
| | | | | | | | |
| | | | | | | 2,346,277,946 | |
| | | | | | | | |
Certified Semi-Annual Report 11
| | |
| SCHEDULE OF INVESTMENTS, CONTINUED | | |
| |
| Thornburg International Value Fund | | March 31, 2011 (Unaudited) |
| | | | | | | | |
| | | Shares/
Principal Amount | | | Value | |
| ENERGY — 10.50% | | | | | | | | |
ENERGY EQUIPMENT & SERVICES — 2.94% | | | | | | | | |
Schlumberger Ltd. | | | 6,222,625 | | | $ | 580,322,007 | |
Seadrill Ltd. | | | 7,222,524 | | | | 261,200,633 | |
OIL, GAS & CONSUMABLE FUELS — 7.56% | | | | | | | | |
a BG Group plc | | | 24,473,892 | | | | 608,938,060 | |
Canadian Natural Resources Ltd. | | | 9,894,900 | | | | 489,284,689 | |
Cenovus Energy, Inc. | | | 4,273,613 | | | | 168,828,652 | |
CNOOC Ltd. | | | 257,235,370 | | | | 649,491,572 | |
a Coal India Ltd. | | | 32,418,974 | | | | 251,166,174 | |
| | | | | | | | |
| | | | | | | 3,009,231,787 | |
| | | | | | | | |
| FOOD & STAPLES RETAILING — 3.43% | | | | | | | | |
FOOD & STAPLES RETAILING — 3.43% | | | | | | | | |
Tesco plc | | | 93,417,218 | | | | 570,965,921 | |
Wal-Mart de Mexico SAB de C.V. | | | 137,062,200 | | | | 411,378,462 | |
| | | | | | | | |
| | | | | | | 982,344,383 | |
| | | | | | | | |
| FOOD, BEVERAGE & TOBACCO — 4.85% | | | | | | | | |
BEVERAGES — 1.06% | | | | | | | | |
Sabmiller plc | | | 8,615,750 | | | | 305,106,938 | |
FOOD PRODUCTS — 1.75% | | | | | | | | |
Nestle SA | | | 8,776,300 | | | | 503,072,613 | |
TOBACCO — 2.04% | | | | | | | | |
British American Tobacco plc | | | 14,534,525 | | | | 583,373,142 | |
| | | | | | | | |
| | | | | | | 1,391,552,693 | |
| | | | | | | | |
| HEALTH CARE EQUIPMENT & SERVICES — 3.39% | | | | | | | | |
HEALTH CARE EQUIPMENT & SUPPLIES — 1.03% | | | | | | | | |
Covidien plc | | | 5,658,498 | | | | 293,902,386 | |
HEALTH CARE PROVIDERS & SERVICES — 2.36% | | | | | | | | |
Fresenius Medical Care AG & Co. | | | 6,521,994 | | | | 438,024,163 | |
Sinopharm Group Co. H | | | 67,089,500 | | | | 238,479,495 | |
| | | | | | | | |
| | | | | | | 970,406,044 | |
| | | | | | | | |
| HOUSEHOLD & PERSONAL PRODUCTS — 2.52% | | | | | | | | |
HOUSEHOLD PRODUCTS — 1.40% | | | | | | | | |
Reckitt Benckiser plc | | | 7,796,278 | | | | 400,467,177 | |
PERSONAL PRODUCTS — 1.12% | | | | | | | | |
Natura Cosmeticos SA | | | 11,460,500 | | | | 322,900,193 | |
| | | | | | | | |
| | | | | | | 723,367,370 | |
| | | | | | | | |
| INSURANCE — 2.95% | | | | | | | | |
INSURANCE — 2.95% | | | | | | | | |
Allianz SE | | | 3,009,807 | | | | 422,412,140 | |
China Life Insurance Co. | | | 51,060,042 | | | | 192,003,166 | |
Dai-ichi Life Insurance Co. | | | 153,157 | | | | 231,079,629 | |
| | | | | | | | |
| | | | | | | 845,494,935 | |
| | | | | | | | |
12 Certified Semi-Annual Report
| | |
| SCHEDULE OF INVESTMENTS, CONTINUED | | |
| |
| Thornburg International Value Fund | | March 31, 2011 (Unaudited) |
| | | | | | | | |
| | | Shares/
Principal Amount | | | Value | |
MATERIALS — 8.46% | | | | | | | | |
CHEMICALS — 2.87% | | | | | | | | |
Air Liquide SA | | | 3,863,440 | | | $ | 513,360,838 | |
Potash Corp. of Saskatchewan, Inc. | | | 5,229,300 | | | | 308,162,649 | |
CONSTRUCTION MATERIALS — 1.30% | | | | | | | | |
Lafarge SA | | | 5,984,204 | | | | 373,282,870 | |
METALS & MINING — 4.29% | | | | | | | | |
ArcelorMittal | | | 14,269,100 | | | | 516,170,639 | |
BHP Billiton Ltd. | | | 10,477,762 | | | | 504,601,924 | |
Southern Copper Corp. | | | 5,214,700 | | | | 209,995,969 | |
| | | | | | | | |
| | | | | | | 2,425,574,889 | |
| | | | | | | | |
MEDIA — 2.47% | | | | | | | | |
MEDIA — 2.47% | | | | | | | | |
Pearson plc | | | 16,108,031 | | | | 284,503,791 | |
Publicis Groupe | | | 7,526,002 | | | | 422,100,841 | |
| | | | | | | | |
| | | | | | | 706,604,632 | |
| | | | | | | | |
PHARMACEUTICALS, BIOTECHNOLOGY & LIFE SCIENCES — 6.55% | | | | | | | | |
PHARMACEUTICALS — 6.55% | | | | | | | | |
Novartis AG | | | 10,081,996 | | | | 546,853,610 | |
Novo Nordisk A/S | | | 5,735,512 | | | | 720,591,012 | |
Teva Pharmaceutical Industries Ltd. ADR | | | 12,164,900 | | | | 610,313,033 | |
| | | | | | | | |
| | | | | | | 1,877,757,655 | |
| | | | | | | | |
RETAILING — 2.92% | | | | | | | | |
SPECIALTY RETAIL — 2.92% | | | | | | | | |
Hennes & Mauritz AB | | | 13,523,874 | | | | 449,088,862 | |
Kingfisher plc | | | 98,103,317 | | | | 386,990,677 | |
| | | | | | | | |
| | | | | | | 836,079,539 | |
| | | | | | | | |
SEMICONDUCTORS & SEMICONDUCTOR EQUIPMENT — 1.02% | | | | | | | | |
SEMICONDUCTORS & SEMICONDUCTOR EQUIPMENT — 1.02% | | | | | | | | |
ARM Holdings plc | | | 31,717,000 | | | | 292,562,211 | |
| | | | | | | | |
| | | | | | | 292,562,211 | |
| | | | | | | | |
SOFTWARE & SERVICES — 2.23% | | | | | | | | |
SOFTWARE — 2.23% | | | | | | | | |
SAP AG | | | 10,441,393 | | | | 639,253,558 | |
| | | | | | | | |
| | | | | | | 639,253,558 | |
| | | | | | | | |
TECHNOLOGY HARDWARE & EQUIPMENT — 4.09% | | | | | | | | |
COMMUNICATIONS EQUIPMENT — 2.52% | | | | | | | | |
HTC Corp. | | | 18,493,671 | | | | 723,231,994 | |
COMPUTERS & PERIPHERALS — 0.38% | | | 6,057,621 | | | | 109,083,344 | |
a Logitech International SA | | | | | | | | |
OFFICE ELECTRONICS — 1.19% | | | | | | | | |
Canon, Inc. | | | 7,811,938 | | | | 339,976,143 | |
| | | | | | | | |
| | | | | | | 1,172,291,481 | |
| | | | | | | | |
TELECOMMUNICATION SERVICES — 3.38% | | | | | | | | |
DIVERSIFIED TELECOMMUNICATION SERVICES — 1.86% | | | | | | | | |
Telefonica SA | | | 21,332,753 | | | | 534,061,795 | |
Certified Semi-Annual Report 13
| | |
| SCHEDULE OF INVESTMENTS, CONTINUED | | |
| |
| Thornburg International Value Fund | | March 31, 2011 (Unaudited) |
| | | | | | | | |
| | | Shares/
Principal Amount | | | Value | |
WIRELESS TELECOMMUNICATION SERVICES — 1.52% | | | | | | | | |
America Movil SAB de C.V. ADR | | | 5,173,344 | | | $ | 300,571,287 | |
KDDI Corp. | | | 21,846 | | | | 135,257,153 | |
| | | | | | | | |
| | | | | | | 969,890,235 | |
| | | | | | | | |
TRANSPORTATION — 1.55% | | | | | | | | |
ROAD & RAIL — 1.55% | | | | | | | | |
Canadian National Railway Co. | | | 5,889,800 | | | | 444,392,852 | |
| | | | | | | | |
| | | | | | | 444,392,852 | |
| | | | | | | | |
TOTAL COMMON STOCK (Cost $20,817,500,065) | | | | | | | 26,843,378,635 | |
| | | | | | | | |
PREFERRED STOCK — 2.47% | | | | | | | | |
AUTOMOBILES & COMPONENTS — 2.47% | | | | | | | | |
AUTOMOBILES — 2.47% | | | | | | | | |
Volkswagen AG Pfd | | | 4,369,070 | | | | 708,656,483 | |
| | | | | | | | |
TOTAL PREFERRED STOCK (Cost $402,710,146) | | | | | | | 708,656,483 | |
| | | | | | | | |
EXCHANGE TRADED FUNDS — 0.54% | | | | | | | | |
ishares MSCI Japan Index Fund | | | 15,000,000 | | | | 154,650,000 | |
| | | | | | | | |
TOTAL EXCHANGE TRADED FUNDS (Cost $149,397,000) | | | | | | | 154,650,000 | |
| | | | | | | | |
SHORT TERM INVESTMENTS — 2.36% | | | | | | | | |
Atlantic City Electric, 0.28%, 4/5/2011 | | $ | 15,730,000 | | | | 15,729,511 | |
Atlantic City Electric, 0.29%, 4/5/2011 | | | 43,000,000 | | | | 42,998,614 | |
BMW U.S. Capital LLC, 0.26%, 4/1/2011 | | | 10,700,000 | | | | 10,700,000 | |
Centerpoint Energy, 0.50%, 4/1/2011 | | | 40,000,000 | | | | 40,000,000 | |
Chicago GO, put 4/7/2011 (Insured: AGM/SPA: Dexia) (weekly demand notes), 0.35%, 1/1/2040 | | | 25,000,000 | | | | 25,000,000 | |
DCP Midstream LLC, 0.30%, 4/1/2011 | | | 25,300,000 | | | | 25,300,000 | |
DCP Midstream LLC, 0.33%, 4/7/2011 | | | 25,000,000 | | | | 24,998,625 | |
Devon Energy Corp., 0.19%, 4/1/2011 | | | 41,600,000 | | | | 41,600,000 | |
Houston, Texas Utilities Services, put 4/7/11 (Insured: AGM/SPA: Dexia) (weekly demand notes), 0.42%, 5/15/2034 | | | 44,595,000 | | | | 44,595,000 | |
Kellogg Co., 0.26%, 4/7/2011 | | | 15,000,000 | | | | 14,999,350 | |
Kinder Morgan Energy, 0.30%, 4/1/2011 | | | 40,000,000 | | | | 40,000,000 | |
Kinder Morgan Energy, 0.32%, 4/7/2011 | | | 10,000,000 | | | | 9,999,467 | |
Mississippi State, put 4/7/2011 (Nissan; Insured: Bank of America) (weekly demand notes), 0.23%, 11/1/2028 | | | 28,790,000 | | | | 28,790,000 | |
Missouri State Health & Educational Facilities Authority, put 4/1/2011 (Washington Univ.; | | | | | | | | |
SPA: Wells Fargo Bank N.A.) (daily demand notes), 0.19%, 2/15/2034 | | | 8,780,000 | | | | 8,780,000 | |
New York City Municipal Water Finance Authority, put 4/1/2011 (SPA: Dexia) (daily demand notes), 0.24%, 6/15/2033 | | | 7,000,000 | | | | 7,000,000 | |
New York City Municipal Water Finance, put 4/1/2011 (SPA: Landesbank Hessen- Thuringen) (daily demand notes), 0.25%, 6/15/2039 | | | 10,000,000 | | | | 10,000,000 | |
Northern Il. Gas Corp., 0.15%, 4/1/2011 | | | 22,000,000 | | | | 22,000,000 | |
Northwest Natural Gas Co., 0.16%, 4/1/2011 | | | 32,000,000 | | | | 32,000,000 | |
Oglethorpe Power Corp., 0.20%, 4/5/2011 | | | 52,112,000 | | | | 52,110,842 | |
Pepco Holdings, Inc., 0.55%, 4/7/2011 | | | 42,748,000 | | | | 42,744,081 | |
South Fulton Georgia Municipal Water & Sewer Authority, put 4/7/2011 (LOC: Bank of America) (weekly demand notes), 0.24%, 1/1/2033 | | | 7,365,000 | | | | 7,365,000 | |
Toyota Motor Credit Corp., 0.11%, 4/1/2011 | | | 30,000,000 | | | | 30,000,000 | |
Toyota Motor Credit Corp., 0.14%, 4/6/2011 | | | 50,000,000 | | | | 49,999,028 | |
14 Certified Semi-Annual Report
| | |
| SCHEDULE OF INVESTMENTS, CONTINUED | | |
| |
| Thornburg International Value Fund | | March 31, 2011 (Unaudited) |
| | | | | | | | |
| | | Shares/
Principal Amount | | | Value | |
Toyota Motor Credit Corp., 0.18%, 4/6/2011 | | $ | 50,000,000 | | | $ | 49,998,750 | |
| | | | | | | | |
TOTAL SHORT TERM INVESTMENTS (Cost $676,708,268) | | | | | | | 676,708,268 | |
| | | | | | | | |
TOTAL INVESTMENTS — 99.03% (Cost $22,046,315,479) | | | | | | $ | 28,383,393,386 | |
OTHER ASSETS LESS LIABILITIES — 0.97% | | | | | | | 278,555,878 | |
| | | | | | | | |
NET ASSETS — 100.00% | | | | | | $ | 28,661,949,264 | |
| | | | | | | | |
Footnote Legend
| b | Investment in Affiliates - Holdings of voting securities of each portfolio company which is considered “affiliated” to the Fund under the Investment Company Act of 1940 because the Fund’s holding represented 5% or more of the company’s voting securities during the period, are shown below: |
| | | | | | | | | | | | | | | | | | | | | | | | |
| Issuer | | Shares/Principal
September 30,
2010 | | | Gross
Additions | | | Gross
Reductions | | | Shares/Principal
March 31, 2011 | | | Market Value
March 31, 2011 | | | Investment
Income | |
Carnival plc | | | 11,352,925 | | | | — | | | | — | | | | 11,352,925 | | | $ | 446,566,887 | | | $ | 3,941,849 | |
Sinopharm | | | 67,089,500 | | | | — | | | | — | | | | 67,089,500 | | | | * | | | | — | |
| | | | | | | | | | | | | | | | | | | | | | | | |
Total non-controlled affiliated issuers – 1.56% of net assets | | | | | | | | | | | $ | 446,566,887 | | | $ | 3,941,849 | |
| | | | | | | | | | | | | | | | | | | | | | | | |
* Issuer not affiliated at March 31, 2011. | | | | | | | | | | | | | | | | | | | | | | | | |
Portfolio Abbreviations
To simplify the listings of securities, abbreviations are used per the table below:
| | |
| ADR | | American Depository Receipt |
| AGM | | Insured by Assured Guaranty Municipal Corp. |
| ARM | | Adjustable Rate Mortgage |
| GO | | General Obligation |
| LOC | | Letter of Credit |
| Pfd | | Preferred Stock |
| SPA | | Stand-by Purchase Agreement |
See notes to financial statements.
Certified Semi-Annual Report 15
| | |
| STATEMENT OF ASSETS AND LIABILITIES | | |
| |
| Thornburg International Value Fund | | March 31, 2011 (Unaudited) |
| | | | |
ASSETS | | | | |
Investments at value | | | | |
Non-affiliated issuers (cost $21,547,584,308) (Note 2) | | $ | 27,936,826,499 | |
Non-controlled affiliated issuers (cost $498,731,171) (Note 2) | | | 446,566,887 | |
Cash | | | 133,478,480 | |
Cash denominated in foreign currency (cost $31,204,961) | | | 31,391,961 | |
Receivable for investments sold | | | 32,543,707 | |
Receivable for fund shares sold | | | 99,540,726 | |
Dividends receivable | | | 87,184,651 | |
Dividend and interest reclaim receivable | | | 15,268,691 | |
Interest receivable | | | 32,287 | |
Prepaid expenses and other assets | | | 498,680 | |
| | | | |
Total Assets | | | 28,783,332,569 | |
| | | | |
| |
LIABILITIES | | | | |
Payable for securities purchased | | | 10,804,551 | |
Payable for fund shares redeemed | | | 51,211,282 | |
Unrealized depreciation on forward currency contracts (Note 7) | | | 23,649,796 | |
Payable to investment advisor and other affiliates (Note 3) | | | 22,211,069 | |
Deferred tax payable | | | 2,813,781 | |
Accounts payable and accrued expenses | | | 10,673,259 | |
Dividends payable | | | 19,567 | |
| | | | |
Total Liabilities | | | 121,383,305 | |
| | | | |
| |
NET ASSETS | | $ | 28,661,949,264 | |
| | | | |
NET ASSETS CONSIST OF: | | | | |
Undistributed net investment income | | $ | 21,400,340 | |
Net unrealized appreciation on investments | | | 6,312,039,435 | |
Accumulated net realized gain (loss) | | | (3,341,121,331 | ) |
Net capital paid in on shares of beneficial interest | | | 25,669,630,820 | |
| | | | |
| | $ | 28,661,949,264 | |
| | | | |
16 Certified Semi-Annual Report
| | |
| STATEMENT OF ASSETS AND LIABILITIES, CONTINUED | | |
| |
| Thornburg International Value Fund | | March 31, 2011 (Unaudited) |
| | | | |
NET ASSET VALUE: | | | | |
Class A Shares: | | | | |
Net asset value and redemption price per share ($7,678,208,245 applicable to 262,897,773 shares of beneficial interest outstanding - Note 4) | | $ | 29.21 | |
Maximum sales charge, 4.50% of offering price | | | 1.38 | |
| | | | |
Maximum offering price per share | | $ | 30.59 | |
| | | | |
| |
Class B Shares: | | | | |
Net asset value and offering price per share * ($77,284,394 applicable to 2,824,867 shares of beneficial interest outstanding - Note 4) | | $ | 27.36 | |
| | | | |
| |
Class C Shares: | | | | |
Net asset value and offering price per share * ($1,828,737,357 applicable to 66,536,632 shares of beneficial interest outstanding - Note 4) | | $ | 27.48 | |
| | | | |
| |
Class I Shares: | | | | |
Net asset value, offering and redemption price per share ($12,219,814,609 applicable to 409,449,563 shares of beneficial interest outstanding - Note 4) | | $ | 29.84 | |
| | | | |
| |
Class R3 Shares: | | | | |
Net asset value, offering and redemption price per share ($1,555,776,866 applicable to 53,209,330 shares of beneficial interest outstanding - Note 4) | | $ | 29.24 | |
| | | | |
| |
Class R4 Shares: | | | | |
Net asset value, offering and redemption price per share ($1,274,088,823 applicable to 43,806,410 shares of beneficial interest outstanding - Note 4) | | $ | 29.08 | |
| | | | |
| |
Class R5 Shares: | | | | |
Net asset value, offering and redemption price per share ($4,028,038,970 applicable to 135,191,060 shares of beneficial interest outstanding - Note 4) | | $ | 29.80 | |
| | | | |
| * | Redemption price per share is equal to net asset value less any applicable contingent deferred sales charge. |
See notes to financial statements.
Certified Semi-Annual Report 17
| | |
| STATEMENT OF OPERATIONS | | |
| |
| Thornburg International Value Fund | | Six Months Ended March 31, 2011 (Unaudited) |
| | | | |
INVESTMENT INCOME: | | | | |
Dividend income | | | | |
Non-affiliated issuers (net of foreign taxes withheld of $16,086,292) | | $ | 200,244,654 | |
Non-controlled affiliated issuers | | | 3,941,849 | |
Interest income | | | 1,457,861 | |
| | | | |
Total Income | | | 205,644,364 | |
| | | | |
EXPENSES: | | | | |
Investment advisory fees (Note 3) | | | 88,569,204 | |
Administration fees (Note 3) | | | | |
Class A Shares | | | 4,515,925 | |
Class B Shares | | | 47,691 | |
Class C Shares | | | 1,093,837 | |
Class I Shares | | | 2,737,244 | |
Class R3 Shares | | | 897,848 | |
Class R4 Shares | | | 672,923 | |
Class R5 Shares | | | 839,809 | |
Distribution and service fees (Note 3) | | | | |
Class A Shares | | | 8,908,056 | |
Class B Shares | | | 381,074 | |
Class C Shares | | | 8,707,589 | |
Class R3 Shares | | | 3,594,045 | |
Class R4 Shares | | | 1,348,675 | |
| Transfer agent fees | | | | |
Class A Shares | | | 4,928,550 | |
Class B Shares | | | 64,032 | |
Class C Shares | | | 1,064,470 | |
Class I Shares | | | 4,386,700 | |
Class R3 Shares | | | 1,413,805 | |
Class R4 Shares | | | 1,352,769 | |
Class R5 Shares | | | 3,129,124 | |
Registration and filing fees | | | | |
Class A Shares | | | 29,750 | |
Class B Shares | | | 28,007 | |
Class C Shares | | | 24,677 | |
Class I Shares | | | 202,408 | |
Class R3 Shares | | | 14,250 | |
Class R4 Shares | | | 29,100 | |
Class R5 Shares | | | 67,804 | |
Custodian fees (Note 3) | | | 4,752,932 | |
Professional fees | | | 182,490 | |
Accounting fees | | | 311,665 | |
Trustee fees | | | 284,550 | |
Other expenses | | | 1,234,350 | |
| | | | |
Total Expenses | | | 145,815,353 | |
Less: | | | | |
Expenses reimbursed by investment advisor (Note 3) | | | (1,462,812 | ) |
Fees paid indirectly (Note 3) | | | (7,032 | ) |
| | | | |
Net Expenses | | | 144,345,509 | |
| | | | |
Net Investment Income | | $ | 61,298,855 | |
| | | | |
18 Certified Semi-Annual Report
| | |
| STATEMENT OF OPERATIONS, CONTINUED | | |
| |
| Thornburg International Value Fund | | Six Months Ended March 31, 2011 (Unaudited) |
| | | | |
REALIZED AND UNREALIZED GAIN (LOSS) | | | | |
Net realized gain (loss) from: | | | | |
Investments | | $ | 259,492,721 | |
Forward currency contracts (Note 7) | | | (137,436,678 | ) |
Foreign currency transactions | | | 4,251,485 | |
| | | | |
| | | 126,307,528 | |
| | | | |
Net change in unrealized appreciation (depreciation) on: | | | | |
Investments | | | | |
Non-affiliated issuers (net of change in deferred taxes payable of $2,813,781) | | | 2,690,213,286 | |
Non-controlled affiliated issuers | | | 352,623 | |
Forward currency contracts (Note 7) | | | 99,102,602 | |
Foreign currency translations | | | (671,846 | ) |
| | | | |
| | | 2,788,996,665 | |
| | | | |
Net Realized and Unrealized Gain | | | 2,915,304,193 | |
| | | | |
Net Increase in Net Assets Resulting from Operations | | $ | 2,976,603,048 | |
| | | | |
See notes to financial statements.
Certified Semi-Annual Report 19
STATEMENTS OF CHANGES IN NET ASSETS
Thornburg International Value Fund
| | | | | | | | |
| | | Six Months Ended
March 31, 2011* | | | Year Ended
September 30, 2010 | |
INCREASE (DECREASE) IN NET ASSETS FROM | | | | | | | | |
| | |
OPERATIONS: | | | | | | | | |
Net investment income | | $ | 61,298,855 | | | $ | 167,111,665 | |
Net realized gain (loss) on investments, forward currency contracts and foreign currency transactions | | | 126,307,528 | | | | (658,847,770 | ) |
Increase (Decrease) in unrealized appreciation (depreciation) of investments, forward currency contracts, foreign currency translations and deferred taxes | | | 2,788,996,665 | | | | 2,357,581,186 | |
| | | | | | | | |
| | |
Net Increase (Decrease) in Net Assets Resulting from Operations | | | 2,976,603,048 | | | | 1,865,845,081 | |
| | |
DIVIDENDS TO SHAREHOLDERS: | | | | | | | | |
From net investment income | | | | | | | | |
Class A Shares | | | (7,081,688 | ) | | | (38,456,122 | ) |
Class B Shares | | | — | | | | (198,599 | ) |
Class C Shares | | | — | | | | (4,699,975 | ) |
Class I Shares | | | (31,645,949 | ) | | | (87,399,958 | ) |
Class R3 Shares | | | (412,639 | ) | | | (6,932,653 | ) |
Class R4 Shares | | | (1,275,841 | ) | | | (5,643,833 | ) |
Class R5 Shares | | | (8,362,339 | ) | | | (20,695,344 | ) |
FUND SHARE TRANSACTIONS (NOTE 4): | | | | | | | | |
Class A Shares | | | 144,040,716 | | | | 889,589,596 | |
Class B Shares | | | (5,415,549 | ) | | | (12,642,863 | ) |
Class C Shares | | | (11,621,987 | ) | | | (31,967,736 | ) |
Class I Shares | | | 1,281,796,482 | | | | 2,642,039,493 | |
Class R3 Shares | | | 80,829,974 | | | | 168,532,316 | |
Class R4 Shares | | | 282,113,298 | | | | 285,485,092 | |
Class R5 Shares | | | 1,201,366,445 | | | | 867,059,993 | |
| | | | | | | | |
| | |
Net Increase in Net Assets | | | 5,900,933,971 | | | | 6,509,914,488 | |
| | |
NET ASSETS: | | | | | | | | |
Beginning of Period | | | 22,761,015,293 | | | | 16,251,100,805 | |
| | | | | | | | |
| | |
End of Period | | $ | 28,661,949,264 | | | $ | 22,761,015,293 | |
| | | | | | | | |
| | |
Undistributed net investment income | | $ | 21,400,340 | | | $ | 8,879,941 | |
See notes to financial statements.
20 Certified Semi-Annual Report
| | |
| NOTES TO FINANCIAL STATEMENTS | | |
| |
| Thornburg International Value Fund | | March 31, 2011 (Unaudited) |
NOTE 1 – ORGANIZATION
Thornburg International Value Fund, hereinafter referred to as the “Fund,” is a diversified series of Thornburg Investment Trust (the “Trust”). The Trust was organized as a Massachusetts business trust under a Declaration of Trust dated June 3, 1987 and is registered as a diversified, open-end management investment company under the Investment Company Act of 1940, as amended. The Fund is currently one of sixteen separate series of the Trust. Each series is considered to be a separate entity for financial reporting and tax purposes and bears expenses directly attributable to it. The Fund seeks long-term capital appreciation by investing in equity and debt securities of all types. As a secondary non-fundamental goal, the Fund also seeks some current income.
The Fund currently has seven classes of shares of beneficial interest outstanding: Class A, Class B, Class C, Institutional Class (Class I), and Retirement Classes (Class R3, Class R4, and Class R5). The Fund no longer offers Class B shares for sale. Each class of shares of the Fund represents an interest in the same portfolio of investments, except that (i) Class A shares are sold subject to a front-end sales charge collected at the time the shares are purchased and bear a service fee, (ii) Class B shares are sold at net asset value without a sales charge at the time of purchase, but are subject to a contingent deferred sales charge upon redemption and bear both a service fee and distribution fee, (iii) Class C shares are sold at net asset value without a sales charge at the time of purchase, but are subject to a contingent deferred sales charge upon redemption within one year of purchase, and bear both a service fee and a distribution fee, (iv) Class I shares are sold at net asset value without a sales charge at the time of purchase, (v) Class R3 shares are sold at net asset value without a sales charge at the time of purchase, but bear both a service fee and distribution fee, (vi) Class R4 shares are sold at net asset value without a sales charge at the time of purchase, but bear a service fee, (vii) Class R5 shares are sold at net asset value without a sales charge at the time of purchase, and (viii) the respective classes may have different reinvestment privileges and conversion rights. Additionally, the Fund may allocate among its classes certain expenses, to the extent allowable to specific classes, including transfer agent fees, government registration fees, certain printing and postage costs, and administrative and legal expenses. Currently, class specific expenses of the Fund are limited to service and distribution fees, administration fees, and certain registration and transfer agent expenses. Class B shares of the Fund outstanding for eight years will convert to Class A shares of the Fund.
NOTE 2 – SIGNIFICANT ACCOUNTING POLICIES
Significant accounting policies of the Trust are as follows:
Valuation of Investments: Portfolio securities listed or traded on a national securities exchange are valued on the valuation date at the last reported sale price on the exchange that is the primary market for the security. Portfolio securities traded on an exchange for which there has been no sale that day and other equity securities traded in the over-the-counter market are valued at the mean between the last reported bid and asked prices. Portfolio securities reported by NASDAQ are valued at the NASDAQ official closing price. Any foreign security traded on exchanges outside the United States is valued at the price of the security on the exchange that is normally the security’s primary market, as of the close of that exchange preceding the time of the Fund’s valuation.
Debt obligations held by the Fund have a primary market over the counter and are valued by an independent pricing service approved by the Trustees of the Trust. The pricing service ordinarily values debt obligations at quoted bid prices. When quotations are not available, debt obligations held by the Fund are valued at evaluated prices determined by the pricing service using methods which include consideration of yields or prices of debt obligations of comparable quality, type of issue, coupon, maturity and rating, and indications as to value from dealers and general market conditions. Short-term obligations having remaining maturities of 60 days or less are ordinarily valued at amortized cost, which approximates market value.
Quotations in foreign currencies for foreign portfolio investments are converted to U.S. dollar equivalents using the foreign exchange quotation in effect at the time of valuation.
In any case where the market value of an equity security held by the Fund is not readily available, the Trust’s valuation and pricing committee determines a fair value for the security using procedures approved by the Trustees, which may include the use of a price obtained from an independent pricing service. The pricing service ordinarily values equity securities in these instances using multi-factor models to adjust market prices based upon various inputs, including exchange data, depository receipt prices, futures and index data and other data. A security’s market value is deemed not readily available whenever the exchange or market on which the security is primarily traded is closed for the entire scheduled day of trading. Additionally, a security’s market value may be deemed not readily available under other circumstances identified by the Trustees, including when developments occurring after the most recent close of
Certified Semi-Annual Report 21
| | |
| NOTES TO FINANCIAL STATEMENTS, CONTINUED | | |
| |
| Thornburg International Value Fund | | March 31, 2011 (Unaudited) |
the security’s primary exchange or market, but before the most recent close of trading in Fund shares, create a serious question about the reliability of the security’s market value.
In any case where a pricing service fails to provide a price for a debt obligation held by the Fund, the valuation and pricing committee determines a fair value for the debt obligation using procedures approved by the Trustees. Additionally, in any case where management believes that a price provided by a pricing service for a debt obligation held by the Fund may be unreliable, the valuation and pricing committee decides whether or not to use the pricing service’s valuation or to determine a fair value for the debt obligation.
In determining fair value for any portfolio security or other investment, the valuation and pricing committee seeks to determine the amount that an owner of the investment might reasonably expect to receive upon a sale of the investment. However, because fair value prices are estimated prices, the valuation and pricing committee’s determination of fair value for an investment may differ from the value that would be realized by the Fund upon a sale of the investment, and that difference could be material to the Fund’s financial statements. The valuation and pricing committee’s determination of fair value for an investment may also differ from the prices obtained by other persons (including other mutual funds) for the investment.
Valuation Measurements: Various inputs are used in determining the value of the Fund’s investments. These inputs are summarized in the three levels listed below.
Level 1: Quoted prices in active markets for identical investments.
Level 2: Other significant observable inputs (including quoted prices for similar investments, interest rates, prepayment rates, credit risk, etc.).
Level 3: Significant unobservable inputs (including the Fund’s own assumptions in determining the fair value of investments).
The following table displays a summary of the inputs used to value the Fund’s net assets as of March 31, 2011. In any instance when valuation inputs from more than one level are used to determine the fair value of a specific investment, the investment is placed in the level of the table based upon the lowest level input that is significant in determining the fair value of the investment:
| | | | | | | | | | | | | | | | |
| | | Fair Value Measurements at March 31, 2011 | |
| | | Total | | | Level 1 | | | Level 2 | | | Level 3 | |
Assets | | | | | | | | | | | | | | | | |
Investments in Securities* | | | | | | | | | | | | | | | | |
Common Stock | | $ | 26,843,378,635 | | | $ | 26,843,378,635 | | | $ | — | | | $ | — | |
Preferred Stock | | | 708,656,483 | | | | 708,656,483 | | | | — | | | | — | |
Exchange Traded Funds | | | 154,650,000 | | | | 154,650,000 | | | | — | | | | — | |
Short Term Investments | | | 676,708,268 | | | | — | | | | 676,708,268 | | | | — | |
| | | | | | | | | | | | | | | | |
Total Investments in Securities | | $ | 28,383,393,386 | | | $ | 27,706,685,118 | | | $ | 676,708,268 | | | $ | — | |
Other Financial Instruments** | | | | | | | | | | | | | | | | |
Spot Currency | | $ | 32,183 | | | $ | 32,183 | | | $ | — | | | $ | — | |
Liabilities | | | | | | | | | | | | | | | | |
Other Financial Instruments** | | | | | | | | | | | | | | | | |
Forward Currency Contracts | | $ | (23,649,796 | ) | | $ | — | | | $ | (23,649,796 | ) | | $ | — | |
| * | See Schedule of Investments for a summary of the industry exposure as grouped according to the Global Industry Classification Standard (GICS), which is an industry taxonomy developed by MSCI Barra and Standard & Poor’s (S&P). |
| ** | Other Financial Instruments include investments not reflected in the Schedule of Investments, such as futures, forwards and swap contracts, which are valued at the unrealized appreciation (depreciation) on the investment. |
22 Certified Semi-Annual Report
| | |
| NOTES TO FINANCIAL STATEMENTS, CONTINUED | | |
| |
| Thornburg International Value Fund | | March 31, 2011 (Unaudited) |
Other Notes: It is the policy of the Fund to recognize significant transfers between Levels 1 and 2 and to disclose those transfers at the last date of the reporting period. The Fund recognized no significant transfers into and out of Levels 1 and 2 during the six months ended March 31, 2011.
Foreign Currency Translation: Portfolio securities and other assets and liabilities denominated in foreign currencies are translated into U.S. dollars based on the exchange rate of such currencies against the U.S. dollar on the date of valuation. Purchases and sales of securities and income items denominated in foreign currencies are translated into U.S. dollars at the exchange rate in effect on the translation date. When the Fund purchases or sells foreign securities, it will customarily enter into a foreign exchange contract to minimize foreign exchange risk from the trade date to the settlement date of such transactions.
The Fund does not separately report the effect of changes in foreign exchange rates from changes in market prices on securities held. Such changes are included in net realized and unrealized gain or loss from investments.
Reported net realized foreign exchange gains or losses arise from sales of foreign currencies, currency gains or losses realized between the trade and settlement dates on securities transactions and the difference between the amounts of dividends, interest, and foreign withholding taxes recorded on the Fund’s books, and the U.S. dollar equivalent of the amounts actually received or paid.
Net unrealized foreign exchange gains and losses arise from changes in the fair value of assets and liabilities, other than investments in securities at fiscal period end, resulting from changes in exchange rates.
Deferred Taxes: The Fund is subject to a tax imposed on net realized gains of securities of certain foreign countries. The Fund records an estimated deferred tax liability for net unrealized gains on these securities as reflected in the accompanying financial statements.
Federal Income Taxes: It is the policy of the Trust to comply with the provisions of the Internal Revenue Code applicable to “regulated investment companies” and to distribute to shareholders substantially all taxable income, including any net realized gain on investments of the Fund. Therefore, no provision for federal income taxes is required.
Management reviews each tax position believed to be material to the preparation of the Fund’s financial statements, to assess if it is more likely than not that the position would be sustained upon examination, based upon the technical merits of the position. As of March 31, 2011, management has not identified any such position for which a liability must be reflected in the Statement of Assets and Liabilities. The Fund’s tax returns remain subject to examination for three years after filing.
When-Issued and Delayed Delivery Transactions: The Fund may engage in when-issued or delayed delivery transactions. To the extent the Fund engages in such transactions, it will do so for the purpose of acquiring portfolio securities consistent with the Fund’s investment objectives and not for the purpose of investment leverage or to speculate on interest rate and/or market changes. At the time the Fund makes a commitment to purchase a security on a when-issued or delayed delivery basis, the Fund will record the transaction and reflect the value in determining its net asset value. When effecting such transactions, assets of an amount sufficient to make payment for the portfolio securities to be purchased will be segregated on the Fund’s records on the trade date. Securities purchased on a when-issued or delayed delivery basis do not earn interest until the settlement date.
Dividends: Dividends to shareholders, if any, are generally paid quarterly and are reinvested in additional shares of the Fund at net asset value per share at the close of business on the dividend payment date or, at the shareholder’s option, paid in cash. Net realized capital gains, to the extent available, will be distributed at least annually. Distributions to shareholders are based on income tax regulations and therefore, their characteristics may differ for financial statement and tax purposes.
General: Securities transactions are accounted for on a trade date basis. Interest income is accrued as earned and dividend income is recorded on the ex-dividend date. Certain income from foreign securities is recognized as soon as information is available to the Fund. Realized gains and losses from the sale of securities are recorded on an identified cost basis. Net investment income (other than class specific expenses) and realized and unrealized gains and losses are allocated daily to each class of shares based upon the relative net asset value of outstanding shares of each class of shares at the beginning of the day (after adjusting for the current share activity of the respective class). Expenses common to all Funds are allocated among the Funds comprising the Trust based upon their relative net asset values or other appropriate allocation methods.
Certified Semi-Annual Report 23
| | |
| NOTES TO FINANCIAL STATEMENTS, CONTINUED | | |
| |
| Thornburg International Value Fund | | March 31, 2011 (Unaudited) |
Guarantees and Indemnifications: Under the Trust’s organizational documents, its officers and Trustees are indemnified against certain liabilities arising out of the performance of their duties to the Fund. Additionally, in the normal course of business the Trust enters into contracts with service providers that contain general indemnification clauses. The Trust’s maximum exposure under these arrangements is unknown. However, based on experience, the Trust expects the risk of loss to be remote.
Use of Estimates: The preparation of financial statements, in conformity with generally accepted accounting principles, requires management to make estimates and assumptions that affect the reported amounts of assets and liabilities and the disclosure of contingent assets and liabilities at the date of the financial statements and the reported amounts of increases and decreases in net assets from operations during the reporting period. Actual results could differ from those estimates.
NOTE 3 – INVESTMENT ADVISORY FEE AND OTHER TRANSACTIONS WITH AFFILIATES
Pursuant to an investment advisory agreement, Thornburg Investment Management, Inc. (the “Advisor”) serves as the investment advisor and performs services to the Fund for which the fees are payable at the end of each month. For the six months ended March 31, 2011, these fees were payable at annual rates ranging from .875 of 1% to .675 of 1% per annum of the average daily net assets of the Fund depending on the Fund’s asset size. The Trust also has entered into administrative services agreements with the Advisor, whereby the Advisor will perform certain administrative services for the shareholders of each class of the Fund’s shares, and for which fees will be payable at an annual rate of up to .125 of 1% per annum of the average daily net assets attributable to each class of shares. For the six months ended March 31, 2011, the Advisor contractually reimbursed certain class specific expenses, administrative fees, and distribution fees of $15,341 for Class B shares, $804,316 for Class R3 shares, and $643,155 for Class R4 shares.
The Trust has an underwriting agreement with Thornburg Securities Corporation (the “Distributor,” an affiliate of the Advisor), which acts as the distributor of the Fund’s shares. For the six months ended March 31, 2011, the Distributor has advised the Fund that it earned net commissions aggregating $215,423 from the sale of Class A shares, and collected contingent deferred sales charges aggregating $60,155 from redemptions of Class C shares of the Fund.
Pursuant to a service plan under Rule 12b-1 of the Investment Company Act of 1940, the Fund may reimburse to the Advisor an amount not to exceed .25 of 1% per annum of the average daily net assets attributable to each class of shares of the Fund for payments made by the Advisor to securities dealers and other financial institutions to obtain various shareholder and distribution related services. The Advisor may pay out of its own resources additional expenses for distribution of the Fund’s shares.
The Trust has also adopted distribution plans pursuant to Rule 12b-1, applicable only to the Fund’s Class B, Class C, and Class R3 shares, under which the Fund compensates the Distributor for services in promoting the sale of Class B, Class C, and Class R3 shares of the Fund at an annual rate of up to .75 of 1% per annum of the average daily net assets attributable to Class B and Class C shares, and an annual rate of up to .25 of 1% per annum of the average daily net assets attributable to Class R3 shares. Total fees incurred by the Distributor for each class of shares of the Fund under their respective Service and Distribution Plans for the six months ended March 31, 2011, are set forth in the Statement of Operations.
The Trust has an agreement with the custodian bank to indirectly pay a portion of the custodian’s fees through credits earned by the Fund’s cash on deposit with the bank. This deposit agreement is an alternative to overnight investments. Custodial fees have been adjusted to reflect amounts that would have been paid without this agreement, with a corresponding adjustment reflected as fees paid indirectly in the Statement of Operations. For the six months ended March 31, 2011, fees paid indirectly were $7,032.
Certain officers and Trustees of the Trust are also officers and/or directors of the Advisor and Distributor. The compensation of independent Trustees is borne by the Trust.
24 Certified Semi-Annual Report
| | |
| NOTES TO FINANCIAL STATEMENTS, CONTINUED | | |
| |
| Thornburg International Value Fund | | March 31, 2011 (Unaudited) |
NOTE 4 – SHARES OF BENEFICIAL INTEREST
At March 31, 2011, there were an unlimited number of shares of beneficial interest authorized. Transactions in shares of beneficial interest were as follows:
| | | | | | | | | | | | | | | | |
| | | Six Months Ended
March 31, 2011 (Unaudited) | | | Year Ended
September 30, 2010 (Audited) | |
| | | Shares | | | Amount | | | Shares | | | Amount | |
Class A Shares | | | | | | | | | | | | | | | | |
Shares sold | | | 39,142,871 | | | $ | 1,097,278,209 | | | | 98,256,291 | | | $ | 2,406,532,000 | |
Shares issued to shareholders in reinvestment of dividends | | | 212,939 | | | | 6,124,844 | | | | 1,284,114 | | | | 31,575,504 | |
Shares repurchased | | | (34,294,051 | ) | | | (959,387,647 | ) | | | (63,800,486 | ) | | | (1,548,569,721 | ) |
Redemption fees received* | | | — | | | | 25,310 | | | | — | | | | 51,813 | |
| | | | | | | | | | | | | | | | |
| | | | |
Net Increase (Decrease) | | | 5,061,759 | | | $ | 144,040,716 | | | | 35,739,919 | | | $ | 889,589,596 | |
| | | | | | | | | | | | | | | | |
| | | | |
Class B Shares | | | | | | | | | | | | | | | | |
Shares sold | | | 19,564 | | | $ | 512,830 | | | | 49,186 | | | $ | 1,143,298 | |
Shares issued to shareholders in reinvestment of dividends | | | — | | | | — | | | | 5,827 | | | | 132,783 | |
Shares repurchased | | | (226,610 | ) | | | (5,928,647 | ) | | | (609,378 | ) | | | (13,919,631 | ) |
Redemption fees received* | | | — | | | | 268 | | | | — | | | | 687 | |
| | | | | | | | | | | | | | | | |
| | | | |
Net Increase (Decrease) | | | (207,046 | ) | | $ | (5,415,549 | ) | | | (554,365 | ) | | $ | (12,642,863 | ) |
| | | | | | | | | | | | | | | | |
| | | | |
Class C Shares | | | | | | | | | | | | | | | | |
Shares sold | | | 6,151,773 | | | $ | 162,394,949 | | | | 12,441,045 | | | $ | 288,168,162 | |
Shares issued to shareholders in reinvestment of dividends | | | 1 | | | | 10 | | | | 134,652 | | | | 3,080,176 | |
Shares repurchased | | | (6,605,340 | ) | | | (174,023,073 | ) | | | (14,084,287 | ) | | | (323,230,328 | ) |
Redemption fees received* | | | — | | | | 6,127 | | | | — | | | | 14,254 | |
| | | | | | | | | | | | | | | | |
| | | | |
Net Increase (Decrease) | | | (453,566 | ) | | $ | (11,621,987 | ) | | | (1,508,590 | ) | | $ | (31,967,736 | ) |
| | | | | | | | | | | | | | | | |
| | | | |
Class I Shares | | | | | | | | | | | | | | | | |
Shares sold | | | 92,461,083 | | | $ | 2,651,319,218 | | | | 170,443,043 | | | $ | 4,255,830,103 | |
Shares issued to shareholders reinvestment of dividends | | | 658,774 | | | | 19,161,080 | | | | 2,095,554 | | | | 52,935,805 | |
Shares repurchased | | | (48,505,091 | ) | | | (1,388,722,058 | ) | | | (66,945,828 | ) | | | (1,666,796,964 | ) |
Redemption fees received* | | | — | | | | 38,242 | | | | — | | | | 70,549 | |
| | | | | | | | | | | | | | | | |
| | | | |
Net Increase (Decrease) | | | 44,614,766 | | | $ | 1,281,796,482 | | | | 105,592,769 | | | $ | 2,642,039,493 | |
| | | | | | | | | | | | | | | | |
| | | | |
Class R3 Shares | | | | | | | | | | | | | | | | |
Shares sold | | | 11,161,276 | | | $ | 314,161,246 | | | | 20,220,086 | | | $ | 495,436,244 | |
Shares issued to shareholders in reinvestment of dividends | | | 12,924 | | | | 373,254 | | | | 252,563 | | | | 6,217,484 | |
Shares repurchased | | | (8,309,988 | ) | | | (233,709,547 | ) | | | (13,635,248 | ) | | | (333,131,790 | ) |
Redemption fees received* | | | — | | | | 5,021 | | | | — | | | | 10,378 | |
| | | | | | | | | | | | | | | | |
| | | | |
Net Increase (Decrease) | | | 2,864,212 | | | $ | 80,829,974 | | | | 6,837,401 | | | $ | 168,532,316 | |
| | | | | | | | | | | | | | | | |
Certified Semi-Annual Report 25
| | |
| NOTES TO FINANCIAL STATEMENTS, CONTINUED | | |
| |
| Thornburg International Value Fund | | March 31, 2011 (Unaudited) |
| | | | | | | | | | | | | | | | |
| | | Six Months Ended
March 31, 2011 (Unaudited) | | | Year Ended
September 30, 2010 (Audited) | |
| | | Shares | | | Amount | | | Shares | | | Amount | |
Class R4 Shares | | | | | | | | | | | | | | | | |
Shares sold | | | 14,848,540 | | | $ | 413,398,828 | | | | 20,306,284 | | | $ | 494,190,744 | |
Shares issued to shareholders in reinvestment of dividends | | | 34,910 | | | | 994,606 | | | | 166,103 | | | | 4,086,982 | |
Shares repurchased | | | (4,751,543 | ) | | | (132,283,873 | ) | | | (8,731,380 | ) | | | (212,798,772 | ) |
Redemption fees received* | | | — | | | | 3,737 | | | | — | | | | 6,138 | |
| | | | | | | | | | | | | | | | |
Net Increase (Decrease) | | | 10,131,907 | | | $ | 282,113,298 | | | | 11,741,007 | | | $ | 285,485,092 | |
| | | | | | | | | | | | | | | | |
| | | | |
Class R5 Shares | | | | | | | | | | | | | | | | |
Shares sold | | | 52,299,060 | | | $ | 1,484,150,525 | | | | 47,990,020 | | | $ | 1,194,175,209 | |
Shares issued to shareholders in reinvestment of dividends | | | 273,515 | | | | 7,956,205 | | | | 768,879 | | | | 19,399,053 | |
Shares repurchased | | | (10,190,986 | ) | | | (290,751,932 | ) | | | (13,949,845 | ) | | | (346,531,210 | ) |
Redemption fees received* | | | — | | | | 11,647 | | | | — | | | | 16,941 | |
| | | | | | | | | | | | | | | | |
Net Increase (Decrease) | | | 42,381,589 | | | $ | 1,201,366,445 | | | | 34,809,054 | | | $ | 867,059,993 | |
| | | | | | | | | | | | | | | | |
| * | The Fund charges a redemption fee of 1% of the Class A and Class I shares redeemed or exchanged within 30 days of purchase. Redemption fees charged to any class are allocated to all classes upon receipt of payment based on relative net asset values of each class or other appropriate allocation methods. |
NOTE 5 – SECURITIES TRANSACTIONS
For the six months ended March 31, 2011, the Fund had purchase and sale transactions of investment securities (excluding short-term investments) of $5,444,931,507 and $2,694,716,848, respectively.
NOTE 6 – INCOME TAXES
At March 31, 2011, information on the tax components of capital is as follows:
| | | | |
Cost of investments for tax purposes | | $ | 22,046,315,479 | |
| | | | |
Gross unrealized appreciation on a tax basis | | $ | 7,125,214,562 | |
Gross unrealized depreciation on a tax basis | | | (788,136,655 | ) |
| | | | |
Net unrealized appreciation (depreciation) on investments (tax basis) | | $ | 6,337,077,907 | |
| | | | |
At March 31, 2011, the Fund had deferred tax basis currency and capital losses occurring subsequent to October 31, 2009 of $3,311,212 and $727,165,223, respectively. For tax purposes, such losses will be reflected in the year ending September 30, 2011.
At March 31, 2011, the Fund had tax basis capital losses, which may be carried forward to offset future capital gains. To the extent such carryforwards are used, capital gain distributions may be reduced to the extent provided by regulations.
Such capital loss carryforwards expire as follows:
| | | | |
2017 | | $ | 1,052,728,465 | |
2018 | | | 1,792,171,182 | |
| | | | |
| | $ | 2,844,899,647 | |
| | | | |
26 Certified Semi-Annual Report
| | |
| NOTES TO FINANCIAL STATEMENTS, CONTINUED | | |
| |
| Thornburg International Value Fund | | March 31, 2011 (Unaudited) |
NOTE 7 – DERIVATIVE FINANCIAL INSTRUMENTS WITH OFF-BALANCE SHEET RISK AND FOREIGN INVESTMENT RISK
The Fund may use a variety of derivative financial instruments to hedge or adjust the risks affecting its investment portfolio or to enhance investment returns. Provisions of FASB Accounting Standards Codification ASC 815-10-50 (“ASC 815”), require certain disclosures. The disclosures are intended to provide users of financial statements with an understanding of the use of derivative instruments by the Fund and how these derivatives affect the financial position, financial performance and cash flows of the Fund. The Fund does not designate any derivative instruments as hedging instruments under ASC 815. During the six months ended March 31, 2011, the Fund’s principal exposure to derivative financial instruments of the type addressed by ASC 815 was investment in foreign exchange contracts. A foreign exchange contract is an agreement between two parties to exchange different currencies at a specified rate of exchange at an agreed upon future date. Foreign exchange contracts involve risks to the Fund, including the risk that a contract counterparty will not meet its obligations to the Fund, the risk that a change in a contract’s value may not correlate perfectly with the currency the contract was intended to track, and the risk that the Fund’s advisor is unable to correctly implement its strategy in using a contract. In any such instance, the Fund may not achieve the intended benefit of entering into a contract, and may experience a loss.
The Fund entered into forward currency contracts during the six months ended March 31, 2011 in the normal course of pursuing its investment objectives, in anticipation of purchasing foreign investments or with the intent of reducing the risk to the value of the Fund’s foreign investments from adverse changes in the relationship between the U.S. dollar and foreign currencies. In each case these contracts have been initiated in conjunction with foreign investment transactions.
These contracts are accounted for by the Fund under ASC 815. Unrealized gains and unrealized losses on outstanding contracts are reported in the Fund’s Statement of Assets and Liabilities at the Fund’s net equity, as measured by the difference between the forward exchange rates at the reporting date and the forward exchange rates at each contract’s inception date. Net realized gain (loss) on contracts closed during the period, and changes in net unrealized appreciation (depreciation) on outstanding contracts are recognized in the Fund’s Statement of Operations.
The following table displays the outstanding forward currency contracts at March 31, 2011:
Outstanding Forward Currency Contracts
to Buy or Sell at March 31, 2011
| | | | | | | | | | | | | | | | | | | | | | | | |
Contract Description | | Buy/Sell | | | Contract
Amount | | | Contract
Value Date | | | Value
USD | | | Unrealized
Appreciation | | | Unrealized
Depreciation | |
Mexican Peso | | | Sell | | | | 6,300,000,000 | | | | 05/24/2011 | | | | 527,229,609 | | | $ | — | | | $ | (23,649,796 | ) |
| | | | | | | | | | | | | | | | | | | | | | | | |
Total | | | | | | | | | | | | | | | | | | $ | — | | | $ | (23,649,796 | ) |
| | | | | | | | | | | | | | | | | | | | | | | | |
The unrealized appreciation (depreciation) of the outstanding forward currency contracts recognized in the Fund’s Statement of Assets and Liabilities at March 31, 2011 is disclosed in the following table:
Fair Values of Derivative Financial Instruments
at March 31, 2011
| | | | | | |
Liability Derivatives | | | |
| | | Balance Sheet Location | | Fair Value | |
Foreign exchange contracts | | Liabilities - Unrealized depreciation on forward currency contracts | | $ | (23,649,796 | ) |
Certified Semi-Annual Report 27
| | |
| NOTES TO FINANCIAL STATEMENTS, CONTINUED | | |
| |
| Thornburg International Value Fund | | March 31, 2011 (Unaudited) |
The realized gains (losses) from forward currency contracts, and the change in unrealized appreciation (depreciation) of outstanding forward currency contracts recognized in the Fund’s Statement of Operations for the six months ended March 31, 2011 are disclosed in the following tables:
Amount of Realized Gain (Loss) on Derivative
Financial Instruments Recognized in Income for the
Six Months Ended March 31, 2011
| | | | | | | | |
| | | Total | | | Forward Currency Contracts | |
Foreign exchange contracts | | $ | (137,436,678 | ) | | $ | (137,436,678 | ) |
Change in Unrealized Appreciation (Depreciation)
of Derivative Financial Instruments Recognized in
Income for the Six Months Ended March 31, 2011
| | | | | | | | |
| | | Total | | | Forward Currency Contracts | |
Foreign exchange contracts | | $ | 99,102,602 | | | $ | 99,102,602 | |
OTHER NOTES
Fund management believes no events have occurred between March 31, 2011 and May 20, 2011, the date of issuance of the financial statements, which require adjustment of, or disclosure in, the accompanying financial statements.
28 Certified Semi-Annual Report
This page intentionally left blank.
Certified Semi-Annual Report 29
| | |
| FINANCIAL HIGHLIGHTS | | |
| |
| Thornburg International Value Fund | | |
| | | | | | | | | | | | | | | | | | | | | | | | | | | | | | | | | | | | | | | | | | | | | | | | | | | | | | | | | | | | |
| | | PER SHARE PERFORMANCE (for a share outstanding throughout the period)+ | | | RATIOS TO AVERAGE NET ASSETS | | | SUPPLEMENTAL DATA | |
Unless
Otherwise
Noted, Periods
are Fiscal Years Ended Sept. 30, | | Net Asset
Value
Beginning
of Period | | | Net
Investment
Income
(Loss) | | | Net
Realized &
Unrealized
Gain
(Loss) on
Investments | | | Total from
Investment
Operations | | | Dividends
from Net
Investment
Income | | | Dividends
from Net
Realized
Gains | | | Total
Dividends | | | Net
Asset
Value
End of
Period | | | Net
Investment
Income
(Loss)
(%) | | | Expenses,
After
Expense
Reductions
(%) | | | Expenses,
After
Expense
Reductions
and Net of
Custody
Credits
(%) | | | Expenses,
Before
Expense
Reductions
(%) | | | Total
Return
(%)(a) | | | Portfolio
Turnover
Rate
(%) | | | Net Assets
at End of
Period
(Thousands) | |
Class A Shares | | | | | | | | | | | | | | | | | | | | | | | | | | | | | | | | | | | | | | | | | | | | | | | | | | | | | | | | | | | | |
2011(b)(c) | | $ | 26.00 | | | | 0.05 | | | | 3.19 | | | | 3.24 | | | | (0.03 | ) | | | — | | | | (0.03 | ) | | $ | 29.21 | | | | 0.32 | (d) | | | 1.25 | (d) | | | 1.25 | (d) | | | 1.25 | (d) | | | 12.45 | | | | 10.94 | | | $ | 7,678,208 | |
2010 (c) | | $ | 23.91 | | | | 0.18 | | | | 2.07 | | | | 2.25 | | | | (0.16 | ) | | | — | | | | (0.16 | ) | | $ | 26.00 | | | | 0.72 | | | | 1.33 | | | | 1.33 | | | | 1.33 | | | | 9.43 | | | | 22.26 | | | $ | 6,704,550 | |
2009(c) | | $ | 23.68 | | | | 0.21 | | | | 0.24 | | | | 0.45 | | | | (0.22 | ) | | | — | | | | (0.22 | ) | | $ | 23.91 | | | | 1.09 | | | | 1.34 | | | | 1.34 | | | | 1.34 | | | | 2.05 | | | | 32.76 | | | $ | 5,309,704 | |
2008(c) | | $ | 36.09 | | | | 0.37 | | | | (9.59 | ) | | | (9.22 | ) | | | (0.31 | ) | | | (2.88 | ) | | | (3.19 | ) | | $ | 23.68 | | | | 1.23 | | | | 1.28 | | | | 1.28 | | | | 1.28 | | | | (27.77 | ) | | | 27.31 | | | $ | 5,510,070 | |
2007(c) | | $ | 26.51 | | | | 0.27 | | | | 10.25 | | | | 10.52 | | | | (0.29 | ) | | | (0.65 | ) | | | (0.94 | ) | | $ | 36.09 | | | | 0.88 | | | | 1.29 | | | | 1.29 | | | | 1.29 | | | | 40.64 | | | | 64.77 | | | $ | 7,111,205 | |
2006(c) | | $ | 22.80 | | | | 0.32 | | | | 4.00 | | | | 4.32 | | | | (0.21 | ) | | | (0.40 | ) | | | (0.61 | ) | | $ | 26.51 | | | | 1.25 | | | | 1.33 | | | | 1.33 | | | | 1.33 | | | | 19.30 | | | | 36.58 | | | $ | 4,261,892 | |
Class B Shares | | | | | | | | | | | | | | | | | | | | | | | | | | | | | | | | | | | | | | | | | | | | | | | | | | | | | | | | | | | | |
2011(b) | | $ | 24.43 | | | | (0.07 | ) | | | 3.00 | | | | 2.93 | | | | — | | | | — | | | | — | | | $ | 27.36 | | | | (0.51 | )(d) | | | 2.06 | (d) | | | 2.06 | (d) | | | 2.10 | (d) | | | 11.99 | | | | 10.94 | | | $ | 77,284 | |
2010 | | $ | 22.56 | | | | (0.02 | ) | | | 1.95 | | | | 1.93 | | | | (0.06 | ) | | | — | | | | (0.06 | ) | | $ | 24.43 | | | | (0.10 | ) | | | 2.10 | | | | 2.10 | | | | 2.10 | | | | 8.59 | | | | 22.26 | | | $ | 74,083 | |
2009 | | $ | 22.37 | | | | 0.05 | | | | 0.22 | | | | 0.27 | | | | (0.08 | ) | | | — | | | | (0.08 | ) | | $ | 22.56 | | | | 0.29 | | | | 2.13 | | | | 2.13 | | | | 2.13 | | | | 1.24 | | | | 32.76 | | | $ | 80,908 | |
2008 | | $ | 34.33 | | | | 0.13 | | | | (9.06 | ) | | | (8.93 | ) | | | (0.15 | ) | | | (2.88 | ) | | | (3.03 | ) | | $ | 22.37 | | | | 0.44 | | | | 2.04 | | | | 2.04 | | | | 2.04 | | | | (28.33 | ) | | | 27.31 | | | $ | 98,541 | |
2007 | | $ | 25.28 | | | | 0.03 | | | | 9.75 | | | | 9.78 | | | | (0.08 | ) | | | (0.65 | ) | | | (0.73 | ) | | $ | 34.33 | | | | 0.11 | | | | 2.06 | | | | 2.06 | | | | 2.06 | | | | 39.55 | | | | 64.77 | | | $ | 135,486 | |
2006 | | $ | 21.82 | | | | 0.11 | | | | 3.81 | | | | 3.92 | | | | (0.06 | ) | | | (0.40 | ) | | | (0.46 | ) | | $ | 25.28 | | | | 0.44 | | | | 2.13 | | | | 2.13 | | | | 2.13 | | | | 18.32 | | | | 36.58 | | | $ | 82,799 | |
Class C Shares | | | | | | | | | | | | | | | | | | | | | | | | | | | | | | | | | | | | | | | | | | | | | | | | | | | | | | | | | | | | |
2011(b) | | $ | 24.54 | | | | (0.05 | ) | | | 2.99 | | | | 2.94 | | | | — | | | | — | | | | — | | | $ | 27.48 | | | | (0.42 | )(d) | | | 1.98 | (d) | | | 1.98 | (d) | | | 1.98 | (d) | | | 11.98 | | | | 10.94 | | | $ | 1,828,737 | |
2010 | | $ | 22.65 | | | | (0.01 | ) | | | 1.97 | | | | 1.96 | | | | (0.07 | ) | | | — | | | | (0.07 | ) | | $ | 24.54 | | | | (0.03 | ) | | | 2.06 | | | | 2.06 | | | | 2.06 | | | | 8.67 | | | | 22.26 | | | $ | 1,643,753 | |
2009 | | $ | 22.46 | | | | 0.06 | | | | 0.22 | | | | 0.28 | | | | (0.09 | ) | | | — | | | | (0.09 | ) | | $ | 22.65 | | | | 0.34 | | | | 2.06 | | | | 2.06 | | | | 2.06 | | | | 1.31 | | | | 32.76 | | | $ | 1,551,488 | |
2008 | | $ | 34.45 | | | | 0.15 | | | | (9.10 | ) | | | (8.95 | ) | | | (0.16 | ) | | | (2.88 | ) | | | (3.04 | ) | | $ | 22.46 | | | | 0.50 | | | | 2.00 | | | | 2.00 | | | | 2.00 | | | | (28.28 | ) | | | 27.31 | | | $ | 1,852,185 | |
2007 | | $ | 25.37 | | | | 0.05 | | | | 9.78 | | | | 9.83 | | | | (0.10 | ) | | | (0.65 | ) | | | (0.75 | ) | | $ | 34.45 | | | | 0.17 | | | | 2.01 | | | | 2.01 | | | | 2.01 | | | | 39.63 | | | | 64.77 | | | $ | 2,309,487 | |
2006 | | $ | 21.89 | | | | 0.13 | | | | 3.82 | | | | 3.95 | | | | (0.07 | ) | | | (0.40 | ) | | | (0.47 | ) | | $ | 25.37 | | | | 0.55 | | | | 2.06 | | | | 2.05 | | | | 2.06 | | | | 18.41 | | | | 36.58 | | | $ | 1,290,250 | |
Class I Shares | | | | | | | | | | | | | | | | | | | | | | | | | | | | | | | | | | | | | | | | | | | | | | | | | | | | | | | | | | | | |
2011(b) | | $ | 26.57 | | | | 0.10 | | | | 3.25 | | | | 3.35 | | | | (0.08 | ) | | | — | | | | (0.08 | ) | | $ | 29.84 | | | | 0.72 | (d) | | | 0.87 | (d) | | | 0.87 | (d) | | | 0.87 | (d) | | | 12.61 | | | | 10.94 | | | $ | 12,219,815 | |
2010 | | $ | 24.42 | | | | 0.29 | | | | 2.11 | | | | 2.40 | | | | (0.25 | ) | | | — | | | | (0.25 | ) | | $ | 26.57 | | | | 1.17 | | | | 0.92 | | | | 0.92 | | | | 0.92 | | | | 9.90 | | | | 22.26 | | | $ | 9,693,445 | |
2009 | | $ | 24.18 | | | | 0.31 | | | | 0.24 | | | | 0.55 | | | | (0.31 | ) | | | — | | | | (0.31 | ) | | $ | 24.42 | | | | 1.54 | | | | 0.92 | | | | 0.92 | | | | 0.92 | | | | 2.46 | | | | 32.76 | | | $ | 6,330,268 | |
2008 | | $ | 36.77 | | | | 0.51 | | | | (9.79 | ) | | | (9.28 | ) | | | (0.43 | ) | | | (2.88 | ) | | | (3.31 | ) | | $ | 24.18 | | | | 1.64 | | | | 0.89 | | | | 0.89 | | | | 0.89 | | | | (27.45 | ) | | | 27.31 | | | $ | 5,152,506 | |
2007 | | $ | 26.99 | | | | 0.41 | | | | 10.42 | | | | 10.83 | | | | (0.40 | ) | | | (0.65 | ) | | | (1.05 | ) | | $ | 36.77 | | | | 1.32 | | | | 0.90 | | | | 0.90 | | | | 0.90 | | | | 41.17 | | | | 64.77 | | | $ | 5,113,109 | |
2006 | | $ | 23.19 | | | | 0.43 | | | | 4.06 | | | | 4.49 | | | | (0.29 | ) | | | (0.40 | ) | | | (0.69 | ) | | $ | 26.99 | | | | 1.67 | | | | 0.94 | | | | 0.94 | | | | 0.94 | | | | 19.76 | | | | 36.58 | | | $ | 2,034,453 | |
Class R3 Shares | | | | | | | | | | | | | | | | | | | | | | | | | | | | | | | | | | | | | | | | | | | | | | | | | | | | | | | | | | | | |
2011(b) | | $ | 26.04 | | | | 0.02 | | | | 3.19 | | | | 3.21 | | | | (0.01 | ) | | | — | | | | (0.01 | ) | | $ | 29.24 | | | | 0.13 | (d) | | | 1.45 | (d) | | | 1.45 | (d) | | | 1.56 | (d) | | | 12.32 | | | | 10.94 | | | $ | 1,555,777 | |
2010 | | $ | 23.96 | | | | 0.15 | | | | 2.07 | | | | 2.22 | | | | (0.14 | ) | | | — | | | | (0.14 | ) | | $ | 26.04 | | | | 0.61 | | | | 1.45 | | | | 1.45 | | | | 1.63 | | | | 9.30 | | | | 22.26 | | | $ | 1,311,041 | |
2009 | | $ | 23.73 | | | | 0.20 | | | | 0.23 | | | | 0.43 | | | | (0.20 | ) | | | — | | | | (0.20 | ) | | $ | 23.96 | | | | 1.02 | | | | 1.45 | | | | 1.45 | | | | 1.64 | | | | 1.96 | | | | 32.76 | | | $ | 1,042,248 | |
2008 | | $ | 36.18 | | | | 0.33 | | | | (9.63 | ) | | | (9.30 | ) | | | (0.27 | ) | | | (2.88 | ) | | | (3.15 | ) | | $ | 23.73 | | | | 1.07 | | | | 1.45 | | | | 1.45 | | | | 1.62 | | | | (27.90 | ) | | | 27.31 | | | $ | 902,150 | |
2007 | | $ | 26.58 | | | | 0.23 | | | | 10.26 | | | | 10.49 | | | | (0.24 | ) | | | (0.65 | ) | | | (0.89 | ) | | $ | 36.18 | | | | 0.75 | | | | 1.45 | | | | 1.45 | | | | 1.61 | | | | 40.43 | | | | 64.77 | | | $ | 984,587 | |
2006 | | $ | 22.88 | | | | 0.33 | | | | 3.97 | | | | 4.30 | | | | (0.20 | ) | | | (0.40 | ) | | | (0.60 | ) | | $ | 26.58 | | | | 1.29 | | | | 1.45 | | | | 1.45 | | | | 1.61 | | | | 19.15 | | | | 36.58 | | | $ | 445,081 | |
Class R4 Shares | | | | | | | | | | | | | | | | | | | | | | | | | | | | | | | | | | | | | | | | | | | | | | | | | | | | | | | | | | | | |
2011(b) | | $ | 25.90 | | | | 0.05 | | | | 3.16 | | | | 3.21 | | | | (0.03 | ) | | | — | | | | (0.03 | ) | | $ | 29.08 | | | | 0.37 | (d) | | | 1.25 | (d) | | | 1.25 | (d) | | | 1.37 | (d) | | | 12.40 | | | | 10.94 | | | $ | 1,274,089 | |
2010 | | $ | 23.82 | | | | 0.21 | | | | 2.05 | | | | 2.26 | | | | (0.18 | ) | | | — | | | | (0.18 | ) | | $ | 25.90 | | | | 0.85 | | | | 1.25 | | | | 1.25 | | | | 1.49 | | | | 9.53 | | | | 22.26 | | | $ | 872,122 | |
2009 | | $ | 23.60 | | | | 0.26 | | | | 0.21 | | | | 0.47 | | | | (0.25 | ) | | | — | | | | (0.25 | ) | | $ | 23.82 | | | | 1.29 | | | | 1.25 | | | | 1.25 | | | | 1.50 | | | | 2.16 | | | | 32.76 | | | $ | 522,363 | |
2008 | | $ | 36.02 | | | | 0.44 | | | | (9.62 | ) | | | (9.18 | ) | | | (0.36 | ) | | | (2.88 | ) | | | (3.24 | ) | | $ | 23.60 | | | | 1.51 | | | | 1.25 | | | | 1.25 | | | | 1.40 | | | | (27.73 | ) | | | 27.31 | | | $ | 231,960 | |
2007(e) | | $ | 28.86 | | | | 0.09 | | | | 7.36 | | | | 7.45 | | | | (0.29 | ) | | | — | | | | (0.29 | ) | | $ | 36.02 | | | | 0.42 | (d) | | | 1.25 | (d) | | | 1.25 | (d) | | | 1.70 | (d) | | | 25.90 | | | | 64.77 | | | $ | 39,217 | |
Class R5 Shares | | | | | | | | | | | | | | | | | | | | | | | | | | | | | | | | | | | | | | | | | | | | | | | | | | | | | | | | | | | | |
2011(b) | | $ | 26.53 | | | | 0.09 | | | | 3.25 | | | | 3.34 | | | | (0.07 | ) | | | — | | | | (0.07 | ) | | $ | 29.80 | | | | 0.65 | (d) | | | 0.98 | (d) | | | 0.98 | (d) | | | 0.98 | (d) | | | 12.58 | | | | 10.94 | | | $ | 4,028,039 | |
2010 | | $ | 24.38 | | | | 0.28 | | | | 2.11 | | | | 2.39 | | | | (0.24 | ) | | | — | | | | (0.24 | ) | | $ | 26.53 | | | | 1.11 | | | | 0.99 | | | | 0.99 | | | | 1.08 | | | | 9.86 | | | | 22.26 | | | $ | 2,462,021 | |
2009 | | $ | 24.14 | | | | 0.30 | | | | 0.23 | | | | 0.53 | | | | (0.29 | ) | | | — | | | | (0.29 | ) | | $ | 24.38 | | | | 1.51 | | | | 0.99 | | | | 0.99 | | | | 1.08 | | | | 2.40 | | | | 32.76 | | | $ | 1,414,122 | |
2008 | | $ | 36.74 | | | | 0.50 | | | | (9.81 | ) | | | (9.31 | ) | | | (0.41 | ) | | | (2.88 | ) | | | (3.29 | ) | | $ | 24.14 | | | | 1.65 | | | | 0.99 | | | | 0.99 | | | | 1.01 | | | | (27.54 | ) | | | 27.31 | | | $ | 944,582 | |
2007 | | $ | 26.97 | | | | 0.43 | | | | 10.39 | | | | 10.82 | | | | (0.40 | ) | | | (0.65 | ) | | | (1.05 | ) | | $ | 36.74 | | | | 1.33 | | | | 0.94 | | | | 0.94 | | | | 0.95 | | | | 41.13 | | | | 64.77 | | | $ | 450,944 | |
2006 | | $ | 23.18 | | | | 0.45 | | | | 4.03 | | | | 4.48 | | | | (0.29 | ) | | | (0.40 | ) | | | (0.69 | ) | | $ | 26.97 | | | | 1.76 | | | | 0.95 | | | | 0.95 | | | | 0.96 | | | | 19.72 | | | | 36.58 | | | $ | 48,699 | |
| (a) | Not annualized for periods less than one year. |
| (b) | Unaudited Six Month Period Ended March 31. |
| (c) | Sales loads are not reflected in computing total return. |
| (e) | Effective date of this class of shares was February 1, 2007. |
| + | Based on weighted average shares outstanding. |
See notes to financial statements.
| | |
| 30 Certified Semi-Annual Report | | Certified Semi-Annual Report 31 |
| | |
| EXPENSE EXAMPLE | | |
| |
| Thornburg International Value Fund | | March 31, 2011 (Unaudited) |
As a shareholder of the Fund, you incur two types of costs:
| | (1) | transaction costs, including |
(a) sales charges (loads) on purchase payments for Class A shares;
(b) a deferred sales charge on redemptions of any part or all of a purchase of $1 million of Class A shares within 12 months of purchase;
(c) a deferred sales charge on redemptions of Class B shares within eight years of purchase;
(d) a deferred sales charge on redemptions of Class C shares within 12 months of purchase;
(e) a 30-day redemption fee on Class A and Class I shares;
| | (2) | ongoing costs, including management fees; distribution and/or service (12b-1) fees; and other Fund expenses. |
This example is intended to help you understand your ongoing costs (in dollars) of investing in the Fund and to compare these costs with the ongoing costs of investing in other mutual funds.
The example is based on a $1,000 investment beginning on October 1, 2010, and held until March 31, 2011.
ACTUAL EXPENSES
For each class of shares, the first line of the table at right provides information about actual account values and actual expenses. You may use the information in this line, together with the amount you invested, to estimate the expenses that you paid over the period. Simply divide your account value by $1,000 (for example, an $8,600 account value divided by $1,000 = 8.6), then multiply the result by the number in the first line for your class of shares under the heading entitled “Expenses Paid During Period” to estimate the expenses you paid on your account during this period.
HYPOTHETICAL EXAMPLE FOR COMPARISON PURPOSES
For each class of shares, the second line of the table at right provides information about hypothetical account values and hypothetical expenses based on the Fund’s actual expense ratio and an assumed rate of return of 5% per year before expenses, which is not the Fund’s actual return. The hypothetical account values and expenses may not be used to estimate the actual ending account balance or expenses you paid for the period. You may use this information to compare the ongoing costs of investing in the Fund and other funds. To do so, compare this 5% hypothetical example with the 5% hypothetical examples that appear in the shareholder reports of the other funds.
| | | | | | | | | | | | |
| | | Beginning
Account Value
10/1/10 | | | Ending
Account Value
3/31/11 | | | Expenses Paid
During Period†
10/1/10–3/31/11 | |
Class A Shares | | | | | | | | | | | | |
Actual | | $ | 1,000.00 | | | $ | 1,124.50 | | | $ | 6.60 | |
Hypothetical* | | $ | 1,000.00 | | | $ | 1,018.72 | | | $ | 6.27 | |
Class B Shares | | | | | | | | | | | | |
Actual | | $ | 1,000.00 | | | $ | 1,119.90 | | | $ | 10.90 | |
Hypothetical* | | $ | 1,000.00 | | | $ | 1,014.65 | | | $ | 10.36 | |
Class C Shares | | | | | | | | | | | | |
Actual | | $ | 1,000.00 | | | $ | 1,119.80 | | | $ | 10.47 | |
Hypothetical* | | $ | 1,000.00 | | | $ | 1,015.05 | | | $ | 9.96 | |
Class I Shares | | | | | | | | | | | | |
Actual | | $ | 1,000.00 | | | $ | 1,126.10 | | | $ | 4.62 | |
Hypothetical* | | $ | 1,000.00 | | | $ | 1,020.59 | | | $ | 4.39 | |
Class R3 Shares | | | | | | | | | | | | |
Actual | | $ | 1,000.00 | | | $ | 1,123.20 | | | $ | 7.67 | |
Hypothetical* | | $ | 1,000.00 | | | $ | 1,017.71 | | | $ | 7.29 | |
Class R4 Shares | | | | | | | | | | | | |
Actual | | $ | 1,000.00 | | | $ | 1,124.00 | | | $ | 6.62 | |
Hypothetical* | | $ | 1,000.00 | | | $ | 1,018.70 | | | $ | 6.29 | |
Class R5 Shares | | | | | | | | | | | | |
Actual | | $ | 1,000.00 | | | $ | 1,125.80 | | | $ | 5.18 | |
Hypothetical* | | $ | 1,000.00 | | | $ | 1,020.06 | | | $ | 4.92 | |
| † | Expenses are equal to the annualized expense ratio for each class (A: 1.25%; B: 2.06%; C: 1.98%; I: 0.87%; R3: 1.45%; R4: 1.25%; R5: 0.98%) multiplied by the average account value over the period, multiplied by 182/365 to reflect the one-half year period. |
| * | Hypothetical assumes a rate of return of 5% per year before expenses. |
Please note that the expenses shown in the table are meant to highlight your ongoing costs only and do not reflect any transactional costs, such as sales charges (loads), redemption fees, or exchange fees. Therefore, the second line of the table for each class of shares is useful in comparing ongoing costs only, and will not help you determine the relative total costs of owning different funds. In addition, if these transactional costs were included, your costs would have been higher.
32 Certified Semi-Annual Report
| | |
| INDEX COMPARISON | | |
| |
| Thornburg International Value Fund | | March 31, 2011 (Unaudited) |
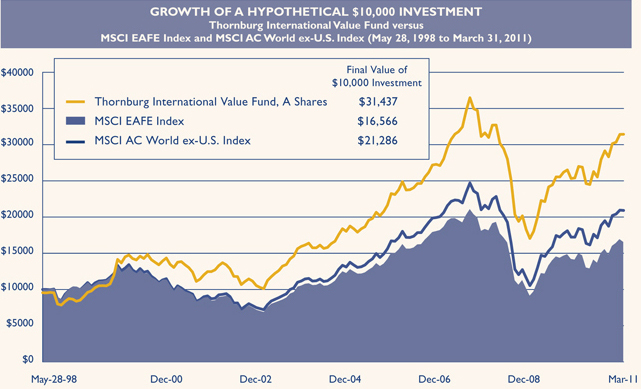
AVERAGE ANNUAL TOTAL RETURNS
For periods ended March 31, 2011 (with sales charge)
| | | | | | | | | | | | | | | | |
| | | 1 Yr | | | 5 Yrs | | | 10 Yrs | | | Since
Inception | |
A Shares (Incep: 5/28/98) | | | 11.22 | % | | | 4.78 | % | | | 8.70 | % | | | 9.33 | % |
B Shares (Incep: 4/3/00) | | | 10.52 | % | | | 4.60 | % | | | 8.48 | % | | | 6.59 | % |
C Shares (Incep: 5/28/98) | | | 14.57 | % | | | 4.98 | % | | | 8.36 | % | | | 8.84 | % |
I Shares (Incep: 3/30/01) | | | 16.90 | % | | | 6.17 | % | | | 9.68 | % | | | 9.68 | % |
R3 Shares (Incep: 7/1/03) | | | 16.26 | % | | | 5.60 | % | | | — | | | | 12.95 | % |
R4 Shares (Incep: 2/1/07) | | | 16.49 | % | | | — | | | | — | | | | 3.29 | % |
R5 Shares (Incep: 2/1/05) | | | 16.85 | % | | | 6.12 | % | | | — | | | | 9.80 | % |
MSCI EAFE Index (Since 5/28/98) | | | 10.42 | % | | | 1.30 | % | | | 5.39 | % | | | 4.02 | % |
MSCI AC World ex-U.S. Index (Since 5/28/98) | | | 13.61 | % | | | 4.05 | % | | | 7.84 | % | | | 5.92 | % |
Performance data shown represents past performance and is no guarantee of future results. Investment return and principal value will fluctuate so shares, when redeemed, may be worth more or less than their original cost. Current performance may be lower or higher than quoted. For performance current to the most recent month end, visit thornburg.com or call 800.847.0200. The performance data and graph do not reflect the deduction of taxes that a shareholder would pay on distributions or the redemption of Fund shares. Returns reflect the reinvestment of dividends and capital gains as well as applicable sales charges. Class A shares are sold with a maximum sales charge of 4.50%. Class B shares carry a contingent deferred sales charge (CDSC) that declines from 5.00% to 0% depending upon the period of time the shares are held. Class B shares will automatically convert to Class A shares on a quarterly basis approximately eight years after purchase. Class C shares are subject to a 1% CDSC for the first year only. There is no up-front sales charge for Class I, R3, R4 and R5 shares. Class A and I shares are subject to a 1% 30-day redemption fee.
Certified Semi-Annual Report 33
| | |
| OTHER INFORMATION | | |
| |
| Thornburg International Value Fund | | March 31, 2011 (Unaudited) |
PORTFOLIO PROXY VOTING
Policies and Procedures:
The Trust has delegated to Thornburg Investment Management, Inc. (the “Advisor”) voting decisions respecting proxies for the Fund’s voting securities. The Advisor makes voting decisions in accordance with its Proxy Voting Policy and Procedures. A description of the Policy and Procedures is available (i) without charge, upon request, by calling the Advisor toll-free at 1-800-847-0200, (ii) on the Thornburg web site at www.thornburg.com, and (iii) on the Securities and Exchange Commission’s web site at www.sec.gov.
Information regarding how proxies were voted is available on or before August 31 of each year for the twelve months ending the preceding June 30. This information is available (i) without charge, upon request by calling the Advisor toll-free at 1-800-847-0200, (ii) on the Thornburg web site at www.thornburg.com, and (iii) on the Securities and Exchange Commission’s web site at www.sec.gov.
AVAILABILITY OF QUARTERLY PORTFOLIO SCHEDULE
The Fund files with the Securities and Exchange Commission schedules of its portfolio holdings on Form N-Q for the first and third quarters of each fiscal year. The Fund’s Forms N-Q are available on the Commission’s web site at www.sec.gov, or may be reviewed and copied at the Commission’s Public Reference Room in Washington, D.C. Information on the operation of the Public Reference Room may be obtained by calling 1-800-SEC-0330. The Fund also makes this information available on its web site at www.thornburg. com/download or upon request by calling 1-800-847-0200.
34 Certified Semi-Annual Report
Trustees’ Statement to Shareholders
Not part of the Certified Semi-Annual Report
February 8, 2005, as readopted September 13, 2010
The Trustees are concerned that ongoing commentaries and opinions reported in the media may confuse investors in general as to the supervisory duties of trustees of mutual funds and, in particular, leave Thornburg Investment Trust shareholders uncertain regarding how we discharge our responsibilities in supervising the Funds’ investment advisor and in reviewing the advisor’s contract for renewal. We decided to spell out clearly three principal guidelines that we follow in supervising the Trust’s investment advisor on your behalf.
We begin with the premise that each shareholder selected his or her Fund because its investments are managed by the investment advisor identified in the prospectus and in accordance with the objective and policies described in the prospectus. We realize, as each of you do, that if you believe that your Fund’s stated objective and policies no longer serve your personal investment goals, you can sell your shares and leave the Fund.
Therefore, we believe that our primary supervisory task – our principal obligation to you – is to assess the nature and quality of the advisor’s services, and to confirm that the advisor actively and competently pursues the Fund’s objective, in accordance with the policies set out in the prospectus. To do this, we meet regularly with management to review your Fund’s portfolio and to discuss the advisor’s specific actions and judgments in pursuing the Fund’s objective. We do not substitute our own judgment for the advisor’s decisions in selecting investments; the advisor is paid to exercise its informed judgment on investment decisions, and we seek to confirm, in reviewing the advisor’s performance, that the advisor is doing just that.
Second, while we are conscious of costs and the effect that costs have on shareholders’ returns, we do not seek the lowest fees or expense ratio as our sole or primary objective. We try to make sure that your Fund’s fees and costs are reasonable in relationship to the services rendered and that they are generally in line with those charged by other expert investment advisors, consistent with our belief that the Fund’s investors searched for and expect that expertise and attention and have decided to pay a reasonable price for it. We do not put the management contract “out to bid” as a matter of course, and we would not do so unless we had concluded that the advisor materially had failed to pursue the Fund’s objectives in accordance with its policies, or for other equally important reasons. We believe that any other approach would be inconsistent with your interests and contrary to your expectations when you bought shares of the Fund in the first place.
Finally, because we believe that most Thornburg Fund shareholders have invested with a long-term perspective, we try not to focus too much on the fashions of the moment and on short-term performance. The market will not favor any specific investment objective or set of policies at all times and under all economic circumstances. A fund will experience periods of both high and low returns relative to other funds and other investments. Even if one of our Funds is not favored by the market at a particular time, we believe that the advisor is nonetheless obliged to remain true to the Fund’s objective and policies, and we watch to see that it does so.
This page is not part of the Semi-Annual Report. 35
This page intentionally left blank.
36 This page is not part of the Semi-Annual Report.
Retirement and Education Accounts
Thornburg Investment Management offers retirement and education savings accounts that can help you meet a variety of planning challenges. For account applications or further information on any of the accounts below, please call 1-800-847-0200 or go to www.thornburg.com/ira. Your financial advisor can help you determine which plan is right for you.
Individual Retirement Accounts
Individual Retirement Accounts (IRAs) provide a tax-advantaged means to save money for the future. For a detailed outline of the difference between retirement accounts, see www.thornburg.com/ira. Rollovers are available. Call 1-800-847-0200 for more information.
Traditional IRAs – Contributions to Traditional IRAs are tax deductible for eligible individuals, and withdrawals are taxed as additional ordinary income. You may contribute to an IRA if you receive compensation and are under 70 1/2, even if you are covered by an employer retirement plan. Deductible contributions are subject to certain qualifications. Please consult your tax advisor.
Roth IRAs – Under a Roth IRA, there is no tax deduction for contributions, but there is no income tax on qualified withdrawals. For a more detailed comparison of Traditional and Roth IRAs, please see our web site at www.thornburg.com/ira.
SEP IRAs – Simplified Employee Pension (SEP) IRAs are established by employers. The employer is allowed a tax deduction for contributions made to the SEP Plan and makes contributions to each eligible employee’s SEP IRA on a discretionary basis.
SIMPLE IRAs – Savings Incentive Match Plan for Employees of Small Employers (SIMPLE) is designed to give small business owners a simplified method to establish and contribute to a retirement plan for employees. The employer is allowed a tax deduction for contributions and makes either matching or non-elective contributions to each eligible employee’s SIMPLE IRA. Employees may make salary deferral contributions.
Coverdell Education Savings Account
These savings accounts are designed to provide a way to save money for higher education expenses. In an Education Savings Account, earnings and interest grow tax-free, and qualified withdrawals used to pay for eligible higher-education expenses are tax- and penalty-free.
Funds Available
The following funds are available in the accounts listed above:
| | • | | Thornburg International Value Fund |
| | • | | Thornburg Core Growth Fund |
| | • | | Thornburg Investment Income Builder Fund |
| | • | | Thornburg Global Opportunities Fund |
| | • | | Thornburg International Growth Fund |
| | • | | Thornburg Developing World Fund |
| | • | | Thornburg Limited Term U.S. Government Fund |
| | • | | Thornburg Limited Term Income Fund |
| | • | | Thornburg Strategic Income Fund |
This page is not part of the Semi-Annual Report. 37

Thornburg Equity Funds
Thornburg’s equity research uses a fundamental and comprehensive analytical approach. Thornburg equity funds focus on a limited number of securities so that each holding can impact performance. The equity team searches for firms believed to have a promising future and seeks to buy shares of those companies at a discount to their intrinsic value.
| | • | | Thornburg International Value Fund |
| | • | | Thornburg Core Growth Fund |
| | • | | Thornburg Investment Income Builder Fund |
| | • | | Thornburg Global Opportunities Fund |
| | • | | Thornburg International Growth Fund |
| | • | | Thornburg Developing World Fund |
Thornburg Bond Funds
Thornburg Investment Management applies a disciplined philosophy to fixed-income management. Since the launch of our first fixed-income fund over 25 years ago, we have been conducting fundamental, bottom-up research in an effort to identify bonds which we believe provide the best return for a given level of risk. We are very organic in our approach, avoiding leverage or complex strategies which could backfire in periods of market uncertainty.
| | • | | Thornburg Limited Term Municipal Fund |
| | • | | Thornburg Intermediate Municipal Fund |
| | • | | Thornburg California Limited Term Municipal Fund |
| | • | | Thornburg New Mexico Intermediate Municipal Fund |
| | • | | Thornburg New York Intermediate Municipal Fund |
| | • | | Thornburg Strategic Municipal Income Fund |
| | • | | Thornburg Limited Term U.S. Government Fund |
| | • | | Thornburg Limited Term Income Fund |
| | • | | Thornburg Strategic Income Fund |
Before investing, carefully consider the Fund’s investment goals, risks, charges, and expenses. For a prospectus containing this and other information, contact your financial advisor or visit thornburg. com. Read it carefully before investing.
For additional information, please visit www.thornburg.com
Thornburg Investment Management, Inc. 2300 North Ridgetop Road, Santa Fe, NM 87506
This page is not part of the Semi-Annual Report. 39
| | | | | | |
 | | Waste not, | | 
|
| | Wait not | |
| | | | Get instant access to your shareholder reports. |
| | |
| | This Semi-Annual Report is submitted for the general information of shareholders of the Fund. It is not authorized for distribution to prospective investors in the Fund unless preceded or accompanied by an effective prospectus. | | By switching from your postal mailbox to your email inbox, you reduce paper clutter, improve record keeping access, and help conserve our natural resources. |

| | Investment Advisor: | | Go to www.thornburg.com/edelivery and sign up to receive your shareholder reports, prospectuses, and proxy statements electronically. |
| | Thornburg Investment Management® 800.847.0200 | |
| | Distributor: | | |
| | Thornburg Securities Corporation® 800.847.0200 | | You invest in the future, without spending a dime. |
| | TH176 | | |

Important Information
The information presented on the following pages was current as of March 31, 2011. The managers’ views, portfolio holdings, and sector and country diversification are provided for the general information of the Fund’s shareholders; they are historical and subject to change. This material should not be deemed a recommendation to buy or sell any of the securities mentioned.
Investments in the Fund carry risks, including possible loss of principal. Special risks may be associated with investments outside the United States, especially in emerging markets, including currency fluctuations, illiquidity and volatility. Investments in small capitalization companies may increase the risk of greater price fluctuations. Please see the Fund’s Prospectus for a discussion of the risks associated with an investment in the Fund. Investments in the Fund are not FDIC insured, nor are they deposits of or guaranteed by a bank or any other entity. There is no guarantee that the Fund will meet its investment objectives. Funds invested in a limited number of holdings may expose an investor to greater volatility.
Performance data given at net asset value (NAV) does not take into account the applicable sales charges. If the sales charges had been included, the performance would have been lower.
Class I, R3, R4, and R5 shares may not be available to all investors. Minimum investments for Class I shares may be higher than those for other classes.
| | | | |
Share Class | | NASDAQ Symbol | | Cusip |
Class A | | THCGX | | 885-215-582 |
Class C | | TCGCX | | 885-215-574 |
Class I | | THIGX | | 885-215-475 |
Class R3 | | THCRX | | 885-215-517 |
Class R4 | | TCGRX | | 885-215-251 |
Class R5 | | THGRX | | 885-215-350 |
Glossary
Russell 3000 Growth Index – The Russell 3000 Growth Index (Russell 3K G) is an unmanaged index comprised of those Russell 3000 companies with higher price-to-book ratios and higher forecasted growth values.
S&P 500 Stock Index – The S&P 500 Index is a broad measure of the U.S. stock market.
Unless otherwise noted, index returns reflect the reinvestment of income dividends and capital gains, if any, but do not reflect fees, brokerage commissions or other expenses of investing. Investors may not make direct investments into any index. The performance of any index is not indicative of the performance of any particular investment.
Basis Point (BPS) – Unit equal to 1/100th of 1%. A 1% change = 100 basis points (bps).
Beta – Beta is a measure of market-related risk. Less than one means the portfolio is less volatile than the index, while greater than one indicates more volatility than the index.
Median Market Capitalization – Market capitalization (market cap) is the total value of a company’s stock, calculated by multiplying the number of outstanding common shares by the current share price. The company whose market cap is in the middle of the portfolio is the median market cap. Half the companies in the portfolio have values greater than the median, and half have values that are less.
Price to Book Value (P/B) – A ratio used to compare a stock’s market value to its book value. It is calculated by dividing the current closing price of the stock by the latest quarter’s book value (book value is simply assets minus liabilities).
Price to Cash Flow Ratio – A measure of the market’s expectations of a firm’s future financial health. It is calculated by dividing the price per share by cash flow per share.
Price to Earnings Ratio (P/E) – A valuation ratio equaling a company’s market value per share divided by earnings per share.
This page is not part of the Semi-Annual Report. 3
Thornburg Core Growth Fund
Tim Cunningham,CFA, Alexander M.V. Motola,CFA, and Greg Dunn
IMPORTANT PERFORMANCE
INFORMATION
Performance data shown represents past performance and is no guarantee of future results. Investment return and principal value will fluctuate so shares, when redeemed, may be worth more or less than their original cost. Current performance may be lower or higher than quoted. For performance current to the most recent month end, visit thornburg.com or call 800.847.0200.
The maximum sales charge for Class A shares is 4.50%. Class A shares are subject to a 1% 30-day redemption fee. The total annual fund operating expense of Class A shares is 1.48%, as disclosed in the most recent Prospectus.
Continually Evaluating the Risk Equation
Growth stocks are often referred to as “glamour” stocks, and it is easy to understand why. Growth stocks generate excitement. These are stocks whose rapid earnings growth is expected to be followed by rapid price appreciation. Growth stocks capture the imagination, and investing in them may potentially offer considerable opportunities for reward.
But growth stocks can also be volatile. Identifying which companies will succeed takes work. It takes digging down to the nuts and bolts of companies. The management team of Thornburg Core Growth Fund understands this. They know that it is grit, not glamour, that creates a successful growth fund.
Portfolio manager Alex Motola and his team apply a rigorous stock selection process to the investments that comprise the Thornburg Core Growth Fund. This is a portfolio run on common sense, not on abstract theory. Motola’s overarching philosophy is to create a fund that generates good performance over the long term, while reducing volatility in the interim. Intensive, hands-on, independent research is the central theme. While many other growth funds rely on broad portfolio diversification to temper volatility, the Thornburg Core Growth Fund focuses on a limited number of stocks and diversifies those investments among three segments of the growth fund universe: Consistent Growth Companies, Growth Industry Leaders, and Emerging Growth Companies. By limiting the number of securities, the Fund’s managers can evaluate each stock in greater depth. We believe that diversifying among three growth baskets further mitigates risk because each of these segments typically reacts differently than the equity markets as a whole.
How does the stock selection process work? Before adding a stock to the Fund’s portfolio, Motola and his team drill down into the company and its business. The team believes that an intimate understanding of
AVERAGE ANNUAL TOTAL RETURNS
FOR PERIODS ENDED 3/31/11
| | | | | | | | | | | | | | | | |
| | | 1 Yr | | | 3 Yrs | | | 5 Yrs | | | Since
Inception | |
A Shares (Incep: 12/27/00) | | | | | | | | | | | | | | | | |
Without sales charge | | | 13.26 | % | | | 0.06 | % | | | -0.20 | % | | | 3.26 | % |
With sales charge | | | 8.16 | % | | | -1.47 | % | | | -1.11 | % | | | 2.80 | % |
Russell 3000 Growth Index | | | | | | | | | | | | | | | | |
(Since: 12/27/00) | | | 19.24 | % | | | 5.58 | % | | | 4.32 | % | | | 0.74 | % |
4 This page is not part of the Semi-Annual Report.
the companies in the portfolio is one of the most effective forms of risk management.
Companies are initially screened using a variety of quantitative measures and parameters. Most are rejected and logged as a screening rejection. Only those with the most appealing opportunities to expand margins and grow earnings move on to the next step – the construction of a company-specific model. The goal is to cut to the quick and scrutinize the underlying business. The team uses SEC filings to construct proprietary income statement, balance sheet and cash flow statement models for each remaining company. From these they analyze historical data, monitor current conditions, identify red flags, and estimate future growth potential.
Motola, a former historian who has been at the Fund’s helm since its inception, is not one to go along with the crowd. He and his team are not tied to “mainstream thinking.” While they have access to the best of Wall Street’s analysis, they are not ruled by it.
The team test the strength of a company’s underlying business model against a variety of what-if screens. Besides conducting site visits and interviewing company management, they also check in with a company’s major customers, suppliers, and distributors to get a complete picture of a company before investing. Revenue and cost of goods sold are given particular attention. All data points are broken down in as many ways as possible before reaching an investment decision.
STOCKS CONTRIBUTING AND DETRACTING
FOR THE SIX MONTHS ENDED 3/31/11
| | |
Top Contributors | | Top Detractors |
Gentex Corp. | | Grand Canyon Education, Inc. |
Frontier Oil Corp. | | Equinix, Inc. |
Affiliated Managers Group, Inc. | | F5 Networks, Inc. |
ON Semiconductor Corp. | | Skechers USA, Inc. |
Charles Schwab Corp. | | Sourcefire, Inc. |
| |
Source: FactSet | | |
KEY PORTFOLIO ATTRIBUTES
As of 3/31/11
| | | | |
Portfolio P/E Trailing 12-months* | | | 21.8x | |
Portfolio Price to Cash Flow* | | | 14.2x | |
Portfolio Price to Book Value* | | | 3.7x | |
Median Market Cap* | | $ | 8.7 B | |
7-Year Beta (A Shares vs. Russell 3K G)* | | | 1.14 | |
Number of Companies | | | 38 | |
| |
* Source: FactSet | | | | |
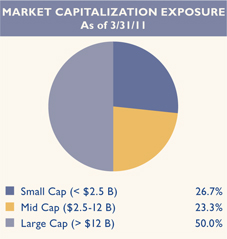
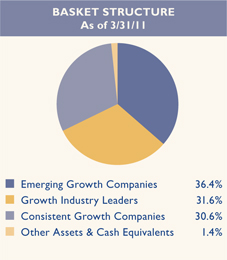
This page is not part of the Semi-Annual Report. 5

Thornburg Core Growth Fund
March 31, 2011
This report is certified under the Sarbanes-Oxley Act of 2002, which requires that public companies, including mutual funds, affirm that the information provided in their annual and semiannual shareholder reports fully and fairly represents their financial position.
6 Certified Semi-Annual Report
Letter to Shareholders
| | |

Alexander M.V. Motola,CFA Portfolio Manager | | April 18, 2010 Dear Fellow Shareholder: For the six months ended March 31, 2011, the performance of the Thornburg Core Growth Fund was relatively benchmark-like. The Fund’s Class A shares marginally underperformed its benchmark with a total return of 18.10% (without sales charge) compared to 19.33% for the Russell 3000 Growth Index. On March 31, 2011, the net asset value (NAV) for the Class A shares was $16.31. At the end of the last fiscal year, September 30, 2010, the Class A share NAV was $13.81. The stock selection effect was positive over the past half year, with particularly good results in health care, financials, and energy. Consumer discretionary was our toughest sector, with Grand Canyon Education, Life Time Fitness, and Skechers USA dragging on our results. The overall positive stock selection impact was overwhelmed by our weights within various sectors: relative to the Russell 3000 Growth Index, results were hampered by being overweight health care and technology, and underweight industrials and especially energy. The three best performing sectors over the past six months within our benchmark were industrials, materials, and energy – all cyclical sectors that we have historically had less exposure to. Given the state of the global economy in general, and the U.S. economy in particular, we believe secular growth is an increasingly scarce resource – and something investors will be willing to pay for. Large moves in the more cyclical parts of the market are a challenge for us, but a temporal one. Our largest positive contributors to returns were Gentex, Frontier Oil, Affiliated Managers Group, ON Semiconductor, and Charles Schwab Corp. Gentex is the leading supplier of auto-dimming mirrors to the global auto industry and the company has a strong presence in the Rear Camera Display (RCD) market, integrating this product into their mirror lineup. Recently, there has been a lot of regulatory interest in mandating RCD in all cars, and Gentex has benefited. Affiliated Managers is a holding company which invests in the firms of asset managers. In addition to strong performance from their stable of managers, the company has been very successful in attracting new assets from overseas investors. When we started the Fund, we labeled it “Thornburg Core Growth Fund” with the idea of addressing a wide variety of investment opportunities. We wanted a fund that could and would buy small-, mid-, and large-cap stocks, a fund that would use the “basket” structure, |
Certified Semi-Annual Report 7
Letter to Shareholders,
Continued
which has worked well across multiple Thornburg Funds, and a fund that would buy very valuation-sensitive “core” holdings, as well as more aggressive, high-growth stocks in all parts of the market. Leading into late 2007, the Fund was always more “growth” than “core”, but we were sensitive of the desire to balance both. Since the 2008 financial crisis, the nature of the holdings evolved to more “core” and less “growth.” Several of the recent additions to the Fund seek to re-establish the growth bias more prominently.
We added eighteen new stocks to the portfolio over the past six months, including a number of higher-growth names like EMC, SolarWinds, BroadSoft, Intuit, Zoll Medical, and PriceSmart, as well as some “economic recovery” names like FedEx Corp., Portfolio Recovery Associates, and UBS. Many of those additions have already made a material contribution to performance. BroadSoft sells software to wireline, wireless, and cable operators to enhance service offerings over internet-protocol based networks – basically representing a direct opportunity on the success and deployment of 4G (LTE) networks in the intermediate term, and the conversion of wireline networks from time-division multiplexing to packet-based technologies in the near term. This is an area of tremendous growth. Intuit, the market leader in do-it-yourself tax preparation software, also contributed nicely, shortly after purchase. Online tax preparation is a secular growth market as more and more people shift from paper tax returns to online filing. Intuit also offers a number of solutions for small businesses, including QuickBooks accounting software.
We remain optimistic that regardless of the economic environment, our disciplined, consistent, bottom-up approach to stock research will lead us to attractive growth companies. We encourage you to learn more about your portfolio. Descriptions of each holding and links within the Thornburg company website can be found by pointing your internet browser to www.thornburg.com/funds. Thank you for investing in the Thornburg Core Growth Fund.
Sincerely,

Alexander M.V. Motola,CFA
Managing Director
Portfolio Manager
The matters discussed in this report may constitute forward-looking statements made pursuant to the safe harbor provisions of the Securities Litigation Reform Act of 1995. These include any advisor or portfolio manager prediction, assessment, analysis or outlook for individual securities, industries, investment styles, market sectors and/or markets. These statements involve risks and uncertainties. In addition to the general risks described for each fund in its current prospectus, other factors bearing on these reports include the accuracy of the advisor’s or portfolio manager’s forecasts and predictions, the appropriateness of the investment strategies designed by the advisor or portfolio manager, and the ability of the advisor or portfolio manager to implement their strategies efficiently and successfully. Any one or more of these factors, as well as other risks affecting the securities markets generally, could cause the actual results of any fund to differ materially as compared to its benchmarks.
8 Certified Semi-Annual Report.
SCHEDULE OF INVESTMENTS
| | |
Thornburg Core Growth Fund | | March 31, 2011 (Unaudited) |
TOP TEN HOLDINGS
As of 3/31/11
| | | | | | | | | | |
Gilead Sciences, Inc. | | | 5.0 | % | | Visa, Inc. | | | 3.5 | % |
Amazon.com, Inc. | | | 4.3 | % | | Microsoft Corp. | | | 3.5 | % |
EMC Corp. | | | 3.8 | % | | Intuit, Inc. | | | 3.4 | % |
Qualcomm, Inc. | | | 3.7 | % | | The Gap, Inc. | | | 3.0 | % |
Google, Inc. | | | 3.7 | % | | Charles Schwab Corp. | | | 3.0 | % |
SUMMARY OF INDUSTRY EXPOSURE
As of 3/31/11
| | | | | | | | | | |
Software & Services | | | 30.5 | % | | Semiconductors & Semiconductor Equipment | | | 2.5 | % |
Diversified Financials | | | 13.3 | % | | Food & Staples Retailing | | | 2.5 | % |
Technology Hardware & Equipment | | | 9.9 | % | | Banks | | | 2.3 | % |
Pharmaceuticals, Biotechnology & Life Sciences | | | 9.8 | % | | Transportation | | | 2.3 | % |
Health Care Equipment & Services | | | 9.4 | % | | Energy | | | 2.2 | % |
Retailing | | | 7.3 | % | | Capital Goods | | | 1.4 | % |
Automobiles & Components | | | 2.6 | % | | Other Assets & Cash Equivalents | | | 1.4 | % |
Telecommunication Services | | | 2.6 | % | | | | | | |
SUMMARY OF COUNTRY EXPOSURE
As of 3/31/11 (% of equity holdings)
| | | | | | | | | | |
United States | | | 89.5 | % | | Switzerland | | | 2.9 | % |
United Kingdom | | | 5.1 | % | | Costa Rica | | | 2.5 | % |
Certified Semi-Annual Report 9
SCHEDULE OF INVESTMENTS, CONTINUED
| | |
| Thornburg Core Growth Fund | | March 31, 2011 (Unaudited) |
| | | | | | | | |
| | | Shares/
Principal Amount | | | Value | |
COMMON STOCK — 98.61% | | | | | | | | |
AUTOMOBILES & COMPONENTS — 2.59% | | | | | | | | |
AUTO COMPONENTS — 2.59% | | | | | | | | |
Gentex Corp. | | | 1,011,623 | | | $ | 30,601,596 | |
| | | | | | | | |
| | | | | | | 30,601,596 | |
| | | | | | | | |
BANKS — 2.31% | | | | | | | | |
COMMERCIAL BANKS — 2.31% | | | 479,606 | | | | 27,303,969 | |
| | | | | | | | |
a SVB Financial Group | | | | | | | | |
| | | | | | | 27,303,969 | |
| | | | | | | | |
CAPITAL GOODS — 1.43% | | | | | | | | |
TRADING COMPANIES & DISTRIBUTORS — 1.43% | | | | | | | | |
a RSC Holdings, Inc. | | | 1,177,116 | | | | 16,926,928 | |
| | | | | | | | |
| | | | | | | 16,926,928 | |
| | | | | | | | |
DIVERSIFIED FINANCIALS — 13.31% | | | | | | | | |
CAPITAL MARKETS — 8.77% | | | | | | | | |
a Affiliated Managers Group, Inc. | | | 322,876 | | | | 35,312,948 | |
Charles Schwab Corp. | | | 1,961,435 | | | | 35,364,673 | |
a UBS AG | | | 1,844,000 | | | | 33,085,596 | |
DIVERSIFIED FINANCIAL SERVICES — 4.54% | | | | | | | | |
a Encore Capital Group, Inc. | | | 375,000 | | | | 8,883,750 | |
a Intercontinental Exchange, Inc. | | | 184,144 | | | | 22,749,150 | |
a Portfolio Recovery Associates, Inc. | | | 258,794 | | | | 22,031,133 | |
| | | | | | | | |
| | | | | | | 157,427,250 | |
| | | | | | | | |
ENERGY — 2.23% | | | | | | | | |
ENERGY EQUIPMENT & SERVICES — 1.10% | | | | | | | | |
Baker Hughes, Inc. | | | 177,800 | | | | 13,055,854 | |
OIL, GAS & CONSUMABLE FUELS — 1.13% | | | | | | | | |
a Continental Resources, Inc. | | | 187,300 | | | | 13,386,331 | |
| | | | | | | | |
| | | | | | | 26,442,185 | |
| | | | | | | | |
FOOD & STAPLES RETAILING — 2.48% | | | | | | | | |
FOOD & STAPLES RETAILING — 2.48% | | | | | | | | |
PriceSmart, Inc. | | | 800,000 | | | | 29,312,000 | |
| | | | | | | | |
| | | | | | | 29,312,000 | |
| | | | | | | | |
HEALTH CARE EQUIPMENT & SERVICES — 9.37% | | | | | | | | |
HEALTH CARE EQUIPMENT & SUPPLIES — 4.47% | | | | | | | | |
Covidien plc | | | 677,310 | | | | 35,179,481 | |
a Zoll Medical Corp. | | | 395,306 | | | | 17,713,662 | |
HEALTH CARE PROVIDERS & SERVICES — 4.90% | | | | | | | | |
a HMS Holdings Corp. | | | 392,677 | | | | 32,140,613 | |
a Medco Health Solutions, Inc. | | | 459,600 | | | | 25,811,136 | |
| | | | | | | | |
| | | | | | | 110,844,892 | |
| | | | | | | | |
PHARMACEUTICALS, BIOTECHNOLOGY & LIFE SCIENCES — 9.82% | | | | | |
BIOTECHNOLOGY — 7.34% | | | | | |
a Alexion Pharmaceuticals, Inc. | | | 276,055 | | | | 27,241,107 | |
10 Certified Semi-Annual Report
SCHEDULE OF INVESTMENTS, CONTINUED
| | |
| Thornburg Core Growth Fund | | March 31, 2011 (Unaudited) |
| | | | | | | | |
| | | Shares/
Principal Amount | | | Value | |
a Gilead Sciences, Inc. | | | 1,404,179 | | | $ | 59,593,357 | |
PHARMACEUTICALS — 2.48% | | | | | | | | |
a Salix Pharmaceuticals Ltd. | | | 836,437 | | | | 29,300,388 | |
| | | | | | | | |
| | | | | | | 116,134,852 | |
| | | | | | | | |
RETAILING — 7.34% | | | | | | | | |
INTERNET & CATALOG RETAIL — 4.29% | | | | | | | | |
a Amazon.com, Inc. | | | 281,715 | | | | 50,745,323 | |
SPECIALTY RETAIL — 3.05% | | | | | | | | |
The Gap, Inc. | | | 1,591,600 | | | | 36,065,656 | |
| | | | | | | | |
| | | | | | | 86,810,979 | |
| | | | | | | | |
SEMICONDUCTORS & SEMICONDUCTOR EQUIPMENT — 2.50% | | | | | | | | |
SEMICONDUCTORS & SEMICONDUCTOR EQUIPMENT — 2.50% | | | | | | | | |
a ON Semiconductor Corp. | | | 3,003,198 | | | | 29,641,564 | |
| | | | | | | | |
| | | | | | | 29,641,564 | |
| | | | | | | | |
| | |
SOFTWARE & SERVICES — 30.49% | | | | | | | | |
INFORMATION TECHNOLOGY SERVICES — 9.26% | | | | | | | | |
a Amdocs Ltd. | | | 1,198,006 | | | | 34,562,473 | |
a Fiserv, Inc. | | | 528,284 | | | | 33,133,972 | |
Visa, Inc. | | | 569,356 | | | | 41,915,989 | |
INTERNET SOFTWARE & SERVICES — 8.04% | | | | | | | | |
a Google, Inc. | | | 73,669 | | | | 43,185,505 | |
a RightNow Technologies, Inc. | | | 848,340 | | | | 26,553,042 | |
a Telecity Group plc | | | 3,108,056 | | | | 25,353,509 | |
SOFTWARE — 13.19% | | | | | | | | |
a BroadSoft, Inc. | | | 560,677 | | | | 26,738,686 | |
a Intuit, Inc. | | | 747,200 | | | | 39,676,320 | |
Microsoft Corp. | | | 1,610,438 | | | | 40,840,708 | |
a RealD, Inc. | | | 732,200 | | | | 20,032,992 | |
a SolarWinds, Inc. | | | 1,225,579 | | | | 28,752,083 | |
| | | | | | | | |
| | | | | | | 360,745,279 | |
| | | | | | | | |
TECHNOLOGY HARDWARE & EQUIPMENT — 9.91% | | | | | | | | |
COMMUNICATIONS EQUIPMENT — 6.08% | | | | | | | | |
a F5 Networks, Inc. | | | 274,100 | | | | 28,114,437 | |
Qualcomm, Inc. | | | 799,800 | | | | 43,853,034 | |
COMPUTERS & PERIPHERALS — 3.83% | | | | | | | | |
a EMC Corp. | | | 1,707,300 | | | | 45,328,815 | |
| | | | | | | | |
| | | | | | | 117,296,286 | |
| | | | | | | | |
TELECOMMUNICATION SERVICES — 2.58% | | | | | | | | |
WIRELESS TELECOMMUNICATION SERVICES — 2.58% | | | | | | | | |
a SBA Communications Corp. | | | 770,700 | | | | 30,581,376 | |
| | | | | | | | |
| | | | | | | 30,581,376 | |
| | | | | | | | |
TRANSPORTATION — 2.25% | | | | | | | | |
AIR FREIGHT & LOGISTICS — 2.25% | | | | | | | | |
FedEx Corp. | | | 284,027 | | | | 26,570,727 | |
| | | | | | | | |
| | | | | | | 26,570,727 | |
| | | | | | | | |
TOTAL COMMON STOCK (Cost $922,571,893) | | | | | | | 1,166,639,883 | |
| | | | | | | | |
Certified Semi-Annual Report 11
SCHEDULE OF INVESTMENTS, CONTINUED
| | |
| |
| Thornburg Core Growth Fund | | March 31, 2011 (Unaudited) |
| | | | | | | | |
| | | Shares/
Principal Amount | | | Value | |
SHORT TERM INVESTMENTS — 1.10% | | | | | | | | |
Wellpoint, Inc., 0.20%, 4/1/2011 | | $ | 13,000,000 | | | $ | 13,000,000 | |
| | | | | | | | |
TOTAL SHORT TERM INVESTMENTS (Cost $13,000,000) | | | | | | | 13,000,000 | |
| | | | | | | | |
TOTAL INVESTMENTS — 99.71% (Cost $935,571,894) | | | | | | $ | 1,179,639,883 | |
OTHER ASSETS LESS LIABILITIES — 0.29% | | | | | | | 3,372,107 | |
| | | | | | | | |
NET ASSETS — 100.00% | | | | | | $ | 1,183,011,990 | |
| | | | | | | | |
Footnote Legend
See notes to financial statements.
12 Certified Semi-Annual Report
This page intentionally left blank.
Certified Semi-Annual Report 13
STATEMENT OF ASSETS AND LIABILITIES
| | |
Thornburg Core Growth Fund | | March 31, 2011 (Unaudited) |
| | | | |
ASSETS | | | | |
Investments at value (cost $935,571,894) (Note 2) | | $ | 1,179,639,883 | |
Cash | | | 751,695 | |
Receivable for investments sold | | | 15,973,550 | |
Receivable for fund shares sold | | | 1,003,279 | |
Dividends receivable | | | 34,083 | |
Prepaid expenses and other assets | | | 86,862 | |
| | | | |
Total Assets | | | 1,197,489,352 | |
| | | | |
| |
LIABILITIES | | | | |
Payable for securities purchased | | | 1,662,899 | |
Payable for fund shares redeemed | | | 10,608,414 | |
Payable to investment advisor and other affiliates (Note 3) | | | 1,223,595 | |
Accounts payable and accrued expenses | | | 982,385 | |
Dividends payable | | | 69 | |
| | | | |
Total Liabilities | | | 14,477,362 | |
| | | | |
| |
NET ASSETS | | $ | 1,183,011,990 | |
| | | | |
NET ASSETS CONSIST OF: | | | | |
Net investment loss | | $ | (6,356,342 | ) |
Net unrealized appreciation on investments | | | 244,067,989 | |
Accumulated net realized gain (loss) | | | (761,110,459 | ) |
Net capital paid in on shares of beneficial interest | | | 1,706,410,802 | |
| | | | |
| | $ | 1,183,011,990 | |
| | | | |
14 Certified Semi-Annual Report.
STATEMENT OF ASSETS AND LIABILITIES, CONTINUED
| | |
| Thornburg Core Growth Fund | | March 31, 2011 (Unaudited) |
| | | | |
NET ASSET VALUE: | | | | |
Class A Shares: | | | | |
Net asset value and redemption price per share ($335,363,092 applicable to 20,557,204 shares of beneficial interest outstanding - Note 4) | | $ | 16.31 | |
Maximum sales charge, 4.50% of offering price | | | 0.77 | |
| | | | |
Maximum offering price per share | | $ | 17.08 | |
| | | | |
| |
Class C Shares: | | | | |
Net asset value and offering price per share * ($201,186,970 applicable to 13,407,802 shares of beneficial interest outstanding - Note 4) | | $ | 15.01 | |
| | | | |
| |
Class I Shares: | | | | |
Net asset value, offering and redemption price per share ($157,243,701 applicable to 9,280,769 shares of beneficial interest outstanding - Note 4) | | $ | 16.94 | |
| | | | |
| |
Class R3 Shares: | | | | |
Net asset value, offering and redemption price per share ($188,508,274 applicable to 11,553,265 shares of beneficial interest outstanding - Note 4) | | $ | 16.32 | |
| | | | |
| |
Class R4 Shares: | | | | |
Net asset value, offering and redemption price per share ($17,244,336 applicable to 1,054,410 shares of beneficial interest outstanding - Note 4) | | $ | 16.35 | |
| | | | |
| |
Class R5 Shares: | | | | |
Net asset value, offering and redemption price per share ($283,465,617 applicable to 16,744,796 shares of beneficial interest outstanding - Note 4) | | $ | 16.93 | |
| | | | |
| * | Redemption price per share is equal to net asset value less any applicable contingent deferred sales charge. |
See notes to financial statements.
Certified Semi-Annual Report 15
STATEMENT OF OPERATIONS
| | |
| Thornburg Core Growth Fund | | Six Months Ended March 31, 2011 (Unaudited) |
| | | | |
INVESTMENT INCOME: | | | | |
Dividend income | | $ | 2,714,483 | |
Interest income | | | 52,803 | |
| | | | |
Total Income | | | 2,767,286 | |
| | | | |
| |
EXPENSES: | | | | |
Investment advisory fees (Note 3) | | | 5,310,114 | |
Administration fees (Note 3) | | | | |
Class A Shares | | | 223,409 | |
Class C Shares | | | 131,474 | |
Class I Shares | | | 42,392 | |
Class R3 Shares | | | 128,302 | |
Class R4 Shares | | | 12,347 | |
Class R5 Shares | | | 77,857 | |
Distribution and service fees (Note 3) | | | | |
Class A Shares | | | 446,822 | |
Class C Shares | | | 1,046,747 | |
Class R3 Shares | | | 513,313 | |
Class R4 Shares | | | 24,563 | |
Transfer agent fees | | | | |
Class A Shares | | | 388,378 | |
Class C Shares | | | 228,220 | |
Class I Shares | | | 115,385 | |
Class R3 Shares | | | 276,830 | |
Class R4 Shares | | | 49,702 | |
Class R5 Shares | | | 393,665 | |
Registration and filing fees | | | | |
Class A Shares | | | 11,468 | |
Class C Shares | | | 10,216 | |
Class I Shares | | | 10,205 | |
Class R3 Shares | | | 10,395 | |
Class R4 Shares | | | 10,548 | |
Class R5 Shares | | | 12,612 | |
Custodian fees (Note 3) | | | 106,980 | |
Professional fees | | | 32,467 | |
Accounting fees | | | 19,350 | |
Trustee fees | | | 15,278 | |
Other expenses | | | 93,505 | |
| | | | |
Total Expenses | | | 9,742,544 | |
Less: | | | | |
Expenses reimbursed by investment advisor (Note 3) | | | (715,233 | ) |
| | | | |
Net Expenses | | | 9,027,311 | |
| | | | |
Net Investment Loss | | $ | (6,260,025 | ) |
| | | | |
16 Certified Semi-Annual Report.
STATEMENT OF OPERATIONS, CONTINUED
| | |
| Thornburg Core Growth Fund | | Six Months Ended March 31, 2011 (Unaudited) |
| | | | |
REALIZED AND UNREALIZED GAIN (LOSS) | | | | |
Net realized gain (loss) from: | | | | |
Investments | | $ | 152,935,221 | |
Foreign currency transactions | | | (101,962 | ) |
| | | | |
| | | 152,833,259 | |
| | | | |
Net change in unrealized appreciation (depreciation) on investments | | | 69,719,320 | |
| | | | |
Net Realized and Unrealized Gain | | | 222,552,579 | |
| | | | |
Net Increase in Net Assets Resulting from Operations | | $ | 216,292,554 | |
| | | | |
See notes to financial statements.
Certified Semi-Annual Report 17
STATEMENTS OF CHANGES IN NET ASSETS
Thornburg Core Growth Fund
| | | | | | | | |
| | | Six Months Ended
March 31, 2011* | | | Year Ended
September 30, 2010 | |
INCREASE (DECREASE) IN NET ASSETS FROM | | | | | | | | |
| | |
OPERATIONS: | | | | | | | | |
Net investment income (loss) | | $ | (6,260,025 | ) | | $ | (16,110,454 | ) |
Net realized gain (loss) on investments and foreign currency transactions | | | 152,833,259 | | | | 118,279,325 | |
Increase (Decrease) in unrealized appreciation (depreciation) on investments and foreign currency translations | | | 69,719,320 | | | | (84,200,086 | ) |
| | | | | | | | |
| | |
Net Increase (Decrease) in Net Assets Resulting from Operations | | | 216,292,554 | | | | 17,968,785 | |
| | |
FUND SHARE TRANSACTIONS (NOTE 4): | | | | | | | | |
Class A Shares | | | (98,083,679 | ) | | | (143,803,748 | ) |
Class C Shares | | | (48,907,900 | ) | | | (75,171,959 | ) |
Class I Shares | | | (43,853,119 | ) | | | (48,814,392 | ) |
Class R3 Shares | | | (58,498,611 | ) | | | (69,273,239 | ) |
Class R4 Shares | | | (11,149,823 | ) | | | (5,941,399 | ) |
Class R5 Shares | | | (95,571,717 | ) | | | (3,484,259 | ) |
| | | | | | | | |
| | |
Net Decrease in Net Assets | | | (139,772,295 | ) | | | (328,520,211 | ) |
| | |
NET ASSETS: | | | | | | | | |
Beginning of Period | | | 1,322,784,285 | | | | 1,651,304,496 | |
| | | | | | | | |
| | |
End of Period | | $ | 1,183,011,990 | | | $ | 1,322,784,285 | |
| | | | | | | | |
See notes to financial statements.
18 Certified Semi-Annual Report
| | |
NOTES TO FINANCIAL STATEMENTS |
| Thornburg Core Growth Fund | | March 31, 2011 (Unaudited) |
NOTE 1 – ORGANIZATION
Thornburg Core Growth Fund, hereinafter referred to as the “Fund,” is a diversified series of Thornburg Investment Trust (the “Trust”). The Trust was organized as a Massachusetts business trust under a Declaration of Trust dated June 3, 1987 and is registered as a diversified, open-end management investment company under the Investment Company Act of 1940, as amended. The Fund is currently one of sixteen separate series of the Trust. Each series is considered to be a separate entity for financial reporting and tax purposes and bears expenses directly attributable to it. The Fund seeks long-term capital appreciation by investing in equity securities selected for their growth potential.
The Fund currently offers six classes of shares of beneficial interest: Class A, Class C, Institutional Class (Class I), and Retirement Classes (Class R3, Class R4, and Class R5). Each class of shares of the Fund represents an interest in the same portfolio of investments, except that (i) Class A shares are sold subject to a front-end sales charge collected at the time the shares are purchased and bear a service fee, (ii) Class C shares are sold at net asset value without a sales charge at the time of purchase, but are subject to a contingent deferred sales charge upon redemption within one year of purchase, and bear both a service fee and a distribution fee, (iii) Class I shares are sold at net asset value without a sales charge at the time of purchase, (iv) Class R3 shares are sold at net asset value without a sales charge at the time of purchase, but bear both a service fee and distribution fee, (v) Class R4 shares are sold at net asset value without sales charge at the time of purchase, but bear a service fee, (vi) Class R5 shares are sold at net asset value without a sales charge at the time of purchase, and (vii) the respective classes may have different reinvestment privileges and conversion rights. Additionally, the Fund may allocate among its classes certain expenses, to the extent allowable to specific classes, including transfer agent fees, government registration fees, certain printing and postage costs, and administrative and legal expenses. Currently, class specific expenses of the Fund are limited to service and distribution fees, administration fees, and certain registration and transfer agent expenses.
NOTE 2 – SIGNIFICANT ACCOUNTING POLICIES
Significant accounting policies of the Trust are as follows:
Valuation of Investments: Portfolio securities listed or traded on a national securities exchange are valued on the valuation date at the last reported sale price on the exchange that is the primary market for the security. Portfolio securities traded on an exchange for which there has been no sale that day and other equity securities traded in the over-the-counter market are valued at the mean between the last reported bid and asked prices. Portfolio securities reported by NASDAQ are valued at the NASDAQ official closing price. Any foreign security traded on exchanges outside the United States is valued at the price of the security on the exchange that is normally the security’s primary market, as of the close of that exchange preceding the time of the Fund’s valuation.
Debt obligations held by the Fund have a primary market over the counter and are valued by an independent pricing service approved by the Trustees of the Trust. The pricing service ordinarily values debt obligations at quoted bid prices. When quotations are not available, debt obligations held by the Fund are valued at evaluated prices determined by the pricing service using methods which include consideration of yields or prices of debt obligations of comparable quality, type of issue, coupon, maturity and rating, and indications as to value from dealers and general market conditions. Short-term obligations having remaining maturities of 60 days or less are ordinarily valued at amortized cost, which approximates market value.
Quotations in foreign currencies for foreign portfolio investments are converted to U.S. dollar equivalents using the foreign exchange quotation in effect at the time of valuation.
In any case where the market value of an equity security held by the Fund is not readily available, the Trust’s valuation and pricing committee determines a fair value for the security using procedures approved by the Trustees, which may include the use of a price obtained from an independent pricing service. The pricing service ordinarily values equity securities in these instances using multi-factor models to adjust market prices based upon various inputs, including exchange data, depository receipt prices, futures and index data and other data. A security’s market value is deemed not readily available whenever the exchange or market on which the security is primarily traded is closed for the entire scheduled day of trading. Additionally, a security’s market value may be deemed not readily available under other circumstances identified by the Trustees, including when developments occurring after the most recent close of the security’s primary exchange or market, but before the most recent close of trading in Fund shares, create a serious question about the reliability of the security’s market value.
Certified Semi-Annual Report 19
NOTES TO FINANCIAL STATEMENTS, CONTINUED
| | |
| Thornburg Core Growth Fund | | March 31, 2011 (Unaudited) |
In any case where a pricing service fails to provide a price for a debt obligation held by the Fund, the valuation and pricing committee determines a fair value for the debt obligation using procedures approved by the Trustees. Additionally, in any case where management believes that a price provided by a pricing service for a debt obligation held by the Fund may be unreliable, the valuation and pricing committee decides whether or not to use the pricing service’s valuation or to determine a fair value for the debt obligation.
In determining fair value for any portfolio security or other investment, the valuation and pricing committee seeks to determine the amount that an owner of the investment might reasonably expect to receive upon a sale of the investment. However, because fair value prices are estimated prices, the valuation and pricing committee’s determination of fair value for an investment may differ from the value that would be realized by the Fund upon a sale of the investment, and that difference could be material to the Fund’s financial statements. The valuation and pricing committee’s determination of fair value for an investment may also differ from the prices obtained by other persons (including other mutual funds) for the investment.
Valuation Measurements: Various inputs are used in determining the value of the Fund’s investments. These inputs are summarized in the three levels listed below.
Level 1: Quoted prices in active markets for identical investments.
Level 2: Other significant observable inputs (including quoted prices for similar investments, interest rates, prepayment rates, credit risk, etc.).
Level 3: Significant unobservable inputs (including the Fund’s own assumptions in determining the fair value of investments).
The following table displays a summary of the inputs used to value the Fund’s net assets as of March 31, 2011. In any instance when valuation inputs from more than one level are used to determine the fair value of a specific investment, the investment is placed in the level of the table based upon the lowest level input that is significant in determining the fair value of the investment:
| | | | | | | | | | | | | | | | |
| | | Fair Value Measurements at March 31, 2011 | |
| | | Total | | | Level 1 | | | Level 2 | | | Level 3 | |
Assets | | | | | | | | | | | | | | | | |
Investments in Securities* | | | | | | | | | | | | | | | | |
Common Stock | | $ | 1,166,639,883 | | | $ | 1,166,639,883 | | | $ | — | | | $ | — | |
Short Term Investments | | | 13,000,000 | | | | — | | | | 13,000,000 | | | | — | |
| | | | | | | | | | | | | | | | |
Total Investments in Securities | | | $1,179,639,883 | | | | $1,166,639,883 | | | | $13,000,000 | | | $ | — | |
| * | See Schedule of Investments for a summary of the industry exposure as grouped according to the Global Industry Classification Standard (GICS), which is an industry taxonomy developed by MSCI Barra and Standard & Poor’s (S&P). |
Other Notes: It is the policy of the Fund to recognize significant transfers between Levels 1 and 2 and to disclose those transfers at the last date of the reporting period. The Fund recognized no significant transfers into and out of Levels 1 and 2 during the six months ended March 31, 2011.
Foreign Currency Translation: Portfolio securities and other assets and liabilities denominated in foreign currencies are translated into U.S. dollars based on the exchange rate of such currencies against the U.S. dollar on the date of valuation. Purchases and sales of securities and income items denominated in foreign currencies are translated into U.S. dollars at the exchange rate in effect on the translation date. When the Fund purchases or sells foreign securities, it will customarily enter into a foreign exchange contract to minimize foreign exchange risk from the trade date to the settlement date of such transactions.
The Fund does not separately report the effect of changes in foreign exchange rates from changes in market prices on securities held. Such changes are included in net realized and unrealized gain or loss from investments.
Reported net realized foreign exchange gains or losses arise from sales of foreign currencies, currency gains or losses realized between the trade and settlement dates on securities transactions and the difference between the amounts of dividends, interest, and foreign withholding taxes recorded on the Fund’s books, and the U.S. dollar equivalent of the amounts actually received or paid.
20 Certified Semi-Annual Report
NOTES TO FINANCIAL STATEMENTS, CONTINUED
| | |
| Thornburg Core Growth Fund | | March 31, 2011 (Unaudited) |
Net unrealized foreign exchange gains and losses arise from changes in the fair value of assets and liabilities, other than investments in securities at fiscal period end, resulting from changes in exchange rates.
Deferred Taxes: The Fund is subject to a tax imposed on net realized gains of securities of certain foreign countries. The Fund records an estimated deferred tax liability for net unrealized gains on these securities as reflected in the accompanying financial statements.
Federal Income Taxes: It is the policy of the Trust to comply with the provisions of the Internal Revenue Code applicable to “regulated investment companies” and to distribute to shareholders substantially all taxable income, including any net realized gain on investments of the Fund. Therefore, no provision for federal income taxes is required.
Management reviews each tax position believed to be material to the preparation of the Fund’s financial statements, to assess if it is more likely than not that the position would be sustained upon examination, based upon the technical merits of the position. As of March 31, 2011, management has not identified any such position for which a liability must be reflected in the Statement of Assets and Liabilities. The Fund’s tax returns remain subject to examination for three years after filing.
When-Issued and Delayed Delivery Transactions: The Fund may engage in when-issued or delayed delivery transactions. To the extent the Fund engages in such transactions, it will do so for the purpose of acquiring portfolio securities consistent with the Fund’s investment objectives and not for the purpose of investment leverage or to speculate on interest rate and/or market changes. At the time the Fund makes a commitment to purchase a security on a when-issued or delayed delivery basis, the Fund will record the transaction and reflect the value in determining its net asset value. When effecting such transactions, assets of an amount sufficient to make payment for the portfolio securities to be purchased will be segregated on the Fund’s records on the trade date. Securities purchased on a when-issued or delayed delivery basis do not earn interest until the settlement date.
Dividends: Dividends to shareholders, if any, are generally paid quarterly and are reinvested in additional shares of the Fund at net asset value per share at the close of business on the dividend payment date or, at the shareholder’s option, paid in cash. Net realized capital gains, to the extent available, will be distributed at least annually. Distributions to shareholders are based on income tax regulations and therefore, their characteristics may differ for financial statement and tax purposes.
General: Securities transactions are accounted for on a trade date basis. Interest income is accrued as earned and dividend income is recorded on the ex-dividend date. Certain income from foreign securities is recognized as soon as information is available to the Fund. Realized gains and losses from the sale of securities are recorded on an identified cost basis. Net investment income (other than class specific expenses) and realized and unrealized gains and losses are allocated daily to each class of shares based upon the relative net asset value of outstanding shares of each class of shares at the beginning of the day (after adjusting for the current share activity of the respective class). Expenses common to all Funds are allocated among the Funds comprising the Trust based upon their relative net asset values or other appropriate allocation methods.
Guarantees and Indemnifications: Under the Trust’s organizational documents, its officers and Trustees are indemnified against certain liabilities arising out of the performance of their duties to the Fund. Additionally, in the normal course of business the Trust enters into contracts with service providers that contain general indemnification clauses. The Trust’s maximum exposure under these arrangements is unknown. However, based on experience, the Trust expects the risk of loss to be remote.
Use of Estimates: The preparation of financial statements, in conformity with generally accepted accounting principles, requires management to make estimates and assumptions that affect the reported amounts of assets and liabilities and the disclosure of contingent assets and liabilities at the date of the financial statements and the reported amounts of increases and decreases in net assets from operations during the reporting period. Actual results could differ from those estimates.
NOTE 3 – INVESTMENT ADVISORY FEE AND OTHER TRANSACTIONS WITH AFFILIATES
Pursuant to an investment advisory agreement, Thornburg Investment Management, Inc. (the “Advisor”) serves as the investment advisor and performs services to the Fund for which the fees are payable at the end of each month. For the six months ended March 31, 2011, these fees were payable at annual rates ranging from .875 of 1% to .675 of 1% per annum of the average daily net assets of the
Certified Semi-Annual Report 21
NOTES TO FINANCIAL STATEMENTS, CONTINUED
| | |
| Thornburg Core Growth Fund | | March 31, 2011 (Unaudited) |
Fund depending on the Fund’s asset size. The Trust also has entered into administrative services agreements with the Advisor, whereby the Advisor will perform certain administrative services for the shareholders of each class of the Fund’s shares, and for which fees will be payable at an annual rate of up to .125 of 1% per annum of the average daily net assets attributable to each class of shares. For the six months ended March 31, 2011, the Advisor voluntarily or contractually reimbursed certain class specific expenses, administrative fees, and distribution fees of $3,324 for Class A shares, $71,291 for Class I shares, $288,734 for Class R3 shares, $45,586 for Class R4 shares, and $306,298 for Class R5 shares.
The Trust has an underwriting agreement with Thornburg Securities Corporation (the “Distributor,” an affiliate of the Advisor), which acts as the distributor of the Fund’s shares. For the six months ended March 31, 2011, the Distributor has advised the Fund that it earned commissions aggregating $7,690 from the sale of Class A shares, and collected contingent deferred sales charges aggregating $7,511 from redemptions of Class C shares of the Fund.
Pursuant to a service plan under Rule 12b-1 of the Investment Company Act of 1940, the Fund may reimburse to the Advisor an amount not to exceed .25 of 1% per annum of the average daily net assets attributable to each class of shares of the Fund for payments made by the Advisor to securities dealers and other financial institutions to obtain various shareholder and distribution related services. For the six months ended March 31, 2011, there were no 12b-1 service plan fees charged for Class I shares. The Advisor may pay out of its own resources additional expenses for distribution of the Fund’s shares.
The Trust has also adopted distribution plans pursuant to Rule 12b-1, applicable only to the Fund’s Class C and Class R3 shares, under which the Fund compensates the Distributor for services in promoting the sale of Class C and Class R3 shares of the Fund at an annual rate of up to .75 of 1% per annum of the average daily net assets attributable to Class C shares, and an annual rate of up to .25 of 1% per annum of the average daily net assets attributable to Class R3 shares. Total fees incurred by the Distributor for each class of shares of the Fund under their respective Service and Distribution Plans for the six months ended March 31, 2011, are set forth in the Statement of Operations.
The Trust has an agreement with the custodian bank to indirectly pay a portion of the custodian’s fees through credits earned by the Fund’s cash on deposit with the bank. This deposit agreement is an alternative to overnight investments. Custodial fees have been adjusted to reflect amounts that would have been paid without this agreement, with a corresponding adjustment reflected as fees paid indirectly in the Statement of Operations. For the six months ended March 31, 2011, there were no fees paid indirectly.
Certain officers and Trustees of the Trust are also officers and/or directors of the Advisor and Distributor. The compensation of independent Trustees is borne by the Trust.
NOTE 4 – SHARES OF BENEFICIAL INTEREST
At March 31, 2011, there were an unlimited number of shares of beneficial interest authorized. Transactions in shares of beneficial interest were as follows:
| | | | | | | | | | | | | | | | |
| | | Six Months Ended
March 31, 2011 (Unaudited) | | | Year Ended
September 30, 2010 (Audited) | |
| | | Shares | | | Amount | | | Shares | | | Amount | |
Class A Shares | | | | | | | | | | | | | | | | |
Shares sold | | | 915,820 | | | $ | 14,050,508 | | | | 3,895,692 | | | $ | 53,800,051 | |
Shares issued to shareholders in reinvestment of dividends | | | — | | | | — | | | | — | | | | — | |
Shares repurchased | | | (7,361,078 | ) | | | (112,134,738 | ) | | | (14,432,625 | ) | | | (197,604,891 | ) |
Redemption fees received* | | | — | | | | 551 | | | | — | | | | 1,092 | |
| | | | | | | | | | | | | | | | |
| | | | |
Net Increase (Decrease) | | | (6,445,258 | ) | | $ | (98,083,679 | ) | | | (10,536,933 | ) | | $ | (143,803,748 | ) |
| | | | | | | | | | | | | | | | |
22 Certified Semi-Annual Report
NOTES TO FINANCIAL STATEMENTS, CONTINUED
| | |
| Thornburg Core Growth Fund | | March 31, 2011 (Unaudited) |
| | | | | | | | | | | | | | | | |
| | | Six Months Ended
March 31, 2011 (Unaudited) | | | Year Ended
September 30, 2010 (Audited) | |
| | | Shares | | | Amount | | | Shares | | | Amount | |
Class C Shares | | | | | | | | | | | | | | | | |
Shares sold | | | 323,283 | | | $ | 4,629,899 | | | | 1,070,092 | | | $ | 13,715,365 | |
Shares issued to shareholders in reinvestment of dividends | | | — | | | | — | | | | — | | | | — | |
Shares repurchased | | | (3,808,581 | ) | | | (53,538,123 | ) | | | (7,016,592 | ) | | | (88,887,938 | ) |
Redemption fees received* | | | — | | | | 324 | | | | — | | | | 614 | |
| | | | | | | | | | | | | | | | |
| | | | |
Net Increase (Decrease) | | | (3,485,298 | ) | | $ | (48,907,900 | ) | | | (5,946,500 | ) | | $ | (75,171,959 | ) |
| | | | | | | | | | | | | | | | |
| | | | |
Class I Shares | | | | | | | | | | | | | | | | |
Shares sold | | | 1,334,949 | | | $ | 21,311,676 | | | | 3,751,437 | | | $ | 53,348,009 | |
Shares issued to shareholders in reinvestment of dividends | | | — | | | | — | | | | — | | | | — | |
Shares repurchased | | | (4,082,330 | ) | | | (65,165,054 | ) | | | (7,276,584 | ) | | | (102,162,877 | ) |
Redemption fees received* | | | — | | | | 259 | | | | — | | | | 476 | |
| | | | | | | | | | | | | | | | |
| | | | |
Net Increase (Decrease) | | | (2,747,381 | ) | | $ | (43,853,119 | ) | | | (3,525,147 | ) | | $ | (48,814,392 | ) |
| | | | | | | | | | | | | | | | |
| | | | |
Class R3 Shares | | | | | | | | | | | | | | | | |
Shares sold | | | 1,045,250 | | | $ | 16,103,043 | | | | 4,447,347 | | | $ | 61,659,930 | |
Shares issued to shareholders in reinvestment of dividends | | | — | | | | — | | | | — | | | | — | |
Shares repurchased | | | (4,862,081 | ) | | | (74,601,971 | ) | | | (9,529,774 | ) | | | (130,933,778 | ) |
Redemption fees received* | | | — | | | | 317 | | | | — | | | | 609 | |
| | | | | | | | | | | | | | | | |
| | | | |
Net Increase (Decrease) | | | (3,816,831 | ) | | $ | (58,498,611 | ) | | | (5,082,427 | ) | | $ | (69,273,239 | ) |
| | | | | | | | | | | | | | | | |
| | | | |
Class R4 Shares | | | | | | | | | | | | | | | | |
Shares sold | | | 323,698 | | | $ | 5,056,323 | | | | 686,300 | | | $ | 9,351,159 | |
Shares issued to shareholders in reinvestment of dividends | | | — | | | | — | | | | — | | | | — | |
Shares repurchased | | | (1,073,225 | ) | | | (16,206,177 | ) | | | (1,147,030 | ) | | | (15,292,633 | ) |
Redemption fees received* | | | — | | | | 31 | | | | — | | | | 75 | |
| | | | | | | | | | | | | | | | |
| | | | |
Net Increase (Decrease) | | | (749,527 | ) | | $ | (11,149,823 | ) | | | (460,730 | ) | | $ | (5,941,399 | ) |
| | | | | | | | | | | | | | | | |
| | | | |
Class R5 Shares | | | | | | | | | | | | | | | | |
Shares sold | | | 1,276,075 | | | $ | 20,481,458 | | | | 6,078,290 | | | $ | 86,903,397 | |
Shares issued to shareholders reinvestment of dividends | | | — | | | | — | | | | — | | | | — | |
Shares repurchased | | | (7,259,294 | ) | | | (116,053,659 | ) | | | (6,402,491 | ) | | | (90,388,466 | ) |
Redemption fees received* | | | — | | | | 484 | | | | — | | | | 810 | |
| | | | | | | | | | | | | | | | |
| | | | |
Net Increase (Decrease) | | | (5,983,219 | ) | | $ | (95,571,717 | ) | | | (324,201 | ) | | $ | (3,484,259 | ) |
| | | | | | | | | | | | | | | | |
| * | The Fund charges a redemption fee of 1% of the Class A and Class I shares redeemed or exchanged within 30 days of purchase. Redemption fees charged to any class are allocated to all classes upon receipt of payment based on relative net asset values of each class or other appropriate allocation methods. |
Certified Semi-Annual Report 23
NOTES TO FINANCIAL STATEMENTS, CONTINUED
| | |
| Thornburg Core Growth Fund | | March 31, 2011 (Unaudited) |
NOTE 5 – SECURITIES TRANSACTIONS
For the six months ended March 31, 2011, the Fund had purchase and sale transactions of investment securities (excluding short-term investments) of $537,432,320 and $885,796,595, respectively.
NOTE 6 – INCOME TAXES
At March 31, 2011, information on the tax components of capital is as follows:
| | | | |
Cost of investments for tax purposes | | $ | 935,571,894 | |
| | | | |
Gross unrealized appreciation on a tax basis | | $ | 255,639,269 | |
Gross unrealized depreciation on a tax basis | | | (11,571,280 | ) |
| | | | |
Net unrealized appreciation (depreciation) on investments (tax basis) | | $ | 244,067,989 | |
| | | | |
At March 31, 2011, the Fund had deferred tax basis currency losses occurring subsequent to October 31, 2009 of $96,317. For tax purposes, such losses will be reflected in the year ending September 30, 2011.
At March 31, 2011, the Fund had tax basis capital losses, which may be carried forward to offset future capital gains. To the extent such carryforwards are used, capital gain distributions may be reduced to the extent provided by regulations.
Such capital loss carryforwards expire as follows:
| | | | |
2016 | | $ | 10,083,359 | |
2017 | | | 650,071,235 | |
2018 | | | 253,358,410 | |
| | | | |
| |
| | $ | 913,513,004 | |
| | | | |
NOTE 7 – DERIVATIVE FINANCIAL INSTRUMENTS WITH OFF-BALANCE SHEET RISK AND FOREIGN INVESTMENT RISK
The Fund may use a variety of derivative financial instruments to hedge or adjust the risks affecting its investment portfolio or to enhance investment returns. Provisions of FASB Accounting Standards Codification ASC 815-10-50 (“ASC 815”), require certain disclosures. The disclosures are intended to provide users of financial statements with an understanding of the use of derivative instruments by the Fund and how these derivatives affect the financial position, financial performance and cash flows of the Fund. The Fund does not designate any derivative instruments as hedging instruments under ASC 815. During the six months ended March 31, 2011, the Fund did not invest in any derivative financial instruments of the type addressed by ASC 815.
OTHER NOTES
Fund management believes no events have occurred between March 31, 2011 and May 20, 2011, the date of issuance of the financial statements, which require adjustment of, or disclosure in, the accompanying financial statements.
24 Certified Semi-Annual Report
This page intentionally left blank.
Certified Semi-Annual Report 25
FINANCIAL HIGHLIGHTS
Thornburg Core Growth Fund
| | | | | | | | | | | | | | | | | | | | | | | | | | | | | | | | | | | | | | | | | | | | | | | | | | | | | | | | | | | | |
| | | PER SHARE PERFORMANCE (for a share outstanding throughout the period)+ | | | RATIOS TO AVERAGE NET ASSETS | | | SUPPLEMENTAL DATA | |
Unless
Otherwise
Noted,
Periods
are
Fiscal
Years
Ended
Sept. 30, | | Net Asset
Value
Beginning
of
Period | | | Net
Investment
Income
(Loss) | | | Net
Realized
&
Unrealized
Gain (Loss)
on
Investments | | | Total from
Investment
Operations | | | Dividends
from Net
Investment
Income | | | Dividends
from Net
Realized
Gains | | | Total
Dividends | | | Net
Asset
Value
End
of
Period | | | Net
Investment
Income
(Loss)
(%) | | | Expenses,
After
Expense
Reductions
(%) | | | Expenses,
After
Expense
Reductions
and
Net of
Custody
Credits
(%) | | | Expenses,
Before
Expense
Reductions
(%) | | | Total
Return
(%)(a) | | | Portfolio
Turnover
Rate (%) | | | Net Assets
at End of
Period
(Thousands) | |
Class A Shares | | | | | | | | | | | | | | | | | | | | | | | | | | | | | | | | | | | | | | | | | | | | | | | | | | | | | |
2011(b)(c) | | $ | 13.81 | | | | (0.08 | ) | | | 2.58 | | | | 2.50 | | | | — | | | | — | | | | — | | | $ | 16.31 | | | | (1.04 | )(d) | | | 1.47 | (d) | | | 1.47 | (d) | | | 1.47 | (d) | | | 18.10 | | | | 43.87 | | | $ | 335,363 | |
2010(c) | | $ | 13.61 | | | | (0.15 | ) | | | 0.35 | | | | 0.20 | | | | — | | | | — | | | | — | | | $ | 13.81 | | | | (1.09 | ) | | | 1.48 | | | | 1.48 | | | | 1.48 | | | | 1.47 | | | | 75.06 | | | $ | 372,954 | |
2009(c) | | $ | 13.36 | | | | (0.09 | ) | | | 0.34 | | | | 0.25 | | | | — | | | | — | | | | — | | | $ | 13.61 | | | | (0.81 | ) | | | 1.48 | | | | 1.48 | | | | 1.49 | | | | 1.87 | | | | 82.86 | | | $ | 511,065 | |
2008(c) | | $ | 20.72 | | | | (0.10 | ) | | | (7.25 | ) | | | (7.35 | ) | | | — | | | | (0.01 | ) | | | (0.01 | ) | | $ | 13.36 | | | | (0.58 | ) | | | 1.38 | | | | 1.38 | | | | 1.38 | | | | (35.48 | ) | | | 79.73 | | | $ | 738,457 | |
2007(c) | | $ | 16.38 | | | | (0.15 | ) | | | 4.49 | | | | 4.34 | | | | — | | | | — | | | | — | | | $ | 20.72 | | | | (0.78 | ) | | | 1.37 | | | | 1.36 | | | | 1.37 | | | | 26.50 | | | | 82.37 | | | $ | 1,470,020 | |
2006(c) | | $ | 14.21 | | | | (0.13 | ) | | | 2.54 | | | | 2.41 | | | | — | | | | (0.24 | ) | | | (0.24 | ) | | $ | 16.38 | | | | (0.86 | ) | | | 1.48 | | | | 1.46 | | | | 1.48 | | | | 17.20 | | | | 98.00 | | | $ | 502,345 | |
Class C Shares | | | | | | | | | | | | | | | | | | | | | | | | | | | | | | | | | | | | | | | | | | | | | | | | | | | | | |
2011(b) | | $ | 12.75 | | | | (0.13 | ) | | | 2.39 | | | | 2.26 | | | | — | | | | — | | | | — | | | $ | 15.01 | | | | (1.79 | )(d) | | | 2.22 | (d) | | | 2.22 | (d) | | | 2.22 | (d) | | | 17.73 | | | | 43.87 | | | $ | 201,187 | |
2010 | | $ | 12.66 | | | | (0.23 | ) | | | 0.32 | | | | 0.09 | | | | — | | | | — | | | | — | | | $ | 12.75 | | | | (1.84 | ) | | | 2.23 | | | | 2.23 | | | | 2.23 | | | | 0.71 | | | | 75.06 | | | $ | 215,413 | |
2009 | | $ | 12.53 | | | | (0.16 | ) | | | 0.29 | | | | 0.13 | | | | — | | | | — | | | | — | | | $ | 12.66 | | | | (1.59 | ) | | | 2.26 | | | | 2.26 | | | | 2.26 | | | | 1.04 | | | | 82.86 | | | $ | 289,224 | |
2008 | | $ | 19.57 | | | | (0.22 | ) | | | (6.81 | ) | | | (7.03 | ) | | | — | | | | (0.01 | ) | | | (0.01 | ) | | $ | 12.53 | | | | (1.34 | ) | | | 2.13 | | | | 2.13 | | | | 2.13 | | | | (35.93 | ) | | | 79.73 | | | $ | 385,110 | |
2007 | | $ | 15.59 | | | | (0.28 | ) | | | 4.26 | | | | 3.98 | | | | — | | | | — | | | | — | | | $ | 19.57 | | | | (1.53 | ) | | | 2.12 | | | | 2.11 | | | | 2.12 | | | | 25.53 | | | | 82.37 | | | $ | 664,252 | |
2006 | | $ | 13.63 | | | | (0.23 | ) | | | 2.43 | | | | 2.20 | | | | — | | | | (0.24 | ) | | | (0.24 | ) | | $ | 15.59 | | | | (1.63 | ) | | | 2.25 | | | | 2.23 | | | | 2.25 | | | | 16.38 | | | | 98.00 | | | $ | 187,180 | |
Class I Shares | | | | | | | | | | | | | | | | | | | | | | | | | | | | | | | | | | | | | | | | | | | | | | | | | | | | | |
2011(b) | | $ | 14.31 | | | | (0.04 | ) | | | 2.67 | | | | 2.63 | | | | — | | | | — | | | | — | | | $ | 16.94 | | | | (0.55 | )(d) | | | 0.99 | (d) | | | 0.99 | (d) | | | 1.07 | (d) | | | 18.38 | | | | 43.87 | | | $ | 157,244 | |
2010 | | $ | 14.04 | | | | (0.09 | ) | | | 0.36 | | | | 0.27 | | | | — | | | | — | | | | — | | | $ | 14.31 | | | | (0.60 | ) | | | 0.99 | | | | 0.99 | | | | 1.08 | | | | 1.92 | | | | 75.06 | | | $ | 172,126 | |
2009 | | $ | 13.71 | | | | (0.03 | ) | | | 0.36 | | | | 0.33 | | | | — | | | | — | | | | — | | | $ | 14.04 | | | | (0.29 | ) | | | 0.97 | | | | 0.97 | | | | 1.08 | | | | 2.41 | | | | 82.86 | | | $ | 218,300 | |
2008 | | $ | 21.16 | | | | (0.03 | ) | | | (7.41 | ) | | | (7.44 | ) | | | — | | | | (0.01 | ) | | | (0.01 | ) | | $ | 13.71 | | | | (0.17 | ) | | | 0.96 | | | | 0.96 | | | | 0.96 | | | | (35.17 | ) | | | 79.73 | | | $ | 346,497 | |
2007 | | $ | 16.66 | | | | (0.08 | ) | | | 4.58 | | | | 4.50 | | | | — | | | | — | | | | — | | | $ | 21.16 | | | | (0.39 | ) | | | 0.98 | | | | 0.97 | | | | 0.98 | | | | 27.01 | | | | 82.37 | | | $ | 642,143 | |
2006 | | $ | 14.37 | | | | (0.05 | ) | | | 2.58 | | | | 2.53 | | | | — | | | | (0.24 | ) | | | (0.24 | ) | | $ | 16.66 | | | | (0.40 | ) | | | 1.01 | | | | 0.99 | | | | 1.10 | | | | 17.85 | | | | 98.00 | | | $ | 188,422 | |
Class R3 Shares | | | | | | | | | | | | | | | | | | | | | | | | | | | | | | | | | | | | | | | | | | | | | | | | | | | | | |
2011(b) | | $ | 13.82 | | | | (0.08 | ) | | | 2.58 | | | | 2.50 | | | | — | | | | — | | | | — | | | $ | 16.32 | | | | (1.06 | )(d) | | | 1.50 | (d) | | | 1.50 | (d) | | | 1.78 | (d) | | | 18.09 | | | | 43.87 | | | $ | 188,508 | |
2010 | | $ | 13.62 | | | | (0.15 | ) | | | 0.35 | | | | 0.20 | | | | — | | | | — | | | | — | | | $ | 13.82 | | | | (1.11 | ) | | | 1.50 | | | | 1.50 | | | | 1.79 | | | | 1.47 | | | | 75.06 | | | $ | 212,360 | |
2009 | | $ | 13.37 | | | | (0.09 | ) | | | 0.34 | | | | 0.25 | | | | — | | | | — | | | | — | | | $ | 13.62 | | | | (0.84 | ) | | | 1.49 | | | | 1.49 | | | | 1.76 | | | | 1.87 | | | | 82.86 | | | $ | 278,576 | |
2008 | | $ | 20.75 | | | | (0.13 | ) | | | (7.24 | ) | | | (7.37 | ) | | | — | | | | (0.01 | ) | | | (0.01 | ) | | $ | 13.37 | | | | (0.74 | ) | | | 1.50 | | | | 1.50 | | | | 1.72 | | | | (35.53 | ) | | | 79.73 | | | $ | 289,500 | |
2007 | | $ | 16.43 | | | | (0.18 | ) | | | 4.50 | | | | 4.32 | | | | — | | | | — | | | | — | | | $ | 20.75 | | | | (0.91 | ) | | | 1.51 | | | | 1.50 | | | | 1.64 | | | | 26.29 | | | | 82.37 | | | $ | 414,267 | |
2006 | | $ | 14.26 | | | | (0.13 | ) | | | 2.54 | | | | 2.41 | | | | — | | | | (0.24 | ) | | | (0.24 | ) | | $ | 16.43 | | | | (0.90 | ) | | | 1.53 | | | | 1.50 | | | | 1.73 | | | | 17.14 | | | | 98.00 | | | $ | 90,167 | |
Class R4 Shares | | | | | | | | | | | | | | | | | | | | | | | | | | | | | | | | | | | | | | | | | | | | | | | | | | | | | |
2011(b) | | $ | 13.84 | | | | (0.07 | ) | | | 2.58 | | | | 2.51 | | | | — | | | | — | | | | — | | | $ | 16.35 | | | | (0.97 | )(d) | | | 1.40 | (d) | | | 1.40 | (d) | | | 1.86 | (d) | | | 18.14 | | | | 43.87 | | | $ | 17,244 | |
2010 | | $ | 13.63 | | | | (0.14 | ) | | | 0.35 | | | | 0.21 | | | | — | | | | — | | | | — | | | $ | 13.84 | | | | (1.01 | ) | | | 1.40 | | | | 1.40 | | | | 1.73 | | | | 1.54 | | | | 75.06 | | | $ | 24,968 | |
2009 | | $ | 13.37 | | | | (0.08 | ) | | | 0.34 | | | | 0.26 | | | | — | | | | — | | | | — | | | $ | 13.63 | | | | (0.77 | ) | | | 1.40 | | | | 1.40 | | | | 1.83 | | | | 1.94 | | | | 82.86 | | | $ | 30,871 | |
2008 | | $ | 20.73 | | | | (0.13 | ) | | | (7.22 | ) | | | (7.35 | ) | | | — | | | | (0.01 | ) | | | (0.01 | ) | | $ | 13.37 | | | | (0.78 | ) | | | 1.40 | | | | 1.40 | | | | 1.73 | | | | (35.47 | ) | | | 79.73 | | | $ | 21,047 | |
2007(e) | | $ | 18.90 | | | | (0.12 | ) | | | 1.95 | | | | 1.83 | | | | — | | | | — | | | | — | | | $ | 20.73 | | | | (0.93 | )(d) | | | 1.41 | (d) | | | 1.40 | (d) | | | 8.74 | (d)(f) | | | 9.68 | | | | 82.37 | | | $ | 3,508 | |
Class R5 Shares | | | | | | | | | | | | | | | | | | | | | | | | | | | | | | | | | | | | | | | | | | | | | | | | | | | | | |
2011(b) | | $ | 14.30 | | | | (0.04 | ) | | | 2.67 | | | | 2.63 | | | | — | | | | — | | | | — | | | $ | 16.93 | | | | (0.56 | )(d) | | | 0.99 | (d) | | | 0.99 | (d) | | | 1.19 | (d) | | | 18.39 | | | | 43.87 | | | $ | 283,466 | |
2010 | | $ | 14.02 | | | | (0.08 | ) | | | 0.36 | | | | 0.28 | | | | — | | | | — | | | | — | | | $ | 14.30 | | | | (0.60 | ) | | | 0.99 | | | | 0.99 | | | | 1.18 | | | | 2.00 | | | | 75.06 | | | $ | 324,963 | |
2009 | | $ | 13.70 | | | | (0.04 | ) | | | 0.36 | | | | 0.32 | | | | — | | | | — | | | | — | | | $ | 14.02 | | | | (0.34 | ) | | | 0.99 | | | | 0.99 | | | | 1.27 | | | | 2.34 | | | | 82.86 | | | $ | 323,268 | |
2008 | | $ | 21.15 | | | | (0.05 | ) | | | (7.39 | ) | | | (7.44 | ) | | | — | | | | (0.01 | ) | | | (0.01 | ) | | $ | 13.70 | | | | (0.30 | ) | | | 0.99 | | | | 0.99 | | | | 1.18 | | | | (35.19 | ) | | | 79.73 | | | $ | 251,299 | |
2007 | | $ | 16.65 | | | | (0.07 | ) | | | 4.57 | | | | 4.50 | | | | — | | | | — | | | | — | | | $ | 21.15 | | | | (0.37 | ) | | | 0.95 | | | | 0.95 | | | | 0.97 | | | | 27.03 | | | | 82.37 | | | $ | 158,084 | |
2006(g) | | $ | 14.43 | | | | (0.05 | ) | | | 2.51 | | | | 2.46 | | | | — | | | | (0.24 | ) | | | (0.24 | ) | | $ | 16.65 | | | | (0.38 | )(d) | | | 1.01 | (d) | | | 0.99 | (d) | | | 176.54 | (d)(f) | | | 17.29 | | | | 98.00 | | | $ | 45 | |
| (a) | Not annualized for periods less than one year. |
| (b) | Unaudited Six Month Period Ended March 31. |
| (c) | Sales loads are not reflected in computing total return. |
| (e) | Effective date of this class of shares was February 1, 2007. |
| (f) | Due to the size of net assets and fixed expenses, ratios may appear disproportionate. |
| (g) | Effective date of this class of shares was October 3, 2005. |
| + | Based on weighted average shares outstanding. |
See notes to financial statements.
| | |
| 26 Certified Semi-Annual Report | | Certified Semi-Annual Report 27 |
EXPENSE EXAMPLE
| | |
| Thornburg Core Growth Fund | | March 31, 2011 (Unaudited) |
As a shareholder of the Fund, you incur two types of costs:
| | (1) | transaction costs, including |
(a) sales charges (loads) on purchase payments for Class A shares;
(b) a deferred sales charge on redemptions of any part or all of a purchase of $1 million of Class A shares within 12 months of purchase;
(c) a deferred sales charge on redemptions of Class C shares within 12 months of purchase;
(d) a 30-day redemption fee on Class A and Class I shares;
| | (2) | ongoing costs, including management fees; distribution and/or service (12b-1) fees; and other Fund expenses. |
This example is intended to help you understand your ongoing costs (in dollars) of investing in the Fund and to compare these costs with the ongoing costs of investing in other mutual funds.
The example is based on a $1,000 investment beginning on October 1, 2010, and held until March 31, 2011.
ACTUAL EXPENSES
For each class of shares, the first line of the table at right provides information about actual account values and actual expenses. You may use the information in this line, together with the amount you invested, to estimate the expenses that you paid over the period. Simply divide your account value by $1,000 (for example, an $8,600 account value divided by $1,000 = 8.6), then multiply the result by the number in the first line for your class of shares under the heading entitled “Expenses Paid During Period” to estimate the expenses you paid on your account during this period.
HYPOTHETICAL EXAMPLE FOR COMPARISON PURPOSES
For each class of shares, the second line of the table at right provides information about hypothetical account values and hypothetical expenses based on the Fund’s actual expense ratio and an assumed rate of return of 5% per year before expenses, which is not the Fund’s actual return. The hypothetical account values and expenses may not be used to estimate the actual ending account balance or expenses you paid for the period. You may use this information to compare the ongoing costs of investing in the Fund and other funds. To do so, compare this 5% hypothetical example with the 5% hypothetical examples that appear in the shareholder reports of the other funds.
| | | | | | | | | | | | |
| | | Beginning
Account Value
10/1/10 | | | Ending
Account Value
3/31/11 | | | Expenses Paid
During Period†
10/1/10–3/31/11 | |
Class A Shares | | | | | | | | | | | | |
Actual | | $ | 1,000.00 | | | $ | 1,181.00 | | | $ | 8.01 | |
Hypothetical* | | $ | 1,000.00 | | | $ | 1,017.59 | | | $ | 7.41 | |
Class C Shares | | | | | | | | | | | | |
Actual | | $ | 1,000.00 | | | $ | 1,177.30 | | | $ | 12.06 | |
Hypothetical* | | $ | 1,000.00 | | | $ | 1,013.85 | | | $ | 11.16 | |
Class I Shares | | | | | | | | | | | | |
Actual | | $ | 1,000.00 | | | $ | 1,183.80 | | | $ | 5.39 | |
Hypothetical* | | $ | 1,000.00 | | | $ | 1,020.00 | | | $ | 4.98 | |
Class R3 Shares | | | | | | | | | | | | |
Actual | | $ | 1,000.00 | | | $ | 1,180.90 | | | $ | 8.15 | |
Hypothetical* | | $ | 1,000.00 | | | $ | 1,017.46 | | | $ | 7.54 | |
Class R4 Shares | | | | | | | | | | | | |
Actual | | $ | 1,000.00 | | | $ | 1,181.40 | | | $ | 7.60 | |
Hypothetical* | | $ | 1,000.00 | | | $ | 1,017.96 | | | $ | 7.03 | |
Class R5 Shares | | | | | | | | | | | | |
Actual | | $ | 1,000.00 | | | $ | 1,183.90 | | | $ | 5.39 | |
Hypothetical* | | $ | 1,000.00 | | | $ | 1,020.00 | | | $ | 4.99 | |
| † | Expenses are equal to the annualized expense ratio for each class (A: 1.47%; C: 2.22%; I: 0.99%; R3: 1.50%; R4: 1.40%; R5: 0.99%) multiplied by the average account value over the period, multiplied by 182/365 to reflect the one-half year period. |
| * | Hypothetical assumes a rate of return of 5% per year before expenses. |
Please note that the expenses shown in the table are meant to highlight your ongoing costs only and do not reflect any transactional costs, such as sales charges (loads), redemption fees, or exchange fees. Therefore, the second line of the table for each class of shares is useful in comparing ongoing costs only, and will not help you determine the relative total costs of owning different funds. In addition, if these transactional costs were included, your costs would have been higher.
28 Certified Semi-Annual Report
INDEX COMPARISON
| | |
| Thornburg Core Growth Fund | | March 31, 2011 (Unaudited) |
GROWTH OF A HYPOTHETICAL $10,000 INVESTMENT
Thornburg Core Growth Fund versus Russell 3000 Growth Index (December 27, 2000 to March 31, 2011)
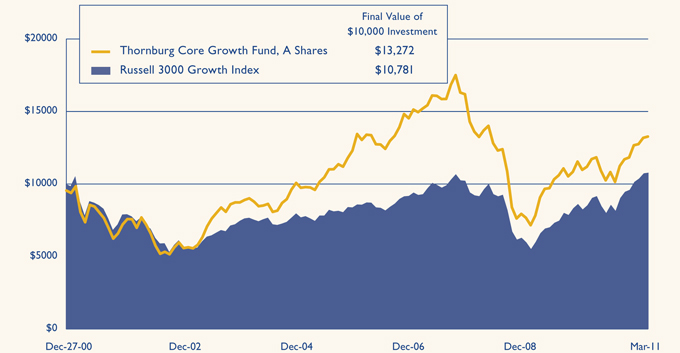
AVERAGE ANNUAL TOTAL RETURNS
For periods ended March 31, 2011 (with sales charge)
| | | | | | | | | | | | |
| | | 1 Yr | | | 5 Yrs | | | Since
Inception | |
A Shares (Incep: 12/27/00) | | | 8.16 | % | | | -1.11 | % | | | 2.80 | % |
C Shares (Incep: 12/27/00) | | | 11.52 | % | | | -0.93 | % | | | 2.43 | % |
I Shares (Incep: 11/1/03) | | | 13.84 | % | | | 0.27 | % | | | 6.42 | % |
R3 Shares (Incep: 7/1/03) | | | 13.33 | % | | | -0.24 | % | | | 7.34 | % |
R4 Shares (Incep: 2/1/07) | | | 13.38 | % | | | — | | | | -3.41 | % |
R5 Shares (Incep: 10/3/05) | | | 13.93 | % | | | 0.27 | % | | | 3.27 | % |
Russell 3000 Growth Index (Since: 12/27/00) | | | 19.24 | % | | | 4.32 | % | | | 0.74 | % |
Performance data shown represents past performance and is no guarantee of future results. Investment return and principal value will fluctuate so shares, when redeemed, may be worth more or less than their original cost. Current performance may be lower or higher than quoted. For performance current to the most recent month end, visit thornburg.com or call 800.847.0200. The performance data and graph do not reflect the deduction of taxes that a shareholder would pay on distributions or the redemption of Fund shares. Returns reflect the reinvestment of dividends and capital gains as well as applicable sales charges. Class A shares are sold with a maximum sales charge of 4.50%. Class C shares are subject to a 1% contingent deferred sales charge (CDSC) for the first year only. There is no up-front sales charge for Class I, R3, R4, and R5 shares. Class A and I shares are subject to a 1% 30-day redemption fee.
Certified Semi-Annual Report 29
OTHER INFORMATION
| | |
| Thornburg Core Growth Fund | | March 31, 2011 (Unaudited) |
PORTFOLIO PROXY VOTING
Policies and Procedures:
The Trust has delegated to Thornburg Investment Management, Inc. (the “Advisor”) voting decisions respecting proxies for the Fund’s voting securities. The Advisor makes voting decisions in accordance with its Proxy Voting Policy and Procedures. A description of the Policy and Procedures is available (i) without charge, upon request, by calling the Advisor toll-free at 1-800-847-0200, (ii) on the Thornburg web site at www.thornburg.com, and (iii) on the Securities and Exchange Commission’s web site at www.sec.gov.
Information regarding how proxies were voted is available on or before August 31 of each year for the twelve months ending the preceding June 30. This information is available (i) without charge, upon request by calling the Advisor toll-free at 1-800-847-0200, (ii) on the Thornburg web site at www.thornburg.com, and (iii) on the Securities and Exchange Commission’s web site at www.sec.gov.
AVAILABILITY OF QUARTERLY PORTFOLIO SCHEDULE
The Fund files with the Securities and Exchange Commission schedules of its portfolio holdings on Form N-Q for the first and third quarters of each fiscal year. The Fund’s Forms N-Q are available on the Commission’s web site at www.sec.gov, or may be reviewed and copied at the Commission’s Public Reference Room in Washington, D.C. Information on the operation of the Public Reference Room may be obtained by calling 1-800-SEC-0330. The Fund also makes this information available on its web site at www.thornburg. com/download or upon request by calling 1-800-847-0200.
30 Certified Semi-Annual Report
Trustees’ Statement to Shareholders
Not part of the Certified Semi-Annual Report
February 8, 2005, as readopted September 13, 2010
The Trustees are concerned that ongoing commentaries and opinions reported in the media may confuse investors in general as to the supervisory duties of trustees of mutual funds and, in particular, leave Thornburg Investment Trust shareholders uncertain regarding how we discharge our responsibilities in supervising the Funds’ investment advisor and in reviewing the advisor’s contract for renewal. We decided to spell out clearly three principal guidelines that we follow in supervising the Trust’s investment advisor on your behalf.
We begin with the premise that each shareholder selected his or her Fund because its investments are managed by the investment advisor identified in the prospectus and in accordance with the objective and policies described in the prospectus. We realize, as each of you do, that if you believe that your Fund’s stated objective and policies no longer serve your personal investment goals, you can sell your shares and leave the Fund.
Therefore, we believe that our primary supervisory task – our principal obligation to you – is to assess the nature and quality of the advisor’s services, and to confirm that the advisor actively and competently pursues the Fund’s objective, in accordance with the policies set out in the prospectus. To do this, we meet regularly with management to review your Fund’s portfolio and to discuss the advisor’s specific actions and judgments in pursuing the Fund’s objective. We do not substitute our own judgment for the advisor’s decisions in selecting investments; the advisor is paid to exercise its informed judgment on investment decisions, and we seek to confirm, in reviewing the advisor’s performance, that the advisor is doing just that.
Second, while we are conscious of costs and the effect that costs have on shareholders’ returns, we do not seek the lowest fees or expense ratio as our sole or primary objective. We try to make sure that your Fund’s fees and costs are reasonable in relationship to the services rendered and that they are generally in line with those charged by other expert investment advisors, consistent with our belief that the Fund’s investors searched for and expect that expertise and attention and have decided to pay a reasonable price for it. We do not put the management contract “out to bid” as a matter of course, and we would not do so unless we had concluded that the advisor materially had failed to pursue the Fund’s objectives in accordance with its policies, or for other equally important reasons. We believe that any other approach would be inconsistent with your interests and contrary to your expectations when you bought shares of the Fund in the first place.
Finally, because we believe that most Thornburg Fund shareholders have invested with a long-term perspective, we try not to focus too much on the fashions of the moment and on short-term performance. The market will not favor any specific investment objective or set of policies at all times and under all economic circumstances. A fund will experience periods of both high and low returns relative to other funds and other investments. Even if one of our Funds is not favored by the market at a particular time, we believe that the advisor is nonetheless obliged to remain true to the Fund’s objective and policies, and we watch to see that it does so.
This page is not part of the Semi-Annual Report. 31
This page intentionally left blank.
32 This page is not part of the Semi-Annual Report.
Retirement and Education Accounts
Thornburg Investment Management offers retirement and education savings accounts that can help you meet a variety of planning challenges. For account applications or further information on any of the accounts below, please call 1-800-847-0200 or go to www.thornburg.com/ira. Your financial advisor can help you determine which plan is right for you.
Individual Retirement Accounts
Individual Retirement Accounts (IRAs) provide a tax-advantaged means to save money for the future. For a detailed outline of the difference between retirement accounts, see www.thornburg.com/ira. Rollovers are available. Call 1-800-847-0200 for more information.
Traditional IRAs – Contributions to Traditional IRAs are tax deductible for eligible individuals, and withdrawals are taxed as additional ordinary income. You may contribute to an IRA if you receive compensation and are under 70 1/2, even if you are covered by an employer retirement plan. Deductible contributions are subject to certain qualifications. Please consult your tax advisor.
Roth IRAs – Under a Roth IRA, there is no tax deduction for contributions, but there is no income tax on qualified withdrawals. For a more detailed comparison of Traditional and Roth IRAs, please see our web site at www.thornburg.com/ira.
SEP IRAs – Simplified Employee Pension (SEP) IRAs are established by employers. The employer is allowed a tax deduction for contributions made to the SEP Plan and makes contributions to each eligible employee’s SEP IRA on a discretionary basis.
SIMPLE IRAs – Savings Incentive Match Plan for Employees of Small Employers (SIMPLE) is designed to give small business owners a simplified method to establish and contribute to a retirement plan for employees. The employer is allowed a tax deduction for contributions and makes either matching or non-elective contributions to each eligible employee’s SIMPLE IRA. Employees may make salary deferral contributions.
Coverdell Education Savings Account
These savings accounts are designed to provide a way to save money for higher education expenses. In an Education Savings Account, earnings and interest grow tax-free, and qualified withdrawals used to pay for eligible higher-education expenses are tax- and penalty-free.
Funds Available
The following funds are available in the accounts listed above:
| | • | | Thornburg International Value Fund |
| | • | | Thornburg Core Growth Fund |
| | • | | Thornburg Investment Income Builder Fund |
| | • | | Thornburg Global Opportunities Fund |
| | • | | Thornburg International Growth Fund |
| | • | | Thornburg Developing World Fund |
| | • | | Thornburg Limited Term U.S. Government Fund |
| | • | | Thornburg Limited Term Income Fund |
| | • | | Thornburg Strategic Income Fund |
This page is not part of the Semi-Annual Report. 33

Thornburg Equity Funds
Thornburg’s equity research uses a fundamental and comprehensive analytical approach. Thornburg equity funds focus on a limited number of securities so that each holding can impact performance. The equity team searches for firms believed to have a promising future and seeks to buy shares of those companies at a discount to their intrinsic value.
| | • | | Thornburg International Value Fund |
| | • | | Thornburg Core Growth Fund |
| | • | | Thornburg Investment Income Builder Fund |
| | • | | Thornburg Global Opportunities Fund |
| | • | | Thornburg International Growth Fund |
| | • | | Thornburg Developing World Fund |
Thornburg Bond Funds
Thornburg Investment Management applies a disciplined philosophy to fixed-income management. Since the launch of our first fixed-income fund over 25 years ago, we have been conducting fundamental, bottom-up research in an effort to identify bonds which we believe provide the best return for a given level of risk. We are very organic in our approach, avoiding leverage or complex strategies which could backfire in periods of market uncertainty.
| | • | | Thornburg Limited Term Municipal Fund |
| | • | | Thornburg Intermediate Municipal Fund |
| | • | | Thornburg California Limited Term Municipal Fund |
| | • | | Thornburg New Mexico Intermediate Municipal Fund |
| | • | | Thornburg New York Intermediate Municipal Fund |
| | • | | Thornburg Strategic Municipal Income Fund |
| | • | | Thornburg Limited Term U.S. Government Fund |
| | • | | Thornburg Limited Term Income Fund |
| | • | | Thornburg Strategic Income Fund |
Before investing, carefully consider the Fund’s investment goals, risks, charges, and expenses. For a prospectus containing this and other information, contact your financial advisor or visit thornburg. com. Read it carefully before investing.
For additional information, please visit www.thornburg.com
Thornburg Investment Management, Inc. 2300 North Ridgetop Road, Santa Fe, NM 87506
This page is not part of the Semi-Annual Report. 35
| | | | | | |
 | | Waste not, Wait not | |  |
| | | | Get instant access to your shareholder reports. |
| | This Semi-Annual Report is submitted for the general information of shareholders of the Fund. It is not authorized for distribution to prospective investors in the Fund unless preceded or accompanied by an effective prospectus. | | By switching from your postal mailbox to your email inbox, you reduce paper clutter, improve record keeping access, and help conserve our natural resources. |
| | Investment Advisor: Thornburg Investment Management® 800.847.0200 Distributor: Thornburg Securities Corporation® 800.847.0200 TH180 | | Go to www.thornburg.com/edelivery and sign up to receive your shareholder reports, prospectuses, and proxy statements electronically. You invest in the future, without spending a dime. |

Important Information
The information presented on the following pages was current as of March 31, 2011. The managers’ views, portfolio holdings, and sector and country diversification are provided for the general information of the Fund’s shareholders; they are historical and subject to change. This material should not be deemed a recommendation to buy or sell any of the securities mentioned.
Investments in the Fund carry risks, including possible loss of principal. Special risks may be associated with investments outside the United States, especially in emerging markets, including currency fluctuations, illiquidity and volatility. Investments in small capitalization companies may increase the risk of greater price fluctuations. Please see the Fund’s Prospectus for a discussion of the risks associated with an investment in the Fund. Investments in the Fund are not FDIC insured, nor are they deposits of or guaranteed by a bank or any other entity. There is no guarantee that the Fund will meet its investment objectives. Funds invested in a limited number of holdings may expose an investor to greater volatility.
Performance data given at net asset value (NAV) does not take into account the applicable sales charges. If the sales charges had been included, the performance would have been lower.
Class I, R3, R4, and R5 shares may not be available to all investors. Minimum investments for Class I shares may be higher than those for other classes.
From time to time, the Fund may invest in shares of companies through initial public offerings (IPOs). IPOs have the potential to produce substantial gains for the Fund. There is no assurance that the Fund will have continued access to profitable IPOs and, as the Fund’s assets grow, the impact of IPO investments may decline. Therefore, investors should not rely on these past gains as an indication of future performance.
Impact to performance of IPOs, as disclosed in the following letter to shareholders, is calculated using the performance on the first day of the IPO, assuming that the acquired shares are held to the end of the first day.
| | | | |
Share Class | | NASDAQ Symbol | | Cusip |
Class A | | TIGAX | | 885-215-319 |
Class C | | TIGCX | | 885-215-293 |
Class I | | TINGX | | 885-215-244 |
Class R3 | | TIGVX | | 885-215-178 |
Class R4 | | TINVX | | 885-215-160 |
Class R5 | | TINFX | | 885-215-152 |
Glossary
MSCI All Country (AC) World ex-U.S. Growth Index – A market capitalization weighted index that includes growth companies in developed and emerging markets throughout the world, excluding the United States.
Unless otherwise noted, index returns reflect the reinvestment of income dividends and capital gains, if any, but do not reflect fees, brokerage commissions or other expenses of investing. Investors may not make direct investments into any index. The performance of any index is not indicative of the performance of any particular investment.
Allocation Effect – The portion of portfolio excess return attributed to taking different group (e.g. sector, industry) decisions from the benchmark.
Basis Point (BPS) – A unit equal to 1/100th of 1%. A 1% change = 100 basis points (bps).
Median Market Capitalization – Market capitalization (market cap) is the total value of a company’s stock, calculated by multiplying the number of outstanding common shares by the current share price. The company whose market cap is in the middle of the portfolio is the median market cap. Half the companies in the portfolio have values greater than the median, and half have values that are less.
Price to Book Value (P/B) – A ratio used to compare a stock’s market value to its book value. It is calculated by dividing the current closing price of the stock by the latest quarter’s book value. Book value is simply assets minus liabilities.
Price to Cash Flow Ratio – A measure of the market’s expectations of a firm’s future financial health. It is calculated by dividing the price per share by cash flow per share.
Price to Earnings Ratio (P/E) – A valuation ratio equaling a company’s market value per share divided by earnings per share.
This page is not part of the Semi-Annual Report. 3
Thornburg International Growth Fund
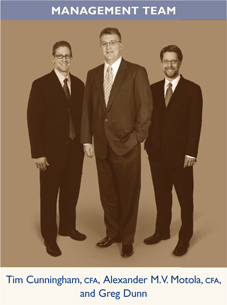
IMPORTANT PERFORMANCE INFORMATION
Performance data shown represents past performance and is no guarantee of future results. Investment return and principal value will fluctuate so shares, when redeemed, may be worth more or less than their original cost. Current performance may be lower or higher than quoted. For performance current to the most recent month end, visit thornburg.com or call 800.847.0200.
The maximum sales charge for Class A shares is 4.50%. Class A shares are subject to a 1% 30-day redemption fee. The total annual operating expenses of Class A shares are 1.70% as disclosed in the most recent Prospectus. Thornburg Investment Management and Thornburg Securities Corporation have contractually agreed to waive fees and reimburse expenses through at least February 1, 2012, so that actual expenses, for Class A shares, do not exceed 1.63%.
Comprehensive International Growth Investing
A major benefit of an interconnected global economy is the ability to tap into a country or region’s comparative advantages. Some countries have abundant natural resources, while others excel at manufacturing or engineering. The ability to allocate capital across borders allows the entire globe to benefit from these advantages. In an effort to capture these opportunities, Thornburg Investment Management launched the Thornburg International Growth Fund in 2007.
The Fund’s process is centered on identifying attractively valued international growth companies from the bottom up. The management team will leave it to others to make broad-based calls on the direction of the market. Instead, portfolio manager Alex Motola and his team will employ a comprehensive, “go-everywhere” approach to growth investing. The team classifies stocks into various growth baskets: Growth Industry Leaders, Consistent Growers, or Emerging Growth Companies. From those baskets, the team will build a portfolio of 30–50 stocks, which they believe provides the best long-term prospects for investors. While stocks are analyzed on their individual merits, their role as part of a diversified portfolio is also taken into account.
Equity investing, especially disciplines focused on growing companies, can bring volatility. The Thornburg International Growth Fund team recognizes this and strives to balance the aims of generating a strong long-term record while attempting to manage downside volatility. Portfolio construction and geographic diversification provide part of the answer, but fundamental analysis can often play a more important role. While other growth funds limit volatility by diversifying across a large number of names, the team managing the Thornburg International Growth Fund believes that a more robust understanding of a smaller
| | | | | | | | | | | | |
| AVERAGE ANNUAL TOTAL RETURNS | |
| FOR PERIODS ENDED 3/31/11 | |
| | | 1 Yr | | | 3 Yrs | | | Since
Inception | |
A Shares (Incep: 2/1/07) | | | | | | | | | | | | |
Without sales charge | | | 24.54 | % | | | 3.12 | % | | | 5.77 | % |
With sales charge | | | 18.99 | % | | | 1.56 | % | | | 4.61 | % |
MSCI AC World ex-U.S. Growth Index | | | | | | | | | | | | |
(Since 2/1/07) | | | 14.73 | % | | | -1.09 | % | | | 1.17 | % |
4 This page is not part of the Semi-Annual Report.
number of portfolio holdings is one of the most effective forms of risk management.
Much of the research process is focused on identifying how the overall market came to price a security. Many of the ideas are sourced through a quantitative screening process of the universe of international companies. Only those with the most appealing growth and valuation characteristics pass on to the step of having a complex financial model built. Thornburg’s growth investment team scours regulatory filings, visits company management, and interviews suppliers and customers. By doing this work, they develop their own view of the intrinsic value of the company. Only if their view is materially higher than the market do they make an investment.
Others may question how the team manages a growth portfolio, especially an international one, from Santa Fe, New Mexico. At Thornburg Investment Management, we embrace our location, away from the ancillary noise of the major money centers. We have access to Wall Street research, but prefer to come to our own conclusions about the value of an investment. The investment process allows the team to take a very broad view of what an attractively valued, international growth company looks like, and invest in those few companies that they believe provide the most attractive risk-reward trade-off. The result is a portfolio which at any given time will look quite unlike the MSCI AC World ex-U.S. Growth Index or the competition. All of this is done with a goal of providing attractive, consistent returns over the long term.
| | |
| STOCKS CONTRIBUTING AND DETRACTING |
| FOR THE SIX MONTHS ENDED 3/31/11 |
| |
Top Contributors | | Top Detractors |
| Infineon Technologies AG | | CPP Group plc |
| SodaStream International Ltd. | | Man Wah Holdings Ltd. |
| Start Today Co. Ltd. | | OGX Petroleo e Gas Participacoes S/A |
| EXFO, Inc. | | Tesco plc |
| Covidien plc | | MercadoLibre, Inc. |
| Source: FactSet | | |
| | | | |
| KEY PORTFOLIO ATTRIBUTES | |
As of 3/31/11 | |
Portfolio P/E Trailing 12-months* | | | 20.5x | |
Portfolio Price to Cash Flow* | | | 13.8x | |
Portfolio Price to Book Value* | | | 3.4x | |
Median Market Cap* | | $ | 3.9 B | |
Number of Companies | | | 48 | |
| |
* Source: FactSet | | | | |
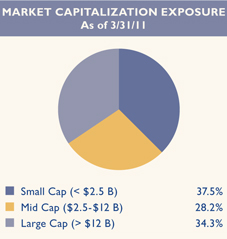
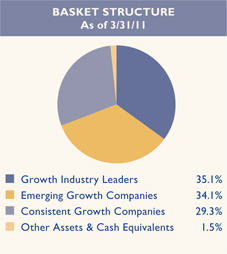
This page is not part of the Semi-Annual Report. 5

Thornburg International Growth Fund
March 31, 2011
This report is certified under the Sarbanes-Oxley Act of 2002, which requires that public companies, including mutual funds, affirm that the information provided in their annual and semiannual shareholder reports fully and fairly represents their financial position.
6 Certified Semi-Annual Report
Letter to Shareholders
| | |

| | April 18, 2011 Dear Fellow Shareholder: For the six months ended March 31, 2011, the Thornburg International Growth Fund generated better performance than its benchmark. The Fund’s Class A shares outperformed its benchmark with a total return of 17.53% (without sales charge) during this period, compared to 10.62% for the MSCI AC World ex-U.S. Growth Index. On September 30, 2010, the net asset value (NAV) for the Class A shares was $12.25. On March 31, 2011, the NAV of the Class A shares was $14.36. |
| | The world continues to recover from the financial crisis of 2008 and there have been significant improvements in both sentiment regarding global stocks as well as earnings power for individual companies. Risk remains omnipresent, but fears of the systematic breakdown of capital markets have abated. As valuations increased, along with stock prices, some of our stocks approached our internally generated price targets. |
| | Abcam plc is an example of our price target discipline. Internally, we referred to Abcam as the “Amazon of Antibodies” as it is one of the largest online suppliers of antibodies and other products used by research scientists. It is a large and fragmented market with strong growth and attractive secular growth drivers. Our interest in Abcam was piqued by its attractive valuation and underestimated growth. Although our original thesis provided for more upside than our final sale, we seek to remain flexible in our ongoing valuation work, often adjusting sales, earnings, and cash flow projections, as well as the multiples we use to capitalize on those estimates. In Abcam’s case, earnings and revenue development over our ownership period was slightly better than we had modeled, but our target multiple on earnings was reduced from 25x to 20x. Why? While good things were happening on a reported basis, we grew increasingly concerned about how the company’s customers were funding their research, with the bulk of that coming from public sources. In a “normal” economic environment, the fact that 80% of revenues came from scientists funded by schools or government would be a positive, because those public sources tend to be less cyclical. By late 2010, it wasn’t clear what the impact of austerity programs would be and we felt the risk to future earnings was increased. Although we reduced our target price, Abcam was still a successful investment, returning in excess of 50% over an eight-month holding period. Absent the risks, we would have liked to own the stock longer and hopefully generate further investment returns. |
| | Over the past twelve months, we added over thirty stocks to the portfolio. Many internationally oriented investors focus on prominent and well-known names, but our approach is more agnostic regarding reputation (within the investor community), leading to high profile names such as CNOOC and Bayer AG, as well as investments far from the beaten path, such as YOOX SpA, Regus plc, and Start Today Co. Ltd. As you consider |
Certified Semi-Annual Report 7
Letter to Shareholders,
Continued
the results over the past year, several metrics are worthy of consideration at the portfolio level. Our “allocation effect” was essentially zero across sectors in aggregate – better in some (financials), worse in others (materials), and our higher cash position was a significant drag to performance as well. The net impact was zero. In stock selection by sector, we moderately underperformed in a couple of areas (industrials, energy, consumer staples), but significantly outperformed in others (consumer discretionary, technology, and health care) and more than made up the difference. Our currency exposure hurt us. The outcome of the various elements of performance was that stock selection explained all of our positive performance, which is encouraging, since our focus is much more on picking stocks than allocating via sectors or predicting currency markets. During the six-month period ended March 31, 2011, IPOs contributed 3.16% to the performance of the Fund.
Top contributors included Infineon Technologies AG, Start Today Co. Ltd, EXFO Inc., Covidien plc, and SodaStream International. Infineon has been a long-term holding, which we found through our research into ON Semiconductor for the Thornburg Core Growth Fund. The company was benefiting from many of the secular trends which were helping ON Semiconductor, but also had additional characteristics that made it interesting as an investment prospect: the potential divestiture of its wireless business and the mispricing of the business as a whole. Without the wireless unit, the core industrial and automotive semiconductor and module business should carry a higher multiple, since those businesses are characterized by long design cycles, consistent margins, and lower volatility. Covidien, in our view, was also seriously mispriced, primarily due to concerns about the company’s pharmaceutical business, which represents a relatively small portion of revenues. As investor attention returned to the core medical devices business, the stock appreciated. EXFO sells equipment to network operators, much of which is used across the spectrum of designing, maintaining, and building networks, including high capacity optical networks and LTE wireless networks (4G). Due to the “hangover” caused by the excessive enthusiasm regarding optical companies at the turn of the century, investors have had little interest in the space. However, over the last decade, there has been a lot of consolidation and many companies have failed, creating an environment of reduced competition and increased profitability – setting the stage for EXFO and its peers.
What did not work? Only three stocks had negative impacts that exceeded 0.25% of total return. We continue to believe that the best way to mitigate risk is to know our investments extremely well and monitor them closely over time. We also frequently re-weight positions to reflect changing risk profiles. While it is clearly easier to avoid absolute return drag in a rising market, we remain very pleased with the small number of stocks that detracted from performance during the past six months.
As mentioned above, the currency impact was slightly negative during the period. The impact tends to vary across different countries and time periods. We manage currency with an eye to the total impact on each position as well as monitoring total exposure to each economic region/currency. In most cases, we are biased towards isolating the return of the stock in U.S. dollar terms, while evaluating issues such as hedging costs, cross currency exposures, and anticipated impact on operating results. Often revenues and costs are in different currencies creating somewhat offsetting effects.
As of March 31, 2011, the portfolio has emerging markets exposure of slightly less than 25%. In many ways, especially in March, more would have been better. Our goal is not to buy the fastest growing companies, but to buy what we believe are the best growth companies, which is obviously more nuanced, as it incorporates not just the growth of the business, but the risks it faces, the competitive dynamics, and valuation. We also use the portfolio
8 Certified Semi-Annual Report
and the basket structure as tools to attempt to reduce risk and create “free lunch” diversification. Of course, our portfolio is not diversified optimally in a “Markowitz” sense, but we consider and worry as much or more about non-statistical correlation as much as statistical correlation. Emerging markets generally do have high levels of growth, but when things are going well in the world, valuations often reflect that. We like investing in high-growth economies but believe selectivity – not excess – is the key to success. Also, in their haste to throw capital into emerging markets, many investors missed great opportunities in “low/no growth” Europe – an area that worked well for us through investments in higher growth European names like Abcam, SuperGroup plc, Asos plc, YOOX SpA, Carphone Warehouse Group plc, and Pandora A/S.
After a long period of holding a cash balance in the Fund that was higher than average, we ended the first calendar quarter of 2011 with 1.5% cash. It is our goal to be fully invested over time, but we prefer to hold cash rather than invest in anything other than great ideas. As mentioned above, we found many names to invest in over the past six months, but this is not always the case. There is always tension between equitizing the portfolio and holding cash. Our long-term target is to hold less than 5% cash, and I would expect our average over time to be at or below that level. A higher cash balance is not a defensive position, nor is it indicative of our view on the markets. We typically invest in a limited number of stocks, and the sale of two or three names can have a very meaningful impact on cash levels.
Our focus, as always, is to maximize long-term, after-tax returns over time. We remain optimistic that regardless of the economic environment, our disciplined, consistent, bottom-up approach to stock research will lead us to attractive growth companies. We encourage you to learn more about your portfolio. Descriptions of each holding and links to company web sites can be found by pointing your Internet browser to www.thornburg.com/funds. Thank you for investing in the Thornburg International Growth Fund.
Sincerely,
|
 |
Alexander M.V. Motola,CFA |
Managing Director |
Portfolio Manager |
The matters discussed in this report may constitute forward-looking statements made pursuant to the safe harbor provisions of the Securities Litigation Reform Act of 1995. These include any advisor or portfolio manager prediction, assessment, analysis or outlook for individual securities, industries, investment styles, market sectors and/or markets. These statements involve risks and uncertainties. In addition to the general risks described for each fund in its current prospectus, other factors bearing on these reports include the accuracy of the advisor’s or portfolio manager’s forecasts and predictions, the appropriateness of the investment strategies designed by the advisor or portfolio manager, and the ability of the advisor or portfolio manager to implement their strategies efficiently and successfully. Any one or more of these factors, as well as other risks affecting the securities markets generally, could cause the actual results of any fund to differ materially as compared to its benchmarks.
Certified Semi-Annual Report 9
| | |
| SCHEDULE OF INVESTMENTS | | |
| |
| Thornburg International Growth Fund | | March 31, 2011 (Unaudited) |
| | | | | | | | | | |
TOP TEN HOLDINGS As of 3/31/11 | |
| | | |
CNOOC Ltd. | | | 3.4 | % | | IG Group Holdings plc | | | 2.9 | % |
UBS AG | | | 3.1 | % | | Check Point Software Technologies Ltd. | | | 2.7 | % |
Covidien plc | | | 3.1 | % | | Teva Pharmaceutical Industries Ltd. ADR | | | 2.6 | % |
Diagnosticos da America SA | | | 3.0 | % | | Compagnie Financiere Richemont SA | | | 2.6 | % |
Tesco plc | | | 3.0 | % | | Regus plc | | | 2.6 | % |
|
SUMMARY OF INDUSTRY EXPOSURE As of 3/31/11 | |
| | | |
Software & Services | | | 13.3 | % | | Telecommunication Services | | | 4.6 | % |
Retailing | | | 11.9 | % | | Technology Hardware & Equipment | | | 4.3 | % |
Energy | | | 9.6 | % | | Consumer Services | | | 3.6 | % |
Health Care Equipment & Services | | | 9.4 | % | | Food, Beverage & Tobacco | | | 3.4 | % |
Commercial & Professional Services | | | 8.4 | % | | Transportation | | | 2.3 | % |
Pharmaceuticals, Biotechnology & Life Sciences | | | 6.7 | % | | Media | | | 2.2 | % |
Diversified Financials | | | 6.1 | % | | Semiconductors & Semiconductor Equipment | | | 2.1 | % |
Food & Staples Retailing | | | 5.3 | % | | Other Assets & Cash Equivalents | | | 1.5 | % |
Consumer Durables & Apparel | | | 5.3 | % | | | | | | |
|
SUMMARY OF COUNTRY EXPOSURE As of 3/31/11 (percent of equity holdings) | |
| | | |
United Kingdom | | | 20.3 | % | | Greece | | | 2.5 | % |
China | | | 8.5 | % | | France | | | 2.4 | % |
Japan | | | 7.2 | % | | Denmark | | | 2.4 | % |
Switzerland | | | 5.9 | % | | Costa Rica | | | 2.3 | % |
Ireland | | | 5.7 | % | | South Korea | | | 2.3 | % |
Israel | | | 5.4 | % | | Mexico | | | 2.3 | % |
Canada | | | 5.3 | % | | Australia | | | 2.1 | % |
United States | | | 5.1 | % | | Spain | | | 1.9 | % |
Germany | | | 4.3 | % | | Taiwan | | | 1.8 | % |
Brazil | | | 4.1 | % | | Italy | | | 1.7 | % |
Luxembourg | | | 2.6 | % | | Singapore | | | 0.8 | % |
South Africa | | | 2.6 | % | | Hong Kong | | | 0.5 | % |
10 Certified Semi-Annual Report
| | |
| SCHEDULE OF INVESTMENTS, CONTINUED | | |
| |
| Thornburg International Growth Fund | | March 31, 2011 (Unaudited) |
| | | | | | | | |
| | | Shares/
Principal Amount | | | Value | |
COMMON STOCK — 98.51% | | | | | | | | |
COMMERCIAL & PROFESSIONAL SERVICES — 8.42% | | | | | | | | |
COMMERCIAL SERVICES & SUPPLIES — 3.94% | | | | | | | | |
CPP Group plc | | | 875,379 | | | $ | 2,162,595 | |
Regus plc | | | 2,193,700 | | | | 4,043,482 | |
PROFESSIONAL SERVICES — 4.48% | | | | | | | | |
Experian plc | | | 311,800 | | | | 3,861,462 | |
Seek Ltd. | | | 455,065 | | | | 3,181,907 | |
| | | | | | | | |
| | | | | | | 13,249,446 | |
| | | | | | | | |
CONSUMER DURABLES & APPAREL — 5.26% | | | | | | | | |
HOUSEHOLD DURABLES — 0.29% | | | | | | | | |
Man Wah Holdings Ltd. | | | 344,663 | | | | 445,753 | |
TEXTILES, APPAREL & LUXURY GOODS — 4.97% | | | | | | | | |
Compagnie Financiere Richemont SA | | | 71,900 | | | | 4,152,744 | |
Pandora A/S | | | 71,900 | | | | 3,669,343 | |
| | | | | | | | |
| | | | | | | 8,267,840 | |
| | | | | | | | |
CONSUMER SERVICES — 3.65% | | | | | | | | |
HOTELS, RESTAURANTS & LEISURE — 3.65% | | | | | | | | |
a 7 Days Group Holdings Ltd. ADR | | | 118,583 | | | | 2,404,863 | |
a Genting Singapore plc | | | 750,000 | | | | 1,219,754 | |
a Las Vegas Sands Corp. | | | 30,200 | | | | 1,275,044 | |
a Wynn Macau Ltd. | | | 298,400 | | | | 834,372 | |
| | | | | | | | |
| | | | | | | 5,734,033 | |
| | | | | | | | |
DIVERSIFIED FINANCIALS — 6.08% | | | | | | | | |
CAPITAL MARKETS — 3.15% | | | | | | | | |
a UBS AG | | | 276,000 | | | | 4,952,074 | |
DIVERSIFIED FINANCIAL SERVICES — 2.93% | | | | | | | | |
IG Group Holdings plc | | | 630,600 | | | | 4,619,002 | |
| | | | | | | | |
| | | | | | | 9,571,076 | |
| | | | | | | | |
ENERGY — 9.63% | | | | | | | | |
OIL, GAS & CONSUMABLE FUELS — 9.63% | | | | | | | | |
a Bankers Petroleum Ltd. | | | 265,300 | | | | 2,380,722 | |
Canadian Natural Resources Ltd. | | | 50,500 | | | | 2,497,133 | |
Cenovus Energy, Inc. | | | 84,900 | | | | 3,353,966 | |
CNOOC Ltd. | | | 2,121,000 | | | | 5,355,296 | |
a OGX Petroleo e Gas Participacoes SA | | | 130,100 | | | | 1,565,838 | |
| | | | | | | | |
| | | | | | | 15,152,955 | |
| | | | | | | | |
FOOD & STAPLES RETAILING — 5.34% | | | | | | | | |
FOOD & STAPLES RETAILING — 5.34% | | | | | | | | |
PriceSmart, Inc. | | | 99,500 | | | | 3,645,680 | |
Tesco plc | | | 777,200 | | | | 4,750,245 | |
| | | | | | | | |
| | | | | | | 8,395,925 | |
| | | | | | | | |
Certified Semi-Annual Report 11
| | |
| SCHEDULE OF INVESTMENTS, CONTINUED | | |
| |
| Thornburg International Growth Fund | | March 31, 2011 (Unaudited) |
| | | | | | | | |
| | | Shares/
Principal Amount | | | Value | |
FOOD, BEVERAGE & TOBACCO — 3.38% | | | | | | | | |
BEVERAGES — 3.38% | | | | | | | | |
Coca-Cola Hellenic Bottling Co. S.A. | | | 142,321 | | | $ | 3,822,163 | |
Remy Cointreau SA | | | 19,900 | | | | 1,498,668 | |
| | | | | | | | |
| | | | | | | 5,320,831 | |
| | | | | | | | |
HEALTH CARE EQUIPMENT & SERVICES — 9.42% | | | | | | | | |
HEALTH CARE EQUIPMENT & SUPPLIES — 4.91% | | | | | | | | |
Covidien plc | | | 95,000 | | | | 4,934,300 | |
St. Shine Optical Co. Ltd. | | | 227,356 | | | | 2,798,798 | |
HEALTH CARE PROVIDERS & SERVICES — 4.51% | | | | | | | | |
Diagnosticos da America SA | | | 372,200 | | | | 4,787,432 | |
Orpea | | | 47,100 | | | | 2,301,543 | |
| | | | | | | | |
| | | | | | | 14,822,073 | |
| | | | | | | | |
MEDIA — 2.18% | | | | | | | | |
MEDIA — 2.18% | | | | | | | | |
a Kabel Deutschland Holding AG | | | 64,700 | | | | 3,429,311 | |
| | | | | | | | |
| | | | | | | 3,429,311 | |
| | | | | | | | |
PHARMACEUTICALS, BIOTECHNOLOGY & LIFE SCIENCES — 6.74% | | | | | | | | |
BIOTECHNOLOGY — 1.84% | | | | | | | | |
Grifols SA | | | 165,683 | | | | 2,888,112 | |
PHARMACEUTICALS — 4.90% | | | | | | | | |
a Genomma Lab Internacional SA | | | 1,566,400 | | | | 3,542,506 | |
Teva Pharmaceutical Industries Ltd. ADR | | | 83,000 | | | | 4,164,110 | |
| | | | | | | | |
| | | | | | | 10,594,728 | |
| | | | | | | | |
RETAILING — 11.90% | | | | | | | | |
INTERNET & CATALOG RETAIL — 5.00% | | | | | | | | |
a ASOS plc | | | 60,200 | | | | 1,649,463 | |
Start Today Co. Ltd. | | | 234,500 | | | | 3,628,294 | |
a YOOX S.p.A | | | 186,050 | | | | 2,583,966 | |
MULTILINE RETAIL — 2.52% | | | | | | | | |
Clicks Group Ltd. | | | 631,500 | | | | 3,972,895 | |
SPECIALTY RETAIL — 4.38% | | | | | | | | |
a Carphone Warehouse Group plc | | | 666,300 | | | | 3,890,716 | |
a SuperGroup plc | | | 128,115 | | | | 2,996,510 | |
| | | | | | | | |
| | | | | | | 18,721,844 | |
| | | | | | | | |
SEMICONDUCTORS & SEMICONDUCTOR EQUIPMENT — 2.09% | | | | | | | | |
SEMICONDUCTORS & SEMICONDUCTOR EQUIPMENT — 2.09% | | | | | | | | |
a Infineon Technologies AG | | | 320,600 | | | | 3,287,252 | |
| | | | | | | | |
| | | | | | | 3,287,252 | |
| | | | | | | | |
SOFTWARE & SERVICES — 13.24% | | | | | | | | |
INFORMATION TECHNOLOGY SERVICES — 2.48% | | | | | | | | |
a Amdocs Ltd. | | | 135,039 | | | | 3,895,875 | |
INTERNET SOFTWARE & SERVICES — 6.07% | | | | | | | | |
Kakaku.com, Inc. | | | 670 | | | | 3,733,410 | |
a Qihoo 360 Technologies Co. Ltd. ADR | | | 61,100 | | | | 1,807,949 | |
a Telecity Group plc | | | 492,480 | | | | 4,017,333 | |
12 Certified Semi-Annual Report
| | |
| SCHEDULE OF INVESTMENTS, CONTINUED | | |
| |
| Thornburg International Growth Fund | | March 31, 2011 (Unaudited) |
| | | | | | | | |
| | | Shares/
Principal Amount | | | Value | |
SOFTWARE — 4.69% | | | | | | | | |
a AutoNavi Holdings Ltd. ADR | | | 179,300 | | | $ | 3,175,403 | |
a Check Point Software Technologies Ltd. | | | 82,300 | | | | 4,201,415 | |
| | | | | | | | |
| | | | | | | 20,831,385 | |
| | | | | | | | |
TECHNOLOGY HARDWARE & EQUIPMENT — 4.25% | | | | | | | | |
COMMUNICATIONS EQUIPMENT — 4.25% | | | | | | | | |
a EXFO, Inc. | | | 346,035 | | | | 3,782,163 | |
Qualcomm, Inc. | | | 53,000 | | | | 2,905,990 | |
| | | | | | | | |
| | | | | | | 6,688,153 | |
| | | | | | | | |
TELECOMMUNICATION SERVICES — 4.62% | | | | | | | | |
WIRELESS TELECOMMUNICATION SERVICES — 4.62% | | | | | | | | |
KDDI Corp. | | | 620 | | | | 3,838,663 | |
Vodafone Group plc | | | 1,212,400 | | | | 3,432,803 | |
| | | | | | | | |
| | | | | | | 7,271,466 | |
| | | | | | | | |
TRANSPORTATION — 2.31% | | | | | | | | |
AIR FREIGHT & LOGISTICS — 2.31% | | | | | | | | |
Glovis Co. Ltd. | | | 25,600 | | | | 3,640,640 | |
| | | | | | | | |
| | | | | | | 3,640,640 | |
| | | | | | | | |
TOTAL COMMON STOCK (Cost $134,092,001) | | | | | | | 154,978,958 | |
| | | | | | | | |
| | |
TOTAL INVESTMENTS — 98.51% (Cost $134,092,001) | | | | | | $ | 154,978,958 | |
| | |
OTHER ASSETS LESS LIABILITIES — 1.49% | | | | | | | 2,348,932 | |
| | | | | | | | |
| | |
NET ASSETS — 100.00% | | | | | | $ | 157,327,890 | |
| | | | | | | | |
Footnote Legend
Portfolio Abbreviations
To simplify the listings of securities, abbreviations are used per the table below:
| | |
| ADR | | American Depository Receipt |
See notes to financial statements.
Certified Semi-Annual Report 13
| | |
| STATEMENT OF ASSETS AND LIABILITIES | | |
| |
| Thornburg International Growth Fund | | March 31, 2011 (Unaudited) |
| | | | |
ASSETS | | | | |
Investments at value (cost $134,092,001) (Note 2) | | $ | 154,978,958 | |
Cash denominated in foreign currency (cost $3,974,212) | | | 3,392,672 | |
Receivable for investments sold | | | 2,509,726 | |
Receivable for fund shares sold | | | 672,495 | |
Unrealized appreciation on forward currency contracts (Note 7) | | | 255,343 | |
Dividends receivable | | | 188,919 | |
Dividend and interest reclaim receivable | | | 21,260 | |
Prepaid expenses and other assets | | | 71,226 | |
| | | | |
Total Assets | | | 162,090,599 | |
| | | | |
| |
LIABILITIES | | | | |
Payable for securities purchased | | | 4,193,822 | |
Payable for fund shares redeemed | | | 153,061 | |
Unrealized depreciation on forward currency contracts (Note 7) | | | 213,331 | |
Payable to investment advisor and other affiliates (Note 3) | | | 154,408 | |
Accounts payable and accrued expenses | | | 48,087 | |
| | | | |
Total Liabilities | | | 4,762,709 | |
| | | | |
NET ASSETS | | $ | 157,327,890 | |
| | | | |
NET ASSETS CONSIST OF: | | | | |
Distribution in excess of net investment income | | $ | (704,377 | ) |
Net unrealized appreciation on investments | | | 21,003,318 | |
Accumulated net realized gain (loss) | | | (24,416,399 | ) |
Net capital paid in on shares of beneficial interest | | | 161,445,348 | |
| | | | |
| | $ | 157,327,890 | |
| | | | |
14 Certified Semi-Annual Report
| | |
| STATEMENT OF ASSETS AND LIABILITIES, CONTINUED |
| |
| Thornburg International Growth Fund | | March 31, 2011 (Unaudited) |
| | | | |
NET ASSET VALUE: | | | | |
Class A Shares: | | | | |
Net asset value and redemption price per share ($61,714,260 applicable to 4,297,297 shares of beneficial interest outstanding - Note 4) | | $ | 14.36 | |
| |
Maximum sales charge, 4.50% of offering price | | | 0.68 | |
| | | | |
| |
Maximum offering price per share | | $ | 15.04 | |
| | | | |
| |
Class C Shares: | | | | |
Net asset value and offering price per share * ($32,554,046 applicable to 2,283,095 shares of beneficial interest outstanding - Note 4) | | $ | 14.26 | |
| | | | |
| |
Class I Shares: | | | | |
Net asset value, offering and redemption price per share ($61,358,085 applicable to 4,229,485 shares of beneficial interest outstanding - Note 4) | | $ | 14.51 | |
| | | | |
| |
Class R3 Shares: | | | | |
Net asset value, offering and redemption price per share ($1,414,760 applicable to 98,785 shares of beneficial interest outstanding - Note 4) | | $ | 14.32 | |
| | | | |
| |
Class R4 Shares: | | | | |
Net asset value, offering and redemption price per share ($85,880 applicable to 6,017 shares of beneficial interest outstanding - Note 4) | | $ | 14.27 | |
| | | | |
| |
Class R5 Shares: | | | | |
Net asset value, offering and redemption price per share ($200,859 applicable to 13,816 shares of beneficial interest outstanding - Note 4) | | $ | 14.54 | |
| | | | |
| * | Redemption price per share is equal to net asset value less any applicable contingent deferred sales charge. |
See notes to financial statements.
Certified Semi-Annual Report 15
| | |
| STATEMENT OF OPERATIONS | | |
| |
| Thornburg International Growth Fund | | Six Months Ended March 31, 2011 (Unaudited) |
| | | | |
INVESTMENT INCOME: | | | | |
Dividend income (net of foreign taxes withheld of $23,560) | | $ | 510,300 | |
Interest income | | | 7,824 | |
| | | | |
Total Income | | | 518,124 | |
| | | | |
| |
EXPENSES: | | | | |
Investment advisory fees (Note 3) | | | 567,692 | |
Administration fees (Note 3) | | | | |
Class A Shares | | | 30,521 | |
Class C Shares | | | 18,307 | |
Class I Shares | | | 12,550 | |
Class R3 Shares | | | 773 | |
Class R4 Shares | | | 5 | |
Class R5 Shares | | | 47 | |
Distribution and service fees (Note 3) | | | | |
Class A Shares | | | 61,950 | |
Class C Shares | | | 146,428 | |
Class R3 Shares | | | 3,104 | |
Class R4 Shares | | | 11 | |
Transfer agent fees | | | | |
Class A Shares | | | 21,078 | |
Class C Shares | | | 17,441 | |
Class I Shares | | | 7,411 | |
Class R3 Shares | | | 1,576 | |
Class R4 Shares | | | 577 | |
Class R5 Shares | | | 583 | |
Registration and filing fees | | | | |
Class A Shares | | | 11,524 | |
Class C Shares | | | 11,114 | |
Class I Shares | | | 11,340 | |
Class R3 Shares | | | 9,495 | |
Class R4 Shares | | | 9,495 | |
Class R5 Shares | | | 9,495 | |
Custodian fees (Note 3) | | | 63,210 | |
Professional fees | | | 22,891 | |
Accounting fees | | | 1,477 | |
Trustee fees | | | 1,369 | |
Other expenses | | | 11,965 | |
| | | | |
Total Expenses | | | 1,053,429 | |
Less: | | | | |
Expenses reimbursed by investment advisor (Note 3) | | | (63,294 | ) |
Investment advisory fees waived by investment advisor (Note 3) | | | (21,693 | ) |
Fees paid indirectly (Note 3) | | | (1,554 | ) |
| | | | |
Net Expenses | | | 966,888 | |
| | | | |
Net Investment Loss | | $ | (448,764 | ) |
| | | | |
16 Certified Semi-Annual Report
| | |
| STATEMENT OF OPERATIONS, CONTINUED | | |
| |
| Thornburg International Growth Fund | | Six Months Ended March 31, 2011 (Unaudited) |
| | | | |
REALIZED AND UNREALIZED GAIN (LOSS) | | | | |
Net realized gain (loss) from: | | | | |
Investments | | $ | 12,983,863 | |
Forward currency contracts (Note 7) | | | (2,330,026 | ) |
Foreign currency transactions | | | 203,487 | |
| | | | |
| | | 10,857,324 | |
| | | | |
Net change in unrealized appreciation (depreciation) on: | | | | |
Investments | | | 7,118,236 | |
Forward currency contracts (Note 7) | | | 1,557,212 | |
Foreign currency translations | | | (31,405 | ) |
| | | | |
| | | 8,644,043 | |
| | | | |
Net Realized and Unrealized Gain | | | 19,501,367 | |
| | | | |
Net Increase in Net Assets Resulting from Operations | | $ | 19,052,603 | |
| | | | |
See notes to financial statements.
Certified Semi-Annual Report 17
STATEMENTS OF CHANGES IN NET ASSETS
Thornburg International Growth Fund
| | | | | | | | |
| | | Six Months Ended
March 31, 2011* | | | Year Ended
September 30, 2010 | |
INCREASE (DECREASE) IN NET ASSETS FROM | | | | | | | | |
| | |
OPERATIONS: | | | | | | | | |
Net investment income (loss) | | $ | (448,764 | ) | | $ | (11,261 | ) |
Net realized gain (loss) on investments, forward currency contracts and foreign currency transactions | | | 10,857,324 | | | | 6,318,159 | |
Increase (Decrease) in unrealized appreciation (depreciation) on investments, forward currency contracts and foreign currency translations | | | 8,644,043 | | | | 7,914,881 | |
| | | | | | | | |
| | |
Net Increase (Decrease) in Net Assets Resulting from Operations | | | 19,052,603 | | | | 14,221,779 | |
| | |
DIVIDENDS TO SHAREHOLDERS: | | | | | | | | |
From net investment income | | | | | | | | |
Class A Shares | | | (125,932 | ) | | | (129,435 | ) |
Class I Shares | | | (269,792 | ) | | | (222,424 | ) |
Class R3 Shares | | | (3,181 | ) | | | (4,168 | ) |
Class R4 Shares | | | (10 | ) | | | (16 | ) |
Class R5 Shares | | | (991 | ) | | | (83 | ) |
| | |
FUND SHARE TRANSACTIONS (NOTE 4): | | | | | | | | |
Class A Shares | | | 18,290,643 | | | | 7,623,208 | |
Class C Shares | | | 3,365,534 | | | | 1,984,070 | |
Class I Shares | | | 15,008,617 | | | | 9,475,126 | |
Class R3 Shares | | | 134,332 | | | | 200,963 | |
Class R4 Shares | | | 82,279 | | | | 19 | |
Class R5 Shares | | | 436 | | | | 324,084 | |
| | | | | | | | |
| | |
Net Increase in Net Assets | | | 55,534,538 | | | | 33,473,123 | |
| | |
NET ASSETS: | | | | | | | | |
Beginning of Period | | | 101,793,352 | | | | 68,320,229 | |
| | | | | | | | |
| | |
End of Period | | $ | 157,327,890 | | | $ | 101,793,352 | |
| | | | | | | | |
| | |
Undistributed net investment income | | $ | — | | | $ | 144,293 | |
See notes to financial statements.
18 Certified Semi-Annual Report
| | |
| NOTES TO FINANCIAL STATEMENTS | | |
| |
| Thornburg International Growth Fund | | March 31, 2011 (Unaudited) |
NOTE 1 – ORGANIZATION
Thornburg International Growth Fund, hereinafter referred to as the “Fund,” is a diversified series of Thornburg Investment Trust (the “Trust”). The Fund commenced operations on February 1, 2007. The Trust was organized as a Massachusetts business trust under a Declaration of Trust dated June 3, 1987 and is registered as a diversified, open-end management investment company under the Investment Company Act of 1940, as amended. The Fund is currently one of sixteen separate series of the Trust. Each series is considered to be a separate entity for financial reporting and tax purposes and bears expenses directly attributable to it. The Fund seeks long-term capital appreciation by investing in equity securities selected for their growth potential.
The Fund currently offers six classes of shares of beneficial interest: Class A, Class C, Institutional Class (Class I), and Retirement Classes (Class R3, Class R4, and Class R5). Each class of shares of the Fund represents an interest in the same portfolio of investments, except that (i) Class A shares are sold subject to a front-end sales charge collected at the time the shares are purchased and bear a service fee, (ii) Class C shares are sold at net asset value without a sales charge at the time of purchase, but are subject to a contingent deferred sales charge upon redemption within one year of purchase, and bear both a service fee and a distribution fee, (iii) Class I shares are sold at net asset value without a sales charge at the time of purchase, (iv) Class R3 shares are sold at net asset value without a sales charge at the time of purchase, but bear both a service fee and distribution fee, (v) Class R4 shares are sold at net asset value without a sales charge at the time of purchase, but bear a service fee, (vi) Class R5 shares are sold at net asset value without a sales charge at the time of purchase, and (vii) the respective classes may have different reinvestment privileges and conversion rights. Additionally, the Fund may allocate among its classes certain expenses, to the extent allowable to specific classes, including transfer agent fees, government registration fees, certain printing and postage costs, and administrative and legal expenses. Currently, class specific expenses of the Fund are limited to service and distribution fees, administration fees, and certain registration and transfer agent expenses.
NOTE 2 – SIGNIFICANT ACCOUNTING POLICIES
Significant accounting policies of the Trust are as follows:
Valuation of Investments: Portfolio securities listed or traded on a national securities exchange are valued on the valuation date at the last reported sale price on the exchange that is the primary market for the security. Portfolio securities traded on an exchange for which there has been no sale that day and other equity securities traded in the over-the-counter market are valued at the mean between the last reported bid and asked prices. Portfolio securities reported by NASDAQ are valued at the NASDAQ official closing price. Any foreign security traded on exchanges outside the United States is valued at the price of the security on the exchange that is normally the security’s primary market, as of the close of that exchange preceding the time of the Fund’s valuation.
Debt obligations held by the Fund have a primary market over the counter and are valued by an independent pricing service approved by the Trustees of the Trust. The pricing service ordinarily values debt obligations at quoted bid prices. When quotations are not available, debt obligations held by the Fund are valued at evaluated prices determined by the pricing service using methods which include consideration of yields or prices of debt obligations of comparable quality, type of issue, coupon, maturity and rating, and indications as to value from dealers and general market conditions. Short-term obligations having remaining maturities of 60 days or less are ordinarily valued at amortized cost, which approximates market value.
Quotations in foreign currencies for foreign portfolio investments are converted to U.S. dollar equivalents using the foreign exchange quotation in effect at the time of valuation.
In any case where the market value of an equity security held by the Fund is not readily available, the Trust’s valuation and pricing committee determines a fair value for the security using procedures approved by the Trustees, which may include the use of a price obtained from an independent pricing service. The pricing service ordinarily values equity securities in these instances using multi-factor models to adjust market prices based upon various inputs, including exchange data, depository receipt prices, futures and index data and other data. A security’s market value is deemed not readily available whenever the exchange or market on which the security is primarily traded is closed for the entire scheduled day of trading. Additionally, a security’s market value may be deemed not readily available under other circumstances identified by the Trustees, including when developments occurring after the most recent close of the security’s primary exchange or market, but before the most recent close of trading in Fund shares, create a serious question about the reliability of the security’s market value.
Certified Semi-Annual Report 19
| | |
| NOTES TO FINANCIAL STATEMENTS, CONTINUED | | |
| |
| Thornburg International Growth Fund | | March 31, 2011 (Unaudited) |
In any case where a pricing service fails to provide a price for a debt obligation held by the Fund, the valuation and pricing committee determines a fair value for the debt obligation using procedures approved by the Trustees. Additionally, in any case where management believes that a price provided by a pricing service for a debt obligation held by the Fund may be unreliable, the valuation and pricing committee decides whether or not to use the pricing service’s valuation or to determine a fair value for the debt obligation.
In determining fair value for any portfolio security or other investment, the valuation and pricing committee seeks to determine the amount that an owner of the investment might reasonably expect to receive upon a sale of the investment. However, because fair value prices are estimated prices, the valuation and pricing committee’s determination of fair value for an investment may differ from the value that would be realized by the Fund upon a sale of the investment, and that difference could be material to the Fund’s financial statements. The valuation and pricing committee’s determination of fair value for an investment may also differ from the prices obtained by other persons (including other mutual funds) for the investment.
Valuation Measurements: Various inputs are used in determining the value of the Fund’s investments. These inputs are summarized in the three levels listed below.
Level 1: Quoted prices in active markets for identical investments.
Level 2: Other significant observable inputs (including quoted prices for similar investments, interest rates, prepayment rates, credit risk, etc.).
Level 3: Significant unobservable inputs (including the Fund’s own assumptions in determining the fair value of investments).
The following table displays a summary of the inputs used to value the Fund’s net assets as of March 31, 2011. In any instance when valuation inputs from more than one level are used to determine the fair value of a specific investment, the investment is placed in the level of the table based upon the lowest level input that is significant in determining the fair value of the investment:
| | | | | | | | | | | | | | | | |
| | | Fair Value Measurements at March 31, 2011 | |
| | | Total | | | Level 1 | | | Level 2 | | | Level 3 | |
Assets | | | | | | | | | | | | | | | | |
Investments in Securities* | | | | | | | | | | | | | | | | |
Common Stock | | $ | 154,978,958 | | | $ | 154,978,958 | | | $ | — | | | $ | — | |
| | | | | | | | | | | | | | | | |
Total Investments in Securities | | $ | 154,978,958 | | | $ | 154,978,958 | | | $ | — | | | $ | — | |
| | | | |
Other Financial Instruments** | | | | | | | | | | | | | | | | |
Forward Currency Contracts | | $ | 255,343 | | | $ | — | | | $ | 255,343 | | | $ | — | |
Spot Currency | | $ | 15,388 | | | $ | 15,388 | | | $ | — | | | $ | — | |
| | | | |
Liabilities | | | | | | | | | | | | | | | | |
Other Financial Instruments** | | | | | | | | | | | | | | | | |
Forward Currency Contracts | | $ | (213,331 | ) | | $ | — | | | $ | (213,331 | ) | | $ | — | |
| * | See Schedule of Investments for a summary of the industry exposure as grouped according to the Global Industry Classification Standard (GICS), which is an industry taxonomy developed by MSCI Barra and Standard & Poor’s (S&P). |
| ** | Other Financial Instruments include investments not reflected in the Schedule of Investments, such as futures, forwards and swap contracts, which are valued at the unrealized appreciation (depreciation) on the investment. |
Other Notes: It is the policy of the Fund to recognize significant transfers between Levels 1 and 2 and to disclose those transfers at the last date of the reporting period. The Fund recognized no significant transfers into and out of Levels 1 and 2 during the six months ended March 31, 2011.
20 Certified Semi-Annual Report
| | |
| NOTES TO FINANCIAL STATEMENTS, CONTINUED | | |
| |
| Thornburg International Growth Fund | | March 31, 2011 (Unaudited) |
Foreign Currency Translation: Portfolio securities and other assets and liabilities denominated in foreign currencies are translated into U.S. dollars based on the exchange rate of such currencies against the U.S. dollar on the date of valuation. Purchases and sales of securities and income items denominated in foreign currencies are translated into U.S. dollars at the exchange rate in effect on the translation date. When the Fund purchases or sells foreign securities, it will customarily enter into a foreign exchange contract to minimize foreign exchange risk from the trade date to the settlement date of such transactions.
The Fund does not separately report the effect of changes in foreign exchange rates from changes in market prices on securities held. Such changes are included in net realized and unrealized gain or loss from investments.
Reported net realized foreign exchange gains or losses arise from sales of foreign currencies, currency gains or losses realized between the trade and settlement dates on securities transactions and the difference between the amounts of dividends, interest, and foreign withholding taxes recorded on the Fund’s books, and the U.S. dollar equivalent of the amounts actually received or paid.
Net unrealized foreign exchange gains and losses arise from changes in the fair value of assets and liabilities, other than investments in securities at fiscal period end, resulting from changes in exchange rates.
Deferred Taxes: The Fund is subject to a tax imposed on net realized gains of securities of certain foreign countries. The Fund records an estimated deferred tax liability for net unrealized gains on these securities as reflected in the accompanying financial statements.
Federal Income Taxes: It is the policy of the Trust to comply with the provisions of the Internal Revenue Code applicable to “regulated investment companies” and to distribute to shareholders substantially all taxable income, including any net realized gain on investments of the Fund. Therefore, no provision for federal income taxes is required.
Management reviews each tax position believed to be material to the preparation of the Fund’s financial statements, to assess if it is more likely than not that the position would be sustained upon examination, based upon the technical merits of the position. As of March 31, 2011, management has not identified any such position for which a liability must be reflected in the Statement of Assets and Liabilities. The Fund’s tax returns remain subject to examination for three years after filing.
When-Issued and Delayed Delivery Transactions: The Fund may engage in when-issued or delayed delivery transactions. To the extent the Fund engages in such transactions, it will do so for the purpose of acquiring portfolio securities consistent with the Fund’s investment objectives and not for the purpose of investment leverage or to speculate on interest rate and/or market changes. At the time the Fund makes a commitment to purchase a security on a when-issued or delayed delivery basis, the Fund will record the transaction and reflect the value in determining its net asset value. When effecting such transactions, assets of an amount sufficient to make payment for the portfolio securities to be purchased will be segregated on the Fund’s records on the trade date. Securities purchased on a when-issued or delayed delivery basis do not earn interest until the settlement date.
Dividends: Dividends to shareholders, if any, are generally paid quarterly and are reinvested in additional shares of the Fund at net asset value per share at the close of business on the dividend payment date or, at the shareholder’s option, paid in cash. Net realized capital gains, to the extent available, will be distributed at least annually. Distributions to shareholders are based on income tax regulations and therefore, their characteristics may differ for financial statement and tax purposes.
General: Securities transactions are accounted for on a trade date basis. Interest income is accrued as earned and dividend income is recorded on the ex-dividend date. Certain income from foreign securities is recognized as soon as information is available to the Fund. Realized gains and losses from the sale of securities are recorded on an identified cost basis. Net investment income (other than class specific expenses) and realized and unrealized gains and losses are allocated daily to each class of shares based upon the relative net asset value of outstanding shares of each class of shares at the beginning of the day (after adjusting for the current share activity of the respective class). Expenses common to all Funds are allocated among the Funds comprising the Trust based upon their relative net asset values or other appropriate allocation methods.
Guarantees and Indemnifications: Under the Trust’s organizational documents, its officers and Trustees are indemnified against certain liabilities arising out of the performance of their duties to the Fund. Additionally, in the normal course of business the Trust enters into contracts with service providers that contain general indemnification clauses. The Trust’s maximum exposure under these arrangements is unknown. However, based on experience, the Trust expects the risk of loss to be remote.
Certified Semi-Annual Report 21
| | |
| NOTES TO FINANCIAL STATEMENTS, CONTINUED | | |
| |
| Thornburg International Growth Fund | | March 31, 2011 (Unaudited) |
Use of Estimates: The preparation of financial statements, in conformity with generally accepted accounting principles, requires management to make estimates and assumptions that affect the reported amounts of assets and liabilities and the disclosure of contingent assets and liabilities at the date of the financial statements and the reported amounts of increases and decreases in net assets from operations during the reporting period. Actual results could differ from those estimates.
NOTE 3 – INVESTMENT ADVISORY FEE AND OTHER TRANSACTIONS WITH AFFILIATES
Pursuant to an investment advisory agreement, Thornburg Investment Management, Inc. (the “Advisor”) serves as the investment advisor and performs services to the Fund for which the fees are payable at the end of each month. For the six months ended March 31, 2011, these fees were payable at annual rates ranging from .875 of 1% to .675 of 1% per annum of the average daily net assets of the Fund depending on the Fund’s asset size. For the six months ended March 31, 2011, the Advisor contractually waived investment advisory fees of $21,693. The Trust has also entered into administrative services agreements with the Advisor, whereby the Advisor will perform certain administrative services for the shareholders of each class of the Fund’s shares, and for which fees will be payable at an annual rate of up to .125 of 1% per annum of the average daily net assets attributable to each class of shares. For the six months ended March 31, 2011, the Advisor contractually reimbursed certain class specific expenses, administrative fees, and distribution fees of $31,301 for Class I shares, $11,794 for Class R3 shares, $10,072 for Class R4 shares, and $10,127 for Class R5 shares.
The Trust has an underwriting agreement with Thornburg Securities Corporation (the “Distributor,” an affiliate of the Advisor), which acts as the distributor of the Fund’s shares. For the six months ended March 31, 2011, the Distributor has advised the Fund that it earned commissions aggregating $10,887 from the sale of Class A shares, and collected contingent deferred sales charges aggregating $1,153 from redemptions of Class C shares of the Fund.
Pursuant to a service plan under Rule 12b-1 of the Investment Company Act of 1940, the Fund may reimburse to the Advisor an amount not to exceed .25 of 1% per annum of the average daily net assets attributable to each class of shares of the Fund for payments made by the Advisor to securities dealers and other financial institutions to obtain various shareholder and distribution related services. For the six months ended March 31, 2011, there were no 12b-1 service plan fees charged for Class I shares. The Advisor may pay out of its own resources additional expenses for distribution of the Fund’s shares.
The Trust has also adopted distribution plans pursuant to Rule 12b-1, applicable only to the Fund’s Class C and Class R3 shares, under which the Fund compensates the Distributor for services in promoting the sale of Class C and Class R3 shares of the Fund at an annual rate of up to .75 of 1% per annum of the average daily net assets attributable to Class C shares, and an annual rate of up to .25 of 1% per annum of the average daily net assets attributable to Class R3 shares. Total fees incurred by the Distributor for each class of shares of the Fund under their respective Service and Distribution Plans for the six months ended March 31, 2011, are set forth in the Statement of Operations.
The Trust has an agreement with the custodian bank to indirectly pay a portion of the custodian’s fees through credits earned by the Fund’s cash on deposit with the bank. This deposit agreement is an alternative to overnight investments. Custodial fees have been adjusted to reflect amounts that would have been paid without this agreement, with a corresponding adjustment reflected as fees paid indirectly in the Statement of Operations. For the six months ended March 31, 2011, fees paid indirectly were $1,554.
Certain officers and Trustees of the Trust are also officers and/or directors of the Advisor and Distributor. The compensation of independent Trustees is borne by the Trust.
22 Certified Semi-Annual Report
| | |
| NOTES TO FINANCIAL STATEMENTS, CONTINUED | | |
| |
| Thornburg International Growth Fund | | March 31, 2011 (Unaudited) |
NOTE 4 – SHARES OF BENEFICIAL INTEREST
At March 31, 2011, there were an unlimited number of shares of beneficial interest authorized. Transactions in shares of beneficial interest were as follows:
| | | | | | | | | | | | | | | | |
| | | Six Months Ended
March 31, 2011 (Unaudited) | | | Year Ended
September 30, 2010 (Audited) | |
| | | Shares | | | Amount | | | Shares | | | Amount | |
Class A Shares | | | | | | | | | | | | | | | | |
Shares sold | | | 1,677,603 | | | $ | 23,207,380 | | | | 1,295,491 | | | $ | 14,607,416 | |
Shares issued to shareholders in reinvestment of dividends | | | 8,126 | | | | 111,333 | | | | 10,856 | | | | 117,457 | |
Shares repurchased | | | (369,916 | ) | | | (5,028,833 | ) | | | (643,507 | ) | | | (7,102,453 | ) |
Redemption fees received* | | | — | | | | 763 | | | | — | | | | 788 | |
| | | | | | | | | | | | | | | | |
| | | | |
Net Increase (Decrease) | | | 1,315,813 | | | $ | 18,290,643 | | | | 662,840 | | | $ | 7,623,208 | |
| | | | | | | | | | | | | | | | |
| | | | |
Class C Shares | | | | | | | | | | | | | | | | |
Shares sold | | | 428,416 | | | $ | 5,875,358 | | | | 618,259 | | | $ | 6,834,000 | |
Shares issued to shareholders in reinvestment of dividends | | | — | | | | — | | | | — | | | | — | |
Shares repurchased | | | (183,686 | ) | | | (2,510,283 | ) | | | (442,078 | ) | | | (4,850,518 | ) |
Redemption fees received* | | | — | | | | 459 | | | | — | | | | 588 | |
| | | | | | | | | | | | | | | | |
| | | | |
Net Increase (Decrease) | | | 244,730 | | | $ | 3,365,534 | | | | 176,181 | | | $ | 1,984,070 | |
| | | | | | | | | | | | | | | | |
| | | | |
Class I Shares | | | | | | | | | | | | | | | | |
Shares sold | | | 2,308,086 | | | $ | 32,147,330 | | | | 1,240,075 | | | $ | 14,043,843 | |
Shares issued to shareholders in reinvestment of dividends | | | 16,331 | | | | 225,702 | | | | 18,921 | | | | 206,051 | |
Shares repurchased | | | (1,259,592 | ) | | | (17,365,187 | ) | | | (423,456 | ) | | | (4,775,568 | ) |
Redemption fees received* | | | — | | | | 772 | | | | — | | | | 800 | |
| | | | | | | | | | | | | | | | |
| | | | |
Net Increase (Decrease) | | | 1,064,825 | | | $ | 15,008,617 | | | | 835,540 | | | $ | 9,475,126 | |
| | | | | | | | | | | | | | | | |
| | | | |
Class R3 Shares | | | | | | | | | | | | | | | | |
Shares sold | | | 28,088 | | | $ | 389,157 | | | | 33,942 | | | $ | 385,167 | |
Shares issued to shareholders in reinvestment of dividends | | | 230 | | | | 3,141 | | | | 386 | | | | 4,168 | |
Shares repurchased | | | (19,096 | ) | | | (257,986 | ) | | | (17,232 | ) | | | (188,395 | ) |
Redemption fees received* | | | — | | | | 20 | | | | — | | | | 23 | |
| | | | | | | | | | | | | | | | |
| | | | |
Net Increase (Decrease) | | | 9,222 | | | $ | 134,332 | | | | 17,096 | | | $ | 200,963 | |
| | | | | | | | | | | | | | | | |
| | | | |
Class R4 Shares | | | | | | | | | | | | | | | | |
Shares sold | | | 5,779 | | | $ | 82,299 | | | | — | | | $ | 3 | |
Shares issued to shareholders in reinvestment of dividends | | | 1 | | | | 10 | | | | 2 | | | | 16 | |
Shares repurchased | | | (2 | ) | | | (30 | ) | | | — | | | | — | |
Redemption fees received* | | | — | | | | — | | | | — | | | | — | |
| | | | | | | | | | | | | | | | |
| | | | |
Net Increase (Decrease) | | | 5,778 | | | $ | 82,279 | | | | 2 | | | $ | 19 | |
| | | | | | | | | | | | | | | | |
Certified Semi-Annual Report 23
| | |
| NOTES TO FINANCIAL STATEMENTS, CONTINUED | | |
| |
| Thornburg International Growth Fund | | March 31, 2011 (Unaudited) |
| | | | | | | | | | | | | | | | |
| | | Six Months Ended
March 31,2011 (Unaudited) | | | Year Ended
September 30, 2010 (Audited) | |
| | | Shares | | | Amount | | | Shares | | | Amount | |
Class R5 Shares | | | | | | | | | | | | | | | | |
Shares sold | | | 966 | | | $ | 13,415 | | | | 613,212 | | | $ | 6,687,310 | |
Shares issued to shareholders in reinvestment of dividends | | | 72 | | | | 991 | | | | 7 | | | | 83 | |
Shares repurchased | | | (1,023 | ) | | | (13,973 | ) | | | (600,288 | ) | | | (6,363,309 | ) |
Redemption fees received* | | | — | | | | 3 | | | | — | | | | — | |
| | | | | | | | | | | | | | | | |
| | | | |
Net Increase (Decrease) | | | 15 | | | $ | 436 | | | | 12,931 | | | $ | 324,084 | |
| | | | | | | | | | | | | | | | |
| * | The Fund charges a redemption fee of 1% of the Class A and Class I shares redeemed or exchanged within 30 days of purchase. Redemption fees charged to any class are allocated to all classes upon receipt of payment based on relative net asset values of each class or other appropriate allocation methods. |
NOTE 5 – SECURITIES TRANSACTIONS
For the six months ended March 31, 2011, the Fund had purchase and sale transactions of investment securities (excluding short-term investments) of $118,895,025 and $77,331,628, respectively.
NOTE 6 – INCOME TAXES
At March 31, 2011, information on the tax components of capital is as follows:
| | | | |
Cost of investments for tax purposes | | $ | 134,092,001 | |
| | | | |
Gross unrealized appreciation on a tax basis | | $ | 24,206,615 | |
Gross unrealized depreciation on a tax basis | | | (3,319,658 | ) |
| | | | |
Net unrealized appreciation (depreciation) on investments (tax basis) | | $ | 20,886,957 | |
| | | | |
At March 31, 2011, the Fund had deferred tax basis capital losses occurring subsequent to October 31, 2009 of $2,091,603. For tax purposes, such losses will be reflected in the year ending September 30, 2011.
At March 31, 2011, the Fund had tax basis capital losses, which may be carried forward to offset future capital gains. To the extent such carryforwards are used, capital gain distributions may be reduced to the extent provided by regulations.
Such capital loss carryforwards expire as follows:
| | | | |
2016 | | $ | 4,974,731 | |
2017 | | | 12,306,688 | |
2018 | | | 17,401,544 | |
| | | | |
| | $ | 34,682,963 | |
| | | | |
NOTE 7 – DERIVATIVE FINANCIAL INSTRUMENTS WITH OFF-BALANCE SHEET RISK AND FOREIGN INVESTMENT RISK
The Fund may use a variety of derivative financial instruments to hedge or adjust the risks affecting its investment portfolio or to enhance investment returns. Provisions of FASB Accounting Standards Codification ASC 815-10-50 (“ASC 815”), require certain disclosures. The disclosures are intended to provide users of financial statements with an understanding of the use of derivative instruments by the Fund and how these derivatives affect the financial position, financial performance and cash flows of the Fund. The Fund does not
24 Certified Semi-Annual Report
| | |
| NOTES TO FINANCIAL STATEMENTS, CONTINUED | | |
| |
| Thornburg International Growth Fund | | March 31, 2011 (Unaudited) |
designate any derivative instruments as hedging instruments under ASC 815. During the six months ended March 31, 2011, the Fund’s principal exposure to derivative financial instruments of the type addressed by ASC 815 was investment in foreign exchange contracts. A foreign exchange contract is an agreement between two parties to exchange different currencies at a specified rate of exchange at an agreed upon future date. Foreign exchange contracts involve risks to the Fund, including the risk that a contract counterparty will not meet its obligations to the Fund, the risk that a change in a contract’s value may not correlate perfectly with the currency the contract was intended to track, and the risk that the Fund’s advisor is unable to correctly implement its strategy in using a contract. In any such instance, the Fund may not achieve the intended benefit of entering into a contract, and may experience a loss.
The Fund entered into forward currency contracts during the six months ended March 31, 2011 in the normal course of pursuing its investment objectives, in anticipation of purchasing foreign investments or with the intent of reducing the risk to the value of the Fund’s foreign investments from adverse changes in the relationship between the U.S. dollar and foreign currencies. In each case these contracts have been initiated in conjunction with foreign investment transactions.
These contracts are accounted for by the Fund under ASC 815. Unrealized gains and unrealized losses on outstanding contracts are reported in the Fund’s Statement of Assets and Liabilities at the Fund’s net equity, as measured by the difference between the forward exchange rates at the reporting date and the forward exchange rates at each contract’s inception date. Net realized gain (loss) on contracts closed during the period, and changes in net unrealized appreciation (depreciation) on outstanding contracts are recognized in the Fund’s Statement of Operations.
The following table displays the outstanding forward currency contracts, at March 31, 2011:
| | | | | | | | | | | | | | | | | | | | | | |
Outstanding Forward Currency Contracts to Buy or Sell at March 31, 2011 | |
Contract Description | | Buy/Sell | | Contract
Amount | | | Contract
Value Date | | | Value USD | | | Unrealized
Appreciation | | | Unrealized
Depreciation | |
Euro | | Sell | | | 6,074,400 | | | | 09/21/2011 | | | | 8,575,334 | | | $ | — | | | $ | (21,424 | ) |
Great Britain Pound | | Sell | | | 12,033,400 | | | | 09/21/2011 | | | | 19,251,257 | | | | 32,387 | | | | — | |
Japanese Yen | | Sell | | | 157,432,700 | | | | 07/07/2011 | | | | 1,893,861 | | | | 46,542 | | | | — | |
Japanese Yen | | Sell | | | 229,084,500 | | | | 07/07/2011 | | | | 2,755,808 | | | | 58,671 | | | | — | |
Japanese Yen | | Sell | | | 88,779,300 | | | | 07/07/2011 | | | | 1,067,985 | | | | 61,997 | | | | — | |
Japanese Yen | | Sell | | | 211,957,000 | | | | 07/07/2011 | | | | 2,549,770 | | | | 8,583 | | | | — | |
Mexican Peso | | Sell | | | 12,890,800 | | | | 05/17/2011 | | | | 1,079,469 | | | | — | | | | (53,425 | ) |
Mexican Peso | | Sell | | | 13,731,900 | | | | 05/17/2011 | | | | 1,149,902 | | | | — | | | | (50,911 | ) |
Mexican Peso | | Buy | | | 12,818,500 | | | | 05/17/2011 | | | | 1,073,415 | | | | 47,163 | | | | — | |
South African Rand | | Sell | | | 15,020,500 | | | | 06/10/2011 | | | | 2,198,923 | | | | — | | | | (87,571 | ) |
| | | | | | | | | | | | | | | | | | | | | | |
Total | | | | | | | | | | | | | | | | $ | 255,343 | | | $ | (213,331 | ) |
| | | | | | | | | | | | | | | | | | | | | | |
The unrealized appreciation (depreciation) of the outstanding forward currency contracts recognized in the Fund’s Statement of Assets and Liabilities at March 31, 2011 is disclosed in the following table:
| | | | | | |
Fair Values of Derivative Financial Instruments at March 31, 2011 | |
Asset Derivatives | | | | | | |
| | | Balance Sheet Location | | Fair Value | |
Foreign exchange contracts | | Assets - Unrealized appreciation on forward currency contracts | | $ | 255,343 | |
Liability Derivatives | | | | | | |
| | | Balance Sheet Location | | Fair Value | |
Foreign exchange contracts | | Liabilities - Unrealized depreciation on forward currency contracts | | $ | (213,331 | ) |
Certified Semi-Annual Report 25
| | |
| NOTES TO FINANCIAL STATEMENTS, CONTINUED | | |
| |
| Thornburg International Growth Fund | | March 31, 2011 (Unaudited) |
The realized gains (losses) from forward currency contracts, and the change in unrealized appreciation (depreciation) of outstanding forward currency contracts recognized in the Fund’s Statement of Operations for the six months ended March 31, 2011 are disclosed in the following tables:
| | | | | | | | |
Amount of Realized Gain (Loss) on Derivative Financial Instruments Recognized in Income for the Six Months Ended March 31, 2011 | |
| | |
| | | Total | | | Forward Currency Contracts | |
Foreign exchange contracts | | $ | (2,330,026 | ) | | $ | (2,330,026 | ) |
|
Change in Unrealized Appreciation (Depreciation) of Derivative Financial Instruments Recognized in Income for the Six Months Ended March 31, 2011 | |
| | | Total | | | Forward Currency Contracts | |
Foreign exchange contracts | | $ | 1,557,212 | | | $ | 1,557,212 | |
OTHER NOTES
Fund management believes no events have occurred between March 31, 2011 and May 20, 2011, the date of issuance of the financial statements, which require adjustment of, or disclosure in, the accompanying financial statements.
26 Certified Semi-Annual Report
This page intentionally left blank.
Certified Semi-Annual Report 27
FINANCIAL HIGHLIGHTS
Thornburg International Growth Fund
| | | | | | | | | | | | | | | | | | | | | | | | | | | | | | | | | | | | | | | | | | | | | | | | | | | | | | | | | | | | |
| | | PER SHARE PERFORMANCE (for a share outstanding throughout the
period)+ | | | RATIOS TO AVERAGE NET ASSETS | | | SUPPLEMENTAL DATA | |
Unless
Otherwise
Noted, Periods
are Fiscal Years
Ended Sept. 30, | | Net Asset
Value
Beginning
of Period | | | Net
Investment
Income
(Loss) | | | Net
Realized
&
Unrealized
Gain (Loss)
on
Investments | | | Total from
Investment
Operations | | | Dividends
from Net
Investment
Income | | | Dividends
from Net
Realized
Gains | | | Total
Dividends | | | Net
Asset
Value
End
of
Period | | | Net
Investment
Income
(Loss)
(%) | | | Expenses,
After
Expense
Reductions
(%) | | | Expenses,
After
Expense
Reductions
and
Net of
Custody
Credits
(%) | | | Expenses,
Before
Expense
Reductions
(%) | | | Total
Return
(%)(a) | | | Portfolio
Turnover
Rate (%) | | | Net Assets
at End
of Period
(Thousands) | |
Class A Shares | | | | | | | | | | | | | | | | | | | | | | | | | | | | | | | | | | | | | | | | | | | | | | | | | | | | | |
2011(b)(c) | | $ | 12.25 | | | | (0.05 | ) | | | 2.20 | | | | 2.15 | | | | (0.04 | ) | | | — | | | | (0.04 | ) | | $ | 14.36 | | | | (0.70 | )(d) | | | 1.51 | (d) | | | 1.51 | (d) | | | 1.54 | (d) | | | 17.53 | | | | 64.83 | | | $ | 61,714 | |
2010(c) | | $ | 10.36 | | | | — | (e) | | | 1.94 | | | | 1.94 | | | | (0.05 | ) | | | — | | | | (0.05 | ) | | $ | 12.25 | | | | (0.02 | ) | | | 1.61 | | | | 1.60 | | | | 1.70 | | | | 18.82 | | | | 128.86 | | | $ | 36,527 | |
2009(c) | | $ | 10.35 | | | | 0.04 | | | | 0.10 | | | | 0.14 | | | | (0.13 | ) | | | — | | | | (0.13 | ) | | $ | 10.36 | | | | 0.52 | | | | 1.62 | | | | 1.61 | | | | 1.95 | | | | 1.89 | | | | 103.57 | | | $ | 24,015 | |
2008(c) | | $ | 14.92 | | | | 0.07 | | | | (4.27 | ) | | | (4.20 | ) | | | — | | | | (0.37 | ) | | | (0.37 | ) | | $ | 10.35 | | | | 0.53 | | | | 1.56 | | | | 1.55 | | | | 1.63 | | | | (28.98 | ) | | | 54.31 | | | $ | 28,414 | |
2007(c)(f) | | $ | 11.94 | | | | (0.03 | ) | | | 3.01 | | | | 2.98 | | | | — | | | | — | | | | — | | | $ | 14.92 | | | | (0.29 | )(d) | | | 1.64 | (d) | | | 1.62 | (d) | | | 2.10 | (d) | | | 24.96 | | | | 113.34 | | | $ | 25,145 | |
Class C Shares | | | | | | | | | | | | | | | | | | | | | | | | | | | | | | | | | | | | | | | | | | | | | | | | | | | | | |
2011(b) | | $ | 12.18 | | | | (0.10 | ) | | | 2.18 | | | | 2.08 | | | | — | | | | — | | | | — | | | $ | 14.26 | | | | (1.54 | )(d) | | | 2.32 | (d) | | | 2.31 | (d) | | | 2.35 | (d) | | | 17.08 | | | | 64.83 | | | $ | 32,554 | |
2010 | | $ | 10.33 | | | | (0.09 | ) | | | 1.94 | | | | 1.85 | | | | — | | | | — | | | | — | | | $ | 12.18 | | | | (0.81 | ) | | | 2.38 | | | | 2.38 | | | | 2.51 | | | | 17.91 | | | | 128.86 | | | $ | 24,829 | |
2009 | | $ | 10.22 | | | | (0.02 | ) | | | 0.18 | | | | 0.16 | | | | (0.05 | ) | | | — | | | | (0.05 | ) | | $ | 10.33 | | | | (0.21 | ) | | | 2.37 | | | | 2.37 | | | | 2.72 | | | | 1.76 | | | | 103.57 | | | $ | 19,233 | |
2008 | | $ | 14.85 | | | | (0.03 | ) | | | (4.23 | ) | | | (4.26 | ) | | | — | | | | (0.37 | ) | | | (0.37 | ) | | $ | 10.22 | | | | (0.23 | ) | | | 2.32 | | | | 2.32 | | | | 2.45 | | | | (29.53 | ) | | | 54.31 | | | $ | 23,638 | |
2007(f) | | $ | 11.94 | | | | (0.10 | ) | | | 3.01 | | | | 2.91 | | | | — | | | | — | | | | — | | | $ | 14.85 | | | | (1.13 | )(d) | | | 2.39 | (d) | | | 2.38 | (d) | | | 3.23 | (d) | | | 24.37 | | | | 113.34 | | | $ | 12,376 | |
Class I Shares | | | | | | | | | | | | | | | | | | | | | | | | | | | | | | | | | | | | | | | | | | | | | | | | | | | | | |
2011(b) | | $ | 12.38 | | | | (0.01 | ) | | | 2.21 | | | | 2.20 | | | | (0.07 | ) | | | — | | | | (0.07 | ) | | $ | 14.51 | | | | (0.18 | )(d) | | | 0.99 | (d) | | | 0.99 | (d) | | | 1.16 | (d) | | | 17.83 | | | | 64.83 | | | $ | 61,358 | |
2010 | | $ | 10.44 | | | | 0.07 | | | | 1.96 | | | | 2.03 | | | | (0.09 | ) | | | — | | | | (0.09 | ) | | $ | 12.38 | | | | 0.58 | | | | 0.99 | | | | 0.99 | | | | 1.25 | | | | 19.60 | | | | 128.86 | | | $ | 39,169 | |
2009 | | $ | 10.46 | | | | 0.10 | | | | 0.08 | | | | 0.18 | | | | (0.20 | ) | | | — | | | | (0.20 | ) | | $ | 10.44 | | | | 1.17 | | | | 0.99 | | | | 0.99 | | | | 1.42 | | | | 2.56 | | | | 103.57 | | | $ | 24,313 | |
2008 | | $ | 14.99 | | | | 0.14 | | | | (4.30 | ) | | | (4.16 | ) | | | — | | | | (0.37 | ) | | | (0.37 | ) | | $ | 10.46 | | | | 1.03 | | | | 1.00 | | | | 0.99 | | | | 1.25 | | | | (28.57 | ) | | | 54.31 | | | $ | 28,164 | |
2007(f) | | $ | 11.94 | | | | 0.05 | | | | 3.00 | | | | 3.05 | | | | — | | | | — | | | | — | | | $ | 14.99 | | | | 0.52 | (d) | | | 1.01 | (d) | | | 0.99 | (d) | | | 1.64 | (d) | | | 25.54 | | | | 113.34 | | | $ | 27,659 | |
Class R3 Shares | | | | | | | | | | | | | | | | | | | | | | | | | | | | | | | | | | | | | | | | | | | | | | | | | | | | | |
2011(b) | | $ | 12.22 | | | | (0.05 | ) | | | 2.19 | | | | 2.14 | | | | (0.04 | ) | | | — | | | | (0.04 | ) | | $ | 14.32 | | | | (0.74 | )(d) | | | 1.50 | (d) | | | 1.50 | (d) | | | 3.45 | (d) | | | 17.50 | | | | 64.83 | | | $ | 1,415 | |
2010 | | $ | 10.33 | | | | 0.01 | | | | 1.94 | | | | 1.95 | | | | (0.06 | ) | | | — | | | | (0.06 | ) | | $ | 12.22 | | | | 0.07 | | | | 1.50 | | | | 1.50 | | | | 4.34 | | | | 18.98 | | | | 128.86 | | | $ | 1,094 | |
2009 | | $ | 10.36 | | | | 0.08 | | | | 0.06 | | | | 0.14 | | | | (0.17 | ) | | | — | | | | (0.17 | ) | | $ | 10.33 | | | | 0.94 | | | | 1.46 | | | | 1.46 | | | | 6.14 | (g) | | | 2.09 | | | | 103.57 | | | $ | 748 | |
2008(h) | | $ | 13.94 | | | | 0.09 | | | | (3.67 | ) | | | (3.58 | ) | | | — | | | | — | | | | — | | | $ | 10.36 | | | | 1.08 | (d) | | | 1.50 | (d) | | | 1.49 | (d) | | | 26.47 | (d)(g) | | | (25.68 | ) | | | 54.31 | | | $ | 113 | |
Class R4 Shares | | | | | | | | | | | | | | | | | | | | | | | | | | | | | | | | | | | | | | | | | | | | | | | | | | | | | |
2011(b) | | $ | 12.18 | | | | (0.03 | ) | | | 2.16 | | | | 2.13 | | | | (0.04 | ) | | | — | | | | (0.04 | ) | | $ | 14.27 | | | | (0.43 | )(d) | | | 1.38 | (d) | | | 1.38 | (d) | | | 240.41 | (d)(g) | | | 17.53 | | | | 64.83 | | | $ | 86 | |
2010 | | $ | 10.29 | | | | 0.02 | | | | 1.94 | | | | 1.96 | | | | (0.07 | ) | | | — | | | | (0.07 | ) | | $ | 12.18 | | | | 0.15 | | | | 1.42 | | | | 1.40 | | | | 738.92 | (g) | | | 19.11 | | | | 128.86 | | | $ | 3 | |
2009 | | $ | 10.36 | | | | 0.07 | | | | 0.06 | | | | 0.13 | | | | (0.20 | ) | | | — | | | | (0.20 | ) | | $ | 10.29 | | | | 0.82 | | | | 1.40 | | | | 1.40 | | | | 980.09 | (g) | | | 2.10 | | | | 103.57 | | | $ | 2 | |
2008(h) | | $ | 13.94 | | | | 0.10 | | | | (3.68 | ) | | | (3.58 | ) | | | — | | | | — | | | | — | | | $ | 10.36 | | | | 1.16 | (d) | | | 1.40 | (d) | | | 1.40 | (d) | | | 861.94 | (d)(g) | | | (25.68 | ) | | | 54.31 | | | $ | 2 | |
Class R5 Shares | | | | | | | | | | | | | | | | | | | | | | | | | | | | | | | | | | | | | | | | | | | | | | | | | | | | | |
2011(b) | | $ | 12.40 | | | | (0.02 | ) | | | 2.23 | | | | 2.21 | | | | (0.07 | ) | | | — | | | | (0.07 | ) | | $ | 14.54 | | | | (0.23 | )(d) | | | 0.99 | (d) | | | 0.99 | (d) | | | 11.72 | (d)(g) | | | 17.87 | | | | 64.83 | | | $ | 201 | |
2010 | | $ | 10.46 | | | | (0.09 | ) | | | 2.12 | | | | 2.03 | | | | (0.09 | ) | | | — | | | | (0.09 | ) | | $ | 12.40 | | | | (0.83 | ) | | | 0.99 | | | | 0.99 | | | | 17.58 | (g) | | | 19.56 | | | | 128.86 | | | $ | 171 | |
2009 | | $ | 10.46 | | | | 0.08 | | | | 0.11 | | | | 0.19 | | | | (0.19 | ) | | | — | | | | (0.19 | ) | | $ | 10.46 | | | | 0.92 | | | | 0.97 | | | | 0.97 | | | | 522.27 | (g) | | | 2.53 | | | | 103.57 | | | $ | 9 | |
2008(h) | | $ | 14.03 | | | | 0.14 | | | | (3.71 | ) | | | (3.57 | ) | | | — | | | | — | | | | — | | | $ | 10.46 | | | | 1.57 | (d) | | | 0.96 | (d) | | | 0.95 | (d) | | | 851.43 | (d)(g) | | | (25.45 | ) | | | 54.31 | | | $ | 2 | |
| (a) | Not annualized for periods less than one year. |
| (b) | Unaudited Six Month Period Ended March 31. |
| (c) | Sales loads are not reflected in computing total return. |
| (e) | Net investment income (loss) was less than $0.01 per share. |
| (f) | Fund commenced operations on February 1, 2007. |
| (g) | Due to the size of net assets and fixed expenses, ratios may appear disproportionate. |
| (h) | Effective date of this class of shares was February 1, 2008. |
| + | Based on weighted average shares outstanding. |
See notes to financial statements.
| | |
| 28 Certified Semi-Annual Report | | Certified Semi-Annual Report 29 |
| | |
| EXPENSE EXAMPLE | | |
| Thornburg International Growth Fund | | March 31, 2011 (Unaudited) |
As a shareholder of the Fund, you incur two types of costs:
| | (1) | transaction costs, including |
(a) sales charges (loads) on purchase payments for Class A shares;
(b) a deferred sales charge on redemptions of any part or all of a purchase of $1 million of Class A shares within 12 months of purchase;
(c) a deferred sales charge on redemptions of Class C shares within 12 months of purchase;
(d) a 30-day redemption fee on Class A and Class I shares;
| | (2) | ongoing costs, including management fees; distribution and/or service (12b-1) fees; and other Fund expenses. |
This example is intended to help you understand your ongoing costs (in dollars) of investing in the Fund and to compare these costs with the ongoing costs of investing in other mutual funds.
The example is based on a $1,000 investment beginning on October 1, 2010, and held until March 31, 2011.
ACTUAL EXPENSES
For each class of shares, the first line of the table at right provides information about actual account values and actual expenses. You may use the information in this line, together with the amount you invested, to estimate the expenses that you paid over the period. Simply divide your account value by $1,000 (for example, an $8,600 account value divided by $1,000 = 8.6), then multiply the result by the number in the first line for your class of shares under the heading entitled “Expenses Paid During Period” to estimate the expenses you paid on your account during this period.
HYPOTHETICAL EXAMPLE FOR COMPARISON PURPOSES
For each class of shares, the second line of the table at right provides information about hypothetical account values and hypothetical expenses based on the Fund’s actual expense ratio and an assumed rate of return of 5% per year before expenses, which is not the Fund’s actual return. The hypothetical account values and expenses may not be used to estimate the actual ending account balance or expenses you paid for the period. You may use this information to compare the ongoing costs of investing in the Fund and other funds. To do so, compare this 5% hypothetical example with the 5% hypothetical examples that appear in the shareholder reports of the other funds.
| | | | | | | | | | | | |
| | | Beginning
Account Value
10/1/10 | | | Ending
Account Value
3/31/11 | | | Expenses Paid
During Period†
10/1/10–3/31/11 | |
Class A Shares | | | | | | | | | | | | |
Actual | | $ | 1,000.00 | | | $ | 1,175.30 | | | $ | 8.20 | |
Hypothetical* | | $ | 1,000.00 | | | $ | 1,017.39 | | | $ | 7.60 | |
Class C Shares | | | | | | | | | | | | |
Actual | | $ | 1,000.00 | | | $ | 1,170.80 | | | $ | 12.53 | |
Hypothetical* | | $ | 1,000.00 | | | $ | 1,013.39 | | | $ | 11.62 | |
Class I Shares | | | | | | | | | | | | |
Actual | | $ | 1,000.00 | | | $ | 1,178.30 | | | $ | 5.38 | |
Hypothetical* | | $ | 1,000.00 | | | $ | 1,020.00 | | | $ | 4.99 | |
Class R3 Shares | | | | | | | | | | | | |
Actual | | $ | 1,000.00 | | | $ | 1,175.00 | | | $ | 8.13 | |
Hypothetical* | | $ | 1,000.00 | | | $ | 1,017.45 | | | $ | 7.54 | |
Class R4 Shares | | | | | | | | | | | | |
Actual | | $ | 1,000.00 | | | $ | 1,175.30 | | | $ | 7.46 | |
Hypothetical* | | $ | 1,000.00 | | | $ | 1,018.07 | | | $ | 6.92 | |
Class R5 Shares | | | | | | | | | | | | |
Actual | | $ | 1,000.00 | | | $ | 1,178.70 | | | $ | 5.37 | |
Hypothetical* | | $ | 1,000.00 | | | $ | 1,020.00 | | | $ | 4.98 | |
| † | Expenses are equal to the annualized expense ratio for each class (A: 1.51%; C: 2.31%; I: 0.99%; R3: 1.50%; R4: 1.38%; R5: 0.99%) multiplied by the average account value over the period, multiplied by 182/365 to reflect the one-half year period. |
| * | Hypothetical assumes a rate of return of 5% per year before expenses. |
Please note that the expenses shown in the table are meant to highlight your ongoing costs only and do not reflect any transactional costs, such as sales charges (loads), redemption fees, or exchange fees. Therefore, the second line of the table for each class of shares is useful in comparing ongoing costs only, and will not help you determine the relative total costs of owning different funds. In addition, if these transactional costs were included, your costs would have been higher.
30 Certified Semi-Annual Report
| | |
| INDEX COMPARISON | | |
| Thornburg International Growth Fund | | March 31, 2011 (Unaudited) |
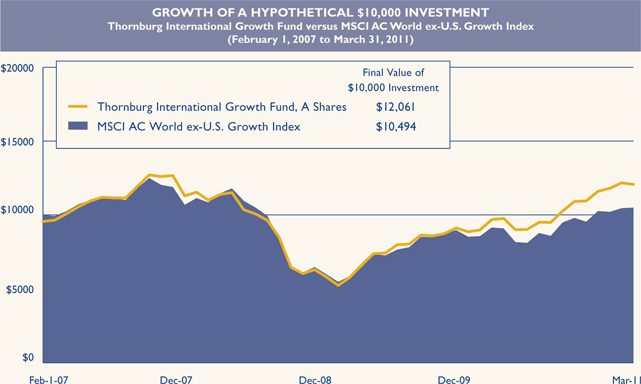
| | | | | | | | | | | | |
AVERAGE ANNUAL TOTAL RETURNS For periods ended March 31, 2011 (with sales charge) | |
| | | |
| | | 1 Yr | | | 3 Yrs | | | Since
Inception | |
| | | |
A Shares (Incep: 2/1/07) | | | 18.99 | % | | | 1.56 | % | | | 4.61 | % |
| | | |
C Shares (Incep: 2/1/07) | | | 22.57 | % | | | 2.53 | % | | | 5.13 | % |
| | | |
I Shares (Incep: 2/1/07) | | | 25.32 | % | | | 3.77 | % | | | 6.44 | % |
| | | |
R3 Shares (Incep: 2/1/08) | | | 24.64 | % | | | 3.23 | % | | | 1.88 | % |
| | | |
R4 Shares (Incep: 2/1/08) | | | 24.58 | % | | | 3.28 | % | | | 1.93 | % |
| | | |
R5 Shares (Incep: 2/1/08) | | | 25.25 | % | | | 3.76 | % | | | 2.38 | % |
| | | |
MSCI AC World ex-U.S. | | | | | | | | | | | | |
Growth Index (Since 2/1/07) | | | 14.73 | % | | | -1.09 | % | | | 1.17 | % |
Performance data shown represents past performance and is no guarantee of future results. Investment return and principal value will fluctuate so shares, when redeemed, may be worth more or less than their original cost. Current performance may be lower or higher than quoted. For performance current to the most recent month end, visit thornburg.com or call 800.847.0200. The performance data and graph do not reflect the deduction of taxes that a shareholder would pay on distributions or the redemption of Fund shares. Returns reflect the reinvestment of dividends and capital gains as well as applicable sales charges. Class A shares are sold with a maximum sales charge of 4.50%. Class C shares are subject to a 1% CDSC for the first year only. There is no up-front sales charge for Class I, R3, R4 and R5 shares. Class A and I shares are subject to a 1% 30-day redemption fee.
Certified Semi-Annual Report 31
| | |
| OTHER INFORMATION | | |
| Thornburg International Growth Fund | | March 31, 2011 (Unaudited) |
PORTFOLIO PROXY VOTING
Policies and Procedures:
The Trust has delegated to Thornburg Investment Management, Inc. (the “Advisor”) voting decisions respecting proxies for the Fund’s voting securities. The Advisor makes voting decisions in accordance with its Proxy Voting Policy and Procedures. A description of the Policy and Procedures is available (i) without charge, upon request, by calling the Advisor toll-free at 1-800-847-0200, (ii) on the Thornburg web site at www.thornburg.com, and (iii) on the Securities and Exchange Commission’s web site at www.sec.gov.
Information regarding how proxies were voted is available on or before August 31 of each year for the twelve months ending the preceding June 30. This information is available (i) without charge, upon request by calling the Advisor toll-free at 1-800-847-0200, (ii) on the Thornburg web site at www.thornburg.com, and (iii) on the Securities and Exchange Commission’s web site at www.sec.gov.
AVAILABILITY OF QUARTERLY PORTFOLIO SCHEDULE
The Fund files with the Securities and Exchange Commission schedules of its portfolio holdings on Form N-Q for the first and third quarters of each fiscal year. The Fund’s Forms N-Q are available on the Commission’s web site at www.sec.gov, or may be reviewed and copied at the Commission’s Public Reference Room in Washington, D.C. Information on the operation of the Public Reference Room may be obtained by calling 1-800-SEC-0330. The Fund also makes this information available on its web site at www.thornburg. com/download or upon request by calling 1-800-847-0200.
32 Certified Semi-Annual Report
Trustees’ Statement to Shareholders
Not part of the Certified Semi-Annual Report
February 8, 2005, as readopted September 13, 2010
The Trustees are concerned that ongoing commentaries and opinions reported in the media may confuse investors in general as to the supervisory duties of trustees of mutual funds and, in particular, leave Thornburg Investment Trust shareholders uncertain regarding how we discharge our responsibilities in supervising the Funds’ investment advisor and in reviewing the advisor’s contract for renewal. We decided to spell out clearly three principal guidelines that we follow in supervising the Trust’s investment advisor on your behalf.
We begin with the premise that each shareholder selected his or her Fund because its investments are managed by the investment advisor identified in the prospectus and in accordance with the objective and policies described in the prospectus. We realize, as each of you do, that if you believe that your Fund’s stated objective and policies no longer serve your personal investment goals, you can sell your shares and leave the Fund.
Therefore, we believe that our primary supervisory task – our principal obligation to you – is to assess the nature and quality of the advisor’s services, and to confirm that the advisor actively and competently pursues the Fund’s objective, in accordance with the policies set out in the prospectus. To do this, we meet regularly with management to review your Fund’s portfolio and to discuss the advisor’s specific actions and judgments in pursuing the Fund’s objective. We do not substitute our own judgment for the advisor’s decisions in selecting investments; the advisor is paid to exercise its informed judgment on investment decisions, and we seek to confirm, in reviewing the advisor’s performance, that the advisor is doing just that.
Second, while we are conscious of costs and the effect that costs have on shareholders’ returns, we do not seek the lowest fees or expense ratio as our sole or primary objective. We try to make sure that your Fund’s fees and costs are reasonable in relationship to the services rendered and that they are generally in line with those charged by other expert investment advisors, consistent with our belief that the Fund’s investors searched for and expect that expertise and attention and have decided to pay a reasonable price for it. We do not put the management contract “out to bid” as a matter of course, and we would not do so unless we had concluded that the advisor materially had failed to pursue the Fund’s objectives in accordance with its policies, or for other equally important reasons. We believe that any other approach would be inconsistent with your interests and contrary to your expectations when you bought shares of the Fund in the first place.
Finally, because we believe that most Thornburg Fund shareholders have invested with a long-term perspective, we try not to focus too much on the fashions of the moment and on short-term performance. The market will not favor any specific investment objective or set of policies at all times and under all economic circumstances. A fund will experience periods of both high and low returns relative to other funds and other investments. Even if one of our Funds is not favored by the market at a particular time, we believe that the advisor is nonetheless obliged to remain true to the Fund’s objective and policies, and we watch to see that it does so.
This page is not part of the Semi-Annual Report. 33
This page intentionally left blank.
34 This page is not part of the Semi-Annual Report.
Retirement and Education Accounts
Thornburg Investment Management offers retirement and education savings accounts that can help you meet a variety of planning challenges. For account applications or further information on any of the accounts below, please call 1-800-847-0200 or go to www.thornburg.com/ira. Your financial advisor can help you determine which plan is right for you.
Individual Retirement Accounts
Individual Retirement Accounts (IRAs) provide a tax-advantaged means to save money for the future. For a detailed outline of the difference between retirement accounts, see www.thornburg.com/ira. Rollovers are available. Call 1-800-847-0200 for more information.
Traditional IRAs – Contributions to Traditional IRAs are tax deductible for eligible individuals, and withdrawals are taxed as additional ordinary income. You may contribute to an IRA if you receive compensation and are under 70 1/2, even if you are covered by an employer retirement plan. Deductible contributions are subject to certain qualifications. Please consult your tax advisor.
Roth IRAs – Under a Roth IRA, there is no tax deduction for contributions, but there is no income tax on qualified withdrawals. For a more detailed comparison of Traditional and Roth IRAs, please see our web site at www.thornburg.com/ira.
SEP IRAs – Simplified Employee Pension (SEP) IRAs are established by employers. The employer is allowed a tax deduction for contributions made to the SEP Plan and makes contributions to each eligible employee’s SEP IRA on a discretionary basis.
SIMPLE IRAs – Savings Incentive Match Plan for Employees of Small Employers (SIMPLE) is designed to give small business owners a simplified method to establish and contribute to a retirement plan for employees. The employer is allowed a tax deduction for contributions and makes either matching or non-elective contributions to each eligible employee’s SIMPLE IRA. Employees may make salary deferral contributions.
Coverdell Education Savings Account
These savings accounts are designed to provide a way to save money for higher education expenses. In an Education Savings Account, earnings and interest grow tax-free, and qualified withdrawals used to pay for eligible higher-education expenses are tax- and penalty-free.
Funds Available
The following funds are available in the accounts listed above:
| | • | | Thornburg International Value Fund |
| | • | | Thornburg Core Growth Fund |
| | • | | Thornburg Investment Income Builder Fund |
| | • | | Thornburg Global Opportunities Fund |
| | • | | Thornburg International Growth Fund |
| | • | | Thornburg Developing World Fund |
| | • | | Thornburg Limited Term U.S. Government Fund |
| | • | | Thornburg Limited Term Income Fund |
| | • | | Thornburg Strategic Income Fund |
This page is not part of the Semi-Annual Report. 35

Thornburg Equity Funds
Thornburg’s equity research uses a fundamental and comprehensive analytical approach. Thornburg equity funds focus on a limited number of securities so that each holding can impact performance. The equity team searches for firms believed to have a promising future and seeks to buy shares of those companies at a discount to their intrinsic value.
| | • | | Thornburg International Value Fund |
| | • | | Thornburg Core Growth Fund |
| | • | | Thornburg Investment Income Builder Fund |
| | • | | Thornburg Global Opportunities Fund |
| | • | | Thornburg International Growth Fund |
| | • | | Thornburg Developing World Fund |
Thornburg Bond Funds
Thornburg Investment Management applies a disciplined philosophy to fixed-income management. Since the launch of our first fixed-income fund over 25 years ago, we have been conducting fundamental, bottom-up research in an effort to identify bonds which we believe provide the best return for a given level of risk. We are very organic in our approach, avoiding leverage or complex strategies which could backfire in periods of market uncertainty.
| | • | | Thornburg Limited Term Municipal Fund |
| | • | | Thornburg Intermediate Municipal Fund |
| | • | | Thornburg California Limited Term Municipal Fund |
| | • | | Thornburg New Mexico Intermediate Municipal Fund |
| | • | | Thornburg New York Intermediate Municipal Fund |
| | • | | Thornburg Strategic Municipal Income Fund |
| | • | | Thornburg Limited Term U.S. Government Fund |
| | • | | Thornburg Limited Term Income Fund |
| | • | | Thornburg Strategic Income Fund |
Before investing, carefully consider the Fund’s investment goals, risks, charges, and expenses. For a prospectus containing this and other information, contact your financial advisor or visit thornburg. com. Read it carefully before investing.
For additional information, please visit www.thornburg.com
Thornburg Investment Management, Inc. 2300 North Ridgetop Road, Santa Fe, NM 87506
This page is not part of the Semi-Annual Report. 37
This page intentionally left blank.
38 This page is not part of the Semi-Annual Report.
This page intentionally left blank.
This page is not part of the Semi-Annual Report 39
| | | | | | |
 | | Waste not, Wait not | |  |
| | |
| | | | Get instant access to your shareholder reports. |
| | |
| | This Semi-Annual Report is submitted for the general information of shareholders of the Fund. It is not authorized for distribution to prospective investors in the Fund unless preceded or accompanied by an effective prospectus. | | By switching from your postal mailbox to your email inbox, you reduce paper clutter, improve record keeping access, and help conserve our natural resources. |
| | |

| | Investment Advisor: Thornburg Investment Management® | | Go to www.thornburg.com/edelivery and sign up to receive your shareholder reports, prospectuses, and proxy statements electronically. |
| | 800.847.0200 | | | | |
| | Distributor: | | | | |
| | Thornburg Securities Corporation�� 800.847.0200 | | You invest in the future, without spending a dime. |
| | TH1409 | | | | |

Important Information
The information presented on the following pages was current as of March 31, 2011. The managers’ views, portfolio holdings, and sector and country diversification are provided for the general information of the Fund’s shareholders; they are historical and subject to change. This material should not be deemed a recommendation to buy or sell any of the securities mentioned.
Investments in the Fund carry risks including possible loss of principal. Investing outside the United States involves additional risks, such as currency fluctuations. Additionally, the Fund may invest a portion of the assets in small capitalization companies, which may increase the risk of greater price fluctuations. As with direct bond ownership, funds that invest in bonds are subject to certain risks including interest-rate risk, credit risk, and inflation risk. The principal value of bonds will fluctuate relative to changes in interest rates, decreasing when interest rates rise. Please see the Fund’s Prospectus for a discussion of the risks associated with an investment in the Fund. Investments in the Fund are not deposits or obligations of, or guaranteed or endorsed by, any bank, the Federal Deposit Insurance Corporation, the Federal Reserve Board or any government agency. There is no guarantee that the Fund will meet its investment objectives.
Performance data given at net asset value (NAV) does not take into account the applicable sales charges. If the sales charges had been included, the performance would have been lower.
Class I, R3, R4, and R5 shares may not be available to all investors. Minimum investments for Class I shares may be higher than those for other classes.
| | | | |
Share Class | | NASDAQ Symbol | | Cusip |
Class A | | TIBAX | | 885-215-558 |
Class C | | TIBCX | | 885-215-541 |
Class I | | TIBIX | | 885-215-467 |
Class R3 | | TIBRX | | 885-215-384 |
Class R4 | | TIBGX | | 885-215-186 |
Class R5 | | TIBMX | | 885-215-236 |
Glossary
Blended Index – The Blended Index is composed of 25% Barclays Capital Aggregate Bond Index and 75% MSCI World Index. The Barclays Capital Aggregate Bond Index is composed of approximately 8,000 publicly traded bonds including U.S. government, mortgage-backed, corporate and Yankee bonds. The index is weighted by the market value of the bonds included in the index. The MSCI World Index is an unmanaged market-weighted index that consists of securities traded in 24 of the world’s most developed countries. Securities are listed on exchanges in the U.S., Europe, Canada, Australia, New Zealand, and the Far East. The index is calculated with net dividends reinvested, in U.S. dollars.
Russell 1000 Index – An index that measures the performance of the large-cap segment of the U.S. equity universe. It is a subset of the Russell 3000 Index and includes approximately 1,000 of the largest securities based on a combination of their market cap and current index membership.
Russell 2000 Index – An index that measures the performance of the small-cap segment of the U.S. equity universe. The Russell 2000 Index is a subset of the Russell 3000 Index including approximately 2,000 of the smallest securities based on a combination of their market cap and current index membership.
S&P 500 Stock Index – An unmanaged index generally representative of the U.S. stock market.
Unless otherwise noted, index returns reflect the reinvestment of income dividends and capital gains, if any, but do not reflect fees, brokerage commissions or other expenses of investing. Investors may not make direct investments into any index. The performance of any index is not indicative of the performance of any particular investment.
Bond Credit Ratings – A bond credit rating assesses the financial ability of a debt issuer to make timely payments of principal and interest. Ratings of AAA (the highest), AA, A, and BBB are investment-grade quality. Ratings of BB, B, CCC, CC, C, and D (the lowest) are considered below investment grade, speculative grade, or junk bonds. Unless otherwise noted, the ratings listed are from Bloomberg Market Data and are a combination of ratings from Standard and Poor’s, Moody’s Investors Service, and Fitch Ratings.
Coupon – The interest rate stated on a bond when it’s issued. The coupon is typically paid semi-annually.
Effective Duration – A bond’s sensitivity to interest rates, incorporating the embedded option features, such as call provisions. Bonds with longer durations experience greater price volatility than bonds with shorter durations.
Indicated Yield – The yield that a share of stock would return based on the most recent dividend payment. Indicated yield is calculated by dividing the indicated dividend by the current share price. It is usually quoted as a percentage.
Median Market Capitalization – Market capitalization (market cap) is the total value of a company’s stock, calculated by multiplying the number of outstanding common shares by the current share price. The company whose market cap is in the middle of the portfolio is the median market cap. Half the companies in the portfolio have values greater than the median, and half have values that are less.
Price to Earnings Ratio (P/E) – A valuation ratio equaling a company’s market value per share divided by earnings per share.
U.S. Treasury Securities – U.S. Treasury securities, such as bills, notes and bonds, are negotiable debt obligations of the U.S. government. These debt obligations are backed by the “full faith and credit” of the government and issued at various schedules and maturities. Income from Treasury securities is exempt from state and local, but not federal income taxes.
This page is not part of the Semi-Annual Report. 3
The Dividend Landscape
To appreciate the investment environment in which Thornburg Investment Income Builder Fund operates, you may wish to review these highlights of the “dividend landscape.”
The S&P 500 Index Payout Ratio — A Historical Perspective
The dividend payout ratio is a fraction that expresses dividend payments as a percentage of per-share earnings. As the economy slowed in the recent downturn, earnings-per-share on average declined, causing the payout ratio to climb, even as dividends paid by the S&P 500 portfolio declined by more than ten percent in 2010.
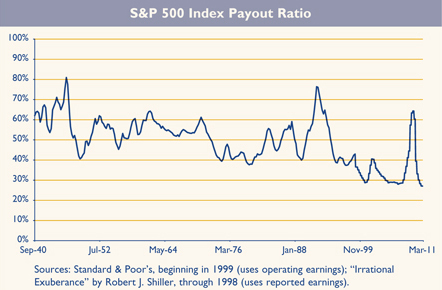
Corporate Willingness to Pay Dividends is Key to the Fund’s Investment Process
The Russell 1000 Index includes 1000 public companies that are supposed to be generally representative of corporate America. Between 1980 and 1993, at least 75% of these firms paid some dividend. Between 1994 and 2001, the percentage of Russell 1000 companies paying dividends sank to just over 50%, indicating a preference towards reinvesting retained earnings in growth initiatives. Dividends returned to fashion between 2002 and 2008, but the recent recession stalled dividend momentum.
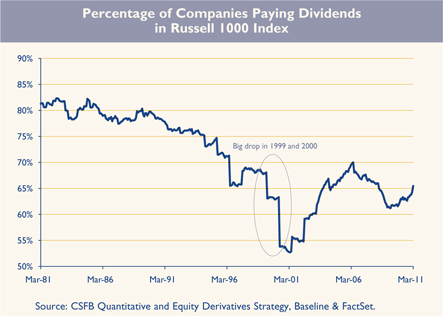
4 This page is not part of the Semi-Annual Report.
Rising Dividend Payments Despite Decreasing Dividend Yields

Over time, the dollar dividend per unit of the S&P 500 Index has generally increased. Because the price of the index itself has increased even more, the yield on the S&P 500 Index, as a percentage of the current index price, has generally decreased in recent decades. You should note, however, that the yield on the original investment made at a fixed point in time (say, 1970 or 1989) has increased, even without reinvestment of dividends.
Hypothetical chart is for illustration purposes only and is not indicative of an investment in any particular security. Investors may not invest directly in an index.
A Truly Diversified Dividend-Paying Portfolio Must Look Beyond the Obvious High Yield Stocks!
The Top 100 Dividend Yields
| | | | | | | | |
| | | Russell 1000
Index | | | Russell 2000
Index | |
Financials | | | 36 | % | | | 69 | % |
Utilities | | | 32 | % | | | 4 | % |
Consumer Staples | | | 9 | % | | | 2 | % |
Telecommunication Services | | | 6 | % | | | 5 | % |
Consumer Discretionary | | | 5 | % | | | 5 | % |
Health Care | | | 4 | % | | | 1 | % |
Industrials | | | 3 | % | | | 7 | % |
Energy | | | 2 | % | | | 5 | % |
Information Technology | | | 2 | % | | | 2 | % |
Materials | | | 1 | % | | | 0 | % |
Source: FactSet, as of March 31, 2011
In the (large cap) Russell 1000 Index, 68% of the top 100 dividend payers are in the financials and utilities sectors. In the (small cap) Russell 2000 Index, 69% of the top 100 dividend-yielding stocks are financial companies. In order to construct a diversified portfolio of attractive yielding stocks, one must look beyond these two sectors. We do!
Dividend yield is a ratio that shows how much a company pays out in dividends each year relative to its share price.
This page is not part of the Semi-Annual Report. 5
The Dividend Landscape,
Continued
Global Diversification Can Improve the Portfolio Yield
Since firms outside the U.S. tend to pay higher dividends than U.S. firms, particularly outside the real estate and utility sectors, we maintain the ability to diversify the Thornburg Investment Income Builder Fund into foreign dividend-paying stocks to try to take advantage of these opportunities.
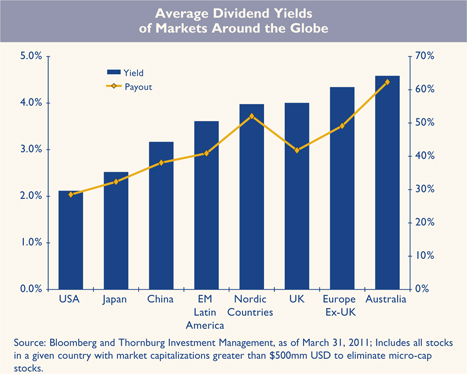
6 This page is not part of the Semi-Annual Report.
Portfolio Overview
Thornburg Investment Income Builder Fund

IMPORTANT
PERFORMANCE INFORMATION
Performance data shown represents past performance and is no guarantee of future results. Investment return and principal value will fluctuate so shares, when redeemed, may be worth more or less than their original cost. Current performance may be lower or higher than quoted. For performance current to the most recent month end, visit thornburg.com or call 800.847.0200.
The maximum sales charge for Class A shares is 4.50%. Class A shares are subject to a 1% 30-day redemption fee. The total annual fund operating expense of Class A shares is 1.25% , as disclosed in the most recent Prospectus.
We do not expect each sequential quarter’s dividend to increase over that of the prior quarter, since dividend payments outside the United States tend to be seasonal. Rather, the Fund aspires to increase the dividend paid on an annual basis.
QUARTERLY DIVIDEND HISTORY, CLASS A
| | | | | | | | | | | | | | | | | | | | |
Year | | Q1 | | | Q2 | | | Q3 | | | Q4 | | | Total | |
2003 | | | 9.2 | ¢ | | | 11.2 | ¢ | | | 12.4 | ¢ | | | 17.5 | ¢ | | | 50.3 | ¢ |
2004 | | | 10.2 | ¢ | | | 12.5 | ¢ | | | 15.0 | ¢ | | | 21.8 | ¢ | | | 59.5 | ¢ |
2005 | | | 11.0 | ¢ | | | 13.6 | ¢ | | | 17.4 | ¢ | | | 29.0 | ¢ | | | 71.0 | ¢ |
2006 | | | 12.5 | ¢ | | | 16.0 | ¢ | | | 19.2 | ¢ | | | 33.0 | ¢ | | | 80.7 | ¢ |
2007 | | | 14.2 | ¢ | | | 18.5 | ¢ | | | 21.5 | ¢ | | | 36.8 | ¢ | | | 91.0 | ¢ |
2008 | | | 17.9 | ¢ | | | 21.8 | ¢ | | | 26.0 | ¢ | | | 36.8 | ¢ | | | 102.5 | ¢ |
2009 | | | 18.0 | ¢ | | | 24.2 | ¢ | | | 28.0 | ¢ | | | 34.5 | ¢ | | | 104.7 | ¢ |
2010 | | | 19.8 | ¢ | | | 25.0 | ¢ | | | 32.0 | ¢ | | | 36.0 | ¢ | | | 112.8 | ¢ |
2011 | | | 21.0 | ¢ | | | | | | | | | | | | | | | | |
30-day SEC Yield as of March 31, 2011 (A Shares): 4.49%
KEY PORTFOLIO ATTRIBUTES
As of 3/31/11
| | | | |
Equity Statistics | | | | |
Portfolio P/E (12-mo. trailing) | | | 10.6x | |
Median Market Cap | | $ | 11.4 B | |
Equity & Pref. Equity Holdings | | | 90 | |
| |
Fixed Income Statistics | | | | |
Weighted Average Coupon | | | 7.7 | % |
Average Maturity | | | 11.52 yrs | |
Effective Duration | | | 3.84 yrs | |
Bond Holdings | | | 204 | |
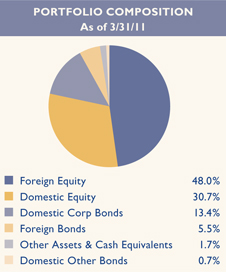
AVERAGE ANNUAL TOTAL RETURNS
FOR PERIODS ENDED 3/31/11
| | | | | | | | | | | | | | | | |
| | | 1 Yr | | | 3 Yrs | | | 5 Yrs | | | Since
Inception | |
A Shares (Incep: 12/24/02) | | | | | | | | | | | | | | | | |
Without sales charge | | | 13.58 | % | | | 4.92 | % | | | 7.26 | % | | | 12.26 | % |
With sales charge | | | 8.44 | % | | | 3.32 | % | | | 6.28 | % | | | 11.64 | % |
Blended Index (Since 12/24/02) | | | 11.71 | % | | | 1.62 | % | | | 3.41 | % | | | 7.87 | % |
S&P 500 Index (Since 12/24/02) | | | 15.65 | % | | | 2.35 | % | | | 2.62 | % | | | 7.02 | % |
| Blended | Index: 25% Barclays Capital Aggregate Bond Index/75% MSCI World Index |
This page is not part of the Semi-Annual Report. 7
Portfolio Overview,
Continued
The primary investment objective of Thornburg Investment Income Builder Fund is to provide a level of current income which exceeds the average yield on U.S. stocks, and which will generally grow, subject to periodic fluctuations, over the years on a per share basis. This objective remains constant over time. However, the specific investments we have used to try to reach our objective have changed over time. There is no guarantee the Fund will meet its investment objectives.
Business conditions for various industries and operating effectiveness at individual firms change over time. Investor preferences, expressed as both absolute and relative prices, also change over time. In the view of your portfolio management team, “some doors close and others open.” As shown in the tables below, the percentage industry allocations of your Fund evolve to reflect these changing conditions.
TOP TEN INDUSTRIES
As of 3/31/11
| | | | |
Telecommunication Services | | | 17.4 | % |
Energy | | | 13.2 | % |
Diversified Financials | | | 9.0 | % |
Utilities | | | 8.3 | % |
Food, Beverage & Tobacco | | | 7.3 | % |
Banks | | | 6.2 | % |
Insurance | | | 6.1 | % |
Pharmaceuticals, Biotechnology & Life Sciences | �� | | 6.1 | % |
Real Estate | | | 5.8 | % |
Semiconductors & Semiconductor Equipment | | | 3.0 | % |
TOP TEN INDUSTRIES
As of 9/30/10
| | | | |
Telecommunication Services | | | 17.5 | % |
Energy | | | 12.8 | % |
Diversified Financials | | | 10.0 | % |
Utilities | | | 8.0 | % |
Banks | | | 7.2 | % |
Food, Beverage & Tobacco | | | 6.4 | % |
Real Estate | | | 5.9 | % |
Insurance | | | 5.3 | % |
Semiconductors & Semiconductor Equipment | | | 3.5 | % |
Pharmaceuticals, Biotechnology & Life Sciences | | | 3.4 | % |
TOP TEN INDUSTRIES
As of 12/31/10
| | | | |
Telecommunication Services | | | 18.9 | % |
Energy | | | 13.6 | % |
Diversified Financials | | | 9.2 | % |
Utilities | | | 7.0 | % |
Banks | | | 6.9 | % |
Food, Beverage & Tobacco | | | 6.6 | % |
Real Estate | | | 5.6 | % |
Insurance | | | 4.8 | % |
Semiconductors & Semiconductor Equipment | | | 3.7 | % |
Pharmaceuticals, Biotechnology & Life Sciences | | | 3.4 | % |
TOP TEN INDUSTRIES
As of 6/30/10
| | | | |
Telecommunication Services | | | 16.0 | % |
Energy | | | 11.1 | % |
Diversified Financials | | | 10.0 | % |
Utilities | | | 9.7 | % |
Banks | | | 7.6 | % |
Real Estate | | | 6.7 | % |
Insurance | | | 5.7 | % |
Food, Beverage & Tobacco | | | 5.2 | % |
Semiconductors & Semiconductor Equipment | | | 3.7 | % |
Consumer Services | | | 3.2 | % |
8 This page is not part of the Semi-Annual Report.

Thornburg Investment Income Builder Fund
March 31, 2011
This report is certified under the Sarbanes-Oxley Act of 2002, which requires that public companies, including mutual funds, affirm that the information provided in their annual and semi-annual shareholder reports fully and fairly represents their financial position.
Certified Semi-Annual Report 9
Letter to Shareholders
April 18, 2011
Dear Fellow Shareholder:
This letter will review the basic results of Thornburg Investment Income Builder Fund’s investment activities for the six-month fiscal period ended March 31, 2011, and comment on the overall investment landscape, which continues to evolve in important ways.
Thornburg Investment Income Builder paid ordinary quarterly dividends of 57.0¢ per Class A share in the six-month period ending March 31, 2011, up 5% from 54.3¢ in the comparable six-month period of the prior fiscal year. The dividend per share was higher for Class I and R5 shares and lower for Class C, R3, and R4 shares, to account for varying class-specific expenses.
Your Fund’s net asset value increased by $1.30 per share during the six-month period under review, to $19.61, bringing the six-month total return to 10.29%. As another reference point, the net asset values of both the Class A and C shares two years earlier, March 31, 2009, were both $12.59.
Your Fund slightly underperformed its blended benchmark, the Blended Index (75% MSCI World Equity Index; 25% Barclays Capital Aggregate U.S. Bond Index) by 0.02% over the six-month period. The Fund underperformed the S&P 500 Index by 7.02% over the same period. Performance comparisons of Investment Income Builder Fund to each of these benchmarks over various longer periods are shown on page 7 of this report. Reviewing these, you will see that the performance of your Fund has compared very well to both benchmarks over longer periods.
In assessing the performance of your Fund, it is constructive to consider the performance in U.S. dollars (USD) of the sector components of the MSCI World Equity Index over the six months ended March 31, 2011. This comprises 75%, and the entire equity portion, of our global performance benchmark:
| | 1. | All ten Index sectors showed positive total returns, ranging from 3% (utilities) to more than 30% (energy). |
| | 2. | On average, performances of stocks of firms in the pro-cyclical energy, materials, industrials, and technology sectors delivered the strongest returns within the MSCI World Index. Stocks of firms in the consumer staples, health care, telecommunication, and utilities sectors lagged overall index performance. |
Performance data shown represents past performance and is no guarantee of future results. Investment return and principal value will fluctuate so shares, when redeemed, may be worth more or less than their original cost. Current performance may be lower or higher than quoted. For performance current to the most recent month end, visit thornburg.com or call 800.847.0200.
The maximum sales charge for Class A shares is 4.50%. Class A shares are subject to a 1% 30-day redemption fee. The total annual fund operating expense of Class A shares is 1.25%, as disclosed in the most recent Prospectus.
10 Certified Semi-Annual Report
Relative to the index weightings, Investment Income Builder had relatively large portfolio allocations in telecommunication services firms, energy, utilities, and financials. We continue to have large weightings in these industry sectors, where we find a relatively high concentration of cash generative dividend paying businesses.
Within the telecommunication sector, Verizon and Australia’s Telstra delivered good contributions to portfolio performance during the period. Italy’s ENEL caused our holdings in utilities to outperform the benchmark contribution from this sector.
Among the best contributing investments to portfolio performance from the financials sector were business development company Apollo Investment Corporation, a convertible preferred stock from Fifth Third Bancorp, recently listed Norwegian insurer Gjensidge, and German insurer Allianz. Within the energy sector, the Fund benefited from significant price appreciation in Canadian Oil Sands, Seadrill, and Royal Dutch Shell.
Other than investments in the four sectors just noted, Greek lottery operator OPAP, Norwegian fish farmer Marine Harvest, and global tobacco giant Philip Morris International performed well during the six-month period ended March 31, 2011.
Investment Income Builder’s under weightings to equities in the industrials, information technology, and materials sectors detracted from portfolio performance in the period under review. In general, these sectors have fewer high dividend payers, so we expect your portfolio’s under-allocation here to persist. Performance laggards from your portfolio for the period under review were China-based firms (China Mobile, Hopewell Holdings, Hopewell Highway Infrastructure, and Taiwan-based semiconductor chip maker Mediatek) and pharmaceutical firms Eli Lilly and Novartis. Each of these delivered modest negative total returns over the period.
Within its bond portfolio, Investment Income Builder owned significantly fewer U.S. government and agency bonds than the Barclays Index. This fact hurt the relative performance of the Fund’s portfolio in 2008, was quite helpful in 2009, and was marginally positive in 2010 and the first quarter of 2011. Market yields increased by about 0.2% during the first three months of 2011 on those U.S. government bonds with maturities longer than two years. That modest yield rise wasn’t enough to cause us to want a higher percentage of bonds in the portfolio. In fact, we modestly reduced portfolio capital invested in bonds during the period under review, due to both maturities and some selling of small or longer duration positions.
Readers of this commentary who are long-time shareholders of Investment Income Builder Fund will recall that the interest bearing debt portion of the Fund’s portfolio fell well below 20% during the “yield drought” between 2004 and 2007. For most of 2009, the Investment Income Builder portfolio was weighted more than 40% in interest bearing debt, as a result of large bond purchases we made in response to material increases in non-government bond yields over the four quarters ended March 31, 2009. We reduced our percentage holdings of cash and interest bearing debt in 2010 and Q1 2011, reaching a level of approximately 21.4% on March 31, 2011. We allocated the majority of new cash flow into equities in the March 2011 quarter.
Certified Semi-Annual Report 11
Letter to Shareholders,
Continued
The chart below shows that interest bearing investments as a percentage of the Fund’s portfolio have varied over time, ranging from less than 12% in mid 2005 to 45% at March 31, 2009.
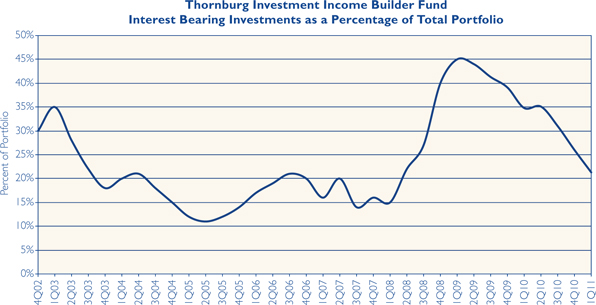
As of March 31, 2011, your portfolio included more than 200 bonds and hybrid securities, with an average cost of approximately 84% of the maturity value of these bonds. In general, secondary market prices of these bonds increased slightly over the six-month period ending March 31, 2011, so the average market price of these bonds on March 31st was just below 102% of maturity value.
In the six months ended March 31, 2011, approximately 70% of Income Builder’s income was derived from stock dividends, with the remaining 30% coming from interest. At March 31, 2011, domestic stocks, including preferred stocks, comprised around 31% of your portfolio; foreign stocks around 48%, and cash and interest bearing investments 21%.
In general, the sustainability of dividends from your portfolio holdings has exceeded that of most major index portfolios, which typically showed annual declines exceeding 20% during 2009. A recovery in dividend payments will take time to play out: the S&P 500 Index portfolio delivered an overall dividend increase of approximately 1.4% in 2010, though we expect a better increase for 2011. Readers should be aware that the reduced yields now available from bond investments and a very gradual recovery of corporate dividend payments following the reductions seen in 2009 will restrict our ability to increase the Fund’s dividend at the rates observed between 2003 and 2008.
12 Certified Semi-Annual Report
If the global economy recovers, we expect firming interest rates, better business conditions, and reduced anxiety from corporate boards about distributing retained earnings. To the extent that the global economy does not recover, and this is always a possibility, we can expect the opposite. The sharp recent rise in oil prices is not helpful to global economic growth. Widespread initiatives to reduce government fiscal deficits by a variety of G-10 countries may also constrain near-term growth, particularly if accompanied by tightening monetary conditions. The fact that Standard & Poor’s Corporation announced that United States Treasury debt obligations have been put on “credit watch” status, for possible downgrade from their current AAA rating, may sharpen the debate about fiscal responsibility that is beginning to unfold in Washington, DC.
Yields on taxable and tax-exempt money funds remain below 1/4 of one percent, and banks have aggressively reduced yields on all deposits. A very large pool of investor dollars is looking for better returns, but in sensible investment programs. This process was evidenced by the sizable flows of investor dollars into bond funds and individual bonds during 2010, and is beginning to be reflected in increased preference for dividend paying equities. We are optimistic that the types of income producing investments owned by Thornburg Investment Income Builder Fund will experience sustainable popularity among investors as their intrinsic values for income production are recognized. A high percentage of investor funds belong to people over the age of 55, for whom income is an increasingly necessary and desirable attribute.
Thank you for being a shareholder of Thornburg Investment Income Builder Fund. Remember that you can review descriptions of many of the stocks in your portfolio at your leisure by going to our internet site, www.thornburg.com/funds. Best wishes for a wonderful summer.
The matters discussed in this report may constitute forward-looking statements made pursuant to the safe harbor provisions of the Securities Litigation Reform Act of 1995. These include any advisor or portfolio manager prediction, assessment, analysis or outlook for individual securities, industries, investment styles, market sectors and/or markets. These statements involve risks and uncertainties. In addition to the general risks described for each fund in its current prospectus, other factors bearing on these reports include the accuracy of the advisor’s or portfolio manager’s forecasts and predictions, the appropriateness of the investment strategies designed by the advisor or portfolio manager, and the ability of the advisor or portfolio manager to implement their strategies efficiently and successfully. Any one or more of these factors, as well as other risks affecting the securities markets generally, could cause the actual results of any fund to differ materially as compared to its benchmarks.
Certified Semi-Annual Report 13
| | |
| SCHEDULE OF INVESTMENTS | | |
| |
| Thornburg Investment Income Builder Fund | | March 31, 2011 (Unaudited) |
SUMMARY OF INDUSTRY EXPOSURE
As of 3/31/11
| | | | |
Telecommunication Services | | | 17.4 | % |
Energy | | | 13.2 | % |
Diversified Financials | | | 9.0 | % |
Utilities | | | 8.3 | % |
Food, Beverage & Tobacco | | | 7.3 | % |
Banks | | | 6.2 | % |
Insurance | | | 6.1 | % |
Pharmaceuticals, Biotechnology & Life Sciences | | | 6.1 | % |
Real Estate | | | 5.8 | % |
Semiconductors & Semiconductor Equipment | | | 3.0 | % |
Software & Services | | | 2.7 | % |
Consumer Services | | | 2.5 | % |
Materials | | | 2.1 | % |
Transportation | | | 2.1 | % |
Food & Staples Retailing | | | 1.1 | % |
Retailing | | | 0.9 | % |
Miscellaneous | | | 0.7 | % |
Capital Goods | | | 0.6 | % |
Household & Personal Products | | | 0.5 | % |
Media | | | 0.5 | % |
Health Care Equipment & Services | | | 0.3 | % |
Technology Hardware & Equipment | | | 0.3 | % |
Industrials | | | 0.1 | % |
Automobiles & Components | | | 0.1 | % |
Commercial & Professional Services * | | | 0.0 | % |
Other Non-Classified Securities: | | | | |
Exchange Traded Funds | | | 0.7 | % |
Asset Backed Securities | | | 0.3 | % |
Other Securities | | | 0.3 | % |
U.S. Government Agencies | | | 0.1 | % |
Municipal Bonds * | | | 0.0 | % |
Other Assets & Cash Equivalents | | | 1.7 | % |
| * | Industry percentage was less than 0.1%. |
TOP TEN EQUITY HOLDINGS
As of 3/31/11
| | | | |
Telstra Corp. Ltd. | | | 2.8 | % |
Enel S.p.A. | | | 2.7 | % |
Total SA | | | 2.4 | % |
Royal Dutch Shell plc ADR | | | 2.3 | % |
Philip Morris International, Inc. | | | 2.3 | % |
Pfizer, Inc. | | | 2.2 | % |
Eni SpA | | | 2.1 | % |
Telefonica SA | | | 2.0 | % |
Vodafone Group plc | | | 1.9 | % |
Koninklijke KPN N.V. | | | 1.9 | % |
14 Certified Semi-Annual Report
| | |
| SCHEDULE OF INVESTMENTS, CONTINUED | | |
| |
| Thornburg Investment Income Builder Fund | | March 31, 2011 (Unaudited) |
SUMMARY OF COUNTRY EXPOSURE
As of 3/31/11
| | | | |
United States | | | 44.6 | % |
Switzerland | | | 7.5 | % |
Australia | | | 6.8 | % |
Italy | | | 5.7 | % |
France | | | 5.2 | % |
Netherlands | | | 4.8 | % |
Norway | | | 3.5 | % |
Germany | | | 2.5 | % |
Spain | | | 2.5 | % |
United Kingdom | | | 2.1 | % |
Canada | | | 1.9 | % |
China | | | 1.5 | % |
Taiwan | | | 1.3 | % |
Mexico | | | 1.1 | % |
Hong Kong | | | 1.1 | % |
South Korea | | | 1.0 | % |
Greece | | | 0.8 | % |
Brazil | | | 0.7 | % |
Bermuda | | | 0.6 | % |
Singapore | | | 0.6 | % |
Luxembourg | | | 0.6 | % |
Thailand | | | 0.5 | % |
South Africa | | | 0.5 | % |
Cayman Islands | | | 0.3 | % |
Malaysia | | | 0.2 | % |
Japan | | | 0.2 | % |
Russia | | | 0.1 | % |
Trinidad and Tobago | | | 0.1 | % |
Indonesia * | | | 0.0 | % |
Chile * | | | 0.0 | % |
Other Assets & Cash Equivalents | | | 1.7 | % |
| * | Country percentage was less than 0.1%. |
| | | | | | | | |
| | | Shares/
Principal
Amount | | | Value | |
COMMON STOCK — 74.67% | | | | | | | | |
| | |
BANKS — 2.74% | | | | | | | | |
COMMERCIAL BANKS — 2.27% | | | | | | | | |
Banque Cantonale Vaudoise | | | 55,100 | | | $ | 31,224,333 | |
Intesa Sanpaolo | | | 14,296,800 | | | | 37,787,542 | |
Liechtensteinische Landesbank AG | | | 1,150,000 | | | | 92,150,245 | |
St. Galler Kantonalbank | | | 63,124 | | | | 32,644,420 | |
THRIFTS & MORTGAGE FINANCE — 0.47% | | | | | | | | |
Capitol Federal Financial, Inc. | | | 3,600,000 | | | | 40,572,000 | |
| | | | | | | | |
| | | | | | | 234,378,540 | |
| | | | | | | | |
| | |
CAPITAL GOODS — 0.25% | | | | | | | | |
INDUSTRIAL CONGLOMERATES — 0.25% | | | | | | | | |
NWS Holdings Ltd. | | | 13,821,000 | | | | 21,144,031 | |
| | | | | | | | |
| | | | | | | 21,144,031 | |
| | | | | | | | |
| | |
CONSUMER SERVICES — 2.31% | | | | | | | | |
HOTELS, RESTAURANTS & LEISURE — 2.31% | | | | | | | | |
Berjaya Sports Toto Berhad | | | 14,600,000 | | | | 20,535,204 | |
McDonald’s Corp. | | | 1,461,500 | | | | 111,205,535 | |
OPAP SA | | | 3,056,300 | | | | 65,447,251 | |
| | | | | | | | |
| | | | | | | 197,187,990 | |
| | | | | | | | |
| | |
DIVERSIFIED FINANCIALS — 5.89% | | | | | | | | |
CAPITAL MARKETS — 3.98% | | | | | | | | |
AllianceBernstein Holdings LP | | | 900,000 | | | | 19,620,000 | |
Certified Semi-Annual Report 15
| | |
| SCHEDULE OF INVESTMENTS, CONTINUED | | |
| |
| Thornburg Investment Income Builder Fund | | March 31, 2011 (Unaudited) |
| | | | | | | | |
| | | Shares/
Principal
Amount | | | Value | |
Apollo Investment Corp. | | | 8,579,600 | | | $ | 103,469,976 | |
Ares Capital Corp. | | | 5,206,400 | | | | 87,988,160 | |
Och-Ziff Capital Management Group | | | 2,400,000 | | | | 39,168,000 | |
aSolar Capital Ltd. | | | 3,600,000 | | | | 85,968,000 | |
aSolar Capital Ltd. | | | 150,000 | | | | 3,582,000 | |
DIVERSIFIED FINANCIAL SERVICES — 1.91% | | | | | | | | |
Bolsas y Mercados Espanoles | | | 885,600 | | | | 26,946,392 | |
Hong Kong Exchanges & Clearing Ltd. | | | 2,317,300 | | | | 50,257,247 | |
KKR Financial Holdings, LLC | | | 8,800,000 | | | | 86,152,000 | |
| | | | | | | | |
| | | | | | | 503,151,775 | |
| | | | | | | | |
| | |
ENERGY — 10.21% | | | | | | | | |
ENERGY EQUIPMENT & SERVICES — 1.86% | | | | | | | | |
Seadrill Ltd. | | | 4,380,794 | | | | 158,430,234 | |
OIL, GAS & CONSUMABLE FUELS — 8.35% | | | | | | | | |
Canadian Oil Sands Ltd. | | | 3,846,500 | | | | 129,618,520 | |
Eni SpA | | | 7,406,300 | | | | 181,899,216 | |
Origin Energy Ltd. | | | 37,076 | | | | 622,030 | |
Royal Dutch Shell plc ADR | | | 2,698,200 | | | | 196,590,852 | |
Total SA | | | 3,359,900 | | | | 204,536,603 | |
| | | | | | | | |
| | | | | | | 871,697,455 | |
| | | | | | | | |
| | |
FOOD & STAPLES RETAILING — 0.95% | | | | | | | | |
FOOD & STAPLES RETAILING — 0.95% | | | | | | | | |
Sysco Corp. | | | 2,942,300 | | | | 81,501,710 | |
| | | | | | | | |
| | | | | | | 81,501,710 | |
| | | | | | | | |
| | |
FOOD, BEVERAGE & TOBACCO — 6.82% | | | | | | | | |
BEVERAGES — 1.92% | | | | | | | | |
Coca Cola Co. | | | 2,462,400 | | | | 163,380,240 | |
FOOD PRODUCTS — 2.65% | | | | | | | | |
Kraft Foods, Inc. | | | 3,158,400 | | | | 99,047,424 | |
Marine Harvest | | | 33,299,000 | | | | 41,365,966 | |
Nestle SA | | | 1,500,000 | | | | 85,982,580 | |
TOBACCO — 2.25% | | | | | | | | |
Philip Morris International, Inc. | | | 2,928,900 | | | | 192,223,707 | |
| | | | | | | | |
| | | | | | | 581,999,917 | |
| | | | | | | | |
| | |
HOUSEHOLD & PERSONAL PRODUCTS — 0.52% | | | | | | | | |
HOUSEHOLD PRODUCTS — 0.52% | | | | | | | | |
Kimberly-Clark Corp. | | | 675,000 | | | | 44,057,250 | |
| | | | | | | | |
| | | | | | | 44,057,250 | |
| | | | | | | | |
| | |
INSURANCE — 3.78% | | | | | | | | |
INSURANCE — 3.78% | | | | | | | | |
Allianz SE | | | 310,700 | | | | 43,605,272 | |
bGjensidige Forsikring ASA | | | 8,219,200 | | | | 99,131,258 | |
MunichRe AG | | | 482,800 | | | | 75,948,850 | |
Scor SE | | | 1,000,000 | | | | 27,231,487 | |
Zurich Financial Services AG | | | 276,000 | | | | 77,255,961 | |
| | | | | | | | |
| | | | | | | 323,172,828 | |
| | | | | | | | |
16 Certified Semi-Annual Report
| | |
| SCHEDULE OF INVESTMENTS, CONTINUED | | |
| |
| Thornburg Investment Income Builder Fund | | March 31, 2011 (Unaudited) |
| | | | | | | | |
| | | Shares/
Principal
Amount | | | Value | |
MATERIALS — 1.50% | | | | | | | | |
METALS & MINING — 1.50% | | | | | | | | |
Impala Platinum Holdings Ltd. | | | 1,349,900 | | | $ | 39,058,304 | |
Southern Copper Corp. | | | 2,200,000 | | | | 88,594,000 | |
| | | | | | | | |
| | | | | | | 127,652,304 | |
| | | | | | | | |
| | |
PHARMACEUTICALS, BIOTECHNOLOGY & LIFE SCIENCES — 5.92% | | | | | | | | |
PHARMACEUTICALS — 5.92% | | | | | | | | |
Novartis AG | | | 3,007,800 | | | | 163,144,906 | |
Pfizer, Inc. | | | 9,114,000 | | | | 185,105,340 | |
Roche Holding AG | | | 1,100,000 | | | | 157,125,748 | |
| | | | | | | | |
| | | | | | | 505,375,994 | |
| | | | | | | | |
| | |
REAL ESTATE — 5.38% | | | | | | | | |
REAL ESTATE INVESTMENT TRUSTS — 5.03% | | | | | | | | |
Annaly Capital Management, Inc. | | | 4,567,200 | | | | 79,697,640 | |
Anworth Mortgage Asset Corp. | | | 3,067,800 | | | | 21,750,702 | |
Capstead Mortgage Corp. | | | 1,779,987 | | | | 22,748,234 | |
Chimera Investment Corp. | | | 15,742,600 | | | | 62,340,696 | |
Dexus Property Group | | | 78,947,249 | | | | 69,410,205 | |
Dynex Capital, Inc. | | | 1,100,000 | | | | 11,066,000 | |
Invesco Mortgage Capital, Inc. | | | 3,000,000 | | | | 65,550,000 | |
MFA Financial, Inc. | | | 11,850,000 | | | | 97,170,000 | |
REAL ESTATE MANAGEMENT & DEVELOPMENT — 0.35% | | | | | | | | |
Hopewell Holdings Ltd. | | | 9,991,500 | | | | 29,800,258 | |
| | | | | | | | |
| | | | | | | 459,533,735 | |
| | | | | | | | |
| | |
RETAILING — 0.76% | | | | | | | | |
MULTILINE RETAIL — 0.76% | | | | | | | | |
David Jones Ltd. | | | 13,231,303 | | | | 65,007,524 | |
| | | | | | | | |
| | | | | | | 65,007,524 | |
| | | | | | | | |
| | |
SEMICONDUCTORS & SEMICONDUCTOR EQUIPMENT — 2.88% | | | | | | | | |
SEMICONDUCTORS & SEMICONDUCTOR EQUIPMENT — 2.88% | | | | | | | | |
Intel Corp. | | | 6,765,500 | | | | 136,460,135 | |
Mediatek, Inc. | | | 1,182,235 | | | | 13,588,677 | |
Taiwan Semiconductor Manufacturing Co. Ltd. | | | 40,000,000 | | | | 96,033,190 | |
| | | | | | | | |
| | | | | | | 246,082,002 | |
| | | | | | | | |
| | |
SOFTWARE & SERVICES — 2.35% | | | | | | | | |
INFORMATION TECHNOLOGY SERVICES — 0.75% | | | | | | | | |
Paychex, Inc. | | | 2,032,700 | | | | 63,745,472 | |
SOFTWARE — 1.60% | | | | | | | | |
Microsoft Corp. | | | 5,400,000 | | | | 136,944,000 | |
| | | | | | | | |
| | | | | | | 200,689,472 | |
| | | | | | | | |
| | |
TELECOMMUNICATION SERVICES — 16.04% | | | | | | | | |
DIVERSIFIED TELECOMMUNICATION SERVICES — 11.56% | | | | | | | | |
AT&T, Inc. | | | 2,876,100 | | | | 88,008,660 | |
France Telecom SA | | | 4,241,700 | | | | 95,039,203 | |
Koninklijke KPN N.V. | | | 9,701,600 | | | | 165,264,204 | |
Qwest Communications International, Inc. | | | 4,900,400 | | | | 33,469,732 | |
Singapore Telecommunications Ltd. | | | 21,628,700 | | | | 51,819,654 | |
Certified Semi-Annual Report 17
| | |
| SCHEDULE OF INVESTMENTS, CONTINUED | | |
| |
| Thornburg Investment Income Builder Fund | | March 31, 2011 (Unaudited) |
| | | | | | | | |
| | | Shares/
Principal
Amount | | | Value | |
Telecom Italia-RSP S.p.A. | | | 12,230,500 | | | $ | 16,449,072 | |
Telecom Italia S.p.A. | | | 15,929,200 | | | | 24,493,715 | |
Telefonica SA | | | 6,904,074 | | | | 172,842,303 | |
Telstra Corp. Ltd. | | | 81,957,000 | | | | 239,057,604 | |
Verizon Communications, Inc. | | | 2,609,000 | | | | 100,550,860 | |
WIRELESS TELECOMMUNICATION SERVICES — 4.48% | | | | | | | | |
Advanced Info Service Public Company Ltd. | | | 15,190,452 | | | | 45,202,205 | |
China Mobile Ltd. | | | 11,151,207 | | | | 102,716,313 | |
SK Telecom Co. Ltd. | | | 463,500 | | | | 69,084,507 | |
Vodafone Group plc | | | 58,677,100 | | | | 166,139,016 | |
| | | | | | | | |
| | | | | | | 1,370,137,048 | |
| | | | | | | | |
| | |
TRANSPORTATION — 1.05% | | | | | | | | |
TRANSPORTATION INFRASTRUCTURE — 1.05% | | | | | | | | |
Hopewell Highway Infrastructure Ltd. | | | 15,722,341 | | | | 10,773,226 | |
MAp Airports | | | 25,090,909 | | | | 78,896,435 | |
| | | | | | | | |
| | | | | | | 89,669,661 | |
| | | | | | | | |
| | |
UTILITIES — 5.32% | | | | | | | | |
ELECTRIC UTILITIES — 4.11% | | | | | | | | |
E. ON AG | | | 3,033,600 | | | | 92,648,108 | |
Enel S.p.A. | | | 35,912,700 | | | | 226,382,995 | |
Entergy Corp. | | | 483,567 | | | | 32,500,538 | |
MULTI-UTILITIES — 1.21% | | | | | | | | |
GDF Suez | | | 2,528,333 | | | | 103,015,621 | |
| | | | | | | | |
| | | | | | | 454,547,262 | |
| | | | | | | | |
TOTAL COMMON STOCK (Cost $5,722,426,139) | | | | | | | 6,376,986,498 | |
| | | | | | | | |
| | |
PREFERRED STOCK — 4.03% | | | | | | | | |
| | |
BANKS — 2.42% | | | | | | | | |
COMMERCIAL BANKS — 2.42% | | | | | | | | |
Barclays Bank plc Pfd, 7.10% | | | 200,000 | | | | 5,044,000 | |
Fifth Third Bancorp Pfd, 8.50% | | | 564,789 | | | | 83,588,772 | |
cFirst Tennessee Bank Pfd, 3.75% | | | 12,000 | | | | 7,781,250 | |
Huntington Bancshares Pfd, 8.50% | | | 95,087 | | | | 110,538,638 | |
| | | | | | | | |
| | | | | | | 206,952,660 | |
| | | | | | | | |
| | |
DIVERSIFIED FINANCIALS — 0.30% | | | | | | | | |
CAPITAL MARKETS — 0.03% | | | | | | | | |
Morgan Stanley Pfd, 4.00% | | | 120,000 | | | | 2,482,800 | |
DIVERSIFIED FINANCIAL SERVICES — 0.27% | | | | | | | | |
Bank of America Corp. Pfd, 3.00% | | | 420,000 | | | | 7,182,000 | |
Citigroup Capital XII Pfd, 8.50% | | | 600,000 | | | | 15,798,000 | |
| | | | | | | | |
| | | | | | | 25,462,800 | |
| | | | | | | | |
| | |
INSURANCE — 0.23% | | | | | | | | |
INSURANCE — 0.23% | | | | | | | | |
Principal Financial Group Pfd, 5.563% | | | 201,500 | | | | 19,192,875 | |
| | | | | | | | |
| | | | | | | 19,192,875 | |
| | | | | | | | |
18 Certified Semi-Annual Report
| | |
| SCHEDULE OF INVESTMENTS, CONTINUED | | |
| |
| Thornburg Investment Income Builder Fund | | March 31, 2011 (Unaudited) |
| | | | | | | | |
| | | Shares/
Principal
Amount | | | Value | |
MISCELLANEOUS — 0.12% | | | | | | | | |
U.S. GOVERNMENT AGENCIES — 0.12% | | | | | | | | |
Farm Credit Bank of Texas Pfd, 10.00% | | | 9,000 | | | $ | 10,085,625 | |
| | | | | | | | |
| | | | | | | 10,085,625 | |
| | | | | | | | |
| | |
REAL ESTATE — 0.19% | | | | | | | | |
REAL ESTATE INVESTMENT TRUSTS — 0.19% | | | | | | | | |
cSovereign REIT Pfd, 12.00% | | | 4,000 | | | | 4,640,000 | |
Alexandria Real Estate Pfd, 7.00% | | | 463,500 | | | | 11,911,950 | |
| | | | | | | | |
| | | | | | | 16,551,950 | |
| | | | | | | | |
| | |
TECHNOLOGY HARDWARE & EQUIPMENT — 0.24% | | | | | | | | |
COMMUNICATIONS EQUIPMENT — 0.24% | | | | | | | | |
Lucent Technologies Capital Trust I Pfd, 7.75% | | | 20,500 | | | | 20,090,000 | |
| | | | | | | | |
| | | | | | | 20,090,000 | |
| | | | | | | | |
| | |
TELECOMMUNICATION SERVICES — 0.19% | | | | | | | | |
WIRELESS TELECOMMUNICATION SERVICES — 0.19% | | | | | | | | |
cCentaur Funding Corp. Pfd, 9.08% | | | 15,000 | | | | 16,575,000 | |
| | | | | | | | |
| | | | | | | 16,575,000 | |
| | | | | | | | |
| | |
UTILITIES — 0.34% | | | | | | | | |
MULTI-UTILITIES — 0.34% | | | | | | | | |
Centerpoint Energy, Inc. Pfd, 7.5% | | | 850,000 | | | | 29,378,125 | |
| | | | | | | | |
TOTAL PREFERRED STOCK (Cost $279,229,416) | | | | | | | 344,289,035 | |
| | | | | | | | |
| | |
EXCHANGE TRADED FUNDS — 0.67% | | | | | | | | |
iShares High Yield Corporate Bond | | | 625,000 | | | | 57,475,000 | |
| | | | | | | | |
TOTAL EXCHANGE TRADED FUNDS (Cost $46,047,908) | | | | | | | 57,475,000 | |
| | | | | | | | |
| | |
ASSET BACKED SECURITIES — 0.32% | | | | | | | | |
| | |
BANKS — 0.05% | | | | | | | | |
COMMERCIAL BANKS — 0.05% | | | | | | | | |
Wells Fargo Asset Securities Corp., Series 2005-AR2 Class B1, 2.744%, 2/25/2035 | | $ | 10,236,114 | | | | 2,028,569 | |
Wells Fargo Asset Securities Corp., Series 2005-AR2 Class B1, 3.483%, 3/25/2035 | | | 9,638,574 | | | | 1,925,821 | |
| | | | | | | | |
| | | | | | | 3,954,390 | |
| | | | | | | | |
| | |
DIVERSIFIED FINANCIALS — 0.24% | | | | | | | | |
CAPITAL MARKETS — 0.17% | | | | | | | | |
Bear Stearns ARM Mtg Series 2003-6 Class 2B-1, 2.803%, 8/25/2033 | | | 606,247 | | | | 441,707 | |
Merrill Lynch Mtg Investors Trust, 2.787%, 8/25/2034 | | | 6,246,915 | | | | 5,195,743 | |
Morgan Stanley Capital, Inc. Series 2005-HE7 Class A2C, 0.57%, 11/25/2035 | | | 10,425,633 | | | | 9,245,845 | |
DIVERSIFIED FINANCIAL SERVICES — 0.07% | | | | | | | | |
Banc of America Funding Corp. Series 2006-I Class SB1, 3.407%, 12/20/2036 | | | 3,245,330 | | | | 672,015 | |
Banc of America Mtg Securities Series 2005-A Class B1, 3.236%, 2/25/2035 | | | 5,218,270 | | | | 2,346,851 | |
Citigroup Mtg Loan Trust, Inc., 2.886%, 3/25/2034 | | | 1,525,936 | | | | 1,276,958 | |
Structured Asset Security Corp. Series 2002-27A Class B1, 2.53%, 1/25/2033 | | | 2,578,579 | | | | 1,346,937 | |
| | | | | | | | |
| | | | | | | 20,526,056 | |
| | | | | | | | |
Certified Semi-Annual Report 19
| | |
| SCHEDULE OF INVESTMENTS, CONTINUED | | |
| |
| Thornburg Investment Income Builder Fund | | March 31, 2011 (Unaudited) |
| | | | | | | | |
| | | Shares/
Principal
Amount | | | Value | |
PHARMACEUTICALS, BIOTECHNOLOGY & LIFE SCIENCES — 0.03% | | | | | | | | |
PHARMACEUTICALS — 0.03% | | | | | | | | |
cQHP PhaRMA, 10.25%, 3/15/2015 | | $ | 2,759,390 | | | $ | 2,812,039 | |
| | | | | | | | |
TOTAL ASSET BACKED SECURITIES (Cost $47,235,295) | | | | | | | 27,292,485 | |
| | | | | | | | |
| | |
CORPORATE BONDS — 13.94% | | | | | | | | |
| | |
AUTOMOBILES & COMPONENTS — 0.07% | | | | | | | | |
AUTOMOBILES — 0.07% | | | | | | | | |
cAmerican Honda Finance, 7.625%, 10/1/2018 | | | 5,000,000 | | | | 6,147,165 | |
| | | | | | | | |
| | | | | | | 6,147,165 | |
| | | | | | | | |
| | |
BANKS — 1.04% | | | | | | | | |
COMMERCIAL BANKS — 1.04% | | | | | | | | |
c,dAlfa Diversified, 2.31%, 3/15/2012 | | | 1,750,000 | | | | 1,740,935 | |
c,dBanco Industrial e Comercial S.A., 6.25%, 1/20/2013 | | | 9,000,000 | | | | 9,270,000 | |
Fifth Third Bancorp, 6.25%, 5/1/2013 | | | 2,750,000 | | | | 2,982,966 | |
c,dGroupe BPCE, 12.50%, 8/29/2049 | | | 13,211,000 | | | | 14,821,025 | |
b,c,d,e,f Landsbanki Islands HF, 7.431%, 12/31/2049 | | | 5,000,000 | | | | 0 | |
National City Preferred Capital Trust I, 12.00%, 12/29/2049 | | | 3,250,000 | | | | 3,686,215 | |
PNC Financial Services Group, Inc., 8.25%, 5/29/2049 | | | 10,000,000 | | | | 10,554,680 | |
cPNC Preferred Funding Trust III, 8.70%, 12/31/2049 | | | 4,500,000 | | | | 4,812,390 | |
Provident Bank of Maryland, 9.50%, 5/1/2018 | | | 5,600,000 | | | | 6,184,881 | |
dShinhan Bank, 6.819%, 9/20/2036 | | | 900,000 | | | | 936,400 | |
Silicon Valley Bank, 6.05%, 6/1/2017 | | | 26,713,000 | | | | 27,994,610 | |
Wells Fargo Capital XIII Preferred Note, 7.70%, 12/29/2049 | | | 2,500,000 | | | | 2,575,000 | |
Zions Bancorp, 7.75%, 9/23/2014 | | | 3,000,000 | | | | 3,258,048 | |
| | | | | | | | |
| | | | | | | 88,817,150 | |
| | | | | | | | |
| | |
CAPITAL GOODS — 0.37% | | | | | | | | |
INDUSTRIAL CONGLOMERATES — 0.22% | | | | | | | | |
Otter Tail Corp., 9.00%, 12/15/2016 | | | 17,000,000 | | | | 19,252,500 | |
TRADING COMPANIES & DISTRIBUTORS — 0.15% | | | | | | | | |
cInternational Lease Finance Corp. E-Capital Trust I, 5.97%, 12/21/2065 | | | 15,000,000 | | | | 12,483,150 | |
| | | | | | | | |
| | | | | | | 31,735,650 | |
| | | | | | | | |
| | |
COMMERCIAL & PROFESSIONAL SERVICES — 0.01% | | | | | | | | |
COMMERCIAL SERVICES & SUPPLIES — 0.01% | | | | | | | | |
Allied Waste North America, Inc., 6.375%, 4/15/2011 | | | 500,000 | | | | 500,704 | |
| | | | | | | | |
| | | | | | | 500,704 | |
| | | | | | | | |
| | |
CONSUMER SERVICES — 0.04% | | | | | | | | |
HOTELS, RESTAURANTS & LEISURE — 0.04% | | | | | | | | |
cSeneca Nation Indians Capital Improvements Authority, 6.75%, 12/1/2013 | | | 3,040,000 | | | | 2,992,059 | |
| | | | | | | | |
| | | | | | | 2,992,059 | |
| | | | | | | | |
| | |
DIVERSIFIED FINANCIALS — 1.26% | | | | | | | | |
CAPITAL MARKETS — 0.10% | | | | | | | | |
Goldman Sachs Group, Inc., 5.625%, 1/15/2017 | | | 8,000,000 | | | | 8,430,480 | |
CONSUMER FINANCE — 0.57% | | | | | | | | |
American Express Credit Co., 5.875%, 5/2/2013 | | | 5,000,000 | | | | 5,398,520 | |
Capital One Capital IV, 6.745%, 2/17/2037 | | | 6,400,000 | | | | 6,424,000 | |
20 Certified Semi-Annual Report
| | |
| SCHEDULE OF INVESTMENTS, CONTINUED | | |
| |
| Thornburg Investment Income Builder Fund | | March 31, 2011 (Unaudited) |
| | | | | | | | |
| | | Shares/
Principal
Amount | | | Value | |
Capital One Financial Corp., 6.15%, 9/1/2016 | | $ | 25,000,000 | | | $ | 27,376,525 | |
SLM Corp., 4.00%, 7/25/2014 | | | 2,000,000 | | | | 1,935,200 | |
SLM Corp. LIBOR Floating Rate Note, 0.603%, 1/27/2014 | | | 5,000,000 | | | | 4,742,130 | |
cTMX Finance LLC/TitleMax Finance Corp., 13.25%, 7/15/2015 | | | 2,500,000 | | | | 2,775,000 | |
DIVERSIFIED FINANCIAL SERVICES — 0.59% | | | | | | | | |
Citigroup, Inc., 5.00%, 9/15/2014 | | | 16,250,000 | | | | 16,968,298 | |
dExport-Import Bank of Korea, 8.125%, 1/21/2014 | | | 2,750,000 | | | | 3,152,394 | |
JPMorgan Chase & Co., 7.90%, 4/29/2049 | | | 15,000,000 | | | | 16,411,650 | |
dKorea Development Bank, 5.30%, 1/17/2013 | | | 800,000 | | | | 844,480 | |
MBNA Corp., 6.125%, 3/1/2013 | | | 2,000,000 | | | | 2,139,704 | |
National Rural Utilities CFC, 10.375%, 11/1/2018 | | | 5,000,000 | | | | 6,826,875 | |
cSquareTwo Financial Corp., 11.625%, 4/1/2017 | | | 4,000,000 | | | | 4,060,000 | |
| | | | | | | | |
| | | | | | | 107,485,256 | |
| | | | | | | | |
| | |
ENERGY — 3.07% | | | | | | | | |
ENERGY EQUIPMENT & SERVICES — 0.31% | | | | | | | | |
Nabors Industries, Inc., 9.25%, 1/15/2019 | | | 10,500,000 | | | | 13,235,786 | |
c,dRDS Ultra-Deepwater Ltd., 11.875%, 3/15/2017 | | | 9,400,000 | | | | 10,293,000 | |
Seacor Holdings, Inc., 7.375%, 10/1/2019 | | | 2,000,000 | | | | 2,127,522 | |
Seitel, Inc., 9.75%, 2/15/2014 | | | 1,000,000 | | | | 1,005,000 | |
OIL, GAS & CONSUMABLE FUELS — 2.76% | | | | | | | | |
cBlack Elk Energy Offshore, 13.75%, 12/1/2015 | | | 16,750,000 | | | | 17,085,000 | |
c,dBumi Capital PTE, Ltd., 12.00%, 11/10/2016 | | | 3,000,000 | | | | 3,502,500 | |
cDCP Midstream LLC, 9.75%, 3/15/2019 | | | 5,000,000 | | | | 6,444,520 | |
Enbridge Energy Partners LP, 9.875%, 3/1/2019 | | | 9,750,000 | | | | 12,744,176 | |
cEnogex LLC, 6.875%, 7/15/2014 | | | 2,000,000 | | | | 2,190,224 | |
cEnogex LLC, 6.25%, 3/15/2020 | | | 2,500,000 | | | | 2,685,028 | |
Enterprise Products Operating LP, 9.75%, 1/31/2014 | | | 4,000,000 | | | | 4,793,024 | |
Enterprise Products Operating LP, 7.034%, 1/15/2068 | | | 22,880,000 | | | | 23,738,000 | |
cGaz Capital SA, 8.146%, 4/11/2018 | | | 2,000,000 | | | | 2,357,400 | |
b,c,fGriffin Coal Mining Ltd., 9.50%, 12/1/2016 | | | 17,000,000 | | | | 15,852,500 | |
cGS Caltex Corp., 7.25%, 7/2/2013 | | | 7,000,000 | | | | 7,689,430 | |
Kinder Morgan Energy Partners LP, 9.00%, 2/1/2019 | | | 8,000,000 | | | | 10,153,384 | |
cMaritimes & Northeast Pipeline LLC, 7.50%, 5/31/2014 | | | 7,041,750 | | | | 7,616,638 | |
Murphy Oil Corp., 6.375%, 5/1/2012 | | | 5,000,000 | | | | 5,257,155 | |
Niska Gas Storage, 8.875%, 3/15/2018 | | | 8,739,000 | | | | 9,503,662 | |
NuStar Logistics, 7.65%, 4/15/2018 | | | 18,000,000 | | | | 21,015,090 | |
Oneok Partners LP, 8.625%, 3/1/2019 | | | 8,000,000 | | | | 10,062,544 | |
Oneok Partners LP, 5.90%, 4/1/2012 | | | 3,000,000 | | | | 3,139,563 | |
c,dPetro Co. Trinidad Tobago Ltd., 9.75%, 8/14/2019 | | | 4,000,000 | | | | 4,850,000 | |
c,dPetroplus Finance Ltd., 6.75%, 5/1/2014 | | | 5,000,000 | | | | 4,900,000 | |
Plains Exploration & Production Co., 7.625%, 6/1/2018 | | | 1,000,000 | | | | 1,070,000 | |
cRAAM Global Energy Co., 12.50%, 10/1/2015 | | | 12,000,000 | | | | 12,600,000 | |
Southern Union Co., 7.20%, 11/1/2066 | | | 23,020,000 | | | | 21,984,100 | |
Teppco Partners LP, 7.00%, 6/1/2067 | | | 7,000,000 | | | | 6,947,500 | |
cWindsor Petroleum Transport Corp., 7.84%, 1/15/2021 | | | 8,557,939 | | | | 7,751,011 | |
cWoodside Financial Ltd., 8.125%, 3/1/2014 | | | 8,000,000 | | | | 9,189,920 | |
| | | | | | | | |
| | | | | | | 261,783,677 | |
| | | | | | | | |
| | |
FOOD & STAPLES RETAILING — 0.13% | | | | | | | | |
FOOD & STAPLES RETAILING — 0.13% | | | | | | | | |
Rite Aid Corp., 8.625%, 3/1/2015 | | | 3,000,000 | | | | 2,730,000 | |
Certified Semi-Annual Report 21
| | |
| SCHEDULE OF INVESTMENTS, CONTINUED | | |
| |
| Thornburg Investment Income Builder Fund | | March 31, 2011 (Unaudited) |
| | | | | | | | |
| | | Shares/
Principal
Amount | | | Value | |
Rite Aid Corp., 9.375%, 12/15/2015 | | $ | 9,500,000 | | | $ | 8,656,875 | |
| | | | | | | | |
| | | | | | | 11,386,875 | |
| | | | | | | | |
| | |
FOOD, BEVERAGE & TOBACCO — 0.33% | | | | | | | | |
BEVERAGES — 0.03% | | | | | | | | |
Anheuser Busch Cos., Inc., 4.70%, 4/15/2012 | | | 3,000,000 | | | | 3,119,355 | |
TOBACCO — 0.30% | | | | | | | | |
Altria Group, Inc., 8.50%, 11/10/2013 | | | 4,000,000 | | | | 4,664,840 | |
Altria Group, Inc., 9.70%, 11/10/2018 | | | 10,750,000 | | | | 14,137,508 | |
c,dB.A.T. International Finance, plc, 9.50%, 11/15/2018 | | | 5,000,000 | | | | 6,613,165 | |
| | | | | | | | |
| | | | | | | 28,534,868 | |
| | | | | | | | |
| | |
HEALTH CARE EQUIPMENT & SERVICES — 0.35% | | | | | | | | |
HEALTH CARE EQUIPMENT & SUPPLIES — 0.06% | | | | | | | | |
Alere, Inc., 8.625%, 10/1/2018 | | | 5,000,000 | | | | 5,293,750 | |
HEALTH CARE PROVIDERS & SERVICES — 0.14% | | | | | | | | |
cAurora Diagnostics Holdings, LLC, 10.75%, 1/15/2018 | | | 11,000,000 | | | | 11,330,000 | |
HEALTH CARE TECHNOLOGY — 0.15% | | | | | | | | |
Merge Healthcare, Inc., 11.75%, 5/1/2015 | | | 12,000,000 | | | | 12,960,000 | |
| | | | | | | | |
| | | | | | | 29,583,750 | |
| | | | | | | | |
| | |
INDUSTRIALS — 0.12% | | | | | | | | |
CAPITAL GOODS — 0.12% | | | | | | | | |
Da-Lite Screen Co., Inc., 12.50%, 4/1/2015 | | | 9,000,000 | | | | 10,158,750 | |
| | | | | | | | |
| | | | | | | 10,158,750 | |
| | | | | | | | |
| | |
INSURANCE — 1.93% | | | | | | | | |
INSURANCE — 1.93% | | | | | | | | |
American General Finance Corp., 4.875%, 7/15/2012 | | | 1,000,000 | | | | 982,500 | |
c,dDai Ichi Mutual Life, 7.25%, 12/31/2049 | | | 12,000,000 | | | | 11,862,648 | |
Hartford Financial Services Group, 8.125%, 6/15/2038 | | | 9,650,000 | | | | 10,566,750 | |
cLiberty Mutual Group, Inc., 5.75%, 3/15/2014 | | | 1,000,000 | | | | 1,049,762 | |
cMetlife Capital Trust X, 9.25%, 4/8/2068 | | | 12,000,000 | | | | 14,490,000 | |
Metlife, Inc. Series A, 6.817%, 8/15/2018 | | | 4,000,000 | | | | 4,625,052 | |
cNational Life Insurance of Vermont, 10.50%, 9/15/2039 | | | 2,000,000 | | | | 2,512,230 | |
Northwind Holdings, LLC Series 2007-1A Class A1, 1.091%, 12/1/2037 | | | 5,360,911 | | | | 4,099,918 | |
c,dOil Insurance Ltd., 7.558%, 12/29/2049 | | | 4,000,000 | | | | 3,795,440 | |
cPacific Life Global Funding CPI Floating Rate Note, 3.68%, 2/6/2016 | | | 2,000,000 | | | | 2,020,740 | |
cPrudential Holdings, LLC, 8.695%, 12/18/2023 | | | 4,500,000 | | | | 5,508,135 | |
c,dQBE Insurance Group Ltd., 5.647%, 7/1/2023 | | | 10,613,000 | | | | 9,869,209 | |
cSwiss Re Capital I, LP, 6.854%, 5/29/2049 | | | 49,865,000 | | | | 48,794,897 | |
Transatlantic Holdings, Inc., 5.75%, 12/14/2015 | | | 14,647,000 | | | | 15,488,016 | |
cWhite Mountains Re Group Ltd., 7.506%, 5/29/2049 | | | 14,000,000 | | | | 13,392,680 | |
cZFS Finance USA Trust II, 6.45%, 12/15/2065 | | | 14,198,000 | | | | 14,481,960 | |
cZFS Finance USA Trust V, 6.50%, 5/9/2037 | | | 1,260,000 | | | | 1,263,150 | |
| | | | | | | | |
| | | | | | | 164,803,087 | |
| | | | | | | | |
| | |
MATERIALS — 0.52% | | | | | | | | |
CONSTRUCTION MATERIALS — 0.19% | | | | | | | | |
c,dC8 Capital Ltd., 6.64%, 12/31/2049 | | | 2,000,000 | | | | 1,540,000 | |
CRH America, Inc., 8.125%, 7/15/2018 | | | 12,000,000 | | | | 14,123,340 | |
CONTAINERS & PACKAGING — 0.03% | | | | | | | | |
cPlastipak Holdings, Inc., 10.625%, 8/15/2019 | | | 2,250,000 | | | | 2,565,000 | |
22 Certified Semi-Annual Report
| | |
| SCHEDULE OF INVESTMENTS, CONTINUED | | |
| |
| Thornburg Investment Income Builder Fund | | March 31, 2011 (Unaudited) |
| | | | | | | | |
| | | Shares/
Principal
Amount | | | Value | |
METALS & MINING — 0.30% | | | | | | | | |
Allegheny Technologies, Inc., 9.375%, 6/1/2019 | | $ | 3,000,000 | | | $ | 3,800,658 | |
c,dAnglo American Capital, 9.375%, 4/8/2014 | | | 3,500,000 | | | | 4,186,280 | |
c,dBemax Resources Ltd., 9.375%, 7/15/2014 | | | 5,000,000 | | | | 4,406,250 | |
Freeport-McMoRan Copper & Gold, 8.375%, 4/1/2017 | | | 4,965,000 | | | | 5,473,913 | |
cGTL Trade Finance, Inc., 7.25%, 10/20/2017 | | | 7,000,000 | | | | 7,875,000 | |
| | | | | | | | |
| | | | | | | 43,970,441 | |
| | | | | | | | |
| | |
MEDIA — 0.37% | | | | | | | | |
MEDIA — 0.37% | | | | | | | | |
Comcast Cable Communications, 8.875%, 5/1/2017 | | | 5,000,000 | | | | 6,256,070 | |
DIRECTV Holdings LLC, 7.625%, 5/15/2016 | | | 3,000,000 | | | | 3,307,500 | |
Time Warner Cable, Inc., 8.75%, 2/14/2019 | | | 14,000,000 | | | | 17,454,276 | |
Time Warner Cable, Inc., 8.25%, 2/14/2014 | | | 4,000,000 | | | | 4,650,832 | |
| | | | | | | | |
| | | | | | | 31,668,678 | |
| | | | | | | | |
| | |
PHARMACEUTICALS, BIOTECHNOLOGY & LIFE SCIENCES — 0.17% | | | | | | | | |
BIOTECHNOLOGY — 0.11% | | | | | | | | |
eJPR Royalty LLC, 14.00%, 12/1/2020 | | | 5,000,000 | | | | 5,000,000 | |
c,dNovasep Holding S.A.S., 9.75%, 12/15/2016 | | | 3,000,000 | | | | 1,920,000 | |
Tiers Inflation Linked Trust Series Wyeth 2004 21 Trust Certificate CPI Floating Rate Note, 3.346%, 2/1/2014 | | | 3,000,000 | | | | 2,908,170 | |
PHARMACEUTICALS — 0.06% | | | | | | | | |
Axcan Intermediate Holdings, Inc., 12.75%, 3/1/2016 | | | 4,250,000 | | | | 4,728,125 | |
| | | | | | | | |
| | | | | | | 14,556,295 | |
| | | | | | | | |
| | |
RETAILING — 0.09% | | | | | | | | |
INTERNET & CATALOG RETAIL — 0.02% | | | | | | | | |
Ticketmaster, 10.75%, 8/1/2016 | | | 1,500,000 | | | | 1,638,750 | |
MULTILINE RETAIL — 0.02% | | | | | | | | |
c,dGrupo Famsa S.A.B. de C.V., 11.00%, 7/20/2015 | | | 1,500,000 | | | | 1,608,750 | |
SPECIALTY RETAIL — 0.05% | | | | | | | | |
Best Buy, Inc., 6.75%, 7/15/2013 | | | 4,000,000 | | | | 4,373,312 | |
| | | | | | | | |
| | | | | | | 7,620,812 | |
| | | | | | | | |
| | |
SEMICONDUCTORS & SEMICONDUCTOR EQUIPMENT — 0.17% | | | | | | | | |
SEMICONDUCTORS & SEMICONDUCTOR EQUIPMENT — 0.17% | | | | | | | | |
KLA Instruments Corp., 6.90%, 5/1/2018 | | | 10,000,000 | | | | 11,028,740 | |
National Semiconductor Corp., 6.15%, 6/15/2012 | | | 2,000,000 | | | | 2,101,112 | |
National Semiconductor Corp., 6.60%, 6/15/2017 | | | 1,000,000 | | | | 1,100,394 | |
| | | | | | | | |
| | | | | | | 14,230,246 | |
| | | | | | | | |
| | |
SOFTWARE & SERVICES — 0.19% | | | | | | | | |
INTERNET SOFTWARE & SERVICES — 0.17% | | | | | | | | |
c,d,gEAccess Ltd., 8.25%, 4/1/2018 | | | 4,000,000 | | | | 4,000,000 | |
SSI Investments II/CO-ISSR LLC, 11.125%, 6/1/2018 | | | 3,000,000 | | | | 3,360,000 | |
eYahoo!, Inc., 6.65%, 8/10/2026 | | | 7,217,998 | | | | 7,073,638 | |
SOFTWARE — 0.02% | | | | | | | | |
cAspect Software, Inc., 10.625%, 5/15/2017 | | | 2,000,000 | | | | 2,140,000 | |
| | | | | | | | |
| | | | | | | 16,573,638 | |
| | | | | | | | |
Certified Semi-Annual Report 23
| | |
| SCHEDULE OF INVESTMENTS, CONTINUED | | |
| |
| Thornburg Investment Income Builder Fund | | March 31, 2011 (Unaudited) |
| | | | | | | | |
| | | Shares/
Principal
Amount | | | Value | |
TECHNOLOGY HARDWARE & EQUIPMENT — 0.06% | | | | | | | | |
COMMUNICATIONS EQUIPMENT — 0.06% | | | | | | | | |
cBrightstar Corp., 9.50%, 12/1/2016 | | $ | 5,000,000 | | | $ | 5,368,750 | |
| | | | | | | | |
| | | | | | | 5,368,750 | |
| | | | | | | | |
| | |
TELECOMMUNICATION SERVICES — 0.88% | | | | | | | | |
DIVERSIFIED TELECOMMUNICATION SERVICES — 0.80% | | | | | | | | |
dDeutsche Telekom International Finance B.V., 8.75%, 6/15/2030 | | | 26,150,000 | | | | 34,285,160 | |
dGlobal Crossing Ltd., 12.00%, 9/15/2015 | | | 4,000,000 | | | | 4,560,000 | |
c,dGlobal Crossing Ltd., 9.00%, 11/15/2019 | | | 8,000,000 | | | | 8,000,000 | |
Level 3 Financing, Inc., 9.25%, 11/1/2014 | | | 7,912,000 | | | | 8,090,020 | |
d,hTelecom Italia Capital SA, 5.25%, 10/1/2015 | | | 4,190,000 | | | | 4,336,901 | |
c,dTelemar Norte Leste SA, 5.50%, 10/23/2020 | | | 9,065,000 | | | | 8,906,363 | |
WIRELESS TELECOMMUNICATION SERVICES — 0.08% | | | | | | | | |
c,dDigicel SA, 12.00%, 4/1/2014 | | | 2,000,000 | | | | 2,345,000 | |
c,dVimpelcom, 8.25%, 5/23/2016 | | | 4,500,000 | | | | 4,983,750 | |
| | | | | | | | |
| | | | | | | 75,507,194 | |
| | | | | | | | |
| | |
TRANSPORTATION — 0.22% | | | | | | | | |
AIRLINES — 0.16% | | | | | | | | |
c,dAir Canada, 9.25%, 8/1/2015 | | | 9,000,000 | | | | 9,382,500 | |
American Airlines, Inc., 13.00%, 8/1/2016 | | | 4,030,789 | | | | 4,731,138 | |
MARINE — 0.06% | | | | | | | | |
Commercial Barge Line Co., 12.50%, 7/15/2017 | | | 2,000,000 | | | | 2,305,000 | |
United Maritime LLC, 11.75%, 6/15/2015 | | | 2,500,000 | | | | 2,593,750 | |
| | | | | | | | |
| | | | | | | 19,012,388 | |
| | | | | | | | |
| | |
UTILITIES — 2.55% | | | | | | | | |
ELECTRIC UTILITIES — 1.16% | | | | | | | | |
Alabama Power Capital Trust V, 3.403%, 10/1/2042 | | | 4,000,000 | | | | 3,909,120 | |
Arizona Public Service Co., 5.50%, 9/1/2035 | | | 4,000,000 | | | | 3,815,040 | |
Arizona Public Service Co., 8.75%, 3/1/2019 | | | 6,500,000 | | | | 8,194,602 | |
Comed Financing III, 6.35%, 3/15/2033 | | | 2,961,000 | | | | 2,508,145 | |
c,dE. CL SA, 5.625%, 1/15/2021 | | | 2,000,000 | | | | 2,002,938 | |
c,dEnel Finance International S.A., 6.25%, 9/15/2017 | | | 38,000,000 | | | | 41,614,294 | |
Entergy Gulf States Louisiana LLC, 6.00%, 5/1/2018 | | | 8,000,000 | | | | 8,667,312 | |
cGreat River Energy, 5.829%, 7/1/2017 | | | 1,872,755 | | | | 2,043,588 | |
cMonongahela Power Co., 7.95%, 12/15/2013 | | | 2,000,000 | | | | 2,276,304 | |
cTexas-New Mexico Power, 9.50%, 4/1/2019 | | | 19,000,000 | | | | 24,108,511 | |
GAS UTILITIES — 0.12% | | | | | | | | |
Southwest Gas Corp., 7.625%, 5/15/2012 | | | 9,465,000 | | | | 10,056,865 | |
INDEPENDENT POWER PRODUCERS & ENERGY TRADERS — 0.21% | | | | | | | | |
c,dInkia Energy Ltd., 8.375%, 4/4/2021 | | | 18,000,000 | | | | 17,850,420 | |
MULTI-UTILITIES — 1.06% | | | | | | | | |
Ameren Illinois Co., 9.75%, 11/15/2018 | | | 5,000,000 | | | | 6,449,495 | |
AmerenEnergy Generating Co., 7.00%, 4/15/2018 | | | 9,050,000 | | | | 9,172,673 | |
Black Hills Corp., 9.00%, 5/15/2014 | | | 4,500,000 | | | | 5,114,889 | |
Dominion Resources, Inc., 8.875%, 1/15/2019 | | | 14,750,000 | | | | 18,827,741 | |
NiSource Finance Corp., 6.15%, 3/1/2013 | | | 12,237,000 | | | | 13,265,667 | |
NiSource Finance Corp., 6.40%, 3/15/2018 | | | 20,000,000 | | | | 22,375,320 | |
Sempra Energy, 9.80%, 2/15/2019 | | | 7,750,000 | | | | 10,289,411 | |
Sempra Energy, 8.90%, 11/15/2013 | | | 2,000,000 | | | | 2,326,760 | |
24 Certified Semi-Annual Report
| | |
| SCHEDULE OF INVESTMENTS, CONTINUED | | |
| |
| Thornburg Investment Income Builder Fund | | March 31, 2011 (Unaudited) |
| | | | | | | | |
| | | Shares/
Principal
Amount | | | Value | |
Union Electric Co., 6.70%, 2/1/2019 | | $ | 2,500,000 | | | $ | 2,885,097 | |
| | | | | | | | |
| | | | | | | 217,754,192 | |
| | | | | | | | |
TOTAL CORPORATE BONDS (Cost $994,583,509) | | | | | | | 1,190,191,625 | |
| | | | | | | | |
| | |
CONVERTIBLE BONDS — 2.11% | | | | | | | | |
| | |
CONSUMER SERVICES — 0.12% | | | | | | | | |
HOTELS, RESTAURANTS & LEISURE — 0.12% | | | | | | | | |
cICAHN Enterprise LP | | | 10,000,000 | | | | 10,200,000 | |
| | | | | | | | |
| | | | | | | 10,200,000 | |
| | | | | | | | |
| | |
DIVERSIFIED FINANCIALS — 1.13% | | | | | | | | |
DIVERSIFIED FINANCIAL SERVICES — 1.13% | | | | | | | | |
KKR Financial Holdings LLC, 7.00%, 7/15/2012 | | | 61,600,000 | | | | 64,218,000 | |
KKR Financial Holdings LLC, 7.50%, 1/15/2017 | | | 22,750,000 | | | | 32,361,875 | |
| | | | | | | | |
| | | | | | | 96,579,875 | |
| | | | | | | | |
| | |
FOOD, BEVERAGE & TOBACCO — 0.09% | | | | | | | | |
BEVERAGES — 0.09% | | | | | | | | |
Central European Distribution Corp. | | | 9,300,000 | | | | 8,079,375 | |
| | | | | | | | |
| | | | | | | 8,079,375 | |
| | | | | | | | |
| | |
MATERIALS — 0.09% | | | | | | | | |
METALS & MINING — 0.09% | | | | | | | | |
c,dJaguar Mining, Inc., 4.50%, 11/1/2014 | | | 8,500,000 | | | | 7,501,250 | |
| | | | | | | | |
| | | | | | | 7,501,250 | |
| | | | | | | | |
| | |
MEDIA — 0.04% | | | | | | | | |
MEDIA — 0.04% | | | | | | | | |
Live Nation Entertainment, Inc., 2.875%, 7/15/2027 | | | 4,000,000 | | | | 3,620,000 | |
| | | | | | | | |
| | | | | | | 3,620,000 | |
| | | | | | | | |
| | |
REAL ESTATE — 0.24% | | | | | | | | |
REAL ESTATE INVESTMENT TRUSTS — 0.12% | | | | | | | | |
cExtra Space Storage LP, 3.625%, 4/1/2027 | | | 10,000,000 | | | | 10,000,000 | |
REAL ESTATE MANAGEMENT & DEVELOPMENT — 0.12% | | | | | | | | |
Avatar Holdings, Inc., 7.50%, 2/15/2016 | | | 10,000,000 | | | | 10,587,500 | |
| | | | | | | | |
| | | | | | | 20,587,500 | |
| | | | | | | | |
| | |
SOFTWARE & SERVICES — 0.14% | | | | | | | | |
SOFTWARE — 0.14% | | | | | | | | |
c,dTelvent Git SA, 5.50%, 4/15/2015 | | | 10,000,000 | | | | 11,625,000 | |
| | | | | | | | |
| | | | | | | 11,625,000 | |
| | | | | | | | |
| | |
TELECOMMUNICATION SERVICES — 0.24% | | | | | | | | |
DIVERSIFIED TELECOMMUNICATION SERVICES — 0.03% | | | | | | | | |
Level 3 Communications, Inc., 7.00%, 3/15/2015 | | | 2,000,000 | | | | 2,327,500 | |
WIRELESS TELECOMMUNICATION SERVICES — 0.21% | | | | | | | | |
NII Holdings, 3.125%, 6/15/2012 | | | 18,000,000 | | | | 18,090,000 | |
| | | | | | | | |
| | | | | | | 20,417,500 | |
| | | | | | | | |
Certified Semi-Annual Report 25
| | |
| SCHEDULE OF INVESTMENTS, CONTINUED | | |
| |
| Thornburg Investment Income Builder Fund | | March 31, 2011 (Unaudited) |
| | | | | | | | |
| | | Shares/
Principal
Amount | | | Value | |
TRANSPORTATION — 0.02% | | | | | | | | |
MARINE — 0.02% | | | | | | | | |
cUltrapetrol Bahamas Ltd., 7.25%, 1/15/2017 | | $ | 1,500,000 | | | $ | 1,462,500 | |
| | | | | | | | |
TOTAL CONVERTIBLE BONDS (Cost $158,238,977) | | | | | | | 180,073,000 | |
| | | | | | | | |
| | |
MUNICIPAL BONDS — 0.04% | | | | | | | | |
San Bernardino County California, 8.45%, 9/1/2030 | | | 2,555,000 | | | | 2,451,573 | |
Victor New York, 9.20%, 5/1/2014 | | | 1,130,000 | | | | 1,161,855 | |
| | | | | | | | |
TOTAL MUNICIPAL BONDS (Cost $3,668,503) | | | | | | | 3,613,428 | |
| | | | | | | | |
| | |
U.S. GOVERNMENT AGENCIES — 0.12% | | | | | | | | |
cAgribank FCB, 9.125%, 7/15/2019 | | | 6,750,000 | | | | 8,058,697 | |
Federal National Mtg Association REMIC Series 2006-B1 Class AB, 6.00%, 6/25/2016 | | | 2,596,917 | | | | 2,654,149 | |
| | | | | | | | |
TOTAL U.S. GOVERNMENT AGENCIES (Cost $9,340,635) | | | | | | | 10,712,846 | |
| | | | | | | | |
| | |
FOREIGN BONDS — 2.14% | | | | | | | | |
| | |
CONSUMER SERVICES — 0.00% | | | | | | | | |
HOTELS, RESTAURANTS & LEISURE — 0.00% | | | | | | | | |
b,e,fFU JI Food and Catering (HKD), 0%, 10/18/2010 | | | 17,500,000 | | | | 0 | |
| | | | | | | | |
| | | | | | | 0 | |
| | | | | | | | |
| | |
DIVERSIFIED FINANCIALS — 0.21% | | | | | | | | |
CAPITAL MARKETS — 0.13% | | | | | | | | |
Morgan Stanley (AUD), 5.37%, 3/1/2013 | | | 4,000,000 | | | | 4,050,480 | |
Morgan Stanley (BRL), 10.09%, 5/3/2017 | | | 12,560,000 | | | | 7,346,829 | |
DIVERSIFIED FINANCIAL SERVICES — 0.08% | | | | | | | | |
c,eBank of America Corp. (BRL), 10.00%, 11/19/2014 | | | 6,500,000 | | | | 3,921,539 | |
eBank of America Corp. (BRL), 10.75%, 8/20/2018 | | | 5,000,000 | | | | 3,016,568 | |
| | | | | | | | |
| | | | | | | 18,335,416 | |
| | | | | | | | |
| | |
FOOD & STAPLES RETAILING — 0.02% | | | | | | | | |
FOOD & STAPLES RETAILING — 0.02% | | | | | | | | |
Wesfarmers Ltd. (AUD), 7.68%, 9/11/2014 | | | 2,000,000 | | | | 2,143,092 | |
| | | | | | | | |
| | | | | | | 2,143,092 | |
| | | | | | | | |
| | |
FOOD, BEVERAGE & TOBACCO — 0.13% | | | | | | | | |
BEVERAGES — 0.13% | | | | | | | | |
Ambev International Finance Co., Ltd. (BRL), 9.50%, 7/24/2017 | | | 7,669,000 | | | | 4,650,299 | |
Anheuser-Busch InBev (BRL), 1.00%, 11/17/2015 | | | 10,000,000 | | | | 6,293,449 | |
| | | | | | | | |
| | | | | | | 10,943,748 | |
| | | | | | | | |
| | |
INSURANCE — 0.18% | | | | | | | | |
INSURANCE — 0.18% | | | | | | | | |
ELM BV (AUD), 7.635%, 12/31/2049 | | | 10,500,000 | | | | 9,012,186 | |
ELM BV (AUD), 6.458%, 12/27/2049 | | | 8,000,000 | | | | 6,387,730 | |
| | | | | | | | |
| | | | | | | 15,399,916 | |
| | | | | | | | |
| | |
MEDIA — 0.08% | | | | | | | | |
MEDIA — 0.08% | | | | | | | | |
cCorus Entertainment (CAD), 7.25%, 2/10/2017 | | | 2,000,000 | | | | 2,202,166 | |
26 Certified Semi-Annual Report
| | |
| SCHEDULE OF INVESTMENTS, CONTINUED | | |
| |
| Thornburg Investment Income Builder Fund | | March 31, 2011 (Unaudited) |
| | | | | | | | |
| | | Shares/
Principal
Amount | | | Value | |
News America Holdings (AUD), 8.625%, 2/7/2014 | | $ | 4,000,000 | | | $ | 4,242,087 | |
| | | | | | | | |
| | | | | | | 6,444,253 | |
| | | | | | | | |
| | |
MISCELLANEOUS — 0.55% | | | | | | | | |
MISCELLANEOUS — 0.55% | | | | | | | | |
New South Wales Treasury Corp. (AUD), 3.75%, 11/20/2020 | | | 8,500,000 | | | | 9,729,109 | |
Regional Muni of York (CAD), 5.00%, 4/29/2019 | | | 4,500,000 | | | | 4,942,759 | |
Republic of Brazil (BRL), 12.50%, 1/5/2016 | | | 25,750,000 | | | | 17,901,112 | |
Republic of Brazil (BRL), 12.50%, 1/5/2022 | | | 20,000,000 | | | | 14,210,026 | |
| | | | | | | | |
| | | | | | | 46,783,006 | |
| | | | | | | | |
| | |
TELECOMMUNICATION SERVICES — 0.06% | | | | | | | | |
DIVERSIFIED TELECOMMUNICATION SERVICES — 0.06% | | | | | | | | |
cWind Acquisition Finance SA (EUR), 11.75%, 7/15/2017 | | | 3,000,000 | | | | 4,921,225 | |
| | | | | | | | |
| | | | | | | 4,921,225 | |
| | | | | | | | |
| | |
TRANSPORTATION — 0.78% | | | | | | | | |
TRANSPORTATION INFRASTRUCTURE — 0.78% | | | | | | | | |
Southern Cross Air Corp. (AUD), 6.76%, 12/20/2016 | | | 64,833,500 | | | | 66,557,559 | |
| | | | | | | | |
| | | | | | | 66,557,559 | |
| | | | | | | | |
| | |
UTILITIES — 0.13% | | | | | | | | |
MULTI-UTILITIES — 0.13% | | | | | | | | |
Ville De Montreal (CAD), 5.45%, 12/1/2019 | | | 10,000,000 | | | | 11,227,437 | |
| | | | | | | | |
| | | | | | | 11,227,437 | |
| | | | | | | | |
TOTAL FOREIGN BONDS (Cost $143,584,670) | | | | | | | 182,755,652 | |
| | | | | | | | |
| | |
OTHER SECURITIES — 0.30% | | | | | | | | |
| | |
LOAN PARTICIPATIONS — 0.30% | | | | | | | | |
Crown Castle Operating Co., 1.762%, 3/6/2014 | | | 2,931,472 | | | | 2,909,867 | |
eMerisant Co. Term Loan B, 7.50%, 1/31/2014 | | | 2,550,033 | | | | 2,530,908 | |
Mylan Laboratories, Inc., 3.563%, 10/2/2014 | | | 1,956,182 | | | | 1,959,840 | |
Texas Comp Electric Holdings LLC, 3.803%, 10/10/2014 | | | 4,396,749 | | | | 3,700,876 | |
Texas Comp Electric Holdings LLC, 3.759%, 10/10/2014 | | | 13,010,101 | | | | 10,920,418 | |
Texas Comp Electric Holdings LLC, 3.759%, 10/10/2014 | | | 3,118,402 | | | | 2,624,853 | |
Texas Comp Electric Holdings LLC, 3.789%, 10/31/2014 | | | 530,303 | | | | 445,126 | |
Texas Comp Electric Holdings LLC, 3.803%, 10/10/2014 | | | 303,030 | | | | 255,070 | |
Texas Comp Electric Holdings LLC, 3.803%, 5/10/2014 | | | 141,414 | | | | 118,700 | |
| | | | | | | | |
TOTAL OTHER SECURITIES (Cost $24,577,420) | | | | | | | 25,465,658 | |
| | | | | | | | |
| | |
SHORT TERM INVESTMENTS — 1.30% | | | | | | | | |
Devon Energy Corp., 0.19%, 4/1/2011 | | | 33,400,000 | | | | 33,400,000 | |
McCormick & Co., 0.16%, 4/1/2011 | | | 35,000,000 | | | | 35,000,000 | |
Wellpoint, Inc., 0.20%, 4/1/2011 | | | 42,600,000 | | | | 42,600,000 | |
| | | | | | | | |
TOTAL SHORT TERM INVESTMENTS (Cost $111,000,000) | | | | | | | 111,000,000 | |
| | | | | | | | |
TOTAL INVESTMENTS — 99.64% (Cost $7,539,932,472) | | | | | | $ | 8,509,855,227 | |
OTHER ASSETS LESS LIABILITIES — 0.36% | | | | | | | 30,603,928 | |
| | | | | | | | |
NET ASSETS — 100.00% | | | | | | $ | 8,540,459,155 | |
| | | | | | | | |
Certified Semi-Annual Report 27
| | |
| SCHEDULE OF INVESTMENTS, CONTINUED | | |
| |
| Thornburg Investment Income Builder Fund | | March 31, 2011 (Unaudited) |
Footnote Legend
| a | Investment in Affiliates - Holdings of voting securities of each portfolio company which is considered “affiliated” to the Fund under the Investment Company Act of 1940 because the Fund’s holding represented 5% or more of the company’s voting securities during the period, are shown below: |
| | | | | | | | | | | | | | | | | | | | | | | | |
Issuer | | Shares/Principal
September 30,
2010 | | | Gross
Additions | | | Gross
Reductions | | | Shares/Principal
March 31,
2011 | | | Market Value
March 31,
2011 | | | Investment
Income | |
Solar Capital Ltd. | | | 1,901,000 | | | | 1,852,599 | | | | (3,599 | ) | | | 3,750,000 | | | $ | 89,550,000 | | | $ | 3,922,020 | |
Invesco Mortgage Capital, Inc. | | | 1,915,165 | | | | 1,084,835 | | | | — | | | | 3,000,000 | | | | * | | | | 5,585,210 | |
| | | | | | | | | | | | | | | | | | | | | | | | |
Total non-controlled affiliated issuers - 1.05% of net assets | | | | | | | | | | | $ | 89,550,000 | | | $ | 9,507,230 | |
| | | | | | | | | | | | | | | | | | | | | | | | |
| * | Issuer not affiliated at March 31, 2011. |
| c | Securities exempt from registration under Rule 144A of the Securities Act of 1933, as amended. These securities may only be resold in the ordinary course of business in transactions exempt from registration, normally to qualified institutional buyers. As of March 31, 2011, the aggregate value of these securities in the Fund’s portfolio was $571,917,275, representing 6.70% of the Fund’s net assets. |
| d | Yankee Bond - Denominated in U.S. dollars and is issued in the U.S. by foreign banks and corporations. |
| e | Security currently fair valued by the valuation and pricing committee using procedures approved by the Trustees. |
| h | Segregated as collateral for a when-issued security. |
Portfolio Abbreviations
To simplify the listings of securities, abbreviations are used per the table below:
| | |
| ADR | | American Depository Receipt |
| ARM | | Adjustable Rate Mortgage |
| AUD | | Denominated in Australian Dollars |
| BRL | | Denominated in Brazilian Real |
| CAD | | Denominated in Canadian Dollars |
| CHL | | Denominated in Chilean Peso |
| CMO | | Collateralized Mortgage Obligation |
| CPI | | Consumer Price Index |
| EUR | | Denominated in Euros |
| FCB | | Farm Credit Bank |
| HKD | | Denominated in Hong Kong Dollars |
| LIBOR | | London Interbank Offered Rate |
| MFA | | Mortgage Finance Authority |
| Mtg | | Mortgage |
| Pfd | | Preferred Stock |
| REIT | | Real Estate Investment Trust |
| REMIC | | Real Estate Mortgage Investment Conduit |
See notes to financial statements.
28 Certified Semi-Annual Report
This page intentionally left blank.
Certified Semi-Annual Report 29
| | |
| STATEMENT OF ASSETS AND LIABILITIES |
| |
| Thornburg Investment Income Builder Fund | | March 31, 2011 (Unaudited) |
| | | | |
ASSETS | | | | |
Investments at value | | | | |
Non-affiliated issuers (cost $7,458,403,007) (Note 2) | | $ | 8,420,305,227 | |
Non-controlled affiliated issuers (cost $81,529,465) (Note 2) | | | 89,550,000 | |
Cash | | | 368,096 | |
Receivable for investments sold | | | 25,382,402 | |
Receivable for fund shares sold | | | 58,777,651 | |
Unrealized appreciation on forward currency contracts (Note 7) | | | 6,265,292 | |
Dividends receivable | | | 25,526,376 | |
Dividend and interest reclaim receivable | | | 4,379,038 | |
Interest receivable | | | 30,113,993 | |
Prepaid expenses and other assets | | | 212,221 | |
| | | | |
Total Assets | | | 8,660,880,296 | |
| | | | |
| |
LIABILITIES | | | | |
Payable for securities purchased | | | 46,767,073 | |
Payable for fund shares redeemed | | | 8,404,095 | |
Unrealized depreciation on forward currency contracts (Note 7) | | | 49,952,127 | |
Payable to investment advisor and other affiliates (Note 3) | | | 8,654,037 | |
Deferred tax payable | | | 679,504 | |
Accounts payable and accrued expenses | | | 1,501,117 | |
Dividends payable | | | 4,463,188 | |
| | | | |
Total Liabilities | | | 120,421,141 | |
| | | | |
NET ASSETS | | $ | 8,540,459,155 | |
| | | | |
NET ASSETS CONSIST OF: | | | | |
Distribution in excess of net investment income | | $ | (7,260,291 | ) |
Net unrealized appreciation on investments | | | 926,050,491 | |
Accumulated net realized gain (loss) | | | (751,955,216 | ) |
Net capital paid in on shares of beneficial interest | | | 8,373,624,171 | |
| | | | |
| | $ | 8,540,459,155 | |
| | | | |
30 Certified Semi-Annual Report
| | |
| STATEMENT OF ASSETS AND LIABILITIES, CONTINUED |
| |
| Thornburg Investment Income Builder Fund | | March 31, 2011 (Unaudited) |
| | | | |
NET ASSET VALUE: | | | | |
Class A Shares: | | | | |
Net asset value and redemption price per share ($2,729,203,808 applicable to 139,179,464 shares of beneficial interest outstanding - Note 4) | | $ | 19.61 | |
Maximum sales charge, 4.50% of offering price | | | 0.92 | |
| | | | |
Maximum offering price per share | | $ | 20.53 | |
| | | | |
| |
Class C Shares: | | | | |
Net asset value and offering price per share * ($3,093,637,882 applicable to 157,748,997 shares of beneficial interest outstanding - Note 4) | | $ | 19.61 | |
| | | | |
| |
Class I Shares: | | | | |
Net asset value, offering and redemption price per share ($2,669,880,957 applicable to 135,229,041 shares of beneficial interest outstanding - Note 4) | | $ | 19.74 | |
| | | | |
| |
Class R3 Shares: | | | | |
Net asset value, offering and redemption price per share ($35,492,829 applicable to 1,810,184 shares of beneficial interest outstanding - Note 4) | | $ | 19.61 | |
| | | | |
| |
Class R4 Shares: | | | | |
Net asset value, offering and redemption price per share ($7,045,455 applicable to 358,647 shares of beneficial interest outstanding - Note 4) | | $ | 19.64 | |
| | | | |
| |
Class R5 Shares: | | | | |
Net asset value, offering and redemption price per share ($5,198,224 applicable to 263,360 shares of beneficial interest outstanding - Note 4) | | $ | 19.74 | |
| | | | |
| * | Redemption price per share is equal to net asset value less any applicable contingent deferred sales charge. |
See notes to financial statements.
Certified Semi-Annual Report 31
| | |
| STATEMENT OF OPERATIONS | | |
| |
| Thornburg Investment Income Builder Fund | | Six Months Ended March 31, 2011 (Unaudited) |
| | | | |
INVESTMENT INCOME: | | | | |
Dividend income | | | | |
Non-affiliated issuers (net of foreign taxes withheld of $6,152,313) | | $ | 140,898,449 | |
Non-controlled affiliated issuers | | | 9,507,230 | |
Interest income (net of premium amortized of $882,339) | | | 65,257,735 | |
| | | | |
Total Income | | | 215,663,414 | |
| | | | |
| |
EXPENSES: | | | | |
Investment advisory fees (Note 3) | | | 25,401,271 | |
Administration fees (Note 3) | | | | |
Class A Shares | | | 1,470,990 | |
Class C Shares | | | 1,639,507 | |
Class I Shares | | | 535,665 | |
Class R3 Shares | | | 18,198 | |
Class R4 Shares | | | 2,570 | |
Class R5 Shares | | | 1,066 | |
Distribution and service fees (Note 3) | | | | |
Class A Shares | | | 2,965,437 | |
Class C Shares | | | 13,151,197 | |
Class R3 Shares | | | 72,937 | |
Class R4 Shares | | | 5,195 | |
Transfer agent fees | | | | |
Class A Shares | | | 865,340 | |
Class C Shares | | | 1,079,925 | |
Class I Shares | | | 633,720 | |
Class R3 Shares | | | 18,528 | |
Class R4 Shares | | | 3,321 | |
Class R5 Shares | | | 3,981 | |
Registration and filing fees | | | | |
Class A Shares | | | 38,530 | |
Class C Shares | | | 32,370 | |
Class I Shares | | | 37,231 | |
Class R3 Shares | | | 9,496 | |
Class R4 Shares | | | 9,672 | |
Class R5 Shares | | | 11,385 | |
Custodian fees (Note 3) | | | 778,230 | |
Professional fees | | | 78,962 | |
Accounting fees | | | 85,410 | |
Trustee fees | | | 72,045 | |
Other expenses | | | 375,656 | |
| | | | |
Total Expenses | | | 49,397,835 | |
Less: | | | | |
Expenses reimbursed by investment advisor (Note 3) | | | (832,979 | ) |
| | | | |
Net Expenses | | | 48,564,856 | |
| | | | |
Net Investment Income | | $ | 167,098,558 | |
| | | | |
32 Certified Semi-Annual Report
| | |
| STATEMENT OF OPERATIONS, CONTINUED |
| |
| Thornburg Investment Income Builder Fund | | Six Months Ended March 31, 2011 (Unaudited) |
| | | | |
REALIZED AND UNREALIZED GAIN (LOSS) | | | | |
Net realized gain (loss) from: | | | | |
Investments | | | | |
Non-affiliated issuers | | $ | 79,884,043 | |
Non-controlled affiliated issuers | | | (1,767 | ) |
Forward currency contracts (Note 7) | | | (66,863,627 | ) |
Foreign currency transactions | | | 32,469,557 | |
| | | | |
| | | 45,488,206 | |
| | | | |
Net change in unrealized appreciation (depreciation) on: | | | | |
Investments | | | | |
Non-affiliated issuers (net of change in deferred taxes payable of $679,504) | | | 482,088,192 | |
Non-controlled affiliated issuers | | | 4,185,081 | |
Forward currency contracts (Note 7) | | | (14,357,972 | ) |
Foreign currency translations | | | (206,262 | ) |
| | | | |
| | | 471,709,039 | |
| | | | |
Net Realized and Unrealized Gain | | | 517,197,245 | |
| | | | |
Net Increase in Net Assets Resulting from Operations | | $ | 684,295,803 | |
| | | | |
See notes to financial statements.
Certified Semi-Annual Report 33
STATEMENTS OF CHANGES IN NET ASSETS
Thornburg Investment Income Builder Fund
| | | | | | | | |
| | | Six Months Ended
March 31, 2011* | | | Year Ended
September 30, 2010 | |
INCREASE (DECREASE) IN NET ASSETS FROM | | | | | | | | |
| | |
OPERATIONS: | | | | | | | | |
Net investment income | | $ | 167,098,558 | | | $ | 298,606,872 | |
Net realized gain (loss) on investments, forward currency contracts and foreign currency transactions | | | 45,488,206 | | | | (58,389,099 | ) |
Increase (Decrease) in unrealized appreciation (depreciation) on investments, forward currency contracts, foreign currency translations and deferred taxes | | | 471,709,039 | | | | 297,073,577 | |
| | | | | | | | |
| | |
Net Increase (Decrease) in Net Assets Resulting from Operations | | | 684,295,803 | | | | 537,291,350 | |
| | |
DIVIDENDS TO SHAREHOLDERS: | | | | | | | | |
From net investment income | | | | | | | | |
Class A Shares | | | (69,121,986 | ) | | | (105,095,569 | ) |
Class C Shares | | | (68,210,929 | ) | | | (100,021,633 | ) |
Class I Shares | | | (65,896,664 | ) | | | (82,223,032 | ) |
Class R3 Shares | | | (808,873 | ) | | | (1,088,290 | ) |
Class R4 Shares | | | (107,333 | ) | | | (59,426 | ) |
Class R5 Shares | | | (128,683 | ) | | | (114,390 | ) |
| | |
FUND SHARE TRANSACTIONS (NOTE 4): | | | | | | | | |
Class A Shares | | | 552,359,568 | | | | 529,891,266 | |
Class C Shares | | | 682,419,767 | | | | 715,272,973 | |
Class I Shares | | | 844,585,531 | | | | 707,722,464 | |
Class R3 Shares | | | 10,013,299 | | | | 7,823,039 | |
Class R4 Shares | | | 4,864,013 | | | | 1,799,483 | |
Class R5 Shares | | | 1,558,767 | | | | 2,943,638 | |
| | | | | | | | |
| | |
Net Increase in Net Assets | | | 2,575,822,280 | | | | 2,214,141,873 | |
| | |
NET ASSETS: | | | | | | | | |
Beginning of Period | | | 5,964,636,875 | | | | 3,750,495,002 | |
| | | | | | | | |
| | |
End of Period | | $ | 8,540,459,155 | | | $ | 5,964,636,875 | |
| | | | | | | | |
| | |
Undistributed net investment income | | $ | — | | | $ | 29,915,619 | |
See notes to financial statements.
34 Certified Semi-Annual Report
| | |
| NOTES TO FINANCIAL STATEMENTS |
| |
| Thornburg Investment Income Builder Fund | | March 31, 2011 (Unaudited) |
NOTE 1 – ORGANIZATION
Thornburg Investment Income Builder Fund, hereinafter referred to as the “Fund,” is a diversified series of Thornburg Investment Trust (the “Trust”). The Trust was organized as a Massachusetts business trust under a Declaration of Trust dated June 3, 1987 and is registered as a diversified, open-end management investment company under the Investment Company Act of 1940, as amended. The Fund is currently one of sixteen separate series of the Trust. Each series is considered to be a separate entity for financial reporting and tax purposes and bears expenses directly attributable to it. The Fund’s primary investment goal is to provide a level of current income which exceeds the average yield on U.S. stocks generally, and which will generally grow, subject to periodic fluctuations, over the years on a per share basis. The Fund’s secondary investment goal is long-term capital appreciation.
The Fund currently offers six classes of shares of beneficial interest: Class A, Class C, Institutional Class (Class I), and Retirement Classes (Class R3, Class R4, and Class R5). Each class of shares of the Fund represents an interest in the same portfolio of investments, except that (i) Class A shares are sold subject to a front-end sales charge collected at the time the shares are purchased and bear a service fee, (ii) Class C shares are sold at net asset value without a sales charge at the time of purchase, but are subject to a contingent deferred sales charge upon redemption within one year of purchase, and bear both a service fee and a distribution fee, (iii) Class I shares are sold at net asset value without a sales charge at the time of purchase, (iv) Class R3 shares are sold at net asset value without a sales charge at the time of purchase, but bear both a service fee and distribution fee, (v) Class R4 shares are sold at net asset value without sales charge at the time of purchase, but bear a service fee, (vi) Class R5 shares are sold at net asset value without a sales charge at the time of purchase, and (vii) the respective classes may have different reinvestment privileges and conversion rights. Additionally, the Fund may allocate among its classes certain expenses, to the extent allowable to specific classes, including transfer agent fees, government registration fees, certain printing and postage costs, and administrative and legal expenses. Currently, class specific expenses of the Fund are limited to service and distribution fees, administration fees, and certain registration and transfer agent expenses.
NOTE 2 – SIGNIFICANT ACCOUNTING POLICIES
Significant accounting policies of the Trust are as follows:
Valuation of Investments: Portfolio securities listed or traded on a national securities exchange are valued on the valuation date at the last reported sale price on the exchange that is the primary market for the security. Portfolio securities traded on an exchange for which there has been no sale that day and other equity securities traded in the over-the-counter market are valued at the mean between the last reported bid and asked prices. Portfolio securities reported by NASDAQ are valued at the NASDAQ official closing price. Any foreign security traded on exchanges outside the United States is valued at the price of the security on the exchange that is normally the security’s primary market, as of the close of that exchange preceding the time of the Fund’s valuation.
Debt obligations held by the Fund have a primary market over the counter and are valued by an independent pricing service approved by the Trustees of the Trust. The pricing service ordinarily values debt obligations at quoted bid prices. When quotations are not available, debt obligations held by the Fund are valued at evaluated prices determined by the pricing service using methods which include consideration of yields or prices of debt obligations of comparable quality, type of issue, coupon, maturity and rating, and indications as to value from dealers and general market conditions. Short-term obligations having remaining maturities of 60 days or less are ordinarily valued at amortized cost, which approximates market value.
Quotations in foreign currencies for foreign portfolio investments are converted to U.S. dollar equivalents using the foreign exchange quotation in effect at the time of valuation.
In any case where the market value of an equity security held by the Fund is not readily available, the Trust’s valuation and pricing committee determines a fair value for the security using procedures approved by the Trustees, which may include the use of a price obtained from an independent pricing service. The pricing service ordinarily values equity securities in these instances using multi-factor models to adjust market prices based upon various inputs, including exchange data, depository receipt prices, futures and index data and other data. A security’s market value is deemed not readily available whenever the exchange or market on which the security is primarily traded is closed for the entire scheduled day of trading. Additionally, a security’s market value may be deemed not readily available under other circumstances identified by the Trustees, including when developments occurring after the most recent close of the security’s primary exchange or market, but before the most recent close of trading in Fund shares, create a serious question about the reliability of the security’s market value.
Certified Semi-Annual Report 35
| | |
| NOTES TO FINANCIAL STATEMENTS, CONTINUED |
| |
| Thornburg Investment Income Builder Fund | | March 31, 2011 (Unaudited) |
In any case where a pricing service fails to provide a price for a debt obligation held by the Fund, the valuation and pricing committee determines a fair value for the debt obligation using procedures approved by the Trustees. Additionally, in any case where management believes that a price provided by a pricing service for a debt obligation held by the Fund may be unreliable, the valuation and pricing committee decides whether or not to use the pricing service’s valuation or to determine a fair value for the debt obligation.
In determining fair value for any portfolio security or other investment, the valuation and pricing committee seeks to determine the amount that an owner of the investment might reasonably expect to receive upon a sale of the investment. However, because fair value prices are estimated prices, the valuation and pricing committee’s determination of fair value for an investment may differ from the value that would be realized by the Fund upon a sale of the investment, and that difference could be material to the Fund’s financial statements. The valuation and pricing committee’s determination of fair value for an investment may also differ from the prices obtained by other persons (including other mutual funds) for the investment.
Valuation Measurements: Various inputs are used in determining the value of the Fund’s investments. These inputs are summarized in the three levels listed below.
Level 1: Quoted prices in active markets for identical investments.
Level 2: Other significant observable inputs (including quoted prices for similar investments, interest rates, prepayment rates, credit risk, etc.).
Level 3: Significant unobservable inputs (including the Fund’s own assumptions in determining the fair value of investments).
The following table displays a summary of the inputs used to value the Fund’s net assets as of March 31, 2011. In any instance when valuation inputs from more than one level are used to determine the fair value of a specific investment, the investment is placed in the level of the table based upon the lowest level input that is significant in determining the fair value of the investment:
| | | | | | | | | | | | | | | | |
| | | Fair Value Measurements at March 31, 2011 | |
| | | Total | | | Level 1 | | | Level 2 | | | Level 3 | |
Assets | | | | | | | | | | | | | | | | |
Investments in Securities* | | | | | | | | | | | | | | | | |
Common Stock | | $ | 6,376,986,498 | | | $ | 6,376,986,498 | | | $ | — | | | $ | — | |
Preferred Stock (a) | | | 344,289,035 | | | | 315,292,785 | | | | 28,996,250 | | | | — | |
Exchange Traded Funds | | | 57,475,000 | | | | 57,475,000 | | | | — | | | | — | |
Asset Backed Securities | | | 27,292,485 | | | | — | | | | 27,292,485 | | | | — | |
Corporate Bonds | | | 1,190,191,625 | | | | — | | | | 1,178,117,987 | | | | 12,073,638 | |
Convertible Bonds | | | 180,073,000 | | | | — | | | | 180,073,000 | | | | — | |
Municipal Bonds | | | 3,613,428 | | | | — | | | | 3,613,428 | | | | — | |
U.S. Government Agencies | | | 10,712,846 | | | | — | | | | 10,712,846 | | | | — | |
Foreign Bonds | | | 182,755,652 | | | | — | | | | 175,817,545 | | | | 6,938,107 | |
Other Securities | | | 25,465,658 | | | | — | | | | 22,934,750 | | | | 2,530,908 | |
Short Term Investments | | | 111,000,000 | | | | — | | | | 111,000,000 | | | | — | |
| | | | | | | | | | | | | | | | |
Total Investments in Securities | | $ | 8,509,855,227 | | | $ | 6,749,754,283 | | | $ | 1,738,558,291 | | | $ | 21,542,653 | |
| | | | |
Other Financial Instruments** | | | | | | | | | | | | | | | | |
Forward Currency Contracts | | $ | 6,265,292 | | | $ | — | | | $ | 6,265,292 | | | $ | — | |
| | | | |
Liabilities | | | | | | | | | | | | | | | | |
Other Financial Instruments** | | | | | | | | | | | | | | | | |
Forward Currency Contracts | | $ | (49,952,127 | ) | | $ | — | | | $ | (49,952,127 | ) | | $ | — | |
Spot Currency | | $ | (21,006 | ) | | $ | (21,006 | ) | | $ | — | | | $ | — | |
| (a) | Industry classifications for Preferred Stock in Level 2 consist of $7,781,250 in Banks, $4,640,000 in Real Estate and $16,575,000 in Telecommunication Services. |
36 Certified Semi-Annual Report
| | |
| NOTES TO FINANCIAL STATEMENTS, CONTINUED |
| |
| Thornburg Investment Income Builder Fund | | March 31, 2011 (Unaudited) |
| * | See Schedule of Investments for a summary of the industry exposure as grouped according to the Global Industry Classification Standard (GICS), which is an industry taxonomy developed by MSCI Barra and Standard & Poor’s (S&P). |
| ** | Other Financial Instruments include investments not reflected in the Schedule of Investments, such as futures, forwards and swap contracts, which are valued at the unrealized appreciation (depreciation) on the investment. |
A rollforward of fair value measurements using significant unobservable inputs (Level 3) for the six months ended March 31, 2011, was as follows:
| | | | | | | | | | | | | | | | | | | | | | | | | | | | |
| | | Beginning
Balance
9/30/2010 | | | Gross
Purchases | | | Gross
Sales | | | Net Realized
Gain/(Loss) | | | Net Unrealized
Appreciation/
(Depreciation) | | | Net Transfers
in/(out) of
Level 3(b) | | | Ending
Balance
3/31/2011 | |
Investments in Securities(a) | | $ | 31,312,142 | | | $ | 7,964,180 | | | $ | (248,406 | ) | | $ | 12,801 | | | $ | 1,918,089 | | | $ | (19,416,153 | ) | | $ | 21,542,653 | |
| (a) | Level 3 Securities represent 0.25% of Total Net Assets at the period ended March 31, 2011. |
| (b) | Net transfers out of Level 3 were to Level 2, and were due to changes in other significant observable inputs existing during the six months ended March 31, 2011. Transfers into or out of Level 3 are based on the beginning market value of the period in which they occurred. |
Other Notes: It is the policy of the Fund to recognize significant transfers between Levels 1 and 2 and to disclose those transfers at the last date of the reporting period. The Fund recognized no significant transfers into and out of Levels 1 and 2 during the six months ended March 31, 2011.
Foreign Currency Translation: Portfolio securities and other assets and liabilities denominated in foreign currencies are translated into U.S. dollars based on the exchange rate of such currencies against the U.S. dollar on the date of valuation. Purchases and sales of securities and income items denominated in foreign currencies are translated into U.S. dollars at the exchange rate in effect on the translation date. When the Fund purchases or sells foreign securities, it will customarily enter into a foreign exchange contract to minimize foreign exchange risk from the trade date to the settlement date of such transactions.
The Fund does not separately report the effect of changes in foreign exchange rates from changes in market prices on securities held. Such changes are included in net realized and unrealized gain or loss from investments.
Reported net realized foreign exchange gains or losses arise from sales of foreign currencies, currency gains or losses realized between the trade and settlement dates on securities transactions and the difference between the amounts of dividends, interest, and foreign withholding taxes recorded on the Fund’s books, and the U.S. dollar equivalent of the amounts actually received or paid.
Net unrealized foreign exchange gains and losses arise from changes in the fair value of assets and liabilities, other than investments in securities at fiscal period end, resulting from changes in exchange rates.
Deferred Taxes: The Fund is subject to a tax imposed on net realized gains of securities of certain foreign countries. The Fund records an estimated deferred tax liability for net unrealized gains on these securities as reflected in the accompanying financial statements.
Federal Income Taxes: It is the policy of the Trust to comply with the provisions of the Internal Revenue Code applicable to “regulated investment companies” and to distribute to shareholders substantially all taxable income, including any net realized gain on investments of the Fund. Therefore, no provision for federal income taxes is required.
Management reviews each tax position believed to be material to the preparation of the Fund’s financial statements, to assess if it is more likely than not that the position would be sustained upon examination, based upon the technical merits of the position. As of March 31, 2011, management has not identified any such position for which a liability must be reflected in the Statement of Assets and Liabilities. The Fund’s tax returns remain subject to examination for three years after filing.
When-Issued and Delayed Delivery Transactions: The Fund may engage in when-issued or delayed delivery transactions. To the extent the Fund engages in such transactions, it will do so for the purpose of acquiring portfolio securities consistent with the Fund’s investment
Certified Semi-Annual Report 37
| | |
| NOTES TO FINANCIAL STATEMENTS, CONTINUED |
| |
| Thornburg Investment Income Builder Fund | | March 31, 2011 (Unaudited) |
objectives and not for the purpose of investment leverage or to speculate on interest rate and/or market changes. At the time the Fund makes a commitment to purchase a security on a when-issued or delayed delivery basis, the Fund will record the transaction and reflect the value in determining its net asset value. When effecting such transactions, assets of an amount sufficient to make payment for the portfolio securities to be purchased will be segregated on the Fund’s records on the trade date. Securities purchased on a when-issued or delayed delivery basis do not earn interest until the settlement date.
Dividends: Net investment income of the Fund is declared daily as a dividend on shares for which the Fund has received payment. Dividends are paid quarterly and are reinvested in additional shares of the Fund at net asset value per share at the close of business on the dividend payment date, or at the shareholder’s option, paid in cash. Net realized capital gains, to the extent available, will be distributed at least annually. Distributions to shareholders are based on income tax regulations and therefore, their characteristics may differ for financial statement and tax purposes.
General: Securities transactions are accounted for on a trade date basis. Interest income is accrued as earned and dividend income is recorded on the ex-dividend date. Certain income from foreign securities is recognized as soon as information is available to the Fund. Realized gains and losses from the sale of securities are recorded on an identified cost basis. Net investment income (other than class specific expenses) and realized and unrealized gains and losses are allocated daily to each class of shares based upon the relative net asset value of outstanding shares of each class of shares at the beginning of the day (after adjusting for the current share activity of the respective class). Expenses common to all Funds are allocated among the Funds comprising the Trust based upon their relative net asset values or other appropriate allocation methods.
Guarantees and Indemnifications: Under the Trust’s organizational documents, its officers and Trustees are indemnified against certain liabilities arising out of the performance of their duties to the Fund. Additionally, in the normal course of business the Trust enters into contracts with service providers that contain general indemnification clauses. The Trust’s maximum exposure under these arrangements is unknown. However, based on experience, the Trust expects the risk of loss to be remote.
Use of Estimates: The preparation of financial statements, in conformity with generally accepted accounting principles, requires management to make estimates and assumptions that affect the reported amounts of assets and liabilities and the disclosure of contingent assets and liabilities at the date of the financial statements and the reported amounts of increases and decreases in net assets from operations during the reporting period. Actual results could differ from those estimates.
NOTE 3 – INVESTMENT ADVISORY FEE AND OTHER TRANSACTIONS WITH AFFILIATES
Pursuant to an investment advisory agreement, Thornburg Investment Management, Inc. (the “Advisor”) serves as the investment advisor and performs services to the Fund for which the fees are payable at the end of each month. For the six months ended March 31, 2011, these fees were payable at annual rates ranging from .875 of 1% to .675 of 1% per annum of the average daily net assets of the Fund depending on the Fund’s asset size. The Trust also has entered into administrative services agreements with the Advisor, whereby the Advisor will perform certain administrative services for the shareholders of each class of the Fund’s shares, and for which fees will be payable at an annual rate of up to .125 of 1% per annum of the average daily net assets attributable to each class of shares. For the six months ended March 31, 2011, the Advisor voluntarily or contractually reimbursed certain class specific expenses, administrative fees, and distribution fees of $803,656 for Class C shares, $495 for Class I shares, $9,961 for Class R3 shares, $7,585 for Class R4 shares, and $11,282 for Class R5 shares.
The Trust has an underwriting agreement with Thornburg Securities Corporation (the “Distributor,” an affiliate of the Advisor), which acts as the distributor of the Fund’s shares. For the six months ended March 31, 2011, the Distributor has advised the Fund that it earned commissions aggregating $1,191,474 from the sale of Class A shares, and collected contingent deferred sales charges aggregating $165,809 from redemptions of Class C shares of the Fund.
Pursuant to a service plan under Rule 12b-1 of the Investment Company Act of 1940, the Fund may reimburse to the Advisor an amount not to exceed .25 of 1% per annum of the average daily net assets attributable to each class of shares of the Fund for payments made by the Advisor to securities dealers and other financial institutions to obtain various shareholder and distribution related services. For the six months ended March 31, 2011, there were no 12b-1 service plan fees charged for Class I shares. The Advisor may pay out of its own resources additional expenses for distribution of the Fund’s shares.
38 Certified Semi-Annual Report
| | |
| NOTES TO FINANCIAL STATEMENTS, CONTINUED |
| |
| Thornburg Investment Income Builder Fund | | March 31, 2011 (Unaudited) |
The Trust has also adopted distribution plans pursuant to Rule 12b-1, applicable only to the Fund’s Class C and Class R3 shares, under which the Fund compensates the Distributor for services in promoting the sale of Class C and Class R3 shares of the Fund at an annual rate of up to .75 of 1% per annum of the average daily net assets attributable to Class C shares, and an annual rate of up to .25 of 1% per annum of the average daily net assets attributable to Class R3 shares. Total fees incurred by the Distributor for each class of shares of the Fund under their respective Service and Distribution Plans for the six months ended March 31, 2011, are set forth in the Statement of Operations.
The Trust has an agreement with the custodian bank to indirectly pay a portion of the custodian’s fees through credits earned by the Fund’s cash on deposit with the bank. This deposit agreement is an alternative to overnight investments. Custodial fees have been adjusted to reflect amounts that would have been paid without this agreement, with a corresponding adjustment reflected as fees paid indirectly in the Statement of Operations. For the six months ended March 31, 2011, there were no fees paid indirectly.
Certain officers and Trustees of the Trust are also officers and/or directors of the Advisor and Distributor. The compensation of independent Trustees is borne by the Trust.
NOTE 4 – SHARES OF BENEFICIAL INTEREST
At March 31, 2011, there were an unlimited number of shares of beneficial interest authorized. Transactions in shares of beneficial interest were as follows:
| | | | | | | | | | | | | | | | |
| | | Six Months Ended
March 31, 2011 (Unaudited) | | | Year Ended
September 30, 2010 (Audited) | |
| | | Shares | | | Amount | | | Shares | | | Amount | |
Class A Shares | | | | | | | | | | | | | | | | |
Shares sold | | | 35,693,933 | | | $ | 681,478,236 | | | | 43,283,964 | | | $ | 770,088,645 | |
Shares issued to shareholders in reinvestment of dividends | | | 2,725,581 | | | | 52,221,191 | | | | 4,439,224 | | | | 79,354,477 | |
Shares repurchased | | | (9,493,869 | ) | | | (181,350,945 | ) | | | (18,042,158 | ) | | | (319,573,633 | ) |
Redemption fees received* | | | — | | | | 11,086 | | | | — | | | | 21,777 | |
| | | | | | | | | | | | | | | | |
| | | | |
Net Increase (Decrease) | | | 28,925,645 | | | $ | 552,359,568 | | | | 29,681,030 | | | $ | 529,891,266 | |
| | | | | | | | | | | | | | | | |
| | | | |
Class C Shares | | | | | | | | | | | | | | | | |
Shares sold | | | 41,204,631 | | | $ | 787,740,401 | | | | 49,564,535 | | | $ | 883,762,048 | |
Shares issued to shareholders in reinvestment of dividends | | | 2,495,737 | | | | 47,798,352 | | | | 3,972,825 | | | | 71,048,461 | |
Shares repurchased | | | (8,016,938 | ) | | | (153,131,334 | ) | | | (13,520,528 | ) | | | (239,560,490 | ) |
Redemption fees received* | | | — | | | | 12,348 | | | | — | | | | 22,954 | |
| | | | | | | | | | | | | | | | |
| | | | |
Net Increase (Decrease) | | | 35,683,430 | | | $ | 682,419,767 | | | | 40,016,832 | | | $ | 715,272,973 | |
| | | | | | | | | | | | | | | | |
| | | | |
Class I Shares | | | | | | | | | | | | | | | | |
Shares sold | | | 51,383,496 | | | $ | 987,604,250 | | | | 54,684,137 | | | $ | 981,032,227 | |
Shares issued to shareholders in reinvestment of dividends | | | 2,571,096 | | | | 49,633,239 | | | | 3,466,124 | | | | 62,410,241 | |
Shares repurchased | | | (10,020,300 | ) | | | (192,662,014 | ) | | | (18,750,557 | ) | | | (335,736,228 | ) |
Redemption fees received* | | | — | | | | 10,056 | | | | — | | | | 16,224 | |
| | | | | | | | | | | | | | | | |
| | | | |
Net Increase (Decrease) | | | 43,934,292 | | | $ | 844,585,531 | | | | 39,399,704 | | | $ | 707,722,464 | |
| | | | | | | | | | | | | | | | |
Certified Semi-Annual Report 39
| | |
| NOTES TO FINANCIAL STATEMENTS, CONTINUED |
| |
| Thornburg Investment Income Builder Fund | | March 31, 2011 (Unaudited) |
| | | | | | | | | | | | | | | | |
| | | Six Months Ended
March 31, 2011 (Unaudited) | | | Year Ended
September 30, 2010 (Audited) | |
| | | Shares | | | Amount | | | Shares | | | Amount | |
Class R3 Shares | | | | | | | | | | | | | | | | |
Shares sold | | | 683,899 | | | $ | 13,077,767 | | | | 746,503 | | | $ | 13,383,203 | |
Shares issued to shareholders in reinvestment of dividends | | | 37,266 | | | | 713,936 | | | | 55,329 | | | | 988,963 | |
Shares repurchased | | | (197,655 | ) | | | (3,778,541 | ) | | | (368,316 | ) | | | (6,549,359 | ) |
Redemption fees received* | | | — | | | | 137 | | | | — | | | | 232 | |
| | | | | | | | | | | | | | | | |
| | | | |
Net Increase (Decrease) | | | 523,510 | | | $ | 10,013,299 | | | | 433,516 | | | $ | 7,823,039 | |
| | | | | | | | | | | | | | | | |
| | | | |
Class R4 Shares | | | | | | | | | | | | | | | | |
Shares sold | | | 272,633 | | | $ | 5,258,562 | | | | 105,112 | | | $ | 1,826,925 | |
Shares issued to shareholders in reinvestment of dividends | | | 3,185 | | | | 61,615 | | | | 1,635 | | | | 29,296 | |
Shares repurchased | | | (23,486 | ) | | | (456,184 | ) | | | (3,165 | ) | | | (56,750 | ) |
Redemption fees received* | | | — | | | | 20 | | | | — | | | | 12 | |
| | | | | | | | | | | | | | | | |
| | | | |
Net Increase (Decrease) | | | 252,332 | | | $ | 4,864,013 | | | | 103,582 | | | $ | 1,799,483 | |
| | | | | | | | | | | | | | | | |
| | | | |
Class R5 Shares | | | | | | | | | | | | | | | | |
Shares sold | | | 92,355 | | | $ | 1,777,583 | | | | 302,943 | | | $ | 5,496,684 | |
Shares issued to shareholders in reinvestment of dividends | | | 6,588 | | | | 127,055 | | | | 6,243 | | | | 111,969 | |
Shares repurchased | | | (18,250 | ) | | | (345,891 | ) | | | (150,901 | ) | | | (2,665,036 | ) |
Redemption fees received* | | | — | | | | 20 | | | | — | | | | 21 | |
| | | | | | | | | | | | | | | | |
| | | | |
Net Increase (Decrease) | | | 80,693 | | | $ | 1,558,767 | | | | 158,285 | | | $ | 2,943,638 | |
| | | | | | | | | | | | | | | | |
| * | The Fund charges a redemption fee of 1% of the Class A and Class I shares redeemed or exchanged within 30 days of purchase. Redemption fees charged to any class are allocated to all classes upon receipt of payment based on relative net asset values of each class or other appropriate allocation methods. |
NOTE 5 – SECURITIES TRANSACTIONS
For the six months ended March 31, 2011, the Fund had purchase and sale transactions of investment securities (excluding short-term investments and U. S. Government obligations) of $2,717,825,397 and $770,331,204, respectively.
NOTE 6 – INCOME TAXES
At March 31, 2011, information on the tax components of capital is as follows:
| | | | |
Cost of investments for tax purposes | | $ | 7,539,932,472 | |
| | | | |
Gross unrealized appreciation on a tax basis | | $ | 1,092,340,888 | |
Gross unrealized depreciation on a tax basis | | | (122,418,133 | ) |
| | | | |
Net unrealized appreciation (depreciation) on investments (tax basis) | | $ | 969,922,755 | |
| | | | |
40 Certified Semi-Annual Report
| | |
| NOTES TO FINANCIAL STATEMENTS, CONTINUED |
| |
| Thornburg Investment Income Builder Fund | | March 31, 2011 (Unaudited) |
At March 31, 2011, the Fund had deferred tax basis currency and capital losses occurring subsequent to October 31, 2009 of $288,211 and $32,070,845, respectively. For tax purposes, such losses will be reflected in the year ending September 30, 2011.
At March 31, 2011, the Fund had tax basis capital losses, which may be carried forward to offset future capital gains. To the extent such carryforwards are used, capital gain distributions may be reduced to the extent provided by regulations.
Such capital loss carryforwards expire as follows:
| | | | |
2016 | | $ | 4,262,779 | |
2017 | | | 280,451,429 | |
2018 | | | 493,662,779 | |
| | | | |
| | $ | 778,376,987 | |
| | | | |
NOTE 7 – DERIVATIVE FINANCIAL INSTRUMENTS WITH OFF-BALANCE SHEET RISK AND FOREIGN INVESTMENT RISK
The Fund may use a variety of derivative financial instruments to hedge or adjust the risks affecting its investment portfolio or to enhance investment returns. Provisions of FASB Accounting Standards Codification ASC 815-10-50 (“ASC 815”), require certain disclosures. The disclosures are intended to provide users of financial statements with an understanding of the use of derivative instruments by the Fund and how these derivatives affect the financial position, financial performance and cash flows of the Fund. The Fund does not designate any derivative instruments as hedging instruments under ASC 815. During the six months ended March 31, 2011, the Fund’s principal exposure to derivative financial instruments of the type addressed by ASC 815 was investment in foreign exchange contracts. A foreign exchange contract is an agreement between two parties to exchange different currencies at a specified rate of exchange at an agreed upon future date. Foreign exchange contracts involve risks to the Fund, including the risk that a contract counterparty will not meet its obligations to the Fund, the risk that a change in a contract’s value may not correlate perfectly with the currency the contract was intended to track, and the risk that the Fund’s advisor is unable to correctly implement its strategy in using a contract. In any such instance, the Fund may not achieve the intended benefit of entering into a contract, and may experience a loss.
The Fund entered into forward currency contracts during the six months ended March 31, 2011 in the normal course of pursuing its investment objectives, in anticipation of purchasing foreign investments or with the intent of reducing the risk to the value of the Fund’s foreign investments from adverse changes in the relationship between the U.S. dollar and foreign currencies. In each case these contracts have been initiated in conjunction with foreign investment transactions.
These contracts are accounted for by the Fund under ASC 815. Unrealized gains and unrealized losses on outstanding contracts are reported in the Fund’s Statement of Assets and Liabilities at the Fund’s net equity, as measured by the difference between the forward exchange rates at the reporting date and the forward exchange rates at each contract’s inception date. Net realized gain (loss) on contracts closed during the period, and changes in net unrealized appreciation (depreciation) on outstanding contracts are recognized in the Fund’s Statement of Operations.
Certified Semi-Annual Report 41
| | |
| NOTES TO FINANCIAL STATEMENTS, CONTINUED | | |
| |
| Thornburg Investment Income Builder Fund | | March 31, 2011 (Unaudited) |
The following table displays the outstanding forward currency contracts, at March 31, 2011:
| | | | | | | | | | | | | | | | | | | | | | | | |
Outstanding Forward Currency Contracts to Buy or Sell at March 31, 2011 | |
Contract Description | | Buy/Sell | | | Contract
Amount | | | Contract
Value Date | | | Value USD | | | Unrealized
Appreciation | | | Unrealized
Depreciation | |
Euro | | | Buy | | | | 549,796,800 | | | | 04/06/2011 | | | $ | 779,142,733 | | | $ | 6,155,922 | | | $ | — | |
Euro | | | Sell | | | | 107,340,200 | | | | 08/31/2011 | | | | 151,616,874 | | | | — | | | | (4,205,504 | ) |
Euro | | | Sell | | | | 127,439,500 | | | | 04/06/2011 | | | | 180,600,470 | | | | — | | | | (12,614,818 | ) |
Euro | | | Sell | | | | 422,357,300 | | | | 04/06/2011 | | | | 598,542,263 | | | | — | | | | (20,246,424 | ) |
Euro | | | Sell | | | | 648,459,200 | | | | 08/31/2011 | | | | 915,941,620 | | | | — | | | | (7,210,351 | ) |
Great Britain Pound | | | Sell | | | | 20,967,500 | | | | 04/06/2011 | | | | 33,635,305 | | | | 109,370 | | | | — | |
Great Britain Pound | | | Sell | | | | 51,178,900 | | | | 04/06/2011 | | | | 82,099,339 | | | | — | | | | (1,047,315 | ) |
Swiss Franc | | | Sell | | | | 17,764,500 | | | | 04/06/2011 | | | | 19,341,012 | | | | — | | | | (226,039 | ) |
Swiss Franc | | | Sell | | | | 67,440,500 | | | | 04/06/2011 | | | | 73,425,511 | | | | — | | | | (4,092,212 | ) |
Thai Baht | | | Sell | | | | 355,380,200 | | | | 08/25/2011 | | | | 11,652,964 | | | | — | | | | (82,716 | ) |
Thai Baht | | | Sell | | | | 779,346,600 | | | | 08/25/2011 | | | | 25,554,880 | | | | — | | | | (226,748 | ) |
| | | | | | | | | | | | | | | | | | | | | | | | |
Total | | | | | | | | | | | | | | | | | | $ | 6,265,292 | | | $ | (49,952,127 | ) |
| | | | | | | | | | | | | | | | | | | | | | | | |
The unrealized appreciation (depreciation) of the outstanding forward currency contracts recognized in the Fund’s Statement of Assets and Liabilities at March 31, 2011 is disclosed in the following table:
| | | | |
Fair Values of Derivative Financial Instruments at March 31, 2011 |
Asset Derivatives
| | | | | | |
| | | Balance Sheet Location | | Fair Value | |
Foreign exchange contracts | | Assets - Unrealized appreciation on
forward currency contracts | | $ | 6,265,292 | |
Liability Derivatives
| | | | | | |
| | | Balance Sheet Location | | Fair Value | |
Foreign exchange contracts | | Liabilities - Unrealized depreciation on
forward currency contracts | | $ | (49,952,127 | ) |
The realized gains (losses) from forward currency contracts and the change in unrealized appreciation (depreciation) of outstanding forward currency contracts recognized in the Fund’s Statement of Operations for the six months ended March 31, 2011 are disclosed in the following tables:
| | | | | | | | |
Amount of Realized Gain (Loss) on Derivative
Financial Instruments Recognized in Income for the
Six Months Ended March 31, 2011 | |
| | | Total | | | Forward Currency Contracts | |
Foreign exchange contracts | | $ | (66,863,627 | ) | | $ | (66,863,627 | ) |
| | | | | | | | |
Change in Unrealized Appreciation (Depreciation)
of Derivative Financial Instruments Recognized in
Income for the Six Months Ended March 31, 2011 | |
| | | Total | | | Forward Currency Contracts | |
Foreign exchange contracts | | $ | (14,357,972 | ) | | $ | (14,357,972 | ) |
OTHER NOTES
Fund management believes no events have occurred between March 31, 2011 and May 20, 2011, the date of issuance of the financial statements, which require adjustment of, or disclosure in, the accompanying financial statements.
42 Certified Semi-Annual Report
This page intentionally left blank.
Certified Semi-Annual Report 43
| | |
| FINANCIAL HIGHLIGHTS |
| |
| Thornburg Investment Income Builder Fund | | March 31, 2011 (Unaudited) |
| | | | | | | | | | | | | | | | | | | | | | | | | | | | | | | | | | | | | | | | | | | | | | | | | | | | | | | | | | | | |
| | | PER SHARE PERFORMANCE (for a share outstanding throughout the period)+ | | | RATIOS TO AVERAGE NET ASSETS | | | SUPPLEMENTAL DATA | |
Unless
Otherwise
Noted,
Periods
are
Fiscal
Years
Ended
Sept. 30, | | Net Asset
Value
Beginning
of
Period | | | Net
Investment
Income
(Loss) | | | Net
Realized
&
Unrealized
Gain (Loss)
on
Investments | | | Total from
Investment
Operations | | | Dividends
from Net
Investment
Income | | | Dividends
from Net
Realized
Gains | | | Total
Dividends | | | Net
Asset
Value
End
of
Period | | | Net
Investment
Income
(Loss)
(%) | | | Expenses,
After
Expense
Reductions
(%) | | | Expenses,
After
Expense
Reductions
and
Net of
Custody
Credits
(%) | | | Expenses,
Before
Expense
Reductions
(%) | | | Total
Return
(%)(a) | | | Portfolio
Turnover
Rate (%) | | | Net Assets
at End
of Period
(Thousands) | |
Class A Shares | | | | | | | | | | | | | | | | | | | | | | | | | | | | | | | | | | | | | | | | | | | | | | | | | | | | | | | | | |
2011(b)(c) | | $ | 18.31 | | | | 0.46 | | | | 1.41 | | | | 1.87 | | | | (0.57 | ) | | | — | | | | (0.57 | ) | | $ | 19.61 | | | | 4.81 | (d) | | | 1.20 | (d) | | | 1.20 | (d) | | | 1.20 | (d) | | | 10.29 | | | | 10.92 | | | $ | 2,729,204 | |
2010(c) | | $ | 17.38 | | | | 1.14 | | | | 0.90 | | | | 2.04 | | | | (1.11 | ) | | | — | | | | (1.11 | ) | | $ | 18.31 | | | | 6.47 | | | | 1.25 | | | | 1.25 | | | | 1.25 | | | | 12.08 | | | | 35.50 | | | $ | 2,018,202 | |
2009(c) | | $ | 16.86 | | | | 1.01 | | | | 0.58 | | | | 1.59 | | | | (1.07 | ) | | | — | | | | (1.07 | ) | | $ | 17.38 | | | | 7.03 | | | | 1.30 | | | | 1.30 | | | | 1.30 | | | | 10.89 | | | | 63.05 | | | $ | 1,400,454 | |
2008(c) | | $ | 23.35 | | | | 1.04 | | | | (6.04 | ) | | | (5.00 | ) | | | (1.02 | ) | | | (0.47 | ) | | | (1.49 | ) | | $ | 16.86 | | | | 5.01 | | | | 1.25 | | | | 1.25 | | | | 1.25 | | | | (22.48 | ) | | | 46.07 | | | $ | 1,393,268 | |
2007(c) | | $ | 19.58 | | | | 0.93 | | | | 4.23 | | | | 5.16 | | | | (0.88 | ) | | | (0.51 | ) | | | (1.39 | ) | | $ | 23.35 | | | | 4.39 | | | | 1.30 | | | | 1.30 | | | | 1.30 | | | | 27.40 | | | | 62.60 | | | $ | 1,697,061 | |
2006(c) | | $ | 17.93 | | | | 0.78 | | | | 1.98 | | | | 2.76 | | | | (0.77 | ) | | | (0.34 | ) | | | (1.11 | ) | | $ | 19.58 | | | | 4.22 | | | | 1.38 | | | | 1.38 | | | | 1.38 | | | | 16.05 | | | | 55.29 | | | $ | 903,347 | |
| | | | | | | | | | | | | | |
Class C Shares | | | | | | | | | | | | | | | | | | | | | | | | | | | | | | | | | | | | | | | | | | | | | | | | | | | | | | | | | |
2011(b) | | $ | 18.31 | | | | 0.39 | | | | 1.41 | | | | 1.80 | | | | (0.50 | ) | | | — | | | | (0.50 | ) | | $ | 19.61 | | | | 4.12 | (d) | | | 1.90 | (d) | | | 1.90 | (d) | | | 1.96 | (d) | | | 9.94 | | | | 10.92 | | | $ | 3,093,638 | |
2010 | | $ | 17.39 | | | | 1.03 | | | | 0.89 | | | | 1.92 | | | | (1.00 | ) | | | — | | | | (1.00 | ) | | $ | 18.31 | | | | 5.86 | | | | 1.90 | | | | 1.90 | | | | 2.02 | | | | 11.32 | | | | 35.50 | | | $ | 2,234,953 | |
2009 | | $ | 16.87 | | | | 0.92 | | | | 0.59 | | | | 1.51 | | | | (0.99 | ) | | | — | | | | (0.99 | ) | | $ | 17.39 | | | | 6.44 | | | | 1.90 | | | | 1.90 | | | | 2.08 | | | | 10.27 | | | | 63.05 | | | $ | 1,426,613 | |
2008 | | $ | 23.37 | | | | 0.90 | | | | (6.04 | ) | | | (5.14 | ) | | | (0.89 | ) | | | (0.47 | ) | | | (1.36 | ) | | $ | 16.87 | | | | 4.36 | | | | 1.90 | | | | 1.90 | | | | 2.03 | | | | (23.02 | ) | | | 46.07 | | | $ | 1,399,947 | |
2007 | | $ | 19.60 | | | | 0.81 | | | | 4.22 | | | | 5.03 | | | | (0.75 | ) | | | (0.51 | ) | | | (1.26 | ) | | $ | 23.37 | | | | 3.79 | | | | 1.90 | | | | 1.89 | | | | 2.06 | | | | 26.64 | | | | 62.60 | | | $ | 1,535,532 | |
2006 | | $ | 17.95 | | | | 0.70 | | | | 1.97 | | | | 2.67 | | | | (0.68 | ) | | | (0.34 | ) | | | (1.02 | ) | | $ | 19.60 | | | | 3.73 | | | | 1.90 | | | | 1.90 | | | | 2.15 | | | | 15.45 | | | | 55.29 | | | $ | 636,947 | |
| | | | | | | | | | | | | | |
Class I Shares | | | | | | | | | | | | | | | | | | | | | | | | | | | | | | | | | | | | | | | | | | | | | | | | | | | | | | | | | |
2011(b) | | $ | 18.43 | | | | 0.49 | | | | 1.42 | | | | 1.91 | | | | (0.60 | ) | | | — | | | | (0.60 | ) | | $ | 19.74 | | | | 5.19 | (d) | | | 0.86 | (d) | | | 0.86 | (d) | | | 0.86 | (d) | | | 10.48 | | | | 10.92 | | | $ | 2,669,881 | |
2010 | | $ | 17.50 | | | | 1.22 | �� | | | 0.89 | | | | 2.11 | | | | (1.18 | ) | | | — | | | | (1.18 | ) | | $ | 18.43 | | | | 6.87 | | | | 0.93 | | | | 0.93 | | | | 0.93 | | | | 12.39 | | | | 35.50 | | | $ | 1,682,616 | |
2009 | | $ | 16.97 | | | | 1.07 | | | | 0.59 | | | | 1.66 | | | | (1.13 | ) | | | — | | | | (1.13 | ) | | $ | 17.50 | | | | 7.39 | | | | 0.97 | | | | 0.97 | | | | 0.97 | | | | 11.29 | | | | 63.05 | | | $ | 908,126 | |
2008 | | $ | 23.50 | | | | 1.10 | | | | (6.06 | ) | | | (4.96 | ) | | | (1.10 | ) | | | (0.47 | ) | | | (1.57 | ) | | $ | 16.97 | | | | 5.34 | | | | 0.89 | | | | 0.89 | | | | 0.89 | | | | (22.20 | ) | | | 46.07 | | | $ | 766,772 | |
2007 | | $ | 19.71 | | | | 1.02 | | | | 4.24 | | | | 5.26 | | | | (0.96 | ) | | | (0.51 | ) | | | (1.47 | ) | | $ | 23.50 | | | | 4.74 | | | | 0.95 | | | | 0.94 | | | | 0.95 | | | | 27.80 | | | | 62.60 | | | $ | 644,294 | |
2006 | | $ | 18.03 | | | | 0.88 | | | | 1.98 | | | | 2.86 | | | | (0.84 | ) | | | (0.34 | ) | | | (1.18 | ) | | $ | 19.71 | | | | 4.68 | | | | 0.99 | | | | 0.98 | | | | 1.02 | | | | 16.53 | | | | 55.29 | | | $ | 308,859 | |
| | | | | | | | | | | | | | |
Class R3 Shares | | | | | | | | | | | | | | | | | | | | | | | | | | | | | | | | | | | | | | | | | | | | | | | | | | | | | | | | | |
2011(b) | | $ | 18.30 | | | | 0.43 | | | | 1.42 | | | | 1.85 | | | | (0.54 | ) | | | — | | | | (0.54 | ) | | $ | 19.61 | | | | 4.55 | (d) | | | 1.50 | (d) | | | 1.50 | (d) | | | 1.57 | (d) | | | 10.20 | | | | 10.92 | | | $ | 35,493 | |
2010 | | $ | 17.38 | | | | 1.11 | | | | 0.88 | | | | 1.99 | | | | (1.07 | ) | | | — | | | | (1.07 | ) | | $ | 18.30 | | | | 6.27 | | | | 1.50 | | | | 1.50 | | | | 1.69 | | | | 11.75 | | | | 35.50 | | | $ | 23,550 | |
2009 | | $ | 16.85 | | | | 1.00 | | | | 0.58 | | | | 1.58 | | | | (1.05 | ) | | | — | | | | (1.05 | ) | | $ | 17.38 | | | | 6.93 | | | | 1.50 | | | | 1.50 | | | | 1.87 | | | | 10.74 | | | | 63.05 | | | $ | 14,828 | |
2008 | | $ | 23.34 | | | | 1.00 | | | | (6.05 | ) | | | (5.05 | ) | | | (0.97 | ) | | | (0.47 | ) | | | (1.44 | ) | | $ | 16.85 | | | | 4.89 | | | | 1.49 | | | | 1.49 | | | | 1.77 | | | | (22.69 | ) | | | 46.07 | | | $ | 11,848 | |
2007 | | $ | 19.58 | | | | 0.86 | | | | 4.24 | | | | 5.10 | | | | (0.83 | ) | | | (0.51 | ) | | | (1.34 | ) | | $ | 23.34 | | | | 4.00 | | | | 1.50 | | | | 1.50 | | | | 2.16 | | | | 27.10 | | | | 62.60 | | | $ | 7,544 | |
2006 | | $ | 17.93 | | | | 0.82 | | | | 1.92 | | | | 2.74 | | | | (0.75 | ) | | | (0.34 | ) | | | (1.09 | ) | | $ | 19.58 | | | | 4.36 | | | | 1.50 | | | | 1.50 | | | | 6.05 | | | | 15.91 | | | | 55.29 | | | $ | 1,301 | |
| | | | | | | | | | | | | | |
Class R4 Shares | | | | | | | | | | | | | | | | | | | | | | | | | | | | | | | | | | | | | | | | | | | | | | | | | | | | | | | | | |
2011(b) | | $ | 18.34 | | | | 0.47 | | | | 1.38 | | | | 1.85 | | | | (0.55 | ) | | | — | | | | (0.55 | ) | | $ | 19.64 | | | | 4.87 | (d) | | | 1.39 | (d) | | | 1.39 | (d) | | | 1.76 | (d) | | | 10.18 | | | | 10.92 | | | $ | 7,045 | |
2010 | | $ | 17.47 | | | | 1.22 | | | | 0.74 | | | | 1.96 | | | | (1.09 | ) | | | — | | | | (1.09 | ) | | $ | 18.34 | | | | 6.89 | | | | 1.40 | | | | 1.40 | | | | 3.60 | | | | 11.52 | | | | 35.50 | | | $ | 1,950 | |
2009 | | $ | 16.94 | | | | 1.01 | | | | 0.59 | | | | 1.60 | | | | (1.07 | ) | | | — | | | | (1.07 | ) | | $ | 17.47 | | | | 7.02 | | | | 1.40 | | | | 1.40 | | | | 9.54 | (e) | | | 10.83 | | | | 63.05 | | | $ | 48 | |
2008(f) | | $ | 21.22 | | | | 0.66 | | | | (4.39 | ) | | | (3.73 | ) | | | (0.55 | ) | | | — | | | | (0.55 | ) | | $ | 16.94 | | | | 5.28 | (d) | | | 1.40 | (d) | | | 1.40 | (d) | | | 16.97 | (d)(e) | | | (17.79 | ) | | | 46.07 | | | $ | 251 | |
| | | | | | | | | | | | | | |
Class R5 Shares | | | | | | | | | | | | | | | | | | | | | | | | | | | | | | | | | | | | | | | | | | | | | | | | | | | | | | | | | |
2011(b) | | $ | 18.42 | | | | 0.49 | | | | 1.42 | | | | 1.91 | | | | (0.59 | ) | | | — | | | | (0.59 | ) | | $ | 19.74 | | | | 5.08 | (d) | | | 0.99 | (d) | | | 0.99 | (d) | | | 1.52 | (d) | | | 10.47 | | | | 10.92 | | | $ | 5,198 | |
2010 | | $ | 17.50 | | | | 1.36 | | | | 0.74 | | | | 2.10 | | | | (1.18 | ) | | | — | | | | (1.18 | ) | | $ | 18.42 | | | | 7.67 | | | | 0.99 | | | | 0.99 | | | | 2.35 | | | | 12.31 | | | | 35.50 | | | $ | 3,366 | |
2009 | | $ | 16.98 | | | | 1.04 | | | | 0.61 | | | | 1.65 | | | | (1.13 | ) | | | — | | | | (1.13 | ) | | $ | 17.50 | | | | 7.14 | | | | 0.99 | | | | 0.99 | | | | 9.20 | (e) | | | 11.19 | | | | 63.05 | | | $ | 427 | |
2008 | | $ | 23.51 | | | | 1.11 | | | | (6.09 | ) | | | (4.98 | ) | | | (1.08 | ) | | | (0.47 | ) | | | (1.55 | ) | | $ | 16.98 | | | | 5.48 | | | | 0.99 | | | | 0.99 | | | | 11.77 | (e) | | | (22.27 | ) | | | 46.07 | | | $ | 221 | |
2007(g) | | $ | 20.74 | | | | 0.46 | | | | 2.87 | | | | 3.33 | | | | (0.56 | ) | | | — | | | | (0.56 | ) | | $ | 23.51 | | | | 3.17 | (d) | | | 0.99 | (d) | | | 0.98 | (d) | | | 278.77 | (d)(e) | | | 16.19 | | | | 62.60 | | | $ | 72 | |
| (a) | Not annualized for periods less than one year. |
| (b) | Unaudited Six Month Period Ended March 31. |
| (c) | Sales loads are not reflected in computing total return. |
| (e) | Due to the size of net assets and fixed expenses, ratios may appear disproportionate. |
| (f) | Effective date of this class of shares was February 1, 2008. |
| (g) | Effective date of this class of shares was February 1, 2007. |
| + | Based on weighted average shares outstanding. |
See notes to financial statements.
| | |
| 44 Certified Semi-Annual Report | | Certified Semi-Annual Report 45 |
| | |
| EXPENSE EXAMPLE | | |
| |
Thornburg Investment Income Builder Fund | | March 31, 2011 (Unaudited) |
As a shareholder of the Fund, you incur two types of costs:
| | (1) | transaction costs, including |
(a) sales charges (loads) on purchase payments for Class A shares;
(b) a deferred sales charge on redemptions of any part or all of a purchase of $1 million of Class A shares within 12 months of purchase;
(c) a deferred sales charge on redemptions of Class C shares within 12 months of purchase;
(d) a 30-day redemption fee on Class A and Class I shares;
| | (2) | ongoing costs, including management fees; distribution and/or service (12b-1) fees; and other Fund expenses. |
This example is intended to help you understand your ongoing costs (in dollars) of investing in the Fund and to compare these costs with the ongoing costs of investing in other mutual funds.
The example is based on a $1,000 investment beginning on October 1, 2010, and held until March 31, 2011.
ACTUAL EXPENSES
For each class of shares, the first line of the table at right provides information about actual account values and actual expenses. You may use the information in this line, together with the amount you invested, to estimate the expenses that you paid over the period. Simply divide your account value by $1,000 (for example, an $8,600 account value divided by $1,000 = 8.6), then multiply the result by the number in the first line for your class of shares under the heading entitled “Expenses Paid During Period” to estimate the expenses you paid on your account during this period.
HYPOTHETICAL EXAMPLE FOR COMPARISON PURPOSES
For each class of shares, the second line of the table at right provides information about hypothetical account values and hypothetical expenses based on the Fund’s actual expense ratio and an assumed rate of return of 5% per year before expenses, which is not the Fund’s actual return. The hypothetical account values and expenses may not be used to estimate the actual ending account balance or expenses you paid for the period. You may use this information to compare the ongoing costs of investing in the Fund and other funds. To do so, compare this 5% hypothetical example with the 5% hypothetical examples that appear in the shareholder reports of the other funds.
| | | | | | | | | | | | |
| | | Beginning
Account Value
10/1/10 | | | Ending
Account Value
3/31/11 | | | Expenses Paid
During Period†
10/1/10–3/31/11 | |
Class A Shares | | | | | | | | | | | | |
Actual | | $ | 1,000.00 | | | $ | 1,102.90 | | | $ | 6.31 | |
Hypothetical* | | $ | 1,000.00 | | | $ | 1,018.93 | | | $ | 6.05 | |
Class C Shares | | | | | | | | | | | | |
Actual | | $ | 1,000.00 | | | $ | 1,099.40 | | | $ | 9.94 | |
Hypothetical* | | $ | 1,000.00 | | | $ | 1,015.46 | | | $ | 9.55 | |
Class I Shares | | | | | | | | | | | | |
Actual | | $ | 1,000.00 | | | $ | 1,104.80 | | | $ | 4.52 | |
Hypothetical* | | $ | 1,000.00 | | | $ | 1,020.64 | | | $ | 4.34 | |
Class R3 Shares | | | | | | | | | | | | |
Actual | | $ | 1,000.00 | | | $ | 1,102.00 | | | $ | 7.85 | |
Hypothetical* | | $ | 1,000.00 | | | $ | 1,017.46 | | | $ | 7.54 | |
Class R4 Shares | | | | | | | | | | | | |
Actual | | $ | 1,000.00 | | | $ | 1,101.80 | | | $ | 7.26 | |
Hypothetical* | | $ | 1,000.00 | | | $ | 1,018.02 | | | $ | 6.98 | |
Class R5 Shares | | | | | | | | | | | | |
Actual | | $ | 1,000.00 | | | $ | 1,104.70 | | | $ | 5.19 | |
Hypothetical* | | $ | 1,000.00 | | | $ | 1,020.00 | | | $ | 4.99 | |
| † | Expenses are equal to the annualized expense ratio for each class (A: 1.20%; C: 1.90%; I: 0.86%; R3: 1.50%; R4: 1.39%; R5: 0.99%) multiplied by the average account value over the period, multiplied by 182/365 to reflect the one-half year period. |
| * | Hypothetical assumes a rate of return of 5% per year before expenses. |
Please note that the expenses shown in the table are meant to highlight your ongoing costs only and do not reflect any transactional costs, such as sales charges (loads), redemption fees, or exchange fees. Therefore, the second line of the table for each class of shares is useful in comparing ongoing costs only, and will not help you determine the relative total costs of owning different funds. In addition, if these transactional costs were included, your costs would have been higher.
46 Certified Semi-Annual Report
| | |
| INDEX COMPARISON | | |
| |
| Thornburg Investment Income Builder Fund | | March 31, 2011 (Unaudited) |
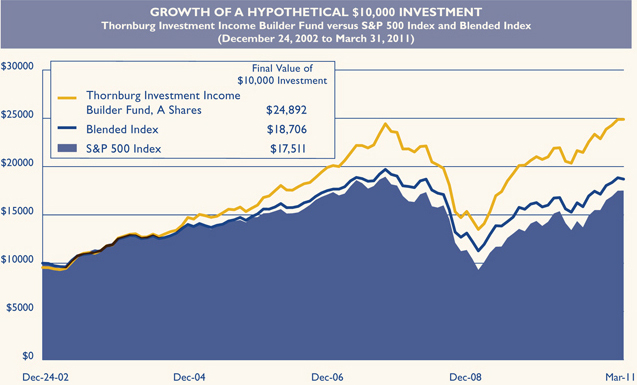
AVERAGE ANNUAL TOTAL RETURNS
For periods ended March 31, 2011 (with sales charge)
| | | | | | | | | | | | |
| | | 1 Yr | | | 5 Yrs | | | Since
Inception | |
A Shares (Incep: 12/24/02) | | | 8.44 | % | | | 6.28 | % | | | 11.64 | % |
C Shares (Incep: 12/24/02) | | | 11.85 | % | | | 6.59 | % | | | 11.65 | % |
I Shares (Incep: 11/3/03) | | | 13.95 | % | | | 7.62 | % | | | 10.89 | % |
R3 Shares (Incep: 2/1/05) | | | 13.28 | % | | | 7.04 | % | | | 8.71 | % |
R4 Shares (Incep: 2/1/08) | | | 13.38 | % | | | — | | | | 3.64 | % |
R5 Shares (Incep: 2/1/07) | | | 13.91 | % | | | — | | | | 5.43 | % |
Blended Index (Since 12/24/02) | | | 11.71 | % | | | 3.41 | % | | | 7.87 | % |
S&P 500 Index (Since 12/24/02) | | | 15.65 | % | | | 2.62 | % | | | 7.02 | % |
Performance data shown represents past performance and is no guarantee of future results. Investment return and principal value will fluctuate so shares, when redeemed, may be worth more or less than their original cost. Current performance may be lower or higher than quoted. For performance current to the most recent month end, visit thornburg.com or call 800-847-0200. The performance data and graph do not reflect the deduction of taxes that a shareholder would pay on distributions or the redemption of Fund shares. Returns reflect the reinvestment of dividends and capital gains as well as applicable sales charges. Class A shares are sold with a maximum sales charge of 4.50%. Class C shares are subject to a 1% CDSC for the first year only. There is no up-front sales charge for Class I, R3, R4 and R5 shares. Class A and I shares are subject to a 1% 30-day redemption fee.
Certified Semi-Annual Report 47
| | |
OTHER INFORMATION | | |
| |
| Thornburg Investment Income Builder Fund | | March 31, 2011 (Unaudited) |
PORTFOLIO PROXY VOTING
Policies and Procedures:
The Trust has delegated to Thornburg Investment Management, Inc. (the “Advisor”) voting decisions respecting proxies for the Fund’s voting securities. The Advisor makes voting decisions in accordance with its Proxy Voting Policy and Procedures. A description of the Policy and Procedures is available (i) without charge, upon request, by calling the Advisor toll-free at 1-800-847-0200, (ii) on the Thornburg web site at www.thornburg.com, and (iii) on the Securities and Exchange Commission’s web site at www.sec.gov.
Information regarding how proxies were voted is available on or before August 31 of each year for the twelve months ending the preceding June 30. This information is available (i) without charge, upon request by calling the Advisor toll-free at 1-800-847-0200, (ii) on the Thornburg web site at www.thornburg.com, and (iii) on the Securities and Exchange Commission’s web site at www.sec.gov.
AVAILABILITY OF QUARTERLY PORTFOLIO SCHEDULE
The Fund files with the Securities and Exchange Commission schedules of its portfolio holdings on Form N-Q for the first and third quarters of each fiscal year. The Fund’s Forms N-Q are available on the Commission’s web site at www.sec.gov, or may be reviewed and copied at the Commission’s Public Reference Room in Washington, D.C. Information on the operation of the Public Reference Room may be obtained by calling 1-800-SEC-0330. The Fund also makes this information available on its web site at www.thornburg. com/download or upon request by calling 1-800-847-0200.
48 Certified Semi-Annual Report
Trustees’ Statement to Shareholders
Not part of the Certified Semi-Annual Report
February 8, 2005, as readopted September 13, 2010
The Trustees are concerned that ongoing commentaries and opinions reported in the media may confuse investors in general as to the supervisory duties of trustees of mutual funds and, in particular, leave Thornburg Investment Trust shareholders uncertain regarding how we discharge our responsibilities in supervising the Funds’ investment advisor and in reviewing the advisor’s contract for renewal. We decided to spell out clearly three principal guidelines that we follow in supervising the Trust’s investment advisor on your behalf.
We begin with the premise that each shareholder selected his or her Fund because its investments are managed by the investment advisor identified in the prospectus and in accordance with the objective and policies described in the prospectus. We realize, as each of you do, that if you believe that your Fund’s stated objective and policies no longer serve your personal investment goals, you can sell your shares and leave the Fund.
Therefore, we believe that our primary supervisory task – our principal obligation to you – is to assess the nature and quality of the advisor’s services, and to confirm that the advisor actively and competently pursues the Fund’s objective, in accordance with the policies set out in the prospectus. To do this, we meet regularly with management to review your Fund’s portfolio and to discuss the advisor’s specific actions and judgments in pursuing the Fund’s objective. We do not substitute our own judgment for the advisor’s decisions in selecting investments; the advisor is paid to exercise its informed judgment on investment decisions, and we seek to confirm, in reviewing the advisor’s performance, that the advisor is doing just that.
Second, while we are conscious of costs and the effect that costs have on shareholders’ returns, we do not seek the lowest fees or expense ratio as our sole or primary objective. We try to make sure that your Fund’s fees and costs are reasonable in relationship to the services rendered and that they are generally in line with those charged by other expert investment advisors, consistent with our belief that the Fund’s investors searched for and expect that expertise and attention and have decided to pay a reasonable price for it. We do not put the management contract “out to bid” as a matter of course, and we would not do so unless we had concluded that the advisor materially had failed to pursue the Fund’s objectives in accordance with its policies, or for other equally important reasons. We believe that any other approach would be inconsistent with your interests and contrary to your expectations when you bought shares of the Fund in the first place.
Finally, because we believe that most Thornburg Fund shareholders have invested with a long-term perspective, we try not to focus too much on the fashions of the moment and on short-term performance. The market will not favor any specific investment objective or set of policies at all times and under all economic circumstances. A fund will experience periods of both high and low returns relative to other funds and other investments. Even if one of our Funds is not favored by the market at a particular time, we believe that the advisor is nonetheless obliged to remain true to the Fund’s objective and policies, and we watch to see that it does so.
This page is not part of the Semi-Annual Report. 49
This page intentionally left blank.
50 This page is not part of the Semi-Annual Report.
Retirement and Education Accounts
Thornburg Investment Management offers retirement and education savings accounts that can help you meet a variety of planning challenges. For account applications or further information on any of the accounts below, please call 1-800-847-0200 or go to www.thornburg.com/ira. Your financial advisor can help you determine which plan is right for you.
Individual Retirement Accounts
Individual Retirement Accounts (IRAs) provide a tax-advantaged means to save money for the future. For a detailed outline of the difference between retirement accounts, see www.thornburg.com/ira. Rollovers are available. Call 1-800-847-0200 for more information.
Traditional IRAs – Contributions to Traditional IRAs are tax deductible for eligible individuals, and withdrawals are taxed as additional ordinary income. You may contribute to an IRA if you receive compensation and are under 70 1/2, even if you are covered by an employer retirement plan. Deductible contributions are subject to certain qualifications. Please consult your tax advisor.
Roth IRAs – Under a Roth IRA, there is no tax deduction for contributions, but there is no income tax on qualified withdrawals. For a more detailed comparison of Traditional and Roth IRAs, please see our web site at www.thornburg.com/ira.
SEP IRAs – Simplified Employee Pension (SEP) IRAs are established by employers. The employer is allowed a tax deduction for contributions made to the SEP Plan and makes contributions to each eligible employee’s SEP IRA on a discretionary basis.
SIMPLE IRAs – Savings Incentive Match Plan for Employees of Small Employers (SIMPLE) is designed to give small business owners a simplified method to establish and contribute to a retirement plan for employees. The employer is allowed a tax deduction for contributions and makes either matching or non-elective contributions to each eligible employee’s SIMPLE IRA. Employees may make salary deferral contributions.
Coverdell Education Savings Account
These savings accounts are designed to provide a way to save money for higher education expenses. In an Education Savings Account, earnings and interest grow tax-free, and qualified withdrawals used to pay for eligible higher-education expenses are tax- and penalty-free.
Funds Available
The following funds are available in the accounts listed above:
| | • | | Thornburg International Value Fund |
| | • | | Thornburg Core Growth Fund |
| | • | | Thornburg Investment Income Builder Fund |
| | • | | Thornburg Global Opportunities Fund |
| | • | | Thornburg International Growth Fund |
| | • | | Thornburg Developing World Fund |
| | • | | Thornburg Limited Term U.S. Government Fund |
| | • | | Thornburg Limited Term Income Fund |
| | • | | Thornburg Strategic Income Fund |
This page is not part of the Semi-Annual Report. 51

Thornburg Equity Funds
Thornburg’s equity research uses a fundamental and comprehensive analytical approach. Thornburg equity funds focus on a limited number of securities so that each holding can impact performance. The equity team searches for firms believed to have a promising future and seeks to buy shares of those companies at a discount to their intrinsic value.
| | • | | Thornburg International Value Fund |
| | • | | Thornburg Core Growth Fund |
| | • | | Thornburg Investment Income Builder Fund |
| | • | | Thornburg Global Opportunities Fund |
| | • | | Thornburg International Growth Fund |
| | • | | Thornburg Developing World Fund |
Thornburg Bond Funds
Thornburg Investment Management applies a disciplined philosophy to fixed-income management. Since the launch of our first fixed-income fund over 25 years ago, we have been conducting fundamental, bottom-up research in an effort to identify bonds which we believe provide the best return for a given level of risk. We are very organic in our approach, avoiding leverage or complex strategies which could backfire in periods of market uncertainty.
Thornburg Limited Term Municipal Fund
| | • | | Thornburg Intermediate Municipal Fund |
| | • | | Thornburg California Limited Term Municipal Fund |
| | • | | Thornburg New Mexico Intermediate Municipal Fund |
| | • | | Thornburg New York Intermediate Municipal Fund |
| | • | | Thornburg Strategic Municipal Income Fund |
| | • | | Thornburg Limited Term U.S. Government Fund |
| | • | | Thornburg Limited Term Income Fund |
| | • | | Thornburg Strategic Income Fund |
Before investing, carefully consider the Fund’s investment goals, risks, charges, and expenses. For a prospectus containing this and other information, contact your financial advisor or visit thornburg. com. Read it carefully before investing.
For additional information, please visit www.thornburg.com
Thornburg Investment Management, Inc. 2300 North Ridgetop Road, Santa Fe, NM 87506
This page is not part of the Semi-Annual Report. 53
This page intentionally left blank.
54 This page is not part of the Semi-Annual Report.
This page intentionally left blank.
This page is not part of the Semi-Annual Report. 55
| | | | | | |

| | Waste not, Wait not | | 
|
| | |
| | | | Get instant access to your shareholder reports. |
| | |
| | This Semi-Annual Report is submitted for the general information of shareholders of the Fund. It is not authorized for distribution to prospective investors in the Fund unless preceded or accompanied by an effective prospectus. | | By switching from your postal mailbox to your email inbox, you reduce paper clutter, improve record keeping access, and help conserve our natural resources. |
| | |
| | Investment Advisor: Thornburg Investment Management® | | Go to www.thornburg.com/edelivery and sign up to receive your shareholder reports, prospectuses, and proxy statements electronically. |
| | 800.847.0200 | | | | |
| | Distributor: | | | | |
| | Thornburg Securities Corporation® 800.847.0200 | | You invest in the future, without spending a dime. |
| | TH1075 | | | | |

Important Information
The information presented on the following pages was current as of March 31, 2011. The managers’ views, portfolio holdings, and sector and country diversification are provided for the general information of the Fund’s shareholders; they are historical and subject to change. This material should not be deemed a recommendation to buy or sell any of the securities mentioned.
Investments in the Fund carry risks, including possible loss of principal. Special risks may be associated with investments outside the United States, especially in emerging markets, including currency fluctuations, illiquidity and volatility. Investments in small capitalization companies may increase the risk of greater price fluctuations. Please see the Fund’s Prospectus for a discussion of the risks associated with an investment in the Fund. Investments in the Fund are not FDIC insured, nor are they deposits of or guaranteed by a bank or any other entity. There is no guarantee that the Fund will meet its investment objectives. Funds invested in a limited number of holdings may expose an investor to greater volatility.
Performance data given at net asset value (NAV) does not take into account the applicable sales charges. If the sales charges had been included, the performance would have been lower.
Class I, R3, R4, and R5 shares may not be available to all investors. Minimum investments for Class I shares may be higher than those for other classes.
From time to time, the Fund may invest in shares of companies through initial public offerings (IPOs). IPOs have the potential to produce substantial gains for the Fund. There is no assurance that the Fund will have continued access to profitable IPOs and as the Fund’s assets grow, the impact of IPO investment may decline. Therefore, investors should not rely on these past gains as an indication of future performance.
| | | | |
Share Class | | NASDAQ Symbol | | Cusip |
| Class A | | THOAX | | 885-215-343 |
| Class C | | THOCX | | 885-215-335 |
| Class I | | THOIX | | 885-215-327 |
| Class R3 | | THORX | | 885-215-145 |
| Class R4 | | THOVX | | 885-215-137 |
| Class R5 | | THOFX | | 885-215-129 |
Glossary
MSCI All Country (AC) World Index – A market capitalization weighted index that is representative of the market structure of 45 developed and emerging market countries in North and South America, Europe, Africa, and the Pacific Rim. The index is calculated with net dividends reinvested in U.S. dollars.
Unless otherwise noted, index returns reflect the reinvestment of income dividends and capital gains, if any, but do not reflect fees, brokerage commissions or other expenses of investing. Investors may not make direct investments into any index. The performance of any index is not indicative of the performance of any particular investment.
Beta – A measure of market-related risk. Less than one means the portfolio is less volatile than the index, while greater than one indicates more volatility than the index.
Bond Credit Ratings – A bond credit rating assesses the financial ability of a debt issuer to make timely payments of principal and interest. Ratings of AAA (the highest), AA, A, and BBB are investment-grade quality. Ratings of BB, B, CCC, CC, C, and D (the lowest) are considered below investment grade, speculative grade, or junk bonds. Unless otherwise noted, the ratings listed are from Bloomberg Market Data and are a combination of ratings from Standard and Poor’s, Moody’s Investors Service, and Fitch Ratings.
Earnings Per Share (EPS) – The total earnings divided by the number of shares outstanding.
Median Market Capitalization – Market capitalization (market cap) is the total value of a company’s stock, calculated by multiplying the number of outstanding common shares by the current share price. The company whose market cap is in the middle of the portfolio is the median market cap. Half the companies in the portfolio have values greater than the median, and half have values that are less.
Price to Book Value (P/B) – A ratio used to compare a stock’s market value to its book value. It is calculated by dividing the current closing price of the stock by the latest quarter’s book value (book value is simply assets minus liabilities).
Price to Cash Flow Ratio – A measure of the market’s expectations of a firm’s future financial health. It is calculated by dividing the price per share by cash flow per share.
Price to Earnings Ratio (P/E) – A valuation ratio equaling a company’s market value per share divided by earnings per share.
Gross Domestic Product (GDP) – The market value of goods and services produced by labor and property in the United States, regardless of nationality.
This page is not part of the Semi-Annual Report. 3
Thornburg Global Opportunities Fund

IMPORTANT
PERFORMANCE INFORMATION
Performance data shown represents past performance and is no guarantee of future results. Investment return and principal value will fluctuate so shares, when redeemed, may be worth more or less than their original cost. Current performance may be lower or higher than quoted. For performance current to the most recent month end, visit thornburg.com or call 800.847.0200.
The maximum sales charge for Class A shares is 4.50%. Class A shares are subject to a 1% 30-day redemption fee. The total annual fund operating expense of Class A shares is 1.47%, as disclosed in the most recent Prospectus.
Investment fads come and go, and the landscape is littered with funds that generated an avalanche of interest for a brief period of time, then fell by the wayside when the market turned its attention to the next hot trend. At Thornburg Investment Management, we believe that the soundest investments over the long term are conceptually simple and grounded in common sense. It is with this mindset that we created the Thornburg Global Opportunities Fund.
The Fund was launched in 2006 to capitalize on what Thornburg Investment Management is known for — solid, bottom-up research based on a team-oriented, flexible approach to uncovering value. The goal in creating the Fund was to leverage the research of the Thornburg equity investment team, while employing a broad mandate to pursue companies across the globe. Once identified, a focused number of stocks are combined into a compact, yet diversified portfolio.
The philosophy of Thornburg Global Opportunities Fund is straightforward — to invest in promising companies that the team feels are trading at a discount to their intrinsic value. As the balance sheets of global companies become more complex, it is getting increasingly difficult to see how some companies actually make money. These companies are not the ones pursued in the Global Opportunities Fund. Rather, we believe that straightforward business models executed by capable management teams make the best investments.
AVERAGE ANNUAL TOTAL RETURNS
FOR PERIODS ENDED 3/31/11
| | | | | | | | | | | | |
| | | 1 Yr | | | 3 Yrs | | | Since
Inception | |
A Shares (Incep: 7/28/06) | | | | | | | | | | | | |
Without sales charge | | | 12.46 | % | | | 1.22 | % | | | 9.67 | % |
With sales charge | | | 7.41 | % | | | -0.32 | % | | | 8.60 | % |
MSCI AC World Index | | | | | | | | | | | | |
(Since: 7/28/06) | | | 14.08 | % | | | 0.31 | % | | | 3.16 | % |
4 This page is not part of the Semi-Annual Report.
The Thornburg Global Opportunities Fund is unique in the marketplace. Currently, assets in the global stock fund universe are concentrated in a few very large funds. Based on size alone, these funds must focus on the largest capitalization stocks, or alternatively, spread their assets across many names. In fact, about 72% of category assets are concentrated in ten funds, and the average world stock fund holds approximately 170 stocks (as of 3/31/11).
Thornburg Global Opportunities Fund is different, in that it will typically be focused in 30–40 stocks which the management team feels have the best combination of promise and discount. Each stock is analyzed on its own merits, and the team then combines them into a portfolio of stocks, with what we view as attractive long-term prospects. The result is a Fund which looks quite unlike either the MSCI AC World Index or its peers.
Thornburg Global Opportunities Fund is grounded in common sense principles, which we think resonate well with investors and can be effective over the long term.
STOCKS CONTRIBUTING AND DETRACTING
FOR THE SIX MONTHS ENDED 3/31/11
| | |
| Top Contributors | | Top Detractors |
Ensign Energy Services, Inc. | | Bank of America Corp. |
Trinity Industries, Inc. | | China Mobile Ltd. |
Willis Group Holdings plc | | Teva Pharmaceutical Inds. Ltd. ADR |
Ensco plc ADR | | UBS AG |
Swiss Re | | Tokyo Steel Manufacturing Co. Ltd. |
| |
| Source: FactSet | | |
KEY PORTFOLIO ATTRIBUTES
As of 3/31/11
| | | | |
Portfolio P/E Trailing 12-months* | | | 14.3x | |
Portfolio Price to Cash Flow* | | | 7.4x | |
Portfolio Price to Book Value* | | | 1.5x | |
Median Market Cap* | | $ | 9.6 B | |
3-Year Beta (A Shares vs. MSCI AC World)* | | | 1.12 | |
Number of Holdings | | | 32 | |
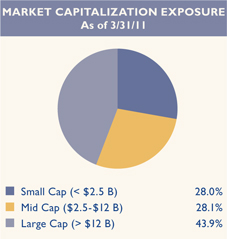
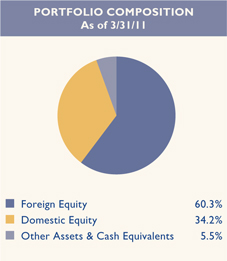
This page is not part of the Semi-Annual Report. 5

Thornburg Global Opportunities Fund
March 31, 2011
This report is certified under the Sarbanes-Oxley Act of 2002, which requires that public companies, including mutual funds, affirm that the information provided in their annual and semiannual shareholder reports fully and fairly represents their financial position.
6 Certified Semi-Annual Report
Letter to Shareholders
April 18, 2011
Dear Fellow Shareholder:
This letter will highlight the results of Thornburg Global Opportunities Fund’s investment activities for the six-month period ended March 31, 2011. In addition, we will comment on the overall investment landscape.
In the six months ended March 31, 2011, the Thornburg Global Opportunities Fund net asset value (NAV) per Class A share increased 16% from $13.98 to $16.23. The Fund also paid dividends of 14¢ per share to give a total return for the period of 17.17%. The dividends per share were higher for Class I and R5 shares, and lower on the C, R3, and R4 shares, to account for varying class specific expenses.
For the six-month period, Thornburg Global Opportunities Fund outperformed the MSCI AC World Index by approximately 3.6%. Since its inception on July 28, 2006, Thornburg Global Opportunities Fund has outperformed the same index by an average annualized margin of 6.51%.
We do not expect to pay any capital gain distributions for 2011. At March 31, 2011, Global Opportunities Fund had tax basis realized capital losses of approximately $200 million, which may be carried forward to offset future capital gains to the extent provided by regulations. This capital loss carryforward is material relative to the Fund’s total assets at March 31, 2011 of approximately $364 million.
Performance data shown represents past performance and is no guarantee of future results. Investment return and principal value will fluctuate so shares, when redeemed, may be worth more or less than their original cost. Current performance may be lower or higher than quoted. For performance current to the most recent month end, visit thornburg.com or call 800.847.0200.
The maximum sales charge for Class A shares is 4.50%. Class A shares are subject to a 1% 30-day redemption fee. The total annual fund operating expense of Class A shares is 1.47%, as disclosed in the most recent Prospectus.
In assessing the performance of the Fund, it is constructive to consider the performance in U.S. dollars of the sector components of the MSCI All Country World Index over the six months ended March 31, 2011, because this is our global performance benchmark:
| | 1. | All ten sectors showed positive total returns, with a range of 3% (utilities) to more than 30% (energy). |
| | 2. | In addition to firms in the energy sector, the strongest contributors to index appreciation were firms in the materials, industrials, and information technology sectors. |
Relative to the index weightings, Global Opportunities Fund had large significant investments in financial and energy industry firms, and no investments in the generally sluggish utilities sector. Drilling service firms Ensign Energy Services, Transocean, and Ensco plc were each strong contributors to portfolio performance during the period under review. These firms have assets and contract production skills that remain in high demand.
Among the Fund’s holdings in the industrials sector, railcar and barge manufacturer Trinity Industries and aircraft component maker Spirit Aerosystems Holdings each delivered significant price appreciation. Operating growth from food company Brazil Foods led to a stock price gain that was enhanced by currency appreciation during the period. Another consumer
Certified Semi-Annual Report 7
Letter to Shareholders,
Continued
facing business, Carphone Warehouse, delivered strong performance following a successful joint venture with electronics retailer Best Buy in the United States.
Among our financial sector holdings, insurance broker Willis Group, reinsurer Swiss Re, Fifth Third Bancorp convertible preferred stock, and Dutch financial conglomerate ING Groep were each strong performers during the period under review. For the most part, these tend to be continuing recovery stories as the climb out of the global financial crisis grinds forward.
On the negative side, China Mobile, Tokyo Steel, Teva Pharmaceuticals, Amdocs, and currency hedges on the euro and British pound each detracted from portfolio performance. The Fund’s holdings in the information technology sector did not keep pace, with Microsoft particularly sluggish.
Expectations for Gross Domestic Product (GDP) and corporate earnings growth have improved in most markets around the world between October 1, 2010 and March 31, 2011 although there are meaningful corners of resistance. Greece, Ireland, and Portugal get much of the publicity in this regard, since each suffers from economic contraction even as interest burdens on these countries compound. The debt securities issued by these countries and held by European banks are significant enough to threaten the strength of certain institutions if material debt restructurings are carried out. Widespread initiatives to reduce government fiscal deficits by a variety of G-10 countries may also constrain near-term growth, particularly if accompanied by tightening monetary conditions. The fact that Standard & Poor’s Corp. announced that United States Treasury debt obligations have been put on “credit watch” status, for possible downgrade from their current AAA rating, may sharpen the debate about fiscal responsibility that is beginning to unfold in Washington, DC.
We are concerned about these issues. At the same time, we can see that global consumer demand is holding up well, strongly supported by emerging economies with modest public and private debt loads and expanding private sectors. Since the U.S. economy came to be overly dependent on residential real estate over the last generation, certain geographies in this country that were particularly caught up in that phenomenon are still in the penalty box. It is also very challenging for those whose jobs depended in any way on the U.S. residential real estate boom to find work. Aggregate employment statistics for the United States reflect this, as we struggle to channel production and employment in other uses. To a large extent, this is not a global issue. The United States is well into its fourth year of trying to reorient its economy, and industrial production figures are gradually improving. We begin to see signs that the costly trip down the road of too much real estate consumption will quit being a drag on the real economy and the overall financial sector, although high oil prices could impede progress in the coming quarters.
At March 31, 2011, domestic stocks comprised approximately 34% of the Fund’s portfolio; foreign stocks around 60%; and cash and interest bearing debt the remaining 6%. The average price/earnings multiple of the 32 stocks in your portfolio was 13.8x on an estimated forward basis, using 2011 estimates provided by FactSet and IBES. For comparative reference, the forward price/earnings multiple of the MSCI All Country World Index was approximately 12.9x, again using 2011 estimates provided by FactSet and IBES. Industry weightings, country weightings, and the top equity holdings of Global Opportunities Fund are summarized on page 10 of this report.
We remind readers that the Thornburg Global Opportunities Fund portfolio, which has generally included between 30 and 40 stocks, is very focused relative to the MSCI All Country World Index, which includes more than 2,000 stocks.
8 Certified Semi-Annual Report
We believe that our focus on a relatively small group of stocks can help outperform the broader index over time. The returns to date are encouraging, even though the Thornburg Global Opportunities Fund does not beat the Index portfolio over some shorter measurement periods.
Thank you for being a shareholder of Thornburg Global Opportunities Fund. Remember that you can review descriptions of many of the stocks in your portfolio on our internet site, www.thornburg.com/funds. Best wishes for a wonderful summer.
Sincerely,
| | | | |
 | |  | | |
| Brian McMahon | | W. Vinson Walden,CFA | | |
| Co-Portfolio Manager | | Co-Portfolio Manager | | |
| CEO & Chief Investment Officer | | Managing Director | | |
The matters discussed in this report may constitute forward-looking statements made pursuant to the safe harbor provisions of the Securities Litigation Reform Act of 1995. These include any advisor or portfolio manager prediction, assessment, analysis or outlook for individual securities, industries, investment styles, market sectors and/or markets. These statements involve risks and uncertainties. In addition to the general risks described for each fund in its current prospectus, other factors bearing on these reports include the accuracy of the advisor’s or portfolio manager’s forecasts and predictions, the appropriateness of the investment strategies designed by the advisor or portfolio manager, and the ability of the advisor or portfolio manager to implement their strategies efficiently and successfully. Any one or more of these factors, as well as other risks affecting the securities markets generally, could cause the actual results of any fund to differ materially as compared to its benchmarks.
Certified Semi-Annual Report 9
| | |
| SCHEDULE OF INVESTMENTS | | |
| |
| Thornburg Global Opportunities Fund | | March 31, 2011 (Unaudited) |
TOP TEN HOLDINGS
As of 3/31/11
| | | | |
Ensign Energy Services, Inc. | | | 5.4 | % |
Global Crossing Ltd. | | | 5.0 | % |
BRF-Brasil Foods SA | | | 4.9 | % |
KKR Financial Holdings LLC | | | 4.8 | % |
Google, Inc. | | | 4.0 | % |
Telstra Corp. Ltd. | | | 3.8 | % |
Ensco plc ADR | | | 3.6 | % |
Transocean Ltd. | | | 3.5 | % |
Fly Leasing Ltd. ADR | | | 3.5 | % |
Liechtensteinische Landesbank AG | | | 3.5 | % |
SUMMARY OF INDUSTRY EXPOSURE
As of 3/31/11
| | | | |
Energy | | | 15.8 | % |
Diversified Financials | | | 15.3 | % |
Banks | | | 12.2 | % |
Telecommunication Services | | | 9.7 | % |
Insurance | | | 8.0 | % |
Software & Services | | | 7.1 | % |
Capital Goods | | | 6.8 | % |
Food, Beverage & Tobacco | | | 4.9 | % |
Pharmaceuticals, Biotechnology & Life Sciences | | | 4.3 | % |
Retailing | | | 3.1 | % |
Technology Hardware & Equipment | | | 2.4 | % |
Media | | | 2.0 | % |
Materials | | | 1.6 | % |
Food & Staples Retailing | | | 1.2 | % |
Other Assets & Cash Equivalents | | | 5.6 | % |
SUMMARY OF COUNTRY EXPOSURE
As of 3/31/11 (percent of equity holdings)
| | | | |
United States | | | 36.2 | % |
Switzerland | | | 12.0 | % |
United Kingdom | | | 10.3 | % |
Canada | | | 9.2 | % |
Bermuda | | | 5.3 | % |
Brazil | | | 5.2 | % |
Australia | | | 4.1 | % |
Ireland | | | 3.7 | % |
China | | | 3.6 | % |
Netherlands | | | 3.5 | % |
Israel | | | 3.0 | % |
Germany | | | 2.2 | % |
Japan | | | 1.7 | % |
10 Certified Semi-Annual Report
| | |
| SCHEDULE OF INVESTMENTS, CONTINUED | | |
| |
| Thornburg Global Opportunities Fund | | March 31, 2010 (Unaudited) |
| | | | | | | | |
| | | Shares/
Principal Amount | | | Value | |
COMMON STOCK — 91.17% | | | | | | | | |
| | |
BANKS — 8.88% | | | | | | | | |
COMMERCIAL BANKS — 8.88% | | | | | | | | |
BancorpSouth, Inc. | | | 681,100 | | | $ | 10,522,995 | |
China Merchants Bank Co., Ltd. | | | 3,297,441 | | | | 9,135,360 | |
Liechtensteinische Landesbank AG | | | 157,678 | | | | 12,634,840 | |
| | | | | | | | |
| | | | | | | 32,293,195 | |
| | | | | | | | |
| | |
CAPITAL GOODS — 6.83% | | | | | | | | |
MACHINERY — 3.31% | | | | | | | | |
Trinity Industries, Inc. | | | 328,821 | | | | 12,057,866 | |
TRADING COMPANIES & DISTRIBUTORS — 3.52% | | | | | | | | |
Fly Leasing Ltd. ADR | | | 925,113 | | | | 12,794,313 | |
| | | | | | | | |
| | | | | | | 24,852,179 | |
| | | | | | | | |
| | |
DIVERSIFIED FINANCIALS — 15.25% | | | | | | | | |
CAPITAL MARKETS — 4.10% | | | | | | | | |
a UBS AG | | | 629,046 | | | | 11,286,530 | |
Verwaltungs und Privat Bank AG | | | 29,800 | | | | 3,627,262 | |
DIVERSIFIED FINANCIAL SERVICES — 11.15% | | | | | | | | |
Bank of America Corp. | | | 822,300 | | | | 10,961,259 | |
a ING Groep N.V. | | | 957,900 | | | | 12,124,148 | |
KKR Financial Holdings LLC | | | 1,784,000 | | | | 17,465,360 | |
| | | | | | | | |
| | | | | | | 55,464,559 | |
| | | | | | | | |
| | |
ENERGY — 15.85% | | | | | | | | |
ENERGY EQUIPMENT & SERVICES — 12.51% | | | | | | | | |
Ensco plc ADR | | | 227,300 | | | | 13,147,032 | |
Ensign Energy Services, Inc. | | | 1,036,400 | | | | 19,520,025 | |
a Transocean Ltd. | | | 164,600 | | | | 12,830,570 | |
OIL, GAS & CONSUMABLE FUELS — 3.34% | | | | | | | | |
a Bankers Petroleum Ltd. | | | 1,353,300 | | | | 12,144,105 | |
| | | | | | | | |
| | | | | | | 57,641,732 | |
| | | | | | | | |
| | |
FOOD & STAPLES RETAILING — 1.20% | | | | | | | | |
FOOD & STAPLES RETAILING — 1.20% | | | | | | | | |
Walgreen Co. | | | 108,300 | | | | 4,347,162 | |
| | | | | | | | |
| | | | | | | 4,347,162 | |
| | | | | | | | |
| | |
FOOD, BEVERAGE & TOBACCO — 4.93% | | | | | | | | |
FOOD PRODUCTS — 4.93% | | | | | | | | |
BRF-Brasil Foods SA | | | 948,800 | | | | 17,916,580 | |
| | | | | | | | |
| | | | | | | 17,916,580 | |
| | | | | | | | |
| | |
INSURANCE — 8.05% | | | | | | | | |
INSURANCE — 8.05% | | | | | | | | |
Hartford Financial Services Group, Inc. | | | 365,800 | | | | 9,850,994 | |
Swiss Re | | | 150,050 | | | | 8,584,788 | |
Willis Group Holdings plc | | | 269,000 | | | | 10,856,840 | |
| | | | | | | | |
| | | | | | | 29,292,622 | |
| | | | | | | | |
Certified Semi-Annual Report 11
| | |
| SCHEDULE OF INVESTMENTS, CONTINUED | | |
| |
| Thornburg Global Opportunities Fund | | March 31, 2010 (Unaudited) |
| | | | | | | | |
| | | Shares/
Principal Amount | | | Value | |
MATERIALS — 1.57% | | | | | | | | |
METALS & MINING — 1.57% | | | | | | | | |
Tokyo Steel Manufacturing Co., Ltd. | | | 489,100 | | | $ | 5,709,499 | |
| | | | | | | | |
| | | | | | | 5,709,499 | |
| | | | | | | | |
| | |
MEDIA — 2.03% | | | | | | | | |
MEDIA — 2.03% | | | | | | | | |
a Kabel Deutschland Holding AG | | | 139,500 | | | | 7,393,954 | |
| | | | | | | | |
| | | | | | | 7,393,954 | |
| | | | | | | | |
| | |
PHARMACEUTICALS, BIOTECHNOLOGY & LIFE SCIENCES — 4.26% | | | | | | | | |
PHARMACEUTICALS — 4.26% | | | | | | | | |
Roche Holding AG | | | 36,500 | | | | 5,213,718 | |
Teva Pharmaceutical Industries Ltd. ADR | | | 204,830 | | | | 10,276,321 | |
| | | | | | | | |
| | | | | | | 15,490,039 | |
| | | | | | | | |
| | |
RETAILING — 3.12% | | | | | | | | |
SPECIALTY RETAIL — 3.12% | | | | | | | | |
a Carphone Warehouse Group plc | | | 1,943,800 | | | | 11,350,402 | |
| | | | | | | | |
| | | | | | | 11,350,402 | |
| | | | | | | | |
| | |
SOFTWARE & SERVICES — 7.09% | | | | | | | | |
INTERNET SOFTWARE & SERVICES — 4.03% | | | | | | | | |
a Google, Inc. | | | 24,985 | | | | 14,646,457 | |
SOFTWARE — 3.06% | | | | | | | | |
Microsoft Corp. | | | 439,400 | | | | 11,143,184 | |
| | | | | | | | |
| | | | | | | 25,789,641 | |
| | | | | | | | |
| | |
TECHNOLOGY HARDWARE & EQUIPMENT — 2.39% | | | | | | | | |
COMPUTERS & PERIPHERALS — 2.39% | | | | | | | | |
a Dell, Inc. | | | 600,000 | | | | 8,706,000 | |
| | | | | | | | |
| | | | | | | 8,706,000 | |
| | | | | | | | |
| | |
TELECOMMUNICATION SERVICES — 9.72% | | | | | | | | |
DIVERSIFIED TELECOMMUNICATION SERVICES — 8.80% | | | | | | | | |
a Global Crossing Ltd. | | | 1,295,007 | | | | 18,026,497 | |
Telstra Corp. Ltd. | | | 4,796,317 | | | | 13,990,215 | |
WIRELESS TELECOMMUNICATION SERVICES — 0.92% | | | | | | | | |
China Mobile Ltd. | | | 361,100 | | | | 3,326,175 | |
| | | | | | | | |
| | | | | | | 35,342,887 | |
| | | | | | | | |
TOTAL COMMON STOCK (Cost $273,797,913) | | | | | | | 331,590,451 | |
| | | | | | | | |
12 Certified Semi-Annual Report
| | |
| SCHEDULE OF INVESTMENTS, CONTINUED | | |
| |
| Thornburg Global Opportunities Fund | | March 31, 2010 (Unaudited) |
| | | | | | | | |
| | | Shares/
Principal Amount | | | Value | |
PREFERRED STOCK — 3.28% | | | | | | | | |
| | |
BANKS — 3.28% | | | | | | | | |
COMMERCIAL BANKS — 3.28% | | | | | | | | |
Fifth Third Bancorp Pfd, 8.50% | | | 80,500 | | | $ | 11,914,000 | |
| | | | | | | | |
TOTAL PREFERRED STOCK (Cost $2,079,829) | | | | | | | 11,914,000 | |
| | | | | | | | |
| | |
SHORT TERM INVESTMENTS — 4.95% | | | | | | | | |
Wellpoint, Inc., 0.20%, 4/1/2011 | | $ | 18,000,000 | | | | 18,000,000 | |
| | | | | | | | |
TOTAL SHORT TERM INVESTMENTS (Cost $18,000,000) | | | | | | | 18,000,000 | |
| | | | | | | | |
| | |
TOTAL INVESTMENTS — 99.40% (Cost $293,877,742) | | | | | | $ | 361,504,451 | |
| | |
OTHER ASSETS LESS LIABILITIES — 0.60% | | | | | | | 2,180,677 | |
| | | | | | | | |
| | |
NET ASSETS — 100.00% | | | | | | $ | 363,685,128 | |
| | | | | | | | |
Footnote Legend
Portfolio Abbreviations
To simplify the listings of securities, abbreviations are used per the table below:
| | |
| ADR | | American Depository Receipt |
| Pfd | | Preferred Stock |
See notes to financial statements.
Certified Semi-Annual Report 13
| | |
| STATEMENT OF ASSETS AND LIABILITIES | | |
| |
Thornburg Global Opportunities Fund | | March 31, 2011 (Unaudited) |
| | | | |
ASSETS | | | | |
Investments at value (cost $293,877,742) (Note 2) | | $ | 361,504,451 | |
Cash | | | 3,598,181 | |
Cash denominated in foreign currency (cost $902,749) | | | 952,620 | |
Receivable for fund shares sold | | | 420,657 | |
Unrealized appreciation on forward currency contracts (Note 7) | | | 33,926 | |
Dividends receivable | | | 318,097 | |
Dividend and interest reclaim receivable | | | 132,069 | |
Prepaid expenses and other assets | | | 51,980 | |
| | | | |
Total Assets | | | 367,011,981 | |
| | | | |
| |
LIABILITIES | | | | |
Payable for securities purchased | | | 1,085,147 | |
Payable for fund shares redeemed | | | 519,733 | |
Unrealized depreciation on forward currency contracts (Note 7) | | | 1,216,994 | |
Payable to investment advisor and other affiliates (Note 3) | | | 376,338 | |
Accounts payable and accrued expenses | | | 126,251 | |
Dividends payable | | | 2,390 | |
| | | | |
Total Liabilities | | | 3,326,853 | |
| | | | |
| |
NET ASSETS | | $ | 363,685,128 | |
| | | | |
NET ASSETS CONSIST OF: | | | | |
Distribution in excess of net investment income | | $ | (4,388,312 | ) |
Net unrealized appreciation on investments | | | 66,508,644 | |
Accumulated net realized gain (loss) | | | (204,102,258 | ) |
Net capital paid in on shares of beneficial interest | | | 505,667,054 | |
| | | | |
| | $ | 363,685,128 | |
| | | | |
14 Certified Semi-Annual Report
| | |
| STATEMENT OF ASSETS AND LIABILITIES, CONTINUED | | |
| |
| Thornburg Global Opportunities Fund | | March 31, 2010 (Unaudited) |
| | | | |
NET ASSET VALUE: | | | | |
Class A Shares: | | | | |
Net asset value and redemption price per share ($100,197,775 applicable to 6,174,513 shares of beneficial interest outstanding - Note 4) | | $ | 16.23 | |
Maximum sales charge, 4.50% of offering price | | | 0.76 | |
| | | | |
Maximum offering price per share | | $ | 16.99 | |
| | | | |
| |
Class C Shares: | | | | |
Net asset value and offering price per share * ($90,825,563 applicable to 5,668,960 shares of beneficial interest outstanding - Note 4) | | $ | 16.02 | |
| | | | |
| |
Class I Shares: | | | | |
Net asset value, offering and redemption price per share ($151,881,871 applicable to 9,326,366 shares of beneficial interest outstanding - Note 4) | | $ | 16.29 | |
| | | | |
| |
Class R3 Shares: | | | | |
Net asset value, offering and redemption price per share ($211,586 applicable to 13,086 shares of beneficial interest outstanding - Note 4) | | $ | 16.17 | |
| | | | |
| |
Class R4 Shares: | | | | |
Net asset value, offering and redemption price per share ($1,560,198 applicable to 96,644 shares of beneficial interest outstanding - Note 4) | | $ | 16.14 | |
| | | | |
| |
Class R5 Shares: | | | | |
Net asset value, offering and redemption price per share ($19,008,135 applicable to 1,166,393 shares of beneficial interest outstanding - Note 4) | | $ | 16.30 | |
| | | | |
| * | Redemption price per share is equal to net asset value less any applicable contingent deferred sales charge. |
See notes to financial statements.
Certified Semi-Annual Report 15
| | |
| STATEMENT OF OPERATIONS | | |
| |
| Thornburg Global Opportunities Fund | | Six Months Ended March 31, 2011 (Unaudited) |
| | | | |
INVESTMENT INCOME: | | | | |
Dividend income (net of foreign taxes withheld of $113,920) | | $ | 3,536,648 | |
Interest income | | | 12,834 | |
| | | | |
Total Income | | | 3,549,482 | |
| | | | |
| |
EXPENSES: | | | | |
Investment advisory fees (Note 3) | | | 1,495,880 | |
Administration fees (Note 3) | | | | |
Class A Shares | | | 60,882 | |
Class C Shares | | | 54,372 | |
Class I Shares | | | 34,710 | |
Class R3 Shares | | | 109 | |
Class R4 Shares | | | 866 | |
Class R5 Shares | | | 4,277 | |
Distribution and service fees (Note 3) | | | | |
Class A Shares | | | 122,022 | |
Class C Shares | | | 435,002 | |
Class R3 Shares | | | 416 | |
Class R4 Shares | | | 1,734 | |
Transfer agent fees | | | | |
Class A Shares | | | 59,801 | |
Class C Shares | | | 56,851 | |
Class I Shares | | | 59,327 | |
Class R3 Shares | | | 669 | |
Class R4 Shares | | | 2,409 | |
Class R5 Shares | | | 13,913 | |
Registration and filing fees | | | | |
Class A Shares | | | 10,765 | |
Class C Shares | | | 10,280 | |
Class I Shares | | | 11,539 | |
Class R3 Shares | | | 9,413 | |
Class R4 Shares | | | 9,510 | |
Class R5 Shares | | | 9,462 | |
Custodian fees (Note 3) | | | 63,147 | |
Professional fees | | | 26,457 | |
Accounting fees | | | 4,373 | |
Trustee fees | | | 4,021 | |
Other expenses | | | 28,187 | |
| | | | |
Total Expenses | | | 2,590,394 | |
Less: | | | | |
Expenses reimbursed by investment advisor (Note 3) | | | (122,433 | ) |
Fees paid indirectly (Note 3) | | | (627 | ) |
| | | | |
Net Expenses | | | 2,467,334 | |
| | | | |
Net Investment Income | | $ | 1,082,148 | |
| | | | |
16 Certified Semi-Annual Report
| | |
| STATEMENT OF OPERATIONS, CONTINUED | | |
| |
| Thornburg Global Opportunities Fund | | Six Months Ended March 31, 2011 (Unaudited) |
| | | | |
REALIZED AND UNREALIZED GAIN (LOSS) | | | | |
Net realized gain (loss) from: | | | | |
Investments | | $ | 10,600,800 | |
Forward currency contracts (Note 7) | | | (3,155,597 | ) |
Foreign currency transactions | | | 685,075 | |
| | | | |
| | | 8,130,278 | |
| | | | |
Net change in unrealized appreciation (depreciation) on: | | | | |
Investments | | | 43,352,027 | |
Forward currency contracts (Note 7) | | | 1,078,644 | |
Foreign currency translations | | | 55,135 | |
| | | | |
| | | 44,485,806 | |
| | | | |
| |
Net Realized and Unrealized Gain | | | 52,616,084 | |
| | | | |
| |
Net Increase in Net Assets Resulting from Operations | | $ | 53,698,232 | |
| | | | |
See notes to financial statements.
Certified Semi-Annual Report 17
STATEMENTS OF CHANGES IN NET ASSETS
Thornburg Global Opportunities Fund
| | | | | | | | |
| | | Six Months Ended
March 31, 2011* | | | Year Ended
September 30, 2010 | |
INCREASE (DECREASE) IN NET ASSETS FROM | | | | | | | | |
| | |
OPERATIONS: | | | | | | | | |
Net investment income | | $ | 1,082,148 | | | $ | 3,869,663 | |
Net realized gain (loss) on investments, forward currency contracts and foreign currency transactions | | | 8,130,278 | | | | 38,105,914 | |
Increase (Decrease) in unrealized appreciation (depreciation) of investments, forward currency contracts and foreign currency translations | | | 44,485,806 | | | | (21,260,073 | ) |
| | | | | | | | |
| | |
Net Increase (Decrease) in Net Assets Resulting from Operations | | | 53,698,232 | | | | 20,715,504 | |
| | |
DIVIDENDS TO SHAREHOLDERS: | | | | | | | | |
From net investment income | | | | | | | | |
Class A Shares | | | (893,661 | ) | | | (1,057,336 | ) |
Class C Shares | | | (645,237 | ) | | | (302,170 | ) |
Class I Shares | | | (1,405,584 | ) | | | (2,033,417 | ) |
Class R3 Shares | | | (1,595 | ) | | | (1,467 | ) |
Class R4 Shares | | | (13,009 | ) | | | (16,293 | ) |
Class R5 Shares | | | (175,593 | ) | | | (178,405 | ) |
| | |
FUND SHARE TRANSACTIONS (NOTE 4): | | | | | | | | |
Class A Shares | | | (7,223,245 | ) | | | 5,589,247 | |
Class C Shares | | | (4,064,966 | ) | | | (4,319,558 | ) |
Class I Shares | | | (514,004 | ) | | | 18,072,732 | |
Class R3 Shares | | | 35,078 | | | | 127,094 | |
Class R4 Shares | | | 5,976 | | | | 21,801 | |
Class R5 Shares | | | 48,574 | | | | 16,091,131 | |
| | | | | | | | |
| | |
Net Increase in Net Assets | | | 38,850,966 | | | | 52,708,863 | |
| | |
NET ASSETS: | | | | | | | | |
Beginning of Period | | | 324,834,162 | | | | 272,125,299 | |
| | | | | | | | |
| | |
End of Period | | $ | 363,685,128 | | | $ | 324,834,162 | |
| | | | | | | | |
See notes to financial statements.
18 Certified Semi-Annual Report
| | |
| NOTES TO FINANCIAL STATEMENTS | | |
| |
| Thornburg Global Opportunities Fund | | March 31, 2011 (Unaudited) |
NOTE 1 – ORGANIZATION
Thornburg Global Opportunities Fund, hereinafter referred to as the “Fund,” is a diversified series of Thornburg Investment Trust (the “Trust”). The Trust was organized as a Massachusetts business trust under a Declaration of Trust dated June 3, 1987 and is registered as a diversified, open-end management investment company under the Investment Company Act of 1940, as amended. The Fund is currently one of sixteen separate series of the Trust. Each series is considered to be a separate entity for financial reporting and tax purposes and bears expenses directly attributable to it. The Fund seeks long-term capital appreciation by investing in equity and debt securities of all types from issuers around the world.
The Fund currently offers six classes of shares of beneficial interest: Class A, Class C, Institutional Class (Class I), and Retirement Classes (Class R3, Class R4, and Class R5). Each class of shares of the Fund represents an interest in the same portfolio of investments, except that (i) Class A shares are sold subject to a front-end sales charge collected at the time the shares are purchased and bear a service fee, (ii) Class C shares are sold at net asset value without a sales charge at the time of purchase, but are subject to a contingent deferred sales charge upon redemption within one year of purchase, and bear both a service fee and a distribution fee, (iii) Class I shares are sold at net asset value without a sales charge at the time of purchase, (iv) Class R3 shares are sold at net asset value without a sales charge at the time of purchase, but bear both a service fee and distribution fee, (v) Class R4 shares are sold at net asset value without a sales charge at the time of purchase, but bear a service fee, (vi) Class R5 shares are sold at net asset value without a sales charge at the time of purchase, and (vii) the respective classes may have different reinvestment privileges and conversion rights. Additionally, the Fund may allocate among its classes certain expenses, to the extent allowable to specific classes, including transfer agent fees, government registration fees, certain printing and postage costs, and administrative and legal expenses. Currently, class specific expenses of the Fund are limited to service and distribution fees, administration fees, and certain registration and transfer agent expenses.
NOTE 2 – SIGNIFICANT ACCOUNTING POLICIES
Significant accounting policies of the Trust are as follows:
Valuation of Investments: Portfolio securities listed or traded on a national securities exchange are valued on the valuation date at the last reported sale price on the exchange that is the primary market for the security. Portfolio securities traded on an exchange for which there has been no sale that day and other equity securities traded in the over-the-counter market are valued at the mean between the last reported bid and asked prices. Portfolio securities reported by NASDAQ are valued at the NASDAQ official closing price. Any foreign security traded on exchanges outside the United States is valued at the price of the security on the exchange that is normally the security’s primary market, as of the close of that exchange preceding the time of the Fund’s valuation.
Debt obligations held by the Fund have a primary market over the counter and are valued by an independent pricing service approved by the Trustees of the Trust. The pricing service ordinarily values debt obligations at quoted bid prices. When quotations are not available, debt obligations held by the Fund are valued at evaluated prices determined by the pricing service using methods which include consideration of yields or prices of debt obligations of comparable quality, type of issue, coupon, maturity and rating, and indications as to value from dealers and general market conditions. Short-term obligations having remaining maturities of 60 days or less are ordinarily valued at amortized cost, which approximates market value.
Quotations in foreign currencies for foreign portfolio investments are converted to U.S. dollar equivalents using the foreign exchange quotation in effect at the time of valuation.
In any case where the market value of an equity security held by the Fund is not readily available, the Trust’s valuation and pricing committee determines a fair value for the security using procedures approved by the Trustees, which may include the use of a price obtained from an independent pricing service. The pricing service ordinarily values equity securities in these instances using multi-factor models to adjust market prices based upon various inputs, including exchange data, depository receipt prices, futures and index data and other data. A security’s market value is deemed not readily available whenever the exchange or market on which the security is primarily traded is closed for the entire scheduled day of trading. Additionally, a security’s market value may be deemed not readily available under other circumstances identified by the Trustees, including when developments occurring after the most recent close of the security’s primary exchange or market, but before the most recent close of trading in Fund shares, create a serious question about the reliability of the security’s market value.
Certified Semi-Annual Report 19
| | |
| NOTES TO FINANCIAL STATEMENTS, CONTINUED | | |
| |
| Thornburg Global Opportunities Fund | | March 31, 2011 (Unaudited) |
In any case where a pricing service fails to provide a price for a debt obligation held by the Fund, the valuation and pricing committee determines a fair value for the debt obligation using procedures approved by the Trustees. Additionally, in any case where management believes that a price provided by a pricing service for a debt obligation held by the Fund may be unreliable, the valuation and pricing committee decides whether or not to use the pricing service’s valuation or to determine a fair value for the debt obligation.
In determining fair value for any portfolio security or other investment, the valuation and pricing committee seeks to determine the amount that an owner of the investment might reasonably expect to receive upon a sale of the investment. However, because fair value prices are estimated prices, the valuation and pricing committee’s determination of fair value for an investment may differ from the value that would be realized by the Fund upon a sale of the investment, and that difference could be material to the Fund’s financial statements. The valuation and pricing committee’s determination of fair value for an investment may also differ from the prices obtained by other persons (including other mutual funds) for the investment.
Valuation Measurements: Various inputs are used in determining the value of the Fund’s investments. These inputs are summarized in the three levels listed below.
Level 1: Quoted prices in active markets for identical investments.
Level 2: Other significant observable inputs (including quoted prices for similar investments, interest rates, prepayment rates, credit risk, etc.).
Level 3: Significant unobservable inputs (including the Fund’s own assumptions in determining the fair value of investments).
The following table displays a summary of the inputs used to value the Fund’s net assets as of March 31, 2011. In any instance when valuation inputs from more than one level are used to determine the fair value of a specific investment, the investment is placed in the level of the table based upon the lowest level input that is significant in determining the fair value of the investment:
| | | | | | | | | | | | | | | | |
| | | Fair Value Measurements at March 31, 2011 | |
| | | Total | | | Level 1 | | | Level 2 | | | Level 3 | |
Assets | | | | | | | | | | | | | | | | |
Investments in Securities* | | | | | | | | | | | | | | | | |
Common Stock | | $ | 331,590,451 | | | $ | 331,590,451 | | | $ | — | | | $ | — | |
Preferred Stock | | | 11,914,000 | | | | 11,914,000 | | | | — | | | | — | |
Short Term Investments | | | 18,000,000 | | | | — | | | | 18,000,000 | | | | — | |
| | | | | | | | | | | | | | | | |
Total Investments in Securities | | $ | 361,504,451 | | | $ | 343,504,451 | | | $ | 18,000,000 | | | $ | — | |
| | | | |
Other Financial Instruments** | | | | | | | | | | | | | | | | |
Forward Currency Contracts | | $ | 33,926 | | | $ | — | | | $ | 33,926 | | | $ | — | |
| | | | |
Liabilities | | | | | | | | | | | | | | | | |
Other Financial Instruments** | | | | | | | | | | | | | | | | |
Forward Currency Contracts | | $ | (1,216,994 | ) | | $ | — | | | $ | (1,216,994 | ) | | $ | — | |
| * | See Schedule of Investments for a summary of the industry exposure as grouped according to the Global Industry Classification Standard (GICS), which is an industry taxonomy developed by MSCI Barra and Standard & Poor’s (S&P). |
| ** | Other Financial Instruments include investments not reflected in the Schedule of Investments, such as futures, forwards and swap contracts, which are valued at the unrealized appreciation (depreciation) on the investment. |
20 Certified Semi-Annual Report
| | |
| NOTES TO FINANCIAL STATEMENTS, CONTINUED |
| |
| Thornburg Global Opportunities Fund | | March 31, 2011 (Unaudited) |
A rollforward of fair value measurements using significant unobservable inputs (Level 3) for the six months ended March 31, 2011, was as follows:
| | | | | | | | | | | | | | | | | | | | | | | | | | | | |
| | | Beginning
Balance
9/30/2010 | | | Gross
Purchases | | | Gross
Sales | | | Net Realized
Gain/(Loss) | | | Net Unrealized
Appreciation/
(Depreciation) | | | Net Transfers
in/(out) of
Level 3(a) | | | Ending
Balance
3/31/2011 | |
Investments in Securities | | $ | 6,000,000 | | | $ | — | | | $ | — | | | $ | — | | | $ | — | | | $ | (6,000,000 | ) | | $ | — | |
| (a) | Net transfers out of Level 3 were to Level 1, and were due to quoted prices in active markets for identical investments existing during the six months ended March 31, 2011. Transfers into or out of Level 3 are based on the beginning market value of the period in which they occurred. |
Other Notes: It is the policy of the Fund to recognize significant transfers between Levels 1 and 2 and to disclose those transfers at the last date of the reporting period. The Fund recognized no significant transfers into and out of Levels 1 and 2 during the six months ended March 31, 2011.
Foreign Currency Translation: Portfolio securities and other assets and liabilities denominated in foreign currencies are translated into U.S. dollars based on the exchange rate of such currencies against the U.S. dollar on the date of valuation. Purchases and sales of securities and income items denominated in foreign currencies are translated into U.S. dollars at the exchange rate in effect on the translation date. When the Fund purchases or sells foreign securities, it will customarily enter into a foreign exchange contract to minimize foreign exchange risk from the trade date to the settlement date of such transactions.
The Fund does not separately report the effect of changes in foreign exchange rates from changes in market prices on securities held. Such changes are included in net realized and unrealized gain or loss from investments.
Reported net realized foreign exchange gains or losses arise from sales of foreign currencies, currency gains or losses realized between the trade and settlement dates on securities transactions and the difference between the amounts of dividends, interest, and foreign withholding taxes recorded on the Fund’s books, and the U.S. dollar equivalent of the amounts actually received or paid.
Net unrealized foreign exchange gains and losses arise from changes in the fair value of assets and liabilities, other than investments in securities at fiscal period end, resulting from changes in exchange rates.
Deferred Taxes: The Fund is subject to a tax imposed on net realized gains of securities of certain foreign countries. The Fund records an estimated deferred tax liability for net unrealized gains on these securities as reflected in the accompanying financial statements.
Federal Income Taxes: It is the policy of the Trust to comply with the provisions of the Internal Revenue Code applicable to “regulated investment companies” and to distribute to shareholders substantially all taxable income, including any net realized gain on investments of the Fund. Therefore, no provision for federal income taxes is required.
Management reviews each tax position believed to be material to the preparation of the Fund’s financial statements, to assess if it is more likely than not that the position would be sustained upon examination, based upon the technical merits of the position. As of March 31, 2011, management has not identified any such position for which a liability must be reflected in the Statement of Assets and Liabilities. The Fund’s tax returns remain subject to examination for three years after filing.
When-Issued and Delayed Delivery Transactions: The Fund may engage in when-issued or delayed delivery transactions. To the extent the Fund engages in such transactions, it will do so for the purpose of acquiring portfolio securities consistent with the Fund’s investment objectives and not for the purpose of investment leverage or to speculate on interest rate and/or market changes. At the time the Fund makes a commitment to purchase a security on a when-issued or delayed delivery basis, the Fund will record the transaction and reflect the value in determining its net asset value. When effecting such transactions, assets of an amount sufficient to make payment for the portfolio securities to be purchased will be segregated on the Fund’s records on the trade date. Securities purchased on a when-issued or delayed delivery basis do not earn interest until the settlement date.
Dividends: Dividends to shareholders, if any, are generally paid quarterly and are reinvested in additional shares of the Fund at net asset value per share at the close of business on the dividend payment date or, at the shareholder’s option, paid in cash. Net realized capital
Certified Semi-Annual Report 21
| | |
| NOTES TO FINANCIAL STATEMENTS, CONTINUED |
| |
| Thornburg Global Opportunities Fund | | March 31, 2011 (Unaudited) |
gains, to the extent available, will be distributed at least annually. Distributions to shareholders are based on income tax regulations and therefore, their characteristics may differ for financial statement and tax purposes.
General: Securities transactions are accounted for on a trade date basis. Interest income is accrued as earned and dividend income is recorded on the ex-dividend date. Certain income from foreign securities is recognized as soon as information is available to the Fund. Realized gains and losses from the sale of securities are recorded on an identified cost basis. Net investment income (other than class specific expenses) and realized and unrealized gains and losses are allocated daily to each class of shares based upon the relative net asset value of outstanding shares of each class of shares at the beginning of the day (after adjusting for the current share activity of the respective class). Expenses common to all Funds are allocated among the Funds comprising the Trust based upon their relative net asset values or other appropriate allocation methods.
Guarantees and Indemnifications: Under the Trust’s organizational documents, its officers and Trustees are indemnified against certain liabilities arising out of the performance of their duties to the Fund. Additionally, in the normal course of business the Trust enters into contracts with service providers that contain general indemnification clauses. The Trust’s maximum exposure under these arrangements is unknown. However, based on experience, the Trust expects the risk of loss to be remote.
Use of Estimates: The preparation of financial statements, in conformity with generally accepted accounting principles, requires management to make estimates and assumptions that affect the reported amounts of assets and liabilities and the disclosure of contingent assets and liabilities at the date of the financial statements and the reported amounts of increases and decreases in net assets from operations during the reporting period. Actual results could differ from those estimates.
NOTE 3 – INVESTMENT ADVISORY FEE AND OTHER TRANSACTIONS WITH AFFILIATES
Pursuant to an investment advisory agreement, Thornburg Investment Management, Inc. (the “Advisor”) serves as the investment advisor and performs services to the Fund for which the fees are payable at the end of each month. For the six months ended March 31, 2011, these fees were payable at annual rates ranging from .875 of 1% to .675 of 1% per annum of the average daily net assets of the Fund depending on the Fund’s asset size. The Trust has also entered into administrative services agreements with the Advisor, whereby the Advisor will perform certain administrative services for the shareholders of each class of the Fund’s shares, and for which fees will be payable at an annual rate of up to .125 of 1% per annum of the average daily net assets attributable to each class of shares. For the six months ended March 31, 2011, the Advisor contractually reimbursed certain class specific expenses, administrative fees, and distribution fees of $76,815 for Class I shares, $10,136 for Class R3 shares, $11,390 for Class R4 shares, and $24,092 for Class R5 shares.
The Trust has an underwriting agreement with Thornburg Securities Corporation (the “Distributor,” an affiliate of the Advisor), which acts as the distributor of the Fund’s shares. For the six months ended March 31, 2011, the Distributor has advised the Fund that it earned commissions aggregating $7,661 from the sale of Class A shares, and collected contingent deferred sales charges aggregating $2,697 from redemptions of Class C shares of the Fund.
Pursuant to a service plan under Rule 12b-1 of the Investment Company Act of 1940, the Fund may reimburse to the Advisor an amount not to exceed .25 of 1% per annum of the average daily net assets attributable to each class of shares of the Fund for payments made by the Advisor to securities dealers and other financial institutions to obtain various shareholder and distribution related services. For the six months ended March 31, 2011, there were no 12b-1 service plan fees charged for Class I shares. The Advisor may pay out of its own resources additional expenses for distribution of the Fund’s shares.
The Trust has also adopted distribution plans pursuant to Rule 12b-1, applicable only to the Fund’s Class C and Class R3 shares, under which the Fund compensates the Distributor for services in promoting the sale of Class C and Class R3 shares of the Fund at an annual rate of up to .75 of 1% per annum of the average daily net assets attributable to Class C shares, and an annual rate of up to .25 of 1% per annum of the average daily net assets attributable to Class R3 shares. Total fees incurred by the Distributor for each class of shares of the Fund under their respective Service and Distribution Plans for the six months ended March 31, 2011, are set forth in the Statement of Operations.
The Trust has an agreement with the custodian bank to indirectly pay a portion of the custodian’s fees through credits earned by the Fund’s cash on deposit with the bank. This deposit agreement is an alternative to overnight investments. Custodial fees have been
22 Certified Semi-Annual Report
| | |
| NOTES TO FINANCIAL STATEMENTS, CONTINUED | | |
| |
| Thornburg Global Opportunities Fund | | March 31, 2011 (Unaudited) |
adjusted to reflect amounts that would have been paid without this agreement, with a corresponding adjustment reflected as fees paid indirectly in the Statement of Operations. For the six months ended March 31, 2011, fees paid indirectly were $627.
Certain officers and Trustees of the Trust are also officers and/or directors of the Advisor and Distributor. The compensation of independent Trustees is borne by the Trust.
NOTE 4 – SHARES OF BENEFICIAL INTEREST
At March 31, 2011, there were an unlimited number of shares of beneficial interest authorized. Transactions in shares of beneficial interest were as follows:
| | | | | | | | | | | | | | | | |
| | | Six Months Ended
March 31, 2011 (Unaudited) | | | Year Ended
September 30, 2010 (Audited) | |
| | | Shares | | | Amount | | | Shares | | | Amount | |
Class A Shares | | | | | | | | | | | | | | | | |
Shares sold | | | 564,270 | | | $ | 8,701,082 | | | | 1,932,225 | | | $ | 26,869,017 | |
Shares issued to shareholders in reinvestment of dividends | | | 50,548 | | | | 766,820 | | | | 64,470 | | | | 884,066 | |
Shares repurchased | | | (1,089,243 | ) | | | (16,691,312 | ) | | | (1,630,246 | ) | | | (22,166,671 | ) |
Redemption fees received* | | | — | | | | 165 | | | | — | | | | 2,835 | |
| | | | | | | | | | | | | | | | |
| | | | |
Net Increase (Decrease) | | | (474,425 | ) | | $ | (7,223,245 | ) | | | 366,449 | | | $ | 5,589,247 | |
| | | | | | | | | | | | | | | | |
| | | | |
Class C Shares | | | | | | | | | | | | | | | | |
Shares sold | | | 229,044 | | | $ | 3,464,234 | | | | 896,157 | | | $ | 12,294,052 | |
Shares issued to shareholders in reinvestment of dividends | | | 35,337 | | | | 530,417 | | | | 18,260 | | | | 245,234 | |
Shares repurchased | | | (535,577 | ) | | | (8,059,763 | ) | | | (1,248,317 | ) | | | (16,861,356 | ) |
Redemption fees received* | | | — | | | | 146 | | | | — | | | | 2,512 | |
| | | | | | | | | | | | | | | | |
| | | | |
Net Increase (Decrease) | | | (271,196 | ) | | $ | (4,064,966 | ) | | | (333,900 | ) | | $ | (4,319,558 | ) |
| | | | | | | | | | | | | | | | |
| | | | |
Class I Shares | | | | | | | | | | | | | | | | |
Shares sold | | | 1,548,895 | | | $ | 23,836,824 | | | | 3,274,574 | | | $ | 45,532,091 | |
Shares issued to shareholders in reinvestment of dividends | | | 83,521 | | | | 1,270,359 | | | | 133,385 | | | | 1,837,387 | |
Shares repurchased | | | (1,720,164 | ) | | | (25,621,415 | ) | | | (2,151,068 | ) | | | (29,300,502 | ) |
Redemption fees received* | | | — | | | | 228 | | | | — | | | | 3,756 | |
| | | | | | | | | | | | | | | | |
| | | | |
Net Increase (Decrease) | | | (87,748 | ) | | $ | (514,004 | ) | | | 1,256,891 | | | $ | 18,072,732 | |
| | | | | | | | | | | | | | | | |
| | | | |
Class R3 Shares | | | | | | | | | | | | | | | | |
Shares sold | | | 2,898 | | | $ | 46,028 | | | | 9,552 | | | $ | 130,546 | |
Shares issued to shareholders in reinvestment of dividends | | | 100 | | | | 1,507 | | | | 98 | | | | 1,351 | |
Shares repurchased | | | (785 | ) | | | (12,457 | ) | | | (328 | ) | | | (4,806 | ) |
Redemption fees received* | | | — | | | | — | | | | — | | | | 3 | |
| | | | | | | | | | | | | | | | |
| | | | |
Net Increase (Decrease) | | | 2,213 | | | $ | 35,078 | | | | 9,322 | | | $ | 127,094 | |
| | | | | | | | | | | | | | | | |
Certified Semi-Annual Report 23
| | |
| NOTES TO FINANCIAL STATEMENTS, CONTINUED |
| |
| Thornburg Global Opportunities Fund | | March 31, 2011 (Unaudited) |
| | | | | | | | | | | | | | | | |
| | | Six Months Ended
March 31, 2011 (Unaudited) | | | Year Ended
September 30, 2010 (Audited) | |
| | | Shares | | | Amount | | | Shares | | | Amount | |
Class R4 Shares | | | | | | | | | | | | | | | | |
Shares sold | | | 11,009 | | | $ | 168,270 | | | | 11,897 | | | $ | 163,293 | |
Shares issued to shareholders in reinvestment of dividends | | | 862 | | | | 13,008 | | | | 1,193 | | | | 16,293 | |
Shares repurchased | | | (11,973 | ) | | | (175,304 | ) | | | (11,780 | ) | | | (157,823 | ) |
Redemption fees received* | | | — | | | | 2 | | | | — | | | | 38 | |
| | | | | | | | | | | | | | | | |
| | | | |
Net Increase (Decrease) | | | (102 | ) | | $ | 5,976 | | | | 1,310 | | | $ | 21,801 | |
| | | | | | | | | | | | | | | | |
| | | | |
Class R5 Shares | | | | | | | | | | | | | | | | |
Shares sold | | | 58,997 | | | $ | 943,069 | | | | 1,156,994 | | | $ | 16,024,177 | |
Shares issued to shareholders in reinvestment of dividends | | | 11,537 | | | | 175,593 | | | | 12,827 | | | | 178,404 | |
Shares repurchased | | | (72,455 | ) | | | (1,070,116 | ) | | | (8,074 | ) | | | (111,608 | ) |
Redemption fees received* | | | — | | | | 28 | | | | — | | | | 158 | |
| | | | | | | | | | | | | | | | |
| | | | |
Net Increase (Decrease) | | | (1,921 | ) | | $ | 48,574 | | | | 1,161,747 | | | $ | 16,091,131 | |
| | | | | | | | | | | | | | | | |
| * | The Fund charges a redemption fee of 1% of the Class A and Class I shares redeemed or exchanged within 30 days of purchase. Redemption fees charged to any class are allocated to all classes upon receipt of payment based on relative net asset values of each class or other appropriate allocation methods. |
NOTE 5 – SECURITIES TRANSACTIONS
For the six months ended March 31, 2011, the Fund had purchase and sale transactions of investment securities (excluding short-term investments) of $82,689,735 and $112,707,510, respectively.
NOTE 6 – INCOME TAXES
At March 31, 2011, information on the tax components of capital is as follows:
| | | | |
Cost of investments for tax purposes | | $ | 293,877,742 | |
| | | | |
Gross unrealized appreciation on a tax basis | | $ | 74,363,595 | |
Gross unrealized depreciation on a tax basis | | | (6,736,886 | ) |
| | | | |
Net unrealized appreciation (depreciation) on investments (tax basis) | | $ | 67,626,709 | |
| | | | |
At March 31, 2011, the Fund had deferred tax basis currency losses occurring subsequent to October 31, 2009 of $30,821. For tax purposes, such losses will be reflected in the year ending September 30, 2011.
At March 31, 2011, the Fund had tax basis capital losses, which may be carried forward to offset future capital gains. To the extent such carryforwards are used, capital gain distributions may be reduced to the extent provided by regulations.
Such loss carryforwards expire as follows:
| | | | |
2016 | | $ | 88,134 | |
2017 | | | 68,696,690 | |
2018 | | | 140,977,215 | |
| | | | |
| | $ | 209,762,039 | |
| | | | |
24 Certified Semi-Annual Report
| | |
| NOTES TO FINANCIAL STATEMENTS, CONTINUED | | |
| |
| Thornburg Global Opportunities Fund | | March 31, 2011 (Unaudited) |
NOTE 7 – DERIVATIVE FINANCIAL INSTRUMENTS WITH OFF-BALANCE SHEET RISK AND FOREIGN INVESTMENT RISK
The Fund may use a variety of derivative financial instruments to hedge or adjust the risks affecting its investment portfolio or to enhance investment returns. Provisions of FASB Accounting Standards Codification ASC 815-10-50 (“ASC 815”), require certain disclosures. The disclosures are intended to provide users of financial statements with an understanding of the use of derivative instruments by the Fund and how these derivatives affect the financial position, financial performance and cash flows of the Fund. The Fund does not designate any derivative instruments as hedging instruments under ASC 815. During the six months ended March 31, 2011, the Fund’s principal exposure to derivative financial instruments of the type addressed by ASC 815 was investment in foreign exchange contracts. A foreign exchange contract is an agreement between two parties to exchange different currencies at a specified rate of exchange at an agreed upon future date. Foreign exchange contracts involve risks to the Fund, including the risk that a contract counterparty will not meet its obligations to the Fund, the risk that a change in a contract’s value may not correlate perfectly with the currency the contract was intended to track, and the risk that the Fund’s advisor is unable to correctly implement its strategy in using a contract. In any such instance, the Fund may not achieve the intended benefit of entering into a contract, and may experience a loss.
The Fund entered into forward currency contracts during the six months ended March 31, 2011 in the normal course of pursuing its investment objectives, in anticipation of purchasing foreign investments or with the intent of reducing the risk to the value of the Fund’s foreign investments from adverse changes in the relationship between the U.S. dollar and foreign currencies. In each case these contracts have been initiated in conjunction with foreign investment transactions.
These contracts are accounted for by the Fund under ASC 815. Unrealized gains and unrealized losses on outstanding contracts are reported in the Fund’s Statement of Assets and Liabilities at the Fund’s net equity, as measured by the difference between the forward exchange rates at the reporting date and the forward exchange rates at each contract’s inception date. Net realized gain (loss) on contracts closed during the period, and changes in net unrealized appreciation (depreciation) on outstanding contracts are recognized in the Fund’s Statement of Operations.
The following table displays the outstanding forward currency contracts, at March 31, 2011:
| | | | | | | | | | | | | | | | | | | | | | | | |
Outstanding Forward Currency Contracts to Buy or Sell at March 31, 2011 | |
Contract Description | | Buy/Sell | | | Contract
Amount | | | Contract
Value Date | | | Value USD | | | Unrealized
Appreciation | | | Unrealized
Depreciation | |
Euro | | | Sell | | | | 1,665,100 | | | | 08/18/2011 | | | | 2,352,732 | | | $ | — | | | $ | (34,647 | ) |
Euro | | | Sell | | | | 5,161,200 | | | | 08/18/2011 | | | | 7,292,609 | | | | — | | | | (350,433 | ) |
Euro | | | Sell | | | | 3,085,600 | | | | 08/18/2011 | | | | 4,359,853 | | | | — | | | | (34,212 | ) |
Japanese Yen | | | Sell | | | | 394,656,100 | | | | 06/09/2011 | | | | 4,746,481 | | | | 33,926 | | | | — | |
Swiss Franc | | | Sell | | | | 13,146,300 | | | | 04/06/2011 | | | | 14,312,969 | | | | — | | | | (797,702 | ) |
| | | | | | | | | | | | | | | | | | | | | | | | |
Total | | | | | | | | | | | | | | | | | | $ | 33,926 | | | $ | (1,216,994 | ) |
| | | | | | | | | | | | | | | | | | | | | | | | |
The unrealized appreciation (depreciation) of the outstanding forward currency contracts recognized in the Fund’s Statement of Assets and Liabilities at March 31, 2011 is disclosed in the following table:
| | | | | | |
Fair Values of Derivative Financial Instruments at March 31, 2011 | |
| Asset Derivatives | | | | | |
| | | Balance Sheet Location | | Fair Value | |
Foreign exchange contracts | | Assets - Unrealized appreciation on forward currency contracts | | $ | 33,926 | |
| | |
| Liability Derivatives | | | | | |
| | | Balance Sheet Location | | Fair Value | |
Foreign exchange contracts | | Liabilities - Unrealized depreciation on forward currency contracts | | $ | (1,216,994 | ) |
| | |
Certified Semi-Annual Report 25
| | |
| NOTES TO FINANCIAL STATEMENTS, CONTINUED | | |
| |
| Thornburg Global Opportunities Fund | | March 31, 2011 (Unaudited) |
The realized gains (losses) from forward currency contracts and the change in unrealized appreciation (depreciation) of outstanding forward currency contracts recognized in the Fund’s Statement of Operations for the six months ended March 31, 2011 are disclosed in the following tables:
| | | | | | | | |
Amount of Realized Gain (Loss) on Derivative Financial Instruments Recognized in Income for the Six Months Ended March 31, 2011 | |
| | | Total | | | Forward Currency Contracts | |
Foreign exchange contracts | | $ | (3,155,597 | ) | | $ | (3,155,597 | ) |
| | | | | | | | |
Change in Unrealized Appreciation (Depreciation) of Derivative Financial Instruments Recognized in Income for the Six Months Ended March 31, 2011 | |
| | | Total | | | Forward Currency Contracts | |
Foreign exchange contracts | | $ | 1,078,644 | | | $ | 1,078,644 | |
OTHER NOTES
Fund management believes no events have occurred between March 31, 2011 and May 20, 2011, the date of issuance of the financial statements, which require adjustment of, or disclosure in, the accompanying financial statements.
26 Certified Semi-Annual Report
This page intentionally left blank.
Certified Semi-Annual Report 27
FINANCIAL HIGHLIGHTS
Thornburg Global Opportunities Fund
| | | | | | | | | | | | | | | | | | | | | | | | | | | | | | | | | | | | | | | | | | | | | | | | | | | | | | | | | | | | |
| | | PER SHARE PERFORMANCE (for a share outstanding throughout the period)+ | | | RATIOS TO AVERAGE NET ASSETS | | | SUPPLEMENTAL DATA | |
Unless
Otherwise
Noted, Periods
are Fiscal Years
Ended Sept. 30, | | Net Asset
Value
Beginning
of Period | | | Net
Investment
Income
(Loss) | | | Net Realized
& Unrealized
Gain
(Loss) on
Investments | | | Total
from
Investment
Operations | | | Dividends
from Net
Investment
Income | | | Dividends
from
Net
Realized
Gains | | | Total
Dividends | | | Net
Asset
Value
End
of
Period | | | Net
Investment
Income
(Loss)
(%) | | | Expenses,
After
Expense
Reductions
(%) | | | Expenses,
After
Expense
Reductions
and
Net of
Custody
Credits (%) | | | Expenses,
Before
Expense
Reductions
(%) | | | Total
Return
(%)(a) | | | Portfolio
Turnover
Rate (%) | | | Net
Assets at End
of Period
(Thousands) | |
Class A Shares | | | | | | | | | | | | | | | | | | | | | | | | | | | | | | | | | | | | | | | | | | | | | | | | | | | | | |
2011(b)(c) | | $ | 13.98 | | | | 0.05 | | | | 2.34 | | | | 2.39 | | | | (0.14 | ) | | | — | | | | (0.14 | ) | | $ | 16.23 | | | | 0.60 | (d) | | | 1.47 | (d) | | | 1.47 | (d) | | | 1.47 | (d) | | | 17.17 | | | | 25.15 | | | $ | 100,198 | |
2010(c) | | $ | 13.10 | | | | 0.18 | | | | 0.86 | | | | 1.04 | | | | (0.16 | ) | | | — | | | | (0.16 | ) | | $ | 13.98 | | | | 1.29 | | | | 1.47 | | | | 1.47 | | | | 1.47 | | | | 7.98 | | | | 66.27 | | | $ | 92,927 | |
2009(c) | | $ | 13.38 | | | | 0.29 | | | | 0.03 | | | | 0.32 | | | | (0.60 | ) | | | — | | | | (0.60 | ) | | $ | 13.10 | | | | 2.96 | | | | 1.53 | | | | 1.52 | | | | 1.55 | | | | 3.60 | | | | 103.02 | | | $ | 82,309 | |
2008(c) | | $ | 20.06 | | | | 0.30 | | | | (6.30 | ) | | | (6.00 | ) | | | (0.14 | ) | | | (0.54 | ) | | | (0.68 | ) | | $ | 13.38 | | | | 1.68 | | | | 1.50 | | | | 1.49 | | | | 1.50 | | | | (30.85 | ) | | | 83.70 | | | $ | 159,996 | |
2007(c) | | $ | 12.86 | | | | 0.07 | | | | 7.29 | | | | 7.36 | | | | — | (e) | | | (0.16 | ) | | | (0.16 | ) | | $ | 20.06 | | | | 0.41 | | | | 1.51 | | | | 1.50 | | | | 1.55 | | | | 57.75 | | | | 91.02 | | | $ | 262,475 | |
2006(c)(f) | | $ | 11.94 | | | | 0.01 | | | | 0.91 | | | | 0.92 | | | | — | | | | — | | | | — | | | $ | 12.86 | | | | 0.34 | (d) | | | 1.70 | (d) | | | 1.63 | (d) | | | 6.12 | (d)(g) | | | 7.71 | | | | 6.08 | | | $ | 8,477 | |
| | | | | | | | | | | | | |
Class C Shares | | | | | | | | | | | | | | | | | | | | | | | | | | | | | | | | | | | | | | | | | | | | | | | | | | | | | |
2011(b) | | $ | 13.83 | | | | (0.01 | ) | | | 2.31 | | | | 2.30 | | | | (0.11 | ) | | | — | | | | (0.11 | ) | | $ | 16.02 | | | | (0.15 | )(d) | | | 2.23 | (d) | | | 2.23 | (d) | | | 2.23 | (d) | | | 16.70 | | | | 25.15 | | | $ | 90,825 | |
2010 | | $ | 12.96 | | | | 0.07 | | | | 0.85 | | | | 0.92 | | | | (0.05 | ) | | | — | | | | (0.05 | ) | | $ | 13.83 | | | | 0.48 | | | | 2.28 | | | | 2.28 | | | | 2.28 | | | | 7.10 | | | | 66.27 | | | $ | 82,139 | |
2009 | | $ | 13.22 | | | | 0.23 | | | | 0.01 | | | | 0.24 | | | | (0.50 | ) | | | — | | | | (0.50 | ) | | $ | 12.96 | | | | 2.36 | | | | 2.31 | | | | 2.31 | | | | 2.35 | | | | 2.79 | | | | 103.02 | | | $ | 81,334 | |
2008 | | $ | 19.87 | | | | 0.17 | | | | (6.24 | ) | | | (6.07 | ) | | | (0.04 | ) | | | (0.54 | ) | | | (0.58 | ) | | $ | 13.22 | | | | 0.97 | | | | 2.25 | | | | 2.24 | | | | 2.25 | | | | (31.38 | ) | | | 83.70 | | | $ | 101,908 | |
2007 | | $ | 12.84 | | | | (0.06 | ) | | | 7.25 | | | | 7.19 | | | | — | | | | (0.16 | ) | | | (0.16 | ) | | $ | 19.87 | | | | (0.34 | ) | | | 2.28 | | | | 2.28 | | | | 2.33 | | | | 56.48 | | | | 91.02 | | | $ | 107,298 | |
2006(f) | | $ | 11.94 | | | | (0.01 | ) | | | 0.91 | | | | 0.90 | | | | — | | | | — | | | | — | | | $ | 12.84 | | | | (0.40 | )(d) | | | 2.41 | (d) | | | 2.35 | (d) | | | 9.01 | (d)(g) | | | 7.54 | | | | 6.08 | | | $ | 3,505 | |
| | | | | | | | | | | | | |
Class I Shares | | | | | | | | | | | | | | | | | | | | | | | | | | | | | | | | | | | | | | | | | | | | | | | | | | | | | |
2011(b) | | $ | 14.01 | | | | 0.08 | | | | 2.36 | | | | 2.44 | | | | (0.16 | ) | | | — | | | | (0.16 | ) | | $ | 16.29 | | | | 1.09 | (d) | | | 0.99 | (d) | | | 0.99 | (d) | | | 1.10 | (d) | | | 17.49 | | | | 25.15 | | | $ | 151,882 | |
2010 | | $ | 13.13 | | | | 0.24 | | | | 0.87 | | | | 1.11 | | | | (0.23 | ) | | | — | | | | (0.23 | ) | | $ | 14.01 | | | | 1.78 | | | | 0.99 | | | | 0.99 | | | | 1.19 | | | | 8.48 | | | | 66.27 | | | $ | 131,892 | |
2009 | | $ | 13.45 | | | | 0.37 | | | | (0.01 | ) | | | 0.36 | | | | (0.68 | ) | | | — | | | | (0.68 | ) | | $ | 13.13 | | | | 3.65 | | | | 0.99 | | | | 0.99 | | | | 1.33 | | | | 4.16 | | | | 103.02 | | | $ | 107,132 | |
2008 | | $ | 20.16 | | | | 0.40 | | | | (6.34 | ) | | | (5.94 | ) | | | (0.23 | ) | | | (0.54 | ) | | | (0.77 | ) | | $ | 13.45 | | | | 2.25 | | | | 0.99 | | | | 0.99 | | | | 1.10 | | | | (30.49 | ) | | | 83.70 | | | $ | 154,102 | |
2007 | | $ | 12.87 | | | | 0.17 | | | | 7.29 | | | | 7.46 | | | | (0.01 | ) | | | (0.16 | ) | | | (0.17 | ) | | $ | 20.16 | | | | 0.97 | | | | 1.00 | | | | 0.99 | | | | 1.20 | | | | 58.51 | | | | 91.02 | | | $ | 108,461 | |
2006(f) | | $ | 11.94 | | | | 0.02 | | | | 0.91 | | | | 0.93 | | | | — | | | | — | | | | — | | | $ | 12.87 | | | | 0.90 | (d) | | | 1.04 | (d) | | | 0.99 | (d) | | | 2.98 | (d) | | | 7.79 | | | | 6.08 | | | $ | 12,968 | |
| | | | | | | | | | | | | |
Class R3 Shares | | | | | | | | | | | | | | | | | | | | | | | | | | | | | | | | | | | | | | | | | | | | | | | | | | | | | |
2011(b) | | $ | 13.93 | | | | 0.05 | | | | 2.33 | | | | 2.38 | | | | (0.14 | ) | | | — | | | | (0.14 | ) | | $ | 16.17 | | | | 0.64 | (d) | | | 1.49 | (d) | | | 1.49 | (d) | | | 13.08 | (d)(g) | | | 17.16 | | | | 25.15 | | | $ | 212 | |
2010 | | $ | 13.08 | | | | 0.17 | | | | 0.87 | | | | 1.04 | | | | (0.19 | ) | | | — | | | | (0.19 | ) | | $ | 13.93 | | | | 1.28 | | | | 1.46 | | | | 1.46 | | | | 32.05 | (g) | | | 7.97 | | | | 66.27 | | | $ | 151 | |
2009 | | $ | 13.37 | | | | 0.26 | | | | 0.05 | | | | 0.31 | | | | (0.60 | ) | | | — | | | | (0.60 | ) | | $ | 13.08 | | | | 2.57 | | | | 1.50 | | | | 1.49 | | | | 116.95 | (g) | | | 3.61 | | | | 103.02 | | | $ | 20 | |
2008(h) | | $ | 17.91 | | | | 0.29 | | | | (4.70 | ) | | | (4.41 | ) | | | (0.13 | ) | | | — | | | | (0.13 | ) | | $ | 13.37 | | | | 2.61 | (d) | | | 1.49 | (d) | | | 1.49 | (d) | | | 67.47 | (d)(g) | | | (24.78 | ) | | | 83.70 | | | $ | 35 | |
| | | | | | | | | | | | | |
Class R4 Shares | | | | | | | | | | | | | | | | | | | | | | | | | | | | | | | | | | | | | | | | | | | | | | | | | | | | | |
2011(b) | | $ | 13.90 | | | | 0.05 | | | | 2.33 | | | | 2.38 | | | | (0.14 | ) | | | — | | | | (0.14 | ) | | $ | 16.14 | | | | 0.68 | (d) | | | 1.40 | (d) | | | 1.40 | (d) | | | 3.04 | (d) | | | 17.22 | | | | 25.15 | | | $ | 1,560 | |
2010 | | $ | 13.04 | | | | 0.19 | | | | 0.84 | | | | 1.03 | | | | (0.17 | ) | | | — | | | | (0.17 | ) | | $ | 13.90 | | | | 1.38 | | | | 1.40 | | | | 1.40 | | | | 3.29 | | | | 7.96 | | | | 66.27 | | | $ | 1,345 | |
2009 | | $ | 13.38 | | | | 0.40 | | | | (0.08 | ) | | | 0.32 | | | | (0.66 | ) | | | — | | | | (0.66 | ) | | $ | 13.04 | | | | 3.19 | | | | 1.40 | | | | 1.40 | | | | 14.73 | (g) | | | 3.73 | | | | 103.02 | | | $ | 1,244 | |
2008(h) | | $ | 17.91 | | | | 0.28 | | | | (4.69 | ) | | | (4.41 | ) | | | (0.12 | ) | | | — | | | | (0.12 | ) | | $ | 13.38 | | | | 2.48 | (d) | | | 1.41 | (d) | | | 1.40 | (d) | | | 864.00 | (d)(g) | | | (24.74 | ) | | | 83.70 | | | $ | 3 | |
| | | | | | | | | | | | | |
Class R5 Shares | | | | | | | | | | | | | | | | | | | | | | | | | | | | | | | | | | | | | | | | | | | | | | | | | | | | | |
2011(b) | | $ | 14.02 | | | | 0.08 | | | | 2.36 | | | | 2.44 | | | | (0.16 | ) | | | — | | | | (0.16 | ) | | $ | 16.30 | | | | 1.09 | (d) | | | 0.99 | (d) | | | 0.99 | (d) | | | 1.27 | (d) | | | 17.48 | | | | 25.15 | | | $ | 19,008 | |
2010 | | $ | 13.15 | | | | 0.34 | | | | 0.76 | | | | 1.10 | | | | (0.23 | ) | | | — | | | | (0.23 | ) | | $ | 14.02 | | | | 2.46 | | | | 0.99 | | | | 0.99 | | | | 1.64 | | | | 8.41 | | | | 66.27 | | | $ | 16,380 | |
2009 | | $ | 13.46 | | | | 0.53 | | | | (0.15 | ) | | | 0.38 | | | | (0.69 | ) | | | — | | | | (0.69 | ) | | $ | 13.15 | | | | 4.36 | | | | 0.97 | | | | 0.97 | | | | 239.11 | (g) | | | 4.25 | | | | 103.02 | | | $ | 86 | |
2008(h) | | $ | 17.98 | | | | 0.33 | | | | (4.70 | ) | | | (4.37 | ) | | | (0.15 | ) | | | — | | | | (0.15 | ) | | $ | 13.46 | | | | 2.97 | (d) | | | 0.92 | (d) | | | 0.92 | (d) | | | 850.59 | (d)(g) | | | (24.47 | ) | | | 83.70 | | | $ | 2 | |
| (a) | Not annualized for periods less than one year. |
| (b) | Unaudited Six Month Period Ended March 31. |
| (c) | Sales loads are not reflected in computing total return. |
| (e) | Dividends from net investment income per share were less than $(0.01). |
| (f) | Fund commenced operations on July 28, 2006. |
| (g) | Due to the size of net assets and fixed expenses, ratios may appear disproportionate. |
| (h) | Effective date of this class of shares was February 1, 2008. |
| + | Based on weighted average shares outstanding. |
See notes to financial statements.
| | |
| 28 Certified Semi-Annual Report | | Certified Semi-Annual Report 29 |
| | |
| EXPENSE EXAMPLE | | |
| |
| Thornburg Global Opportunities Fund | | March 31, 2011 (Unaudited) |
As a shareholder of the Fund, you incur two types of costs:
| | (1) | transaction costs, including |
(a) sales charges (loads) on purchase payments for Class A shares;
(b) a deferred sales charge on redemptions of any part or all of a purchase of $1 million of Class A shares within 12 months of purchase;
(c) a deferred sales charge on redemptions of Class C shares within 12 months of purchase;
(d) a 30-day redemption fee on Class A and Class I shares;
| | (2) | ongoing costs, including management fees; distribution and/or service (12b-1) fees; and other Fund expenses. |
This example is intended to help you understand your ongoing costs (in dollars) of investing in the Fund and to compare these costs with the ongoing costs of investing in other mutual funds.
The example is based on a $1,000 investment beginning on October 1, 2010, and held until March 31, 2011.
ACTUAL EXPENSES
For each class of shares, the first line of the table at right provides information about actual account values and actual expenses. You may use the information in this line, together with the amount you invested, to estimate the expenses that you paid over the period. Simply divide your account value by $1,000 (for example, an $8,600 account value divided by $1,000 = 8.6), then multiply the result by the number in the first line for your class of shares under the heading entitled “Expenses Paid During Period” to estimate the expenses you paid on your account during this period.
HYPOTHETICAL EXAMPLE FOR COMPARISON PURPOSES
For each class of shares, the second line of the table at right provides information about hypothetical account values and hypothetical expenses based on the Fund’s actual expense ratio and an assumed rate of return of 5% per year before expenses, which is not the Fund’s actual return. The hypothetical account values and expenses may not be used to estimate the actual ending account balance or expenses you paid for the period. You may use this information to compare the ongoing costs of investing in the Fund and other funds. To do so, compare this 5% hypothetical example with the 5% hypothetical examples that appear in the shareholder reports of the other funds.
| | | | | | | | | | | | |
| | | Beginning
Account Value
10/1/10 | | | Ending
Account Value
3/31/11 | | | Expenses Paid
During Period†
10/1/10–3/31/11 | |
Class A Shares | | | | | | | | | | | | |
Actual | | $ | 1,000.00 | | | $ | 1,171.70 | | | $ | 7.95 | |
Hypothetical* | | $ | 1,000.00 | | | $ | 1,017.61 | | | $ | 7.39 | |
Class C Shares | | | | | | | | | | | | |
Actual | | $ | 1,000.00 | | | $ | 1,167.00 | | | $ | 12.04 | |
Hypothetical* | | $ | 1,000.00 | | | $ | 1,013.82 | | | $ | 11.19 | |
Class I Shares | | | | | | | | | | | | |
Actual | | $ | 1,000.00 | | | $ | 1,174.90 | | | $ | 5.37 | |
Hypothetical* | | $ | 1,000.00 | | | $ | 1,020.00 | | | $ | 4.98 | |
Class R3 Shares | | | | | | | | | | | | |
Actual | | $ | 1,000.00 | | | $ | 1,171.60 | | | $ | 8.05 | |
Hypothetical* | | $ | 1,000.00 | | | $ | 1,017.51 | | | $ | 7.48 | |
Class R4 Shares | | | | | | | | | | | | |
Actual | | $ | 1,000.00 | | | $ | 1,172.20 | | | $ | 7.58 | |
Hypothetical* | | $ | 1,000.00 | | | $ | 1,017.95 | | | $ | 7.04 | |
Class R5 Shares | | | | | | | | | | | | |
Actual | | $ | 1,000.00 | | | $ | 1,174.80 | | | $ | 5.37 | |
Hypothetical* | | $ | 1,000.00 | | | $ | 1,020.00 | | | $ | 4.99 | |
| † | Expenses are equal to the annualized expense ratio for each class (A: 1.47%; C: 2.23%; I: 0.99%; R3: 1.49%; R4: 1.40%; R5: 0.99%) multiplied by the average account value over the period, multiplied by 182/365 to reflect the one-half year period. |
| * | Hypothetical assumes a rate of return of 5% per year before expenses. |
Please note that the expenses shown in the table are meant to highlight your ongoing costs only and do not reflect any transactional costs, such as sales charges (loads), redemption fees, or exchange fees. Therefore, the second line of the table for each class of shares is useful in comparing ongoing costs only, and will not help you determine the relative total costs of owning different funds. In addition, if these transactional costs were included, your costs would have been higher.
30 Certified Semi-Annual Report
| | |
| INDEX COMPARISON | | |
| |
| Thornburg Global Opportunities Fund | | March 31, 2011 (Unaudited) |

AVERAGE ANNUAL TOTAL RETURNS
For periods ended March 31, 2011 (with sales charge)
| | | | | | | | | | | | |
| | | 1 Yr | | | 3 Yrs | | | Since
Inception | |
A Shares (Incep: 7/28/06) | | | 7.41 | % | | | -0.32 | % | | | 8.60 | % |
C Shares (Incep: 7/28/06) | | | 10.58 | % | | | 0.43 | % | | | 8.81 | % |
I Shares (Incep: 7/28/06) | | | 13.04 | % | | | 1.77 | % | | | 10.23 | % |
R3 Shares (Incep: 2/1/08) | | | 12.43 | % | | | 1.23 | % | | | -0.45 | % |
R4 Shares (Incep: 2/1/08) | | | 12.49 | % | | | 1.30 | % | | | -0.38 | % |
R5 Shares (Incep: 2/1/08) | | | 12.97 | % | | | 1.78 | % | | | 0.09 | % |
MSCI AC World Index (Since: 7/28/06) | | | 14.08 | % | | | 0.31 | % | | | 3.16 | % |
Performance data shown represents past performance and is no guarantee of future results. Investment return and principal value will fluctuate so shares, when redeemed, may be worth more or less than their original cost. Current performance may be lower or higher than quoted. For performance current to the most recent month end, visit thornburg.com or call 800.847.0200. The performance data and graph do not reflect the deduction of taxes that a shareholder would pay on distributions or the redemption of Fund shares. Returns reflect the reinvestment of dividends and capital gains as well as applicable sales charges. Class A shares are sold with a maximum sales charge of 4.50%. Class C shares are subject to a 1% CDSC for the first year only. There is no up-front sales charge for Class I, R3, R4 and R5 shares. Class A and I shares are subject to a 1% 30-day redemption fee.
Certified Semi-Annual Report 31
| | |
| OTHER INFORMATION | | |
| |
| Thornburg Global Opportunities Fund | | March 31, 2011 (Unaudited) |
PORTFOLIO PROXY VOTING
Policies and Procedures:
The Trust has delegated to Thornburg Investment Management, Inc. (the “Advisor”) voting decisions respecting proxies for the Fund’s voting securities. The Advisor makes voting decisions in accordance with its Proxy Voting Policy and Procedures. A description of the Policy and Procedures is available (i) without charge, upon request, by calling the Advisor toll-free at 1-800-847-0200, (ii) on the Thornburg web site at www.thornburg.com, and (iii) on the Securities and Exchange Commission’s web site at www.sec.gov.
Information regarding how proxies were voted is available on or before August 31 of each year for the twelve months ending the preceding June 30. This information is available (i) without charge, upon request by calling the Advisor toll-free at 1-800-847-0200, (ii) on the Thornburg web site at www.thornburg.com, and (iii) on the Securities and Exchange Commission’s web site at www.sec.gov.
AVAILABILITY OF QUARTERLY PORTFOLIO SCHEDULE
The Fund files with the Securities and Exchange Commission schedules of its portfolio holdings on Form N-Q for the first and third quarters of each fiscal year. The Fund’s Forms N-Q are available on the Commission’s web site at www.sec.gov, or may be reviewed and copied at the Commission’s Public Reference Room in Washington, D.C. Information on the operation of the Public Reference Room may be obtained by calling 1-800-SEC-0330. The Fund also makes this information available on its web site at www.thornburg. com/download or upon request by calling 1-800-847-0200.
32 Certified Semi-Annual Report
Trustees’ Statement to Shareholders
Not part of the Certified Semi-Annual Report
February 8, 2005, as readopted September 13, 2010
The Trustees are concerned that ongoing commentaries and opinions reported in the media may confuse investors in general as to the supervisory duties of trustees of mutual funds and, in particular, leave Thornburg Investment Trust shareholders uncertain regarding how we discharge our responsibilities in supervising the Funds’ investment advisor and in reviewing the advisor’s contract for renewal. We decided to spell out clearly three principal guidelines that we follow in supervising the Trust’s investment advisor on your behalf.
We begin with the premise that each shareholder selected his or her Fund because its investments are managed by the investment advisor identified in the prospectus and in accordance with the objective and policies described in the prospectus. We realize, as each of you do, that if you believe that your Fund’s stated objective and policies no longer serve your personal investment goals, you can sell your shares and leave the Fund.
Therefore, we believe that our primary supervisory task – our principal obligation to you – is to assess the nature and quality of the advisor’s services, and to confirm that the advisor actively and competently pursues the Fund’s objective, in accordance with the policies set out in the prospectus. To do this, we meet regularly with management to review your Fund’s portfolio and to discuss the advisor’s specific actions and judgments in pursuing the Fund’s objective. We do not substitute our own judgment for the advisor’s decisions in selecting investments; the advisor is paid to exercise its informed judgment on investment decisions, and we seek to confirm, in reviewing the advisor’s performance, that the advisor is doing just that.
Second, while we are conscious of costs and the effect that costs have on shareholders’ returns, we do not seek the lowest fees or expense ratio as our sole or primary objective. We try to make sure that your Fund’s fees and costs are reasonable in relationship to the services rendered and that they are generally in line with those charged by other expert investment advisors, consistent with our belief that the Fund’s investors searched for and expect that expertise and attention and have decided to pay a reasonable price for it. We do not put the management contract “out to bid” as a matter of course, and we would not do so unless we had concluded that the advisor materially had failed to pursue the Fund’s objectives in accordance with its policies, or for other equally important reasons. We believe that any other approach would be inconsistent with your interests and contrary to your expectations when you bought shares of the Fund in the first place.
Finally, because we believe that most Thornburg Fund shareholders have invested with a long-term perspective, we try not to focus too much on the fashions of the moment and on short-term performance. The market will not favor any specific investment objective or set of policies at all times and under all economic circumstances. A fund will experience periods of both high and low returns relative to other funds and other investments. Even if one of our Funds is not favored by the market at a particular time, we believe that the advisor is nonetheless obliged to remain true to the Fund’s objective and policies, and we watch to see that it does so.
This page is not part of the Semi-Annual Report. 33
This page intentionally left blank.
34 This page is not part of the Semi-Annual Report.
Retirement and Education Accounts
Thornburg Investment Management offers retirement and education savings accounts that can help you meet a variety of planning challenges. For account applications or further information on any of the accounts below, please call 1-800-847-0200 or go to www.thornburg.com/ira. Your financial advisor can help you determine which plan is right for you.
Individual Retirement Accounts
Individual Retirement Accounts (IRAs) provide a tax-advantaged means to save money for the future. For a detailed outline of the difference between retirement accounts, see www.thornburg.com/ira. Rollovers are available. Call 1-800-847-0200 for more information.
Traditional IRAs – Contributions to Traditional IRAs are tax deductible for eligible individuals, and withdrawals are taxed as additional ordinary income. You may contribute to an IRA if you receive compensation and are under 70 1/2, even if you are covered by an employer retirement plan. Deductible contributions are subject to certain qualifications. Please consult your tax advisor.
Roth IRAs – Under a Roth IRA, there is no tax deduction for contributions, but there is no income tax on qualified withdrawals. For a more detailed comparison of Traditional and Roth IRAs, please see our web site at www.thornburg.com/ira.
SEP IRAs – Simplified Employee Pension (SEP) IRAs are established by employers. The employer is allowed a tax deduction for contributions made to the SEP Plan and makes contributions to each eligible employee’s SEP IRA on a discretionary basis.
SIMPLE IRAs – Savings Incentive Match Plan for Employees of Small Employers (SIMPLE) is designed to give small business owners a simplified method to establish and contribute to a retirement plan for employees. The employer is allowed a tax deduction for contributions and makes either matching or non-elective contributions to each eligible employee’s SIMPLE IRA. Employees may make salary deferral contributions.
Coverdell Education Savings Account
These savings accounts are designed to provide a way to save money for higher education expenses. In an Education Savings Account, earnings and interest grow tax-free, and qualified withdrawals used to pay for eligible higher-education expenses are tax- and penalty-free.
Funds Available
The following funds are available in the accounts listed above:
| | • | | Thornburg International Value Fund |
| | • | | Thornburg Core Growth Fund |
| | • | | Thornburg Investment Income Builder Fund |
| | • | | Thornburg Global Opportunities Fund |
| | • | | Thornburg International Growth Fund |
| | • | | Thornburg Developing World Fund |
| | • | | Thornburg Limited Term U.S. Government Fund |
| | • | | Thornburg Limited Term Income Fund |
| | • | | Thornburg Strategic Income Fund |
This page is not part of the Semi-Annual Report. 35

Thornburg Equity Funds
Thornburg’s equity research uses a fundamental and comprehensive analytical approach. Thornburg equity funds focus on a limited number of securities so that each holding can impact performance. The equity team searches for firms believed to have a promising future and seeks to buy shares of those companies at a discount to their intrinsic value.
| | • | | Thornburg International Value Fund |
| | • | | Thornburg Core Growth Fund |
| | • | | Thornburg Investment Income Builder Fund |
| | • | | Thornburg Global Opportunities Fund |
| | • | | Thornburg International Growth Fund |
| | • | | Thornburg Developing World Fund |
Thornburg Bond Funds
Thornburg Investment Management applies a disciplined philosophy to fixed-income management. Since the launch of our first fixed-income fund over 25 years ago, we have been conducting fundamental, bottom-up research in an effort to identify bonds which we believe provide the best return for a given level of risk. We are very organic in our approach, avoiding leverage or complex strategies which could backfire in periods of market uncertainty.
| | • | | Thornburg Limited Term Municipal Fund |
| | • | | Thornburg Intermediate Municipal Fund |
| | • | | Thornburg California Limited Term Municipal Fund |
| | • | | Thornburg New Mexico Intermediate Municipal Fund |
| | • | | Thornburg New York Intermediate Municipal Fund |
| | • | | Thornburg Strategic Municipal Income Fund |
| | • | | Thornburg Limited Term U.S. Government Fund |
| | • | | Thornburg Limited Term Income Fund |
| | • | | Thornburg Strategic Income Fund |
Before investing, carefully consider the Fund’s investment goals, risks, charges, and expenses. For a prospectus containing this and other information, contact your financial advisor or visit thornburg. com. Read it carefully before investing.
For additional information, please visit www.thornburg.com
Thornburg Investment Management, Inc. 2300 North Ridgetop Road, Santa Fe, NM 87506
This page is not part of the Semi-Annual Report. 37
This page intentionally left blank.
38 This page is not part of the Semi-Annual Report.
This page intentionally left blank.
This page is not part of the Semi-Annual Report. 39
| | | | | | | | |

| | | | Waste not,
Wait not | |  |
| | | |
| | | | | | Get instant access to your shareholder reports. |
| | | |
| | This Semi-Annual Report is submitted for the general information of shareholders of the Fund. It is not authorized for distribution to prospective investors in the Fund unless preceded or accompanied by an effective prospectus. | | | | By switching from your postal mailbox to your email inbox, you reduce paper clutter, improve record keeping access, and help conserve our natural resources. |
| | | |

| | Investment Advisor: Thornburg Investment Management® 800.847.0200 | | | | Go to www.thornburg.com/edelivery and sign up to receive your shareholder reports, prospectuses, and proxy statements electronically. |
| | Distributor: Thornburg Securities Corporation® 800.847.0200 | | | | You invest in the future, without spending a dime. |
| | TH1411 | | | | |

Important Information
The information presented on the following pages was current as of March 31, 2011. The manager’s views, portfolio holdings, and sector and country diversification are provided for the general information of the Fund’s shareholders; they are historical and subject to change. This material should not be deemed a recommendation to buy or sell any of the securities mentioned.
Investments in the Fund carry risks, including possible loss of principal. Special risks may be associated with investments outside the United States, especially in developing countries, including currency fluctuations, illiquidity and volatility. Investments in small capitalization companies may increase the risk of greater price fluctuations. Please see the Fund’s Prospectus for a discussion of the risks associated with an investment in the Fund. Investments in the Fund are not FDIC insured, nor are they deposits of or guaranteed by a bank or any other entity. There is no guarantee that the Fund will meet its investment objectives. Funds invested in a limited number of holdings may expose an investor to greater volatility.
Performance data given at net asset value (NAV) does not take into account the applicable sales charges. If the sales charges had been included, the performance would have been lower.
Minimum investments for Class I shares are higher than those for other classes. Class I shares may not be available to all investors.
From time to time, the Fund may invest in shares of companies through initial public offerings (IPOs). IPOs have the potential to produce substantial gains for the Fund. There is no assurance that the Fund will have continued access to profitable IPOs and, as the Fund’s assets grow, the impact of IPO investments may decline. Therefore, investors should not rely on these past gains as an indication of future performance.
Impact to performance of IPOs, as disclosed in the following letter to shareholders, is calculated using the performance on the first day of the IPO, assuming that the acquired shares are held to the end of the first day.
| | | | |
Share Class | | NASDAQ Symbol | | Cusip |
| Class A | | THDAX | | 885-216-408 |
| Class C | | THDCX | | 885-216-507 |
| Class I | | THDIX | | 885-216-606 |
Glossary
MSCI Emerging Markets Index – A free float-adjusted market capitalization index that is designed to measure equity market performance of emerging markets. The MSCI Emerging Markets Index consists of the following 21 emerging market country indices: Brazil, Chile, China, Colombia, Czech Republic, Egypt, Hungary, India, Indonesia, Korea, Malaysia, Mexico, Morocco, Peru, Philippines, Poland, Russia, South Africa, Taiwan, Thailand, and Turkey.
MSCI Country Indices (India and Indonesia) – Free float-adjusted market capitalization indices that are designed to measure equity market performance in that specific country.
Unless otherwise noted, index returns reflect the reinvestment of income dividends and capital gains, if any, but do not reflect fees, brokerage commissions or other expenses of investing. Investors may not make direct investments into any index.
Consumer Price Index (CPI) – Measures prices of a fixed basket of goods bought by a typical consumer, including food, transportation, shelter, utilities, clothing, medical care, entertainment and other items. The CPI, published by the Bureau of Labor Statistics in the Department of Labor, is based at 100 in 1982 and is released monthly. It is widely used as a cost-of-living benchmark to adjust Social Security payments and other payment schedules, union contracts and tax brackets. The CPI is also known as the cost-of-living index.
F12 EPS (Forward 12-month Earnings Per Share) – The total forecasted earnings divided by the number of shares outstanding.
Leverage – The amount of debt used to finance a firm’s assets. A firm with significantly more debt than equity is considered to be highly leveraged.
Price/Earnings Ratio (P/E) – A valuation ratio of a company’s current share price compared to its per-share earnings. P/E equals a company’s market value per share divided by earnings per share.
This page is not part of the Semi-Annual Report. 3

Thornburg Developing World Fund
March 31, 2011
Table of Contents
This report is certified under the Sarbanes-Oxley Act of 2002, which requires that public companies, including mutual funds, affirm that the information provided in their annual and semiannual shareholder reports fully and fairly represents their financial position.
4 Certified Semi-Annual Report
Letter to Shareholders
| | |

| | April 19, 2011 |
| | Dear Fellow Shareholder: |
| | We are pleased to present the Semi-Annual Report for the Thornburg Developing World Fund for the six months ended March 31, 2011. The Class A shares of the Thornburg Developing World Fund produced a total return of 9.54% (without sales charge) for the six-month period ended March 31, 2011, compared to 9.53% for the MSCI Emerging Markets Index. Since inception of December 16, 2009, the Class A shares of the Thornburg Developing World Fund produced a total return of 32.48% (without sales charge), compared to 23.43% for the MSCI Emerging Markets Index. |
| |
| Performance data shown represents past performance and is no guarantee of future results. Investment return and principal value will fluctuate so shares, when redeemed, may be worth more or less than their original cost. Current performance may be lower or higher than quoted. For performance current to the most recent month end, visit thornburg.com or call 800-847-0200. | | As recently as January 2011, capital flows were placing upward pressure on developing country currencies and stock valuations, as ever-increasing amounts of capital (from the developed world) pursued a relatively fixed supply of assets (in the developing world). During the six-month period ended March 31, 2011, IPOs contributed 2.30% to the performance of the Fund. Food price inflation, geopolitical unrest in the Middle East and higher interest rates across the emerging world subsequently conspired to create a sharp rotation into developed markets assets. Thus, the MSCI Emerging Markets Index declined 6.6% between January 4, 2011 and February 24, 2011, during which time the S&P 500 Index increased 3.1%. Notably, the significant energy weighting in the MSCI Emerging Markets Index masks far sharper declines in individual markets exposed to some of the aforementioned inflationary pressures. For example, MSCI India Index declined 15.8% during this period and MSCI Indonesia Index declined 7.8%, in U.S. dollar (USD) terms. More recently, many emerging markets have recovered as emerging central bankers come to grips with the need to raise interest rates. However, individual markets and stocks remain out of favor. |
| |
| The maximum sales charge for Class A shares is 4.50%. Class A shares are subject to a 1% 30-day redemption fee. The total annual fund operating expense of Class A shares is 3.29%, as disclosed in the most recent Prospectus. Thornburg Investment Management and Thornburg Securities Corporation have contractually agreed to waive fees and reimburse expenses through at least February 1, 2012, so that actual expenses, for Class A shares, do not exceed 1.83%. | | This pronounced volatility has provided ample opportunities to improve the risk-adjusted characteristics of the Fund’s portfolio. In certain cases, such opportunities took the form of an improved geopolitical tradeoff. For example, emerging market banks generally sold off together in recent months due to inflationary pressures, while only a select few of these markets (notably Egypt and Peru) face deteriorating geopolitical backdrops. Reflecting this dynamic, we sold Commercial International Bank in Egypt and Credicorp in Peru, and redeployed the proceeds in Bank Mandiri in Indonesia and Sberbank in Russia. In other cases, improved risk-adjusted opportunities took the form of lower valuations and better free-cash-flow profiles. For example, we sold Magnit, a Russian food discounter, during the March 2011 quarter due to high valuation (~28x F12 earnings per share (EPS), versus ~16x at purchase last year) and deteriorating free-cash-flow characteristics that could result in equity issuance in our investment horizon. We redeployed the proceeds in Drogasil, a Brazilian drug store chain, which enjoys comparable growth characteristics in the medium term but offers a lower valuation (~20x F12 EPS) and more attractive free-cash-flow characteristics. Reflecting such activity, as of March 31, 2011, the median P/E multiple on calendar 2011 EPS for the Developing World Fund was approximately 17.8x, compared to 20.6x as recently as December |
Certified Semi-Annual Report 5
Letter to Shareholders,
Continued
| | |
| | 31, 2010. While lower valuations are not protective in isolation, they are indicative of an improved opportunity set in the emerging markets exiting the March 2011 quarter. |
| |
| | As we look forward, the short-term investment climate is uncertain. Inflation remains a concern, with food representing anywhere from 21% to 50% of the Consumer Price Index (CPI) baskets in most major emerging markets (tensions across the Middle East and North African region only underscore these pressures). The geopolitically-induced increase in oil prices only exacerbates inflationary pressures, and many emerging market central bankers have until recently been reticent to raise interest rates for fear of amplifying capital inflows. At the same time, concerns about inflation have created significant opportunities in consumer and industrial businesses with real or perceived exposure to rising input costs. Notably, the small absolute movements in the benchmark indices are not indicative of this changing opportunity set given the predominance of energy holdings in these indices. While there may be a short-term mismatch between rising input prices and pricing power, we believe that many of the companies we own have the pricing power to manage through higher input prices within our investment horizon. Moreover, the currency outlook for many emerging markets has arguably improved. Specifically, with central bankers increasingly willing to raise interest rates (thereby increasing interest rate differentials) and halt currency stabilization efforts (thereby removing an impediment to currency appreciation), currencies such as the Brazilian real and Indonesian rupiah continue their march upward. Finally, it is notable that in many cases, high inflation occurs in lockstep with sound economic fundamentals. Indeed, some of the highest inflation markets also feature large central bank reserves, current account surpluses, low consumer debt penetration, and manageable government debt levels. On balance, while global equity markets currently appear positively inclined toward low-inflation markets with accelerating cyclical outlooks, it seems reasonable to expect a shift in tenor in favor of the robust structural outlooks of many emerging markets in the coming quarters. Regardless, we will remain focused on financially sound companies that can create value over an economic cycle. |
| |
| | We invite you to visit our website at www.thornburg.com, where you will find additional information about the Thornburg Developing World Fund, as well as other Thornburg investment products. We thank you for your trust and confidence. |
| |
| | Sincerely, |

Lewis Kaufman,CFA
Portfolio Manager
Managing Director
The matters discussed in this report may constitute forward-looking statements made pursuant to the safe harbor provisions of the Securities Litigation Reform Act of 1995. These include any advisor or portfolio manager prediction, assessment, analysis or outlook for individual securities, industries, investment styles, market sectors and/or markets. These statements involve risks and uncertainties. In addition to the general risks described for each fund in its current prospectus, other factors bearing on these reports include the accuracy of the advisor’s or portfolio manager’s forecasts and predictions, the appropriateness of the investment strategies designed by the advisor or portfolio manager, and the ability of the advisor or portfolio manager to implement their strategies efficiently and successfully. Any one or more of these factors, as well as other risks affecting the securities markets generally, could cause the actual results of any fund to differ materially as compared to its benchmarks.
6 Certified Semi-Annual Report
| | |
| SCHEDULE OF INVESTMENTS | | |
| |
| Thornburg Developing World Fund | | March 31, 2011 (Unaudited) |
SUMMARY OF INDUSTRY EXPOSURE
As of 3/31/11
| | | | | | | | | | |
Materials | | | 12.6 | % | | Food, Beverage & Tobacco | | | 5.3 | % |
Software & Services | | | 10.6 | % | | Pharmaceuticals, Biotechnology & Life Sciences | | | 5.2 | % |
Energy | | | 10.1 | % | | Consumer Services | | | 3.9 | % |
Banks | | | 9.1 | % | | Transportation | | | 2.3 | % |
Household & Personal Products | | | 8.4 | % | | Diversified Financials | | | 2.0 | % |
Health Care Equipment & Services | | | 8.1 | % | | Capital Goods | | | 1.9 | % |
Retailing | | | 7.7 | % | | Consumer Durables & Apparel | | | 1.8 | % |
Food & Staples Retailing | | | 7.3 | % | | Other Assets & Cash Equivalents | | | 3.6 | % |
TOP TEN HOLDINGS
As of 3/31/11
| | | | | | | | | | |
OAO Gazprom ADR | | | 3.6 | % | | Hengan International Group Co. Ltd. | | | 3.2 | % |
Clicks Group Ltd. | | | 3.6 | % | | Cia Hering | | | 3.1 | % |
PT Indocement Tunggal Prakarsa Tbk | | | 3.5 | % | | Sinopharm Group Co. H | | | 3.1 | % |
Colgate Palmolive Co. | | | 3.5 | % | | New Oriental Education & Technology Group, Inc. ADR | | | 2.9 | % |
Genomma Lab Internacional SA | | | 3.2 | % | | Asian Paints Ltd. | | | 2.7 | % |
SUMMARY OF COUNTRY EXPOSURE
As of 3/31/11 (percent of equity holdings)
| | | | | | | | | | |
China | | | 24.8 | % | | South Africa | | | 3.8 | % |
Brazil | | | 11.4 | % | | Hong Kong | | | 3.1 | % |
Indonesia | | | 9.1 | % | | Canada | | | 2.7 | % |
Russia | | | 8.1 | % | | Netherlands | | | 2.7 | % |
United States | | | 8.1 | % | | Taiwan | | | 2.4 | % |
India | | | 7.5 | % | | Czech Republic | | | 2.1 | % |
Turkey | | | 5.7 | % | | Poland | | | 1.6 | % |
Mexico | | | 5.7 | % | | Argentina | | | 1.2 | % |
Certified Semi-Annual Report 7
| | |
| SCHEDULE OF INVESTMENTS, CONTINUED | | |
| |
| Thornburg Developing World Fund | | March 31, 2011 (Unaudited) |
| | | | | | | | |
| | | Shares/
Principal Amount | | | Value | |
COMMON STOCK — 96.40% | | | | | | | | |
BANKS — 9.07% | | | | | | | | |
COMMERCIAL BANKS — 9.07% | | | | | | | | |
Komercni Banka a.s. | | | 5,634 | | | $ | 1,421,757 | |
PT Bank Mandiri | | | 2,379,000 | | | | 1,857,847 | |
Sberbank of Russia | | | 398,200 | | | | 1,496,435 | |
Turkiye Garanti Bankasi A.S. | | | 312,700 | | | | 1,462,190 | |
| | | | | | | | |
| | | | | | | 6,238,229 | |
| | | | | | | | |
CAPITAL GOODS — 1.93% | | | | | | | | |
MACHINERY — 1.93% | | | | | | | | |
Turk Traktor Ve Ziraat Makineleri AS | | | 61,474 | | | | 1,325,789 | |
| | | | | | | | |
| | | | | | | 1,325,789 | |
| | | | | | | | |
CONSUMER DURABLES & APPAREL — 1.82% | | | | | | | | |
TEXTILES, APPAREL & LUXURY GOODS — 1.82% | | | | | | | | |
Daphne International Holding Ltd. | | | 1,655,000 | | | | 1,251,056 | |
| | | | | | | | |
| | | | | | | 1,251,056 | |
| | | | | | | | |
CONSUMER SERVICES — 3.93% | | | | | | | | |
DIVERSIFIED CONSUMER SERVICES — 2.94% | | | | | | | | |
a New Oriental Education & Technology Group, Inc. ADR | | | 20,230 | | | | 2,024,416 | |
HOTELS, RESTAURANTS & LEISURE — 0.99% | | | | | | | | |
Wynn Macau Ltd. | | | 243,600 | | | | 681,142 | |
| | | | | | | | |
| | | | | | | 2,705,558 | |
| | | | | | | | |
DIVERSIFIED FINANCIALS — 1.95% | | | | | | | | |
DIVERSIFIED FINANCIAL SERVICES — 1.95% | | | | | | | | |
Hong Kong Exchanges & Clearing Ltd. | | | 62,000 | | | | 1,344,646 | |
| | | | | | | | |
| | | | | | | 1,344,646 | |
| | | | | | | | |
ENERGY — 10.15% | | | | | | | | |
ENERGY EQUIPMENT & SERVICES — 2.58% | | | | | | | | |
Schlumberger Ltd. | | | 18,991 | | | | 1,771,101 | |
OIL, GAS & CONSUMABLE FUELS — 7.57% | | | | | | | | |
CNOOC Ltd. | | | 597,000 | | | | 1,507,361 | |
Coal India Ltd. | | | 156,200 | | | | 1,210,160 | |
OAO Gazprom ADR | | | 77,100 | | | | 2,493,414 | |
| | | | | | | | |
| | | | | | | 6,982,036 | |
| | | | | | | | |
FOOD & STAPLES RETAILING — 7.32% | | | | | | | | |
FOOD & STAPLES RETAILING — 7.32% | | | | | | | | |
a Bizim Toptan Satis Magazalari AS | | | 50,300 | | | | 1,026,165 | |
Drogasil S.A. | | | 232,367 | | | | 1,816,068 | |
Eurocash SA | | | 97,195 | | | | 1,067,584 | |
PriceSmart, Inc. | | | 30,641 | | | | 1,122,686 | |
| | | | | | | | |
| | | | | | | 5,032,503 | |
| | | | | | | | |
FOOD, BEVERAGE & TOBACCO — 5.31% | | | | | | | | |
BEVERAGES — 2.69% | | | | | | | | |
Coca Cola Co. | | | 27,835 | | | | 1,846,852 | |
8 Certified Semi-Annual Report
| | |
| SCHEDULE OF INVESTMENTS, CONTINUED | | |
| |
| Thornburg Developing World Fund | | March 31, 2011 (Unaudited) |
| | | | | | | | |
| | | Shares/
Principal Amount | | | Value | |
FOOD PRODUCTS — 2.62% | | | | | | | | |
Mayora Indah | | | 1,389,500 | | | $ | 1,803,199 | |
| | | | | | | | |
| | | | | | | 3,650,051 | |
| | | | | | | | |
HEALTH CARE EQUIPMENT & SERVICES — 8.05% | | | | | | | | |
HEALTH CARE EQUIPMENT & SUPPLIES — 2.36% | | | | | | | | |
St. Shine Optical Co. Ltd. | | | 131,644 | | | | 1,620,564 | |
HEALTH CARE PROVIDERS & SERVICES — 5.69% | | | | | | | | |
Diagnosticos da America SA | | | 140,200 | | | | 1,803,326 | |
Sinopharm Group Co. H | | | 594,600 | | | | 2,113,593 | |
| | | | | | | | |
| | | | | | | 5,537,483 | |
| | | | | | | | |
HOUSEHOLD & PERSONAL PRODUCTS — 8.43% | | | | | | | | |
HOUSEHOLD PRODUCTS — 3.46% | | | | | | | | |
Colgate Palmolive Co. | | | 29,507 | | | | 2,382,985 | |
PERSONAL PRODUCTS — 4.97% | | | | | | | | |
Dabur India Ltd. | | | 557,869 | | | | 1,206,559 | |
Hengan International Group Co. Ltd. | | | 297,500 | | | | 2,208,718 | |
| | | | | | | | |
| | | | | | | 5,798,262 | |
| | | | | | | | |
MATERIALS — 12.63% | | | | | | | | |
CHEMICALS — 5.33% | | | | | | | | |
Asian Paints Ltd. | | | 32,918 | | | | 1,871,960 | |
Potash Corp. of Saskatchewan, Inc. | | | 30,501 | | | | 1,797,424 | |
CONSTRUCTION MATERIALS — 5.08% | | | | | | | | |
PT Indocement Tunggal Prakarsa Tbk | | | 1,276,700 | | | | 2,397,249 | |
West China Cement Ltd. | | | 2,452,000 | | | | 1,093,833 | |
METALS & MINING — 2.22% | | | | | | | | |
Southern Copper Corp. | | | 37,962 | | | | 1,528,730 | |
| | | | | | | | |
| | | | | | | 8,689,196 | |
| | | | | | | | |
PHARMACEUTICALS, BIOTECHNOLOGY & LIFE SCIENCES — 5.24% | | | | | | | | |
PHARMACEUTICALS — 5.24% | | | | | | | | |
a Genomma Lab Internacional SA | | | 982,800 | | | | 2,222,660 | |
a Pharmstandard GDR | | | 49,379 | | | | 1,380,143 | |
| | | | | | | | |
| | | | | | | 3,602,803 | |
| | | | | | | | |
RETAILING — 7.73% | | | | | | | | |
INTERNET & CATALOG RETAIL — 1.02% | | | | | | | | |
a Makemytrip Ltd. | | | 24,146 | | | | 707,719 | |
MULTILINE RETAIL — 3.62% | | | | | | | | |
Clicks Group Ltd. | | | 396,315 | | | | 2,493,299 | |
SPECIALTY RETAIL — 3.09% | | | | | | | | |
Cia Hering | | | 115,500 | | | | 2,122,316 | |
| | | | | | | | |
| | | | | | | 5,323,334 | |
| | | | | | | | |
SOFTWARE & SERVICES — 10.57% | | | | | | | | |
INTERNET SOFTWARE & SERVICES — 5.63% | | | | | | | | |
Mercadolibre, Inc. | | | 9,362 | | | | 764,220 | |
a Qihoo 360 Technology Co. Ltd. ADR | | | 29,000 | | | | 858,110 | |
Tencent Holdings Ltd. | | | 68,000 | | | | 1,657,481 | |
a Youku.com, Inc. ADR | | | 12,500 | | | | 593,875 | |
Certified Semi-Annual Report 9
| | |
| SCHEDULE OF INVESTMENTS, CONTINUED | | |
| |
| Thornburg Developing World Fund | | March 31, 2011 (Unaudited) |
| | | | | | | | |
| | | Shares/
Principal Amount | | | Value | |
SOFTWARE — 4.94% | | | | | | | | |
Totvs SA | | | 93,255 | | | $ | 1,790,674 | |
a VanceInfo Technologies ADR | | | 51,203 | | | | 1,608,287 | |
| | | | | | | | |
| | | | | | | 7,272,647 | |
| | | | | | | | |
TRANSPORTATION — 2.27% | | | | | | | | |
TRANSPORTATION INFRASTRUCTURE — 2.27% | | | | | | | | |
China Merchants Holdings International Co. Ltd. | | | 370,000 | | | | 1,564,945 | |
| | | | | | | | |
| | | | | | | 1,564,945 | |
| | | | | | | | |
TOTAL COMMON STOCK (Cost $59,912,463) | | | | | | | 66,318,538 | |
| | | | | | | | |
TOTAL INVESTMENTS — 96.40% (Cost $59,912,463) | | | | | | $ | 66,318,538 | |
OTHER ASSETS LESS LIABILITIES — 3.60% | | | | | | | 2,478,754 | |
| | | | | | | | |
NET ASSETS — 100.00% | | | | | | $ | 68,797,292 | |
| | | | | | | | |
Footnote Legend
Portfolio Abbreviations
To simplify the listings of securities, abbreviations are used per the table below:
| ADR | American Depository Receipt |
| GDR | Global Depository Receipt |
See notes to financial statements.
10 Certified Semi-Annual Report
| | |
| STATEMENT OF ASSETS AND LIABILITIES | | |
| |
| Thornburg Developing World Fund | | March 31, 2011 (Unaudited) |
| | | | |
ASSETS | | | | |
Investments at value (cost $59,912,463) (Note 2) | | $ | 66,318,538 | |
Cash | | | 3,568,825 | |
Cash denominated in foreign currency (cost $622,452) | | | 633,936 | |
Receivable for investments sold | | | 238,735 | |
Receivable for fund shares sold | | | 231,770 | |
Dividends receivable | | | 54,214 | |
Prepaid expenses and other assets | | | 32,460 | |
| | | | |
Total Assets | | | 71,078,478 | |
| | | | |
| |
LIABILITIES | | | | |
Payable for securities purchased | | | 2,180,341 | |
Payable for fund shares redeemed | | | 28,089 | |
Payable to investment advisor and other affiliates (Note 3) | | | 58,492 | |
Deferred tax payable | | | 7,239 | |
Accounts payable and accrued expenses | | | 7,025 | |
| | | | |
Total Liabilities | | | 2,281,186 | |
| | | | |
| |
NET ASSETS | | $ | 68,797,292 | |
| | | | |
NET ASSETS CONSIST OF: | | | | |
Distribution in excess of net investment income | | $ | (276,343 | ) |
Net unrealized appreciation on investments | | | 6,410,802 | |
Accumulated net realized gain (loss) | | | 2,030,658 | |
Net capital paid in on shares of beneficial interest | | | 60,632,175 | |
| | | | |
| | $ | 68,797,292 | |
| | | | |
NET ASSET VALUE: | | | | |
Class A Shares: | | | | |
Net asset value and redemption price per share
($27,999,683 applicable to 1,772,437 shares of beneficial interest outstanding - Note 4) | | $ | 15.80 | |
Maximum sales charge, 4.50% of offering price | | | 0.74 | |
| | | | |
Maximum offering price per share | | $ | 16.54 | |
| | | | |
| |
Class C Shares: | | | | |
Net asset value and offering price per share *
($8,797,642 applicable to 560,626 shares of beneficial interest outstanding - Note 4) | | $ | 15.69 | |
| | | | |
| |
Class I Shares: | | | | |
Net asset value, offering and redemption price per share
($31,999,967 applicable to 2,011,118 shares of beneficial interest outstanding - Note 4) | | $ | 15.91 | |
| | | | |
| * | Redemption price per share is equal to net asset value less any applicable contingent deferred sales charge. |
See notes to financial statements.
Certified Semi-Annual Report 11
| | |
| STATEMENT OF OPERATIONS | | |
| |
| Thornburg Developing World Fund | | Six Months Ended March 31, 2011 (Unaudited) |
| | | | |
INVESTMENT INCOME: | | | | |
Dividend income (net of foreign taxes withheld of $7,061) | | $ | 201,706 | |
Interest income | | | 339 | |
| | | | |
Total Income | | | 202,045 | |
| | | | |
EXPENSES: | | | | |
Investment advisory fees (Note 3) | | | 264,739 | |
Administration fees (Note 3) | | | | |
Class A Shares | | | 14,428 | |
Class C Shares | | | 4,175 | |
Class I Shares | | | 6,135 | |
Distribution and service fees (Note 3) | | | | |
Class A Shares | | | 29,011 | |
Class C Shares | | | 33,611 | |
Transfer agent fees | | | | |
Class A Shares | | | 8,215 | |
Class C Shares | | | 3,995 | |
Class I Shares | | | 3,511 | |
Registration and filing fees | | | | |
Class A Shares | | | 10,099 | |
Class C Shares | | | 9,934 | |
Class I Shares | | | 10,145 | |
Custodian fees (Note 3) | | | 59,923 | |
Professional fees | | | 20,271 | |
Accounting fees | | | 436 | |
Trustee fees | | | 591 | |
Other expenses | | | 7,140 | |
| | | | |
Total Expenses | | | 486,359 | |
Less: | | | | |
Expenses reimbursed by investment advisor (Note 3) | | | (28,343 | ) |
Investment advisory fees waived by investment advisor (Note 3) | | | (51,659 | ) |
Fees paid indirectly (Note 3) | | | (2,118 | ) |
| | | | |
Net Expenses | | | 404,239 | |
| | | | |
Net Investment Loss | | $ | (202,194 | ) |
| | | | |
12 Certified Semi-Annual Report
| | |
| STATEMENT OF OPERATIONS, CONTINUED | | |
| |
| Thornburg Developing World Fund | | Six Months Ended March 31, 2011 (Unaudited) |
| | | | |
REALIZED AND UNREALIZED GAIN (LOSS) | | | | |
Net realized gain (loss) from: | | | | |
Investments | | $ | 2,385,731 | |
Foreign currency transactions | | | (91,293 | ) |
| | | | |
| | | 2,294,438 | |
| | | | |
Net change in unrealized appreciation (depreciation) on: | | | | |
Investments (net of change in deferred taxes payable of $8,869) | | | 1,983,892 | |
Foreign currency translations | | | 12,231 | |
| | | | |
| | | 1,996,123 | |
| | | | |
Net Realized and Unrealized Gain | | | 4,290,561 | |
| | | | |
Net Increase in Net Assets Resulting from Operations | | $ | 4,088,367 | |
| | | | |
See notes to financial statements.
Certified Semi-Annual Report 13
STATEMENTS OF CHANGES IN NET ASSETS
Thornburg Developing World Fund
| | | | | | | | |
| | | Six Months Ended
March 31, 2011* | | | Period Ended
September 30, 2010** | |
INCREASE (DECREASE) IN NET ASSETS FROM | | | | | | | | |
| | |
OPERATIONS: | | | | | | | | |
Net investment income (loss) | | $ | (202,194 | ) | | $ | 90,914 | |
Net realized gain (loss) on investments and foreign currency transactions | | | 2,294,438 | | | | (342,739 | ) |
Increase (Decrease) in unrealized appreciation (depreciation) on investments, foreign currency translations and deferred taxes | | | 1,996,123 | | | | 4,414,679 | |
| | | | | | | | |
| | |
Net Increase (Decrease) in Net Assets Resulting from Operations | | | 4,088,367 | | | | 4,162,854 | |
| | |
DIVIDENDS TO SHAREHOLDERS: | | | | | | | | |
From net investment income | | | | | | | | |
Class A Shares | | | (28,522 | ) | | | — | |
Class C Shares | | | (6,288 | ) | | | — | |
Class I Shares | | | (51,294 | ) | | | — | |
| | |
FUND SHARE TRANSACTIONS (NOTE 4): | | | | | | | | |
Class A Shares | | | 12,294,326 | | | | 12,579,326 | |
Class C Shares | | | 5,476,080 | | | | 2,603,666 | |
Class I Shares | | | 12,438,581 | | | | 15,240,196 | |
| | | | | | | | |
| | |
Net Increase in Net Assets | | | 34,211,250 | | | | 34,586,042 | |
| | |
NET ASSETS: | | | | | | | | |
Beginning of Period | | | 34,586,042 | | | | — | |
| | | | | | | | |
| | |
End of Period | | $ | 68,797,292 | | | $ | 34,586,042 | |
| | | | | | | | |
| | |
Undistributed net investment income | | $ | — | | | $ | 11,955 | |
| ** | For the period from commencement of operations on December 16, 2009 through September 30, 2010. |
See notes to financial statements.
14 Certified Semi-Annual Report
| | |
| NOTES TO FINANCIAL STATEMENTS | | |
| |
| Thornburg Developing World Fund | | March 31, 2011 (Unaudited) |
NOTE 1 – ORGANIZATION
Thornburg Developing World Fund, hereinafter referred to as the “Fund,” is a diversified series of Thornburg Investment Trust (the “Trust”). The Fund commenced operations on December 16, 2009. The Trust was organized as a Massachusetts business trust under a Declaration of Trust dated June 3, 1987 and is registered as a diversified, open-end management investment company under the Investment Company Act of 1940, as amended. The Fund is currently one of sixteen separate series of the Trust. Each series is considered to be a separate entity for financial reporting and tax purposes and bears expenses directly attributable to it. The Fund seeks long-term capital appreciation.
The Fund currently offers three classes of shares of beneficial interest: Class A, Class C, and Institutional Class (Class I). Each class of shares of the Fund represents an interest in the same portfolio of investments, except that (i) Class A shares are sold subject to a front-end sales charge collected at the time the shares are purchased and bear a service fee, (ii) Class C shares are sold at net asset value without a sales charge at the time of purchase, but are subject to a contingent deferred sales charge upon redemption within one year of purchase, and bear both a service fee and a distribution fee, and (iii) Class I shares are sold at net asset value without a sales charge at the time of purchase, and (iv) the respective classes may have different reinvestment privileges and conversion rights. Additionally, the Fund may allocate among its classes certain expenses, to the extent allowable to specific classes, including transfer agent fees, government registration fees, certain printing and postage costs, and administrative and legal expenses. Currently, class specific expenses of the Fund are limited to service and distribution fees, administration fees, and certain registration and transfer agent expenses.
NOTE 2 – SIGNIFICANT ACCOUNTING POLICIES
Significant accounting policies of the Trust are as follows:
Valuation of Investments: Portfolio securities listed or traded on a national securities exchange are valued on the valuation date at the last reported sale price on the exchange that is the primary market for the security. Portfolio securities traded on an exchange for which there has been no sale that day and other equity securities traded in the over-the-counter market are valued at the mean between the last reported bid and asked prices. Portfolio securities reported by NASDAQ are valued at the NASDAQ official closing price. Any foreign security traded on exchanges outside the United States is valued at the price of the security on the exchange that is normally the security’s primary market, as of the close of that exchange preceding the time of the Fund’s valuation.
Debt obligations held by the Fund have a primary market over the counter and are valued by an independent pricing service approved by the Trustees of the Trust. The pricing service ordinarily values debt obligations at quoted bid prices. When quotations are not available, debt obligations held by the Fund are valued at evaluated prices determined by the pricing service using methods which include consideration of yields or prices of debt obligations of comparable quality, type of issue, coupon, maturity and rating, and indications as to value from dealers and general market conditions. Short-term obligations having remaining maturities of 60 days or less are ordinarily valued at amortized cost, which approximates market value.
Quotations in foreign currencies for foreign portfolio investments are converted to U.S. dollar equivalents using the foreign exchange quotation in effect at the time of valuation.
In any case where the market value of an equity security held by the Fund is not readily available, the Trust’s valuation and pricing committee determines a fair value for the security using procedures approved by the Trustees, which may include the use of a price obtained from an independent pricing service. The pricing service ordinarily values equity securities in these instances using multi-factor models to adjust market prices based upon various inputs, including exchange data, depository receipt prices, futures and index data and other data. A security’s market value is deemed not readily available whenever the exchange or market on which the security is primarily traded is closed for the entire scheduled day of trading. Additionally, a security’s market value may be deemed not readily available under other circumstances identified by the Trustees, including when developments occurring after the most recent close of the security’s primary exchange or market, but before the most recent close of trading in Fund shares, create a serious question about the reliability of the security’s market value.
In any case where a pricing service fails to provide a price for a debt obligation held by the Fund, the valuation and pricing committee determines a fair value for the debt obligation using procedures approved by the Trustees. Additionally, in any case where management
Certified Semi-Annual Report 15
| | |
| NOTES TO FINANCIAL STATEMENTS, CONTINUED | | |
| |
| Thornburg Developing World Fund | | March 31, 2011 (Unaudited) |
believes that a price provided by a pricing service for a debt obligation held by the Fund may be unreliable, the valuation and pricing committee decides whether or not to use the pricing service’s valuation or to determine a fair value for the debt obligation.
In determining fair value for any portfolio security or other investment, the valuation and pricing committee seeks to determine the amount that an owner of the investment might reasonably expect to receive upon a sale of the investment. However, because fair value prices are estimated prices, the valuation and pricing committee’s determination of fair value for an investment may differ from the value that would be realized by the Fund upon a sale of the investment, and that difference could be material to the Fund’s financial statements. The valuation and pricing committee’s determination of fair value for an investment may also differ from the prices obtained by other persons (including other mutual funds) for the investment.
Valuation Measurements: Various inputs are used in determining the value of the Fund’s investments. These inputs are summarized in the three levels listed below.
Level 1: Quoted prices in active markets for identical investments.
Level 2: Other significant observable inputs (including quoted prices for similar investments, interest rates, prepayment rates, credit risk, etc.).
Level 3: Significant unobservable inputs (including the Fund’s own assumptions in determining the fair value of investments).
The following table displays a summary of the inputs used to value the Fund’s net assets as of March 31, 2011. In any instance when valuation inputs from more than one level are used to determine the fair value of a specific investment, the investment is placed in the level of the table based upon the lowest level input that is significant in determining the fair value of the investment:
| | | | | | | | | | | | | | | | |
| | | Fair Value Measurements at March 31, 2011 | |
| | | Total | | | Level 1 | | | Level 2 | | | Level 3 | |
Assets | | | | | | | | | | | | | | | | |
Investments in Securities* | | | | | | | | | | | | | | | | |
Common Stock | | $ | 66,318,538 | | | $ | 66,318,538 | | | $ | — | | | $ | — | |
| | | | | | | | | | | | | | | | |
Total Investments in Securities | | $ | 66,318,538 | | | $ | 66,318,538 | | | $ | — | | | $ | — | |
Other Financial Instruments** | | | | | | | | | | | | | | | | |
Spot Currency | | $ | 324 | | | $ | 324 | | | $ | — | | | $ | — | |
| * | See Schedule of Investments for a summary of the industry exposure as grouped according to the Global Industry Classification Standard (GICS), which is an industry taxonomy developed by MSCI Barra and Standard & Poor’s (S&P). |
| ** | Other Financial Instruments include investments not reflected in the Schedule of Investments, such as futures, forwards and swap contracts, which are valued at the unrealized appreciation (depreciation) on the investment. |
Other Notes: It is the policy of the Fund to recognize significant transfers between Levels 1 and 2 and to disclose those transfers at the last date of the reporting period. The Fund recognized no significant transfers into and out of Levels 1 and 2 during the six months ended March 31, 2011.
Foreign Currency Translation: Portfolio securities and other assets and liabilities denominated in foreign currencies are translated into U.S. dollars based on the exchange rate of such currencies against the U.S. dollar on the date of valuation. Purchases and sales of securities and income items denominated in foreign currencies are translated into U.S. dollars at the exchange rate in effect on the translation date. When the Fund purchases or sells foreign securities, it will customarily enter into a foreign exchange contract to minimize foreign exchange risk from the trade date to the settlement date of such transactions.
The Fund does not separately report the effect of changes in foreign exchange rates from changes in market prices on securities held. Such changes are included in net realized and unrealized gain or loss from investments.
16 Certified Semi-Annual Report
| | |
| NOTES TO FINANCIAL STATEMENTS, CONTINUED | | |
| |
| Thornburg Developing World Fund | | March 31, 2011 (Unaudited) |
Reported net realized foreign exchange gains or losses arise from sales of foreign currencies, currency gains or losses realized between the trade and settlement dates on securities transactions and the difference between the amounts of dividends, interest, and foreign withholding taxes recorded on the Fund’s books, and the U.S. dollar equivalent of the amounts actually received or paid.
Net unrealized foreign exchange gains and losses arise from changes in the fair value of assets and liabilities, other than investments in securities at fiscal period end, resulting from changes in exchange rates.
Deferred Taxes: The Fund is subject to a tax imposed on net realized gains of securities of certain foreign countries. The Fund records an estimated deferred tax liability for net unrealized gains on these securities as reflected in the accompanying financial statements.
Federal Income Taxes: It is the policy of the Trust to comply with the provisions of the Internal Revenue Code applicable to “regulated investment companies” and to distribute to shareholders substantially all taxable income, including any net realized gain on investments of the Fund. Therefore, no provision for federal income taxes is required.
Management reviews each tax position believed to be material to the preparation of the Fund’s financial statements, to assess if it is more likely than not that the position would be sustained upon examination, based upon the technical merits of the position. As of March 31, 2011, management has not identified any such position for which a liability must be reflected in the Statement of Assets and Liabilities. The Fund’s tax returns remain subject to examination for three years after filing.
When-Issued and Delayed Delivery Transactions: The Fund may engage in when-issued or delayed delivery transactions. To the extent the Fund engages in such transactions, it will do so for the purpose of acquiring portfolio securities consistent with the Fund’s investment objectives and not for the purpose of investment leverage or to speculate on interest rate and/or market changes. At the time the Fund makes a commitment to purchase a security on a when-issued or delayed delivery basis, the Fund will record the transaction and reflect the value in determining its net asset value. When effecting such transactions, assets of an amount sufficient to make payment for the portfolio securities to be purchased will be segregated on the Fund’s records on the trade date. Securities purchased on a when-issued or delayed delivery basis do not earn interest until the settlement date.
Dividends: Dividends to shareholders, if any, are generally paid quarterly and are reinvested in additional shares of the Fund at net asset value per share at the close of business on the dividend payment date or, at the shareholder’s option, paid in cash. Net realized capital gains, to the extent available, will be distributed at least annually. Distributions to shareholders are based on income tax regulations and therefore, their characteristics may differ for financial statement and tax purposes.
General: Securities transactions are accounted for on a trade date basis. Interest income is accrued as earned and dividend income is recorded on the ex-dividend date. Certain income from foreign securities is recognized as soon as information is available to the Fund. Realized gains and losses from the sale of securities are recorded on an identified cost basis. Net investment income (other than class specific expenses) and realized and unrealized gains and losses are allocated daily to each class of shares based upon the relative net asset value of outstanding shares of each class of shares at the beginning of the day (after adjusting for the current share activity of the respective class). Expenses common to all Funds are allocated among the Funds comprising the Trust based upon their relative net asset values or other appropriate allocation methods.
Guarantees and Indemnifications: Under the Trust’s organizational documents, its officers and Trustees are indemnified against certain liabilities arising out of the performance of their duties to the Fund. Additionally, in the normal course of business the Trust enters into contracts with service providers that contain general indemnification clauses. The Trust’s maximum exposure under these arrangements is unknown. However, based on experience, the Trust expects the risk of loss to be remote.
Use of Estimates: The preparation of financial statements, in conformity with generally accepted accounting principles, requires management to make estimates and assumptions that affect the reported amounts of assets and liabilities and the disclosure of contingent assets and liabilities at the date of the financial statements and the reported amounts of increases and decreases in net assets from operations during the reporting period. Actual results could differ from those estimates.
Certified Semi-Annual Report 17
| | |
| NOTES TO FINANCIAL STATEMENTS, CONTINUED | | |
| |
| Thornburg Developing World Fund | | March 31, 2011 (Unaudited) |
NOTE 3 – INVESTMENT ADVISORY FEE AND OTHER TRANSACTIONS WITH AFFILIATES
Pursuant to an investment advisory agreement, Thornburg Investment Management, Inc. (the “Advisor”) serves as the investment advisor and performs services to the Fund for which the fees are payable at the end of each month. For the six months ended March 31, 2011, these fees were payable at annual rates ranging from .975 of 1% to .775 of 1% per annum of the average daily net assets of the Fund depending on the Fund’s asset size. For the six months ended March 31, 2011, the Advisor contractually waived investment advisory fees of $51,659. The Trust also has entered into administrative services agreements with the Advisor, whereby the Advisor will perform certain administrative services for the shareholders of each class of the Fund’s shares, and for which fees will be payable at an annual rate of up to .125 of 1% per annum of the average daily net assets attributable to each class of shares. For the six months ended March 31, 2011, the Advisor contractually reimbursed certain class specific expenses, administrative fees, and distribution fees of $8,552 for Class C shares, and $19,791 for Class I shares.
The Trust has an underwriting agreement with Thornburg Securities Corporation (the “Distributor,” an affiliate of the Advisor), which acts as the distributor of the Fund’s shares. For the six months ended March 31, 2011, the Distributor has advised the Fund that it earned commissions aggregating $14,906 from the sale of Class A shares, and collected contingent deferred sales charges aggregating $1,088 from redemptions of Class C shares of the Fund.
Pursuant to a service plan under Rule 12b-1 of the Investment Company Act of 1940, the Fund may reimburse to the Advisor an amount not to exceed .25 of 1% per annum of the average daily net assets attributable to each class of shares of the Fund for payments made by the Advisor to securities dealers and other financial institutions to obtain various shareholder and distribution related services. For the six months ended March 31, 2011, there were no 12b-1 service plan fees charged for Class I shares. The Advisor may pay out of its own resources additional expenses for distribution of the Fund’s shares.
The Trust has also adopted distribution plans pursuant to Rule 12b-1, applicable only to the Fund’s Class C shares under which the Fund compensates the Distributor for services in promoting the sale of Class C shares of the Fund at an annual rate of up to .75 of 1% per annum of the average daily net assets attributable to Class C shares. Total fees incurred by the Distributor for each class of shares of the Fund under their respective Service and Distribution Plans for the six months ended March 31, 2011, are set forth in the Statement of Operations.
The Trust has an agreement with the custodian bank to indirectly pay a portion of the custodian’s fees through credits earned by the Fund’s cash on deposit with the bank. This deposit agreement is an alternative to overnight investments. Custodial fees have been adjusted to reflect amounts that would have been paid without this agreement, with a corresponding adjustment reflected as fees paid indirectly in the Statement of Operations. For the six months ended March 31, 2011, fees paid indirectly were $2,118.
Certain officers and Trustees of the Trust are also officers and/or directors of the Advisor and Distributor. The compensation of independent Trustees is borne by the Trust.
NOTE 4 – SHARES OF BENEFICIAL INTEREST
At March 31, 2011, there were an unlimited number of shares of beneficial interest authorized. Transactions in shares of beneficial interest were as follows:
| | | | | | | | | | | | | | | | |
| | | Six Months Ended
March 31, 2011 (Unaudited) | | | Period Ended*
September 30, 2010 (Audited) | |
| | | Shares | | | Amount | | | Shares | | | Amount | |
Class A Shares | | | | | | | | | | | | | | | | |
Shares sold | | | 1,157,886 | | | $ | 17,754,548 | | | | 1,023,348 | | | $ | 13,148,906 | |
Shares issued to shareholders in reinvestment of dividends | | | 1,639 | | | | 25,513 | | | | — | | | | — | |
Shares repurchased | | | (364,864 | ) | | | (5,486,061 | ) | | | (45,572 | ) | | | (569,655 | ) |
Redemption fees received** | | | — | | | | 326 | | | | — | | | | 75 | |
| | | | | | | | | | | | | | | | |
| | | | |
Net Increase (Decrease) | | | 794,661 | | | $ | 12,294,326 | | | | 977,776 | | | $ | 12,579,326 | |
| | | | | | | | | | | | | | | | |
18 Certified Semi-Annual Report
| | |
| NOTES TO FINANCIAL STATEMENTS, CONTINUED | | |
| |
| Thornburg Developing World Fund | | March 31, 2011 (Unaudited) |
| | | | | | | | | | | | | | | | |
| | | Six Months Ended
March 31, 2011 (Unaudited) | | | Period Ended*
September 30, 2010 (Audited) | |
| | | Shares | | | Amount | | | Shares | | | Amount | |
Class C Shares | | | | | | | | | | | | | | | | |
Shares sold | | | 423,672 | | | $ | 6,446,248 | | | | 207,298 | | | $ | 2,690,788 | |
Shares issued to shareholders in reinvestment of dividends | | | 359 | | | | 5,563 | | | | — | | | | — | |
Shares repurchased | | | (64,193 | ) | | | (975,830 | ) | | | (6,510 | ) | | | (87,135 | ) |
Redemption fees received** | | | — | | | | 99 | | | | — | | | | 13 | |
| | | | | | | | | | | | | | | | |
| | | | |
Net Increase (Decrease) | | | 359,838 | | | $ | 5,476,080 | | | | 200,788 | | | $ | 2,603,666 | |
| | | | | | | | | | | | | | | | |
| | | | |
Class I Shares | | | | | | | | | | | | | | | | |
Shares sold | | | 994,897 | | | $ | 15,435,403 | | | | 1,219,783 | | | $ | 15,347,231 | |
Shares issued to shareholders in reinvestment of dividends | | | 2,829 | | | | 44,295 | | | | — | | | | — | |
Shares repurchased | | | (197,747 | ) | | | (3,041,477 | ) | | | (8,644 | ) | | | (107,188 | ) |
Redemption fees received** | | | — | | | | 360 | | | | — | | | | 153 | |
| | | | | | | | | | | | | | | | |
| | | | |
Net Increase (Decrease) | | | 799,979 | | | $ | 12,438,581 | | | | 1,211,139 | | | $ | 15,240,196 | |
| | | | | | | | | | | | | | | | |
| * | Fund commenced operations on December 16, 2009. |
| ** | The Fund charges a redemption fee of 1% of the Class A and Class I shares redeemed or exchanged within 30 days of purchase. Redemption fees charged to any class are allocated to all classes upon receipt of payment based on relative net asset values of each class or other appropriate allocation methods. |
NOTE 5 – SECURITIES TRANSACTIONS
For the six months ended March 31, 2011, the Fund had purchase and sale transactions of investment securities (excluding short-term investments) of $64,493,956 and $33,364,978, respectively.
NOTE 6 – INCOME TAXES
At March 31, 2011, information on the tax components of capital is as follows:
| | | | |
Cost of investments for tax purposes | | $ | 59,912,463 | |
| | | | |
Gross unrealized appreciation on a tax basis | | $ | 7,505,527 | |
Gross unrealized depreciation on a tax basis | | | (1,099,452 | ) |
| | | | |
Net unrealized appreciation (depreciation) on investments (tax basis) | | $ | 6,406,075 | |
| | | | |
At March 31, 2011, the Fund had deferred tax basis currency and capital losses occurring subsequent to inception date of December 16, 2009 of $74,446 and $263,709 respectively. For tax purposes, such losses will be reflected in the year ending September 30, 2011.
Certified Semi-Annual Report 19
| | |
| NOTES TO FINANCIAL STATEMENTS, CONTINUED | | |
| |
| Thornburg Developing World Fund | | March 31, 2011 (Unaudited) |
NOTE 7 – DERIVATIVE FINANCIAL INSTRUMENTS WITH OFF-BALANCE SHEET RISK AND FOREIGN INVESTMENT RISK
The Fund may use a variety of derivative financial instruments to hedge or adjust the risks affecting its investment portfolio or to enhance investment returns. Provisions of FASB Accounting Standards Codification ASC 815-10-50 (“ASC 815”) require certain disclosures. The disclosures are intended to provide users of financial statements with an understanding of the use of derivative instruments by the Fund and how these derivatives affect the financial position, financial performance and cash flows of the Fund. The Fund does not designate any derivative instruments as hedging instruments under ASC 815. During the six months ended March 31, 2011, the Fund did not invest in any derivative financial instruments of the type addressed by ASC 815.
OTHER NOTES
Fund management believes no events have occurred between March 31, 2011 and May 20, 2011, the date of issuance of the financial statements, which require adjustment of, or disclosure in, the accompanying financial statements.
20 Certified Semi-Annual Report
This page intentionally left blank.
Certified Semi-Annual Report 21
| | |
| FINANCIAL HIGHLIGHTS | | |
| |
| Thornburg Developing World Fund | | |
| | | | | | | | | | | | | | | | | | | | | | | | | | | | | | | | | | | | | | | | | | | | | | | | | | | | | | | | | | | | |
| | | PER SHARE PERFORMANCE (for a share outstanding throughout the period)+ | | | RATIOS TO AVERAGE N ET ASSETS | | | SUPPLEMENTAL DATA | |
Unless
Otherwise
Noted, Periods
are Fiscal Years
Ended Sept. 30, | | Net Asset
Value
Beginning
of Period | | | Net
Investment
Income
(Loss) | | | Net
Realized
& Unrealized
Gain (Loss)
on
Investments | | | Total from
Investment
Operations | | | Dividends
from Net
Investment
Income | | | Dividends
from Net
Realized
Gains | | | Total
Dividends | | | Net
Asset
Value
End of
Period | | | Net
Investment
Income
(Loss) (%) | | | Expenses,
After
Expense
Reductions
(%) | | | Expenses,
After
Expense
Reductions
and Net of
Custody
Credits
(%) | | | Expenses,
Before
Expense
Reductions
(%) | | | Total
Return
(%)(a) | | | Portfolio
Turnover
Rate (%) | | | Net Assets
at End of
Period
(Thousands) | |
Class A Shares | | | | | | | | | | | | | | | | | | | | | | | | | | | | | | | | | | | | | | | | | | | | | | | | | | | | | | | | | | | | |
2011(b)(c) | | $ | 14.44 | | | | (0.07 | ) | | | 1.45 | | | | 1.38 | | | | (0.02 | ) | | | — | | | | (0.02 | ) | | $ | 15.80 | | | | (0.91 | )(d) | | | 1.66 | (d) | | | 1.65 | (d) | | | 1.83 | (d) | | | 9.54 | | | | 66.22 | | | $ | 28,000 | |
2010(c)(e) | | $ | 11.94 | | | | 0.06 | | | | 2.44 | | | | 2.50 | | | | — | | | | — | | | | — | | | $ | 14.44 | | | | 0.55 | (d) | | | 1.83 | (d) | | | 1.82 | (d) | | | 3.30 | (d) | | | 20.94 | | | | 47.37 | | | $ | 14,116 | |
Class C Shares | | | | | | | | | | | | | | | | | | | | | | | | | | | | | | | | | | | | | | | | | | | | | | | | | | | | | | | | | | | | |
2011(b) | | $ | 14.39 | | | | (0.12 | ) | | | 1.43 | | | | 1.31 | | | | (0.01 | ) | | | — | | | | (0.01 | ) | | $ | 15.69 | | | | (1.62 | )(d) | | | 2.39 | (d) | | | 2.38 | (d) | | | 2.85 | (d) | | | 9.13 | | | | 66.22 | | | $ | 8,797 | |
2010(e) | | $ | 11.94 | | | | (0.01 | ) | | | 2.46 | | | | 2.45 | | | | — | | | | — | | | | — | | | $ | 14.39 | | | | (0.11 | )(d) | | | 2.39 | (d) | | | 2.38 | (d) | | | 6.89 | (d) | | | 20.52 | | | | 47.37 | | | $ | 2,889 | |
Class I Shares | | | | | | | | | | | | | | | | | | | | | | | | | | | | | | | | | | | | | | | | | | | | | | | | | | | | | | | | | | | | |
2011(b) | | $ | 14.52 | | | | (0.03 | ) | | | 1.45 | | | | 1.42 | | | | (0.03 | ) | | | — | | | | (0.03 | ) | | $ | 15.91 | | | | (0.35 | )(d) | | | 1.10 | (d) | | | 1.09 | (d) | | | 1.46 | (d) | | | 9.82 | | | | 66.22 | | | $ | 32,000 | |
2010(e) | | $ | 11.94 | | | | 0.11 | | | | 2.47 | | | | 2.58 | | | | — | | | | — | | | | — | | | $ | 14.52 | | | | 1.09 | (d) | | | 1.10 | (d) | | | 1.09 | (d) | | | 2.63 | (d) | | | 21.61 | | | | 47.37 | | | $ | 17,581 | |
| (a) | Not annualized for periods less than one year. |
| (b) | Unaudited Six Month Period Ended March 31. |
| (c) | Sales loads are not reflected in computing total return. |
| (e) | Fund commenced operations on December 16, 2009. |
| + | Based on weighted average shares outstanding. |
See notes to financial statements.
| | |
| 22 Certified Semi-Annual Report | | Certified Semi-Annual Report 23 |
| | |
| EXPENSE EXAMPLE | | |
| |
| Thornburg Developing World Fund | | March 31, 2011 (Unaudited) |
As a shareholder of the Fund, you incur two types of costs:
| | (1) | transaction costs, including |
(a) sales charges (loads) on purchase payments for Class A shares;
(b) a deferred sales charge on redemptions of any part or all of a purchase of $1 million of Class A shares within 12 months of purchase;
(c) a deferred sales charge on redemptions of Class C shares within 12 months of purchase;
(d) a 30-day redemption fee on Class A and Class I shares;
| | (2) | ongoing costs, including management fees; distribution and/or service (12b-1) fees; and other Fund expenses. |
This example is intended to help you understand your ongoing costs (in dollars) of investing in the Fund and to compare these costs with the ongoing costs of investing in other mutual funds.
The example is based on a $1,000 investment beginning on October 1, 2010, and held until March 31, 2011.
ACTUAL EXPENSES
For each class of shares, the first line of the table at right provides information about actual account values and actual expenses. You may use the information in this line, together with the amount you invested, to estimate the expenses that you paid over the period. Simply divide your account value by $1,000 (for example, an $8,600 account value divided by $1,000 = 8.6), then multiply the result by the number in the first line for your class of shares under the heading entitled “Expenses Paid During Period” to estimate the expenses you paid on your account during this period.
HYPOTHETICAL EXAMPLE FOR COMPARISON PURPOSES
For each class of shares, the second line of the table at right provides information about hypothetical account values and hypothetical expenses based on the Fund’s actual expense ratio and an assumed rate of return of 5% per year before expenses, which is not the Fund’s actual return. The hypothetical account values and expenses may not be used to estimate the actual ending account balance or expenses you paid for the period. You may use this information to compare the ongoing costs of investing in the Fund and other funds. To do so, compare this 5% hypothetical example with the 5% hypothetical examples that appear in the shareholder reports of the other funds.
Please note that the expenses shown in the table are meant to highlight your ongoing costs only and do not reflect any transactional costs, such as sales charges (loads), redemption fees, or exchange fees. Therefore, the second line of the table for each class of shares is useful in comparing ongoing costs only, and will not help you determine the relative total costs of owning different funds. In addition, if these transactional costs were included, your costs would have been higher.
| | | | | | | | | | | | |
| | | Beginning
Account Value
10/1/10 | | | Ending
Account Value
3/31/11 | | | Expenses Paid
During Period†
10/1/10–3/31/11 | |
Class A Shares | | | | | | | | | | | | |
Actual | | $ | 1,000.00 | | | $ | 1,095.40 | | | $ | 8.64 | |
Hypothetical* | | $ | 1,000.00 | | | $ | 1,016.68 | | | $ | 8.32 | |
Class C Shares | | | | | | | | | | | | |
Actual | | $ | 1,000.00 | | | $ | 1,091.30 | | | $ | 12.41 | |
Hypothetical* | | $ | 1,000.00 | | | $ | 1,013.06 | | | $ | 11.94 | |
Class I Shares | | | | | | | | | | | | |
Actual | | $ | 1,000.00 | | | $ | 1,098.20 | | | $ | 5.70 | |
Hypothetical* | | $ | 1,000.00 | | | $ | 1,019.50 | | | $ | 5.49 | |
| † | Expenses are equal to the annualized expense ratio for each class (A: 1.65%; C: 2.38%; I: 1.09%) multiplied by the average account value over the period, multiplied by 182/365 to reflect the one-half year period. |
| * | Hypothetical assumes a rate of return of 5% per year before expenses. |
24 Certified Semi-Annual Report
| | |
| INDEX COMPARISON | | |
| |
| Thornburg Developing World Fund | | March 31, 2011 (Unaudited) |
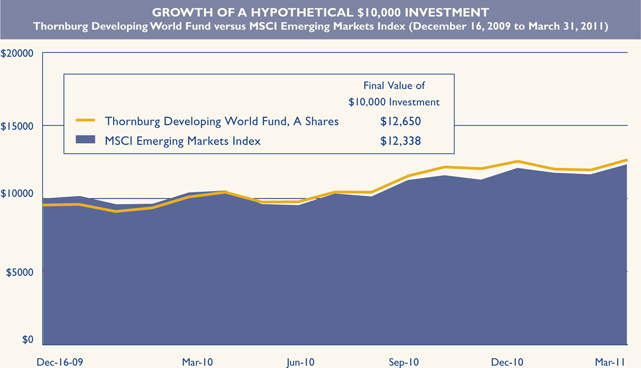
AVERAGE ANNUAL TOTAL RETURNS
For periods ended March 31, 2011 (with sales charge)
| | | | | | | | | | | | | | | | |
| | | 1 Yr | | | 5 Yrs | | | 10 Yrs | | | Since
Inception | |
A Shares (Incep: 12/16/09) | | | 19.47 | % | | | — | | | | — | | | | 20.06 | % |
C Shares (Incep: 12/16/09) | | | 23.34 | % | | | — | | | | — | | | | 23.71 | % |
I Shares (Incep: 12/16/09) | | | 25.85 | % | | | — | | | | — | | | | 25.19 | % |
MSCI Emerging Markets Index (Since 12/16/09) | | | 18.46 | % | | | — | | | | — | | | | 17.72 | % |
Performance data shown represents past performance and is no guarantee of future results. Investment return and principal value will fluctuate so shares, when redeemed, may be worth more or less than their original cost. Current performance may be lower or higher than quoted. For performance current to the most recent month end, visit thornburg.com or call 800.847.0200. The performance data and graph do not reflect the deduction of taxes that a shareholder would pay on distributions or the redemption of Fund shares. Returns reflect the reinvestment of dividends and capital gains as well as applicable sales charges. Class A shares are sold with a maximum sales charge of 4.50%. Class C shares are subject to a 1% CDSC for the first year only. There is no up-front sales charge for Class I shares. Class A and I shares are subject to a 1% 30-day redemption fee.
Certified Semi-Annual Report 25
| | |
| OTHER INFORMATION | | |
| |
| Thornburg Developing World Fund | | March 31, 2011 (Unaudited) |
PORTFOLIO PROXY VOTING
Policies and Procedures:
The Trust has delegated to Thornburg Investment Management, Inc. (the “Advisor”) voting decisions respecting proxies for the Fund’s voting securities. The Advisor makes voting decisions in accordance with its Proxy Voting Policy and Procedures. A description of the Policy and Procedures is available (i) without charge, upon request, by calling the Advisor toll-free at 1-800-847-0200, (ii) on the Thornburg web site at www.thornburg.com, and (iii) on the Securities and Exchange Commission’s web site at www.sec.gov.
Information regarding how proxies were voted is currently available for the period from the Fund’s commencement of investment operations on December 16, 2009 through June 30, 2010, and will hereafter be available on or before August 31 of each year for the twelve months ending the preceding June 30. This information is available (i) without charge, upon request by calling the Advisor toll-free at 1-800-847-0200, (ii) on the Thornburg web site at www.thornburg.com, and (iii) on the Securities and Exchange Commission’s web site at www.sec.gov.
AVAILABILITY OF QUARTERLY PORTFOLIO SCHEDULE
The Fund files with the Securities and Exchange Commission schedules of its portfolio holdings on Form N-Q for the first and third quarters of each fiscal year. The Fund’s Forms N-Q are available on the Commission’s web site at www.sec.gov, or may be reviewed and copied at the Commission’s Public Reference Room in Washington, D.C. Information on the operation of the Public Reference Room may be obtained by calling 1-800-SEC-0330. The Fund also makes this information available on its web site at www.thornburg. com/download or upon request by calling 1-800-847-0200.
26 Certified Semi-Annual Report
Trustees’ Statement to Shareholders
Not part of the Certified Semi-Annual Report
February 8, 2005, as readopted September 13, 2010
The Trustees are concerned that ongoing commentaries and opinions reported in the media may confuse investors in general as to the supervisory duties of trustees of mutual funds and, in particular, leave Thornburg Investment Trust shareholders uncertain regarding how we discharge our responsibilities in supervising the Funds’ investment advisor and in reviewing the advisor’s contract for renewal. We decided to spell out clearly three principal guidelines that we follow in supervising the Trust’s investment advisor on your behalf.
We begin with the premise that each shareholder selected his or her Fund because its investments are managed by the investment advisor identified in the prospectus and in accordance with the objective and policies described in the prospectus. We realize, as each of you do, that if you believe that your Fund’s stated objective and policies no longer serve your personal investment goals, you can sell your shares and leave the Fund.
Therefore, we believe that our primary supervisory task – our principal obligation to you – is to assess the nature and quality of the advisor’s services, and to confirm that the advisor actively and competently pursues the Fund’s objective, in accordance with the policies set out in the prospectus. To do this, we meet regularly with management to review your Fund’s portfolio and to discuss the advisor’s specific actions and judgments in pursuing the Fund’s objective. We do not substitute our own judgment for the advisor’s decisions in selecting investments; the advisor is paid to exercise its informed judgment on investment decisions, and we seek to confirm, in reviewing the advisor’s performance, that the advisor is doing just that.
Second, while we are conscious of costs and the effect that costs have on shareholders’ returns, we do not seek the lowest fees or expense ratio as our sole or primary objective. We try to make sure that your Fund’s fees and costs are reasonable in relationship to the services rendered and that they are generally in line with those charged by other expert investment advisors, consistent with our belief that the Fund’s investors searched for and expect that expertise and attention and have decided to pay a reasonable price for it. We do not put the management contract “out to bid” as a matter of course, and we would not do so unless we had concluded that the advisor materially had failed to pursue the Fund’s objectives in accordance with its policies, or for other equally important reasons. We believe that any other approach would be inconsistent with your interests and contrary to your expectations when you bought shares of the Fund in the first place.
Finally, because we believe that most Thornburg Fund shareholders have invested with a long-term perspective, we try not to focus too much on the fashions of the moment and on short-term performance. The market will not favor any specific investment objective or set of policies at all times and under all economic circumstances. A fund will experience periods of both high and low returns relative to other funds and other investments. Even if one of our Funds is not favored by the market at a particular time, we believe that the advisor is nonetheless obliged to remain true to the Fund’s objective and policies, and we watch to see that it does so.
This page is not part of the Semi-Annual Report. 27
This page intentionally left blank.
28 This page is not part of the Semi-Annual Report.
Retirement and Education Accounts
Thornburg Investment Management offers retirement and education savings accounts that can help you meet a variety of planning challenges. For account applications or further information on any of the accounts below, please call 1-800-847-0200 or go to www.thornburg.com/ira. Your financial advisor can help you determine which plan is right for you.
Individual Retirement Accounts
Individual Retirement Accounts (IRAs) provide a tax-advantaged means to save money for the future. For a detailed outline of the difference between retirement accounts, see www.thornburg.com/ira. Rollovers are available. Call 1-800-847-0200 for more information.
Traditional IRAs – Contributions to Traditional IRAs are tax deductible for eligible individuals, and withdrawals are taxed as additional ordinary income. You may contribute to an IRA if you receive compensation and are under 70 1/2, even if you are covered by an employer retirement plan. Deductible contributions are subject to certain qualifications. Please consult your tax advisor.
Roth IRAs – Under a Roth IRA, there is no tax deduction for contributions, but there is no income tax on qualified withdrawals. For a more detailed comparison of Traditional and Roth IRAs, please see our web site at www.thornburg.com/ira.
SEP IRAs – Simplified Employee Pension (SEP) IRAs are established by employers. The employer is allowed a tax deduction for contributions made to the SEP Plan and makes contributions to each eligible employee’s SEP IRA on a discretionary basis.
SIMPLE IRAs – Savings Incentive Match Plan for Employees of Small Employers (SIMPLE) is designed to give small business owners a simplified method to establish and contribute to a retirement plan for employees. The employer is allowed a tax deduction for contributions and makes either matching or non-elective contributions to each eligible employee’s SIMPLE IRA. Employees may make salary deferral contributions.
Coverdell Education Savings Account
These savings accounts are designed to provide a way to save money for higher education expenses. In an Education Savings Account, earnings and interest grow tax-free, and qualified withdrawals used to pay for eligible higher-education expenses are tax- and penalty-free.
Funds Available
The following funds are available in the accounts listed above:
| | • | | Thornburg International Value Fund |
| | • | | Thornburg Core Growth Fund |
| | • | | Thornburg Investment Income Builder Fund |
| | • | | Thornburg Global Opportunities Fund |
| | • | | Thornburg International Growth Fund |
| | • | | Thornburg Developing World Fund |
| | • | | Thornburg Limited Term U.S. Government Fund |
| | • | | Thornburg Limited Term Income Fund |
| | • | | Thornburg Strategic Income Fund |
This page is not part of the Semi-Annual Report. 29

Thornburg Equity Funds
Thornburg’s equity research uses a fundamental and comprehensive analytical approach. Thornburg equity funds focus on a limited number of securities so that each holding can impact performance. The equity team searches for firms believed to have a promising future and seeks to buy shares of those companies at a discount to their intrinsic value.
| | • | | Thornburg International Value Fund |
| | • | | Thornburg Core Growth Fund |
| | • | | Thornburg Investment Income Builder Fund |
| | • | | Thornburg Global Opportunities Fund |
| | • | | Thornburg International Growth Fund |
| | • | | Thornburg Developing World Fund |
Thornburg Bond Funds
Thornburg Investment Management applies a disciplined philosophy to fixed-income management. Since the launch of our first fixed-income fund over 25 years ago, we have been conducting fundamental, bottom-up research in an effort to identify bonds which we believe provide the best return for a given level of risk. We are very organic in our approach, avoiding leverage or complex strategies which could backfire in periods of market uncertainty.
| | • | | Thornburg Limited Term Municipal Fund |
| | • | | Thornburg Intermediate Municipal Fund |
| | • | | Thornburg California Limited Term Municipal Fund |
| | • | | Thornburg New Mexico Intermediate Municipal Fund |
| | • | | Thornburg New York Intermediate Municipal Fund |
| | • | | Thornburg Strategic Municipal Income Fund |
| | • | | Thornburg Limited Term U.S. Government Fund |
| | • | | Thornburg Limited Term Income Fund |
| | • | | Thornburg Strategic Income Fund |
Before investing, carefully consider the Fund’s investment goals, risks, charges, and expenses. For a prospectus containing this and other information, contact your financial advisor or visit thornburg. com. Read it carefully before investing.
For additional information, please visit www.thornburg.com
Thornburg Investment Management, Inc. 2300 North Ridgetop Road, Santa Fe, NM 87506
This page is not part of the Semi-Annual Report. 31
| | | | | | |
 | | Waste not, | |  |
| | Wait not | |
| | | | Get instant access to your shareholder reports. |
| | |
| | This Semi-Annual Report is submitted for the general information of shareholders of the Fund. It is not authorized for distribution to prospective investors in the Fund unless preceded or accompanied by an effective prospectus. | | By switching from your postal mailbox to your email inbox, you reduce paper clutter, improve record keeping access, and help conserve our natural resources. |
 | | Investment Advisor: | | Go to www.thornburg.com/edelivery and sign up to receive your shareholder reports, prospectuses, and proxy statements electronically. |
| | Thornburg Investment Management® 800.847.0200 | |
| | Distributor: | | |
| | Thornburg Securities Corporation® 800.847.0200 | | You invest in the future, without spending a dime. |
| | TH2148 | | |
Not applicable.
| Item 3. | Audit Committee Financial Expert |
Not applicable.
| Item 4. | Principal Accountant Fees and Services |
Not applicable.
| Item 5. | Audit Committee of Listed Registrants |
Not applicable.
| Item 6. | Schedule of Investments |
Filed as part of the reports to shareholders filed under item 1 of this Form.
| Item 7. | Disclosure of Proxy Voting Policies and Procedures for Closed-End Management Investment Companies |
Not applicable.
| Item 8. | Portfolio Managers of Closed-End Management Investment Companies |
Not applicable.
| Item 9. | Purchases of Equity Securities by Closed-End Management Investment Companies and Affiliated Purchasers. |
Not applicable.
| Item 10. | Submission of Matters to a Vote of Security Holders |
The authority to consider candidates recommended by the shareholders in accordance with the Trust’s Procedures for Shareholder Communications is committed to the Governance and Nominating Committee.
| Item 11. | Controls and Procedures |
(a) The principal executive officer and the principal financial officer have concluded that Thornburg Investment Trust’s disclosure controls and procedures provide reasonable assurance that material information relating to Thornburg Investment Trust is made known to them by the appropriate persons, based on their evaluation of these controls and procedures as of a date within 90 days prior to the filing date of this report.
(b) There was no change in Thornburg Investment Trust’s internal control over financial reporting that occurred during the registrant’s second fiscal quarter of the period covered by this report (that is, the registrant’s second fiscal quarter) that has materially affected, or is reasonably likely to materially affect, the registrant’s internal control over financial reporting.
| (a) | (2) Certifications pursuant to Rule 30a-2(a) under the Investment Company Act of 1940 (17 CFR 70.30a-2(a)) attached hereto as Exhibit 99.CERT. |
| (b) | Certification pursuant to Section 906 of the Sarbanes-Oxley Act of 2002 and Rule 30a-2(b) under the Investment Company Act of 1940 (17 CFR 70.30a-2(b)) attached hereto as Exhibit 99.906CERT. |
SIGNATURES
Pursuant to the requirements of the Securities Exchange Act of 1934 and the Investment Company Act of 1940, the registrant has duly caused this report to be signed on its behalf by the undersigned, thereunto duly authorized.
Thornburg Investment Trust, in respect of the following Thornburg Funds: Limited Term Municipal Fund, Intermediate Municipal Fund, Strategic Municipal Income Fund, California Limited Term Municipal Fund, New Mexico Intermediate Municipal Fund, New York Intermediate Municipal Fund, Limited Term U.S. Government Fund, Limited Term Income Fund, Strategic Income Fund, Value Fund, International Value Fund, Core Growth Fund, International Growth Fund, Investment Income Builder Fund, Global Opportunities Fund, and Developing World Fund.
| | |
| |
| By: | | /s/ Brian J. McMahon |
| | Brian J. McMahon President and principal executive officer |
| Date: | | May 20, 2011 |
Pursuant to the requirements of the Securities Exchange Act of 1934 and the Investment Company Act of 1940, this report has been signed below by the following persons on behalf of the registrant and in the capacities and on the dates indicated.
| | |
| |
| By: | | /s/ Brian J. McMahon |
| | Brian J. McMahon President and principal executive officer |
| Date: | | May 20, 2011 |
| | |
| |
| By: | | /s/ George T. Strickland |
| | George T. Strickland Treasurer and principal financial officer |
| Date: | | May 20, 2011 |