UNITED STATES
SECURITIES AND EXCHANGE COMMISSION
Washington, D.C. 20549
FORM N-CSR
CERTIFIED SHAREHOLDER REPORT OF REGISTERED MANAGEMENT INVESTMENT
COMPANIES
Investment Company Act file number 811-05201
Thornburg Investment Trust
(Exact name of registrant as specified in charter)
c/o Thornburg Investment Management, Inc.
2300 North Ridgetop Road, Santa Fe, New Mexico 87506
(Address of principal executive offices) (Zip code)
Garrett Thornburg, 2300 North Ridgetop Road, Santa Fe, New Mexico 87506
(Name and address of agent for service)
Registrant’s telephone number, including area code: 505-984-0200
Date of fiscal year end: September 30, 2014
Date of reporting period: March 31, 2014
Item 1. Reports to Stockholders
The following annual reports are attached hereto, in order:
Thornburg Low Duration Municipal Fund
Thornburg Limited Term Municipal Fund
Thornburg Intermediate Municipal Fund
Thornburg Strategic Municipal Income Fund
Thornburg California Limited Term Municipal Fund
Thornburg New Mexico Intermediate Municipal Fund
Thornburg New York Intermediate Municipal Fund
Thornburg Low Duration Income Fund
Thornburg Limited Term Income Funds
Thornburg Strategic Income Fund
Thornburg Value Fund
Thornburg International Value Fund
Thornburg Core Growth Fund
Thornburg International Growth Fund
Thornburg Investment Income Builder Fund
Thornburg Global Opportunities Fund
Thornburg Developing World Fund

2 This page is not part of the Semi-Annual Report
IMPORTANT INFORMATION
The information presented on the following pages is current as of March 31, 2014. The managers’ views, portfolio holdings, and sector diversification are provided for the general information of the Fund’s shareholders; to the extent this information is historical, it should not be considered predictive of future circumstances. This material should not be deemed a recommendation to buy or sell any of the securities mentioned.
Investments in the Fund carry risks, including possible loss of principal. Bond funds have the same interest rate, inflation, and credit risks that are associated with the underlying bonds. The principal value of bonds will fluctuate relative to changes in interest rates, decreasing when interest rates rise. Unlike bonds, bond funds have ongoing fees and expenses. Please see the Fund’s Prospectus for a discussion of the risks associated with an investment in the Fund. Investments in the Fund are not FDIC insured, nor are they deposits of or guaranteed by a bank or any other entity. There is no guarantee that the Fund will meet its investment objectives. Diversification does not assure or guarantee better performance and cannot eliminate the risk of investment losses. The laddering strategy does not assure or guarantee better performance and cannot eliminate the risk of investment losses.
Performance data given at net asset value (NAV) does not take into account applicable sales charges. If the sales charges had been included, the performance would have been lower.
Minimum investments for Class I shares are higher than those for other classes. Class I shares may not be available to all investors.
| | | | |
Share Class | | NASDAQ Symbol | | CUSIP |
Class A | | TLMAX | | 885-216-788 |
Class I | | TLMIX | | 885-216-770 |
Glossary
Bloomberg Economic Evaluation of States (BEES) Index – A survey, updated quarterly, that examines the pace of states’ growth following the 18-month recession that officially ended in June 2009.
Bloomberg State Stock Indices – Capitalization-weighted indices consisting of equities domiciled in each state.
BofA Merrill Lynch 1-3 Year Municipal Securities Index – An index that is a subset of the BofA Merrill Lynch U.S. Municipal Securities Index including all securities with a remaining term to final maturity less than 3 years.
Consumer Price Index (CPI) – Index that measures prices of a fixed basket of goods bought by a typical consumer, including food, transportation, shelter, utilities, clothing, medical care, entertainment and other items. The CPI, published by the Bureau of Labor Statistics in the Department of Labor, is based at 100 in 1982 and is released monthly. It is widely used as a cost-of-living benchmark to adjust Social Security payments and other payment schedules, union contracts and tax brackets. Also known as the cost-of-living index.
Unless otherwise noted, index returns reflect the reinvestment of income dividends and capital gains, if any, but do not reflect fees, brokerage commissions or other expenses of investing. Investors may not make direct investments into any index.
Annualized Distribution Yield – The distribution yield reflects actual distributions made to shareholders. The annualized distribution yield is calculated by summing the last 30 days of income at a given month end and annualizing to a 360-day year. The result is divided by the ending maximum offering price.
Barbell Structure – A bond investment strategy that concentrates holdings in shorter-term and longer-term maturities, forming a structure that resembles a barbell.
Basis Point (bp) – A unit equal to 1/100th of 1%. 1% = 100 basis points (bps).
Bond Credit Ratings – A bond credit rating assesses the financial ability of a debt issuer to make timely payments of principal and interest. Ratings of AAA (the highest), AA, A, and BBB are investment-grade quality. Ratings of BB, B, CCC, CC, C, and D (the lowest) are considered below investment grade, speculative grade, or junk bonds. Unless otherwise noted, the ratings listed are from Municipal Market Data and are a combination of ratings from Standard and Poor’s, Moody’s Investors Service, and Fitch Ratings.
Bullet Structure – A bond investment strategy that concentrates holdings in intermediate-term maturities and avoids shorter-term or longer-term maturities.
Credit Spread/Quality Spread – The difference between the yields of securities with different credit qualities.
Duration – A bond’s sensitivity to interest rates. Bonds with longer durations experience greater price volatility than bonds with shorter durations.
Effective Duration – A bond’s sensitivity to interest rates, incorporating the embedded option features, such as call provisions. Bonds with longer durations experience greater price volatility than bonds with shorter durations.
Fed Funds Rate – The interest rate at which a depository institution lends immediately available funds (balances at the Federal Reserve) to another depository institution overnight.
General Obligation Bond – A municipal bond backed by the credit and “taxing power” of the issuing jurisdiction rather than the revenue from a given project.
Gross Domestic Product (GDP) – A country’s income minus foreign investments: the total value of all goods and services produced within a country in a year, minus net income from investments in other countries.
Participation Rate – The number of people who are either employed or are actively looking for work. The people who are no longer actively searching for work would not be included in the participation rate. During an economic recession, many workers often get discouraged and stop looking for employment, as a result, the participation rate decreases.
Quantitative Easing – The Federal Reserve’s monetary policy intended to stimulate the U.S. economy following the recession that began in 2007/08.
Quantitative Easing 3 (QE3) – The third round of the Federal Reserve’s monetary policy intended to stimulate the U.S. economy following the recession that began in 2007/08. Announced in September 2012 and revised in December 2012, December 2013, and January 2014, the Fed intends to buy $65 billion in mortgage-backed securities and Treasuries each month until the economy improves.
SEC Yield – SEC yield is computed in accordance with SEC standards measuring the net investment income per share over a specified 30-day period expressed as a percentage of the maximum offering price of the Fund’s shares at the end of the period.
Yield Curve – A line that plots the interest rates, at a set point in time, of bonds having equal credit quality, but differing maturity dates.
This page is not part of the Semi-Annual Report 3
THORNBURG LOW DURATION MUNICIPAL FUND
Laddering – an All Weather Strategy
The newest addition to Thornburg’s municipal fund line-up is Thornburg Low Duration Municipal Fund. The Fund pursues its primary goal by investing principally in a laddered maturity portfolio of municipal obligations issued by states and state agencies, local governments and their agencies and by certain United States territories and possessions. Thornburg Investment Management actively manages the Fund’s portfolio.
In our opinion, current market conditions have created an ideal situation in which to launch this strategy. Because the magnitude of changes in value of interest-bearing obligations is greater for obligations with longer durations, given an equivalent change in interest rates, the Fund seeks to reduce changes in its share value compared to longer duration fixed income portfolios by maintaining a portfolio of investments with a dollar-weighted average duration of normally no more than three years. The Fund also attempts to reduce changes in its share value through credit analysis, selection, and diversification.
At Thornburg, our approach to management of the Fund is based on the premise that investors in the Fund seek preservation of capital along with an attractive, relatively stable yield. While aggressive bond strategies may generate stronger returns when the market is turning a blind eye towards risk, they often fail to stack up over longer periods of time.
We apply these techniques to manage risk and pursue attractive returns:
| | • | | Building a laddered portfolio. Laddering has been shown over time to mitigate reinvestment and interest rate risk. |
| | • | | Conducting in-depth fundamental research on each issue and actively monitoring positions for subsequent credit events. |
| | • | | Diversifying among a large number of generally high-quality bonds. |
| | • | | Investing on a cash-only basis without using leverage. |
Portfolio Managers

Josh Gonze Chris Ryon, CFA
Objectives
The Fund seeks current income exempt from federal income taxes, consistent with preservation of capital.
Average Annual Total returns
For Periods Ended March 31, 2014
| | | | | | | | | | | | | | | | | | | | |
| | | 1 Yr | | | 3 Yrs | | | 5 Yrs | | | 10 Yrs | | | Since
Inception | |
A Shares (Incep: 12/30/13) | | | | | | | | | | | | | | | | | | | | |
Without sales charge | | | — | | | | — | | | | — | | | | — | | | | 0.06 | % |
With sales charge | | | — | | | | — | | | | — | | | | — | | | | -1.46 | % |
Performance data shown represents past performance and is no guarantee of future results. Investment return and principal value will fluctuate so shares, when redeemed, may be worth more or less than their original cost. Current performance may be lower or higher than quoted. For performance current to the most recent month end, visit thornburg.com or call 800.847.0200.
The maximum sales charge for the Fund’s Class A shares is 1.50%. The total annual fund operating expense of Class A shares is 1.73%, as disclosed in the most recent Prospectus. Thornburg Investment Management and Thornburg Securities Corporation have contractually agreed to waive fees and reimburse expenses until at least February 1, 2015, so that actual expenses for Class A shares do not exceed 0.70%.
30-Day Yields, A Shares
As of March 31, 2014
| | | | |
Annualized Distribution Yield | | | 0.18 | % |
SEC Yield | | | 0.42 | % |
Without fee waivers and expense reimbursements, the 30-day SEC Yield would have been negative 1.58% and the Annualized Distribution Yield would have been negative 1.81%.
Key Portfolio Attributes
As of March 31, 2014
| | | | |
Number of Bonds | | | 38 | |
| |
Effective Duration | | | 1.5Yrs | |
| |
Average Maturity | | | 1.6Yrs | |
See the entire portfolio in the Schedule of Investments beginning on page 11.
4 This page is not part of the Semi-Annual Report
THORNBURG’S SUITE OF MUNICIPAL FUNDS
Municipal Funds for a Range of Interest-Rate Scenarios
At Thornburg, we often say that predicting interest rates is a fool’s game. And with the Federal Reserve still heavily involved in the markets, it’s even more difficult to forecast how rates may rise than when they may rise. Will long rates rise first and short rates follow? Will long and short rates climb simultaneously?
A traditional strategy to protect oneself against interest-rate risk is to move into shorter-duration bond strategies. But the seemingly counterintuitive response of moving to longer-duration strategies can sometimes yield better results.
Diversify Across the Yield Curve
This uncertainty points to why it’s important for investors to match their investment horizon to the duration of the strategy in which they’re invested, and to diversify assets across the yield curve.
For any interest-rate scenario, Thornburg’s comprehensive suite of municipal funds gives prudent investors the ability to diversify across the yield curve.
Diversify Across the Yield Curve with Thornburg Municipal Funds
AAA General Obligation Municipal Yield Curve, as of April 2, 2014


| | | | | | | | |
| | | Low Duration
Municipal Fund | | Limited Term
Municipal Funds | | Intermediate
Municipal Funds | | Strategic Municipal
Income Fund |
Maturity Range (yrs) | | 1-5 | | 1-10 | | 1-20 | | 1-30 |
| | | | |
Portfolio Structure | | Laddered | | Laddered | | Laddered | | Flexible |
| | | | |
Credit Quality | | Investment Grade | | Investment Grade | | Investment Grade | | Flexible
(Maximum of 50%
below investment grade) |
| | | | |
Objective | | Seeks current income
exempt from federal
income taxes,
consistent with
preservation of
capital | | Primary:
Obtain as high a level of current
income exempt from individual
income tax as is consistent with
preservation of capital Secondary: Reduce expected changes in
share price compared to longer
intermediate and long-term
bond portfolios | | Primary:
Obtain as high a level of current
income exempt from individual
income tax as is consistent with
preservation of capital Secondary: Reduce expected changes in
share price compared to long-
term bond portfolios | | Seeks a high level of current
income exempt from federal
individual income tax |
This page is not part of the Semi-Annual Report 5

Thornburg Low Duration Municipal Fund –
March 31, 2014
This report is certified under the Sarbanes-Oxley Act of 2002, which requires that public companies, including mutual funds, affirm that the information provided in their annual and semiannual shareholder reports fully and fairly represents their financial position and the results of their operations for the period presented.
6 Certified Semi-Annual Report
LETTER TO SHAREHOLDERS
April 15, 2014
Dear Fellow Shareholder:
We are pleased to present the semi-annual report for the Thornburg Low Duration Municipal Fund. The fund commenced operations on December 30, 2013. Therefore this “semi-annual” report will reference the first three months of operations. The net asset value (NAV) of the Class A shares remained $12.31 per share during the three months ended March 31, 2014. If you were with us for the entire period, you received dividends of 0.0799 cents per share. If you reinvested your dividends, you received 0.0800 cents per share. Dividends were higher for Class I shares to account for varying class-specific expenses. The Class A shares of your Fund underperformed the index with a total return of 0.06% at NAV for the three months ended March 31, 2014, compared to the 0.25% total return for the BofA Merrill Lynch 1-3 Year Municipal Securities Index (BAML 1-3 Year Municipal Index). The Fund generated 0.85% more price return and 1.04% less income than the index.
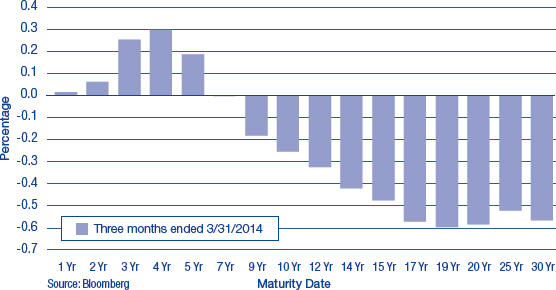
The first three months of fiscal 2014 were very interesting, as interest-rate changes went in various directions, depending on the maturity discussed. This period certainly highlighted that interest rates do not change uniformly across the entire maturity spectrum (the yield curve).
Chart I illustrates how yields changed during the period. It is good to remember the tone of the market at the end of 2013. Most market commentators believed the stock market and yields were going in the same direction: up. The blue bars show the yield changes from December 31, 2013 through March 31, 2014. Those commentators were only partially correct: the only yields to increase were those for the shortest-maturity segment of the municipal bond market. Again, yield changes were not uniform across the yield curve. This time, after new U.S. Federal Reserve Chair Janet Yellen hinted that short-term interest rates may eventually need to increase, short-term yields increased and long-term yields decreased.
Investors may wonder how best to protect themselves from these changes. One way to hedge this risk is to own securities or mutual funds that spread their investments across the different segments of the yield curve. In our opinion, that would mean owning some of our new Thornburg Low Duration Municipal Fund and our Limited Term Municipal, Intermediate Municipal, and Strategic Municipal Income Funds. The percentage ownership of each would depend on levels of risk tolerance.
Chart I: Changes in AAA General-Obligation Municipal Yield Curve
The Economy and the Federal Reserve
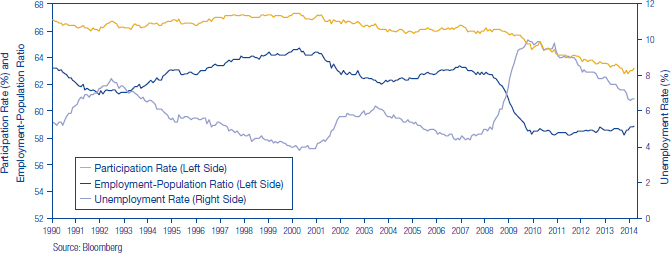
Gross domestic product (GDP) for the year ended December 31, 2013 came in at 2.6%, around its long-term average (to March 1990) of 2.5%. Additions to non-farm payroll employment have averaged about 178,000 per month for the three months ended March 31, 2014. The unemployment rate declined to 6.7%, but it has been clouded by a declining labor participation rate. The percentage of the U.S. population that is employed declined to 58.9% as of March 31, 2014, from 63.3% on March 31, 2007. The retirement of the “baby boomer” generation has certainly contributed to this decline but does not account for all of it. Chart II illustrates each of these trends from 1990.
Certified Semi-Annual Report 7
| | |
| LETTER TO SHAREHOLDERS, | | |
| |
CONTINUED | | |
Chart II: Labor Market Indicators
2/28/1990 – 3/31/2014
Inflation, the bondholder’s worst enemy, has remained well controlled in the last three months. The year-over-year change in the Consumer Price Index increased (CPI) increased to 1.5% as of March 31, 2014 from 1.2% as of December 30, 2013. Subtracting the food and energy components to arrive at the core measure presents a picture of a well-behaved, unchanged 1.7%. The economic backdrop is one of mild expansion with low inflation. The $64,000 question is, “How long can it last?”
In January 2014, Janet Yellen replaced Ben Bernanke as Fed Chair. Her appointment assured a continuation of current Fed policies. Last year, Bernanke roiled the fixed income markets by alluding to the prospect of a decrease in the Fed’s monthly purchases of Treasury and mortgage-backed securities, the tapering of QE3. Rates went up! This year, the tapering started in actuality with the Fed reducing its purchases by $10.0 billion per meeting. Rates went down! Go figure!
Chair Yellen learned that in her new position (to borrow an old E.F. Hutton advertisement tag line), “When she speaks, markets listen.” At her first news conference, Ms. Yellen tried to clarify what “for a considerable time” meant from the last Fed Statement: “This is the kind of term it’s hard to define,” Yellen said. “Probably means something on the order of six months, or that type of thing” [after QE3 tapering ends]. This sent the debt markets, especially the short-term debt markets, lower in price and higher in yield. The results can be seen in Chart I.
8 Certified Semi-Annual Report
LETTER TO SHAREHOLDERS,
CONTINUED
The Municipal Market
The long end of the municipal market has performed very well over the last three months. The short end, those maturities of five years or less, has not been so fortunate. Even with the increase in interest rates in the short end of the market, the NAV of the Thornburg Low Duration Municipal Fund did not change. Low NAV volatility is a key feature of the Fund.
Monthly outflows from municipal bond mutual funds have abated. The Investment Company Institute (ICI), an industry trade group, reported that for the last three months of calendar year 2013, municipal bond mutual funds lost an average of $6.6 billion per month. For the first three months of calendar year 2014, municipal bond mutual funds experienced $1.1 billion of inflows per month. This is not a significant amount, but at least it is positive.
These cash flows would normally not support a significantly positive return environment but when coupled with a decline in new issuance of municipal bonds, a clearer picture presents itself. The supply of new municipal bonds was down 26% for the first three months of 2014. So muted demand was met with reduce supply yielding positive results.
The overall economic health of the municipal bond market is improving, albeit unevenly. We arrive at this judgment in part through the use of the Bloomberg Economic Evaluation of States Index, which includes:
| | • | | Mortgage delinquencies – from the Mortgage Bankers Association |
| | • | | State personal income – from the Bureau of Economic Analysis |
| | • | | Tax revenue – from the U.S. Census Bureau |
| | • | | Employment – from the Bureau of Labor Statistics |
| | • | | Home prices – from the Federal Housing Finance Agency |
| | • | | Bloomberg State Stock Index |
From the fourth quarter of 2012 through the last quarter of 2013 (latest data available), the index increased on average 2.8%, ranging from a high of 8.8% to a low of negative 7.5%. For the comparable prior year period, the average was an increase of 0.2%, with a range from 9.9% to negative 4.1%. Nonetheless, state pension funds are still wrestling with some issues. The median funding level has declined from 82.6% in 2007 to 68.6% in 2012 (the Pew Center on the States suggests a funding level of 80% is adequate).
Two municipal bond market credit stories (Detroit and Puerto Rico) continue to grab headlines. In Detroit’s case, some significant settlements have been announced, but they are short on specifics, including where the new cash came from, and are dependent upon state approval. As in most Chapter 9 proceedings, one should read very little into early reports because the final results may prove very different. For example, a settlement was announced between insured bondholders and the city for a recovery of about 74% of par (a bond’s original face value); a second component of the settlement was reached with several unions for 100% of existing pension obligations and a reduction in cost-of-living adjustments. The original opening offer for these parties was 20% of par for the bondholders, and between 75% and 95% of outstanding pension obligations. It appears to us that these compromises do not address the root problems.
Puerto Rico made the news in March 2014 by successfully coming to market with the largest “junk” bond deal in municipal market history. Puerto Rico, which is now rated BB, pulled off a $3.5 billion offering, which was purchased by non-traditional market participants, i.e. hedge funds. It was a 21-year maturity bond that was priced at $93.00 to yield 8.73%. We looked at the issue very closely as a potential addition to the Thornburg Strategic Municipal Income Fund and decided not to purchase it. The deal initially traded up to around $97.00, but as of this writing (close of business April 15th) it is trading at a dollar price of $87.50, a loss of almost 6.00% from the original offering price. Thornburg Funds are among the 30% of U.S. municipal mutual funds that do not own any debt from the Commonwealth of Puerto Rico.
Certified Semi-Annual Report 9
LETTER TO SHAREHOLDERS,
CONTINUED
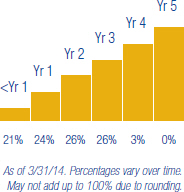
Chart III: Percent of Portfolio Maturing
Conclusion
Your Thornburg Low Duration Municipal Fund maintains a laddered portfolio structure, which was comprised of 38 municipal obligors as of March 31, 2014. We believe that this structure tends to maximize an investor’s income. In our opinion, a laddered portfolio outperforms the other structures (bullet and barbell) two-thirds of the time.1 It effectively manages a portfolio’s yield-curve exposure by owning a roughly equal weighting of each maturity, thereby minimizing a major risk factor.
We diversify our holdings across the Fund’s investment universe. Chart I illustrates that yield changes are not uniform across the Fund’s investment universe. Laddering also reduces reinvestment risk by ensuring that a portion of the portfolio matures each year so it can be reinvested. More importantly, it frees the team to concentrate on higher value-added tasks, such as fundamental, bottom-up credit research. It is just this type of research has allowed us to avoid the two largest, headline-grabbing credit issues in the municipal bond market.
This year has gotten off to a strong start. We thank you for the trust you have placed in us and will keep that foremost in our minds.
Sincerely,
| | |
 | |  |
| Christopher Ryon, CFA | | Josh Gonze |
| Portfolio Manager | | Portfolio Manager |
| Managing Director | | Managing Director |
| 1 | For a copy of the study, go to www.thornburg.com/whyladder |
The matters discussed in this report may constitute forward-looking statements made pursuant to the safe harbor provisions of the Securities Litigation Reform Act of 1995. These include any advisor or portfolio manager prediction, assessment, analysis or outlook for individual securities, industries, investment styles, market sectors and/or markets. These statements involve risks and uncertainties. In addition to the general risks described for each fund in its current prospectus, other factors bearing on these reports include the accuracy of the advisor’s or portfolio manager’s forecasts and predictions, the appropriateness of the investment strategies designed by the advisor or portfolio manager and the ability of the advisor or portfolio manager to implement their strategies efficiently and successfully. Any one or more of these factors, as well as other risks affecting the securities markets generally, could cause the actual results of any fund to differ materially as compared to its benchmarks.
10 Certified Semi-Annual Report
| | |
| SCHEDULE OF INVESTMENTS | | |
| |
Thornburg Low Duration Municipal Fund | | March 31, 2014 (Unaudited) |
SUMMARY OF SECURITY CREDIT RATINGS†
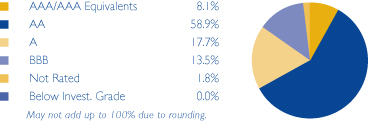
We have used ratings from Standard & Poor’s (S&P). Where S&P ratings are not available, we have used Moody’s Investors Service. Where neither rating is available, we have used ratings from Fitch Ratings. The category of investments identified as “AAA” in this graph includes investments which are pre-refunded or escrowed to maturity. Such investments are backed by an escrow or trust containing sufficient U.S. Government or U.S. Government agency securities to satisfy the timely payment of principal and interest and, therefore, are normally deemed to be equivalent to AAA-rated securities.
| | | | | | | | | | |
Issuer-Description | | Credit Rating†
S&P/ Moody’s | | Principal
Amount | | | Value | |
ARIZONA — 3.93% | | | | | | | | | | |
Pima County COP, 3.00% due 12/1/2014 (Sewer System & Fleet Services Facilities) | | A+/NR | | $ | 200,000 | | | $ | 203,736 | |
a State of Arizona COP, 5.00% due 10/1/2014 (Lease-Purchases-Various State Agency Properties; Insured: AGM) | | AA/A1 | | | 200,000 | | | | 204,724 | |
| | | |
ARKANSAS — 2.00% | | | | | | | | | | |
Jefferson County, 4.00% due 6/1/2015 (Jefferson Regional Medical Center; Insured: AGM) | | AA/NR | | | 200,000 | | | | 207,566 | |
| | | |
CALIFORNIA — 6.79% | | | | | | | | | | |
a California HFFA, 4.00% due 7/1/2016 (Children’s Hospital; Insured: AGM) | | AA/A2 | | | 200,000 | | | | 212,208 | |
California Statewide Communities Development Authority, 5.25% due 7/1/2017 (St. Joseph Health System; Insured: AGM) | | AA/A1 | | | 100,000 | | | | 112,835 | |
San Diego Redevelopment Agency, 5.00% due 9/1/2016 (Centre City Redevelopment; Insured: AMBAC) | | NR/Baa3 | | | 50,000 | | | | 53,544 | |
b Successor Agency to the Richmond County Redevelopment Agency, 4.00% due 9/1/2017 (Insured: BAM) | | AA/NR | | | 300,000 | | | | 326,622 | |
| | | |
COLORADO — 5.16% | | | | | | | | | | |
City & County of Denver Airport System, 0.28% due 11/15/2025 put 4/1/2014 (Denver International Airport; Insured: AGM; SPA: Morgan Stanley Bank) (daily demand notes) | | AA/A1 | | | 200,000 | | | | 200,000 | |
City & County of Denver GO, 3.00% due 8/1/2015 (Civic Facilities and Denver Zoological Gardens Improvements) | | AAA/Aaa | | | 200,000 | | | | 207,580 | |
Denver Convention Center Hotel Authority, 5.25% due 12/1/2014 (Insured: Syncora) | | BBB-/Baa3 | | | 125,000 | | | | 128,569 | |
| | | |
DISTRICT OF COLUMBIA — 2.10% | | | | | | | | | | |
District of Columbia, 5.00% due 4/1/2016 (National Public Radio) (ETM) | | AA-/Aa3 | | | 200,000 | | | | 217,994 | |
| | | |
FLORIDA — 4.22% | | | | | | | | | | |
Florida Higher Educational Facilities Financing Authority, 5.00% due 4/1/2015 (Nova Southeastern University) | | BBB/Baa1 | | | 200,000 | | | | 207,594 | |
Hillsborough County IDA, 5.65% due 5/15/2018 (Tampa Electric Co.) | | BBB+/A2 | | | 200,000 | | | | 230,612 | |
| | | |
GEORGIA — 2.12% | | | | | | | | | | |
City of Atlanta, 5.25% due 12/1/2016 (Atlantic Station Project; Insured: AGM) | | AA/A3 | | | 200,000 | | | | 220,570 | |
| | | |
ILLINOIS — 5.32% | | | | | | | | | | |
City of Chicago, 0.29% due 1/1/2034 put 4/1/2014 (Liquidity Facility; SPA: JPMorgan Chase Bank) (daily demand notes) | | AAA/Baa1 | | | 200,000 | | | | 200,000 | |
a Illinois Finance Authority, 4.30% due 6/1/2035 put 6/1/2016 (Peoples Gas Light & Coke Co.; Insured: AMBAC) | | A/Aa3 | | | 200,000 | | | | 214,480 | |
Town of Cicero Cook County GO, 5.00% due 1/1/2018 (Insured: AGM) | | AA/A2 | | | 125,000 | | | | 137,907 | |
| | | |
INDIANA — 4.11% | | | | | | | | | | |
b Hammond Multi-School Building Corp., 4.00% due 7/15/2017 (School City of Hammond Educational Facilities) (State Aid Withholding) | | AA+/NR | | | 300,000 | | | | 327,216 | |
Indiana Finance Authority, 0.08% due 2/1/2037 put 4/1/2014 (Stadium Project; SPA: JPMorgan Chase Bank) (dailydemand notes) | | AA+/Aa2 | | | 100,000 | | | | 100,000 | |
| | | |
IOWA — 2.00% | | | | | | | | | | |
Iowa Finance Authority, 5.00% due 2/15/2015 (Iowa Health System; Insured: AGM) | | NR/Aa3 | | | 200,000 | | | | 207,836 | |
Certified Semi-Annual Report 11
| | |
| SCHEDULE OF INVESTMENTS, CONTINUED | | |
| |
Thornburg Low Duration Municipal Fund | | March 31, 2014 (Unaudited) |
| | | | | | | | | | |
Issuer-Description | | Credit Rating†
S&p/ Moody’s | | Principal
Amount | | | Value | |
MICHIGAN — 4.24% | | | | | | | | | | |
Michigan State Hospital Finance Authority, 5.00% due 11/15/2016 (Ascension Health) | | AA+/Aa2 | | $ | 200,000 | | | $ | 222,292 | |
Michigan State Hospital Finance Authority, 5.75% due 12/1/2034 put 12/1/2015 (Trinity Health) | | AA-/Aa2 | | | 200,000 | | | | 217,650 | |
| | | |
NEVADA — 3.68% | | | | | | | | | | |
a Carson City, 4.00% due 9/1/2016 (Carson Tahoe Regional Healthcare Project) | | BBB+/NR | | | 200,000 | | | | 211,852 | |
Washoe County School District GO, 5.25% due 6/1/2017 (School Improvements; Insured: AGM) | | AA/Aa3 | | | 150,000 | | | | 169,997 | |
| | | |
NEW YORK — 2.14% | | | | | | | | | | |
Lake Placid Central School District GO, 5.00% due 6/15/2017 (Elementary, Middle/High School Projects; Insured: Natl-Re) (State Aid Withholding) | | NR/A1 | | | 200,000 | | | | 222,402 | |
| | | |
NORTH DAKOTA — 2.06% | | | | | | | | | | |
North Dakota Building Authority, 4.25% due 12/1/2015 (Various State Agency Capital Projects; Insured: Natl-Re) | | AA+/Aa2 | | | 200,000 | | | | 213,412 | |
| | | |
OHIO — 6.76% | | | | | | | | | | |
City of Cleveland, 3.00% due 10/1/2016 (Public Facilities) | | AA/A1 | | | 200,000 | | | | 211,634 | |
a County of Franklin, 4.00% due 11/15/2033 put 8/1/2016 (OhioHealth Corp. Hospital Facilities) | | AA+/Aa2 | | | 200,000 | | | | 215,166 | |
University of Toledo, 3.50% due 6/1/2016 (University Facilities Improvements) | | A+/A1 | | | 260,000 | | | | 275,192 | |
| | | |
PENNSYLVANIA — 9.11% | | | | | | | | | | |
City of Philadelphia Gas Works, 5.00% due 10/1/2017 (Insured: AMBAC) | | BBB+/Baa2 | | | 200,000 | | | | 222,872 | |
b East Allegheny School District GO, 2.00% due 4/1/2017 (Insured: BAM) (State Aid Withholding) | | AA/A3 | | | 300,000 | | | | 306,117 | |
Pennsylvania Economic Development Financing Authority, 3.375% due 12/1/2040 put 7/1/2015 (Shippingport Project) | | BBB-/NR | | | 200,000 | | | | 203,524 | |
Wilson School District GO, 3.00% due 6/1/2017 (State Aid WIthholding) | | AA/NR | | | 200,000 | | | | 212,984 | |
| | | |
TEXAS — 4.93% | | | | | | | | | | |
Brazos River Authority, 4.90% due 10/1/2015 (Center Point Energy; Insured:
Natl-Re) | | AA-/Baa1 | | | 200,000 | | | | 210,676 | |
Harris County Health Facilities Development Corp., 0.07% due 10/1/2041 put 4/1/2014 (Texas Children’s Hospital; SPA: Wells Fargo Bank N.A.) (daily demand notes) | | AA/Aa2 | | | 100,000 | | | | 100,000 | |
a State of Texas, 2.00% due 8/28/2014 (General Revenue Fund-Cash Flow Management) | | SP-1+/Mig1 | | | 200,000 | | | | 201,552 | |
| | | |
VIRGINIA — 2.04% | | | | | | | | | | |
Fairfax County GO, 4.00% due 10/1/2015 (Public Facilities and Improvements) (State Aid Withholding) | | AAA/Aaa | | | 200,000 | | | | 211,438 | |
| | | |
WASHINGTON — 2.09% | | | | | | | | | | |
Seattle Municipal Light & Power, 5.00% due 2/1/2016 | | AA/Aa2 | | | 200,000 | | | | 216,824 | |
| | | | | | | | | | |
TOTAL INVESTMENTS — 74.80% (Cost $7,764,817) | | | | | | | | $ | 7,767,177 | |
OTHER ASSETS LESS LIABILITIES — 25.20% | | | | | | | | | 2,616,932 | |
| | | | | | | | | | |
NET ASSETS — 100.00% | | | | | | | | $ | 10,384,109 | |
| | | | | | | | | | |
12 Certified Semi-Annual Report
| | |
| SCHEDULE OF INVESTMENTS, CONTINUED | | |
| |
Thornburg Low Duration Municipal Fund | | March 31, 2014 (Unaudited) |
Footnote Legend
| † | Credit ratings are unaudited. Rating changes may have occurred subsequent to the reporting period end. Bonds issued with a maturity of one year or less are assigned Moody’s ratings from MIG-1 to MIG-4 and Standard and Poor’s ratings from SP-1+ to SP-3 with MIG-1 and SP-1+ being the strongest ratings. |
| a | Segregated as collateral for a when-issued security. |
Portfolio Abbreviations
To simplify the listings of securities, abbreviations are used per the table below:
| | |
| AGM | | Insured by Assured Guaranty Municipal Corp. |
| AMBAC | | Insured by American Municipal Bond Assurance Corp. |
| BAM | | Build America Mutual Insurance Co. |
| COP | | Certificates of Participation |
| ETM | | Escrowed to Maturity |
| GO | | General Obligation |
| HFFA | | Health Facilities Financing Authority |
| IDA | | Industrial Development Authority |
| Natl-Re | | Insured by National Public Finance Guarantee Corp. |
| SPA | | Stand-by Purchase Agreement |
| Syncora | | Insured by Syncora Guarantee Inc. |
See notes to financial statements.
Certified Semi-Annual Report 13
| | |
| STATEMENT OF ASSETS AND LIABILITIES | | |
| |
Thornburg Low Duration Municipal Fund | | March 31, 2014 (Unaudited) |
| | | | |
ASSETS | | | | |
Investments at value (cost $7,764,817) (Note 2) | | $ | 7,767,177 | |
Cash | | | 3,328,833 | |
Receivable for investments sold | | | 100,000 | |
Receivable from investment advisor | | | 7,123 | |
Interest receivable | | | 81,373 | |
Prepaid expenses and other assets | | | 58,546 | |
| | | | |
Total Assets | | | 11,343,052 | |
| | | | |
| |
LIABILITIES | | | | |
Payable for investments purchased | | | 958,905 | |
Dividends payable | | | 38 | |
| | | | |
Total Liabilities | | | 958,943 | |
| | | | |
| |
NET ASSETS | | $ | 10,384,109 | |
| | | | |
NET ASSETS CONSIST OF | | | | |
Net unrealized appreciation on investments | | $ | 2,360 | |
Net capital paid in on shares of beneficial interest | | | 10,381,749 | |
| | | | |
| | $ | 10,384,109 | |
| | | | |
NET ASSET VALUE | | | | |
Class A Shares: | | | | |
Net asset value and redemption price per share ($2,679,462 applicable to 217,600 shares of beneficial interest outstanding - Note 4) | | $ | 12.31 | |
Maximum sales charge, 1.50% of offering price | | | 0.19 | |
| | | | |
Maximum offering price per share | | $ | 12.50 | |
| | | | |
| |
Class I Shares: | | | | |
Net asset value, offering and redemption price per share ($7,704,647 applicable to 625,714 shares of beneficial interest outstanding - Note 4) | | $ | 12.31 | |
| | | | |
See notes to financial statements.
14 Certified Semi-Annual Report
| | |
| STATEMENT OF OPERATIONS | | |
| |
Thornburg Low Duration Municipal Fund | | Period ended March 31, 2014 (Unaudited)* |
| | | | |
INVESTMENT INCOME | | | | |
Interest income (net of premium amortized of $40,323) | | $ | 15,915 | |
| | | | |
| |
EXPENSES | | | | |
Investment advisory fees (Note 3) | | | 7,102 | |
Administration fees (Note 3) | | | | |
Class A Shares | | | 793 | |
Class I Shares | | | 571 | |
Distribution and service fees (Note 3) | | | | |
Class A Shares | | | 1,282 | |
Transfer agent fees | | | | |
Class A Shares | | | 920 | |
Class I Shares | | | 920 | |
Registration and filing fees | | | | |
Class A Shares | | | 4,600 | |
Class I Shares | | | 4,600 | |
Custodian fees (Note 3) | | | 4,622 | |
Professional fees | | | 6,992 | |
Accounting fees | | | 92 | |
Trustee fees | | | 92 | |
Other expenses | | | 7,081 | |
| | | | |
Total Expenses | | | 39,667 | |
Less: | | | | |
Expenses reimbursed by investment advisor (Note 3) | | | (12,771 | ) |
Investment advisory fees waived by investment advisor (Note 3) | | | (17,630 | ) |
Fees paid indirectly (Note 3) | | | (22 | ) |
| | | | |
Net Expenses | | | 9,244 | |
| | | | |
Net Investment Income | | | 6,671 | |
| | | | |
REALIZED AND UNREALIZED GAIN (LOSS) | | | | |
Net change in unrealized appreciation (depreciation) of investments | | | 2,360 | |
| | | | |
Net Realized and Unrealized Gain | | | 2,360 | |
| | | | |
Net Increase in Net Assets Resulting from Operations | | $ | 9,031 | |
| | | | |
| * | For the period from commencement of operations on December 30, 2013 through March 31, 2014. |
See notes to financial statements.
Certified Semi-Annual Report 15
| | |
| STATEMENT OF CHANGES IN NET ASSETS | | |
| |
Thornburg Low Duration Municipal Fund | | |
| | | | |
| | | Period Ended*
March 31, 2014 | |
INCREASE (DECREASE) IN NET ASSETS FROM | | | | |
| |
OPERATIONS | | | | |
Net investment income | | $ | 6,671 | |
Net unrealized appreciation (depreciation) on investments | | | 2,360 | |
| | | | |
| |
Net Increase (Decrease) in Net Assets Resulting from Operations | | | 9,031 | |
| |
DIVIDENDS TO SHAREHOLDERS | | | | |
From net investment income | | | | |
Class A Shares | | | (1,649 | ) |
Class I Shares | | | (5,022 | ) |
| |
FUND SHARE TRANSACTIONS (NOTE 4) | | | | |
Class A Shares | | | 2,678,714 | |
Class I Shares | | | 7,703,035 | |
| | | | |
Net Increase in Net Assets | | | 10,384,109 | |
| |
NET ASSETS | | | | |
Beginning of Period | | | — | |
| | | | |
| |
End of Period | | $ | 10,384,109 | |
| | | | |
| * | For the unaudited period from commencement of operations on December 30, 2013 through March 31, 2014. |
See notes to financial statements.
16 Certified Semi-Annual Report
| | |
| NOTES TO FINANCIAL STATEMENTS | | |
| |
Thornburg Low Duration Municipal Fund | | March 31, 2014 (Unaudited) |
NOTE 1 – ORGANIZATION
Thornburg Low Duration Municipal Fund (the “Fund”) is a diversified series of Thornburg Investment Trust (the “Trust”). The Trust is organized as a Massachusetts business trust under a Declaration of Trust dated June 3, 1987 and is registered as a diversified, open-end management investment company under the Investment Company Act of 1940, as amended. The Fund is currently one of eighteen separate series of the Trust. Each series is considered to be a separate entity for financial reporting and tax purposes and bears expenses directly attributable to it. The Fund’s investment objective is to seek current income exempt from federal income tax consistent with preservation of capital.
The Fund currently offers two classes of shares of beneficial interest outstanding: Class A and Institutional Class (“Class I”). Each class of shares of the Fund represents an interest in the same portfolio of investments, except that (i) Class A shares are sold subject to a front-end sales charge collected at the time the shares are purchased and bear a service fee, (ii) Class I shares are sold at net asset value without a sales charge at the time of purchase and may be subject to a service fee, and (iii) the respective classes may have different reinvestment privileges and conversion rights. Additionally, the Fund may allocate among its classes certain expenses, to the extent allocable to specific classes, including transfer agent fees, government registration fees, certain printing and postage costs, and administrative and legal expenses. Currently, class specific expenses of the Fund are limited to service and distribution fees, administration fees, and certain registration and transfer agent expenses.
NOTE 2 – SIGNIFICANT ACCOUNTING POLICIES
Significant accounting policies of the Trust are as follows:
Valuation Policy and Procedures: The Fund’s Trustees of the Trust (the “Trustees”) have authorized employees of the Fund’s investment advisor, acting as the Valuation and Pricing Committee (the “Committee”), to make certain valuation determinations, subject to oversight and review by the Trustees and the Audit Committee of the Trustees. The Committee and other employees of the Fund’s investment advisor administer and implement the valuation process. The Committee regularly reviews its own fair value decisions, as well as valuations, valuation techniques and services furnished by pricing services, considers circumstances in the markets which may require valuation determinations by the Committee and reviews previous valuation determinations. The Committee also reports on its activities, the performance of the pricing services and other matters to the Trustees and the Audit Committee of the Trustees.
In determining a fair value for a portfolio investment, the Committee seeks to determine the price that the Fund would reasonably expect to receive upon a sale of the investment in an orderly transaction between market participants at the measurement date. Typically, the fair value process employs standing instructions to use quoted prices in active markets or the use of independent pricing services. Less frequently, the Committee may make a fair value determination using other methods. However, because fair value prices are estimated prices, the determination of fair value for an investment may differ from the value that would be realized by the Fund upon a sale of the investment, and that difference could be material to the Fund’s financial statements. The Committee’s determination of fair value for an investment may also differ from the prices obtained by other persons (including other mutual funds) for the investment.
Valuation of Investments: Debt obligations held by the Fund have a primary over-the-counter market and are valued by an independent pricing service approved by the Trustees. The pricing service ordinarily values debt obligations at quoted bid prices. When quotations are not available, debt obligations held by the Fund are valued at evaluated prices determined by the pricing service using methods which include consideration of yields or prices of debt obligations of comparable quality, type of issue, coupon, maturity and rating, and indications as to value from dealers and general market conditions. Short-term obligations having remaining maturities of 60 days or less are ordinarily valued at amortized cost, which approximates market value.
In any case when a pricing service fails to provide a price for a debt obligation held by the Fund, the Committee determines a fair value for the debt obligation using procedures in accordance with a policy approved by the Trustees, which may include the use of a price obtained from a different independent pricing service. Additionally, in any case when management believes that a price provided by a pricing service for a debt obligation held by the Fund may be unreliable, the Committee decides whether or not to use the pricing service’s valuation or to use an alternative method to determine a fair value for the debt obligation.
Valuation Measurements: The Fund categorizes its investments based upon the inputs used in valuing those investments, according to a three-level hierarchy established by guidance from the Financial Accounting Standards Board (the “FASB”). Categorization of investments using this hierarchy is intended by the FASB to maximize the use of observable inputs and minimize the use of unobservable inputs by prioritizing that the most observable input be used when available. Observable inputs are those that market participants would use in valuing an investment based on available market data. Unobservable inputs are those that reflect assumptions about the information market participants would use in valuing an investment. An investment’s level within the hierarchy is based on the lowest level input that is deemed significant to the fair value measurement. The methodologies and relative inputs used to value investments are not necessarily indications of the risk or liquidity associated with investing in those investments.
Certified Semi-Annual Report 17
| | |
| NOTES TO FINANCIAL STATEMENTS, CONTINUED | | |
| |
Thornburg Low Duration Municipal Fund | | March 31, 2014 (Unaudited) |
Various inputs are used in determining the fair value measurement of the Fund’s investments. These inputs are generally summarized according to the three-level hierarchy below:
Level 1: Quoted prices in active markets for identical investments.
Level 2: Other direct or indirect significant observable inputs (including quoted prices for similar investments in active markets and other observable inputs, such as interest rates, prepayment rates, credit risk, etc.).
Level 3: Significant unobservable inputs, (including the Committee’s own assumptions in determining the fair value of investments), are generally applicable to investments fair valued with single broker quotes and other investments.
Portfolio investments with minimal, if any, market activity are characterized as Level 3 and are valued using significant unobservable inputs, typically including single broker quotes, which may be adjusted or unadjusted, related or comparable investments, last available transactions, and other relevant information. Valuations may also be based upon current market prices of securities that are comparable in coupon, rating, maturity and industry. An income based valuation approach would consider discounted anticipated future cash flows of the investment. Discounts may also be applied due to the nature or duration of any restrictions on the disposition of the investment. The derived value of a Level 3 investment may not represent the value which is received upon disposition.
The following table displays a summary of the fair value hierarchy measurements of the Fund’s investments as of March 31, 2014. In any instance when valuation inputs from more than one level are used to determine the fair value of a specific investment, the investment is placed in the level of the table based upon the lowest level input that is significant in determining the fair value of the investment:
| | | | | | | | | | | | | | | | |
| | | Fair Value Measurements at March 31, 2014 | |
| | | Total | | | Level 1 | | | Level 2 | | | Level 3 | |
Assets | | | | | | | | | | | | | | | | |
Investments in Securities | | | | | | | | | | | | | | | | |
Municipal Bonds | | $ | 7,767,177 | | | $ | — | | | $ | 7,767,177 | | | $ | — | |
| | | | | | | | | | | | | | | | |
Total Investments in Securities | | $ | 7,767,177 | | | $ | — | | | $ | 7,767,177 | | | $ | — | |
In accordance with the guidance prescribed in Accounting Standards Update No. 2011-04, it is the policy of the Fund to recognize transfers between levels and those underlying events which caused the movement. The Fund recognized no transfers between levels for the period ended March 31, 2014.
Federal Income Taxes: It is the policy of the Trust to comply with the provisions of the Internal Revenue Code applicable to “regulated investment companies” and to distribute to shareholders substantially all taxable (if any) and tax exempt income of the Fund. Therefore, no provision for federal income tax is required.
Management reviews each uncertain tax position believed to be material to the preparation of the Fund’s financial statements, to assess if it is more likely than not that the position would be sustained upon examination, based upon the technical merits of the position. As of March 31, 2014, management has not identified any such position for which an asset or liability must be reflected in the Statement of Assets and Liabilities. The Fund’s tax returns remain subject to examination for three years after filing.
When-Issued and Delayed Delivery Transactions: The Fund may engage in when-issued or delayed delivery transactions. To the extent the Fund engages in such transactions, it will do so for the purpose of acquiring portfolio investments consistent with the Fund’s investment objectives and not for the purpose of investment leverage or to speculate on interest rate and/or market changes. At the time the Fund makes a commitment to purchase an investment on a when-issued or delayed delivery basis, the Fund will record the transaction and reflect the value in determining its net asset value. When effecting such transactions, assets of an amount sufficient to make payment for the portfolio investments to be purchased will be segregated on the Fund’s records on the trade date. Investments purchased on a when-issued or delayed delivery basis do not earn interest until the settlement date.
Dividends: Net investment income of the Fund is declared daily as a dividend on shares for which the Fund has received payment. Dividends are paid monthly and are reinvested in additional shares of the Fund at net asset value per share at the close of business on the dividend payment date, or at the shareholder’s option, paid in cash. Net realized capital gains, to the extent available, will be distributed at least annually.
18 Certified Semi-Annual Report
| | |
| NOTES TO FINANCIAL STATEMENTS, CONTINUED | | |
| |
Thornburg Low Duration Municipal Fund | | March 31, 2014 (Unaudited) |
General: Investment transactions are accounted for on a trade date basis. Interest income is accrued as earned. Premiums and discounts on investments purchased are amortized to call dates or maturity dates of the respective investments. Realized gains and losses from the sale of investments are recorded on an identified cost basis. Net investment income (other than class specific expenses) and realized and unrealized gains and losses are allocated daily to each class of shares based upon the relative net asset value of outstanding shares (or the value of the dividend-eligible shares, as appropriate) of each class of shares at the beginning of the day (after adjusting for the current capital shares activity of the respective class). Expenses common to all Funds are allocated among the Funds comprising the Trust based upon their relative net asset values or other appropriate allocation methods.
Guarantees and Indemnifications: Under the Trust’s organizational documents (and under separate agreements with the independent Trustees), its officers and Trustees are indemnified against certain liabilities arising out of the performance of their duties to the Fund. Additionally, in the normal course of business the Trust enters into contracts with service providers that contain general indemnification clauses. The Trust’s maximum exposure under these arrangements is unknown. However, based on experience, the Trust expects the risk of loss to be remote.
Use of Estimates: The preparation of financial statements, in conformity with United States generally accepted accounting principles, requires management to make estimates and assumptions that affect the reported amounts of assets and liabilities and the disclosure of contingent assets and liabilities at the date of the financial statements and the reported amounts of increases and decreases in net assets from operations during the reporting period. Actual amounts could differ from those estimates.
NOTE 3 – INVESTMENT ADVISORY FEE AND OTHER TRANSACTIONS WITH AFFILIATES
Pursuant to an investment advisory agreement, Thornburg Investment Management, Inc. (the “Advisor”) serves as the investment advisor and performs services for the Fund for which the fees are payable at the end of each month. For the period ended March 31, 2014, these fees were payable at annual rates ranging from .40 of 1% to .225 of 1% per annum of the average daily net assets of the Fund depending on the Fund’s asset size. The Trust also has entered into administrative services agreements with the Advisor, whereby the Advisor will perform certain administrative services for the shareholders of each class of the Fund’s shares, and for which fees will be payable at an annual rate of up to .125 of 1% per annum of the average daily net assets attributable to each class of shares.
The Trust has an underwriting agreement with Thornburg Securities Corporation (the “Distributor,” an affiliate of the Advisor), which acts as the distributor of the Fund’s shares. For the period ended March 31, 2014, the Distributor has advised the Fund that it earned net commissions aggregating $25 from the sale of Class A shares of the Fund.
Pursuant to a service plan under Rule 12b-1 of the Investment Company Act of 1940, the Fund may reimburse to the Advisor an amount not to exceed .20 of 1% per annum of the average daily net assets attributable to each Class of shares of the Fund for payments made by the Advisor to securities dealers and other financial institutions to obtain various shareholder and distribution related services. For the period ended March 31, 2014, there were no 12b-1 service plan fees charged for Class I shares. The Advisor may pay out of its own resources additional expenses for distribution of the Fund’s shares.
The Advisor and Distributor have contractually agreed to waive fees and reimburse expenses incurred by the Fund so that actual expenses of certain share classes do not exceed specified levels. The agreement may be terminated by the Fund at any time, but may not be terminated by the Advisor or Distributor before February 1, 2015, unless the Advisor ceases to be the investment advisor to the Fund or the Distributor ceases to be the distributor of the Fund prior to that date. The Advisor and Distributor retain the right to be repaid by the Fund for fee waivers and expense reimbursements if expenses fall below the contractual limit prior to the end of the fiscal year.
For the period ended March 31, 2014, the Advisor contractually reimbursed certain class specific expenses and administrative fees of $6,681 for Class A shares and $6,090 for Class I shares, and voluntarily waived investment advisory fees of $17,630.
The Trust has an agreement with the custodian bank to indirectly pay a portion of the custodian’s fees through credits earned by the Fund’s cash on deposit with the bank. This deposit agreement is an alternative to overnight investments. Custodial fees are adjusted to reflect amounts that would have been paid without this agreement, with a corresponding adjustment reflected as fees paid indirectly in the Statement of Operations. For the period ended March 31, 2014, fees paid indirectly were $22.
Certain officers and Trustees of the Trust are also officers or directors of the Advisor and Distributor. The compensation of independent Trustees is borne by the Trust.
Certified Semi-Annual Report 19
| | |
| NOTES TO FINANCIAL STATEMENTS, CONTINUED | | |
| |
Thornburg Low Duration Municipal Fund | | March 31, 2014 (Unaudited) |
NOTE 4 – SHARES OF BENEFICIAL INTEREST
At March 31, 2014, there were an unlimited number of shares of beneficial interest authorized. Transactions in shares of beneficial interest were as follows:
| | | | | | | | |
| | | Period Ended*
March 31, 2014 | |
| | | Shares | | | Amount | |
Class A Shares | | | | | | | | |
Shares sold | | | 217,467 | | | $ | 2,677,069 | |
Shares issued to shareholders in reinvestment of dividends | | | 133 | | | | 1,645 | |
Shares repurchased | | | — | | | | — | |
| | | | | | | | |
| | |
Net increase (decrease) | | | 217,600 | | | $ | 2,678,714 | |
| | | | | | | | |
| | |
Class I Shares | | | | | | | | |
Shares sold | | | 625,309 | | | $ | 7,698,050 | |
Shares issued to shareholders in reinvestment of dividends | | | 405 | | | | 4,985 | |
Shares repurchased | | | — | | | | — | |
| | | | | | | | |
| | |
Net increase (decrease) | | | 625,714 | | | $ | 7,703,035 | |
| | | | | | | | |
| * | Fund commenced operations on December 30, 2013. |
NOTE 5 – INVESTMENT TRANSACTIONS
For the period ended March 31, 2014, the Fund had purchase and sale transactions of investments (excluding short-term investments) of $7,205,141 and $0, respectively.
NOTE 6 – INCOME TAXES
At March 31, 2014, information on the tax components of capital was as follows:
| | | | |
Cost of investments for tax purposes | | $ | 7,764,817 | |
| | | | |
Gross unrealized appreciation on a tax basis | | $ | 11,161 | |
Gross unrealized depreciation on a tax basis | | | (8,801 | ) |
| | | | |
Net unrealized appreciation (depreciation) on investments (tax basis) | | $ | 2,360 | |
| | | | |
OTHER NOTES
Risks: The Fund’s investments subject it to risks including, but not limited to, credit risk, interest rate risk, management risk, market and economic risk, and liquidity risk. Please see the Fund’s prospectus for a discussion of the risks associated with an investment in the Fund.
Subsequent Events: Fund management believes no events have occurred between March 31, 2014 and the date of issuance of the financial statements that require adjustment to or disclosure in the accompanying financial statements.
20 Certified Semi-Annual Report
This page intentionally left blank.
Certified Semi-Annual Report 21
FINANCIAL HIGHLIGHTS
Thornburg Low Duration Municipal Fund
| | | | | | | | | | | | | | | | | | | | | | | | | | | | | | | | | | | | | | | | | | | | | | | | |
| | | PER SHARE PERFORMANCE (for a share outstanding throughout the
Period)+ | | RATIOS TO AVERAGE NET ASSETS | | | SUPPLEMENTAL DATA | |
Unless
Otherwise
Noted,
Periods are Fiscal Years Ended Sept. 30, | | Net Asset
Value
Beginning
of Period | | | Net
Investment
Income
(Loss) | | Net
Realized
&
Unrealized
Gain (Loss)
on
Investments | | | Total from
Investment
Operations | | Dividends
from Net
Investment
Income | | | Dividends
from Net
Realized
Gains | | Total
Dividends | | | Net
Asset
Value
End of
Period | | Net
Investment
Income
(Loss)
(%) | | | Expenses,
After
Expense
Reductions
(%) | | | Expenses,
After
Expense
Reductions
and
Net of
Custody
Credits
(%) | | | Expenses,
Before
Expense
Reductions
(%) | | | Total
Return
(%)(a) | | Portfolio
Turnover
Rate (%)(a) | | Net
Assets
at End
of
Period
(Thousands) | |
Class A Shares | |
2014(b)(c)(d) | | $ | 12.31 | | | 0.01 | | | — | | | 0.01 | | | (0.01 | ) | | — | | | (0.01 | ) | | $12.31 | | | 0.26 | (e) | | | 0.63 | (e) | | | 0.63 | (e) | | | 2.68 | (e) | | 0.06 | | — | | $ | 2,679 | |
Class I Shares | |
2014(b)(d) | | $ | 12.31 | | | 0.01 | | | — | | | 0.01 | | | (0.01 | ) | | — | | | (0.01 | ) | | $12.31 | | | 0.44 | (e) | | | 0.46 | (e) | | | 0.46 | (e) | | | 1.99 | (e) | | 0.11 | | — | | $ | 7,705 | |
| (a) | Not annualized for periods less than one year. |
| (b) | Fund commenced operations on December 30, 2013. |
| (c) | Sales loads are not reflected in computing total return. |
| (d) | Unaudited Period Ended March 31. |
| + | Based on weighted average shares outstanding, except for Dividends from Net Investment Income and Net Realized Gains, which are actual amounts per share. |
See notes to financial statements.
| | | | |
| 22 Certified Semi-Annual Report | | | | Certified Semi-Annual Report 23 |
| | |
| EXPENSE EXAMPLE | | |
| |
Thornburg Low Duration Municipal Fund | | March 31, 2014 (Unaudited) |
As a shareholder of the Fund, you incur two types of costs:
| | (1) | transaction costs, including |
(a) sales charges (loads) on purchase payments, for Class A shares;
(b) a deferred sales charge on redemptions of any part or all of a purchase of $1 million of Class A shares within 12 months of purchase;
| | (2) | ongoing costs, including management fees; distribution and/or service (12b-1) fees; and other Fund expenses. |
This example is intended to help you understand your ongoing costs (in dollars) of investing in the Fund and to compare these costs with the ongoing costs of investing in other mutual funds.
The example is based on a $1,000 investment beginning on October 1, 2013, and held until March 31, 2014.
| | | | | | | | | | | | |
| | | Beginning
Account Value
10/1/13 | | | Ending
Account Value
3/31/14 | | | Expenses Paid
During Period†
10/1/13–3/31/14 | |
Class A Shares | | | | | | | | | | | | |
Actual | | $ | 1,000.00 | | | $ | 1,000.60 | | | $ | 3.14 | |
Hypothetical* | | $ | 1,000.00 | | | $ | 1,021.79 | | | $ | 3.17 | |
Class I Shares | | | | | | | | | | | | |
Actual | | $ | 1,000.00 | | | $ | 1,001.10 | | | $ | 2.30 | |
Hypothetical* | | $ | 1,000.00 | | | $ | 1,022.64 | | | $ | 2.32 | |
| † | Expenses are equal to the annualized expense ratio for each class (A: 0.63%; I: 0.46%) multiplied by the average account value over the period, multiplied by 182/365 to reflect the one-half year period. |
| * | Hypothetical assumes a rate of return of 5% per year before expenses. |
ACTUAL EXPENSES
For each class of shares, the first line of the accompanying table provides information about actual account values and actual expenses. You may use the information in this line, together with the amount you invested, to estimate the expenses that you paid over the period. Simply divide your account value by $1,000 (for example, an $8,600 account value divided by $1,000 = 8.6), then multiply the result by the number in the first line for your class of shares under the heading entitled “Expenses Paid During Period” to estimate the expenses you paid on your account during this period.
HYPOTHETICAL EXAMPLE FOR COMPARISON PURPOSES
For each class of shares, the second line of the accompanying table provides information about hypothetical account values and hypothetical expenses based on the Fund’s actual expense ratio and an assumed rate of return of 5% per year before expenses, which is not the Fund’s actual return. The hypothetical account values and expenses may not be used to estimate the actual ending account balance or expenses you paid for the period. You may use this information to compare the ongoing costs of investing in the Fund and other funds. To do so, compare this 5% hypothetical example with the 5% hypothetical examples that appear in the shareholder reports of the other funds.
Please note that the expenses shown in the table are meant to highlight your ongoing costs only and do not reflect any transactional costs, such as sales charges (loads), redemption fees, or exchange fees. Therefore, the second line of the table for each class of shares is useful in comparing ongoing costs only, and will not help you determine the relative total costs of owning different funds. In addition, if these transactional costs were included, your costs would have been higher.
24 Certified Semi-Annual Report
| | |
| OTHER INFORMATION | | |
| |
Thornburg Low Duration Municipal Fund | | March 31, 2014 (Unaudited) |
PORTFOLIO PROXY VOTING
Policies and Procedures:
The Trust has delegated to Thornburg Investment Management, Inc. (the “Advisor”) voting decisions respecting proxies for the Fund’s voting securities. The Advisor makes voting decisions in accordance with its Proxy Voting Policy. A description of the Policy is available (i) without charge, upon request, by calling the Advisor toll-free at 1-800-847-0200, (ii) on the Thornburg website at www.thornburg. com, and (iii) on the Securities and Exchange Commission’s website at www.sec.gov.
No proxy voting information is currently available because the Fund commenced operations on December 30, 2013. The Fund expects to begin making annual proxy voting information available in accordance with applicable regulations commencing on or before August 31, 2014. This information is available (i) without charge, upon request by calling the Advisor toll-free at 1-800-847-0200, (ii) on the Thornburg website at www.thornburg.com, and (iii) on the Securities and Exchange Commission’s website at www.sec.gov.
AVAILABILITY OF QUARTERLY PORTFOLIO SCHEDULE
The Fund files with the Securities and Exchange Commission schedules of its portfolio holdings on Form N-Q for the first and third quarters of each fiscal year. The Fund’s Forms N-Q are available on the Commission’s website at www.sec.gov, or may be reviewed and copied at the Commission’s Public Reference Room in Washington, D.C. Information on the operation of the Public Reference Room may be obtained by calling 1-800-SEC-0330. The Fund also makes this information available on its website at www.thornburg. com/download or upon request by calling 1-800-847-0200.
Certified Semi-Annual Report 25
TRUSTEES’ STATEMENT TO SHAREHOLDERS
Not part of the Certified Semi-Annual Report
Reissued September 15, 2013
The Trustees believe current and prospective shareholders should know how we discharge our responsibilities in supervising the Funds’ investment advisor and in reviewing the advisor’s contract for renewal. Since 2005, we have issued a statement which sets out clearly the three principal guidelines that we follow in supervising the Trust’s investment advisor on your behalf. In accordance with our customary practice, in September of this year we again reviewed our statement and concluded we should reissue this statement outlining the principal features of our supervision of the advisor’s performance of investment management services for the Funds.
We begin with the premise that each shareholder selected his or her Fund because its investments are managed by the investment advisor identified in the prospectus and in accordance with the objective and policies described in the prospectus. We realize, as each of you do, that if you believe that your Fund’s stated objective and policies no longer serve your personal investment goals, you can sell your shares and leave the Fund.
Therefore, we believe that our primary supervisory task – our principal obligation to you – is to assess the nature and quality of the advisor’s services, and to confirm that the advisor actively and competently pursues the Fund’s objective, in accordance with the policies set out in the prospectus. To do this, we meet regularly with management to review your Fund’s portfolio and to discuss the advisor’s specific actions and judgments in pursuing the Fund’s objective. We do not substitute our own judgment for the advisor’s decisions in selecting investments; the advisor is paid to exercise its informed judgment on investment decisions, and we seek to confirm, in reviewing the advisor’s performance, that the advisor is doing just that.
Second, while we are conscious of costs and the effect that costs have on shareholders’ returns, we do not seek the lowest fees or expense ratio as our sole or primary objective. We try to make sure that your Fund’s fees and costs are reasonable in relationship to the services rendered and that they are generally in line with those charged by other expert investment advisors, consistent with our belief that the Fund’s investors searched for and expect that expertise and attention and have decided to pay a reasonable price for it. We do not put the management contract “out to bid” as a matter of course, and we would not do so unless we had concluded that the advisor materially had failed to pursue the Fund’s objectives in accordance with its policies, or for other equally important reasons. We believe that any other approach would be inconsistent with your interests and contrary to your expectations when you bought shares of the Fund in the first place.
Finally, because we believe that most Thornburg Fund shareholders have invested with a long-term perspective, we try not to focus too much on the fashions of the moment and on short-term performance. The market will not favor any specific investment objective or set of policies at all times and under all economic circumstances. A fund will experience periods of both high and low returns relative to other funds and other investments. Even if one of our Funds is not favored by the market at a particular time, we believe that the advisor is nonetheless obliged to remain true to the Fund’s objective and policies, and we watch to see that it does so.
26 This page is not part of the Semi-Annual Report
RETIREMENT AND EDUCATION ACCOUNTS
Thornburg Investment Management offers retirement and education savings accounts that can help you meet a variety of planning challenges. For account applications or further information on any of the accounts below, please call 1-800-847-0200 or go to www.thornburg.com/ira. Your financial advisor can help you determine which plan is right for you.
Individual Retirement Accounts
Individual Retirement Accounts (IRAs) provide a tax-advantaged means to save money for the future. For a detailed outline of the difference between retirement accounts, see www.thornburg.com/ira. Rollovers are available. Call 1-800-847-0200 for more information.
Traditional IRAs – Contributions to Traditional IRAs are tax deductible for eligible individuals, and withdrawals are taxed as additional ordinary income. You may contribute to an IRA if you receive compensation and are under 70 1/2, even if you are covered by an employer retirement plan. Deductible contributions are subject to certain qualifications. Please consult your tax advisor.
Roth IRAs – Under a Roth IRA, there is no tax deduction for contributions, but there is no income tax on qualified withdrawals. For a more detailed comparison of Traditional and Roth IRAs, please see our website at www.thornburg. com/ira.
SEP IRAs – Simplified Employee Pension (SEP) IRAs are established by employers. The employer is allowed a tax deduction for contributions made to the SEP Plan and makes contributions to each eligible employee’s SEP IRA on a discretionary basis.
SIMPLE IRAs – Savings Incentive Match Plan for Employees of Small Employers (SIMPLE) is designed to give small business owners a simplified method to establish and contribute to a retirement plan for employees. The employer is allowed a tax deduction for contributions and makes either matching or non-elective contributions to each eligible employee’s SIMPLE IRA. Employees may make salary deferral contributions.
Coverdell Education Savings Account
These savings accounts are designed to provide a way to save money for higher education expenses. In an Education Savings Account, earnings and interest grow tax-free, and qualified withdrawals used to pay for eligible higher-education expenses are tax- and penalty-free.
Funds Available
The following funds are available in the accounts listed above:
| | • | | Thornburg Core Growth Fund |
| | • | | Thornburg International Value Fund |
| | • | | Thornburg International Growth Fund |
| | • | | Thornburg Developing World Fund |
| | • | | Thornburg Investment Income Builder Fund |
| | • | | Thornburg Global Opportunities Fund |
| | • | | Thornburg Low Duration Income Fund |
| | • | | Thornburg Limited Term U.S. Government Fund |
| | • | | Thornburg Limited Term Income Fund |
| | • | | Thornburg Strategic Income Fund |
This page is not part of the Semi-Annual Report 27

28 This page is not part of the Semi-Annual Report
THORNBURG FUND FAMILY
Thornburg Equity Funds
Thornburg’s equity research uses a fundamentally driven, bottom-up, comprehensive analytical approach. Thornburg equity funds generally focus on a limited number of securities so that each holding can impact performance. The team searches for firms believed to have a promising future and seeks to buy shares of those companies at a discount to their intrinsic or long-term value.
| | • | | Thornburg Core Growth Fund |
| | • | | Thornburg International Value Fund |
| | • | | Thornburg International Growth Fund |
| | • | | Thornburg Developing World Fund |
| | • | | Thornburg Investment Income Builder Fund |
| | • | | Thornburg Global Opportunities Fund |
Thornburg Bond Funds
Thornburg Investment Management applies a disciplined philosophy to fixed-income management. Since the launch of our first fixed-income fund over 25 years ago, we have been conducting fundamental, bottom-up research in an effort to identify bonds which we believe provide the best return for a given level of risk. We avoid leverage or complex strategies which could backfire in periods of market uncertainty.
| | • | | Thornburg Low Duration Income Fund |
| | • | | Thornburg Limited Term U.S. Government Fund |
| | • | | Thornburg Limited Term Income Fund |
| | • | | Thornburg Strategic Income Fund |
| | • | | Thornburg Low Duration Municipal Fund |
| | • | | Thornburg Limited Term Municipal Fund |
| | • | | Thornburg Intermediate Municipal Fund |
| | • | | Thornburg California Limited Term Municipal Fund |
| | • | | Thornburg New Mexico Intermediate Municipal Fund |
| | • | | Thornburg New York Intermediate Municipal Fund |
| | • | | Thornburg Strategic Municipal Income Fund |
Before investing, carefully consider the Fund’s investment goals, risks, charges, and expenses. For a prospectus or summary prospectus containing this and other information, contact your financial advisor or visit thornburg.com. Read it carefully before investing.
For additional information, please visit thornburg.com
Thornburg Investment Management, Inc. 2300 North Ridgetop Road, Santa Fe, NM 87506
This page is not part of the Semi-Annual Report 29
This page intentionally left blank.
30 This page is not part of the Semi-Annual Report
This page intentionally left blank.
This page is not part of the Semi-Annual Report 31

2 This page is not part of the Semi-Annual Report
IMPORTANT INFORMATION

Best Short-Intermediate Municipal Debt Fund
Lipper Fund Awards are granted annually to the fund in each Lipper classification that consistently delivered the strongest risk-adjusted performance (calculated with dividends reinvested). In 2014, Class I shares won for the ten-year period ended 11/30/2013 among 29 funds. The Fund did not win the award for other time periods.
The information presented on the following pages is current as of March 31, 2014. The managers’ views, portfolio holdings, and sector diversification are provided for the general information of the Fund’s shareholders; to the extent this information is historical, it should not be considered predictive of future circumstances. This material should not be deemed a recommendation to buy or sell any of the securities mentioned.
Investments in the Fund carry risks, including possible loss of principal. Bond funds have the same interest rate, inflation, and credit risks that are associated with the underlying bonds. The principal value of bonds will fluctuate relative to changes in interest rates, decreasing when interest rates rise. Unlike bonds, bond funds have ongoing fees and expenses. Please see the Fund’s Prospectus for a discussion of the risks associated with an investment in the Fund. Investments in the Fund are not FDIC insured, nor are they deposits of or guaranteed by a bank or any other entity. There is no guarantee that the Fund will meet its investment objectives. Diversification does not assure or guarantee better performance and cannot eliminate the risk of investment losses. The laddering strategy does not assure or guarantee better performance and cannot eliminate the risk of investment losses.
Performance data given at net asset value (NAV) does not take into account applicable sales charges. If the sales charges had been included, the performance would have been lower.
Minimum investments for Class I shares are higher than those for other classes. Class I shares may not be available to all investors.
| | | | |
Share Class | | NASDAQ Symbol | | CUSIP |
Class A | | LTMFX | | 885-215-459 |
Class C | | LTMCX | | 885-215-442 |
Class I | | LTMIX | | 885-215-434 |
Glossary
Bloomberg Economic Evaluation of States (BEES) Index – A survey, updated quarterly, that examines the pace of states’ growth following the 18-month recession that officially ended in June 2009.
Bloomberg State Stock Indices – Capitalization-weighted indices consisting of equities domiciled in each state.
BofA Merrill Lynch 1-10 Year U.S. Municipal Securities Index – A subset of the BofA Merrill Lynch U.S. Municipal Securities Index including all securities with a remaining term to final maturity less than 10 years.
Consumer Price Index (CPI) – Index that measures prices of a fixed basket of goods bought by a typical consumer, including food, transportation, shelter, utilities, clothing, medical care, entertainment and other items. The CPI, published by the Bureau of Labor Statistics in the Department of Labor, is based at 100 in 1982 and is released monthly. It is widely used as a cost-of-living benchmark to adjust Social Security payments and other payment schedules, union contracts and tax brackets. Also known as the cost-of-living index.
Unless otherwise noted, index returns reflect the reinvestment of income dividends and capital gains, if any, but do not reflect fees, brokerage commissions or other expenses of investing. Investors may not make direct investments into any index.
Alternative Minimum Tax (AMT) – A federal tax aimed at ensuring that high-income individuals, estates, trusts, and corporations pay a minimal level income tax. For individuals, the AMT is calculated by adding tax preference items to regular taxable income.
Annualized Distribution Yield – The distribution yield reflects actual distributions made to shareholders. The annualized distribution yield is calculated by summing the last 30 days of income at a given month end and annualizing to a 360-day year. The result is divided by the ending maximum offering price.
Barbell Structure – A bond investment strategy that concentrates holdings in shorter-term and longer-term maturities, forming a structure that resembles a barbell.
Basis Point (bp) – A unit equal to 1/100th of 1%. 1% = 100 basis points (bps).
Bond Credit Ratings – A bond credit rating assesses the financial ability of a debt issuer to make timely payments of principal and interest. Ratings of AAA (the highest), AA, A, and BBB are investment-grade quality. Ratings of BB, B, CCC, CC, C, and D (the lowest) are considered below investment grade, speculative grade, or junk bonds. Unless otherwise noted, the ratings listed are from Municipal Market Data and are a combination of ratings from Standard and Poor’s, Moody’s Investors Service, and Fitch Ratings.
Bullet Structure – A bond investment strategy that concentrates holdings in intermediate-term maturities and avoids shorter-term or longer-term maturities.
Credit Spread/Quality Spread – The difference between the yields of securities with different credit qualities.
Duration – A bond’s sensitivity to interest rates. Bonds with longer durations experience greater price volatility than bonds with shorter durations.
Effective Duration – A bond’s sensitivity to interest rates, incorporating the embedded option features, such as call provisions. Bonds with longer durations experience greater price volatility than bonds with shorter durations.
Fed Funds Rate – The interest rate at which a depository institution lends immediately available funds (balances at the Federal Reserve) to another depository institution overnight.
General Obligation Bond – A municipal bond backed by the credit and “taxing power” of the issuing jurisdiction rather than the revenue from a given project.
Gross Domestic Product (GDP) – A country’s income minus foreign investments: the total value of all goods and services produced within a country in a year, minus net income from investments in other countries.
Participation Rate – The number of people who are either employed or are actively looking for work. The people who are no longer actively searching for work would not be included in the participation rate. During an economic recession, many workers often get discouraged and stop looking for employment, as a result, the participation rate decreases.
Quantitative Easing – The Federal Reserve’s monetary policy intended to stimulate the U.S. economy following the recession that began in 2007/08.
Quantitative Easing 3 (QE3) – The third round of the Federal Reserve’s monetary policy intended to stimulate the U.S. economy following the recession that began in 2007/08. Announced in September 2012 and revised in December 2012, December 2013, and January 2014, the Fed intends to buy $65 billion in mortgage-backed securities and Treasuries each month until the economy improves.
SEC Yield – SEC yield is computed in accordance with SEC standards measuring the net investment income per share over a specified 30-day period expressed as a percentage of the maximum offering price of the Fund’s shares at the end of the period.
Yield Curve – A line that plots the interest rates, at a set point in time, of bonds having equal credit quality, but differing maturity dates.
This page is not part of the Semi-Annual Report 3
THORNBURG LIMITED TERM MUNICIPAL FUND
Laddering – an All Weather Strategy
At Thornburg, our approach to management of the Fund is based on the premise that investors in the Fund seek preservation of capital along with an attractive, relatively stable yield. While aggressive bond strategies may generate stronger returns when the market is turning a blind eye towards risk, they often fail to stack up over longer periods of time.
We apply these techniques to manage risk and pursue attractive returns:
| | • | | Building a laddered portfolio. Laddering has been shown over time to mitigate reinvestment and interest rate risk. |
| | • | | Conducting in-depth fundamental research on each issue and actively monitoring positions for subsequent credit events. |
| | • | | Diversifying among a large number of generally high-quality bonds. |
| | • | | Investing on a cash-only basis without using leverage. |
Portfolio Managers

Josh Gonze Chris Ryon, CFA
Objectives and Strategies
The Fund’s primary investment objective is to obtain as high a level of current income exempt from federal individual income taxes as is consistent, in the view of the Fund’s investment advisor, with preservation of capital (may be subject to Alternative Minimum Tax).
The secondary goal of the Fund is to reduce expected changes in its share price compared to longer intermediate and long-term bond portfolios.
This Fund is a laddered portfolio of municipal bonds with an average maturity of normally less than five years. Laddering involves building a portfolio of bonds with staggered maturities so that a portion of the portfolio matures each year. Cash from maturing bonds, if not needed for other purposes, is invested in bonds with longer maturities at the far end of the ladder. We regard the strategy as a good compromise for managing different types of risk.
Long-Term Stability of Principal
Net Asset Value History of A Shares from September 28, 1984 through March 31, 2014
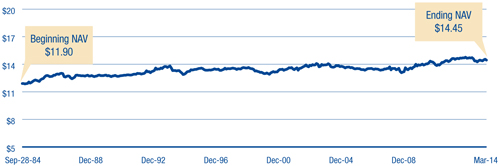
Average Annual Total Returns
For Periods Ended March 31, 2014
| | | | | | | | | | | | | | | | | | | | |
| | | 1 Yr | | | 3 Yrs | | | 5 Yrs | | | 10 Yrs | | | Since
Inception | |
A Shares (Incep: 9/28/84) | | | | | | | | | | | | | | | | | | | | |
Without sales charge | | | 0.25 | % | | | 3.37 | % | | | 3.94 | % | | | 3.20 | % | | | 5.24 | % |
With sales charge | | | (1.23 | %) | | | 2.86 | % | | | 3.63 | % | | | 3.05 | % | | | 5.18 | % |
Performance data shown represents past performance and is no guarantee of future results. Investment return and principal value will fluctuate so shares, when redeemed, may be worth more or less than their original cost. Current performance may be lower or higher than quoted. For performance current to the most recent month end, visit thornburg.com or call 800.847.0200.
The maximum sales charge for the Fund’s Class A shares is 1.50%. The total annual fund operating expense of Class A shares is 0.71%, as disclosed in the most recent Prospectus.
30-Day Yields, A Shares
As of March 31, 2014
| | | | |
Annualized Distribution Yield | | | 1.72 | % |
| |
SEC Yield | | | 0.92 | % |
Key Portfolio Attributes
As of March 31, 2014
| | | | |
Number of Bonds | | | 1,970 | |
| |
Effective Duration | | | 3.5 Yrs | |
| |
Average Maturity | | | 4.0 Yrs | |
See the entire portfolio in the Schedule of Investments beginning on page 11.
4 This page is not part of the Semi-Annual Report
THORNBURG’S SUITE OF MUNICIPAL FUNDS
| | |
Municipal Funds for a Range of Interest-Rate Scenarios At Thornburg, we often say that predicting interest rates is a fool’s game. And with the Federal Reserve still heavily involved in the markets, it’s even more difficult to forecast how rates may rise than when they may rise. Will long rates rise first and short rates follow? Will long and short rates climb simultaneously? A traditional strategy to protect oneself against interest-rate risk is to move into shorter-duration bond strategies. But the seemingly counterintuitive response of moving to longer-duration strategies can sometimes yield better results. Diversify Across the Yield Curve This uncertainty points to why it’s important for investors to match their investment horizon to the duration of the strategy in which they’re invested, and to diversify assets across the yield curve. For any interest-rate scenario, Thornburg’s comprehensive suite of municipal funds gives prudent investors the ability to diversify across the yield curve. Diversify Across the Yield Curve with Thornburg Municipal Funds AAA General Obligation Municipal Yield Curve, as of April 2, 2014 
| |  |
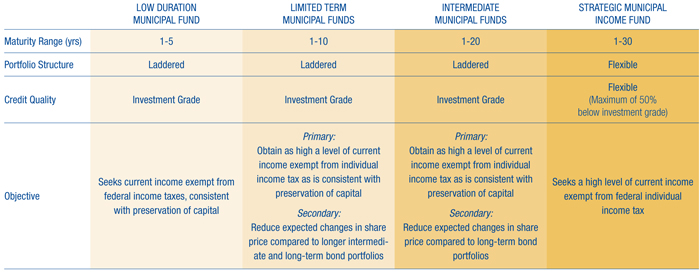
This page is not part of the Semi-Annual Report 5

Thornburg Limited Term Municipal Fund
March 31, 2014
This report is certified under the Sarbanes-Oxley Act of 2002, which requires that public companies, including mutual funds, affirm that the information provided in their annual and semiannual shareholder reports fully and fairly represents their financial position and the results of their operations for the period presented.
6 Certified Semi-Annual Report
LETTER TO SHAREHOLDERS
April 15, 2014
Dear Fellow Shareholder:
We are pleased to present the semi-annual report for the Thornburg Limited Term Municipal Fund. The net asset value (NAV) of the Class A shares increased seven cents to $14.45 per share during the six months ended March 31, 2014. If you were with us for the entire period, you received dividends of 13.3 cents per share. If you reinvested your dividends, you received 13.4 cents per share. Dividends were lower for Class C shares and higher for Class I shares to account for varying class-specific expenses. The Class A shares of your Fund underperformed the index with a total return of 1.42% at NAV for the six months ended March 31, 2014, compared to the 1.74% total return for the BofA Merrill Lynch 1-10 Year U.S. Municipal Securities Index (BAML 1-10 Year Municipal Index). The Fund generated 0.91% more price return and 1.23% less income than the index.
The first six months of fiscal 2014 were very interesting as interest-rate changes went in various directions, depending on the maturity discussed. This period certainly highlighted the fact that interest rates do not change uniformly across the entire maturity spectrum (the yield curve).
Chart I illustrates how yields changed during the period. The gold bars show the yield changes from September 30, 2013 through December 31, 2013. Short-term yields (maturities of five years or less) moved lower, while yields in maturities from five years to 20 years moved higher by varying amounts, and longer-term maturities were flat to slightly lower. It is helpful to remember the market tone during that period. Most market commentators believed the stock market and yields were going in the same direction: up. The blue bars show the yield changes from December 31, 2013 through March 31, 2014. Again, yield changes were not uniform across the yield curve. This time, after the new U.S. Federal Reserve Chair Janet Yellen hinted that short-term interest rates may eventually need to increase, short-term yields increased and long-term yields decreased.
Investors may wonder how best to protect themselves from these changes. One way to hedge this risk is to own securities or mutual funds that focus their investment universe across the different segments of the yield curve. In our opinion, that would mean owning some of our new Thornburg Low Duration Municipal Fund and our Limited Term Municipal, Intermediate Municipal, and Strategic Municipal Income Funds. The percentage ownership of each would depend on levels of risk tolerance.
Throughout the six-month period the Fund maintained a lower risk posture on interest rates than its benchmark; the average effective duration was 3.49 years compared to 4.00 years for the benchmark. This helped relative performance by 0.03% as interest rates increased during the period. The Fund’s position along the yield curve added 0.03% and sector selection was immaterial to relative performance. Our underweight in high-quality AAA bonds was a contributor, adding 0.33% to performance. Other factors including security selection cost 0.08% of underperformance and other factors cost 0.60%.
Chart I Changes in AAA General-Obligation Municipal Yield Curve
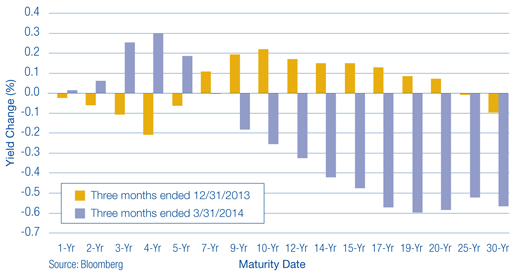
Certified Semi-Annual Report 7
LETTER TO SHAREHOLDERS,
CONTINUED
Chart II Labor Market Indicators
2/28/1990 – 3/31/2014
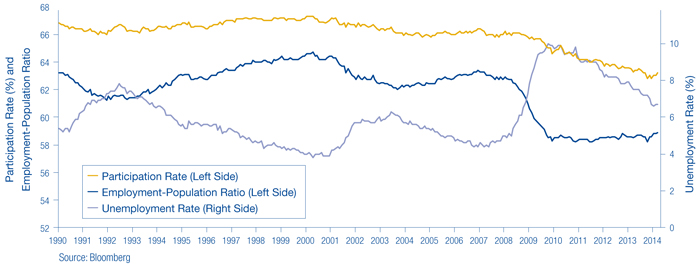
The Economy and the Federal Reserve
Gross domestic product (GDP) for the year ended December 31, 2013 came in at 2.6%, around its long-term average (to March 1990) of 2.5%. Additions to non-farm payroll employment have averaged about 185,000 per month for the six months ended March 31, 2014. The unemployment rate has declined to 6.7%, but it has been clouded by a declining labor participation rate. The percentage of the U.S. population that is employed has declined to 58.9% as of March 31, 2014 from 63.3% on March 31, 2007. The retirement of the “baby boomer” generation certainly contributes to this decline, but does not account for all of it. Chart II illustrates each of these trends from 1990.
Inflation, the bondholder’s worst enemy, has remained well controlled in the last six months. The year-over-year change in the Consumer Price Index (CPI) increased to 1.5% as of March 31, 2014 from 1.2% as of September 30, 2013. Subtracting the food and energy components to arrive at the core measure presents a picture of a well-behaved, unchanged 1.7%. The economic backdrop is one of mild expansion with low inflation. The $64,000 question is, “How long can it last?”
In January 2014, Janet Yellen replaced Ben Bernanke as Federal Reserve Chair. Her appointment as Fed Chair assured a continuation of the current Fed policies. Last year, Bernanke roiled the fixed income markets by alluding to the prospect of a decrease in the Fed’s monthly purchases of Treasury and mortgage-backed securities, the tapering of QE3. Rates went up! This year, the tapering started in actuality with the Fed reducing its purchases by $10.0 billion per meeting. Rates went down! Go figure!
Chair Yellen learned that in her new position (to borrow an old E.F. Hutton advertisement tag line), “When she speaks, markets listen.” At her first news conference, Ms. Yellen tried to clarify what “for a considerable time” meant from the last Fed Statement: “This is the kind of term it’s hard to define,” Yellen said. “Probably means something on the order of six months, or that type of thing” [after QE3 tapering ends]. This sent the debt markets, especially the short-term debt markets, lower in price and higher in yield. The results can be seen in Chart I.
8 Certified Semi-Annual Report
LETTER TO SHAREHOLDERS,
CONTINUED
The Municipal Market
The municipal market has performed very well over the last six months. The monthly outflows from municipal bond mutual funds have abated. The Investment Company Institute (ICI), an industry trade group, has reported that for the last three months of calendar year 2013, municipal bond mutual funds lost an average of $6.6 billion per month. For the first three months of calendar year 2014 municipal bond mutual funds experienced $1.1 billion inflows per month. This is not a significant amount, but at least it is positive.
These cash flows would normally not support a significantly positive return environment, but when coupled with a decline in new issuance of municipal bonds, a clearer picture presents itself. The supply of the new municipal bonds was down 26% for the first three months of 2014. So muted demand was met with reduced supply, yielding positive results.
The overall economic health of the municipal bond market is improving, albeit unevenly. We arrive at this judgment in part through the use of the Bloomberg Economic Evaluation of States Index, which includes:
| | • | | Mortgage delinquencies – from the Mortgage Bankers Association |
| | • | | State personal income – from the Bureau of Economic Analysis |
| | • | | Tax revenue – from the U.S. Census Bureau |
| | • | | Employment – from the Bureau of Labor Statistics |
| | • | | Home prices – from the Federal Housing Finance Agency |
| | • | | Bloomberg State Stock Index |
From the fourth quarter of 2012 through the fourth quarter of 2013 (the latest data available), the index increased on average 2.8%. It ranged from a high of 8.8% to a low of negative 7.5%. For the comparable period from the prior year, the average was an increase of 0.2%, with a range from 9.9% to negative 4.1%. In addition, state pension funds are still wrestling with some of their issues. The median funding levels have declined from 82.6% in 2007 to 68.6% in 2012 (the Pew Center on the States suggests a funding level of 80% is adequate).
Two municipal bond market credit stories (Detroit and Puerto Rico) continue to grab headlines. In Detroit’s case, some significant settlements have been announced, but they are short on specifics, including where the new cash came from, and are dependent upon state approval. As in most Chapter 9 proceedings, one should read very little into early reports because the final results may prove very different. For example, a settlement was announced between insured bondholders and the city for a recovery of about 74% of par (a bond’s original face value); a second component of the settlement was reached with several unions for 100% of existing pension obligations and a reduction in cost-of-living adjustments. The original opening offer for these parties was 20% of par for the bondholders, and between 75% and 95% of outstanding pension obligations. It appears to us that these compromises do not address the root problems. Thornburg Funds do not have direct exposure to the city of Detroit.
Puerto Rico made the news in March 2014 by successfully coming to market with the largest “junk” bond deal in municipal market history. Puerto Rico, which is now rated BB, pulled off a $3.5 billion offering, which was purchased by non-traditional market participants, i.e. hedge funds. It was a 21-year maturity bond that was priced at $93.00 to yield 8.73%. We looked at the issue very closely as a potential addition to the Thornburg Strategic Municipal Income Fund and decided not to purchase it. The deal initially traded up to around $97.00, but as of this writing (close of business April 15th), it is trading at a dollar price of $87.50, a loss of almost 6.00% from the original offering price. Thornburg Funds are among the 30% of U.S. municipal mutual funds that do not own any debt from the Commonwealth of Puerto Rico.
Certified Semi-Annual Report 9
LETTER TO SHAREHOLDERS,
CONTINUED
Conclusion
Your Thornburg Limited Term Municipal Fund maintains a laddered portfolio structure comprised of 774 municipal obligors as of March 31, 2014. We ladder our core portfolios because we believe that this structure tends to maximize an investor’s income. In our opinion, a laddered portfolio structure outperforms the other structures (bullet and barbell) two thirds of the time.1 This structure effectively manages a portfolio’s yield curve exposure by owning a roughly equal weighting of each maturity, thereby minimizing a major risk factor.
We diversify our holdings across the Fund’s investment universe. Chart I illustrates that yield changes are not uniform across the Thornburg Limited Term Municipal Fund’s investment universe. Laddering also reduces reinvestment risk by ensuring that a portion of the portfolio matures each year so it can be reinvested. More importantly, it frees the team to concentrate on higher value-added tasks, such as bottom-up credit research. It is just this type of research that has allowed us to avoid the two largest headline-grabbing credit issues fundamental in the municipal bond market.
This year has gotten off to a strong start. We thank you for the trust you have placed in us and will continue to keep that foremost in our minds.
Sincerely,
| | | | |
 | |  | | |
| Christopher Ryon, CFA | | Josh Gonze | | |
| Portfolio Manager | | Portfolio Manager | | |
| Managing Director | | Managing Director | | |
| 1 | For a copy of the study, go to www.thornburg.com/whyladder |
Chart III Percent of Portfolio Maturing
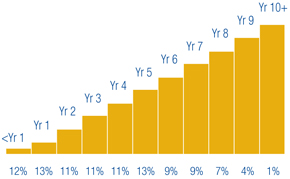

The matters discussed in this report may constitute forward-looking statements made pursuant to the safe harbor provisions of the Securities Litigation Reform Act of 1995. These include any advisor or portfolio manager prediction, assessment, analysis or outlook for individual securities, industries, investment styles, market sectors and/or markets. These statements involve risks and uncertainties. In addition to the general risks described for each fund in its current prospectus, other factors bearing on these reports include the accuracy of the advisor’s or portfolio manager’s forecasts and predictions, the appropriateness of the investment strategies designed by the advisor or portfolio manager and the ability of the advisor or portfolio manager to implement their strategies efficiently and successfully. Any one or more of these factors, as well as other risks affecting the securities markets generally, could cause the actual results of any fund to differ materially as compared to its benchmarks.
10 Certified Semi-Annual Report
| | |
| SCHEDULE OF INVESTMENTS | | |
| |
Thornburg Limited Term Municipal Fund | | March 31, 2014 (Unaudited) |
SUMMARY OF SECURITY CREDIT RATINGS†
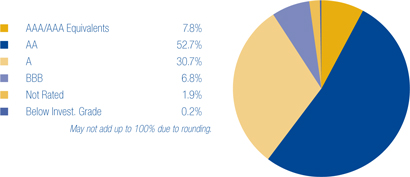
We have used ratings from Standard & Poor’s (S&P). Where S&P ratings are not available, we have used Moody’s Investors Service. Where neither rating is available, we have used ratings from Fitch Ratings. The category of investments identified as “AAA” in this graph includes investments which are pre-refunded or escrowed to maturity. Such investments are backed by an escrow or trust containing sufficient U.S. Government or U.S. Government agency securities to satisfy the timely payment of principal and interest and, therefore, are normally deemed to be equivalent to AAA-rated securities.
| | | | | | | | | | |
Issuer-Description | | Credit Rating†
S&P/ Moody’s | | Principal
Amount | | | Value | |
ALABAMA — 1.64% | | | | | | | | | | |
Alabama Public School & College Authority, 5.00% due 5/1/2015 (Education System Capital Improvements) | | NR/Aa1 | | $ | 8,530,000 | | | $ | 8,976,375 | |
Alabama Public School & College Authority, 5.00% due 5/1/2016 (Education System Capital Improvements) | | AA/Aa1 | | | 5,000,000 | | | | 5,473,400 | |
Alabama Public School & College Authority, 5.00% due 6/1/2019 (Education System Capital Improvements) | | AA/Aa1 | | | 4,840,000 | | | | 5,681,240 | |
Alabama Public School & College Authority, 5.00% due 6/1/2019 (Education System Capital Improvements) | | AA/Aa1 | | | 770,000 | | | | 903,834 | |
Alabama Public School & College Authority, 5.00% due 6/1/2020 (Education System Capital Improvements) | | AA/Aa1 | | | 5,085,000 | | | | 6,007,012 | |
Alabama Public School & College Authority, 5.00% due 6/1/2021 (Education System Capital Improvements) | | AA/Aa1 | | | 5,335,000 | | | | 6,309,758 | |
Alabama Public School & College Authority, 5.00% due 6/1/2022 (Education System Capital Improvements) | | AA/Aa1 | | | 5,605,000 | | | | 6,656,666 | |
Alabama Public School & College Authority, 5.00% due 6/1/2023 (Education System Capital Improvements) | | AA/Aa1 | | | 735,000 | | | | 875,400 | |
Alabama State Board of Education, 3.00% due 5/1/2017 (Calhoun Community College) | | NR/A1 | | | 2,070,000 | | | | 2,158,141 | |
Alabama State Board of Education, 3.00% due 5/1/2018 (Calhoun Community College) | | NR/A1 | | | 2,130,000 | | | | 2,222,208 | |
a Alabama State Board of Education, 4.00% due 5/1/2019 (Calhoun Community College) | | NR/A1 | | | 2,195,000 | | | | 2,372,685 | |
Alabama State Board of Education, 4.00% due 5/1/2020 (Calhoun Community College) | | NR/A1 | | | 1,000,000 | | | | 1,073,650 | |
Alabama State Board of Education, 4.00% due 5/1/2021 (Calhoun Community College) | | NR/A1 | | | 1,000,000 | | | | 1,064,940 | |
Alabama State Board of Education, 4.00% due 5/1/2022 (Calhoun Community College) | | NR/A1 | | | 1,230,000 | | | | 1,304,107 | |
City of Birmingham GO, 5.00% due 2/1/2015 (Government Services) | | AA/Aa2 | | | 4,240,000 | | | | 4,404,300 | |
City of Birmingham GO, 4.00% due 8/1/2015 (Government Services) | | AA/Aa2 | | | 3,005,000 | | | | 3,149,120 | |
City of Birmingham GO, 5.00% due 2/1/2016 (Government Services) | | AA/Aa2 | | | 3,775,000 | | | | 4,069,072 | |
City of Birmingham GO, 4.00% due 8/1/2016 (Government Services) | | AA/Aa2 | | | 3,645,000 | | | | 3,917,573 | |
City of Birmingham GO, 5.00% due 2/1/2017 (Government Services) | | AA/Aa2 | | | 2,045,000 | | | | 2,271,995 | |
City of Birmingham GO, 4.00% due 8/1/2017 (Government Services) | | AA/Aa2 | | | 2,760,000 | | | | 3,020,240 | |
City of Birmingham GO, 5.00% due 2/1/2018 (Government Services) | | AA/Aa2 | | | 2,000,000 | | | | 2,269,600 | |
City of Mobile Industrial Development Board PCR, 1.65% due 6/1/2034 put 3/20/2017 (Alabama Power Company Barry Plant Project) | | A/A1 | | | 6,000,000 | | | | 6,004,860 | |
City of Mobile Industrial Development Board PCR, 5.00% due 6/1/2034 put 3/19/2015 (Alabama Power Company Barry Plant Project) | | A/A1 | | | 6,000,000 | | | | 6,247,440 | |
City of Mobile Private Placement Warrants GO, 4.50% due 8/15/2016 (Senior Center) | | NR/NR | | | 920,000 | | | | 947,444 | |
City of Mobile Warrants GO, 5.00% due 2/15/2019 (City Capital Improvements) | | AA-/Aa2 | | | 2,000,000 | | | | 2,249,700 | |
East Alabama Health Care Authority GO, 5.00% due 9/1/2021 | | A/NR | | | 1,245,000 | | | | 1,402,082 | |
East Alabama Health Care Authority GO, 5.00% due 9/1/2022 | | A/NR | | | 800,000 | | | | 889,136 | |
Montgomery Waterworks and Sanitation, 5.00% due 9/1/2016 | | AAA/Aa1 | | | 2,080,000 | | | | 2,299,045 | |
Montgomery Waterworks and Sanitation, 5.00% due 9/1/2019 | | AAA/Aa1 | | | 3,375,000 | | | | 3,847,297 | |
Town of Courtland Industrial Development Board, 4.75% due 5/1/2017 (Solid Waste Disposal-International Paper Company Project) | | BBB/NR | | | 5,000,000 | | | | 5,089,250 | |
University of Alabama at Birmingham Hospital, 5.25% due 9/1/2017 | | A+/A1 | | | 2,500,000 | | | | 2,837,900 | |
University of Alabama at Birmingham Hospital, 5.00% due 9/1/2018 | | A+/A1 | | | 1,700,000 | | | | 1,945,446 | |
| | | |
ALASKA — 0.75% | | | | | | | | | | |
Alaska Housing Finance Corp. GO, 5.00% due 12/1/2018 (Insured: Natl-Re) | | AA+/Aa2 | | | 2,000,000 | | | | 2,254,600 | |
b Alaska Industrial Development & Export Authority, 5.00% due 4/1/2023 (Greater Fairbanks Community Hospital Foundation) | | A/NR | | | 1,000,000 | | | | 1,123,990 | |
b Alaska Industrial Development & Export Authority, 5.00% due 4/1/2024 (Greater Fairbanks Community Hospital Foundation) | | A/NR | | | 1,000,000 | | | | 1,109,660 | |
Alaska Industrial Development & Export Authority GO, 5.00% due 4/1/2014 | | AA+/Aa3 | | | 2,000,000 | | | | 2,000,000 | |
Alaska Industrial Development & Export Authority GO, 5.00% due 4/1/2015 | | AA+/Aa3 | | | 1,900,000 | | | | 1,989,984 | |
Alaska Industrial Development & Export Authority GO, 5.00% due 4/1/2016 | | AA+/Aa3 | | | 1,100,000 | | | | 1,195,040 | |
Alaska Industrial Development & Export Authority GO, 5.00% due 4/1/2017 | | AA+/Aa3 | | | 3,000,000 | | | | 3,356,160 | |
Alaska Industrial Development & Export Authority GO, 5.00% due 4/1/2018 | | AA+/Aa3 | | | 2,455,000 | | | | 2,805,893 | |
Certified Semi-Annual Report 11
| | |
| SCHEDULE OF INVESTMENTS, CONTINUED | | |
| |
Thornburg Limited Term Municipal Fund | | March 31, 2014 (Unaudited) |
| | | | | | | | | | |
Issuer-Description | | Credit Rating†
S&P/ Moody’s | | Principal
Amount | | | Value | |
Alaska Municipal Bond Bank, 5.00% due 6/1/2014 (Insured: Natl-Re) (State Aid Withholding) | | AA+/Aa2 | | $ | 1,175,000 | | | $ | 1,184,471 | |
City of Valdez, 5.00% due 1/1/2021 (BP Pipelines (Alaska), Inc. Project) | | A/A2 | | | 3,700,000 | | | | 4,266,137 | |
City of Valdez, 5.00% due 1/1/2021 (BP Pipelines (Alaska), Inc. Project) | | A/A2 | | | 12,000,000 | | | | 13,836,120 | |
North Slope Borough GO, 5.00% due 6/30/2015 (Insured: Natl-Re) | | AA-/Aa3 | | | 3,250,000 | | | | 3,445,487 | |
North Slope Borough GO, 5.00% due 6/30/2017 (Insured: Natl-Re) | | AA-/Aa3 | | | 8,800,000 | | | | 9,953,064 | |
State of Alaska, 5.00% due 10/1/2017 (Alaska International Airports System; Insured: Natl-Re) | | AA-/A1 | | | 1,115,000 | | | | 1,227,336 | |
| | | |
ARIZONA — 3.71% | | | | | | | | | | |
Arizona Board of Regents, 4.00% due 7/1/2014 (ASU Polytechnic, Tempe, West Campus Capital Projects) | | AA/Aa3 | | | 400,000 | | | | 403,848 | |
Arizona Board of Regents COP, 5.00% due 7/1/2018 (Arizona State University; Insured: Natl-Re) | | AA-/A1 | | | 1,285,000 | | | | 1,429,717 | |
Arizona Board of Regents COP, 3.00% due 9/1/2018 (Northern Arizona University Projects) | | A/A2 | | | 1,000,000 | | | | 1,057,230 | |
Arizona Board of Regents COP, 5.00% due 7/1/2019 (Arizona State University; Insured: Natl-Re) | | AA-/A1 | | | 3,735,000 | | | | 4,160,977 | |
Arizona Board of Regents COP, 3.00% due 9/1/2019 (Northern Arizona University Projects) | | A/A2 | | | 2,525,000 | | | | 2,639,307 | |
Arizona Board of Regents COP, 5.00% due 9/1/2019 (Arizona State University) | | AA-/A1 | | | 1,085,000 | | | | 1,252,036 | |
Arizona Board of Regents COP, 5.00% due 9/1/2019 pre-refunded 9/1/2014 (Northern Arizona University Research Infrastructure Projects; Insured: AMBAC) | | A/A2 | | | 3,500,000 | | | | 3,570,140 | |
Arizona Board of Regents COP, 5.00% due 9/1/2020 (Northern Arizona University Projects) | | A/A2 | | | 1,000,000 | | | | 1,139,040 | |
Arizona Board of Regents COP, 5.00% due 9/1/2020 (Arizona State University) | | AA-/A1 | | | 3,170,000 | | | | 3,655,264 | |
Arizona Board of Regents COP, 5.00% due 9/1/2021 (Arizona State University) | | AA-/A1 | | | 4,020,000 | | | | 4,637,552 | |
Arizona Board of Regents COP, 5.00% due 6/1/2022 (University of Arizona) | | AA-/Aa3 | | | 6,080,000 | | | | 6,980,205 | |
Arizona Board of Regents COP, 5.00% due 9/1/2022 (Northern Arizona University Projects) | | A/A2 | | | 2,500,000 | | | | 2,848,125 | |
Arizona Board of Regents COP, 5.00% due 9/1/2022 (Arizona State University) | | AA-/A1 | | | 4,380,000 | | | | 5,049,439 | |
Arizona Board of Regents COP, 5.00% due 9/1/2023 (Northern Arizona University Projects) | | A/A2 | | | 3,325,000 | | | | 3,737,333 | |
Arizona Board of Regents COP, 5.00% due 9/1/2023 (Arizona State University) | | AA-/A1 | | | 5,580,000 | | | | 6,405,505 | |
Arizona HFA, 5.25% due 1/1/2018 (Banner Health) | | AA-/NR | | | 3,500,000 | | | | 3,993,290 | |
Arizona HFA, 5.00% due 7/1/2018 (Catholic Health Care West) | | A/A3 | | | 1,470,000 | | | | 1,651,971 | |
Arizona HFA, 5.00% due 7/1/2019 (Catholic Health Care West) | | A/A3 | | | 1,365,000 | | | | 1,552,756 | |
Arizona HFA, 5.00% due 7/1/2020 (Catholic Health Care West) | | A/A3 | | | 1,290,000 | | | | 1,449,741 | |
Arizona School Facilities Board, 5.00% due 7/1/2016 (State School Land Trust; Insured: AMBAC) | | NR/NR | | | 5,775,000 | | | | 6,245,836 | |
Arizona School Facilities Board, 5.00% due 1/1/2017 pre-refunded 7/1/2015 (State School Improvement) | | AAA/Aaa | | | 1,225,000 | | | | 1,298,365 | |
Arizona School Facilities Board COP, 5.25% due 9/1/2023 (School Site and Building Projects) | | A+/A1 | | | 1,315,000 | | | | 1,434,218 | |
Arizona Transportation Board, 5.00% due 7/1/2019 | | AA+/Aa2 | | | 3,510,000 | | | | 4,125,970 | |
Arizona Transportation Board, 5.00% due 7/1/2021 | | AA+/Aa2 | | | 7,465,000 | | | | 8,850,504 | |
Arizona Transportation Board, 5.00% due 7/1/2022 | | AA+/Aa2 | | | 5,000,000 | | | | 5,862,150 | |
City of Chandler, 3.00% due 7/1/2014 | | AA/Aa3 | | | 2,790,000 | | | | 2,809,363 | |
City of Tucson, 5.00% due 7/1/2022 | | AA+/A1 | | | 2,135,000 | | | | 2,460,160 | |
City of Tucson GO, 3.625% due 7/1/2015 (Insured: Natl-Re) | | AA-/Aa3 | | | 1,750,000 | | | | 1,823,430 | |
City of Yuma Municipal Property Corp., 5.00% due 7/1/2016 (Water and Wastewater System; Insured: Syncora) | | A+/A1 | | | 2,000,000 | | | | 2,171,900 | |
City of Yuma Municipal Property Corp., 5.00% due 7/1/2018 (Water and Wastewater System; Insured: Syncora) | | A+/A1 | | | 2,130,000 | | | | 2,341,339 | |
Deer Valley USD No. 97 of Maricopa County, 4.00% due 7/1/2015 (2004 School Improvement Project; Insured: AGM) | | NR/Aa2 | | | 1,325,000 | | | | 1,387,818 | |
Glendale IDA, 5.00% due 5/15/2015 (Midwestern University) | | A-/NR | | | 1,000,000 | | | | 1,042,340 | |
Glendale IDA, 5.00% due 5/15/2016 (Midwestern University) | | A-/NR | | | 1,325,000 | | | | 1,422,374 | |
Glendale IDA, 5.00% due 5/15/2017 (Midwestern University) | | A-/NR | | | 1,440,000 | | | | 1,571,414 | |
Maricopa County IDA Health Facilities, 4.125% due 7/1/2015 (Catholic Health Care West) | | A/A3 | | | 1,600,000 | | | | 1,673,408 | |
Maricopa County IDA Health Facilities, 5.00% due 7/1/2038 put 7/1/2014 (Catholic Health Care West) | | A/A3 | | | 7,500,000 | | | | 7,588,350 | |
Maricopa County Public Finance Corp., 5.00% due 7/1/2024 (Insured: AMBAC) | | AA+/Aa1 | | | 1,000,000 | | | | 1,079,430 | |
Mesa Highway GO, 3.25% due 7/1/2016 | | AA+/Aa3 | | | 10,000,000 | | | | 10,069,100 | |
Mohave County IDA, 5.00% due 4/1/2014 (Mohave Prison LLC; Insured: Syncora) (ETM) | | AA+/NR | | | 3,135,000 | | | | 3,135,000 | |
Mohave County IDA, 7.25% due 5/1/2015 (Mohave Prison LLC) | | BBB+/NR | | | 12,100,000 | | | | 12,598,157 | |
Navajo County PCR, 5.50% due 6/1/2034 put 6/1/2014 (Arizona Public Service Co.) | | A-/A3 | | | 1,600,000 | | | | 1,613,104 | |
Navajo County PCR, 5.50% due 6/1/2034 put 6/1/2014 (Arizona Public Service Co.) | | A-/A3 | | | 2,600,000 | | | | 2,621,294 | |
Navajo County PCR, 5.75% due 6/1/2034 put 6/1/2016 (Arizona Public Service Co.) | | A-/A3 | | | 9,700,000 | | | | 10,696,675 | |
Phoenix Union High School District No. 210 of Maricopa County GO, 4.00% due 7/1/2015 (2003 School Improvement Project; Insured: Natl-Re) | | AA/Aa2 | | | 1,500,000 | | | | 1,571,700 | |
Pima County, 4.00% due 7/1/2014 (Ina & Roger Road Wastewater Reclamation Facilities) | | AA-/NR | | | 1,500,000 | | | | 1,514,535 | |
Pima County, 5.00% due 7/1/2015 (Ina & Roger Road Wastewater Reclamation Facilities) | | AA-/NR | | | 1,400,000 | | | | 1,484,392 | |
Pima County, 5.00% due 7/1/2016 (Ina & Roger Road Wastewater Reclamation Facilities) | | AA-/NR | | | 2,000,000 | | | | 2,203,480 | |
Pima County, 4.50% due 7/1/2017 (Ina & Roger Road Wastewater Reclamation Facilities; Insured: AGM) | | AA/A2 | | | 5,040,000 | | | | 5,635,274 | |
Pima County, 5.00% due 7/1/2017 (Ina & Roger Road Wastewater Reclamation Facilities) | | AA-/NR | | | 2,750,000 | | | | 3,118,830 | |
Pima County, 3.00% due 7/1/2018 (Ina & Roger Road Wastewater Reclamation Facilities) | | AA-/NR | | | 500,000 | | | | 538,040 | |
Pima County, 5.00% due 7/1/2018 (Ina & Roger Road Wastewater Reclamation Facilities; Insured: AGM) | | AA/A2 | | | 5,000,000 | | | | 5,793,900 | |
Pima County, 5.00% due 7/1/2018 (Ina & Roger Road Wastewater Reclamation Facilities) | | AA-/NR | | | 2,000,000 | | | | 2,317,560 | |
Pima County, 5.00% due 7/1/2018 (Ina & Roger Road Wastewater Reclamation Facilities) | | AA-/NR | | | 700,000 | | | | 811,146 | |
Pima County, 5.00% due 7/1/2020 (Ina & Roger Road Wastewater Reclamation Facilities) | | AA-/NR | | | 500,000 | | | | 589,805 | |
a Pima County, 3.00% due 7/1/2021 (Ina & Roger Road Wastewater Reclamation Facilities) | | AA-/NR | | | 1,200,000 | | | | 1,255,416 | |
Pima County, 5.00% due 7/1/2021 (Ina & Roger Road Wastewater Reclamation Facilities) | | AA-/NR | | | 400,000 | | | | 471,892 | |
12 Certified Semi-Annual Report
| | |
| SCHEDULE OF INVESTMENTS, CONTINUED | | |
| |
Thornburg Limited Term Municipal Fund | | March 31, 2014 (Unaudited) |
| | | | | | | | | | |
Issuer-Description | | Credit Rating†
S&P/ Moody’s | | Principal
Amount | | | Value | |
Pima County, 3.00% due 7/1/2022 (Ina & Roger Road Wastewater Reclamation Facilities) | | AA-/NR | | $ | 1,325,000 | | | $ | 1,368,619 | |
Pima County, 5.00% due 7/1/2022 (Ina & Roger Road Wastewater Reclamation Facilities) | | AA-/NR | | | 500,000 | | | | 591,235 | |
Pima County COP, 3.00% due 12/1/2014 (Sewer System & Fleet Services Facilities Expansion) | | A+/NR | | | 2,220,000 | | | | 2,261,470 | |
Pima County COP, 5.00% due 12/1/2015 (Sewer System & Fleet Services Facilities Expansion) | | A+/NR | | | 1,250,000 | | | | 1,347,150 | |
Pima County COP, 5.00% due 12/1/2016 (Sewer System & Fleet Services Facilities Expansion) | | A+/NR | | | 600,000 | | | | 668,538 | |
Pima County COP, 5.00% due 12/1/2017 (Sewer System & Fleet Services Facilities Expansion) | | A+/NR | | | 1,395,000 | | | | 1,589,951 | |
Pima County COP, 5.00% due 12/1/2019 (Sewer System & Fleet Services Facilities Expansion) | | A+/NR | | | 500,000 | | | | 578,890 | |
Pima County COP, 5.00% due 12/1/2020 (Sewer System & Fleet Services Facilities Expansion) | | A+/NR | | | 765,000 | | | | 882,871 | |
Pima County COP, 5.00% due 12/1/2021 (Sewer System & Fleet Services Facilities Expansion) | | A+/NR | | | 1,220,000 | | | | 1,403,512 | |
Pima County COP, 5.00% due 12/1/2022 (Sewer System & Fleet Services Facilities Expansion) | | A+/NR | | | 1,275,000 | | | | 1,465,472 | |
Pima County IDA, 5.00% due 7/1/2016 (Metro Police Facility) | | AA-/Aa2 | | | 2,500,000 | | | | 2,703,825 | |
Pima County IDA, 5.00% due 7/1/2017 (Metro Police Facility) | | AA-/Aa2 | | | 3,000,000 | | | | 3,299,640 | |
Pima County IDA, 5.00% due 7/1/2018 (Metro Police Facility) | | AA-/Aa2 | | | 3,285,000 | | | | 3,670,298 | |
Pima County IDA, 5.00% due 7/1/2019 (Metro Police Facility) | | AA-/Aa2 | | | 2,000,000 | | | | 2,246,600 | |
Scottsdale IDA, 5.00% due 9/1/2019 (Scottsdale Healthcare) | | A-/A2 | | | 6,885,000 | | | | 7,613,433 | |
State of Arizona COP, 5.00% due 10/1/2014 (State Dept. of Administration Lease Purchase Agreement; Insured: AGM) | | AA/A1 | | | 10,175,000 | | | | 10,415,333 | |
State of Arizona Department of Administration, 5.00% due 7/1/2018 (State Lottery; Insured: AGM) | | AA/A1 | | | 8,370,000 | | | | 9,605,161 | |
State of Arizona Department of Administration, 5.00% due 7/1/2020 (State Lottery; Insured: AGM) | | AA/A1 | | | 8,705,000 | | | | 10,063,154 | |
Town of Gilbert Public Facilities Municipal Property Corporation, 3.00% due 7/1/2015 | | AA/Aa2 | | | 1,080,000 | | | | 1,115,662 | |
University Arizona Medical Center Corp. GO, 5.00% due 7/1/2014 | | BBB+/Baa1 | | | 1,000,000 | | | | 1,010,050 | |
| | | |
ARKANSAS — 0.53% | | | | | | | | | | |
Arkansas Development Finance Authority, 2.00% due 12/1/2016 (State Dept. of Environmental Quality Project) | | AA-/NR | | | 460,000 | | | | 474,651 | |
Board of Trustees of the University of Arkansas, 1.00% due 9/15/2014 (Fayetteville Campus Athletic Facilities) | | NR/Aa2 | | | 475,000 | | | | 476,724 | |
Board of Trustees of the University of Arkansas, 1.00% due 11/1/2014 (Fayetteville Campus Capital Projects) | | NR/Aa2 | | | 295,000 | | | | 296,392 | |
Board of Trustees of the University of Arkansas, 2.00% due 9/15/2015 (Fayetteville Campus Athletic Facilities) | | NR/Aa2 | | | 455,000 | | | | 465,388 | |
Board of Trustees of the University of Arkansas, 2.00% due 11/1/2015 (Fayetteville Campus Capital Projects) | | NR/Aa2 | | | 375,000 | | | | 384,398 | |
Board of Trustees of the University of Arkansas, 2.00% due 11/1/2016 (Fayetteville Campus Capital Projects) | | NR/Aa2 | | | 600,000 | | | | 618,984 | |
Board of Trustees of the University of Arkansas, 5.00% due 9/15/2019 (Fayetteville Campus Athletic Facilities) | | NR/Aa2 | | | 600,000 | | | | 661,962 | |
City of Fort Smith, 3.00% due 10/1/2014 (Water and Sewer System Construction; Insured: AGM) | | AA/NR | | | 1,000,000 | | | | 1,013,580 | |
City of Fort Smith, 3.50% due 10/1/2016 (Water and Sewer System Construction; Insured: AGM) | | AA/NR | | | 1,370,000 | | | | 1,465,242 | |
City of Fort Smith, 3.50% due 10/1/2017 (Water and Sewer System Construction; Insured: AGM) | | AA/NR | | | 1,930,000 | | | | 2,091,367 | |
City of Fort Smith, 4.00% due 10/1/2018 (Water and Sewer System Construction; Insured: AGM) | | AA/NR | | | 1,000,000 | | | | 1,111,840 | |
City of Fort Smith, 4.00% due 10/1/2019 (Water and Sewer System Construction; Insured: AGM) | | AA/NR | | | 1,670,000 | | | | 1,859,679 | |
Independence County PCR, 4.90% due 7/1/2022 (Entergy Mississippi, Inc.; Insured: AMBAC) | | NR/A3 | | | 6,400,000 | | | | 6,511,040 | |
Jefferson County, 4.00% due 6/1/2015 (Jefferson Regional Medical Center; Insured: AGM) | | AA/NR | | | 1,005,000 | | | | 1,043,019 | |
Jefferson County, 4.00% due 6/1/2016 (Jefferson Regional Medical Center; Insured: AGM) | | AA/NR | | | 1,395,000 | | | | 1,475,491 | |
Jefferson County, 4.00% due 6/1/2017 (Jefferson Regional Medical Center; Insured: AGM) | | AA/NR | | | 1,375,000 | | | | 1,468,115 | |
Jefferson County, 1.55% due 10/1/2017 (Entergy Arkansas, Inc. Project) | | A-/A3 | | | 10,000,000 | | | | 10,075,700 | |
Jefferson County, 4.50% due 6/1/2018 (Jefferson Regional Medical Center; Insured: AGM) | | AA/NR | | | 1,495,000 | | | | 1,631,763 | |
Jefferson County, 4.50% due 6/1/2019 (Jefferson Regional Medical Center; Insured: AGM) | | AA/NR | | | 1,580,000 | | | | 1,739,201 | |
| | | |
CALIFORNIA — 7.57% | | | | | | | | | | |
Alameda County COP, 5.00% due 12/1/2017 (Santa Rita Jail; Insured: AMBAC) | | AA/NR | | | 1,220,000 | | | | 1,386,249 | |
Alameda County Joint Powers Authority, 5.00% due 12/1/2021 (Alameda County Medical Center Highland Hospital) | | AA/Aa3 | | | 1,000,000 | | | | 1,176,760 | |
Alameda County Joint Powers Authority, 5.00% due 12/1/2022 (Alameda County Medical Center Highland Hospital) | | AA/Aa3 | | | 2,000,000 | | | | 2,357,200 | |
Alameda County Joint Powers Authority, 5.00% due 12/1/2023 (Alameda County Medical Center Highland Hospital) | | AA/Aa3 | | | 3,200,000 | | | | 3,771,680 | |
Anaheim Public Financing Authority, 0% due 9/1/2022 (Public Improvements Project; Insured: AGM) | | AA/A2 | | | 3,250,000 | | | | 2,443,675 | |
Brentwood Infrastructure, 2.00% due 11/1/2015 (Insured: AGM) | | AA/NR | | | 520,000 | | | | 529,438 | |
Brentwood Infrastructure, 4.00% due 11/1/2016 (Insured: AGM) | | AA/NR | | | 325,000 | | | | 345,761 | |
Brentwood Infrastructure, 5.00% due 11/1/2017 (Insured: AGM) | | AA/NR | | | 965,000 | | | | 1,063,411 | |
Brentwood Infrastructure, 5.25% due 11/1/2018 (Insured: AGM) | | AA/NR | | | 1,020,000 | | | | 1,147,286 | |
Brentwood Infrastructure, 5.25% due 11/1/2019 (Insured: AGM) | | AA/NR | | | 725,000 | | | | 820,301 | |
Cabrillo USD GO, 0% due 8/1/2015 (Educational Facilities Projects; Insured: AMBAC) | | NR/NR | | | 1,000,000 | | | | 991,180 | |
Cabrillo USD GO, 0% due 8/1/2021 (Educational Facilities; Insured: AMBAC) | | NR/NR | | | 1,000,000 | | | | 768,960 | |
California Educational Facilities Authority, 5.00% due 4/1/2017 (Pitzer College) | | NR/A2 | | | 1,460,000 | | | | 1,631,959 | |
California Educational Facilities Authority, 5.00% due 4/1/2021 (Chapman University) | | NR/A2 | | | 4,870,000 | | | | 5,618,860 | |
California HFFA, 5.50% due 2/1/2017 (Community Developmental Disabilities Program; Insured: California Mtg Insurance) | | A/NR | | | 2,575,000 | | | | 2,866,438 | |
California HFFA, 5.50% due 2/1/2019 (Community Developmental Disabilities Program; Insured: California Mtg Insurance) | | A/NR | | | 2,865,000 | | | | 3,316,553 | |
California HFFA, 5.75% due 2/1/2020 (Community Developmental Disabilities Program; Insured: California Mtg Insurance) | | A/NR | | | 1,975,000 | | | | 2,323,844 | |
California HFFA, 5.00% due 3/1/2020 (Catholic HealthCare West Health Facilities) | | A/A3 | | | 4,400,000 | | | | 5,030,960 | |
California HFFA, 5.75% due 2/1/2021 (Community Developmental Disabilities Program; Insured: California Mtg Insurance) | | A/NR | | | 1,695,000 | | | | 1,979,913 | |
California HFFA, 5.00% due 3/1/2021 (Catholic HealthCare West Health Facilities) | | A/A3 | | | 3,450,000 | | | | 3,929,343 | |
California HFFA, 5.25% due 3/1/2022 (Catholic HealthCare West Health Facilities) | | A/A3 | | | 7,020,000 | | | | 8,026,668 | |
California HFFA, 5.00% due 7/1/2027 put 7/1/2014 (Catholic HealthCare West Health Facilities) | | A/A3 | | | 3,500,000 | | | | 3,542,315 | |
California HFFA, 5.00% due 7/1/2028 put 7/1/2014 (Catholic HealthCare West Health Facilities) | | A/A3 | | | 2,000,000 | | | | 2,022,960 | |
Certified Semi-Annual Report 13
| | |
| SCHEDULE OF INVESTMENTS, CONTINUED | | |
| |
Thornburg Limited Term Municipal Fund | | March 31, 2014 (Unaudited) |
| | | | | | | | | | |
Issuer-Description | | Credit Rating†
S&P/ Moody’s | | Principal
Amount | | | Value | |
California HFFA, 5.00% due 7/1/2043 put 10/15/2020 (St. Joseph Health System) | | AA-/A1 | | $ | 5,000,000 | | | $ | 5,815,200 | |
California State Department of Transportation COP, 5.25% due 3/1/2016 (Insured: Natl-Re) | | AA-/A2 | | | 570,000 | | | | 572,371 | |
California State Department of Water Resources, 5.00% due 5/1/2015 (DWR Power Supply Program) | | AA-/Aa2 | | | 5,000,000 | | | | 5,260,700 | |
California State Department of Water Resources, 5.00% due 5/1/2016 | | AA-/Aa2 | | | 5,000,000 | | | | 5,476,350 | |
California State Economic Recovery GO, 5.00% due 7/1/2018 | | AA/Aa2 | | | 4,000,000 | | | | 4,656,800 | |
California State Economic Recovery GO, 5.00% due 7/1/2020 | | AA/Aa2 | | | 4,200,000 | | | | 4,954,530 | |
California State Housing Finance Agency, 2.50% due 12/1/2017 (One Santa Fe Apartments-MFH; Collateralized: GNMA) | | NR/Aa1 | | | 1,725,000 | | | | 1,755,550 | |
California State Public Works Board, 3.00% due 4/1/2014 (Various Capital Projects) | | A-/A2 | | | 250,000 | | | | 250,000 | |
California State Public Works Board, 5.00% due 9/1/2016 (Regents of University of California; Insured: Natl-Re) (ETM) | | AA+/Aaa | | | 3,000,000 | | | | 3,326,670 | |
California State Public Works Board, 5.00% due 9/1/2017 (Regents of University of California; Insured: Natl-Re) (ETM) | | AA+/Aaa | | | 3,000,000 | | | | 3,420,870 | |
California State Public Works Board, 5.00% due 11/1/2017 (California State University) | | A-/Aa3 | | | 3,000,000 | | | | 3,428,100 | |
California State Public Works Board, 5.00% due 11/1/2018 (California State University) | | A-/Aa3 | | | 2,700,000 | | | | 3,129,894 | |
California State Public Works Board, 5.00% due 4/1/2020 (Riverside Campus) | | A-/A2 | | | 1,585,000 | | | | 1,846,034 | |
California State Public Works Board, 5.00% due 6/1/2020 (Yuba City Courthouse) | | A-/A2 | | | 1,675,000 | | | | 1,953,938 | |
California State Public Works Board, 5.00% due 6/1/2020 (Coalinga State Hospital) | | A-/A2 | | | 5,685,000 | | | | 6,631,723 | |
California State Public Works Board, 5.00% due 10/1/2020 (California State University) | | A-/A2 | | | 1,000,000 | | | | 1,169,870 | |
California State Public Works Board, 5.00% due 11/1/2020 (Various Capital Projects) | | A-/A2 | | | 1,500,000 | | | | 1,755,855 | |
California State Public Works Board, 5.00% due 4/1/2021 (Riverside Campus) | | A-/A2 | | | 890,000 | | | | 1,037,375 | |
California State Public Works Board, 5.00% due 6/1/2021 (Yuba City Courthouse) | | A-/A2 | | | 1,250,000 | | | | 1,459,950 | |
California State Public Works Board, 5.00% due 6/1/2021 (Coalinga State Hospital) | | A-/A2 | | | 5,000,000 | | | | 5,839,800 | |
California State Public Works Board, 5.00% due 10/1/2021 (Various Capital Projects) | | A-/A2 | | | 1,000,000 | | | | 1,172,620 | |
California State Public Works Board, 5.00% due 11/1/2021 (Various Capital Projects) | | A-/A2 | | | 1,750,000 | | | | 2,053,975 | |
California State Public Works Board, 5.00% due 11/1/2021 (Laboratory Facility and San Diego Courthouse) | | A-/A2 | | | 750,000 | | | | 880,275 | |
California State Public Works Board, 5.00% due 4/1/2022 (California School for the Deaf Riverside Campus) | | A-/A2 | | | 500,000 | | | | 585,010 | |
California State Public Works Board, 5.00% due 6/1/2022 (Coalinga State Hospital) | | A-/A2 | | | 11,555,000 | | | | 13,524,896 | |
California State Public Works Board, 5.00% due 11/1/2022 (Laboratory Facility and San Diego Courthouse) | | A-/A2 | | | 10,075,000 | | | | 11,799,941 | |
California State Public Works Board, 5.00% due 6/1/2023 (Yuba City Courthouse) | | A-/A2 | | | 1,900,000 | | | | 2,216,065 | |
California State Public Works Board, 5.00% due 11/1/2024 (Laboratory Facility and San Diego Courthouse) | | A-/A2 | | | 2,050,000 | | | | 2,366,417 | |
California Statewide Communities Development Authority, 5.00% due 4/1/2019 (Kaiser Foundation Hospitals) | | A+/NR | | | 27,000,000 | | | | 31,536,000 | |
California Statewide Communities Development Authority, 5.00% due 7/1/2020 (Aspire Public Schools; LOC: PCSD Guaranty Pool I, LLC) | | NR/NR | | | 2,080,000 | | | | 2,075,424 | |
Castaic Lake Water Agency COP, 0% due 8/1/2023 (Water System Improvement; Insured: AMBAC) | | AA/NR | | | 10,125,000 | | | | 7,348,219 | |
Castaic USD GO, 0% due 5/1/2018 (Insured: Natl-Re) | | AA-/NR | | | 4,870,000 | | | | 4,171,058 | |
Central Valley Financing Authority, 5.00% due 7/1/2017 (Carson Ice) | | AA-/A1 | | | 600,000 | | | | 677,580 | |
Central Valley Financing Authority, 5.00% due 7/1/2019 (Carson Ice) | | AA-/A1 | | | 1,750,000 | | | | 2,038,837 | |
Chula Vista COP, 5.25% due 3/1/2018 | | AA-/NR | | | 1,170,000 | | | | 1,331,355 | |
Chula Vista COP, 5.25% due 3/1/2019 | | AA-/NR | | | 1,235,000 | | | | 1,420,411 | |
City and County of San Francisco GO, 5.00% due 6/15/2015 (Various Capital Projects) | | AA+/Aa1 | | | 18,385,000 | | | | 19,470,267 | |
Clovis USD GO, 0% due 8/1/2019 (Insured: Natl-Re) | | AA/Baa1 | | | 2,685,000 | | | | 2,380,628 | |
Community Facilities District No. 86-1 of the Irvine USD, 5.25% due 9/1/2017 (Educational Facilities; Insured: AGM) | | AA/NR | | | 5,000,000 | | | | 5,597,200 | |
Community Facilities District No. 86-1 of the Irvine USD, 5.25% due 9/1/2018 (Insured: AGM) | | AA/NR | | | 3,000,000 | | | | 3,420,930 | |
Community Facilities District No. 86-1 of the Irvine USD, 5.25% due 9/1/2019 (Insured: AGM) | | AA/NR | | | 3,000,000 | | | | 3,433,290 | |
County of Los Angeles COP, 0% due 3/1/2017 (Disney Parking Garage and Walt Disney Concert Hall) | | AA/A1 | | | 1,075,000 | | | | 1,031,151 | |
County of Los Angeles COP, 0% due 9/1/2017 (Disney Parking Garage and Walt Disney Concert Hall; Insured: AMBAC) | | AA/A1 | | | 1,200,000 | | | | 1,139,604 | |
Escondido Union High School District GO, 0% due 11/1/2020 (Insured:
Natl-Re) | | AA-/Baa1 | | | 2,655,000 | | | | 2,145,373 | |
Inland Valley Development Agency, 5.50% due 4/1/2014 (ETM) | | NR/NR | | | 2,000,000 | | | | 2,000,000 | |
Kern Community College District COP, 4.00% due 4/1/2014 | | SP-1+/NR | | | 12,000,000 | | | | 12,000,000 | |
Los Angeles Convention and Exhibition Center Authority, 5.00% due 8/15/2018 | | A+/A2 | | | 2,295,000 | | | | 2,635,027 | |
Los Angeles County Metropolitan Transportation Authority, 5.00% due 7/1/2019 pre-refunded 7/1/2014 (Metro Orange Line Transit System; Insured: Natl-Re) | | AA+/Aa3 | | | 2,185,000 | | | | 2,211,198 | |
Los Angeles County Public Works Financing Authority, 5.00% due 8/1/2019 (Multiple Capital Projects) | | AA/A1 | | | 17,935,000 | | | | 20,974,444 | |
Los Angeles County Public Works Financing Authority, 5.00% due 8/1/2018 (Multiple Capital Projects) | | AA/A1 | | | 4,000,000 | | | | 4,631,240 | |
Los Angeles USD COP, 5.00% due 10/1/2017 (Information Technology; Insured: AMBAC) | | A+/A1 | | | 2,445,000 | | | | 2,773,290 | |
Los Angeles USD COP, 5.50% due 12/1/2018 (Educational Facilities and Information Technology Projects) | | A+/A1 | | | 4,600,000 | | | | 5,418,156 | |
Los Angeles USD COP, 5.50% due 12/1/2019 (Educational Facilities Improvements) | | A+/A1 | | | 7,040,000 | | | | 8,361,056 | |
Los Angeles USD GO, 5.00% due 7/1/2018 (Educational Facilities Improvements; Insured: AGM) | | AA/Aa2 | | | 4,000,000 | | | | 4,516,160 | |
Monterey County COP, 5.00% due 8/1/2016 (Insured: AGM) | | AA/A1 | | | 1,435,000 | | | | 1,568,240 | |
Monterey County COP, 5.00% due 8/1/2018 (Insured: AGM) | | AA/A1 | | | 2,260,000 | | | | 2,560,580 | |
Mount San Antonio Community College GO, 0% due 8/1/2017 (Insured: Natl-Re) (ETM) | | AA/Aa2 | | | 5,000,000 | | | | 4,851,150 | |
Needles USD GO, 0% due 8/1/2023 | | AA-/Baa1 | | | 1,005,000 | | | | 629,683 | |
North City West School Facilities Financing Authority, 5.00% due 9/1/2023 (Carmel Valley Educational Facilities; Insured: AGM) | | AA/NR | | | 4,545,000 | | | | 5,108,625 | |
Northern California Power Agency, 5.00% due 7/1/2017 (Hydroelectric Project) | | A+/A1 | | | 1,000,000 | | | | 1,136,190 | |
Northern California Power Agency, 5.00% due 6/1/2018 (Lodi Energy Center) | | A-/A2 | | | 4,480,000 | | | | 5,188,915 | |
Northern California Power Agency, 5.00% due 7/1/2019 (Hydroelectric Project) | | A+/A1 | | | 1,000,000 | | | | 1,176,600 | |
Northern California Power Agency, 5.00% due 7/1/2020 (Hydroelectric Project) | | A+/A1 | | | 1,325,000 | | | | 1,525,724 | |
14 Certified Semi-Annual Report
| | |
| SCHEDULE OF INVESTMENTS, CONTINUED | | |
| |
Thornburg Limited Term Municipal Fund | | March 31, 2014 (Unaudited) |
| | | | | | | | | | |
Issuer-Description | | Credit Rating†
S&P/ Moody’s | | Principal
Amount | | | Value | |
Orange County Public Financing Authority, 5.00% due 7/1/2017 (Insured: Natl-Re) | | AA-/Aa3 | | $ | 1,245,000 | | | $ | 1,406,402 | |
Palo Alto USD GO, 0% due 8/1/2019 | | AAA/Aa1 | | | 1,000,000 | | | | 904,610 | |
Palomar Community College District GO, 0% due 8/1/2021 | | AA-/Aa2 | | | 2,560,000 | | | | 2,072,627 | |
Redding Electrical Systems COP, 5.00% due 6/1/2020 (Insured: AGM) | | NR/A2 | | | 3,955,000 | | | | 4,434,979 | |
Regents of the University of California, 5.00% due 5/15/2019 (Higher Education Facilities; Insured: AGM) | | AA/Aa2 | | | 4,245,000 | | | | 4,509,930 | |
Rocklin USD GO, 0% due 8/1/2022 (Insured: Natl-Re) | | AA-/Aa2 | | | 3,910,000 | | | | 2,984,972 | |
Sacramento City Financing Authority, 0% due 12/1/2019 (Merged Downtown & Oak Park; Insured: Natl-Re) | | AA-/Baa1 | | | 2,920,000 | | | | 2,394,517 | |
Sacramento City Financing Authority, 0% due 12/1/2021 (Merged Downtown & Oak Park; Insured: Natl-Re) | | AA-/Baa1 | | | 1,600,000 | | | | 1,158,576 | |
Sacramento City USD GO, 5.00% due 7/1/2021 (Educational Facilities Improvements) | | A+/A1 | | | 3,265,000 | | | | 3,797,293 | |
a Sacramento Cogeneration Authority, 5.00% due 7/1/2017 (Insured: AMBAC) | | BBB-/NR | | | 8,290,000 | | | | 8,642,491 | |
Sacramento Cogeneration Authority, 5.00% due 7/1/2017 (Procter & Gamble) | | AA-/A1 | | | 750,000 | | | | 846,975 | |
Sacramento Municipal Utility District, 5.00% due 7/1/2016 (Cosumnes Project; Insured: Natl-Re) | | AA-/A3 | | | 4,870,000 | | | | 5,284,047 | |
Sacramento Municipal Utility District, 5.00% due 7/1/2019 (Cosumnes Project; Insured: Natl-Re) | | AA-/A3 | | | 5,000,000 | | | | 5,429,800 | |
Sacramento Municipal Utility District, 5.00% due 7/1/2020 (Cosumnes Project; Insured: Natl-Re) | | AA-/A3 | | | 8,675,000 | | | | 9,348,006 | |
San Diego Convention Center Expansion Financing Authority, 5.00% due 4/15/2020 | | AA-/NR | | | 4,000,000 | | | | 4,564,320 | |
San Diego Convention Center Expansion Financing Authority, 5.00% due 4/15/2021 | | AA-/NR | | | 3,000,000 | | | | 3,427,500 | |
San Diego Convention Center Expansion Financing Authority, 5.00% due 4/15/2022 | | AA-/NR | | | 8,000,000 | | | | 9,174,800 | |
San Diego Redevelopment Agency, 4.50% due 9/1/2019 (Centre City Redevelopment; Insured: AMBAC) | | NR/Baa3 | | | 1,240,000 | | | | 1,278,601 | |
San Diego USD GO, 5.50% due 7/1/2020 (Educational System Capital Projects; Insured: Natl-Re) | | AA-/Aa3 | | | 10,000,000 | | | | 11,939,600 | |
San Francisco Bay Area Rapid Transit District, 5.00% due 7/1/2022 (Insured: Natl-Re) | | AA+/Aa2 | | | 1,220,000 | | | | 1,286,197 | |
San Joaquin Delta Community College District GO, 0% due 8/1/2019 (Insured: AGM) | | AA/Aa2 | | | 7,600,000 | | | | 6,556,900 | |
San Jose Redevelopment Agency, 6.00% due 8/1/2015 (Insured: Natl-Re) | | AA-/Baa1 | | | 2,780,000 | | | | 2,949,469 | |
San Juan USD GO, 0% due 8/1/2015 (Sacramento County Educational Facilities; Insured: AGM) | | AA/Aa2 | | | 760,000 | | | | 754,247 | |
Santa Ana Financing Authority, 6.25% due 7/1/2018 (Police Administration & Holding Facility; Insured: Natl-Re) | | AA-/Baa1 | | | 4,035,000 | | | | 4,746,451 | |
Santa Ana USD GO, 0% due 8/1/2019 (Insured: Natl-Re) | | AA-/Baa1 | | | 3,425,000 | | | | 3,047,976 | |
Santa Clara County Financing Authority, 4.00% due 5/15/2014 (Multiple Facilities) | | AA+/A1 | | | 4,245,000 | | | | 4,265,164 | |
Santa Fe Springs Community Development Commission, 0% due 9/1/2024 (Consolidated Redevelopment Project; Insured: Natl-Re) | | AA-/Baa1 | | | 7,000,000 | | | | 4,422,740 | |
Solano County COP, 5.00% due 11/15/2017 | | AA-/A1 | | | 1,580,000 | | | | 1,773,787 | |
South San Francisco USD GO, 4.00% due 6/15/2018 (Educational Facilities) | | SP-1+/NR | | | 5,130,000 | | | | 5,735,956 | |
Southeast Resource Recovery Facilities Authority, 5.25% due 12/1/2017 (Insured: AMBAC) | | A+/A2 | | | 2,000,000 | | | | 2,007,780 | |
State of California GO, 4.75% due 4/1/2018 (Various Purposes) | | A/A1 | | | 1,250,000 | | | | 1,426,763 | |
State of California GO, 5.00% due 9/1/2020 (Various Purposes) | | A/A1 | | | 10,000,000 | | | | 11,813,200 | |
State of California GO, 5.00% due 9/1/2021 (Various Purposes) | | A/A1 | | | 5,000,000 | | | | 5,921,750 | |
Tuolumne Wind Project Authority, 5.00% due 1/1/2018 | | A+/A2 | | | 2,000,000 | | | | 2,274,680 | |
Tuolumne Wind Project Authority, 5.00% due 1/1/2019 (Tuolumne Co.) | | A+/A2 | | | 2,000,000 | | | | 2,303,860 | |
Tustin Community Redevelopment Agency, 4.00% due 9/1/2017 (Tustin Redevelopment) | | A/NR | | | 935,000 | | | | 1,000,581 | |
Tustin Community Redevelopment Agency, 4.00% due 9/1/2019 (Tustin Redevelopment) | | A/NR | | | 1,010,000 | | | | 1,083,932 | |
Tustin Community Redevelopment Agency, 4.00% due 9/1/2020 (Tustin Redevelopment) | | A/NR | | | 1,050,000 | | | | 1,114,197 | |
Twin Rivers USD GO, 0% due 4/1/2014 (Educational Facilities) | | SP-1/NR | | | 3,490,000 | | | | 3,490,000 | |
Ventura County COP, 5.00% due 8/15/2016 | | AA+/Aa3 | | | 1,520,000 | | | | 1,673,976 | |
Ventura County COP, 5.25% due 8/15/2017 | | AA+/Aa3 | | | 1,635,000 | | | | 1,860,189 | |
West Contra Costa USD GO, 0% due 8/1/2022 (Educational Facilities Projects; Insured: AGM) | | AA/Aa3 | | | 4,000,000 | | | | 2,999,120 | |
West Covina Redevelopment Agency, 6.00% due 9/1/2022 (Fashion Plaza) | | AA+/NR | | | 6,180,000 | | | | 6,995,945 | |
| | | |
COLORADO — 1.84% | | | | | | | | | | |
Adams County Platte Valley Medical Center, 5.00% due 2/1/2015 (Brighton Community Hospital Association; Insured: Natl-Re/FHA) (ETM) | | AA-/NR | | | 1,475,000 | | | | 1,533,174 | |
Adams County Platte Valley Medical Center, 5.00% due 8/1/2015 (Brighton Community Hospital Association; Insured: Natl- Re/FHA) (ETM) | | AA-/NR | | | 1,505,000 | | | | 1,598,762 | |
Beacon Point Metropolitan District, 4.375% due 12/1/2015 (LOC: Compass Bank) | | BBB-/NR | | | 220,000 | | | | 220,378 | |
Castle Oaks Metropolitan District GO, 6.125% due 12/1/2035 pre-refunded 12/1/2015 | | NR/NR | | | 1,428,000 | | | | 1,557,834 | |
City & County of Denver Airport System, 5.00% due 11/15/2016 (Insured: Natl-Re) | | AA-/A1 | | | 1,725,000 | | | | 1,917,872 | |
City & County of Denver Airport System, 5.00% due 11/15/2017 (Insured: Natl-Re) | | AA-/A1 | | | 1,000,000 | | | | 1,140,410 | |
City & County of Denver Airport System, 0.24% due 11/15/2025 put 4/1/2014 (Denver International Airport; Insured: AGM; SPA: Morgan Stanley Bank) (daily demand notes) | | AA/A1 | | | 200,000 | | | | 200,000 | |
City & County of Denver Airport System, 0.28% due 11/15/2025 put 4/1/2014 (Denver International Airport; Insured: AGM; SPA: Morgan Stanley Bank) (daily demand notes) | | AA/A1 | | | 11,710,000 | | | | 11,710,000 | |
City & County of Denver COP, 5.00% due 5/1/2014 (Human Services Center Properties; Insured: MBIA) | | AA+/Aa1 | | | 4,000,000 | | | | 4,015,520 | |
City & County of Denver COP, 5.00% due 12/1/2020 (Buell Theatre Property) | | AA+/Aa1 | | | 3,065,000 | | | | 3,565,913 | |
City & County of Denver COP, 5.00% due 12/1/2021 (Buell Theatre Property) | | AA+/Aa1 | | | 3,825,000 | | | | 4,446,907 | |
City & County of Denver COP, 5.00% due 12/1/2023 (Buell Theatre Property) | | AA+/Aa1 | | | 1,720,000 | | | | 2,008,289 | |
City & County of Denver COP, 0.07% due 12/1/2029 put 4/1/2014 (Wellington E. Webb Municipal Office Building; SPA: JPMorgan Chase Bank, N.A.) (daily demand notes) | | AA+/Aa1 | | | 3,530,000 | | | | 3,530,000 | |
City & County of Denver COP, 0.07% due 12/1/2029 put 4/1/2014 (Wellington E. Webb Municipal Office Building; SPA: JPMorgan Chase Bank, N.A.) (daily demand notes) | | AA+/Aa1 | | | 2,500,000 | | | | 2,500,000 | |
Certified Semi-Annual Report 15
| | |
| SCHEDULE OF INVESTMENTS, CONTINUED | | |
| |
Thornburg Limited Term Municipal Fund | | March 31, 2014 (Unaudited) |
| | | | | | | | | | |
Issuer-Description | | Credit Rating†
S&P/ Moody’s | | Principal
Amount | | | Value | |
City & County of Denver COP, 0.07% due 12/1/2031 put 4/1/2014 (Wellington E. Webb Municipal Office Building; SPA: JPMorgan Chase Bank, N.A.) (daily demand notes) | | AA+/Aa1 | | $ | 3,590,000 | | | $ | 3,590,082 | |
City & County of Denver GO, 3.00% due 8/1/2015 (Civic Facilities and Denver Zoological Gardens Improvements) | | AAA/Aaa | | | 720,000 | | | | 747,288 | |
City & County of Denver School District No. 1 COP, 4.00% due 12/15/2016 (Eastbridge Elementary and Conservatory Green K-8 Schools) | | NR/Aa3 | | | 350,000 | | | | 379,831 | |
City & County of Denver School District No. 1 COP, 4.00% due 12/15/2019 (Eastbridge Elementary and Conservatory Green K-8 Schools) | | NR/Aa3 | | | 400,000 | | | | 440,372 | |
City & County of Denver School District No. 1 COP, 4.00% due 12/15/2020 (Eastbridge Elementary and Conservatory Green K-8 Schools) | | NR/Aa3 | | | 600,000 | | | | 654,912 | |
City & County of Denver School District No. 1 COP, 5.00% due 12/15/2021 (Eastbridge Elementary and Conservatory Green K-8 Schools) | | NR/Aa3 | | | 1,000,000 | | | | 1,150,590 | |
City & County of Denver School District No. 1 COP, 5.00% due 12/15/2022 (Eastbridge Elementary and Conservatory Green K-8 Schools) | | NR/Aa3 | | | 1,030,000 | | | | 1,180,555 | |
City & County of Denver School District No. 1 COP, 5.00% due 12/15/2023 (Eastbridge Elementary and Conservatory Green K-8 Schools) | | NR/Aa3 | | | 1,180,000 | | | | 1,352,268 | |
City of Longmont, 6.00% due 5/15/2019 | | AA+/NR | | | 3,215,000 | | | | 3,860,379 | |
Colorado Department of Corrections COP, 5.00% due 3/1/2016 (Colorado Penitentiary II Project) (ETM) | | AA-/Aa2 | | | 2,000,000 | | | | 2,174,140 | |
Colorado Department of Corrections COP, 5.00% due 3/1/2017 (Colorado Penitentiary II Project) (ETM) | | AA-/Aa2 | | | 2,000,000 | | | | 2,245,640 | |
Colorado Department of Corrections COP, 5.00% due 3/1/2018 (Colorado Penitentiary II Project) (ETM) | | AA-/Aa2 | | | 1,590,000 | | | | 1,830,646 | |
Colorado Department of Corrections COP, 5.00% due 3/1/2019 pre-refunded 3/1/2016 (Colorado Penitentiary II Project; Insured: AMBAC) | | AA-/Aa2 | | | 4,930,000 | | | | 5,365,220 | |
Colorado Educational & Cultural Facilities, 4.00% due 6/1/2014 (NCSL) | | A/A3 | | | 660,000 | | | | 663,439 | |
Colorado Educational & Cultural Facilities, 5.00% due 6/1/2016 (NCSL) | | A/A3 | | | 1,475,000 | | | | 1,592,012 | |
Colorado Educational & Cultural Facilities, 5.00% due 6/1/2018 (NCSL) | | A/A3 | | | 1,625,000 | | | | 1,817,303 | |
Colorado Educational & Cultural Facilities, 5.00% due 6/1/2020 (NCSL) | | A/A3 | | | 1,805,000 | | | | 2,043,242 | |
Colorado Educational & Cultural Facilities, 5.00% due 6/1/2021 (NCSL) | | A/A3 | | | 1,000,000 | | | | 1,122,220 | |
Colorado HFA, 5.00% due 11/15/2015 (Adventist Health/Sunbelt Group) | | AA-/Aa3 | | | 2,365,000 | | | | 2,541,429 | |
Colorado HFA, 5.25% due 5/15/2017 (Northern Colorado Medical Center; Insured: AGM) | | AA/NR | | | 1,185,000 | | | | 1,325,257 | |
Colorado HFA, 5.25% due 5/15/2019 (Northern Colorado Medical Center; Insured: AGM) | | AA/NR | | | 2,225,000 | | | | 2,588,342 | |
Colorado HFA, 5.50% due 10/1/2038 put 11/12/2015 (Catholic Health Initiatives) | | A+/A1 | | | 1,000,000 | | | | 1,081,550 | |
Colorado HFA, 5.00% due 7/1/2039 put 11/11/2014 (Catholic Health Initiatives) | | A+/A1 | | | 3,000,000 | | | | 3,085,440 | |
Denver Convention Center Hotel Authority, 5.25% due 12/1/2014 (Insured: Syncora) | | BBB-/Baa3 | | | 3,450,000 | | | | 3,548,497 | |
Denver Convention Center Hotel Authority, 5.25% due 12/1/2021 (Insured: Syncora) | | BBB-/Baa3 | | | 3,700,000 | | | | 3,872,013 | |
Denver Convention Center Hotel Authority, 5.25% due 12/1/2022 (Insured: Syncora) | | BBB-/Baa3 | | | 1,100,000 | | | | 1,148,730 | |
Denver West Metropolitan District GO, 5.00% due 12/1/2021 (Insured: AGM) | | AA/NR | | | 2,175,000 | | | | 2,490,875 | |
E-470 Public Highway Authority, 0% due 9/1/2014 (Insured: Natl-Re) | | AA-/Baa1 | | | 1,910,000 | | | | 1,902,704 | |
El Paso County COP, 4.00% due 12/1/2021 (Pikes Peak Regional Development Center) | | AA-/Aa2 | | | 1,000,000 | | | | 1,081,880 | |
El Paso County COP, 5.00% due 12/1/2023 (Pikes Peak Regional Development Center) | | AA-/Aa2 | | | 1,330,000 | | | | 1,527,625 | |
Park Creek Metropolitan District, 5.00% due 12/1/2015 (Insured: AGM) | | AA/NR | | | 1,000,000 | | | | 1,069,070 | |
Park Creek Metropolitan District, 5.00% due 12/1/2016 (Insured: AGM) | | AA/NR | | | 1,035,000 | | | | 1,140,187 | |
Park Creek Metropolitan District, 5.00% due 12/1/2017 (Insured: AGM) | | AA/NR | | | 1,525,000 | | | | 1,711,874 | |
Park Creek Metropolitan District, 5.50% due 12/1/2018 (Insured: AGM) | | AA/NR | | | 1,200,000 | | | | 1,390,536 | |
Park Creek Metropolitan District, 5.50% due 12/1/2019 (Insured: AGM) | | AA/NR | | | 1,000,000 | | | | 1,169,040 | |
Regents of the University of Colorado COP, 5.00% due 11/1/2016 (UCDHSC Fitzsimons Academic Facilities) | | AA-/Aa2 | | | 700,000 | | | | 778,435 | |
Regents of the University of Colorado COP, 5.00% due 11/1/2017 (UCDHSC Fitzsimons Academic Facilities) | | AA-/Aa2 | | | 850,000 | | | | 970,649 | |
Regional Transportation District COP, 5.00% due 6/1/2018 | | A/Aa3 | | | 1,750,000 | | | | 2,003,575 | |
Regional Transportation District COP, 5.00% due 6/1/2019 | | A/Aa3 | | | 4,730,000 | | | | 5,439,405 | |
Regional Transportation District COP, 5.00% due 6/1/2020 | | A/Aa3 | | | 3,655,000 | | | | 4,181,210 | |
Regional Transportation District COP, 5.50% due 6/1/2021 | | A/Aa3 | | | 2,370,000 | | | | 2,740,715 | |
Southlands Metropolitan District GO, 6.75% due 12/1/2016 pre-refunded 12/1/2014 | | AA+/NR | | | 500,000 | | | | 520,540 | |
| | | |
CONNECTICUT — 0.27% | | | | | | | | | | |
Capital City EDA, 5.00% due 6/15/2015 (Adriaen’s Landing Convention Center; Insured: AGM) | | AA/A2 | | | 1,705,000 | | | | 1,721,879 | |
City of West Haven GO, 4.00% due 8/1/2018 (Insured: AGM) | | AA/A2 | | | 2,080,000 | | | | 2,246,837 | |
State of Connecticut GO, 5.00% due 6/1/2019 (General State Capital Projects; Insured: AGM) | | AA/Aa3 | | | 2,865,000 | | | | 3,137,605 | |
State of Connecticut GO Floating Rate Note, 0.83% due 9/15/2018 (General State Capital Projects) | | AA/Aa3 | | | 725,000 | | | | 731,192 | |
State of Connecticut GO Floating Rate Note, 0.71% due 9/15/2024 (Education Capital Projects) | | AA/Aa3 | | | 10,000,000 | | | | 10,050,100 | |
| | | |
DELAWARE — 0.03% | | | | | | | | | | |
State of Delaware GO, 5.00% due 7/1/2014 | | AAA/Aaa | | | 860,000 | | | | 870,526 | |
State of Delaware GO, 5.25% due 8/1/2014 | | AAA/Aaa | | | 1,000,000 | | | | 1,017,150 | |
| | | |
DISTRICT OF COLUMBIA — 0.71% | | | | | | | | | | |
District of Columbia, 4.00% due 4/1/2015 (National Public Radio) (ETM) | | AA-/Aa3 | | | 1,000,000 | | | | 1,037,070 | |
District of Columbia, 5.00% due 4/1/2016 (National Public Radio) (ETM) | | AA-/Aa3 | | | 685,000 | | | | 746,629 | |
16 Certified Semi-Annual Report
| | |
| SCHEDULE OF INVESTMENTS, CONTINUED | | |
| |
Thornburg Limited Term Municipal Fund | | March 31, 2014 (Unaudited) |
| | | | | | | | | | |
Issuer-Description | | Credit Rating†
S&P/ Moody’s | | Principal
Amount | | | Value | |
District of Columbia, 4.00% due 4/1/2017 (National Public Radio) | | AA-/Aa3 | | $ | 1,830,000 | | | $ | 1,996,127 | |
District of Columbia, 5.00% due 4/1/2018 (National Public Radio) | | AA-/Aa3 | | | 1,745,000 | | | | 1,997,362 | |
District of Columbia, 5.00% due 4/1/2019 (National Public Radio) | | AA-/Aa3 | | | 805,000 | | | | 930,999 | |
District of Columbia, 5.00% due 4/1/2020 (National Public Radio) | | AA-/Aa3 | | | 1,890,000 | | | | 2,192,003 | |
District of Columbia COP, 5.25% due 1/1/2015 (St. Elizabeth Hospital Lease; Insured: Natl-Re) | | AA-/Aa3 | | | 3,125,000 | | | | 3,239,813 | |
District of Columbia COP, 5.25% due 1/1/2016 (St. Elizabeth Hospital Lease; Insured: Natl-Re) | | AA-/Aa3 | | | 4,700,000 | | | | 5,075,530 | |
District of Columbia COP, 5.00% due 1/1/2018 (St. Elizabeth Hospital Lease; Insured: Natl-Re) | | AA-/Aa3 | | | 5,000,000 | | | | 5,305,500 | |
District of Columbia COP, 5.00% due 1/1/2019 (St. Elizabeth Hospital Lease; Insured: Natl-Re) | | AA-/Aa3 | | | 5,000,000 | | | | 5,295,650 | |
District of Columbia COP, 4.50% due 1/1/2021 (St. Elizabeth Hospital Lease; Insured: Natl-Re) | | AA-/Aa3 | | | 1,100,000 | | | | 1,157,354 | |
District of Columbia GO, 6.00% due 6/1/2018 (Insured: Natl-Re) | | AA-/Aa2 | | | 5,000,000 | | | | 5,965,300 | |
District of Columbia GO, 5.25% due 6/1/2020 (Insured: Syncora) | | AA-/Aa2 | | | 3,005,000 | | | | 3,576,070 | |
a District of Columbia Housing Finance Agency, 5.00% due 7/1/2014 (Insured: AGM-HUD Loan) | | AA/A2 | | | 1,195,000 | | | | 1,208,348 | |
District of Columbia Housing Finance Agency, 5.00% due 7/1/2015 (Insured: AGM-HUD Loan) | | AA/A2 | | | 1,480,000 | | | | 1,558,100 | |
Metropolitan Washington Airports Authority, 0% due 10/1/2014 (Dulles Toll Road; Insured: AGM) | | AA/A3 | | | 2,000,000 | | | | 1,994,700 | |
Metropolitan Washington Airports Authority, 0% due 10/1/2016 (Dulles Toll Road; Insured: AGM) | | AA/A3 | | | 4,000,000 | | | | 3,829,960 | |
| | | |
FLORIDA — 7.27% | | | | | | | | | | |
a Broward County, 5.00% due 10/1/2014 (Airport, Marina & Port Improvements; Insured: AMBAC) (ETM) | | NR/A1 | | | 1,625,000 | | | | 1,664,049 | |
Broward County, 5.00% due 10/1/2014 (Airport, Marina & Port Improvements; Insured: AMBAC) | | A+/A1 | | | 2,375,000 | | | | 2,432,546 | |
Broward County, 5.00% due 9/1/2017 (Port Facilities) | | A-/A2 | | | 2,820,000 | | | | 3,123,235 | |
Broward County, 4.00% due 10/1/2017 (Airport, Marina & Port Improvements) | | A+/A1 | | | 500,000 | | | | 550,005 | |
Broward County, 5.00% due 10/1/2017 (Airport, Marina & Port Improvements) | | A+/A1 | | | 1,000,000 | | | | 1,134,270 | |
Broward County, 5.50% due 9/1/2018 (Port Facilities) | | A-/A2 | | | 3,500,000 | | | | 4,009,845 | |
Broward County, 4.00% due 10/1/2018 (Airport, Marina & Port Improvements) | | A+/A1 | | | 425,000 | | | | 471,057 | |
Broward County, 5.00% due 10/1/2018 (Airport, Marina & Port Improvements) | | A+/A1 | | | 500,000 | | | | 575,865 | |
Broward County, 5.50% due 9/1/2019 (Port Facilities) | | A-/A2 | | | 2,800,000 | | | | 3,239,768 | |
Broward County, 5.00% due 10/1/2019 (Airport, Marina & Port Improvements) | | A+/A1 | | | 1,000,000 | | | | 1,153,520 | |
Broward County, 4.00% due 10/1/2020 (Airport, Marina & Port Improvements) | | A+/A1 | | | 1,660,000 | | | | 1,813,201 | |
Broward County, 5.00% due 10/1/2020 (Airport, Marina & Port Improvements) | | A+/A1 | | | 2,000,000 | | | | 2,304,060 | |
Broward County School Board COP, 5.25% due 7/1/2015 (Insured: AGM) | | AA/A1 | | | 3,035,000 | | | | 3,215,582 | |
Broward County School Board COP, 5.00% due 7/1/2016 (Insured: AGM) | | AA/A1 | | | 1,495,000 | | | | 1,632,959 | |
Broward County School Board COP, 5.25% due 7/1/2016 (Insured: AGM) | | AA/A1 | | | 3,715,000 | | | | 4,078,476 | |
Broward County School Board COP, 5.25% due 7/1/2016 (Insured: AGM) | | AA/A1 | | | 7,630,000 | | | | 8,376,519 | |
Broward County School Board COP, 5.00% due 7/1/2017 (Insured: Natl-Re) | | AA-/A1 | | | 1,000,000 | | | | 1,118,710 | |
Broward County School Board COP, 5.00% due 7/1/2021 | | A/A1 | | | 4,000,000 | | | | 4,586,480 | |
Broward County School Board COP, 5.00% due 7/1/2022 | | A/A1 | | | 4,580,000 | | | | 5,253,947 | |
Capital Projects Finance Authority, 5.50% due 10/1/2015 (University of Central Florida Apartment Student Housing; Insured: Natl-Re) | | AA-/Baa1 | | | 2,660,000 | | | | 2,660,426 | |
City of Fort Myers, 5.00% due 12/1/2018 (Gulf Breeze Loan Program; Insured: Natl-Re) | | AA-/Aa3 | | | 2,195,000 | | | | 2,465,226 | |
City of Fort Myers, 5.00% due 10/1/2023 (Utility Systems Capital Projects) | | A/Aa3 | | | 3,360,000 | | | | 3,852,038 | |
City of Jacksonville, 5.00% due 10/1/2017 | | AA-/Aa2 | | | 1,000,000 | | | | 1,138,340 | |
City of Jacksonville, 5.00% due 10/1/2018 | | AA-/Aa2 | | | 1,050,000 | | | | 1,214,273 | |
City of Jacksonville, 5.00% due 10/1/2019 | | AA-/Aa2 | | | 500,000 | | | | 583,695 | |
City of Jacksonville, 5.00% due 10/1/2020 | | AA-/Aa2 | | | 1,000,000 | | | | 1,167,890 | |
City of Jacksonville, 5.00% due 10/1/2023 | | AA-/Aa2 | | | 1,105,000 | | | | 1,292,485 | |
City of Lakeland, 6.05% due 10/1/2014 (Energy System; Insured: AGM) | | AA/A1 | | | 3,750,000 | | | | 3,858,112 | |
City of Lakeland, 4.00% due 11/15/2014 (Lakeland Regional Health Systems) | | NR/A2 | | | 1,000,000 | | | | 1,019,520 | |
City of Lakeland, 5.00% due 10/1/2016 (Energy System; Insured: AGM) | | AA/A1 | | | 9,780,000 | | | | 10,819,027 | |
City of Lakeland, 5.00% due 10/1/2017 (Energy System; Insured: AGM) | | AA/A1 | | | 7,105,000 | | | | 8,064,246 | |
City of Lakeland, 5.00% due 10/1/2019 (Energy System; Insured: AGM) | | AA/A1 | | | 5,000,000 | | | | 5,825,550 | |
City of Lakeland, 5.00% due 11/15/2019 (Lakeland Regional Health Systems) | | NR/A2 | | | 5,655,000 | | | | 6,367,587 | |
City of Lakeland, 5.00% due 10/1/2020 (Energy System; Insured: AGM) | | AA/A1 | | | 1,695,000 | | | | 1,972,878 | |
City of Miami, 5.00% due 1/1/2018 (Street & Sidewalk Improvement Program; Insured: Natl-Re) | | AA-/A2 | | | 1,970,000 | | | | 2,202,874 | |
City of North Miami Beach, 5.00% due 8/1/2017 (North Miami Beach Water Project) | | A+/NR | | | 750,000 | | | | 840,998 | |
City of North Miami Beach, 3.00% due 8/1/2018 (North Miami Beach Water Project) | | A+/NR | | | 1,280,000 | | | | 1,351,936 | |
City of North Miami Beach, 5.00% due 8/1/2019 (North Miami Beach Water Project) | | A+/NR | | | 1,650,000 | | | | 1,890,735 | |
City of North Miami Beach, 5.00% due 8/1/2020 (North Miami Beach Water Project) | | A+/NR | | | 780,000 | | | | 892,679 | |
City of North Miami Beach, 5.00% due 8/1/2021 (North Miami Beach Water Project) | | A+/NR | | | 1,000,000 | | | | 1,147,410 | |
City of Port St. Lucie, 5.00% due 9/1/2015 (Tesoro Special Assessment District; Insured: Natl-Re) | | NR/A1 | | | 250,000 | | | | 265,260 | |
City of Port St. Lucie, 1.70% due 7/1/2016 (Tesoro Special Assessment District) | | NR/A1 | | | 2,140,000 | | | | 2,162,342 | |
City of Port St. Lucie, 1.875% due 7/1/2017 (Tesoro Special Assessment District; Insured: AGM) | | NR/A1 | | | 2,175,000 | | | | 2,184,309 | |
City of Port St. Lucie, 2.00% due 7/1/2018 (Tesoro Special Assessment District; Insured: AGM) | | NR/A1 | | | 2,215,000 | | | | 2,216,772 | |
Collier County, 4.00% due 10/1/2014 | | AA/Aa2 | | | 1,410,000 | | | | 1,436,903 | |
Escambia County HFA, 5.25% due 11/15/2014 (Ascension Health Credit) | | AA+/Aa2 | | | 1,835,000 | | | | 1,892,949 | |
Flagler County School Board COP, 5.00% due 8/1/2014 (Insured: AGM) | | AA/A2 | | | 1,605,000 | | | | 1,629,332 | |
Flagler County School Board COP, 5.00% due 8/1/2015 (Insured: AGM) | | AA/A2 | | | 1,500,000 | | | | 1,588,335 | |
Certified Semi-Annual Report 17
| | |
| SCHEDULE OF INVESTMENTS, CONTINUED | | |
| |
Thornburg Limited Term Municipal Fund | | March 31, 2014 (Unaudited) |
| | | | | | | | | | |
Issuer-Description | | Credit Rating†
S&P/ Moody’s | | Principal
Amount | | | Value | |
Florida Atlantic University Financing Corp., 5.00% due 7/1/2014 (Innovation Village Capital Improvements) | | A/A1 | | $ | 1,950,000 | | | $ | 1,973,673 | |
Florida Atlantic University Financing Corp., 5.00% due 7/1/2015 (Innovation Village Capital Improvements) | | A/A1 | | | 2,395,000 | | | | 2,530,054 | |
Florida Atlantic University Financing Corp., 5.00% due 7/1/2016 (Innovation Village Capital Improvements) | | A/A1 | | | 2,275,000 | | | | 2,482,798 | |
Florida Department of Management Services, 5.25% due 9/1/2016 (Insured: AGM) | | AA+/Aa2 | | | 3,500,000 | | | | 3,878,210 | |
a Florida Higher Educational Facilities Financing Authority, 5.00% due 4/1/2014 (Nova Southeastern University) | | BBB/Baa1 | | | 2,365,000 | | | | 2,365,000 | |
Florida Higher Educational Facilities Financing Authority, 5.00% due 4/1/2015 (Nova Southeastern University) | | BBB/Baa1 | | | 2,150,000 | | | | 2,231,635 | |
Florida Higher Educational Facilities Financing Authority, 5.00% due 4/1/2016 (Nova Southeastern University) | | BBB/Baa1 | | | 2,345,000 | | | | 2,508,517 | |
Florida Higher Educational Facilities Financing Authority, 5.25% due 4/1/2017 (Nova Southeastern University) | | BBB/Baa1 | | | 1,325,000 | | | | 1,452,439 | |
Florida Higher Educational Facilities Financing Authority, 5.25% due 4/1/2018 (Nova Southeastern University) | | BBB/Baa1 | | | 2,630,000 | | | | 2,925,954 | |
Florida Higher Educational Facilities Financing Authority, 5.00% due 4/1/2019 (University of Tampa) | | BBB+/NR | | | 1,225,000 | | | | 1,360,510 | |
Florida Higher Educational Facilities Financing Authority, 5.00% due 4/1/2019 (Nova Southeastern University) | | BBB/Baa1 | | | 1,035,000 | | | | 1,149,492 | |
Florida Higher Educational Facilities Financing Authority, 5.50% due 4/1/2019 (Nova Southeastern University) | | BBB/Baa1 | | | 1,705,000 | | | | 1,933,317 | |
Florida Higher Educational Facilities Financing Authority, 5.00% due 4/1/2020 (Nova Southeastern University) | | BBB/Baa1 | | | 1,030,000 | | | | 1,143,104 | |
Florida Higher Educational Facilities Financing Authority, 5.00% due 4/1/2022 (University of Tampa) | | BBB+/NR | | | 620,000 | | | | 687,152 | |
Florida Hurricane Catastrophe Fund Finance Corp., 5.00% due 7/1/2014 | | AA-/Aa3 | | | 11,000,000 | | | | 11,133,540 | |
Florida State Board of Governors, 4.00% due 7/1/2020 (University System Capital Improvements) | | AA/Aa2 | | | 4,055,000 | | | | 4,492,778 | |
Florida State Board of Governors, 4.00% due 7/1/2021 (University System Capital Improvements) | | AA/Aa2 | | | 4,215,000 | | | | 4,645,141 | |
Florida State Board of Governors, 4.00% due 7/1/2022 (University System Capital Improvements) | | AA/Aa2 | | | 4,385,000 | | | | 4,816,002 | |
Florida State Correctional Privatization Commission COP, 5.00% due 8/1/2015 (Insured: AMBAC) | | AA+/Aa2 | | | 2,000,000 | | | | 2,031,420 | |
Florida State Department of Children & Families COP, 5.00% due 10/1/2014 | | AA+/NR | | | 905,000 | | | | 923,951 | |
Florida State Department of Children & Families COP, 5.00% due 10/1/2015 | | AA+/NR | | | 925,000 | | | | 980,371 | |
Florida State Department of Transportation GO, 5.00% due 7/1/2018 | | AAA/Aa1 | | | 3,000,000 | | | | 3,395,220 | |
Florida State Housing Finance Corp., 1.625% due 1/1/2015 (Captiva Cove Apartments-Multi-Family Mtg; Insured: FNMA) | | NR/Aaa | | | 1,600,000 | | | | 1,601,904 | |
Highlands County HFA, 5.00% due 11/15/2015 (Adventist Health System Sunbelt Group) | | AA-/Aa3 | | | 1,000,000 | | | | 1,075,030 | |
Highlands County HFA, 5.00% due 11/15/2016 (Adventist Health System Orange County Health Facilities) | | AA-/Aa3 | | | 1,000,000 | | | | 1,113,120 | |
Highlands County HFA, 5.00% due 11/15/2017 (Adventist Health System Orange County Health Facilities) | | AA-/Aa3 | | | 3,200,000 | | | | 3,638,912 | |
Highlands County HFA, 5.00% due 11/15/2017 (Adventist Health System Sunbelt Group) | | AA-/Aa3 | | | 1,000,000 | | | | 1,072,870 | |
Highlands County HFA, 5.00% due 11/15/2019 (Adventist Health System Orange County Health Facilities) | | AA-/Aa3 | | | 3,000,000 | | | | 3,473,700 | |
Highlands County HFA, 5.00% due 11/15/2035 pre-refunded 11/15/2015 (Adventist Health System Sunbelt Group) | | AA-/Aa3 | | | 1,225,000 | | | | 1,317,475 | |
Hillsborough County, 5.00% due 3/1/2015 (Water and Wastewater System Capital Improvements; Insured: Natl-Re) | | AA-/A1 | | | 5,000,000 | | | | 5,192,500 | |
Hillsborough County, 5.00% due 11/1/2016 (Transportation Related Capital Improvements; Insured: AMBAC) | | AA/A1 | | | 1,000,000 | | | | 1,109,140 | |
Hillsborough County, 5.00% due 11/1/2018 (Court Facilities) | | AA/A1 | | | 4,210,000 | | | | 4,856,698 | |
Hillsborough County, 5.00% due 11/1/2019 (Court Facilities) | | AA/A1 | | | 4,420,000 | | | | 5,121,100 | |
Hillsborough County, 5.00% due 11/1/2020 (Court Facilities) | | AA/A1 | | | 4,645,000 | | | | 5,368,459 | |
Hillsborough County, 5.00% due 11/1/2021 (Court Facilities) | | AA/A1 | | | 4,880,000 | | | | 5,633,960 | |
Hillsborough County, 5.00% due 11/1/2021 (Jail and Storm Water Projects) | | AA/A1 | | | 2,300,000 | | | | 2,655,350 | |
Hillsborough County, 5.00% due 11/1/2022 (Jail and Storm Water Projects) | | AA/A1 | | | 3,005,000 | | | | 3,473,479 | |
Hillsborough County IDA PCR, 5.65% due 5/15/2018 (Tampa Electric Co.) | | BBB+/A2 | | | 3,200,000 | | | | 3,689,792 | |
Hillsborough County School Board COP, 5.25% due 7/1/2017 (Insured: Natl-Re) | | AA-/Aa2 | | | 1,300,000 | | | | 1,473,979 | |
Hollywood Community Redevelopment Agency, 5.00% due 3/1/2016 (Insured: Syncora) | | NR/A3 | | | 2,000,000 | | | | 2,131,880 | |
Hollywood Community Redevelopment Agency, 5.00% due 3/1/2017 (Insured: Syncora) | | NR/A3 | | | 2,000,000 | | | | 2,169,200 | |
Hollywood Community Redevelopment Agency, 5.00% due 3/1/2024 (Beach BCA; Insured: Syncora) | | NR/A3 | | | 4,850,000 | | | | 5,082,460 | |
Hollywood Water & Sewer, 5.00% due 10/1/2014 (Insured: AGM) | | NR/Aa2 | | | 1,300,000 | | | | 1,305,226 | |
Jacksonville Economic Development Commission, 6.00% due 9/1/2017 (Florida Proton Therapy Institute) | | NR/NR | | | 3,695,000 | | | | 4,101,819 | |
JEA, 4.00% due 10/1/2016 (Electric System) | | A+/Aa3 | | | 3,540,000 | | | | 3,843,272 | |
JEA, 5.00% due 10/1/2018 (Water & Sewer Systems) | | AA/Aa2 | | | 1,500,000 | | | | 1,740,360 | |
JEA, 5.00% due 10/1/2023 (Electric System) | | A+/Aa3 | | | 1,395,000 | | | | 1,634,215 | |
JEA, 5.00% due 10/1/2024 (Electric System) | | A+/Aa3 | | | 1,200,000 | | | | 1,389,048 | |
Kissimmee Utility Authority, 5.25% due 10/1/2016 (Electrical Systems; Insured: AGM) | | NR/A1 | | | 1,700,000 | | | | 1,883,957 | |
Manatee County, 5.00% due 10/1/2016 (County Capital Projects) | | NR/Aa2 | | | 1,000,000 | | | | 1,109,930 | |
Manatee County, 5.00% due 10/1/2018 (County Capital Projects) | | NR/Aa2 | | | 2,400,000 | | | | 2,785,176 | |
Manatee County, 5.00% due 10/1/2021 (County Capital Projects) | | NR/Aa2 | | | 2,775,000 | | | | 3,265,953 | |
Marion County Hospital District, 5.00% due 10/1/2015 (Munroe Regional Health Systems) (ETM) | | NR/Baa1 | | | 1,000,000 | | | | 1,054,170 | |
Miami Beach GO, 4.00% due 9/1/2019 | | AA-/Aa2 | | | 2,745,000 | | | | 3,040,691 | |
Miami Beach GO, 5.00% due 9/1/2020 | | AA-/Aa2 | | | 3,720,000 | | | | 4,315,832 | |
Miami Beach GO, 4.00% due 9/1/2021 | | AA-/Aa2 | | | 1,015,000 | | | | 1,111,455 | |
Miami Beach GO, 5.00% due 9/1/2022 | | AA-/Aa2 | | | 1,000,000 | | | | 1,148,070 | |
Miami-Dade County, 5.00% due 10/1/2014 (Water and Sewer System; Insured: BHAC) | | AA+/Aa1 | | | 1,070,000 | | | | 1,095,520 | |
Miami-Dade County, 0% due 10/1/2015 (Professional Sports Franchise Facilities; Insured: AGM) | | AA/A1 | | | 3,845,000 | | | | 3,785,864 | |
Miami-Dade County, 0% due 10/1/2016 (Professional Sports Franchise Facilities; Insured: AGM) | | AA/A1 | | | 3,535,000 | | | | 3,391,444 | |
Miami-Dade County, 0% due 10/1/2017 (Professional Sports Franchise Facilities; Insured: AGM) | | AA/A1 | | | 2,435,000 | | | | 2,255,078 | |
Miami-Dade County, 0% due 10/1/2018 (Professional Sports Franchise Facilities; Insured: AGM) | | AA/A1 | | | 5,385,000 | | | | 4,834,599 | |
Miami-Dade County, 0% due 10/1/2019 (Professional Sports Franchise Facilities; Insured: AGM) | | AA/A1 | | | 2,170,000 | | | | 1,863,748 | |
Miami-Dade County Educational Facilities Authority GO, 5.00% due 4/1/2016 (University of Miami; Insured: AMBAC) | | A-/A3 | | | 3,000,000 | | | | 3,234,240 | |
Miami-Dade County Expressway Authority, 5.00% due 7/1/2019 (Insured: AGM) | | AA/A2 | | | 7,530,000 | | | | 8,707,240 | |
18 Certified Semi-Annual Report
| | |
| SCHEDULE OF INVESTMENTS, CONTINUED | | |
| |
Thornburg Limited Term Municipal Fund | | March 31, 2014 (Unaudited) |
| | | | | | | | | | |
Issuer-Description | | Credit Rating†
S&P/ Moody’s | | Principal
Amount | | | Value | |
Miami-Dade County Expressway Authority, 5.00% due 7/1/2029 pre-refunded 7/1/2014 (Toll System Five-Year Work Program; Insured: Natl-Re) | | AA-/A3 | | $ | 490,000 | | | $ | 495,939 | |
Miami-Dade County Expressway Authority, 5.00% due 7/1/2033 pre-refunded 7/1/2014 (Toll System Five-Year Work Program; Insured: Natl-Re) | | AA-/A3 | | | 305,000 | | | | 308,697 | |
Miami-Dade County GO, 5.25% due 7/1/2018 (Building Better Communities) | | AA/Aa2 | | | 5,040,000 | | | | 5,837,782 | |
Miami-Dade County School Board, 5.00% due 5/1/2014 | | AA-/A1 | | | 615,000 | | | | 617,472 | |
Miami-Dade County School Board, 5.00% due 5/1/2014 | | AA-/A1 | | | 385,000 | | | | 386,552 | |
Miami-Dade County School Board COP, 5.00% due 10/1/2015 (Insured: AMBAC) | | A/A1 | | | 1,000,000 | | | | 1,069,190 | |
Miami-Dade County School Board COP, 5.00% due 5/1/2016 (Insured: Natl-Re) | | AA-/A1 | | | 4,065,000 | | | | 4,430,891 | |
Miami-Dade County School Board COP, 5.00% due 10/1/2016 (Insured: AMBAC) | | A/A1 | | | 1,000,000 | | | | 1,105,710 | |
Miami-Dade County School Board COP, 5.00% due 5/1/2032 put 5/1/2016 | | A/A1 | | | 6,000,000 | | | | 6,518,280 | |
Miami-Dade County School District GO, 5.375% due 8/1/2015 (Insured: AGM) | | AA/Aa3 | | | 5,130,000 | | | | 5,478,276 | |
Orange County HFA, 5.00% due 10/1/2014 (Orlando Health, Inc.) | | A/A3 | | | 2,790,000 | | | | 2,850,487 | |
Orange County HFA, 5.00% due 10/1/2015 (Orlando Health, Inc.) | | A/A3 | | | 500,000 | | | | 530,475 | |
Orange County HFA, 6.25% due 10/1/2016 (Orlando Health, Inc.; Insured: Natl-Re) | | AA-/A3 | | | 2,310,000 | | | | 2,469,505 | |
Orange County HFA, 5.00% due 10/1/2017 (Orlando Health, Inc.) | | A/A3 | | | 1,980,000 | | | | 2,216,867 | |
Orange County HFA, 5.25% due 10/1/2019 (Orlando Health, Inc.) | | A/A3 | | | 6,050,000 | | | | 7,026,470 | |
Orange County HFA, 6.25% due 10/1/2021 (Orlando Health, Inc.; Insured: Natl-Re) | | AA-/A3 | | | 1,870,000 | | | | 2,214,192 | |
Orange County HFA, 5.375% due 10/1/2023 (Orlando Health, Inc.) | | A/A3 | | | 4,150,000 | | | | 4,534,082 | |
Orlando and Orange County Expressway Authority, 8.25% due 7/1/2016 (Insured: Natl-Re/FGIC/IBC) | | AA-/A2 | | | 3,000,000 | | | | 3,497,880 | |
Palm Beach County School Board COP, 5.00% due 8/1/2018 (Master Lease Purchase Agreement) | | NR/Aa3 | | | 800,000 | | | | 916,048 | |
Palm Beach County School Board COP, 4.00% due 8/1/2019 (Master Lease Purchase Agreement) | | NR/Aa3 | | | 940,000 | | | | 1,037,948 | |
Palm Beach County School Board COP, 5.00% due 8/1/2020 (Master Lease Purchase Agreement) | | NR/Aa3 | | | 1,090,000 | | | | 1,257,108 | |
Palm Beach County School Board COP, 4.00% due 8/1/2021 (Master Lease Purchase Agreement) | | NR/Aa3 | | | 3,835,000 | | | | 4,157,945 | |
Palm Beach County School Board COP, 5.00% due 8/1/2022 (Master Lease Purchase Agreement) | | NR/Aa3 | | | 1,660,000 | | | | 1,906,659 | |
Palm Beach County School Board COP, 5.00% due 8/1/2032 put 8/1/2016 (Master Lease Purchase Agreement) | | NR/Aa3 | | | 1,300,000 | | | | 1,425,255 | |
Polk County, 4.00% due 10/1/2020 (Water and Wastewater Utility Systems; Insured: AGM) | | A+/Aa3 | | | 3,100,000 | | | | 3,415,952 | |
Polk County, 3.00% due 10/1/2021 (Water and Wastewater Utility Systems; Insured: AGM) | | A+/Aa3 | | | 3,125,000 | | | | 3,205,906 | |
Polk County, 5.00% due 10/1/2023 (Water and Wastewater Utility Systems) | | A+/Aa3 | | | 1,420,000 | | | | 1,646,703 | |
Putnam County Development Authority PCR, 5.35% due 3/15/2042 put 5/1/2018 (Seminole Project; Insured: AMBAC) | | A-/A3 | | | 4,165,000 | | | | 4,730,524 | |
Putnam County Development Authority PCR, 5.35% due 3/15/2042 put 5/1/2018 (Seminole Project; Insured: AMBAC) | | A-/A3 | | | 10,000,000 | | | | 11,357,800 | |
Reedy Creek Improvement District, 5.00% due 10/1/2014 (Walt Disney World Resort Complex Utility Systems) | | A/A1 | | | 460,000 | | | | 470,640 | |
Reedy Creek Improvement District, 5.00% due 10/1/2017 (Walt Disney World Resort Complex Utility Systems) | | A/A1 | | | 400,000 | | | | 451,648 | |
Reedy Creek Improvement District, 5.00% due 10/1/2018 (Walt Disney World Resort Complex Utility Systems) | | A/A1 | | | 755,000 | | | | 865,660 | |
Reedy Creek Improvement District, 5.00% due 10/1/2021 (Walt Disney World Resort Complex Utility Systems) | | A/A1 | | | 1,200,000 | | | | 1,373,544 | |
Reedy Creek Improvement District, 5.00% due 10/1/2022 (Walt Disney World Resort Complex Utility Systems) | | A/A1 | | | 625,000 | | | | 714,144 | |
Reedy Creek Improvement District, 5.00% due 10/1/2023 (Walt Disney World Resort Complex Utility Systems) | | A/A1 | | | 750,000 | | | | 854,565 | |
Reedy Creek Improvement District GO, 5.00% due 6/1/2023 | | A+/Aa3 | | | 1,940,000 | | | | 2,286,348 | |
School Board of Alachua County COP, 5.00% due 7/1/2022 (Educational Facilities) | | A+/Aa3 | | | 1,600,000 | | | | 1,811,664 | |
School Board of Alachua County COP, 5.00% due 7/1/2023 (Educational Facilities) | | A+/Aa3 | | | 2,250,000 | | | | 2,556,562 | |
School Board of Lake County COP, 5.25% due 6/1/2017 (Insured: AMBAC) | | A/NR | | | 2,000,000 | | | | 2,260,140 | |
School Board of Lake County COP, 5.25% due 6/1/2018 (Insured: AMBAC) | | A/NR | | | 1,475,000 | | | | 1,688,683 | |
South Broward Hospital District, 5.00% due 5/1/2020 (Insured: Natl-Re) | | AA-/Aa3 | | | 7,260,000 | | | | 7,816,406 | |
South Florida Water Management District COP, 5.00% due 10/1/2015 (Everglades Restoration Plan; Insured: AMBAC) | | AA/Aa3 | | | 1,000,000 | | | | 1,066,150 | |
South Florida Water Management District COP, 5.00% due 10/1/2023 (Everglades Restoration Plan; Insured: AMBAC) | | AA/Aa3 | | | 500,000 | | | | 548,785 | |
South Miami HFA, 5.00% due 8/15/2016 (Baptist Health) | | AA/Aa2 | | | 4,985,000 | | | | 5,499,901 | |
South Miami HFA, 5.00% due 8/15/2017 (Baptist Health) | | AA/Aa2 | | | 4,610,000 | | | | 5,214,279 | |
St. John’s County IDA, 5.50% due 8/1/2014 (Presbyterian Retirement) | | NR/NR | | | 745,000 | | | | 751,839 | |
St. Petersburg HFA, 5.50% due 11/15/2015 (All Children’s Hospital; Insured: AMBAC) | | NR/A1 | | | 1,995,000 | | | | 2,003,638 | |
a St. Petersburg HFA, 5.50% due 11/15/2016 (All Children’s Hospital; Insured: AMBAC) | | NR/A1 | | | 1,980,000 | | | | 1,988,534 | |
Sunshine State Governmental Financing Commission, 5.00% due 9/1/2021 (Miami-Dade County Program) | | AA-/Aa3 | | | 1,450,000 | | | | 1,647,345 | |
Sunshine State Governmental Financing Commission, 5.00% due 9/1/2021 (Insured: AGM) | | AA/Aa3 | | | 5,000,000 | | | | 5,694,800 | |
Sunshine State Governmental Financing Commission, 5.00% due 9/1/2022 (Miami-Dade County Program) | | AA-/Aa3 | | | 2,000,000 | | | | 2,278,500 | |
Sunshine State Governmental Financing Commission, 5.00% due 9/1/2023 (Miami-Dade County Program) | | AA-/Aa3 | | | 2,100,000 | | | | 2,394,168 | |
Sunshine State Governmental Financing Commission, 5.00% due 9/1/2024 (Miami-Dade County Program) | | AA-/Aa3 | | | 1,725,000 | | | | 1,934,398 | |
Tampa Bay Regional Water Supply Authority, 5.00% due 10/1/2017 | | AA+/Aa2 | | | 5,615,000 | | | | 6,408,456 | |
Tampa Bay Regional Water Supply Authority, 5.00% due 10/1/2018 | | AA+/Aa2 | | | 2,890,000 | | | | 3,362,053 | |
Tampa Bay Regional Water Supply Authority, 5.00% due 10/1/2019 | | AA+/Aa2 | | | 3,000,000 | | | | 3,529,740 | |
Tampa BayCare Health Systems, 5.00% due 11/15/2016 | | NR/Aa2 | | | 2,855,000 | | | | 3,185,095 | |
Tampa BayCare Health Systems, 5.00% due 11/15/2017 | | NR/Aa2 | | | 1,215,000 | | | | 1,377,944 | |
Tampa Sports Authority, 5.75% due 10/1/2015 (Tampa Bay Arena; Insured: Natl-Re) | | AA-/Baa1 | | | 500,000 | | | | 512,665 | |
University of Central Florida Athletics Association, Inc. COP, 5.00% due 10/1/2016 (Insured: Natl-Re) | | AA-/Baa1 | | | 1,640,000 | | | | 1,720,803 | |
Volusia County Educational Facility Authority, 5.00% due 10/15/2016 (Embry-Riddle; Insured: AGM) | | AA/A2 | | | 2,320,000 | | | | 2,563,809 | |
Volusia County Educational Facility Authority, 4.00% due 10/15/2017 (Embry-Riddle; Insured: AGM) | | AA/A2 | | | 1,030,000 | | | | 1,129,271 | |
Volusia County Educational Facility Authority, 5.00% due 10/15/2018 (Embry-Riddle; Insured: AGM) | | AA/A2 | | | 2,075,000 | | | | 2,382,411 | |
Volusia County Educational Facility Authority, 5.00% due 10/15/2019 (Embry-Riddle; Insured: AGM) | | AA/A2 | | | 2,350,000 | | | | 2,706,448 | |
Certified Semi-Annual Report 19
| | |
| SCHEDULE OF INVESTMENTS, CONTINUED | | |
| |
Thornburg Limited Term Municipal Fund | | March 31, 2014 (Unaudited) |
| | | | | | | | | | |
Issuer-Description | | Credit Rating†
S&P/ Moody’s | | Principal
Amount | | | Value | |
GEORGIA — 2.22% | | | | | | | | | | |
Athens-Clarke County Unified Government Development Authority, 3.00% due 6/15/2015 (UGAREF Bolton Commons, LLC) | | NR/Aa2 | | $ | 3,575,000 | | | $ | 3,682,894 | |
Athens-Clarke County Unified Government Development Authority, 3.00% due 12/15/2015 (UGAREF Coverdell Building, LLC) | | NR/Aa2 | | | 670,000 | | | | 697,885 | |
Athens-Clarke County Unified Government Development Authority, 3.00% due 6/15/2016 (UGAREF Bolton Commons, LLC) | | NR/Aa2 | | | 300,000 | | | | 314,550 | |
Athens-Clarke County Unified Government Development Authority, 4.00% due 6/15/2017 (UGAREF Bolton Commons, LLC) | | NR/Aa2 | | | 495,000 | | | | 539,070 | |
Athens-Clarke County Unified Government Development Authority, 5.00% due 6/15/2019 (UGAREF Bolton Commons, LLC) | | NR/Aa2 | | | 400,000 | | | | 457,924 | |
Athens-Clarke County Unified Government Development Authority, 4.00% due 6/15/2020 (UGAREF Bolton Commons, LLC) | | NR/Aa2 | | | 395,000 | | | | 429,258 | |
City of Atlanta, 5.50% due 11/1/2014 (Water & Wastewater System; Insured: Natl-Re) | | AA-/Aa3 | | | 3,000,000 | | | | 3,092,820 | |
City of Atlanta, 5.50% due 11/1/2015 (Water & Wastewater System; Insured: Natl-Re) | | AA-/Aa3 | | | 4,000,000 | | | | 4,326,280 | |
City of Atlanta, 5.00% due 1/1/2016 (Hartsfield-Jackson Atlanta International Airport) | | NR/A1 | | | 1,495,000 | | | | 1,612,328 | |
City of Atlanta, 5.00% due 11/1/2016 (Water & Wastewater System; Insured: AGM) | | AA/Aa3 | | | 3,215,000 | | | | 3,565,885 | |
City of Atlanta, 5.50% due 11/1/2016 (Water & Wastewater System; Insured: Natl-Re) | | AA-/Aa3 | | | 8,215,000 | | | | 9,213,533 | |
City of Atlanta, 5.25% due 12/1/2016 (Atlantic Station Project; Insured: AGM) | | AA/A3 | | | 3,650,000 | | | | 4,025,403 | |
City of Atlanta, 5.00% due 11/1/2017 (Water & Wastewater System; Insured: AGM) | | AA/Aa3 | | | 4,745,000 | | | | 5,395,112 | |
City of Atlanta, 5.00% due 1/1/2018 (Hartsfield-Jackson Atlanta International Airport) | | NR/A1 | | | 2,100,000 | | | | 2,394,210 | |
City of Atlanta, 5.00% due 1/1/2019 (Hartsfield-Jackson Atlanta International Airport) | | NR/Aa3 | | | 3,145,000 | | | | 3,638,388 | |
City of Atlanta, 6.00% due 11/1/2019 (Water & Wastewater System) | | A+/Aa3 | | | 5,650,000 | | | | 6,863,394 | |
City of Atlanta, 5.00% due 1/1/2020 (Hartsfield-Jackson Atlanta International Airport) | | NR/A1 | | | 6,000,000 | | | | 6,951,720 | |
City of Atlanta, 5.25% due 1/1/2020 (Hartsfield-Jackson Atlanta International Airport) | | NR/Aa3 | | | 5,000,000 | | | | 5,884,300 | |
City of Atlanta, 5.00% due 1/1/2021 (Hartsfield-Jackson Atlanta International Airport) | | NR/A1 | | | 7,000,000 | | | | 7,992,040 | |
City of Atlanta, 5.50% due 1/1/2021 (Hartsfield-Jackson Atlanta International Airport) | | NR/Aa3 | | | 3,525,000 | | | | 4,219,073 | |
b City of Atlanta, 5.00% due 1/1/2023 (Airport Passenger Facility) | | A+/Aa3 | | | 1,000,000 | | | | 1,167,950 | |
b City of Atlanta, 5.00% due 1/1/2024 (Airport Passenger Facility) | | A+/A1 | | | 1,350,000 | | | | 1,571,751 | |
b City of Atlanta, 5.00% due 1/1/2025 (Airport Passenger Facility) | | A+/A1 | | | 2,500,000 | | | | 2,878,750 | |
b City of Atlanta, 5.00% due 1/1/2025 (Airport Passenger Facility) | | A+/Aa3 | | | 1,645,000 | | | | 1,901,686 | |
Development Authority of Bartow County, 2.70% due 8/1/2043 put 8/23/2018 (Georgia Power Co. Plant Bowen Project) | | A/A3 | | | 6,000,000 | | | | 6,186,960 | |
Development Authority of the City of Milledgeville and Baldwin County, 5.625% due 9/1/2030 pre-refunded 9/1/2014 (Georgia College & State University Foundation Property III, LLC) | | AA+/NR | | | 1,280,000 | | | | 1,322,022 | |
Fulton County Development Authority, 5.00% due 10/1/2022 (Georgia Tech Athletic Association) | | NR/A2 | | | 4,550,000 | | | | 5,287,555 | |
Fulton County Facilities COP, 5.00% due 11/1/2017 | | AA-/Aa3 | | | 8,400,000 | | | | 9,487,548 | |
Fulton County Facilities COP, 5.00% due 11/1/2019 | | AA-/Aa3 | | | 6,600,000 | | | | 7,601,616 | |
Georgia Municipal Electric Authority, 6.50% due 1/1/2017 | | A+/A1 | | | 905,000 | | | | 984,531 | |
Georgia Municipal Gas Authority, 5.00% due 4/1/2014 (Gas Portfolio III) | | AA-/A1 | | | 3,000,000 | | | | 3,000,000 | |
Gwinnett County Hospital Authority, 5.00% due 7/1/2023 (Gwinnett Hospital System, Inc.; Insured: AGM) | | NR/A2 | | | 5,000,000 | | | | 5,419,000 | |
Gwinnett County School District GO, 4.00% due 10/1/2015 (Educational Capital Building Program) | | AAA/Aaa | | | 10,000,000 | | | | 10,571,900 | |
LaGrange-Troup County Hospital Authority, 5.00% due 7/1/2018 (West Georgia Health Foundation, Inc.) | | A+/Aa2 | | | 2,500,000 | | | | 2,668,300 | |
Main Street Natural Gas, Inc., 5.00% due 3/15/2015 (Georgia Gas) | | A-/Baa2 | | | 2,000,000 | | | | 2,076,860 | |
Main Street Natural Gas, Inc., 5.00% due 3/15/2018 (Georgia Gas) | | A-/Baa2 | | | 5,000,000 | | | | 5,525,550 | |
Municipal Electric Authority of Georgia, 6.60% due 1/1/2018 (Insured: Natl-Re) | | AA-/A1 | | | 1,635,000 | | | | 1,794,625 | |
Valdosta and Lowndes County Hospital Authority, 5.00% due 10/1/2022 (South Medical Center) | | AA-/Aa2 | | | 1,500,000 | | | | 1,683,015 | |
| | | |
GUAM — 0.37% | | | | | | | | | | |
Government of Guam, 5.25% due 12/1/2016 | | BBB+/NR | | | 5,610,000 | | | | 6,037,931 | |
Government of Guam, 5.25% due 12/1/2017 | | BBB+/NR | | | 2,000,000 | | | | 2,169,880 | |
Government of Guam, 5.50% due 12/1/2018 | | BBB+/NR | | | 3,000,000 | | | | 3,308,580 | |
Government of Guam, 5.50% due 12/1/2019 | | BBB+/NR | | | 2,000,000 | | | | 2,195,400 | |
Guam Government Waterworks Authority, 5.25% due 7/1/2020 (Water & Wastewater System Improvements) | | A-/Ba1 | | | 300,000 | | | | 331,887 | |
Guam Government Waterworks Authority, 5.25% due 7/1/2022 (Water & Wastewater System Improvements) | | A-/Ba1 | | | 1,050,000 | | | | 1,156,113 | |
Guam Government Waterworks Authority, 5.25% due 7/1/2023 (Water & Wastewater System Improvements) | | A-/Ba1 | | | 645,000 | | | | 708,881 | |
Guam Power Authority, 5.00% due 10/1/2019 (Electric Power System; Insured: AGM) | | AA/A2 | | | 1,000,000 | | | | 1,132,090 | |
Guam Power Authority, 5.00% due 10/1/2020 (Electric Power System; Insured: AGM) | | AA/A2 | | | 1,500,000 | | | | 1,695,570 | |
Guam Power Authority, 5.00% due 10/1/2022 (Electric Power System; Insured: AGM) | | AA/A2 | | | 5,015,000 | | | | 5,704,161 | |
| | | |
HAWAII — 1.23% | | | | | | | | | | |
City and County of Honolulu GO, 5.00% due 11/1/2019 (Capital Improvement Projects) | | NR/Aa1 | | | 3,620,000 | | | | 4,282,460 | |
City and County of Honolulu GO, 5.00% due 11/1/2020 (Capital Improvement Projects) | | NR/Aa1 | | | 8,265,000 | | | | 9,795,265 | |
City and County of Honolulu GO, 5.00% due 11/1/2021 (Capital Improvement Projects) | | NR/Aa1 | | | 2,770,000 | | | | 3,290,788 | |
City and County of Honolulu GO, 5.00% due 11/1/2022 (Capital Improvement Projects) | | NR/Aa1 | | | 1,750,000 | | | | 2,088,730 | |
City and County of Honolulu GO, 5.00% due 11/1/2022 (Capital Improvement Projects) | | NR/Aa1 | | | 6,695,000 | | | | 7,990,884 | |
County of Hawaii GO, 4.00% due 9/1/2014 (County Capital Improvement Projects) | | AA-/Aa2 | | | 1,475,000 | | | | 1,498,629 | |
State of Hawaii GO, 5.00% due 11/1/2017 (Hawaiian Home Lands Settlement) | | AA/Aa2 | | | 12,000,000 | | | | 13,741,320 | |
State of Hawaii GO, 5.00% due 11/1/2018 (Hawaiian Home Lands Settlement) | | AA/Aa2 | | | 20,000,000 | | | | 23,333,200 | |
State of Hawaii GO, 5.00% due 12/1/2019 (Hawaiian Home Lands Settlement) | | AA/Aa2 | | | 3,000,000 | | | | 3,545,580 | |
a State of Hawaii GO, 5.00% due 12/1/2020 (Hawaiian Home Lands Settlement) | | AA/Aa2 | | | 2,500,000 | | | | 2,964,525 | |
State of Hawaii GO, 5.00% due 12/1/2021 (Hawaiian Home Lands Settlement) | | AA/Aa2 | | | 3,000,000 | | | | 3,565,650 | |
20 Certified Semi-Annual Report
| | |
| SCHEDULE OF INVESTMENTS, CONTINUED | | |
| |
Thornburg Limited Term Municipal Fund | | March 31, 2014 (Unaudited) |
| | | | | | | | | | |
Issuer-Description | | Credit Rating†
S&P/ Moody’s | | Principal
Amount | | | Value | |
State of Hawaii GO, 5.00% due 12/1/2022 (Hawaiian Home Lands Settlement) | | AA/Aa2 | | $ | 4,000,000 | | | $ | 4,727,240 | |
| | | |
IDAHO — 0.28% | | | | | | | | | | |
Idaho Housing & Finance Association, 3.00% due 8/15/2015 | | NR/NR | | | 650,000 | | | | 673,972 | |
Twin Falls Urban Renewal Agency, 4.95% due 8/1/2014 | | NR/NR | | | 440,000 | | | | 441,813 | |
Twin Falls Urban Renewal Agency, 5.15% due 8/1/2017 | | NR/NR | | | 1,455,000 | | | | 1,468,517 | |
University of Idaho, 5.25% due 4/1/2041 put 4/1/2021 | | A+/Aa3 | | | 13,665,000 | | | | 15,623,877 | |
| | | |
ILLINOIS — 6.44% | | | | | | | | | | |
Board of Education of the City of Chicago GO, 5.00% due 12/1/2018 (School District Capital Improvement Program) (State Aid Withholding) | | A+/Baa1 | | | 3,000,000 | | | | 3,388,230 | |
Board of Education of the City of Chicago GO, 5.00% due 12/1/2019 (School District Capital Improvement Program) (State Aid Withholding) | | A+/Baa1 | | | 2,000,000 | | | | 2,249,000 | |
Board of Education of the City of Chicago GO, 0% due 12/1/2020 (Educational Facilities; Insured: BHAC) | | AA+/Aa1 | | | 12,000,000 | | | | 9,764,160 | |
Board of Education of the City of Chicago GO, 5.00% due 12/1/2020 (School District Capital Improvement Program) (State Aid Withholding) | | A+/Baa1 | | | 2,500,000 | | | | 2,810,800 | |
Chicago Housing Authority, 5.00% due 7/1/2015 (Housing Transformation Capital Program; Insured: AGM) (ETM) | | AA/A2 | | | 8,460,000 | | | | 8,957,871 | |
Chicago Housing Authority, 5.00% due 7/1/2016 (Housing Transformation Capital Program; Insured: AGM) (ETM) | | AA/A2 | | | 2,000,000 | | | | 2,201,100 | |
Chicago Park District GO, 5.00% due 1/1/2018 (Park District Capital Improvement Plan) | | AA+/A3 | | | 1,150,000 | | | | 1,281,066 | |
Chicago Park District GO, 5.00% due 1/1/2018 (Park District Capital Improvement Plan; Insured: Natl-Re) | | AA+/A3 | | | 700,000 | | | | 731,227 | |
Chicago School Reform Board of Trustees of the Board of Education GO, 5.25% due 12/1/2021 (School District Capital Improvement Program; Insured: Natl-Re) | | AA-/Baa1 | | | 1,500,000 | | | | 1,691,655 | |
Chicago Transit Authority, 5.25% due 6/1/2017 (Federal Transit Program-Rail Systems; Insured: AGM) | | A/A2 | | | 3,000,000 | | | | 3,332,280 | |
Chicago Transit Authority, 5.50% due 6/1/2018 (Federal Transit Program-Rail Systems; Insured: AGM) | | A/A2 | | | 2,500,000 | | | | 2,851,650 | |
City of Chicago, 5.00% due 11/1/2015 (Water System Extensions & Improvements; Insured: AGM) | | AA/A2 | | | 1,050,000 | | | | 1,124,246 | |
City of Chicago, 4.00% due 1/1/2018 (Wastewater Transmission System) | | A+/A3 | | | 1,475,000 | | | | 1,593,796 | |
City of Chicago, 5.00% due 1/1/2020 (Insured: AGM) | | AAA/A2 | | | 1,320,000 | | | | 1,383,215 | |
City of Chicago, 5.50% due 1/1/2020 (Wastewater Transmission System; Insured: BHAC) | | AA+/Aa1 | | | 1,250,000 | | | | 1,400,525 | |
City of Chicago, 6.75% due 6/1/2022 (Pilsen Redevelopment) | | NR/NR | | | 5,000,000 | | | | 5,031,050 | |
City of Chicago, 5.00% due 1/1/2023 (Chicago Midway Airport) | | A-/A3 | | | 6,215,000 | | | | 7,052,471 | |
City of Chicago, 5.25% due 1/1/2023 (O’Hare International Airport; Insured: AGM) | | AA/A2 | | | 2,000,000 | | | | 2,092,460 | |
City of Chicago, 5.00% due 1/1/2024 (Chicago Midway Airport) | | A-/A3 | | | 16,060,000 | | | | 17,951,226 | |
City of Chicago, 0.29% due 1/1/2034 put 4/1/2014 (Liquidity Facility; SPA: JPMorgan Chase Bank) (daily demand notes) | | AAA/Baa1 | | | 49,235,000 | | | | 49,235,000 | |
City of Chicago Board of Education GO, 6.25% due 1/1/2015 (Insured: Natl-Re) | | AA-/Baa1 | | | 465,000 | | | | 478,490 | |
City of Chicago Board of Education GO, 5.25% due 12/1/2017 (Chicago School Reform Board; Insured: Natl-Re) | | AA-/Baa1 | | | 4,100,000 | | | | 4,601,922 | |
City of Chicago Board of Education GO, 5.00% due 12/1/2018 (Insured: Natl-Re) | | AA-/Baa1 | | | 1,000,000 | | | | 1,129,410 | |
City of Chicago Building Acquisition Certificates GO, 5.40% due 1/1/2018 (Parking Facility Improvements; Insured: AGM) | | AA/A2 | | | 2,105,000 | | | | 2,112,283 | |
City of Chicago GO, 0% due 1/1/2016 (City Colleges; Insured: Natl-Re) | | AA-/Baa1 | | | 2,670,000 | | | | 2,612,408 | |
City of Chicago GO, 5.44% due 1/1/2018 (Transportation Infrastructure Capital Projects; Insured: Natl-Re) | | AA-/Baa1 | | | 3,050,000 | | | | 3,259,992 | |
City of Chicago GO, 5.25% due 1/1/2021 (Public Infrastructure and Facility Improvements) | | A+/Baa1 | | | 500,000 | | | | 551,170 | |
City of Chicago O’Hare International Airport, 5.00% due 1/1/2022 (O’Hare Modernization Program) | | A-/A2 | | | 5,835,000 | | | | 6,592,500 | |
City of Mount Vernon GO, 4.00% due 12/15/2019 (Various Municipal Capital Improvements; Insured: AGM) | | AA/A2 | | | 1,000,000 | | | | 1,095,850 | |
City of Mount Vernon GO, 4.00% due 12/15/2020 (Various Municipal Capital Improvements; Insured: AGM) | | AA/A2 | | | 785,000 | | | | 852,298 | |
City of Mount Vernon GO, 4.00% due 12/15/2021 (Various Municipal Capital Improvements; Insured: AGM) | | AA/A2 | | | 1,640,000 | | | | 1,746,879 | |
City of Quincy, 5.00% due 11/15/2014 (Blessing Hospital) | | A-/A3 | | | 1,000,000 | | | | 1,023,740 | |
City of Quincy, 5.00% due 11/15/2016 (Blessing Hospital) | | A-/A3 | | | 1,750,000 | | | | 1,900,990 | |
City of Quincy, 5.00% due 11/15/2017 (Blessing Hospital) | | A-/A3 | | | 500,000 | | | | 552,980 | |
City of Waukegan GO, 5.00% due 12/30/2019 (Lakehurst Redevelopment Project; Insured: AGM) | | NR/A2 | | | 1,935,000 | | | | 2,182,699 | |
City of Waukegan GO, 5.00% due 12/30/2020 (Lakehurst Redevelopment Project; Insured: AGM) | | NR/A2 | | | 1,000,000 | | | | 1,123,340 | |
City of Waukegan GO, 5.00% due 12/30/2021 (Lakehurst Redevelopment Project; Insured: AGM) | | NR/A2 | | | 2,100,000 | | | | 2,351,496 | |
City of Waukegan GO, 5.00% due 12/30/2022 (Lakehurst Redevelopment Project; Insured: AGM) | | NR/A2 | | | 1,000,000 | | | | 1,117,790 | |
Community College District No. 514 GO, 4.25% due 12/1/2015 (Illinois Central College) | | AA+/Aa2 | | | 2,360,000 | | | | 2,508,373 | |
Community College District No. 516 GO, 4.50% due 12/15/2020 (Waubonsee Community College) | | NR/Aa1 | | | 1,325,000 | | | | 1,499,145 | |
Community College District No. 516 GO, 5.00% due 12/15/2021 (Waubonsee Community College) | | NR/Aa1 | | | 6,175,000 | | | | 7,175,103 | |
Community Consolidated School District No. 146 GO, 9.00% due 12/1/2016 (Tinley Park; Insured: Natl-Re) | | NR/Aa2 | | | 2,500,000 | | | | 2,889,000 | |
Community Consolidated School District No. 158 GO, 0% due 1/1/2017 (McHenry and Kane Counties; Insured: Natl-Re) (ETM) | | NR/Baa1 | | | 95,000 | | | | 92,177 | |
Community Consolidated School District No. 158 GO, 0% due 1/1/2017 (McHenry and Kane Counties; Insured: Natl-Re) | | NR/Baa1 | | | 1,090,000 | | | | 1,020,502 | |
Community Consolidated School District No. 93 GO, 2.00% due 1/1/2017 (Village of Carol Stream) | | AA+/NR | | | 370,000 | | | | 380,723 | |
Community High School District No. 127 GO, 9.00% due 2/1/2015 (Lake County-Grayslake School Bldg.; Insured: AGM) | | AAA/A2 | | | 1,610,000 | | | | 1,718,643 | |
Community High School District No. 127 GO, 9.00% due 2/1/2016 (Lake County-Grayslake School Bldg.; Insured: AGM) | | AAA/A2 | | | 1,890,000 | | | | 2,157,832 | |
Community High School District No. 127 GO, 9.00% due 2/1/2017 (Lake County-Grayslake School Bldg.; Insured: AGM) | | AAA/A2 | | | 2,025,000 | | | | 2,444,965 | |
Community Unit School District No. 200 GO, 5.25% due 10/1/2023 (DuPage County Educational Facilities; Insured: FSA) | | AA/Aa3 | | | 1,000,000 | | | | 1,111,290 | |
Community Unit School District No. 300 GO, 0% due 12/1/2021 (Kane, McHenry Cook & DeKalb Counties; Insured: AMBAC) | | NR/Aa3 | | | 2,000,000 | | | | 1,566,240 | |
Community Unit School District No. 302 GO, 0% due 2/1/2021 (Kane & DeKalb Counties; Insured: Natl-Re) | | NR/Aa3 | | | 3,165,000 | | | | 2,560,453 | |
Certified Semi-Annual Report 21
| | |
| SCHEDULE OF INVESTMENTS, CONTINUED | | |
| |
Thornburg Limited Term Municipal Fund | | March 31, 2014 (Unaudited) |
| | | | | | | | | | |
Issuer-Description | | Credit Rating†
S&P/ Moody’s | | Principal
Amount | | | Value | |
Community Unit School District No. 428 GO, 0% due 1/1/2021 (DeKalb County) | | AA-/Aa2 | | $ | 6,140,000 | | | $ | 4,945,463 | |
Cook County Community College District No. 508 GO, 5.00% due 12/1/2020 (City Colleges of Chicago) | | AA/NR | | | 720,000 | | | | 823,759 | |
Cook County Community College District No. 508 GO, 5.00% due 12/1/2021 (City Colleges of Chicago) | | AA/NR | | | 1,000,000 | | | | 1,140,000 | |
Cook County Community College District No. 508 GO, 5.00% due 12/1/2022 (City Colleges of Chicago) | | AA/NR | | | 1,250,000 | | | | 1,418,812 | |
Cook County Community College District No. 508 GO, 5.00% due 12/1/2023 (City Colleges of Chicago) | | AA/NR | | | 1,250,000 | | | | 1,415,825 | |
Cook County Township High School District No. 227 GO, 5.00% due 12/1/2018 (Rich Township Educational Facilities; Insured: AGM) | | NR/Aa3 | | | 190,000 | | | | 206,281 | |
County of Cook GO, 5.00% due 11/15/2015 (Capital Improvement Plan; Insured: Natl-Re) | | AA/A1 | | | 2,000,000 | | | | 2,147,080 | |
County of Cook GO, 5.00% due 11/15/2019 (Capital Improvement Plan) | | AA/A1 | | | 3,690,000 | | | | 4,215,714 | |
County of Cook GO, 4.00% due 11/15/2020 (Capital Improvement Plan) | | AA/A1 | | | 925,000 | | | | 995,938 | |
County of Cook GO, 5.00% due 11/15/2020 (Capital Improvement Plan) | | AA/A1 | | | 3,590,000 | | | | 4,005,076 | |
County of Cook GO, 5.00% due 11/15/2020 (Capital Improvement Plan) | | AA/A1 | | | 2,000,000 | | | | 2,273,800 | |
County of Cook GO, 4.00% due 11/15/2021 (Capital Improvement Plan) | | AA/A1 | | | 2,000,000 | | | | 2,132,720 | |
County of Cook GO, 5.00% due 11/15/2021 (Capital Improvement Plan) | | AA/A1 | | | 5,000,000 | | | | 5,684,500 | |
County of Cook GO, 5.00% due 11/15/2021 (Capital Improvement Plan) | | AA/A1 | | | 2,105,000 | | | | 2,393,174 | |
County of Cook GO, 4.00% due 11/15/2022 (Capital Improvement Plan) | | AA/A1 | | | 1,000,000 | | | | 1,056,180 | |
County of Cook GO, 5.00% due 11/15/2022 pre-refunded 5/15/2014 (Capital Improvement Plan; Insured: AMBAC) | | NR/A1 | | | 480,000 | | | | 487,646 | |
County of Cook GO, 5.00% due 11/15/2022 pre-refunded 5/15/2014 (Capital Improvement Plan; Insured: AMBAC) | | AA/A1 | | | 1,020,000 | | | | 1,036,249 | |
County of Cook GO, 5.00% due 11/15/2022 (Capital Improvement Plan) | | AA/A1 | | | 1,500,000 | | | | 1,702,155 | |
County of McHenry, 4.50% due 1/15/2016 (Highway Improvement Plan) | | NR/Aaa | | | 1,000,000 | | | | 1,030,380 | |
County of Winnebago GO, 3.00% due 12/30/2015 (Public Safety) | | NR/Aa2 | | | 1,035,000 | | | | 1,081,140 | |
Forest Preserve District of Cook County GO, 5.00% due 11/15/2021 | | AA/A1 | | | 1,500,000 | | | | 1,723,125 | |
Forest Preserve District of Kane County GO, 5.00% due 12/15/2015 (Insured: Natl-Re) | | AA+/Baa1 | | | 2,780,000 | | | | 2,996,979 | |
Illinois Educational Facilities Authority, 4.75% due 3/1/2030 put 3/1/2017 (Art Institute of Chicago) | | AA-/NR | | | 3,030,000 | | | | 3,281,096 | |
Illinois Educational Facilities Authority, 5.00% due 3/1/2030 put 3/1/2017 (Art Institute of Chicago) | | NR/A1 | | | 3,000,000 | | | | 3,269,820 | |
Illinois Educational Facilities Authority, 5.25% due 3/1/2034 put 3/1/2018 (Art Institute of Chicago) | | NR/NR | | | 3,500,000 | | | | 3,888,850 | |
Illinois Educational Facilities Authority, 3.40% due 11/1/2036 put 11/1/2017 (Field Museum of Natural History) | | A/NR | | | 1,300,000 | | | | 1,358,149 | |
Illinois Finance Authority, 5.00% due 5/1/2014 (Student Housing) | | NR/Baa3 | | | 3,895,000 | | | | 3,903,102 | |
Illinois Finance Authority, 5.00% due 11/1/2014 (Central DuPage Health) | | AA/NR | | | 5,000,000 | | | | 5,134,250 | |
Illinois Finance Authority, 4.00% due 4/1/2015 (Advocate Health Care) | | AA/Aa2 | | | 3,000,000 | | | | 3,112,440 | |
Illinois Finance Authority, 5.25% due 5/15/2015 (Resurrection Health Care Corp.) | | BBB+/Baa1 | | | 1,000,000 | | | | 1,044,020 | |
Illinois Finance Authority, 5.00% due 10/1/2015 (DePaul University) | | NR/A2 | | | 1,000,000 | | | | 1,067,710 | |
Illinois Finance Authority, 5.00% due 11/1/2015 (Central DuPage Health) | | AA/NR | | | 5,000,000 | | | | 5,338,650 | |
Illinois Finance Authority, 5.25% due 12/1/2015 (Columbia College) | | BBB+/NR | | | 1,620,000 | | | | 1,716,876 | |
Illinois Finance Authority, 5.00% due 4/1/2016 (Advocate Health Care) | | AA/Aa2 | | | 1,250,000 | | | | 1,358,263 | |
Illinois Finance Authority, 5.00% due 12/1/2016 (Columbia College) | | BBB+/NR | | | 1,710,000 | | | | 1,844,902 | |
Illinois Finance Authority, 5.00% due 11/1/2017 (Rush University Medical Center; Insured: Natl-Re) | | AA-/A2 | | | 1,000,000 | | | | 1,103,940 | |
Illinois Finance Authority, 5.00% due 12/1/2017 (Columbia College) | | BBB+/NR | | | 1,395,000 | | | | 1,526,479 | |
Illinois Finance Authority, 5.50% due 11/1/2018 (Advocate Health Care) | | AA/Aa2 | | | 1,000,000 | | | | 1,163,780 | |
Illinois Finance Authority, 5.25% due 5/1/2019 (Educational Advancement Fund, Inc.) | | NR/Baa3 | | | 4,675,000 | | | | 4,934,462 | |
Illinois Finance Authority, 5.00% due 4/1/2020 (Advocate Health Care) | | AA/Aa2 | | | 1,315,000 | | | | 1,484,122 | |
Illinois Finance Authority, 4.00% due 12/1/2021 (Trinity Health) | | AA-/Aa2 | | | 1,000,000 | | | | 1,069,650 | |
Illinois Finance Authority, 5.00% due 11/1/2030 put 1/15/2020 (Advocate Health Care) | | AA/Aa2 | | | 1,250,000 | | | | 1,432,137 | |
Illinois Finance Authority, 2.625% due 2/1/2033 put 8/1/2015 (Peoples Gas Light & Coke Co.) | | A/Aa3 | | | 9,500,000 | | | | 9,746,905 | |
Illinois Finance Authority, 4.30% due 6/1/2035 put 6/1/2016 (Peoples Gas Light & Coke Co.; Insured: AMBAC) | | A/Aa3 | | | 2,350,000 | | | | 2,520,140 | |
Illinois Finance Authority, 3.00% due 7/1/2042 put 5/6/2014 (Prairie Power; Insured: National Rural Utilities Cooperative) | | A/NR | | | 16,810,000 | | | | 16,840,594 | |
Illinois Toll Highway Authority, 5.50% due 1/1/2015 (Insured: AGM) | | AA/Aa3 | | | 5,000,000 | | | | 5,197,700 | |
Lake County Community High School District No. 127 GO, 7.375% due 2/1/2020 (Grayslake; Insured: Syncora) | | AAA/NR | | | 1,000,000 | | | | 1,274,080 | |
Metropolitan Pier & Exposition Authority, 0% due 6/15/2016 (McCormick Place Expansion; Insured: Natl-Re) (ETM) | | AA-/NR | | | 3,475,000 | | | | 3,426,350 | |
Metropolitan Pier & Exposition Authority, 0% due 6/15/2016 (McCormick Place Expansion; Insured: Natl-Re) | | AA-/Baa1 | | | 8,245,000 | | | | 7,996,825 | |
Metropolitan Pier & Exposition Authority, 5.00% due 12/15/2020 (McCormick Place Expansion) | | AAA/NR | | | 4,000,000 | | | | 4,598,080 | |
Metropolitan Water Reclamation District of Greater Chicago GO, 4.00% due 12/1/2014 (Capital Improvements) | | AAA/Aa1 | | | 2,500,000 | | | | 2,564,000 | |
Railsplitter Tobacco Settlement Authority, 5.00% due 6/1/2019 | | A/NR | | | 22,000,000 | | | | 25,299,560 | |
Railsplitter Tobacco Settlement Authority, 5.125% due 6/1/2019 | | A/NR | | | 6,780,000 | | | | 7,838,358 | |
Regional Transportation Authority GO, 6.25% due 7/1/2014 (Insured: Natl-Re) | | AA/Aa3 | | | 3,500,000 | | | | 3,553,025 | |
Sangamon County Community Unit School District No. 5, 5.00% due 1/1/2015 (Insured: AGM) | | AA/NR | | | 2,210,000 | | | | 2,285,869 | |
School District No. 122 GO, 0% due 1/1/2016 (Winnebago County-Harlem-Loves Park; Insured: AGM) | | NR/A2 | | | 2,000,000 | | | | 1,961,280 | |
School District No. 97 GO, 9.00% due 12/1/2018 (Village of Oak Park; Insured: Natl-Re) | | NR/Aa2 | | | 4,000,000 | | | | 5,241,320 | |
Southwestern Illinois Development Authority, 5.125% due 8/15/2016 (Anderson Hospital) | | BBB-/Baa3 | | | 915,000 | | | | 965,188 | |
State of Illinois, 3.50% due 6/15/2014 (Build Illinois Bond Retirement & Interest Fund) | | AAA/A3 | | | 6,455,000 | | | | 6,499,733 | |
State of Illinois, 5.00% due 6/15/2016 (Build Illinois Bond Retirement & Interest Fund) | | AAA/NR | | | 3,500,000 | | | | 3,844,400 | |
Town of Cicero Cook County GO, 5.00% due 1/1/2018 (Insured: AGM) | | AA/A2 | | | 2,375,000 | | | | 2,620,242 | |
Town of Cicero Cook County GO, 5.00% due 1/1/2019 (Insured: AGM) | | AA/A2 | | | 2,000,000 | | | | 2,213,100 | |
Town of Cicero Cook County GO, 5.25% due 1/1/2019 pre-refunded 1/1/2015 (Economic Redevelopment; Insured: Syncora) | | NR/NR | | | 6,140,000 | | | | 6,370,803 | |
Town of Cicero Cook County GO, 5.00% due 12/1/2019 (Economic Redevelopment) | | A+/NR | | | 1,070,000 | | | | 1,180,777 | |
Town of Cicero Cook County GO, 5.00% due 1/1/2020 (Insured: AGM) | | AA/A2 | | | 1,250,000 | | | | 1,379,688 | |
22 Certified Semi-Annual Report
| | |
| SCHEDULE OF INVESTMENTS, CONTINUED | | |
| |
Thornburg Limited Term Municipal Fund | | March 31, 2014 (Unaudited) |
| | | | | | | | | | |
Issuer-Description | | Credit Rating†
S&P/ Moody’s | | Principal
Amount | | | Value | |
Town of Cicero Cook County GO, 5.00% due 1/1/2021 (Insured: AGM) | | AA/A2 | | $ | 1,250,000 | | | $ | 1,369,663 | |
University of Illinois Board of Trustees COP, 5.00% due 10/1/2019 (Insured: AGM) | | AA/Aa3 | | | 2,000,000 | | | | 2,201,100 | |
Village of Bolingbrook, DuPage and Will Counties GO, 0% due 1/1/2016 (Insured: Natl-Re) | | NR/Aa3 | | | 1,500,000 | | | | 1,413,780 | |
Village of Bolingbrook, DuPage and Will Counties GO, 0% due 1/1/2017 pre-refunded 1/1/2015 (Insured: Natl-Re) | | NR/Aa3 | | | 85,000 | | | | 77,136 | |
Village of Bolingbrook, DuPage and Will Counties GO, 0% due 1/1/2017 (Insured: Natl-Re) | | NR/Aa3 | | | 1,915,000 | | | | 1,712,355 | |
Village of Broadview, 5.375% due 7/1/2015 | | NR/NR | | | 2,325,000 | | | | 2,330,812 | |
Village of Downers Grove GO, 3.00% due 1/1/2017 | | AAA/NR | | | 970,000 | | | | 1,017,084 | |
Village of Melrose Park, 5.20% due 7/1/2018 (Insured: Natl-Re) | | AA-/Baa1 | | | 1,190,000 | | | | 1,202,876 | |
Village of Skokie GO, 5.00% due 12/1/2014 | | NR/Aaa | | | 565,000 | | | | 582,249 | |
Village of Tinley Park GO, 4.00% due 12/1/2022 | | AA+/NR | | | 625,000 | | | | 677,531 | |
Will County Community High School District No. 210 GO, 5.00% due 1/1/2015 (Lincoln-Way School Building; Insured: Natl-Re) (ETM) | | NR/Aa2 | | | 750,000 | | | | 777,083 | |
Will County Community High School District No. 210 GO, 5.00% due 1/1/2015 (Lincoln-Way School Building; Insured: Natl-Re/FGIC) | | NR/Aa2 | | | 250,000 | | | | 258,815 | |
Will County Valley View Community Unit School District No. 365 GO, 0% due 11/1/2018 (Insured: AGM) | | AA/Aa2 | | | 3,370,000 | | | | 3,072,362 | |
| | | |
INDIANA — 3.36% | | | | | | | | | | |
Allen County Jail Building Corp., 5.00% due 10/1/2014 (Insured: Syncora) | | NR/Aa2 | | | 500,000 | | | | 505,750 | |
Allen County Jail Building Corp., 5.00% due 10/1/2015 (Insured: Syncora) | | NR/Aa2 | | | 1,480,000 | | | | 1,561,874 | |
Allen County Jail Building Corp., 5.00% due 10/1/2016 (Insured: Syncora) | | NR/Aa2 | | | 1,520,000 | | | | 1,644,032 | |
Allen County Redevelopment District, 5.00% due 11/15/2016 | | NR/A2 | | | 1,000,000 | | | | 1,064,630 | |
Avon Community School Building Corp., 5.00% due 7/15/2017 (Insured: AMBAC) (State Aid Withholding) | | A/NR | | | 2,500,000 | | | | 2,807,200 | |
Board of Trustees for the Vincennes University, 3.00% due 6/1/2014 | | NR/Aa3 | | | 1,000,000 | | | | 1,004,190 | |
Board of Trustees for the Vincennes University, 3.00% due 6/1/2015 | | NR/Aa3 | | | 1,000,000 | | | | 1,028,510 | |
Board of Trustees for the Vincennes University, 4.00% due 6/1/2018 | | NR/Aa3 | | | 1,000,000 | | | | 1,097,900 | |
Board of Trustees for the Vincennes University, 5.00% due 6/1/2020 | | NR/Aa3 | | | 1,000,000 | | | | 1,159,730 | |
Brownsburg 1999 School Building Corp., 5.00% due 8/1/2017 (Cardinal, Delaware Trail, White Lick Elementary & Brownsburg Junior High Schools; Insured: AGM) (State Aid Withholding) | | AA+/A2 | | | 1,000,000 | | | | 1,060,410 | |
Brownsburg 1999 School Building Corp., 5.00% due 7/15/2018 (Harris Education Center and East Middle School; Insured: AGM) (State Aid Withholding) | | AA+/NR | | | 3,430,000 | | | | 3,633,125 | |
Brownsburg 1999 School Building Corp., 5.00% due 8/1/2018 (Cardinal, Delaware Trail, White Lick Elementary & Brownsburg Junior High Schools; Insured: AGM) (State Aid Withholding) | | AA+/A2 | | | 1,475,000 | | | | 1,563,175 | |
City of Carmel Redevelopment Authority, 3.00% due 8/1/2014 (Road and Intersection Improvements) | | AA+/NR | | | 915,000 | | | | 923,363 | |
City of Carmel Redevelopment Authority, 0% due 2/1/2015 (Performing Arts Center) | | AA+/Aa1 | | | 1,575,000 | | | | 1,569,645 | |
City of Carmel Redevelopment Authority, 4.00% due 2/1/2015 (Road and Intersection Improvements) | | AA+/NR | | | 990,000 | | | | 1,020,146 | |
City of Carmel Redevelopment Authority, 4.25% due 7/1/2015 (Hazel Dell Parkway & Pennsylvania Street Economic Development Area Roadways; Insured: Natl-Re) | | NR/A2 | | | 600,000 | | | | 605,730 | |
City of Carmel Redevelopment Authority, 4.00% due 8/1/2015 (Road and Intersection Improvements) | | AA+/NR | | | 975,000 | | | | 1,021,917 | |
City of Carmel Redevelopment Authority, 5.00% due 8/1/2021 (Road and Intersection Improvements) | | AA+/NR | | | 2,405,000 | | | | 2,802,162 | |
City of Carmel Redevelopment Authority, 5.00% due 8/1/2022 (Road and Intersection Improvements) | | AA+/NR | | | 2,510,000 | | | | 2,931,379 | |
City of Carmel Redevelopment District COP, 5.75% due 7/15/2022 (CFP Energy Center, LLC Installment Purchase Agreement) | | NR/NR | | | 3,945,000 | | | | 4,299,616 | |
City of Fort Wayne, 4.25% due 8/1/2014 (Sewer Works Improvements) | | NR/Aa3 | | | 1,745,000 | | | | 1,768,400 | |
City of Fort Wayne, 2.00% due 12/1/2014 (Waterworks Utility Improvements) | | NR/Aa3 | | | 925,000 | | | | 935,934 | |
City of Fort Wayne, 4.25% due 8/1/2015 (Sewer Works Improvements) | | NR/Aa3 | | | 1,780,000 | | | | 1,872,667 | |
City of Fort Wayne, 2.00% due 12/1/2015 (Waterworks Utility Improvements) | | NR/Aa3 | | | 1,145,000 | | | | 1,175,949 | |
City of Fort Wayne, 2.00% due 12/1/2016 (Waterworks Utility Improvements) | | NR/Aa3 | | | 1,160,000 | | | | 1,195,705 | |
City of Fort Wayne, 2.00% due 12/1/2017 (Waterworks Utility Improvements) | | NR/Aa3 | | | 1,175,000 | | | | 1,206,890 | |
City of Rockport PCR, 6.25% due 6/1/2025 put 6/2/2014 (Indiana Michigan Power Co. Project) | | BBB/Baa1 | | | 4,100,000 | | | | 4,139,606 | |
City of Rockport PCR, 6.25% due 6/1/2025 put 6/2/2014 (Indiana Michigan Power Co. Project) | | BBB/Baa1 | | | 1,000,000 | | | | 1,009,660 | |
City of Whiting, 5.00% due 1/1/2016 (BP Products North America, Inc.) | | A/A2 | | | 5,375,000 | | | | 5,789,950 | |
Clay Multiple School Building Corp., 4.00% due 7/15/2015 (State Aid Withholding) | | AA+/NR | | | 1,000,000 | | | | 1,042,970 | |
Clay Multiple School Building Corp., 5.00% due 7/15/2016 (State Aid Withholding) | | AA+/NR | | | 1,295,000 | | | | 1,415,163 | |
Clay Multiple School Building Corp., 5.00% due 1/15/2017 (State Aid Withholding) | | AA+/NR | | | 1,000,000 | | | | 1,103,410 | |
Crown Point Multi-School Building Corp., 0% due 1/15/2016 (Crown Point Community School Corp.; Insured: Natl-Re) (State Aid Withholding) | | AA-/Baa1 | | | 5,685,000 | | | | 5,602,283 | |
Duneland School Building Corp., 0% due 2/1/2020 (State Aid Withholding) | | A/NR | | | 2,970,000 | | | | 2,494,473 | |
Duneland School Building Corp., 0% due 8/1/2020 (State Aid Withholding) | | A/NR | | | 3,470,000 | | | | 2,856,920 | |
Duneland School Building Corp., 0% due 2/1/2021 (State Aid Withholding) | | A/NR | | | 2,770,000 | | | | 2,202,178 | |
Duneland School Building Corp., 0% due 8/1/2021 (State Aid Withholding) | | A/NR | | | 3,270,000 | | | | 2,539,972 | |
Evansville Vanderburgh Public Library Leasing Corp., 5.00% due 7/15/2014 (Insured: AMBAC) (ETM) | | A+/NR | | | 505,000 | | | | 512,070 | |
Evansville Vanderburgh Public Library Leasing Corp., 5.00% due 7/15/2015 (Insured: AMBAC) (ETM) | | A+/NR | | | 1,000,000 | | | | 1,060,730 | |
Fort Wayne Community Schools GO, 1.00% due 7/15/2014 (Renewal, Restoration & Safety Project) (State Aid Withholding) | | AA+/NR | | | 1,600,000 | | | | 1,603,696 | |
Fort Wayne Community Schools GO, 1.00% due 1/15/2015 (Renewal, Restoration & Safety Project) (State Aid Withholding) | | AA+/NR | | | 1,500,000 | | | | 1,509,195 | |
Indiana Bond Bank, 5.25% due 10/15/2016 (Special Gas Program) | | NR/A3 | | | 1,545,000 | | | | 1,709,481 | |
Indiana Bond Bank, 5.00% due 10/15/2017 (Special Gas Program) | | NR/A3 | | | 5,000,000 | | | | 5,553,600 | |
Certified Semi-Annual Report 23
| | |
| SCHEDULE OF INVESTMENTS, CONTINUED | | |
| |
Thornburg Limited Term Municipal Fund | | March 31, 2014 (Unaudited) |
| | | | | | | | | | |
Issuer-Description | | Credit Rating†
S&P/ Moody’s | | Principal
Amount | | | Value | |
Indiana Bond Bank, 5.00% due 8/1/2021 (Columbus Learning Center) | | AA/NR | | $ | 1,300,000 | | | $ | 1,496,287 | |
Indiana Finance Authority, 5.00% due 11/1/2014 (Sisters of St. Francis Health Services, Inc.) | | NR/Aa3 | | | 1,000,000 | | | | 1,028,230 | |
Indiana Finance Authority, 5.00% due 5/1/2015 (Parkview Health Systems) | | A+/A1 | | | 1,500,000 | | | | 1,572,390 | |
Indiana Finance Authority, 4.90% due 1/1/2016 (Indiana Power & Light Co.) | | BBB+/A2 | | | 11,650,000 | | | | 12,396,182 | |
Indiana Finance Authority, 5.00% due 5/1/2016 (Parkview Health Systems) | | A+/A1 | | | 3,090,000 | | | | 3,364,763 | |
Indiana Finance Authority, 5.00% due 7/1/2016 (Forensic & Health Science; Insured: Natl-Re) (ETM) | | AA+/Aa1 | | | 1,030,000 | | | | 1,133,319 | |
Indiana Finance Authority, 5.00% due 9/15/2016 (Marian University Health Sciences) | | BBB-/NR | | | 1,500,000 | | | | 1,557,135 | |
Indiana Finance Authority, 5.00% due 5/1/2017 (Parkview Health Systems) | | A+/A1 | | | 1,000,000 | | | | 1,109,540 | |
Indiana Finance Authority, 5.00% due 9/15/2017 (Marian University Health Sciences) | | BBB-/NR | | | 1,940,000 | | | | 2,028,755 | |
Indiana Finance Authority, 4.00% due 5/1/2018 (Community Health Network) | | A/A2 | | | 2,820,000 | | | | 3,057,416 | |
Indiana Finance Authority, 5.25% due 7/1/2018 (Wabash Correctional Facilities) | | AA+/Aa1 | | | 1,000,000 | | | | 1,163,240 | |
Indiana Finance Authority, 5.25% due 7/1/2018 (Rockville Correctional Facilities) (ETM) | | AA+/Aa1 | | | 2,150,000 | | | | 2,518,467 | |
Indiana Finance Authority, 5.00% due 9/15/2018 (Marian University Health Sciences) | | BBB-/NR | | | 1,790,000 | | | | 1,876,493 | |
Indiana Finance Authority, 5.00% due 11/1/2018 (Indianapolis Airport) | | AA+/Aa2 | | | 2,750,000 | | | | 3,175,067 | |
Indiana Finance Authority, 5.00% due 11/1/2018 (Sisters of St. Francis Health Services, Inc.) | | NR/Aa3 | | | 1,250,000 | | | | 1,436,837 | |
Indiana Finance Authority, 5.00% due 5/1/2019 (Community Health Network) | | A/A2 | | | 1,385,000 | | | | 1,587,999 | |
Indiana Finance Authority, 5.00% due 9/15/2019 (Marian University Health Sciences) | | BBB-/NR | | | 1,250,000 | | | | 1,303,238 | |
Indiana Finance Authority, 5.00% due 3/1/2020 (Indiana University Health System) | | AA-/Aa3 | | | 5,000,000 | | | | 5,722,950 | |
Indiana Finance Authority, 5.00% due 5/1/2020 (Community Health Network) | | A/A2 | | | 860,000 | | | | 986,730 | |
Indiana Finance Authority, 5.00% due 9/15/2020 (Marian University Health Sciences) | | BBB-/NR | | | 2,245,000 | | | | 2,313,585 | |
Indiana Finance Authority, 5.00% due 3/1/2021 (Indiana University Health System) | | AA-/Aa3 | | | 9,880,000 | | | | 11,186,334 | |
Indiana Finance Authority, 5.00% due 5/1/2021 (Community Health Network) | | A/A2 | | | 2,250,000 | | | | 2,568,127 | |
Indiana Finance Authority, 5.00% due 9/15/2021 (Marian University Health Sciences) | | BBB-/NR | | | 2,320,000 | | | | 2,364,753 | |
Indiana Finance Authority, 5.00% due 3/1/2022 (Indiana University Health System) | | AA-/Aa3 | | | 3,240,000 | | | | 3,611,336 | |
Indiana Finance Authority, 5.00% due 5/1/2022 (Community Health Network) | | A/A2 | | | 1,230,000 | | | | 1,400,047 | |
Indiana Finance Authority, 5.00% due 5/1/2022 (Parkview Regional Medical Center) | | A+/A1 | | | 1,135,000 | | | | 1,283,231 | |
Indiana Finance Authority, 0.05% due 2/1/2037 put 4/1/2014 (Stadium Project; SPA: JPMorgan Chase Bank) (daily demand notes) | | AA+/Aa2 | | | 1,500,000 | | | | 1,500,053 | |
Indiana HFFA, 5.00% due 10/1/2027 put 6/1/2017 (Ascension Health) | | NR/Aa3 | | | 7,100,000 | | | | 7,991,263 | |
Indianapolis Local Public Improvement Bond Bank, 5.00% due 1/1/2015 (Waterworks System; Insured: Natl-Re) | | AA-/A2 | | | 1,000,000 | | | | 1,034,250 | |
Indianapolis Local Public Improvement Bond Bank, 5.00% due 7/1/2015 (Waterworks System; Insured: Natl-Re) | | AA-/A2 | | | 1,000,000 | | | | 1,056,520 | |
Indianapolis Local Public Improvement Bond Bank, 5.00% due 7/1/2016 (Wishard Complex-Myers Special Care Center Building; Insured: Natl-Re) | | AA+/Aa1 | | | 1,030,000 | | | | 1,086,743 | |
IPS (Indianapolis Public Schools) Multi-School Building Corp., 5.50% due 7/15/2015 (Insured: Natl-Re) | | AA/Baa1 | | | 1,690,000 | | | | 1,803,264 | |
IPS (Indianapolis Public Schools) Multi-School Building Corp., 5.00% due 7/15/2016 (Insured: Natl-Re) | | AA/Baa1 | | | 5,000,000 | | | | 5,494,800 | |
Ivy Tech Community College, 4.00% due 7/1/2014 | | AA-/NR | | | 1,500,000 | | | | 1,513,695 | |
Knox Middle School Building Corp., 0% due 1/15/2020 (Insured: Natl-Re) (State Aid Withholding) | | AA-/Baa1 | | | 1,295,000 | | | | 1,089,574 | |
Lake Central Multi-District School Building Corp., 4.00% due 1/15/2019 (Educational Facilities) (State Aid Withholding) | | AA+/A2 | | | 1,000,000 | | | | 1,098,190 | |
Lake Central Multi-District School Building Corp., 5.00% due 7/15/2019 (Educational Facilities) (State Aid Withholding) | | AA+/A2 | | | 1,680,000 | | | | 1,935,780 | |
Lake Central Multi-District School Building Corp., 4.00% due 1/15/2020 (Educational Facilities) (State Aid Withholding) | | AA+/A2 | | | 1,345,000 | | | | 1,471,255 | |
Lake Central Multi-District School Building Corp., 5.00% due 7/15/2020 (Educational Facilities) (State Aid Withholding) | | AA+/A2 | | | 1,170,000 | | | | 1,346,916 | |
Lake Central Multi-District School Building Corp., 4.00% due 1/15/2021 (Educational Facilities) (State Aid Withholding) | | AA+/A2 | | | 1,250,000 | | | | 1,355,238 | |
Lake Central Multi-District School Building Corp., 5.00% due 7/15/2021 (Educational Facilities) (State Aid Withholding) | | AA+/A2 | | | 1,250,000 | | | | 1,430,437 | |
Lake Central Multi-District School Building Corp., 4.00% due 1/15/2022 (Educational Facilities) (State Aid Withholding) | | AA+/A2 | | | 1,455,000 | | | | 1,563,077 | |
Lake Central Multi-District School Building Corp., 5.00% due 7/15/2022 (Educational Facilities) (State Aid Withholding) | | AA+/A2 | | | 1,000,000 | | | | 1,145,320 | |
Madison Schools Lydia Middleton Building Corp., 5.00% due 7/15/2014 (Insured: Natl-Re) (State Aid Withholding) (ETM) | | AA+/Baa1 | | | 605,000 | | | | 613,337 | |
Madison Schools Lydia Middleton Building Corp., 5.00% due 7/15/2015 (Insured: Natl-Re) (State Aid Withholding) (ETM) | | AA+/Baa1 | | | 1,250,000 | | | | 1,311,163 | |
Metropolitan School District of Pike Township GO, 3.00% due 1/15/2017 (College Park Ancillary Rooms) (State Aid Withholding) | | AA+/NR | | | 2,115,000 | | | | 2,243,846 | |
Mount Vernon of Hancock County Multi-School Building Corp., 5.00% due 7/15/2014 (Insured: Natl-Re) (State Aid Withholding) (ETM) | | AA-/Baa1 | | | 870,000 | | | | 882,180 | |
Mount Vernon of Hancock County Multi-School Building Corp., 5.00% due 7/15/2014 (Insured: Natl-Re) (State Aid Withholding) | | AA-/Baa1 | | | 265,000 | | | | 268,474 | |
Mount Vernon of Hancock County Multi-School Building Corp., 5.00% due 7/15/2015 (Insured: Natl-Re) (State Aid Withholding) (ETM) | | AA-/Baa1 | | | 870,000 | | | | 922,835 | |
Mount Vernon of Hancock County Multi-School Building Corp., 5.00% due 7/15/2015 (Insured: Natl-Re) (State Aid Withholding) | | AA-/Baa1 | | | 270,000 | | | | 283,076 | |
MSD of Warren Township Vision 2005 School Building Corp., 5.00% due 7/10/2015 pre-refunded 1/10/2015 (Insured: Natl-Re) (State Aid Withholding) | | AA+/Baa1 | | | 2,895,000 | | | | 3,002,723 | |
Noblesville Building Corp., 5.00% due 7/15/2023 pre-refunded 7/1/2014 (Fire Stations Nos. 5 & 6; Insured: Natl-Re) | | AA/Baa1 | | | 1,570,000 | | | | 1,591,933 | |
Noblesville Multi-School Building Corp., 5.00% due 7/15/2015 pre-refunded 1/15/2015 (Insured: Natl-Re) (State Aid Withholding) | | AA+/Baa1 | | | 1,760,000 | | | | 1,826,634 | |
Noblesville Redevelopment Authority, 5.00% due 8/1/2016 (146th Street Extension A) | | AA/NR | | | 1,660,000 | | | | 1,820,489 | |
Perry Township Multischool Building Corp., 5.00% due 7/10/2014 (Educational Facilities; Insured: AGM) (State Aid Withholding) | | NR/Aa2 | | | 2,130,000 | | | | 2,157,541 | |
Perry Township Multischool Building Corp., 4.00% due 1/15/2018 (Educational Facilities) (State Aid Withholding) | | AA+/NR | | | 1,000,000 | | | | 1,096,050 | |
24 Certified Semi-Annual Report
| | |
| SCHEDULE OF INVESTMENTS, CONTINUED | | |
| |
Thornburg Limited Term Municipal Fund | | March 31, 2014 (Unaudited) |
| | | | | | | | | | |
Issuer-Description | | Credit Rating†
S&P/ Moody’s | | Principal
Amount | | | Value | |
Perry Township Multischool Building Corp., 3.00% due 1/10/2019 (Educational Facilities) (State Aid Withholding) | | AA+/NR | | $ | 1,000,000 | | | $ | 1,052,520 | |
Perry Township Multischool Building Corp., 4.00% due 7/10/2019 (Educational Facilities) (State Aid Withholding) | | AA+/NR | | | 1,000,000 | | | | 1,101,900 | |
Perry Township Multischool Building Corp., 5.00% due 7/10/2020 (Educational Facilities) (State Aid Withholding) | | AA+/NR | | | 2,090,000 | | | | 2,412,445 | |
Perry Township Multischool Building Corp., 5.00% due 7/10/2021 (Educational Facilities) (State Aid Withholding) | | AA+/NR | | | 1,000,000 | | | | 1,150,980 | |
Pike Township Multi-School Building Corp., 4.00% due 1/15/2017 (Metropolitan School District of Pike Township) (State Aid Withholding) | | AA+/NR | | | 1,080,000 | | | | 1,175,526 | |
Plainfield Community High School Building Corp., 5.00% due 1/15/2015 (Insured: Natl-Re) | | AA+/Baa1 | | | 1,445,000 | | | | 1,496,442 | |
South Bend Community School Building Corp., 5.00% due 7/15/2016 (Insured: Natl-Re) (State Aid Withholding) | | AA+/Baa1 | | | 1,785,000 | | | | 1,962,857 | |
Westfield Washington Multi-School Building Corp., 5.00% due 7/15/2015 pre-refunded 1/15/2015 (Insured: AGM) (State Aid Withholding) | | AA/A2 | | | 540,000 | | | | 560,315 | |
Westfield Washington Multi-School Building Corp., 5.00% due 7/15/2015 (Insured: AGM) (State Aid Withholding) | | AA/A2 | | | 370,000 | | | | 383,253 | |
Zionsville Community Schools Building Corp., 5.00% due 7/15/2019 (Insured: AGM) (State Aid Withholding) | | AA/A2 | | | 1,100,000 | | | | 1,267,475 | |
| | | |
IOWA — 0.50% | | | | | | | | | | |
Des Moines Independent Community School District, 4.00% due 6/1/2019 (School Infrastructure; Insured: AGM) | | AA/A2 | | | 3,870,000 | | | | 4,277,434 | |
Des Moines Independent Community School District, 4.00% due 6/1/2020 (School Infrastructure; Insured: AGM) | | AA/A2 | | | 3,990,000 | | | | 4,379,623 | |
Des Moines Independent Community School District, 4.00% due 6/1/2021 (School Infrastructure; Insured: AGM) | | AA/A2 | | | 4,125,000 | | | | 4,445,966 | |
Des Moines Independent Community School District, 4.00% due 6/1/2022 (School Infrastructure; Insured: AGM) | | AA/A2 | | | 2,140,000 | | | | 2,282,396 | |
Iowa Finance Authority, 5.00% due 2/15/2015 (Iowa Health System; Insured: AGM) | | NR/Aa3 | | | 2,100,000 | | | | 2,182,278 | |
Iowa Finance Authority, 5.00% due 2/15/2016 (Iowa Health System; Insured: AGM) | | NR/Aa3 | | | 1,600,000 | | | | 1,724,848 | |
Iowa Finance Authority, 5.00% due 8/15/2016 (Iowa Health System; Insured: AGM) | | NR/Aa3 | | | 1,500,000 | | | | 1,645,230 | |
Iowa Finance Authority, 5.00% due 2/15/2017 (Iowa Health System; Insured: AGM) | | NR/Aa3 | | | 1,600,000 | | | | 1,769,456 | |
Iowa Finance Authority, 5.00% due 8/15/2017 (Iowa Health System; Insured: AGM) | | NR/Aa3 | | | 990,000 | | | | 1,112,047 | |
Iowa Finance Authority, 5.00% due 2/15/2018 (Iowa Health System; Insured: AGM) | | NR/Aa3 | | | 1,405,000 | | | | 1,589,167 | |
Iowa Finance Authority, 5.00% due 7/1/2022 (Genesis Health System) | | NR/A1 | | | 1,735,000 | | | | 1,950,452 | |
Iowa Finance Authority, 5.00% due 7/1/2023 (Genesis Health System) | | NR/A1 | | | 2,000,000 | | | | 2,243,620 | |
Iowa Finance Authority, 5.00% due 7/1/2024 (Genesis Health System) | | NR/A1 | | | 2,350,000 | | | | 2,610,686 | |
State of Iowa, 5.00% due 6/1/2014 (IJOBS Program) | | AA/Aa2 | | | 500,000 | | | | 504,065 | |
| | | |
KANSAS — 0.11% | | | | | | | | | | |
Kansas Development Finance Authority, 5.00% due 11/1/2015 (State Capitol, School of Pharmacy and Wildlife & Parks Projects) | | AA/Aa2 | | | 2,605,000 | | | | 2,796,363 | |
Kansas Development Finance Authority, 5.00% due 5/1/2018 (University of Kansas Housing System Project; Insured: AMBAC) | | AA-/Aa3 | | | 1,400,000 | | | | 1,469,230 | |
Kansas Development Finance Authority, 5.00% due 12/1/2020 (New Jobs Training; Insured: BAM) | | AA/NR | | | 1,500,000 | | | | 1,692,825 | |
Leavenworth County GO, 4.00% due 3/1/2015 (KTA and KDOT Loans) | | AA-/NR | | | 1,040,000 | | | | 1,074,840 | |
| | | |
KENTUCKY — 0.55% | | | | | | | | | | |
Jefferson County School District Finance Corp., 5.25% due 1/1/2016 (Insured: AGM) | | AA/Aa2 | | | 2,145,000 | | | | 2,322,670 | |
Kentucky Economic DFA, 0% due 10/1/2019 (Norton Healthcare, Inc.; Insured: Natl-Re) | | AA-/Baa1 | | | 5,000,000 | | | | 4,245,750 | |
Kentucky Economic DFA, 0% due 10/1/2020 (Norton Healthcare, Inc.; Insured: Natl-Re) | | AA-/Baa1 | | | 9,600,000 | | | | 7,745,280 | |
Kentucky Economic DFA, 0% due 10/1/2021 (Norton Healthcare, Inc.; Insured: Natl-Re) | | AA-/Baa1 | | | 2,885,000 | | | | 2,171,367 | |
Kentucky Economic DFA, 0% due 10/1/2023 (Norton Healthcare, Inc.; Insured: Natl-Re) | | AA-/Baa1 | | | 4,195,000 | | | | 2,794,415 | |
Kentucky Economic DFA, 5.00% due 5/1/2039 put 11/11/2014 (Catholic Health Initiatives) | | A+/A1 | | | 5,500,000 | | | | 5,656,640 | |
Kentucky Municipal Power Agency, 4.00% due 9/1/2015 (Insured: AGM) | | AA/A2 | | | 2,955,000 | | | | 3,099,086 | |
Lexington-Fayette Urban County Government Public Facilities Corp., 5.00% due 6/1/2014 (Eastern State Hospital) | | A+/Aa3 | | | 1,000,000 | | | | 1,008,070 | |
Lexington-Fayette Urban County Government Public Facilities Corp., 5.00% due 6/1/2022 (Eastern State Hospital) | | A+/Aa3 | | | 6,165,000 | | | | 7,008,557 | |
| | | |
LOUISIANA — 2.88% | | | | | | | | | | |
City of Bossier, 4.00% due 12/1/2018 (Public Improvements; Insured: AGM) | | AA/Aa3 | | | 2,020,000 | | | | 2,244,947 | |
City of Bossier, 4.50% due 12/1/2021 (Public Improvements; Insured: AGM) | | AA/Aa3 | | | 2,240,000 | | | | 2,526,944 | |
City of Lafayette, 4.00% due 11/1/2016 (Utilities System Improvements) | | A+/A1 | | | 1,395,000 | | | | 1,510,492 | |
City of Lafayette, 5.00% due 11/1/2019 (Utilities System Improvements) | | A+/A1 | | | 1,000,000 | | | | 1,160,910 | |
City of Monroe, 5.00% due 3/1/2017 pre-refunded 3/1/2015 (Garrett Road Economic Development; Insured: Radian) | | NR/NR | | | 1,155,000 | | | | 1,198,278 | |
City of New Orleans GO, 5.00% due 10/1/2016 (Audubon Park Aquarium) | | A/NR | | | 2,380,000 | | | | 2,594,367 | |
City of New Orleans GO, 4.00% due 10/1/2018 (Audubon Park Aquarium; Insured: AGM) | | AA/NR | | | 1,110,000 | | | | 1,197,357 | |
City of New Orleans GO, 5.00% due 12/1/2019 (Public Improvements; Insured: AGM) | | BBB+/A3 | | | 3,080,000 | | | | 3,498,233 | |
City of New Orleans GO, 5.00% due 12/1/2020 (Public Improvements; Insured: AGM) | | BBB+/A3 | | | 3,250,000 | | | | 3,669,770 | |
City of New Orleans GO, 5.00% due 12/1/2021 (Public Improvements; Insured: AGM) | | BBB+/A3 | | | 5,700,000 | | | | 6,415,008 | |
Consolidated Sales Tax District A of the Parish of LaFourche, 4.00% due 3/1/2021 (Roads, Bridges & Drainage Works) | | A/NR | | | 1,990,000 | | | | 2,118,653 | |
Consolidated Sales Tax District A of the Parish of LaFourche, 4.00% due 3/1/2022 (Roads, Bridges & Drainage Works) | | A/NR | | | 1,545,000 | | | | 1,630,145 | |
East Baton Rouge Sewer Commission, 5.00% due 2/1/2018 (Wastewater System Improvements; Insured: AGM) | | AA/Aa3 | | | 3,000,000 | | | | 3,244,260 | |
Ernest N. Morial New Orleans Exhibition Hall Authority, 5.00% due 7/15/2020 (Convention Center) | | NR/A2 | | | 1,000,000 | | | | 1,137,440 | |
Ernest N. Morial New Orleans Exhibition Hall Authority, 5.00% due 7/15/2021 (Convention Center) | | NR/A2 | | | 780,000 | | | | 882,453 | |
Ernest N. Morial New Orleans Exhibition Hall Authority, 5.00% due 7/15/2022 (Convention Center) | | NR/A2 | | | 1,000,000 | | | | 1,131,010 | |
Certified Semi-Annual Report 25
| | |
| SCHEDULE OF INVESTMENTS, CONTINUED | | |
| |
Thornburg Limited Term Municipal Fund | | March 31, 2014 (Unaudited) |
| | | | | | | | | | |
Issuer-Description | | Credit Rating†
S&P/ Moody’s | | Principal
Amount | | | Value | |
Jefferson Sales Tax District Parish of Jefferson, 5.00% due 12/1/2018 (Sewerage Capital Project; Insured: AGM) | | AA/A2 | | $ | 2,000,000 | | | $ | 2,325,240 | |
Louisiana Citizens Property Insurance Corp., 5.00% due 6/1/2015 (Insured: AMBAC) | | A-/A3 | | | 10,265,000 | | | | 10,762,442 | |
Louisiana Energy & Power Authority, 5.00% due 1/1/2020 (Rodemacher Unit No. 2 Power) | | A-/A3 | | | 1,000,000 | | | | 1,137,680 | |
Louisiana Energy & Power Authority, 5.00% due 1/1/2021 (Rodemacher Unit No. 2 Power) | | A-/A3 | | | 1,000,000 | | | | 1,140,350 | |
Louisiana Energy & Power Authority, 5.00% due 6/1/2022 (LEPA Unit No. 1 Power; Insured: AGM) | | AA/A2 | | | 1,000,000 | | | | 1,161,830 | |
Louisiana Energy & Power Authority, 5.00% due 1/1/2023 (Rodemacher Unit No. 2 Power) | | A-/A3 | | | 1,415,000 | | | | 1,617,260 | |
Louisiana Energy & Power Authority, 5.00% due 6/1/2023 (LEPA Unit No. 1 Power; Insured: AGM) | | AA/A2 | | | 750,000 | | | | 876,623 | |
Louisiana Local Govt Environmental Facilities & Community Development Authority, 4.00% due 10/1/2014 (Community and Technical Colleges Facilities and SIS System; Insured: AGM) | | AA-/A1 | | | 1,500,000 | | | | 1,526,520 | |
Louisiana Local Govt Environmental Facilities & Community Development Authority, 5.00% due 3/1/2015 (Independence Stadium) | | A/NR | | | 1,000,000 | | | | 1,036,160 | |
Louisiana Local Govt Environmental Facilities & Community Development Authority, 5.00% due 3/1/2016 (Independence Stadium) | | A/NR | | | 1,000,000 | | | | 1,070,070 | |
Louisiana Local Govt Environmental Facilities & Community Development Authority, 4.00% due 10/1/2016 (Town of Vinton Public Power Authority; Insured: AGM) | | AA/NR | | | 1,000,000 | | | | 1,063,780 | |
Louisiana Local Govt Environmental Facilities & Community Development Authority, 5.00% due 3/1/2017 (Independence Stadium) | | A/NR | | | 1,265,000 | | | | 1,381,304 | |
Louisiana Local Govt Environmental Facilities & Community Development Authority, 4.00% due 10/1/2017 (Town of Vinton Public Power Authority; Insured: AGM) | | AA/NR | | | 1,000,000 | | | | 1,073,230 | |
Louisiana Local Govt Environmental Facilities & Community Development Authority, 5.00% due 3/1/2018 (Independence Stadium) | | A/NR | | | 1,000,000 | | | | 1,111,420 | |
Louisiana Local Govt Environmental Facilities & Community Development Authority, 4.50% due 10/1/2018 (Town of Vinton Public Power Authority; Insured: AGM) | | AA/NR | | | 1,000,000 | | | | 1,103,430 | |
Louisiana Local Govt Environmental Facilities & Community Development Authority, 4.00% due 12/1/2018 (Bossier Parish Community College - Campus Facilities, Inc. Project) | | AA-/NR | | | 2,655,000 | | | | 2,938,660 | |
Louisiana Local Govt Environmental Facilities & Community Development Authority, 4.50% due 10/1/2019 (Town of Vinton Public Power Authority; Insured: AGM) | | AA/NR | | | 1,000,000 | | | | 1,099,990 | |
Louisiana Local Govt Environmental Facilities & Community Development Authority, 4.00% due 12/1/2019 (Bossier Parish Community College - Campus Facilities, Inc. Project) | | AA-/NR | | | 1,310,000 | | | | 1,441,026 | |
Louisiana Local Govt Environmental Facilities & Community Development Authority, 5.00% due 12/1/2020 (Bossier Parish Community College - Campus Facilities, Inc. Project) | | AA-/NR | | | 1,200,000 | | | | 1,381,716 | |
Louisiana Offshore Terminal Authority, 5.00% due 10/1/2018 (Deepwater Oil Port-Loop LLC) | | BBB/NR | | | 22,000,000 | | | | 24,635,160 | |
Louisiana Offshore Terminal Authority, 2.125% due 10/1/2037 put 10/1/2015 (Deepwater Oil Port-Loop LLC) | | BBB/A3 | | | 5,000,000 | | | | 5,088,050 | |
Louisiana Offshore Terminal Authority, 2.20% due 10/1/2040 put 10/1/2017 (Deepwater Oil Port-Loop LLC) | | BBB/NR | | | 6,000,000 | | | | 6,007,980 | |
Louisiana Public Facilities Authority, 5.00% due 5/15/2014 (Ochsner Clinic Foundation) | | NR/Baa1 | | | 1,000,000 | | | | 1,004,770 | |
Louisiana Public Facilities Authority, 5.00% due 5/15/2015 (Ochsner Clinic Foundation) | | NR/Baa1 | | | 1,825,000 | | | | 1,898,602 | |
Louisiana Public Facilities Authority, 5.75% due 7/1/2015 (Franciscan Missionaries of Our Lady Health System; Insured: AGM) | | AA/A2 | | | 1,325,000 | | | | 1,403,480 | |
Louisiana Public Facilities Authority, 2.875% due 11/1/2015 (Entergy Gulf States) | | A-/A2 | | | 2,500,000 | | | | 2,562,925 | |
Louisiana Public Facilities Authority, 5.00% due 5/15/2016 (Ochsner Clinic Foundation) | | NR/Baa1 | | | 1,000,000 | | | | 1,069,680 | |
Louisiana Public Facilities Authority, 5.00% due 5/15/2017 (Ochsner Clinic Foundation) | | NR/Baa1 | | | 1,035,000 | | | | 1,129,019 | |
Louisiana Public Facilities Authority, 5.00% due 5/15/2018 (Ochsner Clinic Foundation) | | NR/Baa1 | | | 2,000,000 | | | | 2,182,660 | |
Louisiana State Office Facilities Corp., 3.75% due 3/1/2015 (State Capitol) | | AA-/Aa3 | | | 5,000,000 | | | | 5,150,000 | |
Louisiana State Office Facilities Corp., 5.00% due 5/1/2015 (State Capitol) | | NR/Aa3 | | | 2,830,000 | | | | 2,967,934 | |
Louisiana State Office Facilities Corp., 5.00% due 5/1/2016 (State Capitol) | | NR/Aa3 | | | 1,000,000 | | | | 1,087,250 | |
Louisiana State Office Facilities Corp., 5.00% due 5/1/2018 (State Capitol) | | NR/Aa3 | | | 2,500,000 | | | | 2,853,150 | |
Louisiana State Office Facilities Corp., 5.00% due 5/1/2021 (State Capitol) | | NR/Aa3 | | | 4,595,000 | | | | 5,184,309 | |
Parish of LaFourche, 5.00% due 1/1/2019 (Roads, Highways & Bridges) | | AA-/NR | | | 595,000 | | | | 686,279 | |
Parish of LaFourche, 5.00% due 1/1/2022 (Roads, Highways & Bridges) | | AA-/NR | | | 415,000 | | | | 482,587 | |
Parish of LaFourche, 5.00% due 1/1/2023 (Roads, Highways & Bridges) | | AA-/NR | | | 515,000 | | | | 598,028 | |
Parish of Orleans School District GO, 5.00% due 9/1/2016 (Insured: AGM) | | AA/Aa3 | | | 4,500,000 | | | | 4,922,190 | |
Parish of Orleans School District GO, 5.00% due 9/1/2018 (Insured: AGM) | | AA/Aa3 | | | 4,800,000 | | | | 5,451,984 | |
Parish of Orleans School District GO, 5.00% due 9/1/2020 (Insured: AGM) | | AA/Aa3 | | | 3,840,000 | | | | 4,387,738 | |
Parish of Plaquemines Law Enforcement District GO, 5.00% due 9/1/2019 | | BBB+/NR | | | 1,005,000 | | | | 1,118,193 | |
Parish of Plaquemines Law Enforcement District GO, 5.00% due 9/1/2021 | | BBB+/NR | | | 1,115,000 | | | | 1,202,349 | |
Parish of St. Charles, 4.00% due 12/1/2040 put 6/1/2022 (Valero Energy Corp. Refinery) | | BBB/Baa2 | | | 14,000,000 | | | | 14,382,620 | |
Parish of St. Tammany Sales Tax District No. 3, 5.00% due 6/1/2017 pre-refunded 6/1/2016 (Public Works, Improvements and Facilities; Insured: CIFG) | | AA-/NR | | | 1,405,000 | | | | 1,556,965 | |
Parish of Terrebonne Hospital Service District No. 1, 4.00% due 4/1/2014 (Terrebonne General Medical Center) | | A+/A2 | | | 800,000 | | | | 800,000 | |
Parish of Terrebonne Hospital Service District No. 1, 4.00% due 4/1/2015 (Terrebonne General Medical Center) | | A+/A2 | | | 575,000 | | | | 591,192 | |
Parish of Terrebonne Hospital Service District No. 1, 4.00% due 4/1/2017 (Terrebonne General Medical Center) | | A+/A2 | | | 1,000,000 | | | | 1,064,880 | |
Parish of Terrebonne Hospital Service District No. 1, 5.00% due 4/1/2018 (Terrebonne General Medical Center) | | A+/A2 | | | 1,000,000 | | | | 1,111,530 | |
Parish of Terrebonne Hospital Service District No. 1, 5.00% due 4/1/2019 (Terrebonne General Medical Center) | | A+/A2 | | | 1,810,000 | | | | 2,030,494 | |
Parish of Terrebonne Hospital Service District No. 1, 5.00% due 4/1/2021 (Terrebonne General Medical Center) | | A+/A2 | | | 2,320,000 | | | | 2,561,373 | |
Regional Transit Authority, 0% due 12/1/2015 (Streetcar Rail Lines; Insured: Natl-Re) | | AA-/NR | | | 3,085,000 | | | | 2,895,427 | |
Regional Transit Authority, 5.00% due 12/1/2017 (Streetcar Rail Lines; Insured: AGM) | | AA/Aa3 | | | 755,000 | | | | 856,427 | |
Regional Transit Authority, 5.00% due 12/1/2019 (Streetcar Rail Lines; Insured: AGM) | | AA/Aa3 | | | 1,000,000 | | | | 1,156,040 | |
26 Certified Semi-Annual Report
| | |
| SCHEDULE OF INVESTMENTS, CONTINUED | | |
| |
Thornburg Limited Term Municipal Fund | | March 31, 2014 (Unaudited) |
| | | | | | | | | | |
Issuer-Description | | Credit Rating†
S&P/ Moody’s | | Principal
Amount | | | Value | |
Regional Transit Authority, 5.00% due 12/1/2021 (Streetcar Rail Lines; Insured: AGM) | | AA/Aa3 | | $ | 1,000,000 | | | $ | 1,138,440 | |
a Regional Transit Authority, 5.00% due 12/1/2022 (Streetcar Rail Lines; Insured: AGM) | | AA/Aa3 | | | 1,110,000 | | | | 1,250,559 | |
State of Louisiana GO, 5.00% due 8/1/2017 (Insured: Natl-Re) | | AA/Aa2 | | | 4,000,000 | | | | 4,251,200 | |
| | | |
MAINE — 0.32% | | | | | | | | | | |
Maine Finance Authority, 3.80% due 11/1/2015 (Waste Management, Inc.) | | A-/NR | | | 3,440,000 | | | | 3,587,576 | |
Maine Governmental Facilities Authority, 5.00% due 10/1/2020 (Augusta and Machias Courthouses) | | AA-/Aa3 | | | 1,245,000 | | | | 1,449,927 | |
Maine Governmental Facilities Authority, 5.00% due 10/1/2021 (Augusta and Machias Courthouses) | | AA-/Aa3 | | | 1,315,000 | | | | 1,534,894 | |
Maine Governmental Facilities Authority, 5.00% due 10/1/2022 (Augusta and Machias Courthouses) | | AA-/Aa3 | | | 1,175,000 | | | | 1,375,150 | |
Maine Governmental Facilities Authority, 5.00% due 10/1/2023 (Augusta and Machias Courthouses) | | AA-/Aa3 | | | 1,445,000 | | | | 1,695,404 | |
Maine Health & Higher Educational Facilities Authority, 5.25% due 7/1/2021 (Health and Educational Institution Facilities and Equipment; Insured: Natl-Re) | | NR/A1 | | | 2,385,000 | | | | 2,411,712 | |
Maine Health & Higher Educational Facilities Authority, 5.25% due 7/1/2022 (Health and Educational Institution Facilities and Equipment; Insured: Natl-Re) | | NR/A1 | | | 3,675,000 | | | | 3,716,160 | |
Maine Health & Higher Educational Facilities Authority, 5.00% due 7/1/2035 pre-refunded 7/1/2015 (Bowdoin College) (State Aid Withholding) | | NR/A1 | | | 5,175,000 | | | | 5,478,203 | |
| | | |
MARYLAND — 0.69% | | | | | | | | | | |
County Commissioners of Worcester County GO, 4.00% due 8/1/2014 (Consolidated Public Improvements) | | AA+/Aa2 | | | 1,085,000 | | | | 1,098,986 | |
Howard County GO, 5.00% due 8/15/2015 (Consolidated Public Improvements) | | AAA/Aaa | | | 6,000,000 | | | | 6,397,920 | |
Maryland Economic Development Corp., 5.00% due 6/1/2021 (Public Health Laboratory) | | AA+/Aa1 | | | 8,725,000 | | | | 10,293,842 | |
Maryland Economic Development Corp., 4.00% due 6/1/2022 (Public Health Laboratory) | | AA+/Aa1 | | | 8,245,000 | | | | 9,006,096 | |
Montgomery County GO, 4.00% due 11/1/2015 (Consolidated Public Improvements) | | AAA/Aaa | | | 5,160,000 | | | | 5,470,322 | |
State of Maryland GO, 4.00% due 8/1/2015 (Public and Educational Facilities) | | AAA/Aaa | | | 1,000,000 | | | | 1,051,210 | |
State of Maryland GO, 5.00% due 8/1/2015 pre-refunded 8/1/2014 (State and Local Government Capital Facilities) | | AAA/Aaa | | | 300,000 | | | | 304,848 | |
Washington Suburban Sanitary District GO, 5.00% due 6/1/2015 (Water and Sewer System Projects) | | AAA/Aaa | | | 11,500,000 | | | | 12,151,705 | |
| | | |
MASSACHUSETTS — 1.48% | | | | | | | | | | |
Berkshire Wind Power Cooperative Corp., 5.00% due 7/1/2017 | | A-/NR | | | 2,540,000 | | | | 2,786,101 | |
Berkshire Wind Power Cooperative Corp., 5.00% due 7/1/2018 | | A-/NR | | | 2,825,000 | | | | 3,142,954 | |
Berkshire Wind Power Cooperative Corp., 5.00% due 7/1/2019 | | A-/NR | | | 2,765,000 | | | | 3,084,275 | |
Berkshire Wind Power Cooperative Corp., 5.00% due 7/1/2020 | | A-/NR | | | 2,965,000 | | | | 3,271,848 | |
City of Northampton GO, 5.125% due 10/15/2016 (Insured: Natl-Re) | | NR/Aa2 | | | 1,735,000 | | | | 1,797,009 | |
Massachusetts Development Finance Agency, 3.45% due 12/1/2015 (Carleton-Willard Village) | | A-/NR | | | 1,160,000 | | | | 1,181,216 | |
Massachusetts Development Finance Agency, 5.25% due 10/1/2023 (Simmons College) | | BBB+/Baa1 | | | 595,000 | | | | 671,868 | |
Massachusetts Development Finance Agency, 5.75% due 12/1/2042 pre-refunded 5/1/2019 (Dominion Energy Brayton) | | BBB+/Baa2 | | | 2,000,000 | | | | 2,429,500 | |
Massachusetts Educational Financing Authority, 5.25% due 1/1/2016 | | AA/NR | | | 2,450,000 | | | | 2,619,956 | |
Massachusetts Educational Financing Authority, 5.50% due 1/1/2017 | | AA/NR | | | 1,800,000 | | | | 1,983,474 | |
Massachusetts Educational Financing Authority, 5.50% due 1/1/2018 | | AA/NR | | | 11,170,000 | | | | 12,566,697 | |
Massachusetts Educational Financing Authority, 5.75% due 1/1/2020 | | AA/NR | | | 7,500,000 | | | | 8,680,125 | |
Massachusetts Health & Educational Facilities Authority, 5.00% due 7/1/2014 (UMass Memorial Health Care) | | BBB+/Ba1 | | | 2,750,000 | | | | 2,776,235 | |
Massachusetts Health & Educational Facilities Authority, 5.00% due 7/1/2015 (UMass Memorial Health Care) | | BBB+/Ba1 | | | 2,625,000 | | | | 2,742,652 | |
Massachusetts Health & Educational Facilities Authority, 5.00% due 7/1/2018 (UMass Memorial Health Care) | | BBB+/Ba1 | | | 4,290,000 | | | | 4,652,977 | |
Massachusetts Health & Educational Facilities Authority, 5.00% due 10/1/2019 (Berkshire Health Systems; Insured: AGM) | | AA/A3 | | | 1,750,000 | | | | 1,837,833 | |
Massachusetts School Building Authority, 5.00% due 8/15/2027 pre-refunded 8/15/2015 (SMART Fund; Insured: Natl-Re) | | AA+/Aa2 | | | 9,350,000 | | | | 9,959,339 | |
Massachusetts School Building Authority, 5.00% due 8/15/2030 pre-refunded 8/15/2015 (SMART Fund; Insured: AGM) | | AA/Aa2 | | | 25,000,000 | | | | 26,629,250 | |
The Commonwealth of Massachusetts, 5.00% due 12/15/2014 (Federal Highway Grant Anticipation Trust Fund; Insured: AGM) | | AAA/Aa1 | | | 2,325,000 | | | | 2,404,492 | |
The Commonwealth of Massachusetts GO, 5.00% due 9/1/2014 (North Transportation Improvements Association) | | AA+/Aa1 | | | 1,000,000 | | | | 1,020,350 | |
Town of Pembroke GO, 4.50% due 8/1/2014 (Educational Facilities; Insured: Natl-Re) | | NR/Aa3 | | | 1,045,000 | | | | 1,059,870 | |
| | | |
MICHIGAN — 4.60% | | | | | | | | | | |
Byron Center Michigan Public Schools, 4.00% due 5/1/2015 (Insured: Q-SBLF) | | AA-/NR | | | 1,985,000 | | | | 2,064,003 | |
Byron Center Michigan Public Schools, 4.00% due 5/1/2017 (Insured: AGM/Q-SBLF) | | AA/NR | | | 1,305,000 | | | | 1,426,235 | |
Byron Center Michigan Public Schools, 4.00% due 5/1/2018 (Insured: AGM/Q-SBLF) | | AA/NR | | | 1,935,000 | | | | 2,147,560 | |
Byron Center Michigan Public Schools, 4.00% due 5/1/2020 (Insured: AGM/Q-SBLF) | | AA/NR | | | 1,000,000 | | | | 1,104,380 | |
City of Battle Creek County of Calhoun GO, 5.00% due 5/1/2020 (Downtown Development; Insured: AMBAC) | | AA/Aa3 | | | 3,200,000 | | | | 3,495,712 | |
City of Detroit, 5.00% due 7/1/2014 (Sewage Disposal System; Insured: AGM) | | AA/A2 | | | 2,060,000 | | | | 2,066,139 | |
City of Detroit, 5.00% due 7/1/2014 (Sewage Disposal System; Insured: Natl-Re) | | AA-/Baa1 | | | 2,000,000 | | | | 2,005,960 | |
City of Detroit, 5.00% due 7/1/2015 (Water Supply System; Insured: Natl-Re) | | AA-/Baa1 | | | 6,000,000 | | | | 6,017,940 | |
City of Detroit, 5.00% due 7/1/2015 (Sewage Disposal System; Insured: Natl-Re) | | AA-/Baa1 | | | 3,000,000 | | | | 3,008,970 | |
City of Detroit, 5.50% due 7/1/2015 (Sewage Disposal System; Insured: AGM) | | AA/A2 | | | 3,920,000 | | | | 3,949,478 | |
City of Detroit, 6.00% due 7/1/2015 (Water Supply System; Insured: Natl-Re) | | AA-/Baa1 | | | 3,390,000 | | | | 3,399,967 | |
City of Detroit, 6.50% due 7/1/2015 (Water Supply System; Insured: Natl-Re) | | AA-/Baa1 | | | 1,900,000 | | | | 1,909,367 | |
City of Detroit, 5.00% due 7/1/2016 (Water Supply System; Insured: AGM) | | AA/A2 | | | 2,750,000 | | | | 2,767,793 | |
Certified Semi-Annual Report 27
| | |
| SCHEDULE OF INVESTMENTS, CONTINUED | | |
| |
Thornburg Limited Term Municipal Fund | | March 31, 2014 (Unaudited) |
| | | | | | | | | | |
Issuer-Description | | Credit Rating†
S&P/ Moody’s | | Principal
Amount | | | Value | |
City of Detroit, 5.50% due 7/1/2016 (Sewage Disposal System; Insured: Natl-Re) | | AA-/Baa1 | | $ | 375,000 | | | $ | 376,331 | |
City of Detroit, 5.50% due 7/1/2017 (Sewage Disposal System; Insured: AGM) | | AA/A2 | | | 825,000 | | | | 839,388 | |
City of Detroit, 5.50% due 7/1/2018 (Sewage Disposal System; Insured: AGM) | | AA/A2 | | | 3,000,000 | | | | 3,066,900 | |
City of Detroit, 5.25% due 7/1/2019 (Sewage Disposal System; Insured: Natl-Re) | | AA-/Baa1 | | | 3,900,000 | | | | 3,915,834 | |
City of Detroit, 5.00% due 7/1/2020 (Water Supply System; Insured: Natl-Re) | | AA-/Baa1 | | | 2,955,000 | | | | 2,937,566 | |
City of Detroit, 5.25% due 7/1/2020 (Sewage Disposal System; Insured: Natl-Re) | | AA-/Baa1 | | | 3,415,000 | | | | 3,428,762 | |
City of Detroit, 5.25% due 7/1/2020 (Sewage Disposal System; Insured: Natl-Re) | | AA-/Baa1 | | | 4,305,000 | | | | 4,322,478 | |
City of Detroit, 5.25% due 7/1/2022 (Sewage Disposal System; Insured: AGM) | | AA/A2 | | | 4,000,000 | | | | 4,031,640 | |
City of Grand Haven, 5.50% due 7/1/2016 (Electric System; Insured: Natl-Re) | | AA-/Baa1 | | | 3,890,000 | | | | 4,181,711 | |
County of Genesee GO, 3.00% due 11/1/2016 (Water Supply System; Insured: BAM) | | AA/A2 | | | 615,000 | | | | 643,862 | |
County of Genesee GO, 5.00% due 11/1/2022 (Water Supply System; Insured: BAM) | | AA/A2 | | | 600,000 | | | | 668,874 | |
Forest Hills Public Schools GO, 5.00% due 5/1/2020 (Insured: AGM) | | AA/Aa2 | | | 7,490,000 | | | | 7,818,961 | |
Fraser Public School District GO, 5.00% due 5/1/2021 (School Building & Site; Insured: AGM/Q-SBLF) | | AA/Aa2 | | | 1,000,000 | | | | 1,041,400 | |
Grand Blanc Community Schools GO, 5.00% due 5/1/2022 pre-refunded 5/1/2014 (Genesee & Oakland Counties School Building and Site; Insured: AGM/Q-SBLF) | | AA/Aa2 | | | 555,000 | | | | 557,237 | |
Grand Rapids Public Schools GO, 5.00% due 5/1/2024 pre-refunded 5/1/2014 (Kent County School Building and Site; Insured: Natl-Re) | | AA-/NR | | | 400,000 | | | | 401,612 | |
Kalamazoo Hospital Finance Authority, 4.00% due 5/15/2015 (Bronson Methodist Hospital; Insured: AGM) | | NR/A2 | | | 1,735,000 | | | | 1,794,805 | |
Kalamazoo Hospital Finance Authority, 4.00% due 5/15/2016 (Bronson Methodist Hospital; Insured: AGM) | | NR/A2 | | | 1,850,000 | | | | 1,960,020 | |
Kalamazoo Hospital Finance Authority, 4.50% due 5/15/2017 (Bronson Methodist Hospital; Insured: AGM) | | NR/A2 | | | 1,830,000 | | | | 2,005,369 | |
Kalamazoo Hospital Finance Authority, 5.00% due 5/15/2018 (Bronson Methodist Hospital; Insured: AGM) | | AA/A2 | | | 1,520,000 | | | | 1,717,798 | |
Kalamazoo Hospital Finance Authority, 5.00% due 5/15/2018 (Bronson Methodist Hospital; Insured: AGM) | | AA/A2 | | | 2,500,000 | | | | 2,825,325 | |
Kalamazoo Hospital Finance Authority, 5.00% due 5/15/2020 (Bronson Methodist Hospital; Insured: AGM) | | NR/A2 | | | 1,735,000 | | | | 1,999,241 | |
Kalamazoo Hospital Finance Authority, 5.00% due 5/15/2021 (Bronson Methodist Hospital; Insured: AGM) | | NR/A2 | | | 2,350,000 | | | | 2,657,239 | |
Livingston County GO, 4.00% due 5/1/2018 (Howell Public Schools; Insured: Q-SBLF) | | AA-/NR | | | 1,000,000 | | | | 1,104,240 | |
Livingston County GO, 4.00% due 5/1/2020 (Howell Public Schools; Insured: Q-SBLF) | | AA-/NR | | | 1,000,000 | | | | 1,101,980 | |
Livingston County GO, 4.00% due 5/1/2021 (Howell Public Schools; Insured: Q-SBLF) | | AA-/NR | | | 1,000,000 | | | | 1,096,630 | |
Livonia Public Schools School District GO, 4.00% due 5/1/2020 (School Building & Site) | | A/A1 | | | 800,000 | | | | 854,752 | |
Livonia Public Schools School District GO, 5.00% due 5/1/2021 (School Building & Site) | | A/A1 | | | 900,000 | | | | 1,020,456 | |
Michigan Finance Authority, 5.00% due 8/1/2019 (Ypsilanti Community Schools) | | A+/NR | | | 1,460,000 | | | | 1,617,242 | |
Michigan Finance Authority, 5.00% due 8/1/2020 (Ypsilanti Community Schools) | | A+/NR | | | 1,530,000 | | | | 1,680,476 | |
Michigan Finance Authority, 5.00% due 8/1/2021 (Ypsilanti Community Schools) | | A+/NR | | | 1,610,000 | | | | 1,762,676 | |
Michigan Finance Authority, 5.00% due 8/1/2022 (Ypsilanti Community Schools) | | A+/NR | | | 1,690,000 | | | | 1,847,728 | |
Michigan Municipal Bond Authority, 5.00% due 10/1/2020 (Clean Water Fund) | | AAA/Aaa | | | 505,000 | | | | 538,719 | |
Michigan State Hospital Finance Authority, 5.00% due 7/15/2015 (Oakwood Hospital) | | A/A2 | | | 2,500,000 | | | | 2,622,225 | |
Michigan State Hospital Finance Authority, 5.50% due 11/15/2015 (Henry Ford Health System) | | A-/A2 | | | 2,300,000 | | | | 2,450,305 | |
Michigan State Hospital Finance Authority, 5.00% due 7/15/2016 (Oakwood Hospital) | | A/A2 | | | 1,205,000 | | | | 1,301,002 | |
Michigan State Hospital Finance Authority, 5.00% due 11/15/2016 (Ascension Health) | | AA+/Aa2 | | | 3,330,000 | | | | 3,701,162 | |
Michigan State Hospital Finance Authority, 5.00% due 11/15/2017 (Sparrow Memorial Hospital) | | A+/A1 | | | 1,500,000 | | | | 1,660,605 | |
Michigan State Hospital Finance Authority, 5.50% due 11/15/2017 (Henry Ford Health System) | | A-/A2 | | | 1,530,000 | | | | 1,710,770 | |
Michigan State Hospital Finance Authority, 5.00% due 7/15/2018 (Oakwood Hospital) | | A/A2 | | | 1,000,000 | | | | 1,087,670 | |
Michigan State Hospital Finance Authority, 5.50% due 11/15/2018 (Henry Ford Health System) | | A-/A2 | | | 3,500,000 | | | | 3,957,625 | |
Michigan State Hospital Finance Authority, 6.00% due 12/1/2018 (Trinity Health) | | AA-/Aa2 | | | 2,000,000 | | | | 2,397,420 | |
Michigan State Hospital Finance Authority, 5.00% due 7/15/2019 (Oakwood Hospital) | | A/A2 | | | 2,000,000 | | | | 2,157,260 | |
Michigan State Hospital Finance Authority, 5.00% due 10/1/2026 put 6/1/2017 (Ascension Health) | | NR/Aa3 | | | 12,140,000 | | | | 13,643,660 | |
Michigan State Hospital Finance Authority, 5.75% due 12/1/2034 put 12/1/2015 (Trinity Health) | | AA-/Aa2 | | | 9,800,000 | | | | 10,664,850 | |
Michigan State Housing Development Authority, 5.00% due 4/1/2016 (Multi-Family Mtg Loan Financing) | | AA/NR | | | 1,805,000 | | | | 1,837,959 | |
Michigan State Housing Development Authority, 4.00% due 10/1/2016 (Multi-Family Mtg Loan Financing) | | AA/NR | | | 1,715,000 | | | | 1,841,155 | |
Michigan Strategic Fund, 5.00% due 10/15/2017 (Michigan House of Representatives Facilities; Insured: AGM) | | AA/A1 | | | 2,000,000 | | | | 2,219,520 | |
Michigan Strategic Fund, 5.25% due 10/15/2019 (Michigan House of Representatives Facilities; Insured: AGM) | | AA/A1 | | | 2,550,000 | | | | 2,855,592 | |
Michigan Strategic Fund, 5.25% due 10/15/2020 (Michigan House of Representatives Facilities; Insured: AGM) | | AA/A1 | | | 4,025,000 | | | | 4,436,959 | |
Michigan Strategic Fund, 5.25% due 8/1/2029 put 8/1/2014 (Detroit Edison Co. Exempt Facilities Project) | | A/Aa3 | | | 7,500,000 | | | | 7,620,150 | |
Michigan Strategic Fund, 5.50% due 8/1/2029 put 8/1/2016 (Detroit Edison Co. Exempt Facilities Project) | | A/Aa3 | | | 5,160,000 | | | | 5,632,450 | |
Plymouth-Canton Community Schools GO, 4.00% due 5/1/2018 (Insured: Q-SBLF) | | NR/Aa2 | | | 1,500,000 | | | | 1,656,360 | |
Plymouth-Canton Community Schools GO, 4.00% due 5/1/2019 (Insured: Q-SBLF) | | NR/Aa2 | | | 1,000,000 | | | | 1,108,640 | |
Plymouth-Canton Community Schools GO, 5.00% due 5/1/2020 (Insured: Q-SBLF) | | NR/Aa2 | | | 1,000,000 | | | | 1,160,480 | |
Romeo Community School District GO, 5.00% due 5/1/2018 (Insured: Natl-Re/Q-SBLF) | | AA-/Aa2 | | | 3,050,000 | | | | 3,186,427 | |
Royal Oak Hospital Finance Authority, 6.25% due 9/1/2014 (William Beaumont Hospital) | | A/A1 | | | 1,000,000 | | | | 1,023,480 | |
Royal Oak Hospital Finance Authority, 5.25% due 8/1/2017 (William Beaumont Hospital) | | A/A1 | | | 5,855,000 | | | | 6,465,442 | |
School District of the City of Dearborn GO, 4.00% due 5/1/2014 (Insured: Q-SBLF) (State Aid Withholding) | | NR/Aa2 | | | 800,000 | | | | 802,528 | |
School District of the City of Dearborn GO, 3.00% due 5/1/2015 (Insured: Q-SBLF) (State Aid Withholding) | | NR/Aa2 | | | 435,000 | | | | 447,615 | |
School District of the City of Dearborn GO, 3.00% due 5/1/2019 (Insured: Q-SBLF) (State Aid Withholding) | | NR/Aa2 | | | 445,000 | | | | 472,020 | |
School District of the City of Dearborn GO, 4.00% due 5/1/2020 (Insured: Q-SBLF) (State Aid Withholding) | | NR/Aa2 | | | 350,000 | | | | 385,693 | |
School District of the City of Dearborn GO, 4.00% due 5/1/2021 (Insured: Q-SBLF) (State Aid Withholding) | | NR/Aa2 | | | 570,000 | | | | 625,079 | |
School District of the City of Dearborn GO, 4.00% due 5/1/2022 (Insured: Q-SBLF) (State Aid Withholding) | | NR/Aa2 | | | 535,000 | | | | 583,321 | |
School District of the City of Dearborn GO, 4.00% due 5/1/2023 (Insured: Q-SBLF) (State Aid Withholding) | | NR/Aa2 | | | 625,000 | | | | 677,131 | |
28 Certified Semi-Annual Report
| | |
| SCHEDULE OF INVESTMENTS, CONTINUED | | |
| |
Thornburg Limited Term Municipal Fund | | March 31, 2014 (Unaudited) |
| | | | | | | | | | |
Issuer-Description | | Credit Rating†
S&P/ Moody’s | | Principal
Amount | | | Value | |
School District of the City of Detroit GO, 5.00% due 5/1/2014 (Wayne County School Building & Site; Insured: AGM/Q-SBLF) | | AA/Aa2 | | $ | 1,000,000 | | | $ | 1,003,720 | |
School District of the City of Detroit GO, 5.00% due 5/1/2020 (Wayne County School Building & Site; Insured: Q-SBLF) | | AA-/Aa2 | | | 2,200,000 | | | | 2,430,142 | |
School District of the City of Detroit GO, 5.00% due 5/1/2021 (Wayne County School Building & Site; Insured: Q-SBLF) | | AA-/Aa2 | | | 4,000,000 | | | | 4,407,880 | |
School District of the City of Detroit GO, 5.00% due 5/1/2022 (Wayne County School Building & Site; Insured: Q-SBLF) | | AA-/Aa2 | | | 3,000,000 | | | | 3,315,930 | |
Sparta Area Schools, Counties of Kent and Ottawa GO, 4.00% due 5/1/2016 (School Building & Site; Insured: Q-SBLF) | | AA-/NR | | | 1,000,000 | | | | 1,064,480 | |
a Sparta Area Schools, Counties of Kent and Ottawa GO, 5.00% due 5/1/2017 (School Building & Site; Insured: Q-SBLF) | | AA-/NR | | | 1,085,000 | | | | 1,207,692 | |
Sparta Area Schools, Counties of Kent and Ottawa GO, 5.00% due 5/1/2018 (School Building & Site; Insured: Q-SBLF) | | AA-/NR | | | 1,285,000 | | | | 1,459,040 | |
Sparta Area Schools, Counties of Kent and Ottawa GO, 5.00% due 5/1/2020 (School Building & Site; Insured: Q-SBLF) | | AA-/NR | | | 1,335,000 | | | | 1,545,116 | |
St. Johns Public Schools GO, 5.00% due 5/1/2021 (Insured: Natl-Re/FGIC/Q-SBLF) | | AA-/Aa3 | | | 1,000,000 | | | | 1,163,980 | |
State Building Authority of the State of Michigan, 5.00% due 10/15/2015 (Higher Education Facilities Program) | | A+/Aa3 | | | 4,000,000 | | | | 4,278,920 | |
State Building Authority of the State of Michigan, 5.00% due 10/15/2015 (Higher Education Facilities Program; Insured: AMBAC) | | A+/Aa3 | | | 6,000,000 | | | | 6,418,380 | |
State Building Authority of the State of Michigan, 5.00% due 10/15/2016 (Higher Education Facilities Program) | | A+/Aa3 | | | 6,305,000 | | | | 6,975,726 | |
State Building Authority of the State of Michigan, 5.50% due 10/15/2017 (Various Correctional Institution, Higher Education and Other State Facilities) | | A+/Aa3 | | | 4,150,000 | | | | 4,769,138 | |
State Building Authority of the State of Michigan, 5.00% due 10/15/2020 (Higher Education Facilities Program) | | A+/Aa3 | | | 1,000,000 | | | | 1,143,120 | |
State Building Authority of the State of Michigan, 5.00% due 10/15/2021 (Higher Education Facilities Program) | | A+/Aa3 | | | 1,000,000 | | | | 1,141,710 | |
State Building Authority of the State of Michigan, 5.00% due 10/15/2022 (Higher Education Facilities Program) | | A+/Aa3 | | | 3,000,000 | | | | 3,419,640 | |
State Building Authority of the State of Michigan, 5.00% due 10/15/2023 (Higher Education Facilities Program) | | A+/Aa3 | | | 7,715,000 | | | | 8,812,922 | |
Utica Community Schools County of Macomb GO, 4.00% due 5/1/2018 (Technology Infrastructure Improvements; Insured: Q-SBLF) | | AA/NR | | | 1,725,000 | | | | 1,921,529 | |
Utica Community Schools County of Macomb GO, 4.00% due 5/1/2019 (Technology Infrastructure Improvements; Insured: Q-SBLF) | | AA/NR | | | 9,925,000 | | | | 11,090,294 | |
Warren Consolidated School District GO, 4.00% due 5/1/2015 (Insured: Q-SBLF) | | AA-/NR | | | 1,000,000 | | | | 1,039,800 | |
Warren Consolidated School District GO, 4.00% due 5/1/2017 (Insured: Q-SBLF) | | AA-/NR | | | 1,035,000 | | | | 1,128,398 | |
Warren Consolidated School District GO, 5.00% due 5/1/2018 (Insured: Q-SBLF) | | AA-/NR | | | 1,000,000 | | | | 1,144,250 | |
Warren Consolidated School District GO, 5.00% due 5/1/2020 (Insured: Q-SBLF) | | AA-/NR | | | 1,000,000 | | | | 1,160,480 | |
Warren Consolidated School District GO, 5.00% due 5/1/2021 (Insured: Q-SBLF) | | AA-/NR | | | 1,000,000 | | | | 1,163,980 | |
Wayne County Airport Authority, 5.00% due 12/1/2017 (Detroit Metropolitan Airport; Insured: Natl-Re) | | AA-/A2 | | | 1,000,000 | | | | 1,119,120 | |
Wayne County Airport Authority, 5.00% due 12/1/2017 (Detroit Metropolitan Airport) | | A/A2 | | | 2,420,000 | | | | 2,708,270 | |
Wayne County Airport Authority, 5.00% due 12/1/2019 (Detroit Metropolitan Airport) | | A/A2 | | | 12,645,000 | | | | 14,264,445 | |
Wayne County Airport Authority, 5.50% due 12/1/2019 (Detroit Metropolitan Airport) | | A/A2 | | | 2,600,000 | | | | 3,001,128 | |
Wayne County Airport Authority, 5.50% due 12/1/2020 (Detroit Metropolitan Airport) | | A/A2 | | | 4,395,000 | | | | 5,063,479 | |
Wayne County Airport Authority, 5.50% due 12/1/2020 (Detroit Metropolitan Airport) | | A/A2 | | | 3,115,000 | | | | 3,588,791 | |
Western Townships Utilities Authority GO, 5.00% due 1/1/2015 (Sewage Disposal System) | | AA/NR | | | 1,870,000 | | | | 1,934,777 | |
Western Townships Utilities Authority GO, 5.00% due 1/1/2016 (Sewage Disposal System) | | AA/NR | | | 1,670,000 | | | | 1,797,404 | |
Western Townships Utilities Authority GO, 5.00% due 1/1/2017 (Sewage Disposal System) | | AA/NR | | | 1,500,000 | | | | 1,664,925 | |
Western Townships Utilities Authority GO, 5.00% due 1/1/2018 (Sewage Disposal System) | | AA/NR | | | 1,500,000 | | | | 1,703,055 | |
| | | |
MINNESOTA — 1.30% | | | | | | | | | | |
Cities of Minneapolis-St. Paul Metropolitan Airports Commission, 5.00% due 1/1/2017 (Insured: AMBAC) | | AA-/NR | | | 8,005,000 | | | | 8,903,641 | |
City of St. Cloud, 5.00% due 5/1/2015 (CentraCare Health System) | | NR/A1 | | | 1,000,000 | | | | 1,049,380 | |
City of St. Cloud, 5.00% due 5/1/2016 (CentraCare Health System) | | NR/A1 | | | 1,250,000 | | | | 1,360,425 | |
City of St. Cloud, 5.00% due 5/1/2017 (CentraCare Health System) | | NR/A1 | | | 2,920,000 | | | | 3,272,824 | |
City of St. Cloud, 5.00% due 5/1/2017 (CentraCare Health System) | | NR/A1 | | | 1,000,000 | | | | 1,120,830 | |
City of St. Cloud, 5.00% due 5/1/2018 (CentraCare Health System) | | NR/A1 | | | 3,105,000 | | | | 3,533,024 | |
City of St. Cloud, 5.00% due 5/1/2019 (CentraCare Health System) | | NR/A1 | | | 3,495,000 | | | | 4,031,028 | |
City of St. Cloud, 5.00% due 5/1/2020 (CentraCare Health System) | | NR/A1 | | | 3,310,000 | | | | 3,822,057 | |
City of St. Paul Housing & Redevelopment Authority, 5.00% due 2/1/2018 (Gillette Children’s Specialty Healthcare Project) | | A-/NR | | | 1,255,000 | | | | 1,384,893 | |
City of St. Paul Housing & Redevelopment Authority, 5.25% due 2/1/2020 (Gillette Children’s Specialty Healthcare Project) | | A-/NR | | | 2,010,000 | | | | 2,220,708 | |
City of St. Paul Housing & Redevelopment Authority, 5.25% due 5/15/2021 (Regions Hospital) | | A/A2 | | | 1,070,000 | | | | 1,128,839 | |
County of Clay GO, 3.00% due 4/1/2018 (State-Aid Road Improvements) | | AA/NR | | | 1,225,000 | | | | 1,315,601 | |
Eden Prairie ISD No. 272 GO, 4.00% due 2/1/2015 (Minnesota School District Credit Enhancement Program) | | NR/Aa2 | | | 7,170,000 | | | | 7,400,229 | |
Le Sueur-Henderson ISD No. 2397 GO, 3.00% due 4/1/2021 (Minnesota School District Credit Enhancement Program) | | AA+/NR | | | 1,125,000 | | | | 1,177,729 | |
Minnesota Agricultural & Economic Development Board, 5.00% due 2/15/2015 (Essential Health; Insured: AGM) | | AA/NR | | | 1,335,000 | | | | 1,384,288 | |
Minnesota Agricultural & Economic Development Board, 5.00% due 2/15/2017 (Essential Health; Insured: AGM) | | AA/NR | | | 2,500,000 | | | | 2,763,275 | |
Minnesota Public Facilities Authority PCR, 5.25% due 3/1/2015 | | AAA/Aaa | | | 1,000,000 | | | | 1,046,920 | |
Northern Municipal Power Agency, 5.00% due 1/1/2019 (Electric System) | | A-/A3 | | | 5,000,000 | | | | 5,759,650 | |
Northern Municipal Power Agency, 5.00% due 1/1/2020 (Electric System) | | A-/A3 | | | 3,500,000 | | | | 4,051,075 | |
Port Authority of the City of St. Paul, 5.00% due 12/1/2017 (Minnesota Andersen Office Building) | | AA/Aa2 | | | 4,945,000 | | | | 5,657,179 | |
Port Authority of the City of St. Paul, 4.00% due 12/1/2018 (Minnesota Freeman Office Building) | | AA/Aa2 | | | 3,925,000 | | | | 4,394,077 | |
Port Authority of the City of St. Paul, 5.00% due 12/1/2019 (Minnesota Freeman Office Building) | | AA/Aa2 | | | 2,000,000 | | | | 2,350,680 | |
Port Authority of the City of St. Paul, 5.00% due 12/1/2020 (Minnesota Freeman Office Building) | | AA/Aa2 | | | 2,675,000 | | | | 3,153,745 | |
Port Authority of the City of St. Paul, 5.00% due 12/1/2021 (Minnesota Andersen Office Building) | | AA/Aa2 | | | 965,000 | | | | 1,138,034 | |
Port Authority of the City of St. Paul, 5.00% due 12/1/2022 (Minnesota Andersen Office Building) | | AA/Aa2 | | | 1,250,000 | | | | 1,481,925 | |
State of Minnesota GO, 5.00% due 8/1/2015 (Public Facility Capital Projects) | | AA+/Aa1 | | | 10,000,000 | | | | 10,645,300 | |
Certified Semi-Annual Report 29
| | |
| SCHEDULE OF INVESTMENTS, CONTINUED | | |
| |
Thornburg Limited Term Municipal Fund | | March 31, 2014 (Unaudited) |
| | | | | | | | | | |
Issuer-Description | | Credit Rating†
S&P/ Moody’s | | Principal
Amount | | | Value | |
MISSISSIPPI — 0.48% | | | | | | | | | | |
City of Jackson GO, 5.00% due 10/1/2016 (Insured: AMBAC) | | AA-/Aa2 | | $ | 1,500,000 | | | $ | 1,593,975 | |
Lamar County School District GO, 3.00% due 6/1/2016 (Educational and Performing Arts Capital Projects) | | A/NR | | | 1,800,000 | | | | 1,887,858 | |
Lamar County School District GO, 3.50% due 6/1/2017 (Educational and Performing Arts Capital Projects) | | A/NR | | | 1,700,000 | | | | 1,828,537 | |
Medical Center Educational Building, 4.00% due 6/1/2015 (University of Mississippi Medical Center) | | AA-/Aa2 | | | 2,325,000 | | | | 2,419,488 | |
Medical Center Educational Building, 4.00% due 6/1/2016 (University of Mississippi Medical Center) | | AA-/Aa2 | | | 3,300,000 | | | | 3,527,469 | |
Mississippi Development Bank, 5.00% due 1/1/2020 (MDOT-Madison County Highway) | | AA-/Aa3 | | | 1,000,000 | | | | 1,155,690 | |
Mississippi Development Bank, 5.00% due 1/1/2020 (MDOT-Harrison County Highway) | | AA-/Aa3 | | | 1,500,000 | | | | 1,733,535 | |
Mississippi Development Bank, 5.00% due 1/1/2021 (MDOT-Madison County Highway) | | AA-/Aa3 | | | 2,000,000 | | | | 2,314,100 | |
Mississippi Development Bank, 5.00% due 1/1/2021 (MDOT-Harrison County Highway) | | AA-/Aa3 | | | 2,500,000 | | | | 2,892,625 | |
Mississippi Development Bank, 5.00% due 1/1/2022 (MDOT-Harrison County Highway) | | AA-/Aa3 | | | 1,000,000 | | | | 1,162,860 | |
Mississippi Development Bank, 5.00% due 1/1/2022 (MDOT-Madison County Highway) | | AA-/Aa3 | | | 1,000,000 | | | | 1,162,860 | |
Mississippi Development Bank, 5.00% due 1/1/2023 (MDOT-Harrison County Highway) | | AA-/Aa3 | | | 1,500,000 | | | | 1,741,830 | |
Mississippi Development Bank, 5.00% due 1/1/2023 (MDOT-Madison County Highway) | | AA-/Aa3 | | | 1,250,000 | | | | 1,451,525 | |
Mississippi Development Bank, 4.75% due 7/1/2017 (Canton GO Public Improvement Project) | | NR/NR | | | 1,080,000 | | | | 1,132,952 | |
Mississippi Development Bank, 5.00% due 8/1/2018 (Department of Corrections) | | AA-/NR | | | 4,910,000 | | | | 5,604,176 | |
| | | |
MISSOURI — 1.63% | | | | | | | | | | |
Cass County COP, 3.00% due 5/1/2014 | | A/NR | | | 1,425,000 | | | | 1,427,821 | |
Cass County COP, 4.00% due 5/1/2015 | | A/NR | | | 1,000,000 | | | | 1,032,860 | |
Cass County COP, 4.00% due 5/1/2018 | | A/NR | | | 2,255,000 | | | | 2,425,185 | |
Cass County COP, 4.50% due 5/1/2019 | | A/NR | | | 1,270,000 | | | | 1,390,968 | |
Cass County COP, 5.00% due 5/1/2020 | | A/NR | | | 2,255,000 | | | | 2,531,621 | |
Cass County COP, 5.00% due 5/1/2021 | | A/NR | | | 1,750,000 | | | | 1,931,720 | |
City of Lee’s Summit GO, 3.00% due 4/1/2015 | | NR/Aa1 | | | 1,275,000 | | | | 1,311,427 | |
City of Springfield, 5.00% due 8/1/2014 (Southwest Power Station; Insured: Natl-Re) | | AA+/Aa2 | | | 1,000,000 | | | | 1,015,740 | |
Jackson County, 4.00% due 12/1/2014 (Truman Sports Complex) | | NR/A1 | | | 2,580,000 | | | | 2,642,849 | |
Jackson County, 5.00% due 12/1/2014 (Truman Sports Complex; Insured: AMBAC) | | A/Aa3 | | | 7,900,000 | | | | 8,144,979 | |
Jackson County, 4.00% due 12/1/2016 (Parking Facility Projects) | | NR/Aa3 | | | 500,000 | | | | 540,305 | |
Jackson County, 4.00% due 12/1/2017 (Parking Facility Projects) | | NR/Aa3 | | | 500,000 | | | | 547,985 | |
Jackson County, 4.00% due 12/1/2019 (Parking Facility Projects) | | NR/Aa3 | | | 500,000 | | | | 548,050 | |
Jackson County, 4.00% due 12/1/2021 (Parking Facility Projects) | | NR/Aa3 | | | 1,000,000 | | | | 1,081,880 | |
Kansas City IDA, 4.00% due 9/1/2014 (NNSA National Security Campus) | | NR/NR | | | 1,415,000 | | | | 1,426,193 | |
Kansas City IDA, 5.00% due 9/1/2018 (Kansas City Downtown Redevelopment District) | | AA-/A1 | | | 2,000,000 | | | | 2,271,660 | |
Kansas City Municipal Assistance Corp., 5.00% due 4/15/2018 (Bartle Music Hall and Municipal Auditorium Parking Garage; Insured: Natl-Re) | | AA/A1 | | | 1,000,000 | | | | 1,128,980 | |
Kansas City Municipal Assistance Corp., 0% due 4/15/2021 (H. Roe Bartle Convention Center & Infrastructure Project; Insured: AMBAC) | | AA-/A1 | | | 10,055,000 | | | | 8,128,663 | |
Kansas City Municipal Assistance Corp., 0% due 4/15/2022 (H. Roe Bartle Convention Center & Infrastructure Project; Insured: AMBAC) | | AA-/A1 | | | 5,040,000 | | | | 3,877,927 | |
Missouri Development Finance Board, 4.00% due 6/1/2014 (City of Independence Electric System Projects) | | A/NR | | | 3,930,000 | | | | 3,952,794 | |
Missouri Development Finance Board, 4.00% due 6/1/2015 (City of Independence Electric System Projects) | | A/NR | | | 1,000,000 | | | | 1,036,720 | |
Missouri Development Finance Board, 4.00% due 6/1/2016 (City of Independence Electric System Projects) | | A/NR | | | 1,560,000 | | | | 1,657,562 | |
Missouri Development Finance Board, 5.00% due 6/1/2017 (City of Independence Electric System Projects) | | A/NR | | | 1,525,000 | | | | 1,682,700 | |
Missouri Development Finance Board, 5.00% due 6/1/2018 (City of Independence Electric System Projects) | | A/NR | | | 1,705,000 | | | | 1,913,777 | |
Missouri Development Finance Board, 4.00% due 6/1/2019 (City of Independence Electric System Projects) | | A/NR | | | 1,000,000 | | | | 1,077,030 | |
Missouri Development Finance Board, 5.00% due 6/1/2019 (City of Independence Electric System Projects) | | A/NR | | | 1,790,000 | | | | 2,014,359 | |
Missouri Development Finance Board, 4.00% due 6/1/2020 (City of Independence Electric System Projects) | | A/NR | | | 1,265,000 | | | | 1,344,733 | |
Missouri Development Finance Board, 5.00% due 6/1/2020 (City of Independence Electric System Projects) | | A/NR | | | 1,000,000 | | | | 1,119,160 | |
Missouri Development Finance Board, 4.00% due 6/1/2021 (City of Independence Electric System Projects) | | A/NR | | | 2,465,000 | | | | 2,601,832 | |
Missouri Development Finance Board, 4.00% due 6/1/2022 (City of Independence Electric System Projects) | | A/NR | | | 3,155,000 | | | | 3,317,104 | |
Missouri State Health & Educational Facilities Authority, 4.00% due 4/1/2015 (Webster University) | | NR/A2 | | | 2,155,000 | | | | 2,235,101 | |
Missouri State Health & Educational Facilities Authority, 4.00% due 4/1/2016 (Webster University) | | NR/A2 | | | 1,685,000 | | | | 1,799,428 | |
Missouri State Health & Educational Facilities Authority, 5.00% due 5/15/2017 (Children’s Mercy Hospital) | | A+/NR | | | 1,000,000 | | | | 1,102,660 | |
Missouri State Health & Educational Facilities Authority, 5.00% due 5/15/2019 (Children’s Mercy Hospital) | | A+/NR | | | 1,000,000 | | | | 1,132,340 | |
Missouri State Health & Educational Facilities Authority, 5.00% due 5/15/2020 (Children’s Mercy Hospital) | | A+/NR | | | 1,000,000 | | | | 1,110,980 | |
Platte County, 4.00% due 4/1/2017 (Community & Resource Centers) | | NR/A1 | | | 1,500,000 | | | | 1,596,885 | |
Platte County, 4.00% due 4/1/2018 (Community & Resource Centers) | | NR/A1 | | | 2,110,000 | | | | 2,262,215 | |
Platte County, 5.00% due 4/1/2019 (Community & Resource Centers) | | NR/A1 | | | 2,000,000 | | | | 2,235,660 | |
Platte County, 5.00% due 4/1/2021 (Community & Resource Centers) | | NR/A1 | | | 2,440,000 | | | | 2,730,214 | |
Southeast Missouri State University, 4.00% due 4/1/2014 (City of Cape Girardeau Campus System Facilities) | | A/NR | | | 575,000 | | | | 575,000 | |
Southeast Missouri State University, 4.00% due 4/1/2015 (City of Cape Girardeau Campus System Facilities) | | A/NR | | | 600,000 | | | | 621,690 | |
Southeast Missouri State University, 5.00% due 4/1/2016 (City of Cape Girardeau Campus System Facilities) | | A/NR | | | 750,000 | | | | 813,315 | |
Southeast Missouri State University, 5.00% due 4/1/2018 (City of Cape Girardeau Campus System Facilities) | | A/NR | | | 1,165,000 | | | | 1,324,687 | |
Southeast Missouri State University, 5.00% due 4/1/2020 (City of Cape Girardeau Campus System Facilities) | | A/NR | | | 2,825,000 | | | | 3,247,253 | |
30 Certified Semi-Annual Report
| | |
| SCHEDULE OF INVESTMENTS, CONTINUED | | |
| |
Thornburg Limited Term Municipal Fund | | March 31, 2014 (Unaudited) |
| | | | | | | | | | |
Issuer-Description | | Credit Rating†
S&P/ Moody’s | | Principal
Amount | | | Value | |
Special Administrative Board of the Transitional School District of the City of St. Louis GO, 4.00% due 4/1/2019 (State Aid Withholding) | | AA+/NR | | $ | 1,615,000 | | | $ | 1,794,410 | |
Special Administrative Board of the Transitional School District of the City of St. Louis GO, 4.00% due 4/1/2020 (State Aid Withholding) | | AA+/NR | | | 1,600,000 | | | | 1,779,376 | |
Special Administrative Board of the Transitional School District of the City of St. Louis GO, 4.00% due 4/1/2021 (State Aid Withholding) | | AA+/NR | | | 2,055,000 | | | | 2,271,022 | |
a Special Administrative Board of the Transitional School District of the City of St. Louis GO, 4.00% due 4/1/2022 (State Aid Withholding) | | AA+/NR | | | 3,300,000 | | | | 3,638,151 | |
St. Louis Municipal Finance Corp., 5.00% due 2/15/2015 (City Justice Center) | | A/A1 | | | 1,250,000 | | | | 1,295,975 | |
St. Louis Municipal Finance Corp., 5.00% due 2/15/2016 (City Justice Center) | | A/A1 | | | 2,065,000 | | | | 2,215,311 | |
St. Louis Municipal Finance Corp., 5.00% due 2/15/2017 (City Justice Center) | | A/A1 | | | 2,000,000 | | | | 2,191,000 | |
St. Louis Municipal Finance Corp., 5.00% due 2/15/2018 (City Justice Center) | | A/A1 | | | 3,865,000 | | | | 4,302,518 | |
| | | |
NEBRASKA — 0.03% | | | | | | | | | | |
Douglas County School District No. 17 GO, 4.00% due 6/15/2017 (Millard Public Schools) | | AA/Aa1 | | | 1,750,000 | | | | 1,754,812 | |
| | | |
NEVADA — 1.45% | | | | | | | | | | |
Carson City, 4.00% due 9/1/2015 (Carson Tahoe Regional Healthcare Project) | | BBB+/NR | | | 1,000,000 | | | | 1,037,380 | |
Carson City, 4.00% due 9/1/2016 (Carson Tahoe Regional Healthcare Project) | | BBB+/NR | | | 1,045,000 | | | | 1,106,927 | |
Carson City, 5.00% due 9/1/2019 (Carson Tahoe Regional Healthcare Project) | | BBB+/NR | | | 1,000,000 | | | | 1,119,070 | |
Carson City, 5.00% due 9/1/2020 (Carson Tahoe Regional Healthcare Project) | | BBB+/NR | | | 1,000,000 | | | | 1,113,650 | |
Carson City, 5.00% due 9/1/2022 (Carson Tahoe Regional Healthcare Project) | | BBB+/NR | | | 2,450,000 | | | | 2,685,273 | |
City of Las Vegas COP, 5.00% due 9/1/2016 (City Hall) | | AA-/Aa3 | | | 4,000,000 | | | | 4,350,200 | |
City of Las Vegas COP, 5.00% due 9/1/2017 (City Hall) | | AA-/Aa3 | | | 4,300,000 | | | | 4,773,473 | |
City of Las Vegas COP, 5.00% due 9/1/2018 (City Hall) | | AA-/Aa3 | | | 4,000,000 | | | | 4,505,840 | |
City of Las Vegas GO, 7.00% due 4/1/2017 (Performing Arts Center) | | AA/Aa2 | | | 1,825,000 | | | | 2,121,891 | |
City of Las Vegas GO, 7.00% due 4/1/2018 (Performing Arts Center) | | AA/Aa2 | | | 2,095,000 | | | | 2,518,588 | |
City of Las Vegas Special Improvement District 707, 5.40% due 6/1/2014 (Summerlin Area Public Improvements; Insured: AGM) | | AA/A2 | | | 1,285,000 | | | | 1,296,192 | |
City of Reno, 5.25% due 6/1/2014 (Washoe Medical Center; Insured: AGM) | | AA/A2 | | | 1,000,000 | | | | 1,007,630 | |
City of Reno, 5.25% due 6/1/2016 (Washoe Medical Center; Insured: AGM) | | AA/A2 | | | 1,100,000 | | | | 1,195,469 | |
City of Reno, 5.25% due 6/1/2018 (Washoe Medical Center; Insured: AGM) | | AA/A2 | | | 1,000,000 | | | | 1,137,500 | |
City of Reno GO, 5.00% due 6/1/2018 pre-refunded 6/1/2014 (City Street Projects) | | A-/A1 | | | 1,315,000 | | | | 1,325,638 | |
Clark County GO, 5.00% due 11/1/2014 | | AA/Aa1 | | | 4,000,000 | | | | 4,112,280 | |
Clark County GO, 5.00% due 11/1/2017 (Insured: AMBAC) | | AA/Aa1 | | | 1,310,000 | | | | 1,446,109 | |
Clark County GO, 5.00% due 3/1/2019 (University Medical Center of Southern Nevada; Insured: Natl-Re) | | AA/Aa1 | | | 1,850,000 | | | | 1,927,792 | |
Clark County GO, 5.00% due 3/1/2020 (University Medical Center of Southern Nevada; Insured: Natl-Re) | | AA/Aa1 | | | 2,130,000 | | | | 2,215,924 | |
Clark County Improvement District, 5.00% due 12/1/2015 (Insured: AMBAC) | | BBB+/NR | | | 1,660,000 | | | | 1,751,234 | |
Las Vegas Clark County Library District GO, 5.00% due 1/1/2018 | | AA/Aa2 | | | 6,535,000 | | | | 7,437,680 | |
Las Vegas Clark County Library District GO, 5.00% due 1/1/2019 | | AA/Aa2 | | | 3,000,000 | | | | 3,466,170 | |
Las Vegas Convention & Visitors Authority, 5.25% due 7/1/2014 (Insured: AMBAC) | | A+/A1 | | | 2,680,000 | | | | 2,712,294 | |
Las Vegas Convention & Visitors Authority, 5.25% due 7/1/2015 (Insured: AMBAC) | | A+/A1 | | | 4,845,000 | | | | 5,118,210 | |
Las Vegas Convention & Visitors Authority, 5.00% due 7/1/2019 (Insured: AMBAC) | | A+/A1 | | | 6,000,000 | | | | 6,332,520 | |
Las Vegas Valley Water District GO, 5.00% due 6/1/2016 | | AA+/Aa2 | | | 1,000,000 | | | | 1,094,030 | |
Las Vegas Valley Water District GO, 5.00% due 6/1/2017 | | AA+/Aa2 | | | 1,050,000 | | | | 1,181,807 | |
Las Vegas Valley Water District GO, 5.00% due 6/1/2019 | | AA+/Aa2 | | | 1,000,000 | | | | 1,159,670 | |
Las Vegas Valley Water District GO, 5.00% due 6/1/2020 | | AA+/Aa2 | | | 4,255,000 | | | | 4,935,077 | |
Las Vegas Valley Water District GO, 5.00% due 6/1/2020 | | AA+/Aa2 | | | 5,080,000 | | | | 5,891,936 | |
Las Vegas Valley Water District GO, 5.00% due 6/1/2021 | | AA+/Aa2 | | | 5,000,000 | | | | 5,815,150 | |
Redevelopment Agency of the City of Mesquite, 7.00% due 6/1/2019 (Public Facility and Redevelopment Projects) | | BBB+/NR | | | 1,000,000 | | | | 1,004,530 | |
State of Nevada GO, 5.00% due 2/1/2017 pre-refunded 2/1/2015 (Cultural Affairs and Capital Improvement) | | AA/Aa2 | | | 700,000 | | | | 728,210 | |
State of Nevada GO, 5.00% due 12/1/2021 (Municipal Bond Bank Project Nos. R-9A through R-13F; Insured: AGM) | | AA/Aa2 | | | 1,095,000 | | | | 1,153,166 | |
University and Community College System of Nevada, 5.00% due 7/1/2016 pre-refunded 7/1/2015 (Reno Campus Library Facility; Insured: AGM) | | AA/Aa2 | | | 370,000 | | | | 391,967 | |
Washoe County GO, 5.00% due 7/1/2021 (Reno-Sparks Convention & Visitors Authority) | | AA/Aa2 | | | 1,700,000 | | | | 1,957,091 | |
Washoe County GO, 5.00% due 7/1/2022 (Reno-Sparks Convention & Visitors Authority) | | AA/Aa2 | | | 2,500,000 | | | | 2,843,650 | |
| | | |
NEW HAMPSHIRE — 0.40% | | | | | | | | | | |
New Hampshire Business Finance Authority PCR, 5.375% due 5/1/2014 (Central Maine Power Co.) | | BBB+/A3 | | | 1,365,000 | | | | 1,370,405 | |
New Hampshire Health & Educational Facilities, 5.00% due 10/1/2016 (Southern New Hampshire Health Systems) | | A-/NR | | | 1,260,000 | | | | 1,372,669 | |
New Hampshire Health & Educational Facilities, 5.00% due 10/1/2017 (Southern New Hampshire Health Systems) | | A-/NR | | | 1,000,000 | | | | 1,113,110 | |
New Hampshire Municipal Bond Bank, 5.00% due 8/15/2016 (Insured: Natl-Re) | | AA-/A1 | | | 2,985,000 | | | | 3,295,947 | |
New Hampshire Municipal Bond Bank, 5.00% due 8/15/2017 (Insured: Natl-Re) | | AA-/A1 | | | 3,130,000 | | | | 3,553,645 | |
New Hampshire Municipal Bond Bank, 5.25% due 8/15/2020 | | AA/Aa3 | | | 1,000,000 | | | | 1,196,300 | |
New Hampshire Municipal Bond Bank, 5.25% due 8/15/2022 | | AA/Aa3 | | | 2,770,000 | | | | 3,336,216 | |
Certified Semi-Annual Report 31
| | |
| SCHEDULE OF INVESTMENTS, CONTINUED | | |
| |
Thornburg Limited Term Municipal Fund | | March 31, 2014 (Unaudited) |
| | | | | | | | | | |
Issuer-Description | | Credit Rating†
S&P/ Moody’s | | Principal
Amount | | | Value | |
New Hampshire Turnpike System, 5.00% due 2/1/2016 | | A+/A1 | | $ | 3,000,000 | | | $ | 3,244,590 | |
New Hampshire Turnpike System, 5.00% due 2/1/2017 | | A+/A1 | | | 2,425,000 | | | | 2,707,901 | |
New Hampshire Turnpike System, 5.00% due 2/1/2018 | | A+/A1 | | | 1,295,000 | | | | 1,479,486 | |
New Hampshire Turnpike System, 5.00% due 2/1/2020 | | A+/A1 | | | 1,000,000 | | | | 1,163,600 | |
New Hampshire Turnpike System, 5.00% due 2/1/2021 | | A+/A1 | | | 1,260,000 | | | | 1,466,627 | |
State of New Hampshire, 5.00% due 9/1/2015 (I-93 Salem to Manchester Project) | | AA/A1 | | | 825,000 | | | | 880,292 | |
| | | |
NEW JERSEY — 1.94% | | | | | | | | | | |
Burlington County Bridge Commission, 2.00% due 12/1/2014 (County Governmental Loan Program) | | AA/Aa2 | | | 2,140,000 | | | | 2,165,530 | |
Burlington County Bridge Commission, 3.00% due 12/1/2015 (County Governmental Loan Program) | | AA/Aa2 | | | 1,245,000 | | | | 1,300,477 | |
Burlington County Bridge Commission, 3.00% due 12/1/2016 (County Governmental Loan Program) | | AA/Aa2 | | | 1,000,000 | | | | 1,062,430 | |
Burlington County Bridge Commission, 5.00% due 12/1/2018 (County Governmental Loan Program) | | AA/Aa2 | | | 1,000,000 | | | | 1,163,600 | |
Camden County Improvement Authority, 5.00% due 7/1/2014 (Cooper Medical School) | | A+/A2 | | | 2,845,000 | | | | 2,877,717 | |
Camden County Improvement Authority, 5.00% due 7/1/2015 (Cooper Medical School) | | A+/A2 | | | 2,990,000 | | | | 3,157,829 | |
Camden County Improvement Authority, 5.00% due 7/1/2016 (Cooper Medical School) | | A+/A2 | | | 3,040,000 | | | | 3,324,818 | |
City of Paterson, 4.25% due 6/15/2015 (City Capital Projects; Insured: AGM) (State Aid Withholding) (ETM) | | NR/A1 | | | 1,275,000 | | | | 1,336,582 | |
City of Paterson GO, 3.50% due 3/15/2017 (Debt Restructuring & City Capital Projects) (State Aid Withholding) | | NR/A1 | | | 950,000 | | | | 999,581 | |
County of Bergen GO, 3.25% due 11/1/2014 (General Improvement, Special Services, Vocational School Projects) | | NR/Aaa | | | 920,000 | | | | 936,661 | |
County of Essex GO, 4.00% due 6/1/2016 | | NR/Aa2 | | | 500,000 | | | | 537,885 | |
County of Hudson COP, 6.25% due 12/1/2014 (Correctional Facility Lease-Purchase; Insured: Natl-Re) | | AA-/Baa1 | | | 1,500,000 | | | | 1,552,575 | |
County of Hudson COP, 6.25% due 12/1/2016 (Correctional Facility Lease-Purchase; Insured: Natl-Re) | | AA-/Baa1 | | | 550,000 | | | | 617,408 | |
Essex County Improvement Authority, 5.125% due 10/1/2016 (Insured: Natl-Re) | | NR/Aa2 | | | 2,545,000 | | | | 2,606,360 | |
Gloucester County Improvement Authority, 2.125% due 12/1/2029 put 12/1/2017 (Waste Management, Inc. Project) | | A-/NR | | | 2,000,000 | | | | 2,029,360 | |
Hudson County Improvement Authority, 5.25% due 10/1/2014 (Hudson County Lease Project; Insured: AGM) | | AA/Aa3 | | | 3,000,000 | | | | 3,069,690 | |
Hudson County Improvement Authority, 4.75% due 10/1/2015 (Hudson County Lease Project; Insured: AGM) | | AA/Aa3 | | | 2,000,000 | | | | 2,116,480 | |
Hudson County Improvement Authority, 4.75% due 10/1/2016 (Hudson County Lease Project; Insured: AGM) | | AA/Aa3 | | | 3,155,000 | | | | 3,436,931 | |
Hudson County Improvement Authority, 4.75% due 10/1/2017 (Hudson County Lease Project; Insured: AGM) | | AA/Aa3 | | | 4,065,000 | | | | 4,499,833 | |
Hudson County Improvement Authority, 4.75% due 10/1/2018 (Hudson County Lease Project; Insured: AGM) | | AA/Aa3 | | | 2,000,000 | | | | 2,241,480 | |
Hudson County Improvement Authority, 4.75% due 10/1/2019 (Hudson County Lease Project; Insured: AGM) | | AA/Aa3 | | | 4,390,000 | | | | 4,925,668 | |
Hudson County Improvement Authority, 5.375% due 10/1/2020 (Hudson County Lease Project; Insured: AGM) | | AA/Aa3 | | | 2,020,000 | | | | 2,333,948 | |
Middlesex County Improvement Authority, 5.00% due 9/15/2015 (Parks, Open Space, Playgrounds for Public Recreation) | | AAA/Aa2 | | | 500,000 | | | | 534,840 | |
Monmouth County Improvement Authority, 5.00% due 12/1/2016 (Insured: AMBAC) | | NR/NR | | | 1,000,000 | | | | 1,098,160 | |
New Jersey EDA, 5.00% due 11/15/2014 (Seabrook Village) | | NR/NR | | | 1,000,000 | | | | 1,017,180 | |
New Jersey EDA, 5.00% due 12/15/2016 (School Facilities Construction) | | A+/A1 | | | 10,950,000 | | | | 12,228,850 | |
New Jersey EDA, 5.00% due 9/1/2018 (School Facilities Construction; Insured: Natl-Re) | | AA-/A1 | | | 3,000,000 | | | | 3,194,580 | |
New Jersey EDA, 5.50% due 12/15/2019 (School Facilities Construction; Insured: AMBAC) | | A+/A1 | | | 5,525,000 | | | | 6,565,081 | |
New Jersey EDA, 5.00% due 9/1/2020 (School Facilities Construction) | | A+/A1 | | | 500,000 | | | | 577,500 | |
New Jersey EDA, 5.00% due 3/1/2023 (School Facilities Construction) | | A+/A1 | | | 4,000,000 | | | | 4,598,280 | |
New Jersey EDA, 5.75% due 9/1/2023 (School Facilities Construction) | | A+/A1 | | | 5,505,000 | | | | 6,451,585 | |
New Jersey EDA, 6.375% due 4/1/2031 pre-refunded 5/15/2014 (Metromall Urban Renewal, Inc.-Kapkowski Road Landfill) | | NR/Aaa | | | 300,000 | | | | 302,289 | |
New Jersey Educational Facilities Authority, 5.00% due 7/1/2028 pre-refunded 7/1/2014 (Princeton University) | | AAA/Aaa | | | 500,000 | | | | 506,070 | |
New Jersey Health Care Facilities Financing Authority, 5.00% due 7/1/2014 (St. Peter’s University Hospital) | | BB+/Ba1 | | | 3,575,000 | | | | 3,598,273 | |
New Jersey Health Care Facilities Financing Authority, 5.00% due 7/1/2015 (St. Peter’s University Hospital) | | BB+/Ba1 | | | 3,520,000 | | | | 3,622,221 | |
New Jersey Health Care Facilities Financing Authority, 5.00% due 7/1/2023 (Virtua Health Issue) | | A+/NR | | | 500,000 | | | | 571,550 | |
New Jersey Health Care Facilities Financing Authority, 5.00% due 7/1/2024 (Virtua Health Issue) | | A+/NR | | | 1,000,000 | | | | 1,138,020 | |
New Jersey Higher Educational Assistance Authority, 5.00% due 12/1/2017 | | AA/Aa2 | | | 1,910,000 | | | | 2,146,229 | |
New Jersey Higher Educational Assistance Authority, 5.00% due 12/1/2018 | | AA/Aa2 | | | 3,000,000 | | | | 3,396,810 | |
New Jersey Higher Educational Assistance Authority, 5.25% due 12/1/2019 | | AA/Aa2 | | | 5,650,000 | | | | 6,469,024 | |
New Jersey Transit Corporation COP, 5.00% due 9/15/2019 (Multi-Level Rail Cars and Parts; Insured: Natl-Re) | | AA-/A2 | | | 975,000 | | | | 1,032,457 | |
New Jersey Transportation Trust Fund Authority, 5.00% due 6/15/2019 | | A+/A1 | | | 1,000,000 | | | | 1,155,010 | |
New Jersey Transportation Trust Fund Authority, 5.00% due 6/15/2019 pre-refunded 6/15/2015 (State Transportation System; Insured: AGM) | | AA+/NR | | | 1,450,000 | | | | 1,533,839 | |
New Jersey Transportation Trust Fund Authority, 5.00% due 6/15/2020 | | A+/A1 | | | 1,000,000 | | | | 1,153,850 | |
New Jersey Transportation Trust Fund Authority, 5.00% due 6/15/2021 | | A+/A1 | | | 2,360,000 | | | | 2,721,245 | |
Ocean Township Municipal Utility Authority, 6.00% due 8/1/2017 (Insured: Natl-Re) | | AA-/Baa1 | | | 2,585,000 | | | | 2,783,425 | |
Passaic Valley Sewer Commissioners GO, 5.625% due 12/1/2018 (Sewer System) | | NR/A2 | | | 1,210,000 | | | | 1,407,666 | |
Passaic Valley Sewer Commissioners GO, 5.75% due 12/1/2019 (Sewer System) | | NR/A2 | | | 2,000,000 | | | | 2,348,620 | |
Passaic Valley Sewer Commissioners GO, 5.75% due 12/1/2020 (Sewer System) | | NR/A2 | | | 2,800,000 | | | | 3,276,868 | |
Passaic Valley Sewer Commissioners GO, 5.75% due 12/1/2021 (Sewer System) | | NR/A2 | | | 1,000,000 | | | | 1,176,240 | |
State University of New Jersey GO, 4.00% due 5/1/2014 (Rutgers Campus Facility Projects) | | AA-/Aa3 | | | 1,000,000 | | | | 1,003,200 | |
Township of Plainsboro GO, 4.00% due 5/1/2015 (General Improvement) | | NR/Aa1 | | | 1,000,000 | | | | 1,040,280 | |
Township of Wayne GO, 2.00% due 2/15/2018 (General Improvements and Water Utility System) | | AA+/Aaa | | | 1,295,000 | | | | 1,337,191 | |
| | | |
NEW MEXICO — 1.20% | | | | | | | | | | |
Albuquerque Bernalillo County Water Utility Authority, 5.00% due 7/1/2016 (San Juan-Chama Drinking Water Project; Insured: AMBAC) | | AA+/Aa2 | | | 1,800,000 | | | | 1,904,292 | |
32 Certified Semi-Annual Report
| | |
| SCHEDULE OF INVESTMENTS, CONTINUED | | |
| |
Thornburg Limited Term Municipal Fund | | March 31, 2014 (Unaudited) |
| | | | | | | | | | |
Issuer-Description | | Credit Rating†
S&P/ Moody’s | | Principal
Amount | | | Value | |
Albuquerque Municipal School District No. 12 GO, 5.00% due 8/1/2019 (Bernalillo and Sandoval Counties School Facilities) (State Aid Withholding) | | AA/Aa1 | | $ | 2,300,000 | | | $ | 2,711,884 | |
Albuquerque Municipal School District No. 12 GO, 5.00% due 8/1/2021 (Educational Facilities) (State Aid Withholding) | | AA/Aa1 | | | 2,425,000 | | | | 2,631,149 | |
City of Farmington PCR, 1.875% due 6/1/2032 put 9/1/2017 (El Paso Electric Co. Four Corners Project) | | BBB/Baa1 | | | 3,000,000 | | | | 2,973,540 | |
City of Santa Fe, 4.50% due 5/15/2022 (El Castillo Retirement Residences) | | BBB-/NR | | | 2,585,000 | | | | 2,637,734 | |
Gadsden ISD No. 16 GO, 2.00% due 8/15/2014 (Dona Ana & Otero Counties School Facilities) (State Aid Withholding) | | NR/Aa1 | | | 3,025,000 | | | | 3,046,114 | |
Gallup PCR, 5.00% due 8/15/2016 (Insured: AMBAC) | | A/A3 | | | 2,500,000 | | | | 2,637,075 | |
Incorporated County of Los Alamos, 5.50% due 6/1/2017 | | AA+/A1 | | | 2,365,000 | | | | 2,704,259 | |
Incorporated County of Los Alamos, 5.50% due 6/1/2018 | | AA+/A1 | | | 2,205,000 | | | | 2,580,181 | |
New Mexico Educational Assistance Foundation, 4.00% due 9/1/2017 (Student Loans) | | NR/Aaa | | | 6,000,000 | | | | 6,615,720 | |
New Mexico Educational Assistance Foundation, 5.00% due 12/1/2018 (Student Loans) | | AAA/Aaa | | | 5,000,000 | | | | 5,809,400 | |
New Mexico Educational Assistance Foundation, 5.00% due 12/1/2021 (Student Loans) | | AAA/Aaa | | | 3,000,000 | | | | 3,464,610 | |
New Mexico Finance Authority, 3.00% due 6/15/2015 (State Highway Infrastructure Projects) | | AAA/Aa1 | | | 900,000 | | | | 931,014 | |
Regents of New Mexico State University, 5.00% due 4/1/2020 (Corbett Center Student Union & NMSU Golf Course) | | AA/Aa3 | | | 3,095,000 | | | | 3,640,989 | |
Regents of New Mexico State University, 5.00% due 4/1/2021 (Corbett Center Student Union & NMSU Golf Course) | | AA/Aa3 | | | 1,845,000 | | | | 2,178,207 | |
Regents of New Mexico State University, 5.00% due 4/1/2022 (Corbett Center Student Union & NMSU Golf Course) | | AA/Aa3 | | | 1,250,000 | | | | 1,483,088 | |
Rio Rancho Public School District No. 94 GO, 4.00% due 8/1/2014 (Sandoval County School Facilities) (State Aid Withholding) | | NR/Aa1 | | | 1,715,000 | | | | 1,736,678 | |
Santa Fe Public School District GO, 3.00% due 8/1/2015 (District School Building and Renovation Program) (State Aid Withholding) | | AA/Aa1 | | | 1,000,000 | | | | 1,037,350 | |
State of New Mexico, 5.00% due 7/1/2014 (Statewide Capital Project Funding) | | AA/Aa1 | | | 7,435,000 | | | | 7,525,633 | |
State of New Mexico, 5.00% due 7/1/2015 (Statewide Capital Project Funding) | | AA/Aa1 | | | 8,200,000 | | | | 8,694,296 | |
State of New Mexico, 5.00% due 7/1/2016 (Statewide Capital Project Funding) | | AA/Aa1 | | | 10,265,000 | | | | 11,309,361 | |
University of New Mexico, 5.00% due 7/1/2014 (University of New Mexico Hospital; Insured: AGM/FHA) | | AA/A2 | | | 1,000,000 | | | | 1,011,780 | |
| | | |
NEW YORK — 8.93% | | | | | | | | | | |
Amherst Development Corp., 5.00% due 10/1/2015 (Student Housing; Insured: AGM) | | AA/A2 | | | 2,035,000 | | | | 2,162,656 | |
City of Long Beach School District GO, 3.50% due 5/1/2022 (Insured: AGM) (State Aid Withholding) | | AA/Aa2 | | | 1,600,000 | | | | 1,685,488 | |
City of New York GO, 3.00% due 8/1/2014 | | AA/Aa2 | | | 20,480,000 | | | | 20,675,584 | |
City of New York GO, 5.00% due 8/1/2014 | | AA/Aa2 | | | 1,000,000 | | | | 1,016,220 | |
City of New York GO, 5.00% due 8/1/2017 pre-refunded 8/1/2015 | | NR/NR | | | 990,000 | | | | 1,052,093 | |
City of New York GO, 5.00% due 8/1/2017 | | NR/Aa2 | | | 10,000 | | | | 10,623 | |
City of New York GO, 5.00% due 8/1/2021 | | AA/Aa2 | | | 9,000,000 | | | | 10,512,540 | |
City of New York GO, 5.00% due 8/1/2021 | | AA/Aa2 | | | 3,000,000 | | | | 3,504,180 | |
City of New York GO, 5.00% due 8/1/2022 | | AA/Aa2 | | | 6,625,000 | | | | 7,713,024 | |
City of New York GO, 5.00% due 8/1/2022 | | AA/Aa2 | | | 3,000,000 | | | | 3,492,690 | |
City of New York GO, 5.00% due 4/1/2023 pre-refunded 4/1/2015 | | NR/NR | | | 6,090,000 | | | | 6,379,031 | |
City of New York GO, 5.00% due 8/1/2023 | | AA/Aa2 | | | 7,000,000 | | | | 8,165,150 | |
City School District of the City of Rome GO, 5.00% due 6/15/2017 (Insured: Natl-Re) (State Aid Withholding) | | NR/A1 | | | 1,635,000 | | | | 1,722,522 | |
Erie County Individual Development Agency, 5.00% due 5/1/2015 (Buffalo School District) (ETM) | | NR/NR | | | 1,395,000 | | | | 1,467,847 | |
Erie County Individual Development Agency, 5.00% due 5/1/2015 (Buffalo School District) | | AA-/Aa3 | | | 1,605,000 | | | | 1,687,914 | |
Erie County Individual Development Agency, 5.00% due 5/1/2016 (Buffalo School District) (ETM) | | NR/NR | | | 4,090,000 | | | | 4,482,026 | |
Erie County Individual Development Agency, 5.00% due 5/1/2016 (Buffalo School District) | | AA-/Aa3 | | | 4,705,000 | | | | 5,141,201 | |
Erie County Individual Development Agency, 5.00% due 5/1/2017 (Buffalo School District) | | AA-/Aa3 | | | 7,265,000 | | | | 8,178,283 | |
Erie County Individual Development Agency, 5.00% due 5/1/2018 (Buffalo School District) | | AA-/Aa3 | | | 5,000,000 | | | | 5,740,600 | |
Metropolitan Transportation Authority, 5.00% due 11/15/2020 | | AA/NR | | | 2,000,000 | | | | 2,343,840 | |
Metropolitan Transportation Authority, 5.00% due 11/15/2020 | | A+/A2 | | | 12,955,000 | | | | 15,017,695 | |
Metropolitan Transportation Authority, 5.00% due 11/15/2021 | | A+/A2 | | | 24,325,000 | | | | 28,105,835 | |
Monroe County Industrial Development Corp., 5.00% due 6/1/2018 (St. John Fisher College) | | BBB+/NR | | | 1,425,000 | | | | 1,576,592 | |
Monroe County Industrial Development Corp., 5.00% due 6/1/2019 (St. John Fisher College) | | BBB+/NR | | | 1,030,000 | | | | 1,146,380 | |
Monroe County Industrial Development Corp., 5.00% due 6/1/2022 (St. John Fisher College) | | BBB+/NR | | | 2,000,000 | | | | 2,185,920 | |
Nassau County IDA, 5.25% due 3/1/2018 (New York Institute of Technology) | | BBB+/Baa2 | | | 1,260,000 | | | | 1,400,125 | |
Nassau County IDA, 5.25% due 3/1/2020 (New York Institute of Technology) | | BBB+/Baa2 | | | 1,715,000 | | | | 1,927,231 | |
New York City Health and Hospital Corp. GO, 5.00% due 2/15/2019 (Healthcare Facilities Improvements) | | A+/Aa3 | | | 2,700,000 | | | | 3,109,455 | |
New York City Health and Hospital Corp. GO, 5.00% due 2/15/2021 (Healthcare Facilities Improvements) | | A+/Aa3 | | | 2,615,000 | | | | 2,950,871 | |
New York City Health and Hospital Corp. GO, 5.00% due 2/15/2020 (Healthcare Facilities Improvements) | | A+/Aa3 | | | 10,000,000 | | | | 11,521,100 | |
New York City Housing Development Corp., 0.90% due 11/1/2014 (Multi-Family Housing) | | AA/Aa2 | | | 1,400,000 | | | | 1,404,606 | |
New York City Housing Development Corp., 0.80% due 11/1/2015 (Multi-Family Housing) | | AA/Aa2 | | | 1,820,000 | | | | 1,824,222 | |
New York City Municipal Water Finance Authority, 0.07% due 6/15/2035 put 4/1/2014 (Water and Sewer System Capital Improvements; SPA: Bayerische Landesbank) (daily demand notes) | | AAA/Aa1 | | | 40,230,000 | | | | 40,230,000 | |
New York City Transitional Finance Authority, 4.00% due 7/15/2014 (School Financing Act) (State Aid Withholding) | | AA-/Aa3 | | | 2,000,000 | | | | 2,022,340 | |
New York City Transitional Finance Authority, 4.00% due 8/1/2014 (City Capital Projects) | | AAA/Aa1 | | | 12,000,000 | | | | 12,155,520 | |
New York City Transitional Finance Authority, 5.00% due 11/1/2014 (City Capital Projects) | | AAA/Aa1 | | | 10,595,000 | | | | 10,897,063 | |
New York City Transitional Finance Authority, 5.00% due 11/1/2014 (City Capital Projects) | | AAA/Aa1 | | | 2,275,000 | | | | 2,339,860 | |
New York City Transitional Finance Authority, 5.00% due 11/1/2014 (World Trade Center Recovery Costs) (State Aid Withholding) | | AAA/Aaa | | | 2,000,000 | | | | 2,057,020 | |
Certified Semi-Annual Report 33
| | |
| SCHEDULE OF INVESTMENTS, CONTINUED | | |
| |
Thornburg Limited Term Municipal Fund | | March 31, 2014 (Unaudited) |
| | | | | | | | | | |
Issuer-Description | | Credit Rating†
S&P/ Moody’s | | Principal
Amount | | | Value | |
New York City Transitional Finance Authority, 5.00% due 11/1/2015 (City Capital Projects) | | AAA/Aa1 | | $ | 5,000,000 | | | $ | 5,376,950 | |
New York City Transitional Finance Authority, 5.00% due 7/15/2016 (School Financing Act) (State Aid Withholding) | | AA-/Aa3 | | | 3,155,000 | | | | 3,472,645 | |
New York City Transitional Finance Authority, 5.00% due 11/1/2016 (City Capital Projects) | | AAA/Aa1 | | | 5,000,000 | | | | 5,568,050 | |
New York City Transitional Finance Authority, 5.00% due 11/1/2016 (City Capital Projects) | | AAA/Aa1 | | | 12,680,000 | | | | 14,120,575 | |
New York City Transitional Finance Authority, 5.00% due 11/1/2017 (World Trade Center Recovery Costs) | | AAA/Aa1 | | | 1,000,000 | | | | 1,074,010 | |
New York City Transitional Finance Authority, 5.00% due 1/15/2018 (School Financing Act) (State Aid Withholding) | | AA-/Aa3 | | | 4,865,000 | | | | 5,555,879 | |
New York City Transitional Finance Authority, 5.00% due 11/1/2018 (City Capital Projects) | | AAA/Aa1 | | | 2,000,000 | | | | 2,329,420 | |
New York City Transitional Finance Authority, 5.00% due 11/1/2018 (City Capital Projects) | | AAA/Aa1 | | | 1,500,000 | | | | 1,747,065 | |
New York City Transitional Finance Authority, 5.00% due 11/1/2018 (City Capital Projects) | | AAA/Aa1 | | | 11,730,000 | | | | 13,662,048 | |
New York City Transitional Finance Authority, 5.00% due 11/1/2018 (City Capital Projects) | | AAA/Aa1 | | | 3,075,000 | | | | 3,581,483 | |
New York City Transitional Finance Authority, 5.00% due 11/1/2018 (City Capital Projects) | | AAA/Aa1 | | | 1,645,000 | | | | 1,915,948 | |
New York City Transitional Finance Authority, 5.00% due 11/1/2018 (City Capital Projects) | | AAA/Aa1 | | | 12,725,000 | | | | 14,820,935 | |
New York State Dormitory Authority, 3.00% due 8/15/2014 (Mental Health Services Facilities) (ETM) | | NR/NR | | | 10,000 | | | | 10,105 | |
New York State Dormitory Authority, 3.00% due 8/15/2014 (Mental Health Services Facilities) | | AA-/NR | | | 2,630,000 | | | | 2,657,825 | |
New York State Dormitory Authority, 5.00% due 11/1/2014 (AIDS Long-Term Health Care Facilities; Insured: SONYMA) | | NR/Aa1 | | | 500,000 | | | | 502,015 | |
New York State Dormitory Authority, 5.25% due 5/15/2015 (State University of New York Educational Facilities; Insured: Natl-Re/IBC) | | AA-/Aa3 | | | 10,000,000 | | | | 10,227,300 | |
New York State Dormitory Authority, 5.25% due 8/15/2015 (Presbyterian Hospital; Insured: AGM/FHA) | | AA/A2 | | | 3,290,000 | | | | 3,349,845 | |
New York State Dormitory Authority, 5.50% due 2/15/2017 (Mental Health Services Facilities) | | AA-/NR | | | 5,000,000 | | | | 5,668,600 | |
New York State Dormitory Authority, 5.25% due 5/15/2017 (Court Facilities Lease; Insured: AMBAC) | | AA-/Aa3 | | | 4,945,000 | | | | 5,583,399 | |
New York State Dormitory Authority, 5.50% due 10/1/2017 (School Districts Financing Program; Insured: Natl-Re) (State Aid Withholding) | | AA-/A2 | | | 5,000 | | | | 5,022 | |
New York State Dormitory Authority, 5.50% due 2/15/2018 (Mental Health Services Facilities) | | AA-/NR | | | 5,280,000 | | | | 6,139,742 | |
New York State Dormitory Authority, 2.25% due 4/1/2018 (School Districts Financing Program) (State Aid Withholding) | | AA+/NR | | | 4,800,000 | | | | 4,982,928 | |
New York State Dormitory Authority, 5.00% due 4/1/2018 (School Districts Financing Program) (State Aid Withholding) | | AA+/NR | | | 325,000 | | | | 372,821 | |
New York State Dormitory Authority, 5.00% due 10/1/2018 (School Districts Financing Program; Insured: AGM) (State Aid Withholding) | | AA/A2 | | | 2,500,000 | | | | 2,888,175 | |
New York State Dormitory Authority, 5.00% due 10/1/2018 (School Districts Financing Program) (State Aid Withholding) | | NR/Aa3 | | | 1,395,000 | | | | 1,596,843 | |
New York State Dormitory Authority, 5.00% due 10/1/2018 (School Districts Financing Program) (State Aid Withholding) | | AA-/NR | | | 2,520,000 | | | | 2,911,280 | |
New York State Dormitory Authority, 5.00% due 4/1/2019 (School Districts Financing Program) (State Aid Withholding) | | AA+/NR | | | 610,000 | | | | 709,290 | |
New York State Dormitory Authority, 5.00% due 7/1/2019 (New York Department of Health Projects; Insured: Natl-Re) | | AA-/Aa3 | | | 6,975,000 | | | | 7,052,004 | |
New York State Dormitory Authority, 5.25% due 7/1/2019 pre-refunded 7/1/2014 (FIT Student Housing Corp.) | | NR/Baa1 | | | 750,000 | | | | 759,555 | |
New York State Dormitory Authority, 5.00% due 10/1/2019 (School Districts Financing Program; Insured: AGM) (State Aid Withholding) | | AA/A2 | | | 2,100,000 | | | | 2,446,731 | |
New York State Dormitory Authority, 5.00% due 10/1/2019 (School Districts Financing Program) (State Aid Withholding) | | NR/Aa3 | | | 1,585,000 | | | | 1,826,094 | |
New York State Dormitory Authority, 5.00% due 10/1/2019 (School Districts Financing Program) (State Aid Withholding) | | AA-/NR | | | 2,645,000 | | | | 3,081,716 | |
New York State Dormitory Authority, 5.00% due 12/15/2019 (Metropolitan Transportation Authority Service Contract) | | AAA/Aa2 | | | 60,000,000 | | | | 70,804,200 | |
New York State Dormitory Authority, 5.00% due 4/1/2020 (School Districts Financing Program) (State Aid Withholding) | | AA+/NR | | | 1,000,000 | | | | 1,161,010 | |
New York State Dormitory Authority, 5.00% due 7/1/2020 (NYSARC, Inc. Developmental Disability Programs) | | NR/Aa3 | | | 1,000,000 | | | | 1,150,370 | |
New York State Dormitory Authority, 5.00% due 8/15/2020 (Mental Health Services Facilities; Insured: Natl-Re) (State Aid Withholding) | | AA-/Baa1 | | | 2,105,000 | | | | 2,189,305 | |
New York State Dormitory Authority, 5.00% due 10/1/2020 (School Districts Financing Program; Insured: AGM) (State Aid Withholding) | | AA/A2 | | | 2,100,000 | | | | 2,444,274 | |
New York State Dormitory Authority, 5.00% due 10/1/2020 (School Districts Financing Program) (State Aid Withholding) | | NR/Aa3 | | | 1,000,000 | | | | 1,151,540 | |
New York State Dormitory Authority, 5.00% due 10/1/2020 (School Districts Financing Program) (State Aid Withholding) | | AA-/NR | | | 2,775,000 | | | | 3,229,933 | |
New York State Dormitory Authority, 5.00% due 4/1/2021 (School Districts Financing Program) (State Aid Withholding) | | AA+/NR | | | 450,000 | | | | 523,026 | |
New York State Dormitory Authority, 5.00% due 10/1/2021 (School Districts Financing Program; Insured: AGM) (State Aid Withholding) | | AA/A2 | | | 1,250,000 | | | | 1,451,613 | |
New York State Dormitory Authority, 5.00% due 10/1/2021 (School Districts Financing Program) (State Aid Withholding) | | NR/Aa3 | | | 750,000 | | | | 863,385 | |
New York State Dormitory Authority, 5.00% due 10/1/2022 (School Districts Financing Program) (State Aid Withholding) | | AA+/NR | | | 300,000 | | | | 350,853 | |
New York State Dormitory Authority, 5.00% due 2/15/2023 (Mental Health Services Facilities; Insured: Natl-Re) (State Aid Withholding) | | AA-/Baa1 | | | 2,000,000 | | | | 2,076,860 | |
New York State Dormitory Authority, 5.25% due 10/1/2023 (School Districts Financing Program; Insured: AGM) (State Aid Withholding) | | AA/A1 | | | 2,000,000 | | | | 2,287,940 | |
New York State Dormitory Authority, 5.25% due 2/15/2031 pre-refunded 8/15/2014 (Presbyterian Hospital; Insured: FSA/ FHA) | | AA+/Aa1 | | | 9,840,000 | | | | 10,027,058 | |
New York State Energy Research & Development Authority, 2.25% due 12/1/2015 (New York Electric & Gas Corp.) | | BBB+/A3 | | | 5,000,000 | | | | 5,100,650 | |
New York State Environmental Facilities Corp., 4.00% due 11/15/2017 (Water Pollution Control & Drinking Water Projects) | | AAA/Aaa | | | 2,095,000 | | | | 2,172,264 | |
New York State Environmental Facilities Corp., 4.00% due 11/15/2018 (Water Pollution Control & Drinking Water Projects) | | AAA/Aaa | | | 2,170,000 | | | | 2,239,983 | |
New York State Housing Finance Agency, 0.75% due 5/1/2015 (2012 Affordable Housing Projects; Insured: SONYMA) | | NR/Aa2 | | | 2,000,000 | | | | 2,006,760 | |
New York State Housing Finance Agency, 0.80% due 11/1/2015 (2012 Affordable Housing Projects; Insured: SONYMA) | | NR/Aa2 | | | 1,700,000 | | | | 1,709,061 | |
New York State Housing Finance Agency, 0.875% due 11/1/2015 (2012 Affordable Housing Projects; Insured: SONYMA) | | NR/Aa2 | | | 3,100,000 | | | | 3,118,228 | |
New York State Housing Finance Agency, 0.95% due 5/1/2016 (2012 Affordable Housing Projects; Insured: SONYMA) | | NR/Aa2 | | | 2,700,000 | | | | 2,711,340 | |
New York State Thruway Authority, 4.00% due 3/15/2015 (Highway, Bridge, Multi-Modal and MTA Projects) | | AAA/Aa2 | | | 2,000,000 | | | | 2,074,240 | |
New York State Thruway Authority, 5.00% due 4/1/2017 pre-refunded 10/1/2015 (Second General Highway & Bridge Trust; Insured: Natl-Re) | | AA-/NR | | | 345,000 | | | | 369,626 | |
34 Certified Semi-Annual Report
| | |
| SCHEDULE OF INVESTMENTS, CONTINUED | | |
| |
Thornburg Limited Term Municipal Fund | | March 31, 2014 (Unaudited) |
| | | | | | | | | | |
Issuer-Description | | Credit Rating†
S&P/ Moody’s | | Principal
Amount | | | Value | |
New York State Thruway Authority, 5.00% due 4/1/2017 (Second General Highway & Bridge Trust; Insured: Natl-Re) | | AA/NR | | $ | 2,255,000 | | | $ | 2,412,264 | |
New York State Thruway Authority, 5.00% due 5/1/2019 (Multi-Year Highway and Bridge Capital Program) | | A-/A3 | | | 5,000,000 | | | | 5,787,100 | |
New York State Thruway Authority, 5.00% due 1/1/2020 (Governor Thomas E. Dewey Thruway) | | A/A2 | | | 2,000,000 | | | | 2,331,400 | |
New York State Thruway Authority, 5.00% due 1/1/2021 (Governor Thomas E. Dewey Thruway) | | A/A2 | | | 2,500,000 | | | | 2,916,300 | |
New York State Thruway Authority, 5.00% due 1/1/2022 (Governor Thomas E. Dewey Thruway) | | A/A2 | | | 3,000,000 | | | | 3,500,010 | |
New York State Thruway Authority, 5.00% due 3/15/2024 (Highway, Bridge, Multi-Modal and MTA Projects) | | AAA/Aa2 | | | 18,300,000 | | | | 20,944,716 | |
Patchogue-Medford Union Free School District GO, 4.25% due 10/1/2015 (Insured: MBIA) (State Aid Withholding) | | AA-/Baa1 | | | 1,000,000 | | | | 1,053,340 | |
Port Authority 148th GO, 5.00% due 8/15/2017 (Insured: AGM) | | AA/Aa3 | | | 4,725,000 | | | | 5,371,285 | |
Port Authority of New York and New Jersey GO, 5.00% due 12/1/2019 (Port Authority Facilities Capital Projects; Insured: AGM) | | AA/Aa3 | | | 1,000,000 | | | | 1,063,910 | |
Suffolk County Economic Development Corp., 5.00% due 7/1/2020 (Catholic Health Services) | | BBB+/Baa1 | | | 5,000,000 | | | | 5,632,650 | |
Suffolk County Economic Development Corp., 5.00% due 7/1/2021 (Catholic Health Services) | | BBB+/Baa1 | | | 5,000,000 | | | | 5,583,250 | |
Suffolk County Economic Development Corp., 5.00% due 7/1/2022 (Catholic Health Services) | | BBB+/Baa1 | | | 5,000,000 | | | | 5,506,650 | |
Suffolk County IDA Civic Facilities GO, 5.25% due 3/1/2019 (New York Institute of Technology) | | BBB+/Baa2 | | | 1,400,000 | | | | 1,454,586 | |
Tobacco Settlement Financing Corp., 5.00% due 6/1/2014 | | AA-/NR | | | 5,000,000 | | | | 5,040,650 | |
Tobacco Settlement Financing Corp., 5.00% due 6/1/2018 | | AA-/NR | | | 3,725,000 | | | | 4,275,071 | |
Triborough Bridge & Tunnel Authority, 0.12% due 1/1/2032 put 4/1/2014 (MTA Bridges and Tunnels; LOC: California State Teachers’ Retirement System) (daily demand notes) | | AA-/Aa1 | | | 500,000 | | | | 500,018 | |
Triborough Bridge and Tunnel Authority, 5.00% due 11/15/2021 (MTA Bridges & Tunnels) | | AA-/Aa3 | | | 5,140,000 | | | | 6,092,853 | |
United Nations Development Corp., 5.00% due 7/1/2016 | | NR/A1 | | | 3,400,000 | | | | 3,733,812 | |
United Nations Development Corp., 5.00% due 7/1/2017 | | NR/A1 | | | 3,000,000 | | | | 3,370,440 | |
United Nations Development Corp., 5.00% due 7/1/2019 (One, Two and Three U.N. Plaza Project) | | NR/A1 | | | 4,000,000 | | | | 4,623,160 | |
West Seneca Central School District GO, 5.00% due 11/15/2022 (Insured: BAM) (State Aid Withholding) | | AA/A1 | | | 1,000,000 | | | | 1,159,280 | |
| | | |
NORTH CAROLINA — 2.00% | | | | | | | | | | |
Catawba County, 4.00% due 10/1/2015 | | AA-/Aa2 | | | 1,620,000 | | | | 1,710,396 | |
Catawba County, 4.00% due 10/1/2016 | | AA-/Aa2 | | | 1,000,000 | | | | 1,083,840 | |
Catawba County, 4.00% due 10/1/2017 | | AA-/Aa2 | | | 1,000,000 | | | | 1,104,370 | |
Charlotte-Mecklenburg Hospital Authority, 5.00% due 1/15/2016 (Carolinas HealthCare System) | | AA-/Aa3 | | | 3,520,000 | | | | 3,795,933 | |
Charlotte-Mecklenburg Hospital Authority, 5.00% due 1/15/2017 (Carolinas HealthCare System) | | AA-/Aa3 | | | 2,000,000 | | | | 2,219,600 | |
Charlotte-Mecklenburg Hospital Authority, 4.00% due 1/15/2019 (Carolinas HealthCare System) | | AA-/Aa3 | | | 600,000 | | | | 664,632 | |
Charlotte-Mecklenburg Hospital Authority, 3.00% due 1/15/2021 (Carolinas HealthCare System) | | AA-/Aa3 | | | 1,595,000 | | | | 1,632,275 | |
Charlotte-Mecklenburg Hospital Authority, 4.00% due 1/15/2022 (Carolinas HealthCare System) | | AA-/Aa3 | | | 845,000 | | | | 914,070 | |
Charlotte-Mecklenburg Hospital Authority, 5.00% due 1/15/2023 (Carolinas HealthCare System) | | AA-/Aa3 | | | 1,400,000 | | | | 1,633,366 | |
Charlotte-Mecklenburg Hospital Authority, 5.00% due 1/15/2024 (Carolinas HealthCare System) | | AA-/Aa3 | | | 2,855,000 | | | | 3,290,587 | |
County of Buncombe, 5.00% due 6/1/2022 (Primary, Middle School & Community College Facilities) | | AA+/Aa2 | | | 1,000,000 | | | | 1,186,000 | |
County of Buncombe, 5.00% due 6/1/2023 (Primary, Middle School & Community College Facilities) | | AA+/Aa2 | | | 750,000 | | | | 891,915 | |
County of Buncombe, 5.00% due 6/1/2024 (Primary, Middle School & Community College Facilities) | | AA+/Aa2 | | | 600,000 | | | | 716,310 | |
County of Dare, 2.00% due 6/1/2014 (Educational Facility Capital Projects) | | AA-/Aa3 | | | 360,000 | | | | 361,116 | |
County of Dare, 4.00% due 6/1/2016 (Educational Facility Capital Projects) | | AA-/Aa3 | | | 500,000 | | | | 536,820 | |
County of Dare, 4.00% due 6/1/2017 (Educational Facility Capital Projects) | | AA-/Aa3 | | | 400,000 | | | | 438,028 | |
County of Dare, 4.00% due 6/1/2018 (Educational Facility Capital Projects) | | AA-/Aa3 | | | 425,000 | | | | 470,594 | |
County of Dare, 4.00% due 6/1/2019 (Educational Facility Capital Projects) | | AA-/Aa3 | | | 500,000 | | | | 554,200 | |
County of Dare, 4.00% due 6/1/2020 (Educational Facility Capital Projects) | | AA-/Aa3 | | | 765,000 | | | | 841,554 | |
County of Dare, 5.00% due 6/1/2021 (Educational Facility Capital Projects) | | AA-/Aa3 | | | 1,225,000 | | | | 1,429,085 | |
County of Dare, 4.00% due 6/1/2022 (Educational Facility Capital Projects) | | AA-/Aa3 | | | 490,000 | | | | 532,032 | |
County of Dare, 5.00% due 6/1/2024 (Educational Facility Capital Projects) | | AA-/Aa3 | | | 700,000 | | | | 807,709 | |
County of Mecklenburg GO, 4.00% due 8/1/2015 | | AAA/Aaa | | | 3,135,000 | | | | 3,295,543 | |
County of Randolph, 5.00% due 10/1/2020 | | A+/Aa3 | | | 500,000 | | | | 579,680 | |
County of Randolph, 5.00% due 10/1/2021 | | A+/Aa3 | | | 500,000 | | | | 580,645 | |
County of Randolph, 5.00% due 10/1/2021 | | A+/Aa3 | | | 1,065,000 | | | | 1,236,774 | |
County of Randolph, 5.00% due 10/1/2022 | | A+/Aa3 | | | 1,945,000 | | | | 2,265,089 | |
County of Randolph, 5.00% due 10/1/2023 | | A+/Aa3 | | | 400,000 | | | | 466,064 | |
County of Randolph, 5.00% due 10/1/2023 | | A+/Aa3 | | | 550,000 | | | | 640,838 | |
County of Wake, 5.00% due 6/1/2015 (Hammond Road Detention Center) | | AA+/Aa1 | | | 1,135,000 | | | | 1,197,119 | |
North Carolina Eastern Municipal Power Agency, 5.00% due 1/1/2016 (Insured: AMBAC) | | A-/NR | | | 1,700,000 | | | | 1,831,240 | |
North Carolina Eastern Municipal Power Agency, 6.00% due 1/1/2018 (Insured: AMBAC) | | NR/Baa1 | | | 7,500,000 | | | | 8,791,950 | |
North Carolina Eastern Municipal Power Agency, 6.00% due 1/1/2018 (Insured: BHAC/AMBAC) | | AA+/Aa1 | | | 5,965,000 | | | | 7,006,907 | |
North Carolina Eastern Municipal Power Agency, 5.25% due 1/1/2019 (Insured: AGM) | | AA/A3 | | | 3,105,000 | | | | 3,527,963 | |
North Carolina Eastern Municipal Power Agency, 5.00% due 1/1/2021 | | A-/Baa1 | | | 5,000,000 | | | | 5,795,350 | |
North Carolina Eastern Municipal Power Agency, 5.00% due 1/1/2022 | | A-/Baa1 | | | 4,715,000 | | | | 5,461,432 | |
North Carolina Municipal Power Agency, 5.25% due 1/1/2017 (Catawba Electric) | | A/A2 | | | 3,120,000 | | | | 3,492,310 | |
North Carolina Municipal Power Agency, 4.00% due 1/1/2018 (Catawba Electric) | | A/A2 | | | 15,000,000 | | | | 16,535,400 | |
North Carolina Municipal Power Agency, 5.00% due 1/1/2019 (Catawba Electric) | | A/A2 | | | 4,500,000 | | | | 5,203,710 | |
North Carolina Municipal Power Agency, 4.00% due 1/1/2020 (Catawba Electric) | | A/A2 | | | 1,550,000 | | | | 1,716,671 | |
North Carolina Municipal Power Agency, 5.00% due 1/1/2020 (Catawba Electric) | | A/A2 | | | 1,000,000 | | | | 1,161,570 | |
Certified Semi-Annual Report 35
| | |
| SCHEDULE OF INVESTMENTS, CONTINUED | | |
| |
Thornburg Limited Term Municipal Fund | | March 31, 2014 (Unaudited) |
| | | | | | | | | | |
Issuer-Description | | Credit Rating†
S&P/ Moody’s | | Principal
Amount | | | Value | |
North Carolina Municipal Power Agency, 4.00% due 1/1/2022 (Catawba Electric) | | A/A2 | | $ | 1,000,000 | | | $ | 1,091,790 | |
State of North Carolina, 4.00% due 11/1/2014 (State Capital Projects and Correctional Facilities) | | AA+/Aa1 | | | 2,000,000 | | | | 2,045,400 | |
State of North Carolina, 5.00% due 11/1/2019 (State Capital Projects and Correctional Facilities) | | AA+/Aa1 | | | 23,635,000 | | | | 27,877,246 | |
Winston-Salem State University, 4.00% due 4/1/2016 (Student Housing and Student Services Facilities) | | A/A3 | | | 640,000 | | | | 675,635 | |
Winston-Salem State University, 4.00% due 4/1/2017 (Student Housing and Student Services Facilities) | | A/A3 | | | 645,000 | | | | 688,802 | |
Winston-Salem State University, 5.00% due 4/1/2019 (Student Housing and Student Services Facilities) | | A/A3 | | | 815,000 | | | | 906,973 | |
Winston-Salem State University, 5.00% due 4/1/2022 (Student Housing and Student Services Facilities) | | A/A3 | | | 945,000 | | | | 1,049,800 | |
| | | |
NORTH DAKOTA — 0.06% | | | | | | | | | | |
County of Ward, 4.00% due 4/1/2020 (Insured: AGM) | | AA/A2 | | | 2,445,000 | | | | 2,644,292 | |
North Dakota Public Finance Authority, 4.00% due 6/1/2017 (City of Fargo Flood Mitigation Projects) | | AA/NR | | | 1,460,000 | | | | 1,596,890 | |
| | | |
OHIO — 3.64% | | | | | | | | | | |
Akron, Bath & Copley Joint Township Hospital District, 5.00% due 11/15/2021 (Children’s Hospital Medical Center) | | NR/A1 | | | 1,000,000 | | | | 1,127,630 | |
Allen County Hospital Facilities, 5.00% due 9/1/2015 (Catholic Healthcare Partners) | | AA-/A1 | | | 10,000,000 | | | | 10,640,700 | |
Allen County Hospital Facilities, 5.00% due 9/1/2016 (Catholic Healthcare Partners) | | AA-/A1 | | | 10,000,000 | | | | 11,000,600 | |
American Municipal Power, Inc., 5.25% due 2/15/2018 (AMP Combined Hydroelectric Projects) | | A/A3 | | | 5,500,000 | | | | 6,251,355 | |
American Municipal Power, Inc., 5.25% due 2/15/2019 (AMP Combined Hydroelectric Projects) | | A/A3 | | | 5,595,000 | | | | 6,389,658 | |
American Municipal Power, Inc., 5.00% due 2/15/2020 (AMP Fremont Energy Center) | | A/A1 | | | 1,865,000 | | | | 2,154,112 | |
American Municipal Power, Inc., 5.00% due 2/15/2021 (AMP Fremont Energy Center) | | A/A1 | | | 1,300,000 | | | | 1,497,600 | |
American Municipal Power, Inc., 5.00% due 2/15/2022 (AMP Fremont Energy Center) | | A/A1 | | | 2,750,000 | | | | 3,176,580 | |
Cincinnati City School District Board of Education GO, 5.25% due 12/1/2023 (Educational Facilities; Insured: Natl-Re) | | AA-/Aa2 | | | 1,465,000 | | | | 1,764,417 | |
City of Akron, 5.00% due 12/1/2021 (Community Learning Centers) | | AA+/NR | | | 4,120,000 | | | | 4,852,454 | |
City of Akron COP, 5.00% due 12/1/2014 (Canal Park Baseball Stadium; Insured: AGM) (ETM) | | AA/NR | | | 2,000,000 | | | | 2,063,960 | |
City of Akron GO, 5.00% due 12/1/2018 pre-refunded 12/1/2015 (Various Municipal Capital Projects; Insured: AMBAC) | | AA+/Aa3 | | | 2,425,000 | | | | 2,614,878 | |
City of Akron GO, 5.00% due 12/1/2019 (Various Municipal Capital Projects) | | AA-/NR | | | 1,685,000 | | | | 1,969,546 | |
City of Cleveland, 5.00% due 5/15/2014 (Police & Firemen’s Disability and Pension Fund) | | AA/NR | | | 1,000,000 | | | | 1,005,830 | |
City of Cleveland, 2.00% due 10/1/2014 (Public Facilities) | | AA/A1 | | | 855,000 | | | | 862,515 | |
City of Cleveland, 3.00% due 10/1/2016 (Public Facilities) | | AA/A1 | | | 690,000 | | | | 730,137 | |
City of Cleveland, 4.00% due 10/1/2018 (Parks & Recreation Facilities) | | AA/A1 | | | 500,000 | | | | 557,075 | |
City of Cleveland, 4.00% due 10/1/2019 (Public Facilities) | | AA/A1 | | | 600,000 | | | | 669,816 | |
City of Cleveland, 4.00% due 10/1/2019 (Parks & Recreation Facilities) | | AA/A1 | | | 520,000 | | | | 580,507 | |
City of Cleveland, 5.00% due 10/1/2020 (Public Facilities) | | AA/A1 | | | 510,000 | | | | 597,980 | |
City of Cleveland, 5.00% due 10/1/2020 (Parks & Recreation Facilities) | | AA/A1 | | | 545,000 | | | | 639,018 | |
City of Cleveland, 5.00% due 10/1/2021 (Parks & Recreation Facilities) | | AA/A1 | | | 570,000 | | | | 667,863 | |
City of Cleveland, 5.00% due 10/1/2022 (Public Facilities) | | AA/A1 | | | 905,000 | | | | 1,058,778 | |
City of Cleveland, 5.00% due 10/1/2022 (Parks & Recreation Facilities) | | AA/A1 | | | 600,000 | | | | 701,952 | |
City of Cleveland, 5.00% due 11/15/2022 (Parks & Recreation Facilities) | | AA/A1 | | | 1,030,000 | | | | 1,205,306 | |
City of Cleveland, 5.00% due 10/1/2023 (Public Facilities) | | AA/A1 | | | 1,155,000 | | | | 1,362,773 | |
City of Cleveland, 5.00% due 10/1/2023 (Parks & Recreation Facilities) | | AA/A1 | | | 630,000 | | | | 743,331 | |
City of Cleveland COP, 5.00% due 11/15/2016 (Cleveland Stadium) | | A/A2 | | | 2,200,000 | | | | 2,429,284 | |
City of Cleveland GO, 5.50% due 10/1/2019 (City Capital Projects; Insured: AMBAC) | | AA/A1 | | | 1,260,000 | | | | 1,485,704 | |
City of Columbus GO, 5.00% due 7/1/2014 | | AAA/Aaa | | | 1,000,000 | | | | 1,012,240 | |
City of Toledo, 5.00% due 11/15/2018 (Water System Improvements) | | AA-/Aa3 | | | 1,175,000 | | | | 1,365,973 | |
City of Toledo, 5.00% due 11/15/2019 (Water System Improvements) | | AA-/Aa3 | | | 2,260,000 | | | | 2,650,325 | |
City of Toledo, 5.00% due 11/15/2020 (Water System Improvements) | | AA-/Aa3 | | | 2,000,000 | | | | 2,346,520 | |
City of Toledo, 5.00% due 11/15/2021 (Water System Improvements) | | AA-/Aa3 | | | 2,000,000 | | | | 2,351,280 | |
City of Toledo, 5.00% due 11/15/2022 (Water System Improvements) | | AA-/Aa3 | | | 3,255,000 | | | | 3,813,753 | |
City of Toledo, 5.00% due 11/15/2023 (Water System Improvements) | | AA-/Aa3 | | | 1,750,000 | | | | 2,035,828 | |
Cleveland Package Facilities, 5.25% due 9/15/2021 (Insured: AGM) (ETM) | | AA/A2 | | | 965,000 | | | | 1,170,921 | |
Cleveland Package Facilities, 5.25% due 9/15/2021 (Insured: AGM) | | AA/A2 | | | 2,035,000 | | | | 2,326,107 | |
Cleveland State University, 5.00% due 6/1/2019 (Campus Capital Projects) | | A+/A1 | | | 1,000,000 | | | | 1,151,660 | |
Cleveland State University, 5.00% due 6/1/2020 (Campus Capital Projects) | | A+/A1 | | | 700,000 | | | | 806,652 | |
Cleveland State University, 5.00% due 6/1/2021 (Campus Capital Projects) | | A+/A1 | | | 1,000,000 | | | | 1,150,700 | |
Cleveland State University, 5.00% due 6/1/2022 (Campus Capital Projects) | | A+/A1 | | | 2,000,000 | | | | 2,297,080 | |
Cleveland-Cuyahoga County Port Authority, 5.00% due 10/1/2019 (Cleveland Museum of Art) | | AA+/NR | | | 2,000,000 | | | | 2,326,820 | |
County of Clermont, 2.00% due 8/1/2016 (Sanitary Sewer System) | | NR/Aa3 | | | 1,325,000 | | | | 1,360,788 | |
County of Clermont, 2.00% due 8/1/2016 (Water System ) | | NR/Aa3 | | | 1,855,000 | | | | 1,905,901 | |
County of Clermont, 4.00% due 8/1/2019 (Sanitary Sewer System) | | NR/Aa3 | | | 1,420,000 | | | | 1,558,109 | |
County of Franklin, 4.00% due 11/15/2033 put 8/1/2016 (OhioHealth Corp. Hospital Facilities) | | AA+/Aa2 | | | 3,235,000 | | | | 3,480,310 | |
County of Montgomery, 6.00% due 11/15/2028 pre-refunded 11/15/2014 (Miami Valley Hospital) | | NR/Aa3 | | | 2,030,000 | | | | 2,102,227 | |
a County of Montgomery, 6.25% due 11/15/2039 pre-refunded 11/15/2014 (Miami Valley Hospital) | | NR/Aa3 | | | 2,250,000 | | | | 2,333,543 | |
Deerfield Township, 5.00% due 12/1/2017 | | NR/A1 | | | 1,000,000 | | | | 1,104,830 | |
Franklin County Convention Facilities Authority, 4.50% due 12/1/2021 (Greater Columbus Convention Center; Insured: AMBAC) | | AA/Aaa | | | 1,000,000 | | | | 1,059,590 | |
Garfield Heights City School District GO, 5.375% due 12/15/2016 (School Improvements; Insured: Natl-Re) | | NR/A1 | | | 1,625,000 | | | | 1,799,054 | |
36 Certified Semi-Annual Report
| | |
| SCHEDULE OF INVESTMENTS, CONTINUED | | |
| |
Thornburg Limited Term Municipal Fund | | March 31, 2014 (Unaudited) |
| | | | | | | | | | |
Issuer-Description | | Credit Rating†
S&P/ Moody’s | | Principal
Amount | | | Value | |
Greater Cleveland Regional Transportation Authority GO, 5.00% due 12/1/2015 (Insured: Natl-Re) | | NR/Aa2 | | $ | 1,000,000 | | | $ | 1,074,470 | |
Kent State University, 5.00% due 5/1/2020 (Insured: AGM) | | AA/Aa3 | | | 1,000,000 | | | | 1,153,220 | |
Ohio State Air Quality Development Authority, 5.625% due 6/1/2018 (FirstEnergy Nuclear) | | BBB-/Baa2 | | | 5,000,000 | | | | 5,555,800 | |
Ohio State Air Quality Development Authority, 5.75% due 6/1/2033 put 12/1/2011 (FirstEnergy Nuclear) | | BBB-/Baa3 | | | 5,800,000 | | | | 6,219,108 | |
Ohio State Air Quality Development Authority, 3.375% due 1/1/2034 put 7/1/2015 (FirstEnergy Nuclear) | | BBB-/Baa3 | | | 7,200,000 | | | | 7,329,528 | |
Ohio State Air Quality Development Authority, 3.875% due 12/1/2038 put 6/1/2014 (Columbus Southern Power Co.) | | BBB/Baa1 | | | 4,800,000 | | | | 4,822,128 | |
Ohio State Building Authority, 5.00% due 10/1/2015 (Insured: Natl-Re) | | AA/Aa2 | | | 4,600,000 | | | | 4,927,658 | |
Ohio State Building Authority, 5.00% due 10/1/2020 | | AA/Aa2 | | | 1,700,000 | | | | 1,964,112 | |
Ohio State Department Administrative Services COP, 5.00% due 9/1/2015 (Insured: Natl-Re) | | AA/Aa2 | | | 1,950,000 | | | | 2,033,460 | |
Ohio State Water Development Authority PCR, 5.875% due 6/1/2033 put 6/1/2016 (FirstEnergy Nuclear Generation Corp.) | | BBB-/Baa2 | | | 5,500,000 | | | | 5,937,525 | |
Ohio State Water Development Authority PCR, 3.375% due 1/1/2034 put 7/1/2015 (FirstEnergy Nuclear Generation Corp.) | | BBB-/Baa3 | | | 24,400,000 | | | | 24,878,484 | |
Penta Career Center COP, 4.00% due 4/1/2017 (School District Facilities Project) | | NR/Aa3 | | | 1,550,000 | | | | 1,674,186 | |
RiverSouth Authority, 5.00% due 12/1/2016 (RiverSouth Area Redevelopment) | | AA+/Aa2 | | | 2,380,000 | | | | 2,548,004 | |
RiverSouth Authority, 5.00% due 12/1/2019 (RiverSouth Area Redevelopment) | | AA+/Aa2 | | | 2,500,000 | | | | 2,879,975 | |
State of Ohio, 4.00% due 12/15/2018 (Major New Street Infrastructure Project) | | AA/Aa2 | | | 1,000,000 | | | | 1,117,570 | |
State of Ohio, 4.00% due 12/15/2019 (Major New Street Infrastructure Project) | | AA/Aa2 | | | 1,000,000 | | | | 1,118,320 | |
State of Ohio, 5.00% due 10/1/2020 (Cultural and Sports Capital Facilities) | | AA/Aa2 | | | 3,845,000 | | | | 4,447,665 | |
State of Ohio, 5.00% due 12/15/2020 (Major New Street Infrastructure Project) | | AA/Aa2 | | | 1,000,000 | | | | 1,175,130 | |
State of Ohio, 5.00% due 12/15/2021 (Major New Street Infrastructure Project) | | AA/Aa2 | | | 2,500,000 | | | | 2,939,175 | |
State of Ohio GO, 4.00% due 10/1/2014 (Revitalization Project) (ETM) | | AA-/NR | | | 2,075,000 | | | | 2,114,695 | |
a State of Ohio GO, 5.00% due 8/1/2015 (Educational Facilities Projects) | | AA+/Aa1 | | | 5,000,000 | | | | 5,321,950 | |
State of Ohio GO, 5.00% due 8/1/2015 (Higher Education Facility Projects) | | AA+/Aa1 | | | 6,010,000 | | | | 6,396,984 | |
State of Ohio GO, 5.50% due 9/15/2019 (Common Schools Capital Facilities) | | AA+/Aa1 | | | 4,150,000 | | | | 4,995,147 | |
State of Ohio Higher Educational Facility Commission, 5.05% due 7/1/2037 pre-refunded 7/1/2016 (Kenyon College) | | A+/A1 | | | 3,500,000 | | | | 3,860,010 | |
University of Akron Ohio, 5.00% due 1/1/2018 (Insured: AGM) | | AA/A1 | | | 3,415,000 | | | | 3,886,714 | |
Youngstown City School District GO, 3.00% due 12/1/2015 (Educational Facilities) (State Aid Withholding) | | NR/Aa2 | | | 1,000,000 | | | | 1,039,620 | |
Youngstown City School District GO, 3.00% due 12/1/2016 (Educational Facilities) (State Aid Withholding) | | NR/Aa2 | | | 1,440,000 | | | | 1,520,467 | |
Youngstown City School District GO, 4.00% due 12/1/2017 (Educational Facilities) (State Aid Withholding) | | NR/Aa2 | | | 1,480,000 | | | | 1,625,765 | |
Youngstown City School District GO, 4.00% due 12/1/2018 (Educational Facilities) (State Aid Withholding) | | NR/Aa2 | | | 1,545,000 | | | | 1,714,116 | |
Youngstown City School District GO, 4.00% due 12/1/2019 (Educational Facilities) (State Aid Withholding) | | NR/Aa2 | | | 1,605,000 | | | | 1,783,669 | |
Youngstown City School District GO, 4.00% due 12/1/2020 (Educational Facilities) (State Aid Withholding) | | NR/Aa2 | | | 1,670,000 | | | | 1,844,732 | |
Youngstown City School District GO, 4.00% due 12/1/2021 (Educational Facilities) (State Aid Withholding) | | NR/Aa2 | | | 1,735,000 | | | | 1,878,033 | |
Youngstown City School District GO, 4.00% due 12/1/2022 (Educational Facilities) (State Aid Withholding) | | NR/Aa2 | | | 1,805,000 | | | | 1,926,097 | |
Youngstown City School District GO, 4.00% due 12/1/2023 (Educational Facilities) (State Aid Withholding) | | NR/Aa2 | | | 1,700,000 | | | | 1,790,389 | |
| | | |
OKLAHOMA — 1.39% | | | | | | | | | | |
Canadian County Educational Facilities Authority, 4.00% due 9/1/2019 (Mustang Public Schools) | | A+/NR | | | 1,410,000 | | | | 1,530,076 | |
Canadian County Educational Facilities Authority, 4.50% due 9/1/2020 (Mustang Public Schools) | | A+/NR | | | 2,690,000 | | | | 2,969,491 | |
Canadian County Educational Facilities Authority, 4.50% due 9/1/2021 (Mustang Public Schools) | | A+/NR | | | 2,290,000 | | | | 2,516,824 | |
Cleveland County ISD No. 29 GO, 1.50% due 3/1/2017 (Norman School District) | | NR/Aa2 | | | 3,630,000 | | | | 3,709,533 | |
Comanche County Hospital Authority, 5.25% due 7/1/2015 (Insured: Radian) | | BBB-/NR | | | 1,340,000 | | | | 1,393,788 | |
Oklahoma County Finance Authority, 3.00% due 9/1/2015 (Western Heights Public Schools) | | A+/NR | | | 375,000 | | | | 386,685 | |
Oklahoma County Finance Authority, 5.00% due 9/1/2016 (Western Heights Public Schools) | | A+/NR | | | 3,000,000 | | | | 3,289,560 | |
Oklahoma County Finance Authority, 5.00% due 9/1/2017 (Western Heights Public Schools) | | A+/NR | | | 4,075,000 | | | | 4,570,357 | |
Oklahoma County Finance Authority, 4.00% due 9/1/2018 (Western Heights Public Schools) | | A+/NR | | | 250,000 | | | | 271,355 | |
Oklahoma County Finance Authority, 5.00% due 9/1/2018 (Western Heights Public Schools) | | A+/NR | | | 2,120,000 | | | | 2,414,744 | |
Oklahoma County Finance Authority, 5.00% due 9/1/2020 (Western Heights Public Schools) | | A+/NR | | | 2,000,000 | | | | 2,250,840 | |
Oklahoma County ISD No. 1 GO, 1.00% due 1/1/2016 | | A+/NR | | | 4,075,000 | | | | 4,114,731 | |
Oklahoma DFA, 5.00% due 8/15/2017 (INTEGRIS Health) | | AA-/Aa3 | | | 4,375,000 | | | | 4,934,475 | |
Oklahoma DFA, 5.00% due 8/15/2018 (INTEGRIS Health) | | AA-/Aa3 | | | 500,000 | | | | 573,910 | |
Oklahoma DFA, 0.07% due 8/15/2033 put 4/1/2014 (INTEGRIS Health; Insured: AGM; SPA: JPMorgan Chase Bank) (daily demand notes) | | AA/Aa3 | | | 37,000,000 | | | | 37,000,000 | |
a Oklahoma State Industrial Authority, 5.00% due 7/1/2016 (Medical Research Foundation) | | NR/A1 | | | 1,165,000 | | | | 1,265,132 | |
Oklahoma State Industrial Authority, 5.25% due 7/1/2017 (Medical Research Foundation) | | NR/A1 | | | 1,075,000 | | | | 1,204,204 | |
Tulsa County Industrial Authority, 4.50% due 9/1/2020 (Broken Arrow Public Schools) | | AA-/NR | | | 1,585,000 | | | | 1,796,899 | |
Tulsa County Industrial Authority, 4.50% due 9/1/2021 (Broken Arrow Public Schools) | | AA-/NR | | | 8,775,000 | | | | 9,922,243 | |
Tulsa County ISD No. 3 GO, 2.00% due 4/1/2015 (Broken Arrow School District) | | AA/NR | | | 2,000,000 | | | | 2,036,960 | |
Tulsa County ISD No. 3 GO, 2.00% due 4/1/2016 (Broken Arrow School District) | | AA/NR | | | 1,725,000 | | | | 1,776,785 | |
Tulsa Parking Authority, 3.00% due 7/1/2017 | | AA-/NR | | | 1,470,000 | | | | 1,554,554 | |
| | | |
OREGON — 0.18% | | | | | | | | | | |
Clackamas County, 5.00% due 7/15/2037 put 7/15/2014 (Legacy Health System) | | A+/A1 | | | 6,465,000 | | | | 6,553,312 | |
Oregon Facilities Authority, 5.00% due 3/15/2015 (Legacy Health System) | | A+/A1 | | | 1,635,000 | | | | 1,701,381 | |
Oregon Facilities Authority, 5.00% due 3/15/2016 (Legacy Health System) | | A+/A1 | | | 1,000,000 | | | | 1,078,190 | |
Oregon Facilities Authority, 4.50% due 3/15/2018 (Legacy Health System) | | A+/A1 | | | 1,100,000 | | | | 1,215,005 | |
Oregon State Department of Administrative Services COP, 5.00% due 11/1/2014 (Insured: Natl-Re) | | AA/Aa2 | | | 1,000,000 | | | | 1,028,590 | |
Certified Semi-Annual Report 37
| | |
| SCHEDULE OF INVESTMENTS, CONTINUED | | |
| |
Thornburg Limited Term Municipal Fund | | March 31, 2014 (Unaudited) |
| | | | | | | | | | |
Issuer-Description | | Credit Rating†
S&P/ Moody’s | | Principal
Amount | | | Value | |
PENNSYLVANIA — 3.82% | | | | | | | | | | |
Adams County IDA, 5.00% due 8/15/2014 (Gettysburg College) | | A/A2 | | $ | 1,000,000 | | | $ | 1,017,080 | |
Adams County IDA, 5.00% due 8/15/2016 (Gettysburg College) | | A/A2 | | | 1,250,000 | | | | 1,372,588 | |
Adams County IDA, 5.00% due 8/15/2017 (Gettysburg College) | | A/A2 | | | 1,340,000 | | | | 1,509,215 | |
Adams County IDA, 5.00% due 8/15/2019 (Gettysburg College) | | A/A2 | | | 1,765,000 | | | | 2,036,404 | |
Allegheny County Hospital Development Authority, 5.00% due 6/15/2017 (University of Pittsburgh Medical Center) | | A+/Aa3 | | | 3,000,000 | | | | 3,372,420 | |
Allegheny County Hospital Development Authority, 5.00% due 9/1/2017 (University of Pittsburgh Medical Center) | | A+/Aa3 | | | 1,875,000 | | | | 2,117,006 | |
Allegheny County Hospital Development Authority, 5.00% due 5/15/2018 (University of Pittsburgh Medical Center) | | A+/Aa3 | | | 5,915,000 | | | | 6,742,863 | |
Allegheny County Hospital Development Authority, 5.00% due 6/15/2018 (University of Pittsburgh Medical Center) | | A+/Aa3 | | | 3,310,000 | | | | 3,791,737 | |
Allegheny County Hospital Development Authority, 5.00% due 9/1/2018 (University of Pittsburgh Medical Center) | | A+/Aa3 | | | 2,100,000 | | | | 2,412,228 | |
Allegheny County Redevelopment Authority, 5.10% due 7/1/2014 (Pittsburgh Mills) | | NR/NR | | | 465,000 | | | | 469,762 | |
Altoona Area School District GO, 3.25% due 12/1/2016 (Insured: AGM) (State Aid Withholding) | | AA/NR | | | 1,475,000 | | | | 1,563,161 | |
Altoona Area School District GO, 3.00% due 12/1/2022 (Insured: AGM) (State Aid Withholding) | | AA/NR | | | 1,335,000 | | | | 1,331,409 | |
Athens Area School District GO, 2.00% due 4/15/2016 (Insured: AGM) (State Aid Withholding) | | NR/A1 | | | 470,000 | | | | 483,174 | |
Athens Area School District GO, 3.00% due 4/15/2018 (Insured: AGM) (State Aid Withholding) | | NR/A1 | | | 2,600,000 | | | | 2,764,554 | |
Athens Area School District GO, 3.00% due 4/15/2019 (Insured: AGM) (State Aid Withholding) | | NR/A1 | | | 2,680,000 | | | | 2,812,472 | |
Chester County School Authority, 5.00% due 4/1/2016 (Intermediate School; Insured: AMBAC) | | A+/NR | | | 1,915,000 | | | | 2,033,941 | |
City of Philadelphia, 5.00% due 6/15/2017 (Water and Wastewater System; Insured: AGM) | | AA/A1 | | | 5,570,000 | | | | 6,297,108 | |
City of Philadelphia, 5.00% due 7/1/2022 pre-refunded 7/1/2015 (Water and Wastewater System; Insured: AGM) | | AA/A1 | | | 1,155,000 | | | | 1,223,873 | |
City of Philadelphia Gas Works, 5.375% due 7/1/2014 (Richmond LNG Plant; Insured: AGM) | | AA/A2 | | | 7,280,000 | | | | 7,370,927 | |
City of Philadelphia Gas Works, 5.00% due 9/1/2014 (Insured: AGM) | | AA/A2 | | | 3,000,000 | | | | 3,057,210 | |
City of Philadelphia Gas Works, 5.00% due 10/1/2014 (Insured: AMBAC) | | BBB+/Baa2 | | | 1,925,000 | | | | 1,967,023 | |
City of Philadelphia Gas Works, 5.00% due 9/1/2015 (Insured: AGM) | | AA/A2 | | | 3,315,000 | | | | 3,374,703 | |
City of Philadelphia Gas Works, 5.00% due 10/1/2017 (Insured: AMBAC) | | BBB+/Baa2 | | | 400,000 | | | | 445,744 | |
City of Philadelphia Gas Works, 5.00% due 7/1/2018 (Insured: AGM) | | AA/A2 | | | 1,395,000 | | | | 1,582,948 | |
City of Pittsburgh GO, 5.50% due 9/1/2014 (Insured: AMBAC) | | A+/A1 | | | 460,000 | | | | 469,554 | |
City of Pittsburgh GO, 5.25% due 9/1/2016 (Insured: AGM) | | AA/A1 | | | 3,030,000 | | | | 3,343,544 | |
City of Pittsburgh GO, 5.25% due 9/1/2017 (Insured: AGM) | | AA/A1 | | | 2,210,000 | | | | 2,450,116 | |
City of Pittsburgh GO, 5.25% due 9/1/2018 (Insured: AGM) | | AA/A1 | | | 3,240,000 | | | | 3,589,175 | |
Commonwealth of Pennsylvania GO, 5.00% due 10/1/2022 | | AA/Aa2 | | | 575,000 | | | | 633,685 | |
Commonwealth of Pennsylvania State Public School Building Authority, 5.00% due 10/1/2016 (Harrisburg Area Community College Project) | | A-/NR | | | 1,390,000 | | | | 1,510,179 | |
County of Allegheny GO, 5.00% due 11/1/2019 (Insured: Natl-Re) | | AA-/A1 | | | 1,260,000 | | | | 1,291,979 | |
County of Lehigh GO, 4.00% due 11/15/2014 | | NR/Aa1 | | | 3,190,000 | | | | 3,267,007 | |
Cumberland Valley School District GO, 5.00% due 11/15/2018 (Insured: AGM) (State Aid Withholding) | | NR/Aa3 | | | 3,590,000 | | | | 3,851,603 | |
Economy Borough Municipal Authority, 3.00% due 12/15/2014 (Beaver County Sewer System; Insured: BAM) | | AA/NR | | | 330,000 | | | | 336,016 | |
Economy Borough Municipal Authority, 3.00% due 12/15/2016 (Beaver County Sewer System; Insured: BAM) | | AA/NR | | | 505,000 | | | | 533,134 | |
Economy Borough Municipal Authority, 3.00% due 12/15/2018 (Beaver County Sewer System; Insured: BAM) | | AA/NR | | | 435,000 | | | | 459,752 | |
Economy Borough Municipal Authority, 4.00% due 12/15/2020 (Beaver County Sewer System; Insured: BAM) | | AA/NR | | | 605,000 | | | | 659,589 | |
Economy Borough Municipal Authority, 4.00% due 12/15/2022 (Beaver County Sewer System; Insured: BAM) | | AA/NR | | | 1,180,000 | | | | 1,269,503 | |
Geisinger Authority Montour County, 0.07% due 6/1/2041 put 4/1/2014 (Geisinger Health System; SPA: JPMorgan Chase Bank) (daily demand notes) | | AA/Aa2 | | | 6,480,000 | | | | 6,480,013 | |
Geisinger Authority Montour County, 0.07% due 6/1/2041 put 4/1/2014 (Geisinger Health System; SPA: JPMorgan Chase Bank) (daily demand notes) | | AA/Aa2 | | | 7,695,000 | | | | 7,695,018 | |
Lancaster County Solid Waste Management Authority, 5.00% due 12/15/2023 (Harrisburg Resource Recovery Facility) | | AA-/NR | | | 2,680,000 | | | | 3,047,321 | |
Lancaster County Solid Waste Management Authority, 5.25% due 12/15/2024 (Harrisburg Resource Recovery Facility) | | AA-/NR | | | 4,000,000 | | | | 4,591,520 | |
Monroeville Finance Authority, 5.00% due 2/15/2021 (University of Pittsburgh Medical Center) | | A+/Aa3 | | | 2,400,000 | | | | 2,756,448 | |
Monroeville Finance Authority, 5.00% due 2/15/2022 (University of Pittsburgh Medical Center) | | A+/Aa3 | | | 1,250,000 | | | | 1,431,650 | |
Montgomery County Higher Education & Health Authority, 5.00% due 6/1/2022 (Abington Memorial Hospital) | | A/NR | | | 3,000,000 | | | | 3,382,230 | |
Montgomery County IDA, 5.00% due 8/1/2016 (Regional Medical Center; Insured: FHA) | | AA/Aa2 | | | 1,000,000 | | | | 1,098,720 | |
Montgomery County IDA, 5.00% due 2/1/2017 (Regional Medical Center; Insured: FHA) | | AA/Aa2 | | | 1,000,000 | | | | 1,110,050 | |
Montgomery County IDA, 5.00% due 2/1/2020 (Regional Medical Center; Insured: FHA) | | AA/Aa2 | | | 1,000,000 | | | | 1,146,310 | |
Northampton Borough Municipal Authority, 4.00% due 5/15/2021 (Water System; Insured: AGM) | | NR/A1 | | | 500,000 | | | | 530,640 | |
Northampton Borough Municipal Authority, 4.00% due 5/15/2022 (Water System; Insured: AGM) | | NR/A1 | | | 1,185,000 | | | | 1,248,919 | |
Northampton Borough Municipal Authority, 3.00% due 5/15/2023 (Water System; Insured: AGM) | | NR/A1 | | | 1,255,000 | | | | 1,222,219 | |
Norwin School District GO, 4.00% due 4/1/2018 (Insured: AGM) (State Aid Withholding) | | AA/A1 | | | 1,835,000 | | | | 2,011,362 | |
Pennsylvania Economic Development Financing Authority, 5.00% due 7/1/2016 (Pennsylvania Dept. of Labor and Industry) | | AA+/Aaa | | | 10,000,000 | | | | 11,031,700 | |
Pennsylvania Economic Development Financing Authority, 3.70% due 11/1/2021 put 5/1/2015 (Waste Management, Inc.) | | A-/NR | | | 7,750,000 | | | | 7,993,582 | |
Pennsylvania Economic Development Financing Authority, 1.75% due 12/1/2033 put 12/1/2015 (Waste Management, Inc.) | | A-/NR | | | 2,000,000 | | | | 2,032,060 | |
Pennsylvania Economic Development Financing Authority, 3.00% due 12/1/2037 put 9/1/2015 (PPL Energy Supply) | | BBB/NR | | | 14,000,000 | | | | 14,297,640 | |
Pennsylvania Higher Educational Facilities Authority, 5.00% due 6/1/2015 pre-refunded 6/1/2014 (Philadelphia University) | | BBB/Baa2 | | | 985,000 | | | | 992,969 | |
Pennsylvania Higher Educational Facilities Authority, 5.00% due 5/15/2019 (University of Pittsburgh Medical Center) | | A+/Aa3 | | | 5,600,000 | | | | 6,457,864 | |
Pennsylvania Higher Educational Facilities Authority, 5.00% due 5/15/2020 (University of Pittsburgh Medical Center) | | A+/Aa3 | | | 5,100,000 | | | | 5,886,267 | |
Pennsylvania Higher Educational Facilities Authority, 4.00% due 10/1/2022 (Shippensburg University Student Services, Inc. Student Housing) | | BBB-/Baa3 | | | 1,825,000 | | | | 1,808,137 | |
Pennsylvania Higher Educational Facilities Authority, 5.00% due 11/1/2023 (Saint Joseph’s University) | | A-/NR | | | 1,075,000 | | | | 1,185,650 | |
38 Certified Semi-Annual Report
| | |
| SCHEDULE OF INVESTMENTS, CONTINUED | | |
| |
Thornburg Limited Term Municipal Fund | | March 31, 2014 (Unaudited) |
| | | | | | | | | | |
Issuer-Description | | Credit Rating†
S&P/ Moody’s | | Principal
Amount | | | Value | |
Philadelphia Authority for Industrial Development, 5.00% due 8/1/2020 (Mast Charter School) | | BBB+/NR | | $ | 685,000 | | | $ | 708,112 | |
Philadelphia Parking Authority, 5.00% due 9/1/2016 | | A/A1 | | | 1,500,000 | | | | 1,636,830 | |
Philadelphia Parking Authority, 5.00% due 9/1/2017 | | A/A1 | | | 1,020,000 | | | | 1,137,351 | |
Philadelphia School District GO, 4.50% due 9/1/2017 (State Aid Withholding) | | A+/Aa3 | | | 2,270,000 | | | | 2,487,693 | |
Philadelphia School District GO, 5.00% due 9/1/2019 (State Aid Withholding) | | A+/Aa3 | | | 4,210,000 | | | | 4,783,191 | |
Philadelphia School District GO, 5.00% due 9/1/2019 (State Aid Withholding) | | A+/Aa3 | | | 18,410,000 | | | | 20,916,521 | |
Philadelphia School District GO, 5.25% due 9/1/2021 (State Aid Withholding) | | A+/Aa3 | | | 2,265,000 | | | | 2,555,667 | |
Pittsburgh Water & Sewer Authority, 5.00% due 9/1/2023 | | A/A2 | | | 2,520,000 | | | | 2,886,181 | |
Pittsburgh Water & Sewer Authority, 5.00% due 9/1/2024 | | A/A2 | | | 7,365,000 | | | | 8,437,344 | |
Pittsburgh Water & Sewer Authority, 5.00% due 9/1/2024 | | A/A2 | | | 2,395,000 | | | | 2,743,712 | |
Plum Borough School District GO, 2.00% due 9/15/2014 (Insured: BAM) (State Aid Withholding) | | AA/NR | | | 1,000,000 | | | | 1,007,120 | |
Plum Borough School District GO, 2.00% due 9/15/2015 (Insured: BAM) (State Aid Withholding) | | AA/NR | | | 850,000 | | | | 868,029 | |
Plum Borough School District GO, 3.00% due 9/15/2016 (Insured: BAM) (State Aid Withholding) | | AA/NR | | | 750,000 | | | | 789,368 | |
Plum Borough School District GO, 3.00% due 9/15/2017 (Insured: BAM) (State Aid Withholding) | | AA/NR | | | 240,000 | | | | 254,916 | |
Plum Borough School District GO, 4.00% due 9/15/2018 (Insured: BAM) (State Aid Withholding) | | AA/NR | | | 740,000 | | | | 816,871 | |
Plum Borough School District GO, 4.00% due 9/15/2019 (Insured: BAM) (State Aid Withholding) | | AA/NR | | | 390,000 | | | | 429,421 | |
Plum Borough School District GO, 4.00% due 9/15/2019 (Insured: BAM) (State Aid Withholding) | | AA/NR | | | 395,000 | | | | 434,927 | |
Plum Borough School District GO, 4.00% due 9/15/2019 (Insured: BAM) (State Aid Withholding) | | AA/NR | | | 1,205,000 | | | | 1,326,801 | |
Plum Borough School District GO, 4.00% due 9/15/2020 (Insured: BAM) (State Aid Withholding) | | AA/NR | | | 1,455,000 | | | | 1,591,537 | |
Plum Borough School District GO, 4.00% due 9/15/2021 (Insured: BAM) (State Aid Withholding) | | AA/NR | | | 1,610,000 | | | | 1,749,667 | |
Plum Borough School District GO, 5.00% due 9/15/2022 (Insured: BAM) (State Aid Withholding) | | AA/NR | | | 1,410,000 | | | | 1,625,702 | |
Plum Borough School District GO, 5.00% due 9/15/2023 (Insured: BAM) (State Aid Withholding) | | AA/NR | | | 1,495,000 | | | | 1,716,365 | |
Plum Borough School District GO, 5.00% due 9/15/2023 (Insured: BAM) (State Aid Withholding) | | AA/NR | | | 470,000 | | | | 539,593 | |
Plum Borough School District GO, 5.00% due 9/15/2024 (Insured: BAM) (State Aid Withholding) | | AA/NR | | | 1,885,000 | | | | 2,138,419 | |
Saint Mary Hospital Authority, 5.00% due 11/15/2021 (Catholic Health East Issue) | | AA-/Aa2 | | | 2,900,000 | | | | 2,973,979 | |
School District of Pittsburgh GO, 5.50% due 9/1/2016 (Insured: AGM) (State Aid Withholding) | | AA/Aa3 | | | 4,000,000 | | | | 4,453,080 | |
School District of the City of Erie GO, 0% due 5/1/2014 (Insured: Natl-Re) (State Aid Withholding) (ETM) | | AA-/Baa1 | | | 1,100,000 | | | | 1,099,879 | |
Wayne County Hospital and HFA, 2.00% due 7/1/2016 (Wayne Memorial Hospital; Insured: AGM) | | AA/NR | | | 500,000 | | | | 511,880 | |
Wayne County Hospital and HFA, 2.00% due 7/1/2017 (Wayne Memorial Hospital; Insured: AGM) | | AA/NR | | | 1,000,000 | | | | 1,020,590 | |
Wayne County Hospital and HFA, 2.00% due 7/1/2018 (Wayne Memorial Hospital; Insured: AGM) | | AA/NR | | | 625,000 | | | | 633,163 | |
Wayne County Hospital and HFA, 3.00% due 7/1/2019 (Wayne Memorial Hospital; Insured: AGM) | | AA/NR | | | 1,185,000 | | | | 1,234,012 | |
West Mifflin Area School District GO, 3.70% due 10/1/2015
(Insured: AGM) (State Aid Withholding) | | AA/A2 | | | 2,210,000 | | | | 2,321,671 | |
| | | |
RHODE ISLAND — 1.78% | | | | | | | | | | |
Rhode Island Clean Water Finance Agency, 5.00% due 10/1/2018 (Public Drinking Water Supply or Treatment Facilities) | | AAA/NR | | | 870,000 | | | | 1,011,688 | |
Rhode Island Clean Water Finance Agency, 5.00% due 10/1/2019 (Public Drinking Water Supply or Treatment Facilities) | | AAA/NR | | | 1,250,000 | | | | 1,473,600 | |
Rhode Island Clean Water Finance Agency, 5.00% due 10/1/2020 (Public Drinking Water Supply or Treatment Facilities) | | AAA/NR | | | 1,300,000 | | | | 1,539,850 | |
Rhode Island Clean Water Finance Agency, 5.00% due 10/1/2021 (Public Drinking Water Supply or Treatment Facilities) | | AAA/NR | | | 2,000,000 | | | | 2,379,520 | |
Rhode Island Clean Water Finance Agency, 5.00% due 10/1/2022 (Public Drinking Water Supply or Treatment Facilities) | | AAA/NR | | | 2,280,000 | | | | 2,725,626 | |
Rhode Island Clean Water Finance Agency, 5.00% due 10/1/2023 (Public Drinking Water Supply or Treatment Facilities) | | AAA/NR | | | 2,380,000 | | | | 2,853,644 | |
Rhode Island Convention Center Authority, 5.25% due 5/15/2015 (Convention Center and Parking Projects; Insured: Natl-Re) | | AA-/Baa1 | | | 765,000 | | | | 776,506 | |
Rhode Island Convention Center Authority, 5.00% due 5/15/2018 (Convention Center and Parking Projects) | | AA-/Aa3 | | | 5,365,000 | | | | 6,123,396 | |
Rhode Island Convention Center Authority, 5.00% due 5/15/2019 (Convention Center and Parking Projects) | | AA-/Aa3 | | | 7,310,000 | | | | 8,394,000 | |
Rhode Island Convention Center Authority, 5.00% due 5/15/2020 (Convention Center and Parking Projects) | | AA-/Aa3 | | | 5,890,000 | | | | 6,767,846 | |
Rhode Island Convention Center Authority, 5.00% due 5/15/2021 (Convention Center and Parking Projects; Insured: AGM) | | AA/Aa3 | | | 2,000,000 | | | | 2,096,240 | |
Rhode Island Economic Development Corp., 5.00% due 6/15/2014 (RIDOT Transit Improvements; Insured: AGM) | | AA/A1 | | | 2,000,000 | | | | 2,008,040 | |
Rhode Island Health & Educational Building Corp., 4.00% due 9/15/2015 (University of Rhode Island Auxiliary Enterprise) | | A+/A1 | | | 500,000 | | | | 525,010 | |
Rhode Island Health & Educational Building Corp., 5.00% due 9/15/2020 (University of Rhode Island Auxiliary Enterprise) | | A+/A1 | | | 750,000 | | | | 863,018 | |
Rhode Island Health & Educational Building Corp., 5.00% due 9/15/2023 (University of Rhode Island Auxiliary Enterprise) | | A+/A1 | | | 1,400,000 | | | | 1,604,834 | |
State of Rhode Island and Providence Plantations, 5.00% due 10/1/2014 (Department of Children, Youth, and Families; Insured: MBIA) (ETM) | | AA-/Aa3 | | | 1,000,000 | | | | 1,024,030 | |
State of Rhode Island and Providence Plantations COP, 5.00% due 10/1/2015 (Shepard’s Building; Insured: AGM) | | AA/Aa3 | | | 800,000 | | | | 853,608 | |
State of Rhode Island and Providence Plantations COP, 5.00% due 10/1/2019 (Kent County Courthouse) | | AA-/Aa3 | | | 600,000 | | | | 689,244 | |
State of Rhode Island and Providence Plantations COP, 5.00% due 10/1/2019 (Training School Project) | | AA-/Aa3 | | | 1,575,000 | | | | 1,809,265 | |
State of Rhode Island and Providence Plantations COP, 5.00% due 10/1/2020 (Kent County Courthouse) | | AA-/Aa3 | | | 1,375,000 | | | | 1,570,071 | |
State of Rhode Island and Providence Plantations COP, 5.00% due 10/1/2020 (Training School Project) | | AA-/Aa3 | | | 1,405,000 | | | | 1,604,327 | |
State of Rhode Island and Providence Plantations COP, 5.00% due 10/1/2021 (Kent County Courthouse) | | AA-/Aa3 | | | 2,000,000 | | | | 2,289,240 | |
State of Rhode Island and Providence Plantations COP, 5.00% due 10/1/2021 (Training School Project) | | AA-/Aa3 | | | 3,540,000 | | | | 4,051,955 | |
State of Rhode Island and Providence Plantations COP, 5.00% due 4/1/2022 (Energy Conservation Project) | | AA-/Aa3 | | | 2,020,000 | | | | 2,310,153 | |
State of Rhode Island and Providence Plantations COP, 5.00% due 10/1/2022 (Kent County Courthouse) | | AA-/Aa3 | | | 2,100,000 | | | | 2,404,584 | |
State of Rhode Island and Providence Plantations COP, 5.00% due 10/1/2022 (Training School Project) | | AA-/Aa3 | | | 3,620,000 | | | | 4,145,045 | |
State of Rhode Island and Providence Plantations COP, 5.00% due 10/1/2023 (Kent County Courthouse) | | AA-/Aa3 | | | 1,500,000 | | | | 1,715,715 | |
State of Rhode Island and Providence Plantations COP, 5.00% due 10/1/2023 (Training School Project) | | AA-/Aa3 | | | 1,705,000 | | | | 1,950,196 | |
State of Rhode Island and Providence Plantations GO, 5.00% due 10/1/2019 (Consolidated Capital Development Loan) | | AA/Aa2 | | | 5,000,000 | | | | 5,871,350 | |
State of Rhode Island and Providence Plantations GO, 5.00% due 8/1/2020 (Consolidated Capital Development Loan) | | AA/Aa2 | | | 8,365,000 | | | | 9,781,445 | |
State of Rhode Island and Providence Plantations GO, 4.00% due 10/15/2020 (Consolidated Capital Development Loan) | | AA/Aa2 | | | 1,200,000 | | | | 1,337,604 | |
Certified Semi-Annual Report 39
| | |
| SCHEDULE OF INVESTMENTS, CONTINUED | | |
| |
Thornburg Limited Term Municipal Fund | | March 31, 2014 (Unaudited) |
| | | | | | | | | | |
Issuer-Description | | Credit Rating†
S&P/ Moody’s | | Principal
Amount | | | Value | |
State of Rhode Island and Providence Plantations GO, 5.00% due 8/1/2021 (Consolidated Capital Development Loan) | | AA/Aa2 | | $ | 16,535,000 | | | $ | 19,370,422 | |
State of Rhode Island and Providence Plantations GO, 4.00% due 10/15/2021 (Consolidated Capital Development Loan) | | AA/Aa2 | | | 1,000,000 | | | | 1,106,420 | |
State of Rhode Island and Providence Plantations GO, 5.00% due 8/1/2022 (Consolidated Capital Development Loan) | | AA/Aa2 | | | 9,825,000 | | | | 11,549,779 | |
State of Rhode Island and Providence Plantations GO, 4.00% due 10/15/2022 (Consolidated Capital Development Loan) | | AA/Aa2 | | | 1,000,000 | | | | 1,104,000 | |
| | | |
SOUTH CAROLINA — 0.70% | | | | | | | | | | |
Berkeley County School District, 5.00% due 12/1/2020 (School Facility Equipment Acquisition) | | A+/NR | | | 550,000 | | | | 630,014 | |
Berkeley County School District, 5.00% due 12/1/2021 (School Facility Equipment Acquisition) | | A+/NR | | | 1,000,000 | | | | 1,145,230 | |
Berkeley County School District, 5.00% due 12/1/2024 (School Facility Equipment Acquisition) | | A+/NR | | | 2,000,000 | | | | 2,272,180 | |
City of North Charleston Public Facilities Corp. COP, 5.00% due 10/1/2016 (Convention Center Complex) | | AA-/NR | | | 1,560,000 | | | | 1,708,793 | |
County of Charleston, 5.00% due 12/1/2022 (South Aviation Ave. Construction) | | AA+/NR | | | 1,810,000 | | | | 2,128,795 | |
County of Charleston, 5.00% due 12/1/2023 (South Aviation Ave. Construction) | | AA+/NR | | | 2,460,000 | | | | 2,901,742 | |
Georgetown County Environmental Improvement, 5.70% due 4/1/2014 (International Paper Co.) | | BBB/NR | | | 7,975,000 | | | | 7,975,000 | |
Greenville County School District, 5.50% due 12/1/2016 (Building Equity Sooner for Tomorrow) | | AA/Aa2 | | | 3,500,000 | | | | 3,949,960 | |
Greenwood County, 5.00% due 10/1/2022 (Self Regional Healthcare) | | A+/A1 | | | 1,000,000 | | | | 1,111,990 | |
Greenwood Fifty Facilities School District, 5.00% due 12/1/2015 (Insured: AGM) | | AA/A1 | | | 1,000,000 | | | | 1,073,370 | |
Greenwood Fifty Facilities School District, 5.00% due 12/1/2016 (Insured: AGM) | | AA/A1 | | | 1,000,000 | | | | 1,107,720 | |
Lexington One School Facilities Corp., 5.00% due 12/1/2015 (Lexington County School District No. 1) (ETM) | | NR/Aa3 | | | 1,000,000 | | | | 1,077,950 | |
Medical University Hospital Authority, 4.85% due 8/15/2026 pre-refunded 8/15/2014 (Medical University of South Carolina First Phase Expansion; Insured: Natl-Re/FHA) | | AA-/Baa1 | | | 4,100,000 | | | | 4,170,807 | |
Piedmont Municipal Power Agency, 6.75% due 1/1/2019 (Insured: Natl-Re) | | NR/Baa1 | | | 3,800,000 | | | | 4,627,374 | |
School District of Beaufort County GO, 5.00% due 3/1/2015 (Educational Capital Improvements; Insured: SCSDE) | | AA/Aa1 | | | 1,000,000 | | | | 1,044,440 | |
South Carolina Jobs Economic Development Authority, 5.00% due 8/15/2014 (CareAlliance Health Services; Insured: AGM) | | AA/A2 | | | 4,000,000 | | | | 4,059,680 | |
South Carolina Jobs Economic Development Authority, 5.00% due 8/15/2015 (CareAlliance Health Services; Insured: AGM) | | AA/A2 | | | 3,000,000 | | | | 3,158,460 | |
State of South Carolina GO, 5.00% due 4/1/2015 (Transportation Infrastructure) (State Aid Withholding) | | AA+/Aaa | | | 2,070,000 | | | | 2,170,706 | |
| | | |
SOUTH DAKOTA — 0.39% | | | | | | | | | | |
South Dakota Building Authority, 4.50% due 6/1/2016 (Insured: Natl-Re) | | AA/Baa1 | | | 2,000,000 | | | | 2,162,060 | |
South Dakota Building Authority, 5.00% due 6/1/2022 | | AA/Aa2 | | | 500,000 | | | | 581,515 | |
South Dakota Building Authority, 5.00% due 6/1/2024 | | AA/Aa2 | | | 1,000,000 | | | | 1,151,280 | |
South Dakota Health & Educational Facilities Authority, 5.00% due 9/1/2015 (Regional Health) | | NR/A1 | | | 1,390,000 | | | | 1,482,616 | |
South Dakota Health & Educational Facilities Authority, 5.00% due 11/1/2015 (Sanford Health) | | A+/A1 | | | 1,310,000 | | | | 1,393,735 | |
South Dakota Health & Educational Facilities Authority, 5.00% due 9/1/2016 (Regional Health) | | NR/A1 | | | 1,000,000 | | | | 1,097,440 | |
South Dakota Health & Educational Facilities Authority, 5.00% due 4/1/2017 (Prairie Lakes Health) | | A+/NR | | | 2,215,000 | | | | 2,413,309 | |
South Dakota Health & Educational Facilities Authority, 5.00% due 9/1/2017 (Regional Health) | | NR/A1 | | | 1,100,000 | | | | 1,235,949 | |
South Dakota Health & Educational Facilities Authority, 5.00% due 4/1/2018 (Prairie Lakes Health) | | A+/NR | | | 2,290,000 | | | | 2,525,939 | |
South Dakota Health & Educational Facilities Authority, 5.00% due 9/1/2018 (Regional Health) | | NR/A1 | | | 1,275,000 | | | | 1,453,423 | |
South Dakota Health & Educational Facilities Authority, 5.00% due 9/1/2018 (Regional Health) | | NR/A1 | | | 1,000,000 | | | | 1,134,010 | |
South Dakota Health & Educational Facilities Authority, 5.00% due 4/1/2019 (Prairie Lakes Health) | | A+/NR | | | 2,440,000 | | | | 2,714,158 | |
South Dakota Health & Educational Facilities Authority, 5.00% due 9/1/2020 (Regional Health) | | NR/A1 | | | 1,000,000 | | | | 1,155,880 | |
South Dakota Health & Educational Facilities Authority, 5.00% due 7/1/2021 (Avera Health Issue) | | AA-/A1 | | | 1,670,000 | | | | 1,890,206 | |
South Dakota Housing Development Authority, 4.00% due 11/1/2016 (Single Family Mtg) | | NR/Aa3 | | | 1,040,000 | | | | 1,115,483 | |
South Dakota Housing Development Authority, 4.00% due 11/1/2017 (Single Family Mtg) | | NR/Aa3 | | | 1,055,000 | | | | 1,145,878 | |
South Dakota Housing Development Authority, 4.00% due 11/1/2018 (Single Family Mtg) | | NR/Aa3 | | | 1,165,000 | | | | 1,274,883 | |
| | | |
TENNESSEE — 0.68% | | | | | | | | | | |
Clarksville Natural Gas Acquisition Corp., 5.00% due 12/15/2014 | | NR/Baa2 | | | 3,200,000 | | | | 3,298,944 | |
Clarksville Natural Gas Acquisition Corp., 5.00% due 12/15/2015 | | NR/Baa2 | | | 3,500,000 | | | | 3,755,920 | |
Clarksville Natural Gas Acquisition Corp., 5.00% due 12/15/2019 | | NR/Baa2 | | | 6,000,000 | | | | 6,738,780 | |
Hallsdale-Powell Utility District, 2.00% due 4/1/2014 | | AA/NR | | | 1,260,000 | | | | 1,260,000 | |
Hallsdale-Powell Utility District, 3.00% due 4/1/2016 | | AA/NR | | | 500,000 | | | | 524,330 | |
Metropolitan Government of Nashville & Davidson County, 6.50% due 12/1/2014 (Water and Sewer Systems) (ETM) | | AA-/Aaa | | | 1,545,000 | | | | 1,610,338 | |
Tennessee Energy Acquisition Corp., 5.00% due 9/1/2015 | | A-/Baa2 | | | 3,000,000 | | | | 3,181,500 | |
Tennessee Energy Acquisition Corp., 5.00% due 2/1/2017 | | A-/Baa1 | | | 5,000,000 | | | | 5,429,800 | |
Tennessee Energy Acquisition Corp., 5.25% due 9/1/2017 | | A-/Baa2 | | | 11,000,000 | | | | 12,167,100 | |
Tennessee Energy Acquisition Corp., 5.25% due 9/1/2018 | | A-/Baa2 | | | 5,000,000 | | | | 5,604,850 | |
Tennessee Energy Acquisition Corp., 5.25% due 9/1/2020 | | A-/Baa2 | | | 1,190,000 | | | | 1,329,004 | |
| | | |
TEXAS — 8.17% | | | | | | | | | | |
Amarillo Health Facilities Corp., 5.50% due 1/1/2015 (Baptist St. Anthony’s Hospital Corp.; Insured: AGM) (ETM) | | NR/A2 | | | 1,065,000 | | | | 1,097,845 | |
Amarillo ISD GO, 3.00% due 2/1/2015 (Guaranty: PSF) | | AAA/Aaa | | | 1,110,000 | | | | 1,136,618 | |
Austin Community College Public Facilities Corp., 5.25% due 8/1/2017 (Round Rock Campus) | | AA/Aa2 | | | 1,500,000 | | | | 1,705,800 | |
Bexar Metropolitan Water District, 4.50% due 5/1/2021 (Waterworks System; Insured: Natl-Re) | | AA-/A1 | | | 1,200,000 | | | | 1,279,668 | |
Brazos River Authority, 4.90% due 10/1/2015 (Center Point Energy; Insured: Natl-Re) | | AA-/Baa1 | | | 4,685,000 | | | | 4,935,085 | |
Brownwood ISD GO, 5.25% due 2/15/2017 (Educational Facilities; Insured: Natl-Re) | | NR/A1 | | | 1,310,000 | | | | 1,364,129 | |
40 Certified Semi-Annual Report
| | |
| SCHEDULE OF INVESTMENTS, CONTINUED | | |
| |
Thornburg Limited Term Municipal Fund | | March 31, 2014 (Unaudited) |
| | | | | | | | | | |
Issuer-Description | | Credit Rating†
S&P/ Moody’s | | Principal
Amount | | | Value | |
Capital Area Cultural Education Facilities Finance Corp., 5.00% due 4/1/2014 (Roman Catholic Diocese of Austin) | | NR/Baa1 | | $ | 890,000 | | | $ | 890,000 | |
Capital Area Cultural Education Facilities Finance Corp., 5.00% due 4/1/2015 (Roman Catholic Diocese of Austin) | | NR/Baa1 | | | 1,100,000 | | | | 1,141,767 | |
Capital Area Cultural Education Facilities Finance Corp., 5.00% due 4/1/2018 (Roman Catholic Diocese of Austin) | | NR/Baa1 | | | 1,370,000 | | | | 1,512,261 | |
Cities of Dallas and Fort Worth, 5.00% due 11/1/2014 (DFW International Airport Development Plan) | | A+/A2 | | | 1,300,000 | | | | 1,336,725 | |
Cities of Dallas and Fort Worth, 5.00% due 11/1/2015 (DFW International Airport Development Plan) | | A+/A2 | | | 3,370,000 | | | | 3,616,617 | |
Cities of Dallas and Fort Worth, 5.25% due 11/1/2023 (DFW International Airport Terminal Renewal & Improvement Program) | | A+/A2 | | | 3,000,000 | | | | 3,502,650 | |
City of Austin, 5.00% due 5/15/2014 (Water and Wastewater System; Insured: AMBAC) | | AA/Aa2 | | | 2,890,000 | | | | 2,907,253 | |
City of Austin, 5.00% due 5/15/2015 (Water and Wastewater System; Insured: AMBAC) | | AA/Aa2 | | | 1,520,000 | | | | 1,602,369 | |
City of Austin, 5.00% due 5/15/2016 (Water and Wastewater System; Insured: Natl-Re) | | AA/Aa2 | | | 1,500,000 | | | | 1,616,130 | |
City of Austin, 5.00% due 11/15/2022 (Water and Wastewater System) | | AA/Aa2 | | | 2,640,000 | | | | 3,097,670 | |
City of Brownsville, 5.00% due 9/1/2020 (Water, Wastewater & Electric Utilities Systems) | | A+/A2 | | | 1,500,000 | | | | 1,734,435 | |
City of Brownsville, 5.00% due 9/1/2022 (Water, Wastewater & Electric Utilities Systems) | | A+/A2 | | | 1,520,000 | | | | 1,749,870 | |
City of Brownsville, 5.00% due 9/1/2023 (Water, Wastewater & Electric Utilities Systems) | | A+/A2 | | | 2,380,000 | | | | 2,752,375 | |
City of Bryan, 4.00% due 7/1/2014 (Electric System) | | A+/A1 | | | 1,300,000 | | | | 1,312,233 | |
City of Bryan, 5.00% due 7/1/2015 (Electric System) | | A+/A1 | | | 1,150,000 | | | | 1,216,631 | |
City of Bryan, 5.00% due 7/1/2019 (Electric System) | | A+/A1 | | | 8,000,000 | | | | 8,809,760 | |
City of Dallas GO, 5.00% due 2/15/2018 pre-refunded 2/15/2015 | | AA+/Aa1 | | | 3,375,000 | | | | 3,516,649 | |
City of Denton GO, 4.00% due 2/15/2015 | | AA/Aa2 | | | 3,445,000 | | | | 3,560,097 | |
City of Denton GO, 4.00% due 2/15/2016 | | AA/Aa2 | | | 3,535,000 | | | | 3,772,835 | |
City of Denton GO, 5.00% due 2/15/2017 | | AA/Aa2 | | | 3,675,000 | | | | 4,121,035 | |
City of Denton GO, 5.00% due 2/15/2019 | | AA/Aa2 | | | 3,990,000 | | | | 4,640,170 | |
City of Denton GO, 5.00% due 2/15/2020 | | AA/Aa2 | | | 4,195,000 | | | | 4,802,981 | |
City of Houston, 5.00% due 9/1/2014 (Convention & Entertainment Facilities Department) | | A-/A2 | | | 2,000,000 | | | | 2,040,040 | |
City of Houston, 5.00% due 9/1/2014 (Convention & Entertainment Facilities Department) | | A-/A2 | | | 1,300,000 | | | | 1,326,026 | |
City of Houston, 5.00% due 7/1/2015 (Airport System) | | AA-/Aa3 | | | 2,600,000 | | | | 2,752,334 | |
City of Houston, 5.00% due 7/1/2017 (Airport System) | | AA-/Aa3 | | | 1,600,000 | | | | 1,802,480 | |
City of Houston, 5.00% due 7/1/2018 (Airport System) | | AA-/Aa3 | | | 1,000,000 | | | | 1,148,460 | |
City of Houston, 0% due 9/1/2020 (Insured: AGM/AMBAC) | | AA/A2 | | | 3,650,000 | | | | 2,983,510 | |
b City of Houston, 5.00% due 5/15/2022 (Combined Utility System) | | AA/NR | | | 3,000,000 | | | | 3,562,050 | |
b City of Houston, 5.00% due 5/15/2023 (Combined Utility System) | | AA/NR | | | 4,445,000 | | | | 5,292,661 | |
b City of Houston, 5.00% due 5/15/2024 (Combined Utility System) | | AA/NR | | | 7,250,000 | | | | 8,653,745 | |
City of Houston COP, 6.25% due 12/15/2014 (Water Conveyance System; Insured: AMBAC) | | NR/NR | | | 2,850,000 | | | | 2,939,604 | |
City of Laredo, 5.00% due 3/15/2015 (Sports Venue Improvement; Insured: AMBAC) | | A+/A1 | | | 1,930,000 | | | | 2,007,895 | |
City of Laredo GO, 5.00% due 2/15/2018 (Streets, Sidewalks, Drainage, Signals, Lighting; Insured: Natl-Re) | | AA/Aa2 | | | 2,000,000 | | | | 2,234,740 | |
City of Olmos Park Higher Education Facilities Corp., 5.00% due 12/1/2020 (University of the Incarnate Word Project) | | NR/A3 | | | 3,620,000 | | | | 4,117,388 | |
City of Olmos Park Higher Education Facilities Corp., 5.00% due 12/1/2021 (University of the Incarnate Word Project) | | NR/A3 | | | 1,000,000 | | | | 1,131,990 | |
City of San Antonio, 5.00% due 2/1/2022 (CPS Energy) | | AA/Aa1 | | | 20,000,000 | | | | 23,717,000 | |
City of San Antonio, 5.25% due 2/1/2024 (CPS Energy) | | AA/Aa1 | | | 7,000,000 | | | | 8,519,210 | |
City of San Antonio GO, 4.00% due 2/1/2015 (City Public Facility Improvements) | | AAA/Aaa | | | 1,000,000 | | �� | | 1,032,390 | |
City of San Antonio Public Facilities Corp., 5.00% due 9/15/2022 (Convention Center Refinancing & Expansion) | | AA+/Aa2 | | | 1,450,000 | | | | 1,682,406 | |
City of Weslaco GO, 5.25% due 2/15/2019 (Waterworks and Sewer System; Insured: Natl-Re) | | AA-/A3 | | | 2,835,000 | | | | 3,101,292 | |
Clifton Higher Education Finance Corp., 5.00% due 8/15/2016 (IDEA Public Schools) | | BBB/NR | | | 225,000 | | | | 242,460 | |
Clifton Higher Education Finance Corp., 5.00% due 8/15/2017 (IDEA Public Schools) | | BBB/NR | | | 315,000 | | | | 345,662 | |
Clifton Higher Education Finance Corp., 5.00% due 8/15/2018 (IDEA Public Schools) | | BBB/NR | | | 325,000 | | | | 361,293 | |
Clifton Higher Education Finance Corp., 5.00% due 8/15/2019 (IDEA Public Schools) | | BBB/NR | | | 445,000 | | | | 498,213 | |
Clifton Higher Education Finance Corp., 5.00% due 8/15/2023 (IDEA Public Schools) | | BBB/NR | | | 1,100,000 | | | | 1,195,986 | |
Collin County GO, 5.00% due 2/15/2016 (Road and Highway Construction) | | AAA/Aaa | | | 1,465,000 | | | | 1,591,298 | |
Corpus Christi Business & Job Development Corp., 5.00% due 3/1/2021 (Seawall Project) | | A+/A1 | | | 625,000 | | | | 717,288 | |
Dallas Convention Center Hotel Development Corp., 0% due 1/1/2018 | | A+/A1 | | | 5,240,000 | | | | 4,798,687 | |
Dallas Convention Center Hotel Development Corp., 5.00% due 1/1/2019 | | A+/A1 | | | 5,200,000 | | | | 5,865,652 | |
Dallas County Utility & Reclamation District, 5.00% due 2/15/2017 (Insured: AMBAC) | | BBB+/A3 | | | 1,160,000 | | | | 1,294,722 | |
Dallas County Utility & Reclamation District, 5.00% due 2/15/2017 (Insured: AMBAC) | | BBB+/A3 | | | 1,260,000 | | | | 1,406,336 | |
Dallas County Utility & Reclamation District, 5.00% due 2/15/2018 (Insured: AMBAC) | | BBB+/A3 | | | 1,935,000 | | | | 2,134,769 | |
Dallas County Utility & Reclamation District, 5.00% due 2/15/2018 (Insured: AMBAC) | | BBB+/A3 | | | 2,035,000 | | | | 2,245,093 | |
Dallas County Utility & Reclamation District, 5.00% due 2/15/2019 (Insured: AMBAC) | | BBB+/A3 | | | 2,175,000 | | | | 2,384,518 | |
Decatur ISD GO, 3.00% due 8/15/2015 (Wise County; Guaranty: PSF) | | AAA/NR | | | 1,710,000 | | | | 1,777,032 | |
Grayson County GO, 1.625% due 1/1/2017 (State Highway Toll System) | | AA/Aa2 | | | 1,200,000 | | | | 1,226,544 | |
Grayson County GO, 4.00% due 1/1/2020 (State Highway Toll System) | | AA/Aa2 | | | 2,000,000 | | | | 2,228,860 | |
Grayson County GO, 5.00% due 1/1/2022 (State Highway Toll System) | | AA/Aa2 | | | 3,000,000 | | | | 3,536,880 | |
Guadalupe-Blanco River Authority PCR, 5.625% due 10/1/2017 (AEP Texas Central Co.) | | BBB/Baa1 | | | 5,000,000 | | | | 5,629,550 | |
Gulf Coast Waste Disposal Authority, 3.00% due 10/1/2014 (Bayport Area Wastewater Treatment System; Insured: AGM) | | AA/A2 | | | 210,000 | | | | 212,741 | |
Gulf Coast Waste Disposal Authority, 4.00% due 10/1/2016 (Bayport Area Wastewater Treatment System; Insured: AGM) | | AA/A2 | | | 500,000 | | | | 539,195 | |
Gulf Coast Waste Disposal Authority, 4.00% due 10/1/2017 (Bayport Area Wastewater Treatment System; Insured: AGM) | | AA/A2 | | | 800,000 | | | | 875,968 | |
Gulf Coast Waste Disposal Authority, 5.00% due 10/1/2019 (Bayport Area Wastewater Treatment System; Insured: AGM) | | AA/A2 | | | 1,000,000 | | | | 1,148,740 | |
Gulf Coast Waste Disposal Authority, 5.00% due 10/1/2020 (Bayport Area Wastewater Treatment System; Insured: AGM) | | AA/A2 | | | 2,000,000 | | | | 2,286,300 | |
Certified Semi-Annual Report 41
| | |
| SCHEDULE OF INVESTMENTS, CONTINUED | | |
| |
Thornburg Limited Term Municipal Fund | | March 31, 2014 (Unaudited) |
| | | | | | | | | | |
Issuer-Description | | Credit Rating†
S&P/ Moody’s | | Principal
Amount | | | Value | |
Gulf Coast Waste Disposal Authority, 5.00% due 10/1/2022 pre-refunded 10/1/2014 (Bayport Area Wastewater Treatment System; Insured: AMBAC) | | A/NR | | $ | 2,265,000 | | | $ | 2,319,881 | |
Gulf Coast Waste Disposal Authority, 5.00% due 10/1/2022 (Bayport Area Wastewater Treatment System; Insured: AGM) | | AA/A2 | | | 1,635,000 | | | | 1,861,644 | |
Harris County Cultural Education Facilities Finance Corp., 5.00% due 11/15/2015 (Texas Medical Center Central Heating and Cooling Services Corp.) | | AA/Aa3 | | | 1,450,000 | | | | 1,559,707 | |
Harris County Cultural Education Facilities Finance Corp., 5.00% due 11/15/2018 (Texas Medical Center Central Heating and Cooling Services Corp.) | | AA/Aa3 | | | 1,365,000 | | | | 1,585,024 | |
Harris County Cultural Education Facilities Finance Corp., 5.00% due 11/15/2019 (Texas Medical Center Central Heating and Cooling Services Corp.) | | AA/Aa3 | | | 1,000,000 | | | | 1,171,250 | |
Harris County Cultural Education Facilities Finance Corp., 0.07% due 9/1/2031 put 4/1/2014 (Texas Medical Center; LOC: JPMorgan Chase Bank) (daily demand notes) | | AAA/Aa1 | | | 3,475,000 | | | | 3,475,000 | |
Harris County GO, 4.00% due 10/1/2015 (County Permanent Improvements) | | AA+/NR | | | 2,995,000 | | | | 3,165,835 | |
Harris County GO, 5.00% due 10/1/2015 (County Permanent Improvements) | | AA+/NR | | | 4,000,000 | | | | 4,288,040 | |
Harris County Health Facilities Development Corp., 5.00% due 7/1/2016 (CHRISTUS Health System; Insured: AGM) | | AA/A1 | | | 6,260,000 | | | | 6,839,175 | |
Harris County Health Facilities Development Corp., 7.00% due 12/1/2027 pre-refunded 12/1/2018 (Memorial Hermann Healthcare System; LOC: JPMorgan Chase Bank) | | NR/A1 | | | 1,245,000 | | | | 1,567,941 | |
Harris County Health Facilities Development Corp., 0.07% due 10/1/2041 put 4/1/2014 (Texas Children’s Hospital; SPA: Wells Fargo Bank N.A.) (daily demand notes) | | AA/Aa2 | | | 1,415,000 | | | | 1,415,000 | |
Harris County Hospital District, 5.00% due 2/15/2017 (Insured: Natl-Re) | | AA-/A2 | | | 1,500,000 | | | | 1,638,165 | |
Houston Higher Education Finance Corp., 5.875% due 5/15/2021 (Cosmos Foundation, Inc.) | | BBB/NR | | | 2,075,000 | | | | 2,322,132 | |
Houston ISD GO, 5.00% due 2/15/2015 (Harris County School Buildings) | | AA+/Aaa | | | 2,450,000 | | | | 2,552,753 | |
Houston ISD GO, 3.00% due 7/15/2015 (Harris County School Buildings) | | AA+/Aaa | | | 2,000,000 | | | | 2,072,940 | |
Houston ISD GO, 1.50% due 6/1/2036 put 6/1/2015 (Harris County School Buildings; Guaranty: PSF) | | AAA/Aaa | | | 10,000,000 | | | | 10,132,600 | |
Houston ISD GO, 2.00% due 6/1/2037 put 6/1/2016 (Harris County School Buildings; Guaranty: PSF) | | AAA/Aaa | | | 10,000,000 | | | | 10,283,700 | |
Houston ISD Public Facility Corp., 0% due 9/15/2014 (West Side High School; Insured: AMBAC) | | AA/Aa2 | | | 6,190,000 | | | | 6,180,839 | |
Hutto ISD GO, 0% due 8/1/2017 (Guaranty: PSF) | | AAA/NR | | | 2,170,000 | | | | 2,016,451 | |
Irving ISD GO, 0% due 2/15/2017 (Guaranty: PSF) | | AAA/Aaa | | | 1,000,000 | | | | 935,860 | |
Kerrville Health Facilities Development Corp., 5.25% due 8/15/2021 (Sid Peterson Memorial Hospital) | | BBB-/NR | | | 4,000,000 | | | | 4,092,880 | |
Lower Colorado River Authority, 5.875% due 5/15/2016
(Insured: BHAC/FSA) | | NR/Aa1 | | | 2,210,000 | | | | 2,220,188 | |
Lower Colorado River Authority, 5.00% due 5/15/2025 | | A/A1 | | | 8,075,000 | | | | 9,098,991 | |
Mission Economic Development Corp., 3.75% due 12/1/2018 put 5/1/2015 (Waste Management, Inc.) | | A-/NR | | | 8,500,000 | | | | 8,792,570 | |
New Caney ISD GO, 5.00% due 2/15/2024 (Guaranty: PSF) | | AAA/Aaa | | | 865,000 | | | | 1,022,153 | |
North East ISD GO, 5.00% due 8/1/2016 (Guaranty: PSF) | | AAA/Aaa | | | 2,000,000 | | | | 2,211,200 | |
North East ISD GO, 2.00% due 8/1/2043 put 8/1/2015 (Educational Facilities; Guaranty: PSF) | | AAA/Aaa | | | 44,745,000 | | | | 45,634,531 | |
North Texas University, 5.00% due 4/15/2014 | | NR/Aa2 | | | 1,250,000 | | | | 1,252,350 | |
North Texas University, 5.00% due 4/15/2016 | | NR/Aa2 | | | 2,250,000 | | | | 2,454,907 | |
Nueces River Authority, 5.00% due 7/15/2015 (City of Corpus Christi Lake Texana Project; Insured: AGM) | | AA/Aa3 | | | 1,000,000 | | | | 1,060,050 | |
Sam Rayburn Municipal Power Agency, 5.00% due 10/1/2017 | | BBB+/NR | | | 1,000,000 | | | | 1,117,440 | |
Sam Rayburn Municipal Power Agency, 5.00% due 10/1/2019 | | BBB+/NR | | | 2,565,000 | | | | 2,932,924 | |
Sam Rayburn Municipal Power Agency, 5.00% due 10/1/2020 | | BBB+/NR | | | 1,620,000 | | | | 1,850,866 | |
San Antonio Public Facilities Corp., 5.00% due 9/15/2020 (Convention Center Refinancing & Expansion) | | AA+/Aa2 | | | 915,000 | | | | 1,058,207 | |
San Juan Higher Education Finance Authority, 5.125% due 8/15/2020 (IDEA Public Schools) | | BBB/NR | | | 1,825,000 | | | | 1,984,304 | |
State of Texas, 2.00% due 8/28/2014 (General Revenue Fund-Cash Flow Management) | | SP-1+/Mig1 | | | 129,300,000 | | | | 130,303,368 | |
Tarrant County Cultural Educational Facilities Finance Corp., 5.00% due 8/15/2016 (Scott & White Memorial Hospital) | | A+/Aa3 | | | 2,280,000 | | | | 2,495,802 | |
Tarrant County Cultural Educational Facilities Finance Corp., 5.00% due 8/15/2017 (Scott & White Memorial Hospital) | | A+/Aa3 | | | 2,000,000 | | | | 2,245,120 | |
Texas Municipal Power Agency, 5.00% due 9/1/2017 (Insured: AGM) | | AA/A2 | | | 10,000,000 | | | | 11,336,400 | |
Texas Public Finance Authority, 5.00% due 7/1/2014 (Unemployment Compensation) | | AAA/Aaa | | | 5,000,000 | | | | 5,061,100 | |
Texas Public Finance Authority, 5.00% due 10/15/2014 (Stephen F. Austin University; Insured: Natl-Re) | | NR/A1 | | | 1,305,000 | | | | 1,338,160 | |
Texas Public Finance Authority, 5.00% due 10/15/2015 (Stephen F. Austin University; Insured: Natl-Re) | | NR/A1 | | | 1,450,000 | | | | 1,550,717 | |
Texas Public Finance Authority, 5.00% due 7/1/2017 (Unemployment Compensation) | | AAA/Aaa | | | 15,500,000 | | | | 16,730,700 | |
Tyler Junior College District GO, 4.00% due 2/15/2015 (Higher Education Building Projects) | | AA+/NR | | | 1,300,000 | | | | 1,343,056 | |
Uptown Development Authority, 5.00% due 9/1/2015 (Infrastructure Improvements) | | BBB/NR | | | 1,370,000 | | | | 1,449,803 | |
Uptown Development Authority, 5.00% due 9/1/2017 (Infrastructure Improvements) | | BBB/NR | | | 1,580,000 | | | | 1,756,565 | |
Uptown Development Authority, 5.00% due 9/1/2018 (Infrastructure Improvements) | | BBB/NR | | | 1,870,000 | | | | 2,107,340 | |
Uptown Development Authority, 5.00% due 9/1/2019 (Infrastructure Improvements) | | BBB/NR | | | 1,945,000 | | | | 2,205,260 | |
West Harris County Regional Water Authority, 5.00% due 12/15/2020 (Insured: Natl-Re) | | AA-/A1 | | | 2,140,000 | | | | 2,356,204 | |
Ysleta ISD GO, 2.00% due 8/15/2014 (Guaranty: PSF) | | AAA/Aaa | | | 3,115,000 | | | | 3,136,867 | |
| | | |
U.S. VIRGIN ISLANDS — 0.13% | | | | | | | | | | |
Virgin Islands Public Finance Authority, 6.75% due 10/1/2019 (Matching Fund Loan Diageo Project) | | NR/Baa3 | | | 7,690,000 | | | | 8,544,513 | |
| | | |
UTAH — 0.10% | | | | | | | | | | |
Murray City, 0.07% due 5/15/2037 put 4/1/2014 (IHC Health Services, Inc.; SPA: JPMorgan Chase Bank) (daily demand notes) | | AA+/Aa1 | | | 3,575,000 | | | | 3,575,000 | |
South Valley Water Reclamation Facility, 5.00% due 8/15/2024 (Sewer Treatment Facility Improvements; Insured: AMBAC) | | A+/NR | | | 2,110,000 | | | | 2,214,930 | |
State of Utah Building Ownership Authority, 5.00% due 5/15/2014 (State Facilities Master Lease Program) | | AA+/Aa1 | | | 500,000 | | | | 502,945 | |
42 Certified Semi-Annual Report
| | |
| SCHEDULE OF INVESTMENTS, CONTINUED | | |
| |
Thornburg Limited Term Municipal Fund | | March 31, 2014 (Unaudited) |
| | | | | | | | | | |
Issuer-Description | | Credit Rating†
S&P/ Moody’s | | Principal
Amount | | | Value | |
VERMONT — 0.37% | | | | | | | | | | |
Energy Northwest, 5.00% due 7/1/2014 (Nine Canyon Wind Project Phase III; Insured: AMBAC) | | A/A2 | | $ | 2,575,000 | | | $ | 2,604,149 | |
Vermont Colleges GO, 4.00% due 7/1/2017 | | A+/NR | | | 5,375,000 | | | | 5,774,148 | |
Vermont Economic Development Authority, 5.00% due 12/15/2020 (Vermont Public Service Corp.) | | NR/NR | | | 14,250,000 | | | | 16,246,282 | |
| | | |
VIRGINIA — 0.39% | | | | | | | | | | |
City of Portsmouth GO, 5.00% due 7/1/2017 pre-refunded 7/1/2014 (Insured: AGM) | | AA/Aa2 | | | 2,000,000 | | | | 2,024,240 | |
Fairfax County EDA, 5.00% due 8/1/2016 (Wiehle Avenue Metrorail Station Parking Project) | | AA+/Aa2 | | | 2,600,000 | | | | 2,868,164 | |
Fairfax County GO, 4.00% due 10/1/2015 (Public Facilities and Improvements) (State Aid Withholding) | | AAA/Aaa | | | 5,000,000 | | | | 5,285,950 | |
a Fairfax County GO, 5.00% due 10/1/2016 (Public Facilities and Improvements) (State Aid Withholding) | | AAA/Aaa | | | 1,100,000 | | | | 1,224,278 | |
Fairfax County IDA, 4.00% due 5/15/2022 (Inova Health System) | | AA+/Aa2 | | | 5,500,000 | | | | 5,989,115 | |
Fairfax County IDA, 5.00% due 5/15/2022 (Inova Health System) | | AA+/Aa2 | | | 5,000,000 | | | | 5,841,700 | |
Northwestern Regional Jail Authority, 5.00% due 7/1/2033 pre-refunded 7/1/2015 (Community Corrections Center; Insured: Natl-Re) | | AA-/Aa2 | | | 900,000 | | | | 953,784 | |
Virginia Public Building Authority, 5.00% due 8/1/2014 (Public Facilities Projects) | | AA+/Aa1 | | | 1,300,000 | | | | 1,305,239 | |
| | | |
WASHINGTON — 2.17% | | | | | | | | | | |
Bremerton School District No. 100C GO, 0% due 12/1/2015 (Insured: AGM) | | NR/Aa1 | | | 1,270,000 | | | | 1,255,738 | |
Central Puget Sound Regional Transit Authority, 4.00% due 2/1/2015 | | AAA/Aa1 | | | 840,000 | | | | 867,040 | |
Energy Northwest, 5.00% due 7/1/2017 (Bonneville Power Administration Project 1) | | AA-/Aa1 | | | 5,000,000 | | | | 5,670,600 | |
Energy Northwest, 5.00% due 7/1/2017 (Bonneville Power Administration Project 3) | | AA-/Aa1 | | | 5,470,000 | | | | 6,203,636 | |
b Energy Northwest, 5.00% due 7/1/2018 (Nine Canyon Wind Project Phase I-III) | | NR/A2 | | | 1,000,000 | | | | 1,127,280 | |
Energy Northwest, 5.00% due 7/1/2018 (Bonneville Power Administration Project 3) | | AA-/Aa1 | | | 475,000 | | | | 533,207 | |
b Energy Northwest, 5.00% due 7/1/2019 (Nine Canyon Wind Project Phase I-III) | | NR/A2 | | | 2,000,000 | | | | 2,269,780 | |
b Energy Northwest, 5.00% due 7/1/2020 (Nine Canyon Wind Project Phase I-III) | | NR/A2 | | | 2,000,000 | | | | 2,264,120 | |
b Energy Northwest, 5.00% due 7/1/2021 (Nine Canyon Wind Project Phase I-III) | | NR/A2 | | | 2,000,000 | | | | 2,256,100 | |
b Energy Northwest, 5.00% due 7/1/2022 (Nine Canyon Wind Project Phase I-III) | | NR/A2 | | | 1,000,000 | | | | 1,129,600 | |
b Energy Northwest, 5.00% due 7/1/2023 (Nine Canyon Wind Project Phase I-III) | | NR/A2 | | | 1,000,000 | | | | 1,128,590 | |
King County Federal Way School District No. 210 GO, 4.125% due 12/1/2019 (Insured: Natl-Re) | | AA+/Aa1 | | | 2,000,000 | | | | 2,177,100 | |
Marysville School District No. 25 GO, 4.00% due 12/1/2017 (Snohomish County Educational Facilities) (State Aid Withholding) | | NR/Aa1 | | | 1,000,000 | | | | 1,111,030 | |
Marysville School District No. 25 GO, 4.00% due 12/1/2018 (Snohomish County Educational Facilities) (State Aid Withholding) | | NR/Aa1 | | | 1,100,000 | | | | 1,234,112 | |
Marysville School District No. 25 GO, 5.00% due 12/1/2019 (Snohomish County Educational Facilities) (State Aid Withholding) | | NR/Aa1 | | | 1,390,000 | | | | 1,640,311 | |
Marysville School District No. 25 GO, 5.00% due 12/1/2020 (Snohomish County Educational Facilities) (State Aid Withholding) | | NR/Aa1 | | | 1,625,000 | | | | 1,920,263 | |
Marysville School District No. 25 GO, 5.00% due 12/1/2021 (Snohomish County Educational Facilities) (State Aid Withholding) | | NR/Aa1 | | | 1,750,000 | | | | 2,071,860 | |
Marysville School District No. 25 GO, 5.00% due 12/1/2022 (Snohomish County Educational Facilities) (State Aid Withholding) | | NR/Aa1 | | | 2,620,000 | | | | 3,114,866 | |
Marysville School District No. 25 GO, 5.00% due 12/1/2023 (Snohomish County Educational Facilities) (State Aid Withholding) | | NR/Aa1 | | | 1,700,000 | | | | 2,009,502 | |
Port of Seattle, 5.50% due 9/1/2018 (Insured: Natl-Re) | | AA-/A2 | | | 5,000,000 | | | | 5,796,400 | |
Seattle Municipal Light & Power, 5.00% due 2/1/2016 | | AA/Aa2 | | | 800,000 | | | | 867,296 | |
Seattle Municipal Light & Power, 5.00% due 2/1/2017 | | AA/Aa2 | | | 2,000,000 | | | | 2,239,400 | |
Skagit County Public Hospital District No. 1, 4.00% due 12/1/2016 (Skagit Regional Health) | | NR/Baa2 | | | 1,000,000 | | | | 1,059,600 | |
Skagit County Public Hospital District No. 1, 5.00% due 12/1/2018 (Skagit Regional Health) | | NR/Baa2 | | | 800,000 | | | | 880,616 | |
Skagit County Public Hospital District No. 1, 5.00% due 12/1/2019 (Skagit Regional Health) | | NR/Baa2 | | | 835,000 | | | | 925,063 | |
Skagit County Public Hospital District No. 1, 5.00% due 12/1/2021 (Skagit Regional Health) | | NR/Baa2 | | | 1,160,000 | | | | 1,237,384 | |
Skagit County Public Hospital District No. 1, 5.00% due 12/1/2022 (Skagit Regional Health) | | NR/Baa2 | | | 500,000 | | | | 526,795 | |
Skagit County Public Hospital District No. 1, 5.375% due 12/1/2022 (Skagit Valley Hospital) | | NR/Baa2 | | | 500,000 | | | | 513,525 | |
Skagit County Public Hospital District No. 1, 5.00% due 12/1/2023 (Skagit Regional Health) | | NR/Baa2 | | | 750,000 | | | | 786,480 | |
Skagit County Public Hospital District No. 1 GO, 4.00% due 12/1/2017 (Skagit Regional Health) | | NR/A1 | | | 1,000,000 | | | | 1,095,970 | |
Skagit County Public Hospital District No. 1 GO, 4.00% due 12/1/2018 (Skagit Regional Health) | | NR/A1 | | | 1,270,000 | | | | 1,397,673 | |
Skagit County Public Hospital District No. 1 GO, 5.00% due 12/1/2019 (Skagit Regional Health) | | NR/A1 | | | 1,695,000 | | | | 1,971,844 | |
Skagit County Public Hospital District No. 1 GO, 5.00% due 12/1/2020 (Skagit Regional Health) | | NR/A1 | | | 1,570,000 | | | | 1,821,954 | |
Skagit County Public Hospital District No. 1 GO, 5.00% due 12/1/2021 (Skagit Regional Health) | | NR/A1 | | | 3,135,000 | | | | 3,609,890 | |
Skagit County Public Hospital District No. 1 GO, 5.00% due 12/1/2022 (Skagit Regional Health) | | NR/A1 | | | 3,635,000 | | | | 4,167,128 | |
Skagit County Public Hospital District No. 2 GO, 4.00% due 12/1/2018 (Island Hospital) | | NR/A1 | | | 1,000,000 | | | | 1,097,230 | |
Skagit County Public Hospital District No. 2 GO, 4.00% due 12/1/2019 (Island Hospital) | | NR/A1 | | | 1,000,000 | | | | 1,105,960 | |
Skagit County Public Hospital District No. 2 GO, 4.00% due 12/1/2020 (Island Hospital) | | NR/A1 | | | 1,000,000 | | | | 1,090,800 | |
Skagit County Public Hospital District No. 2 GO, 4.00% due 12/1/2021 (Island Hospital) | | NR/A1 | | | 1,000,000 | | | | 1,074,320 | |
Skagit County Public Hospital District No. 2 GO, 5.00% due 12/1/2022 (Island Hospital) | | NR/A1 | | | 1,700,000 | | | | 1,936,368 | |
Snohomish County Public Utilities District, 5.00% due 12/1/2015 pre-refunded 6/1/2014 (Insured: AGM) | | AA/Aa3 | | | 5,015,000 | | | | 5,055,571 | |
Certified Semi-Annual Report 43
| | |
| SCHEDULE OF INVESTMENTS, CONTINUED | | |
| |
Thornburg Limited Term Municipal Fund | | March 31, 2014 (Unaudited) |
| | | | | | | | | | |
Issuer-Description | | Credit Rating†
S&P/ Moody’s | | Principal
Amount | | | Value | |
State of Washington COP, 5.00% due 7/1/2016 (State Agency Real Property Projects) (State Aid Withholding) | | NR/Aa2 | | $ | 2,415,000 | | | $ | 2,660,702 | |
State of Washington COP, 5.00% due 7/1/2017 (State Agency Real Property Projects) (State Aid Withholding) | | NR/Aa2 | | | 2,555,000 | | | | 2,894,151 | |
State of Washington COP, 5.00% due 7/1/2018 (State Agency Real Property Projects) (State Aid Withholding) | | NR/Aa2 | | | 2,670,000 | | | | 3,085,505 | |
State of Washington COP, 5.00% due 7/1/2019 (State & Local Agency Real & Personal Property Projects) (State Aid Withholding) | | NR/Aa2 | | | 1,000,000 | | | | 1,169,980 | |
State of Washington COP, 5.00% due 7/1/2020 (State & Local Agency Real & Personal Property Projects) (State Aid Withholding) | | NR/Aa2 | | | 3,290,000 | | | | 3,868,217 | |
State of Washington COP, 5.00% due 7/1/2021 (State & Local Agency Real & Personal Property Projects) (State Aid Withholding) | | NR/Aa2 | | | 3,125,000 | | | | 3,682,062 | |
State of Washington COP, 5.00% due 7/1/2022 (State & Local Agency Real & Personal Property Projects) (State Aid Withholding) | | NR/Aa2 | | | 3,000,000 | | | | 3,547,410 | |
State of Washington GO, 5.00% due 7/1/2015 (Public Highway, Bridge, Ferry Capital and Operating Costs) | | AA+/Aa1 | | | 5,355,000 | | | | 5,679,192 | |
State of Washington GO, 0% due 1/1/2018 (Stadium and Exhibition Center; Insured: Natl-Re) | | AA+/Aa1 | | | 4,000,000 | | | | 3,824,520 | |
State of Washington GO, 0% due 1/1/2019 (Stadium and Exhibition Center; Insured: Natl-Re) | | AA+/Aa1 | | | 3,000,000 | | | | 2,772,120 | |
State of Washington GO, 0% due 12/1/2019 (Public Highway, Bridge, Ferry Capital and Operating Costs; Insured: Natl-Re) | | AA+/Aa1 | | | 3,030,000 | | | | 2,734,060 | |
State of Washington Public Power Supply Systems, 0% due 7/1/2015 (Nuclear Project No. 3; Insured: Natl-Re/IBC) | | AA-/Aa1 | | | 3,000,000 | | | | 2,984,310 | |
Washington Health Care Facilities Authority, 5.00% due 8/15/2014 (Multicare Health Systems) | | AA-/Aa3 | | | 1,500,000 | | | | 1,525,350 | |
Washington Health Care Facilities Authority, 5.00% due 8/15/2015 (Multicare Health Systems) | | AA-/Aa3 | | | 2,000,000 | | | | 2,119,660 | |
Washington Health Care Facilities Authority, 5.00% due 8/15/2016 (Multicare Health Systems) | | AA-/Aa3 | | | 2,075,000 | | | | 2,275,901 | |
Washington Health Care Facilities Authority, 5.375% due 12/1/2016 (Group Health Cooperative of Puget Sound; Insured: AMBAC) | | BB+/NR | | | 2,000,000 | | | | 2,003,780 | |
Washington Health Care Facilities Authority, 5.00% due 7/1/2017 (Overlake Hospital Medical Center) | | A-/A2 | | | 1,245,000 | | | | 1,366,873 | |
Washington Health Care Facilities Authority, 5.00% due 8/15/2017 (Multicare Health Systems) | | AA-/Aa3 | | | 1,000,000 | | | | 1,121,520 | |
Washington Health Care Facilities Authority, 5.25% due 8/1/2018 (Highline Medical Center; Insured: FHA 242) (ETM) | | NR/NR | | | 7,935,000 | | | | 8,866,331 | |
Washington Health Care Facilities Authority, 5.00% due 8/15/2018 (Multicare Health Systems) | | AA-/Aa3 | | | 2,000,000 | | | | 2,276,520 | |
Washington Health Care Facilities Authority, 5.00% due 7/1/2019 (Overlake Hospital Medical Center) | | A-/A2 | | | 1,050,000 | | | | 1,176,168 | |
Washington Health Care Facilities Authority, 4.75% due 7/1/2020 (Overlake Hospital Medical Center) | | A-/A2 | | | 1,000,000 | | | | 1,097,830 | |
| | | |
WEST VIRGINIA — 0.15% | | | | | | | | | | |
Mason County PCR, 2.00% due 10/1/2022 put 10/1/2014 (Appalachian Power Co.) | | NR/Baa1 | | | 1,500,000 | | | | 1,508,175 | |
Monongalia County Building Commission, 5.25% due 7/1/2020 (Monongalia General Hospital) | | A-/NR | | | 3,545,000 | | | | 3,635,362 | |
West Virginia Higher Education Policy Commission, 5.00% due 4/1/2020 (Higher Education Facilities) | | A+/Aa3 | | | 1,000,000 | | | | 1,158,570 | |
West Virginia Higher Education Policy Commission, 5.00% due 4/1/2021 (Higher Education Facilities) | | A+/Aa3 | | | 1,000,000 | | | | 1,160,190 | |
West Virginia Higher Education Policy Commission, 5.00% due 4/1/2022 (Higher Education Facilities) | | A+/Aa3 | | | 1,500,000 | | | | 1,743,270 | |
West Virginia University Board of Governors, 5.00% due 10/1/2018 pre-refunded 10/1/2014 (West Virginia University Projects;
Insured: Natl-Re) | | AA-/Aa3 | | | 450,000 | | | | 460,868 | |
| | | |
WISCONSIN — 1.04% | | | | | | | | | | |
Fox Valley Technical College District GO, 2.00% due 12/1/2014 (Higher Education Facility Projects) | | NR/Aaa | | | 4,520,000 | | | | 4,576,048 | |
Fox Valley Technical College District GO, 3.00% due 12/1/2015 (Higher Education Facility Projects) | | NR/Aaa | | | 4,515,000 | | | | 4,721,606 | |
State of Wisconsin, 5.00% due 7/1/2015 (Petroleum Environmental Cleanup Fund Award Program) | | AA/Aa2 | | | 4,000,000 | | | | 4,240,600 | |
State of Wisconsin GO, 5.00% due 5/1/2016 pre-refunded 5/1/2014 (General Governmental Purposes; Insured: Natl-Re) | | AA/Aa2 | | | 1,665,000 | | | | 1,671,743 | |
Wisconsin Health & Educational Facilities Authority, 5.00% due 7/15/2014 (Aurora Health Care, Inc.) | | NR/A3 | | | 4,265,000 | | | | 4,321,639 | |
Wisconsin Health & Educational Facilities Authority, 5.00% due 7/15/2015 (Aurora Health Care, Inc.) | | NR/A3 | | | 4,100,000 | | | | 4,323,204 | |
Wisconsin Health & Educational Facilities Authority, 5.00% due 7/15/2016 (Aurora Health Care, Inc.) | | NR/A3 | | | 3,695,000 | | | | 4,017,352 | |
Wisconsin Health & Educational Facilities Authority, 5.00% due 4/15/2017 (Aurora Health Care, Inc.) | | NR/A3 | | | 1,295,000 | | | | 1,424,901 | |
Wisconsin Health & Educational Facilities Authority, 5.00% due 7/1/2017 (Agnesian Healthcare, Inc.) | | A-/A3 | | | 1,000,000 | | | | 1,107,900 | |
Wisconsin Health & Educational Facilities Authority, 5.00% due 7/15/2017 (Aurora Health Care, Inc.) | | NR/A3 | | | 5,025,000 | | | | 5,564,233 | |
Wisconsin Health & Educational Facilities Authority, 5.00% due 7/1/2018 (Agnesian Healthcare, Inc.) | | A-/A3 | | | 1,855,000 | | | | 2,084,631 | |
Wisconsin Health & Educational Facilities Authority, 5.00% due 7/1/2019 (Agnesian Healthcare, Inc.) | | A-/A3 | | | 1,000,000 | | | | 1,137,550 | |
Wisconsin Health & Educational Facilities Authority, 5.00% due 7/1/2020 (Agnesian Healthcare, Inc.) | | A-/A3 | | | 2,110,000 | | | | 2,396,411 | |
Wisconsin Health & Educational Facilities Authority, 5.00% due 8/15/2020 (ProHealth Care, Inc.) | | A+/A1 | | | 1,075,000 | | | | 1,238,379 | |
Wisconsin Health & Educational Facilities Authority, 5.00% due 8/15/2021 (ProHealth Care, Inc.) | | A+/A1 | | | 2,575,000 | | | | 2,946,521 | |
Wisconsin Health & Educational Facilities Authority, 5.00% due 8/15/2022 (ProHealth Care, Inc.) | | A+/A1 | | | 1,600,000 | | | | 1,801,200 | |
Wisconsin Health & Educational Facilities Authority, 5.125% due 8/15/2027 put 8/15/2016 (Aurora Health Care, Inc.) | | NR/A3 | | | 4,500,000 | | | | 4,952,520 | |
Wisconsin Health & Educational Facilities Authority, 5.00% due 11/15/2043 put 6/1/2021 (Ascension Health Alliance System) | | AA+/Aa2 | | | 10,000,000 | | | | 11,442,500 | |
WPPI Energy, 5.00% due 7/1/2021 (Power Supply System) | | A/A1 | | | 4,100,000 | | | | 4,798,025 | |
| | | | | | | | | | |
TOTAL INVESTMENTS — 93.87% (Cost $6,006,780,909) | | | | | | | | $ | 6,189,793,193 | |
OTHER ASSETS LESS LIABILITIES — 6.13% | | | | | | | | | 404,418,877 | |
| | | | | | | | | | |
NET ASSETS — 100.00% | | | | | | | | $ | 6,594,212,070 | |
| | | | | | | | | | |
44 Certified Semi-Annual Report
| | |
| SCHEDULE OF INVESTMENTS, CONTINUED | | |
| |
Thornburg Limited Term Municipal Fund | | March 31, 2014 (Unaudited) |
Footnote Legend
| † | Credit ratings are unaudited. Rating changes may have occurred subsequent to the reporting period end. Bonds issued with a maturity of one year or less are assigned Moody’s ratings from MIG-1 to MIG-4 and Standard and Poor’s ratings from SP-1+ to SP-3 with MIG-1 and SP-1+ being the strongest ratings. |
| a | Segregated as collateral for a when-issued security. |
Portfolio Abbreviations
To simplify the listings of securities, abbreviations are used per the table below:
| | |
| AGM | | Insured by Assured Guaranty Municipal Corp. |
| AMBAC | | Insured by American Municipal Bond Assurance Corp. |
| BAM | | Build America Mutual Insurance Co. |
| BHAC | | Insured by Berkshire Hathaway Assurance Corp. |
| CIFG | | Insured by CIFG Assurance North America Inc. |
| COP | | Certificates of Participation |
| DFA | | Development Finance Authority |
| EDA | | Economic Development Authority |
| ETM | | Escrowed to Maturity |
| FGIC | | Insured by Financial Guaranty Insurance Co. |
| FHA | | Insured by Federal Housing Administration |
| FNMA | | Collateralized by Federal National Mortgage Association |
| FSA | | Insured by Financial Security Assurance Co. |
| GNMA | | Collateralized by Government National Mortgage Association |
| GO | | General Obligation |
| HFA | | Health Facilities Authority |
| HFFA | | Health Facilities Financing Authority |
| | |
| IBC | | Insured Bond Certificate |
| IDA | | Industrial Development Authority |
| ISD | | Independent School District |
| JEA | | Jacksonville Electric Authority |
| LOC | | Letter of Credit |
| MBIA | | Insured by Municipal Bond Investors Assurance |
| Mtg | | Mortgage |
| NCSL | | National Conference of State Legislature |
| Natl-Re | | Insured by National Public Finance Guarantee Corp. |
| PCR | | Pollution Control Revenue Bond |
| PSF | | Guaranteed by Permanent School Fund |
| Q-SBLF | | Qualified School Bond Loan Fund |
| Radian | | Insured by Radian Asset Assurance |
| SCSDE | | Insured by South Carolina Department of Education |
| SONYMA | | State of New York Mortgage Authority |
| SPA | | Stand-by Purchase Agreement |
| Syncora | | Insured by Syncora Guarantee Inc. |
| USD | | Unified School District |
See notes to financial statements.
Certified Semi-Annual Report 45
| | |
| STATEMENT OF ASSETS AND LIABILITIES | | |
| |
Thornburg Limited Term Municipal Fund | | March 31, 2014 (Unaudited) |
| | | | |
ASSETS | | | | |
Investments at value (cost $6,006,780,909) (Note 2) | | $ | 6,189,793,193 | |
Cash | | | 353,086,057 | |
Receivable for investments sold | | | 10,402,160 | |
Receivable for fund shares sold | | | 25,012,210 | |
Interest receivable | | | 74,209,380 | |
Prepaid expenses and other assets | | | 133,144 | |
| | | | |
Total Assets | | | 6,652,636,144 | |
| | | | |
| |
LIABILITIES | | | | |
Payable for investments purchased | | | 37,679,197 | |
Payable for fund shares redeemed | | | 16,657,826 | |
Payable to investment advisor and other affiliates (Note 3) | | | 2,735,121 | |
Accounts payable and accrued expenses | | | 281,225 | |
Dividends payable | | | 1,070,705 | |
| | | | |
Total Liabilities | | | 58,424,074 | |
| | | | |
| |
NET ASSETS | | $ | 6,594,212,070 | |
| | | | |
NET ASSETS CONSIST OF | | | | |
Distribution in excess of net investment income | | $ | (1,051,028 | ) |
Net unrealized appreciation on investments | | | 183,012,284 | |
Accumulated net realized gain (loss) | | | (2,718,425 | ) |
Net capital paid in on shares of beneficial interest | | | 6,414,969,239 | |
| | | | |
| | $ | 6,594,212,070 | |
| | | | |
NET ASSET VALUE | | | | |
Class A Shares: | | | | |
Net asset value and redemption price per share ($2,152,787,148 applicable to 148,998,438 shares of beneficial interest outstanding - Note 4) | | $ | 14.45 | |
Maximum sales charge, 1.50% of offering price | | | 0.22 | |
| | | | |
Maximum offering price per share | | $ | 14.67 | |
| | | | |
| |
Class C Shares: | | | | |
Net asset value and offering price per share* ($756,820,184 applicable to 52,285,741 shares of beneficial interest outstanding - Note 4) | | $ | 14.47 | |
| | | | |
| |
Class I Shares: | | | | |
Net asset value, offering and redemption price per share ($3,684,604,738 applicable to 254,982,927 shares of beneficial interest outstanding - Note 4) | | $ | 14.45 | |
| | | | |
| * | Redemption price per share is equal to net asset value less any applicable contingent deferred sales charge. |
See notes to financial statements.
46 Certified Semi-Annual Report
| | |
| STATEMENT OF OPERATIONS | | |
| |
Thornburg Limited Term Municipal Fund | | Six Months Ended March 31, 2014 (Unaudited) |
| | | | |
INVESTMENT INCOME | | | | |
Interest income (net of premium amortized of $45,987,094) | | $ | 82,907,437 | |
| | | | |
| |
EXPENSES | | | | |
Investment advisory fees (Note 3) | | | 8,694,530 | |
Administration fees (Note 3) | | | | |
Class A Shares | | | 1,362,753 | |
Class C Shares | | | 481,216 | |
Class I Shares | | | 889,812 | |
Distribution and service fees (Note 3) | | | | |
Class A Shares | | | 2,725,506 | |
Class C Shares | | | 1,922,799 | |
Transfer agent fees | | | | |
Class A Shares | | | 320,910 | |
Class C Shares | | | 172,365 | |
Class I Shares | | | 365,445 | |
Registration and filing fees | | | | |
Class A Shares | | | 22,839 | |
Class C Shares | | | 26,034 | |
Class I Shares | | | 92,326 | |
Custodian fees (Note 3) | | | 362,808 | |
Professional fees | | | 46,410 | |
Accounting fees | | | 112,300 | |
Trustee fees | | | 107,030 | |
Other expenses | | | 231,602 | |
| | | | |
Total Expenses | | | 17,936,685 | |
Less: | | | | |
Fees paid indirectly (Note 3) | | | (83,488 | ) |
| | | | |
Net Expenses | | | 17,853,197 | |
| | | | |
Net Investment Income | | | 65,054,240 | |
| | | | |
REALIZED AND UNREALIZED GAIN (LOSS) | | | | |
Net realized gain (loss) on investments | | | (315,454 | ) |
Net change in unrealized appreciation (depreciation) of investments | | | 30,594,818 | |
| | | | |
Net Realized and Unrealized Gain | | | 30,279,364 | |
| | | | |
Net Increase in Net Assets Resulting from Operations | | $ | 95,333,604 | |
| | | | |
See notes to financial statements.
Certified Semi-Annual Report 47
| | |
| STATEMENTS OF CHANGES IN NET ASSETS | | |
| |
Thornburg Limited Term Municipal Fund | | |
| | | | | | | | |
| | | Six Months Ended
March 31, 2014* | | | Year Ended
September 30, 2013 | |
INCREASE (DECREASE) IN NET ASSETS FROM | | | | | | | | |
| | |
OPERATIONS | | | | | | | | |
Net investment income | | $ | 65,054,240 | | | $ | 126,117,448 | |
Net realized gain (loss) on investments | | | (315,454 | ) | | | 689,473 | |
Net unrealized appreciation (depreciation) on investments | | | 30,594,818 | | | | (146,825,824 | ) |
| | | | | | | | |
| | |
Net Increase (Decrease) in Net Assets Resulting from Operations | | | 95,333,604 | | | | (20,018,903 | ) |
| | |
DIVIDENDS TO SHAREHOLDERS | | | | | | | | |
From net investment income | | | | | | | | |
Class A Shares | | | (20,164,748 | ) | | | (40,405,210 | ) |
Class C Shares | | | (6,083,841 | ) | | | (12,785,802 | ) |
Class I Shares | | | (38,805,651 | ) | | | (72,926,436 | ) |
| | |
FUND SHARE TRANSACTIONS (NOTE 4) | | | | | | | | |
Class A Shares | | | (35,776,616 | ) | | | 96,586,210 | |
Class C Shares | | | (41,883,109 | ) | | | 36,889,825 | |
Class I Shares | | | 165,643,125 | | | | 495,171,312 | |
| | | | | | | | |
Net Increase in Net Assets | | | 118,262,764 | | | | 482,510,996 | |
| | |
NET ASSETS | | | | | | | | |
Beginning of Period | | | 6,475,949,306 | | | | 5,993,438,310 | |
| | | | | | | | |
| | |
End of Period | | $ | 6,594,212,070 | | | $ | 6,475,949,306 | |
| | | | | | | | |
| | |
Distribution in excess of net investment income | | $ | (1,051,028 | ) | | $ | (1,051,028 | ) |
See notes to financial statements.
48 Certified Semi-Annual Report
| | |
| NOTES TO FINANCIAL STATEMENTS | | |
| |
Thornburg Limited Term Municipal Fund | | March 31, 2014 (Unaudited) |
NOTE 1 – ORGANIZATION
Thornburg Limited Term Municipal Fund (the “Fund”) is a diversified series of Thornburg Investment Trust (the “Trust”). The Trust is organized as a Massachusetts business trust under a Declaration of Trust dated June 3, 1987 and is registered as a diversified, open-end management investment company under the Investment Company Act of 1940, as amended. The Fund is currently one of eighteen separate series of the Trust. Each series is considered to be a separate entity for financial reporting and tax purposes and bears expenses directly attributable to it. The Fund’s primary investment objective is to obtain as high a level of current income exempt from federal individual income taxes as is consistent, in the view of the Fund’s investment advisor, with the preservation of capital. The Fund’s secondary objective is to reduce expected changes in its share price compared to longer intermediate and long-term bond portfolios.
The Fund currently offers three classes of shares of beneficial interest: Class A, Class C, and Institutional Class (“Class I”). Each class of shares of the Fund represents an interest in the same portfolio of investments, except that (i) Class A shares are sold subject to a front-end sales charge collected at the time the shares are purchased and bear a service fee, (ii) Class C shares are sold at net asset value without a sales charge at the time of purchase, but are subject to a contingent deferred sales charge upon redemption within one year of purchase, and bear both a service fee and a distribution fee, (iii) Class I shares are sold at net asset value without a sales charge at the time of purchase and may be subject to a service fee, and (iv) the respective classes may have different reinvestment privileges and conversion rights. Additionally, the Fund may allocate among its classes certain expenses, to the extent allocable to specific classes, including transfer agent fees, government registration fees, certain printing and postage costs, and administrative and legal expenses. Currently, class specific expenses of the Fund are limited to service and distribution fees, administration fees, and certain registration and transfer agent expenses.
NOTE 2 – SIGNIFICANT ACCOUNTING POLICIES
Significant accounting policies of the Trust are as follows:
Valuation Policy and Procedures: The Fund’s Trustees of the Trust (the “Trustees”) have authorized employees of the Fund’s investment advisor, acting as the Valuation and Pricing Committee (the “Committee”), to make certain valuation determinations, subject to oversight and review by the Trustees and the Audit Committee of the Trustees. The Committee and other employees of the Fund’s investment advisor administer and implement the valuation process. The Committee regularly reviews its own fair value decisions, as well as valuations, valuation techniques and services furnished by pricing services, considers circumstances in the markets which may require valuation determinations by the Committee and reviews previous valuation determinations. The Committee also reports on its activities, the performance of the pricing services and other matters to the Trustees and the Audit Committee of the Trustees.
In determining a fair value for a portfolio investment, the Committee seeks to determine the price that the Fund would reasonably expect to receive upon a sale of the investment in an orderly transaction between market participants at the measurement date. Typically, the fair value process employs standing instructions to use quoted prices in active markets or the use of independent pricing services. Less frequently, the Committee may make a fair value determination using other methods. However, because fair value prices are estimated prices, the determination of fair value for an investment may differ from the value that would be realized by the Fund upon a sale of the investment, and that difference could be material to the Fund’s financial statements. The Committee’s determination of fair value for an investment may also differ from the prices obtained by other persons (including other mutual funds) for the investment.
Valuation of Investments: Debt obligations held by the Fund have a primary over-the-counter market and are valued by an independent pricing service approved by the Trustees. The pricing service ordinarily values debt obligations at quoted bid prices. When quotations are not available, debt obligations held by the Fund are valued at evaluated prices determined by the pricing service using methods which include consideration of yields or prices of debt obligations of comparable quality, type of issue, coupon, maturity and rating, and indications as to value from dealers and general market conditions. Short-term obligations having remaining maturities of 60 days or less are ordinarily valued at amortized cost, which approximates market value.
In any case when a pricing service fails to provide a price for a debt obligation held by the Fund, the Committee determines a fair value for the debt obligation using procedures in accordance with a policy approved by the Trustees, which may include the use of a price obtained from a different independent pricing service. Additionally, in any case when management believes that a price provided by a pricing service for a debt obligation held by the Fund may be unreliable, the Committee decides whether or not to use the pricing service’s valuation or to use an alternative method to determine a fair value for the debt obligation.
Valuation Measurements: The Fund categorizes its investments based upon the inputs used in valuing those investments, according to a three-level hierarchy established by guidance from the Financial Accounting Standards Board (the “FASB”). Categorization of investments using this hierarchy is intended by the FASB to maximize the use of observable inputs and minimize the use of unobservable inputs by prioritizing that the most observable input be used when available. Observable inputs are those that market participants would use in valuing an investment based on available market data. Unobservable inputs are those that reflect assumptions about the information market participants would use in valuing an investment. An investment’s level within the hierarchy is based on the lowest level input that is deemed significant to the fair value measurement. The methodologies and relative inputs used to value investments are not necessarily indications of the risk or liquidity associated with investing in those investments.
Certified Semi-Annual Report 49
| | |
| NOTES TO FINANCIAL STATEMENTS, CONTINUED | | |
| |
Thornburg Limited Term Municipal Fund | | March 31, 2014 (Unaudited) |
Various inputs are used in determining the fair value measurement of the Fund’s investments. These inputs are generally summarized according to the three-level hierarchy below:
Level 1: Quoted prices in active markets for identical investments.
Level 2: Other direct or indirect significant observable inputs (including quoted prices for similar investments in active markets and other observable inputs, such as interest rates, prepayment rates, credit risk, etc.).
Level 3: Significant unobservable inputs, (including the Committee’s own assumptions in determining the fair value of investments), are generally applicable to investments fair valued with single broker quotes and other investments.
Portfolio investments with minimal, if any, market activity are characterized as Level 3 and are valued using significant unobservable inputs, typically including single broker quotes, which may be adjusted or unadjusted, related or comparable investments, last available transactions, and other relevant information. Valuations may also be based upon current market prices of securities that are comparable in coupon, rating, maturity and industry. An income based valuation approach would consider discounted anticipated future cash flows of the investment. Discounts may also be applied due to the nature or duration of any restrictions on the disposition of the investment. The derived value of a Level 3 investment may not represent the value which is received upon disposition.
The following table displays a summary of the fair value hierarchy measurements of the Fund’s investments as of March 31, 2014. In any instance when valuation inputs from more than one level are used to determine the fair value of a specific investment, the investment is placed in the level of the table based upon the lowest level input that is significant in determining the fair value of the investment:
| | | | | | | | | | | | | | | | |
| | | Fair Value Measurements at March 31, 2014 | |
| | | Total | | | Level 1 | | | Level 2 | | | Level 3 | |
Assets | | | | | | | | | | | | | | | | |
Investments in Securities | | | | | | | | | | | | | | | | |
Municipal Bonds | | $ | 6,189,793,193 | | | $ | — | | | $ | 6,189,793,193 | | | $ | — | |
| | | | | | | | | | | | | | | | |
Total Investments in Securities | | $ | 6,189,793,193 | | | $ | — | | | $ | 6,189,793,193 | | | $ | — | |
In accordance with the guidance prescribed in Accounting Standards Update No. 2011-04, it is the policy of the Fund to recognize transfers between levels and those underlying events which caused the movement. The Fund recognized no transfers between levels for the six months ended March 31, 2014.
Federal Income Taxes: It is the policy of the Trust to comply with the provisions of the Internal Revenue Code applicable to “regulated investment companies” and to distribute to shareholders substantially all taxable (if any) and tax exempt income of the Fund. Therefore, no provision for federal income tax is required.
Management reviews each uncertain tax position believed to be material to the preparation of the Fund’s financial statements, to assess if it is more likely than not that the position would be sustained upon examination, based upon the technical merits of the position. As of March 31, 2014, management has not identified any such position for which an asset or liability must be reflected in the Statement of Assets and Liabilities. The Fund’s tax returns remain subject to examination for three years after filing.
When-Issued and Delayed Delivery Transactions: The Fund may engage in when-issued or delayed delivery transactions. To the extent the Fund engages in such transactions, it will do so for the purpose of acquiring portfolio investments consistent with the Fund’s investment objectives and not for the purpose of investment leverage or to speculate on interest rate and/or market changes. At the time the Fund makes a commitment to purchase an investment on a when-issued or delayed delivery basis, the Fund will record the transaction and reflect the value in determining its net asset value. When effecting such transactions, assets of an amount sufficient to make payment for the portfolio investments to be purchased will be segregated on the Fund’s records on the trade date. Investments purchased on a when-issued or delayed delivery basis do not earn interest until the settlement date.
Dividends: Net investment income of the Fund is declared daily as a dividend on shares for which the Fund has received payment. Dividends are paid monthly and are reinvested in additional shares of the Fund at net asset value per share at the close of business on the dividend payment date, or at the shareholder’s option, paid in cash. Net realized capital gains, to the extent available, will be distributed at least annually.
General: Investment transactions are accounted for on a trade date basis. Interest income is accrued as earned. Premiums and discounts on investments purchased are amortized to call dates or maturity dates of the respective investments. Realized gains and losses from the sale of investments are recorded on an identified cost basis. Net investment income (other than class specific expenses) and realized and unrealized gains and losses are allocated daily to each class of shares based upon the relative net asset value of outstanding shares (or the value of the dividend-eligible shares, as appropriate) of each class of shares at the beginning of the day (after adjusting for the current capital shares activity of the respective class). Expenses common to all Funds are allocated among the Funds comprising the Trust based upon their relative net asset values or other appropriate allocation methods.
50 Certified Semi-Annual Report
| | |
| NOTES TO FINANCIAL STATEMENTS, CONTINUED | | |
| |
Thornburg Limited Term Municipal Fund | | March 31, 2014 (Unaudited) |
Guarantees and Indemnifications: Under the Trust’s organizational documents (and under separate agreements with the independent Trustees), its officers and Trustees are indemnified against certain liabilities arising out of the performance of their duties to the Fund. Additionally, in the normal course of business the Trust enters into contracts with service providers that contain general indemnification clauses. The Trust’s maximum exposure under these arrangements is unknown. However, based on experience, the Trust expects the risk of loss to be remote.
Use of Estimates: The preparation of financial statements, in conformity with United States generally accepted accounting principles, requires management to make estimates and assumptions that affect the reported amounts of assets and liabilities and the disclosure of contingent assets and liabilities at the date of the financial statements and the reported amounts of increases and decreases in net assets from operations during the reporting period. Actual amounts could differ from those estimates.
NOTE 3 – INVESTMENT ADVISORY FEE AND OTHER TRANSACTIONS WITH AFFILIATES
Pursuant to an investment advisory agreement, Thornburg Investment Management, Inc. (the “Advisor”) serves as the investment advisor and performs services for the Fund for which the fees are payable at the end of each month. For the six months ended March 31, 2014, these fees were payable at annual rates ranging from .50 of 1% to .225 of 1% per annum of the average daily net assets of the Fund depending on the Fund’s asset size. The Trust also has entered into administrative services agreements with the Advisor, whereby the Advisor will perform certain administrative services for the shareholders of each class of the Fund’s shares, and for which fees will be payable at an annual rate of up to .125 of 1% per annum of the average daily net assets attributable to each class of shares.
The Trust has an underwriting agreement with Thornburg Securities Corporation (the “Distributor,” an affiliate of the Advisor), which acts as the distributor of the Fund’s shares. For the six months ended March 31, 2014, the Distributor has advised the Fund that it earned commissions aggregating $6,439 from the sale of Class A shares, and collected contingent deferred sales charges aggregating $33,013 from redemptions of Class C shares of the Fund.
Pursuant to a service plan under Rule 12b-1 of the Investment Company Act of 1940, the Fund may reimburse to the Advisor an amount not to exceed .25 of 1% per annum of the average daily net assets attributable to each class of shares of the Fund for payments made by the Advisor to securities dealers and other financial institutions to obtain various shareholder and distribution related services. For the six months ended March 31, 2014, there were no 12b-1 service plan fees charged for Class I shares. The Advisor may pay out of its own resources additional expenses for distribution of the Fund’s shares.
The Trust has also adopted a distribution plan pursuant to Rule 12b-1, applicable only to the Fund’s Class C shares under which the Fund compensates the Distributor for services in promoting the sale of Class C shares of the Fund at an annual rate of up to .25 of 1% per annum of the average daily net assets attributable to Class C shares. Total fees incurred by each class of shares of the Fund under their respective service and distribution plans for the six months ended March 31, 2014, are set forth in the Statement of Operations.
The Trust has an agreement with the custodian bank to indirectly pay a portion of the custodian’s fees through credits earned by the Fund’s cash on deposit with the bank. This deposit agreement is an alternative to overnight investments. Custodial fees are adjusted to reflect amounts that would have been paid without this agreement, with a corresponding adjustment reflected as fees paid indirectly in the Statement of Operations. For the six months ended March 31, 2014, fees paid indirectly were $83,488.
Certain officers and Trustees of the Trust are also officers or directors of the Advisor and Distributor. The compensation of independent Trustees is borne by the Trust.
Certified Semi-Annual Report 51
| | |
| NOTES TO FINANCIAL STATEMENTS, CONTINUED | | |
| |
Thornburg Limited Term Municipal Fund | | March 31, 2014 (Unaudited) |
NOTE 4 – SHARES OF BENEFICIAL INTEREST
At March 31, 2014, there were an unlimited number of shares of beneficial interest authorized. Transactions in shares of beneficial interest were as follows:
| | | | | | | | | | | | | | | | |
| | | Six Months Ended
March 31, 2014 (Unaudited) | | | Year Ended
September 30, 2013 (Audited) | |
| | | Shares | | | Amount | | | Shares | | | Amount | |
Class A Shares | | | | | | | | | | | | | | | | |
Shares sold | | | 22,225,832 | | | $ | 320,648,572 | | | | 49,484,325 | | | $ | 722,735,868 | |
Shares issued to shareholders in reinvestment of dividends | | | 1,275,908 | | | | 18,440,045 | | | | 2,462,968 | | | | 35,875,356 | |
Shares repurchased | | | (25,978,856 | ) | | | (374,865,233 | ) | | | (45,505,738 | ) | | | (662,025,014 | ) |
| | | | | | | | | | | | | | | | |
| | | | |
Net increase (decrease) | | | (2,477,116 | ) | | $ | (35,776,616 | ) | | | 6,441,555 | | | $ | 96,586,210 | |
| | | | | | | | | | | | | | | | |
| | | | |
Class C Shares | | | | | | | | | | | | | | | | |
Shares sold | | | 4,001,996 | | | $ | 57,901,307 | | | | 14,778,549 | | | $ | 216,826,246 | |
Shares issued to shareholders in reinvestment of dividends | | | 355,957 | | | | 5,154,204 | | | | 722,140 | | | | 10,538,739 | |
Shares repurchased | | | (7,257,344 | ) | | | (104,938,620 | ) | | | (13,088,746 | ) | | | (190,475,160 | ) |
| | | | | | | | | | | | | | | | |
| | | | |
Net increase (decrease) | | | (2,899,391 | ) | | $ | (41,883,109 | ) | | | 2,411,943 | | | $ | 36,889,825 | |
| | | | | | | | | | | | | | | | |
| | | | |
Class I Shares | | | | | | | | | | | | | | | | |
Shares sold | | | 57,476,755 | | | $ | 830,599,842 | | | | 107,226,983 | | | $ | 1,565,881,920 | |
Shares issued to shareholders in reinvestment of dividends | | | 2,391,797 | | | | 34,579,431 | | | | 4,478,918 | | | | 65,237,854 | |
Shares repurchased | | | (48,412,572 | ) | | | (699,536,148 | ) | | | (78,049,845 | ) | | | (1,135,948,462 | ) |
| | | | | | | | | | | | | | | | |
| | | | |
Net increase (decrease) | | | 11,455,980 | | | $ | 165,643,125 | | | | 33,656,056 | | | $ | 495,171,312 | |
| | | | | | | | | | | | | | | | |
NOTE 5 – INVESTMENT TRANSACTIONS
For the six months ended March 31, 2014, the Fund had purchase and sale transactions of investments (excluding short-term investments) of $304,427,961 and $324,070,002, respectively.
NOTE 6 – INCOME TAXES
At March 31, 2014, information on the tax components of capital was as follows:
| | | | |
Cost of investments for tax purposes | | $ | 6,006,780,909 | |
| | | | |
Gross unrealized appreciation on a tax basis | | $ | 204,354,783 | |
Gross unrealized depreciation on a tax basis | | | (21,342,499 | ) |
| | | | |
Net unrealized appreciation (depreciation) on investments (tax basis) | | $ | 183,012,284 | |
| | | | |
52 Certified Semi-Annual Report
| | |
| NOTES TO FINANCIAL STATEMENTS, CONTINUED | | |
| |
Thornburg Limited Term Municipal Fund | | March 31, 2014 (Unaudited) |
At March 31, 2014, the Fund had deferred tax basis capital losses occurring subsequent to October 31, 2012 of $299,746. For tax purposes, such losses will be reflected in the year ending September 30, 2014.
At March 31, 2014, the Fund had cumulative tax basis capital losses generated prior to October 1, 2011, which may be carried forward to offset future capital gains. To the extent such carryforwards are used, capital gain distributions may be reduced to the extent provided by regulations.
Such capital loss carryforwards expire as follows:
| | | | |
2015 | | $ | 1,903,834 | |
2016 | | | 192,444 | |
| | | | |
| | $ | 2,096,278 | |
| | | | |
OTHER NOTES:
Risks: The Fund’s investments subject it to risks including, but not limited to, credit risk, interest rate risk, management risk, market and economic risk, and liquidity risk. Please see the Fund’s prospectus for a discussion of the risks associated with an investment in the Fund.
Subsequent Events: Fund management believes no events have occurred between March 31, 2014 and the date of issuance of the financial statements that require adjustment to or disclosure in the accompanying financial statements.
Certified Semi-Annual Report 53
FINANCIAL HIGHLIGHTS
Thornburg Limited Term Municipal Fund
| | | | | | | | | | | | | | | | | | | | | | | | | | | | | | | | | | | | | | | | | | | | | | | | |
| | | PER SHARE PERFORMANCE (for a share outstanding throughout the Period)+ | | RATIOS TO AVERAGE NET ASSETS | | | SUPPLEMENTAL DATA | |
Unless
Otherwise
Noted,
Periods
are
Fiscal
Years
Ended
Sept. 30, | | Net Asset
Value
Beginning
of Period | | | Net
Investment
Income
(Loss) | | Net
Realized
&
Unrealized
Gain (Loss)
on
Investments | | | Total from
Investment
Operations | | Dividends
from Net
Investment
Income | | | Dividends
from Net
Realized
Gains | | Total
Dividends | | | Net
Asset
Value
End
of
Period | | Net
Investment
Income
(Loss)
(%) | | | Expenses,
After
Expense
Reductions
(%) | | | Expenses,
After
Expense
Reductions
and
Net of
Custody
Credits
(%) | | | Expenses,
Before
Expense
Reductions
(%) | | | Total
Return
(%)(a) | | Portfolio
Turnover
Rate
(%)(a) | | Net
Assets
at End
of
Period
(Thousands) | |
CLASS A SHARES | | | | | | | | | | | | | | | | | | | | | | | | | | | | | | | | | | | | | | | | | | |
2014(b)(c) | | $ | 14.38 | | | 0.13 | | | 0.07 | | | 0.20 | | | (0.13 | ) | | — | | | (0.13 | ) | | $14.45 | | | 1.85 | (d) | | | 0.70 | (d) | | | 0.70 | (d) | | | 0.70 | (d) | | 1.42 | | 5.04 | | $ | 2,152,787 | |
2013(b) | | $ | 14.70 | | | 0.26 | | | (0.32 | ) | | (0.06) | | | (0.26 | ) | | — | | | (0.26 | ) | | $14.38 | | | 1.81 | | | | 0.71 | | | | 0.71 | | | | 0.71 | | | (0.39) | | 17.47 | | $ | 2,178,317 | |
2012(b) | | $ | 14.39 | | | 0.31 | | | 0.31 | | | 0.62 | | | (0.31 | ) | | — | | | (0.31 | ) | | $14.70 | | | 2.13 | | | | 0.72 | | | | 0.72 | | | | 0.72 | | | 4.36 | | 12.72 | | $ | 2,131,540 | |
2011(b) | | $ | 14.27 | | | 0.36 | | | 0.12 | | | 0.48 | | | (0.36 | ) | | — | | | (0.36 | ) | | $14.39 | | | 2.53 | | | | 0.74 | | | | 0.74 | | | | 0.74 | | | 3.43 | | 16.15 | | $ | 1,649,965 | |
2010(b) | | $ | 14.00 | | | 0.37 | | | 0.28 | | | 0.65 | | | (0.38 | ) | | — | | | (0.38 | ) | | $14.27 | | | 2.66 | | | | 0.78 | | | | 0.78 | | | | 0.78 | | | 4.70 | | 12.57 | | $ | 1,613,582 | |
2009(b) | | $ | 13.22 | | | 0.47 | | | 0.78 | | | 1.25 | | | (0.47 | ) | | — | | | (0.47 | ) | | $14.00 | | | 3.50 | | | | 0.86 | | | | 0.86 | | | | 0.86 | | | 9.67 | | 12.18 | | $ | 1,040,628 | |
CLASS C SHARES | | | | | | | | | | | | | | | | | | | | | | | | | | | | | | | | | | | | | | | | | | |
2014(c) | | $ | 14.41 | | | 0.11 | | | 0.06 | | | 0.17 | | | (0.11 | ) | | — | | | (0.11 | ) | | $14.47 | | | 1.58 | (d) | | | 0.97 | (d) | | | 0.97 | (d) | | | 0.97 | (d) | | 1.21 | | 5.04 | | $ | 756,820 | |
2013 | | $ | 14.72 | | | 0.23 | | | (0.31 | ) | | (0.08) | | | (0.23 | ) | | — | | | (0.23 | ) | | $14.41 | | | 1.55 | | | | 0.97 | | | | 0.97 | | | | 0.97 | | | (0.58) | | 17.47 | | $ | 795,052 | |
2012 | | $ | 14.41 | | | 0.27 | | | 0.31 | | | 0.58 | | | (0.27 | ) | | — | | | (0.27 | ) | | $14.72 | | | 1.85 | | | | 0.99 | | | | 0.99 | | | | 0.99 | | | 4.08 | | 12.72 | | $ | 777,026 | |
2011 | | $ | 14.30 | | | 0.32 | | | 0.11 | | | 0.43 | | | (0.32 | ) | | — | | | (0.32 | ) | | $14.41 | | | 2.27 | | | | 1.00 | | | | 1.00 | | | | 1.00 | | | 3.08 | | 16.15 | | $ | 525,923 | |
2010 | | $ | 14.02 | | | 0.33 | | | 0.29 | | | 0.62 | | | (0.34 | ) | | — | | | (0.34 | ) | | $14.30 | | | 2.36 | | | | 1.05 | | | | 1.05 | | | | 1.55 | | | 4.48 | | 12.57 | | $ | 481,808 | |
2009 | | $ | 13.24 | | | 0.43 | | | 0.79 | | | 1.22 | | | (0.44 | ) | | — | | | (0.44 | ) | | $14.02 | | | 3.21 | | | | 1.13 | | | | 1.13 | | | | 1.63 | | | 9.37 | | 12.18 | | $ | 206,952 | |
CLASS I SHARES | | | | | | | | | | | | | | | | | | | | | | | | | | | | | | | | | | | | | | | | | | |
2014(c) | | $ | 14.38 | | | 0.16 | | | 0.07 | | | 0.23 | | | (0.16 | ) | | — | | | (0.16 | ) | | $14.45 | | | 2.18 | (d) | | | 0.37 | (d) | | | 0.37 | (d) | | | 0.37 | (d) | | 1.58 | | 5.04 | | $ | 3,684,605 | |
2013 | | $ | 14.70 | | | 0.31 | | | (0.32 | ) | | (0.01) | | | (0.31 | ) | | — | | | (0.31 | ) | | $14.38 | | | 2.15 | | | | 0.37 | | | | 0.37 | | | | 0.37 | | | (0.05) | | 17.47 | | $ | 3,502,580 | |
2012 | | $ | 14.39 | | | 0.36 | | | 0.31 | | | 0.67 | | | (0.36 | ) | | — | | | (0.36 | ) | | $14.70 | | | 2.46 | | | | 0.39 | | | | 0.39 | | | | 0.39 | | | 4.71 | | 12.72 | | $ | 3,084,872 | |
2011 | | $ | 14.27 | | | 0.41 | | | 0.12 | | | 0.53 | | | (0.41 | ) | | — | | | (0.41 | ) | | $14.39 | | | 2.87 | | | | 0.40 | | | | 0.40 | | | | 0.40 | | | 3.78 | | 16.15 | | $ | 2,228,418 | |
2010 | | $ | 14.00 | | | 0.41 | | | 0.28 | | | 0.69 | | | (0.42 | ) | | — | | | (0.42 | ) | | $14.27 | | | 2.98 | | | | 0.44 | | | | 0.44 | | | | 0.44 | | | 5.04 | | 12.57 | | $ | 1,890,196 | |
2009 | | $ | 13.22 | | | 0.51 | | | 0.79 | | | 1.30 | | | (0.52 | ) | | — | | | (0.52 | ) | | $14.00 | | | 3.81 | | | | 0.53 | | | | 0.53 | | | | 0.53 | | | 10.03 | | 12.18 | | $ | 865,827 | |
| (a) | Not annualized for periods less than one year. |
| (b) | Sales loads are not reflected in computing total return. |
| (c) | Unaudited Six Month Period Ended March 31. |
| + | Based on weighted average shares outstanding, except for Dividends from Net Investment Income and Net Realized Gains, which are actual amounts per share. |
See notes to financial statements.
| | | | |
| 54 Certified Semi-Annual Report | | | | Certified Semi-Annual Report 55 |
| | |
| EXPENSE EXAMPLE | | |
| |
Thornburg Limited Term Municipal Fund | | March 31, 2014 (Unaudited) |
As a shareholder of the Fund, you incur two types of costs:
| | (1) | transaction costs, including |
(a) sales charges (loads) on purchase payments, for Class A shares;
(b) a deferred sales charge on redemptions of any part or all of a purchase of $1 million of Class A shares within 12 months of purchase;
(c) a deferred sales charge on redemptions of Class C shares within 12 months of purchase;
| | (2) | ongoing costs, including management fees; distribution and/or service (12b-1) fees; and other Fund expenses. |
This example is intended to help you understand your ongoing costs (in dollars) of investing in the Fund and to compare these costs with the ongoing costs of investing in other mutual funds.
The example is based on a $1,000 investment beginning on October 1, 2013, and held until March 31, 2014.
| | | | | | | | | | | | |
| | | Beginning
Account Value
10/1/13 | | | Ending
Account Value
3/31/14 | | | Expenses paid
During period†
10/1/13–3/31/14 | |
Class A Shares | | | | | | | | | | | | |
Actual | | $ | 1,000.00 | | | $ | 1,014.20 | | | $ | 3.50 | |
Hypothetical* | | $ | 1,000.00 | | | $ | 1,021.45 | | | $ | 3.52 | |
Class C Shares | | | | | | | | | | | | |
Actual | | $ | 1,000.00 | | | $ | 1,012.10 | | | $ | 4.85 | |
Hypothetical* | | $ | 1,000.00 | | | $ | 1,020.11 | | | $ | 4.87 | |
Class I Shares | | | | | | | | | | | | |
Actual | | $ | 1,000.00 | | | $ | 1,015.80 | | | $ | 1.84 | |
Hypothetical* | | $ | 1,000.00 | | | $ | 1,023.10 | | | $ | 1.85 | |
| † | Expenses are equal to the annualized expense ratio for each class (A: 0.70%; C: 0.97%; I: 0.37%) multiplied by the average account value over the period, multiplied by 182/365 to reflect the one-half year period. |
| * | Hypothetical assumes a rate of return of 5% per year before expenses. |
ACTUAL EXPENSES
For each class of shares, the first line of the accompanying table provides information about actual account values and actual expenses. You may use the information in this line, together with the amount you invested, to estimate the expenses that you paid over the period. Simply divide your account value by $1,000 (for example, an $8,600 account value divided by $1,000 = 8.6), then multiply the result by the number in the first line for your class of shares under the heading entitled “Expenses Paid During Period” to estimate the expenses you paid on your account during this period.
HYPOTHETICAL EXAMPLE FOR COMPARISON PURPOSES
For each class of shares, the second line of the accompanying table provides information about hypothetical account values and hypothetical expenses based on the Fund’s actual expense ratio and an assumed rate of return of 5% per year before expenses, which is not the Fund’s actual return. The hypothetical account values and expenses may not be used to estimate the actual ending account balance or expenses you paid for the period. You may use this information to compare the ongoing costs of investing in the Fund and other funds. To do so, compare this 5% hypothetical example with the 5% hypothetical examples that appear in the shareholder reports of the other funds.
Please note that the expenses shown in the table are meant to highlight your ongoing costs only and do not reflect any transactional costs, such as sales charges (loads), redemption fees, or exchange fees. Therefore, the second line of the table for each class of shares is useful in comparing ongoing costs only, and will not help you determine the relative total costs of owning different funds. In addition, if these transactional costs were included, your costs would have been higher.
56 Certified Semi-Annual Report
| | |
| OTHER INFORMATION | | |
| |
Thornburg Limited Term Municipal Fund | | March 31, 2014 (Unaudited) |
PORTFOLIO PROXY VOTING
Policies and Procedures:
The Trust has delegated to Thornburg Investment Management, Inc. (the “Advisor”) voting decisions respecting proxies for the Fund’s voting securities. The Advisor makes voting decisions in accordance with its Proxy Voting Policy. A description of the Policy is available (i) without charge, upon request, by calling the Advisor toll-free at 1-800-847-0200, (ii) on the Thornburg website at www.thornburg. com, and (iii) on the Securities and Exchange Commission’s website at www.sec.gov.
Information regarding how proxies were voted is available on or before August 31 of each year for the twelve months ending the preceding June 30. This information is available (i) without charge, upon request by calling the Advisor toll-free at 1-800-847-0200, (ii) on the Thornburg website at www.thornburg.com, and (iii) on the Securities and Exchange Commission’s website at www.sec.gov.
AVAILABILITY OF QUARTERLY PORTFOLIO SCHEDULE
The Fund files with the Securities and Exchange Commission schedules of its portfolio holdings on Form N-Q for the first and third quarters of each fiscal year. The Fund’s Forms N-Q are available on the Commission’s website at www.sec.gov, or may be reviewed and copied at the Commission’s Public Reference Room in Washington, D.C. Information on the operation of the Public Reference Room may be obtained by calling 1-800-SEC-0330. The Fund also makes this information available on its website at www.thornburg. com/download or upon request by calling 1-800-847-0200.
Certified Semi-Annual Report 57
TRUSTEES’ STATEMENT TO SHAREHOLDERS
Not part of the Certified Semi-Annual Report
Reissued September 15, 2013
The Trustees believe current and prospective shareholders should know how we discharge our responsibilities in supervising the Funds’ investment advisor and in reviewing the advisor’s contract for renewal. Since 2005, we have issued a statement which sets out clearly the three principal guidelines that we follow in supervising the Trust’s investment advisor on your behalf. In accordance with our customary practice, in September of this year we again reviewed our statement and concluded we should reissue this statement outlining the principal features of our supervision of the advisor’s performance of investment management services for the Funds.
We begin with the premise that each shareholder selected his or her Fund because its investments are managed by the investment advisor identified in the prospectus and in accordance with the objective and policies described in the prospectus. We realize, as each of you do, that if you believe that your Fund’s stated objective and policies no longer serve your personal investment goals, you can sell your shares and leave the Fund.
Therefore, we believe that our primary supervisory task – our principal obligation to you – is to assess the nature and quality of the advisor’s services, and to confirm that the advisor actively and competently pursues the Fund’s objective, in accordance with the policies set out in the prospectus. To do this, we meet regularly with management to review your Fund’s portfolio and to discuss the advisor’s specific actions and judgments in pursuing the Fund’s objective. We do not substitute our own judgment for the advisor’s decisions in selecting investments; the advisor is paid to exercise its informed judgment on investment decisions, and we seek to confirm, in reviewing the advisor’s performance, that the advisor is doing just that.
Second, while we are conscious of costs and the effect that costs have on shareholders’ returns, we do not seek the lowest fees or expense ratio as our sole or primary objective. We try to make sure that your Fund’s fees and costs are reasonable in relationship to the services rendered and that they are generally in line with those charged by other expert investment advisors, consistent with our belief that the Fund’s investors searched for and expect that expertise and attention and have decided to pay a reasonable price for it. We do not put the management contract “out to bid” as a matter of course, and we would not do so unless we had concluded that the advisor materially had failed to pursue the Fund’s objectives in accordance with its policies, or for other equally important reasons. We believe that any other approach would be inconsistent with your interests and contrary to your expectations when you bought shares of the Fund in the first place.
Finally, because we believe that most Thornburg Fund shareholders have invested with a long-term perspective, we try not to focus too much on the fashions of the moment and on short-term performance. The market will not favor any specific investment objective or set of policies at all times and under all economic circumstances. A fund will experience periods of both high and low returns relative to other funds and other investments. Even if one of our Funds is not favored by the market at a particular time, we believe that the advisor is nonetheless obliged to remain true to the Fund’s objective and policies, and we watch to see that it does so.
58 This page is not part of the Semi-Annual Report
RETIREMENT AND EDUCATION ACCOUNTS
Thornburg Investment Management offers retirement and education savings accounts that can help you meet a variety of planning challenges. For account applications or further information on any of the accounts below, please call 1-800-847-0200 or go to www.thornburg.com/ira. Your financial advisor can help you determine which plan is right for you.
Individual Retirement Accounts
Individual Retirement Accounts (IRAs) provide a tax-advantaged means to save money for the future. For a detailed outline of the difference between retirement accounts, see www.thornburg.com/ira. Rollovers are available. Call 1-800-847-0200 for more information.
Traditional IRAs – Contributions to Traditional IRAs are tax deductible for eligible individuals, and withdrawals are taxed as additional ordinary income. You may contribute to an IRA if you receive compensation and are under 70 1/2, even if you are covered by an employer retirement plan. Deductible contributions are subject to certain qualifications. Please consult your tax advisor.
Roth IRAs – Under a Roth IRA, there is no tax deduction for contributions, but there is no income tax on qualified withdrawals. For a more detailed comparison of Traditional and Roth IRAs, please see our website at www.thornburg. com/ira.
SEP IRAs – Simplified Employee Pension (SEP) IRAs are established by employers. The employer is allowed a tax deduction for contributions made to the SEP Plan and makes contributions to each eligible employee’s SEP IRA on a discretionary basis.
SIMPLE IRAs – Savings Incentive Match Plan for Employees of Small Employers (SIMPLE) is designed to give small business owners a simplified method to establish and contribute to a retirement plan for employees. The employer is allowed a tax deduction for contributions and makes either matching or non-elective contributions to each eligible employee’s SIMPLE IRA. Employees may make salary deferral contributions.
Coverdell Education Savings Account
These savings accounts are designed to provide a way to save money for higher education expenses. In an Education Savings Account, earnings and interest grow tax-free, and qualified withdrawals used to pay for eligible higher-education expenses are tax- and penalty-free.
Funds Available
The following funds are available in the accounts listed above:
| | • | | Thornburg Core Growth Fund |
| | • | | Thornburg International Value Fund |
| | • | | Thornburg International Growth Fund |
| | • | | Thornburg Developing World Fund |
| | • | | Thornburg Investment Income Builder Fund |
| | • | | Thornburg Global Opportunities Fund |
| | • | | Thornburg Low Duration Income Fund |
| | • | | Thornburg Limited Term U.S. Government Fund |
| | • | | Thornburg Limited Term Income Fund |
| | • | | Thornburg Strategic Income Fund |
This page is not part of the Semi-Annual Report 59

60 This page is not part of the Semi-Annual Report
THORNBURG FUND FAMILY
Thornburg Equity Funds
Thornburg’s equity research uses a fundamentally driven, bottom-up, comprehensive analytical approach. Thornburg equity funds generally focus on a limited number of securities so that each holding can impact performance. The team searches for firms believed to have a promising future and seeks to buy shares of those companies at a discount to their intrinsic or long-term value.
| | • | | Thornburg Core Growth Fund |
| | • | | Thornburg International Value Fund |
| | • | | Thornburg International Growth Fund |
| | • | | Thornburg Developing World Fund |
| | • | | Thornburg Investment Income Builder Fund |
| | • | | Thornburg Global Opportunities Fund |
Thornburg Bond Funds
Thornburg Investment Management applies a disciplined philosophy to fixed-income management. Since the launch of our first fixed-income fund over 25 years ago, we have been conducting fundamental, bottom-up research in an effort to identify bonds which we believe provide the best return for a given level of risk. We avoid leverage or complex strategies which could backfire in periods of market uncertainty.
| | • | | Thornburg Low Duration Income Fund |
| | • | | Thornburg Limited Term U.S. Government Fund |
| | • | | Thornburg Limited Term Income Fund |
| | • | | Thornburg Strategic Income Fund |
| | • | | Thornburg Low Duration Municipal Fund |
| | • | | Thornburg Limited Term Municipal Fund |
| | • | | Thornburg Intermediate Municipal Fund |
| | • | | Thornburg California Limited Term Municipal Fund |
| | • | | Thornburg New Mexico Intermediate Municipal Fund |
| | • | | Thornburg New York Intermediate Municipal Fund |
| | • | | Thornburg Strategic Municipal Income Fund |
Before investing, carefully consider the Fund’s investment goals, risks, charges, and expenses. For a prospectus or summary prospectus containing this and other information, contact your financial advisor or visit thornburg.com. Read it carefully before investing.
For additional information, please visit thornburg.com
Thornburg Investment Management, Inc. 2300 North Ridgetop Road, Santa Fe, NM 87506
This page is not part of the Semi-Annual Report 61
This page intentionally left blank.
62 This page is not part of the Semi-Annual Report
This page intentionally left blank.
This page is not part of the Semi-Annual Report 63

This Semi-Annual Report is submitted for the general information of shareholders of the Fund. It is not authorized for distribution to prospective investors in the Fund unless preceded or accompanied by an effective prospectus.
| | | | |
| Investment Advisor: | | Distributor: | | |
| Thornburg Investment Management® | | Thornburg Securities Corporation® | | |
| 800.847.0200 | | 800.847.0200 | | TH1072 |

2 This page is not part of the Semi-Annual Report
Important Information
The information presented on the following pages was current as of March 31, 2014. The managers’ views, portfolio holdings, and sector diversification are provided for the general information of the Fund’s shareholders; to the extent this information is historical, it should not be considered predictive of future circumstances. This material should not be deemed a recommendation to buy or sell any of the securities mentioned.
Investments in the Fund carry risks, including possible loss of principal. Bond funds have the same interest rate, inflation, and credit risks that are associated with the underlying bonds. The principal value of bonds will fluctuate relative to changes in interest rates, decreasing when interest rates rise. Unlike bonds, bond funds have ongoing fees and expenses. Please see the Fund’s Prospectus for a discussion of the risks associated with an investment in the Fund. Investments in the Fund are not FDIC insured, nor are they deposits of or guaranteed by a bank or any other entity. There is no guarantee that the Fund will meet its investment objectives. Diversification does not assure or guarantee better performance and cannot eliminate the risk of investment losses. The laddering strategy does not assure or guarantee better performance and cannot eliminate the risk of investment losses.
Performance data given at net asset value (NAV) does not take into account applicable sales charges. If the sales charges had been included, the performance would have been lower.
Minimum investments for Class I shares are higher than those for other classes. Class I shares may not be available to all investors.
| | | | |
SHARE CLASS | | NASDAQ SYMBOL | | CUSIP |
Class A | | THIMX | | 885-215-202 |
Class C | | THMCX | | 885-215-780 |
Class I | | THMIX | | 885-215-673 |
Glossary
Bloomberg Economic Evaluation of States (BEES) Index – A survey, updated quarterly, that examines the pace of states’ growth following the 18-month recession that officially ended in June 2009.
Bloomberg State Stock Indices – Capitalization-weighted indices consisting of equities domiciled in each state.
BofA Merrill Lynch 3-15 Year U.S. Municipal Securities Index – This index is a subset of the BofA Merrill Lynch U.S. Municipal Securities Index including all securities with a remaining term to final maturity greater than or equal to 3 years and less than 15 years.
Consumer Price Index (CPI) – Index that measures prices of a fixed basket of goods bought by a typical consumer, including food, transportation, shelter, utilities, clothing, medical care, entertainment and other items. The CPI, published by the Bureau of Labor Statistics in the Department of Labor, is based at 100 in 1982 and is released monthly. It is widely used as a cost-of-living benchmark to adjust Social Security payments and other payment schedules, union contracts and tax brackets. Also known as the cost-of-living index.
Unless otherwise noted, index returns reflect the reinvestment of income dividends and capital gains, if any, but do not reflect fees, brokerage commissions or other expenses of investing. Investors may not make direct investments into any index.
Alternative Minimum Tax (AMT) – A federal tax aimed at ensuring that high-income individuals, estates, trusts, and corporations pay a minimal level income tax. For individuals, the AMT is calculated by adding tax preference items to regular taxable income.
Annualized Distribution Yield – The distribution yield reflects actual distributions made to shareholders. The annualized distribution yield is calculated by summing the last 30 days of income at a given month end and annualizing to a 360-day year. The result is divided by the ending maximum offering price.
Barbell Structure – A bond investment strategy that concentrates holdings in shorter-term and longer-term maturities, forming a structure that resembles a barbell.
Basis Point (bp) – A unit equal to 1/100th of 1%. 1% = 100 basis points (bps).
Bond Credit Ratings – A bond credit rating assesses the financial ability of a debt issuer to make timely payments of principal and interest. Ratings of AAA (the highest), AA, A, and BBB are investment-grade quality. Ratings of BB, B, CCC, CC, C, and D (the lowest) are considered below investment grade, speculative grade, or junk bonds. Unless otherwise noted, the ratings listed are from Municipal Market Data and are a combination of ratings from Standard and Poor’s, Moody’s Investors Service, and Fitch Ratings.
Bullet Structure – A bond investment strategy that concentrates holdings in intermediate-term maturities and avoids shorter-term or longer-term maturities.
Credit Spread/Quality Spread – The difference between the yields of securities with different credit qualities.
Duration – A bond’s sensitivity to interest rates. Bonds with longer durations experience greater price volatility than bonds with shorter durations.
Effective Duration – A bond’s sensitivity to interest rates, incorporating the embedded option features, such as call provisions. Bonds with longer durations experience greater price volatility than bonds with shorter durations.
Fed Funds Rate – The interest rate at which a depository institution lends immediately available funds (balances at the Federal Reserve) to another depository institution overnight.
General Obligation Bond – A municipal bond backed by the credit and “taxing power” of the issuing jurisdiction rather than the revenue from a given project.
Gross Domestic Product (GDP) – A country’s income minus foreign investments: the total value of all goods and services produced within a country in a year, minus net income from investments in other countries.
Midpoint-Neutral Duration – A fund’s midpoint duration is the middle of the duration range established for that fund’s investment strategy.
Participation Rate – The number of people who are either employed or are actively looking for work. The people who are no longer actively searching for work would not be included in the participation rate. During an economic recession, many workers often get discouraged and stop looking for employment, as a result, the participation rate decreases.
Quantitative Easing – The Federal Reserve’s monetary policy intended to stimulate the U.S. economy following the recession that began in 2007/08.
Quantitative Easing 3 (QE3) – The third round of the Federal Reserve’s monetary policy intended to stimulate the U.S. economy following the recession that began in 2007/08. Announced in September 2012 and revised in December 2012, December 2013, and January 2014, the Fed intends to buy $65 billion in mortgage-backed securities and Treasuries each month until the economy improves.
SEC Yield – SEC yield is computed in accordance with SEC standards measuring the net investment income per share over a specified 30-day period expressed as a percentage of the maximum offering price of the Fund’s shares at the end of the period.
Yield Curve – A line that plots the interest rates, at a set point in time, of bonds having equal credit quality, but differing maturity dates.
This page is not part of the Semi-Annual Report 3
Thornburg Intermediate Municipal Fund
Laddering – an All Weather Strategy
At Thornburg, our approach to management of the Fund is based on the premise that investors in the Fund seek preservation of capital along with an attractive, relatively stable yield. While aggressive bond strategies may generate stronger returns when the market is turning a blind eye towards risk, they often fail to stack up over longer periods of time.
We apply these techniques to manage risk and pursue attractive returns:
| | • | | Building a laddered portfolio. Laddering has been shown over time to mitigate reinvestment and interest-rate risk. |
| | • | | Conducting in-depth fundamental research on each issue and actively monitoring positions for subsequent credit events. |
| | • | | Diversifying among a large number of generally high-quality bonds. |
| | • | | Investing on a cash-only basis without using leverage. |
Portfolio Managers

Josh Gonze Chris Ryon, CFA
Objectives and Strategies
The Fund’s primary investment goal is to obtain as high a level of current income exempt from federal individual income taxes as is consistent, in the view of the Fund’s investment advisor, with preservation of capital (may be subject to Alternative Minimum Tax).
The secondary goal of the Fund is to reduce expected changes in its share price compared to long-term bond portfolios.
This Fund is a laddered portfolio of municipal bonds with an average maturity of normally three to ten years. Laddering involves building a portfolio of bonds with staggered maturities so that a portion of the portfolio matures each year. Cash from maturing bonds, if not needed for other purposes, is invested in bonds with longer maturities at the far end of the ladder. We regard the strategy as a good compromise for managing different types of risk.
Long-Term Stability of Principal
Net Asset Value History of A Shares from July 22, 1991 through March 31, 2014
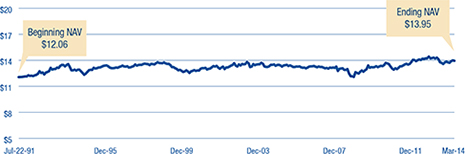
Average Annual Total Returns
For Periods Ended March 31, 2014
| | | | | | | | | | | | | | | | | | | | |
| | | 1 YR | | | 3 YRS | | | 5 YRS | | | 10 YRS | | | SINCE
INCEPTION | |
A Shares (Incep: 7/22/91) | | | | | | | | | | | | | | | | | | | | |
Without sales charge | | | 0.48 | % | | | 5.27 | % | | | 5.56 | % | | | 3.84 | % | | | 5.07 | % |
With sales charge | | | -1.52 | % | | | 4.55 | % | | | 5.14 | % | | | 3.63 | % | | | 4.98 | % |
Performance data shown represents past performance and is no guarantee of future results. Investment return and principal value will fluctuate so shares, when redeemed, may be worth more or less than their original cost. Current performance may be lower or higher than quoted. For performance current to the most recent month end, visit thornburg.com or call 800.847.0200.
The maximum sales charge for the Fund’s Class A shares is 2.00%. The total annual fund operating expense of Class A shares is 0.92%, as disclosed in the most recent Prospectus.
30-Day Yields, A Shares
As of March 31, 2014
| | | | |
Annualized Distribution Yield | | SEC Yield | |
2.37% | | | 1.60 | % |
Key Portfolio Attributes
As of March 31, 2014
| | | | |
Number of Bonds | | | 519 | |
| |
Effective Duration | | | 5.3Yrs | |
| |
Average Maturity | | | 8.0Yrs | |
See the entire portfolio in the Schedule of Investments beginning on page 11.
4 This page is not part of the Semi-Annual Report
Thornburg’s Suite of Municipal Funds
| | |
Municipal Funds for a Range of Interest-Rate Scenarios At Thornburg, we often say that predicting interest rates is a fool’s game. And with the Federal Reserve still heavily involved in the markets, it’s even more difficult to forecast how rates may rise than when they may rise. Will long rates rise first and short rates follow? Will long and short rates climb simultaneously? A traditional strategy to protect oneself against interest-rate risk is to move into shorter-duration bond strategies. But the seemingly counterintuitive response of moving to longer-duration strategies can sometimes yield better results. Diversify Across the Yield Curve This uncertainty points to why it’s important for investors to match their investment horizon to the duration of the strategy in which they’re invested, and to diversify assets across the yield curve. For any interest-rate scenario, Thornburg’s comprehensive suite of municipal funds gives prudent investors the ability to diversify across the yield curve. Diversify Across the Yield Curve with Thornburg Municipal Funds AAA General Obligation Municipal Yield Curve, as of April 2, 2014 
| |  |
| | | | | | | | |
| | | LOW DURATION
MUNICIPAL FUND | | LIMITED TERM
MUNICIPAL FUNDS | | INTERMEDIATE
MUNICIPAL FUNDS | | STRATEGIC MUNICIPAL
INCOME FUND |
Maturity Range (yrs) | | 1-5 | | 1-10 | | 1-20 | | 1-30 |
Portfolio Structure | | Laddered | | Laddered | | Laddered | | Flexible |
| Credit Quality | | Investment Grade | | Investment Grade | | Investment Grade | | Flexible (Maximum of 50% below investment grade) |
| | | | |
| | | | Primary: | | Primary: | | |
| | | | Obtain as high a level of current | | Obtain as high a level of current | | |
| | | | income exempt from individual | | income exempt from individual | | |
| | Seeks current income exempt from | | income tax as is consistent with | | income tax as is consistent with | | Seeks a high level of current income |
| Objective | | federal income taxes, consistent with preservation of capital | | preservation of capital | | preservation of capital | | exempt from federal individual income tax |
| | | | |
| | | | Secondary: | | Secondary: | | |
| | | | Reduce expected changes in share | | Reduce expected changes in share | | |
| | | | price compared to longer intermedi- | | price compared to long-term bond | | |
| | | | ate and long-term bond portfolios | | portfolios | | |
This page is not part of the Semi-Annual Report 5
2014 Certified Semi-Annual Report
Thornburg Intermediate Municipal Fund
March 31, 2014
This report is certified under the Sarbanes-Oxley Act of 2002, which requires that public companies, including mutual funds, affirm that the information provided in their annual and semi-annual shareholder reports fully and fairly represents their financial position and the results of their operations for the period presented.
6 Certified Semi-Annual Report
Letter to Shareholders
April 15, 2014
Dear Fellow Shareholder:
We are pleased to present the semi-annual report for the Thornburg Intermediate Municipal Fund. The net asset value (NAV) of the Class A shares increased 19 cents to $13.95 per share during the six months ended March 31, 2014. If you were with us for the entire period, you received dividends of 17.3 cents per share. If you reinvested your dividends, you received 17.4 cents per share. Dividends were lower for Class C shares and higher for Class I shares to account for varying class-specific expenses. The Class A shares of your Fund underperformed the index with a total return of 2.65% at NAV for the six months ended March 31, 2014, compared to the 2.88% total return for the BofA Merrill Lynch 3-15 Year U.S. Municipal Securities Index (BAML 3-15 Year Municipal Index). The Fund generated 0.70% more price return and 0.93% less income than the index.
The first six months of fiscal 2014 were very interesting as interest-rate changes went in various directions, depending on the maturity discussed. This period certainly highlighted the fact that interest rates do not change uniformly across the entire maturity spectrum (the yield curve).
Chart I illustrates how yields changed during the period. The gold bars show the yield changes from September 30, 2013 through December 31, 2013. Short-term yields (maturities of five years or less) moved lower, while yields in maturities from five years to 20 years moved higher by varying amounts, and longer-term maturities were flat to slightly lower. It is helpful to remember the market tone during that period. Most market commentators believed the stock market and yields were going in the same direction: up. The blue bars show the yield changes from December 31, 2013 through March 31, 2014. Again, yield changes were not uniform across the yield curve. This time, after new U.S. Federal Reserve Chair Janet Yellen hinted that short-term interest rates may eventually need to increase, short-term yields increased and long-term yields decreased.
Investors may wonder how best to protect themselves from these changes. One way to hedge this risk is to own securities or mutual funds that focus their investment universes across the different segments of the yield curve. In our opinion, that would mean owning some of each of our new Thornburg Low Duration Municipal Fund and our Limited Term Municipal, Intermediate Municipal, and Strategic Municipal Income Funds. The percentage ownership of each would depend on levels of risk tolerance.
Throughout the six-month period the Fund maintained a lower risk posture on interest rates than its benchmark; the average effective duration was 5.36 years compared to 5.86 years for the benchmark. This was a slight contributor to performance, adding 0.03%. The Fund’s positioning along the curve added 0.44% to performance. Sector allocations cost the Fund 0.67%. Credit quality was a positive factor, adding 0.40%. Security selection added 0.04% and other factors added 0.46%
Chart I | Changes in AAA General-Obligation Municipal Yield Curve
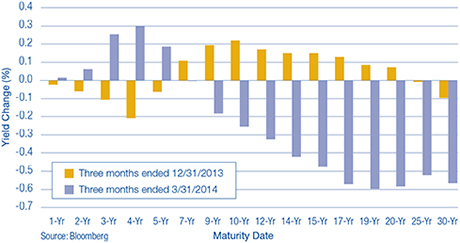
Certified Semi-Annual Report 7
Letter to Shareholders,
Continued
Chart II | Labor Market Indicators
2/28/1990 – 3/31/2014
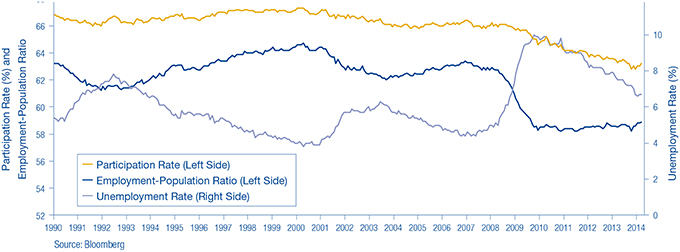
The Economy and the Federal Reserve
Gross domestic product (GDP) for the year ended December 31, 2013 came in at 2.6%, around its long-term average (to March 1990) of 2.5%. Additions to non-farm payroll employment have averaged about 185,000 per month for the six months ended March 31, 2014. The unemployment rate has declined to 6.7%, but it has been clouded by a declining labor participation rate. The percentage of the U.S. population that is employed has declined to 58.9% as of March 31, 2014 from 63.3% on March 31, 2007. The retirement of the “baby boomer” generation certainly contributes to this decline, but does not account for all of it. Chart II illustrates each of these trends from 1990.
Inflation, the bondholder’s worst enemy, has remained well controlled in the last six months. The year-over-year change in the Consumer Price Index (CPI) increased to 1.5% as of March 31, 2014 from 1.2% as of September 30, 2013. Subtracting the food and energy components to arrive at the core measure presents a picture of a well-behaved, unchanged 1.7%. The economic backdrop is one of mild expansion with low inflation. The $64,000 question is, “How long can it last?”
In January 2014, Janet Yellen replaced Ben Bernanke as Federal Reserve Chair. Her appointment as Fed Chair assured a continuation of the current Fed policies. Last year, Bernanke roiled the fixed income markets by alluding to the prospect of a decrease in the Fed’s monthly purchases of Treasury and mortgage-backed securities, the tapering of QE3. Rates went up! This year, the tapering started in actuality with the Fed reducing its purchases by $10.0 billion per meeting. Rates went down! Go figure!
Chair Yellen learned that in her new position (to borrow an old E.F. Hutton advertisement tag line), “When she speaks, markets listen.” At her first news conference, Ms. Yellen tried to clarify what “for a considerable time” meant from the last Fed Statement: “This is the kind of term it’s hard to define,” Yellen said. “Probably means something on the order of six months, or that type of thing” [after QE3 tapering ends]. This sent the debt markets, especially the short-term debt markets, lower in price and higher in yield. The results can be seen in Chart I.
8 Certified Semi-Annual Report
Letter to Shareholders,
Continued
The Municipal Market
The municipal market has performed very well over the last six months. The monthly outflows from municipal bond mutual funds have abated. The Investment Company Institute (ICI), an industry trade group, has reported that for the last three months of calendar year 2013, municipal bond mutual funds lost an average of $6.6 billion per month. For the first three months of calendar year 2014, municipal bond mutual funds experienced $1.1 billion of positive cash flows per month. This is not a significant amount, but at least it is positive.
These cash flows would normally not support a significantly positive return environment, but when coupled with a decline in new issuance of municipal bonds, a clearer picture presents itself. The supply of new municipal bonds was down 26% for the first three months of 2014. So muted demand was met with reduced supply, yielding positive results.
The overall economic health of the municipal bond market is improving, albeit unevenly. We arrive at this judgment in part through the use of the Bloomberg Economic Evaluation of States Index which includes:
| | • | | Mortgage delinquencies – from the Mortgage Bankers Association |
| | • | | State personal income – from the Bureau of Economic Analysis |
| | • | | Tax revenue – from the U.S. Census Bureau |
| | • | | Employment – from the Bureau of Labor Statistics |
| | • | | Home prices – from the Federal Housing Finance Agency |
| | • | | Bloomberg State Stock Index |
From the fourth quarter of 2012 through the fourth quarter of 2013 (the latest data available), the index has increased on average 2.8%. It ranged from a high of 8.8% to a low of negative 7.5%. For the comparable prior year period, the average was an increase of 0.2%, with a range from 9.9% to negative 4.1%. In addition, state pension funds are still wrestling with some of their issues. The median funding levels have declined from 82.6% in 2007 to 68.6% in 2012 (the Pew Center on the States suggests a funding level of 80% is adequate).
Two municipal bond market credit stories (Detroit and Puerto Rico) continue to grab headlines. In Detroit’s case, some significant settlements have been announced, but they are short on specifics, including where the new cash came from, and are dependent upon state approval. As in most Chapter 9 proceedings, one should read very little into early reports because the final results may prove very different. For example, a settlement was announced between insured bondholders and the city for a recovery of about 74% of par (a bond’s original face value); a second component of the settlement was reached with several unions for 100% of existing pension obligations and a reduction in cost-of-living adjustments. The original opening offer for these parties was 20% of par for the bondholders, and between 75% and 95% of outstanding pension obligations. It appears to us that these compromises do not address the root problems. Thornburg Funds do not have direct exposure to the city of Detroit.
Puerto Rico made the news in March 2014 by successfully coming to market with the largest “junk” bond deal in municipal market history. Puerto Rico, which is now rated BB, pulled off a $3.5 billion offering, which was purchased by non-traditional market participants, i.e. hedge funds. It was a 21-year maturity bond that was priced at $93.00 to yield 8.73%. We looked at the issue very closely as a potential addition to the Thornburg Strategic Municipal Income Fund and decided not to purchase it. The deal initially traded up to around $97.00, but as of this writing (close of business April 15th) it is trading at a dollar price of $87.50, a loss of almost 6.00% from the original offering price. Thornburg Funds are among the 30% of U.S. municipal mutual funds that do not own any debt from the Commonwealth of Puerto Rico.
Certified Semi-Annual Report 9
Letter to Shareholders,
Continued
Conclusion
Your Thornburg Intermediate Municipal Fund maintains a laddered portfolio structure of 345 municipal obligors as of March 31, 2014. We ladder our core portfolios, because we believe that this structure tends to maximize an investor’s income. In our opinion, a laddered portfolio structure outperforms the other structures (bullet and barbell) two-thirds of the time.1 This structure effectively manages a portfolio’s yield-curve exposure by owning a roughly equal weighting of each maturity, thereby minimizing a major risk factor.
We diversify our holdings across the Fund’s investment universe. Chart I illustrates that yield changes are not uniform across the Intermediate Municipal Fund’s investment universe. Laddering also reduces reinvestment risk by ensuring that a portion of the portfolio matures each year so it can be reinvested. More importantly, it frees the team to concentrate on higher value-added tasks, such as fundamental bottom-up credit research. It is just this type of research that has allowed us to avoid the two largest headline-grabbing credit issues in the municipal bond market.
This year has gotten off to a strong start. We thank you for the trust you have placed in us and will continue to keep that foremost in our minds.
Sincerely,
| | |

| | 
|
| Christopher Ryon,CFA | | Josh Gonze |
| Portfolio Manager | | Portfolio Manager |
| Managing Director | | Managing Director |
| 1 | For a copy of the study, go to www.thornburg.com/whyladder |
Chart III | Percent of Portfolio Maturing
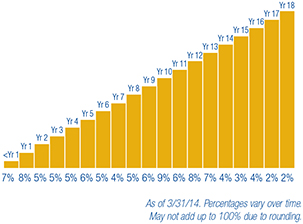
The matters discussed in this report may constitute forward-looking statements made pursuant to the safe harbor provisions of the Securities Litigation Reform Act of 1995. These include any advisor or portfolio manager prediction, assessment, analysis or outlook for individual securities, industries, investment styles, market sectors and/or markets. These statements involve risks and uncertainties. In addition to the general risks described for each fund in its current prospectus, other factors bearing on these reports include the accuracy of the advisor’s or portfolio manager’s forecasts and predictions, the appropriateness of the investment strategies designed by the advisor or portfolio manager and the ability of the advisor or portfolio manager to implement their strategies efficiently and successfully. Any one or more of these factors, as well as other risks affecting the securities markets generally, could cause the actual results of any fund to differ materially as compared to its benchmarks.
10 Certified Semi-Annual Report
| | |
| Schedule of Investments, | | |
| |
Thornburg Intermediate Muncipal Fund | | March 31, 2014 (Unaudited) |
Summary of Security Credit Ratings†
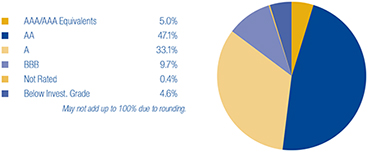
We have used ratings from Standard & Poor’s (S&P). Where S&P ratings are not available, we have used Moody’s Investors Service. Where neither rating is available, we have used ratings from Fitch Ratings. The category of investments identified as “AAA” in this graph includes investments which are pre-refunded or escrowed to maturity. Such investments are backed by an escrow or trust containing sufficient U.S. Government or U.S. Government agency securities to satisfy the timely payment of principal and interest and, therefore, are normally deemed to be equivalent to AAA-rated securities.
| | | | | | | | | | |
ISSUER-DESCRIPTION | | CREDIT RATING†
S&P/ MOODY’S | | PRINCIPAL
AMOUNT | | | VALUE | |
ALABAMA — 2.27% | | | | | | | | | | |
Alabama Capital Region Solid Waste Disposal Authority, 4.00% due 6/15/2016 (Montgomery Materials Recovery Facility) (AMT) | | AA/NR | | $ | 160,000 | | | $ | 170,149 | |
Alabama Capital Region Solid Waste Disposal Authority, 4.00% due 6/15/2017 (Montgomery Materials Recovery Facility) (AMT) | | AA/NR | | | 750,000 | | | | 809,430 | |
Alabama Capital Region Solid Waste Disposal Authority, 4.00% due 6/15/2019 (Montgomery Materials Recovery Facility) (AMT) | | AA/NR | | | 815,000 | | | | 888,081 | |
Alabama Capital Region Solid Waste Disposal Authority, 5.00% due 6/15/2020 (Montgomery Materials Recovery Facility) (AMT) | | AA/NR | | | 845,000 | | | | 960,402 | |
Alabama Capital Region Solid Waste Disposal Authority, 5.00% due 6/15/2021 (Montgomery Materials Recovery Facility) (AMT) | | AA/NR | | | 890,000 | | | | 1,004,944 | |
Alabama Capital Region Solid Waste Disposal Authority, 5.00% due 6/15/2022 (Montgomery Materials Recovery Facility) (AMT) | | AA/NR | | | 930,000 | | | | 1,046,631 | |
Alabama Capital Region Solid Waste Disposal Authority, 5.00% due 6/15/2023 (Montgomery Materials Recovery Facility) (AMT) | | AA/NR | | | 980,000 | | | | 1,092,190 | |
Alabama Drinking Water Finance Authority, 5.25% due 8/15/2015 (Insured: AMBAC) | | NR/NR | | | 1,200,000 | | | | 1,267,800 | |
Alabama Public School & College Authority, 5.00% due 5/1/2016 (Educational Facilities) | | NR/Aa1 | | | 2,000,000 | | | | 2,189,360 | |
Alabama Public School & College Authority, 5.00% due 6/1/2021 (Educational Facilities) | | AA/Aa1 | | | 775,000 | | | | 916,600 | |
Alabama Public School & College Authority, 5.00% due 6/1/2026 (Educational Facilities) | | AA/Aa1 | | | 4,380,000 | | | | 5,074,537 | |
City of Mobile Industrial Development Board PCR, 1.65% due 6/1/2034 put 3/20/2017 (Alabama Power Company Barry Plant Project) | | A/A1 | | | 2,000,000 | | | | 2,001,620 | |
East Alabama Health Care Authority GO, 5.00% due 9/1/2027 (Health Care Facilities Capital Improvements) | | A/NR | | | 1,250,000 | | | | 1,327,388 | |
Montgomery Water Works & Sanitary Sewer Board, 4.00% due 9/1/2014 | | AAA/Aa1 | | | 1,310,000 | | | | 1,330,632 | |
Montgomery Water Works & Sanitary Sewer Board, 5.00% due 9/1/2017 | | AAA/Aa1 | | | 2,185,000 | | | | 2,481,723 | |
University of Alabama at Birmingham Hospital, 5.25% due 9/1/2025 | | A+/A1 | | | 2,000,000 | | | | 2,146,820 | |
| | | |
ALASKA — 0.50% | | | | | | | | | | |
Alaska Housing Finance Corp. GO, 5.00% due 12/1/2021 (State Capital Project) | | AA+/Aa2 | | | 500,000 | | | | 574,450 | |
Alaska Municipal Bond Bank, 5.00% due 10/1/2017 (Insured: Natl-Re) | | AA+/Aa2 | | | 2,470,000 | | | | 2,569,813 | |
City of Valdez, 5.00% due 1/1/2021 (BP Pipelines (Alaska), Inc. Project) | | A/A2 | | | 2,000,000 | | | | 2,306,020 | |
| | | |
ARIZONA — 2.43% | | | | | | | | | | |
Arizona Board of Regents for the Benefit of the University of Arizona, 5.00% due 8/1/2024 (Stimulus Plan for Economic and Educational Development) | | AA-/Aa3 | | | 1,635,000 | | | | 1,860,957 | |
Arizona HFA, 5.00% due 7/1/2017 (Catholic Healthcare West) | | A/A3 | | | 1,450,000 | | | | 1,606,455 | |
Arizona State University Energy Management LLC, 5.00% due 7/1/2017 (Tempe Campus Project) | | AA-/A1 | | | 465,000 | | | | 522,418 | |
City of Flagstaff GO, 2.00% due 7/1/2014 (Urban Trail, Street and Utilities Improvements) | | AA/Aa2 | | | 160,000 | | | | 160,723 | |
City of Flagstaff GO, 1.75% due 7/1/2015 (Urban Trail, Street and Utilities Improvements) | | AA/Aa2 | | | 165,000 | | | | 168,087 | |
City of Flagstaff GO, 1.75% due 7/1/2016 (Urban Trail, Street and Utilities Improvements) | | AA/Aa2 | | | 200,000 | | | | 205,404 | |
City of Flagstaff GO, 3.00% due 7/1/2020 (Urban Trail, Street and Utilities Improvements) | | AA/Aa2 | | | 700,000 | | | | 737,352 | |
City of Flagstaff GO, 4.00% due 7/1/2022 (Urban Trail, Street and Utilities Improvements) | | AA/Aa2 | | | 420,000 | | | | 463,248 | |
City of Flagstaff GO, 4.00% due 7/1/2023 (Urban Trail, Street and Utilities Improvements) | | AA/Aa2 | | | 200,000 | | | | 219,438 | |
Mohave County IDA, 7.25% due 5/1/2015 (Mohave Prison LLC) | | BBB+/NR | | | 4,630,000 | | | | 4,820,617 | |
Phoenix Civic Improvement Corp., 5.00% due 7/1/2017 (Insured: Natl-Re) | | AA/Aa3 | | | 1,000,000 | | | | 1,126,210 | |
Pima County IDA, 5.00% due 12/1/2030 (Providence Day School Project) | | BBB+/NR | | | 2,000,000 | | | | 1,957,820 | |
Certified Semi-Annual Report 11
| | |
| Schedule of Investments, continued | | |
| |
Thornburg Limited Term Municipal Fund | | March 31, 2014 (Unaudited) |
| | | | | | | | | | |
ISSUER-DESCRIPTION | | CREDIT RATING†
S&P/ MOODY’S | | PRINCIPAL
AMOUNT | | | VALUE | |
Salt Verde Financial Corp., 5.25% due 12/1/2022 (Salt River Project Agricultural Improvement and Power District) | | A-/Baa2 | | $ | 2,000,000 | | | $ | 2,252,440 | |
Salt Verde Financial Corp., 5.25% due 12/1/2028 (Salt River Project Agricultural Improvement and Power District) | | A-/Baa2 | | | 735,000 | | | | 814,564 | |
State of Arizona, 5.00% due 7/1/2019 (Insured: AGM) | | AA/A1 | | | 7,280,000 | | | | 8,429,949 | |
University Medical Center Corp. GO, 5.00% due 7/1/2015 (UMCC Health Care Facilities) | | BBB+/Baa1 | | | 1,000,000 | | | | 1,046,480 | |
| | | |
CALIFORNIA — 8.45% | | | | | | | | | | |
Alameda County Joint Powers Authority, 5.25% due 12/1/2027 (Alameda County Medical Center Highland Hospital) | | AA/Aa3 | | | 1,000,000 | | | | 1,157,080 | |
Alameda County Joint Powers Authority, 5.25% due 12/1/2028 (Alameda County Medical Center Highland Hospital) | | AA/Aa3 | | | 1,150,000 | | | | 1,322,949 | |
Alameda County Joint Powers Authority, 5.25% due 12/1/2029 (Alameda County Medical Center Highland Hospital) | | AA/Aa3 | | | 1,500,000 | | | | 1,714,965 | |
Brentwood Infrastructure Financing Authority, 5.00% due 11/1/2026 (Insured: AGM) | | AA/NR | | | 2,000,000 | | | | 2,118,220 | |
California Educational Facilities Authority, 5.50% due 4/1/2029 (Pitzer College) | | NR/A2 | | | 3,000,000 | | | | 3,310,230 | |
California HFFA, 5.00% due 11/15/2022 (Children’s Hospital Los Angeles) | | BBB+/Baa2 | | | 1,000,000 | | | | 1,100,620 | |
California HFFA, 5.00% due 3/1/2026 (Adventist Health System/West) | | A/NR | | | 3,020,000 | | | | 3,331,120 | |
California HFFA, 5.25% due 3/1/2027 (Dignity Health) | | A/A3 | | | 5,250,000 | | | | 5,701,867 | |
California Infrastructure & Economic Development Bank, 5.75% due 8/15/2029 (King City Joint Union High School District) | | A/NR | | | 1,500,000 | | | | 1,610,925 | |
California Pollution Control Financing Authority, 5.25% due 6/1/2023 put 12/1/2017 (Solid Waste Disposal-Republic Services, Inc.) (AMT) | | BBB+/Baa3 | | | 2,000,000 | | | | 2,143,200 | |
California State Housing Finance Agency, 4.55% due 2/1/2015 (Low-Moderate Income Mortgage Financing Program; Insured: FGIC) (AMT) | | A-/Baa2 | | | 2,640,000 | | | | 2,693,962 | |
California State Public Works Board, 5.00% due 6/1/2017 (University of California Multiple Campus Capital Projects; Insured: Natl-Re/FGIC) (ETM) | | AA+/Aaa | | | 2,000,000 | | | | 2,263,340 | |
California State Public Works Board, 5.00% due 4/1/2028 (Corrections & Rehabilitation and Judicial Council) | | A-/A2 | | | 2,500,000 | | | | 2,735,500 | |
California Statewide Community Development Authority, 6.25% due 8/15/2028 (Enloe Medical Center; Insured: California Mtg Insurance) | | A/NR | | | 1,050,000 | | | | 1,212,446 | |
California Statewide Community Development Authority, 6.00% due 7/1/2030 (Aspire Public Schools) | | NR/NR | | | 7,015,000 | | | | 6,999,777 | |
Carson Redevelopment Agency, 6.25% due 10/1/2022 (Redevelopment Project Area No. 1) | | A-/NR | | | 1,620,000 | | | | 1,798,151 | |
Carson Redevelopment Agency, 6.375% due 10/1/2024 (Redevelopment Project Area No. 1) | | A-/NR | | | 1,300,000 | | | | 1,470,755 | |
Chico Redevelopment Agency, 5.00% due 4/1/2030 (Chico Amended & Merged Redevelopment; Insured: AMBAC) | | A+/NR | | | 5,500,000 | | | | 5,558,300 | |
Corona-Norco USD COP, 5.00% due 4/15/2018 (Insured: AGM) | | AA/A1 | | | 1,245,000 | | | | 1,402,978 | |
Corona-Norco USD COP, 5.00% due 4/15/2021 (Insured: AGM) | | AA/A1 | | | 1,000,000 | | | | 1,114,300 | |
Delano Financing Authority, 5.00% due 12/1/2025 (City of Delano Police Station and Woollomes Avenue Bridge) | | A-/NR | | | 2,555,000 | | | | 2,731,729 | |
El Camino Hospital District, 6.25% due 8/15/2017 (Insured: AMBAC) (ETM) | | NR/NR | | | 560,000 | | | | 617,249 | |
Franklin-McKinley School District GO, 5.25% due 8/1/2027 (Insured: Natl-Re) | | NR/A1 | | | 1,000,000 | | | | 1,149,680 | |
Fresno USD GO, 6.00% due 8/1/2026 (Educational Facilities and Improvements; Insured: Natl-Re) | | AA-/Baa1 | | | 1,165,000 | | | | 1,370,355 | |
Jurupa Public Financing Authority, 5.50% due 9/1/2025 (Eastvale Community Services; Insured: AGM) | | AA/NR | | | 1,195,000 | | | | 1,363,650 | |
Jurupa Public Financing Authority, 5.50% due 9/1/2027 (Eastvale Community Services; Insured: AGM) | | AA/NR | | | 1,335,000 | | | | 1,500,820 | |
Kern Community College District COP, 4.00% due 4/1/2014 | | SP-1+/NR | | | 5,000,000 | | | | 5,000,000 | |
Los Angeles Regional Airport Improvement Corp., 5.00% due 1/1/2017 (LAX Fuel Corp.; Insured: AGM) (AMT) | | AA/A2 | | | 1,120,000 | | | | 1,157,072 | |
M-S-R Energy Authority, 6.125% due 11/1/2029 | | A-/NR | | | 2,500,000 | | | | 3,010,975 | |
Mojave USD COP, 0% due 9/1/2021 (Insured: AGM) | | AA/NR | | | 1,095,000 | | | | 810,563 | |
Mojave USD COP, 0% due 9/1/2023 (Insured: AGM) | | AA/NR | | | 1,100,000 | | | | 710,116 | |
North City West School Facilities Financing Authority, 5.00% due 9/1/2024 (Carmel Valley Schools; Insured: AGM) | | AA/NR | | | 1,080,000 | | | | 1,203,012 | |
Redwood City Redevelopment Agency, 0% due 7/15/2023 (Redevelopment Area A-2; Insured: AMBAC) | | A-/NR | | | 2,060,000 | | | | 1,358,282 | |
San Jose Redevelopment Agency, 5.25% due 8/1/2027 (Merged Area Redevelopment Project) | | A/Ba1 | | | 2,400,000 | | | | 2,503,464 | |
San Jose Redevelopment Agency, 5.375% due 8/1/2028 (Merged Area Redevelopment Project) | | A/Ba1 | | | 1,175,000 | | | | 1,225,772 | |
San Mateo Union High School District GO, 0% due 9/1/2019 (Educational Facilities; Insured: Natl-Re) | | AA+/Aa1 | | | 3,000,000 | | | | 2,730,210 | |
Saratoga Union School District GO, 0% due 9/1/2023 (Insured: Natl-Re) | | AA+/Aa2 | | | 900,000 | | | | 650,745 | |
State of California GO, 5.25% due 9/1/2026 (Kindergarten University Facilities) | | A/A1 | | | 5,000,000 | | | | 5,866,350 | |
Tuolumne Wind Project Authority, 5.875% due 1/1/2029 (Tuolumne Co.) | | A+/A2 | | | 3,000,000 | | | | 3,447,780 | |
Turlock Irrigation District, 5.00% due 1/1/2021 | | A+/A2 | | | 1,750,000 | | | | 1,984,902 | |
William S. Hart Union High School District GO, 0% due 9/1/2021 (Educational Facilities) | | AA/A2 | | | 800,000 | | | | 628,632 | |
| | | |
COLORADO — 1.49% | | | | | | | | | | |
Adams County, 5.00% due 8/1/2014 (Platte Valley Medical Center; Insured: Natl-Re/FHA 242) (ETM) | | AA-/NR | | | 965,000 | | | | 980,585 | |
City & County of Denver Airport System, 0.28% due 11/15/2025 put 4/1/2014 (Denver International Airport; Insured: AGM; SPA: Morgan Stanley Bank) (daily demand notes) | | AA/A1 | | | 750,000 | | | | 750,000 | |
Colorado Water Resources & Power Development Authority, 3.00% due 9/1/2014 (Water System Facilities Improvements) | | AAA/Aaa | | | 1,745,000 | | | | 1,765,975 | |
Denver Convention Center Hotel Authority, 5.25% due 12/1/2023 (Insured: Syncora) | | BBB-/Baa3 | | | 2,530,000 | | | | 2,633,274 | |
Housing Authority of the City and County of Denver, 5.20% due 11/1/2027 pre-refunded 11/1/2017 (Three Towers Rehabilitation; Insured: AGM) (AMT) | | NR/Aaa | | | 1,220,000 | | | | 1,400,816 | |
Housing Authority of the City and County of Denver, 5.20% due 11/1/2027 (Three Towers Rehabilitation; Insured: AGM) (AMT) | | NR/A2 | | | 1,335,000 | | | | 1,452,106 | |
Northwest Parkway Public Highway Authority, 5.20% due 6/15/2014 (Insured: AGM) (ETM) | | AA/A2 | | | 1,005,000 | | | | 1,015,432 | |
Park Creek Metropolitan District, 5.25% due 12/1/2020 (Insured: AGM) | | AA/NR | | | 1,120,000 | | | | 1,271,122 | |
Regional Transportation District COP, 5.50% due 6/1/2022 (FasTracks Transportation System) | | A/Aa3 | | | 3,000,000 | | | | 3,429,870 | |
Southlands Metropolitan District GO, 7.00% due 12/1/2024 pre-refunded 12/1/2014 | | AA+/NR | | | 1,370,000 | | | | 1,432,335 | |
12 Certified Semi-Annual Report
| | |
| Schedule of Investments, continued | | |
| |
Thornburg Intermediate Muncipal Fund | | March 31, 2014 (Unaudited) |
| | | | | | | | | | |
ISSUER-DESCRIPTION | | CREDIT RATING†
S&P/ MOODY’S | | PRINCIPAL
AMOUNT | | | VALUE | |
CONNECTICUT — 0.31% | | | | | | | | | | |
Connecticut Health & Educational Facilities Authority, 5.75% due 7/1/2029 (Ethel Walker School) | | BBB-/NR | | $ | 1,350,000 | | | $ | 1,400,544 | |
State of Connecticut GO Floating Rate Note, 0.58% due 9/15/2017 (Public Improvements) | | AA/Aa3 | | | 2,000,000 | | | | 2,002,560 | |
| | | |
DELAWARE — 0.27% | | | | | | | | | | |
Delaware HFA, 5.50% due 6/1/2024 (Beebe Medical Center) | | BBB-/
Baa3 | | | 1,785,000 | | | | 1,788,356 | |
Delaware River and Bay Authority, 5.00% due 1/1/2018 (Delaware Memorial Bridge and Cape May-Lewis Ferry; Insured: Natl-Re) | | AA-/A1 | | | 500,000 | | | | 517,475 | |
Delaware Solid Waste Authority, 5.00% due 6/1/2021 (Capital Improvement Program; Insured: Natl-Re) | | AA+/A2 | | | 615,000 | | | | 657,115 | |
| | | |
DISTRICT OF COLUMBIA — 1.38% | | | | | | | | | | |
District of Columbia Association of American Medical Colleges, 5.00% due 2/15/2017 (Insured: AMBAC) (ETM) | | NR/NR | | | 1,000,000 | | | | 1,111,540 | |
District of Columbia COP, 5.00% due 1/1/2020 (Insured: Natl-Re) | | AA-/Aa3 | | | 3,900,000 | | | | 4,125,732 | |
District of Columbia GO, 6.00% due 6/1/2015 (Insured: Natl-Re) | | AA-/Aa2 | | | 3,000,000 | | | | 3,200,220 | |
Metropolitan Airports Authority, 0% due 10/1/2023 (Dulles Toll Road; Insured: AGM) | | AA/A3 | | | 4,890,000 | | | | 3,330,188 | |
Metropolitan Airports Authority, 0% due 10/1/2024 (Dulles Toll Road; Insured: AGM) | | AA/A3 | | | 5,000,000 | | | | 3,200,250 | |
| | | |
FLORIDA — 7.51% | | | | | | | | | | |
City of Jacksonville, 5.00% due 10/1/2026 (Better Jacksonville Plan) | | A/A1 | | | 2,075,000 | | | | 2,264,281 | |
City of Lakeland, 5.00% due 10/1/2018 (Electric Power System Smart Grid Project; Insured: AGM) | | AA/A1 | | | 2,000,000 | | | | 2,309,120 | |
City of Lakeland, 5.25% due 10/1/2027 (Electric Power System Smart Grid Project; Insured: AGM) | | AA/A1 | | | 3,680,000 | | | | 4,313,954 | |
City of Lakeland, 5.25% due 10/1/2036 (Electric Power System Smart Grid Project; Insured: AGM) | | AA/A1 | | | 2,770,000 | | | | 3,160,016 | |
City of Miami GO, 5.375% due 9/1/2015 (Insured: Natl-Re) | | AA-/A2 | | | 1,000,000 | | | | 1,003,690 | |
Correctional Privatization Commission COP, 5.00% due 8/1/2017 (Insured: AMBAC) | | AA+/Aa2 | | | 1,000,000 | | | | 1,015,490 | |
Escambia County HFA, 5.95% due 7/1/2020 (Florida Health Care Facility Loan; Insured: AMBAC) | | NR/NR | | | 1,935,000 | | | | 2,053,132 | |
Flagler County School Board COP, 5.00% due 8/1/2020 (Insured: AGM) | | AA/A2 | | | 2,560,000 | | | | 2,710,912 | |
Florida Department of Management Services, 5.00% due 9/1/2018 (Financing or Acquisition of State-Owned Office Buildings; Insured: AMBAC) | | AA+/Aa2 | | | 500,000 | | | | 537,825 | |
Florida Department of Management Services COP, 3.50% due 8/1/2016 (Correctional Facilities Construction and Improvements; Insured: AGM) | | AA+/Aa2 | | | 500,000 | | | | 532,940 | |
Florida Municipal Loan Council, 5.00% due 10/1/2020 (Insured: Natl-Re) | | AA-/Baa1 | | | 1,000,000 | | | | 1,076,580 | |
Florida Municipal Loan Council, 5.00% due 10/1/2024 (Insured: Natl-Re) | | AA-/Baa1 | | | 2,235,000 | | | | 2,366,060 | |
Florida State Department of Children & Families COP, 5.00% due 10/1/2018 (South Florida Evaluation Treatment) | | AA+/NR | | | 2,090,000 | | | | 2,213,352 | |
Florida State Department of Children & Families COP, 5.00% due 10/1/2019 (South Florida Evaluation Treatment) | | AA+/NR | | | 2,255,000 | | | | 2,388,090 | |
Highlands County HFA, 5.00% due 11/15/2019 (Adventist Health Hospital) | | AA-/Aa3 | | | 1,100,000 | | | | 1,178,133 | |
Highlands County HFA, 5.00% due 11/15/2019 (Adventist Health Hospital) | | AA-/Aa3 | | | 1,750,000 | | | | 1,874,302 | |
Hillsborough County, 5.00% due 3/1/2017 (Water & Wastewater System; Insured: Natl-Re) | | AA-/A1 | | | 5,630,000 | | | | 5,971,628 | |
Hollywood Community Redevelopment Agency, 5.00% due 3/1/2021 (Insured: Syncora) | | NR/A3 | | | 3,000,000 | | | | 3,185,490 | |
Lake County School Board Master Lease Program COP, 5.00% due 6/1/2026 (School District Facility Projects) | | A/NR | | | 1,210,000 | | | | 1,329,125 | |
Manatee County, 5.00% due 10/1/2015 (Various County Capital Projects) | | NR/Aa2 | | | 500,000 | | | | 535,380 | |
Manatee County, 5.00% due 10/1/2016 pre-refunded 10/1/2014 (Transportation Capital Improvements; Insured: AMBAC) | | AA-/Aa2 | | | 1,000,000 | | | | 1,024,150 | |
Miami-Dade County Educational Facilities Authority, 5.25% due 4/1/2018 (University of Miami) | | A-/A3 | | | 250,000 | | | | 270,313 | |
Miami-Dade County Educational Facilities Authority, 5.25% due 4/1/2024 (University of Miami; Insured: AMBAC) | | A-/A3 | | | 1,000,000 | | | | 1,146,140 | |
Miami-Dade County Expressway Authority, 5.25% due 7/1/2026 pre-refunded 7/1/2014 (Toll System Five-Year Work Program; Insured: Natl-Re) | | AA-/A3 | | | 375,000 | | | | 379,778 | |
Miami-Dade County GO, 5.00% due 10/1/2023 (Seaport Properties) | | AA/Aa2 | | | 1,040,000 | | | | 1,172,444 | |
Miami-Dade County GO, 6.25% due 7/1/2026 (Building Better Communities) | | AA/Aa2 | | | 2,130,000 | | | | 2,483,708 | |
Miami-Dade County School Board COP, 5.00% due 10/1/2021 (Insured: AMBAC) | | A/A1 | | | 3,035,000 | | | | 3,429,641 | |
Miami-Dade County School Board COP, 5.25% due 5/1/2022 (Insured: AGM) | | AA/A1 | | | 2,600,000 | | | | 2,913,768 | |
Orange County HFA, 6.25% due 10/1/2016 (Orlando Regional Hospital; Insured: Natl-Re) | | AA-/A3 | | | 2,545,000 | | | | 2,720,732 | |
Orange County HFA, 5.125% due 10/1/2026 (Orlando Health, Inc.) | | A/A3 | | | 2,000,000 | | | | 2,124,300 | |
Palm Beach County School Board COP, 5.00% due 8/1/2032 put 8/1/2016 | | NR/Aa3 | | | 1,500,000 | | | | 1,644,525 | |
Sarasota County Public Hospital Board, 2.325% due 10/1/2021 (Sarasota Memorial Hospital; Insured: Natl-Re) | | AA-/A1 | | | 2,000,000 | | | | 2,010,520 | |
School Board of Broward County COP, 5.00% due 7/1/2020 (Educational Facilities and Equipment; Insured: AGM) | | AA/A1 | | | 1,000,000 | | | | 1,085,030 | |
School Board of Broward County COP, 5.00% due 7/1/2026 (Educational Facilities and Equipment) | | A/A1 | | | 3,000,000 | | | | 3,305,250 | |
School Board of Broward County COP, 5.00% due 7/1/2027 (Educational Facilities and Equipment) | | A/A1 | | | 2,000,000 | | | | 2,192,260 | |
South Miami HFA, 5.00% due 8/15/2022 (Baptist Health Group) | | AA/Aa2 | | | 1,500,000 | | | | 1,667,715 | |
St. Johns County IDA, 5.85% due 8/1/2024 (Presbyterian Retirement) | | NR/NR | | | 4,885,000 | | | | 4,967,263 | |
Sunshine State Governmental Finance Commission, 5.00% due 9/1/2028 (Miami-Dade County Program) | | AA-/Aa3 | | | 3,500,000 | | | | 3,870,615 | |
University of Central Florida COP Convocation Corp., 5.00% due 10/1/2019 (Insured: Natl-Re) | | AA-/Baa1 | | | 1,135,000 | | | | 1,171,763 | |
| | | |
GEORGIA — 2.06% | | | | | | | | | | |
Athens-Clarke County Unified Government Development Authority, 5.00% due 6/15/2024 (UGAREF Bolton Commons, LLC) | | NR/Aa2 | | | 485,000 | | | | 547,284 | |
Athens-Clarke County Unified Government Development Authority, 5.00% due 6/15/2025 (UGAREF Bolton Commons, LLC) | | NR/Aa2 | | | 510,000 | | | | 568,849 | |
Certified Semi-Annual Report 13
| | |
| Schedule of Investments, continued | | |
| |
Thornburg Intermediate Municipal Fund | | March 31, 2014 (Unaudited) |
| | | | | | | | | | |
ISSUER-DESCRIPTION | | CREDIT RATING†
S&P/ MOODY’S | | PRINCIPAL
AMOUNT | | | VALUE | |
Athens-Clarke County Unified Government Development Authority, 5.00% due 6/15/2027 (UGAREF Bolton Commons, LLC) | | NR/Aa2 | | $ | 735,000 | | | $ | 809,103 | |
Athens-Clarke County Unified Government Development Authority, 5.00% due 6/15/2028 (UGAREF Bolton Commons, LLC) | | NR/Aa2 | | | 590,000 | | | | 644,534 | |
City of Atlanta, 5.50% due 11/1/2022 (Water & Wastewater System; Insured: Natl-Re) | | AA-/Aa3 | | | 530,000 | | | | 617,938 | |
City of Atlanta, 5.50% due 11/1/2024 (Water & Wastewater System; Insured: AGM) | | AA/Aa3 | | | 5,000,000 | | | | 5,634,350 | |
Clarke County Hospital Authority, 5.00% due 1/1/2023 (Athens Regional Medical Center) | | AA/Aa1 | | | 2,060,000 | | | | 2,349,038 | |
Clarke County Hospital Authority, 5.00% due 1/1/2024 (Athens Regional Medical Center) | | AA/Aa1 | | | 2,310,000 | | | | 2,579,854 | |
Clarke County Hospital Authority, 5.00% due 1/1/2025 (Athens Regional Medical Center) | | AA/Aa1 | | | 525,000 | | | | 581,779 | |
Clarke County Hospital Authority, 5.00% due 1/1/2026 (Athens Regional Medical Center) | | AA/Aa1 | | | 725,000 | | | | 796,673 | |
Clayton County & Clayton County Water Authority, 2.00% due 5/1/2014 (Water & Sewerage System) | | AA+/NR | | | 585,000 | | | | 585,924 | |
Development Authority of Fulton County, 5.00% due 10/1/2019 (Georgia Tech Athletic Assoc.) | | NR/A2 | | | 3,000,000 | | | | 3,481,710 | |
Municipal Electric Authority of Georgia, 6.60% due 1/1/2018 (Insured: Natl-Re) | | AA-/A1 | | | 1,655,000 | | | | 1,816,578 | |
Valdosta and Lowndes County Hospital Authority, 5.00% due 10/1/2024 (South Medical Center) | | AA-/Aa2 | | | 1,200,000 | | | | 1,327,416 | |
| | | |
GUAM — 0.77% | | | | | | | | | | |
Guam Power Authority, 5.00% due 10/1/2023 (Electric Power System; Insured: AGM) | | AA/A2 | | | 2,000,000 | | | | 2,254,960 | |
Guam Power Authority, 5.00% due 10/1/2024 (Electric Power System; Insured: AGM) | | AA/A2 | | | 2,000,000 | | | | 2,220,460 | |
Guam Power Authority, 5.00% due 10/1/2025 (Electric Power System; Insured: AGM) | | AA/A2 | | | 2,500,000 | | | | 2,750,975 | |
Guam Waterworks Authority, 5.25% due 7/1/2024 (Water and Wastewater System) | | A-/Ba1 | | | 1,000,000 | | | | 1,097,410 | |
| | | |
HAWAII — 1.16% | | | | | | | | | | |
City and County of Honolulu GO, 5.00% due 7/1/2016 (Insured: Natl-Re) | | NR/Aa1 | | | 1,000,000 | | | | 1,056,900 | |
State of Hawaii GO, 5.00% due 12/1/2027 | | AA/Aa2 | | | 10,000,000 | | | | 11,532,800 | |
| | | |
ILLINOIS — 6.15% | | | | | | | | | | |
Board of Trustees of Southern Illinois University, 0% due 4/1/2014 (Housing & Auxiliary Facilities; Insured: Natl-Re) | | AA-/A3 | | | 1,425,000 | | | | 1,425,000 | |
Board of Trustees of Southern Illinois University, 5.00% due 4/1/2014 (Housing & Auxiliary Facilities; Insured: Natl-Re) | | AA-/A3 | | | 1,350,000 | | | | 1,350,000 | |
Board of Trustees of Southern Illinois University, 5.25% due 4/1/2019 (Housing & Auxiliary Facilities; Insured: Natl-Re) | | AA-/A3 | | | 1,000,000 | | | | 1,147,760 | |
Chicago Housing Authority, 5.00% due 7/1/2018 pre-refunded 7/01/2016 (Low-Income Public Housing Program; Insured: AGM) | | AA/A2 | | | 5,295,000 | | | | 5,811,104 | |
Chicago Transit Authority, 5.00% due 12/1/2018 (Bombardier Transit Rail System) | | AA/A1 | | | 1,500,000 | | | | 1,708,680 | |
City of Chicago, 0% due 11/15/2014 (Near South Redevelopment; Insured: ACA) | | NR/NR | | | 1,510,000 | | | | 1,477,852 | |
City of Chicago, 5.00% due 1/1/2019 (Midway Airport; Insured: AMBAC) (AMT) | | A-/A3 | | | 1,210,000 | | | | 1,246,143 | |
City of Chicago, 5.75% due 11/1/2030 (Water System; Insured: AMBAC) | | AA+/Aa1 | | | 1,270,000 | | | | 1,467,828 | |
City of Chicago, 5.25% due 1/1/2034 (Midway Airport) | | A-/A3 | | | 4,700,000 | | | | 4,980,214 | |
City of Chicago GO, 5.00% due 1/1/2020 (Municipal Facilities Projects; Insured: AMBAC) | | A+/Baa1 | | | 1,000,000 | | | | 1,069,310 | |
City of Chicago GO, 5.00% due 12/1/2022 (Modern Schools Across Chicago Program; Insured: AMBAC) | | A+/Baa1 | | | 415,000 | | | | 443,984 | |
City of Chicago GO, 5.00% due 12/1/2024 (Modern Schools Across Chicago Program; Insured: AMBAC) | | A+/Baa1 | | | 500,000 | | | | 528,750 | |
City of Mount Vernon GO, 4.00% due 12/15/2025 (Various Municipal Capital Improvements; Insured: AGM) | | AA/A2 | | | 1,900,000 | | | | 1,937,335 | |
City of Waukegan GO, 4.00% due 12/30/2015 (Insured: AGM) | | NR/A2 | | | 500,000 | | | | 526,495 | |
City of Waukegan GO, 5.00% due 12/30/2016 (Insured: AGM) | | NR/A2 | | | 1,500,000 | | | | 1,643,895 | |
City of Waukegan GO, 5.00% due 12/30/2017 (Insured: AGM) | | NR/A2 | | | 1,680,000 | | | | 1,874,107 | |
City of Waukegan GO, 5.00% due 12/30/2018 (Insured: AGM) | | NR/A2 | | | 2,000,000 | | | | 2,256,100 | |
Community College District No. 525 GO, 6.25% due 6/1/2024 (Joliet Junior College) | | AA/NR | | | 500,000 | | | | 558,630 | |
Cook County Community College District No. 508 GO, 5.25% due 12/1/2026 (City Colleges of Chicago) | | AA/NR | | | 1,000,000 | | | | 1,111,910 | |
Cook County GO, 5.25% due 11/15/2024 | | AA/A1 | | | 3,000,000 | | | | 3,320,430 | |
Cook County School District No. 104 GO, 0% due 12/1/2022 (Argo Summit Elementary School Facilities; Insured: AGM) (ETM) | | NR/NR | | | 2,000,000 | | | | 1,596,180 | |
DuPage County Community Consolidated School District No. 93 GO, 2.00% due 1/1/2015 (Carol Stream Educational Facilities) (State Aid Withholding) | | AA+/NR | | | 465,000 | | | | 470,743 | |
DuPage County Community Consolidated School District No. 93 GO, 2.00% due 1/1/2016 (Carol Stream Educational Facilities) (State Aid Withholding) | | AA+/NR | | | 485,000 | | | | 496,975 | |
Forest Preserve District of DuPage County GO, 4.00% due 11/1/2022 (Land Acquisition and Development) | | AAA/NR | | | 750,000 | | | | 826,537 | |
Illinois Educational Facilities Authority, 5.00% due 11/1/2016 (Rush University Medical Center) | | AA-/A2 | | | 1,000,000 | | | | 1,085,240 | |
Illinois Educational Facilities Authority, 5.75% due 11/1/2028 (Rush University Medical Center) | | AA-/A2 | | | 1,000,000 | | | | 1,088,300 | |
Illinois Finance Authority, 5.25% due 9/1/2015 pre-refunded 9/1/2014 (Water & Wastewater Facilities) | | AAA/Aaa | | | 420,000 | | | | 437,228 | |
Illinois Finance Authority, 5.00% due 11/1/2016 (Central DuPage Health) | | AA/NR | | | 2,000,000 | | | | 2,205,660 | |
Illinois Finance Authority, 5.00% due 11/1/2017 (Central DuPage Health) | | AA/NR | | | 2,000,000 | | | | 2,251,200 | |
Illinois Finance Authority, 5.00% due 8/1/2022 (Bradley University; Insured: Syncora) | | A/NR | | | 1,000,000 | | | | 1,049,710 | |
Illinois Finance Authority, 6.125% due 11/1/2023 (Advocate Health Care Network) | | AA/Aa2 | | | 5,175,000 | | | | 6,140,707 | |
Illinois Finance Authority, 5.50% due 8/15/2043 pre-refunded 8/15/2014 (Northwestern Memorial Hospital) | | NR/NR | | | 400,000 | | | | 407,924 | |
Illinois HFA, 5.70% due 2/20/2021 (Midwest Care Center I, Inc.; Collateralized: GNMA) | | NR/Aa1 | | | 565,000 | | | | 566,396 | |
Illinois Toll Highway Authority, 5.00% due 1/1/2021 pre-refunded 7/1/2015 (Congestion-Relief Plan; Insured: AGM) | | AA/Aa3 | | | 350,000 | | | | 370,916 | |
McHenry & Lake Counties Community Consolidated School District No. 15 GO, 0% due 1/1/2017 (Insured: AGM) (ETM) | | NR/Aa2 | | | 45,000 | | | | 43,794 | |
McHenry & Lake Counties Community Consolidated School District No. 15 GO, 0% due 1/1/2017 (Insured: AGM) | | NR/Aa2 | | | 955,000 | | | | 910,564 | |
Metropolitan Pier & Exposition Authority, 5.00% due 12/15/2022 (McCormick Place Expansion Project) | | AAA/NR | | | 1,000,000 | | | | 1,159,200 | |
14 Certified Semi-Annual Report
| | |
| Schedule of Investments, continued | | |
| |
Thornburg Intermediate Muncipal Fund | | March 31, 2014 (Unaudited) |
| | | | | | | | | | |
ISSUER-DESCRIPTION | | CREDIT RATING†
S&P/ MOODY’S | | PRINCIPAL
AMOUNT | | | VALUE | |
Niles Park District GO, 2.00% due 12/1/2014 (Parks and Recreation Projects) | | NR/Aa2 | | $ | 315,000 | | | $ | 318,248 | |
Niles Park District GO, 2.00% due 12/1/2015 (Parks and Recreation Projects) | | NR/Aa2 | | | 325,000 | | | | 332,715 | |
Niles Park District GO, 2.00% due 12/1/2016 (Parks and Recreation Projects) | | NR/Aa2 | | | 330,000 | | | | 339,672 | |
Niles Park District GO, 3.00% due 12/1/2017 (Parks and Recreation Projects) | | NR/Aa2 | | | 340,000 | | | | 360,080 | |
Niles Park District GO, 3.00% due 12/1/2018 (Parks and Recreation Projects) | | NR/Aa2 | | | 350,000 | | | | 370,184 | |
Niles Park District GO, 3.00% due 12/1/2019 (Parks and Recreation Projects) | | NR/Aa2 | | | 360,000 | | | | 379,217 | |
Niles Park District GO, 3.00% due 12/1/2020 (Parks and Recreation Projects) | | NR/Aa2 | | | 370,000 | | | | 384,804 | |
State of Illinois, 5.00% due 6/15/2018 | | AAA/NR | | | 2,000,000 | | | | 2,301,760 | |
Tazewell County School District GO, 9.00% due 12/1/2024 (Insured: Natl-Re) | | NR/Aa3 | | | 1,205,000 | | | | 1,778,038 | |
University of Illinois, 0% due 4/1/2014 (Insured: Natl-Re) | | AA-/Aa3 | | | 1,590,000 | | | | 1,590,000 | |
Village of Tinley Park GO, 4.00% due 12/1/2021 | | AA+/NR | | | 585,000 | | | | 637,217 | |
Village of Tinley Park GO, 5.00% due 12/1/2024 | | AA+/NR | | | 870,000 | | | | 991,443 | |
| | | |
INDIANA — 3.98% | | | | | | | | | | |
Allen County Jail Building Corp., 5.00% due 4/1/2018 (Insured: Syncora) | | NR/Aa2 | | | 2,495,000 | | | | 2,704,680 | |
Allen County Redevelopment District, 5.00% due 11/15/2018 | | NR/A2 | | | 1,560,000 | | | | 1,639,061 | |
Board of Trustees for the Vincennes University, 5.375% due 6/1/2022 | | NR/Aa3 | | | 895,000 | | | | 1,028,910 | |
City of Carmel Redevelopment Authority, 0% due 2/1/2016 (Performing Arts Center) | | AA+/Aa1 | | | 1,730,000 | | | | 1,706,714 | |
City of Carmel Redevelopment Authority, 0% due 2/1/2021 (Performing Arts Center) | | AA+/Aa1 | | | 2,000,000 | | | | 1,659,920 | |
City of Carmel Redevelopment District COP, 6.50% due 7/15/2035 (Performing Arts Center) | | NR/NR | | | 2,730,000 | | | | 2,859,675 | |
City of Petersburg, 5.40% due 8/1/2017 (Indianapolis Power and Light Company; Insured: Natl-Re/IBC) | | AA-/A2 | | | 1,325,000 | | | | 1,498,058 | |
Clay Multi-School Building Corp., 5.00% due 1/15/2018 (State Aid Withholding) | | AA+/NR | | | 1,735,000 | | | | 1,959,284 | |
Fort Wayne Redevelopment Authority, 5.00% due 8/1/2023 (Harrison Square; Insured: AGM) | | NR/Aa2 | | | 2,290,000 | | | | 2,508,214 | |
Franklin Township Multi-School Building Corp., 5.00% due 7/10/2017 (Franklin Central High School) (State Aid Withholding) | | AA+/NR | | | 630,000 | | | | 711,730 | |
Hobart Building Corp., 6.50% due 7/15/2019 (Insured: Natl-Re) (State Aid Withholding) | | AA+/Baa1 | | | 1,000,000 | | | | 1,224,140 | |
Indiana Bond Bank, 5.25% due 2/1/2015 (Safe Drinking Water & Wastewater Programs) | | AAA/NR | | | 500,000 | | | | 521,085 | |
Indiana Bond Bank, 5.25% due 10/15/2020 (Natural Gas Utility Improvements) | | NR/A3 | | | 5,340,000 | | | | 6,064,104 | |
Indiana Bond Bank, 5.25% due 4/1/2023 (Hendricks Regional Health Financing Program; Insured: AMBAC) | | AA/NR | | | 2,000,000 | | | | 2,315,080 | |
Indiana Finance Authority, 5.00% due 3/1/2019 (University Health) | | AA-/Aa3 | | | 5,000,000 | | | | 5,713,350 | |
Indiana Finance Authority, 5.00% due 11/1/2021 (Sisters of St. Francis Health Services, Inc.) | | NR/Aa3 | | | 605,000 | | | | 676,269 | |
Indiana Finance Authority, 5.25% due 9/15/2022 (Marian University) | | BBB-/NR | | | 2,480,000 | | | | 2,542,942 | |
Indiana Finance Authority, 5.25% due 9/15/2023 (Marian University) | | BBB-/NR | | | 2,605,000 | | | | 2,648,295 | |
Indiana Finance Authority, 4.10% due 11/15/2046 put 11/3/2016 (Ascension Health) | | AA+/Aa2 | | | 1,000,000 | | | | 1,087,420 | |
Noblesville Redevelopment Authority, 5.00% due 8/1/2017 (146th Street Extension) | | AA/NR | | | 1,000,000 | | | | 1,094,710 | |
Noblesville Redevelopment Authority, 5.00% due 8/1/2020 (146th Street Extension) | | AA/NR | | | 1,000,000 | | | | 1,079,400 | |
| | | |
KANSAS — 0.16% | | | | | | | | | | |
Kansas Development Finance Authority, 5.00% due 6/1/2020 (Wichita State University) | | NR/Aa3 | | | 575,000 | | | | 667,983 | |
Wyandotte County School District GO, 5.00% due 9/1/2014 (Insured: Natl-Re) | | NR/A1 | | | 1,030,000 | | | | 1,049,993 | |
| | | |
KENTUCKY — 0.35% | | | | | | | | | | |
Jefferson County School District Finance Corp., 4.00% due 9/1/2018 (Educational Facility Acquisition and Improvements; Insured: AGM) | | AA/Aa2 | | | 610,000 | | | | 617,991 | |
Louisville/Jefferson County Metro Government, 5.25% due 10/1/2026 (Norton Suburban Hospital and Kosair Children’s Hospital) | | A-/NR | | | 2,320,000 | | | | 2,543,022 | |
Turnpike Authority of Kentucky, 5.00% due 7/1/2017 (Revitalization Projects-Highway Capital Planning; Insured: AMBAC) | | AA+/Aa2 | | | 650,000 | | | | 688,298 | |
| | | |
LOUISIANA — 3.07% | | | | | | | | | | |
City of New Orleans, 6.00% due 6/1/2024 (Sewerage System; Insured: AGM) | | AA/A3 | | | 750,000 | | | | 840,952 | |
Law Enforcement District of the Parish of Plaquemines, 5.00% due 9/1/2023 | | BBB+/NR | | | 1,230,000 | | | | 1,300,577 | |
Law Enforcement District of the Parish of Plaquemines, 5.00% due 9/1/2025 | | BBB+/NR | | | 1,350,000 | | | | 1,411,317 | |
Law Enforcement District of the Parish of Plaquemines, 5.15% due 9/1/2027 | | BBB+/NR | | | 1,490,000 | | | | 1,561,565 | |
Law Enforcement District of the Parish of Plaquemines, 5.30% due 9/1/2029 | | BBB+/NR | | | 1,650,000 | | | | 1,731,345 | |
Louisiana Energy and Power Authority, 5.25% due 6/1/2029 (LEPA Unit No. 1; Insured: AGM) | | AA/A2 | | | 1,000,000 | | | | 1,113,760 | |
Louisiana Energy and Power Authority, 5.25% due 6/1/2030 (LEPA Unit No. 1; Insured: AGM) | | AA/A2 | | | 2,955,000 | | | | 3,252,657 | |
Louisiana Energy and Power Authority, 5.25% due 6/1/2031 (LEPA Unit No. 1; Insured: AGM) | | AA/A2 | | | 2,145,000 | | | | 2,347,231 | |
Louisiana Offshore Terminal Authority, 2.125% due 10/1/2037 put 10/1/2015 (Deepwater Oil Port-Loop LLC) | | BBB/A3 | | | 2,500,000 | | | | 2,544,025 | |
Louisiana Public Facilities Authority, 5.00% due 7/1/2022 (Black & Gold Facilities; Insured: CIFG) | | AA/A3 | | | 1,590,000 | | | | 1,663,585 | |
New Orleans Aviation Board, 5.25% due 1/1/2018 (Insured: AGM) (AMT) | | AA/A2 | | | 1,000,000 | | | | 1,122,990 | |
New Orleans Aviation Board, 5.25% due 1/1/2020 (Insured: AGM) | | AA/A2 | | | 2,000,000 | | | | 2,204,680 | |
New Orleans Regional Transit Authority, 5.00% due 12/1/2023 (Insured: AGM) | | AA/Aa3 | | | 1,000,000 | | | | 1,115,610 | |
New Orleans Regional Transit Authority, 5.00% due 12/1/2024 (Insured: AGM) | | AA/Aa3 | | | 1,000,000 | | | | 1,107,770 | |
Office Facilities Corp., 5.00% due 5/1/2014 (State Capitol Complex Program) | | NR/Aa3 | | | 1,000,000 | | | | 1,003,940 | |
Office Facilities Corp., 5.00% due 3/1/2019 (State Capitol Complex Program) | | AA-/Aa3 | | | 255,000 | | | | 293,064 | |
Parish of Lafourche, 5.00% due 1/1/2024 (Roads, Highways and Bridges) | | AA-/NR | | | 1,065,000 | | | | 1,235,070 | |
Certified Semi-Annual Report 15
| | |
| Schedule of Investments, continued | | |
| |
Thornburg Intermediate Muncipal Fund | | March 31, 2014 (Unaudited) |
| | | | | | | | | | |
ISSUER-DESCRIPTION | | CREDIT RATING†
S&P/ MOODY’S | | PRINCIPAL
AMOUNT | | | VALUE | |
Parish of Lafourche, 5.00% due 1/1/2025 (Roads, Highways and Bridges) | | AA-/NR | | $ | 2,620,000 | | | $ | 3,038,231 | |
St. Tammany Parish, 5.00% due 6/1/2019 pre-refunded 6/1/2016 (Insured: CIFG) | | AA-/NR | | | 1,300,000 | | | | 1,440,608 | |
St. Tammany Parish, 5.00% due 6/1/2020 pre-refunded 6/1/2016 (Insured: CIFG) | | AA-/NR | | | 1,000,000 | | | | 1,108,160 | |
State of Louisiana GO, 5.00% due 8/1/2018 (Insured: AGM) | | AA/Aa2 | | | 300,000 | | | | 318,840 | |
Terrebonne Parish Hospital Service District 1, 5.00% due 4/1/2028 (General Medical Center) | | A+/A2 | | | 1,500,000 | | | | 1,573,605 | |
| | | |
MAINE — 0.29% | | | | | | | | | | |
Maine Health and Higher Educational Facilities Authority, 5.00% due 7/1/2025 (Health and Educational Institution Facilities and Equipment; Insured: Natl-Re) | | NR/A1 | | | 3,105,000 | | | | 3,133,318 | |
| | | |
MARYLAND — 0.05% | | | | | | | | | | |
Washington Suburban Sanitary District GO, 4.00% due 6/1/2015 (Water Supply System) | | AAA/Aaa | | | 500,000 | | | | 503,215 | |
| | | |
MASSACHUSETTS — 1.47% | | | | | | | | | | |
Commonwealth of Massachusetts GO, 4.00% due 6/1/2015 (Commonwealth Capital Investment Plan) | | AA+/Aa1 | | | 525,000 | | | | 548,509 | |
Massachusetts Bay Transportation Authority, 5.25% due 7/1/2020 pre-refunded 7/1/2014 (Transportation Capital Program) | | AAA/Aa1 | | | 300,000 | | | | 303,813 | |
Massachusetts Bay Transportation Authority, 5.25% due 7/1/2030 (Transportation Capital Program) | | AAA/Aa1 | | | 1,000,000 | | | | 1,192,040 | |
Massachusetts Development Finance Agency, 5.50% due 10/1/2025 (Simmons College) | | BBB+/Baa1 | | | 460,000 | | | | 521,185 | |
Massachusetts Development Finance Agency, 5.50% due 10/1/2028 (Simmons College) | | BBB+/Baa1 | | | 1,330,000 | | | | 1,477,510 | |
Massachusetts Educational Financing Authority, 5.50% due 1/1/2022 (Higher Education Student Loans) | | AA/NR | | | 1,130,000 | | | | 1,251,690 | |
Massachusetts School Building Authority, 5.00% due 8/15/2030 pre-refunded 8/15/2015 (SMART Fund; Insured: AGM) | | AA/Aa2 | | | 10,000,000 | | | | 10,651,700 | |
| | | |
MICHIGAN — 4.87% | | | | | | | �� | | | |
Brighton Area Schools GO, 5.00% due 5/1/2016 (Livingston County School Building and Site; Insured: Q-SBLF) | | NR/Aa2 | | | 370,000 | | | | 403,925 | |
City of Detroit, 5.00% due 7/1/2015 (Water Supply System; Insured: AGM) | | AA/A2 | | | 1,260,000 | | | | 1,264,322 | |
City of Detroit, 4.00% due 7/1/2016 (Water Supply System; Insured: BHAC) | | AA+/Aa1 | | | 855,000 | | | | 873,246 | |
City of Detroit, 4.25% due 7/1/2016 (Water Supply System; Insured: Natl-Re) | | AA-/Baa1 | | | 1,100,000 | | | | 1,093,048 | |
City of Detroit, 5.25% due 7/1/2020 (Sewage Disposal System; Insured: Natl-Re) | | AA-/Baa1 | | | 3,000,000 | | | | 3,012,180 | |
City of Troy GO, 5.00% due 10/1/2016 (Public Safety Facilities and City Hall) | | AAA/NR | | | 1,060,000 | | | | 1,164,283 | |
City of Troy GO, 5.00% due 11/1/2025 (Downtown Development Authority-Community Center Facilities) | | AAA/NR | | | 300,000 | | | | 333,426 | |
County of Genesee, 5.00% due 11/1/2024 (Water Supply System; Insured: BAM) | | AA/A2 | | | 610,000 | | | | 664,937 | |
County of Genesee, 5.00% due 11/1/2025 (Water Supply System; Insured: BAM) | | AA/A2 | | | 345,000 | | | | 373,914 | |
County of Genesee, 5.25% due 11/1/2026 (Water Supply System; Insured: BAM) | | AA/A2 | | | 900,000 | | | | 983,142 | |
County of Genesee, 5.25% due 11/1/2027 (Water Supply System; Insured: BAM) | | AA/A2 | | | 1,375,000 | | | | 1,497,114 | |
County of Genesee, 5.25% due 11/1/2028 (Water Supply System; Insured: BAM) | | AA/A2 | | | 645,000 | | | | 699,741 | |
County of Genesee, 5.00% due 11/1/2029 (Water Supply System; Insured: BAM) | | AA/A2 | | | 1,210,000 | | | | 1,289,957 | |
County of Genesee, 5.00% due 11/1/2030 (Water Supply System; Insured: BAM) | | AA/A2 | | | 1,195,000 | | | | 1,271,181 | |
County of Genesee, 5.125% due 11/1/2032 (Water Supply System; Insured: BAM) | | AA/A2 | | | 750,000 | | | | 796,672 | |
Detroit City School District GO, 5.25% due 5/1/2026 (School Building & Site Improvement; Insured: AGM/Q-SBLF) | | AA/Aa2 | | | 3,150,000 | | | | 3,432,807 | |
Detroit City School District GO, 5.25% due 5/1/2027 (School Building & Site Improvement; Insured: AGM/Q-SBLF) | | AA/Aa2 | | | 1,100,000 | | | | 1,197,966 | |
Fraser Public School District GO, 5.00% due 5/1/2018 (School Building & Site Improvement; Insured: AGM/Q-SBLF) | | AA/Aa2 | | | 910,000 | | | | 950,704 | |
Kalamazoo Hospital Finance Authority, 6.25% due 6/1/2014 (Borgess Medical Center) (ETM) | | AA+/Aaa | | | 650,000 | | | | 656,591 | |
Kalamazoo Hospital Finance Authority, 5.00% due 5/15/2019 (Bronson Hospital; Insured: AGM) | | AA/A2 | | | 2,000,000 | | | | 2,246,380 | |
Kalamazoo Hospital Finance Authority, 5.00% due 5/15/2022 (Bronson Hospital; Insured: AGM) | | NR/A2 | | | 2,470,000 | | | | 2,760,521 | |
Kalamazoo Hospital Finance Authority, 5.25% due 5/15/2026 (Bronson Hospital) | | NR/A2 | | | 1,285,000 | | | | 1,390,691 | |
L’Anse Creuse Public Schools GO, 5.00% due 5/1/2014 (Macomb County School District Building & Site; Insured: AGM/Q-SBLF) | | AA/Aa2 | | | 500,000 | | | | 502,010 | |
Michigan Finance Authority, 5.00% due 4/1/2026 (Government Loan Program) | | A+/NR | | | 1,580,000 | | | | 1,704,630 | |
Michigan Public Educational Facilities Authority, 5.50% due 9/1/2022 (Black River School) | | NR/NR | | | 1,110,000 | | | | 1,060,971 | |
Michigan Public School Academy, 8.00% due 8/1/2035 (Will Carleton Charter School) | | NR/NR | | | 960,000 | | | | 1,009,296 | |
Michigan State Building Authority, 0% due 10/15/2025 (Insured: Natl-Re) | | AA-/Aa3 | | | 5,000,000 | | | | 2,938,150 | |
Michigan State Hospital Finance Authority, 5.00% due 11/15/2024 (Sparrow Health System) | | A+/A1 | | | 2,140,000 | | | | 2,219,266 | |
Michigan State Hospital Finance Authority, 5.00% due 7/15/2025 (Oakwood Health System) | | A/A2 | | | 3,000,000 | | | | 3,096,960 | |
Michigan State Hospital Finance Authority, 5.625% due 11/15/2029 (Henry Ford Health System) | | A-/A2 | | | 2,500,000 | | | | 2,636,925 | |
Michigan Strategic Fund, 5.25% due 10/15/2023 (Michigan House of Representatives Facilities; Insured: AGM) | | AA/A1 | | | 1,000,000 | | | | 1,082,240 | |
Royal Oak Hospital Finance Authority, 5.25% due 8/1/2016 (William Beaumont Hospital) | | A/A1 | | | 2,000,000 | | | | 2,166,640 | |
Royal Oak Hospital Finance Authority, 8.00% due 9/1/2029 (William Beaumont Hospital) | | A/A1 | | | 2,540,000 | | | | 3,077,591 | |
South Lyon Community Schools GO, 4.00% due 5/1/2019 (School Buildings and Sites; Insured: Natl-Re) | | AA-/Aa2 | | | 450,000 | | | | 473,171 | |
State of Michigan Trunk Line Fund, 5.50% due 11/1/2020 (Insured: AGM) | | AA+/Aa2 | | | 1,500,000 | | | | 1,787,895 | |
Warren Consolidated Schools District GO, 4.00% due 5/1/2018 (School Buildings and Sites; Insured: AGM) | | AA/A2 | | | 750,000 | | | | 788,423 | |
| | | |
MINNESOTA — 1.40% | | | | | | | | | | |
City of St. Cloud, 5.00% due 5/1/2014 (CentraCare Health System) | | NR/A1 | | | 835,000 | | | | 838,323 | |
Clay County GO, 3.00% due 4/1/2014 (Construction of County State-Aid Road Improvements) | | AA/NR | | | 725,000 | | | | 725,000 | |
Housing & Redevelopment Authority of the City of St. Paul, 5.25% due 5/15/2020 (HealthPartners Health System) | | A/A2 | | | 1,965,000 | | | | 2,087,538 | |
16 Certified Semi-Annual Report
| | |
| Schedule of Investments, continued | | |
| |
Thornburg Intermediate Municipal Fund | | March 31, 2014 (Unaudited) |
| | | | | | | | | | |
ISSUER-DESCRIPTION | | CREDIT RATING†
S&P/ MOODY’S | | PRINCIPAL
AMOUNT | | | VALUE | |
Minneapolis-St. Paul Metropolitan Airports Commission, 5.00% due 1/1/2023 (Airport, Marina & Port Improvements; Insured: BHAC) (AMT) | | AA+/Aa1 | | $ | 3,885,000 | | | $ | 4,002,249 | |
Minnesota Agriculture & Economic Development Board, 5.50% due 2/15/2025 (Essentia Health; Insured: AGM) | | AA/NR | | | 2,500,000 | | | | 2,799,475 | |
State of Minnesota GO, 5.00% due 8/1/2015 (Public Facility Capital Projects) | | AA+/Aa1 | | | 4,500,000 | | | | 4,790,385 | |
| | | |
MISSISSIPPI — 1.14% | | | | | | | | | | |
Medical Center Educational Building Corp., 4.00% due 6/1/2014 (University of Mississippi Medical Center) | | AA-/Aa2 | | | 1,240,000 | | | | 1,247,440 | |
Mississippi Development Bank, 5.00% due 3/1/2018 (Municipal Energy Agency Power Supply; Insured: Syncora) | | NR/Baa1 | | | 1,920,000 | | | | 2,031,629 | |
Mississippi Development Bank, 5.00% due 7/1/2022 (City of Canton Parking Facilities) | | NR/NR | | | 1,935,000 | | | | 2,067,528 | |
Mississippi Development Bank, 5.25% due 8/1/2027 (Department of Corrections) | | AA-/NR | | | 3,415,000 | | | | 3,740,518 | |
Mississippi Development Bank GO, 5.00% due 3/1/2025 (Capital City Convention Center) | | AA-/Aa2 | | | 2,850,000 | | | | 3,301,069 | |
| | | |
MISSOURI — 1.53% | | | | | | | | | | |
Kansas City Metropolitan Community Colleges Building Corp., 5.00% due 7/1/2017 (Junior College District; Insured: Natl-Re) | | NR/Aa2 | | | 1,000,000 | | | | 1,094,260 | |
Missouri Development Finance Board, 5.00% due 4/1/2019 (Eastland Center) | | A-/NR | | | 1,000,000 | | | | 1,071,230 | |
Missouri Development Finance Board, 5.00% due 4/1/2021 (Eastland Center) | | A-/NR | | | 2,000,000 | | | | 2,098,280 | |
Missouri Development Finance Board, 5.125% due 4/1/2022 (Eastland Center) | | A-/NR | | | 2,000,000 | | | | 2,121,320 | |
Missouri Health and Educational Facilities Authority, 5.00% due 4/1/2019 (Webster University) | | NR/A2 | | | 2,235,000 | | | | 2,574,384 | |
Missouri Health and Educational Facilities Authority, 5.00% due 4/1/2021 (Webster University) | | NR/A2 | | | 2,520,000 | | | | 2,900,520 | |
Tax Increment Financing Commission of Kansas City, 5.25% due 3/1/2018 (Maincor Project-Public Improvements) (ETM) | | NR/NR | | | 810,000 | | | | 893,179 | |
Tax Increment Financing Commission of Kansas City, 5.00% due 5/1/2022 (Union Hill Redevelopment Project) | | NR/NR | | | 3,805,000 | | | | 3,842,137 | |
| | | |
NEVADA — 1.40% | | | | | | | | | | |
Carson City, 5.00% due 9/1/2027 (Carson Tahoe Regional Medical Center) | | BBB+/NR | | | 2,450,000 | | | | 2,549,470 | |
City of Henderson, 5.625% due 7/1/2024 (Catholic Healthcare West) | | A/A3 | | | 2,910,000 | | | | 2,939,478 | |
Washoe County GO, 5.00% due 7/1/2026 (Reno Sparks Convention & Visitors Authority) | | AA/Aa2 | | | 5,000,000 | | | | 5,471,400 | |
Washoe County GO, 5.00% due 7/1/2029 (Reno Sparks Convention & Visitors Authority) | | AA/Aa2 | | | 2,000,000 | | | | 2,150,740 | |
Washoe County GO, 5.00% due 7/1/2032 (Reno Sparks Convention & Visitors Authority) | | AA/Aa2 | | | 2,000,000 | | | | 2,119,500 | |
| | | |
NEW HAMPSHIRE — 1.49% | | | | | | | | | | |
Manchester Housing & Redevelopment Authority, 0% due 1/1/2016 (Insured: Radian/ACA) | | NR/Caa1 | | | 4,990,000 | | | | 4,427,677 | |
New Hampshire Business Finance Authority PCR, 5.375% due 5/1/2014 (Central Maine Power Co.) | | BBB+/A3 | | | 3,920,000 | | | | 3,935,523 | |
New Hampshire Health & Education Facilities Authority, 5.25% due 10/1/2023 (Southern New Hampshire Medical Center) | | A-/NR | | | 1,000,000 | | | | 1,061,920 | |
New Hampshire Municipal Bond Bank, 5.00% due 8/15/2026 | | AA/Aa3 | | | 1,860,000 | | | | 2,146,142 | |
State of New Hampshire, 5.00% due 2/1/2022 (Turnpike System) | | A+/A1 | | | 2,250,000 | | | | 2,629,778 | |
State of New Hampshire, 5.00% due 2/1/2024 (Turnpike System) | | A+/A1 | | | 1,755,000 | | | | 2,001,174 | |
| | | |
NEW JERSEY — 1.63% | | | | | | | | | | |
Burlington County Bridge Commission, 4.00% due 12/1/2017 (County Governmental Loan Program) | | AA/Aa2 | | | 850,000 | | | | 941,128 | |
Cape May County Industrial Pollution Control Financing Authority, 6.80% due 3/1/2021 (Atlantic City Electric Company; Insured: Natl-Re) | | AA-/Baa1 | | | 560,000 | | | | 681,666 | |
Essex County Improvement Authority, 5.50% due 10/1/2024 (County Correctional Facilities & State Court Facilities; Insured: Natl-Re) | | NR/Aa2 | | | 2,500,000 | | | | 3,008,725 | |
New Jersey EDA, 5.50% due 9/1/2026 (School Facilities Construction; Insured: AMBAC) | | A+/A1 | | | 3,000,000 | | | | 3,553,320 | |
New Jersey EDA, 5.50% due 9/1/2027 (Schools Facilities Construction; Insured: Natl-Re) | | AA-/A1 | | | 1,700,000 | | | | 2,021,249 | |
New Jersey State Health Care Facilities Financing Authority, 5.00% due 7/1/2027 (Virtua Health) | | A+/NR | | | 2,000,000 | | | | 2,201,620 | |
New Jersey State Health Care Facilities Financing Authority, 5.00% due 7/1/2028 (Virtua Health) | | A+/NR | | | 1,000,000 | | | | 1,092,690 | |
New Jersey Water Supply Authority, 5.00% due 8/1/2019 (Manasquan Reservoir Water Supply System; Insured: Natl-Re) | | AA/Aa3 | | | 635,000 | | | | 672,433 | |
Passaic Valley Sewage Commissioners GO, 5.75% due 12/1/2022 | | NR/A2 | | | 3,000,000 | | | | 3,559,440 | |
| | | |
NEW MEXICO — 1.16% | | | | | | | | | | |
City of Farmington PCR, 4.70% due 9/1/2024 (Arizona Public Service Co.-Four Corners Project) | | A-/A3 | | | 3,000,000 | | | | 3,142,170 | |
City of Las Cruces GRT, 5.00% due 6/1/2030 (NMFA Loan) | | NR/Aa3 | | | 2,040,000 | | | | 2,196,590 | |
Incorporated County of Los Alamos, 5.00% due 7/1/2014 (Department of Public Utilities; Insured: AGM) | | AA/A2 | | | 2,000,000 | | | | 2,008,040 | |
New Mexico Hospital Equipment Loan Council, 5.00% due 7/1/2032 (Haverland Carter Lifestyle Group) | | NR/NR | | | 1,800,000 | | | | 1,665,738 | |
Regents of New Mexico State University, 3.00% due 4/1/2014 (NMSU Golf Course and Corbett Center Student Union) | | AA/Aa3 | | | 555,000 | | | | 555,000 | |
Rio Rancho Public School District No. 94, 5.00% due 8/1/2015 (State Aid Withholding) | | NR/Aa1 | | | 1,715,000 | | | | 1,823,045 | |
Rio Rancho Public School District No. 94 GO, 4.00% due 8/1/2014 (Insured: AGM) (State Aid Withholding) | | NR/Aa1 | | | 1,205,000 | | | | 1,220,448 | |
| | | |
NEW YORK — 4.82% | | | | | | | | | | |
City of New York GO, 5.00% due 8/1/2019 pre-refunded 8/1/2015 (Financial Emergency Act; Insured: Natl-Re) | | AA-/Aa2 | | | 465,000 | | | | 494,165 | |
City of New York GO, 5.00% due 8/1/2019 (Financial Emergency Act; Insured: Natl-Re) | | AA/Aa2 | | | 140,000 | | | | 148,655 | |
City of New York GO, 0.44% due 8/1/2021 (Capital Projects) | | AA/Aa2 | | | 2,700,000 | | | | 2,702,322 | |
City of New York GO, 5.00% due 8/1/2027 (Financial Emergency Act) | | AA/Aa2 | | | 4,530,000 | | | | 5,155,683 | |
Certified Semi-Annual Report 17
| | |
| Schedule of Investments, continued | | |
| |
Thornburg Intermediate Municipal Fund | | March 31, 2014 (Unaudited) |
| | | | | | | | | | |
ISSUER-DESCRIPTION | | CREDIT RATING†
S&P/ MOODY’S | | PRINCIPAL
AMOUNT | | | VALUE | |
County of Nassau GO, 5.00% due 4/1/2026 (Insured: BAM) | | AA/NR | | $ | 1,300,000 | | | $ | 1,446,016 | |
Erie County IDA, 5.00% due 5/1/2019 (City of Buffalo School District) | | AA-/Aa3 | | | 3,000,000 | | | | 3,485,460 | |
Erie County IDA, 5.00% due 5/1/2027 (City of Buffalo School District) (State Aid Withholding) | | AA-/Aa3 | | | 5,000,000 | | | | 5,612,300 | |
Lake Placid Central School District GO, 5.00% due 6/15/2017 (Elementary, Middle/High School Projects; Insured: Natl-Re) (State Aid Withholding) | | NR/A1 | | | 305,000 | | | | 339,163 | |
New York City Municipal Water Finance Authority, 0.07% due 6/15/2035 put 4/1/2014 (Water and Sewer System Capital Improvements; SPA: Bayerische Landesbank) (daily demand notes) | | AAA/Aa1 | | | 20,000,000 | | | | 20,000,000 | |
New York City Transitional Finance Authority, 4.00% due 8/1/2014 (City Capital Projects) | | AAA/Aa1 | | | 3,340,000 | | | | 3,383,286 | |
New York State Dormitory Authority, 5.625% due 7/1/2016 (City University System) | | AA-/Aa3 | | | 990,000 | | | | 1,050,796 | |
New York State Dormitory Authority, 5.00% due 7/1/2017 (Bishop Henry B. Hucles Nursing Home; Insured: SONYMA) | | NR/Aa1 | | | 850,000 | | | | 923,457 | |
New York State Dormitory Authority, 5.25% due 5/15/2021 (State University Educational Facilities) | | AA-/Aa3 | | | 500,000 | | | | 584,515 | |
New York State Dormitory Authority, 5.00% due 7/1/2023 (Miriam Osborn Memorial Home Assoc.) | | NR/NR | | | 2,180,000 | | | | 2,330,093 | |
New York State Dormitory Authority, 5.00% due 12/15/2027 (State Educational & Medical Facilities) | | AAA/Aa2 | | | 2,500,000 | | | | 2,839,900 | |
United Nations Development Corp., 5.00% due 7/1/2025 (One, Two and Three U.N. Plaza Project) | | NR/A1 | | | 1,700,000 | | | | 1,829,285 | |
| | | |
NORTH CAROLINA — 0.30% | | | | | | | | | | |
Charlotte-Mecklenburg Hospital Authority, 3.00% due 1/15/2018 (Carolinas HealthCare System) | | AA-/Aa3 | | | 600,000 | | | | 636,282 | |
Charlotte-Mecklenburg Hospital Authority, 5.00% due 1/15/2028 (Carolinas HealthCare System) | | AA-/Aa3 | | | 2,190,000 | | | | 2,412,198 | |
County of Henderson COP, 5.25% due 5/1/2017 pre-refunded 5/1/2015 (Dana Elementary School and Depts. of Social Services, Public Health and Veterans Services; Insured: AMBAC) | | AA/Aa3 | | | 230,000 | | | | 242,606 | |
| | | |
NORTH DAKOTA — 0.23% | | | | | | | | | | |
City of Bismarck GO, 2.50% due 5/1/2014 (Street, Sewer and Water Systems) | | NR/Aa1 | | | 250,000 | | | | 250,478 | |
County of Ward, 5.125% due 7/1/2021 (Trinity Health System) | | BBB-/NR | | | 1,000,000 | | | | 1,027,070 | |
North Dakota Building Authority, 4.25% due 12/1/2015 (Various State Agency Capital Projects; Insured: Natl-Re) | | AA+/Aa2 | | | 1,105,000 | | | | 1,179,101 | |
| | | |
OHIO — 6.53% | | | | | | | | | | |
Akron, Bath and Copley Joint Township Hospital District, 5.00% due 11/15/2024 (Children’s Hospital Medical Center of Akron) | | NR/A1 | | | 1,000,000 | | | | 1,093,930 | |
American Municipal Power, Inc., 5.25% due 2/15/2028 (AMP Fremont Energy Center) | | A/A1 | | | 4,000,000 | | | | 4,419,920 | |
City of Cleveland, 2.00% due 10/1/2014 (Parks and Recreation Facilities) | | AA/A1 | | | 470,000 | | | | 474,131 | |
City of Cleveland, 2.00% due 10/1/2015 (Parks and Recreation Facilities) | | AA/A1 | | | 475,000 | | | | 486,932 | |
City of Cleveland, 2.00% due 10/1/2015 (Public Safety, Health and Welfare Facilities) | | AA/A1 | | | 375,000 | | | | 384,420 | |
City of Cleveland, 3.00% due 10/1/2017 (Parks and Recreation Facilities) | | AA/A1 | | | 490,000 | | | | 523,443 | |
City of Cleveland, 5.00% due 11/15/2027 (Public Facilities Improvements) | | AA/A1 | | | 1,285,000 | | | | 1,453,052 | |
City of Cleveland, 5.00% due 10/1/2028 (Bridges and Roadways) | | AA/A1 | | | 2,420,000 | | | | 2,707,593 | |
City of Cleveland, 5.00% due 11/15/2028 (Public Facilities Improvements) | | AA/A1 | | | 1,000,000 | | | | 1,119,980 | |
City of Cleveland, 5.00% due 10/1/2029 (Bridges and Roadways) | | AA/A1 | | | 100,000 | | | | 111,010 | |
City of Cleveland, 5.00% due 11/15/2029 (Public Facilities Improvements) | | AA/A1 | | | 1,415,000 | | | | 1,571,202 | |
City of Cleveland, 5.00% due 11/15/2030 (Public Facilities Improvements) | | AA/A1 | | | 1,485,000 | | | | 1,637,510 | |
City of Cleveland GO, 5.00% due 12/1/2016 (Various Municipal Capital Improvements) | | AA/A1 | | | 1,000,000 | | | | 1,109,640 | |
City of Cleveland GO, 5.00% due 12/1/2024 (Various Municipal Capital Improvements) | | AA/A1 | | | 1,000,000 | | | | 1,140,870 | |
City of Cleveland GO, 5.00% due 12/1/2026 (Various Municipal Capital Improvements) | | AA/A1 | | | 1,230,000 | | | | 1,382,323 | |
City of Hamilton, 5.25% due 10/1/2017 (Wastewater System; Insured: AGM) | | NR/A1 | | | 1,500,000 | | | | 1,607,040 | |
Cleveland Municipal School District GO, 5.25% due 12/1/2019 pre-refunded 6/1/2014 (Educational Facilities Improvements; Insured: AGM) (State Aid Withholding) | | AA/Aa2 | | | 1,045,000 | | | | 1,053,903 | |
Cleveland Municipal School District GO, 5.25% due 12/1/2023 pre-refunded 6/1/2014 (Educational Facilities Improvements; Insured: AGM) (State Aid Withholding) | | AA/Aa2 | | | 1,000,000 | | | | 1,008,520 | |
Cleveland-Cuyahoga County Port Authority, 6.25% due 5/15/2016 (Council for Economic Opportunities in Greater Cleveland; LOC: FifthThird Bank) | | BBB+/NR | | | 710,000 | | | | 710,774 | |
Cleveland-Cuyahoga County Port Authority, 5.00% due 10/1/2021 (Cleveland Museum of Art) | | AA+/NR | | | 1,330,000 | | | | 1,537,187 | |
Cleveland-Cuyahoga County Port Authority, 5.00% due 7/1/2025 (County Administration Offices) | | AA-/Aa2 | | | 1,780,000 | | | | 2,056,968 | |
County of Allen, 5.00% due 5/1/2025 (Catholic Health Partners-Mercy Health West Facility) | | AA-/A1 | | | 4,470,000 | | | | 4,927,371 | |
County of Allen, 5.00% due 5/1/2026 (Catholic Health Partners-Mercy Health West Facility) | | AA-/A1 | | | 3,855,000 | | | | 4,203,222 | |
County of Hamilton, 5.00% due 5/15/2028 (Cincinnati Children’s Hospital Medical Center) | | AA/Aa2 | | | 2,665,000 | | | | 2,976,645 | |
County of Hamilton, 5.00% due 5/15/2029 (Cincinnati Children’s Hospital Medical Center) | | AA/Aa2 | | | 1,000,000 | | | | 1,109,870 | |
County of Hamilton, 5.00% due 5/15/2031 (Cincinnati Children’s Hospital Medical Center) | | AA/Aa2 | | | 4,420,000 | | | | 4,827,082 | |
Deerfield Township, 5.00% due 12/1/2016 | | NR/A1 | | | 1,035,000 | | | | 1,129,268 | |
Deerfield Township, 5.00% due 12/1/2025 | | NR/A1 | | | 1,000,000 | | | | 1,026,870 | |
Lucas County Health Care Facility, 5.00% due 8/15/2021 (Sunset Retirement Community) | | NR/NR | | | 1,400,000 | | | | 1,498,938 | |
Lucas County Health Care Facility, 5.125% due 8/15/2025 (Sunset Retirement Community) | | NR/NR | | | 1,250,000 | | | | 1,334,650 | |
Ohio Air Quality Development Authority, 5.70% due 8/1/2020 (FirstEnergy Nuclear Generation Corp.) | | BBB-/Baa3 | | | 3,000,000 | | | | 3,364,620 | |
Ohio State Water Development Authority PCR, 5.875% due 6/1/2033 put 6/1/2016 (FirstEnergy Nuclear Generation Corp.) | | BBB-/Baa2 | | | 1,000,000 | | | | 1,079,550 | |
Ohio State Water Development Authority PCR, 3.375% due 7/1/2033 put 7/1/2015 (FirstEnergy Nuclear Generation Corp.) | | BBB-/Baa3 | | | 3,000,000 | | | | 3,058,830 | |
State of Ohio GO, 5.00% due 8/1/2015 (Educational Facilities Projects) | | AA+/Aa1 | | | 10,775,000 | | | | 11,468,802 | |
18 Certified Semi-Annual Report
| | |
| Schedule of Investments, continued | | |
| |
Thornburg Intermediate Municipal Fund | | March 31, 2014 (Unaudited) |
| | | | | | | | | | |
ISSUER-DESCRIPTION | | CREDIT RATING†
S&P/ MOODY’S | | PRINCIPAL
AMOUNT | | | VALUE | |
State of Ohio Higher Educational Facility Commission, 5.05% due 7/1/2037 pre-refunded 7/1/2016 (Kenyon College) | | A+/A1 | | $ | 1,200,000 | | | $ | 1,323,432 | |
| | | |
OKLAHOMA — 0.59% | | | | | | | | | | |
Oklahoma State Industries Authority, 5.50% due 7/1/2023 (Oklahoma Medical Research Foundation) | | NR/A1 | | | 3,730,000 | | | | 4,060,441 | |
Oklahoma State Power Authority, 5.00% due 1/1/2018 (Insured: AGM) | | AA/A2 | | | 1,000,000 | | | | 1,138,520 | |
Tulsa County Industrial Authority, 5.00% due 12/15/2024 (St. Francis Health System, Inc.) | | AA+/Aa2 | | | 1,130,000 | | | | 1,241,079 | |
| | | |
OREGON — 0.03% | | | | | | | | | | |
Oregon State Department of Administrative Services COP, 4.00% due 5/1/2014 (Correctional Facilities Improvements; Insured: Natl-Re) | | AA/Aa2 | | | 320,000 | | | | 321,043 | |
| | | |
PENNSYLVANIA — 5.41% | | | | | | | | | | |
Allegheny County Hospital Development Authority, 5.00% due 5/15/2019 (University of Pittsburgh Medical Center) | | A+/Aa3 | | | 2,500,000 | | | | 2,876,725 | |
Allegheny County IDA, 5.90% due 8/15/2026 (Propel Charter School-McKeesport) | | BBB-/NR | | | 1,090,000 | | | | 1,120,160 | |
Allegheny County IDA, 6.375% due 8/15/2035 (Propel Charter School-McKeesport) | | BBB-/NR | | | 1,130,000 | | | | 1,164,409 | |
Ambridge Area School District GO, 5.50% due 11/1/2031 pre-refunded 11/1/2014 (Senior High School; Insured: Natl-Re) (State Aid Withholding) | | AA-/NR | | | 350,000 | | | | 360,913 | |
Bethlehem Area School District GO, 5.00% due 10/15/2020 (Educational Facilities; Insured: AGM) (State Aid Withholding) | | AA/NR | | | 475,000 | | | | 529,150 | |
Bradford County IDA, 5.20% due 12/1/2019 (International Paper Company) (AMT) | | BBB/Baa3 | | | 2,620,000 | | | | 2,722,887 | |
Chartiers Valley Industrial & Community Development Authority, 5.75% due 12/1/2022 (Asbury Health Center) | | NR/NR | | | 900,000 | | | | 920,304 | |
County of Lehigh GO, 5.00% due 11/15/2016 | | NR/Aa1 | | | 5,725,000 | | | | 6,392,478 | |
Dallastown Area School District GO, 4.00% due 5/1/2021 (State Aid Withholding) | | AA/NR | | | 460,000 | | | | 502,679 | |
Lancaster County Solid Waste Management Authority, 5.25% due 12/15/2030 (Acquisition of Susquehanna Resource Management Facility) | | AA-/NR | | | 3,000,000 | | | | 3,304,080 | |
Monroeville Financing Authority, 5.00% due 2/15/2026 (University of Pittsburgh Medical Center) | | A+/Aa3 | | | 3,490,000 | | | | 3,996,713 | |
Pennsylvania Economic Development Financing Authority, 4.625% due 12/1/2018 (Colver Project; Insured: AMBAC) (AMT) | | BBB-/Ba1 | | | 7,470,000 | | | | 7,674,230 | |
Pennsylvania Higher Education Facilities Authority, 0% due 7/1/2020 (Insured: AMBAC) | | NR/NR | | | 2,032,839 | | | | 1,285,893 | |
Pennsylvania Turnpike Commission, 0% due 12/1/2030 (PennDOT-Mass Transit Agencies) | | A-/A3 | | | 4,000,000 | | | | 4,012,400 | |
Pittsburgh Water & Sewer Authority, 5.00% due 9/1/2030 (Water and Sewer System; Insured: AGM) | | A/A2 | | | 5,000,000 | | | | 5,442,150 | |
Pittsburgh Water & Sewer Authority, 5.00% due 9/1/2031 (Water and Sewer System; Insured: AGM) | | A/A2 | | | 3,740,000 | | | | 4,030,935 | |
Pittsburgh Water & Sewer Authority, 5.00% due 9/1/2031 (Water and Sewer System; Insured: AGM) | | A/A2 | | | 3,665,000 | | | | 3,950,100 | |
Plum Borough School District GO, 4.00% due 9/15/2020 (Insured: BAM) (State Aid Withholding) | | AA/NR | | | 405,000 | | | | 443,005 | |
Plum Borough School District GO, 4.00% due 9/15/2017 (Insured: BAM) (State Aid Withholding) | | AA/NR | | | 365,000 | | | | 399,624 | |
Plum Borough School District GO, 4.00% due 9/15/2018 (Insured: BAM) (State Aid Withholding) | | AA/NR | | | 355,000 | | | | 391,877 | |
Plum Borough School District GO, 4.00% due 9/15/2020 (Insured: BAM) (State Aid Withholding) | | AA/NR | | | 385,000 | | | | 421,128 | |
Plum Borough School District GO, 4.00% due 9/15/2021 (Insured: BAM) (State Aid Withholding) | | AA/NR | | | 425,000 | | | | 461,869 | |
Plum Borough School District GO, 5.00% due 9/15/2021 (Insured: BAM) (State Aid Withholding) | | AA/NR | | | 430,000 | | | | 496,156 | |
School District of Philadelphia GO, 5.00% due 9/1/2018 (School Reform Commission) (State Aid Withholding) | | A+/Aa3 | | | 5,250,000 | | | | 5,919,427 | |
| | | |
RHODE ISLAND — 0.46% | | | | | | | | | | |
State of Rhode Island and Providence Plantations COP, 5.00% due 10/1/2024 (Training School Project) | | AA-/Aa3 | | | 3,595,000 | | | | 4,072,668 | |
State of Rhode Island and Providence Plantations GO, 4.00% due 10/15/2023 (Consolidated Capital Development Loan) | | AA/Aa2 | | | 800,000 | | | | 871,024 | |
| | | |
SOUTH CAROLINA — 2.07% | | | | | | | | | | |
City of Myrtle Beach, 5.00% due 6/1/2028 (Municipal Sports Complex) | | AA-/A1 | | | 1,000,000 | | | | 1,113,760 | |
City of Myrtle Beach, 5.00% due 6/1/2030 (Municipal Sports Complex) | | AA-/A1 | | | 1,000,000 | | | | 1,097,710 | |
Greenwood Fifty School Facilities, Inc., 5.00% due 12/1/2025 (School District No. 50 Project; Insured: AGM) | | AA/A1 | | | 2,400,000 | | | | 2,687,592 | |
Lexington County Health Services District, Inc., 5.00% due 11/1/2016 (Lexington Medical Center) | | AA-/A1 | | | 250,000 | | | | 277,470 | |
Lexington One School Facilities Corp., 5.00% due 12/1/2019 (School District No. 1 Project) | | NR/Aa3 | | | 1,000,000 | | | | 1,099,420 | |
Lexington One School Facilities Corp., 5.25% due 12/1/2021 pre-refunded 12/1/2015 (School District No. 1 Project) | | NR/Aa3 | | | 1,700,000 | | | | 1,838,686 | |
Medical University Hospital Authority, 5.25% due 8/15/2022 pre-refunded 8/15/2014 (Healthcare Facilities Capital Project; Insured: Natl-Re/FHA) | | AA-/Baa1 | | | 300,000 | | | | 305,628 | |
Medical University Hospital Authority, 5.25% due 8/15/2023 pre-refunded 8/15/2014 (Healthcare Facilities Capital Project; Insured: Natl-Re/FHA) | | AA-/Baa1 | | | 1,550,000 | | | | 1,579,078 | |
Medical University Hospital Authority, 5.25% due 2/15/2024 pre-refunded 8/15/2014 (Healthcare Facilities Capital Project; Insured: Natl-Re/FHA) | | AA-/Baa1 | | | 725,000 | | | | 738,601 | |
Medical University Hospital Authority, 4.85% due 2/15/2026 pre-refunded 8/15/2014 (Healthcare Facilities Capital Project; Insured: Natl-Re/FHA) | | AA-/Baa1 | | | 300,000 | | | | 305,181 | |
Medical University Hospital Authority, 5.25% due 2/15/2027 pre-refunded 8/15/2014 (Healthcare Facilities Capital Project; Insured: Natl-Re/FHA) | | AA-/Baa1 | | | 250,000 | | | | 254,690 | |
Scago Educational Facilities Corp., 5.00% due 12/1/2017 (Colleton School District; Insured: AGM) | | AA/A3 | | | 1,000,000 | | | | 1,100,520 | |
Scago Educational Facilities Corp., 5.00% due 4/1/2019 pre-refunded 10/1/2015 (Spartanburg School District; Insured: AGM) | | AA/Aa3 | | | 2,740,000 | | | | 2,932,156 | |
Scago Educational Facilities Corp., 5.00% due 4/1/2021 pre-refunded 10/1/2015 (Spartanburg School District; Insured: AGM) | | AA/Aa3 | | | 1,000,000 | | | | 1,070,130 | |
Certified Semi-Annual Report 19
| | |
| Schedule of Investments, continued | | |
| |
Thornburg Intermediate Municipal Fund | | March 31, 2014 (Unaudited) |
| | | | | | | | | | |
ISSUER-DESCRIPTION | | CREDIT RATING†
S&P/ MOODY’S | | PRINCIPAL
AMOUNT | | | VALUE | |
Securing Assets For Education, 5.00% due 12/1/2019 (School District of Berkeley County Project) | | A+/Aa3 | | $ | 2,000,000 | | | $ | 2,204,960 | |
South Carolina Housing Finance & Development Authority, 5.30% due 7/1/2023 (AMT) | | NR/Aa1 | | | 835,000 | | | | 858,238 | |
Sumter Two School Facilities, Inc., 5.00% due 12/1/2021 (School District No. 2 Project; Insured: AGM) | | AA/A3 | | | 2,855,000 | | | | 3,064,671 | |
| | | |
SOUTH DAKOTA — 0.33% | | | | | | | | | | |
South Dakota Health & Educational Facilities Authority, 5.00% due 7/1/2023 (Avera Health) | | AA-/A1 | | | 1,575,000 | | | | 1,735,650 | |
South Dakota Health & Educational Facilities Authority, 5.00% due 11/1/2024 (Sanford Health) | | A+/A1 | | | 1,700,000 | | | | 1,832,719 | |
| | | |
TENNESSEE — 1.08% | | | | | | | | | | |
Clarksville Natural Gas Acquisition Corp., 5.00% due 12/15/2014 | | NR/Baa2 | | | 1,000,000 | | | | 1,030,920 | |
Tennessee Energy Acquisition Corp., 5.00% due 2/1/2023 (Prepaid Gas Purchase Agreement) | | A-/Baa1 | | | 2,500,000 | | | | 2,764,700 | |
Tennessee Energy Acquisition Corp., 5.25% due 9/1/2023 (Prepaid Gas Purchase Agreement) | | A-/Baa2 | | | 7,000,000 | | | | 7,921,270 | |
| | | |
TEXAS — 8.41% | | | | | | | | | | |
Arlington ISD GO, 5.00% due 2/15/2018 pre-refunded 2/15/2015 (Tarrant County Educational Facilities; Guaranty: PSF) | | NR/Aaa | | | 300,000 | | | | 312,591 | |
Austin Community College District, 5.50% due 8/1/2023 (Round Rock Campus) | | AA/Aa2 | | | 2,180,000 | | | | 2,486,137 | |
Bexar County Health Facilities Development Corp., 5.00% due 7/1/2027 (Army Retirement Residence) | | BBB/NR | | | 1,825,000 | | | | 1,851,353 | |
Bexar Metropolitan Water District, 5.00% due 5/1/2021 (Waterworks System; Insured: Syncora) | | A+/A1 | | | 1,300,000 | | | | 1,444,820 | |
Bexar Metropolitan Water District, 5.00% due 5/1/2022 (Waterworks System; Insured: Syncora) | | A+/A1 | | | 2,300,000 | | | | 2,556,220 | |
Board of Regents of the Texas A&M University System, 5.25% due 5/15/2017 (Revenue Financing System and Capital Plan Projects) | | AA+/Aaa | | | 200,000 | | | | 211,054 | |
Cities of Dallas and Fort Worth, 5.00% due 11/1/2015 (DFW International Airport Development Plan) | | A+/A2 | | | 1,000,000 | | | | 1,073,180 | |
City of Arlington GO, 5.00% due 8/15/2019 (Insured: AGM) | | AAA/Aa1 | | | 600,000 | | | | 638,352 | |
City of Dallas, 5.00% due 10/1/2031 pre-refunded 10/1/2015 (Waterworks & Sewer System; Insured: AGM) | | AAA/Aa1 | | | 4,710,000 | | | | 5,042,526 | |
City of Galveston, 5.00% due 9/1/2021 (Galveston Island Convention Center; Insured: AGM) | | NR/A2 | | | 545,000 | | | | 615,043 | |
City of Galveston, 5.00% due 9/1/2024 (Galveston Island Convention Center; Insured: AGM) | | NR/A2 | | | 1,115,000 | | | | 1,241,129 | |
City of Laredo, 5.00% due 3/15/2018 (Sports Venue Improvements; Insured: AMBAC) | | A+/A1 | | | 2,040,000 | | | | 2,101,894 | |
City of Laredo GO, 5.00% due 8/15/2017 pre-refunded 8/15/2015 (Waterworks and Sewer System; Insured: AMBAC) | | NR/Aa2 | | | 185,000 | | | | 197,056 | |
City of Laredo GO, 5.00% due 8/15/2017 (Waterworks and Sewer System; Insured: AMBAC) | | AA/Aa2 | | | 315,000 | | | | 334,562 | |
City of Pharr Higher Education Finance Authority, 5.75% due 8/15/2024 (IDEA Public Schools) | | BBB/NR | | | 5,050,000 | | | | 5,435,264 | |
City of San Antonio Passenger Facility, 5.00% due 7/1/2024 (Airport System Improvements) (AMT) | | A-/A2 | | | 2,065,000 | | | | 2,274,329 | |
City of San Antonio Passenger Facility, 5.00% due 7/1/2025 (Airport System Improvements) (AMT) | | A-/A2 | | | 1,160,000 | | | | 1,268,483 | |
Dallas County Utilities & Reclamation District, 5.15% due 2/15/2022 (Insured: AMBAC) | | BBB+/A3 | | | 3,000,000 | | | | 3,254,820 | |
Eagle Mountain & Saginaw Texas ISD GO, 2.50% due 8/1/2050 put 8/1/2014 (School Improvements; Guaranty: PSF) | | AAA/NR | | | 1,000,000 | | | | 1,007,340 | |
Grapevine-Colleyville ISD GO, 5.25% due 8/15/2023 pre-refunded 8/15/2015 (Educational Facilities; Insured: Natl-Re) | | AA-/Aa2 | | | 545,000 | | | | 582,387 | |
Grapevine-Colleyville ISD GO, 5.25% due 8/15/2023 (Educational Facilities; Insured: Natl-Re) | | AA/Aa2 | | | 20,000 | | | | 21,322 | |
Harris County Hospital District, 5.00% due 2/15/2015 (Insured: Natl-Re) | | AA-/A2 | | | 2,075,000 | | | | 2,147,750 | |
Houston Airport System, 5.00% due 7/1/2014 | | A/NR | | | 1,000,000 | | | | 1,011,960 | |
Houston Higher Education Finance Corp., 6.50% due 5/15/2031 (Cosmos Foundation, Inc.) | | BBB/NR | | | 775,000 | | | | 879,617 | |
Houston ISD GO, 1.00% due 6/1/2035 put 6/1/2014 (Harris County Educational Facilities; Guaranty: PSF) | | AAA/Aaa | | | 2,000,000 | | | | 2,002,520 | |
Kimble County Hospital District GO, 5.00% due 8/15/2017 | | NR/NR | | | 510,000 | | | | 566,702 | |
Kimble County Hospital District GO, 5.00% due 8/15/2018 | | NR/NR | | | 525,000 | | | | 591,796 | |
La Vernia Higher Education Finance Corp., 5.75% due 8/15/2024 (Kipp, Inc.) | | BBB/NR | | | 3,000,000 | | | | 3,304,680 | |
Lower Colorado River Authority, 5.00% due 5/15/2026 (Electric Generation, Water & Electric Transmission) | | A/A1 | | | 9,470,000 | | | | 10,599,108 | |
North Central Texas Health Facilities Development Corp., 5.00% due 8/15/2019 (Children’s Medical Center of Dallas) | | NR/Aa3 | | | 270,000 | | | | 310,546 | |
North East ISD GO, 2.00% due 8/1/2043 put 8/1/2015 (Educational Facilities; Guaranty: PSF) | | AAA/Aaa | | | 7,130,000 | | | | 7,271,744 | |
North Texas Tollway Authority, 5.00% due 9/1/2017 (DOT-President George Bush Turnpike Western Extension) | | AA+/NR | | | 450,000 | | | | 512,091 | |
Nueces River Authority, 5.00% due 7/15/2020 (Corpus Christi Lake Texana Water Supply Facilities; Insured: AGM) | | AA/Aa3 | | | 1,000,000 | | | | 1,054,940 | |
San Juan Higher Education Finance Authority, 5.75% due 8/15/2024 (IDEA Public Schools) | | BBB/NR | | | 1,590,000 | | | | 1,726,454 | |
Socorro ISD GO, 5.25% due 8/15/2014 (Educational Facility Projects; Guaranty: PSF) | | AAA/NR | | | 1,100,000 | | | | 1,121,021 | |
Stafford Economic Development Corp., 6.00% due 9/1/2017 (Convention Center-Performing Arts Center Theater Complex; Insured: Natl-Re) | | AA-/A1 | | | 1,775,000 | | | | 1,914,213 | |
State of Texas, 2.00% due 8/28/2014 (General Revenue Fund-Cash Flow Management) | | SP-1+/Mig1 | | | 10,500,000 | | | | 10,581,480 | |
Texas City Industrial Development Corp., 7.375% due 10/1/2020 (BP Pipelines N.A., Inc.) | | A/A2 | | | 2,705,000 | | | | 3,491,587 | |
Texas Public Finance Authority Charter School Finance Corp., 5.00% due 8/15/2023 (IDEA Public Schools; Insured: ACA) | | BBB/NR | | | 3,000,000 | | | | 3,109,920 | |
Texas Public Finance Authority Charter School Finance Corp., 6.00% due 2/15/2030 (Cosmos Foundation, Inc.) | | BBB/NR | | | 1,750,000 | | | | 1,896,230 | |
Texas Public Finance Authority Charter School Finance Corp., 5.00% due 8/15/2030 (IDEA Public Schools; Insured: ACA) | | BBB/NR | | | 2,000,000 | | | | 2,017,160 | |
Uptown Development Authority, 5.50% due 9/1/2029 (Infrastructure Improvements) | | BBB/NR | | | 1,250,000 | | | | 1,321,125 | |
| | | |
U.S. VIRGIN ISLANDS — 0.50% | | | | | | | | | | |
Virgin Islands Public Finance Authority, 6.625% due 10/1/2029 | | NR/Baa3 | | | 5,000,000 | | | | 5,466,800 | |
| | | |
UTAH — 0.18% | | | | | | | | | | |
City of Herriman, 5.75% due 11/1/2027 (Towne Center Assessment Area) | | AA-/NR | | | 480,000 | | | | 536,933 | |
Local Building Authority of Salt Lake Valley Fire Service Area, 5.25% due 4/1/2020 | | NR/Aa2 | | | 1,250,000 | | | | 1,398,412 | |
20 Certified Semi-Annual Report
| | |
| Schedule of Investments, continued | | |
| |
Thornburg Intermediate Municipal Fund | | March 31, 2014 (Unaudited) |
| | | | | | | | | | |
ISSUER-DESCRIPTION | | CREDIT RATING†
S&P/ MOODY’S | | PRINCIPAL
AMOUNT | | | VALUE | |
| | | |
VIRGINIA — 0.99% | | | | | | | | | | |
County of Hanover IDA, 6.00% due 10/1/2021 (FirstHealth Richmond Memorial Hospital) (ETM) | | AA-/NR | | $ | 795,000 | | | $ | 861,255 | |
Fairfax County GO, 4.00% due 10/1/2015 (Public Facilities and Improvements) (State Aid Withholding) | | AAA/Aaa | | | 2,850,000 | | | | 3,012,992 | |
Pittsylvania County GO, 3.00% due 7/15/2017 (Educational Capital Projects) (State Aid Withholding) | | A+/Aa3 | | | 280,000 | | | | 280,476 | |
Virginia Housing Development Authority GO, 4.85% due 4/1/2019 (Multi-Family Housing Development) (AMT) | | AAA/Aaa | | | 3,100,000 | | | | 3,315,729 | |
Virginia Housing Development Authority GO, 4.85% due 10/1/2019 (Multi-Family Housing Development) (AMT) | | AAA/Aaa | | | 3,100,000 | | | | 3,328,377 | |
| | | |
WASHINGTON — 2.49% | | | | | | | | | | |
City of Seattle, 5.00% due 2/1/2019 (Light and Power Improvements) | | AA/Aa2 | | | 3,000,000 | | | | 3,506,220 | |
Skagit County Public Hospital District No. 1 GO, 5.125% due 12/1/2015 (Skagit Valley Hospital; Insured: Natl-Re) | | NR/A1 | | | 1,900,000 | | | | 2,039,821 | |
Skagit County Public Hospital District No. 1 GO, 5.00% due 12/1/2025 (Skagit Regional Health) | | NR/A1 | | | 4,860,000 | | | | 5,416,713 | |
Skagit County Public Hospital District No. 1 GO, 5.00% due 12/1/2028 (Skagit Regional Health) | | NR/A1 | | | 3,000,000 | | | | 3,252,030 | |
Skagit County Public Hospital District No. 2 GO, 5.00% due 12/1/2027 (Island Hospital) | | NR/A1 | | | 2,445,000 | | | | 2,661,847 | |
Skagit County Public Hospital District No. 2 GO, 5.00% due 12/1/2028 (Island Hospital) | | NR/A1 | | | 2,195,000 | | | | 2,372,685 | |
State of Washington COP, 5.00% due 7/1/2014 (Higher Education Capital Projects) | | NR/Aa2 | | | 1,905,000 | | | | 1,928,222 | |
Washington Health Care Facilities Authority, 5.25% due 8/15/2024 (Multi-care Systems; Insured: AGM) | | AA/Aa3 | | | 1,000,000 | | | | 1,090,560 | |
Washington Health Care Facilities Authority, 6.25% due 8/1/2028 pre-refunded 8/1/2018 (Highline Medical Centers; Insured: FHA 242) | | NR/NR | | | 3,985,000 | | | | 4,818,702 | |
| | | |
WEST VIRGINIA — 0.25% | | | | | | | | | | |
State of West Virginia GO, 5.00% due 6/1/2022 (Division of Highways State Road Fund; Insured: Natl-Re) | | AA/Aa1 | | | 1,000,000 | | | | 1,053,950 | |
West Virginia Hospital Finance Authority, 5.00% due 6/1/2020 (United Hospital Center; Insured: AMBAC) | | A/A2 | | | 1,530,000 | | | | 1,615,726 | |
| | | |
WISCONSIN — 1.83% | | | | | | | | | | |
Wisconsin Health & Educational Facilities Authority, 5.00% due 7/1/2021 (Agnesian Healthcare, Inc.) | | A-/A3 | | | 2,170,000 | | | | 2,413,648 | |
Wisconsin Health & Educational Facilities Authority, 5.00% due 8/15/2023 (ProHealth Care, Inc.) | | A+/A1 | | | 1,980,000 | | | | 2,204,789 | |
Wisconsin Health & Educational Facilities Authority, 5.00% due 8/15/2024 (ProHealth Care, Inc.) | | A+/A1 | | | 2,460,000 | | | | 2,716,799 | |
Wisconsin Health & Educational Facilities Authority, 5.50% due 7/1/2025 (Agnesian Healthcare, Inc.) | | A-/A3 | | | 5,000,000 | | | | 5,497,800 | |
Wisconsin Health & Educational Facilities Authority, 5.00% due 8/15/2025 (ProHealth Care, Inc.) | | A+/A1 | | | 3,180,000 | | | | 3,484,771 | |
Wisconsin Health & Educational Facilities Authority, 5.00% due 8/15/2026 (ProHealth Care, Inc.) | | A+/A1 | | | 3,305,000 | | | | 3,600,203 | |
| | | | | | | | | | |
| | | |
TOTAL INVESTMENTS — 95.24% (Cost $991,444,830) | | | | | | | | $ | 1,034,642,905 | |
| | | |
OTHER ASSETS LESS LIABILITIES — 4.76% | | | | | | | | | 51,684,912 | |
| | | | | | | | | | |
| | | |
NET ASSETS — 100.00% | | | | | | | | $ | 1,086,327,817 | |
| | | | | | | | | | |
Certified Semi-Annual Report 21
| | |
| Schedule of Investments, continued | | |
| |
Thornburg Intermediate Municipal Fund | | March 31, 2014 (Unaudited) |
Footnote Legend
| † | Credit ratings are unaudited. Rating changes may have occurred subsequent to the reporting period end. Bonds issued with a maturity of one year or less are assigned Moody’s ratings from MIG-1 to MIG-4 and Standard and Poor’s ratings from SP-1+ to SP-3 with MIG-1 and SP-1+ being the strongest ratings. |
Portfolio Abbreviations
To simplify the listings of securities, abbreviations are used per the table below:
| | |
| ACA | | Insured by American Capital Access |
| AGM | | Insured by Assured Guaranty Municipal Corp. |
| AMBAC | | Insured by American Municipal Bond Assurance Corp. |
| AMT | | Alternative Minimum Tax |
| BAM | | Insured by Build America Mutual Insurance Co. |
| BHAC | | Insured by Berkshire Hathaway Assurance Corp. |
| CIFG | | Insured by CIFG Assurance North America Inc. |
| COP | | Certificates of Participation |
| EDA | | Economic Development Authority |
| ETM | | Escrowed to Maturity |
| FGIC | | Insured by Financial Guaranty Insurance Co. |
| FHA | | Insured by Federal Housing Administration |
| GNMA | | Collateralized by Government National Mortgage Association |
| GO | | General Obligation |
| GRT | | Gross Receipts Tax |
| | |
| HFA | | Health Facilities Authority |
| HFFA | | Health Facilities Financing Authority |
| IBC | | Insured Bond Certificate |
| IDA | | Industrial Development Authority/Agency |
| ISD | | Independent School District |
| LOC | | Letter of Credit |
| Mtg | | Mortgage |
| Natl-Re | | Insured by National Public Finance Guarantee Corp. |
| PCR | | Pollution Control Revenue Bond |
| PSF | | Guaranteed by Permanent School Fund |
| Q-SBLF | | Insured by Qualified School Bond Loan Fund |
| Radian | | Insured by Radian Asset Assurance |
| SONYMA | | State of New York Mortgage Authority |
| SPA | | Stand-by Purchase Agreement |
| Syncora | | Insured by Syncora Guarantee Inc. |
| USD | | Unified School District |
See notes to financial statements.
22 Certified Semi-Annual Report
| | |
| Statement of Assets and Liabilities | | |
| |
Thornburg Intermediate Municipal Fund | | March 31, 2014, (Unaudited) |
| | | | |
ASSETS | | | | |
Investments at value (cost $991,444,830) (Note 2) | | $ | 1,034,642,905 | |
Cash | | | 39,480,767 | |
Receivable for investments sold | | | 51,244 | |
Receivable for fund shares sold | | | 2,552,129 | |
Interest receivable | | | 13,024,549 | |
Prepaid expenses and other assets | | | 48,427 | |
| | | | |
Total Assets | | | 1,089,800,021 | |
| | | | |
| |
LIABILITIES | | | | |
Payable for fund shares redeemed | | | 2,421,602 | |
Payable to investment advisor and other affiliates (Note 3) | | | 672,823 | |
Accounts payable and accrued expenses | | | 90,492 | |
Dividends payable | | | 287,287 | |
| | | | |
Total Liabilities | | | 3,472,204 | |
| | | | |
| |
NET ASSETS | | $ | 1,086,327,817 | |
| | | | |
NET ASSETS CONSIST OF | | | | |
Distribution in excess of net investment income | | $ | (3,781 | ) |
Net unrealized appreciation on investments | | | 43,198,075 | |
Accumulated net realized gain (loss) | | | (915,904 | ) |
Net capital paid in on shares of beneficial interest | | | 1,044,049,427 | |
| | | | |
| | $ | 1,086,327,817 | |
| | | | |
| |
NET ASSET VALUE | | | | |
Class A Shares: | | | | |
Net asset value and redemption price per share ($419,682,714 applicable to 30,081,295 shares of beneficial interest outstanding - Note 4) | | $ | 13.95 | |
Maximum sales charge, 2.00% of offering price | | | 0.28 | |
| | | | |
Maximum offering price per share | | $ | 14.23 | |
| | | | |
| |
Class C Shares: | | | | |
Net asset value and offering price per share* ($151,190,634 applicable to 10,822,959 shares of beneficial interest outstanding - Note 4) | | $ | 13.97 | |
| | | | |
| |
Class I Shares: | | | | |
Net asset value, offering and redemption price per share ($515,454,469 applicable to 36,994,264 shares of beneficial interest outstanding - Note 4) | | $ | 13.93 | |
| * | Redemption price per share is equal to net asset value less any applicable contingent deferred sales charge. |
See notes to financial statements.
Certified Semi-Annual Report 23
| | |
| Statement of Operations | | |
| |
Thornburg Intermediate Municipal Fund | | Six Months Ended March 31, 2014, (Unaudited) |
| | | | |
INVESTMENT INCOME | | | | |
Interest income (net of premium amortized of $5,090,374) | | $ | 17,978,225 | |
| | | | |
| |
EXPENSES | | | | |
Investment advisory fees (Note 3) | | | 2,472,893 | |
Administration fees (Note 3) | | | | |
Class A Shares | | | 265,071 | |
Class C Shares | | | 95,599 | |
Class I Shares | | | 118,097 | |
Distribution and service fees (Note 3) | | | | |
Class A Shares | | | 530,141 | |
Class C Shares | | | 458,246 | |
Transfer agent fees | | | | |
Class A Shares | | | 69,850 | |
Class C Shares | | | 37,385 | |
Class I Shares | | | 71,710 | |
Registration and filing fees | | | | |
Class A Shares | | | 15,377 | |
Class C Shares | | | 11,231 | |
Class I Shares | | | 20,526 | |
Custodian fees (Note 3) | | | 78,680 | |
Professional fees | | | 22,973 | |
Accounting fees | | | 15,800 | |
Trustee fees | | | 18,200 | |
Other expenses | | | 39,060 | |
| | | | |
Total Expenses | | | 4,340,839 | |
Less: | | | | |
Expenses reimbursed by investment advisor (Note 3) | | | (39,324 | ) |
Fees paid indirectly (Note 3) | | | (9,275 | ) |
| | | | |
Net Expenses | | | 4,292,240 | |
| | | | |
Net Investment Income | | | 13,685,985 | |
| | | | |
REALIZED AND UNREALIZED GAIN (LOSS) | | | | |
Net realized gain (loss) on investments | | | (170,080 | ) |
Net change in unrealized appreciation (depreciation) of investments | | | 14,478,801 | |
| | | | |
Net Realized and Unrealized Gain | | | 14,308,721 | |
| | | | |
Net Increase in Net Assets Resulting from Operations | | $ | 27,994,706 | |
| | | | |
See notes to financial statements.
24 Certified Semi-Annual Report
| | |
| Statement of Changes in Net Assets | | |
| |
Thornburg Intermediate Municipal Fund | | |
| | | | | | | | |
| | | SIX MONTHS ENDED
MARCH 31, 2014* | | | YEAR ENDED
SEPTEMBER 30, 2013 | |
INCREASE (DECREASE) IN NET ASSETS FROM | | | | | | | | |
| | |
OPERATIONS | | | | | | | | |
Net investment income | | $ | 13,685,985 | | | $ | 25,499,159 | |
Net realized gain (loss) on investments | | | (170,080 | ) | | | 1,075,284 | |
Net unrealized appreciation (depreciation) on investments | | | 14,478,801 | | | | (36,445,474 | ) |
| | | | | | | | |
Net Increase (Decrease) in Net Assets Resulting from Operations | | | 27,994,706 | | | | (9,871,031 | ) |
| | |
DIVIDENDS TO SHAREHOLDERS | | | | | | | | |
From net investment income | | | | | | | | |
Class A Shares | | | (5,315,282 | ) | | | (10,928,600 | ) |
Class C Shares | | | (1,670,662 | ) | | | (3,566,005 | ) |
Class I Shares | | | (6,700,041 | ) | | | (11,004,554 | ) |
| | |
FUND SHARE TRANSACTIONS (NOTE 4) | | | | | | | | |
Class A Shares | | | (15,982,408 | ) | | | (11,257,015 | ) |
Class C Shares | | | (10,590,305 | ) | | | (4,502,452 | ) |
Class I Shares | | | 59,422,369 | | | | 98,257,908 | |
| | | | | | | | |
Net Increase in Net Assets | | | 47,158,377 | | | | 47,128,251 | |
NET ASSETS | | | | | | | | |
Beginning of Period | | | 1,039,169,440 | | | | 992,041,189 | |
| | | | | | | | |
| | |
End of Period | | $ | 1,086,327,817 | | | $ | 1,039,169,440 | |
| | | | | | | | |
Distribution in excess of net investment income | | $ | (3,781 | ) | | $ | (3,781 | ) |
See notes to financial statements.
Certified Semi-Annual Report 25
| | |
| Notes to Financial Statements | | |
| |
Thornburg Intermediate Municipal Fund | | March 31, 2014 (Unaudited) |
NOTE 1 – ORGANIZATION
Thornburg Intermediate Municipal Fund (the “Fund”) is a diversified series of Thornburg Investment Trust (the “Trust”). The Trust is organized as a Massachusetts business trust under a Declaration of Trust dated June 3, 1987 and is registered as a diversified, open-end management investment company under the Investment Company Act of 1940, as amended. The Fund is currently one of eighteen separate series of the Trust. Each series is considered to be a separate entity for financial reporting and tax purposes and bears expenses directly attributable to it. The Fund’s primary investment objective is to obtain as high a level of current income exempt from federal individual income taxes as is consistent, in the view of the Fund’s investment advisor, with the preservation of capital. The Fund’s secondary objective is to reduce expected changes in its share price compared to long-term bond portfolios.
The Fund currently offers three classes of shares of beneficial interest: Class A, Class C, and Institutional Class (“Class I”). Each class of shares of the Fund represents an interest in the same portfolio of investments, except that (i) Class A shares are sold subject to a front-end sales charge collected at the time the shares are purchased and bear a service fee, (ii) Class C shares are sold at net asset value without a sales charge at the time of purchase, but are subject to a contingent deferred sales charge upon redemption within one year of purchase, and bear both a service fee and a distribution fee, (iii) Class I shares are sold at net asset value without a sales charge at the time of purchase and may be subject to a service fee, and (iv) the respective classes may have different reinvestment privileges and conversion rights. Additionally, the Fund may allocate among its classes certain expenses, to the extent allocable to specific classes, including transfer agent fees, government registration fees, certain printing and postage costs, and administrative and legal expenses. Currently, class specific expenses of the Fund are limited to service and distribution fees, administration fees, and certain registration and transfer agent expenses.
NOTE 2 – SIGNIFICANT ACCOUNTING POLICIES
Significant accounting policies of the Trust are as follows:
Valuation Policy and Procedures: The Fund’s Trustees of the Trust (the “Trustees”) have authorized employees of the Fund’s investment advisor, acting as the Valuation and Pricing Committee (the “Committee”), to make certain valuation determinations, subject to oversight and review by the Trustees and the Audit Committee of the Trustees. The Committee and other employees of the Fund’s investment advisor administer and implement the valuation process. The Committee regularly reviews its own fair value decisions, as well as valuations, valuation techniques and services furnished by pricing services, considers circumstances in the markets which may require valuation determinations by the Committee and reviews previous valuation determinations. The Committee also reports on its activities, the performance of the pricing services and other matters to the Trustees and the Audit Committee of the Trustees.
In determining a fair value for a portfolio investment, the Committee seeks to determine the price that the Fund would reasonably expect to receive upon a sale of the investment in an orderly transaction between market participants at the measurement date. Typically, the fair value process employs standing instructions to use quoted prices in active markets or the use of independent pricing services. Less frequently, the Committee may make a fair value determination using other methods. However, because fair value prices are estimated prices, the determination of fair value for an investment may differ from the value that would be realized by the Fund upon a sale of the investment, and that difference could be material to the Fund’s financial statements. The Committee’s determination of fair value for an investment may also differ from the prices obtained by other persons (including other mutual funds) for the investment.
Valuation of Investments: Debt obligations held by the Fund have a primary over-the-counter market and are valued by an independent pricing service approved by the Trustees. The pricing service ordinarily values debt obligations at quoted bid prices. When quotations are not available, debt obligations held by the Fund are valued at evaluated prices determined by the pricing service using methods which include consideration of yields or prices of debt obligations of comparable quality, type of issue, coupon, maturity and rating, and indications as to value from dealers and general market conditions. Short-term obligations having remaining maturities of 60 days or less are ordinarily valued at amortized cost, which approximates market value.
In any case when a pricing service fails to provide a price for a debt obligation held by the Fund, the Committee determines a fair value for the debt obligation using procedures in accordance with a policy approved by the Trustees, which may include the use of a price obtained from a different independent pricing service. Additionally, in any case when management believes that a price provided by a pricing service for a debt obligation held by the Fund may be unreliable, the Committee decides whether or not to use the pricing service’s valuation or to use an alternative method to determine a fair value for the debt obligation.
Valuation Measurements: The Fund categorizes its investments based upon the inputs used in valuing those investments, according to a three-level hierarchy established by guidance from the Financial Accounting Standards Board (the “FASB”). Categorization of investments using this hierarchy is intended by the FASB to maximize the use of observable inputs and minimize the use of unobservable inputs by prioritizing that the most observable input be used when available. Observable inputs are those that market participants would use in valuing an investment based on available market data. Unobservable inputs are those that reflect assumptions about the information market participants would use in valuing an investment. An investment’s level within the hierarchy is based on the lowest level input that is deemed significant to the fair value measurement. The methodologies and relative inputs used to value investments are not necessarily indications of the risk or liquidity associated with investing in those investments.
26 Certified Semi-Annual Report
| | |
| Notes to Financial Statements, Continued | | |
| |
Thornburg Intermediate Municipal Fund | | March 31, 2014 (Unaudited) |
Various inputs are used in determining the fair value measurement of the Fund’s investments. These inputs are generally summarized according to the three-level hierarchy below:
Level 1: Quoted prices in active markets for identical investments.
Level 2: Other direct or indirect significant observable inputs (including quoted prices for similar investments in active markets and other observable inputs, such as interest rates, prepayment rates, credit risk, etc.).
Level 3: Significant unobservable inputs, (including the Committee’s own assumptions in determining the fair value of investments), are generally applicable to investments fair valued with single broker quotes and other investments.
Portfolio investments with minimal, if any, market activity are characterized as Level 3 and are valued using significant unobservable inputs, typically including single broker quotes, which may be adjusted or unadjusted, related or comparable investments, last available transactions, and other relevant information. Valuations may also be based upon current market prices of securities that are comparable in coupon, rating, maturity and industry. An income based valuation approach would consider discounted anticipated future cash flows of the investment. Discounts may also be applied due to the nature or duration of any restrictions on the disposition of the investment. The derived value of a Level 3 investment may not represent the value which is received upon disposition.
The following table displays a summary of the fair value hierarchy measurements of the Fund’s investments as of March 31, 2014. In any instance when valuation inputs from more than one level are used to determine the fair value of a specific investment, the investment is placed in the level of the table based upon the lowest level input that is significant in determining the fair value of the investment:
| | | | | | | | | | | | | | | | |
| | | FAIR VALUE MEASUREMENTS AT MARCH 31, 2014 | |
| | | TOTAL | | | LEVEL 1 | | | LEVEL 2 | | | LEVEL 3 | |
Assets | | | | | | | | | | | | | | | | |
Investments in Securities | | | | | | | | | | | | | | | | |
Municipal Bonds | | $ | 1,034,642,905 | | | $ | — | | | $ | 1,034,642,905 | | | $ | — | |
| | | | | | | | | | | | | | | | |
Total Investments in Securities | | $ | 1,034,642,905 | | | $ | — | | | $ | 1,034,642,905 | | | $ | — | |
In accordance with the guidance prescribed in Accounting Standards Update No. 2011-04, it is the policy of the Fund to recognize transfers between levels and those underlying events which caused the movement. The Fund recognized no transfers between levels for the six months ended March 31, 2014.
Federal Income Taxes: It is the policy of the Trust to comply with the provisions of the Internal Revenue Code applicable to “regulated investment companies” and to distribute to shareholders substantially all taxable (if any) and tax exempt income of the Fund. Therefore, no provision for federal income tax is required.
Management reviews each uncertain tax position believed to be material to the preparation of the Fund’s financial statements, to assess if it is more likely than not that the position would be sustained upon examination, based upon the technical merits of the position. As of March 31, 2014, management has not identified any such position for which an asset or liability must be reflected in the Statement of Assets and Liabilities. The Fund’s tax returns remain subject to examination for three years after filing.
When-Issued and Delayed Delivery Transactions: The Fund may engage in when-issued or delayed delivery transactions. To the extent the Fund engages in such transactions, it will do so for the purpose of acquiring portfolio investments consistent with the Fund’s investment objectives and not for the purpose of investment leverage or to speculate on interest rate and/or market changes. At the time the Fund makes a commitment to purchase an investment on a when-issued or delayed delivery basis, the Fund will record the transaction and reflect the value in determining its net asset value. When effecting such transactions, assets of an amount sufficient to make payment for the portfolio investments to be purchased will be segregated on the Fund’s records on the trade date. Investments purchased on a when-issued or delayed delivery basis do not earn interest until the settlement date.
Dividends: Net investment income of the Fund is declared daily as a dividend on shares for which the Fund has received payment. Dividends are paid monthly and are reinvested in additional shares of the Fund at net asset value per share at the close of business on the dividend payment date, or at the shareholder’s option, paid in cash. Net realized capital gains, to the extent available, will be distributed at least annually.
General: Investment transactions are accounted for on a trade date basis. Interest income is accrued as earned. Premiums and discounts on investments purchased are amortized to call dates or maturity dates of the respective investments. Realized gains and losses from the sale of investments are recorded on an identified cost basis. Net investment income (other than class specific expenses) and realized and unrealized gains and losses are allocated daily to each class of shares based upon the relative net asset value of outstanding shares (or the value of the dividend-eligible shares, as appropriate) of each class of shares at the beginning of the day (after adjusting for the current capital shares activity of the respective class). Expenses common to all Funds are allocated among the Funds comprising the Trust based upon their relative net asset values or other appropriate allocation methods.
Certified Semi-Annual Report 27
| | |
| Notes to Financial Statements, Continued | | |
| |
Thornburg Intermediate Municipal Fund | | March 31, 2014 (Unaudited) |
Guarantees and Indemnifications: Under the Trust’s organizational documents (and under separate agreements with the independent Trustees), its officers and Trustees are indemnified against certain liabilities arising out of the performance of their duties to the Fund. Additionally, in the normal course of business the Trust enters into contracts with service providers that contain general indemnification clauses. The Trust’s maximum exposure under these arrangements is unknown. However, based on experience, the Trust expects the risk of loss to be remote.
Use of Estimates: The preparation of financial statements, in conformity with United States generally accepted accounting principles, requires management to make estimates and assumptions that affect the reported amounts of assets and liabilities and the disclosure of contingent assets and liabilities at the date of the financial statements and the reported amounts of increases and decreases in net assets from operations during the reporting period. Actual amounts could differ from those estimates.
NOTE 3 – INVESTMENT ADVISORY FEE AND OTHER TRANSACTIONS WITH AFFILIATES
Pursuant to an investment advisory agreement, Thornburg Investment Management, Inc. (the “Advisor”) serves as the investment advisor and performs services for the Fund for which the fees are payable at the end of each month. For the six months ended March 31, 2014, these fees were payable at annual rates ranging from .50 of 1% to .275 of 1% per annum of the average daily net assets of the Fund depending on the Fund’s asset size. The Trust also has entered into administrative services agreements with the Advisor, whereby the Advisor will perform certain administrative services for the shareholders of each class of the Fund’s shares, and for which fees will be payable at an annual rate of up to .125 of 1% per annum of the average daily net assets attributable to each class of shares.The Trust has an underwriting agreement with Thornburg Securities Corporation (the “Distributor,” an affiliate of the Advisor), which acts as the distributor of the Fund’s shares. For the six months ended March 31, 2014, the Distributor has advised the Fund that it refunded net commissions aggregating $4,798 from the sale of Class A shares, and collected contingent deferred sales charges aggregating $6,229 from redemptions of Class C shares of the Fund.
Pursuant to a service plan under Rule 12b-1 of the Investment Company Act of 1940, the Fund may reimburse to the Advisor an amount not to exceed .25 of 1% per annum of the average daily net assets attributable to each class of shares of the Fund for payments made by the Advisor to securities dealers and other financial institutions to obtain various shareholder and distribution related services. For the six months ended March 31, 2014, there were no 12b-1 service plan fees charged for Class I shares. The Advisor may pay out of its own resources additional expenses for distribution of the Fund’s shares.
The Trust has also adopted a distribution plan pursuant to Rule 12b-1, applicable only to the Fund’s Class C shares, under which the Fund compensates the Distributor for services in promoting the sale of Class C shares of the Fund at an annual rate of up to .35 of 1% per annum of the average daily net assets attributable to Class C shares. Total fees incurred by each class of shares of the Fund under their respective service and distribution plans for the six months ended March 31, 2014, are set forth in the Statement of Operations.
The Advisor and Distributor have contractually agreed to waive fees and reimburse expenses incurred by the Fund so that actual expenses of certain share classes do not exceed specified levels. The agreement may be terminated by the Fund at any time, but may not be terminated by the Advisor or Distributor before February 1, 2015, unless the Advisor ceases to be the investment advisor to the Fund or the Distributor ceases to be the distributor of the Fund prior to that date. The Advisor and Distributor retain the right to be repaid by the Fund for fee waivers and expense reimbursements if expenses fall below the contractual limit prior to the end of the fiscal year.
For the six months ended March 31, 2014, the Advisor contractually reimbursed certain class specific expenses and administrative fees of $39,324 for Class C shares.
The Trust has an agreement with the custodian bank to indirectly pay a portion of the custodian’s fees through credits earned by the Fund’s cash on deposit with the bank. This deposit agreement is an alternative to overnight investments. Custodial fees are adjusted to reflect amounts that would have been paid without this agreement, with a corresponding adjustment reflected as fees paid indirectly in the Statement of Operations. For the six months ended March 31, 2014, fees paid indirectly were $9,275.
Certain officers and Trustees of the Trust are also officers or directors of the Advisor and Distributor. The compensation of independent Trustees is borne by the Trust.
28 Certified Semi-Annual Report
| | |
| Notes to Financial Statements, Continued | | |
| |
Thornburg Intermediate Municipal Fund | | March 31, 2014 (Unaudited) |
NOTE 4 – SHARES OF BENEFICIAL INTEREST
At March 31, 2014, there were an unlimited number of shares of beneficial interest authorized. Transactions in shares of beneficial interest were as follows:
| | | | | | | | | | | | | | | | |
| | | SIX MONTHS ENDED | | | YEAR ENDED | |
| | | MARCH 31, 2014 (UNAUDITED) | | | SEPTEMBER 30, 2013 (AUDITED) | |
| | | SHARES | | | AMOUNT | | | SHARES | | | AMOUNT | |
Class A Shares | | | | | | | | | | | | | | | | |
Shares sold | | | 3,121,642 | | | $ | 43,081,372 | | | | 5,965,417 | | | $ | 84,404,539 | |
Shares issued to shareholders in reinvestment of dividends | | | 350,161 | | | | 4,853,511 | | | | 669,580 | | | | 9,424,691 | |
Shares repurchased | | | (4,628,427 | ) | | | (63,917,291 | ) | | | (7,502,932 | ) | | | (105,086,245 | ) |
| | | | | | | | | | | | | | | | |
| | | | |
Net increase (decrease) | | | (1,156,624 | ) | | $ | (15,982,408 | ) | | | (867,935 | ) | | $ | (11,257,015 | ) |
| | | | | | | | | | | | | | | | |
| | | | |
Class C Shares | | | | | | | | | | | | | | | | |
Shares sold | | | 787,220 | | | $ | 10,896,950 | | | | 2,531,450 | | | $ | 35,950,972 | |
Shares issued to shareholders in reinvestment of dividends | | | 102,158 | | | | 1,417,880 | | | | 207,139 | | | | 2,919,971 | |
Shares repurchased | | | (1,656,752 | ) | | | (22,905,135 | ) | | | (3,093,344 | ) | | | (43,373,395 | ) |
| | | | | | | | | | | | | | | | |
| | | | |
Net increase (decrease) | | | (767,374 | ) | | $ | (10,590,305 | ) | | | (354,755 | ) | | $ | (4,502,452 | ) |
| | | | | | | | | | | | | | | | |
| | | | |
Class I Shares | | | | | | | | | | | | | | | | |
Shares sold | | | 12,007,823 | | | $ | 165,791,410 | | | | 17,143,818 | | | $ | 240,924,202 | |
Shares issued to shareholders in reinvestment of dividends | | | 402,610 | | | | 5,573,701 | | | | 580,482 | | | | 8,138,676 | |
Shares repurchased | | | (8,117,797 | ) | | | (111,942,742 | ) | | | (10,756,211 | ) | | | (150,804,970 | ) |
| | | | | | | | | | | | | | | | |
| | | | |
Net increase (decrease) | | | 4,292,636 | | | $ | 59,422,369 | | | | 6,968,089 | | | $ | 98,257,908 | |
| | | | | | | | | | | | | | | | |
NOTE 5 – INVESTMENT TRANSACTIONS
For the six months ended March 31, 2014, the Fund had purchase and sale transactions of investments (excluding short-term investments) of $89,981,818 and $52,290,743, respectively.
NOTE 6 – INCOME TAXES
At March 31, 2014, information on the tax components of capital was as follows:
| | | | |
Cost of investments for tax purposes | | $ | 991,444,830 | |
| | | | |
Gross unrealized appreciation on a tax basis | | $ | 45,305,346 | |
Gross unrealized depreciation on a tax basis | | | (2,107,271 | ) |
| | | | |
Net unrealized appreciation (depreciation) on investments (tax basis) | | $ | 43,198,075 | |
| | | | |
At March 31, 2014, the Fund had cumulative tax basis capital losses of $745,825 generated prior to October 1, 2011, which may be carried forward to offset future capital gains. To the extent such carryforwards are used, capital gain distributions may be reduced to the extent provided by regulations. Such capital loss carryforwards expire in 2019.
Certified Semi-Annual Report 29
| | |
| Notes to Financial Statements, Continued | | |
| |
Thornburg Intermediate Municipal Fund | | March 31, 2014 (Unaudited) |
OTHER NOTES
Risks: The Fund’s investments subject it to risks including, but not limited to, credit risk, interest rate risk, management risk, market and economic risk, and liquidity risk. Please see the Fund’s prospectus for a discussion of the risks associated with an investment in the Fund.
Subsequent Events: Fund management believes no events have occurred between March 31, 2014 and the date of issuance of the financial statements that require adjustment to or disclosure in the accompanying financial statements.
30 Certified Semi-Annual Report
| | |
| Notes to Financial Statements, Continued | | |
| |
Thornburg Intermediate Municipal Fund | | March 31, 2014 (Unaudited) |
This page intentionally left blank.
Certified Semi-Annual Report 31
Financial Highlights
Thornburg Intermediate Municipal Fund
| | | | | | | | | | | | | | | | | | | | | | | | | | | | | | | | | | | | | | | | | | | | | | | | |
| | | PER SHARE PERFORMANCE (FOR A SHARE OUTSTANDING THROUGHOUT THE PERIOD)+ | | RATIOS TO AVERAGE NET ASSETS | | | SUPPLEMENTAL DATA | |
UNLESS
OTHERWISE
NOTED,
PERIODS
ARE
FISCAL
YEARS
ENDED
SEPT. 30, | | NET ASSET
VALUE
BEGINNING
OF PERIOD | | | NET
INVESTMENT
INCOME
(LOSS) | | NET
REALIZED
&
UNREALIZED
GAIN (LOSS)
ON
INVESTMENTS | | | TOTAL FROM
INVESTMENT
OPERATIONS | | DIVIDENDS
FROM NET
INVESTMENT
INCOME | | | DIVIDENDS
FROM NET
REALIZED
GAINS | | TOTAL
DIVIDENDS | | | NET
ASSET
VALUE
END
OF
PERIOD | | NET
INVESTMENT
INCOME
(LOSS)
(%) | | | EXPENSES,
AFTER
EXPENSE
REDUCTIONS
(%) | | | EXPENSES,
AFTER
EXPENSE
REDUCTIONS
AND
NET OF
CUSTODY
CREDITS
(%) | | | EXPENSES,
BEFORE
EXPENSE
REDUCTIONS
(%) | | | TOTAL
RETURN
(%)(a) | | PORTFOLIO
TURNOVER
RATE
(%)(a) | | NET
ASSETS
AT END
OF
PERIOD
(THOUSANDS) | |
CLASS A SHARES | | | | | | | | | | | | | | | | | | | | | | | | | | | | | | | | | | | | | | | | | | |
2014(b)(c) | | $ | 13.76 | | | 0.17 | | | 0.19 | | | 0.36 | | | (0.17 | ) | | — | | | (0.17 | ) | | $13.95 | | | 2.51 | (d) | | | 0.92 | (d) | | | 0.92 | (d) | | | 0.92 | (d) | | 2.65 | | 5.26 | | $ | 419,683 | |
2013(b) | | $ | 14.22 | | | 0.33 | | | (0.46 | ) | | (0.13) | | | (0.33 | ) | | — | | | (0.33 | ) | | $13.76 | | | 2.37 | | | | 0.92 | | | | 0.92 | | | | 0.92 | | | (0.91) | | 29.18 | | $ | 429,941 | |
2012(b) | | $ | 13.59 | | | 0.40 | | | 0.63 | | | 1.03 | | | (0.40 | ) | | — | | | (0.40 | ) | | $14.22 | | | 2.88 | | | | 0.93 | | | | 0.93 | | | | 0.93 | | | 7.69 | | 16.94 | | $ | 456,527 | |
2011(b) | | $ | 13.64 | | | 0.48 | | | (0.05 | ) | | 0.43 | | | (0.48 | ) | | — | | | (0.48 | ) | | $13.59 | | | 3.59 | | | | 0.95 | | | | 0.95 | | | | 0.95 | | | 3.27 | | 18.33 | | $ | 381,839 | |
2010(b) | | $ | 13.40 | | | 0.49 | | | 0.24 | | | 0.73 | | | (0.49 | ) | | — | | | (0.49 | ) | | $13.64 | | | 3.68 | | | | 0.97 | | | | 0.97 | | | | 0.97 | | | 5.61 | | 9.87 | | $ | 409,844 | |
2009(b) | | $ | 12.47 | | | 0.54 | | | 0.93 | | | 1.47 | | | (0.54 | ) | | — | | | (0.54 | ) | | $13.40 | | | 4.26 | | | | 0.98 | | | | 0.98 | | | | 0.98 | | | 12.12 | | 15.15 | | $ | 337,037 | |
CLASS C SHARES | | | | | | | | | | | | | | | | | | | | | | | | | | | | | | | | | | | | | | | | | | |
2014(c) | | $ | 13.78 | | | 0.15 | | | 0.19 | | | 0.34 | | | (0.15 | ) | | — | | | (0.15 | ) | | $13.97 | | | 2.18 | (d) | | | 1.24 | (d) | | | 1.24 | (d) | | | 1.29 | (d) | | 2.49 | | 5.26 | | $ | 151,191 | |
2013 | | $ | 14.24 | | | 0.29 | | | (0.46 | ) | | (0.17) | | | (0.29 | ) | | — | | | (0.29 | ) | | $13.78 | | | 2.05 | | | | 1.24 | | | | 1.24 | | | | 1.30 | | | (1.22) | | 29.18 | | $ | 159,727 | |
2012 | | $ | 13.61 | | | 0.36 | | | 0.63 | | | 0.99 | | | (0.36 | ) | | — | | | (0.36 | ) | | $14.24 | | | 2.56 | | | | 1.24 | | | | 1.24 | | | | 1.31 | | | 7.36 | | 16.94 | | $ | 170,071 | |
2011 | | $ | 13.65 | | | 0.44 | | | (0.04 | ) | | 0.40 | | | (0.44 | ) | | — | | | (0.44 | ) | | $13.61 | | | 3.29 | | | | 1.24 | | | | 1.24 | | | | 1.32 | | | 3.05 | | 18.33 | | $ | 125,512 | |
2010 | | $ | 13.42 | | | 0.45 | | | 0.24 | | | 0.69 | | | (0.46 | ) | | — | | | (0.46 | ) | | $13.65 | | | 3.39 | | | | 1.24 | | | | 1.24 | | | | 1.73 | | | 5.25 | | 9.87 | | $ | 128,449 | |
2009 | | $ | 12.48 | | | 0.50 | | | 0.94 | | | 1.44 | | | (0.50 | ) | | — | | | (0.50 | ) | | $13.42 | | | 3.99 | | | | 1.24 | | | | 1.24 | | | | 1.76 | | | 11.90 | | 15.15 | | $ | 80,571 | |
CLASS I SHARES | | | | | | | | | | | | | | | | | | | | | | | | | | | | | | | | | | | | | | | | | | |
2014(c) | | $ | 13.75 | | | 0.19 | | | 0.19 | | | 0.38 | | | (0.20 | ) | | — | | | (0.20 | ) | | $13.93 | | | 2.84 | (d) | | | 0.59 | (d) | | | 0.59 | (d) | | | 0.59 | (d) | | 2.75 | | 5.26 | | $ | 515,454 | |
2013 | | $ | 14.20 | | | 0.38 | | | (0.45 | ) | | (0.07) | | | (0.38 | ) | | — | | | (0.38 | ) | | $13.75 | | | 2.68 | | | | 0.61 | | | | 0.61 | | | | 0.61 | | | (0.53) | | 29.18 | | $ | 449,501 | |
2012 | | $ | 13.58 | | | 0.44 | | | 0.63 | | | 1.07 | | | (0.45 | ) | | — | | | (0.45 | ) | | $14.20 | | | 3.18 | | | | 0.61 | | | | 0.61 | | | | 0.61 | | | 7.96 | | 16.94 | | $ | 365,443 | |
2011 | | $ | 13.62 | | | 0.52 | | | (0.04 | ) | | 0.48 | | | (0.52 | ) | | — | | | (0.52 | ) | | $13.58 | | | 3.90 | | | | 0.63 | | | | 0.63 | | | | 0.63 | | | 3.67 | | 18.33 | | $ | 232,422 | |
2010 | | $ | 13.39 | | | 0.53 | | | 0.23 | | | 0.76 | | | (0.53 | ) | | — | | | (0.53 | ) | | $13.62 | | | 3.99 | | | | 0.65 | | | | 0.65 | | | | 0.65 | | | 5.87 | | 9.87 | | $ | 202,859 | |
2009 | | $ | 12.45 | | | 0.57 | | | 0.94 | | | 1.51 | | | (0.57 | ) | | — | | | (0.57 | ) | | $13.39 | | | 4.59 | | | | 0.66 | | | | 0.66 | | | | 0.68 | | | 12.56 | | 15.15 | | $ | 125,709 | |
| (a) | Not annualized for periods less than one year. |
| (b) | Sales loads are not reflected in computing total return. |
| (c) | Unaudited Six Month Period Ended March 31. |
| + | Based on weighted average shares outstanding, except for Dividends from Net Investment Income and Net Realized Gains, which are actual amounts per share. |
See notes to financial statements.
| | | | |
| 32 Certified Semi-Annual Report | | | | Certified Semi-Annual Report 33 |
| | |
| Expense Example | | |
| |
Thornburg Intermediate Municipal Fund | | March 31, 2014 (Unaudited) |
As a shareholder of the Fund, you incur two types of costs:
| | (1) | transaction costs, including |
(a) sales charges (loads) on purchase payments, for Class A shares;
(b) a deferred sales charge on redemptions of any part or all of a purchase of $1 million of Class A shares within 12 months of purchase;
(c) a deferred sales charge on redemptions of Class C shares within 12 months of purchase;
| | (2) | ongoing costs, including management fees; distribution and/or service (12b-1) fees; and other Fund expenses. |
This example is intended to help you understand your ongoing costs (in dollars) of investing in the Fund and to compare these costs with the ongoing costs of investing in other mutual funds.
The example is based on a $1,000 investment beginning on October 1, 2013, and held until March 31, 2014.
| | | | | | | | | | | | |
| | | BEGINNING
ACCOUNT VALUE
10/1/13 | | | ENDING
ACCOUNT VALUE
3/31/14 | | | EXPENSES PAID
DURING PERIOD†
10/1/13–3/31/14 | |
Class A Shares | | | | | | | | | | | | |
Actual | | $ | 1,000.00 | | | $ | 1,026.50 | | | $ | 4.64 | |
Hypothetical* | | $ | 1,000.00 | | | $ | 1,020.35 | | | $ | 4.62 | |
Class C Shares | | | | | | | | | | | | |
Actual | | $ | 1,000.00 | | | $ | 1,027.50 | | | $ | 6.26 | |
Hypothetical* | | $ | 1,000.00 | | | $ | 1,018.75 | | | $ | 6.24 | |
Class I Shares | | | | | | | | | | | | |
Actual | | $ | 1,000.00 | | | $ | 1,024.90 | | | $ | 2.99 | |
Hypothetical* | | $ | 1,000.00 | | | $ | 1,021.98 | | | $ | 2.98 | |
| † | Expenses are equal to the annualized expense ratio for each class (A: 0.92%; C: 1.24%; I: 0.59%) multiplied by the average account value over the period, multiplied by 182/365 to reflect the one-half year period. |
| * | Hypothetical assumes a rate of return of 5% per year before expenses. |
Actual Expenses
For each class of shares, the first line of the accompanying table provides information about actual account values and actual expenses. You may use the information in this line, together with the amount you invested, to estimate the expenses that you paid over the period. Simply divide your account value by $1,000 (for example, an $8,600 account value divided by $1,000 = 8.6), then multiply the result by the number in the first line for your class of shares under the heading entitled “Expenses Paid During Period” to estimate the expenses you paid on your account during this period.
Hypothetical Example for Comparison Purposes
For each class of shares, the second line of the accompanying table provides information about hypothetical account values and hypothetical expenses based on the Fund’s actual expense ratio and an assumed rate of return of 5% per year before expenses, which is not the Fund’s actual return. The hypothetical account values and expenses may not be used to estimate the actual ending account balance or expenses you paid for the period. You may use this information to compare the ongoing costs of investing in the Fund and other funds. To do so, compare this 5% hypothetical example with the 5% hypothetical examples that appear in the shareholder reports of the other funds.
Please note that the expenses shown in the table are meant to highlight your ongoing costs only and do not reflect any transactional costs, such as sales charges (loads), redemption fees, or exchange fees. Therefore, the second line of the table for each class of shares is useful in comparing ongoing costs only, and will not help you determine the relative total costs of owning different funds. In addition, if these transactional costs were included, your costs would have been higher.
34 Certified Semi-Annual Report
| | |
| Other Information | | |
| |
Thornburg Intermediate Municipal Fund | | March 31, 2014 (Unaudited) |
Portfolio Proxy Voting
Policies and Procedures:
The Trust has delegated to Thornburg Investment Management, Inc. (the “Advisor”) voting decisions respecting proxies for the Fund’s voting securities. The Advisor makes voting decisions in accordance with its Proxy Voting Policy. A description of the Policy is available (i) without charge, upon request, by calling the Advisor toll-free at 1-800-847-0200, (ii) on the Thornburg website at www.thornburg. com, and (iii) on the Securities and Exchange Commission’s website at www.sec.gov.
Information regarding how proxies were voted is available on or before August 31 of each year for the twelve months ending the preceding June 30. This information is available (i) without charge, upon request by calling the Advisor toll-free at 1-800-847-0200, (ii) on the Thornburg website at www.thornburg.com, and (iii) on the Securities and Exchange Commission’s website at www.sec.gov.
Availability of Quarterly Portfolio Schedule
The Fund files with the Securities and Exchange Commission schedules of its portfolio holdings on Form N-Q for the first and third quarters of each fiscal year. The Fund’s Forms N-Q are available on the Commission’s website at www.sec.gov, or may be reviewed and copied at the Commission’s Public Reference Room in Washington, D.C. Information on the operation of the Public Reference Room may be obtained by calling 1-800-SEC-0330. The Fund also makes this information available on its website at www.thornburg. com/download or upon request by calling 1-800-847-0200.
Certified Semi-Annual Report 35
Trustees’ Statement to Shareholders
Not part of the Certified Semi-Annual Report
Reissued September 15, 2013
The Trustees believe current and prospective shareholders should know how we discharge our responsibilities in supervising the Funds’ investment advisor and in reviewing the advisor’s contract for renewal. Since 2005, we have issued a statement which sets out clearly the three principal guidelines that we follow in supervising the Trust’s investment advisor on your behalf. In accordance with our customary practice, in September of this year we again reviewed our statement and concluded we should reissue this statement outlining the principal features of our supervision of the advisor’s performance of investment management services for the Funds.
We begin with the premise that each shareholder selected his or her Fund because its investments are managed by the investment advisor identified in the prospectus and in accordance with the objective and policies described in the prospectus. We realize, as each of you do, that if you believe that your Fund’s stated objective and policies no longer serve your personal investment goals, you can sell your shares and leave the Fund.
Therefore, we believe that our primary supervisory task – our principal obligation to you – is to assess the nature and quality of the advisor’s services, and to confirm that the advisor actively and competently pursues the Fund’s objective, in accordance with the policies set out in the prospectus. To do this, we meet regularly with management to review your Fund’s portfolio and to discuss the advisor’s specific actions and judgments in pursuing the Fund’s objective. We do not substitute our own judgment for the advisor’s decisions in selecting investments; the advisor is paid to exercise its informed judgment on investment decisions, and we seek to confirm, in reviewing the advisor’s performance, that the advisor is doing just that.
Second, while we are conscious of costs and the effect that costs have on shareholders’ returns, we do not seek the lowest fees or expense ratio as our sole or primary objective. We try to make sure that your Fund’s fees and costs are reasonable in relationship to the services rendered and that they are generally in line with those charged by other expert investment advisors, consistent with our belief that the Fund’s investors searched for and expect that expertise and attention and have decided to pay a reasonable price for it. We do not put the management contract “out to bid” as a matter of course, and we would not do so unless we had concluded that the advisor materially had failed to pursue the Fund’s objectives in accordance with its policies, or for other equally important reasons. We believe that any other approach would be inconsistent with your interests and contrary to your expectations when you bought shares of the Fund in the first place.
Finally, because we believe that most Thornburg Fund shareholders have invested with a long-term perspective, we try not to focus too much on the fashions of the moment and on short-term performance. The market will not favor any specific investment objective or set of policies at all times and under all economic circumstances. A fund will experience periods of both high and low returns relative to other funds and other investments. Even if one of our Funds is not favored by the market at a particular time, we believe that the advisor is nonetheless obliged to remain true to the Fund’s objective and policies, and we watch to see that it does so.
36 This page is not part of the Semi-Annual Report
Retirement and Education Accounts
Thornburg Investment Management offers retirement and education savings accounts that can help you meet a variety of planning challenges. For account applications or further information on any of the accounts below, please call 1-800-847-0200 or go to www.thornburg.com/ira. Your financial advisor can help you determine which plan is right for you.
Individual Retirement Accounts
Individual Retirement Accounts (IRAs) provide a tax-advantaged means to save money for the future. For a detailed outline of the difference between retirement accounts, see www.thornburg.com/ira. Rollovers are available. Call 1-800-847-0200 for more information.
Traditional IRAs – Contributions to Traditional IRAs are tax deductible for eligible individuals, and withdrawals are taxed as additional ordinary income. You may contribute to an IRA if you receive compensation and are under 70 1⁄2, even if you are covered by an employer retirement plan. Deductible contributions are subject to certain qualifications. Please consult your tax advisor.
Roth IRAs – Under a Roth IRA, there is no tax deduction for contributions, but there is no income tax on qualified withdrawals. For a more detailed comparison of Traditional and Roth IRAs, please see our website at www.thornburg. com/ira.
SEP IRAs – Simplified Employee Pension (SEP) IRAs are established by employers. The employer is allowed a tax deduction for contributions made to the SEP Plan and makes contributions to each eligible employee’s SEP IRA on a discretionary basis.
SIMPLE IRAs – Savings Incentive Match Plan for Employees of Small Employers (SIMPLE) is designed to give small business owners a simplified method to establish and contribute to a retirement plan for employees. The employer is allowed a tax deduction for contributions and makes either matching or non-elective contributions to each eligible employee’s SIMPLE IRA. Employees may make salary deferral contributions.
Coverdell Education Savings Account
These savings accounts are designed to provide a way to save money for higher education expenses. In an Education Savings Account, earnings and interest grow tax-free, and qualified withdrawals used to pay for eligible higher-education expenses are tax- and penalty-free.
Funds Available
The following funds are available in the accounts listed above:
| | • | | Thornburg Core Growth Fund |
| | • | | Thornburg International Value Fund |
| | • | | Thornburg International Growth Fund |
| | • | | Thornburg Developing World Fund |
| | • | | Thornburg Investment Income Builder Fund |
| | • | | Thornburg Global Opportunities Fund |
| | • | | Thornburg Low Duration Income Fund |
| | • | | Thornburg Limited Term U.S. Government Fund |
| | • | | Thornburg Limited Term Income Fund |
| | • | | Thornburg Strategic Income Fund |
This page is not part of the Semi-Annual Report 37
Firm & Philosophy

The Firm
Founded in 1982 and headquartered in Santa Fe, New Mexico, Thornburg Investment Management advises a range of active investment strategies, each offered through multiple vehicles, to serve a broad spectrum of client needs worldwide. From short-term fixed income to flexible global equity, our objective is to help clients reach their long-term financial goals via active portfolio management. As of March 31, 2014, Thornburg managed approximately $90 billion in assets.
Investment Philosophy
We seek to preserve and increase the real wealth of shareholders after accounting for inflation, taxes, and investment expenses. We’re committed to disciplined investing and managing risk in all market environments.
Portfolio Holdings Commentary
At Thornburg, we believe you should know what you own. Our website keeps investors informed of the Funds’ equity holdings. Go to www.thornburg.com/funds for equity funds holdings and commentary.
Co-Ownership of Funds
We invest side-by-side with shareholders. Our employees have invested $387 million in Thornburg products as of March 31, 2014.
38 This page is not part of the Semi-Annual Report
Thornburg Fund Family
Thornburg Equity Funds
Thornburg’s equity research uses a fundamentally driven, bottom-up, comprehensive analytical approach. Thornburg equity funds generally focus on a limited number of securities so that each holding can impact performance. The team searches for firms believed to have a promising future and seeks to buy shares of those companies at a discount to their intrinsic or long-term value.
| | • | | Thornburg Core Growth Fund |
| | • | | Thornburg International Value Fund |
| | • | | Thornburg International Growth Fund |
| | • | | Thornburg Developing World Fund |
| | • | | Thornburg Investment Income Builder Fund |
| | • | | Thornburg Global Opportunities Fund |
Thornburg Bond Funds
Thornburg Investment Management applies a disciplined philosophy to fixed-income management. Since the launch of our first fixed-income fund over 25 years ago, we have been conducting fundamental, bottom-up research in an effort to identify bonds which we believe provide the best return for a given level of risk. We avoid leverage or complex strategies which could backfire in periods of market uncertainty.
| | • | | Thornburg Low Duration Income Fund |
| | • | | Thornburg Limited Term U.S. Government Fund |
| | • | | Thornburg Limited Term Income Fund |
| | • | | Thornburg Strategic Income Fund |
| | • | | Thornburg Low Duration Municipal Fund |
| | • | | Thornburg Limited Term Municipal Fund |
| | • | | Thornburg Intermediate Municipal Fund |
| | • | | Thornburg California Limited Term Municipal Fund |
| | • | | Thornburg New Mexico Intermediate Municipal Fund |
| | • | | Thornburg New York Intermediate Municipal Fund |
| | • | | Thornburg Strategic Municipal Income Fund |
Before investing, carefully consider the Fund’s investment goals, risks, charges, and expenses. For a prospectus or summary prospectus containing this and other information, contact your financial advisor or visit thornburg.com. Read it carefully before investing.
For additional information, please visit thornburg.com
Thornburg Investment Management, Inc. 2300 North Ridgetop Road, Santa Fe, NM 87506
This page is not part of the Semi-Annual Report 39
| | |
 | | Waste not, Wait not |

This Semi-Annual Report is submitted for the general information of shareholders of the Fund. It is not authorized for distribution to prospective investors in the Fund unless preceded or accompanied by an effective prospectus.
| | | | |
Investment Advisor: Thornburg Investment Management® 800.847.0200 | | Distributor: Thornburg Securities Corporation® 800.847.0200 | | TH172 |

2 This page is not part of the Semi-Annual Report
Important Information
The information presented on the following pages is current as of March 31, 2014. The managers’ views, portfolio holdings, and sector diversification are provided for the general information of the Fund’s shareholders; to the extent this information is historical, it should not be considered predictive of future circumstances. This material should not be deemed a recommendation to buy or sell any of the securities mentioned.
Investments in the Fund carry risks, including possible loss of principal. Bond funds have the same interest rate, inflation, and credit risks that are associated with the underlying bonds. The principal value of bonds will fluctuate relative to changes in interest rates, decreasing when interest rates rise. This effect is more pronounced for longer-term bonds. Unlike bonds, bond funds have ongoing fees and expenses. Investments in lower-rated and unrated bonds may be more sensitive to default, downgrades, and market volatility; these investments may also be less liquid than higher-rated bonds. Investments in derivatives are subject to counterparty risk and the risks associated with the securities or other assets underlying the pool of securities, including illiquidity and difficulty in valuation. Please see the Fund’s Prospectus for a discussion of the risks associated with an investment in the Fund. Investments in the Fund are not FDIC insured, nor are they deposits of or guaranteed by a bank or any other entity. There is no guarantee that the Fund will meet its investment objectives. Diversification does not assure or guarantee better performance and cannot eliminate the risk of investment losses. Performance data given at net asset value (NAV) does not take into account applicable sales charges. If the sales charges had been included, the performance would have been lower.
Minimum investments for Class I shares are higher than those for other classes. Class I shares may not be available to all investors.
| | | | |
SHARE CLASS | | NASDAQ SYMBOL | | CUSIP |
Class A | | TSSAX | | 885-216-101 |
Class C | | TSSCX | | 885-216-200 |
Class I | | TSSIX | | 885-216-309 |
Glossary
Bloomberg Economic Evaluation of States (BEES) Index – A survey, updated quarterly, that examines the pace of states’ growth following the 18-month recession that officially ended in June 2009.
Bloomberg State Stock Indices – Capitalization-weighted indices consisting of equities domiciled in each state.
BofA Merrill Lynch Municipal Master Index – This index tracks the performance of the investment-grade U.S. tax-exempt bond market. Qualifying bonds must have at least one year remaining term to maturity, a fixed coupon schedule, and an investment grade rating (based on an average of Moody’s, S&P, and Fitch).
Consumer Price Index (CPI) – Index that measures prices of a fixed basket of goods bought by a typical consumer, including food, transportation, shelter, utilities, clothing, medical care, entertainment and other items. The CPI, published by the Bureau of Labor Statistics in the Department of Labor, is based at 100 in 1982 and is released monthly. It is widely used as a cost-of-living benchmark to adjust Social Security payments and other payment schedules, union contracts and tax brackets. Also known as the cost-of-living index.
Core Personal Consumption Expenditure Price Index – A measure of the Personal Consumption Expenditure Price Index that excludes the more volatile and seasonal food and energy prices.
Personal Consumption Expenditure Price Index (PCEPI) – This index is one measure of U.S. inflation that assesses the percentage change in prices of goods and services purchased by consumers throughout the economy. Of all the measures of consumer price inflation, the PCEPI covers the broadest set of goods and services.
Unless otherwise noted, index returns reflect the reinvestment of income dividends and capital gains, if any, but do not reflect fees, brokerage commissions or other expenses of investing. Investors may not make direct investments into any index.
Alternative Minimum Tax (AMT) – A federal tax aimed at ensuring that high-income individuals, estates, trusts, and corporations pay a minimal level income tax. For individuals, the AMT is calculated by adding tax preference items to regular taxable income.
Annualized Distribution Yield – The distribution yield reflects actual distributions made to shareholders. The annualized distribution yield is calculated by summing the last 30 days of income at a given month end and annualizing to a 360-day year. The result is divided by the ending maximum offering price.
Basis Point (bp) – A unit equal to 1/100th of 1%. 1% = 100 basis points (bps).
Bond Credit Ratings – A bond credit rating assesses the financial ability of a debt issuer to make timely payments of principal and interest. Ratings of AAA (the highest), AA, A, and BBB are investment-grade quality. Ratings of BB, B, CCC, CC, C, and D (the lowest) are considered below investment grade, speculative grade, or junk bonds. Unless otherwise noted, the ratings listed are from Municipal Market Data and are a combination of ratings from Standard and Poor’s, Moody’s Investors Service, and Fitch Ratings.
Credit Spread/Quality Spread – The difference between the yields of securities with different credit qualities.
Duration – A bond’s sensitivity to interest rates. Bonds with longer durations experience greater price volatility than bonds with shorter durations.
Effective Duration – A bond’s sensitivity to interest rates, incorporating the embedded option features, such as call provisions. Bonds with longer durations experience greater price volatility than bonds with shorter durations.
Fed Funds Rate – The interest rate at which a depository institution lends immediately available funds (balances at the Federal Reserve) to another depository institution overnight.
General Obligation Bond – A municipal bond backed by the credit and “taxing power” of the issuing jurisdiction rather than the revenue from a given project.
Gross Domestic Product (GDP) – A country’s income minus foreign investments: the total value of all goods and services produced within a country in a year, minus net income from investments in other countries.
Participation Rate – The number of people who are either employed or are actively looking for work. The people who are no longer actively searching for work would not be included in the participation rate. During an economic recession, many workers often get discouraged and stop looking for employment, as a result, the participation rate decreases.
Quantitative Easing – The Federal Reserve’s monetary policy intended to stimulate the U.S. economy following the recession that began in 2007/08.
Quantitative Easing 3 (QE3) – The third round of the Federal Reserve’s monetary policy intended to stimulate the U.S. economy following the recession that began in 2007/08. Announced in September 2012 and revised in December 2012, December 2013, and January 2014, the Fed intends to buy $65 billion in mortgage-backed securities and Treasuries each month until the economy improves.
SEC Yield – SEC yield is computed in accordance with SEC standards measuring the net investment income per share over a specified 30-day period expressed as a percentage of the maximum offering price of the Fund’s shares at the end of the period.
Yield Curve – A line that plots the interest rates, at a set point in time, of bonds having equal credit quality, but differing maturity dates.
This page is not part of the Semi-Annual Report 3
Thornburg Strategic Municipal Income Fund
The Thornburg Strategic Municipal Income Fund differentiates itself in four ways from other general municipal funds.
| | • | | First, it has a more flexible mandate; we go where we perceive value. This allows us to search various sectors, issuers, credit qualities, geographic areas, and segments of the yield curve. |
| | • | | Second, we don’t have a legacy of bonds purchased prior to the credit meltdown of 2007–2008. |
| | • | | Third, the Fund does not use leverage, as do many high-yield muni funds. |
| | • | | Finally, we believe that we can apply some of the risk-management skills we have demonstrated in our investment grade funds. Our portfolio managers have over 55 years of combined experience in the municipal market. |
Portfolio Managers

Josh Gonze Chris Ryon,CFA
Objectives and Strategies
The Fund seeks a high level of current income exempt from federal individual income tax (may be subject to AMT).
Not more than 50% of the portfolio is invested in bonds rated below investment grade (or of equivalent quality as determined in accordance with the Prospectus) at the time of purchase. Also, the portfolio is typically diversified among sectors, issuers, credit qualities, geographic regions, and segments of the yield curve. The flexible nature of the Fund allows the team to adapt the portfolio’s duration and credit quality to our perception of future market conditions.
Average Annual Total Returns
For Periods Ended March 31, 2014
| | | | | | | | | | | | |
| | | 1 YR | | | 3 YRS | | | SINCE
INCEPTION | |
A Shares (Incep: 4/1/09) | | | | | | | | | | | | |
Without sales charge | | | 0.31 | % | | | 7.60 | % | | | 8.61 | % |
With sales charge | | | -1.70 | % | | | 6.87 | % | | | 8.18 | % |
Performance data shown represents past performance and is no guarantee of future results. Investment return and principal value will fluctuate so shares, when redeemed, may be worth more or less than their original cost. Current performance may be lower or higher than quoted. For performance current to the most recent month end, visit thornburg.com or call 800.847.0200.
The maximum sales charge for the Fund’s Class A shares is 2.00%. The total annual fund operating expense of Class A shares is 1.31%, as disclosed in the most recent Prospectus. Thornburg Investment Management and Thornburg Securities Corporation have contractually agreed to waive fees and reimburse expenses until at least February 1, 2015, so that actual expenses for Class A shares do not exceed 1.25%.
30-Day Yields, A Shares
As of March 31, 2014
| | | | |
Annualized Distribution Yield | | SEC
Yield | |
2.88% | | | 2.28 | % |
Without fee waivers and expense reimbursements, the 30-day SEC Yield would have been 2.26% and the Annualized Distribution Yield would have been 2.85%.
Key Portfolio Attributes
As of March 31, 2014
| | | | |
Number of Bonds | | | 184 | |
| |
Effective Duration | | | 6.1 Yrs | |
| |
Average Maturity | | | 12.7 Yrs | |
See the entire portfolio in the Schedule of Investments beginning on page 11.
4 This page is not part of the Semi-Annual Report
Thornburg’s Suite of Municipal Funds
| | |
Municipal Funds for a Range of Interest-Rate Scenarios At Thornburg, we often say that predicting interest rates is a fool’s game. And with the Federal Reserve still heavily involved in the markets, it’s even more difficult to forecast how rates may rise than when they may rise. Will long rates rise first and short rates follow? Will long and short rates climb simultaneously? A traditional strategy to protect oneself against interest-rate risk is to move into shorter-duration bond strategies. But the seemingly counterintuitive response of moving to longer-duration strategies can sometimes yield better results. Diversify Across the Yield Curve This uncertainty points to why it’s important for investors to match their investment horizon to the duration of the strategy in which they’re invested, and to diversify assets across the yield curve. For any interest-rate scenario, Thornburg’s comprehensive suite of municipal funds gives prudent investors the ability to diversify across the yield curve. Diversify Across the Yield Curve with Thornburg Municipal Funds AAA General Obligation Municipal Yield Curve, as of April 2, 2014 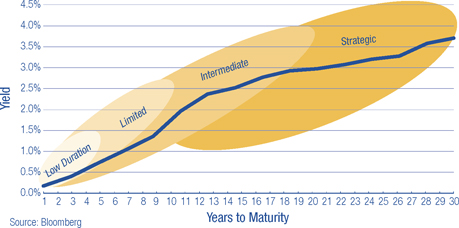
| |  |
| | | | | | | | |
| | | LOW DURATION | | LIMITED TERM | | INTERMEDIATE | | STRATEGIC MUNICIPAL |
| | | MUNICIPAL FUND | | MUNICIPAL FUNDS | | MUNICIPAL FUNDS | | INCOME FUND |
| Maturity Range (yrs) | | 1-5 | | 1-10 | | 1-20 | | 1-30 |
| Portfolio Structure | | Laddered | | Laddered | | Laddered | | Flexible |
| Credit Quality | | Investment Grade | | Investment Grade | | Investment Grade | | Flexible (Maximum of 50% below investment grade) |
| | | | Primary: | | Primary: | | |
| Objective | | Seeks current income exempt from federal income taxes, consistent with preservation of capital | | Obtain as high a level of current income exempt from individual income tax as is consistent with preservation of capital Secondary: Reduce expected changes in share price compared to longer intermedi- ate and long-term bond portfolios | | Obtain as high a level of current income exempt from individual income tax as is consistent with preservation of capital Secondary: Reduce expected changes in share price compared to long-term bond portfolios | | Seeks a high level of current income exempt from federal individual income tax |
This page is not part of the Semi-Annual Report 5
2014 Certified Semi-Annual Report
Thornburg Strategic Municipal Income Fund
March 31, 2014
This report is certified under the Sarbanes-Oxley Act of 2002, which requires that public companies, including mutual funds, affirm that the information provided in their annual and semiannual shareholder reports fully and fairly represents their financial position and the results of their operations for the period presented.
6 Certified Semi-Annual Report
Letter to Shareholders
April 15, 2014
Dear Fellow Shareholder:
We are pleased to present the semi-annual report for the Thornburg Strategic Municipal Income Fund. The net asset value (NAV) of the Class A shares increased 31 cents to $14.71 per share during the six months ended March 31, 2014. If you were with us for the entire period, you received dividends of 22.6 cents per share. If you reinvested your dividends, you received 22.8 cents per share. Dividends were lower for Class C shares and higher for Class I shares to account for varying class-specific expenses. The Class A shares of your Fund underperformed the index with a total return of 4.15% at NAV for the six months ended March 31, 2014, compared to the 4.18% total return for the BofA Merrill Lynch Municipal Master Index (BAML Municipal Master Index). The Fund generated 0.33% more price return and 0.36% less income than the index.
The first six months of fiscal 2014 were very interesting as interest-rate changes went in various directions, dependent on the maturity discussed. This period certainly highlighted the fact that interest rates do not change uniformly across the entire maturity spectrum (the yield curve).
Chart I illustrates how yields changed during the period. The gold bars show the yield changes from September 30, 2013 through December 31, 2013. Short-term yields (maturities of five years or less) moved lower, while yields in maturities from five years to 20 years moved higher by varying amounts, and longer-term maturities were flat to slightly lower. It is helpful to remember the market tone during that period. Most market commentators believed the stock market and yields were going in the same direction: up. The blue bars show the yield changes from December 31, 2013 through March 31, 2014. Again, yield changes were not uniform across the yield curve. This time, after new U.S. Federal Reserve Chair Janet Yellen hinted that short-term interest rates may eventually need to increase, short-term yields increased and long-term yields decreased.
Investors may wonder how best to protect themselves from these changes. One way to hedge this risk is to own securities or mutual funds that focus their investment universes across the different segments of the yield curve. In our opinion, that would mean owning some of our new Thornburg Low Duration Municipal Fund and our Limited Term Municipal, Intermediate Municipal, and Strategic Municipal Income Funds. The percentage ownership of each would depend on levels of risk tolerance.
Throughout the six-month period the Fund maintained a lower risk posture on interest rates than its benchmark; the average effective duration was 6.67 years compared to 7.98 years for the benchmark. This detracted from relative performance by 0.14% in the period. The Fund’s positioning along the yield curve cost the Fund 0.15% of relative performance. Sector allocations were a positive component of performance, adding 0.26% of relative performance. Dollar price, which examines the effects of discounts and premiums in the Fund, detracted by 0.31%. The Fund’s overweight in lower-rated bonds added 0.42% of relative performance. Security selection added 0.47% and other factors subtracted 0.22%.
Chart I | Changes in AAA General-Obligation Municipal Yield Curve
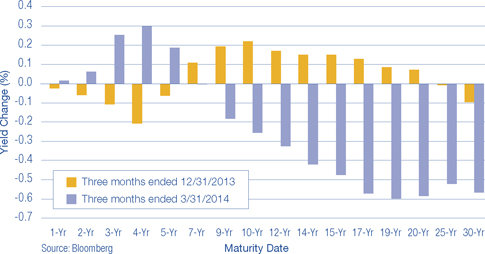
Certified Semi-Annual Report 7
Letter to Shareholders,
Continued
Chart II | Labor Market Indicators
2/28/1990 – 3/31/2014
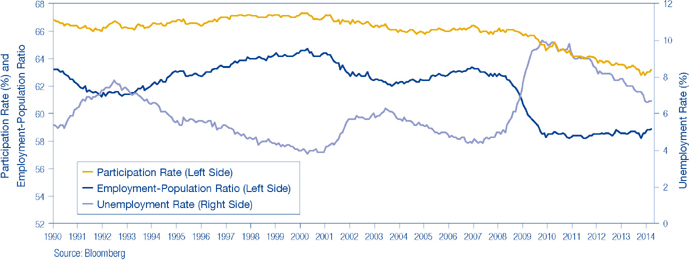
The Economy and the Federal Reserve
Gross domestic product (GDP) for the year ended December 31, 2013 came in at 2.6%, around its long-term average (to March 1990) of 2.5%. Additions to non-farm payroll employment have averaged about 185,000 per month for the six months ended March 31, 2014. The unemployment rate has declined to 6.7%, but it has been clouded by a declining labor participation rate. The percentage of the U.S. population that is employed has declined to 58.9% as of March 31, 2014 from 63.3% on March 31, 2007. The retirement of the “baby boomer” generation certainly contributes to this decline, but does not account for all of it. Chart II illustrates each of these trends from 1990.
Inflation, the bondholder’s worst enemy, has remained well controlled in the last six months. The year-over-year change in the Consumer Price Index (CPI) increased to 1.5% as of March 31, 2014 from 1.2% as of September 30, 2013. Subtracting the food and energy components to arrive at the core measure presents a picture of a well-behaved, unchanged 1.7%. The economic backdrop is one of mild expansion with low inflation. The $64,000 question is, “How long can it last?” In January 2014, Janet Yellen replaced Ben Bernanke as Federal Reserve Chair. Her appointment as Fed Chair assured a continuation of the current Fed policies. Last year, Bernanke roiled the fixed income markets by alluding to the prospect of a decrease in the Fed’s monthly purchases of Treasury and mortgage backed securities by the Federal Reserve; the tapering of QE3 Rates went up! This year, the tapering started in actuality with the Fed reducing its purchases by $10.0 billion per meeting. Rates went down! Go figure!
Chair Yellen learned that in her new position (to borrow an old E.F. Hutton advertisement tag line), “When she speaks, markets listen.” At her first news conference, Ms. Yellen tried to clarify what “for a considerable time” meant from the last Fed Statement: “This is the kind of term it’s hard to define,” Yellen said. “Probably means something on the order of six months, or that type of thing” [after QE3 tapering ends]. This sent the debt markets, especially the short-term debt markets, lower in price and higher in yield. The results can be seen in Chart I.
8 Certified Semi-Annual Report
Letter to Shareholders,
Continued
The Municipal Market
The municipal market has performed very well over the last six months. The monthly outflows from municipal bond mutual funds have abated. The Investment Company Institute (ICI), an industry trade group, has reported that for the last three months of calendar year 2013, municipal bond mutual funds lost an average of $6.6 billion per month. For the first three months of calendar year 2014, municipal bond mutual funds experienced $1.1 billion of inflows per month. This is not a significant amount, but at least it is positive.
These cash flows would normally not support a significantly positive-return environment, but when coupled with a decline in new issuance of municipal bonds, a clearer picture presents itself. The supply of new municipal bonds was down 26% for the first three months of 2014. So, muted demand was met with reduced supply, yielding positive results.
The overall economic health of the municipal bond market is improving, albeit unevenly. We arrive at this judgment in part through the use of the Bloomberg Economic Evaluation of States Index, which includes:
| | • | | Mortgage delinquencies – from the Mortgage Bankers Association |
| | • | | State personal income – from the Bureau of Economic Analysis |
| | • | | Tax revenue – from the U.S. Census Bureau |
| | • | | Employment – from the Bureau of Labor Statistics |
| | • | | Home prices – from the Federal Housing Finance Agency |
| | • | | Bloomberg State Stock Index |
From the fourth quarter of 2012 through the fourth quarter of 2013 (latest data available) the BAML Municipal Master Index increased on average 2.8%. It ranged from a high of 8.8% to a low of negative 7.5%. For the comparable prior year period, the average was an increase of 0.2% with a range from 9.9% to negative 4.1%. In addition, state pension funds are still wrestling with some of their issues. The median funding levels have declined from 82.6% in 2007 to 68.6% in 2012 (the Pew Center on the States suggests a funding level of 80% is adequate).
Two municipal bond market credit stories (Detroit and Puerto Rico) continue to grab headlines. In Detroit’s case, some significant settlements have been announced, but they are short on specifics, including where the new cash came from, and are dependent upon state approval. As in most Chapter 9 proceedings, one should read very little into early reports because the final results may prove very different. For example, a settlement was announced between insured bondholders and the city for a recovery of about 74% of par (a bond’s original face value); a second component of the settlement was reached with several unions for 100% of existing pension obligations and a reduction in cost-of-living adjustments. The original opening offer for these parties was 20% of par for the bondholders, and between 75% and 95% of outstanding pension obligations. It appears to us that these compromises do not address the root problems. Thornburg Funds do not have direct exposure to the city of Detroit.
Puerto Rico made the news in March 2014 by successfully coming to market with the largest “junk” bond deal in municipal market history. Puerto Rico, which is now rated BB, pulled off a $3.5 billion offering, which was purchased by non-traditional market participants, i.e. hedge funds. It was a 21-year maturity bond that was priced at $93.00 to yield 8.73%. We looked at the issue very closely and decided not to purchase it for your Fund. The deal initially traded up to around $97.00 but as of this writing (close of business April 15th), it is trading at a dollar price of $87.50, a loss of almost 6.00% from the original offering price. Thornburg Funds are among the 30% of U.S. municipal mutual funds that do not own any debt from the Commonwealth of Puerto Rico.
Certified Semi-Annual Report 9
Letter to Shareholders,
Continued
Conclusion
Your Thornburg Strategic Municipal Income Fund focuses on undervalued segments of the municipal bond market and comprised 144 municipal obligors as of March 31, 2014. We diversify our holdings across the Fund’s investment universe. Chart I illustrates that yield changes are not uniform across that universe. We continue to concentrate on higher value-added tasks, such as performing fundamental bottom-up credit research. It is just this type of research that has allowed us to avoid the two largest headline-grabbing credit issues in the municipal bond market.
This year has gotten off to a strong start. We thank you for the trust you have placed with us and will continue to keep that foremost in our minds.
Sincerely,
| | |
 | |  |
| Christopher Ryon,CFA | | Josh Gonze |
| Portfolio Manager | | Portfolio Manager |
| Managing Director | | Managing Director |
The matters discussed in this report may constitute forward-looking statements made pursuant to the safe harbor provisions of the Securities Litigation Reform Act of 1995. These include any advisor or portfolio manager prediction, assessment, analysis or outlook for individual securities, industries, investment styles, market sectors and/or markets. These statements involve risks and uncertainties. In addition to the general risks described for each fund in its current prospectus, other factors bearing on these reports include the accuracy of the advisor’s or portfolio manager’s forecasts and predictions, the appropriateness of the investment strategies designed by the advisor or portfolio manager and the ability of the advisor or portfolio manager to implement their strategies efficiently and successfully. Any one or more of these factors, as well as other risks affecting the securities markets generally, could cause the actual results of any fund to differ materially as compared to its benchmarks.
10 Certified Semi-Annual Report
| | |
| Schedule of Investments | | |
| |
Thornburg Strategic Municipal Income Fund | | March 31, 2014 (Unaudited) |
Summary of Security Credit Rating†
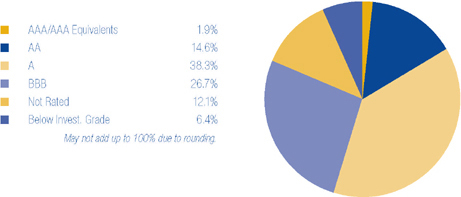
We have used ratings from Standard & Poor’s (S&P). Where S&P ratings are not available, we have used Moody’s Investors Service. Where neither rating is available, we have used ratings from Fitch Ratings. The category of investments identified as “AAA” in this graph includes investments which are pre-refunded or escrowed to maturity. Such investments are backed by an escrow or trust containing sufficient U.S. Government or U.S. Government agency securities to satisfy the timely payment of principal and interest and, therefore, are normally deemed to be equivalent to AAA-rated securities.
| | | | | | | | | | |
ISSUER-DESCRIPTION | | CREDIT RATING†
S&P/ MOODY’S | | PRINCIPAL
AMOUNT | | | VALUE | |
ALABAMA — 0.56% | | | | | | | | | | |
City of Mobile Industrial Development Board PCR, 1.65% due 6/1/2034 put 3/20/2017 (Alabama Power Company Barry Plant Project) | | A/A1 | | $ | 1,000,000 | | | $ | 1,000,810 | |
| | | |
ARIZONA — 0.57% | | | | | | | | | | |
Pima County IDA, 5.875% due 4/1/2022 (Cambridge Academy) | | NR/NR | | | 370,000 | | | | 367,558 | |
Pima County IDA, 5.125% due 12/1/2040 (Providence Day School) | | BBB+/NR | | | 710,000 | | | | 664,461 | |
| | | |
CALIFORNIA — 15.09% | | | | | | | | | | |
ABAG Finance Authority for Nonprofit Corporations, 5.00% due 7/1/2047 (Episcopal Senior Communities) | | NR/NR | | | 1,635,000 | | | | 1,572,461 | |
Benicia USD GO, 0% due 8/1/2026 (Benicia High School; Insured: AGM) | | AA/A2 | | | 830,000 | | | | 476,254 | |
California HFFA, 6.25% due 2/1/2026 (Community Program Developmental Disabilities; Insured: California Mtg Insurance) | | A/NR | | | 1,500,000 | | | | 1,723,860 | |
California HFFA, 5.00% due 11/15/2034 (Children’s Hospital Los Angeles) | | BBB+/Baa2 | | | 420,000 | | | | 426,741 | |
California Housing Finance Agency, 4.625% due 8/1/2016 (Low-Moderate Income Housing Loans; Insured: FGIC) (AMT) | | A-/Baa2 | | | 1,175,000 | | | | 1,228,474 | |
California Housing Finance Agency, 4.625% due 8/1/2026 (Low-Moderate Income Housing Loans; Insured: FGIC) (AMT) | | A-/Baa2 | | | 560,000 | | | | 559,994 | |
California Municipal Finance Authority, 8.50% due 11/1/2039 (Harbor Regional Center) | | NR/Baa1 | | | 1,000,000 | | | | 1,185,190 | |
California Pollution Control Financing Authority, 5.00% due 11/21/2045 (Poseidon Resources (Channelside) LP Desalination Project) (AMT) | | NR/Baa3 | | | 3,000,000 | | | | 2,836,110 | |
California State Public Works Board, 5.00% due 4/1/2028 (Corrections & Rehabilitation and Judicial Council) | | A-/A2 | | | 1,000,000 | | | | 1,094,200 | |
California State Public Works Board, 6.25% due 4/1/2034 (Department of General Services-Offices Renovation) | | A-/A2 | | | 100,000 | | | | 116,108 | |
California Statewide Communities Development Authority, 5.00% due 7/1/2020 (Aspire Public Schools; LOC: PCSD Guaranty Pool I, LLC) | | NR/NR | | | 200,000 | | | | 199,560 | |
California Statewide Communities Development Authority, 6.125% due 7/1/2046 (Aspire Public Schools) | | NR/NR | | | 995,000 | | | | 968,304 | |
Calipatria USD GO, 4.00% due 8/1/2017 (Educational Facilities; Insured: AMBAC) | | NR/NR | | | 150,000 | | | | 150,612 | |
Calipatria USD GO, 0% due 8/1/2025 (Educational Facilities; Insured: ACA) | | NR/NR | | | 2,425,000 | | | | 1,247,760 | |
Carson Redevelopment Agency, 7.00% due 10/1/2036 (Project Area 1) | | A-/NR | | | 500,000 | | | | 567,070 | |
Chico Redevelopment Agency, 5.00% due 4/1/2030 (Chico Amended & Merged Redevelopment; Insured: AMBAC) | | A+/NR | | | 1,500,000 | | | | 1,515,900 | |
City of Moorpark Mobile Home Park, 6.15% due 5/15/2031 (Villa Del Arroyo) | | A/NR | | | 1,000,000 | | | | 1,090,630 | |
City of Santa Monica, 4.00% due 1/1/2017 (Hyperion Project-Wastewater Enterprise; Insured: Natl-Re) | | AAA/Aa1 | | | 75,000 | | | | 75,203 | |
Corona-Norco USD COP, 5.00% due 4/15/2031 (Insured: AGM) | | AA/A1 | | | 1,750,000 | | | | 1,826,807 | |
County of El Dorado, 5.00% due 9/1/2026 (El Dorado Hills Development-Community Facilities) | | A/NR | | | 630,000 | | | | 681,641 | |
Daly County Housing Development Finance Agency, 5.25% due 12/15/2023 (Franciscan Country Club Mobile Home Park Acquisition) | | A/NR | | | 650,000 | | | | 680,771 | |
Los Angeles County Public Works Financing Authority, 4.00% due 9/1/2014 (Lynwood Regional Justice Center and Central Jail Expansion; Insured: Natl-Re) | | AA-/NR | | | 75,000 | | | | 76,165 | |
Los Angeles County Public Works Financing Authority, 4.00% due 9/1/2015 (Lynwood Regional Justice Center and Central Jail Expansion; Insured: Natl-Re) | | AA-/NR | | | 50,000 | | | | 52,174 | |
Los Angeles County Public Works Financing Authority, 3.625% due 9/1/2016 (Lynwood Regional Justice Center and Central Jail Expansion; Insured: Natl-Re) | | AA-/Baa1 | | | 200,000 | | | | 210,968 | |
M-S-R Energy Authority, 6.50% due 11/1/2039 | | A-/NR | | | 1,000,000 | | | | 1,266,240 | |
Redwood City Redevelopment Agency, 0% due 7/15/2021 (Redevelopment Project Area 2; Insured: AMBAC) | | A-/NR | | | 1,285,000 | | | | 954,138 | |
Riverside Community College District GO, 5.00% due 8/1/2021 (Insured: AGM) | | AA/Aa2 | | | 150,000 | | | | 159,291 | |
Riverside County Asset Leasing Corp., 0% due 6/1/2021 (Riverside County Hospital; Insured: Natl-Re) | | AA-/A2 | | | 535,000 | | | | 411,827 | |
San Francisco City & County Redevelopment Financing Authority, 0% due 8/1/2023 (Redevelopment Project; Insured: Natl-Re) | | AA-/Baa1 | | | 1,025,000 | | | | 704,114 | |
Certified Semi-Annual Report 11
| | |
| Schedule of Investments, continued | | |
| |
Thornburg Strategic Municipal Income Fund | | March 31, 2014 (Unaudited) |
| | | | | | | | | | |
ISSUER-DESCRIPTION | | CREDIT RATING†
S&P/ MOODY’S | | PRINCIPAL
AMOUNT | | | VALUE | |
San Francisco City & County Redevelopment Financing Authority, 6.50% due 8/1/2039 (Mission Bay North Redevelopment) | | A-/NR | | $ | 250,000 | | | $ | 279,860 | |
San Francisco City & County Redevelopment Financing Authority, 6.75% due 8/1/2041 (Mission Bay North Redevelopment) | | A-/NR | | | 500,000 | | | | 576,115 | |
San Jose Redevelopment Agency, 5.50% due 8/1/2035 (Merged Area Redevelopment) | | A/Ba1 | | | 1,000,000 | | | | 1,037,770 | |
Sonoma County Community Redevelopment Agency, 6.50% due 8/1/2034 (The Springs Redevelopment; Insured: AGM) | | AA/NR | | | 100,000 | | | | 100,467 | |
Southeast Resource Recovery Facilities Authority, 5.25% due 12/1/2016 (Insured: AMBAC) | | A+/A2 | | | 500,000 | | | | 501,995 | |
Union Elementary School District, 0% due 9/1/2027 (Santa Clara County District Schools; Insured: Natl-Re) | | AA+/NR | | | 905,000 | | | | 516,791 | |
| | | |
COLORADO — 3.90% | | | | | | | | | | |
Denver Convention Center Hotel Authority, 5.125% due 12/1/2026 (Insured: Syncora) | | BBB-/Baa3 | | | 2,450,000 | | | | 2,505,296 | |
Denver Convention Center Hotel Authority, 5.00% due 12/1/2030 (Insured: Syncora) | | BBB-/Baa3 | | | 450,000 | | | | 456,071 | |
Denver Convention Center Hotel Authority, 5.00% due 12/1/2035 (Insured: Syncora) | | BBB-/Baa3 | | | 605,000 | | | | 608,902 | |
Eagle Bend Metropolitan District GO, 5.00% due 12/1/2020 (Insured: Radian) | | A-/NR | | | 825,000 | | | | 842,903 | |
Eagle River Fire District, 6.625% due 12/1/2024 | | NR/NR | | | 225,000 | | | | 238,608 | |
Eagle River Fire District, 6.875% due 12/1/2030 | | NR/NR | | | 400,000 | | | | 422,448 | |
Public Authority for Colorado Energy, 5.75% due 11/15/2018 (Natural Gas Purchase) | | A-/Baa2 | | | 615,000 | | | | 688,874 | |
Public Authority for Colorado Energy, 6.50% due 11/15/2038 (Natural Gas Purchase) | | A-/Baa2 | | | 260,000 | | | | 327,834 | |
Regional Transportation District COP, 4.50% due 6/1/2016 pre-refunded 6/1/2015 (Transit Vehicles Project; Insured: AMBAC) | | A/Aa3 | | | 350,000 | | | | 367,311 | |
Regional Transportation District COP, 5.375% due 6/1/2031 | | A/Aa3 | | | 500,000 | | | | 540,760 | |
| | | |
CONNECTICUT — 1.57% | | | | | | | | | | |
Borough of Naugatuck COP, 5.00% due 6/15/2017 (Incineration Facilities; Insured: AMBAC) (AMT) | | NR/Aa3 | | | 775,000 | | | | 780,774 | |
Connecticut Health & Educational Facilities Authority, 6.00% due 7/1/2039 (Ethel Walker School) | | BBB-/NR | | | 1,000,000 | | | | 1,036,250 | |
State of Connecticut GO Floating Rate Note, 0.58% due 9/15/2017 (Public Improvements) | | AA/Aa3 | | | 1,000,000 | | | | 1,001,280 | |
| | | |
DELAWARE — 1.14% | | | | | | | | | | |
Delaware HFA, 5.00% due 7/1/2021 (Nanticoke Memorial Hospital) | | BB+/NR | | | 1,000,000 | | | | 1,045,040 | |
Delaware HFA, 5.50% due 6/1/2024 (Beebe Medical Center) | | BBB-/Baa3 | | | 1,000,000 | | | | 1,001,880 | |
| | | |
DISTRICT OF COLUMBIA — 0.44% | | | | | | | | | | |
Metropolitan Washington Airports Authority, 0% due 10/1/2027 (Dulles Toll Road; Insured: AGM) | | AA/A3 | | | 1,500,000 | | | | 797,730 | |
| | | |
FLORIDA — 5.86% | | | | | | | | | | |
City of Miami GO, 5.00% due 1/1/2017 (Homeland Defense/Neighborhood Capital Improvements) | | BBB-/A3 | | | 1,245,000 | | | | 1,322,053 | |
City of Miami GO, 5.00% due 1/1/2018 (Homeland Defense/Neighborhood Capital Improvements) | | BBB-/A3 | | | 1,790,000 | | | | 1,911,416 | |
Florida Higher Educational Facilities Financing Authority, 5.00% due 4/1/2027 (Nova Southeastern University) | | BBB/Baa1 | | | 1,000,000 | | | | 1,048,700 | |
Hollywood Community Redevelopment Agency, 5.625% due 3/1/2024 | | NR/A3 | | | 340,000 | | | | 340,578 | |
Miami-Dade County School Board COP, 5.00% due 8/1/2027 (District School Facilities and Infrastructure) | | A/A1 | | | 1,100,000 | | | | 1,198,813 | |
Orange County, 0% due 10/1/2016 (County Correctional Facilities and Communications System; Insured: AMBAC) | | NR/NR | | | 410,000 | | | | 392,374 | |
Pinellas County Educational Facilities Authority, 5.25% due 10/1/2030 (Barry University) | | BBB/NR | | | 500,000 | | | | 515,200 | |
Sarasota County Public Hospital Board, 2.325% due 10/1/2021 (Sarasota Memorial Hospital; Insured: Natl-Re) | | AA-/A1 | | | 1,000,000 | | | | 1,005,260 | |
School Board of Marion County COP, 5.25% due 6/1/2022 (Educational Facilities; Insured: AMBAC) | | NR/A1 | | | 1,000,000 | | | | 1,050,600 | |
St. Johns County IDA, 5.625% due 8/1/2034 (Presbyterian Retirement Communities Project) | | NR/NR | | | 230,000 | | | | 233,015 | |
Tampa Sports Authority, 5.75% due 10/1/2020 (Tampa Bay Arena; Insured: Natl-Re) | | AA-/Baa1 | | | 1,000,000 | | | | 1,108,550 | |
University of Southern Florida Financing Corp. COP, 5.00% due 7/1/2021 (Student Housing & Parking Facilities; Insured: AMBAC) | | A+/A1 | | | 375,000 | | | | 395,783 | |
| | | |
GEORGIA — 1.72% | | | | | | | | | | |
City of Atlanta, 6.25% due 11/1/2034 (Water and Wastewater Capital Improvement Program) | | A+/Aa3 | | | 500,000 | | | | 582,340 | |
Development Authority of Fulton County, 5.00% due 10/1/2019 (Georgia Tech Athletic Assoc.) | | NR/A2 | | | 1,000,000 | | | | 1,160,570 | |
Main Street Natural Gas, Inc., 5.00% due 3/15/2018 (Georgia Gas) | | A/A3 | | | 515,000 | | | | 567,710 | |
Main Street Natural Gas, Inc., 5.50% due 9/15/2023 (Georgia Gas) | | A-/Baa2 | | | 350,000 | | | | 395,402 | |
Municipal Gas Authority of Georgia GO, 5.00% due 4/1/2016 (Public Gas Partners, Inc.-Gas Portfolio III Project) | | AA-/A1 | | | 350,000 | | | | 379,071 | |
| | | |
GUAM — 2.38% | | | | | | | | | | |
Guam Government, 5.75% due 12/1/2034 (Layon Solid Waste Disposal Facility) | | BBB+/NR | | | 500,000 | | | | 529,895 | |
Guam Government Department of Education COP, 6.875% due 12/1/2040 (John F. Kennedy High School) | | B+/NR | | | 1,000,000 | | | | 1,030,660 | |
Guam Government GO, 7.00% due 11/15/2039 | | BB-/NR | | | 520,000 | | | | 550,550 | |
Guam Power Authority, 5.00% due 10/1/2027 (Electric Power System; Insured: AGM) | | AA/A2 | | | 1,000,000 | | | | 1,089,130 | |
Guam Waterworks Authority, 5.25% due 7/1/2024 (Water and Wastewater System) | | A-/Ba1 | | | 500,000 | | | | 548,705 | |
Guam Waterworks Authority, 5.00% due 7/1/2028 (Water and Wastewater System) | | A-/Ba1 | | | 500,000 | | | | 519,480 | |
12 Certified Semi-Annual Report
| | |
| Schedule of Investments, continued | | |
| |
| Thornburg Strategic Municipal Income Fund | | March 31, 2014 (Unaudited) |
| | | | | | | | | | |
ISSUER-DESCRIPTION | | CREDIT RATING†
S&P/ MOODY’S | | PRINCIPAL
AMOUNT | | | VALUE | |
ILLINOIS — 5.28% | | | | | | | | | | |
Board of Education of the City of Chicago GO, 5.00% due 12/1/2020 (Education Capital Improvement Program; Insured: AGM) | | AA/A2 | | $ | 365,000 | | | $ | 392,203 | |
City of Chicago, 5.25% due 1/1/2016 (Municipal Residential Street Improvements; Insured: AMBAC) | | AA+/Baa1 | | | 800,000 | | | | 803,192 | |
City of Chicago, 6.75% due 6/1/2022 (Pilsen Redevelopment) | | NR/NR | | | 1,000,000 | | | | 1,006,210 | |
City of Chicago, 5.00% due 1/1/2035 (Midway Airport Development Plan; Insured: Natl-Re) | | AA-/A2 | | | 1,055,000 | | | | 1,058,534 | |
City of Chicago GO, 5.00% due 1/1/2020 (Insured: AGM) | | AA/A2 | | | 475,000 | | | | 484,253 | |
Cook County GO, 5.25% due 11/15/2033 | | AA/A1 | | | 1,000,000 | | | | 1,058,920 | |
Illinois Finance Authority, 5.75% due 11/15/2037 (OSF Healthcare System) | | A/A3 | | | 330,000 | | | | 345,985 | |
Illinois Finance Authority, 6.00% due 5/15/2039 (OSF Healthcare System) | | A/A3 | | | 1,545,000 | | | | 1,702,436 | |
Metropolitan Pier & Exposition Authority, 5.00% due 6/15/2050 (McCormick Place) | | AAA/Baa1 | | | 1,500,000 | | | | 1,507,035 | |
Village of Melrose Park GO, 6.75% due 12/15/2016 (Redevelopment Project Costs; Insured: Natl-Re) | | NR/Baa1 | | | 250,000 | | | | 267,270 | |
Village of Melrose Park GO, 6.75% due 12/15/2021 (Redevelopment Project Costs; Insured: Natl-Re) | | NR/Baa1 | | | 410,000 | | | | 491,500 | |
Will County School District No. 114 GO, 0% due 12/1/2023 (Educational Facilities; Insured: Natl-Re) | | NR/Baa1 | | | 570,000 | | | | 364,122 | |
| | | |
INDIANA — 2.91% | | | | | | | | | | |
City of Carmel Redevelopment District COP, 6.50% due 7/15/2035 (Performing Arts Center) | | NR/NR | | | 1,000,000 | | | | 1,047,500 | |
Indiana Finance Authority, 6.00% due 12/1/2019 (U.S. Steel Corp.) | | BB-/B1 | | | 3,000,000 | | | | 3,139,290 | |
Indiana Finance Authority, 6.375% due 9/15/2041 (Marian University) | | BBB-/NR | | | 1,000,000 | | | | 1,029,190 | |
| | | |
IOWA — 0.87% | | | | | | | | | | |
Iowa Finance Authority Midwestern Disaster Area, 5.25% due 12/1/2025 (Iowa Fertilizer Company Project) | | BB-/NR | | | 1,615,000 | | | | 1,566,921 | |
| | | |
KANSAS — 0.66% | | | | | | | | | | |
City of Wichita, 5.90% due 12/1/2016 (Brentwood Apartments) | | B/NR | | | 255,000 | | | | 251,711 | |
City of Wichita, 5.85% due 12/1/2025 (Brentwood Apartments) | | B/NR | | | 895,000 | | | | 773,253 | |
Kansas City Community College COP, 3.00% due 4/1/2016 (Higher Education Campus Facilities) | | AA-/NR | | | 150,000 | | | | 156,642 | |
| | | |
KENTUCKY — 1.67% | | | | | | | | | | |
County of Owen, 6.25% due 6/1/2039 (Kentucky-American Water Co. Project) | | A-/Baa1 | | | 540,000 | | | | 582,320 | |
Kentucky Economic DFA, 0% due 10/1/2021 (Norton Healthcare, Inc.; Insured: Natl-Re) | | AA-/Baa1 | | | 715,000 | | | | 538,138 | |
Kentucky Economic DFA, 0% due 10/1/2022 (Norton Healthcare, Inc.; Insured: Natl-Re) | | AA-/Baa1 | | | 2,650,000 | | | | 1,868,647 | |
| | | |
LOUISIANA — 2.69% | | | | | | | | | | |
Louisiana Energy and Power Authority, 5.25% due 6/1/2038 (LEPA Unit No. 1; Insured: AGM) | | AA/A2 | | | 2,000,000 | | | | 2,151,980 | |
Louisiana Public Facilities Authority, 5.00% due 7/1/2032 (Black & Gold Facilities; Insured: CIFG) | | AA/A3 | | | 120,000 | | | | 121,606 | |
Louisiana Public Facilities Authority, 5.375% due 5/15/2043 (Ochsner Clinic Foundation) | | NR/Baa1 | | | 500,000 | | | | 506,335 | |
Parish of St. Charles, 4.00% due 12/1/2040 put 6/1/2022 (Valero Energy Corp. Refinery) | | BBB/Baa2 | | | 2,000,000 | | | | 2,054,660 | |
| | | |
MASSACHUSETTS — 0.21% | | | | | | | | | | |
Massachusetts Educational Financing Authority, 6.00% due 1/1/2028 | | AA/NR | | | 345,000 | | | | 368,574 | |
| | | |
MICHIGAN — 8.46% | | | | | | | | | | |
City of Detroit, 0% due 7/1/2017 (Sewage Disposal System; Insured: Natl-Re) | | AA-/Baa1 | | | 100,000 | | | | 83,622 | |
City of Detroit, 5.00% due 7/1/2017 (Sewage Disposal System; Insured: Natl-Re) | | AA-/Baa1 | | | 100,000 | | | | 100,247 | |
City of Detroit, 0% due 7/1/2018 (Sewage Disposal System; Insured: Natl-Re) | | AA-/Baa1 | | | 330,000 | | | | 260,010 | |
City of Detroit, 5.00% due 7/1/2018 (Water Supply System; Insured: Natl-Re) | | AA-/Baa1 | | | 350,000 | | | | 350,865 | |
City of Detroit, 5.00% due 7/1/2020 (Water Supply System; Insured: Natl-Re) | | AA-/Baa1 | | | 1,000,000 | | | | 994,100 | |
City of Detroit, 5.25% due 7/1/2021 (Sewage Disposal System; Insured: Natl-Re) | | AA-/Baa1 | | | 200,000 | | | | 198,226 | |
City of Detroit, 5.00% due 7/1/2022 (Water Supply System; Insured: Natl-Re) | | AA-/Baa1 | | | 260,000 | | | | 257,403 | |
City of Detroit, 5.25% due 7/1/2023 (Sewage Disposal System; Insured: Natl-Re) | | AA-/Baa1 | | | 180,000 | | | | 178,814 | |
City of Kalamazoo Hospital Finance Authority, 5.00% due 5/15/2036 (Bronson Methodist Hospital) | | NR/A2 | | | 1,000,000 | | | | 1,023,760 | |
City of Kalamazoo Hospital Finance Authority, 5.25% due 5/15/2041 (Bronson Nursing and Rehabilitation Center) | | NR/A2 | | | 1,000,000 | | | | 1,043,360 | |
City of Troy GO, 5.25% due 11/1/2032 (Downtown Development Authority-Community Center Facilities) | | AAA/NR | | | 1,025,000 | | | | 1,119,976 | |
County of Genesee GO, 5.375% due 11/1/2038 (Water Supply System; Insured: BAM) | | AA/A2 | | | 1,000,000 | | | | 1,075,420 | |
Livonia Public School District GO, 5.00% due 5/1/2036 (School Building & Site) | | AA/A1 | | | 225,000 | | | | 235,697 | |
Michigan Finance Authority, 5.00% due 4/1/2031 (State Dept. of Human Services Office Buildings) | | A+/NR | | | 1,000,000 | | | | 1,032,820 | |
Michigan Finance Authority, 8.125% due 4/1/2041 (Hope Academy Project) | | NR/NR | | | 980,000 | | | | 1,055,607 | |
Michigan Housing Development Authority, 3.375% due 11/1/2016 (AMT) | | AA/NR | | | 655,000 | | | | 668,041 | |
Michigan Public School Academy, 8.00% due 8/1/2035 (Will Carleton Charter School) | | NR/NR | | | 1,050,000 | | | | 1,103,917 | |
Michigan State Hospital Finance Authority, 5.00% due 11/15/2015 (Edward W. Sparrow Hospital Assoc.) | | A+/A1 | | | 200,000 | | | | 212,404 | |
Michigan State Hospital Finance Authority, 5.00% due 7/15/2025 (Oakwood Southshore Medical Center) | | A/A2 | | | 650,000 | | | | 671,008 | |
Michigan State Hospital Finance Authority, 5.75% due 11/15/2039 (Henry Ford Health System) | | A-/A2 | | | 1,000,000 | | | | 1,047,770 | |
Certified Semi-Annual Report 13
| | |
| Schedule of Investments, continued | | |
| |
Thornburg Strategic Municipal Income Fund | | March 31, 2014 (Unaudited) |
| | | | | | | | | | |
ISSUER-DESCRIPTION | | CREDIT RATING†
S&P/ MOODY’S | | PRINCIPAL
AMOUNT | | | VALUE | |
Michigan Strategic Fund, 7.00% due 5/1/2021 (Detroit Edison Company; Insured: Natl-Re/AMBAC) | | NR/NR | | $ | 250,000 | | | $ | 305,120 | |
School District of the City of Detroit, 5.00% due 5/1/2025 (School Building & Site; Insured: Q-SBLF) | | AA-/Aa2 | | | 1,000,000 | | | | 1,068,480 | |
School District of the City of Detroit GO, 5.25% due 5/1/2027 (School Building & Site; Insured: AGM) | | AA/Aa2 | | | 1,000,000 | | | | 1,089,060 | |
| | | |
MINNESOTA — 0.86% | | | | | | | | | | |
Minneapolis-St. Paul Metropolitan Airports Commission, 5.00% due 1/1/2023 (Airport, Marina & Port Improvements; | | | | | | | | | | |
Insured: BHAC) (AMT) | | AA+/Aa1 | | | 1,000,000 | | | | 1,030,180 | |
St. Paul Housing & Redevelopment Authority, 5.25% due 5/15/2023 | | A/A2 | | | 115,000 | | | | 120,748 | |
Washington County Housing Redevelopment Authority, 5.625% due 6/1/2037 (Birchwood & Woodbury) | | NR/NR | | | 415,000 | | | | 398,877 | |
| | | |
MISSISSIPPI — 0.08% | | | | | | | | | | |
Jackson Public School District, 4.00% due 2/1/2018 (District Long Range Capital Expenditure Program; Insured: AGM) (State Aid Withholding) | | NR/Aa3 | | | 140,000 | | | | 145,075 | |
| | | |
MISSOURI — 2.04% | | | | | | | | | | |
Tax Increment Financing Commission of Kansas City, 5.25% due 3/1/2018 (Maincor Project-Public Improvements) (ETM) | | NR/NR | | | 1,025,000 | | | | 1,130,257 | |
Tax Increment Financing Commission of Kansas City, 6.00% due 5/1/2030 (Union Hill Redevelopment Project) | | NR/NR | | | 2,505,000 | | | | 2,528,447 | |
| | | |
NEVADA — 0.84% | | | | | | | | | | |
Redevelopment Agency of the City of Mesquite, 7.00% due 6/1/2019 (Public Facility and Redevelopment Projects) | | BBB+/NR | | | 700,000 | | | | 703,171 | |
Redevelopment Agency of the City of Mesquite, 7.125% due 6/1/2021 (Public Facility and Redevelopment Projects) | | BBB+/NR | | | 300,000 | | | | 301,044 | |
Redevelopment Agency of the City of Mesquite, 7.375% due 6/1/2024 (Public Facility and Redevelopment Projects) | | BBB+/NR | | | 500,000 | | | | 501,630 | |
| | | |
NEW JERSEY — 1.09% | | | | | | | | | | |
Higher Education Student Assistance Authority, 5.75% due 12/1/2039 (NJCLASS Student Loan Program) (AMT) | | A/A2 | | | 750,000 | | | | 762,727 | |
New Jersey EDA, 5.50% due 9/1/2027 (Schools Facilities Construction; Insured: Natl-Re) | | AA-/A1 | | | 1,000,000 | | | | 1,188,970 | |
| | | |
NEW MEXICO — 1.10% | | | | | | | | | | |
City of Farmington PCR, 4.70% due 9/1/2024 (Arizona Public Service Co.-Four Corners Project) | | A-/A3 | | | 1,000,000 | | | | 1,047,390 | |
New Mexico Hospital Equipment Loan Council, 5.00% due 7/1/2032 (Haverland Carter Lifestyle Group) | | NR/NR | | | 1,000,000 | | | | 925,410 | |
| | | |
NEW YORK — 0.23% | | | | | | | | | | |
City of Syracuse, 5.00% due 8/1/2017 (City Public and School Building Capital Projects; Insured: AGM) (State Aid Withholding) | | AA/A1 | | | 400,000 | | | | 421,132 | |
| | | |
NORTH CAROLINA — 0.25% | | | | | | | | | | |
North Carolina Eastern Municipal Power Agency, 5.00% due 1/1/2020 (Progress Energy Carolinas, Inc. Initial Project Acquisition; Insured: AMBAC) | | A-/NR | | | 410,000 | | | | 440,233 | |
| | | |
OHIO — 2.64% | | | | | | | | | | |
American Municipal Power, Inc., 5.25% due 2/15/2018 (AMP Combined Hydroelectric Projects) | | A/A3 | | | 500,000 | | | | 568,305 | |
Cleveland-Cuyahoga County Port Authority, 6.25% due 5/15/2016 (Council for Economic Opportunities in Greater Cleveland Project; LOC: FifthThird Bank) | | BBB+/NR | | | 270,000 | | | | 270,294 | |
Cleveland-Cuyahoga County Port Authority, 7.00% due 5/15/2040 (Flats East Development Project; LOC: FifthThird Bank) | | BBB+/NR | | | 1,000,000 | | | | 1,078,780 | |
Ohio State Air Quality Development Authority PCR, 3.375% due 7/1/2033 put 7/1/2015 (FirstEnergy Nuclear Generation Corp.) | | BBB-/Baa3 | | | 100,000 | | | | 101,799 | |
Ohio State Water Development Authority PCR, 5.875% due 6/1/2033 put 6/1/2016 (FirstEnergy Nuclear Generation Corp.) | | BBB-/Baa2 | | | 1,000,000 | | | | 1,079,550 | |
Ohio State Water Development Authority PCR, 3.375% due 7/1/2033 put 7/1/2015 (FirstEnergy Nuclear Generation Corp.) | | BBB-/Baa3 | | | 1,350,000 | | | | 1,376,474 | |
Wyoming City School District GO, 5.00% due 12/1/2018 (Educational Facilities; Insured: AGM) | | NR/A2 | | | 250,000 | | | | 267,095 | |
| | | |
OREGON — 0.56% | | | | | | | | | | |
Western Generation Agency, 5.00% due 1/1/2016 (Wauna Cogeneration Project; Insured: ACA) | | NR/NR | | | 1,000,000 | | | | 1,011,280 | |
| | | |
PENNSYLVANIA — 4.74% | | | | | | | | | | |
Allegheny County IDA, 6.75% due 8/15/2035 (Propel Charter School) | | BBB-/NR | | | 950,000 | | | | 999,609 | |
City of Philadelphia, 5.00% due 6/15/2027 (Philadelphia International and Northeast Philadelphia Airports) (AMT) | | A+/A2 | | | 2,000,000 | | | | 2,123,080 | |
Pennsylvania Economic Development Financing Authority, 5.00% due 12/1/2014 (Colver Project; Insured: AMBAC) (AMT) | | BBB-/Ba1 | | | 450,000 | | | | 457,587 | |
Pennsylvania Economic Development Financing Authority, 4.625% due 12/1/2018 (Colver Project; Insured: AMBAC) (AMT) | | BBB-/Ba1 | | | 1,800,000 | | | | 1,849,212 | |
Pennsylvania Turnpike Commission, 0% due 12/1/2030 (PennDOT-Mass Transit Agencies) | | A-/A3 | | | 2,000,000 | | | | 2,006,200 | |
Philadelphia IDA, 6.00% due 8/1/2035 (Mast Charter School) | | BBB+/NR | | | 1,000,000 | | | | 1,064,790 | |
14 Certified Semi-Annual Report
| | |
| Schedule of Investments, continued | | |
| |
Thornburg Strategic Municipal Income Fund | | March 31, 2014 (Unaudited) |
| | | | | | | | | | |
ISSUER-DESCRIPTION | | CREDIT RATING†
S&P/ MOODY’S | | PRINCIPAL
AMOUNT | | | VALUE | |
RHODE ISLAND — 0.42% | | | | | | | | | | |
Housing Authority of the City of Pawtucket, 5.50% due 9/1/2022 (Public Housing Development) | | A+/NR | | $ | 315,000 | | | $ | 364,090 | |
Housing Authority of the City of Pawtucket, 5.50% due 9/1/2024 (Public Housing Development) | | A+/NR | | | 350,000 | | | | 398,527 | |
| | | |
SOUTH DAKOTA — 0.68% | | | | | | | | | | |
South Dakota Health & Educational Facilities Authority, 5.00% due 7/1/2027 (Avera Health) | | AA-/A1 | | | 400,000 | | | | 426,880 | |
South Dakota Health & Educational Facilities Authority, 5.50% due 11/1/2040 (Sanford Health) | | A+/A1 | | | 750,000 | | | | 787,387 | |
| | | |
TENNESSEE — 0.37% | | | | | | | | | | |
Tennessee Energy Acquisition Corp., 5.00% due 2/1/2015 | | A-/Baa1 | | | 100,000 | | | | 103,566 | |
Tennessee Energy Acquisition Corp., 5.25% due 9/1/2024 | | A-/Baa2 | | | 500,000 | | | | 553,700 | |
| | | |
TEXAS — 8.60% | | | | | | | | | | |
Austin Convention Enterprises, Inc., 5.25% due 1/1/2024 (Austin Convention Center; Insured: Syncora) | | BB+/Ba1 | | | 720,000 | | | | 742,226 | |
Austin Convention Enterprises, Inc., 5.00% due 1/1/2034 (Austin Convention Center; Insured: Syncora) | | BB+/Ba1 | | | 665,000 | | | | 636,777 | |
City of Kerrville Health Facilities Development Corp., 5.45% due 8/15/2035 (Sid Peterson Memorial Hospital) | | BBB-/NR | | | 2,665,000 | | | | 2,679,498 | |
Commissioners Court of Bexar County, 5.00% due 6/15/2018 pre-refunded 6/15/2015 (County Highway Construction and Maintenance) | | AA+/Aaa | | | 200,000 | | | | 211,514 | |
Kimble County Hospital District, 6.25% due 8/15/2033 | | NR/NR | | | 500,000 | | | | 556,430 | |
La Vernia Higher Education Finance Corp., 6.25% due 8/15/2039 (Kipp, Inc.) | | BBB/NR | | | 1,000,000 | | | | 1,099,630 | |
Lower Colorado River Authority, 5.00% due 5/15/2026 (Electric Generation, Water & Electric Transmission) | | A/A1 | | | 3,000,000 | | | | 3,357,690 | |
San Antonio Energy Acquisition Public Facilities Corp., 5.50% due 8/1/2021 | | A-/Baa3 | | | 40,000 | | | | 45,299 | |
San Juan Higher Education Finance Authority, 6.70% due 8/15/2040 (IDEA Public Schools) | | BBB/NR | | | 1,000,000 | | | | 1,114,490 | |
Texas City Industrial Development Corp., 7.375% due 10/1/2020 (BP Pipelines N.A., Inc.) | | A/A2 | | | 1,165,000 | | | | 1,503,770 | |
Texas Public Finance Authority Charter School Finance Corp., 4.15% due 8/15/2016 (IDEA Public Schools; Insured: ACA) | | BBB/NR | | | 100,000 | | | | 105,098 | |
Texas Public Finance Authority Charter School Finance Corp., 5.00% due 2/15/2018 (Cosmos Foundation, Inc.) | | BBB/NR | | | 550,000 | | | | 561,149 | |
Texas Public Finance Authority Charter School Finance Corp., 5.00% due 8/15/2023 (IDEA Public Schools; Insured: ACA) | | BBB/NR | | | 155,000 | | | | 160,679 | |
Texas Public Finance Authority Charter School Finance Corp., 5.00% due 8/15/2030 (IDEA Public Schools; Insured: ACA) | | BBB/NR | | | 1,550,000 | | | | 1,563,299 | |
Texas Public Finance Authority Charter School Finance Corp., 6.20% due 2/15/2040 (Cosmos Foundation, Inc.) | | BBB/NR | | | 1,000,000 | | | | 1,087,890 | |
| | | |
U.S. VIRGIN ISLANDS — 0.30% | | | | | | | | | | |
Virgin Islands Public Finance Authority, 6.75% due 10/1/2037 | | NR/Baa3 | | | 500,000 | | | | 545,180 | |
| | | |
UTAH — 0.61% | | | | | | | | | | |
Herriman City, 4.75% due 11/1/2022 (Towne Center Access and Utility Improvements) | | AA-/NR | | | 1,000,000 | | | | 1,086,950 | |
| | | |
VIRGINIA — 0.85% | | | | | | | | | | |
City of Lexington IDA, 5.375% due 1/1/2028 (Residential Care Facility-Kendal at Lexington) | | NR/NR | | | 1,000,000 | | | | 1,002,060 | |
Virginia Small Business Financing Authority, 9.00% due 7/1/2039 pre-refunded 7/1/2014 (Hampton RDS Proton) | | NR/NR | | | 500,000 | | | | 520,665 | |
| | | |
WASHINGTON — 2.68% | | | | | | | | | | |
Skagit County Public Hospital District No. 1, 5.75% due 12/1/2028 (Skagit Valley Hospital) | | NR/Baa2 | | | 1,510,000 | | | | 1,571,487 | |
Washington Health Care Facilities Authority, 5.70% due 7/1/2038 (Overlake Hospital Medical Center) | | A-/A2 | | | 1,000,000 | | | | 1,064,110 | |
Washington Health Care Facilities Authority, 5.75% due 1/1/2045 (Catholic Health Initiatives) | | A+/A1 | | | 2,000,000 | | | | 2,179,020 | |
| | | | | | | | | | |
TOTAL INVESTMENTS — 84.92% (Cost $143,228,586) | | | | | | | | $ | 152,384,771 | |
OTHER ASSETS LESS LIABILITIES — 15.08% | | | | | | | | | 27,059,237 | |
| | | | | | | | | | |
NET ASSETS — 100.00% | | | | | | | | $ | 179,444,008 | |
| | | | | | | | | | |
Certified Semi-Annual Report 15
| | |
| Schedule of Investments, continued | | |
| |
Thornburg Strategic Municipal Income Fund | | March 31, 2014 (Unaudited) |
Footnote Legend
| † | Credit ratings are unaudited. Rating changes may have occurred subsequent to the reporting period end. Bonds issued with a maturity of one year or less are assigned Moody’s ratings from MIG-1 to MIG-4 and Standard and Poor’s ratings from SP-1+ to SP-3 with MIG-1 and SP-1+ being the strongest ratings. |
Portfolio Abbreviations
To simplify the listings of securities, abbreviations are used per the table below:
| | |
| ABAG | | Association of Bay Area Governments |
| ACA | | Insured by American Capital Access |
| AGM | | Insured by Assured Guaranty Municipal Corp. |
| AMBAC | | Insured by American Municipal Bond Assurance Corp. |
| AMT | | Alternative Minimum Tax |
| BAM | | Insured by Build America Mutual Insurance Co. |
| BHAC | | Insured by Berkshire Hathaway Assurance Corp. |
| CIFG | | Insured by CIFG Assurance North America Inc. |
| COP | | Certificates of Participation |
| DFA | | Development Finance Authority |
| EDA | | Economic Development Authority |
| ETM | | Escrowed to Maturity |
| FGIC | | Insured by Financial Guaranty Insurance Co. |
| GO | | General Obligation |
| HFA | | Health Facilities Authority |
| HFFA | | Health Facilities Financing Authority |
| IDA | | Industrial Development Authority |
| LOC | | Letter of Credit |
| Mtg | | Mortgage |
| Natl-Re | | Insured by National Public Finance Guarantee Corp. |
| PCR | | Pollution Control Revenue Bond |
| Q-SBLF | | Insured by Qualified School Bond Loan Fund |
| Radian | | Insured by Radian Asset Assurance |
| Syncora | | Insured by Syncora Guarantee Inc. |
| USD | | Unified School District |
See notes to financial statements.
16 Certified Semi-Annual Report
| | |
| Statement of Assets and Liabilities | | |
| |
Thornburg Strategic Municipal Income Fund | | March 31, 2014 (Unaudited) |
| | | | |
ASSETS | | | | |
Investments at value (cost $143,228,586) (Note 2) | | $ | 152,384,771 | |
Cash | | | 24,327,773 | |
Receivable for investments sold | | | 45,000 | |
Receivable for fund shares sold | | | 917,909 | |
Interest receivable | | | 2,244,650 | |
Prepaid expenses and other assets | | | 34,477 | |
| | | | |
Total Assets | | | 179,954,580 | |
| | | | |
| |
LIABILITIES | | | | |
Payable for fund shares redeemed | | | 272,259 | |
Payable to investment advisor and other affiliates (Note 3) | | | 140,598 | |
Accounts payable and accrued expenses | | | 56,129 | |
Dividends payable | | | 41,586 | |
| | | | |
Total Liabilities | | | 510,572 | |
| | | | |
| |
NET ASSETS | | $ | 179,444,008 | |
| | | | |
NET ASSETS CONSIST OF | | | | |
Undistributed net investment income | | $ | 3,622 | |
Net unrealized appreciation on investments | | | 9,156,185 | |
Accumulated net realized gain (loss) | | | 88,835 | |
Net capital paid in on shares of beneficial interest | | | 170,195,366 | |
| | | | |
| | $ | 179,444,008 | |
| | | | |
NET ASSET VALUE | | | | |
Class A Shares: | | | | |
Net asset value and redemption price per share ($59,865,416 applicable to 4,069,273 shares of beneficial interest outstanding - Note 4) | | $ | 14.71 | |
Maximum sales charge, 2.00% of offering price | | | 0.30 | |
| | | | |
Maximum offering price per share | | $ | 15.01 | |
| | | | |
| |
Class C Shares: | | | | |
Net asset value and offering price per share* ($21,312,162 applicable to 1,447,194 shares of beneficial interest outstanding - Note 4) | | $ | 14.73 | |
| | | | |
| |
Class I Shares: | | | | |
Net asset value, offering and redemption price per share ($98,266,430 applicable to 6,673,416 shares of beneficial interest outstanding - Note 4) | | $ | 14.73 | |
| | | | |
| * | Redemption price per share is equal to net asset value less any applicable contingent deferred sales charge. |
See notes to financial statements.
Certified Semi-Annual Report 17
| | |
| Statement of Operations | | |
| |
Thornburg Strategic Municipal Income Fund | | Six Months Ended March 31, 2014 (Unaudited) |
| | | | |
INVESTMENT INCOME | | | | |
Dividend income | | $ | 39,162 | |
Interest income (net of premium amortized of $414,534) | | | 3,533,891 | |
| | | | |
Total Income | | | 3,573,053 | |
| | | | |
| |
EXPENSES | | | | |
Investment advisory fees (Note 3) | | | 610,590 | |
Administration fees (Note 3) | | | | |
Class A Shares | | | 31,722 | |
Class C Shares | | | 13,175 | |
Class I Shares | | | 22,747 | |
Distribution and service fees (Note 3) | | | | |
Class A Shares | | | 63,444 | |
Class C Shares | | | 63,236 | |
Transfer agent fees | | | | |
Class A Shares | | | 14,070 | |
Class C Shares | | | 7,968 | |
Class I Shares | | | 16,455 | |
Registration and filing fees | | | | |
Class A Shares | | | 10,158 | |
Class C Shares | | | 13,032 | |
Class I Shares | | | 13,519 | |
Custodian fees (Note 3) | | | 30,175 | |
Professional fees | | | 20,375 | |
Accounting fees | | | 2,814 | |
Trustee fees | | | 3,056 | |
Other expenses | | | 11,469 | |
| | | | |
Total Expenses | | | 948,005 | |
Less: | | | | |
Expenses reimbursed by investment advisor (Note 3) | | | (40,000 | ) |
Fees paid indirectly (Note 3) | | | (775 | ) |
| | | | |
Net Expenses | | | 907,230 | |
| | | | |
Net Investment Income | | | 2,665,823 | |
| | | | |
REALIZED AND UNREALIZED GAIN (LOSS) | | | | |
Net realized gain (loss) on investments | | | 88,882 | |
Net change in unrealized appreciation (depreciation) of investments | | | 4,108,158 | |
| | | | |
Net Realized and Unrealized Gain | | | 4,197,040 | |
| | | | |
Net Increase in Net Assets Resulting from Operations | | $ | 6,862,863 | |
| | | | |
See notes to financial statements.
18 Certified Semi-Annual Report
| | |
| Statements of Changes in Net Assets | | |
| |
Thornburg Strategic Municipal Income Fund | | |
| | | | | | | | |
| | | SIX MONTHS ENDED | | | YEAR ENDED | |
| | | MARCH 31, 2014* | | | SEPTEMBER 30, 2013 | |
INCREASE (DECREASE) IN NET ASSETS FROM | | | | | | | | |
| | |
OPERATIONS | | | | | | | | |
Net investment income | | $ | 2,665,823 | | | $ | 5,198,489 | |
Net realized gain (loss) on investments | | | 88,882 | | | | 610,582 | |
Net unrealized appreciation (depreciation) on investments | | | 4,108,158 | | | | (9,694,162 | ) |
| | | | | | | | |
| | |
Net Increase (Decrease) in Net Assets Resulting from Operations | | | 6,862,863 | | | | (3,885,091 | ) |
| | |
DIVIDENDS TO SHAREHOLDERS | | | | | | | | |
From net investment income | | | | | | | | |
Class A Shares | | | (795,937 | ) | | | (1,710,530 | ) |
Class C Shares | | | (299,371 | ) | | | (600,810 | ) |
Class I Shares | | | (1,570,515 | ) | | | (2,887,149 | ) |
From realized gains | | | | | | | | |
Class A Shares | | | (189,519 | ) | | | (158,051 | ) |
Class C Shares | | | (79,000 | ) | | | (57,504 | ) |
Class I Shares | | | (342,071 | ) | | | (215,913 | ) |
| | |
FUND SHARE TRANSACTIONS (NOTE 4) | | | | | | | | |
Class A Shares | | | 6,463,270 | | | | (10,039,182 | ) |
Class C Shares | | | (498,110 | ) | | | (880,639 | ) |
Class I Shares | | | 7,008,213 | | | | 1,965,732 | |
| | | | | | | | |
| | |
Net Increase (Decrease) in Net Assets | | | 16,559,823 | | | | (18,469,137 | ) |
| | |
NET ASSETS | | | | | | | | |
Beginning of Period | | | 162,884,185 | | | | 181,353,322 | |
| | | | | | | | |
| | |
End of Period | | $ | 179,444,008 | | | $ | 162,884,185 | |
| | | | | | | | |
Undistributed net investment income | | $ | 3,622 | | | $ | 3,622 | |
See notes to financial statements.
Certified Semi-Annual Report 19
| | |
| Notes to Financial Statements | | |
| |
Thornburg Strategic Municipal Income Fund | | March 31, 2014 (Unaudited) |
NOTE 1 – ORGANIZATION
Thornburg Strategic Municipal Income Fund (the “Fund”) is a diversified series of Thornburg Investment Trust (the “Trust”). The Trust is organized as a Massachusetts business trust under a Declaration of Trust dated June 3, 1987 and is registered as a diversified, open-end management investment company under the Investment Company Act of 1940, as amended. The Fund is currently one of eighteen separate series of the Trust. Each series is considered to be a separate entity for financial reporting and tax purposes and bears expenses directly attributable to it. The Fund’s primary investment objective is to seek a high level of current income exempt from federal individual income tax.
The Fund currently offers three classes of shares of beneficial interest: Class A, Class C, and Institutional Class (“Class I”). Each class of shares of the Fund represents an interest in the same portfolio of investments, except that (i) Class A shares are sold subject to a front-end sales charge collected at the time the shares are purchased and bear a service fee, (ii) Class C shares are sold at net asset value without a sales charge at the time of purchase, but are subject to a contingent deferred sales charge upon redemption within one year of purchase, and bear both a service fee and a distribution fee, (iii) Class I shares are sold at net asset value without a sales charge at the time of purchase and may be subject to a service fee, and (iv) the respective classes may have different reinvestment privileges and conversion rights. Additionally, the Fund may allocate among its classes certain expenses, to the extent allocable to specific classes, including transfer agent fees, government registration fees, certain printing and postage costs, and administrative and legal expenses. Currently, class specific expenses of the Fund are limited to service and distribution fees, administration fees, and certain registration and transfer agent expenses.
NOTE 2 – SIGNIFICANT ACCOUNTING POLICIES
Significant accounting policies of the Trust are as follows:
Valuation Policy and Procedures: The Fund’s Trustees of the Trust (the “Trustees”) have authorized employees of the Fund’s investment advisor, acting as the Valuation and Pricing Committee (the “Committee”), to make certain valuation determinations, subject to oversight and review by the Trustees and the Audit Committee of the Trustees. The Committee and other employees of the Fund’s investment advisor administer and implement the valuation process. The Committee regularly reviews its own fair value decisions, as well as valuations, valuation techniques and services furnished by pricing services, considers circumstances in the markets which may require valuation determinations by the Committee and reviews previous valuation determinations. The Committee also reports on its activities, the performance of the pricing services and other matters to the Trustees and the Audit Committee of the Trustees.
In determining a fair value for a portfolio investment, the Committee seeks to determine the price that the Fund would reasonably expect to receive upon a sale of the investment in an orderly transaction between market participants at the measurement date. Typically, the fair value process employs standing instructions to use quoted prices in active markets or the use of independent pricing services. Less frequently, the Committee may make a fair value determination using other methods. However, because fair value prices are estimated prices, the determination of fair value for an investment may differ from the value that would be realized by the Fund upon a sale of the investment, and that difference could be material to the Fund’s financial statements. The Committee’s determination of fair value for an investment may also differ from the prices obtained by other persons (including other mutual funds) for the investment.
Valuation of Investments: Debt obligations held by the Fund have a primary over-the-counter market and are valued by an independent pricing service approved by the Trustees. The pricing service ordinarily values debt obligations at quoted bid prices. When quotations are not available, debt obligations held by the Fund are valued at evaluated prices determined by the pricing service using methods which include consideration of yields or prices of debt obligations of comparable quality, type of issue, coupon, maturity and rating, and indications as to value from dealers and general market conditions. Short-term obligations having remaining maturities of 60 days or less are ordinarily valued at amortized cost, which approximates market value.
In any case when a pricing service fails to provide a price for a debt obligation held by the Fund, the Committee determines a fair value for the debt obligation using procedures in accordance with a policy approved by the Trustees, which may include the use of a price obtained from a different independent pricing service. Additionally, in any case when management believes that a price provided by a pricing service for a debt obligation held by the Fund may be unreliable, the Committee decides whether or not to use the pricing service’s valuation or to use an alternative method to determine a fair value for the debt obligation.
Valuation Measurements: The Fund categorizes its investments based upon the inputs used in valuing those investments, according to a three-level hierarchy established by guidance from the Financial Accounting Standards Board (the “FASB”). Categorization of investments using this hierarchy is intended by the FASB to maximize the use of observable inputs and minimize the use of unobservable inputs by prioritizing that the most observable input be used when available. Observable inputs are those that market participants would use in valuing an investment based on available market data. Unobservable inputs are those that reflect assumptions about the information market participants would use in valuing an investment. An investment’s level within the hierarchy is based on the lowest level input that is deemed significant to the fair value measurement. The methodologies and relative inputs used to value investments are not necessarily indications of the risk or liquidity associated with investing in those investments.
20 Certified Semi-Annual Report
| | |
| Notes to Financial Statements, Continued | | |
| |
Thornburg Strategic Municipal Income Fund | | March 31, 2014 (Unaudited) |
Various inputs are used in determining the fair value measurement of the Fund’s investments. These inputs are generally summarized according to the three-level hierarchy below:
Level 1: Quoted prices in active markets for identical investments.
Level 2: Other direct or indirect significant observable inputs (including quoted prices for similar investments in active markets and other observable inputs, such as interest rates, prepayment rates, credit risk, etc.).
Level 3: Significant unobservable inputs, (including the Committee’s own assumptions in determining the fair value of investments), are generally applicable to investments fair valued with single broker quotes and other investments.
Portfolio investments with minimal, if any, market activity are characterized as Level 3 and are valued using significant unobservable inputs, typically including single broker quotes, which may be adjusted or unadjusted, related or comparable investments, last available transactions, and other relevant information. Valuations may also be based upon current market prices of securities that are comparable in coupon, rating, maturity and industry. An income based valuation approach would consider discounted anticipated future cash flows of the investment. Discounts may also be applied due to the nature or duration of any restrictions on the disposition of the investment. The derived value of a Level 3 investment may not represent the value which is received upon disposition.
The following table displays a summary of the fair value hierarchy measurements of the Fund’s investments as of March 31, 2014. In any instance when valuation inputs from more than one level are used to determine the fair value of a specific investment, the investment is placed in the level of the table based upon the lowest level input that is significant in determining the fair value of the investment:
| | | | | | | | | | | | | | | | |
| | | FAIR VALUE MEASUREMENTS AT MARCH 31, 2014 | |
| | | TOTAL | | | LEVEL 1 | | | LEVEL 2 | | | LEVEL 3 | |
Assets | | | | | | | | | | | | | | | | |
Investments in Securities | | | | | | | | | | | | | | | | |
Municipal Bonds | | $ | 152,384,771 | | | $ | — | | | $ | 152,384,771 | | | $ | — | |
| | | | | | | | | | | | | | | | |
Total Investments in Securities | | $ | 152,384,771 | | | $ | — | | | $ | 152,384,771 | | | $ | — | |
In accordance with the guidance prescribed in Accounting Standards Update No. 2011-04, it is the policy of the Fund to disclose transfers between levels and those underlying events which caused the movement. The Fund recognized no transfers between levels for the six months ended March 31, 2014.
Federal Income Taxes: It is the policy of the Trust to comply with the provisions of the Internal Revenue Code applicable to “regulated investment companies” and to distribute to shareholders substantially all taxable (if any) and tax exempt income of the Fund. Therefore, no provision for federal income tax is required.
Management reviews each uncertain tax position believed to be material to the preparation of the Fund’s financial statements, to assess if it is more likely than not that the position would be sustained upon examination, based upon the technical merits of the position. As of March 31, 2014, management has not identified any such position for which an asset or liability must be reflected in the Statement of Assets and Liabilities. The Fund’s tax returns remain subject to examination for three years after filing.
When-Issued and Delayed Delivery Transactions: The Fund may engage in when-issued or delayed delivery transactions. To the extent the Fund engages in such transactions, it will do so for the purpose of acquiring portfolio investments consistent with the Fund’s investment objectives and not for the purpose of investment leverage or to speculate on interest rate and/or market changes. At the time the Fund makes a commitment to purchase an investment on a when-issued or delayed delivery basis, the Fund will record the transaction and reflect the value in determining its net asset value. When effecting such transactions, assets of an amount sufficient to make payment for the portfolio investments to be purchased will be segregated on the Fund’s records on the trade date. Investments purchased on a when-issued or delayed delivery basis do not earn interest until the settlement date.
Dividends: Net investment income of the Fund is declared daily as a dividend on shares for which the Fund has received payment. Dividends are paid monthly and are reinvested in additional shares of the Fund at net asset value per share at the close of business on the dividend payment date, or at the shareholder’s option, paid in cash. Net realized capital gains, to the extent available, will be distributed at least annually.
General: Investment transactions are accounted for on a trade date basis. Interest income is accrued as earned. Premiums and discounts on investments purchased are amortized to call dates or maturity dates of the respective investments. Realized gains and losses from the sale of investments are recorded on an identified cost basis. Net investment income (other than class specific expenses) and realized and unrealized gains and losses are allocated daily to each class of shares based upon the relative net asset value of outstanding shares (or the value of the dividend-eligible shares, as appropriate) of each class of shares at the beginning of the day (after adjusting for the current capital shares activity of the respective class). Expenses common to all Funds are allocated among the Funds comprising the Trust based upon their relative net asset values or other appropriate allocation methods.
Certified Semi-Annual Report 21
| | |
| Notes to Financial Statements, Continued | | |
| |
Thornburg Strategic Municipal Income Fund | | March 31, 2014 (Unaudited) |
Guarantees and Indemnifications: Under the Trust’s organizational documents (and under separate agreements with the independent Trustees), its officers and Trustees are indemnified against certain liabilities arising out of the performance of their duties to the Fund. Additionally, in the normal course of business the Trust enters into contracts with service providers that contain general indemnification clauses. The Trust’s maximum exposure under these arrangements is unknown. However, based on experience, the Trust expects the risk of loss to be remote.
Use of Estimates: The preparation of financial statements, in conformity with United States generally accepted accounting principles, requires management to make estimates and assumptions that affect the reported amounts of assets and liabilities and the disclosure of contingent assets and liabilities at the date of the financial statements and the reported amounts of increases and decreases in net assets from operations during the reporting period. Actual amounts could differ from those estimates.
NOTE 3 – INVESTMENT ADVISORY FEE AND OTHER TRANSACTIONS WITH AFFILIATES
Pursuant to an investment advisory agreement, Thornburg Investment Management, Inc. (the “Advisor”) serves as the investment advisor and performs services for the Fund for which the fees are payable at the end of each month. For the six months ended March 31, 2014, these fees were payable at annual rates ranging from .75 of 1% to .50 of 1% per annum of the average daily net assets of the Fund depending on the Fund’s asset size. The Trust also has entered into administrative services agreements with the Advisor, whereby the Advisor will perform certain administrative services for the shareholders of each class of the Fund’s shares, and for which fees will be payable at an annual rate of up to .125 of 1% per annum of the average daily net assets attributable to each class of shares.
The Trust has an underwriting agreement with Thornburg Securities Corporation (the “Distributor,” an affiliate of the Advisor), which acts as the distributor of the Fund’s shares. For the six months ended March 31, 2014, the Distributor has advised the Fund that it earned net commissions aggregating $967 from the sale of Class A shares, and collected contingent deferred sales charges aggregating $507 from redemptions of Class C shares of the Fund.
Pursuant to a service plan under Rule 12b-1 of the Investment Company Act of 1940, the Fund may reimburse to the Advisor an amount not to exceed .25 of 1% per annum of the average daily net assets attributable to each class of shares of the Fund for payments made by the Advisor to securities dealers and other financial institutions to obtain various shareholder and distribution related services. For the six months ended March 31, 2014, there were no 12b-1 service plan fees charged for Class I shares. The Advisor may pay out of its own resources additional expenses for distribution of the Fund’s shares.
The Trust has also adopted a distribution plan pursuant to Rule 12b-1, applicable only to the Fund’s Class C shares, under which the Fund compensates the Distributor for services in promoting the sale of Class C shares of the Fund at an annual rate of up to .35 of 1% per annum of the average daily net assets attributable to Class C shares. Total fees incurred by each class of shares of the Fund under their respective service and distribution plans for the six months ended March 31, 2014, are set forth in the Statement of Operations.
The Advisor and Distributor have contractually agreed to waive fees and reimburse expenses incurred by the Fund so that actual expenses of certain share classes do not exceed specified levels. The agreement may be terminated by the Fund at any time, but may not be terminated by the Advisor or Distributor before February 1, 2015, unless the Advisor ceases to be the investment advisor to the Fund or the Distributor ceases to be the distributor of the Fund prior to that date. The Advisor and Distributor retain the right to be repaid by the Fund for fee waivers and expense reimbursements if expenses fall below the contractual limit prior to the end of the fiscal year.
For the six months ended March 31, 2014, the Advisor contractually reimbursed certain class specific expenses and administrative fees of $13,425 for Class A shares, $21,843 for Class C shares, and voluntarily reimbursed $4,732 for Class I shares.
The Trust has an agreement with the custodian bank to indirectly pay a portion of the custodian’s fees through credits earned by the Fund’s cash on deposit with the bank. This deposit agreement is an alternative to overnight investments. Custodial fees are adjusted to reflect amounts that would have been paid without this agreement, with a corresponding adjustment reflected as fees paid indirectly in the Statement of Operations. For the six months ended March 31, 2014, fees paid indirectly were $775.
Certain officers and Trustees of the Trust are also officers or directors of the Advisor and Distributor. The compensation of independent Trustees is borne by the Trust.
22 Certified Semi-Annual Report
| | |
| Notes to Financial Statements, Continued | | |
| |
Thornburg Strategic Municipal Income Fund | | March 31, 2014 (Unaudited) |
NOTE 4 – SHARES OF BENEFICIAL INTEREST
At March 31, 2014, there were an unlimited number of shares of beneficial interest authorized. Transactions in shares of beneficial interest were as follows:
| | | | | | | | | | | | | | | | |
| | | SIX MONTHS ENDED | | | YEAR ENDED | |
| | | MARCH 31, 2014 (UNAUDITED) | | | SEPTEMBER 30, 2013 (AUDITED) | |
| | | SHARES | | | AMOUNT | | | SHARES | | | AMOUNT | |
Class A Shares | | | | | | | | | | | | | | | | |
Shares sold | | | 1,195,399 | | | $ | 17,384,722 | | | | 1,268,566 | | | $ | 19,218,808 | |
Shares issued to shareholders in reinvestment of dividends | | | 65,278 | | | | 945,388 | | | | 112,412 | | | | 1,684,533 | |
Shares repurchased | | | (823,009 | ) | | | (11,866,840 | ) | | | (2,064,383 | ) | | | (30,942,523 | ) |
| | | | | | | | | | | | | | | | |
| | | | |
Net increase (decrease) | | | 437,668 | | | $ | 6,463,270 | | | | (683,405 | ) | | $ | (10,039,182 | ) |
| | | | | | | | | | | | | | | | |
| | | | |
Class C Shares | | | | | | | | | | | | | | | | |
Shares sold | | | 183,634 | | | $ | 2,658,125 | | | | 466,350 | | | $ | 7,039,591 | |
Shares issued to shareholders in reinvestment of dividends | | | 23,341 | | | | 338,236 | | | | 36,935 | | | | 553,550 | |
Shares repurchased | | | (240,959 | ) | | | (3,494,471 | ) | | | (571,287 | ) | | | (8,473,780 | ) |
| | | | | | | | | | | | | | | | |
| | | | |
Net increase (decrease) | | | (33,984 | ) | | $ | (498,110 | ) | | | (68,002 | ) | | $ | (880,639 | ) |
| | | | | | | | | | | | | | | | |
| | | | |
Class I Shares | | | | | | | | | | | | | | | | |
Shares sold | | | 1,532,527 | | | $ | 22,209,208 | | | | 2,115,021 | | | $ | 31,792,973 | |
Shares issued to shareholders in reinvestment of dividends | | | 123,563 | | | | 1,791,471 | | | | 186,468 | | | | 2,792,658 | |
Shares repurchased | | | (1,177,588 | ) | | | (16,992,466 | ) | | | (2,192,296 | ) | | | (32,619,899 | ) |
| | | | | | | | | | | | | | | | |
| | | | |
Net increase (decrease) | | | 478,502 | | | $ | 7,008,213 | | | | 109,193 | | | $ | 1,965,732 | |
| | | | | | | | | | | | | | | | |
NOTE 5 – INVESTMENT TRANSACTIONS
For the six months ended March 31, 2014, the Fund had purchase and sale transactions of investments (excluding short-term investments) of $18,666,463 and $20,237,707, respectively.
NOTE 6 – INCOME TAXES
At March 31, 2014, information on the tax components of capital was as follows:
| | | | |
Cost of investments for tax purposes | | $ | 143,228,586 | |
| | | | |
Gross unrealized appreciation on a tax basis | | $ | 9,520,870 | |
Gross unrealized depreciation on a tax basis | | | (364,685 | ) |
| | | | |
Net unrealized appreciation (depreciation) on investments (tax basis) | | $ | 9,156,185 | |
| | | | |
OTHER NOTES
Risks: The Fund’s investments subject it to risks including, but not limited to, credit risk, interest rate risk, management risk, market and economic risk, and liquidity risk. Please see the Fund’s prospectus for a discussion of the risks associated with an investment in the Fund.
Subsequent Events: Fund management believes no events have occurred between March 31, 2014 and the date of issuance of the financial statements that require adjustment to or disclosure in the accompanying financial statements.
Certified Semi-Annual Report 23
Financial Highlights
Thornburg Strategic Municipal Income Fund
| | | | | | | | | | | | | | | | | | | | | | | | | | | | | | | | | | | | | | | | | | | | | | | | | | | | | | | | | | | | |
| | | PER SHARE PERFORMANCE (FOR A SHARE OUTSTANDING THROUGHOUT THE
PERIOD)+ | | | RATIOS TO AVERAGE NET ASSETS | | | SUPPLEMENTAL DATA | |
UNLESS OTHERWISE NOTED, PERIODS ARE FISCAL YEARS ENDED SEPT. 30, | | NET ASSET
VALUE
BEGINNING
OF PERIOD | | | NET
INVESTMENT
INCOME
(LOSS) | | | NET
REALIZED
&
UNREALIZED
GAIN
(LOSS)
ON
INVESTMENTS | | | TOTAL
FROM
INVESTMENT
OPERATIONS | | | DIVIDENDS
FROM
NET
INVESTMENT
INCOME | | | DIVIDENDS
FROM
NET
REALIZED
GAINS | | | TOTAL
DIVIDENDS | | | NET
ASSET
VALUE
END
OF
PERIOD | | | NET
INVESTMENT
INCOME
(LOSS)
(%) | | | EXPENSES,
AFTER
EXPENSE
REDUCTIONS
(%) | | | EXPENSES,
AFTER
EXPENSE
REDUCTIONS
AND NET
OF
CUSTODY
CREDITS
(%) | | | EXPENSES,
BEFORE
EXPENSE
REDUCTIONS
(%) | | | TOTAL
RETURN
(%)(a) | | | PORTFOLIO
TURNOVER
RATE (%)(a) | | | NET
ASSETS
AT
END
OF
PERIOD
(THOUSANDS) | |
CLASS A SHARES | | | | | | | | | | | | | | | | | | | | | | | | | | | | | | | | | | | | | | | | | | | | | | | | | | | | | |
2014(b)(c) | | $ | 14.40 | | | | 0.23 | | | | 0.36 | | | | 0.59 | | | | (0.23 | ) | | | (0.05 | ) | | | (0.28 | ) | | $ | 14.71 | | | | 3.14 | (d) | | | 1.25 | (d) | | | 1.25 | (d) | | | 1.30 | (d) | | | 4.15 | | | | 12.27 | | | $ | 59,866 | |
2013(b) | | $ | 15.17 | | | | 0.41 | | | | (0.74 | ) | | | (0.33 | ) | | | (0.41 | ) | | | (0.03 | ) | | | (0.44 | ) | | $ | 14.40 | | | | 2.74 | | | | 1.25 | | | | 1.25 | | | | 1.31 | | | | (2.21 | ) | | | 37.42 | | | $ | 52,278 | |
2012(b) | | $ | 14.06 | | | | 0.49 | | | | 1.13 | | | | 1.62 | | | | (0.50 | ) | | | (0.01 | ) | | | (0.51 | ) | | $ | 15.17 | | | | 3.34 | | | | 1.25 | | | | 1.25 | | | | 1.31 | | | | 11.71 | | | | 12.52 | | | $ | 65,446 | |
2011(b) | | $ | 14.22 | | | | 0.59 | | | | (0.14 | ) | | | 0.45 | | | | (0.59 | ) | | | (0.02 | ) | | | (0.61 | ) | | $ | 14.06 | | | | 4.37 | | | | 1.25 | | | | 1.25 | | | | 1.38 | | | | 3.47 | | | | 19.45 | | | $ | 39,808 | |
2010(b) | | $ | 13.86 | | | | 0.60 | | | | 0.48 | | | | 1.08 | | | | (0.61 | ) | | | (0.11 | ) | | | (0.72 | ) | | $ | 14.22 | | | | 4.40 | | | | 1.25 | | | | 1.25 | | | | 1.50 | | | | 8.20 | | | | 16.26 | | | $ | 28,166 | |
2009(b)(e) | | $ | 11.94 | | | | 0.29 | | | | 1.91 | | | | 2.20 | | | | (0.28 | ) | | | — | | | | (0.28 | ) | | $ | 13.86 | | | | 4.71 | (d) | | | 1.25 | (d) | | | 1.25 | (d) | | | 2.92 | (d) | | | 18.65 | | | | 14.37 | | | $ | 11,761 | |
CLASS C SHARES | | | | | | | | | | | | | | | | | | | | | | | | | | | | | | | | | | | | | | | | | | | | | | | | | | | | | |
2014(c) | | $ | 14.41 | | | | 0.20 | | | | 0.38 | | | | 0.58 | | | | (0.21 | ) | | | (0.05 | ) | | | (0.26 | ) | | $ | 14.73 | | | | 2.84 | (d) | | | 1.55 | (d) | | | 1.55 | (d) | | | 1.76 | (d) | | | 4.07 | | | | 12.27 | | | $ | 21,312 | |
2013 | | $ | 15.18 | | | | 0.37 | | | | (0.74 | ) | | | (0.37 | ) | | | (0.37 | ) | | | (0.03 | ) | | | (0.40 | ) | | $ | 14.41 | | | | 2.44 | | | | 1.55 | | | | 1.55 | | | | 1.73 | | | | (2.50 | ) | | | 37.42 | | | $ | 21,344 | |
2012 | | $ | 14.07 | | | | 0.45 | | | | 1.12 | | | | 1.57 | | | | (0.45 | ) | | | (0.01 | ) | | | (0.46 | ) | | $ | 15.18 | | | | 3.04 | | | | 1.55 | | | | 1.55 | | | | 1.78 | | | | 11.38 | | | | 12.52 | | | $ | 23,521 | |
2011 | | $ | 14.23 | | | | 0.55 | | | | (0.14 | ) | | | 0.41 | | | | (0.55 | ) | | | (0.02 | ) | | | (0.57 | ) | | $ | 14.07 | | | | 4.07 | | | | 1.55 | | | | 1.55 | | | | 1.83 | | | | 3.16 | | | | 19.45 | | | $ | 15,344 | |
2010 | | $ | 13.87 | | | | 0.55 | | | | 0.49 | | | | 1.04 | | | | (0.57 | ) | | | (0.11 | ) | | | (0.68 | ) | | $ | 14.23 | | | | 4.05 | | | | 1.55 | | | | 1.55 | | | | 2.36 | | | | 7.88 | | | | 16.26 | | | $ | 15,261 | |
2009(e) | | $ | 11.94 | | | | 0.27 | | | | 1.93 | | | | 2.20 | | | | (0.27 | ) | | | — | | | | (0.27 | ) | | $ | 13.87 | | | | 4.40 | (d) | | | 1.55 | (d) | | | 1.55 | (d) | | | 6.40 | (d)(f) | | | 18.58 | | | | 14.37 | | | $ | 3,684 | |
CLASS I SHARES | | | | | | | | | | | | | | | | | | | | | | | | | | | | | | | | | | | | | | | | | | | | | | | | | | | | | |
2014(c) | | $ | 14.41 | | | | 0.25 | | | | 0.37 | | | | 0.62 | | | | (0.25 | ) | | | (0.05 | ) | | | (0.30 | ) | | $ | 14.73 | | | | 3.45 | (d) | | | 0.94 | (d) | | | 0.94 | (d) | | | 0.95 | (d) | | | 4.38 | | | | 12.27 | | | $ | 98,266 | |
2013 | | $ | 15.18 | | | | 0.45 | | | | (0.73 | ) | | | (0.28 | ) | | | (0.46 | ) | | | (0.03 | ) | | | (0.49 | ) | | $ | 14.41 | | | | 3.04 | | | | 0.95 | | | | 0.95 | | | | 0.96 | | | | (1.92 | ) | | | 37.42 | | | $ | 89,262 | |
2012 | | $ | 14.07 | | | | 0.53 | | | | 1.13 | | | | 1.66 | | | | (0.54 | ) | | | (0.01 | ) | | | (0.55 | ) | | $ | 15.18 | | | | 3.62 | | | | 0.95 | | | | 0.95 | | | | 0.95 | | | | 12.03 | | | | 12.52 | | | $ | 92,386 | |
2011 | | $ | 14.23 | | | | 0.63 | | | | (0.14 | ) | | | 0.49 | | | | (0.63 | ) | | | (0.02 | ) | | | (0.65 | ) | | $ | 14.07 | | | | 4.62 | | | | 0.99 | | | | 0.99 | | | | 1.03 | | | | 3.74 | | | | 19.45 | | | $ | 54,736 | |
2010 | | $ | 13.87 | | | | 0.64 | | | | 0.48 | | | | 1.12 | | | | (0.65 | ) | | | (0.11 | ) | | | (0.76 | ) | | $ | 14.23 | | | | 4.66 | | | | 0.99 | | | | 0.99 | | | | 1.11 | | | | 8.48 | | | | 16.26 | | | $ | 42,134 | |
2009(e) | | $ | 11.94 | | | | 0.31 | | | | 1.92 | | | | 2.23 | | | | (0.30 | ) | | | — | | | | (0.30 | ) | | $ | 13.87 | | | | 4.90 | (d) | | | 0.99 | (d) | | | 0.99 | (d) | | | 2.12 | (d) | | | 18.87 | | | | 14.37 | | | $ | 18,561 | |
| (a) | Not annualized for periods less than one year. |
| (b) | Sales loads are not reflected in computing total return. |
| (c) | Unaudited Six Month Period Ended March 31. |
| (e) | Fund commenced operations on April 1, 2009. |
| (f) | Due to the size of net assets and fixed expenses, ratios may appear disproportionate. |
| + | Based on weighted average shares outstanding, except for Dividends from Net Investment Income and Net Realized Gains, which are actual amount per share. |
See notes to financial statements.
| | | | |
| 24 Certified Semi-Annual Report | | | | Certified Semi-Annual Report 25 |
| | |
| Expense Example | | |
| |
Thornburg Strategic Municipal Income Fund | | March 31, 2014 (Unaudited) |
As a shareholder of the Fund, you incur two types of costs:
| | (1) | transaction costs, including |
(a) sales charges (loads) on purchase payments, for Class A shares;
(b) a deferred sales charge on redemptions of any part or all of a purchase of $1 million of Class A shares within 12 months of purchase;
(c) a deferred sales charge on redemptions of Class C shares within 12 months of purchase;
| | (2) | ongoing costs, including management fees; distribution and/or service (12b-1) fees; and other Fund expenses. |
This example is intended to help you understand your ongoing costs (in dollars) of investing in the Fund and to compare these costs with the ongoing costs of investing in other mutual funds.
The example is based on a $1,000 investment beginning on October 1, 2013, and held until March 31, 2014.
| | | | | | | | | | | | |
| | | BEGINNING | | | ENDING | | | EXPENSES PAID | |
| | | ACCOUNT VALUE | | | ACCOUNT VALUE | | | DURING PERIOD† | |
| | | 10/1/13 | | | 3/31/14 | | | 10/1/13–3/31/14 | |
Class A Shares | | | | | | | | | | | | |
Actual | | $ | 1,000.00 | | | $ | 1,041.50 | | | $ | 6.36 | |
Hypothetical* | | $ | 1,000.00 | | | $ | 1,018.70 | | | $ | 6.29 | |
Class C Shares | | | | | | | | | | | | |
Actual | | $ | 1,000.00 | | | $ | 1,040.70 | | | $ | 7.88 | |
Hypothetical* | | $ | 1,000.00 | | | $ | 1,017.21 | | | $ | 7.79 | |
Class I Shares | | | | | | | | | | | | |
Actual | | $ | 1,000.00 | | | $ | 1,043.80 | | | $ | 4.78 | |
Hypothetical* | | $ | 1,000.00 | | | $ | 1,020.25 | | | $ | 4.72 | |
| † | Expenses are equal to the annualized expense ratio for each class (A: 1.25%; C: 1.55%; I: 0.94%) multiplied by the average account value over the period, multiplied by 182/365 to reflect the one-half year period. |
| * | Hypothetical assumes a rate of return of 5% per year before expenses. |
Actual Expenses
For each class of shares, the first line of the accompanying table provides information about actual account values and actual expenses. You may use the information in this line, together with the amount you invested, to estimate the expenses that you paid over the period. Simply divide your account value by $1,000 (for example, an $8,600 account value divided by $1,000 = 8.6), then multiply the result by the number in the first line for your class of shares under the heading entitled “Expenses Paid During Period” to estimate the expenses you paid on your account during this period.
Hypothetical Example for Comparison Purposes
For each class of shares, the second line of the accompanying table provides information about hypothetical account values and hypothetical expenses based on the Fund’s actual expense ratio and an assumed rate of return of 5% per year before expenses, which is not the Fund’s actual return. The hypothetical account values and expenses may not be used to estimate the actual ending account balance or expenses you paid for the period. You may use this information to compare the ongoing costs of investing in the Fund and other funds. To do so, compare this 5% hypothetical example with the 5% hypothetical examples that appear in the shareholder reports of the other funds.
Please note that the expenses shown in the table are meant to highlight your ongoing costs only and do not reflect any transactional costs, such as sales charges (loads), redemption fees, or exchange fees. Therefore, the second line of the table for each class of shares is useful in comparing ongoing costs only, and will not help you determine the relative total costs of owning different funds. In addition, if these transactional costs were included, your costs would have been higher.
26 Certified Semi-Annual Report
| | |
| Other Information | | |
| |
Thornburg Strategic Municipal Income Fund | | March 31, 2014 (Unaudited) |
Portfolio Proxy Voting
Policies and Procedures:
The Trust has delegated to Thornburg Investment Management, Inc. (the “Advisor”) voting decisions respecting proxies for the Fund’s voting securities. The Advisor makes voting decisions in accordance with its Proxy Voting Policy. A description of the Policy is available (i) without charge, upon request, by calling the Advisor toll-free at 1-800-847-0200, (ii) on the Thornburg website at www.thornburg. com, and (iii) on the Securities and Exchange Commission’s website at www.sec.gov.
Information regarding how proxies were voted is available on or before August 31 of each year for the twelve months ending the preceding June 30. This information is available (i) without charge, upon request by calling the Advisor toll-free at 1-800-847-0200, (ii) on the Thornburg website at www.thornburg.com, and (iii) on the Securities and Exchange Commission’s website at www.sec.gov.
Availability of Quarterly Portfolio Schedule
The Fund files with the Securities and Exchange Commission schedules of its portfolio holdings on Form N-Q for the first and third quarters of each fiscal year. The Fund’s Forms N-Q are available on the Commission’s website at www.sec.gov, or may be reviewed and copied at the Commission’s Public Reference Room in Washington, D.C. Information on the operation of the Public Reference Room may be obtained by calling 1-800-SEC-0330. The Fund also makes this information available on its website at www.thornburg. com/download or upon request by calling 1-800-847-0200.
Certified Semi-Annual Report 27
Trustees’ Statement to Shareholders
Not part of the Certified Semi-Annual Report
Reissued September 15, 2013
The Trustees believe current and prospective shareholders should know how we discharge our responsibilities in supervising the Funds’ investment advisor and in reviewing the advisor’s contract for renewal. Since 2005, we have issued a statement which sets out clearly the three principal guidelines that we follow in supervising the Trust’s investment advisor on your behalf. In accordance with our customary practice, in September of this year we again reviewed our statement and concluded we should reissue this statement outlining the principal features of our supervision of the advisor’s performance of investment management services for the Funds.
We begin with the premise that each shareholder selected his or her Fund because its investments are managed by the investment advisor identified in the prospectus and in accordance with the objective and policies described in the prospectus. We realize, as each of you do, that if you believe that your Fund’s stated objective and policies no longer serve your personal investment goals, you can sell your shares and leave the Fund.
Therefore, we believe that our primary supervisory task – our principal obligation to you – is to assess the nature and quality of the advisor’s services, and to confirm that the advisor actively and competently pursues the Fund’s objective, in accordance with the policies set out in the prospectus. To do this, we meet regularly with management to review your Fund’s portfolio and to discuss the advisor’s specific actions and judgments in pursuing the Fund’s objective. We do not substitute our own judgment for the advisor’s decisions in selecting investments; the advisor is paid to exercise its informed judgment on investment decisions, and we seek to confirm, in reviewing the advisor’s performance, that the advisor is doing just that.
Second, while we are conscious of costs and the effect that costs have on shareholders’ returns, we do not seek the lowest fees or expense ratio as our sole or primary objective. We try to make sure that your Fund’s fees and costs are reasonable in relationship to the services rendered and that they are generally in line with those charged by other expert investment advisors, consistent with our belief that the Fund’s investors searched for and expect that expertise and attention and have decided to pay a reasonable price for it. We do not put the management contract “out to bid” as a matter of course, and we would not do so unless we had concluded that the advisor materially had failed to pursue the Fund’s objectives in accordance with its policies, or for other equally important reasons. We believe that any other approach would be inconsistent with your interests and contrary to your expectations when you bought shares of the Fund in the first place.
Finally, because we believe that most Thornburg Fund shareholders have invested with a long-term perspective, we try not to focus too much on the fashions of the moment and on short-term performance. The market will not favor any specific investment objective or set of policies at all times and under all economic circumstances. A fund will experience periods of both high and low returns relative to other funds and other investments. Even if one of our Funds is not favored by the market at a particular time, we believe that the advisor is nonetheless obliged to remain true to the Fund’s objective and policies, and we watch to see that it does so.
28 This page is not part of the Semi-Annual Report
Retirement and Education Accounts
Thornburg Investment Management offers retirement and education savings accounts that can help you meet a variety of planning challenges. For account applications or further information on any of the accounts below, please call 1-800-847-0200 or go to www.thornburg.com/ira. Your financial advisor can help you determine which plan is right for you.
Individual Retirement Accounts
Individual Retirement Accounts (IRAs) provide a tax-advantaged means to save money for the future. For a detailed outline of the difference between retirement accounts, see www.thornburg.com/ira. Rollovers are available. Call 1-800-847-0200 for more information.
Traditional IRAs – Contributions to Traditional IRAs are tax deductible for eligible individuals, and withdrawals are taxed as additional ordinary income. You may contribute to an IRA if you receive compensation and are under 70 1⁄2, even if you are covered by an employer retirement plan. Deductible contributions are subject to certain qualifications. Please consult your tax advisor.
Roth IRAs – Under a Roth IRA, there is no tax deduction for contributions, but there is no income tax on qualified withdrawals. For a more detailed comparison of Traditional and Roth IRAs, please see our website at www.thornburg. com/ira.
SEP IRAs – Simplified Employee Pension (SEP) IRAs are established by employers. The employer is allowed a tax deduction for contributions made to the SEP Plan and makes contributions to each eligible employee’s SEP IRA on a discretionary basis.
SIMPLE IRAs – Savings Incentive Match Plan for Employees of Small Employers (SIMPLE) is designed to give small business owners a simplified method to establish and contribute to a retirement plan for employees. The employer is allowed a tax deduction for contributions and makes either matching or non-elective contributions to each eligible employee’s SIMPLE IRA. Employees may make salary deferral contributions.
Coverdell Education Savings Account
These savings accounts are designed to provide a way to save money for higher education expenses. In an Education Savings Account, earnings and interest grow tax-free, and qualified withdrawals used to pay for eligible higher-education expenses are tax- and penalty-free.
Funds Available
The following funds are available in the accounts listed above:
| | • | | Thornburg Core Growth Fund |
| | • | | Thornburg International Value Fund |
| | • | | Thornburg International Growth Fund |
| | • | | Thornburg Developing World Fund |
| | • | | Thornburg Investment Income Builder Fund |
| | • | | Thornburg Global Opportunities Fund |
| | • | | Thornburg Low Duration Income Fund |
| | • | | Thornburg Limited Term U.S. Government Fund |
| | • | | Thornburg Limited Term Income Fund |
| | • | | Thornburg Strategic Income Fund |
This page is not part of the Semi-Annual Report 29
Firm & Philosophy

The Firm
Founded in 1982 and headquartered in Santa Fe, New Mexico, Thornburg Investment Management advises a range of active investment strategies, each offered through multiple vehicles, to serve a broad spectrum of client needs worldwide. From short-term fixed income to flexible global equity, our objective is to help clients reach their long-term financial goals via active portfolio management. As of March 31, 2014, Thornburg managed approximately $90 billion in assets.
Investment Philosophy
We seek to preserve and increase the real wealth of shareholders after accounting for inflation, taxes, and investment expenses. We’re committed to disciplined investing and managing risk in all market environments.
Portfolio Holdings Commentary
At Thornburg, we believe you should know what you own. Our website keeps investors informed of the Funds’ equity holdings. Go to www.thornburg.com/funds for equity funds holdings and commentary.
Co-Ownership of Funds
We invest side-by-side with shareholders. Our employees have invested $387 million in Thornburg products as of March 31, 2014.
30 This page is not part of the Semi-Annual Report
Thornburg Fund Family
Thornburg Equity Funds
Thornburg’s equity research uses a fundamentally driven, bottom-up, comprehensive analytical approach. Thornburg equity funds generally focus on a limited number of securities so that each holding can impact performance. The team searches for firms believed to have a promising future and seeks to buy shares of those companies at a discount to their intrinsic or long-term value.
| | • | | Thornburg Core Growth Fund |
| | • | | Thornburg International Value Fund |
| | • | | Thornburg International Growth Fund |
| | • | | Thornburg Developing World Fund |
| | • | | Thornburg Investment Income Builder Fund |
| | • | | Thornburg Global Opportunities Fund |
Thornburg Bond Funds
Thornburg Investment Management applies a disciplined philosophy to fixed-income management. Since the launch of our first fixed-income fund over 25 years ago, we have been conducting fundamental, bottom-up research in an effort to identify bonds which we believe provide the best return for a given level of risk. We avoid leverage or complex strategies which could backfire in periods of market uncertainty.
| | • | | Thornburg Low Duration Income Fund |
| | • | | Thornburg Limited Term U.S. Government Fund |
| | • | | Thornburg Limited Term Income Fund |
| | • | | Thornburg Strategic Income Fund |
| | • | | Thornburg Low Duration Municipal Fund |
| | • | | Thornburg Limited Term Municipal Fund |
| | • | | Thornburg Intermediate Municipal Fund |
| | • | | Thornburg California Limited Term Municipal Fund |
| | • | | Thornburg New Mexico Intermediate Municipal Fund |
| | • | | Thornburg New York Intermediate Municipal Fund |
| | • | | Thornburg Strategic Municipal Income Fund |
Before investing, carefully consider the Fund’s investment goals, risks, charges, and expenses. For a prospectus or summary prospectus containing this and other information, contact your financial advisor or visit thornburg.com. Read it carefully before investing.
For additional information, please visit thornburg.com
Thornburg Investment Management, Inc. 2300 North Ridgetop Road, Santa Fe, NM 87506
This page is not part of the Semi-Annual Report 31
| | | | |
 | | Waste not, Wait not | | |

This Semi-Annual Report is submitted for the general information of shareholders of the Fund. It is not authorized for distribution to prospective investors in the Fund unless preceded or accompanied by an effective prospectus.
| | | | |
| Investment Advisor: | | Distributor: | | |
| Thornburg Investment Management® | | Thornburg Securities Corporation® | | |
| 800.847.0200 | | 800.847.0200 | | TH1979 |

2 This page is not part of the Semi-Annual Report
Important Information
The information presented on the following pages is current as of March 31, 2014. The managers’ views, portfolio holdings, and sector diversification are provided for the general information of the Fund’s shareholders; to the extent this information is historical, it should not be considered predictive of future circumstances. This material should not be deemed a recommendation to buy or sell any of the securities mentioned.
Investments in the Fund carry risks, including possible loss of principal. Bond funds have the same interest rate, inflation, and credit risks that are associated with the underlying bonds. The principal value of bonds will fluctuate relative to changes in interest rates, decreasing when interest rates rise. Unlike bonds, bond funds have ongoing fees and expenses. Please see the Fund’s Prospectus for a discussion of the risks associated with an investment in the Fund. Investments in the Fund are not FDIC insured, nor are they deposits of or guaranteed by a bank or any other entity. There is no guarantee that the Fund will meet its investment objectives. Diversification does not assure or guarantee better performance and cannot eliminate the risk of investment losses. The laddering strategy does not assure or guarantee better performance and cannot eliminate the risk of investment losses.
Performance data given at net asset value (NAV) does not take into account applicable sales charges. If the sales charges had been included, the performance would have been lower.
Minimum investments for Class I shares are higher than those for other classes. Class I shares may not be available to all investors.
| | | | |
SHARE CLASS | | NASDAQ SYMBOL | | CUSIP |
Class A | | LTCAX | | 885-215-426 |
Class C | | LTCCX | | 885-215-418 |
Class I | | LTCIX | | 885-215-392 |
Glossary
Bloomberg Economic Evaluation of States (BEES) Index – A survey, updated quarterly, that examines the pace of states’ growth following the 18-month recession that officially ended in June 2009.
Bloomberg State Stock Indices – Capitalization-weighted indices consisting of equities domiciled in each state.
BofA Merrill Lynch 1-10 Year U.S. Municipal Securities Index – A subset of the BofA Merrill Lynch U.S. Municipal Securities Index including all securities with a remaining term to final maturity less than 10 years.
Consumer Price Index (CPI) – Index that measures prices of a fixed basket of goods bought by a typical consumer, including food, transportation, shelter, utilities, clothing, medical care, entertainment and other items. The CPI, published by the Bureau of Labor Statistics in the Department of Labor, is based at 100 in 1982 and is released monthly. It is widely used as a cost-of-living benchmark to adjust Social Security payments and other payment schedules, union contracts and tax brackets. Also known as the cost-of-living index.
Unless otherwise noted, index returns reflect the reinvestment of income dividends and capital gains, if any, but do not reflect fees, brokerage commissions or other expenses of investing. Investors may not make direct investments into any index.
Alternative Minimum Tax (AMT) – A federal tax aimed at ensuring that high-income individuals, estates, trusts, and corporations pay a minimal level income tax. For individuals, the AMT is calculated by adding tax preference items to regular taxable income.
Annualized Distribution Yield – The distribution yield reflects actual distributions made to shareholders. The annualized distribution yield is calculated by summing the last 30 days of income at a given month end and annualizing to a 360-day year. The result is divided by the ending maximum offering price.
Barbell Structure – A bond investment strategy that concentrates holdings in shorter-term and longer-term maturities, forming a structure that resembles a barbell.
Basis Point (bp) – A unit equal to 1/100th of 1%. 1% = 100 basis points (bps).
Bond Credit Ratings – A bond credit rating assesses the financial ability of a debt issuer to make timely payments of principal and interest. Ratings of AAA (the highest), AA, A, and BBB are investment-grade quality. Ratings of BB, B, CCC, CC, C, and D (the lowest) are considered below investment grade, speculative grade, or junk bonds. Unless otherwise noted, the ratings listed are from Municipal Market Data and are a combination of ratings from Standard and Poor’s, Moody’s Investors Service, and Fitch Ratings.
Bullet Structure – A bond investment strategy that concentrates holdings in intermediate-term maturities and avoids shorter-term or longer-term maturities.
Credit Spread/Quality Spread – The difference between the yields of securities with different credit qualities.
Duration – A bond’s sensitivity to interest rates. Bonds with longer durations experience greater price volatility than bonds with shorter durations.
Effective Duration – A bond’s sensitivity to interest rates, incorporating the embedded option features, such as call provisions. Bonds with longer durations experience greater price volatility than bonds with shorter durations.
Fed Funds Rate – The interest rate at which a depository institution lends immediately available funds (balances at the Federal Reserve) to another depository institution overnight.
General Obligation Bond – A municipal bond backed by the credit and “taxing power” of the issuing jurisdiction rather than the revenue from a given project.
Gross Domestic Product (GDP) – A country’s income minus foreign investments: the total value of all goods and services produced within a country in a year, minus net income from investments in other countries.
Participation Rate – The number of people who are either employed or are actively looking for work. The people who are no longer actively searching for work would not be included in the participation rate. During an economic recession, many workers often get discouraged and stop looking for employment, as a result, the participation rate decreases.
Quantitative Easing – The Federal Reserve’s monetary policy intended to stimulate the U.S. economy following the recession that began in 2007/08.
Quantitative Easing 3 (QE3) – The third round of the Federal Reserve’s monetary policy intended to stimulate the U.S. economy following the recession that began in 2007/08. Announced in September 2012 and revised in December 2012, December 2013, and January 2014, the Fed intends to buy $65 billion in mortgage-backed securities and Treasuries each month until the economy improves.
SEC Yield – SEC yield is computed in accordance with SEC standards measuring the net investment income per share over a specified 30-day period expressed as a percentage of the maximum offering price of the Fund’s shares at the end of the period.
Yield Curve – A line that plots the interest rates, at a set point in time, of bonds having equal credit quality, but differing maturity dates.
This page is not part of the Semi-Annual Report 3
Thornburg California Limited Term Municipal Fund
Laddering – an All Weather Strategy
At Thornburg, our approach to management of the Fund is based on the premise that investors in the Fund seek preservation of capital along with an attractive, relatively stable yield. While aggressive bond strategies may generate stronger returns when the market is turning a blind eye towards risk, they often fail to stack up over longer periods of time.
We apply these techniques to manage risk and pursue attractive returns:
| | • | | Building a laddered portfolio. Laddering has been shown over time to mitigate reinvestment and interest rate risk. |
| | • | | Conducting in-depth fundamental research on each issue and actively monitoring positions for subsequent credit events. |
| | • | | Diversifying among a large number of generally high-quality bonds. |
| | • | | Investing on a cash-only basis without using leverage. |
Portfolio Managers

Josh Gonze Chris Ryon, CFA
Objectives and Strategies
The Fund’s primary investment objective is to obtain as high a level of current income exempt from federal and California state individual income taxes as is consistent, in the view of the Fund’s investment advisor, with preservation of capital.
The secondary goal of the Fund is to reduce expected changes in its share price compared to longer intermediate and long-term bond portfolios.
The Fund offers California investors double tax-free yields (may be subject to Alternative Minimum Tax) in a laddered municipal bond portfolio with an average maturity of normally less than five years. Laddering involves building a portfolio of bonds with staggered maturities so that a portion of the portfolio matures each year. Cash from maturing bonds, if not needed for other purposes, is invested in bonds with longer maturities at the far end of the ladder. We regard this strategy as a good compromise for managing different types of risk.
Long-Term Stability of Principal
Net Asset Value History of A Shares from February 19, 1987 through March 31, 2014
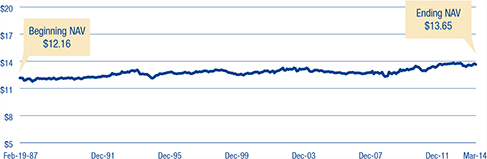
Average Annual Total Returns
For Periods Ended March 31, 2014
| | | | | | | | | | | | | | | | | | | | |
| A Shares (Incep: 2/19/87) | | 1 YR | | | 3 YRS | | | 5 YRS | | | 10 YRS | | | SINCE
INCEPTION | |
| | | | | | | | | | | | | | | | | | | | |
Without sales charge | | | 0.91 | % | | | 3.94 | % | | | 4.12 | % | | | 3.21 | % | | | 4.58 | % |
With sales charge | | | -0.61 | % | | | 3.41 | % | | | 3.81 | % | | | 3.05 | % | | | 4.52 | % |
Performance data shown represents past performance and is no guarantee of future results. Investment return and principal value will fluctuate so shares, when redeemed, may be worth more or less than their original cost. Current performance may be lower or higher than quoted. For performance current to the most recent month end, visit thornburg.com or call 800.847.0200.
The maximum sales charge for the Fund’s Class A shares is 1.50%. The total annual fund operating expense of Class A shares is 0.94%, as disclosed in the most recent Prospectus.
30-Day Yields, A Shares
As of March 31, 2014
| | | | |
Annualized Distribution Yield | | | 1.57 | % |
SEC Yield | | | 0.72 | % |
Key Portfolio Attributes
As of March 31, 2014
| | | | |
Number of Bonds | | | 299 | |
| |
Effective Duration | | | 3.7 Yrs | |
| |
Average Maturity | | | 5.0 Yrs | |
See the entire portfolio in the Schedule of Investments beginning on page 11.
4 This page is not part of the Semi-Annual Report
Thornburg’s Suite of Municipal Funds
Municipal Funds for a Range of Interest-Rate Scenarios
At Thornburg, we often say that predicting interest rates is a fool’s game. And with the Federal Reserve still heavily involved in the markets, it’s even more difficult to forecast how rates may rise than when they may rise. Will long rates rise first and short rates follow? Will long and short rates climb simultaneously?
A traditional strategy to protect oneself against interest-rate risk is to move into shorter-duration bond strategies. But the seemingly counterintuitive response of moving to longer-duration strategies can sometimes yield better results.
Diversify Across the Yield Curve
This uncertainty points to why it’s important for investors to match their investment horizon to the duration of the strategy in which they’re invested, and to diversify assets across the yield curve.
For any interest-rate scenario, Thornburg’s comprehensive suite of municipal funds gives prudent investors the ability to diversify across the yield curve.
Diversify Across the Yield Curve with Thornburg Municipal Funds
AAA General Obligation Municipal Yield Curve, as of April 2, 2014


| | | | | | | | |
| | | LOW DURATION
MUNICIPAL FUND | | LIMITED TERM
MUNICIPAL FUNDS | | INTERMEDIATE
MUNICIPAL FUNDS | | STRATEGIC MUNICIPAL
INCOME FUND |
Maturity Range (yrs) | | 1-5 | | 1-10 | | 1-20 | | 1-30 |
Portfolio Structure | | Laddered | | Laddered | | Laddered | | Flexible |
Credit Quality | | Investment Grade | | Investment Grade | | Investment Grade | | Flexible (Maximum of 50% below investment grade) |
Objective | | Seeks current income exempt from federal income taxes, consistent with preservation of capital | | Primary: Obtain as high a level of current income exempt from individual income tax as is consistent with preservation of capital Secondary: Reduce expected changes in share price compared to longer intermediate and long-term bond portfolios | | Primary: Obtain as high a level of current income exempt from individual income tax as is consistent with preservation of capital Secondary: Reduce expected changes in share price compared to long-term bond portfolios | | Seeks a high level of current income exempt from federal individual income tax |
This page is not part of the Semi-Annual Report 5
2014 Certified Semi-Annual Report
Thornburg California Limited Term Municipal Fund
March 31, 2014
This report is certified under the Sarbanes-Oxley Act of 2002, which requires that public companies, including mutual funds, affirm that the information provided in their annual and semiannual shareholder reports fully and fairly represents their financial position and the results of their operations for the period presented.
6 Certified Semi-Annual Report
Letter to Shareholders
April 15, 2014
Dear Shareholder:
We are pleased to present the semi-annual report for the Thornburg California Limited Term Municipal Fund. The net asset value (NAV) of the Class A shares increased by 11 cents to $13.65 per share during the six months ended March 31, 2014. If you were with us for the entire period, you received dividends of 11.69 cents per share. If you reinvested your dividends, you received 11.73 cents per share. Dividends were lower for Class C shares and higher for Class I shares to account for varying class-specific expenses. The Class A shares of your Fund underperformed the index with a total return of 1.68% at NAV for the six months ended March 31, 2014, compared to the 1.74% total return for the BofA Merrill Lynch 1-10 Year U.S. Municipal Securities Index (BAML 1-10 Year Municipal Index). The Fund generated 1.24% more price return and 1.30% less income than the index.
The first six months of fiscal 2014 were very interesting as interest-rate changes went in various directions, depending on the maturity discussed. This period certainly highlighted the fact that interest rates do not change uniformly across the entire maturity spectrum (the yield curve).
Chart I illustrates how yields changed during the period. The gold bars show the yield changes from September 30, 2013 through December 31, 2013. Short-term yields (maturities of five years or less) moved lower, while yields in maturities from five years to 20 years moved higher by varying amounts, and longer-term maturities were flat to slightly lower. It is good to remember the tone of the market during that period. Most market commentators believed the stock market and yields were going in the same direction: up. The blue bars show the yield changes from December 31, 2013 through March 31, 2014. Again, yield changes were not uniform across the yield curve. This time, after the new U.S. Federal Reserve Chair Janet Yellen hinted that short-term interest rates may eventually need to increase, short-term yields increased and long-term yields decreased.
Investors may wonder how best to protect themselves from these changes. One way to hedge this risk is to own securities or mutual funds that spread their investments across the different segments of the yield curve. In our opinion, that would mean owning some of our new Thornburg Low Duration Municipal Fund and our Limited Term Municipal, Intermediate Municipal, and Strategic Municipal Income Funds. The percentage ownership of each would depend on levels of risk tolerance.
Throughout the six-month period the Fund maintained a lower risk posture on interest rates than its benchmark; the average effective duration was 3.55 years compared to 4.00 years for the benchmark. This helped relative performance by 0.14% as interest rates increased during the period. The Fund’s positioning along the yield curve added 0.18% of performance relative to the benchmark. Sector allocations added 0.72% of relative performance, with the Fund being heavy on insured bonds and revenue bonds. Our overweight to lower quality bonds cost us 0.15%. Security selection added 0.04% and other factors added 0.30%.
Chart I | Changes in AAA General-Obligation Municipal Yield Curve
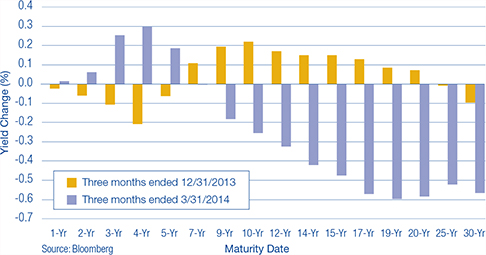
Certified Semi-Annual Report 7
Letter to Shareholders,
Continued
Chart II | Labor Market Indicators
2/28/1990 – 3/31/2014
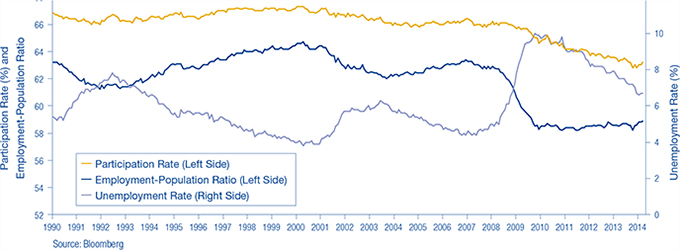
The Economy and the Federal Reserve
Gross domestic product (GDP) for the year ended December 31, 2013 came in at 2.6%, around its long-term average (to March 1990) of 2.5%. Additions to non-farm payroll employment have averaged about 185,000 per month for the six months ended March 31, 2014. The unemployment rate has declined to 6.7%, but it has been clouded by a declining labor participation rate. The percentage of the U.S. population that is employed has declined to 58.9% as of March 31, 2014, from 63.3% on March 31, 2007. The retirement of the “baby boomer” generation certainly contributes to this decline, but does not account for all of it. Chart II illustrates each of these trends from 1990.
Inflation, the bondholder’s worst enemy, has remained well controlled in the last six months. The year-over-year change in the Consumer Price Index (CPI) increased to 1.5% as of March 31, 2014 from 1.2% as of September 30, 2013. Subtracting the food and energy components to arrive at the core measure presents a picture of a well-behaved, unchanged 1.7%. The economic backdrop is one of mild expansion with low inflation. The $64,000 question is, “How long can it last?”
In January 2014, Janet Yellen replaced Ben Bernanke as Federal Reserve Chair. Her appointment as Fed Chair assured a continuation of the current Fed policies. Last year, Bernanke roiled the fixed income markets by alluding to the prospect of a decrease in the Fed’s monthly purchases of Treasury and mortgage-backed securities, the tapering of QE3. Rates went up! This year, the tapering started in actuality with the Fed reducing its purchases by $10.0 billion per meeting. Rates went down! Go figure!
Chair Yellen learned that in her new position (to borrow an old E.F. Hutton advertisement tag line), “When she speaks, markets listen.” At her first news conference, Ms. Yellen tried to clarify what “for a considerable time” meant from the last Fed Statement: “This is the kind of term it’s hard to define,” Yellen said. “Probably means something on the order of six months, or that type of thing” [after QE3 tapering ends]. This sent the debt markets, especially the short-term debt markets, lower in price and higher in yield. The results can be seen in Chart I.
8 Certified Semi-Annual Report
Letter to Shareholders,
Continued
The Municipal Market
The municipal market has performed very well over the last six months. The monthly outflows from municipal bond mutual funds have abated. The Investment Company Institute (ICI), an industry trade group, has reported that for the last three months of calendar year 2013, municipal bond mutual funds lost an average of $6.6 billion per month. For the first three months of calendar year 2014, municipal bond mutual funds experienced $1.1 billion of inflows per month. This is not a significant amount, but at least it is positive.
These cash flows would normally not support a significantly positive return environment, but when coupled with a decline in new issuance of municipal bonds, a clearer picture presents itself. The supply of new municipal bonds was down 26% for the first three months of 2014. So muted demand was met with reduced supply yielding positive results.
The overall economic health of the municipal bond market is improving, albeit unevenly. We arrive at this judgment in part through the use of the Bloomberg Economic Evaluation of States (BEES) Index, for California, which includes:
| | • | | Mortgage delinquencies – from the Mortgage Bankers Association |
| | • | | State personal income – from the Bureau of Economic Analysis |
| | • | | Tax revenue – from the U.S. Census Bureau |
| | • | | Employment – from the Bureau of Labor Statistics |
| | • | | Home prices – from the Federal Housing Finance Agency |
| | • | | Bloomberg State Stock Index |
Table I compares the changes in these various economic factors for the state of California, for the fourth quarter of 2012 through the fourth quarter of 2013 (the latest data available.)
From the fourth quarter of 2012 through the last three months of 2013, the index increased on average 6.3%. That contrasts with a national average of 2.8%, and ranged for all 50 states and the District of Columbia from a high of 8.8% to a low of negative 7.5%. For the comparable prior year period, the average was an increase of 0.2%, with a range of 9.9% to negative 4.1%. That said, state pension funds are still wrestling with some of their issues. The median funding levels have declined from 82.6% in 2007 to 68.6% in 2012 (the Pew Center on the States suggests a funding level of 80% is adequate). California’s pension funding levels was reported at 77.4% in 2012, down from 87.4% in 2007.
Table I | BEES Index: California
| | |
ECONOMIC INDICATOR | | CHANGE FROM Q4 2012
THROUGH Q4 2013 |
Overall Economic Health | | 6.3% |
Mortgage Delinquency | | -1.7% |
Personal Income | | 0.7% |
Tax Revenue | | 16.8% |
Employment | | 2.6% |
Home Prices | | 16.4% |
Equity Index | | 30.1% |
Overall Economic Health Rank | | 11 out of 51
(District of Columbia included) |
Two municipal bond market credit stories, which were not in California, (Detroit and Puerto Rico) continue to grab headlines. In Detroit’s case, some significant settlements have been announced, but they are short on specifics, including where the new cash came from, and are dependent upon state approval. As in most Chapter 9 proceedings, one should read very little into early reports because the final results may prove very different. For example, a settlement was announced between insured bondholders and the city for a recovery of about 74% of par (a bond’s original face value); a second component of the settlement was reached with several unions for 100% of existing pension obligations and a reduction in cost-of-living adjustments. The original opening offer for these parties was 20% of par for the bondholders, and between 75% and 95% of outstanding pension obligations. It appears to us that these compromises do not address the root problems.
Puerto Rico made the news in March 2014 by successfully coming to market with the largest “junk” bond deal in municipal market history. Puerto Rico, which is now rated BB, pulled off a $3.5 billion offering, which was purchased by non-traditional market participants, i.e. hedge funds. It was a 21-year maturity bond that was priced at $93.00 to yield 8.73%. We looked at the issue very closely as a potential addition to the Thornburg Strategic Municipal Income Fund and decided not to purchase it. The deal initially traded up to around $97.00, but as of this writing (close of business April 15th) it is trading at a dollar price of $87.50, a loss of almost 6.00% from the original offering price. Thornburg Funds are among the 30% of U.S. municipal mutual funds that do not own any debt from the Commonwealth of Puerto Rico.
Certified Semi-Annual Report 9
Letter to Shareholders,
Continued
Conclusion
Your Thornburg California Limited Term Municipal Fund maintains a laddered portfolio structure, which was comprised of 141 municipal obligors as of March 31, 2014. We ladder our core portfolios, because we believe that this structure tends to maximize an investor’s income. In our opinion, a laddered portfolio structure outperforms the other structures (bullet and barbell) two-thirds of the time.1 This structure effectively manages a portfolio’s yield-curve exposure by owning a roughly equal weighting of each maturity, thereby minimizing a major risk factor.
We diversify our holdings across the Fund’s investment universe. Chart I illustrates that yield changes are not uniform across the Fund’s investment universe. Laddering also reduces reinvestment risk by ensuring that a portion of the portfolio matures each year so it can be reinvested. More importantly, it frees the team to concentrate on higher value-added tasks, such as performing fundamental bottom-up credit research. It is just this type of research that has allowed us to avoid the two largest, headline-grabbing credit issues in the municipal bond market.
This year has gotten off to a strong start. We thank you for the trust you have placed in us and will keep that foremost in our minds.
Sincerely,
| | |
 | |  |
| Christopher Ryon, CFA | | Josh Gonze |
| Portfolio Manager | | Portfolio Manager |
| Managing Director | | Managing Director |
Chart III | Percent of Portfolio Maturing
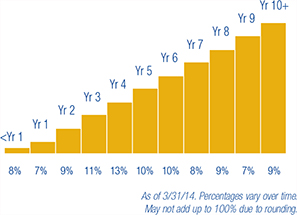
.
| 1 | For a copy of the study, go to www.thornburg.com/whyladder |
The matters discussed in this report may constitute forward-looking statements made pursuant to the safe harbor provisions of the Securities Litigation Reform Act of 1995. These include any advisor or portfolio manager prediction, assessment, analysis or outlook for individual securities, industries, investment styles, market sectors and/or markets. These statements involve risks and uncertainties. In addition to the general risks described for each fund in its current prospectus, other factors bearing on these reports include the accuracy of the advisor’s or portfolio manager’s forecasts and predictions, the appropriateness of the investment strategies designed by the advisor or portfolio manager and the ability of the advisor or portfolio manager to implement their strategies efficiently and successfully. Any one or more of these factors, as well as other risks affecting the securities markets generally, could cause the actual results of any fund to differ materially as compared to its benchmarks.
10 Certified Semi-Annual Report
| | |
| Schedule of Investments | | |
| |
Thornburg California Limited Term Municipal Fund | | March 31, 2014 (Unaudited) |
SUMMARY OF SECURITY CREDIT RATINGS†
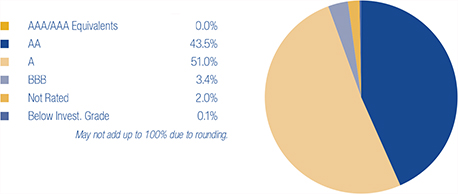
We have used ratings from Standard & Poor’s (S&P). Where S&P ratings are not available, we have used Moody’s Investors Service. Where neither rating is available, we have used ratings from Fitch Ratings. The category of investments identified as “AAA” in this graph includes investments which are pre-refunded or escrowed to maturity. Such investments are backed by an escrow or trust containing sufficient U.S. Government or U.S. Government agency securities to satisfy the timely payment of principal and interest and, therefore, are normally deemed to be equivalent to AAA-rated securities.
| | | | | | | | | | |
ISSUER-DESCRIPTION | | CREDIT RATING†
S&P/ MOODY’S | | PRINCIPAL
AMOUNT | | | VALUE | |
Alameda County COP, 5.625% due 12/1/2016 (Santa Rita Jail; Insured: AMBAC) | | AA/NR | | $ | 1,830,000 | | | $ | 2,062,904 | |
Alameda County Joint Powers Authority, 5.00% due 12/1/2018 (Alameda County Medical Center Highland Hospital) | | AA/Aa3 | | | 400,000 | | | | 465,340 | |
Alameda County Joint Powers Authority, 5.00% due 12/1/2019 (Alameda County Medical Center Highland Hospital) | | AA/Aa3 | | | 750,000 | | | | 879,360 | |
Alameda County Joint Powers Authority, 5.00% due 12/1/2020 (Alameda County Medical Center Highland Hospital) | | AA/Aa3 | | | 725,000 | | | | 850,817 | |
Alameda County Joint Powers Authority, 5.00% due 12/1/2021 (Public Facility Capital Projects) | | AA/Aa3 | | | 1,000,000 | | | | 1,163,160 | |
Alameda County Joint Powers Authority, 5.00% due 12/1/2024 (Alameda County Medical Center Highland Hospital) | | AA/Aa3 | | | 2,500,000 | | | | 2,909,525 | |
Anaheim Public Financing Authority, 5.00% due 10/1/2018 (Electric System Distribution Facilities; Insured: AMBAC) | | NR/NR | | | 780,000 | | | | 822,128 | |
Anaheim Public Financing Authority, 5.00% due 10/1/2020 (Electric System Distribution Facilities; Insured: AMBAC) | | NR/NR | | | 445,000 | | | | 463,249 | |
Anaheim Public Financing Authority, 5.00% due 10/1/2021 (Electric System Distribution Facilities; Insured: AMBAC) | | NR/NR | | | 820,000 | | | | 849,815 | |
Anaheim Public Financing Authority, 0% due 9/1/2022 (Public Improvements Project; Insured: AGM) | | AA/A2 | | | 3,000,000 | | | | 2,255,700 | |
Bay Area Toll Authority, 5.00% due 4/1/2016 (San Francisco Bay Area Toll Bridge) | | AA/Aa3 | | | 2,075,000 | | | | 2,268,016 | |
Bay Area Toll Authority, 0.76% due 4/1/2047 put 10/1/2019 (San Francisco Bay Area Toll Bridge) | | AA/Aa3 | | | 5,000,000 | | | | 4,997,600 | |
Bay Area Water Supply & Conservation Agency, 1.00% due 10/1/2014 (Regional Water System Improvements) | | AA-/Aa3 | | | 1,000,000 | | | | 1,004,370 | |
Bay Area Water Supply & Conservation Agency, 2.00% due 10/1/2015 (Regional Water System Improvements) | | AA-/Aa3 | | | 1,000,000 | | | | 1,027,020 | |
Bay Area Water Supply & Conservation Agency, 3.00% due 10/1/2016 (Regional Water System Improvements) | | AA-/Aa3 | | | 3,965,000 | | | | 4,214,002 | |
Bonita USD GO, 5.00% due 8/1/2024 (Educational Facilities) | | AA-/NR | | | 1,000,000 | | | | 1,152,360 | |
Calexico USD COP, 6.75% due 9/1/2017 | | A-/NR | | | 3,060,000 | | | | 3,276,556 | |
California Educational Facilities Authority, 5.00% due 4/1/2018 (Pitzer College) | | NR/A2 | | | 1,540,000 | | | | 1,758,819 | |
California Educational Facilities Authority, 0% due 10/1/2019 (Loyola Marymount University; Insured: Natl-Re) | | NR/A2 | | | 2,025,000 | | | | 1,764,889 | |
California Educational Facilities Authority, 5.00% due 4/1/2020 (Pitzer College) | | NR/A2 | | | 1,445,000 | | | | 1,672,371 | |
California Educational Facilities Authority, 5.00% due 4/1/2022 (Chapman University) | | NR/A2 | | | 2,000,000 | | | | 2,295,800 | |
California HFFA, 5.00% due 8/15/2014 (Cedars-Sinai Medical Center) | | NR/A1 | | | 1,500,000 | | | | 1,526,865 | |
California HFFA, 4.00% due 2/1/2016 (Community Program Developmental Disabilities; Insured: California Mtg Insurance) | | A/NR | | | 2,475,000 | | | | 2,617,882 | |
California HFFA, 5.50% due 10/1/2017 (Providence Health and Services) | | AA/Aa2 | | | 1,100,000 | | | | 1,270,643 | |
California HFFA, 5.50% due 2/1/2018 (Community Program Developmental Disabilities; Insured: California Mtg Insurance) | | A/NR | | | 2,715,000 | | | | 3,092,928 | |
California HFFA, 6.00% due 10/1/2018 (Providence Health and Services) | | AA/Aa2 | | | 1,000,000 | | | | 1,203,310 | |
California HFFA, 5.00% due 11/15/2018 (Children’s Hospital Los Angeles) | | BBB+/Baa2 | | | 1,235,000 | | | | 1,376,531 | |
California HFFA, 5.10% due 2/1/2019 (Episcopal Home; Insured: California Mtg Insurance) (ETM) | | A/NR | | | 1,230,000 | | | | 1,372,077 | |
California HFFA, 5.00% due 11/15/2020 (Children’s Hospital Los Angeles) | | BBB+/Baa2 | | | 1,190,000 | | | | 1,332,895 | |
California HFFA, 5.25% due 3/1/2022 (Dignity Health) | | A/A3 | | | 1,000,000 | | | | 1,143,400 | |
California HFFA, 5.125% due 7/1/2022 (Dignity Health) | | A/A3 | | | 1,865,000 | | | | 1,969,086 | |
California HFFA, 1.45% due 8/15/2023 put 3/15/2017 (Lucile Salter Packard Children’s Hospital) | | AA/Aa3 | | | 3,000,000 | | | | 3,048,660 | |
California HFFA, 5.00% due 11/15/2023 (Children’s Hospital Los Angeles) | | BBB+/Baa2 | | | 1,000,000 | | | | 1,094,030 | |
California HFFA, 5.00% due 7/1/2024 (St. Joseph Health System) | | AA-/A1 | | | 1,000,000 | | | | 1,168,390 | |
California HFFA, 5.00% due 7/1/2027 put 7/1/2014 (Catholic HealthCare West Health Facilities) | | A/A3 | | | 2,000,000 | | | | 2,024,180 | |
California HFFA, 5.00% due 7/1/2043 put 10/17/2017 (St. Joseph Health System) | | AA-/A1 | | | 3,000,000 | | | | 3,413,190 | |
California HFFA, 5.00% due 7/1/2043 put 10/15/2020 (St. Joseph Health System) | | AA-/A1 | | | 5,000,000 | | | | 5,815,200 | |
California Municipal Finance Authority, 5.00% due 10/1/2021 (Biola University Residential Hall and Parking Structure) | | NR/Baa1 | | | 150,000 | | | | 165,119 | |
California Municipal Finance Authority, 5.00% due 10/1/2022 (Biola University Residential Hall and Parking Structure) | | NR/Baa1 | | | 160,000 | | | | 176,216 | |
California Municipal Finance Authority, 5.00% due 10/1/2023 (Biola University Residential Hall and Parking Structure) | | NR/Baa1 | | | 125,000 | | | | 137,260 | |
California Pollution Control Financing Authority, 5.90% due 6/1/2014 (San Diego Gas & Electric; Insured: Natl-Re) | | AA-/A1 | | | 55,000 | | | | 55,521 | |
California Pollution Control Financing Authority, 5.90% due 6/1/2014 (San Diego Gas & Electric) | | A/A1 | | | 275,000 | | | | 277,604 | |
California Pollution Control Financing Authority, 5.25% due 6/1/2023 put 12/1/2017 (Solid Waste Disposal-Republic Services, Inc.) (AMT) | | BBB+/Baa3 | | | 2,820,000 | | | | 3,021,912 | |
California Pollution Control Financing Authority, 0.05% due 11/1/2026 put 4/1/2014 (Pacific Gas & Electric; LOC: JPMorgan Chase Bank) (daily demand notes) | | AA+/NR | | | 500,000 | | | | 500,011 | |
California State Department of Transportation COP, 5.25% due 3/1/2016 (Insured: Natl-Re) | | AA-/A2 | | | 1,130,000 | | | | 1,134,701 | |
Certified Semi-Annual Report 11
| | |
| Schedule of Investments, continued | | |
| |
Thornburg California Limited Term Municipal Fund | | March 31, 2014 (Unaudited) |
| | | | | | | | | | |
ISSUER-DESCRIPTION | | CREDIT RATING†
S&P/ MOODY’S | | PRINCIPAL
AMOUNT | | | VALUE | |
California State Department of Veterans Affairs, 2.75% due 12/1/2018 (Farm and Home Purchase Program) | | AA/Aa3 | | $ | 1,000,000 | | | $ | 1,029,850 | |
California State Department of Veterans Affairs, 3.00% due 12/1/2019 (Farm and Home Purchase Program) | | AA/Aa3 | | | 500,000 | | | | 517,175 | |
California State Department of Veterans Affairs GO, 4.40% due 12/1/2022 (Farm and Home Purchase Program) (AMT) | | AA/Aa2 | | | 550,000 | | | | 556,804 | |
California State Department of Water Resources, 5.00% due 5/1/2014 (DWR Power Supply Program) | | AA-/Aa2 | | | 1,000,000 | | | | 1,004,090 | |
California State Department of Water Resources, 5.00% due 5/1/2015 (DWR Power Supply Program) | | AA-/Aa2 | | | 5,000,000 | | | | 5,260,700 | |
California State Department of Water Resources, 5.00% due 5/1/2015 (DWR Power Supply Program) | | AA-/Aa2 | | | 3,400,000 | | | | 3,577,276 | |
California State Economic Recovery GO, 5.25% due 7/1/2014 (Insured: Natl-Re) | | AA/Aa2 | | | 1,045,000 | | | | 1,058,470 | |
California State Economic Recovery GO, 5.00% due 7/1/2015 (Insured: Natl-Re) | | AA/Aa2 | | | 585,000 | | | | 592,079 | |
California State Economic Recovery GO, 5.00% due 7/1/2018 | | AA/Aa2 | | | 3,000,000 | | | | 3,492,600 | |
California State Housing Finance Agency, 4.85% due 8/1/2016 (Single Family Housing; Insured: AGM) (AMT) | | AA/A2 | | | 1,000,000 | | | | 1,057,790 | |
California State Housing Finance Agency, 5.00% due 8/1/2017 (Single Family Housing; Insured: AGM) (AMT) | | AA/A2 | | | 980,000 | | | | 1,003,491 | |
California State Housing Finance Agency, 5.125% due 8/1/2018 (Single Family Housing; Insured: AGM) (AMT) | | AA/A2 | | | 1,000,000 | | | | 1,023,130 | |
California State Housing Finance Agency, 3.05% due 12/1/2019 (Multi-Family Housing; Insured: FHA) | | NR/Aa1 | | | 735,000 | | | | 745,283 | |
California State Infrastructure & Economic Development Bank, 5.25% due 8/15/2020 (King City High School) | | A/NR | | | 1,000,000 | | | | 1,124,410 | |
California State Public Works Board, 5.25% due 11/1/2014 (University of California; Insured: Natl-Re) (ETM) | | AA+/Aaa | | | 1,000,000 | | | | 1,029,620 | |
California State Public Works Board, 5.25% due 12/1/2014 (California Community Colleges) | | A-/A2 | | | 1,525,000 | | | | 1,531,268 | |
California State Public Works Board, 5.00% due 1/1/2015 (Correctional Facilities Improvements; Insured: AMBAC) | | A-/A2 | | | 2,000,000 | | | | 2,071,600 | |
California State Public Works Board, 5.00% due 11/1/2015 pre-refunded 11/1/2014 (University of California) | | AA+/Aaa | | | 1,000,000 | | | | 1,028,170 | |
California State Public Works Board, 5.00% due 11/1/2016 (California State University-J. Paul Leonard & Sutro Library) | | A-/Aa3 | | | 1,000,000 | | | | 1,112,690 | |
California State Public Works Board, 5.00% due 6/1/2020 (University of California; Insured: Natl-Re) (ETM) | | AA+/Aaa | | | 1,185,000 | | | | 1,413,444 | |
California State Public Works Board, 5.125% due 3/1/2021 (Various State Participating Agency Capital Projects) | | A-/A2 | | | 1,635,000 | | | | 1,878,746 | |
California State Public Works Board, 5.00% due 12/1/2021 (Judicial Council Projects) | | A-/A2 | | | 3,100,000 | | | | 3,641,849 | |
California State Public Works Board, 5.00% due 4/1/2022 (California School for the Deaf Riverside Campus) | | A-/A2 | | | 565,000 | | | | 661,061 | |
California State Public Works Board, 5.00% due 6/1/2022 (Yuba City Courthouse) | | A-/A2 | | | 1,950,000 | | | | 2,282,436 | |
a California State Public Works Board, 5.00% due 9/1/2022 (Correctional and Rehabilitation Facilities) | | A-/A2 | | | 3,250,000 | | | | 3,805,750 | |
California State Public Works Board, 5.00% due 11/1/2022 (Correctional and Rehabilitation Facilities) | | A-/A2 | | | 1,500,000 | | | | 1,756,815 | |
California State Public Works Board, 5.00% due 12/1/2022 (Judicial Council Projects) | | A-/A2 | | | 1,200,000 | | | | 1,384,236 | |
California State Public Works Board, 5.00% due 3/1/2023 (Judicial Council Projects) | | A-/A2 | | | 1,400,000 | | | | 1,631,574 | |
California State Public Works Board, 5.00% due 6/1/2023 (Coalinga State Hospital) | | A-/A2 | | | 7,200,000 | | | | 8,397,720 | |
a California State Public Works Board, 5.00% due 9/1/2023 (Correctional and Rehabilitation Facilities) | | A-/A2 | | | 3,600,000 | | | | 4,201,704 | |
California State Public Works Board, 5.00% due 11/1/2023 (Laboratory Facility and San Diego Courthouse) | | A-/A2 | | | 3,000,000 | | | | 3,502,710 | |
California State Public Works Board, 5.00% due 3/1/2024 (Judicial Council Projects) | | A-/A2 | | | 1,000,000 | | | | 1,150,670 | |
California State Public Works Board, 5.00% due 4/1/2024 (Correctional and Rehabilitation Facilities) | | A-/A2 | | | 3,350,000 | | | | 3,806,839 | |
a California State Public Works Board, 5.00% due 9/1/2024 (Correctional and Rehabilitation Faclilities) | | A-/A2 | | | 3,580,000 | | | | 4,179,113 | |
California State Public Works Board, 5.00% due 11/1/2024 (Laboratory Facility and San Diego Courthouse) | | A-/A2 | | | 4,000,000 | | | | 4,617,400 | |
California Statewide Communities Development Authority, 5.50% due 8/15/2014 (Enloe Medical Center; Insured: California Mtg Insurance) | | A/NR | | | 750,000 | | | | 764,100 | |
b California Statewide Communities Development Authority, 5.00% due 4/1/2019 (Kaiser Foundation Hospitals) | | A+/NR | | | 3,715,000 | | | | 4,339,120 | |
California Statewide Communities Development Authority, 5.00% due 7/1/2020 (Aspire Public Schools; LOC: PCSD Guaranty Pool I, LLC) | | NR/NR | | | 1,445,000 | | | | 1,441,821 | |
California Statewide Communities Development Authority, 3.90% due 8/1/2031 put 7/1/2014 (Kaiser Foundation Hospitals) | | A+/NR | | | 800,000 | | | | 807,152 | |
Calipatria USD GO, 0% due 8/1/2025 (Educational Facilities; Insured: ACA) | | NR/NR | | | 5,000,000 | | | | 2,572,700 | |
Carson Redevelopment Agency, 6.00% due 10/1/2019 (Project Area 1) | | A-/NR | | | 1,050,000 | | | | 1,194,333 | |
Castaic USD GO, 0% due 5/1/2018 (Insured: Natl-Re) | | AA-/NR | | | 2,295,000 | | | | 1,965,622 | |
Central Valley Financing Authority, 5.00% due 7/1/2015 (Carson Ice) | | AA-/A1 | | | 1,000,000 | | | | 1,057,810 | |
Central Valley Financing Authority, 5.25% due 7/1/2020 (Carson Ice) | | AA-/A1 | | | 500,000 | | | | 590,030 | |
Cerritos Public Financing Authority, 5.00% due 11/1/2014 (Insured: AMBAC) | | A-/NR | | | 1,260,000 | | | | 1,291,399 | |
Chabot-Las Positas Community College District GO, 0% due 8/1/2018 (Capital Improvements; Insured: AMBAC) | | A+/Aa3 | | | 2,465,000 | | | | 2,185,617 | |
City and County of San Francisco COP, 5.00% due 11/1/2016 (525 Golden Gate Avenue-Public Utilities Commission Office Project) | | AA/Aa3 | | | 200,000 | | | | 222,574 | |
City and County of San Francisco COP, 5.00% due 9/1/2018 (City Office Buildings-Multiple Properties Project; Insured: Natl- Re) | | AA/Aa3 | | | 300,000 | | | | 305,667 | |
City and County of San Francisco COP, 5.00% due 11/1/2022 (525 Golden Gate Ave-Public Utilities Commission Office Project) | | AA/Aa3 | | | 700,000 | | | | 790,223 | |
City and County of San Francisco Redevelopment Agency, 5.25% due 8/1/2014 (San Francisco Redevelopment Project; Insured: Natl-Re) | | AA-/Baa1 | | | 2,000,000 | | | | 2,008,300 | |
City and County of San Francisco Redevelopment Agency, 5.00% due 6/1/2020 (San Francisco Redevelopment Project; Insured: AGM) | | AA/A1 | | | 1,730,000 | | | | 1,963,792 | |
City of Burbank, 5.00% due 6/1/2015 (Burbank Water and Power System) | | AA-/A1 | | | 750,000 | | | | 790,958 | |
City of Burbank, 5.00% due 6/1/2016 (Burbank Water and Power System) | | AA-/A1 | | | 500,000 | | | | 547,755 | |
City of Burbank, 5.00% due 6/1/2017 (Burbank Water and Power System) | | AA-/A1 | | | 1,000,000 | | | | 1,127,260 | |
City of Burbank, 5.00% due 6/1/2018 (Burbank Water and Power System) | | AA-/A1 | | | 360,000 | | | | 414,900 | |
City of Burbank, 5.00% due 6/1/2020 (Burbank Water and Power System) | | AA-/A1 | | | 625,000 | | | | 736,038 | |
City of Chula Vista, 1.65% due 7/1/2018 (San Diego Gas & Electric Co.) | | A+/Aa2 | | | 3,000,000 | | | | 3,014,010 | |
City of Chula Vista COP, 5.25% due 3/1/2020 (Capital Facilities Project) | | AA-/NR | | | 1,300,000 | | | | 1,502,865 | |
City of Clovis, 5.00% due 3/1/2021 (Water System Facilities; Insured: BAM) | | AA/A2 | | | 550,000 | | | | 630,900 | |
12 Certified Semi-Annual Report
| | |
| Schedule of Investments, continued | | |
| |
Thornburg California Limited Term Municipal Fund | | March 31, 2014 (Unaudited) |
| | | | | | | | | | |
ISSUER-DESCRIPTION | | CREDIT RATING†
S&P/ MOODY’S | | PRINCIPAL
AMOUNT | | | VALUE | |
City of Clovis, 5.00% due 3/1/2022 (Water System Facilities; Insured: BAM) | | AA/A2 | | $ | 720,000 | | | $ | 829,296 | |
City of Clovis, 5.00% due 3/1/2023 (Water System Facilities; Insured: BAM) | | AA/A2 | | | 1,000,000 | | | | 1,156,330 | |
City of Folsom, 4.00% due 12/1/2014 (Community Facilities District No. 2) | | A+/NR | | | 755,000 | | | | 771,542 | |
City of Folsom, 5.00% due 12/1/2016 (Community Facilities District No. 2) | | A+/NR | | | 1,100,000 | | | | 1,210,517 | |
City of Folsom, 5.00% due 12/1/2018 (Community Facilities District No. 2) | | A+/NR | | | 965,000 | | | | 1,093,557 | |
City of Los Angeles COP, 3.00% due 11/1/2030 put 2/1/2018 (American Academy of Dramatic Arts; LOC: TD Bank N.A.) | | NR/Aa3 | | | 2,755,000 | | | | 2,855,530 | |
City of Manteca, 2.00% due 7/1/2014 (Water Supply System) | | AA-/A1 | | | 450,000 | | | | 452,034 | |
City of Manteca, 3.00% due 12/1/2015 (Wastewater and Sewer System) | | AA-/Aa3 | | | 280,000 | | | | 291,998 | |
City of Manteca, 4.00% due 7/1/2016 (Water Supply System) | | AA-/A1 | | | 300,000 | | | | 323,601 | |
b City of Manteca, 3.00% due 12/1/2016 (Wastewater and Sewer System) | | AA-/Aa3 | | | 520,000 | | | | 550,779 | |
City of Manteca, 4.00% due 7/1/2018 (Water Supply System) | | AA-/A1 | | | 550,000 | | | | 612,403 | |
City of Manteca, 4.00% due 12/1/2018 (Wastewater and Sewer System) | | AA-/Aa3 | | | 375,000 | | | | 417,476 | |
City of Manteca, 5.00% due 7/1/2019 (Water Supply System) | | AA-/A1 | | | 400,000 | | | | 467,552 | |
City of Manteca, 5.00% due 7/1/2021 (Water Supply System) | | AA-/A1 | | | 1,000,000 | | | | 1,170,980 | |
City of Manteca, 5.00% due 7/1/2023 (Water Supply System) | | AA-/A1 | | | 650,000 | | | | 749,502 | |
City of Moorpark Mobile Home Park, 4.90% due 5/15/2017 (Villa Del Arroyo) | | A/NR | | | 790,000 | | | | 836,610 | |
City of Porterville COP, 6.30% due 10/1/2018 (Public Service Capital Projects; Insured: AMBAC) | | NR/NR | | | 1,075,000 | | | | 1,141,069 | |
City of Roseville COP, 5.00% due 2/1/2019 pre-refunded 2/1/2015 (Electric System; Insured: Natl-Re) | | AA-/A2 | | | 850,000 | | | | 884,280 | |
City of San Jose Financing Authority, 5.00% due 6/1/2019 (Civic Center Project) | | AA/Aa3 | | | 650,000 | | | | 760,091 | |
City of San Jose Financing Authority, 5.00% due 6/1/2020 (Civic Center Project) | | AA/Aa3 | | | 600,000 | | | | 701,178 | |
City of San Jose Financing Authority, 4.00% due 6/1/2021 (Civic Center Project) | | AA/Aa3 | | | 1,000,000 | | | | 1,104,710 | |
City of San Jose Financing Authority, 5.00% due 6/1/2022 (Civic Center Project) | | AA/Aa3 | | | 745,000 | | | | 873,594 | |
City of San Jose Financing Authority, 5.00% due 6/1/2023 (Civic Center Project) | | AA/Aa3 | | | 1,000,000 | | | | 1,164,460 | |
City of San Jose Financing Authority, 5.00% due 6/1/2024 (Civic Center Project) | | AA/Aa3 | | | 750,000 | | | | 866,047 | |
City of Santa Fe Springs Community Development Commission, 5.00% due 9/1/2018 (Redevelopment Project; Insured: Natl-Re) | | AA-/Baa1 | | | 1,235,000 | | | | 1,378,383 | |
City of Torrance, 5.00% due 9/1/2020 (Torrance Memorial Medical Center) | | A/A3 | | | 1,155,000 | | | | 1,322,463 | |
City of Torrance, 6.00% due 6/1/2022 (Torrance Memorial Medical Center) | | A/A3 | | | 2,600,000 | | | | 2,610,504 | |
City of Vallejo, 5.00% due 5/1/2017 (Water Improvement Project; Insured: Natl-Re) | | AA-/Baa1 | | | 1,240,000 | | | | 1,338,617 | |
City of Whittier, 5.375% due 8/1/2014 (Solid Waste; Insured: AMBAC) | | NR/NR | | | 190,000 | | | | 190,576 | |
Colton Public Financing Authority, 4.00% due 4/1/2017 (Electric Generation Facility Project) | | NR/A2 | | | 530,000 | | | | 574,096 | |
b Colton Public Financing Authority, 4.00% due 4/1/2018 (Electric Generation Facility Project) | | NR/A2 | | | 550,000 | | | | 603,086 | |
Colton Public Financing Authority, 4.00% due 4/1/2019 (Electric Generation Facility Project) | | NR/A2 | | | 400,000 | | | | 438,892 | |
Colton Public Financing Authority, 5.00% due 4/1/2020 (Electric Generation Facility Project) | | NR/A2 | | | 410,000 | | | | 467,580 | |
Colton Public Financing Authority, 5.00% due 4/1/2021 (Electric Generation Facility Project) | | NR/A2 | | | 650,000 | | | | 738,803 | |
Colton Public Financing Authority, 5.00% due 4/1/2022 (Electric Generation Facility Project) | | NR/A2 | | | 970,000 | | | | 1,101,202 | |
Community Facilities District No. 86-1 of the Irvine USD, 5.25% due 9/1/2017 (Educational Facilities; Insured: AGM) | | AA/NR | | | 250,000 | | | | 279,860 | |
Community Redevelopment Agency of the City of Union City, 4.50% due 10/1/2020 (Community Redevelopment Project; Insured: AMBAC) | | NR/Ba1 | | | 460,000 | | | | 460,322 | |
Corona-Norco USD GO, 0% due 9/1/2017 (Insured: AGM) | | AA/Aa2 | | | 1,595,000 | | | | 1,514,724 | |
County of El Dorado Community Facilities District, 5.00% due 9/1/2019 (El Dorado Hills Development) | | A/NR | | | 1,700,000 | | | | 1,928,684 | |
County of Monterey COP, 5.00% due 8/1/2014 (Natividad Medical Center; Insured: AGM) | | AA/A1 | | | 2,000,000 | | | | 2,029,640 | |
b County of Monterey COP, 5.25% due 8/1/2021 (Natividad Medical Center; Insured: AGM) | | AA/A1 | | | 3,700,000 | | | | 4,182,665 | |
County of Stanislaus, 5.75% due 5/1/2015 (Insured: Natl-Re) | | AA-/Baa1 | | | 1,815,000 | | | | 1,911,631 | |
Delano Financing Authority, 5.00% due 12/1/2017 (Police Station and Capital Improvements) | | A-/NR | | | 1,085,000 | | | | 1,212,542 | |
Delano Financing Authority, 5.00% due 12/1/2018 (Police Station and Capital Improvements) | | A-/NR | | | 1,135,000 | | | | 1,282,698 | |
Delano Financing Authority, 5.00% due 12/1/2019 (Police Station and Capital Improvements) | | A-/NR | | | 1,195,000 | | | | 1,359,540 | |
Fillmore Public Financing Authority, 5.00% due 5/1/2016 (Water Recycling Financing Project; Insured: CIFG) | | AA/A3 | | | 735,000 | | | | 792,558 | |
Fresno County USD GO, 5.90% due 8/1/2017 (Educational Facilities; Insured: Natl-Re) | | AA-/Baa1 | | | 590,000 | | | | 682,565 | |
Fresno County USD GO, 5.90% due 8/1/2018 (Educational Facilities; Insured: Natl-Re) | | AA-/Baa1 | | | 630,000 | | | | 749,152 | |
Fresno County USD GO, 5.90% due 8/1/2019 (Educational Facilities; Insured: Natl-Re) | | AA-/Baa1 | | | 675,000 | | | | 805,626 | |
Fresno County USD GO, 5.00% due 2/1/2020 (Educational Facilities; Insured: Natl-Re) | | AA-/Baa1 | | | 2,510,000 | | | | 2,876,636 | |
Fresno County USD GO, 5.90% due 8/1/2020 (Educational Facilities; Insured: Natl-Re) | | AA-/Baa1 | | | 720,000 | | | | 869,177 | |
Fullerton Public Financing Authority, 5.00% due 9/1/2016 (Insured: AMBAC) | | A/NR | | | 1,775,000 | | | | 1,877,968 | |
Guam Power Authority, 5.00% due 10/1/2021 (Electric Power System; Insured: AGM) | | AA/A2 | | | 1,275,000 | | | | 1,443,529 | |
Hemet USD GO, 4.00% due 8/1/2018 (Insured: AGM) | | AA/NR | | | 1,335,000 | | | | 1,472,692 | |
Irvine Public Facilities & Infrastructure Authority, 3.00% due 9/2/2015 | | BBB+/NR | | | 565,000 | | | | 580,018 | |
Irvine Public Facilities & Infrastructure Authority, 3.00% due 9/2/2016 | | BBB+/NR | | | 1,290,000 | | | | 1,337,162 | |
Jurupa Public Financing Authority, 4.50% due 9/1/2018 (Community Services District-Eastvale Area; Insured: AGM) | | AA/NR | | | 870,000 | | | | 964,569 | |
Jurupa Public Financing Authority, 4.50% due 9/1/2019 (Community Services District-Eastvale Area; Insured: AGM) | | AA/NR | | | 905,000 | | | | 1,003,844 | |
Jurupa Public Financing Authority, 4.50% due 9/1/2020 (Community Services District-Eastvale Area; Insured: AGM) | | AA/NR | | | 945,000 | | | | 1,037,156 | |
Kern Community College District COP, 4.00% due 4/1/2014 | | SP-1+/NR | | | 3,000,000 | | | | 3,000,000 | |
Kern High School District GO, 3.00% due 8/1/2014 (Insured: AGM) | | A+/Aa2 | | | 610,000 | | | | 615,697 | |
Kern High School District GO, 3.00% due 8/1/2015 (Insured: AGM) | | A+/Aa2 | | | 500,000 | | | | 518,210 | |
Kern High School District GO, 4.00% due 8/1/2016 (Insured: AGM) | | A+/Aa2 | | | 500,000 | | | | 540,700 | |
Kern High School District GO, 4.00% due 8/1/2017 (Insured: AGM) | | A+/Aa2 | | | 500,000 | | | | 551,850 | |
Certified Semi-Annual Report 13
| | |
| Schedule of Investments, continued | | |
| |
Thornburg California Limited Term Municipal Fund | | March 31, 2014 (Unaudited) |
| | | | | | | | | | |
ISSUER-DESCRIPTION | | CREDIT RATING†
S&P/ MOODY’S | | PRINCIPAL
AMOUNT | | | VALUE | |
Kern High School District GO, 4.00% due 8/1/2018 (Insured: AGM) | | A+/Aa2 | | $ | 500,000 | | | $ | 558,520 | |
La Quinta Redevelopment Agency, 5.00% due 9/1/2021 (Redevelopment Project Areas No. 1 and 2) | | A+/NR | | | 1,000,000 | | | | 1,140,390 | |
La Quinta Redevelopment Agency, 5.00% due 9/1/2022 (Redevelopment Project Areas No. 1 and 2) | | A+/NR | | | 2,000,000 | | | | 2,268,980 | |
La Quinta Redevelopment Agency, 5.00% due 9/1/2023 (Redevelopment Project Areas No. 1 and 2) | | A+/NR | | | 1,500,000 | | | | 1,694,100 | |
Lodi Public Financing Authority, 3.00% due 10/1/2016 (City Police Building and Jail) | | A/NR | | | 830,000 | | | | 864,279 | |
Lodi Public Financing Authority, 5.00% due 10/1/2020 (City Police Building and Jail) | | A/NR | | | 965,000 | | | | 1,072,626 | |
Lodi Public Financing Authority, 5.00% due 10/1/2021 (City Police Building and Jail) | | A/NR | | | 1,020,000 | | | | 1,131,333 | |
Lodi Public Financing Authority, 5.00% due 10/1/2022 (City Police Building and Jail) | | A/NR | | | 1,040,000 | | | | 1,149,179 | |
Lodi Public Financing Authority, 5.00% due 10/1/2023 (City Police Building and Jail) | | A/NR | | | 1,120,000 | | | | 1,224,698 | |
Los Alamitos USD GO, 0% due 9/1/2016 (Educational Facilities) (ETM) | | SP-1+/Aa2 | | | 2,000,000 | | | | 1,974,400 | |
Los Angeles Convention & Exhibition Center Authority, 5.00% due 8/15/2016 | | A+/A2 | | | 2,100,000 | | | | 2,310,651 | |
Los Angeles Convention & Exhibition Center Authority, 5.00% due 8/15/2017 | | A+/A2 | | | 1,660,000 | | | | 1,873,459 | |
Los Angeles County Public Works Financing Authority, 5.00% due 9/1/2014 (Multiple Capital Projects; Insured: Natl-Re) | | AA-/NR | | | 2,990,000 | | | | 3,048,903 | |
Los Angeles County Public Works Financing Authority, 4.25% due 6/1/2016 (Calabasas Landfill; Insured: AMBAC) | | AA/A1 | | | 1,000,000 | | | | 1,036,320 | |
Los Angeles County Public Works Financing Authority, 5.00% due 8/1/2018 (Multiple Capital Projects) | | AA/A1 | | | 2,060,000 | | | | 2,385,089 | |
Los Angeles County Schools Regionalized Business Services Corp. COP, 0% due 8/1/2021 (Insured: AMBAC) | | NR/NR | | | 2,135,000 | | | | 1,514,185 | |
Los Angeles Department of Airports, 5.50% due 5/15/2018 (Los Angeles International Airport) (AMT) | | AA/Aa3 | | | 2,000,000 | | | | 2,332,880 | |
Los Angeles Department of Water & Power, 0.12% due 7/1/2035 put 4/1/2014 (SPA: Royal Bank of Canada) (daily demand notes) | | AA/Aa2 | | | 700,000 | | | | 700,016 | |
Los Angeles Municipal Improvement Corp., 5.00% due 11/1/2017 (Capital Improvements) | | A+/A3 | | | 3,235,000 | | | | 3,636,075 | |
Los Angeles Municipal Improvement Corp., 5.00% due 3/1/2018 (Capital Improvements) | | A+/A3 | | | 4,765,000 | | | | 5,368,725 | |
Los Angeles USD COP, 5.00% due 10/1/2014 (Information Technology Projects; Insured: AMBAC) | | A+/A1 | | | 725,000 | | | | 742,400 | |
Los Angeles USD COP, 5.00% due 10/1/2015 (Information Technology Projects; Insured: AMBAC) | | A+/A1 | | | 2,000,000 | | | | 2,141,040 | |
Los Angeles USD COP, 5.00% due 10/1/2016 (Information Technology Projects; Insured: AMBAC) | | A+/A1 | | | 425,000 | | | | 470,824 | |
Los Angeles USD COP, 5.50% due 12/1/2018 (Educational Facilities and Information Technology Projects) | | A+/A1 | | | 2,000,000 | | | | 2,355,720 | |
Lynwood USD GO, 5.00% due 8/1/2023 (Insured: AGM) | | AA/A2 | | | 1,000,000 | | | | 1,127,360 | |
Manteca USD Community Facilities District No. 1989-2, 3.00% due 9/1/2016 (Educational Facilities; Insured: AGM) | | AA/A2 | | | 410,000 | | | | 429,824 | |
Manteca USD Community Facilities District No. 1989-2, 4.00% due 9/1/2018 (Educational Facilities; Insured: AGM) | | AA/A2 | | | 500,000 | | | | 543,815 | |
Manteca USD Community Facilities District No. 1989-2, 4.00% due 9/1/2019 (Educational Facilities; Insured: AGM) | | AA/A2 | | | 870,000 | | | | 940,714 | |
Manteca USD Community Facilities District No. 1989-2, 5.00% due 9/1/2020 (Educational Facilities; Insured: AGM) | | AA/A2 | | | 1,425,000 | | | | 1,605,505 | |
Manteca USD Community Facilities District No. 1989-2, 5.00% due 9/1/2021 (Educational Facilities; Insured: AGM) | | AA/A2 | | | 750,000 | | | | 845,513 | |
Manteca USD Community Facilities District No. 1989-2, 5.00% due 9/1/2023 (Educational Facilities; Insured: AGM) | | AA/A2 | | | 500,000 | | | | 564,700 | |
Mark West Union School District GO, 4.125% due 8/1/2020 (Educational Facilities; Insured: Natl-Re) | | AA/Baa1 | | | 1,275,000 | | | | 1,278,570 | |
Milpitas Redevelopment Agency, 5.00% due 9/1/2015 (Insured: Natl-Re) | | AA-/Baa1 | | | 2,200,000 | | | | 2,208,602 | |
Modesto Irrigation District, 5.00% due 7/1/2022 (San Joaquin Valley Electric System) | | A+/A2 | | | 1,000,000 | | | | 1,175,550 | |
Mojave USD COP, 0% due 9/1/2017 (Educational Facilities; Insured: AGM) | | AA/NR | | | 1,045,000 | | | | 978,935 | |
Mojave USD COP, 0% due 9/1/2018 (Educational Facilities; Insured: AGM) | | AA/NR | | | 1,095,000 | | | | 990,778 | |
Murrieta Valley USD Public Financing Authority GO, 5.00% due 9/1/2023 (Educational Facilities; Insured: BAM) | | AA/NR | | | 1,080,000 | | | | 1,217,592 | |
North City West School Facilities Financing Authority, 5.00% due 9/1/2021 (Carmel Valley; Insured: AGM) | | AA/NR | | | 2,155,000 | | | | 2,441,141 | |
North City West School Facilities Financing Authority, 5.00% due 9/1/2022 (Carmel Valley; Insured: AGM) | | AA/NR | | | 2,260,000 | | | | 2,556,806 | |
Northern California Power Agency, 4.00% due 7/1/2015 (Hydroelectric Project) | | A+/A1 | | | 500,000 | | | | 523,965 | |
b Northern California Power Agency, 5.00% due 7/1/2016 (Hydroelectric Project) | | A+/A1 | | | 500,000 | | | | 551,700 | |
Northern California Power Agency, 5.00% due 7/1/2017 (Hydroelectric Project) | | A+/A1 | | | 100,000 | | | | 113,619 | |
Northern California Power Agency, 5.00% due 7/1/2018 (Hydroelectric Project) | | A+/A1 | | | 1,250,000 | | | | 1,450,725 | |
Northern California Power Agency, 5.00% due 6/1/2019 (Lodi Energy Center) | | A-/A2 | | | 2,340,000 | | | | 2,749,032 | |
Norwalk Redevelopment Agency, 5.00% due 10/1/2014 (Insured: Natl-Re) | | AA-/Baa1 | | | 625,000 | | | | 637,375 | |
Palomar Pomerado Health GO, 0% due 8/1/2019 (Insured: AGM) | | AA/A2 | | | 2,000,000 | | | | 1,766,760 | |
Palomar Pomerado Health GO, 0% due 8/1/2021 (Insured: Natl-Re) | | AA-/A2 | | | 2,850,000 | | | | 2,248,194 | |
Pasadena USD GO, 5.00% due 11/1/2018 pre-refunded 11/1/2015 (Insured: AGM) | | NR/Aa2 | | | 1,200,000 | | | | 1,312,824 | |
Pomona USD GO, 6.10% due 2/1/2020 (Educational Facilities; Insured: Natl-Re) | | AA-/Baa1 | | | 465,000 | | | | 560,688 | |
Redding Electrical Systems COP, 5.00% due 6/1/2020 (Insured: AGM) | | NR/A2 | | | 2,500,000 | | | | 2,803,400 | |
Redevelopment Agency of the City of San Mateo, 4.00% due 8/1/2020 (Downtown and Shoreline Area Redevelopment Projects; Insured: Syncora) | | A/NR | | | 400,000 | | | | 403,088 | |
Regents of the University of California, 4.00% due 5/15/2017 (Campus Housing and Facilities) | | AA-/Aa3 | | | 1,250,000 | | | | 1,377,087 | |
Ridgecrest Redevelopment Agency, 5.00% due 6/30/2016 (Redevelopment Project) | | A-/NR | | | 1,055,000 | | | | 1,139,558 | |
Ridgecrest Redevelopment Agency, 5.00% due 6/30/2017 (Redevelopment Project) | | A-/NR | | | 1,055,000 | | | | 1,151,321 | |
Ridgecrest Redevelopment Agency, 5.25% due 6/30/2018 (Redevelopment Project) | | A-/NR | | | 1,050,000 | | | | 1,162,150 | |
Ridgecrest Redevelopment Agency, 5.50% due 6/30/2019 (Redevelopment Project) | | A-/NR | | | 1,050,000 | | | | 1,169,049 | |
Ridgecrest Redevelopment Agency, 5.50% due 6/30/2020 (Redevelopment Project) | | A-/NR | | | 1,040,000 | | | | 1,154,005 | |
Riverside County Palm Desert Financing Authority, 6.00% due 5/1/2022 (Palm Desert Sheriff’s Station Facilities) | | AA-/A2 | | | 2,600,000 | | | | 2,934,594 | |
Rosemead Community Development Commission, 5.00% due 10/1/2015 (Redevelopment Project Area No. 1; Insured: AMBAC) | | A+/NR | | | 1,015,000 | | | | 1,077,879 | |
Rosemead Community Development Commission, 5.00% due 10/1/2016 (Redevelopment Project Area No. 1; Insured: AMBAC) | | A+/NR | | | 700,000 | | | | 761,243 | |
Roseville Natural Gas Financing Authority, 5.00% due 2/15/2017 | | A-/Baa2 | | | 1,390,000 | | | | 1,511,291 | |
Sacramento City Financing Authority, 0% due 11/1/2014 (Redevelopment Project Areas; Insured: Natl-Re) | | AA-/Baa1 | | | 3,495,000 | | | | 3,460,749 | |
14 Certified Semi-Annual Report
| | |
| Schedule of Investments, continued | | |
| |
Thornburg California Limited Term Municipal Fund | | March 31, 2014 (Unaudited) |
| | | | | | | | | | |
ISSUER-DESCRIPTION | | CREDIT RATING†
S&P/ MOODY’S | | PRINCIPAL
AMOUNT | | | VALUE | |
Sacramento City Schools Joint Power Financing Authority, 5.00% due 3/1/2021 (Sacramento City USD Educational Facility Sublease; Insured: BAM) | | AA/NR | | $ | 830,000 | | | $ | 945,337 | |
Sacramento City Schools Joint Power Financing Authority, 5.00% due 3/1/2022 (Sacramento City USD Educational Facility Sublease; Insured: BAM) | | AA/NR | | | 775,000 | | | | 886,057 | |
Sacramento City Schools Joint Power Financing Authority, 5.00% due 3/1/2023 (Sacramento City USD Educational Facility Sublease; Insured: BAM) | | AA/NR | | | 815,000 | | | | 934,960 | |
Sacramento City Schools Joint Power Financing Authority, 5.00% due 3/1/2024 (Sacramento City USD Educational Facility Sublease; Insured: BAM) | | AA/NR | | | 765,000 | | | | 874,693 | |
Sacramento City Schools Joint Power Financing Authority, 5.00% due 3/1/2025 (Sacramento City USD Educational Facility Sublease; Insured: BAM) | | AA/NR | | | 2,175,000 | | | | 2,459,033 | |
Sacramento City USD GO, 4.00% due 7/1/2019 (Educational Facilities Improvements) | | A+/A1 | | | 5,455,000 | | | | 6,041,958 | |
Sacramento City USD GO, 5.00% due 7/1/2021 (Educational Facilities Improvements) | | A+/A1 | | | 3,600,000 | | | | 4,186,908 | |
Sacramento Cogeneration Authority, 5.00% due 7/1/2015 (Procter & Gamble Project) | | AA-/A1 | | | 1,100,000 | | | | 1,163,591 | |
Sacramento Cogeneration Authority, 5.00% due 7/1/2019 (Procter & Gamble Project) | | AA-/A1 | | | 625,000 | | | | 728,156 | |
Sacramento Municipal Utility District, 5.00% due 7/1/2020 (Cosumnes Project; Insured: Natl-Re) | | AA-/A3 | | | 3,000,000 | | | | 3,232,740 | |
Salinas Valley Solid Waste Authority, 5.00% due 8/1/2023 (Insured: AGM) (AMT) | | AA/A2 | | | 1,530,000 | | | | 1,700,488 | |
San Diego Redevelopment Agency, 5.00% due 9/1/2014 (Centre City Redevelopment; Insured: AMBAC) | | NR/Baa3 | | | 200,000 | | | | 202,812 | |
San Diego Redevelopment Agency, 5.25% due 9/1/2015 (Centre City Redevelopment; Insured: AGM) | | AA/A2 | | | 1,375,000 | | | | 1,380,665 | |
San Diego Redevelopment Agency, 5.00% due 9/1/2018 (Centre City Redevelopment; Insured: AMBAC) | | NR/Baa3 | | | 3,215,000 | | | | 3,407,675 | |
San Diego Redevelopment Agency, 0% due 9/1/2019 (Centre City Redevelopment; Insured: AGM) | | AA/A2 | | | 1,910,000 | | | | 1,662,617 | |
San Diego Redevelopment Agency, 5.80% due 11/1/2021 (Horton Plaza) | | A-/Baa3 | | | 2,635,000 | | | | 2,639,769 | |
San Diego USD GO, 5.50% due 7/1/2020 (Educational System Capital Projects; Insured: Natl-Re) | | AA-/Aa3 | | | 1,390,000 | | | | 1,659,604 | |
San Francisco Bay Area Rapid Transit District, 5.00% due 7/1/2024 (Insured: Natl-Re) | | AA+/Aa2 | | | 5,675,000 | | | | 5,969,362 | |
San Francisco City & County Airports Commission, 5.00% due 5/1/2024 (San Francisco International Airport; Insured: Natl- Re) | | AA-/A1 | | | 5,000,000 | | | | 5,400,500 | |
b San Joaquin Delta Community College District GO, 0% due 8/1/2019 (Insured: AGM) | | AA/Aa2 | | | 5,000,000 | | | | 4,313,750 | |
San Jose Evergreen Community College District GO, 5.25% due 9/1/2017 (Higher Education Facilities; Insured: AMBAC) | | AA/Aa1 | | | 395,000 | | | | 403,327 | |
San Juan USD GO, 5.00% due 8/1/2014 (Sacramento County Educational Facilities) | | NR/Aa2 | | | 1,335,000 | | | | 1,356,413 | |
San Mateo County Joint Powers Authority, 5.00% due 7/15/2018 (County Capital Projects) | | AA+/Aa2 | | | 800,000 | | | | 919,384 | |
San Mateo County Transit District, 4.50% due 6/1/2022 (Transit Services; Insured: Natl-Re) | | AA/Aa2 | | | 400,000 | | | | 417,176 | |
San Mateo Flood Control District COP, 5.25% due 8/1/2017 (Colma Creek; Insured: Natl-Re) | | AA-/Baa1 | | | 820,000 | | | | 822,353 | |
San Mateo Union High School District GO, 0% due 9/1/2019 (Educational Facilities; Insured: Natl-Re) | | AA+/Aa1 | | | 2,000,000 | | | | 1,820,140 | |
Santa Ana Financing Authority, 6.25% due 7/1/2018 (Police Administration & Holding Facility; Insured: Natl-Re) | | AA-/Baa1 | | | 2,000,000 | | | | 2,352,640 | |
Santa Ana USD GO, 0% due 8/1/2020 (Insured: Natl-Re) | | AA-/Baa1 | | | 2,035,000 | | | | 1,721,040 | |
Santa Clara County Financing Authority, 4.00% due 5/15/2017 (Multiple Facilities) | | AA+/A1 | | | 1,000,000 | | | | 1,095,330 | |
Santa Monica Community College District GO, 0% due 8/1/2018 pre-refunded 8/1/2015 (College District Capital Improvements; Insured: MBIA) | | AA/Aa2 | | | 1,320,000 | | | | 1,145,628 | |
Solano County COP, 5.00% due 11/15/2016 (Health & Social Services Headquarters) | | AA-/A1 | | | 1,000,000 | | | | 1,102,370 | |
South San Francisco USD GO, 4.00% due 6/15/2018 (Educational Facilities) | | SP-1+/NR | | | 5,000,000 | | | | 5,590,600 | |
Southeast Resource Recovery Facilities Authority, 5.25% due 12/1/2017 (Insured: AMBAC) | | A+/A2 | | | 1,000,000 | | | | 1,003,890 | |
Southeast Resource Recovery Facilities Authority, 5.375% due 12/1/2018 (Insured: AMBAC) (AMT) | | A+/A2 | | | 2,000,000 | | | | 2,008,000 | |
Southern California Public Power Authority, 0% due 7/1/2015 (Multiple Transmission Projects; Insured: Natl-Re) | | AA-/Aa3 | | | 1,500,000 | | | | 1,489,545 | |
Southern California Public Power Authority, 5.15% due 7/1/2015
(Mead-Adelanto Project; Insured: AMBAC) | | NR/Aa3 | | | 450,000 | | | | 463,419 | |
Southern California Public Power Authority, 5.15% due 7/1/2015 (Mead-Phoenix Project; Insured: AMBAC) | | NR/Aa3 | | | 275,000 | | | | 283,319 | |
Southern California Public Power Authority, 5.00% due 7/1/2016 (Southern Transmission Project) | | AA-/NR | | | 2,000,000 | | | | 2,204,900 | |
State of California GO, 4.00% due 8/1/2016 (Kindergarten University Facilities) | | A/A1 | | | 500,000 | | | | 541,050 | |
State of California GO, 5.00% due 3/1/2017 (Various Capital Projects; Insured: Syncora) | | A/A1 | | | 2,860,000 | | | | 3,104,530 | |
State of California GO, 4.75% due 9/1/2018 (Various Capital Projects; Insured: AGM) | | AA/A1 | | | 365,000 | | | | 371,610 | |
State of California GO, 5.00% due 9/1/2020 (Kindergarten University Facilities) | | A/A1 | | | 2,000,000 | | | | 2,362,640 | |
State of California GO, 0.06% due 5/1/2034 put 4/1/2014 (Kindergarten University Facilities; LOC: Citibank N.A.) (daily demand notes) | | AAA/Aa2 | | | 14,500,000 | | | | 14,500,000 | |
State of California GO, 0.17% due 5/1/2034 put 4/1/2014 (Kindergarten University Facilities; LOC: Citibank N.A.) (daily demand notes) | | AAA/Aa2 | | | 5,000,000 | | | | 5,000,127 | |
a Successor Agency to the Richmond County Redevelopment Agency, 5.00% due 9/1/2022 (Insured: BAM) | | AA/NR | | | 400,000 | | | | 450,020 | |
a Successor Agency to the Richmond County Redevelopment Agency, 5.00% due 9/1/2023 (Insured: BAM) | | AA/NR | | | 400,000 | | | | 448,448 | |
a Successor Agency to the Richmond County Redevelopment Agency, 5.00% due 9/1/2024 (Insured: BAM) | | AA/NR | | | 450,000 | | | | 502,502 | |
Sweetwater Union High School District COP, 4.00% due 9/1/2014 (Rancho Del Rey Middle School; Insured: Natl-Re) | | AA-/Baa1 | | | 1,020,000 | | | | 1,033,688 | |
Tracy Area Public Facilities Financing Agency, 5.875% due 10/1/2019 (Community Facilities District No. 87) | | AA-/Baa1 | | | 590,000 | | | | 600,189 | |
Tuolumne Wind Project Authority, 5.00% due 1/1/2015 | | A+/A2 | | | 500,000 | | | | 517,435 | |
Tuolumne Wind Project Authority, 5.00% due 1/1/2018 | | A+/A2 | | | 1,690,000 | | | | 1,922,105 | |
Turlock Irrigation District, 5.00% due 1/1/2015 | | A+/A2 | | | 1,125,000 | | | | 1,164,836 | |
Turlock Irrigation District, 5.00% due 1/1/2019 | | A+/A2 | | | 1,000,000 | | | | 1,149,950 | |
Tustin Community Redevelopment Agency, 3.50% due 9/1/2014 (Public Improvements; Insured: AGM) | | AA/NR | | | 760,000 | | | | 769,713 | |
Twin Rivers USD GO, 0% due 4/1/2014 (Educational Facilities) | | SP-1/NR | | | 1,000,000 | | | | 1,000,000 | |
Ukiah USD GO, 0% due 8/1/2019 (Insured: Natl-Re) | | AA-/A1 | | | 2,000,000 | | | | 1,761,640 | |
Upper Lake Union High School District GO, 0% due 8/1/2020 (Insured: Natl-Re) | | NR/Baa1 | | | 1,050,000 | | | | 802,694 | |
Certified Semi-Annual Report 15
| | |
| Schedule of Investments, continued | | |
| |
Thornburg California Limited Term Municipal Fund | | March 31, 2014 (Unaudited) |
| | | | | | | | | | |
ISSUER-DESCRIPTION | | CREDIT RATING†
S&P/ MOODY’S | | PRINCIPAL
AMOUNT | | | VALUE | |
Ventura County Public Financing Authority, 5.00% due 11/1/2023 (Office Building Purchase and Improvements) | | AA+/Aa3 | | $ | 500,000 | | | $ | 581,975 | |
Ventura County Public Financing Authority, 5.00% due 11/1/2024 (Office Building Purchase and Improvements) | | AA+/Aa3 | | | 1,060,000 | | | | 1,216,043 | |
Virgin Islands Public Finance Authority, 5.00% due 10/1/2017 | | BBB-/Baa2 | | | 1,440,000 | | | | 1,567,483 | |
Walnut Improvement Agency, 4.00% due 3/1/2015 (City of Walnut Improvement Plan; Insured: BAM) | | AA/NR | | | 500,000 | | | | 515,000 | |
Walnut Improvement Agency, 4.00% due 3/1/2016 (City of Walnut Improvement Plan; Insured: BAM) | | AA/NR | | | 500,000 | | | | 527,360 | |
Walnut Improvement Agency, 4.00% due 3/1/2017 (City of Walnut Improvement Plan; Insured: BAM) | | AA/NR | | | 1,000,000 | | | | 1,069,520 | |
Walnut Improvement Agency, 4.00% due 3/1/2018 (City of Walnut Improvement Plan; Insured: BAM) | | AA/NR | | | 1,000,000 | | | | 1,080,620 | |
Walnut Improvement Agency, 5.00% due 3/1/2019 (City of Walnut Improvement Plan; Insured: BAM) | | AA/NR | | | 400,000 | | | | 451,532 | |
Washington USD Yolo County COP, 5.00% due 8/1/2017 (West Sacramento High School; Insured: AMBAC) | | A/NR | | | 725,000 | | | | 822,977 | |
Washington USD Yolo County COP, 5.00% due 8/1/2021 (West Sacramento High School; Insured: AMBAC) | | A/NR | | | 910,000 | | | | 985,029 | |
Washington USD Yolo County COP, 5.00% due 8/1/2022 (West Sacramento High School; Insured: AMBAC) | | A/NR | | | 2,010,000 | | | | 2,166,579 | |
Westminster Redevelopment Agency, 5.00% due 8/1/2024 (Commercial Redevelopment Project No. 1; Insured: AGM) | | AA/A3 | | | 1,205,000 | | | | 1,327,297 | |
| | | | | | | | | | |
TOTAL INVESTMENTS — 92.42% (Cost $461,385,082) | | | | | | | | $ | 476,640,907 | |
OTHER ASSETS LESS LIABILITIES — 7.58% | | | | | | | | | 39,085,865 | |
| | | | | | | | | | |
NET ASSETS — 100.00% | | | | | | | | $ | 515,726,772 | |
| | | | | | | | | | |
Footnote Legend
| † | Credit ratings are unaudited. Rating changes may have occurred subsequent to the reporting period end. Bonds issued with a maturity of one year or less are assigned Moody’s ratings from MIG-1 to MIG-4 and Standard and Poor’s ratings from SP-1+ to SP-3 with MIG-1 and SP-1+ being the strongest ratings. |
| b | Segregated as collateral for a when-issued security. |
Portfolio Abbreviations
To simplify the listings of securities, abbreviations are used per the table below:
| | |
| ACA | | Insured by American Capital Access |
| AGM | | Insured by Assured Guaranty Municipal Corp. |
| AMBAC | | Insured by American Municipal Bond Assurance Corp. |
| AMT | | Alternative Minimum Tax |
| BAM | | Build America Mutual Insurance Co. |
| CIFG | | Insured by CIFG Assurance North America Inc. |
| COP | | Certificates of Participation |
| ETM | | Escrowed to Maturity |
| FHA | | Insured by Federal Housing Administration |
| | |
| GO | | General Obligation |
| HFFA | | Health Facilities Financing Authority |
| LOC | | Letter of Credit |
| MBIA | | Insured by Municipal Bond Investors Assurance |
| Mtg | | Mortgage |
| Natl-Re | | Insured by National Public Finance Guarantee Corp. |
| SPA | | Stand-by Purchase Agreement |
| Syncora | | Insured by Syncora Guarantee Inc. |
| USD | | Unified School District |
See notes to financial statements.
16 Certified Semi-Annual Report
| | |
| Statement of Assets and Liabilities | | |
| |
Thornburg California Limited Term Municipal Fund | | March 31, 2014 (Unaudited) |
| | | | |
ASSETS | | | | |
Investments at value (cost $461,385,082) (Note 2) | | $ | 476,640,907 | |
Cash | | | 45,580,673 | |
Receivable for investments sold | | | 409,713 | |
Receivable for fund shares sold | | | 3,121,611 | |
Interest receivable | | | 4,848,702 | |
Prepaid expenses and other assets | | | 1,357 | |
| | | | |
Total Assets | | | 530,602,963 | |
| | | | |
| |
LIABILITIES | | | | |
Payable for investments purchased | | | 13,492,489 | |
Payable for fund shares redeemed | | | 807,101 | |
Payable to investment advisor and other affiliates (Note 3) | | | 312,991 | |
Accounts payable and accrued expenses | | | 45,832 | |
Dividends payable | | | 217,778 | |
| | | | |
Total Liabilities | | | 14,876,191 | |
| | | | |
| |
NET ASSETS | | $ | 515,726,772 | |
| | | | |
NET ASSETS CONSIST OF | | | | |
Undistributed net investment income | | $ | 2,404 | |
Net unrealized appreciation on investments | | | 15,255,825 | |
Accumulated net realized gain (loss) | | | (66,022 | ) |
Net capital paid in on shares of beneficial interest | | | 500,534,565 | |
| | | | |
| | $ | 515,726,772 | |
| | | | |
NET ASSET VALUE | | | | |
Class A Shares: | | | | |
Net asset value and redemption price per share
($164,976,008 applicable to 12,089,969 shares of beneficial interest outstanding - Note 4) | | $ | 13.65 | |
Maximum sales charge, 1.50% of offering price | | | 0.21 | |
| | | | |
Maximum offering price per share | | $ | 13.86 | |
| | | | |
| |
Class C Shares: | | | | |
Net asset value and offering price per share*
($59,792,073 applicable to 4,378,166 shares of beneficial interest outstanding - Note 4) | | $ | 13.66 | |
| | | | |
| |
Class I Shares: | | | | |
Net asset value, offering and redemption price per share
($290,958,691 applicable to 21,302,072 shares of beneficial interest outstanding - Note 4) | | $ | 13.66 | |
| | | | |
| * | Redemption price per share is equal to net asset value less any applicable contingent deferred sales charge. |
See notes to financial statements.
Certified Semi-Annual Report 17
| | |
| Statement of Operations | | |
| |
Thornburg California Limited Term Municipal Fund | | March 31, 2014 (Unaudited) |
| | | | |
INVESTMENT INCOME | | | | |
Interest income (net of premium amortized of $2,890,186) | | $ | 6,534,699 | |
| | | | |
| |
EXPENSES | | | | |
Investment advisory fees (Note 3) | | | 1,226,476 | |
Administration fees (Note 3) | | | | |
Class A Shares | | | 100,274 | |
Class C Shares | | | 36,859 | |
Class I Shares | | | 67,969 | |
Distribution and service fees (Note 3) | | | | |
Class A Shares | | | 200,548 | |
Class C Shares | | | 147,538 | |
Transfer agent fees | | | | |
Class A Shares | | | 19,590 | |
Class C Shares | | | 12,765 | |
Class I Shares | | | 22,837 | |
Registration and filing fees | | | | |
Class A Shares | | | 17 | |
Class C Shares | | | 17 | |
Class I Shares | | | 17 | |
Custodian fees (Note 3) | | | 52,326 | |
Professional fees | | | 15,605 | |
Accounting fees | | | 8,365 | |
Trustee fees | | | 7,398 | |
Other expenses | | | 20,360 | |
| | | | |
Total Expenses | | | 1,938,961 | |
Less: | | | | |
Fees paid indirectly (Note 3) | | | (10,521 | ) |
| | | | |
Net Expenses | | | 1,928,440 | |
| | | | |
Net Investment Income | | | 4,606,259 | |
| | | | |
REALIZED AND UNREALIZED GAIN (LOSS) | | | | |
Net realized gain (loss) on investments | | | 24,560 | |
Net change in unrealized appreciation (depreciation) of investments | | | 3,861,886 | |
| | | | |
Net Realized and Unrealized Gain | | | 3,886,446 | |
| | | | |
Net Increase in Net Assets Resulting from Operations | | $ | 8,492,705 | |
| | | | |
See notes to financial statements.
18 Certified Semi-Annual Report
| | |
| Statements of Changes in Net Assets | | |
| |
Thornburg California Limited Term Municipal Fund | | |
| | | | | | | | |
| | | SIX MONTHS ENDED
MARCH 31, 2014* | | | YEAR ENDED
SEPTEMBER 30, 2013 | |
INCREASE (DECREASE) IN NET ASSETS FROM | | | | | | | | |
| | |
OPERATIONS | | | | | | | | |
Net investment income | | $ | 4,606,259 | | | $ | 8,366,485 | |
Net realized gain (loss) on investments | | | 24,560 | | | | (90,096 | ) |
Net unrealized appreciation (depreciation) on investments | | | 3,861,886 | | | | (7,001,914 | ) |
| | | | | | | | |
| | |
Net Increase (Decrease) in Net Assets Resulting from Operations | | | 8,492,705 | | | | 1,274,475 | |
| | |
DIVIDENDS TO SHAREHOLDERS | | | | | | | | |
From net investment income | | | | | | | | |
Class A Shares | | | (1,381,929 | ) | | | (2,769,894 | ) |
Class C Shares | | | (428,510 | ) | | | (921,476 | ) |
Class I Shares | | | (2,795,820 | ) | | | (4,675,115 | ) |
From realized gains | | | | | | | | |
Class A Shares | | | — | | | | (106,242 | ) |
Class C Shares | | | — | | | | (43,151 | ) |
Class I Shares | | | — | | | | (144,116 | ) |
| | |
FUND SHARE TRANSACTIONS (NOTE 4) | | | | | | | | |
Class A Shares | | | 4,644,203 | | | | 11,413,740 | |
Class C Shares | | | (252,331 | ) | | | 1,026,904 | |
Class I Shares | | | 33,936,158 | | | | 62,667,864 | |
| | | | | | | | |
Net Increase in Net Assets | | | 42,214,476 | | | | 67,722,989 | |
| | |
NET ASSETS | | | | | | | | |
Beginning of Period | | | 473,512,296 | | | | 405,789,307 | |
| | | | | | | | |
| | |
End of Period | | $ | 515,726,772 | | | $ | 473,512,296 | |
| | | | | | | | |
Undistributed net investment income | | $ | 2,404 | | | $ | 2,404 | |
See notes to financial statements.
Certified Semi-Annual Report 19
| | |
| Notes to Financial Statements | | |
| |
Thornburg California Limited Term Municipal Fund | | March 31, 2014 (Unaudited) |
NOTE 1 – ORGANIZATION
Thornburg California Limited Term Municipal Fund (the “Fund”) is a diversified series of Thornburg Investment Trust (the “Trust”). The Trust is organized as a Massachusetts business trust under a Declaration of Trust dated June 3, 1987 and is registered as a diversified, open-end management investment company under the Investment Company Act of 1940, as amended. The Fund is currently one of eighteen separate series of the Trust. Each series is considered to be a separate entity for financial reporting and tax purposes and bears expenses directly attributable to it. The Fund’s primary investment objective is to obtain as high a level of current income exempt from federal and California state individual income tax as is consistent, in the view of the Fund’s investment advisor, with the preservation of capital. The Fund’s secondary objective is to reduce expected changes in its share price compared to longer intermediate and long-term bond portfolios.
The Fund currently offers three classes of shares of beneficial interest: Class A, Class C, and Institutional Class (“Class I”). Each class of shares of the Fund represents an interest in the same portfolio of investments, except that (i) Class A shares are sold subject to a front-end sales charge collected at the time the shares are purchased and bear a service fee, (ii) Class C shares are sold at net asset value without a sales charge at the time of purchase, but are subject to a contingent deferred sales charge upon redemption within one year of purchase, and bear both a service fee and a distribution fee, (iii) Class I shares are sold at net asset value without a sales charge at the time of purchase and may be subject to a service fee, and (iv) the respective classes may have different reinvestment privileges and conversion rights. Additionally, the Fund may allocate among its classes certain expenses, to the extent allocable to specific classes, including transfer agent fees, government registration fees, certain printing and postage costs, and administrative and legal expenses. Currently, class specific expenses of the Fund are limited to service and distribution fees, administration fees, and certain registration and transfer agent expenses.
NOTE 2 – SIGNIFICANT ACCOUNTING POLICIES
Significant accounting policies of the Trust are as follows:
Valuation Policy and Procedures: The Fund’s Trustees of the Trust (the “Trustees”) have authorized employees of the Fund’s investment advisor, acting as the Valuation and Pricing Committee (the “Committee”), to make certain valuation determinations, subject to oversight and review by the Trustees and the Audit Committee of the Trustees. The Committee and other employees of the Fund’s investment advisor administer and implement the valuation process. The Committee regularly reviews its own fair value decisions, as well as valuations, valuation techniques and services furnished by pricing services, considers circumstances in the markets which may require valuation determinations by the Committee and reviews previous valuation determinations. The Committee also reports on its activities, the performance of the pricing services and other matters to the Trustees and the Audit Committee of the Trustees.
In determining a fair value for a portfolio investment, the Committee seeks to determine the price that the Fund would reasonably expect to receive upon a sale of the investment in an orderly transaction between market participants at the measurement date. Typically, the fair value process employs standing instructions to use quoted prices in active markets or the use of independent pricing services. Less frequently, the Committee may make a fair value determination using other methods. However, because fair value prices are estimated prices, the determination of fair value for an investment may differ from the value that would be realized by the Fund upon a sale of the investment, and that difference could be material to the Fund’s financial statements. The Committee’s determination of fair value for an investment may also differ from the prices obtained by other persons (including other mutual funds) for the investment.
Valuation of Investments: Debt obligations held by the Fund have a primary over-the-counter market and are valued by an independent pricing service approved by the Trustees. The pricing service ordinarily values debt obligations at quoted bid prices. When quotations are not available, debt obligations held by the Fund are valued at evaluated prices determined by the pricing service using methods which include consideration of yields or prices of debt obligations of comparable quality, type of issue, coupon, maturity and rating, and indications as to value from dealers and general market conditions. Short-term obligations having remaining maturities of 60 days or less are ordinarily valued at amortized cost, which approximates market value.
In any case when a pricing service fails to provide a price for a debt obligation held by the Fund, the Committee determines a fair value for the debt obligation using procedures in accordance with a policy approved by the Trustees, which may include the use of a price obtained from a different independent pricing service. Additionally, in any case when management believes that a price provided by a pricing service for a debt obligation held by the Fund may be unreliable, the Committee decides whether or not to use the pricing service’s valuation or to use an alternative method to determine a fair value for the debt obligation.
Valuation Measurements: The Fund categorizes its investments based upon the inputs used in valuing those investments, according to a three-level hierarchy established by guidance from the Financial Accounting Standards Board (the “FASB”). Categorization of investments using this hierarchy is intended by the FASB to maximize the use of observable inputs and minimize the use of unobservable inputs by prioritizing that the most observable input be used when available. Observable inputs are those that market participants would use in valuing an investment based on available market data. Unobservable inputs are those that reflect assumptions about the information market participants would use in valuing an investment. An investment’s level within the hierarchy is based on the lowest
20 Certified Semi-Annual Report
| | |
| Notes to Financial Statements, Continued | | |
| |
Thornburg California Limited Term Municipal Fund | | March 31, 2014 (Unaudited) |
level input that is deemed significant to the fair value measurement. The methodologies and relative inputs used to value investments are not necessarily indications of the risk or liquidity associated with investing in those investments.
Various inputs are used in determining the fair value measurement of the Fund’s investments. These inputs are generally summarized according to the three-level hierarchy below:
Level 1: Quoted prices in active markets for identical investments.
Level 2: Other direct or indirect significant observable inputs (including quoted prices for similar investments in active markets and other observable inputs, such as interest rates, prepayment rates, credit risk, etc.).
Level 3: Significant unobservable inputs, (including the Committee’s own assumptions in determining the fair value of investments), are generally applicable to investments fair valued with single broker quotes and other investments.
Portfolio investments with minimal, if any, market activity are characterized as Level 3 and are valued using significant unobservable inputs, typically including single broker quotes, which may be adjusted or unadjusted, related or comparable investments, last available transactions, and other relevant information. Valuations may also be based upon current market prices of securities that are comparable in coupon, rating, maturity and industry. An income based valuation approach would consider discounted anticipated future cash flows of the investment. Discounts may also be applied due to the nature or duration of any restrictions on the disposition of the investment. The derived value of a Level 3 investment may not represent the value which is received upon disposition.
The following table displays a summary of the fair value hierarchy measurements of the Fund’s investments as of March 31, 2014. In any instance when valuation inputs from more than one level are used to determine the fair value of a specific investment, the investment is placed in the level of the table based upon the lowest level input that is significant in determining the fair value of the investment:
| | | | | | | | | | | | | | | | |
| | | FAIR VALUE MEASUREMENTS AT MARCH 31, 2014 | |
| | | TOTAL | | | LEVEL 1 | | | LEVEL 2 | | | LEVEL 3 | |
Assets | | | | | | | | | | | | | | | | |
Investments in Securities | | | | | | | | | | | | | | | | |
Municipal Bonds | | $ | 476,640,907 | | | $ | — | | | $ | 476,640,907 | | | $ | — | |
| | | | | | | | | | | | | | | | |
Total Investments in Securities | | $ | 476,640,907 | | | $ | — | | | $ | 476,640,907 | | | $ | — | |
In accordance with the guidance prescribed in Accounting Standards Update No. 2011-04, it is the policy of the Fund to disclose transfers between levels and those underlying events which caused the movement. The Fund recognized no transfers between levels for the six months ended March 31, 2014.
Federal Income Taxes: It is the policy of the Trust to comply with the provisions of the Internal Revenue Code applicable to “regulated investment companies” and to distribute to shareholders substantially all taxable (if any) and tax exempt income of the Fund. Therefore, no provision for federal income tax is required.
Management reviews each uncertain tax position believed to be material to the preparation of the Fund’s financial statements, to assess if it is more likely than not that the position would be sustained upon examination, based upon the technical merits of the position. As of March 31, 2014, management has not identified any such position for which an asset or liability must be reflected in the Statement of Assets and Liabilities. The Fund’s tax returns remain subject to examination for three years after filing.
When-Issued and Delayed Delivery Transactions: The Fund may engage in when-issued or delayed delivery transactions. To the extent the Fund engages in such transactions, it will do so for the purpose of acquiring portfolio investments consistent with the Fund’s investment objectives and not for the purpose of investment leverage or to speculate on interest rate and/or market changes. At the time the Fund makes a commitment to purchase an investment on a when-issued or delayed delivery basis, the Fund will record the transaction and reflect the value in determining its net asset value. When effecting such transactions, assets of an amount sufficient to make payment for the portfolio investments to be purchased will be segregated on the Fund’s records on the trade date. Investments purchased on a when-issued or delayed delivery basis do not earn interest until the settlement date.
Dividends: Net investment income of the Fund is declared daily as a dividend on shares for which the Fund has received payment. Dividends are paid monthly and are reinvested in additional shares of the Fund at net asset value per share at the close of business on the dividend payment date, or at the shareholder’s option, paid in cash. Net realized capital gains, to the extent available, will be distributed at least annually.
General: Investment transactions are accounted for on a trade date basis. Interest income is accrued as earned. Premiums and discounts on investments purchased are amortized to call dates or maturity dates of the respective investments. Realized gains and losses from the sale of investments are recorded on an identified cost basis. Net investment income (other than class specific expenses) and realized and unrealized gains and losses are allocated daily to each class of shares based upon the relative net asset value of
Certified Semi-Annual Report 21
| | |
| Notes to Financial Statements, Continued | | |
| |
Thornburg California Limited Term Municipal Fund | | March 31, 2014 (Unaudited) |
outstanding shares (or the value of the dividend-eligible shares, as appropriate) of each class of shares at the beginning of the day (after adjusting for the current capital shares activity of the respective class). Expenses common to all Funds are allocated among the Funds comprising the Trust based upon their relative net asset values or other appropriate allocation methods.
Guarantees and Indemnifications: Under the Trust’s organizational documents (and under separate agreements with the independent Trustees), its officers and Trustees are indemnified against certain liabilities arising out of the performance of their duties to the Fund. Additionally, in the normal course of business the Trust enters into contracts with service providers that contain general indemnification clauses. The Trust’s maximum exposure under these arrangements is unknown. However, based on experience, the Trust expects the risk of loss to be remote.
Use of Estimates: The preparation of financial statements, in conformity with United States generally accepted accounting principles, requires management to make estimates and assumptions that affect the reported amounts of assets and liabilities and the disclosure of contingent assets and liabilities at the date of the financial statements and the reported amounts of increases and decreases in net assets from operations during the reporting period. Actual amounts could differ from those estimates.
NOTE 3 – INVESTMENT ADVISORY FEE AND OTHER TRANSACTIONS WITH AFFILIATES
Pursuant to an investment advisory agreement, Thornburg Investment Management, Inc. (the “Advisor”) serves as the investment advisor and performs services for the Fund for which the fees are payable at the end of each month. For the six months ended March 31, 2014, these fees were payable at annual rates ranging from .50 of 1% to .225 of 1% per annum of the average daily net assets of the Fund depending on the Fund’s asset size. The Trust also has entered into administrative services agreements with the Advisor, whereby the Advisor will perform certain administrative services for the shareholders of each class of the Fund’s shares, and for which fees will be payable at an annual rate of up to .125 of 1% per annum of the average daily net assets attributable to each class of shares.
The Trust has an underwriting agreement with Thornburg Securities Corporation (the “Distributor,” an affiliate of the Advisor), which acts as the distributor of the Fund’s shares. For the six months ended March 31, 2014, the Distributor has advised the Fund that it earned $2,056 from the sale of Class A shares, and collected contingent deferred sales charges aggregating $4,026 from redemptions of Class C shares of the Fund.
Pursuant to a service plan under Rule 12b-1 of the Investment Company Act of 1940, the Fund may reimburse to the Advisor an amount not to exceed .25 of 1% per annum of the average daily net assets attributable to each class of shares of the Fund for payments made by the Advisor to securities dealers and other financial institutions to obtain various shareholder and distribution related services. For the six months ended March 31, 2014, there were no 12b-1 service plan fees charged for Class I shares. The Advisor may pay out of its own resources additional expenses for distribution of the Fund’s shares.
The Trust has also adopted a distribution plan pursuant to Rule 12b-1, applicable only to the Fund’s Class C shares, under which the Fund compensates the Distributor for services in promoting the sale of Class C shares of the Fund at an annual rate of up to .25 of 1% per annum of the average daily net assets attributable to Class C shares. Total fees incurred by each class of shares of the Fund under their respective service and distribution plans for the six months ended March 31, 2014, are set forth in the Statement of Operations.
The Trust has an agreement with the custodian bank to indirectly pay a portion of the custodian’s fees through credits earned by the Fund’s cash on deposit with the bank. This deposit agreement is an alternative to overnight investments. Custodial fees are adjusted to reflect amounts that would have been paid without this agreement, with a corresponding adjustment reflected as fees paid indirectly in the Statement of Operations. For the six months ended March 31, 2014, fees paid indirectly were $10,521.
Certain officers and Trustees of the Trust are also officers or directors of the Advisor and Distributor. The compensation of independent Trustees is borne by the Trust.
22 Certified Semi-Annual Report
| | |
| Notes to Financial Statements, Continued | | |
| |
Thornburg California Limited Term Municipal Fund | | March 31, 2014 (Unaudited) |
NOTE 4 – SHARES OF BENEFICIAL INTEREST
At March 31, 2014, there were an unlimited number of shares of beneficial interest authorized. Transactions in shares of beneficial interest were as follows:
| | | | | | | | | | | | | | | | |
| | | SIX MONTHS ENDED
MARCH 31, 2014 (UNAUDITED) | | | YEAR ENDED
SEPTEMBER 30, 2013 (AUDITED) | |
| | | SHARES | | | AMOUNT | | | SHARES | | | AMOUNT | |
Class A Shares | | | | | | | | | | | | | | | | |
Shares sold | | | 2,489,673 | | | $ | 33,831,985 | | | | 3,878,340 | | | $ | 53,027,648 | |
Shares issued to shareholders in reinvestment of dividends | | | 85,189 | | | | 1,160,397 | | | | 168,324 | | | | 2,301,198 | |
Shares repurchased | | | (2,233,659 | ) | | | (30,348,179 | ) | | | (3,219,888 | ) | | | (43,915,106 | ) |
| | | | | | | | | | | | | | | | |
| | | | |
Net increase (decrease) | | | 341,203 | | | $ | 4,644,203 | | | | 826,776 | | | $ | 11,413,740 | |
| | | | | | | | | | | | | | | | |
| | | | |
Class C Shares | | | | | | | | | | | | | | | | |
Shares sold | | | 501,165 | | | $ | 6,831,808 | | | | 1,232,884 | | | $ | 16,912,368 | |
Shares issued to shareholders in reinvestment of dividends | | | 24,464 | | | | 333,593 | | | | 53,455 | | | | 731,838 | |
Shares repurchased | | | (545,065 | ) | | | (7,417,732 | ) | | | (1,217,594 | ) | | | (16,617,302 | ) |
| | | | | | | | | | | | | | | | |
| | | | |
Net increase (decrease) | | | (19,436 | ) | | $ | (252,331 | ) | | | 68,745 | | | $ | 1,026,904 | |
| | | | | | | | | | | | | | | | |
| | | | |
Class I Shares | | | | | | | | | | | | | | | | |
Shares sold | | | 5,411,899 | | | $ | 73,657,299 | | | | 11,597,326 | | | $ | 158,667,124 | |
Shares issued to shareholders in reinvestment of dividends | | | 134,682 | | | | 1,836,725 | | | | 229,955 | | | | 3,146,002 | |
Shares repurchased | | | (3,052,436 | ) | | | (41,557,866 | ) | | | (7,267,821 | ) | | | (99,145,262 | ) |
| | | | | | | | | | | | | | | | |
| | | | |
Net increase (decrease) | | | 2,494,145 | | | $ | 33,936,158 | | | | 4,559,460 | | | $ | 62,667,864 | |
| | | | | | | | | | | | | | | | |
NOTE 5 – INVESTMENT TRANSACTIONS
For the six months ended March 31, 2014, the Fund had purchase and sale transactions of investments (excluding short-term investments) of $58,930,246 and $46,834,713, respectively.
NOTE 6 – INCOME TAXES
At March 31, 2014, information on the tax components of capital was as follows:
| | | | |
Cost of investments for tax purposes | | $ | 461,385,082 | |
| | | | |
Gross unrealized appreciation on a tax basis | | $ | 16,303,276 | |
Gross unrealized depreciation on a tax basis | | | (1,047,451 | ) |
| | | | |
Net unrealized appreciation (depreciation) on investments (tax basis) | | $ | 15,255,825 | |
| | | | |
At March 31, 2014, the Fund had deferred tax basis capital losses occurring subsequent to October 31, 2012 of $90,582. For tax purposes, such losses will be reflected in the year ending September 30, 2014.
OTHER NOTES
Risks: The Fund’s investments subject it to risks including, but not limited to, credit risk, interest rate risk, management risk, market and economic risk, liquidity risk, diversification risk, and the risks of investing primarily in the obligations of a single state. Please see the Fund’s prospectus for a discussion of the risks associated with an investment in the Fund.
Subsequent Events: Fund management believes no events have occurred between March 31, 2014 and the date of issuance of the financial statements that require adjustment to or disclosure in the accompanying financial statements.
Certified Semi-Annual Report 23
Financial Highlights
Thornburg California Limited Term Municipal Fund
| | | | | | | | | | | | | | | | | | | | | | | | | | | | | | | | | | | | | | | | | | | | | | | | | | |
| | | PER SHARE PERFORMANCE (for a share outstanding throughout the Period)+ | | | RATIOS TO AVERAGE NET ASSETS | | | SUPPLEMENTAL DATA | |
UNLESS
OTHERWISE
NOTED,
PERIODS
ARE
FISCAL
YEARS
ENDED
SEPT. 30, | | NET ASSET
VALUE
BEGINNING
OF PERIOD | | | NET
INVESTMENT
INCOME
(LOSS) | | NET
REALIZED
&
UNREALIZED
GAIN (LOSS)
ON
INVESTMENTS | | | TOTAL FROM
INVESTMENT
OPERATIONS | | DIVIDENDS
FROM NET
INVESTMENT
INCOME | | | DIVIDENDS
FROM NET
REALIZED
GAINS | | TOTAL
DIVIDENDS | | | NET
ASSET
VALUE
END
OF
PERIOD | | | NET
INVESTMENT
INCOME
(LOSS)
(%) | | | EXPENSES,
AFTER
EXPENSE
REDUCTIONS
(%) | | | EXPENSES,
AFTER
EXPENSE
REDUCTIONS
AND
NET OF
CUSTODY
CREDITS (%) | | | EXPENSES,
BEFORE
EXPENSE
REDUCTIONS
(%) | | | TOTAL
RETURN
(%)(A) | | PORTFOLIO
TURNOVER
RATE (%)(A) | | NET
ASSETS
AT END
OF
PERIOD
(THOUSANDS) | |
CLASS A SHARES | | | | | | | | | | | | | | | | | | | | | | | | | | | | | | | | | | | | | | | | | | | | |
2014(b)(c) | | $ | 13.54 | | | 0.12 | | | 0.11 | | | 0.23 | | | (0.12 | ) | | — | | | (0.12 | ) | | $ | 13.65 | | | | 1.72 | (d) | | | 0.94 | (d) | | | 0.94 | (d) | | | 0.94 | (d) | | 1.68 | | 10.55 | | $ | 164,976 | |
2013(b) | | $ | 13.75 | | | 0.24 | | | (0.20 | ) | | 0.04 | | | (0.24 | ) | | (0.01) | | | (0.25 | ) | | $ | 13.54 | | | | 1.75 | | | | 0.94 | | | | 0.94 | | | | 0.94 | | | 0.28 | | 17.57 | | $ | 159,058 | |
2012(b) | | $ | 13.41 | | | 0.29 | | | 0.34 | | | 0.63 | | | (0.29 | ) | | — | | | (0.29 | ) | | $ | 13.75 | | | | 2.15 | | | | 0.95 | | | | 0.95 | | | | 0.95 | | | 4.78 | | 13.06 | | $ | 150,155 | |
2011(b) | | $ | 13.38 | | | 0.36 | | | 0.03 | | | 0.39 | | | (0.36 | ) | | — | | | (0.36 | ) | | $ | 13.41 | | | | 2.71 | | | | 0.96 | | | | 0.96 | | | | 0.96 | | | 2.98 | | 13.33 | | $ | 123,910 | |
2010(b) | | $ | 13.09 | | | 0.39 | | | 0.29 | | | 0.68 | | | (0.39 | ) | | — | | | (0.39 | ) | | $ | 13.38 | | | | 2.94 | | | | 0.97 | | | | 0.97 | | | | 0.97 | | | 5.29 | | 13.69 | | $ | 114,813 | |
2009(b) | | $ | 12.49 | | | 0.44 | | | 0.60 | | | 1.04 | | | (0.44 | ) | | — | | | (0.44 | ) | | $ | 13.09 | | | | 3.48 | | | | 0.98 | | | | 0.98 | | | | 0.99 | | | 8.50 | | 44.06 | | $ | 79,455 | |
CLASS C SHARES | | | | | | | | | | | | | | | | | | | | | | | | | | | | | | | | | | | | | | | | | | | | |
2014(c) | | $ | 13.55 | | | 0.10 | | | 0.11 | | | 0.21 | | | (0.10 | ) | | — | | | (0.10 | ) | | $ | 13.66 | | | | 1.45 | (d) | | | 1.21 | (d) | | | 1.21 | (d) | | | 1.21 | (d) | | 1.54 | | 10.55 | | $ | 59,792 | |
2013 | | $ | 13.76 | | | 0.20 | | | (0.20 | ) | | — | | | (0.20 | ) | | (0.01) | | | (0.21 | ) | | $ | 13.55 | | | | 1.48 | | | | 1.21 | | | | 1.21 | | | | 1.21 | | | 0.02 | | 17.57 | | $ | 59,585 | |
2012 | | $ | 13.42 | | | 0.26 | | | 0.34 | | | 0.60 | | | (0.26 | ) | | — | | | (0.26 | ) | | $ | 13.76 | | | | 1.88 | | | | 1.22 | | | | 1.22 | | | | 1.22 | | | 4.49 | | 13.06 | | $ | 59,563 | |
2011 | | $ | 13.40 | | | 0.32 | | | 0.02 | | | 0.34 | | | (0.32 | ) | | — | | | (0.32 | ) | | $ | 13.42 | | | | 2.45 | | | | 1.22 | | | �� | 1.22 | | | | 1.22 | | | 2.63 | | 13.33 | | $ | 45,897 | |
2010 | | $ | 13.10 | | | 0.35 | | | 0.30 | | | 0.65 | | | (0.35 | ) | | — | | | (0.35 | ) | | $ | 13.40 | | | | 2.67 | | | | 1.23 | | | | 1.23 | | | | 1.74 | | | 5.09 | | 13.69 | | $ | 42,039 | |
2009 | | $ | 12.50 | | | 0.41 | | | 0.60 | | | 1.01 | | | (0.41 | ) | | — | | | (0.41 | ) | | $ | 13.10 | | | | 3.23 | | | | 1.24 | | | | 1.24 | | | | 1.76 | | | 8.22 | | 44.06 | | $ | 26,004 | |
CLASS I SHARES | | | | | | | | | | | | | | | | | | | | | | | | | | | | | | | | | | | | | | | | | | | | |
2014(c) | | $ | 13.55 | | | 0.14 | | | 0.11 | | | 0.25 | | | (0.14 | ) | | — | | | (0.14 | ) | | $ | 13.66 | | | | 2.06 | (d) | | | 0.61 | (d) | | | 0.60 | (d) | | | 0.61 | (d) | | 1.85 | | 10.55 | | $ | 290,959 | |
2013 | | $ | 13.76 | | | 0.28 | | | (0.19 | ) | | 0.09 | | | (0.29 | ) | | (0.01) | | | (0.30 | ) | | $ | 13.55 | | | | 2.08 | | | | 0.61 | | | | 0.61 | | | | 0.61 | | | 0.62 | | 17.57 | | $ | 254,869 | |
2012 | | $ | 13.42 | | | 0.33 | | | 0.35 | | | 0.68 | | | (0.34 | ) | | — | | | (0.34 | ) | | $ | 13.76 | | | | 2.46 | | | | 0.62 | | | | 0.62 | | | | 0.62 | | | 5.12 | | 13.06 | | $ | 196,071 | |
2011 | | $ | 13.40 | | | 0.40 | | | 0.02 | | | 0.42 | | | (0.40 | ) | | — | | | (0.40 | ) | | $ | 13.42 | | | | 3.03 | | | | 0.63 | | | | 0.62 | | | | 0.63 | | | 3.24 | | 13.33 | | $ | 120,693 | |
2010 | | $ | 13.10 | | | 0.43 | | | 0.30 | | | 0.73 | | | (0.43 | ) | | — | | | (0.43 | ) | | $ | 13.40 | | | | 3.27 | | | | 0.63 | | | | 0.63 | | | | 0.63 | | | 5.72 | | 13.69 | | $ | 78,948 | |
2009 | | $ | 12.50 | | | 0.48 | | | 0.60 | | | 1.08 | | | (0.48 | ) | | — | | | (0.48 | ) | | $ | 13.10 | | | | 3.81 | | | | 0.65 | | | | 0.65 | | | | 0.65 | | | 8.86 | | 44.06 | | $ | 41,186 | |
| (a) | Not annualized for periods less than one year. |
| (b) | Sales loads are not reflected in computing total return. |
| (c) | Unaudited Six Month Period Ended March 31. |
| + | Based on weighted average shares outstanding, except for Dividends from Net Investment Income and Net Realized Gains, which are actual amounts per share. |
See notes to financial statements.
| | | | |
| 24 Certified Semi-Annual Report | | | | Certified Semi-Annual Report 25 |
| | |
| Expense Example | | |
| |
Thornburg California Limited Term Municipal Fund | | March 31, 2014 (Unaudited) |
As a shareholder of the Fund, you incur two types of costs:
| | (1) | transaction costs, including |
(a) sales charges (loads) on purchase payments, for Class A shares;
(b) a deferred sales charge on redemptions of any part or all of a purchase of $1 million of Class A shares within 12 months of purchase;
(c) a deferred sales charge on redemptions of Class C shares within 12 months of purchase;
| | (2) | ongoing costs, including management fees; distribution and/or service (12b-1) fees; and other Fund expenses. |
This example is intended to help you understand your ongoing costs (in dollars) of investing in the Fund and to compare these costs with the ongoing costs of investing in other mutual funds.
The example is based on a $1,000 investment beginning on October 1, 2013, and held until March 31, 2014.
| | | | | | | | | | | | |
| | | BEGINNING
ACCOUNT VALUE
10/1/13 | | | ENDING
ACCOUNT VALUE
3/31/14 | | | EXPENSES PAID
DURING PERIOD†
10/1/13–3/31/14 | |
Class A Shares | | | | | | | | | | | | |
Actual | | $ | 1,000.00 | | | $ | 1,016.80 | | | $ | 4.71 | |
Hypothetical* | | $ | 1,000.00 | | | $ | 1,020.26 | | | $ | 4.72 | |
Class C Shares | | | | | | | | | | | | |
Actual | | $ | 1,000.00 | | | $ | 1,015.40 | | | $ | 6.06 | |
Hypothetical* | | $ | 1,000.00 | | | $ | 1,018.92 | | | $ | 6.07 | |
Class I Shares | | | | | | | | | | | | |
Actual | | $ | 1,000.00 | | | $ | 1,018.50 | | | $ | 3.04 | |
Hypothetical* | | $ | 1,000.00 | | | $ | 1,021.92 | | | $ | 3.05 | |
| † | Expenses are equal to the annualized expense ratio for each class (A: 0.94%; C: 1.21%; I: 0.60%) multiplied by the average account value over the period, multiplied by 182/365 to reflect the one-half year period. |
| * | Hypothetical assumes a rate of return of 5% per year before expenses. |
Actual Expenses
For each class of shares, the first line of the accompanying table provides information about actual account values and actual expenses. You may use the information in this line, together with the amount you invested, to estimate the expenses that you paid over the period. Simply divide your account value by $1,000 (for example, an $8,600 account value divided by $1,000 = 8.6), then multiply the result by the number in the first line for your class of shares under the heading entitled “Expenses Paid During Period” to estimate the expenses you paid on your account during this period.
Hypothetical Example for Comparison Purposes
For each class of shares, the second line of the accompanying table provides information about hypothetical account values and hypothetical expenses based on the Fund’s actual expense ratio and an assumed rate of return of 5% per year before expenses, which is not the Fund’s actual return. The hypothetical account values and expenses may not be used to estimate the actual ending account balance or expenses you paid for the period. You may use this information to compare the ongoing costs of investing in the Fund and other funds. To do so, compare this 5% hypothetical example with the 5% hypothetical examples that appear in the shareholder reports of the other funds.
Please note that the expenses shown in the table are meant to highlight your ongoing costs only and do not reflect any transactional costs, such as sales charges (loads), redemption fees, or exchange fees. Therefore, the second line of the table for each class of shares is useful in comparing ongoing costs only, and will not help you determine the relative total costs of owning different funds. In addition, if these transactional costs were included, your costs would have been higher.
26 Certified Semi-Annual Report
| | |
| Other Information | | |
| |
Thornburg California Limited Term Municipal Fund | | March 31, 2014 (Unaudited) |
Portfolio Proxy Voting
Policies and Procedures:
The Trust has delegated to Thornburg Investment Management, Inc. (the “Advisor”) voting decisions respecting proxies for the Fund’s voting securities. The Advisor makes voting decisions in accordance with its Proxy Voting Policy. A description of the Policy is available (i) without charge, upon request, by calling the Advisor toll-free at 1-800-847-0200, (ii) on the Thornburg website at www.thornburg.com, and (iii) on the Securities and Exchange Commission’s website at www.sec.gov.
Information regarding how proxies were voted is available on or before August 31 of each year for the twelve months ending the preceding June 30. This information is available (i) without charge, upon request by calling the Advisor toll-free at 1-800-847-0200, (ii) on the Thornburg website at www.thornburg.com, and (iii) on the Securities and Exchange Commission’s website at www.sec.gov.
Availability of Quarterly Portfolio Schedule
The Fund files with the Securities and Exchange Commission schedules of its portfolio holdings on Form N-Q for the first and third quarters of each fiscal year. The Fund’s Forms N-Q are available on the Commission’s website at www.sec.gov, or may be reviewed and copied at the Commission’s Public Reference Room in Washington, D.C. Information on the operation of the Public Reference Room may be obtained by calling 1-800-SEC-0330. The Fund also makes this information available on its website at www.thornburg. com/download or upon request by calling 1-800-847-0200.
Certified Semi-Annual Report 27
Trustees’ Statement to Shareholders
Not part of the Certified Semi-Annual Report
Reissued September 15, 2013
The Trustees believe current and prospective shareholders should know how we discharge our responsibilities in supervising the Funds’ investment advisor and in reviewing the advisor’s contract for renewal. Since 2005, we have issued a statement which sets out clearly the three principal guidelines that we follow in supervising the Trust’s investment advisor on your behalf. In accordance with our customary practice, in September of this year we again reviewed our statement and concluded we should reissue this statement outlining the principal features of our supervision of the advisor’s performance of investment management services for the Funds.
We begin with the premise that each shareholder selected his or her Fund because its investments are managed by the investment advisor identified in the prospectus and in accordance with the objective and policies described in the prospectus. We realize, as each of you do, that if you believe that your Fund’s stated objective and policies no longer serve your personal investment goals, you can sell your shares and leave the Fund.
Therefore, we believe that our primary supervisory task – our principal obligation to you – is to assess the nature and quality of the advisor’s services, and to confirm that the advisor actively and competently pursues the Fund’s objective, in accordance with the policies set out in the prospectus. To do this, we meet regularly with management to review your Fund’s portfolio and to discuss the advisor’s specific actions and judgments in pursuing the Fund’s objective. We do not substitute our own judgment for the advisor’s decisions in selecting investments; the advisor is paid to exercise its informed judgment on investment decisions, and we seek to confirm, in reviewing the advisor’s performance, that the advisor is doing just that.
Second, while we are conscious of costs and the effect that costs have on shareholders’ returns, we do not seek the lowest fees or expense ratio as our sole or primary objective. We try to make sure that your Fund’s fees and costs are reasonable in relationship to the services rendered and that they are generally in line with those charged by other expert investment advisors, consistent with our belief that the Fund’s investors searched for and expect that expertise and attention and have decided to pay a reasonable price for it. We do not put the management contract “out to bid” as a matter of course, and we would not do so unless we had concluded that the advisor materially had failed to pursue the Fund’s objectives in accordance with its policies, or for other equally important reasons. We believe that any other approach would be inconsistent with your interests and contrary to your expectations when you bought shares of the Fund in the first place.
Finally, because we believe that most Thornburg Fund shareholders have invested with a long-term perspective, we try not to focus too much on the fashions of the moment and on short-term performance. The market will not favor any specific investment objective or set of policies at all times and under all economic circumstances. A fund will experience periods of both high and low returns relative to other funds and other investments. Even if one of our Funds is not favored by the market at a particular time, we believe that the advisor is nonetheless obliged to remain true to the Fund’s objective and policies, and we watch to see that it does so.
28 This page is not part of the Semi-Annual Report
Retirement and Education Accounts
Thornburg Investment Management offers retirement and education savings accounts that can help you meet a variety of planning challenges. For account applications or further information on any of the accounts below, please call 1-800-847-0200 or go to www.thornburg.com/ira. Your financial advisor can help you determine which plan is right for you.
Individual Retirement Accounts
Individual Retirement Accounts (IRAs) provide a tax-advantaged means to save money for the future. For a detailed outline of the difference between retirement accounts, see www.thornburg.com/ira. Rollovers are available. Call 1-800-847-0200 for more information.
Traditional IRAs – Contributions to Traditional IRAs are tax deductible for eligible individuals, and withdrawals are taxed as additional ordinary income. You may contribute to an IRA if you receive compensation and are under 70 1⁄2, even if you are covered by an employer retirement plan. Deductible contributions are subject to certain qualifications. Please consult your tax advisor.
Roth IRAs – Under a Roth IRA, there is no tax deduction for contributions, but there is no income tax on qualified withdrawals. For a more detailed comparison of Traditional and Roth IRAs, please see our website at www.thornburg.com/ira.
SEP IRAs – Simplified Employee Pension (SEP) IRAs are established by employers. The employer is allowed a tax deduction for contributions made to the SEP Plan and makes contributions to each eligible employee’s SEP IRA on a discretionary basis.
SIMPLE IRAs – Savings Incentive Match Plan for Employees of Small Employers (SIMPLE) is designed to give small business owners a simplified method to establish and contribute to a retirement plan for employees. The employer is allowed a tax deduction for contributions and makes either matching or non-elective contributions to each eligible employee’s SIMPLE IRA. Employees may make salary deferral contributions.
Coverdell Education Savings Account
These savings accounts are designed to provide a way to save money for higher education expenses. In an Education Savings Account, earnings and interest grow tax-free, and qualified withdrawals used to pay for eligible higher-education expenses are tax- and penalty-free.
Funds Available
The following funds are available in the accounts listed above:
| | • | | Thornburg Core Growth Fund |
| | • | | Thornburg International Value Fund |
| | • | | Thornburg International Growth Fund |
| | • | | Thornburg Developing World Fund |
| | • | | Thornburg Investment Income Builder Fund |
| | • | | Thornburg Global Opportunities Fund |
| | • | | Thornburg Low Duration Income Fund |
| | • | | Thornburg Limited Term U.S. Government Fund |
| | • | | Thornburg Limited Term Income Fund |
| | • | | Thornburg Strategic Income Fund |
This page is not part of the Semi-Annual Report 29
Firm & Philosophy

The Firm
Founded in 1982 and headquartered in Santa Fe, New Mexico, Thornburg Investment Management advises a range of active investment strategies, each offered through multiple vehicles, to serve a broad spectrum of client needs worldwide. From short-term fixed income to flexible global equity, our objective is to help clients reach their long-term financial goals via active portfolio management. As of March 31, 2014, Thornburg managed approximately $90 billion in assets.
Investment Philosophy
We seek to preserve and increase the real wealth of shareholders after accounting for inflation, taxes, and investment expenses. We’re committed to disciplined investing and managing risk in all market environments.
Portfolio Holdings Commentary
At Thornburg, we believe you should know what you own. Our website keeps investors informed of the Funds’ equity holdings. Go to www.thornburg.com/funds for equity funds holdings and commentary.
Co-Ownership of Funds
We invest side-by-side with shareholders. Our employees have invested $387 million in Thornburg products as of March 31, 2014.
30 This page is not part of the Semi-Annual Report
Thornburg Fund Family
Thornburg Equity Funds
Thornburg’s equity research uses a fundamentally driven, bottom-up, comprehensive analytical approach. Thornburg equity funds generally focus on a limited number of securities so that each holding can impact performance. The team searches for firms believed to have a promising future and seeks to buy shares of those companies at a discount to their intrinsic or long-term value.
| | • | | Thornburg Core Growth Fund |
| | • | | Thornburg International Value Fund |
| | • | | Thornburg International Growth Fund |
| | • | | Thornburg Developing World Fund |
| | • | | Thornburg Investment Income Builder Fund |
| | • | | Thornburg Global Opportunities Fund |
Thornburg Bond Funds
Thornburg Investment Management applies a disciplined philosophy to fixed-income management. Since the launch of our first fixed-income fund over 25 years ago, we have been conducting fundamental, bottom-up research in an effort to identify bonds which we believe provide the best return for a given level of risk. We avoid leverage or complex strategies which could backfire in periods of market uncertainty.
| | • | | Thornburg Low Duration Income Fund |
| | • | | Thornburg Limited Term U.S. Government Fund |
| | • | | Thornburg Limited Term Income Fund |
| | • | | Thornburg Strategic Income Fund |
| | • | | Thornburg Low Duration Municipal Fund |
| | • | | Thornburg Limited Term Municipal Fund |
| | • | | Thornburg Intermediate Municipal Fund |
| | • | | Thornburg California Limited Term Municipal Fund |
| | • | | Thornburg New Mexico Intermediate Municipal Fund |
| | • | | Thornburg New York Intermediate Municipal Fund |
| | • | | Thornburg Strategic Municipal Income Fund |
Before investing, carefully consider the Fund’s investment goals, risks, charges, and expenses. For a prospectus or summary prospectus containing this and other information, contact your financial advisor or visit thornburg.com. Read it carefully before investing.
For additional information, please visit thornburg.com
Thornburg Investment Management, Inc. 2300 North Ridgetop Road, Santa Fe, NM 87506
This page is not part of the Semi-Annual Report 31
| | |
 | | Waste not, Wait not |

This Semi-Annual Report is submitted for the general information of shareholders of the Fund. It is not authorized for distribution to prospective investors in the Fund unless preceded or accompanied by an effective prospectus.
| | | | |
Investment Advisor: Thornburg Investment Management® 800.847.0200 | | Distributor: Thornburg Securities Corporation® 800.847.0200 | | TH1070 |

IMPORTANT INFORMATION
The information presented on the following pages was current as of March 31, 2014. The managers’ views, portfolio holdings, and sector diversification are provided for the general information of the Fund’s shareholders; to the extent this information is historical, it should not be considered predictive of future circumstances. This material should not be deemed a recommendation to buy or sell any of the securities mentioned.
Investments in the Fund carry risks, including possible loss of principal. Bond funds have the same interest rate, inflation, and credit risks that are associated with the underlying bonds. The principal value of bonds will fluctuate relative to changes in interest rates, decreasing when interest rates rise. Unlike bonds, bond funds have ongoing fees and expenses. Please see the Fund’s Prospectus for a discussion of the risks associated with an investment in the Fund. Investments in the Fund are not FDIC insured, nor are they deposits of or guaranteed by a bank or any other entity. There is no guarantee that the Fund will meet its investment objectives. Diversification does not assure or guarantee better performance and cannot eliminate the risk of investment losses. The laddering strategy does not assure or guarantee better performance and cannot eliminate the risk of investment losses.
Performance data given at net asset value (NAV) does not take into account the applicable sales charges. If the sales charges had been included, the performance would have been lower.
Minimum investments for Class I shares are higher than those for other classes. Class I shares may not be available to all investors.
| | | | |
SHARE CLASS | | NASDAQ SYMBOL | | CUSIP |
Class A | | THNMX | | 885-215-301 |
Class D | | THNDX | | 885-215-624 |
Class I | | THNIX | | 885-215-285 |
Glossary
Bloomberg Economic Evaluation of States (BEES) Index – A survey, updated quarterly, that examines the pace of states’ growth following the 18-month recession that officially ended in June 2009.
Bloomberg State Stock Indices – Capitalization-weighted indices consisting of equities domiciled in each state.
BofA Merrill Lynch 3-15 Year U.S. Municipal Securities Index – This index is a subset of the BofA Merrill Lynch U.S. Municipal Securities Index including all securities with a remaining term to final maturity greater than or equal to 3 years and less than 15 years.
Consumer Price Index (CPI) – Index that measures prices of a fixed basket of goods bought by a typical consumer, including food, transportation, shelter, utilities, clothing, medical care, entertainment and other items. The CPI, published by the Bureau of Labor Statistics in the Department of Labor, is based at 100 in 1982 and is released monthly. It is widely used as a cost-of-living benchmark to adjust Social Security payments and other payment schedules, union contracts and tax brackets. Also known as the cost-of-living index.
Unless otherwise noted, index returns reflect the reinvestment of income dividends and capital gains, if any, but do not reflect fees, brokerage commissions or other expenses of investing. Investors may not make direct investments into any index.
Alternative Minimum Tax (AMT) – A federal tax aimed at ensuring that high-income individuals, estates, trusts, and corporations pay a minimal level income tax. For individuals, the AMT is calculated by adding tax preference items to regular taxable income.
Annualized Distribution Yield – The distribution yield reflects actual distributions made to shareholders. The annualized distribution yield is calculated by summing the last 30 days of income at a given month end and annualizing to a 360-day year. The result is divided by the ending maximum offering price.
Barbell Structure – A bond investment strategy that concentrates holdings in shorter-term and longer-term maturities, forming a structure that resembles a barbell.
Basis Point (bp) – A unit equal to 1/100th of 1%. 1% = 100 basis points (bps).
Bond Credit Ratings – A bond credit rating assesses the financial ability of a debt issuer to make timely payments of principal and interest. Ratings of AAA (the highest), AA, A, and BBB are investment-grade quality. Ratings of BB, B, CCC, CC, C, and D (the lowest) are considered below investment grade, speculative grade, or junk bonds. Unless otherwise noted, the ratings listed are from Municipal Market Data and are a combination of ratings from Standard and Poor’s, Moody’s Investors Service, and Fitch Ratings.
Bullet Structure – A bond investment strategy that concentrates holdings in intermediate-term maturities and avoids shorter-term or longer-term maturities.
Credit Spread/Quality Spread – The difference between the yields of securities with different credit qualities.
Duration – A bond’s sensitivity to interest rates. Bonds with longer durations experience greater price volatility than bonds with shorter durations.
Effective Duration – A bond’s sensitivity to interest rates, incorporating the embedded option features, such as call provisions. Bonds with longer durations experience greater price volatility than bonds with shorter durations.
Fed Funds Rate – The interest rate at which a depository institution lends immediately available funds (balances at the Federal Reserve) to another depository institution overnight.
General Obligation Bond – A municipal bond backed by the credit and “taxing power” of the issuing jurisdiction rather than the revenue from a given project.
Gross Domestic Product (GDP) – A country’s income minus foreign investments: the total value of all goods and services produced within a country in a year, minus net income from investments in other countries.
Participation Rate – The number of people who are either employed or are actively looking for work. The people who are no longer actively searching for work would not be included in the participation rate. During an economic recession, many workers often get discouraged and stop looking for employment, as a result, the participation rate decreases.
Quantitative Easing – The Federal Reserve’s monetary policy intended to stimulate the U.S. economy following the recession that began in 2007/08.
Quantitative Easing 3 (QE3) – The third round of the Federal Reserve’s monetary policy intended to stimulate the U.S. economy following the recession that began in 2007/08. Announced in September 2012 and revised in December 2012, December 2013, and January 2014, the Fed intends to buy $65 billion in mortgage-backed securities and Treasuries each month until the economy improves.
SEC Yield – SEC yield is computed in accordance with SEC standards measuring the net investment income per share over a specified 30-day period expressed as a percentage of the maximum offering price of the Fund’s shares at the end of the period.
Yield Curve – A line that plots the interest rates, at a set point in time, of bonds having equal credit quality, but differing maturity dates.
This page is not part of the Semi-Annual Report 3
THORNBURG NEW MEXICO INTERMEDIATE MUNICIPAL FUND
Laddering – an All Weather Strategy
At Thornburg, our approach to management of the Fund is based on the premise that investors in the Fund seek preservation of capital along with an attractive, relatively stable yield. While aggressive bond strategies may generate stronger returns when the market is turning a blind eye towards risk, they often fail to stack up over longer periods of time.
We apply these techniques to manage risk and pursue attractive returns:
| | • | | Building a laddered portfolio. Laddering has been shown over time to mitigate reinvestment and interest rate risk. |
| | • | | Conducting in-depth fundamental research on each issue and actively monitoring positions for subsequent credit events. |
| | • | | Diversifying among a large number of generally high-quality bonds. |
| | • | | Investing on a cash-only basis without using leverage. |
Portfolio Managers
Objectives and Strategies
The Fund’s primary investment objective is to obtain as high a level of current income exempt from federal and New Mexico state individual income taxes as is consistent, in the view of the investment advisor, with preservation of capital.
The secondary goal of the Fund is to reduce expected changes in its share price compared to long-term bond portfolios.
This Fund offers New Mexico investors double tax-free yields (may be subject to Alternative Minimum Tax) in a laddered municipal bond portfolio with an average maturity of normally three to ten years. Laddering involves building a portfolio of bonds with staggered maturities so that a portion of the portfolio matures each year. Cash from maturing bonds, if not needed for other purposes, is invested in bonds with longer maturities at the far end of the ladder. We regard the strategy as a good compromise for managing different types of risk.
Long-Term Stability of Principal
Net Asset Value History of A Shares from June 18, 1991 through March 31, 2014
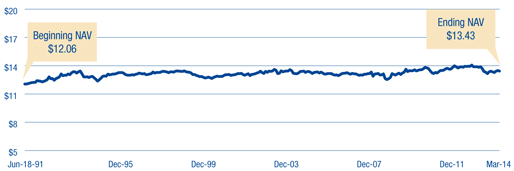
Average Annual Total Returns
For Periods Ended March 31, 2014
| | | | | | | | | | | | | | | | | | | | |
| | | 1 YR | | | 3 YRS | | | 5 YRS | | | 10 YRS | | | SINCE
INCEPTION | |
A Shares (Incep: 6/18/91) | | | | | | | | | | | | | | | | | | | | |
Without sales charge | | | -0.06 | % | | | 3.51 | % | | | 3.81 | % | | | 3.30 | % | | | 4.63 | % |
With sales charge | | | -2.04 | % | | | 2.81 | % | | | 3.38 | % | | | 3.08 | % | | | 4.54 | % |
Performance data shown represents past performance and is no guarantee of future results. Investment return and principal value will fluctuate so shares, when redeemed, may be worth more or less than their original cost. Current performance may be lower or higher than quoted. For performance current to the most recent month end, visit thornburg.com or call 800.847.0200.
The maximum sales charge for the Fund’s Class A shares is 2.00%. The total annual fund operating expense of Class A shares is 0.95%, as disclosed in the most recent Prospectus.
30-Day Yields, A Shares
As of March 31, 2014
| | | | |
Annualized Distribution Yield | | | 2.67 | % |
SEC Yield | | | 1.37 | % |
Key Portfolio Attributes
As of March 31, 2014
| | | | |
Number of Bonds | | | 110 | |
| |
Effective Duration | | | 5.0 Yrs | |
| |
Average Maturity | | | 8.6 Yrs | |
See the entire portfolio in the Schedule of Investments beginning on page 11.
4 This page is not part of the Semi-Annual Report
THORNBURG’S SUITE OF MUNICIPAL FUNDS
Municipal Funds for a Range of Interest-Rate Scenarios
| | |
At Thornburg, we often say that predicting interest rates is a fool’s game. And with the Federal Reserve still heavily involved in the markets, it’s even more difficult to forecast how rates may rise than when they may rise. Will long rates rise first and short rates follow? Will long and short rates climb simultaneously? A traditional strategy to protect oneself against interest-rate risk is to move into shorter-duration bond strategies. But the seemingly counterintuitive response of moving to longer-duration strategies can sometimes yield better results. Diversify Across the Yield Curve This uncertainty points to why it’s important for investors to match their investment horizon to the duration of the strategy in which they’re invested, and to diversify assets across the yield curve. For any interest-rate scenario, Thornburg’s comprehensive suite of municipal funds gives prudent investors the ability to diversify across the yield curve. Diversify Across the Yield Curve with Thornburg Municipal Funds AAA General Obligation Municipal Yield Curve, as of April 2, 2014 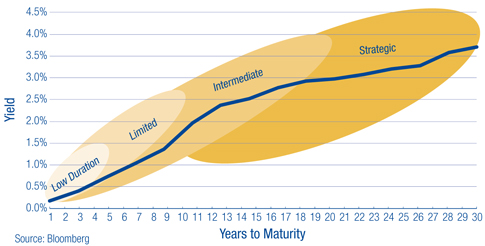
| |  |
| | | | | | | | |
| | | LOW DURATION
MUNICIPAL FUND | | LIMITED TERM
MUNICIPAL FUNDS | | INTERMEDIATE
MUNICIPAL FUNDS | | STRATEGIC MUNICIPAL
INCOME FUND |
Maturity Range (yrs) | | 1-5 | | 1-10 | | 1-20 | | 1-30 |
| | | | |
Portfolio Structure | | Laddered | | Laddered | | Laddered | | Flexible |
| | | | |
Credit Quality | | Investment Grade | | Investment Grade | | Investment Grade | | Flexible
(Maximum of 50% below investment grade) |
| | | | |
| | | | Primary: | | Primary: | | |
Objective | | Seeks current income
exempt from federal
income taxes, consistent
with preservation of
capital | | Obtain as high a level
of current income
exempt from individual
income tax as is
consistent with
preservation of capital | | Obtain as high a
level of current
income exempt from
individual income
tax as is consistent
with preservation of
capital | | Seeks a high level of
current income exempt
from federal individual
income tax |
| | | Secondary: | | Secondary: | |
| | | Reduce expected
changes in share price
compared to longer
intermediate and long-
term bond portfolios | | Reduce expected
changes in share
price compared to
long-term bond
portfolios | |
This page is not part of the Semi-Annual Report 5

Thornburg New Mexico Intermediate Municipal Fund
March 31, 2014
This report is certified under the Sarbanes-Oxley Act of 2002, which requires that public companies, including mutual funds, affirm that the information provided in their annual and semiannual shareholder reports fully and fairly represents their financial position and the results of their operations for the period presented.
6 Certified Semi-Annual Report
LETTER TO SHAREHOLDERS
April 15, 2014
Dear Fellow Shareholder:
We are pleased to present the semi-annual report for the Thornburg New Mexico Intermediate Municipal Fund. The net asset value (NAV) of the Class A shares increased 8 cents to $13.43 per share during the six months ended March 31, 2014. If you were with us for the entire period, you received dividends of 19.4 cents per share. If you reinvested your dividends, you received 19.5 cents per share. Dividends were lower for Class D shares and higher for Class I shares to account for varying class-specific expenses. The Class A shares of your Fund underperformed its index with a total return of 2.07% at NAV for the six months ended March 31, 2014, compared to the 2.88% total return for the BofA Merrill Lynch 3-15 Year U.S. Municipal Securities Index (BAML 3-15 Year Municipal Index). The Fund generated 0.08% less price return and 0.73% less income than the index.
The first six months of fiscal 2014 were very interesting as interest-rate changes went in various directions, depending on the maturity discussed. This period certainly highlighted the fact that interest rates do not change uniformly across the entire maturity spectrum (the yield curve).
Chart I illustrates how yields changed during the period. The gold bars show the yield changes from September 30, 2013 through December 31, 2013. Short-term yields (maturities of five years or less) moved lower, while yields in maturities from five years to 20 years moved higher by varying amounts and longer-term maturities were flat to slightly lower. It is good to remember the tone of the market during that period. Most market commentators believed the stock market and yields were going in the same direction: up. The blue bars show the yield changes from December 31, 2013 through March 31, 2014. Again, yield changes were not uniform across the yield curve. This time, after new U.S. Federal Reserve Chair Janet Yellen hinted that short-term interest rates may eventually need to increase, short-term yields increased and long-term yields decreased.
Investors may wonder how best to protect themselves from these changes. One way to hedge this risk is to own securities or mutual funds that spread their investments across the different segments of the yield curve. In our opinion, that would mean owning some of our new Thornburg Low Duration Municipal Fund and our Limited Term Municipal, Intermediate Municipal, and Strategic Municipal Income Funds. The percentage ownership of each would depend on levels of risk tolerance.
Throughout the six-month period the Fund maintained a lower risk posture on interest rates than its benchmark; the average effective duration was 5.16 years compared to 5.86 years for the benchmark. This detracted from relative performance by 0.04%. The Fund’s positioning along the yield curve added 0.40% of performance relative to the benchmark. Sector allocations subtracted 0.46% from relative performance. The Fund’s credit quality was a mild detractor, taking out 0.13% of performance. Security selection cost 0.25% of relative performance and other factors added 0.40%.
Chart I | Changes in AAA General-Obligation Municipal Yield Curve
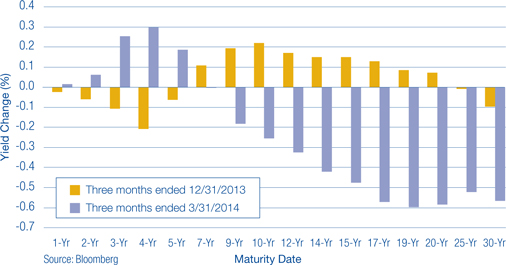
Certified Semi-Annual Report 7
LETTER TO SHAREHOLDERS,
CONTINUED
Chart II | Labor Market Indicators
2/28/1990 – 3/31/2014
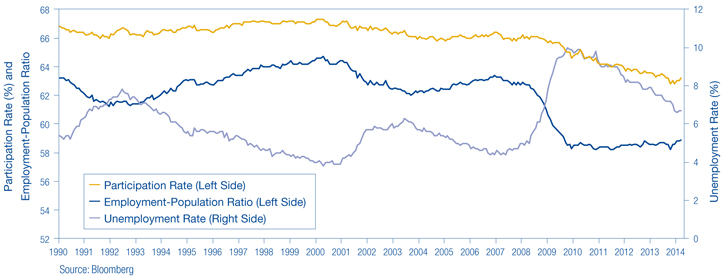
The Economy and the Federal Reserve
Gross domestic product (GDP) for the year ended December 31, 2013 came in at 2.6%, around its long-term average (to March 1990) of 2.5%. Additions to non-farm payroll employment have averaged about 185,000 per month for the six months ended March 31, 2014. The unemployment rate has declined to 6.7%, but it has been clouded by a declining labor participation rate. The percentage of the U.S. population that is employed has declined to 58.9% as of March 31, 2014 from 63.3% on March 31, 2007. The retirement of the “baby boomer” generation certainly contributes to this decline, but does not account for all of it. Chart II illustrates each of these trends from 1990.
Inflation, the bondholder’s worst enemy, has remained well controlled in the last six months. The year-over-year change in the Consumer Price Index (CPI) increased to 1.5% as of March 31, 2014 from 1.2% as of September 30, 2013. Subtracting the food and energy components to arrive at the core measure presents a picture of a well-behaved, unchanged 1.7%. The economic backdrop is one of mild expansion with low inflation. The $64,000 question is, “How long can it last?”
In January 2014, Janet Yellen replaced Ben Bernanke as Federal Reserve Chair. Her appointment as Fed Chair assured a continuation of the current Fed policies. Last year, Bernanke roiled the fixed income markets by alluding to the prospect of a decrease in the Fed’s monthly purchases of Treasury and mortgage-backed securities, the tapering of QE3. Rates went up! This year, the tapering started in actuality with the Fed reducing its purchases by $10.0 billion per meeting. Rates went down! Go figure!
Chair Yellen learned that in her new position (to borrow an old E.F. Hutton advertisement tag line), “When she speaks, markets listen.” At her first news conference, Ms. Yellen tried to clarify what “for a considerable time” meant from the last Fed Statement: “This is the kind of term it’s hard to define,” Yellen said. “Probably means something on the order of six months, or that type of thing” [after QE3 tapering ends]. This sent the debt markets, especially the short-term debt markets, lower in price and higher in yield. The results can be seen in Chart I.
8 Certified Semi-Annual Report
LETTER TO SHAREHOLDERS,
CONTINUED
The Municipal Market
The municipal market has performed very well over the last six months. The monthly outflows from municipal bond mutual funds have abated. The Investment Company Institute (ICI), an industry trade group, has reported that for the last three months of calendar year 2013, municipal bond mutual funds lost an average of $6.6 billion per month. For the first three months of 2014, municipal bond mutual funds experienced $1.1 billion of positive cash flows per month. This is not a significant amount, but at least it is positive.
These cash flows would normally not support a significantly positive return environment, but when coupled with a decline in new issuance of municipal bonds, a clearer picture presents itself. The supply of new municipal bonds was down 26% for the first three months of 2014. So muted demand was met with reduced supply yielding positive results.
The overall economic health of the municipal bond market is improving, albeit unevenly. We arrive at this judgment in part through the use of the Bloomberg Economic Evaluation of States (BEES) Index, for New Mexico which includes:
| | • | | Mortgage delinquencies – from the Mortgage Bankers Association |
| | • | | State personal income – from the Bureau of Economic Analysis |
| | • | | Tax revenue – from the U.S. Census Bureau |
| | • | | Employment – from the Bureau of Labor Statistics |
| | • | | Home prices – from the Federal Housing Finance Agency |
| | • | | Bloomberg State Stock Index |
Table I shows the changes in these various economic factors for the state of New Mexico from the fourth quarter of 2012 through the fourth quarter of 2013, the latest data available.
From the fourth quarter of 2012 through the last quarter of 2013, the index was flat. That contrasts with a national average for all 50 states and the District of Columbia of 2.8%, ranging from a high of 8.8% to a low of negative 7.5%. In addition, state pension funds are still wrestling with some of their issues. The median funding levels have declined from 82.6% in 2007 to 68.6% in 2012 (the Pew Center on the States suggests a funding level of 80% is adequate). New Mexico’s pension funding level was reported at 63.1% in 2012, down from 82.1% in 2007.
Table I | BEES Index: New Mexico
| | |
ECONOMIC INDICATOR | | CHANGE FROM Q4 2012
THROUGH Q4 2013 |
Overall Economic Health | | 0.0% |
Mortgage Delinquency | | -0.8% |
Personal Income | | 1.3% |
Tax Revenue | | 5.1% |
Employment | | -0.2% |
Home Prices | | 1.8% |
Equity Index | | 20.5% |
Overall Economic Health Rank | | 29 out of 51
(District of Columbia included) |
Two municipal bond market credit stories (Detroit and Puerto Rico) continue to grab headlines. In Detroit’s case, some significant settlements have been announced, but they are short on specifics, including where the new cash came from, and are dependent upon state approval. As in most Chapter 9 proceedings, one should read very little into early reports because the final results may prove very different. For example, a settlement was announced between insured bondholders and the city for a recovery of about 74% of par (a bond’s original face value); a second component of the settlement was reached with several unions for 100% of existing pension obligations and a reduction in cost-of-living adjustments. The original opening offer for these parties was 20% of par for the bondholders, and between 75% and 95% of outstanding pension obligations. It appears to us that these compromises do not address the root problems.
Puerto Rico made the news in March 2014 by successfully coming to market with the largest “junk” bond deal in municipal market history. Puerto Rico, which is now rated BB, pulled off a $3.5 billion offering, which was purchased by non-traditional market participants, i.e. hedge funds. It was a 21-year maturity bond that was priced at $93.00 to yield 8.73%. We looked at the issue very closely as a potential addition to the Thornburg Strategic Municipal Income Fund and decided not to purchase it. The deal initially traded up to around $97.00, but as of this writing (close of business April 15th) it is trading at a dollar price of $87.50, a loss of almost 6.00% from the original offering price. Thornburg Funds are among the 30% of U.S. municipal mutual funds that do not own any debt from the Commonwealth of Puerto Rico.
Certified Semi-Annual Report 9
LETTER TO SHAREHOLDERS,
CONTINUED
Conclusion
Your Thornburg New Mexico Intermediate Municipal Fund maintains a laddered portfolio structure, which was comprised of 44 municipal obligors as of March 31, 2014. We ladder our core portfolios because we believe that this structure tends to maximize an investor’s income. In our opinion, a laddered portfolio structure outperforms the other structures (bullet and barbell) two-thirds of the time.1 This structure effectively manages a portfolio’s yield-curve exposure by owning a roughly equal weighting of each maturity, thereby minimizing a major risk factor.
We diversify our holdings across the Fund’s investment universe. Chart I illustrates that yield changes are not uniform across the New Mexico Intermediate Municipal Fund’s investment universe. Laddering also reduces reinvestment risk by ensuring that a portion of the portfolio matures each year so it can be reinvested. More importantly, it frees the team to concentrate on higher value-added tasks, such as fundamental bottom-up credit research. It is just this type of research that has allowed us to avoid the two largest headline-grabbing credit issues in the municipal bond market.
This year has gotten off to a strong start. We thank you for the trust you have placed in us and will continue to keep that foremost in our minds.
Sincerely,
| | | | |
 | |  | | |
| Christopher Ryon,CFA | | Josh Gonze | | |
| Portfolio Manager | | Portfolio Manager | | |
| Managing Director | | Managing Director | | |
| 1 | For a copy of the study, go to www.thornburg.com/whyladder |
Chart III | Percent of Portfolio Maturing
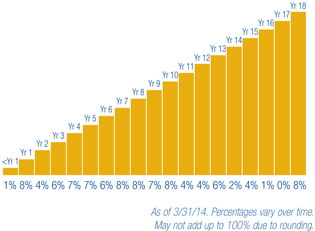
The matters discussed in this report may constitute forward-looking statements made pursuant to the safe harbor provisions of the Securities Litigation Reform Act of 1995. These include any advisor or portfolio manager prediction, assessment, analysis or outlook for individual securities, industries, investment styles, market sectors and/or markets. These statements involve risks and uncertainties. In addition to the general risks described for each fund in its current prospectus, other factors bearing on these reports include the accuracy of the advisor’s or portfolio manager’s forecasts and predictions, the appropriateness of the investment strategies designed by the advisor or portfolio manager and the ability of the advisor or portfolio manager to implement their strategies efficiently and successfully. Any one or more of these factors, as well as other risks affecting the securities markets generally, could cause the actual results of any fund to differ materially as compared to its benchmarks.
10 Certified Semi-Annual Report
| | |
| SCHEDULE OF INVESTMENTS | | |
| |
Thornburg New Mexico Intermediate Municipal Fund | | March 31, 2014 (Unaudited) |
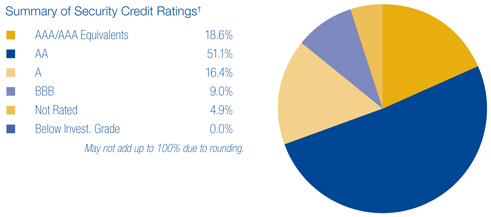
We have used ratings from Standard & Poor’s (S&P). Where S&P ratings are not available, we have used Moody’s Investors Service. Where neither rating is available, we have used ratings from Fitch Ratings. The category of investments identified as “AAA” in this graph includes investments which are pre-refunded or escrowed to maturity. Such investments are backed by an escrow or trust containing sufficient U.S. Government or U.S. Government agency securities to satisfy the timely payment of principal and interest and, therefore, are normally deemed to be equivalent to AAA-rated securities.
| | | | | | | | | | |
ISSUER-DESCRIPTION | | CREDIT RATING†
S&P/ MOODY’S | | PRINCIPAL
AMOUNT | | | VALUE | |
Albuquerque Bernalillo County Water Utility Authority, 5.00% due 7/1/2021 (New Mexico Utilities, Inc. Water System) | | AA+/Aa2 | | $ | 1,760,000 | | | $ | 2,002,598 | |
Albuquerque Bernalillo County Water Utility Authority, 5.50% due 7/1/2025 (New Mexico Utilities, Inc. Water System) | | AA+/Aa2 | | | 1,000,000 | | | | 1,160,400 | |
Albuquerque Bernalillo County Water Utility Authority, 5.00% due 7/1/2026 (San Juan-Chama Drinking Water Project) | | AA+/Aa2 | | | 1,420,000 | | | | 1,601,945 | |
Albuquerque Municipal School District No. 12 GO, 5.00% due 8/1/2019 (Bernalillo and Sandoval Counties School Facilities) (State Aid Withholding) | | AA/Aa1 | | | 3,585,000 | | | | 4,227,002 | |
Bernalillo County GRT, 5.00% due 4/1/2021 (Government Services; Insured: Natl-Re) | | AAA/Aa2 | | | 3,000,000 | | | | 3,426,960 | |
Bernalillo County GRT, 5.25% due 10/1/2022 (Government Services; Insured: AMBAC) | | AAA/Aa2 | | | 3,170,000 | | | | 3,832,498 | |
Bernalillo County GRT, 5.25% due 10/1/2023 (Government Services; Insured: AMBAC) | | AAA/Aa2 | | | 1,275,000 | | | | 1,554,493 | |
Bernalillo County GRT, 5.25% due 10/1/2025 (Government Services; Insured: AMBAC) | | AAA/Aa2 | | | 3,850,000 | | | | 4,558,554 | |
Bernalillo County GRT, 5.25% due 4/1/2027 (Government Services) | | AAA/Aa2 | | | 300,000 | | | | 354,783 | |
Bernalillo County GRT, 5.70% due 4/1/2027 (Juvenile Detention Facilities) | | AAA/Aa2 | | | 3,000,000 | | | | 3,639,600 | |
Bernalillo County GRT, 5.70% due 4/1/2027 (Government Services; Insured: Natl-Re) | | AAA/Aa2 | | | 745,000 | | | | 903,834 | |
Central New Mexico Community College GO, 5.00% due 8/15/2020 (Campus Buildings Acquisition & Improvements) | | AA+/Aa1 | | | 1,375,000 | | | | 1,630,750 | |
Central New Mexico Community College GO, 5.00% due 8/15/2021 (Campus Buildings Acquisition & Improvements) | | AA+/Aa1 | | | 1,435,000 | | | | 1,709,142 | |
Central New Mexico Community College GO, 5.00% due 8/15/2022 (Campus Buildings Acquisition & Improvements) | | AA+/Aa1 | | | 1,100,000 | | | | 1,317,976 | |
Central New Mexico Community College GO, 4.00% due 8/15/2023 (Campus Buildings Acquisition & Improvements) | | AA+/Aa1 | | | 1,920,000 | | | | 2,083,853 | |
City of Albuquerque GRT, 5.00% due 7/1/2021 | | AAA/Aa2 | | | 1,340,000 | | | | 1,516,183 | |
City of Albuquerque GRT, 5.00% due 7/1/2021 | | AAA/Aa2 | | | 3,000,000 | | | | 3,403,980 | |
City of Albuquerque GRT, 5.00% due 7/1/2025 (I-25/Paseo del Norte Interchange) | | AAA/Aa2 | | | 540,000 | | | | 636,692 | |
City of Farmington, 5.00% due 6/1/2017 (San Juan Regional Medical Center) | | NR/A3 | | | 1,035,000 | | | | 1,142,464 | |
City of Farmington, 5.125% due 6/1/2018 (San Juan Regional Medical Center) | | NR/A3 | | | 570,000 | | | | 572,947 | |
City of Farmington, 5.125% due 6/1/2019 (San Juan Regional Medical Center) | | NR/A3 | | | 645,000 | | | | 648,032 | |
City of Farmington, 5.00% due 6/1/2022 (San Juan Regional Medical Center) | | NR/A3 | | | 2,825,000 | | | | 2,971,363 | |
City of Farmington PCR, 4.70% due 5/1/2024 (Arizona Public Service Co.-Four Corners Project) | | A-/A3 | | | 965,000 | | | | 1,013,240 | |
City of Farmington PCR, 4.70% due 9/1/2024 (Arizona Public Service Co.-Four Corners Project) | | A-/A3 | | | 4,000,000 | | | | 4,189,560 | |
City of Farmington PCR, 1.875% due 6/1/2032 put 9/1/2017 (El Paso Electric Co. Four Corners Project) | | BBB/Baa1 | | | 3,300,000 | | | | 3,270,894 | |
City of Gallup PCR, 5.00% due 8/15/2017 (Tri-State Generation & Transmission Assoc., Inc. Project; Insured: AMBAC) | | A/A3 | | | 3,540,000 | | | | 3,709,000 | |
City of Las Cruces GRT, 5.00% due 6/1/2021 (NMFA Loan) | | NR/Aa3 | | | 730,000 | | | | 838,296 | |
City of Las Cruces GRT, 5.00% due 6/1/2022 (NMFA Loan) | | NR/Aa3 | | | 765,000 | | | | 868,466 | |
City of Las Cruces GRT, 5.00% due 6/1/2023 (NMFA Loan) | | NR/Aa3 | | | 800,000 | | | | 899,512 | |
City of Las Cruces GRT, 5.00% due 6/1/2024 (NMFA Loan) | | NR/Aa3 | | | 840,000 | | | | 937,625 | |
City of Las Cruces GRT, 5.00% due 6/1/2030 (NMFA Loan) | | NR/Aa3 | | | 2,000,000 | | | | 2,153,520 | |
City of Las Cruces GRT, 5.00% due 6/1/2037 (NMFA Loan) | | NR/Aa3 | | | 5,000,000 | | | | 5,259,450 | |
City of Rio Rancho GRT, 5.00% due 6/1/2014 (Public Service Facility Projects; Insured: Natl-Re) | | AA-/Aa3 | | | 955,000 | | | | 962,640 | |
City of Rio Rancho GRT, 5.00% due 6/1/2016 pre-refunded 6/1/2015 (Public Service Facility Projects; Insured: Natl-Re) | | AA-/Aa3 | | | 555,000 | | | | 585,947 | |
City of Rio Rancho GRT, 5.00% due 6/1/2022 pre-refunded 6/1/2015 (Public Service Facility Projects; Insured: Natl-Re) | | AA-/Aa3 | | | 1,000,000 | | | | 1,055,760 | |
City of Santa Fe, 4.50% due 5/15/2027 (El Castillo Retirement Residences) | | BBB-/NR | | | 3,275,000 | | | | 3,232,163 | |
City of Santa Fe, 5.00% due 5/15/2034 (El Castillo Retirement Residences) | | BBB-/NR | | | 1,465,000 | | | | 1,412,685 | |
Colfax County GRT, 5.00% due 9/1/2019 (Government Center Facility) | | A-/NR | | | 670,000 | | | | 747,961 | |
Colfax County GRT, 5.50% due 9/1/2029 (Government Center Facility) | | A-/NR | | | 2,510,000 | | | | 2,708,114 | |
County of Los Alamos GRT, 5.75% due 6/1/2016 (Public Facilities Projects) | | AA+/A1 | | | 1,315,000 | | | | 1,462,162 | |
County of Los Alamos GRT, 5.625% due 6/1/2023 pre-refunded 6/1/2018 (Public Facilities Projects) | | AA+/A1 | | | 1,000,000 | | | | 1,184,370 | |
County of Los Alamos GRT, 5.75% due 6/1/2024 pre-refunded 6/1/2018 (Public Facilities Projects) | | AA+/A1 | | | 3,000,000 | | | | 3,568,350 | |
County of Los Alamos GRT, 5.75% due 6/1/2025 pre-refunded 6/1/2018 (Public Facilities Projects) | | AA+/A1 | | | 1,000,000 | | | | 1,189,450 | |
Dona Ana County, 5.50% due 12/1/2014 (County Administrative Facilities; Insured: Radian) | | A/NR | | | 460,000 | | | | 475,438 | |
Dona Ana County GRT, 5.50% due 6/1/2016 (County Jail Improvement Project; Insured: AMBAC) | | NR/NR | | | 250,000 | | | | 266,633 | |
Government of Guam, 5.375% due 12/1/2024 | | BBB+/NR | | | 2,000,000 | | | | 2,113,320 | |
Certified Semi-Annual Report 11
| | |
| SCHEDULE OF INVESTMENTS, CONTINUED | | |
| |
Thornburg New Mexico Intermediate Municipal Fund | | March 31, 2014 (Unaudited) |
| | | | | | | | | | |
ISSUER-DESCRIPTION | | CREDIT RATING†
S&P/ MOODY’S | | PRINCIPAL
AMOUNT | | | VALUE | |
Grant County, 3.75% due 7/1/2014 (State Dept. of Health-Ft. Bayard Project) | | AA/Aa1 | | $ | 250,000 | | | $ | 252,045 | |
Grant County, 5.50% due 7/1/2020 (State Dept. of Health-Ft. Bayard Project) | | AA/Aa1 | | | 1,565,000 | | | | 1,781,549 | |
Grant County, 5.50% due 7/1/2021 (State Dept. of Health-Ft. Bayard Project) | | AA/Aa1 | | | 1,655,000 | | | | 1,884,002 | |
Grant County, 5.50% due 7/1/2022 (State Dept. of Health-Ft. Bayard Project) | | AA/Aa1 | | | 1,745,000 | | | | 1,986,456 | |
Guam Power Authority, 5.00% due 10/1/2026 (Electric Power System; Insured: AGM) | | AA/A2 | | | 2,000,000 | | | | 2,187,000 | |
New Mexico Educational Assistance Foundation, 4.10% due 9/1/2015 (Student Loans; LOC: Royal Bank of Canada) (AMT) | | NR/Aaa | | | 2,000,000 | | | | 2,087,160 | |
New Mexico Educational Assistance Foundation, 4.00% due 9/1/2016 (Student Loans) | | NR/Aaa | | | 690,000 | | | | 746,304 | |
New Mexico Educational Assistance Foundation, 4.00% due 9/1/2017 (Student Loans) | | NR/Aaa | | | 1,150,000 | | | | 1,268,013 | |
New Mexico Educational Assistance Foundation, 5.00% due 12/1/2019 (Student Loans) | | AAA/Aaa | | | 1,000,000 | | | | 1,171,210 | |
New Mexico Educational Assistance Foundation, 5.00% due 12/1/2022 (Student Loans) | | AAA/Aaa | | | 3,000,000 | | | | 3,424,830 | |
New Mexico Finance Authority, 5.25% due 6/1/2016 (Bernalillo County Water Authority; Insured: AMBAC) | | AAA/Aa1 | | | 250,000 | | | | 252,050 | |
New Mexico Finance Authority, 2.00% due 6/15/2016 (State Highway Infrastructure) | | AAA/Aa1 | | | 3,000,000 | | | | 3,102,960 | |
New Mexico Finance Authority, 5.00% due 6/15/2018 (Bernalillo County Metropolitan Court; Insured: AMBAC) | | NR/Aa2 | | | 2,915,000 | | | | 3,071,040 | |
New Mexico Finance Authority, 5.00% due 6/15/2019 (UNM Health Sciences Center; Insured: Natl-Re) | | NR/Aa2 | | | 1,215,000 | | | | 1,278,824 | |
New Mexico Finance Authority, 5.00% due 6/1/2020 (Various Governmental Projects; Insured: AMBAC) | | AAA/Aa1 | | | 365,000 | | | | 397,748 | |
New Mexico Finance Authority, 5.00% due 6/15/2022 (Various Governmental Projects; Insured: Natl-Re) | | AA+/Aa2 | | | 1,300,000 | | | | 1,442,974 | |
New Mexico Finance Authority, 5.00% due 6/15/2024 (Various Governmental Projects; Insured: Natl-Re) | | AA+/Aa2 | | | 7,000,000 | | | | 7,753,620 | |
New Mexico Finance Authority, 5.00% due 6/15/2026 (State Highway Infrastructure) | | AA/Aa2 | | | 1,220,000 | | | | 1,434,171 | |
New Mexico Finance Authority, 5.00% due 6/15/2027 (State Highway Infrastructure) | | AA/Aa2 | | | 1,195,000 | | | | 1,395,915 | |
New Mexico Hospital Equipment Loan Council, 5.00% due 7/1/2017 pre-refunded 7/1/2015 (St. Vincent Hospital; Insured: Radian) | | NR/NR | | | 1,730,000 | | | | 1,824,406 | |
New Mexico Hospital Equipment Loan Council, 5.00% due 7/1/2019 pre-refunded 7/1/2015 (St. Vincent Hospital; Insured: Radian) | | NR/NR | | | 1,000,000 | | | | 1,054,570 | |
New Mexico Hospital Equipment Loan Council, 5.00% due 7/1/2021 pre-refunded 7/1/2015 (St. Vincent Hospital; Insured: Radian) | | NR/NR | | | 1,185,000 | | | | 1,249,665 | |
New Mexico Hospital Equipment Loan Council, 6.00% due 8/1/2023 (Presbyterian Healthcare Services) | | AA/Aa3 | | | 6,000,000 | | | | 6,917,760 | |
New Mexico Hospital Equipment Loan Council, 5.25% due 7/1/2025 pre-refunded 7/1/2015 (St. Vincent Hospital; Insured: Radian) | | NR/NR | | | 1,000,000 | | | | 1,057,680 | |
New Mexico Hospital Equipment Loan Council, 5.00% due 7/1/2032 (Haverland Carter Lifestyle Group) | | NR/NR | | | 2,000,000 | | | | 1,850,820 | |
New Mexico Hospital Equipment Loan Council, 5.00% due 8/1/2039 (Presbyterian Healthcare Services) | | AA/Aa3 | | | 3,000,000 | | | | 3,090,300 | |
New Mexico Housing Authority MFR, 5.30% due 12/1/2022 (El Paseo Apartments; Insured: AMBAC) (AMT) | | NR/NR | | | 790,000 | | | | 789,929 | |
New Mexico Institute of Mining and Technology, 5.00% due 7/1/2015 | | A+/A1 | | | 490,000 | | | | 516,298 | |
New Mexico Institute of Mining and Technology, 5.00% due 7/1/2020 | | A+/A1 | | | 590,000 | | | | 669,910 | |
New Mexico Institute of Mining and Technology, 5.00% due 7/1/2023 | | A+/A1 | | | 685,000 | | | | 756,267 | |
New Mexico Institute of Mining and Technology, 5.00% due 7/1/2024 | | A+/A1 | | | 525,000 | | | | 575,899 | |
New Mexico Institute of Mining and Technology, 5.00% due 7/1/2025 | | A+/A1 | | | 505,000 | | | | 550,248 | |
New Mexico Institute of Mining and Technology, 5.00% due 7/1/2028 | | A+/A1 | | | 1,500,000 | | | | 1,607,160 | |
New Mexico MFA, 5.25% due 7/1/2023 (HERO Loan SFM Program; Collateralized: GNMA/FNMA/FHLMC) (AMT) | | AA+/NR | | | 495,000 | | | | 519,047 | |
New Mexico MFA, 5.375% due 7/1/2023 (Saver Loan SFM Program; Collateralized: GNMA/FNMA/FHLMC) (AMT) | | AA+/NR | | | 385,000 | | | | 387,988 | |
New Mexico MFA, 4.625% due 3/1/2028 (NIBP SFM Program; Collateralized: GNMA/FNMA/FHLMC) | | AA+/NR | | | 1,575,000 | | | | 1,652,348 | |
New Mexico MFA, 5.50% due 7/1/2028 (HERO Loan SFM Program; Collateralized: GNMA/FNMA/FHLMC) (AMT) | | AA+/NR | | | 1,080,000 | | | | 1,125,317 | |
New Mexico MFA, 5.60% due 7/1/2028 (Saver SFM Loan Program; Collateralized: GNMA/FNMA/FHLMC) (AMT) | | AA+/NR | | | 340,000 | | | | 356,538 | |
New Mexico MFA, 5.40% due 9/1/2029 (Saver SFM Loan Program; Collateralized: GNMA/FNMA/FHLMC) | | AA+/NR | | | 525,000 | | | | 559,183 | |
Regents of the University of New Mexico, 5.00% due 6/1/2015 (Campus Improvements; Insured: AMBAC) | | AA/Aa2 | | | 1,590,000 | | | | 1,678,181 | |
Regents of the University of New Mexico, 5.25% due 6/1/2015 (UNM Hospital Capital Improvements) | | AA/Aa2 | | | 1,195,000 | | | | 1,199,959 | |
Regents of the University of New Mexico, 5.00% due 1/1/2016 (Children’s Hospital and Critical Care Pavilion; Insured: AGM/ FHA) | | AA/A2 | | | 2,920,000 | | | | 2,950,835 | |
Regents of the University of New Mexico, 5.00% due 1/1/2017 (Children’s Hospital and Critical Care Pavilion; Insured: AGM/ FHA) | | AA/A2 | | | 2,000,000 | | | | 2,019,420 | |
Regents of the University of New Mexico, 5.00% due 1/1/2018 (Children’s Hospital and Critical Care Pavilion; Insured: AGM/ FHA) | | AA/A2 | | | 2,000,000 | | | | 2,017,960 | |
Regents of the University of New Mexico, 5.25% due 6/1/2018 (UNM Hospital Capital Improvements) | | AA/Aa2 | | | 1,200,000 | | | | 1,204,920 | |
Regents of the University of New Mexico, 5.00% due 1/1/2019 (Children’s Hospital and Critical Care Pavilion; Insured: AGM/ FHA) | | AA/A2 | | | 3,000,000 | | | | 3,024,480 | |
Regents of the University of New Mexico, 5.00% due 7/1/2019 (Children’s Hospital and Critical Care Pavilion; Insured: AGM/ FHA) | | AA/A2 | | | 3,000,000 | | | | 3,023,640 | |
Regents of the University of New Mexico, 5.00% due 1/1/2020 (Children’s Hospital and Critical Care Pavilion; Insured: AGM/ FHA) | | AA/A2 | | | 2,310,000 | | | | 2,326,863 | |
Regents of the University of New Mexico, 5.00% due 7/1/2020 (Children’s Hospital and Critical Care Pavilion; Insured: AGM/ FHA) | | AA/A2 | | | 500,000 | | | | 503,480 | |
Regents of the University of New Mexico, 6.00% due 6/1/2021 (Campus Buildings Acquisition & Improvements) | | AA/Aa2 | | | 555,000 | | | | 640,442 | |
San Juan County GRT, 5.00% due 6/15/2014 (Insured: Natl-Re) | | AA-/A2 | | | 1,225,000 | | | | 1,236,650 | |
Sandoval County, 4.00% due 6/1/2015 (Intel Corp.) | | A+/NR | | | 425,000 | | | | 431,192 | |
Sandoval County, 5.00% due 6/1/2020 (Intel Corp.) | | A+/NR | | | 6,440,000 | | | | 6,722,652 | |
Santa Fe County, 5.00% due 2/1/2018 (County Correctional System; Insured: AGM) | | AA/A2 | | | 755,000 | | | | 814,494 | |
Santa Fe County, 6.00% due 2/1/2027 (County Correctional System; Insured: AGM) | | AA/A2 | | | 1,520,000 | | | | 1,802,386 | |
12 Certified Semi-Annual Report
| | |
| SCHEDULE OF INVESTMENTS, CONTINUED | | |
| |
Thornburg New Mexico Intermediate Municipal Fund | | March 31, 2014 (Unaudited) |
| | | | | | | | | | |
ISSUER-DESCRIPTION | | CREDIT RATING†
S&P/ MOODY’S | | PRINCIPAL
AMOUNT | | | VALUE | |
Santa Fe County GO, 4.00% due 7/1/2019 (County Road and Water System Improvement Projects; Insured: Natl-Re) | | NR/Aaa | | $ | 750,000 | | | $ | 799,320 | |
Santa Fe County GRT, 5.00% due 6/1/2025 (County Courthouse and Other Public Facilities) | | AA+/Aa2 | | | 1,400,000 | | | | 1,576,708 | |
Santa Fe County GRT, 5.00% due 6/1/2026 (County Courthouse and Other Public Facilities) | | AA+/Aa2 | | | 1,535,000 | | | | 1,700,089 | |
Town of Silver City GRT, 4.00% due 6/1/2029 (Public Facility Capital Projects) | | A+/NR | | | 1,000,000 | | | | 1,030,770 | |
Town of Silver City GRT, 4.25% due 6/1/2032 (Public Facility Capital Projects) | | A+/NR | | | 1,050,000 | | | | 1,072,081 | |
Ventana West Public Improvement District, 6.625% due 8/1/2023 | | NR/NR | | | 1,760,000 | | | | 1,767,691 | |
Village of Los Ranchos de Albuquerque, 4.50% due 9/1/2040 (Albuquerque Academy) | | A/NR | | | 3,000,000 | | | | 3,043,320 | |
Virgin Islands Public Finance Authority, 6.625% due 10/1/2029 | | NR/Baa3 | | | 2,500,000 | | | | 2,733,400 | |
Zuni Public School District, 5.00% due 8/1/2028 (Teacher Housing Projects) | | A/NR | | | 1,600,000 | | | | 1,711,680 | |
| | | | | | | | | | |
TOTAL INVESTMENTS — 95.75% (Cost $190,711,626) | | | | | | | | $ | 200,062,422 | |
OTHER ASSETS LESS LIABILITIES — 4.25% | | | | | | | | | 8,879,227 | |
| | | | | | | | | | |
NET ASSETS — 100.00% | | | | | | | | $ | 208,941,649 | |
| | | | | | | | | | |
Footnote Legend
| † | Credit ratings are unaudited. Rating changes may have occurred subsequent to the reporting period end. Bonds issued with a maturity of one year or less are assigned Moody’s ratings from MIG-1 to MIG-4 and Standard and Poor’s ratings from SP-1+ to SP-3 with MIG-1 and SP-1+ being the strongest ratings. |
Portfolio Abbreviations
To simplify the listings of securities, abbreviations are used per the table below:
| | |
| AGM | | Insured by Assured Guaranty Municipal Corp. |
| AMBAC | | Insured by American Municipal Bond Assurance Corp. |
| AMT | | Alternative Minimum Tax |
| FHA | | Insured by Federal Housing Administration |
| FHLMC | | Collateralized by Federal Home Loan Mortgage Corp. |
| FNMA | | Collateralized by Federal National Mortgage Association |
| GNMA | | Collateralized by Government National Mortgage Association |
| | |
| GO | | General Obligation |
| GRT | | Gross Receipts Tax |
| LOC | | Letter of Credit |
| MFA | | Mortgage Finance Authority |
| MFR | | Multi-Family Revenue Bond |
| Natl-Re | | Insured by National Public Finance Guarantee Corp. |
| PCR | | Pollution Control Revenue Bond |
| Radian | | Insured by Radian Asset Assurance |
See notes to financial statements.
Certified Semi-Annual Report 13
| | |
| STATEMENT OF ASSETS AND LIABILITIES | | |
| |
Thornburg New Mexico Intermediate Municipal Fund | | March 31, 2014 (Unaudited) |
| | | | |
ASSETS | | | | |
Investments at value (cost $190,711,626) (Note 2) | | $ | 200,062,422 | |
Cash | | | 6,523,304 | |
Receivable for fund shares sold | | | 465,499 | |
Interest receivable | | | 2,629,294 | |
| | | | |
Total Assets | | | 209,680,519 | |
| | | | |
| |
LIABILITIES | | | | |
Payable for fund shares redeemed | | | 496,738 | |
Payable to investment advisor and other affiliates (Note 3) | | | 152,698 | |
Accounts payable and accrued expenses | | | 41,842 | |
Dividends payable | | | 47,592 | |
| | | | |
Total Liabilities | | | 738,870 | |
| | | | |
| |
NET ASSETS | | $ | 208,941,649 | |
| | | | |
NET ASSETS CONSIST OF | | | | |
Distribution in excess of net investment income | | $ | (25,896 | ) |
Net unrealized appreciation on investments | | | 9,350,796 | |
Accumulated net realized gain (loss) | | | (1,226,142 | ) |
Net capital paid in on shares of beneficial interest | | | 200,842,891 | |
| | | | |
| | $ | 208,941,649 | |
| | | | |
NET ASSET VALUE | | | | |
Class A Shares: | | | | |
Net asset value and redemption price per share ($149,931,692 applicable to 11,167,765 shares of beneficial interest outstanding - Note 4) | | $ | 13.43 | |
Maximum sales charge, 2.00% of offering price | | | 0.27 | |
| | | | |
Maximum offering price per share | | $ | 13.70 | |
| | | | |
| |
Class D Shares: | | | | |
Net asset value, offering and redemption price per share ($28,205,112 applicable to 2,099,882 shares of beneficial interest outstanding - Note 4) | | $ | 13.43 | |
| | | | |
| |
Class I Shares: | | | | |
Net asset value, offering and redemption price per share ($30,804,845 applicable to 2,295,556 shares of beneficial interest outstanding - Note 4) | | $ | 13.42 | |
| | | | |
See notes to financial statements.
14 Certified Semi-Annual Report
| | |
| STATEMENT OF OPERATIONS | | |
| |
Thornburg New Mexico Intermediate Municipal Fund | | Six Months Ended March 31, 2014 (Unaudited) |
| | | | |
INVESTMENT INCOME | | | | |
Interest income (net of premium amortized of $602,462) | | $ | 4,013,889 | |
| | | | |
| |
EXPENSES | | | | |
Investment advisory fees (Note 3) | | | 518,683 | |
Administration fees (Note 3) | | | | |
Class A Shares | | | 95,365 | |
Class D Shares | | | 17,761 | |
Class I Shares | | | 6,618 | |
Distribution and service fees (Note 3) | | | | |
Class A Shares | | | 190,729 | |
Class D Shares | | | 70,553 | |
Transfer agent fees | | | | |
Class A Shares | | | 24,585 | |
Class D Shares | | | 5,534 | |
Class I Shares | | | 2,365 | |
Registration and filing fees | | | | |
Class A Shares | | | 263 | |
Class D Shares | | | 1,820 | |
Class I Shares | | | 1,820 | |
Custodian fees (Note 3) | | | 24,374 | |
Professional fees | | | 13,279 | |
Accounting fees | | | 3,534 | |
Trustee fees | | | 3,780 | |
Other expenses | | | 11,107 | |
| | | | |
Total Expenses | | | 992,170 | |
Less: | | | | |
Expenses reimbursed by investment advisor (Note 3) | | | (178 | ) |
Fees paid indirectly (Note 3) | | | (2,169 | ) |
| | | | |
Net Expenses | | | 989,823 | |
| | | | |
Net Investment Income | | | 3,024,066 | |
| | | | |
REALIZED AND UNREALIZED GAIN (LOSS) | | | | |
Net realized gain (loss) on investments | | | (203,065 | ) |
Net change in unrealized appreciation (depreciation) of investments | | | 1,326,290 | |
| | | | |
Net Realized and Unrealized Gain | | | 1,123,225 | |
| | | | |
Net Increase in Net Assets Resulting from Operations | | $ | 4,147,291 | |
| | | | |
See notes to financial statements.
Certified Semi-Annual Report 15
| | |
| STATEMENT OF CHANGES IN NET ASSETS | | |
| |
Thornburg New Mexico Intermediate Municipal Fund | | |
| | | | | | | | |
| | | SIX MONTHS ENDED
MARCH 31, 2014* | | | YEAR ENDED
SEPTEMBER 30, 2013 | |
INCREASE (DECREASE) IN NET ASSETS FROM | | | | | | | | |
| | |
OPERATIONS | | | | | | | | |
Net investment income | | $ | 3,024,066 | | | $ | 6,759,638 | |
Net realized gain (loss) on investments | | | (203,065 | ) | | | 139,966 | |
Net unrealized appreciation (depreciation) of investments | | | 1,326,290 | | | | (10,844,544 | ) |
| | | | | | | | |
| | |
Net Increase (Decrease) in Net Assets Resulting from Operations | | | 4,147,291 | | | | (3,944,940 | ) |
| | |
DIVIDENDS TO SHAREHOLDERS | | | | | | | | |
From net investment income | | | | | | | | |
Class A Shares | | | (2,219,576 | ) | | | (4,927,135 | ) |
Class D Shares | | | (375,844 | ) | | | (796,491 | ) |
Class I Shares | | | (428,646 | ) | | | (1,036,012 | ) |
| | |
FUND SHARE TRANSACTIONS (NOTE 4) | | | | | | | | |
Class A Shares | | | (9,405,012 | ) | | | (21,162,302 | ) |
Class D Shares | | | (807,338 | ) | | | (1,677,868 | ) |
Class I Shares | | | 5,083,311 | | | | (11,168,790 | ) |
| | | | | | | | |
Net Decrease in Net Assets | | | (4,005,814 | ) | | | (44,713,538 | ) |
| | |
NET ASSETS | | | | | | | | |
Beginning of Period | | | 212,947,463 | | | | 257,661,001 | |
| | | | | | | | |
| | |
End of Period | | $ | 208,941,649 | | | $ | 212,947,463 | |
| | | | | | | | |
Distribution in excess of net investment income | | $ | (25,896 | ) | | $ | (25,896 | ) |
See notes to financial statements.
16 Certified Semi-Annual Report
| | |
| NOTES TO FINANCIAL STATEMENTS | | |
| |
Thornburg New Mexico Intermediate Municipal Fund | | March 31, 2014 (Unaudited) |
NOTE 1 – ORGANIZATION
Thornburg New Mexico Intermediate Municipal Fund (the “Fund”) is a non-diversified series of Thornburg Investment Trust (the “Trust”). The Trust is organized as a Massachusetts business trust under a Declaration of Trust dated June 3, 1987 and is registered as a diversified, open-end management investment company under the Investment Company Act of 1940, as amended. The Fund is currently one of eighteen separate series of the Trust. Each series is considered to be a separate entity for financial reporting and tax purposes and bears expenses directly attributable to it. The Fund’s primary investment objective is to obtain as high a level of current income exempt from federal and New Mexico state individual income tax as is consistent, in the view of the Fund’s investment advisor, with the preservation of capital. The Fund’s secondary objective is to reduce expected changes in its share price compared to long-term bond portfolios.
The Fund currently offers three classes of shares of beneficial interest: Class A, Class D, and Institutional Class (“Class I”). Each class of shares of the Fund represents an interest in the same portfolio of investments, except that (i) Class A shares are sold subject to a front-end sales charge collected at the time the shares are purchased and bear a service fee, (ii) Class D shares are sold at net asset value without a sales charge at the time of purchase or redemption, and bear both a service fee and a distribution fee, (iii) Class I shares are sold at net asset value without a sales charge at the time of purchase and may be subject to a service fee, and (iv) the respective classes may have different reinvestment privileges and conversion rights. Additionally, the Fund may allocate among its classes certain expenses, to the extent allocable to specific classes, including transfer agent fees, government registration fees, certain printing and postage costs, and administrative and legal expenses. Currently, class specific expenses of the Fund are limited to service and distribution fees, administration fees, and certain registration and transfer agent expenses.
NOTE 2 – SIGNIFICANT ACCOUNTING POLICIES
Significant accounting policies of the Trust are as follows:
Valuation Policy and Procedures: The Fund’s Trustees of the Trust (the “Trustees”) have authorized employees of the Fund’s investment advisor, acting as the Valuation and Pricing Committee (the “Committee”), to make certain valuation determinations, subject to oversight and review by the Trustees and the Audit Committee of the Trustees. The Committee and other employees of the Fund’s investment advisor administer and implement the valuation process. The Committee regularly reviews its own fair value decisions, as well as valuations, valuation techniques and services furnished by pricing services, considers circumstances in the markets which may require valuation determinations by the Committee and reviews previous valuation determinations. The Committee also reports on its activities, the performance of the pricing services and other matters to the Trustees and the Audit Committee of the Trustees.
In determining a fair value for a portfolio investment, the Committee seeks to determine the price that the Fund would reasonably expect to receive upon a sale of the investment in an orderly transaction between market participants at the measurement date. Typically, the fair value process employs standing instructions to use quoted prices in active markets or the use of independent pricing services. Less frequently, the Committee may make a fair value determination using other methods. However, because fair value prices are estimated prices, the determination of fair value for an investment may differ from the value that would be realized by the Fund upon a sale of the investment, and that difference could be material to the Fund’s financial statements. The Committee’s determination of fair value for an investment may also differ from the prices obtained by other persons (including other mutual funds) for the investment.
Valuation of Investments: Debt obligations held by the Fund have a primary over-the-counter market and are valued by an independent pricing service approved by the Trustees. The pricing service ordinarily values debt obligations at quoted bid prices. When quotations are not available, debt obligations held by the Fund are valued at evaluated prices determined by the pricing service using methods which include consideration of yields or prices of debt obligations of comparable quality, type of issue, coupon, maturity and rating, and indications as to value from dealers and general market conditions. Short-term obligations having remaining maturities of 60 days or less are ordinarily valued at amortized cost, which approximates market value.
In any case when a pricing service fails to provide a price for a debt obligation held by the Fund, the Committee determines a fair value for the debt obligation using procedures in accordance with a policy approved by the Trustees, which may include the use of a price obtained from a different independent pricing service. Additionally, in any case when management believes that a price provided by a pricing service for a debt obligation held by the Fund may be unreliable, the Committee decides whether or not to use the pricing service’s valuation or to use an alternative method to determine a fair value for the debt obligation.
Valuation Measurements: The Fund categorizes its investments based upon the inputs used in valuing those investments, according to a three-level hierarchy established by guidance from the Financial Accounting Standards Board (the “FASB”). Categorization of investments using this hierarchy is intended by the FASB to maximize the use of observable inputs and minimize the use of unobservable inputs by prioritizing that the most observable input be used when available. Observable inputs are those that market participants would use in valuing an investment based on available market data. Unobservable inputs are those that reflect assumptions about the information market participants would use in valuing an investment. An investment’s level within the hierarchy is based on the lowest level input that is deemed significant to the fair value measurement. The methodologies and relative inputs used to value investments are not necessarily indications of the risk or liquidity associated with investing in those investments.
Certified Semi-Annual Report 17
| | |
| NOTES TO FINANCIAL STATEMENTS, CONTINUED | | |
| |
Thornburg New Mexico Intermediate Municipal Fund | | March 31, 2014 (Unaudited) |
Various inputs are used in determining the fair value measurement of the Fund’s investments. These inputs are generally summarized according to the three-level hierarchy below:
Level 1: Quoted prices in active markets for identical investments.
Level 2: Other direct or indirect significant observable inputs (including quoted prices for similar investments in active markets and other observable inputs, such as interest rates, prepayment rates, credit risk, etc.).
Level 3: Significant unobservable inputs, (including the Committee’s own assumptions in determining the fair value of investments), are generally applicable to investments fair valued with single broker quotes and other investments.
Portfolio investments with minimal, if any, market activity are characterized as Level 3 and are valued using significant unobservable inputs, typically including single broker quotes, which may be adjusted or unadjusted, related or comparable investments, last available transactions, and other relevant information. Valuations may also be based upon current market prices of securities that are comparable in coupon, rating, maturity and industry. An income based valuation approach would consider discounted anticipated future cash flows of the investment. Discounts may also be applied due to the nature or duration of any restrictions on the disposition of the investment. The derived value of a Level 3 investment may not represent the value which is received upon disposition.
The following table displays a summary of the fair value hierarchy measurements of the Fund’s investments as of March 31, 2014. In any instance when valuation inputs from more than one level are used to determine the fair value of a specific investment, the investment is placed in the level of the table based upon the lowest level input that is significant in determining the fair value of the investment:
| | | | | | | | | | | | | | | | |
| | | FAIR VALUE MEASUREMENTS AT MARCH 31, 2014 | |
| | | TOTAL | | | LEVEL 1 | | | LEVEL 2 | | | LEVEL 3 | |
Assets | | | | | | | | | | | | | | | | |
Investments in Securities | | | | | | | | | | | | | | | | |
Municipal Bonds | | $ | 200,062,422 | | | $ | — | | | $ | 200,062,422 | | | $ | — | |
| | | | | | | | | | | | | | | | |
Total Investments in Securities | | $ | 200,062,422 | | | $ | — | | | $ | 200,062,422 | | | $ | — | |
In accordance with the guidance prescribed in Accounting Standards Update No. 2011-04, it is the policy of the Fund to recognize transfers between levels and those underlying events which caused the movement. The Fund recognized no transfers between levels for the six months ended March 31, 2014.
Federal Income Taxes: It is the policy of the Trust to comply with the provisions of the Internal Revenue Code applicable to “regulated investment companies” and to distribute to shareholders substantially all taxable (if any) and tax exempt income of the Fund. Therefore, no provision for federal income tax is required.
Management reviews each uncertain tax position believed to be material to the preparation of the Fund’s financial statements, to assess if it is more likely than not that the position would be sustained upon examination, based upon the technical merits of the position. As of March 31, 2014, management has not identified any such position for which an asset or liability must be reflected in the Statement of Assets and Liabilities. The Fund’s tax returns remain subject to examination for three years after filing.
When-Issued and Delayed Delivery Transactions: The Fund may engage in when-issued or delayed delivery transactions. To the extent the Fund engages in such transactions, it will do so for the purpose of acquiring portfolio investments consistent with the Fund’s investment objectives and not for the purpose of investment leverage or to speculate on interest rate and/or market changes. At the time the Fund makes a commitment to purchase an investment on a when-issued or delayed delivery basis, the Fund will record the transaction and reflect the value in determining its net asset value. When effecting such transactions, assets of an amount sufficient to make payment for the portfolio investments to be purchased will be segregated on the Fund’s records on the trade date. Investments purchased on a when-issued or delayed delivery basis do not earn interest until the settlement date.
Dividends: Net investment income of the Fund is declared daily as a dividend on shares for which the Fund has received payment. Dividends are paid monthly and are reinvested in additional shares of the Fund at net asset value per share at the close of business on the dividend payment date, or at the shareholder’s option, paid in cash. Net realized capital gains, to the extent available, will be distributed at least annually.
18 Certified Semi-Annual Report
| | |
| NOTES TO FINANCIAL STATEMENTS, CONTINUED | | |
| |
Thornburg New Mexico Intermediate Municipal Fund | | March 31, 2014 (Unaudited) |
General: Investment transactions are accounted for on a trade date basis. Interest income is accrued as earned. Premiums and discounts on investments purchased are amortized to call dates or maturity dates of the respective investments. Realized gains and losses from the sale of investments are recorded on an identified cost basis. Net investment income (other than class specific expenses) and realized and unrealized gains and losses are allocated daily to each class of shares based upon the relative net asset value of outstanding shares (or the value of the dividend-eligible shares, as appropriate) of each class of shares at the beginning of the day (after adjusting for the current capital shares activity of the respective class). Expenses common to all Funds are allocated among the Funds comprising the Trust based upon their relative net asset values or other appropriate allocation methods.
Guarantees and Indemnifications: Under the Trust’s organizational documents (and under separate agreements with the independent Trustees), its officers and Trustees are indemnified against certain liabilities arising out of the performance of their duties to the Fund. Additionally, in the normal course of business the Trust enters into contracts with service providers that contain general indemnification clauses. The Trust’s maximum exposure under these arrangements is unknown. However, based on experience, the Trust expects the risk of loss to be remote.
Use of Estimates: The preparation of financial statements, in conformity with United States generally accepted accounting principles, requires management to make estimates and assumptions that affect the reported amounts of assets and liabilities and the disclosure of contingent assets and liabilities at the date of the financial statements and the reported amounts of increases and decreases in net assets from operations during the reporting period. Actual amounts could differ from those estimates.
NOTE 3 – INVESTMENT ADVISORY FEE AND OTHER TRANSACTIONS WITH AFFILIATES
Pursuant to an investment advisory agreement, Thornburg Investment Management, Inc. (the “Advisor”) serves as the investment advisor and performs services for the Fund for which the fees are payable at the end of each month. For the six months ended March 31, 2014, these fees were payable at annual rates ranging from .50 of 1% to .275 of 1% per annum of the average daily net assets of the Fund depending on the Fund’s asset size. The Trust also has entered into administrative services agreements with the Advisor, whereby the Advisor will perform certain administrative services for the shareholders of each class of the Fund’s shares, and for which fees will be payable at an annual rate of up to .125 of 1% per annum of the average daily net assets attributable to each class of shares.
The Trust has an underwriting agreement with Thornburg Securities Corporation (the “Distributor,” an affiliate of the Advisor), which acts as the distributor of the Fund’s shares. For the six months ended March 31, 2014, the Distributor has advised the Fund that it earned net commissions aggregating $236 from the sale of Class A shares.
Pursuant to a service plan under Rule 12b-1 of the Investment Company Act of 1940, the Fund may reimburse to the Advisor an amount not to exceed .25 of 1% per annum of the average daily net assets attributable to each class of shares of the Fund for payments made by the Advisor to securities dealers and other financial institutions to obtain various shareholder and distribution related services. For the six months ended March 31, 2014, there were no 12b-1 service plan fees charged for Class I shares. The Advisor may pay out of its own resources additional expenses for distribution of the Fund’s shares.
The Trust has also adopted a distribution plan pursuant to Rule 12b-1, applicable only to the Fund’s Class D shares, under which the Fund compensates the Distributor for services in promoting the sale of Class D shares of the Fund at an annual rate of up to .25 of 1% per annum of the average daily net assets attributable to Class D shares. Total fees incurred by each class of shares of the Fund under their respective service and distribution plans for the six months ended March 31, 2014, are set forth in the Statement of Operations.
The Advisor and Distributor have contractually agreed to waive fees and reimburse expenses incurred by the Fund so that actual expenses of certain share classes do not exceed specified levels. The agreement may be terminated by the Fund at any time, but may not be terminated by the Advisor or Distributor before February 1, 2015, unless the Advisor ceases to be the investment advisor to the Fund or the Distributor ceases to be the distributor of the Fund prior to that date. The Advisor and Distributor retain the right to be repaid by the Fund for fee waivers and expense reimbursements if expenses fall below the contractual limit prior to the end of the fiscal year.
For the six months ended March 31, 2014, the advisor contractually reimbursed certain class specific expenses and administrative fees $178 for Class D shares.
The Trust has an agreement with the custodian bank to indirectly pay a portion of the custodian’s fees through credits earned by the Fund’s cash on deposit with the bank. This deposit agreement is an alternative to overnight investments. Custodial fees are adjusted to reflect amounts that would have been paid without this agreement, with a corresponding adjustment reflected as fees paid indirectly in the Statement of Operations. For the six months ended March 31, 2014, fees paid indirectly were $2,169.
Certain officers and Trustees of the Trust are also officers or directors of the Advisor and Distributor. The compensation of independent Trustees is borne by the Trust.
Certified Semi-Annual Report 19
| | |
| NOTES TO FINANCIAL STATEMENTS, CONTINUED | | |
| |
Thornburg New Mexico Intermediate Municipal Fund | | March 31, 2014 (Unaudited) |
NOTE 4 – SHARES OF BENEFICIAL INTEREST
At March 31, 2014, there were an unlimited number of shares of beneficial interest authorized. Transactions in shares of beneficial interest were as follows:
| | | | | | | | | | | | | | | | |
| | | SIX MONTHS ENDED
MARCH 31, 2014 (UNAUDITED) | | | YEAR ENDED
SEPTEMBER 30, 2013 (AUDITED) | |
| | | SHARES | | | AMOUNT | | | SHARES | | | AMOUNT | |
Class A Shares | | | | | | | | | | | | | | | | |
Shares sold | | | 329,810 | | | $ | 4,416,047 | | | | 895,379 | | | $ | 12,378,090 | |
Shares issued to shareholders in reinvestment of dividends | | | 143,892 | | | | 1,927,779 | | | | 301,157 | | | | 4,121,844 | |
Shares repurchased | | | (1,178,019 | ) | | | (15,748,838 | ) | | | (2,766,936 | ) | | | (37,662,236 | ) |
| | | | | | | | | | | | | | | | |
| | | | |
Net increase (decrease) | | | (704,317 | ) | | $ | (9,405,012 | ) | | | (1,570,400 | ) | | $ | (21,162,302 | ) |
| | | | | | | | | | | | | | | | |
Class D Shares | | | | | | | | | | | | | | | | |
Shares sold | | | 119,300 | | | $ | 1,600,212 | | | | 415,691 | | | $ | 5,764,194 | |
Shares issued to shareholders in reinvestment of dividends | | | 27,773 | | | | 372,177 | | | | 56,544 | | | | 774,236 | |
Shares repurchased | | | (207,675 | ) | | | (2,779,727 | ) | | | (602,543 | ) | | | (8,216,298 | ) |
| | | | | | | | | | | | | | | | |
| | | | |
Net increase (decrease) | | | (60,602 | ) | | $ | (807,338 | ) | | | (130,308 | ) | | $ | (1,677,868 | ) |
| | | | | | | | | | | | | | | | |
Class I Shares | | | | | | | | | | | | | | | | |
Shares sold | | | 607,320 | | | $ | 8,140,826 | | | | 259,542 | | | $ | 3,566,466 | |
Shares issued to shareholders in reinvestment of dividends | | | 27,992 | | | | 374,990 | | | | 67,264 | | | | 922,972 | |
Shares repurchased | | | (257,255 | ) | | | (3,432,505 | ) | | | (1,141,246 | ) | | | (15,658,228 | ) |
| | | | | | | | | | | | | | | | |
| | | | |
Net increase (decrease) | | | 378,057 | | | $ | 5,083,311 | | | | (814,440 | ) | | $ | (11,168,790 | ) |
| | | | | | | | | | | | | | | | |
NOTE 5 – INVESTMENT TRANSACTIONS
For the six months ended March 31, 2014, the Fund had purchase and sale transactions of investments (excluding short-term investments) of $7,494,345 and $11,029,728, respectively.
NOTE 6 – INCOME TAXES
At March 31, 2014, information on the tax components of capital was as follows:
| | | | |
Cost of investments for tax purposes | | $ | 190,711,626 | |
| | | | |
Gross unrealized appreciation on a tax basis | | $ | 10,117,977 | |
Gross unrealized depreciation on a tax basis | | | (767,181 | ) |
| | | | |
Net unrealized appreciation (depreciation) on investments (tax basis) | | $ | 9,350,796 | |
| | | | |
At March 31, 2014, the Fund had deferred tax basis capital losses occurring subsequent to October 31, 2012 of $85,197. For tax purposes, such losses will be reflected in the year ending September 30, 2014.
At March 31, 2014, the Fund had cumulative tax basis capital losses of $937,880, (of which $2,216 is short-term and $935,664 is long-term) generated after September 30, 2011, which may be carried forward to offset future capital gains. To the extent such carry-forwards are used, capital gain distributions may be reduced to the extent provided by regulations. Such capital loss carryforwards do not expire.
20 Certified Semi-Annual Report
| | |
| NOTES TO FINANCIAL STATEMENTS, CONTINUED | | |
| |
Thornburg New Mexico Intermediate Municipal Fund | | March 31, 2014 (Unaudited) |
OTHER NOTES
Risks: The Fund’s investments subject it to risks including, but not limited to, credit risk, interest rate risk, management risk, market and economic risk, liquidity risk, diversification risk, and the risks of investing primarily in the obligations of a single state. Please see the Fund’s prospectus for a discussion of the risks associated with an investment in the Fund.
Subsequent Events: Fund management believes no events have occurred between March 31, 2014 and the date of issuance of the financial statements that require adjustment to or disclosure in the accompanying financial statements.
Certified Semi-Annual Report 21
FINANCIAL HIGHLIGHTS
Thornburg New Mexico Intermediate Municipal Fund
| | | | | | | | | | | | | | | | | | | | | | | | | | | | | | | | | | | | | | | | | | | | | | | | | | | | | | |
| | | PER SHARE PERFORMANCE (for a share outstanding throughout
the Period)+ | | RATIOS TO AVERAGE NET ASSETS | | | SUPPLEMENTAL DATA | |
Unless
Otherwise
Noted,
Periods
are
Fiscal
Years
Ended
Sept. 30, | | Net Asset
Value
Beginning
of Period | | | Net
Investment
Income (Loss) | | Net
Realized
&
Unrealized
Gain (Loss)
on
Investments | | | Total from
Investment
Operations | | | Dividends
from Net
Investment
Income | | | Dividends
from Net
Realized
Gains | | | Total
Dividends | | | Net
Asset
Value
End
of
Period | | Net
Investment
Income
(Loss)
(%) | | | Expenses,
After
Expense
Reductions
(%) | | | Expenses,
After
Expense
Reductions
and
Net of
Custody
Credits
(%) | | | Expenses,
Before
Expense
Reductions
(%) | | | Total
Return
(%)(a) | | | Portfolio
Turnover
Rate (%)(a) | | Net
Assets
at End
of
Period
(Thousands) | |
CLASS A SHARES | | | | | | | | | | | | | | | | | | | | | | | | | | | | | | | | | | | | | | | | | | | | | | | | |
2014(b)(c) | | $ | 13.35 | | | 0.19 | | | 0.08 | | | | 0.27 | | | | (0.19 | ) | | | — | | | | (0.19 | ) | | $13.43 | | | 2.91 | (d) | | | 0.96 | (d) | | | 0.96 | (d) | | | 0.96 | (d) | | | 2.07 | | | 3.75 | | $ | 149,932 | |
2013(b) | | $ | 13.95 | | | 0.38 | | | (0.60 | ) | | | (0.22 | ) | | | (0.38 | ) | | | — | | | | (0.38 | ) | | $13.35 | | | 2.76 | | | | 0.96 | | | | 0.95 | | | | 0.96 | | | | (1.61 | ) | | 11.78 | | $ | 158,499 | |
2012(b) | | $ | 13.72 | | | 0.41 | | | 0.24 | | | | 0.65 | | | | (0.41 | ) | | | (0.01 | ) | | | (0.42 | ) | | $13.95 | | | 2.95 | | | | 0.95 | | | | 0.95 | | | | 0.95 | | | | 4.80 | | | 11.66 | | $ | 187,578 | |
2011(b) | | $ | 13.78 | | | 0.44 | | | (0.05 | ) | | | 0.39 | | | | (0.44 | ) | | | (0.01 | ) | | | (0.45 | ) | | $13.72 | | | 3.23 | | | | 0.96 | | | | 0.96 | | | | 0.96 | | | | 2.93 | | | 10.64 | | $ | 185,208 | |
2010(b) | | $ | 13.63 | | | 0.43 | | | 0.15 | | | | 0.58 | | | | (0.43 | ) | | | — | | | | (0.43 | ) | | $13.78 | | | 3.19 | | | | 0.96 | | | | 0.96 | | | | 0.96 | | | | 4.38 | | | 7.70 | | $ | 202,870 | |
2009(b) | | $ | 12.64 | | | 0.47 | | | 0.99 | | | | 1.46 | | | | (0.47 | ) | | | — | | | | (0.47 | ) | | $13.63 | | | 3.62 | | | | 0.96 | | | | 0.96 | | | | 0.96 | | | | 11.79 | | | 14.12 | | $ | 187,940 | |
CLASS D SHARES | | | | | | | | | | | | | | | | | | | | | | | | | | | | | | | | | | | | | | | | | | | | | | | | |
2014(c) | | $ | 13.36 | | | 0.18 | | | 0.07 | | | | 0.25 | | | | (0.18 | ) | | | — | | | | (0.18 | ) | | $13.43 | | | 2.65 | (d) | | | 1.23 | (d) | | | 1.22 | (d) | | | 1.23 | (d) | | | 1.86 | | | 3.75 | | $ | 28,205 | |
2013 | | $ | 13.96 | | | 0.34 | | | (0.59 | ) | | | (0.25 | ) | | | (0.35 | ) | | | — | | | | (0.35 | ) | | $13.36 | | | 2.51 | | | | 1.21 | | | | 1.21 | | | | 1.22 | | | | (1.85 | ) | | 11.78 | | $ | 28,858 | |
2012 | | $ | 13.72 | | | 0.37 | | | 0.26 | | | | 0.63 | | | | (0.38 | ) | | | (0.01 | ) | | | (0.39 | ) | | $13.96 | | | 2.71 | | | | 1.18 | | | | 1.18 | | | | 1.22 | | | | 4.62 | | | 11.66 | | $ | 31,984 | |
2011 | | $ | 13.78 | | �� | 0.40 | | | (0.05 | ) | | | 0.35 | | | | (0.40 | ) | | | (0.01 | ) | | | (0.41 | ) | | $13.72 | | | 2.97 | | | | 1.22 | | | | 1.21 | | | | 1.22 | | | | 2.66 | | | 10.64 | | $ | 24,228 | |
2010 | | $ | 13.63 | | | 0.28 | | | 0.27 | | | | 0.55 | | | | (0.40 | ) | | | — | | | | (0.40 | ) | | $13.78 | | | 2.92 | | | | 1.22 | | | | 1.22 | | | | 1.71 | | | | 4.11 | | | 7.70 | | $ | 24,068 | |
2009 | | $ | 12.64 | | | 0.44 | | | 0.99 | | | | 1.43 | | | | (0.44 | ) | | | — | | | | (0.44 | ) | | $13.63 | | | 3.35 | | | | 1.23 | | | | 1.23 | | | | 1.73 | | | | 11.50 | | | 14.12 | | $ | 17,301 | |
CLASS I SHARES | | | | | | | | | | | | | | | | | | | | | | | | | | | | | | | | | | | | | | | | | | | | | | | | |
2014(c) | | $ | 13.35 | | | 0.21 | | | 0.08 | | | | 0.29 | | | | (0.22 | ) | | | — | | | | (0.22 | ) | | $13.42 | | | 3.24 | (d) | | | 0.64 | (d) | | | 0.63 | (d) | | | 0.64 | (d) | | | 2.15 | | | 3.75 | | $ | 30,805 | |
2013 | | $ | 13.95 | | | 0.43 | | | (0.61 | ) | | | (0.18 | ) | | | (0.42 | ) | | | — | | | | (0.42 | ) | | $13.35 | | | 3.09 | | | | 0.61 | | | | 0.61 | | | | 0.61 | | | | (1.29 | ) | | 11.78 | | $ | 25,590 | |
2012 | | $ | 13.71 | | | 0.46 | | | 0.25 | | | | 0.71 | | | | (0.46 | ) | | | (0.01 | ) | | | (0.47 | ) | | $13.95 | | | 3.30 | | | | 0.61 | | | | 0.61 | | | | 0.61 | | | | 5.24 | | | 11.66 | | $ | 38,099 | |
2011 | | $ | 13.77 | | | 0.48 | | | (0.05 | ) | | | 0.43 | | | | (0.48 | ) | | | (0.01 | ) | | | (0.49 | ) | | $13.71 | | | 3.57 | | | | 0.62 | | | | 0.61 | | | | 0.62 | | | | 3.28 | | | 10.64 | | $ | 41,645 | |
2010 | | $ | 13.62 | | | 0.67 | | | (0.04 | ) | | | 0.63 | | | | (0.48 | ) | | | — | | | | (0.48 | ) | | $13.77 | | | 3.53 | | | | 0.61 | | | | 0.61 | | | | 0.61 | | | | 4.74 | | | 7.70 | | $ | 26,971 | |
2009 | | $ | 12.63 | | | 0.52 | | | 0.99 | | | | 1.51 | | | | (0.52 | ) | | | — | | | | (0.52 | ) | | $13.62 | | | 3.96 | | | | 0.62 | | | | 0.62 | | | | 0.62 | | | | 12.18 | | | 14.12 | | $ | 27,508 | |
| (a) | Not annualized for periods less than one year. |
| (b) | Sales loads are not reflected in computing total return. |
| (c) | Unaudited Six Month Period Ended March 31. |
| + | Based on weighted average shares outstanding, except for Dividends from Net Investment Income and Net Realized Gains, which are actual amounts per share. |
See notes to financial statements.
| | | | |
| 22 Certified Semi-Annual Report | | | | Certified Semi-Annual Report 23 |
| | |
| EXPENSE EXAMPLE | | |
| |
Thornburg New Mexico Intermediate Municipal Fund | | March 31, 2014 (Unaudited) |
As a shareholder of the Fund, you incur two types of costs:
| | (1) | transaction costs, including |
(a) sales charges (loads) on purchase payments, for Class A shares;
(b) a deferred sales charge on redemptions of any part or all of a purchase of $1 million of Class A shares within 12 months of purchase;
| | (2) | ongoing costs, including management fees; distribution and/or service (12b-1) fees; and other Fund expenses. |
This example is intended to help you understand your ongoing costs (in dollars) of investing in the Fund and to compare these costs with the ongoing costs of investing in other mutual funds.
The example is based on a $1,000 investment beginning on October 1, 2013, and held until March 31, 2014.
| | | | | | | | | | | | |
| | | BEGINNING
ACCOUNT VALUE
10/1/13 | | | ENDING
ACCOUNT VALUE
3/31/14 | | | EXPENSES PAID
DURING PERIOD†
10/1/13–3/31/14 | |
Class A Shares | | | | | | | | | | | | |
Actual | | $ | 1,000.00 | | | $ | 1,020.70 | | | $ | 4.83 | |
Hypothetical* | | $ | 1,000.00 | | | $ | 1,020.15 | | | $ | 4.83 | |
Class D Shares | | | | | | | | | | | | |
Actual | | $ | 1,000.00 | | | $ | 1,018.60 | | | $ | 6.16 | |
Hypothetical* | | $ | 1,000.00 | | | $ | 1,018.83 | | | $ | 6.16 | |
Class I Shares | | | | | | | | | | | | |
Actual | | $ | 1,000.00 | | | $ | 1,021.50 | | | $ | 3.19 | |
Hypothetical* | | $ | 1,000.00 | | | $ | 1,021.77 | | | $ | 3.19 | |
| † | Expenses are equal to the annualized expense ratio for each class (A: 0.96%; D: 1.22%; I: 0.63%) multiplied by the average account value over the period, multiplied by 182/365 to reflect the one-half year period. |
| * | Hypothetical assumes a rate of return of 5% per year before expenses. |
Actual Expenses
For each class of shares, the first line of the accompanying table provides information about actual account values and actual expenses. You may use the information in this line, together with the amount you invested, to estimate the expenses that you paid over the period. Simply divide your account value by $1,000 (for example, an $8,600 account value divided by $1,000 = 8.6), then multiply the result by the number in the first line for your class of shares under the heading entitled “Expenses Paid During Period” to estimate the expenses you paid on your account during this period.
Hypothetical Example for Comparison Purposes
For each class of shares, the second line of the accompanying table provides information about hypothetical account values and hypothetical expenses based on the Fund’s actual expense ratio and an assumed rate of return of 5% per year before expenses, which is not the Fund’s actual return. The hypothetical account values and expenses may not be used to estimate the actual ending account balance or expenses you paid for the period. You may use this information to compare the ongoing costs of investing in the Fund and other funds. To do so, compare this 5% hypothetical example with the 5% hypothetical examples that appear in the shareholder reports of the other funds.
Please note that the expenses shown in the table are meant to highlight your ongoing costs only and do not reflect any transactional costs, such as sales charges (loads), redemption fees, or exchange fees. Therefore, the second line of the table for each class of shares is useful in comparing ongoing costs only, and will not help you determine the relative total costs of owning different funds. In addition, if these transactional costs were included, your costs would have been higher.
24 Certified Semi-Annual Report
| | |
| OTHER INFORMATION | | |
| |
Thornburg New Mexico Intermediate Municipal Fund | | March 31, 2014 (Unaudited) |
Portfolio Proxy Voting
Policies and Procedures:
The Trust has delegated to Thornburg Investment Management, Inc. (the “Advisor”) voting decisions respecting proxies for the Fund’s voting securities. The Advisor makes voting decisions in accordance with its Proxy Voting Policy. A description of the Policy is available (i) without charge, upon request, by calling the Advisor toll-free at 1-800-847-0200, (ii) on the Thornburg website at www.thornburg. com, and (iii) on the Securities and Exchange Commission’s website at www.sec.gov.
Information regarding how proxies were voted is available on or before August 31 of each year for the twelve months ending the preceding June 30. This information is available (i) without charge, upon request by calling the Advisor toll-free at 1-800-847-0200, (ii) on the Thornburg website at www.thornburg.com, and (iii) on the Securities and Exchange Commission’s website at www.sec.gov.
Availability of Quarterly Portfolio Schedule
The Fund files with the Securities and Exchange Commission schedules of its portfolio holdings on Form N-Q for the first and third quarters of each fiscal year. The Fund’s Forms N-Q are available on the Commission’s website at www.sec.gov, or may be reviewed and copied at the Commission’s Public Reference Room in Washington, D.C. Information on the operation of the Public Reference Room may be obtained by calling 1-800-SEC-0330. The Fund also makes this information available on its website at www.thornburg. com/download or upon request by calling 1-800-847-0200.
Certified Semi-Annual Report 25
| | |
| TRUSTEES’ STATEMENT TO SHAREHOLDERS | | |
| |
Not part of the Certified Semi-Annual Report Reissued September 15, 2013 | | |
The Trustees believe current and prospective shareholders should know how we discharge our responsibilities in supervising the Funds’ investment advisor and in reviewing the advisor’s contract for renewal. Since 2005, we have issued a statement which sets out clearly the three principal guidelines that we follow in supervising the Trust’s investment advisor on your behalf. In accordance with our customary practice, in September of this year we again reviewed our statement and concluded we should reissue this statement outlining the principal features of our supervision of the advisor’s performance of investment management services for the Funds.
We begin with the premise that each shareholder selected his or her Fund because its investments are managed by the investment advisor identified in the prospectus and in accordance with the objective and policies described in the prospectus. We realize, as each of you do, that if you believe that your Fund’s stated objective and policies no longer serve your personal investment goals, you can sell your shares and leave the Fund.
Therefore, we believe that our primary supervisory task – our principal obligation to you – is to assess the nature and quality of the advisor’s services, and to confirm that the advisor actively and competently pursues the Fund’s objective, in accordance with the policies set out in the prospectus. To do this, we meet regularly with management to review your Fund’s portfolio and to discuss the advisor’s specific actions and judgments in pursuing the Fund’s objective. We do not substitute our own judgment for the advisor’s decisions in selecting investments; the advisor is paid to exercise its informed judgment on investment decisions, and we seek to confirm, in reviewing the advisor’s performance, that the advisor is doing just that.
Second, while we are conscious of costs and the effect that costs have on shareholders’ returns, we do not seek the lowest fees or expense ratio as our sole or primary objective. We try to make sure that your Fund’s fees and costs are reasonable in relationship to the services rendered and that they are generally in line with those charged by other expert investment advisors, consistent with our belief that the Fund’s investors searched for and expect that expertise and attention and have decided to pay a reasonable price for it. We do not put the management contract “out to bid” as a matter of course, and we would not do so unless we had concluded that the advisor materially had failed to pursue the Fund’s objectives in accordance with its policies, or for other equally important reasons. We believe that any other approach would be inconsistent with your interests and contrary to your expectations when you bought shares of the Fund in the first place.
Finally, because we believe that most Thornburg Fund shareholders have invested with a long-term perspective, we try not to focus too much on the fashions of the moment and on short-term performance. The market will not favor any specific investment objective or set of policies at all times and under all economic circumstances. A fund will experience periods of both high and low returns relative to other funds and other investments. Even if one of our Funds is not favored by the market at a particular time, we believe that the advisor is nonetheless obliged to remain true to the Fund’s objective and policies, and we watch to see that it does so.
26 This page is not part of the Semi-Annual Report
RETIREMENT AND EDUCATION ACCOUNTS
Thornburg Investment Management offers retirement and education savings accounts that can help you meet a variety of planning challenges. For account applications or further information on any of the accounts below, please call 1-800-847-0200 or go to www.thornburg.com/ira. Your financial advisor can help you determine which plan is right for you.
Individual Retirement Accounts
Individual Retirement Accounts (IRAs) provide a tax-advantaged means to save money for the future. For a detailed outline of the difference between retirement accounts, see www.thornburg.com/ira. Rollovers are available. Call 1-800-847-0200 for more information.
Traditional IRAs – Contributions to Traditional IRAs are tax deductible for eligible individuals, and withdrawals are taxed as additional ordinary income. You may contribute to an IRA if you receive compensation and are under 70 1/2, even if you are covered by an employer retirement plan. Deductible contributions are subject to certain qualifications. Please consult your tax advisor.
Roth IRAs – Under a Roth IRA, there is no tax deduction for contributions, but there is no income tax on qualified withdrawals. For a more detailed comparison of Traditional and Roth IRAs, please see our website at www.thornburg.com/ira.
SEP IRAs – Simplified Employee Pension (SEP) IRAs are established by employers. The employer is allowed a tax deduction for contributions made to the SEP Plan and makes contributions to each eligible employee’s SEP IRA on a discretionary basis.
SIMPLE IRAs – Savings Incentive Match Plan for Employees of Small Employers (SIMPLE) is designed to give small business owners a simplified method to establish and contribute to a retirement plan for employees. The employer is allowed a tax deduction for contributions and makes either matching or non-elective contributions to each eligible employee’s SIMPLE IRA. Employees may make salary deferral contributions.
Coverdell Education Savings Account
These savings accounts are designed to provide a way to save money for higher education expenses. In an Education Savings Account, earnings and interest grow tax-free, and qualified withdrawals used to pay for eligible higher-education expenses are tax- and penalty-free.
Funds Available
The following funds are available in the accounts listed above:
| | • | | Thornburg Core Growth Fund |
| | • | | Thornburg International Value Fund |
| | • | | Thornburg International Growth Fund |
| | • | | Thornburg Developing World Fund |
| | • | | Thornburg Investment Income Builder Fund |
| | • | | Thornburg Global Opportunities Fund |
| | • | | Thornburg Low Duration Income Fund |
| | • | | Thornburg Limited Term U.S. Government Fund |
| | • | | Thornburg Limited Term Income Fund |
| | • | | Thornburg Strategic Income Fund |
This page is not part of the Semi-Annual Report 27

THORNBURG FUND FAMILY
Thornburg Equity Funds
Thornburg’s equity research uses a fundamentally driven, bottom-up, comprehensive analytical approach. Thornburg equity funds generally focus on a limited number of securities so that each holding can impact performance. The team searches for firms believed to have a promising future and seeks to buy shares of those companies at a discount to their intrinsic or long-term value.
| | • | | Thornburg Core Growth Fund |
| | • | | Thornburg International Value Fund |
| | • | | Thornburg International Growth Fund |
| | • | | Thornburg Developing World Fund |
| | • | | Thornburg Investment Income Builder Fund |
| | • | | Thornburg Global Opportunities Fund |
Thornburg Bond Funds
Thornburg Investment Management applies a disciplined philosophy to fixed-income management. Since the launch of our first fixed-income fund over 25 years ago, we have been conducting fundamental, bottom-up research in an effort to identify bonds which we believe provide the best return for a given level of risk. We avoid leverage or complex strategies which could backfire in periods of market uncertainty.
| | • | | Thornburg Low Duration Income Fund |
| | • | | Thornburg Limited Term U.S. Government Fund |
| | • | | Thornburg Limited Term Income Fund |
| | • | | Thornburg Strategic Income Fund |
| | • | | Thornburg Low Duration Municipal Fund |
| | • | | Thornburg Limited Term Municipal Fund |
| | • | | Thornburg Intermediate Municipal Fund |
| | • | | Thornburg California Limited Term Municipal Fund |
| | • | | Thornburg New Mexico Intermediate Municipal Fund |
| | • | | Thornburg New York Intermediate Municipal Fund |
| | • | | Thornburg Strategic Municipal Income Fund |
Before investing, carefully consider the Fund’s investment goals, risks, charges, and expenses. For a prospectus or summary prospectus containing this and other information, contact your financial advisor or visit thornburg.com. Read it carefully before investing.
For additional information, please visit thornburg.com
Thornburg Investment Management, Inc. 2300 North Ridgetop Road, Santa Fe, NM 87506
This page is not part of the Semi-Annual Report 29
This page intentionally left blank.
30 This page is not part of the Semi-Annual Report
This page intentionally left blank.
This page is not part of the Semi-Annual Report 31

This Semi-Annual Report is submitted for the general information of shareholders of the Fund. It is not authorized for distribution to prospective investors in the Fund unless preceded or accompanied by an effective prospectus.
| | | | |
| Investment Advisor: | | Distributor: | | |
| Thornburg Investment Management® | | Thornburg Securities Corporation® | | |
| 800.847.0200 | | 800.847.0200 | | TH178 |

2 This page is not part of the Semi-Annual Report
IMPORTANT INFORMATION

Best New York Intermediate Municipal Debt Fund
Lipper Classification Awards are granted annually to the fund in each Lipper classification that consistently delivered the strongest risk-adjusted performance (calculated with dividends reinvested). In 2014, Class I shares won for the three-year period ended 11/30/2013 among 31 funds. The Fund did not win the award for other time periods.
The information presented on the following pages was current as of March 31, 2014. The managers’ views, portfolio holdings, and sector diversification are provided for the general information of the Fund’s shareholders; to the extent this information is historical, it should not be considered predictive of future circumstances. This material should not be deemed a recommendation to buy or sell any of the securities mentioned.
Investments in the Fund carry risks, including possible loss of principal. Bond funds have the same interest rate, inflation, and credit risks that are associated with the underlying bonds. The principal value of bonds will fluctuate relative to changes in interest rates, decreasing when interest rates rise. Unlike bonds, bond funds have ongoing fees and expenses. Please see the Fund’s Prospectus for a discussion of the risks associated with an investment in the Fund. Investments in the Fund are not FDIC insured, nor are they deposits of or guaranteed by a bank or any other entity. There is no guarantee that the Fund will meet its investment objectives. Diversification does not assure or guarantee better performance and cannot eliminate the risk of investment losses. The laddering strategy does not assure or guarantee better performance and cannot eliminate the risk of investment losses.
Performance data given at net asset value (NAV) does not take into account the applicable sales charges. If the sales charges had been included, the performance would have been lower.
Minimum investments for Class I shares are higher than those for other classes. Class I shares may not be available to all investors.
| | | | |
Share Class | | NASDAQ Symbol | | CUSIP |
Class A | | THNYX | | 885-215-665 |
Class I | | TNYIX | | 885-216-705 |
Glossary
Bloomberg Economic Evaluation of States (BEES) Index – A survey, updated quarterly, that examines the pace of states’ growth following the 18-month recession that officially ended in June 2009.
Bloomberg State Stock Indices – Capitalization-weighted indices consisting of equities domiciled in each state.
BofA Merrill Lynch 3-15 Year U.S. Municipal Securities Index – This index is a subset of the BofA Merrill Lynch U.S. Municipal Securities Index including all securities with a remaining term to final maturity greater than or equal to 3 years and less than 15 years.
Consumer Price Index (CPI) – Index that measures prices of a fixed basket of goods bought by a typical consumer, including food, transportation, shelter, utilities, clothing, medical care, entertainment and other items. The CPI, published by the Bureau of Labor Statistics in the Department of Labor, is based at 100 in 1982 and is released monthly. It is widely used as a cost-of-living benchmark to adjust Social Security payments and other payment schedules, union contracts and tax brackets. Also known as the cost-of-living index.
Unless otherwise noted, index returns reflect the reinvestment of income dividends and capital gains, if any, but do not reflect fees, brokerage commissions or other expenses of investing. Investors may not make direct investments into any index.
Alternative Minimum Tax (AMT) – A federal tax aimed at ensuring that high-income individuals, estates, trusts, and corporations pay a minimal level income tax. For individuals, the AMT is calculated by adding tax preference items to regular taxable income.
Annualized Distribution Yield – The distribution yield reflects actual distributions made to shareholders. The annualized distribution yield is calculated by summing the last 30 days of income at a given month end and annualizing to a 360-day year. The result is divided by the ending maximum offering price.
Barbell Structure – A bond investment strategy that concentrates holdings in shorter-term and longer-term maturities, forming a structure that resembles a barbell.
Basis Point (bp) – A unit equal to 1/100th of 1%. 1% = 100 basis points (bps).
Bond Credit Ratings – A bond credit rating assesses the financial ability of a debt issuer to make timely payments of principal and interest. Ratings of AAA (the highest), AA, A, and BBB are investment-grade quality. Ratings of BB, B, CCC, CC, C, and D (the lowest) are considered below investment grade, speculative grade, or junk bonds. Unless otherwise noted, the ratings listed are from Municipal Market Data and are a combination of ratings from Standard and Poor’s, Moody’s Investors Service, and Fitch Ratings.
Bullet Structure – A bond investment strategy that concentrates holdings in intermediate-term maturities and avoids shorter-term or longer-term maturities.
Credit Spread/Quality Spread – The difference between the yields of securities with different credit qualities.
Duration – A bond’s sensitivity to interest rates. Bonds with longer durations experience greater price volatility than bonds with shorter durations.
Effective Duration – A bond’s sensitivity to interest rates, incorporating the embedded option features, such as call provisions. Bonds with longer durations experience greater price volatility than bonds with shorter durations.
Fed Funds Rate – The interest rate at which a depository institution lends immediately available funds (balances at the Federal Reserve) to another depository institution overnight.
General Obligation Bond – A municipal bond backed by the credit and “taxing power” of the issuing jurisdiction rather than the revenue from a given project.
Gross Domestic Product (GDP) – A country’s income minus foreign investments: the total value of all goods and services produced within a country in a year, minus net income from investments in other countries.
Participation Rate – The number of people who are either employed or are actively looking for work. The people who are no longer actively searching for work would not be included in the participation rate. During an economic recession, many workers often get discouraged and stop looking for employment, as a result, the participation rate decreases.
Quantitative Easing – The Federal Reserve’s monetary policy intended to stimulate the U.S. economy following the recession that began in 2007/08.
Quantitative Easing 3 (QE3) – The third round of the Federal Reserve’s monetary policy intended to stimulate the U.S. economy following the recession that began in 2007/08. Announced in September 2012 and revised in December 2012, December 2013, and January 2014, the Fed intends to buy $65 billion in mortgage-backed securities and Treasuries each month until the economy improves.
SEC Yield – SEC yield is computed in accordance with SEC standards measuring the net investment income per share over a specified 30-day period expressed as a percentage of the maximum offering price of the Fund’s shares at the end of the period.
Yield Curve – A line that plots the interest rates, at a set point in time, of bonds having equal credit quality, but differing maturity dates.
This page is not part of the Semi-Annual Report 3
THORNBURG NEW YORK INTERMEDIATE MUNICIPAL FUND
Laddering – an All Weather Strategy
At Thornburg, our approach to management of the Fund is based on the premise that investors in the Fund seek preservation of capital along with an attractive, relatively stable yield. While aggressive bond strategies may generate stronger returns when the market is turning a blind eye towards risk, they often fail to stack up over longer periods of time.
We apply these techniques to manage risk and pursue attractive returns:
| | • | | Building a laddered portfolio. Laddering has been shown over time to mitigate reinvestment and interest rate risk. |
| | • | | Conducting in-depth fundamental research on each issue and actively monitoring positions for subsequent credit events. |
| | • | | Diversifying among a large number of generally high-quality bonds. |
| | • | | Investing on a cash-only basis without using leverage. |
Portfolio Managers

Josh Gonze Chris Ryon, CFA
Objectives and Strategies
The Fund’s primary investment objective is to obtain as high a level of current income exempt from federal, New York State and New York City individual income taxes as is consistent, in the view of the Fund’s investment advisor, with preservation of capital.
The secondary goal of the Fund is to reduce expected changes in its share price compared to long-term bond portfolios.
The Fund offers New York investors double (or for New York City residents triple) tax-free yields in a laddered municipal bond portfolio with an average maturity of normally three to ten years (may be subject to Alternative Minimum Tax). Laddering involves building a portfolio of bonds with staggered maturities so that a portion of the portfolio matures each year. Cash from maturing bonds, if not needed for other purposes, is invested in bonds with longer maturities at the far end of the ladder. We regard the strategy as a good compromise for managing different types of risk.
Long-Term Stability of Principal
Net Asset Value History of A Shares from September 5, 1997 through March 31, 2014
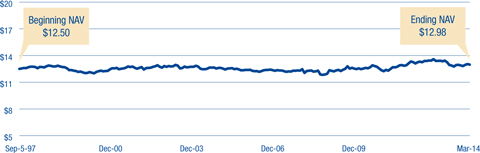
Average Annual Total Returns
For Periods Ended March 31, 2014
| | | | | | | | | | | | | | | | | | | | |
| | | 1 Yr | | | 3 Yrs | | | 5 Yrs | | | 10 Yrs | | | Since
Inception | |
A Shares (Incep: 9/5/97) | | | | | | | | | | | | | | | | | | | | |
Without sales charge | | | -0.37 | % | | | 4.61 | % | | | 4.29 | % | | | 3.51 | % | | | 4.13 | % |
With sales charge | | | -2.34 | % | | | 3.91 | % | | | 3.87 | % | | | 3.30 | % | | | 4.00 | % |
Performance data shown represents past performance and is no guarantee of future results. Investment return and principal value will fluctuate so shares, when redeemed, may be worth more or less than their original cost. Current performance may be lower or higher than quoted. For performance current to the most recent month end, visit thornburg.com or call 800.847.0200.
The maximum sales charge for the Fund’s Class A shares is 2.00%. The total annual operating expenses of Class A shares are 1.05%, as disclosed in the most recent Prospectus. Thornburg Investment Management and/or Thornburg Securities Corporation have contractually agreed to waive fees and reimburse expenses until at least February 1, 2015, resulting in a net expense ratio of 0.99%. For more detailed information, please see the fund’s prospectus.
30-Day Yields, A Shares
As of March 31, 2014
| | | | |
Annualized Distribution Yield | | | 2.09 | % |
| |
SEC Yield | | | 1.22 | % |
Without fee waivers and expense reimbursements, the 30-day SEC Yield would have been 1.19% and the Annualized Distribution Yield would have been 2.06%.
Key Portfolio Attributes
As of March 31, 2014
| | | | |
Number of Bonds | | | 69 | |
| |
Effective Duration | | | 5.3 Yrs | |
| |
Average Maturity | | | 7.9 Yrs | |
See the entire portfolio in the Schedule of Investments beginning on page 11.
4 This page is not part of the Semi-Annual Report
THORNBURG’S SUITE OF MUNICIPAL FUNDS
| | |
Municipal Funds for a Range of Interest-Rate Scenarios At Thornburg, we often say that predicting interest rates is a fool’s game. And with the Federal Reserve still heavily involved in the markets, it’s even more difficult to forecast how rates may rise than when they may rise. Will long rates rise first and short rates follow? Will long and short rates climb simultaneously? A traditional strategy to protect oneself against interest-rate risk is to move into shorter-duration bond strategies. But the seemingly counterintuitive response of moving to longer-duration strategies can sometimes yield better results. Diversify Across the Yield Curve This uncertainty points to why it’s important for investors to match their investment horizon to the duration of the strategy in which they’re invested, and to diversify assets across the yield curve. For any interest-rate scenario, Thornburg’s comprehensive suite of municipal funds gives prudent investors the ability to diversify across the yield curve. Diversify Across the Yield Curve with Thornburg Municipal Funds AAA General Obligation Municipal Yield Curve, as of April 2, 2014 
| |  |
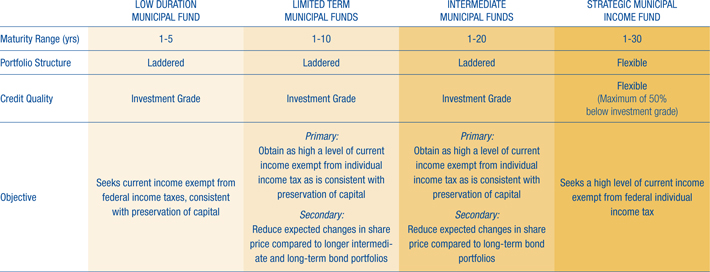
This page is not part of the Semi-Annual Report 5

Thornburg New York Intermediate Municipal Fund
March 31, 2014
This report is certified under the Sarbanes-Oxley Act of 2002, which requires that public companies, including mutual funds, affirm that the information provided in their annual and semiannual shareholder reports fully and fairly represents their financial position and the results of their operations for the period presented.
6 Certified Semi-Annual Report
LETTER TO SHAREHOLDERS
April 15, 2014
Dear Shareholder:
We are pleased to present the semi-annual report for the Thornburg New York Intermediate Municipal Fund. The net asset value (NAV) of the Class A shares increased by $0.05 cents to $12.98 per share during the six months ended March 31, 2014. If you were with us for the entire period, you received dividends of 15.3 cents per share. If you reinvested your dividends, you received 15.4 cents per share. Dividends were higher for Class I shares to account for varying class-specific expenses. The Class A shares of your Fund underperformed its index with a total return of 1.58% at NAV for the six months ended March 31, 2014, compared to the 2.88% total return for the BofA Merrill Lynch 3-15 Year U.S. Municipal Securities Index (BAML 3-15 Year Municipal Index). The Fund generated 0.29% less price return and 1.01% less income than the index.
The first six months of fiscal 2014 were very interesting as interest-rate changes went in various directions, depending on the maturity discussed. This period certainly highlighted that interest rates do not change uniformly across the entire maturity spectrum (the yield curve).
Chart I illustrates how yields changed during the period. The gold bars show the yield changes from September 30, 2013 through December 31, 2013. Short-term yields (maturities of five years or less) moved lower, while yields in maturities from five years to 20 years moved higher by varying amounts, and longer-term maturities were flat to slightly lower. It is good to remember the tone of the market during that period. Most market commentators believed the stock market and yields were going in the same direction: up. The blue bars show the yield changes from December 31, 2013 through March 31, 2014. Again, yield changes were not uniform across the yield curve. This time, after the new U.S. Federal Reserve Chair Janet Yellen hinted that short-term interest rates may eventually need to increase, short-term yields increased and long-term yields decreased.
Investors may wonder how best to protect themselves from these changes. One way to hedge this risk is to own securities or mutual funds that spread their investments across the different segments of the yield curve. In our opinion, that would mean owning some of our new Thornburg Low Duration Municipal Fund and our Limited Term Municipal, Intermediate Municipal, and Strategic Municipal Income Funds. The percentage ownership of each would depend on levels of risk tolerance.
Throughout the six-month period the Fund maintained a lower risk posture on interest rates than its benchmark; the average effective duration was 5.26 years compared to 5.69 years for the benchmark. This detracted from relative performance by 0.03% as interest rates increased during the period. The Fund’s positioning along the yield curve added 0.33% of relative performance. Sector allocations were a detractor, taking 0.94% of performance compared to the benchmark. The Fund’s credit quality added 0.37% of positive performance. Security selection was a negative factor, causing 0.30% of underperformance, and other factors added 0.28% to the Fund.
Chart I Changes in AAA General-Obligation Municipal Yield Curve
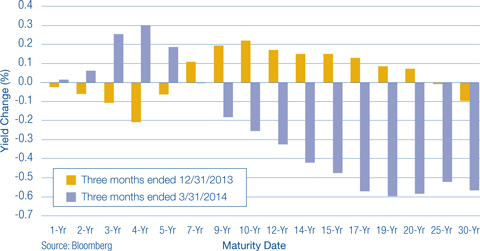
Certified Semi-Annual Report 7
LETTER TO SHAREHOLDERS,
CONTINUED
Chart II Labor Market Indicators
2/28/1990 – 3/31/2014
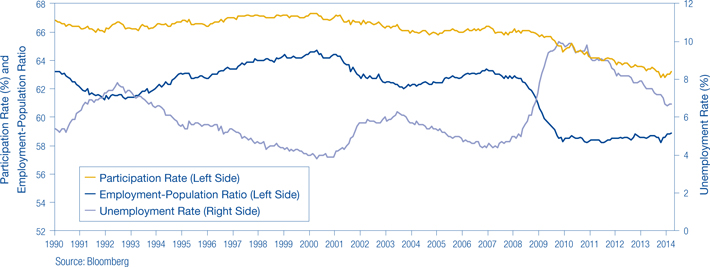
The Economy and the Federal Reserve
Gross domestic product (GDP) for the year ended December 31, 2013 came in at 2.6%, around its long-term average (to March 1990) of 2.5%. Additions to non-farm payroll employment have averaged about 185,000 per month for the six months ended March 31, 2014. The unemployment rate has declined to 6.7%, but it has been clouded by a declining labor participation rate. The percentage of the U.S. population that is employed has declined to 58.9% as of March 31, 2014, from 63.3% on March 31, 2007. The retirement of the “baby boomer” generation certainly contributes to this decline, but does not account for all of it. Chart II illustrates each of these trends from 1990.
Inflation, the bondholder’s worst enemy, has remained well controlled in the last six months. The year-over-year change in the Consumer Price Index (CPI) increased to 1.5% as of March 31, 2014 from 1.2% as of September 30, 2013. Subtracting the food and energy components to arrive at the core measure presents a picture of a well-behaved, unchanged 1.7%. The economic backdrop is one of mild expansion with low inflation. The $64,000 question is, “How long can it last?”
In January 2014, Janet Yellen replaced Ben Bernanke as Federal Reserve Chair. Her appointment as Fed Chair assured a continuation of current Fed policies. Last year, Bernanke roiled the fixed income markets by alluding to the prospect of a decrease in the Fed’s monthly purchases of Treasury and mortgage-backed securities, the tapering of QE3. Rates went up! This year, the tapering started in actuality with the Fed reducing its purchases by $10.0 billion per meeting. Rates went down! Go figure!
Chair Yellen learned that in her new position (to borrow an old E.F. Hutton advertisement tag line), “When she speaks, markets listen.” At her first news conference, Ms. Yellen tried to clarify what “for a considerable time” meant from the last Fed Statement: “This is the kind of term it’s hard to define,” Yellen said. “Probably means something on the order of six months, or that type of thing” [after QE3 tapering ends]. This sent the debt markets, especially the short-term debt markets, lower in price and higher in yield. The results can be seen in Chart I.
8 Certified Semi-Annual Report
LETTER TO SHAREHOLDERS,
CONTINUED
The Municipal Market
The municipal market has performed very well over the last six months. The monthly outflows from municipal bond mutual funds have abated. The Investment Company Institute (ICI), an industry trade group, has reported that for the last three months of calendar year 2013, municipal bond mutual funds lost an average of $6.6 billion per month. For the first three months of 2014, municipal bond mutual funds experienced $1.1 billion of inflows per month. This is not a significant amount, but at least it is positive.
These cash flows would normally not support a significantly positive return environment, but when coupled with a decline in new issuance of municipal bonds, a clearer picture presents itself. The supply of new municipal bonds was down 26% for the first three months of 2014. So muted demand met with reduced supply, yielding positive results.
The overall economic health of the municipal bond market is improving, albeit unevenly. We arrive at this judgment in part through the use of the Bloomberg Economic Evaluation of States (BEES) Index, for New York, which includes:
| | • | | Mortgage delinquencies – from the Mortgage Bankers Association |
| | • | | State personal income – from the Bureau of Economic Analysis |
| | • | | Tax revenue – from the U.S. Census Bureau |
| | • | | Employment – from the Bureau of Labor Statistics |
| | • | | Home prices – from the Federal Housing Finance Agency |
| | • | | Bloomberg State Stock Index |
Table I shows the changes in these various economic factors for the state of New York from the fourth quarter of 2012 through the fourth quarter of 2013, the latest data available.
From the fourth quarter of 2012 through the last four months of 2013 the index has increased on average 2.0%. The national average was 2.8%, and the range for all 50 states and the District of Columbia went from a high of 8.8% to a low of negative 7.5%. For the comparable prior year period, the average was an increase of 0.2%, with a range of 9.9% to negative 4.1%. That said, state pension funds are still wrestling with some of their issues. The median funding levels have declined from 82.6% in 2007 to 68.6% in 2012 (the Pew Center on the States suggests a funding level of 80% is adequate). New York’s pension funding levels, one of the few states to exceed the Pew Center’s 80% adequate funding level, was reported at 90.5% in 2012, down from 104.5% in 2007.
Table I BEES Index: New York
| | |
ECONOMIC INDICATOR | | CHANGE FROM Q4 2012
THROUGH Q4 2013 |
Overall Economic Health | | 2.0% |
Mortgage Delinquency | | -0.7% |
Personal Income | | 0.4% |
Tax Revenue | | 6.0% |
Employment | | 1.3% |
Home Prices | | 1.8% |
Equity Index | | 32.3% |
Overall Economic Health Rank | | 4 out of 51
(District of Columbia included) |
Two municipal bond market credit stories (Detroit and Puerto Rico) continue to grab headlines. In Detroit’s case, some significant settlements have been announced, but they are short on specifics, including where the new cash came from, and are dependent upon state approval. As in most Chapter 9 proceedings, one should read very little into early reports because the final results may prove very different. For example, a settlement was announced between insured bondholders and the city for a recovery of about 74% of par (a bond’s original face value); a second component of the settlement was reached with several unions for 100% of existing pension obligations and a reduction in cost-of-living adjustments. The original opening offer for these parties was 20% of par for the bondholders, and between 75% and 95% of outstanding pension obligations. It appears to us that these compromises do not address the root problems.
Puerto Rico made the news in March 2014 by successfully coming to market with the largest “junk” bond deal in municipal market history. Puerto Rico, which is now rated BB, pulled off a $3.5 billion offering, which was purchased by non-traditional market participants, i.e. hedge funds. It was a 21-year maturity bond that was priced at $93.00 to yield 8.73%. We looked at the issue very closely as a potential addition to the Thornburg Strategic Municipal Income Fund and decided not to purchase it. The deal initially traded up to around $97.00 but as of this writing (close of business April 15th) it is trading at a dollar price of $87.50, a loss of almost 6.00% from the original offering price. Thornburg Funds are among the 30% of U.S. municipal mutual funds that do not own any debt from the Commonwealth of Puerto Rico.
Certified Semi-Annual Report 9
LETTER TO SHAREHOLDERS,
CONTINUED
Conclusion
Your Thornburg New York Intermediate Municipal Fund maintains a laddered portfolio structure, comprised of 51 municipal obligors as of March 31, 2014. We ladder our core portfolios, because we believe that this structure tends to maximize investor income. In our opinion, a laddered portfolio outperforms the other structures (bullet and barbell) two-thirds of the time.1 This structure effectively manages a portfolio’s yield-curve exposure by owning a roughly equal weighting of each maturity, thereby minimizing a major risk factor.
We diversify our holdings across the Fund’s investment universe. Chart I illustrates that yield changes are not uniform across the New York Intermediate Municipal Fund’s investment universe. Laddering also reduces reinvestment risk by ensuring that a portion of the portfolio matures each year so it can be reinvested. More importantly, it frees the team to concentrate on higher value-added tasks, such as performing fundamental bottom-up credit research. It is just this type of research that has allowed us to avoid the two largest, headline-grabbing credit issues in the municipal bond market.
This year has gotten off to a strong start. We thank you for the trust you have placed in us and will keep that foremost in our minds.
Sincerely,
| | | | |
 | |  | | |
| Christopher Ryon, CFA | | Josh Gonze | | |
| Portfolio Manager | | Portfolio Manager | | |
| Managing Director | | Managing Director | | |
| 1 | For a copy of the study go to www.thornburg.com/whyladder |
Chart III Percent of Portfolio Maturing
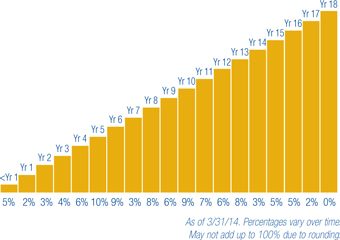
The matters discussed in this report may constitute forward-looking statements made pursuant to the safe harbor provisions of the Securities Litigation Reform Act of 1995. These include any advisor or portfolio manager prediction, assessment, analysis or outlook for individual securities, industries, investment styles, market sectors and/or markets. These statements involve risks and uncertainties. In addition to the general risks described for each fund in its current prospectus, other factors bearing on these reports include the accuracy of the advisor’s or portfolio manager’s forecasts and predictions, the appropriateness of the investment strategies designed by the advisor or portfolio manager and the ability of the advisor or portfolio manager to implement their strategies efficiently and successfully. Any one or more of these factors, as well as other risks affecting the securities markets generally, could cause the actual results of any fund to differ materially as compared to its benchmarks.
10 Certified Semi-Annual Report
| | |
| SCHEDULE OF INVESTMENTS | | |
| |
Thornburg New York Intermediate Municipal Fund | | March 31, 2014 (Unaudited) |
SUMMARY OF SECURITY CREDIT RATINGS†
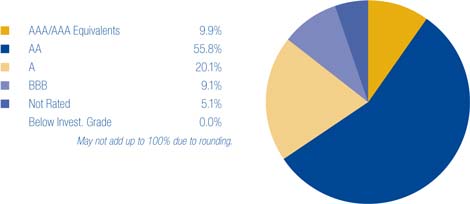
We have used ratings from Standard & Poor’s (S&P). Where S&P ratings are not available, we have used Moody’s Investors Service. Where neither rating is available, we have used ratings from Fitch Ratings. The category of investments identified as “AAA” in this graph includes investments which are pre-refunded or escrowed to maturity. Such investments are backed by an escrow or trust containing sufficient U.S. Government or U.S. Government agency securities to satisfy the timely payment of principal and interest and, therefore, are normally deemed to be equivalent to AAA-rated securities.
| | | | | | | | | | |
Issuer-Description | | Credit Rating†
S&P/ Moody’s | | Principal
Amount | | | Value | |
City of New York GO, 5.00% due 6/1/2019 pre-refunded 6/1/2016 (Insured: AGM) | | AA/Aa2 | | $ | 255,000 | | | $ | 280,403 | |
City of New York GO, 5.00% due 8/1/2019 (Government Financial Management) | | AA/Aa2 | | | 1,000,000 | | | | 1,170,510 | |
City of New York GO, 0.07% due 8/1/2021 put 4/1/2014 (LOC: JPMorgan Chase Bank) (daily demand notes) | | AAA/Aa1 | | | 1,000,000 | | | | 1,000,000 | |
City of New York GO, 5.00% due 8/1/2025 (Government Financial Management) | | AA/Aa2 | | | 400,000 | | | | 448,580 | |
City of New York GO, 5.00% due 8/1/2030 (Government Financial Management) | | AA/Aa2 | | | 1,000,000 | | | | 1,108,040 | |
County of Nassau GO, 5.00% due 4/1/2026 (Insured: BAM) | | AA/NR | | | 1,000,000 | | | | 1,112,320 | |
Dutchess County Local Development Corp., 5.00% due 7/1/2021 (Health Quest Systems, Inc.; Insured: AGM) | | AA/A2 | | | 535,000 | | | | 606,471 | |
Dutchess County Local Development Corp., 5.00% due 7/1/2022 (Health Quest Systems, Inc.; Insured: AGM) | | AA/A2 | | | 510,000 | | | | 570,496 | |
Erie County Industrial Development Agency, 5.25% due 5/1/2025 (Buffalo City School District) | | AA-/Aa3 | | | 1,000,000 | | | | 1,127,130 | |
Government of Guam, 5.375% due 12/1/2024 | | BBB+/NR | | | 1,000,000 | | | | 1,056,660 | |
Guam Waterworks Authority, 5.00% due 7/1/2028 (Water and Wastewater System) | | A-/Ba1 | | | 500,000 | | | | 519,480 | |
Hempstead Town Local Development Corp., 5.00% due 7/1/2028 (Hofstra University) | | A/A3 | | | 500,000 | | | | 539,655 | |
Long Island Power Authority, 5.25% due 9/1/2029 | | NR/Baa1 | | | 645,000 | | | | 744,343 | |
Monroe County Industrial Development Corp., 4.00% due 6/1/2016 (St. John Fisher College) | | BBB+/NR | | | 880,000 | | | | 927,159 | |
Nassau County IDA, 4.75% due 3/1/2026 (New York Institute of Technology) | | BBB+/Baa2 | | | 1,000,000 | | | | 1,032,510 | |
New York City Health and Hospitals Corp. GO, 5.00% due 2/15/2020 (Healthcare Facilities Improvements) | | A+/Aa3 | | | 770,000 | | | | 887,125 | |
New York City Health and Hospitals Corp. GO, 5.00% due 2/15/2025 (Healthcare Facilities Improvements) | | A+/Aa3 | | | 1,000,000 | | | | 1,084,410 | |
New York City Metropolitan Transportation Authority, 6.25% due 11/15/2023 | | A+/A2 | | | 1,000,000 | | | | 1,174,460 | |
New York City Transitional Finance Authority, 5.00% due 1/15/2020 (World Trade Center Recovery) (State Aid Withholding) | | AA-/Aa3 | | | 1,000,000 | | | | 1,135,100 | |
New York City Transitional Finance Authority, 5.00% due 11/1/2020 (World Trade Center Recovery) | | AAA/Aaa | | | 1,000,000 | | | | 1,072,660 | |
New York City Trust For Cultural Resources, 5.25% due 12/1/2018 (Lincoln Center for the Performing Arts) | | A+/A2 | | | 175,000 | | | | 203,877 | |
New York Convention Center Development Corp., 5.00% due 11/15/2017 (Hotel Unit Fee; Insured: AMBAC) | | NR/A1 | | | 1,000,000 | | | | 1,065,290 | |
New York Environmental Facilities Corp. PCR, 6.875% due 6/15/2014 | | AAA/Aaa | | | 110,000 | | | | 110,620 | |
New York Municipal Bond Bank Agency, 5.00% due 4/15/2018 (Insured: AGM) | | AA/A2 | | | 1,000,000 | | | | 1,138,030 | |
New York State Dormitory Authority, 5.00% due 10/1/2023 (School District Financing Program; Insured: AGM) (State Aid Withholding) | | AA/A2 | | | 400,000 | | | | 454,052 | |
New York State Dormitory Authority, 5.00% due 10/1/2014 (School District Financing Program; Insured: AGM) (State Aid Withholding) | | AA/A1 | | | 1,000,000 | | | | 1,023,690 | |
New York State Dormitory Authority, 5.00% due 2/15/2015 (Mental Health Services Facilities; Insured: AMBAC) | | AA-/NR | | | 1,000,000 | | | | 1,041,240 | |
New York State Dormitory Authority, 5.00% due 7/1/2016 (Bishop Henry B. Hucles Nursing Home; Insured: SONYMA) | | NR/Aa1 | | | 600,000 | | | | 658,338 | |
New York State Dormitory Authority, 5.00% due 10/1/2018 (School District Financing Program; Insured: AGM) | | AA/A1 | | | 1,000,000 | | | | 1,113,200 | |
New York State Dormitory Authority, 5.25% due 10/1/2018 (School District Financing Program; Insured: AGM) | | AA/A1 | | | 775,000 | | | | 895,505 | |
New York State Dormitory Authority, 5.00% due 3/15/2019 pre-refunded 3/15/2015 (University & College Improvements; Insured: AGM) | | AAA/Aa2 | | | 50,000 | | | | 52,310 | |
New York State Dormitory Authority, 5.00% due 3/15/2019 pre-refunded 3/15/2015 (University & College Improvements; Insured: AGM) | | AA/Aa2 | | | 950,000 | | | | 993,225 | |
New York State Dormitory Authority, 5.00% due 7/1/2020 (NYSARC, Inc. Developmental Disability Programs) | | NR/Aa3 | | | 1,175,000 | | | | 1,351,685 | |
New York State Dormitory Authority, 4.00% due 10/1/2020 (School District Financing Program; Insured: AGM) (State Aid Withholding) | | AA/A1 | | | 325,000 | | | | 357,919 | |
New York State Dormitory Authority, 5.00% due 7/1/2021 (State University of New York; Insured: Natl-Re) | | AA-/NR | | | 300,000 | | | | 316,860 | |
New York State Dormitory Authority, 5.25% due 7/1/2022 (St. John’s University; Insured: Natl-Re) | | AA-/A3 | | | 1,000,000 | | | | 1,168,920 | |
New York State Dormitory Authority, 5.00% due 1/15/2023 (Municipal Health Facilities) | | AA-/Aa3 | | | 1,000,000 | | | | 1,111,020 | |
New York State Dormitory Authority, 5.00% due 10/1/2023 (School District Financing Program) (State Aid Withholding) | | AA-/NR | | | 575,000 | | | | 669,449 | |
New York State Dormitory Authority, 5.00% due 7/1/2024 (Miriam Osborn Memorial Home Assoc.) | | NR/NR | | | 1,540,000 | | | | 1,651,357 | |
New York State Dormitory Authority, 5.00% due 7/1/2024 (Bishop Henry B. Hucles Nursing Home; Insured: SONYMA) | | NR/Aa1 | | | 1,000,000 | | | | 1,038,510 | |
New York State Dormitory Authority, 5.00% due 10/1/2024 (School District Financing Program; Insured: AGM) (State Aid Withholding) | | AA/A1 | | | 1,000,000 | | | | 1,116,000 | |
Certified Semi-Annual Report 11
| | |
| SCHEDULE OF INVESTMENTS, CONTINUED | | |
| |
Thornburg New York Intermediate Municipal Fund | | March 31, 2014 (Unaudited) |
| | | | | | | | | | |
Issuer-Description | | Credit Rating†
S&P/ Moody’s | | Principal
Amount | | | Value | |
New York State Dormitory Authority, 5.00% due 7/1/2025 (Miriam Osborn Memorial Home Assoc.) | | NR/NR | | $ | 1,105,000 | | | $ | 1,172,913 | |
New York State Dormitory Authority, 5.00% due 7/1/2027 (Columbia University Teachers College) | | A+/A1 | | | 750,000 | | | | 839,677 | |
New York State Dormitory Authority, 5.00% due 7/1/2027 (Interagency Council Pooled Loan Program) | | NR/Aa3 | | | 1,000,000 | | | | 1,076,400 | |
New York State Dormitory Authority, 5.25% due 7/1/2027 (Health Quest Systems; Insured: AGM) | | AA/A3 | | | 500,000 | | | | 548,145 | |
New York State Dormitory Authority, 5.00% due 12/15/2027 (State Educational & Medical Facilities) | | AAA/Aa2 | | | 2,500,000 | | | | 2,839,900 | |
New York State Dormitory Authority, 5.25% due 5/1/2030 (North Shore Long Island Jewish Medical) | | A-/A3 | | | 1,000,000 | | | | 1,059,780 | |
New York State Energy Research & Development Authority, 2.25% due 12/1/2015 (New York Electric & Gas Corp.) | | BBB+/A3 | | | 1,000,000 | | | | 1,020,130 | |
New York State Thruway Authority, 5.00% due 4/1/2018 pre-refunded 10/1/2015 (Insured: AMBAC) | | NR/NR | | | 60,000 | | | | 64,283 | |
New York State Thruway Authority, 5.00% due 4/1/2018 (Insured: AMBAC) | | AA/NR | | | 385,000 | | | | 411,850 | |
New York State Thruway Authority, 5.00% due 4/1/2019 (Multi-Year Highway and Bridge Capital Program; Insured: AMBAC) | | AA/A2 | | | 235,000 | | | | 250,893 | |
New York State Thruway Authority, 5.00% due 5/1/2019 (Multi-Year Highway and Bridge Capital Program) | | A-/A3 | | | 2,000,000 | | | | 2,314,840 | |
New York State Thruway Authority, 5.00% due 4/1/2022 (Multi-Year Highway and Bridge Capital Program) | | AA/NR | | | 1,000,000 | | | | 1,125,700 | |
New York State Urban Development Corp., 5.25% due 1/1/2021 | | AA-/NR | | | 1,000,000 | | | | 1,140,690 | |
Oneida County IDA, 6.10% due 6/1/2020 (Presbyterian Home for Central New York; LOC: HSBC Bank USA) | | NR/A1 | | | 450,000 | | | | 451,409 | |
Onondaga Civic Development Corp., 5.00% due 7/1/2021 (Le Moyne College) | | NR/Baa2 | | | 1,000,000 | | | | 1,085,580 | |
Onondaga Civic Development Corp., 5.50% due 12/1/2031 (Upstate Properties Development) | | A+/NR | | | 1,000,000 | | | | 1,090,560 | |
Port Authority New York & New Jersey, 5.00% due 8/15/2022 (Insured: AGM) | | AA/Aa3 | | | 1,000,000 | | | | 1,127,490 | |
Syracuse Industrial Development Agency, 5.25% due 5/1/2026 (Syracuse City School District) | | AA-/Aa3 | | | 2,150,000 | | | | 2,411,440 | |
Town of Amherst Development Corp., 5.00% due 10/1/2020 (University at Buffalo Foundation Facility-Student Housing; Insured: AGM) | | AA/A2 | | | 1,000,000 | | | | 1,133,400 | |
Town of Babylon GO, 5.00% due 9/1/2015 (Insured: AMBAC) | | NR/NR | | | 465,000 | | | | 474,230 | |
Triborough Bridge & Tunnel Authority GO, 5.00% due 11/15/2025 pre-refunded 11/15/2017 (MTA Bridges and Tunnels) | | AA-/Aa3 | | | 1,410,000 | | | | 1,619,921 | |
Triborough Bridge & Tunnel Authority GO, 5.00% due 11/15/2028 (MTA Bridges and Tunnels) | | AA-/Aa3 | | | 1,000,000 | | | | 1,139,010 | |
Triborough Bridge & Tunnel Authority GO, 5.00% due 11/15/2029 (MTA Bridges and Tunnels) | | AA-/Aa3 | | | 1,000,000 | | | | 1,129,620 | |
United Nations Development Corp., 5.00% due 7/1/2019 (One, Two and Three U.N. Plaza Project) | | NR/A1 | | | 230,000 | | | | 265,832 | |
United Nations Development Corp., 5.00% due 7/1/2025 (One, Two and Three U.N. Plaza Project) | | NR/A1 | | | 710,000 | | | | 763,995 | |
Utility Debt Securitization Authority, 5.00% due 12/15/2029 (Restructuring Property) | | AAA/Aaa | | | 1,000,000 | | | | 1,152,720 | |
Utility Debt Securitization Authority, 5.00% due 12/15/2030 (Restructuring Property) | | AAA/Aaa | | | 1,000,000 | | | | 1,143,730 | |
West Seneca Central School District GO, 5.00% due 11/15/2023 (Facilities Improvements; Insured: BAM) (State Aid Withholding) | | AA/A1 | | | 1,300,000 | | | | 1,517,061 | |
| | | | | | | | | | |
TOTAL INVESTMENTS — 88.41% (Cost $62,402,370) | | | | | | | | $ | 65,499,808 | |
OTHER ASSETS LESS LIABILITIES — 11.59% | | | | | | | | | 8,588,794 | |
| | | | | | | | | | |
NET ASSETS — 100.00% | | | | | | | | $ | 74,088,602 | |
| | | | | | | | | | |
Footnote Legend
| † | Credit ratings are unaudited. Rating changes may have occurred subsequent to the reporting period end. Bonds issued with a maturity of one year or less are assigned Moody’s ratings from MIG-1 to MIG-4 and Standard and Poor’s ratings from SP-1+ to SP-3 with MIG-1 and SP-1+ being the strongest ratings. |
Portfolio Abbreviations
To simplify the listings of securities, abbreviations are used per the table below:
| | | | | | |
| AGM | | Insured by Assured Guaranty Municipal Corp. | | | | |
| AMBAC | | Insured by American Municipal Bond Assurance Corp. | | | | |
| BAM | | Build America Mutual Insurance Co. | | | | |
| GO | | General Obligation | | | | |
| IDA | | Industrial Development Authority | | | | |
| LOC | | Letter of Credit | | | | |
| Natl-Re | | Insured by National Public Finance Guarantee Corp. | | | | |
| PCR | | Pollution Control Revenue Bond | | | | |
| SONYMA | | State of New York Mortgage Authority | | | | |
See notes to financial statements.
12 Certified Semi-Annual Report
| | |
| STATEMENT OF ASSETS AND LIABILITIES | | |
| |
Thornburg New York Intermediate Municipal Fund | | March 31, 2014 (Unaudited) |
| | | | |
ASSETS | | | | |
Investments at value (cost $62,402,370) (Note 2) | | $ | 65,499,808 | |
Cash | | | 7,691,437 | |
Receivable for fund shares sold | | | 505,362 | |
Interest receivable | | | 890,184 | |
Prepaid expenses and other assets | | | 1,234 | |
| | | | |
Total Assets | | | 74,588,025 | |
| | | | |
| |
LIABILITIES | | | | |
Payable for fund shares redeemed | | | 405,296 | |
Payable to investment advisor and other affiliates (Note 3) | | | 48,616 | |
Accounts payable and accrued expenses | | | 24,966 | |
Dividends payable | | | 20,545 | |
| | | | |
Total Liabilities | | | 499,423 | |
| | | | |
| |
NET ASSETS | | $ | 74,088,602 | |
| | | | |
NET ASSETS CONSIST OF | | | | |
Distribution in excess of net investment income | | $ | (16,847 | ) |
Net unrealized appreciation on investments | | | 3,097,438 | |
Accumulated net realized gain (loss) | | | (460,733 | ) |
Net capital paid in on shares of beneficial interest | | | 71,468,744 | |
| | | | |
| | $ | 74,088,602 | |
| | | | |
NET ASSET VALUE | | | | |
Class A Shares: | | | | |
Net asset value and redemption price per share ($56,697,647 applicable to 4,368,257 shares of beneficial interest outstanding - Note 4) | | $ | 12.98 | |
Maximum sales charge, 2.00% of offering price | | | 0.26 | |
| | | | |
Maximum offering price per share | | $ | 13.24 | |
| | | | |
| |
Class I Shares: | | | | |
Net asset value, offering and redemption price per share ($17,390,955 applicable to 1,339,872 shares of beneficial interest outstanding - Note 4) | | $ | 12.98 | |
| | | | |
See notes to financial statements.
Certified Semi-Annual Report 13
| | |
| STATEMENT OF OPERATIONS | | |
| |
Thornburg New York Intermediate Municipal Fund | | Six Months Ended March 31, 2014 (Unaudited) |
| | | | |
INVESTMENT INCOME | | | | |
Interest income (net of premium amortized of $248,199) | | $ | 1,141,086 | |
| | | | |
| |
EXPENSES | | | | |
Investment advisory fees (Note 3) | | | 169,946 | |
Administration fees (Note 3) | | | | |
Class A Shares | | | 35,410 | |
Class I Shares | | | 2,831 | |
Distribution and service fees (Note 3) | | | | |
Class A Shares | | | 70,820 | |
Transfer agent fees | | | | |
Class A Shares | | | 12,470 | |
Class I Shares | | | 2,449 | |
Registration and filing fees | | | | |
Class A Shares | | | 146 | |
Custodian fees (Note 3) | | | 14,451 | |
Professional fees | | | 12,276 | |
Accounting fees | | | 818 | |
Trustee fees | | | 1,085 | |
Other expenses | | | 6,821 | |
| | | | |
Total Expenses | | | 329,523 | |
Less: | | | | |
Expenses reimbursed by investment advisor (Note 3) | | | (10,013 | ) |
Fees paid indirectly (Note 3) | | | (1,426 | ) |
| | | | |
Net Expenses | | | 318,084 | |
| | | | |
Net Investment Income | | | 823,002 | |
| | | | |
REALIZED AND UNREALIZED GAIN (LOSS) | | | | |
Net realized gain (loss) on investments | | | (249,977 | ) |
Net change in unrealized appreciation (depreciation) of investments | | | 622,695 | |
| | | | |
Net Realized and Unrealized Gain | | | 372,718 | |
| | | | |
Net Increase in Net Assets Resulting from Operations | | $ | 1,195,720 | |
| | | | |
See notes to financial statements.
14 Certified Semi-Annual Report
| | |
| STATEMENTS OF CHANGES IN NET ASSETS | | |
| |
Thornburg New York Intermediate Municipal Fund | | |
| | | | | | | | |
| | | Six Months Ended
March 31, 2014* | | | Year Ended
September 30, 2013 | |
INCREASE (DECREASE) IN NET ASSETS FROM | | | | | | | | |
| | |
OPERATIONS | | | | | | | | |
Net investment income | | $ | 823,002 | | | $ | 1,593,330 | |
Net realized gain (loss) on investments | | | (249,977 | ) | | | (77,545 | ) |
Net unrealized appreciation (depreciation) on investments | | | 622,695 | | | | (2,373,054 | ) |
| | | | | | | | |
| | |
Net Increase (Decrease) in Net Assets Resulting from Operations | | | 1,195,720 | | | | (857,269 | ) |
| | |
DIVIDENDS TO SHAREHOLDERS | | | | | | | | |
From net investment income | | | | | | | | |
Class A Shares | | | (670,893 | ) | | | (1,431,117 | ) |
Class I Shares | | | (152,109 | ) | | | (162,213 | ) |
| | |
FUND SHARE TRANSACTIONS (NOTE 4) | | | | | | | | |
Class A Shares | | | 2,329,637 | | | | 415,288 | |
Class I Shares | | | 10,265,358 | | | | 2,587,250 | |
| | | | | | | | |
Net Increase in Net Assets | | | 12,967,713 | | | | 551,939 | |
| | |
NET ASSETS | | | | | | | | |
Beginning of Period | | | 61,120,889 | | | | 60,568,950 | |
| | | | | | | | |
| | |
End of Period | | $ | 74,088,602 | | | $ | 61,120,889 | |
| | | | | | | | |
| | |
Distribution in excess of net investment income | | $ | (16,847 | ) | | $ | (16,847 | ) |
See notes to financial statements.
Certified Semi-Annual Report 15
| | |
| NOTES TO FINANCIAL STATEMENTS | | |
| |
Thornburg New York Intermediate Municipal Fund | | March 31, 2014 (Unaudited) |
NOTE 1 – ORGANIZATION
Thornburg New York Intermediate Municipal Fund (the “Fund”) is a non-diversified series of Thornburg Investment Trust (the “Trust”). The Trust is organized as a Massachusetts business trust under a Declaration of Trust dated June 3, 1987 and is registered as a diversified, open-end management investment company under the Investment Company Act of 1940, as amended. The Fund is currently one of eighteen separate series of the Trust. Each series is considered to be a separate entity for financial reporting and tax purposes and bears expenses directly attributable to it. The Fund’s primary investment objective is to obtain as high a level of current income exempt from federal, New York State, and New York City individual income tax as is consistent, in the view of the Fund’s investment advisor, with the preservation of capital. The Fund’s secondary objective is to reduce expected changes in its share price compared to long-term bond portfolios. The Fund will invest primarily in municipal obligations within the state of New York.
The Fund currently offers two classes of shares of beneficial interest outstanding: Class A and Institutional Class (“Class I”) shares. Each class of shares of the Fund represents an interest in the same portfolio of investments, except that (i) Class A shares are sold subject to a front-end sales charge collected at the time the shares are purchased and bear a service fee and (ii) Class I shares are sold at net asset value without a sales charge at the time of purchase and may be subject to a service fee, and (iii) the respective classes may have different reinvestment privileges and conversion rights. Additionally, the Fund may allocate among its classes certain expenses, to the extent allocable to specific classes, including transfer agent fees, government registration fees, certain printing and postage costs, and administrative and legal expenses. Currently, class specific expenses of the Fund are limited to service and distribution fees, administration fees, and certain registration and transfer agent expenses.
NOTE 2 – SIGNIFICANT ACCOUNTING POLICIES
Significant accounting policies of the Trust are as follows:
Valuation Policy and Procedures: The Fund’s Trustees of the Trust (the “Trustees”) have authorized employees of the Fund’s investment advisor, acting as the Valuation and Pricing Committee (the “Committee”), to make certain valuation determinations, subject to oversight and review by the Trustees and the Audit Committee of the Trustees. The Committee and other employees of the Fund’s investment advisor administer and implement the valuation process. The Committee regularly reviews its own fair value decisions, as well as valuations, valuation techniques and services furnished by pricing services, considers circumstances in the markets which may require valuation determinations by the Committee and reviews previous valuation determinations. The Committee also reports on its activities, the performance of the pricing services and other matters to the Trustees and the Audit Committee of the Trustees.
In determining a fair value for a portfolio investment, the Committee seeks to determine the price that the Fund would reasonably expect to receive upon a sale of the investment in an orderly transaction between market participants at the measurement date. Typically, the fair value process employs standing instructions to use quoted prices in active markets or the use of independent pricing services. Less frequently, the Committee may make a fair value determination using other methods. However, because fair value prices are estimated prices, the determination of fair value for an investment may differ from the value that would be realized by the Fund upon a sale of the investment, and that difference could be material to the Fund’s financial statements. The Committee’s determination of fair value for an investment may also differ from the prices obtained by other persons (including other mutual funds) for the investment.
Valuation of Investments: Debt obligations held by the Fund have a primary over-the-counter market and are valued by an independent pricing service approved by the Trustees. The pricing service ordinarily values debt obligations at quoted bid prices. When quotations are not available, debt obligations held by the Fund are valued at evaluated prices determined by the pricing service using methods which include consideration of yields or prices of debt obligations of comparable quality, type of issue, coupon, maturity and rating, and indications as to value from dealers and general market conditions. Short-term obligations having remaining maturities of 60 days or less are ordinarily valued at amortized cost, which approximates market value.
In any case when a pricing service fails to provide a price for a debt obligation held by the Fund, the Committee determines a fair value for the debt obligation using procedures in accordance with a policy approved by the Trustees, which may include the use of a price obtained from a different independent pricing service. Additionally, in any case when management believes that a price provided by a pricing service for a debt obligation held by the Fund may be unreliable, the Committee decides whether or not to use the pricing service’s valuation or to use an alternative method to determine a fair value for the debt obligation.
Valuation Measurements: The Fund categorizes its investments based upon the inputs used in valuing those investments, according to a three-level hierarchy established by guidance from the Financial Accounting Standards Board (the “FASB”). Categorization of investments using this hierarchy is intended by the FASB to maximize the use of observable inputs and minimize the use of unobservable inputs by prioritizing that the most observable input be used when available. Observable inputs are those that market participants would use in valuing an investment based on available market data. Unobservable inputs are those that reflect assumptions about the information market participants would use in valuing an investment. An investment’s level within the hierarchy is based on the lowest level input that is deemed significant to the fair value measurement. The methodologies and relative inputs used to value investments are not necessarily indications of the risk or liquidity associated with investing in those investments.
16 Certified Semi-Annual Report
| | |
| NOTES TO FINANCIAL STATEMENTS, CONTINUED | | |
| |
Thornburg New York Intermediate Municipal Fund | | March 31, 2014 (Unaudited) |
Various inputs are used in determining the fair value measurement of the Fund’s investments. These inputs are generally summarized according to the three-level hierarchy below:
Level 1: Quoted prices in active markets for identical investments.
Level 2: Other direct or indirect significant observable inputs (including quoted prices for similar investments in active markets and other observable inputs, such as interest rates, prepayment rates, credit risk, etc.).
Level 3: Significant unobservable inputs, (including the Committee’s own assumptions in determining the fair value of investments), are generally applicable to investments fair valued with single broker quotes and other investments.
Portfolio investments with minimal, if any, market activity are characterized as Level 3 and are valued using significant unobservable inputs, typically including single broker quotes, which may be adjusted or unadjusted, related or comparable investments, last available transactions, and other relevant information. Valuations may also be based upon current market prices of securities that are comparable in coupon, rating, maturity and industry. An income based valuation approach would consider discounted anticipated future cash flows of the investment. Discounts may also be applied due to the nature or duration of any restrictions on the disposition of the investment. The derived value of a Level 3 investment may not represent the value which is received upon disposition.
The following table displays a summary of the fair value hierarchy measurements of the Fund’s investments as of March 31, 2014. In any instance when valuation inputs from more than one level are used to determine the fair value of a specific investment, the investment is placed in the level of the table based upon the lowest level input that is significant in determining the fair value of the investment:
| | | | | | | | | | | | | | | | |
| | | Fair Value Measurements at March 31, 2014 | |
| | | Total | | | Level 1 | | | Level 2 | | | Level 3 | |
Assets | | | | | | | | | | | | | | | | |
Investments in Securities | | | | | | | | | | | | | | | | |
Municipal Bonds | | $ | 65,499,808 | | | $ | — | | | $ | 65,499,808 | | | $ | — | |
| | | | | | | | | | | | | | | | |
Total Investments in Securities | | $ | 65,499,808 | | | $ | — | | | $ | 65,499,808 | | | $ | — | |
In accordance with the guidance prescribed in Accounting Standards Update No. 2011-04, it is the policy of the Fund to recognize transfers between levels and those underlying events which caused the movement. The Fund recognized no transfers between levels for the six months ended March 31, 2014.
Federal Income Taxes: It is the policy of the Trust to comply with the provisions of the Internal Revenue Code applicable to “regulated investment companies” and to distribute to shareholders substantially all taxable (if any) and tax exempt income of the Fund. Therefore, no provision for federal income tax is required.
Management reviews each uncertain tax position believed to be material to the preparation of the Fund’s financial statements, to assess if it is more likely than not that the position would be sustained upon examination, based upon the technical merits of the position. As of March 31, 2014, management has not identified any such position for which an asset or liability must be reflected in the Statement of Assets and Liabilities. The Fund’s tax returns remain subject to examination for three years after filing.
When-Issued and Delayed Delivery Transactions: The Fund may engage in when-issued or delayed delivery transactions. To the extent the Fund engages in such transactions, it will do so for the purpose of acquiring portfolio investments consistent with the Fund’s investment objectives and not for the purpose of investment leverage or to speculate on interest rate and/or market changes. At the time the Fund makes a commitment to purchase an investment on a when-issued or delayed delivery basis, the Fund will record the transaction and reflect the value in determining its net asset value. When effecting such transactions, assets of an amount sufficient to make payment for the portfolio investments to be purchased will be segregated on the Fund’s records on the trade date. Investments purchased on a when-issued or delayed delivery basis do not earn interest until the settlement date.
Dividends: Net investment income of the Fund is declared daily as a dividend on shares for which the Fund has received payment. Dividends are paid monthly and are reinvested in additional shares of the Fund at net asset value per share at the close of business on the dividend payment date, or at the shareholder’s option, paid in cash. Net realized capital gains, to the extent available, will be distributed at least annually.
General: Investment transactions are accounted for on a trade date basis. Interest income is accrued as earned. Premiums and discounts on investments purchased are amortized to call dates or maturity dates of the respective investments. Realized gains and losses from the sale of investments are recorded on an identified cost basis. Net investment income (other than class specific expenses) and realized and unrealized gains and losses are allocated daily to each class of shares based upon the relative net asset value of outstanding shares (or the value of the dividend-eligible shares, as appropriate) of each class of shares at the beginning of the day (after adjusting for the current capital shares activity of the respective class). Expenses common to all Funds are allocated among the Funds comprising the Trust based upon their relative net asset values or other appropriate allocation methods.
Certified Semi-Annual Report 17
| | |
| NOTES TO FINANCIAL STATEMENTS, CONTINUED | | |
| |
Thornburg New York Intermediate Municipal Fund | | March 31, 2014 (Unaudited) |
Guarantees and Indemnifications: Under the Trust’s organizational documents (and under separate agreements with the independent Trustees), its officers and Trustees are indemnified against certain liabilities arising out of the performance of their duties to the Fund. Additionally, in the normal course of business the Trust enters into contracts with service providers that contain general indemnification clauses. The Trust’s maximum exposure under these arrangements is unknown. However, based on experience, the Trust expects the risk of loss to be remote.
Use of Estimates: The preparation of financial statements, in conformity with United States generally accepted accounting principles, requires management to make estimates and assumptions that affect the reported amounts of assets and liabilities and the disclosure of contingent assets and liabilities at the date of the financial statements and the reported amounts of increases and decreases in net assets from operations during the reporting period. Actual amounts could differ from those estimates.
NOTE 3 – INVESTMENT ADVISORY FEE AND OTHER TRANSACTIONS WITH AFFILIATES
Pursuant to an investment advisory agreement, Thornburg Investment Management, Inc. (the “Advisor”) serves as the investment advisor and performs services for the Fund for which the fees are payable at the end of each month. For the six months ended March 31, 2014, these fees were payable at annual rates ranging from .50 of 1% to .275 of 1% per annum of the average daily net assets of the Fund depending on the Fund’s asset size. The Trust also has entered into administrative services agreements with the Advisor, whereby the Advisor will perform certain administrative services for the shareholders of each class of the fund shares, and for which fees will be payable at an annual rate of up to .125 of 1% per annum of the average daily net assets attributable to each class of shares.
The Trust has an underwriting agreement with Thornburg Securities Corporation (the “Distributor,” an affiliate of the Advisor), which acts as the distributor of the Fund’s shares. For the six months ended March 31, 2014, the Distributor has advised the Fund that it earned net commissions aggregating $337 from the sale of Class A shares.
Pursuant to a service plan under Rule 12b-1 of the Investment Company Act of 1940, the Fund may reimburse to the Advisor an amount not to exceed .25 of 1% per annum of the average daily net assets attributable to each class of shares of the Fund for payments made by the Advisor to securities dealers and other financial institutions to obtain various shareholder and distribution related services. For the six months ended March 31, 2014, there were no 12b-1 service plan fees charged for Class I shares. The Advisor may pay out of its own resources additional expenses for distribution of the Fund’s shares.
The Advisor and Distributor have contractually agreed to waive fees and reimburse expenses incurred by the Fund so that actual expenses of certain share classes do not exceed specified levels. The agreement may be terminated by the Fund at any time, but may not be terminated by the Advisor or Distributor before February 1, 2015, unless the Advisor ceases to be the investment advisor to the Fund or the Distributor ceases to be the distributor of the Fund prior to that date. The Advisor and Distributor retain the right to be repaid by the Fund for fee waivers and expense reimbursements if expenses fall below the contractual limit prior to the end of the fiscal year.
For the six months ended March 31, 2014, the Advisor contractually reimbursed certain class specific expenses and administrative fees of $8,450 for Class A shares and $1,563 for Class I shares.
The Trust has an agreement with the custodian bank to indirectly pay a portion of the custodian’s fees through credits earned by the Fund’s cash on deposit with the bank. This deposit agreement is an alternative to overnight investments. Custodial fees are adjusted to reflect amounts that would have been paid without this agreement, with a corresponding adjustment reflected as fees paid indirectly in the Statement of Operations. For the six months ended March 31, 2014, fees paid indirectly were $1,426.
Certain officers and Trustees of the Trust are also officers or directors of the Advisor and Distributor. The compensation of independent Trustees is borne by the Trust.
NOTE 4 – SHARES OF BENEFICIAL INTEREST
At March 31, 2014, there were an unlimited number of shares of beneficial interest authorized. Transactions in shares of beneficial interest were as follows:
18 Certified Semi-Annual Report
| | |
| NOTES TO FINANCIAL STATEMENTS, CONTINUED | | |
| |
Thornburg New York Intermediate Municipal Fund | | March 31, 2014 (Unaudited) |
| | | | | | | | | | | | | | | | |
| | | Six Months Ended
March 31, 2014 (Unaudited) | | | Year Ended
September 30, 2013 (Audited) | |
| | | Shares | | | Amount | | | Shares | | | Amount | |
Class A Shares | | | | | | | | | | | | | | | | |
Shares sold | | | 1,430,205 | | | $ | 18,415,632 | | | | 901,050 | | | $ | 11,922,513 | |
Shares issued to shareholders in reinvestment of dividends | | | 42,416 | | | | 548,831 | | | | 80,325 | | | | 1,062,658 | |
Shares repurchased | | | (1,286,557 | ) | | | (16,634,826 | ) | | | (954,983 | ) | | | (12,569,883 | ) |
| | | | | | | | | | | | | | | | |
| | | | |
Net increase (decrease) | | | 186,064 | | | $ | 2,329,637 | | | | 26,392 | | | $ | 415,288 | |
| | | | | | | | | | | | | | | | |
| | | | |
Class I Shares | | | | | | | | | | | | | | | | |
Shares sold | | | 980,001 | | | $ | 12,671,064 | | | | 456,801 | | | $ | 6,000,154 | |
Shares issued to shareholders in reinvestment of dividends | | | 11,176 | | | | 144,830 | | | | 11,720 | | | | 154,702 | |
Shares repurchased | | | (197,346 | ) | | | (2,550,536 | ) | | | (272,677 | ) | | | (3,567,606 | ) |
| | | | | | | | | | | | | | | | |
| | | | |
Net increase (decrease) | | | 793,831 | | | $ | 10,265,358 | | | | 195,844 | | | $ | 2,587,250 | |
| | | | | | | | | | | | | | | | |
NOTE 5 – INVESTMENT TRANSACTIONS
For the six months ended March 31, 2014, the Fund had purchase and sale transactions of investments (excluding short-term investments) of $18,024,932 and $8,491,099, respectively.
NOTE 6 – INCOME TAXES
At March 31, 2014, information on the tax components of capital was as follows:
| | | | |
Cost of investments for tax purposes | | $ | 62,402,370 | |
| | | | |
Gross unrealized appreciation on a tax basis | | $ | 3,150,969 | |
Gross unrealized depreciation on a tax basis | | | (53,531 | ) |
| | | | |
Net unrealized appreciation (depreciation) on investments (tax basis) | | $ | 3,097,438 | |
| | | | |
At March 31, 2014, the Fund had deferred tax basis capital losses occurring subsequent to October 31, 2012 of $81,063. For tax purposes, such losses will be reflected in the year ending September 30, 2014.
At March 31, 2014, the Fund had cumulative tax basis capital losses of $96,862, (of which $46,442 is short-term and $50,420 is long-term) generated after September 30, 2011, which may be carried forward to offset future capital gains. To the extent such carryforwards are used, capital gain distributions may be reduced to the extent provided by regulations. Such capital loss carryforwards do not expire but are required to be utilized to offset future gains prior to the utilization of losses that occurred prior to October 1, 2011, which may expire prior to utilization.
At March 31, 2014, the Fund had tax basis capital losses of $32,830 generated prior to October 1, 2011, which may be carried forward to offset future capital gains. Such capital loss carryforwards expire September 30, 2014.
OTHER NOTES:
Risks: The Fund’s investments subject it to risks including, but not limited to, credit risk, interest rate risk, management risk, market and economic risk, liquidity risk, diversification risk, and the risks of investing primarily in the obligations of a single state. Please see the Fund’s prospectus for a discussion of the risks associated with an investment in the Fund.
Subsequent Events: Fund management believes no events have occurred between March 31, 2014 and the date of issuance of the financial statements that require adjustment to or disclosure in the accompanying financial statements.
Certified Semi-Annual Report 19
FINANCIAL HIGHLIGHTS
Thornburg New York Intermediate Municipal Fund
| | | | | | | | | | | | | | | | | | | | | | | | | | | | | | | | | | | | | | | | | | | | | | | | | | | | |
| | | PER SHARE PERFORMANCE (for a share outstanding throughout the Period)+ | | RATIOS TO AVERAGE NET ASSETS | | | SUPPLEMENTAL DATA | |
Unless
Otherwise
Noted,
Periods
are
Fiscal
Years
Ended
Sept. 30, | | Net Asset
Value
Beginning
of Period | | | Net
Investment
Income ( Loss) | | Net
Realized
&
Unrealized
Gain (Loss)
on
Investments | | | Total from
Investment
Operations | | | Dividends
from Net
Investment
Income | | | Dividends
from Net
Realized
Gains | | Total
Dividends | | | Net
Asset
Value
End
of
Period | | Net
Investment
Income
(Loss)
(%) | | | Expenses,
After
Expense
Reductions
(%) | | | Expenses,
After
Expense
Reductions
and
Net of
Custody
Credits
(%) | | | Expenses,
Before
Expense
Reductions
(%) | | | Total
Return
(%)(a) | | | Portfolio
Turnover
Rate (%) | | Net
Assets
at End
of
Period
(Thousands) | |
Class A Shares | | | | | | | | | | | | | | | | | | | | | | | | | | | | | | | | | | | | | | | | | | | | | | |
2014(b)(c) | | $ | 12.93 | | | 0.15 | | | 0.05 | | | | 0.20 | | | | (0.15 | ) | | — | | | (0.15 | ) | | $12.98 | | | 2.37 | (d) | | | 0.99 | (d) | | | 0.99 | (d) | | | 1.02 | (d) | | | 1.58 | | | 13.92 | | $ | 56,698 | |
2013(b) | | $ | 13.44 | | | 0.34 | | | (0.51 | ) | | | (0.17 | ) | | | (0.34 | ) | | — | | | (0.34 | ) | | $12.93 | | | 2.54 | | | | 0.99 | | | | 0.99 | | | | 1.05 | | | | (1.32 | ) | | 11.31 | | $ | 54,061 | |
2012(b) | | $ | 12.93 | | | 0.37 | | | 0.51 | | | | 0.88 | | | | (0.37 | ) | | — | | | (0.37 | ) | | $13.44 | | | 2.80 | | | | 0.99 | | | | 0.99 | | | | 1.05 | | | | 6.90 | | | 13.37 | | $ | 55,862 | |
2011(b) | | $ | 12.82 | | | 0.41 | | | 0.11 | | | | 0.52 | | | | (0.41 | ) | | — | | | (0.41 | ) | | $12.93 | | | 3.26 | | | | 0.99 | | | | 0.99 | | | | 1.07 | | | | 4.20 | | | 26.39 | | $ | 45,551 | |
2010(b) | | $ | 12.79 | | | 0.42 | | | 0.04 | | | | 0.46 | | | | (0.43 | ) | | — | | | (0.43 | ) | | $12.82 | | | 3.38 | | | | 0.99 | | | | 0.99 | | | | 1.07 | | | | 3.68 | | | 11.79 | | $ | 48,203 | |
2009(b) | | $ | 11.87 | | | 0.45 | | | 0.92 | | | | 1.37 | | | | (0.45 | ) | | — | | | (0.45 | ) | | $12.79 | | | 3.67 | | | | 0.99 | | | | 0.99 | | | | 1.07 | | | | 11.77 | | | 13.00 | | $ | 40,115 | |
Class I Shares | | | | | | | | | | | | | | | | | | | | | | | | | | | | | | | | | | | | | | | | | | | | | | |
2014(c) | | $ | 12.93 | | | 0.17 | | | 0.05 | | | | 0.22 | | | | (0.17 | ) | | — | | | (0.17 | ) | | $12.98 | | | 2.69 | (d) | | | 0.67 | (d) | | | 0.66 | (d) | | | 0.70 | (d) | | | 1.74 | | | 13.92 | | $ | 17,391 | |
2013 | | $ | 13.44 | | | 0.38 | | | (0.51 | ) | | | (0.13 | ) | | | (0.38 | ) | | — | | | (0.38 | ) | | $12.93 | | | 2.86 | | | | 0.67 | | | | 0.67 | | | | 0.74 | | | | (1.00 | ) | | 11.31 | | $ | 7,060 | |
2012 | | $ | 12.92 | | | 0.41 | | | 0.52 | | | | 0.93 | | | | (0.41 | ) | | — | | | (0.41 | ) | | $13.44 | | | 3.12 | | | | 0.67 | | | | 0.67 | | | | 0.77 | | | | 7.33 | | | 13.37 | | $ | 4,707 | |
2011 | | $ | 12.82 | | | 0.45 | | | 0.10 | | | | 0.55 | | | | (0.45 | ) | | — | | | (0.45 | ) | | $12.92 | | | 3.54 | | | | 0.67 | | | | 0.67 | | | | 0.71 | | | | 4.45 | | | 26.39 | | $ | 3,514 | |
2010(e) | | $ | 12.48 | | | 0.29 | | | 0.35 | | | | 0.64 | | | | (0.30 | ) | | — | | | (0.30 | ) | | $12.82 | | | 3.53 | (d) | | | 0.67 | (d) | | | 0.67 | (d) | | | 1.32 | (d) | | | 5.22 | | | 11.79 | | $ | 1,772 | |
| (a) | Not annualized for periods less than one year. |
| (b) | Sales loads are not reflected in computing total return. |
| (c) | Unaudited Six Month Period Ended March 31. |
| (e) | Effective date of this class of shares was February 1, 2010. |
| + | Based on weighted average shares outstanding, except for Dividends from Net Investment Income and Net Realized Gains, which are actual amounts per share. |
See notes to financial statements.
| | | | |
| 20 Certified Semi-Annual Report | | | | Certified Semi-Annual Report 21 |
| | |
| EXPENSE EXAMPLE | | |
| |
Thornburg New York Intermediate Municipal Fund | | March 31, 2014 (Unaudited) |
As a shareholder of the Fund, you incur two types of costs:
| | (1) | transaction costs, including |
(a) sales charges (loads) on purchase payments, for Class A shares;
(b) a deferred sales charge on redemptions of any part or all of a purchase of $1 million of Class A shares within 12 months of purchase;
| | (2) | ongoing costs, including management fees; distribution and/or service (12b-1) fees; and other Fund expenses. |
This example is intended to help you understand your ongoing costs (in dollars) of investing in the Fund and to compare these costs with the ongoing costs of investing in other mutual funds.
The example is based on a $1,000 investment beginning on October 1, 2013, and held until March 31, 2014.
| | | | | | | | | | | | |
| | | Beginning
Account Value
10/1/13 | | | Ending
Account Value
3/31/14 | | | Expenses Paid
During Period†
10/1/13–3/31/14 | |
Class A Shares | | | | | | | | | | | | |
Actual | | $ | 1,000.00 | | | $ | 1,015.80 | | | $ | 4.98 | |
Hypothetical* | | $ | 1,000.00 | | | $ | 1,020.00 | | | $ | 4.99 | |
Class I Shares | | | | | | | | | | | | |
Actual | | $ | 1,000.00 | | | $ | 1,017.40 | | | $ | 3.34 | |
Hypothetical* | | $ | 1,000.00 | | | $ | 1,021.62 | | | $ | 3.35 | |
| † | Expenses are equal to the annualized expense ratio for each class (A: 0.99%; I: 0.66%) multiplied by the average account value over the period, multiplied by 182/365 to reflect the one-half year period. |
| * | Hypothetical assumes a rate of return of 5% per year before expenses. |
ACTUAL EXPENSES
For each class of shares, the first line of the accompanying table provides information about actual account values and actual expenses. You may use the information in this line, together with the amount you invested, to estimate the expenses that you paid over the period. Simply divide your account value by $1,000 (for example, an $8,600 account value divided by $1,000 = 8.6), then multiply the result by the number in the first line for your class of shares under the heading entitled “Expenses Paid During Period” to estimate the expenses you paid on your account during this period.
HYPOTHETICAL EXAMPLE FOR COMPARISON PURPOSES
For each class of shares, the second line of the accompanying table provides information about hypothetical account values and hypothetical expenses based on the Fund’s actual expense ratio and an assumed rate of return of 5% per year before expenses, which is not the Fund’s actual return. The hypothetical account values and expenses may not be used to estimate the actual ending account balance or expenses you paid for the period. You may use this information to compare the ongoing costs of investing in the Fund and other funds. To do so, compare this 5% hypothetical example with the 5% hypothetical examples that appear in the shareholder reports of the other funds.
Please note that the expenses shown in the table are meant to highlight your ongoing costs only and do not reflect any transactional costs, such as sales charges (loads), redemption fees, or exchange fees. Therefore, the second line of the table for each class of shares is useful in comparing ongoing costs only, and will not help you determine the relative total costs of owning different funds. In addition, if these transactional costs were included, your costs would have been higher.
22 Certified Semi-Annual Report
| | |
| OTHER INFORMATION | | |
| |
Thornburg New York Intermediate Municipal Fund | | March 31, 2014 (Unaudited) |
PORTFOLIO PROXY VOTING
Policies and Procedures:
The Trust has delegated to Thornburg Investment Management, Inc. (the “Advisor”) voting decisions respecting proxies for the Fund’s voting securities. The Advisor makes voting decisions in accordance with its Proxy Voting Policy. A description of the Policy is available (i) without charge, upon request, by calling the Advisor toll-free at 1-800-847-0200, (ii) on the Thornburg website at www.thornburg. com, and (iii) on the Securities and Exchange Commission’s website at www.sec.gov.
Information regarding how proxies were voted is available on or before August 31 of each year for the twelve months ending the preceding June 30. This information is available (i) without charge, upon request by calling the Advisor toll-free at 1-800-847-0200, (ii) on the Thornburg website at www.thornburg.com, and (iii) on the Securities and Exchange Commission’s website at www.sec.gov.
AVAILABILITY OF QUARTERLY PORTFOLIO SCHEDULE
The Fund files with the Securities and Exchange Commission schedules of its portfolio holdings on Form N-Q for the first and third quarters of each fiscal year. The Fund’s Forms N-Q are available on the Commission’s website at www.sec.gov, or may be reviewed and copied at the Commission’s Public Reference Room in Washington, D.C. Information on the operation of the Public Reference Room may be obtained by calling 1-800-SEC-0330. The Fund also makes this information available on its website at www.thornburg. com/download or upon request by calling 1-800-847-0200.
Certified Semi-Annual Report 23
TRUSTEES’ STATEMENT TO SHAREHOLDERS
Not part of the Certified Semi-Annual Report
Reissued September 15, 2013
The Trustees believe current and prospective shareholders should know how we discharge our responsibilities in supervising the Funds’ investment advisor and in reviewing the advisor’s contract for renewal. Since 2005, we have issued a statement which sets out clearly the three principal guidelines that we follow in supervising the Trust’s investment advisor on your behalf. In accordance with our customary practice, in September of this year we again reviewed our statement and concluded we should reissue this statement outlining the principal features of our supervision of the advisor’s performance of investment management services for the Funds.
We begin with the premise that each shareholder selected his or her Fund because its investments are managed by the investment advisor identified in the prospectus and in accordance with the objective and policies described in the prospectus. We realize, as each of you do, that if you believe that your Fund’s stated objective and policies no longer serve your personal investment goals, you can sell your shares and leave the Fund.
Therefore, we believe that our primary supervisory task – our principal obligation to you – is to assess the nature and quality of the advisor’s services, and to confirm that the advisor actively and competently pursues the Fund’s objective, in accordance with the policies set out in the prospectus. To do this, we meet regularly with management to review your Fund’s portfolio and to discuss the advisor’s specific actions and judgments in pursuing the Fund’s objective. We do not substitute our own judgment for the advisor’s decisions in selecting investments; the advisor is paid to exercise its informed judgment on investment decisions, and we seek to confirm, in reviewing the advisor’s performance, that the advisor is doing just that.
Second, while we are conscious of costs and the effect that costs have on shareholders’ returns, we do not seek the lowest fees or expense ratio as our sole or primary objective. We try to make sure that your Fund’s fees and costs are reasonable in relationship to the services rendered and that they are generally in line with those charged by other expert investment advisors, consistent with our belief that the Fund’s investors searched for and expect that expertise and attention and have decided to pay a reasonable price for it. We do not put the management contract “out to bid” as a matter of course, and we would not do so unless we had concluded that the advisor materially had failed to pursue the Fund’s objectives in accordance with its policies, or for other equally important reasons. We believe that any other approach would be inconsistent with your interests and contrary to your expectations when you bought shares of the Fund in the first place.
Finally, because we believe that most Thornburg Fund shareholders have invested with a long-term perspective, we try not to focus too much on the fashions of the moment and on short-term performance. The market will not favor any specific investment objective or set of policies at all times and under all economic circumstances. A fund will experience periods of both high and low returns relative to other funds and other investments. Even if one of our Funds is not favored by the market at a particular time, we believe that the advisor is nonetheless obliged to remain true to the Fund’s objective and policies, and we watch to see that it does so.
24 This page is not part of the Semi-Annual Report
RETIREMENT AND EDUCATION ACCOUNTS
Thornburg Investment Management offers retirement and education savings accounts that can help you meet a variety of planning challenges. For account applications or further information on any of the accounts below, please call 1-800-847-0200 or go to www.thornburg.com/ira. Your financial advisor can help you determine which plan is right for you.
Individual Retirement Accounts
Individual Retirement Accounts (IRAs) provide a tax-advantaged means to save money for the future. For a detailed outline of the difference between retirement accounts, see www.thornburg.com/ira. Rollovers are available. Call 1-800-847-0200 for more information.
Traditional IRAs – Contributions to Traditional IRAs are tax deductible for eligible individuals, and withdrawals are taxed as additional ordinary income. You may contribute to an IRA if you receive compensation and are under 70 1/2, even if you are covered by an employer retirement plan. Deductible contributions are subject to certain qualifications. Please consult your tax advisor.
Roth IRAs – Under a Roth IRA, there is no tax deduction for contributions, but there is no income tax on qualified withdrawals. For a more detailed comparison of Traditional and Roth IRAs, please see our website at www.thornburg. com/ira.
SEP IRAs – Simplified Employee Pension (SEP) IRAs are established by employers. The employer is allowed a tax deduction for contributions made to the SEP Plan and makes contributions to each eligible employee’s SEP IRA on a discretionary basis.
SIMPLE IRAs – Savings Incentive Match Plan for Employees of Small Employers (SIMPLE) is designed to give small business owners a simplified method to establish and contribute to a retirement plan for employees. The employer is allowed a tax deduction for contributions and makes either matching or non-elective contributions to each eligible employee’s SIMPLE IRA. Employees may make salary deferral contributions.
Coverdell Education Savings Account
These savings accounts are designed to provide a way to save money for higher education expenses. In an Education Savings Account, earnings and interest grow tax-free, and qualified withdrawals used to pay for eligible higher-education expenses are tax- and penalty-free.
Funds Available
The following funds are available in the accounts listed above:
| | • | | Thornburg Core Growth Fund |
| | • | | Thornburg International Value Fund |
| | • | | Thornburg International Growth Fund |
| | • | | Thornburg Developing World Fund |
| | • | | Thornburg Investment Income Builder Fund |
| | • | | Thornburg Global Opportunities Fund |
| | • | | Thornburg Low Duration Income Fund |
| | • | | Thornburg Limited Term U.S. Government Fund |
| | • | | Thornburg Limited Term Income Fund |
| | • | | Thornburg Strategic Income Fund |
This page is not part of the Semi-Annual Report 25

26 This page is not part of the Semi-Annual Report
THORNBURG FUND FAMILY
Thornburg Equity Funds
Thornburg’s equity research uses a fundamentally driven, bottom-up, comprehensive analytical approach. Thornburg equity funds generally focus on a limited number of securities so that each holding can impact performance. The team searches for firms believed to have a promising future and seeks to buy shares of those companies at a discount to their intrinsic or long-term value.
| | • | | Thornburg Core Growth Fund |
| | • | | Thornburg International Value Fund |
| | • | | Thornburg International Growth Fund |
| | • | | Thornburg Developing World Fund |
| | • | | Thornburg Investment Income Builder Fund |
| | • | | Thornburg Global Opportunities Fund |
Thornburg Bond Funds
Thornburg Investment Management applies a disciplined philosophy to fixed-income management. Since the launch of our first fixed-income fund over 25 years ago, we have been conducting fundamental, bottom-up research in an effort to identify bonds which we believe provide the best return for a given level of risk. We avoid leverage or complex strategies which could backfire in periods of market uncertainty.
| | • | | Thornburg Low Duration Income Fund |
| | • | | Thornburg Limited Term U.S. Government Fund |
| | • | | Thornburg Limited Term Income Fund |
| | • | | Thornburg Strategic Income Fund |
| | • | | Thornburg Low Duration Municipal Fund |
| | • | | Thornburg Limited Term Municipal Fund |
| | • | | Thornburg Intermediate Municipal Fund |
| | • | | Thornburg California Limited Term Municipal Fund |
| | • | | Thornburg New Mexico Intermediate Municipal Fund |
| | • | | Thornburg New York Intermediate Municipal Fund |
| | • | | Thornburg Strategic Municipal Income Fund |
Before investing, carefully consider the Fund’s investment goals, risks, charges, and expenses. For a prospectus or summary prospectus containing this and other information, contact your financial advisor or visit thornburg.com. Read it carefully before investing.
For additional information, please visit thornburg.com
Thornburg Investment Management, Inc. 2300 North Ridgetop Road, Santa Fe, NM 87506
This page is not part of the Semi-Annual Report 27

This Semi-Annual Report is submitted for the general information of shareholders of the Fund. It is not authorized for distribution to prospective investors in the Fund unless preceded or accompanied by an effective prospectus.
| | | | |
| Investment Advisor: | | Distributor: | | |
| Thornburg Investment Management® | | Thornburg Securities Corporation® | | |
| 800.847.0200 | | 800.847.0200 | | TH1069 |

2 This page is not part of the Semi-Annual Report
Important Information
The information presented on the following pages was current as of March 31, 2014. The managers’ views, portfolio holdings, and sector diversification are provided for the general information of the Fund’s shareholders; to the extent this information is historical, it should not be considered predictive of future circumstances. This material should not be deemed a recommendation to buy or sell any of the securities mentioned.
Investments in the Fund carry risks, including possible loss of principal. Bond funds have the same interest rate, inflation, and credit risks that are associated with the underlying bonds. The principal value of bonds will fluctuate relative to changes in interest rates, decreasing when interest rates rise. Unlike bonds, bond funds have ongoing fees and expenses. Please see the Fund’s Prospectus for a discussion of the risks associated with an investment in the Fund. Investments in the Fund are not FDIC insured, nor are they deposits of or guaranteed by a bank or any other entity. There is no guarantee that the Fund will meet its investment objectives. The laddering strategy does not assure or guarantee better performance and cannot eliminate the risk of investment losses.
Performance data given at net asset value (NAV) does not take into account applicable sales charges. If the sales charges had been included, the performance would have been lower.
Minimum investments for Class I shares are higher than those for other classes. Class I shares may not be available to all investors.
| | | | |
SHARE CLASS | | NASDAQ SYMBOL | | CUSIP |
Class A | | TLDAX | | 885-216-812 |
Class I | | TLDIX | | 885-216-796 |
Glossary
Barclays U.S. 1-3 Yr Aggregate Bond Index – Index that measures the investment grade, U.S. dollar-denominated, fixed-rate taxable bond market with maturities between 1 and 3 years, including Treasuries, government-related and corporate securities, MBS (agency fixed-rate and hybrid ARM passthroughs), ABS, and CMBS.
Consumer Price Index (CPI) – Index that measures prices of a fixed basket of goods bought by a typical consumer, including food, transportation, shelter, utilities, clothing, medical care, entertainment and other items. The CPI, published by the Bureau of Labor Statistics in the Department of Labor, is based at 100 in 1982 and is released monthly. It is widely used as a cost-of-living benchmark to adjust Social Security payments and other payment schedules, union contracts and tax brackets. Also known as the cost-of-living index.
Unless otherwise noted, index returns reflect the reinvestment of income dividends and capital gains, if any, but do not reflect fees, brokerage commissions or other expenses of investing. Investors may not make direct investments into any index.
Annualized Distribution Yield – The distribution yield reflects actual distributions made to shareholders. The annualized distribution yield is calculated by summing the last 30 days of income at a given month end and annualizing to a 360-day year. The result is divided by the ending maximum offering price.
Basis Point (bp) – A unit equal to 1/100th of 1%. 1% = 100 basis points (bps).
Bond Credit Ratings – A bond credit rating assesses the financial ability of a debt issuer to make timely payments of principal and interest. Ratings of AAA (the highest), AA, A, and BBB are investment-grade quality. Ratings of BB, B, CCC, CC, C, and D (the lowest) are considered below investment grade, speculative grade, or junk bonds. Unless otherwise noted, the ratings listed are from Municipal Market Data and are a combination of ratings from Standard and Poor’s, Moody’s Investors Service, and Fitch Ratings.
Duration – A bond’s sensitivity to interest rates. Bonds with longer durations experience greater price volatility than bonds with shorter durations.
Effective Duration – A bond’s sensitivity to interest rates, incorporating the embedded option features, such as call provisions. Bonds with longer durations experience greater price volatility than bonds with shorter durations.
This page is not part of the Semi-Annual Report 3
Thornburg Low Duration Income Fund
Laddering – an All Weather Strategy
Thornburg Low Duration Income Fund is an actively managed, laddered portfolio of debt obligations that are rated investment grade, or if no credit rating is available, are judged by the Fund’s advisor to be at comparable quality. The Fund seeks to reduce changes in its share value compared to longer duration fixed income portfolios by maintaining a portfolio of investments with a dollar-weighted average duration of normally no more than three years. The Fund’s investments are determined by individual security analysis.
Portfolio Managers

Jason Brady, CFA Lon Erickson, CFA
Objectives
The Fund’s objective is to seek current income, consistent with preservation of capital.
The Fund seeks to reduce changes in its share value compared to longer duration fixed income portfolios. There is no guarantee that the Fund will meet its objectives.
Average Annual Total Returns
For Periods Ended March 31, 2014
| | | | |
| A Shares (Incep: 12/30/13) | | SINCE
INCEPTION | |
Without sales charge | | | 0.69 | % |
With sales charge | | | -0.84 | % |
Performance data shown represents past performance and is no guarantee of future results. Investment return and principal value will fluctuate so shares, when redeemed, may be worth more or less than their original cost. Current performance may be lower or higher than quoted. For performance current to the most recent month end, visit thornburg. com or call 800.847.0200.
The maximum sales charge for the Fund’s Class A shares is 1.50%. The total annual fund operating expense of Class A shares is 1.73%, as disclosed in the most recent Prospectus. Thornburg Investment Management and Thornburg Securities Corporation have contractually agreed to waive fees and reimburse expenses until at least February 1, 2015, so that actual expenses for Class A shares do not exceed 0.70%.
30-Day Yields, A Shares
As of March 31, 2014
| | | | |
Annualized Distribution Yield | | | 1.06 | % |
SEC Yield | | | 1.08 | % |
Without fee waivers and expense reimbursements, the SEC Yield would have been negative 0.98% and the Annualized Distribution Yield would have been negative 0.99%.
Key Portfolio Attributes
As of March 31, 2014
| | | | |
Number of Bonds | | | 56 | |
Effective Duration | | | 1.7 Yrs | |
Average Maturity | | | 2.4 Yrs | |
See the entire portfolio in the Schedule of Investments beginning on page 8.
4 This page is not part of the Semi-Annual Report
This page intentionally left blank.
This page is not part of the Semi-Annual Report 5
2014 Certified Semi-Annual Report
Thornburg Low Duration Income Fund
March 31, 2014
This report is certified under the Sarbanes-Oxley Act of 2002, which requires that public companies, including mutual funds, affirm that the information provided in their annual and semi-annual shareholder reports fully and fairly represents their financial position and the results of their operations for the period presented.
6 Certified Semi-Annual Report
Letter to Shareholders
April 23, 2014
Dear Fellow Shareholder:
We are very pleased to present the inaugural semi-annual report for the Thornburg Low Duration Income Fund for the period ended March 31, 2014, beginning with the Fund’s commencement on December 30, 2013. The net asset value (NAV) of a Class A share of the Fund increased 5 cents to $12.36 in the period. If you were invested for the three full months, you received dividends of 3.506 cents per share. If you reinvested your dividends, you received 3.509 cents per share. Please examine the accompanying exhibits for more detailed information.
Thornburg Investment Management has been investing in the fixed income marketplace for over three decades, and this portfolio serves as an extension of our various offerings across the risk spectrum. The new Fund’s goal is to provide current income, consistent with preservation of capital. The practical upshot of this strategy is that we are attempting to give investors at least some shelter from risk, while still providing a modicum of income. Some portfolios may advertise a lower duration, and therefore a low exposure to changes in interest rates, but take on a large exposure to credit risk to generate yield. We do not follow this strategy. Rather, the appeal of this Fund is that relative to cash, the additional payment for a small amount of researched risk in both credit and duration is significant. Furthermore, the fiction that the underlying NAV of a money market fund is fixed obscures whatever market price risk, however low, is in the portfolio. Because investors do not know what is going on within a money market fund, in ugly times they fear the worst. We trust a transparent, low-risk strategy without the fixed NAV fabrication should serve the investment community better, and we are setting out with this portfolio to provide that strategy.
At the end of March 2014, the duration of the portfolio was 1.7 years, indicating it has, we believe, a manageable amount of interest-rate exposure. In keeping with the prospectus limitation, all securities purchased for the Fund over the past three months are investment grade or nonrated equivalents, with over 70% currently A-rated or better. The short performance history of the portfolio was fairly strong, given the market environment. Through the end of the period, the portfolio had a 0.69% return since commencement (Class A shares at NAV), while the benchmark Barclays U.S. 1-3 Yr Aggregate Bond Index returned 0.27%. The index reflects no deduction for fees, expenses, or taxes. Our slightly shorter duration versus the index’s 1.92 years and our exposure to very high-quality corporate credit drove the outperformance. That exposure was in keeping with both the portfolio’s goals and our current skepticism around value in much of the corporate market. In all, we are not trying to “knock the cover off the ball” with this portfolio. But we believe that our experience in these markets enables us to provide incremental value in a category that has some relative merit in these lean times, and is likely to have absolute merit at other points in the rate and credit cycle.
In this, as in any environment, high-quality bond funds should represent a place of some refuge, despite limited current potential for price appreciation. With this Fund, Thornburg Investment Management will continue striving to give you, the bond investor, a consistent income stream, and a value both on its own and in the context of a broader set of investments.
No matter the direction of interest rates or credit spreads in the near-term, we believe your Fund is well positioned to achieve the longer-term goal of income consistent with capital preservation. The Thornburg Low Duration Income Fund is a laddered portfolio of high-quality, short-maturity bonds. This strategy endeavors to balance duration and yield to provide solid, risk-adjusted returns over time, as a core bond investment.
Thank you very much for investing alongside us.
Sincerely,
| | |

| |  |
Jason H. Brady, cfa Co-Portfolio Manager | | Lon R. Erickson, cfa Co-Portfolio Manager |
The matters discussed in this report may constitute forward-looking statements made pursuant to the safe harbor provisions of the Securities Litigation Reform Act of 1995. These include any advisor or portfolio manager prediction, assessment, analysis or outlook for individual securities, industries, investment styles, market sectors and/or markets. These statements involve risks and uncertainties. In addition to the general risks described for each fund in its current prospectus, other factors bearing on these reports include the accuracy of the advisor’s or portfolio manager’s forecasts and predictions, the appropriateness of the investment strategies designed by the advisor or portfolio manager and the ability of the advisor or portfolio manager to implement their strategies efficiently and successfully. Any one or more of these factors, as well as other risks affecting the securities markets generally, could cause the actual results of any fund to differ materially as compared to its benchmarks.
Certified Semi-Annual Report 7
| | |
| Schedule of Investments | | |
| |
Thornburg Low Duration Income Fund | | March 31, 2014 (Unaudited) |
Summary of Security Credit Ratings†
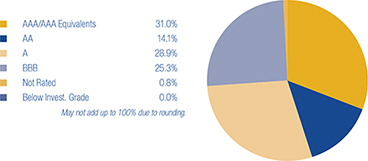
We have used ratings from Moody’s Investors Service. Where Moody’s ratings are not available, we have used Standard & Poor’s ratings. Where neither rating is available, we have used ratings from Fitch Ratings. “NR” = not rated.
| | | | | | | | | | |
| ISSUER-DESCRIPTION | | CREDIT RATING†
S&P/ MOODY’S | | PRINCIPAL
AMOUNT | | | VALUE | |
U.S. TREASURY SECURITIES — 8.56% | | | | | | | | | | |
| | | |
United States Treasury Notes, 0.25% due 10/31/2015 | | NR/NR | | $ | 100,000 | | | $ | 99,977 | |
United States Treasury Notes, 0.25% due 12/31/2015 | | NR/NR | | | 100,000 | | | | 99,866 | |
United States Treasury Notes, 0.50% due 6/15/2016 | | NR/Aaa | | | 100,000 | | | | 99,939 | |
United States Treasury Notes, 0.625% due 12/15/2016 | | NR/NR | | | 100,000 | | | | 99,616 | |
United States Treasury Notes, 0.75% due 12/31/2017 | | NR/Aaa | | | 100,000 | | | | 98,052 | |
| | | | | | | | | | |
TOTAL U.S. TREASURY SECURITIES (Cost $497,171) | | | | | | | | | 497,450 | |
| | | | | | | | | | |
| | | |
U.S. GOVERNMENT AGENCIES — 3.45% | | | | | | | | | | |
| | | |
Export Leasing (2009) LLC, (Guaranty: Export-Import Bank of the United States), 1.859% due 8/28/2021 | | NR/NR | | | 96,951 | | | | 96,460 | |
Small Business Administration Participation Certificates, Series 2005-20K Class 1, 5.36% due 11/1/2025 | | NR/NR | | | 95,782 | | | | 104,057 | |
| | | | | | | | | | |
TOTAL U.S. GOVERNMENT AGENCIES (Cost $200,331) | | | | | | | | | 200,517 | |
| | | | | | | | | | |
| | | |
OTHER GOVERNMENT — 5.31% | | | | | | | | | | |
| | | |
a Corp Andina de Fomento, 3.75% due 1/15/2016 | | AA-/Aa3 | | | 100,000 | | | | 104,249 | |
a Export-Import Bank of Korea, 5.875% due 1/14/2015 | | A+/Aa3 | | | 100,000 | | | | 103,972 | |
a,b Government of Aruba, 6.80% due 4/2/2014 | | BBB+/NR | | | 100,000 | | | | 100,000 | |
| | | | | | | | | | |
TOTAL OTHER GOVERNMENT (Cost $307,367) | | | | | | | | | 308,221 | |
| | | | | | | | | | |
| | | |
ASSET BACKED SECURITIES — 21.36% | | | | | | | | | | |
| | | |
ADVANCE RECEIVABLES — 6.90% | | | | | | | | | | |
| | | |
b HLSS Servicer Advance Receivables Trust, Series 2013-T5 Class AT5, 1.979% due 8/15/2046 | | AAA/NR | | | 100,000 | | | | 100,330 | |
b HLSS Servicer Advance Receivables Trust, Series 2013-T7 Class A7, 1.981% due 11/15/2046 | | AAA/NR | | | 100,000 | | | | 100,130 | |
b HLSS Servicer Advance Receivables Trust, Series 2014-T2 Class AT2, 2.217% due 1/15/2047 | | AAA/NR | | | 100,000 | | | | 100,255 | |
b,c New Residential Advance Receivables Trust, Series 2014-T1 Class A1, 1.274% due 3/15/2045 | | AAA/NR | | | 100,000 | | | | 100,062 | |
| | | | | | | | | | |
| | | | | | | | | 400,777 | |
| | | | | | | | | | |
AUTO RECEIVABLES — 3.40% | | | | | | | | | | |
| | | |
b Exeter Automobile Receivables Trust, 1.29% due 5/15/2018 | | AA/NR | | | 96,366 | | | | 96,622 | |
Santander Drive Auto Receivables Trust, 1.33% due 3/15/2018 | | AA/Aaa | | | 100,000 | | | | 100,515 | |
| | | | | | | | | | |
| | | | | | | | | 197,137 | |
| | | | | | | | | | |
COMMERCIAL MTG TRUST — 6.76% | | | | | | | | | | |
| | | |
b DBUBS Mtg Trust CMO, Series 2011-LC1A Class A1, 3.742% due 11/10/2046 | | NR/Aaa | | | 91,353 | | | | 95,393 | |
b FREMF Mtg Trust, Series 2013-KF02 Class B Floating Rate Note, 2.823% due 12/25/2045 | | NR/Baa3 | | | 96,478 | | | | 98,507 | |
b JPMorgan Chase Commercial Mtg, Series 2013-JWRZ Class B Floating Rate Note, 1.305% due 4/15/2030 | | AA-/Aa3 | | | 100,000 | | | | 99,411 | |
b Motel 6 Trust, Series 2012-MTL6 Class A2, 1.948% due 10/5/2025 | | AAA/NR | | | 100,000 | | | | 99,071 | |
| | | | | | | | | | |
| | | | | | | | | 392,382 | |
| | | | | | | | | | |
OTHER ASSET BACKED — 2.60% | | | | | | | | | | |
| | | |
b,c Concord Funding Co. LLC, 2.42% due 2/15/2015 | | A/NR | | | 100,000 | | | | 99,125 | |
b Sierra Receivables Funding Co. LLC, 2.84% due 11/20/2028 | | A+/NR | | | 51,192 | | | | 52,064 | |
| | | | | | | | | | |
| | | | | | | | | 151,189 | |
| | | | | | | | | | |
STUDENT LOAN — 1.70% | | | | | | | | | | |
| | | |
b Pennsylvania Higher Education Assistance Agency Floating Rate Note, 0.704% due 5/25/2027 | | AA+/NR | | | 99,516 | | | | 98,781 | |
| | | | | | | | | | |
| | | | | | | | | 98,781 | |
| | | | | | | | | | |
TOTAL ASSET BACKED SECURITIES (Cost $1,236,668) | | | | | | | | | 1,240,266 | |
| | | | | | | | | | |
8 Certified Semi-Annual Report
| | |
| Schedule of Investments, continued | | |
| |
Thornburg Low Duration Income Fund | | March 31, 2014 (Unaudited) |
| | | | | | | | | | |
| ISSUER-DESCRIPTION | | CREDIT RATING†
S&P/ MOODY’S | | PRINCIPAL
AMOUNT | | | VALUE | |
CORPORATE BONDS — 47.15% | | | | | | | | | | |
| | | |
AUTOMOBILES & COMPONENTS — 3.54% | | | | | | | | | | |
Automobiles — 3.54% | | | | | | | | | | |
a,b Hyundai Capital Services, Inc., 6.00% due 5/5/2015 | | BBB+/Baa1 | | $ | 100,000 | | | $ | 105,355 | |
b Nissan Motor Acceptance Corp., 1.95% due 9/12/2017 | | BBB+/A3 | | | 100,000 | | | | 100,439 | |
| | | | | | | | | | |
| | | | | | | | | 205,794 | |
| | | | | | | | | | |
BANKS — 3.73% | | | | | | | | | | |
Banks — 1.80% | | | | | | | | | | |
a,b Standard Chartered plc, 3.20% due 5/12/2016 | | A+/
A2 | | | 100,000 | | | | 104,364 | |
Thrifts & Mortgage Finance — 1.93% a,b Northern Rock Asset Management plc, 5.625% due 6/22/2017 | | AAA/
Aaa | | | 100,000 | | | | 111,902 | |
| | | | | | | | | | |
| | | | | | | | | 216,266 | |
| | | | | | | | | | |
CAPITAL GOODS — 5.32% | | | | | | | | | | |
Construction & Engineering — 1.78% | | | | | | | | | | |
URS Corp., 3.85% due 4/1/2017 | | BBB-
/Baa3 | | | 100,000 | | | | 103,494 | |
Industrial Conglomerates — 1.73% | | | | | | | | | | |
a,b Smiths Group plc, 6.05% due 5/15/2014 | | BBB+/Baa2 | | | 100,000 | | | | 100,529 | |
Machinery — 1.81% | | | | | | | | | | |
a,b Volvo Treasury AB, 5.95% due 4/1/2015 | | BBB/
Baa2 | | | 100,000 | | | | 104,988 | |
| | | | | | | | | | |
| | | | | | | | | 309,011 | |
| | | | | | | | | | |
COMMERCIAL & PROFESSIONAL SERVICES — 1.78% | | | | | | | | | | |
Commercial Services & Supplies — 1.78% | | | | | | | | | | |
Cintas Corp. No. 2, 2.85% due 6/1/2016 | | BBB+/A2 | | | 100,000 | | | | 103,292 | |
| | | | | | | | | | |
| | | | | | | | | 103,292 | |
| | | | | | | | | | |
CONSUMER DURABLES & APPAREL — 1.74% | | | | | | | | | | |
Household Durables — 1.74% | | | | | | | | | | |
Newell Rubbermaid, Inc., 2.00% due 6/15/2015 | | BBB-
/Baa3 | | | 100,000 | | | | 101,213 | |
| | | | | | | | | | |
| | | | | | | | | 101,213 | |
| | | | | | | | | | |
CONSUMER SERVICES — 1.81% | | | | | | | | | | |
Diversified Consumer Services — 1.81% | | | | | | | | | | |
George Washington University, 4.411% due 9/15/2017 | | A+/
A1 | | | 100,000 | | | | 105,333 | |
| | | | | | | | | | |
| | | | | | | | | 105,333 | |
| | | | | | | | | | |
DIVERSIFIED FINANCIALS — 4.81% | | | | | | | | | | |
Capital Markets — 4.81% | | | | | | | | | | |
a Deutsche Bank AG/London, 2.50% due 2/13/2019 | | A/A2 | | | 75,000 | | | | 75,233 | |
Goldman Sachs Group, Inc. Floating Rate Note, 1.336% due 11/15/2018 | | A-/
Baa1 | | | 100,000 | | | | 100,899 | |
a,b Macquarie Bank Ltd., 3.45% due 7/27/2015 | | A/A2 | | | 100,000 | | | | 103,208 | |
| | | | | | | | | | |
| | | | | | | | | 279,340 | |
| | | | | | | | | | |
ENERGY — 1.73% | | | | | | | | | | |
Oil, Gas & Consumable Fuels — 1.73% | | | | | | | | | | |
a Petrobras Global Finance B.V. Floating Rate Note, 2.593% due 3/17/2017 | | BBB-
/Baa1 | | | 100,000 | | | | 100,375 | |
| | | | | | | | | | |
| | | | | | | | | 100,375 | |
| | | | | | | | | | |
FOOD, BEVERAGE & TOBACCO — 1.82% | | | | | | | | | | |
Beverages — 1.82% | | | | | | | | | | |
a Coca Cola HBC Finance BV, 5.50% due 9/17/2015 | | BBB/
Baa1 | | | 100,000 | | | | 105,842 | |
| | | | | | | | | | |
| | | | | | | | | 105,842 | |
| | | | | | | | | | |
HEALTH CARE EQUIPMENT & SERVICES — 1.69% | | | | | | | | | | |
Health Care Providers & Services — 1.69% | | | | | | | | | | |
Catholic Health Initiatives, 1.60% due 11/1/2017 | | A+/
NR | | | 100,000 | | | | 98,017 | |
| | | | | | | | | | |
| | | | | | | | | 98,017 | |
| | | | | | | | | | |
HOTELS RESTAURANTS & LEISURE — 1.74% | | | | | | | | | | |
Hotels, Restaurants & Leisure — 1.74% | | | | | | | | | | |
a,b TDIC Finance Ltd., 6.50% due 7/2/2014 | | AA/
A1 | | | 100,000 | | | | 101,200 | |
| | | | | | | | | | |
| | | | | | | | | 101,200 | |
| | | | | | | | | | |
Certified Semi-Annual Report 9
| | |
| Schedule of Investments, continued | | |
| |
Thornburg Low Duration Income Fund | | March 31, 2014 (Unaudited) |
| | | | | | | | | | |
| ISSUER-DESCRIPTION | | CREDIT RATING†
S&P/ MOODY’S | | PRINCIPAL
AMOUNT | | | VALUE | |
TELECOMMUNICATION SERVICES — 10.84% | | | | | | | | | | |
Diversified Telecommunication Services — 7.20% | | | | | | | | | | |
AT&T, Inc. Floating Rate Note, 1.144% due 11/27/2018 | | A-/A3 | | $ | 100,000 | | | $ | 101,458 | |
a,b Qtel International Finance Ltd., 6.50% due 6/10/2014 | | A-/A2 | | | 100,000 | | | | 100,790 | |
a Telefonica Emisiones SAU, 6.421% due 6/20/2016 | | BBB/Baa2 | | | 100,000 | | | | 110,673 | |
Verizon Communications, Inc. Floating Rate Note, 1.984% due 9/14/2018 | | BBB+/Baa1 | | | 100,000 | | | | 105,019 | |
Wireless Telecommunication Services — 3.64% | | | | | | | | | | |
b Crown Castle Towers LLC, 5.495% due 1/15/2037 | | NR/A2 | | | 100,000 | | | | 108,104 | |
b SBA Tower Trust, 4.254% due 4/15/2040 | | NR/A2 | | | 100,000 | | | | 103,361 | |
| | | | | | | | | | |
| | | | | | | | | 629,405 | |
| | | | | | | | | | |
TRANSPORTATION — 3.14% | | | | | | | | | | |
Air Freight & Logistics — 1.37% | | | | | | | | | | |
b FedEx Corp., 2.625% due 1/15/2018 | | BBB/A3 | | | 78,110 | | | | 79,655 | |
Road & Rail — 1.77% | | | | | | | | | | |
a,b Asciano Finance Ltd., 3.125% due 9/23/2015 | | BBB-/Baa2 | | | 100,000 | | | | 102,534 | |
| | | | | | | | | | |
| | | | | | | | | 182,189 | |
| | | | | | | | | | |
UTILITIES — 3.46% | | | | | | | | | | |
Electric Utilities — 3.46% | | | | | | | | | | |
a,b Electricite de France S.A., 2.15% due 1/22/2019 | | NR/NR | | | 100,000 | | | | 99,494 | |
a,b Iberdrola Finance Ireland Ltd., 3.80% due 9/11/2014 | | BBB/Baa1 | | | 100,000 | | | | 101,308 | |
| | | | | | | | | | |
| | | | | | | | | 200,802 | |
| | | | | | | | | | |
TOTAL CORPORATE BONDS (Cost $2,727,255) | | | | | | | | | 2,738,079 | |
| | | | | | | | | | |
| | | |
CONVERTIBLE BONDS — 0.83% | | | | | | | | | | |
| | | |
REAL ESTATE — 0.83% | | | | | | | | | | |
Real Estate Investment Trusts — 0.83% | | | | | | | | | | |
b IAS Operating Partnership LP, 5.00% due 3/15/2018 | | NR/NR | | | 50,000 | | | | 48,250 | |
| | | | | | | | | | |
| | | | | | | | | 48,250 | |
| | | | | | | | | | |
TOTAL CONVERTIBLE BONDS (Cost $46,119) | | | | | | | | | 48,250 | |
| | | | | | | | | | |
| | | |
MUNICIPAL BONDS — 7.12% | | | | | | | | | | |
City & County of Denver Airport System, 0.28% due 11/15/2025 put 4/1/2014 (Denver International Airport; Insured: AGM; | | | | | | | | | | |
SPA: Morgan Stanley Bank) (daily demand notes) | | AA/A1 | | | 115,000 | | | | 115,000 | |
JobsOhio Beverage System, 2.217% due 1/1/2019 | | AA/A2 | | | 100,000 | | | | 97,727 | |
Massachusetts Housing Finance Agency, 1.45% due 12/1/2015 (Multi-Family Residential Development) | | A+/Aa3 | | | 100,000 | | | | 100,854 | |
State of New York Mtg Agency, 0.42% due 10/1/2014 | | NR/Aa1 | | | 50,000 | | | | 50,012 | |
State of New York Mtg Agency, 0.52% due 4/1/2015 | | NR/Aa1 | | | 50,000 | | | | 49,970 | |
| | | | | | | | | | |
TOTAL MUNICIPAL BONDS (Cost $410,748) | | | | | | | | | 413,563 | |
| | | | | | | | | | |
TOTAL INVESTMENTS — 93.78% (Cost $5,425,659) | | | | | | | | $ | 5,446,346 | |
OTHER ASSETS LESS LIABILITIES — 6.22% | | | | | | | | | 361,138 | |
| | | | | | | | | | |
NET ASSETS — 100.00% | | | | | | | | $ | 5,807,484 | |
| | | | | | | | | | |
10 Certified Semi-Annual Report
| | |
| Schedule of Investments, continued | | |
| |
Thornburg Low Duration Income Fund | | March 31, 2014 (Unaudited) |
Footnote Legend
| † | Credit ratings are unaudited. Rating changes may have occurred subsequent to the reporting period end. Bonds issued with a maturity of one year or less are assigned Moody’s ratings from MIG-1 to MIG-4 and Standard and Poor’s ratings from SP-1+ to SP-3 with MIG-1 and SP-1+ being the strongest ratings. |
| a | Yankee Bond - Denominated in U.S. dollars and is issued in the U.S. by foreign banks and corporations. |
| b | Securities exempt from registration under Rule 144A of the Securities Act of 1933, as amended. These securities may only be resold in the ordinary course of business in transactions exempt from registration, normally to qualified institutional buyers. As of March 31, 2014, the aggregate value of these securities in the Fund’s portfolio was $2,815,232, representing 48.48% of the Fund’s net assets. |
| c | Security currently fair valued by the Valuation and Pricing Committee using procedures approved by the Trustees. |
Portfolio Abbreviations
To simplify the listings of securities, abbreviations are used per the table below:
| | |
| CMO | | Collateralized Mortgage Obligation |
| Mtg | | Mortgage |
| SPA | | Stand-by Purchase Agreement |
See notes to financial statements.
Certified Semi-Annual Report 11
| | |
| Statement of Assets and Liabilities | | |
| |
Thornburg Low Duration Income Fund | | March 31, 2014 (Unaudited) |
| | | | |
ASSETS | | | | |
Investments at value (cost $5,425,659) (Note 2) | | $ | 5,446,346 | |
Cash | | | 261,563 | |
Receivable for fund shares sold | | | 49 | |
Receivable from investment advisor | | | 7,193 | |
Interest receivable | | | 32,600 | |
Prepaid expenses and other assets | | | 60,026 | |
| | | | |
Total Assets | | | 5,807,777 | |
| | | | |
| |
LIABILITIES | | | | |
Payable for fund shares redeemed | | | 140 | |
Dividends payable | | | 153 | |
| | | | |
Total Liabilities | | | 293 | |
| | | | |
| |
NET ASSETS | | $ | 5,807,484 | |
| | | | |
NET ASSETS CONSIST OF | | | | |
Net unrealized appreciation on investments | | $ | 20,687 | |
Accumulated net realized gain (loss) | | | (239 | ) |
Net capital paid in on shares of beneficial interest | | | 5,787,036 | |
| | | | |
| | $ | 5,807,484 | |
| | | | |
NET ASSET VALUE | | | | |
Class A Shares: | | | | |
Net asset value and redemption price per share
($2,870,707 applicable to 232,314 shares of beneficial interest outstanding - Note 4) | | $ | 12.36 | |
Maximum sales charge, 1.50% of offering price | | | 0.19 | |
| | | | |
Maximum offering price per share | | $ | 12.55 | |
| | | | |
| |
Class I Shares: | | | | |
Net asset value, offering and redemption price per share
($2,936,777 applicable to 237,653 shares of beneficial interest outstanding - Note 4) | | $ | 12.36 | |
| | | | |
See notes to financial statements.
12 Certified Semi-Annual Report
| | |
| Statement of Operations | | |
| |
Thornburg Low Duration Income Fund | | Period ended March 31, 2014 (Unaudited)* |
| | | | |
INVESTMENT INCOME | | | | |
Interest income (net of premium amortized of $14,158) | | $ | 25,599 | |
| | | | |
| |
EXPENSES | | | | |
Investment advisory fees (Note 3) | | | 5,588 | |
Administration fees (Note 3) | | | | |
Class A Shares | | | 821 | |
Class I Shares | | | 370 | |
Distribution and service fees (Note 3) | | | | |
Class A Shares | | | 1,331 | |
Transfer agent fees | | | | |
Class A Shares | | | 920 | |
Class I Shares | | | 920 | |
Registration and filing fees | | | | |
Class A Shares | | | 4,600 | |
Class I Shares | | | 4,600 | |
Custodian fees (Note 3) | | | 4,656 | |
Professional fees | | | 6,992 | |
Accounting fees | | | 92 | |
Trustee fees | | | 92 | |
Other expenses | | | 7,174 | |
| | | | |
Total Expenses | | | 38,156 | |
Less: | | | | |
Expenses reimbursed by investment advisor (Note 3) | | | (12,274 | ) |
Investment advisory fees waived by investment advisor (Note 3) | | | (17,652 | ) |
Fees paid indirectly (Note 3) | | | (56 | ) |
| | | | |
Net Expenses | | | 8,174 | |
| | | | |
Net Investment Income | | | 17,425 | |
| | | | |
| |
REALIZED AND UNREALIZED GAIN (LOSS) | | | | |
Net realized gain (loss) on investments | | | (239 | ) |
Net change in unrealized appreciation (depreciation) of investments | | | 20,687 | |
| | | | |
Net Realized and Unrealized Gain | | | 20,448 | |
| | | | |
Net Increase in Net Assets Resulting from Operations | | $ | 37,873 | |
| | | | |
| * | For the unaudited period from commencement of operations on December 30, 2013 through March 31, 2014. |
See notes to financial statements.
Certified Semi-Annual Report 13
| | |
| Statement of Changes in Net Assets | | |
| |
Thornburg Low Duration Income Fund | | |
| | | | |
| | | PERIOD ENDED*
MARCH 31, 2014 | |
INCREASE (DECREASE) IN NET ASSETS FROM | | | | |
| |
OPERATIONS | | | | |
Net investment income | | $ | 17,425 | |
Net realized gain (loss) on investments | | | (239 | ) |
Net unrealized appreciation (depreciation) on investments | | | 20,687 | |
| | | | |
| |
Net Increase (Decrease) in Net Assets Resulting from Operations | | | 37,873 | |
| |
DIVIDENDS TO SHAREHOLDERS | | | | |
From net investment income | | | | |
Class A Shares | | | (7,480 | ) |
Class I Shares | | | (9,945 | ) |
| |
FUND SHARE TRANSACTIONS (NOTE 4) | | | | |
Class A Shares | | | 2,861,567 | |
Class I Shares | | | 2,925,469 | |
| | | | |
Net Increase in Net Assets | | | 5,807,484 | |
| |
NET ASSETS | | | | |
Beginning of Period | | | — | |
| | | | |
| |
End of Period | | $ | 5,807,484 | |
| | | | |
| * | For the unaudited period from commencement of operations on December 30, 2013 through March 31, 2014. |
See notes to financial statements.
14 Certified Semi-Annual Report
| | |
| Notes to Financial Statements | | |
| |
Thornburg Low Duration Income Fund | | March 31, 2014 (Unaudited) |
NOTE 1 – ORGANIZATION
Thornburg Low Duration Income Fund (the “Fund”) is a diversified series of Thornburg Investment Trust (the “Trust”). The Trust is organized as a Massachusetts business trust under a Declaration of Trust dated June 3, 1987 and is registered as a diversified, open-end management investment company under the Investment Company Act of 1940, as amended. The Fund is currently one of eighteen separate series of the Trust. Each series is considered to be a separate entity for financial reporting and tax purposes and bears expenses directly attributable to it. The Fund’s investment objective is to seek current income, consistent with the preservation of capital.
The Fund currently offers two classes of shares of beneficial interest: Class A and Institutional Class (“Class I”). Each class of shares of the Fund represents an interest in the same portfolio of investments, except that (i) Class A shares are sold subject to a front-end sales charge collected at the time the shares are purchased and bear a service fee, (ii) Class I shares are sold at net asset value without a sales charge at the time of purchase and may be subject to a service fee, and (iii) the respective classes may have different reinvestment privileges and conversion rights. Additionally, the Fund may allocate among its classes certain expenses, to the extent allocable to specific classes, including transfer agent fees, government registration fees, certain printing and postage costs, and administrative and legal expenses. Currently, class specific expenses of the Fund are limited to service and distribution fees, administration fees, and certain registration and transfer agent expenses.
NOTE 2 – SIGNIFICANT ACCOUNTING POLICIES
Significant accounting policies of the Trust are as follows:
Valuation Policy and Procedures: The Fund’s Trustees of the Trust (the “Trustees”) have authorized employees of the Fund’s investment advisor, acting as the Valuation and Pricing Committee (the “Committee”), to make certain valuation determinations, subject to oversight and review by the Trustees and the Audit Committee of the Trustees. The Committee and other employees of the Fund’s investment advisor administer and implement the valuation process. The Committee regularly reviews its own fair value decisions, as well as valuations, valuation techniques and services furnished by pricing services, considers circumstances in the markets which may require valuation determinations by the Committee and reviews previous valuation determinations. The Committee also reports on its activities, the performance of the pricing services and other matters to the Trustees and the Audit Committee of the Trustees.
In determining a fair value for a portfolio investment, the Committee seeks to determine the price that the Fund would reasonably expect to receive upon a sale of the investment in an orderly transaction between market participants at the measurement date. Typically, the fair value process employs standing instructions to use quoted prices in active markets or the use of independent pricing services. Less frequently, the Committee may make a fair value determination using other methods. However, because fair value prices are estimated prices, the determination of fair value for an investment may differ from the value that would be realized by the Fund upon a sale of the investment, and that difference could be material to the Fund’s financial statements. The Committee’s determination of fair value for an investment may also differ from the prices obtained by other persons (including other mutual funds) for the investment.
Valuation of Investments: Debt obligations held by the Fund have a primary over-the-counter market and are valued by an independent pricing service approved by the Trustees. The pricing service ordinarily values debt obligations at quoted bid prices. When quotations are not available, debt obligations held by the Fund are valued at evaluated prices determined by the pricing service using methods which include consideration of yields or prices of debt obligations of comparable quality, type of issue, coupon, maturity and rating, and indications as to value from dealers and general market conditions. Short-term obligations having remaining maturities of 60 days or less are ordinarily valued at amortized cost, which approximates market value.
In any case when a pricing service fails to provide a price for a debt obligation held by the Fund, the Committee determines a fair value for the debt obligation using procedures in accordance with a policy approved by the Trustees, which may include the use of a price obtained from a different independent pricing service. Additionally, in any case when management believes that a price provided by a pricing service for a debt obligation held by the Fund may be unreliable, the Committee decides whether or not to use the pricing service’s valuation or to use an alternative method to determine a fair value for the debt obligation.
Valuation Measurements: The Fund categorizes its investments based upon the inputs used in valuing those investments, according to a three-level hierarchy established by guidance from the Financial Accounting Standards Board (the “FASB”). Categorization of investments using this hierarchy is intended by the FASB to maximize the use of observable inputs and minimize the use of unobservable inputs by prioritizing that the most observable input be used when available. Observable inputs are those that market participants would use in valuing an investment based on available market data. Unobservable inputs are those that reflect assumptions about the information market participants would use in valuing an investment. An investment’s level within the hierarchy is based on the lowest level input that is deemed significant to the fair value measurement. The methodologies and relative inputs used to value investments are not necessarily indications of the risk or liquidity associated with investing in those investments.
Certified Semi-Annual Report 15
| | |
| Notes to Financial Statements, Continued | | |
| |
Thornburg Low Duration Income Fund | | March 31, 2014 (Unaudited) |
Various inputs are used in determining the fair value measurement of the Fund’s investments. These inputs are generally summarized according to the three-level hierarchy below:
Level 1: Quoted prices in active markets for identical investments.
Level 2: Other direct or indirect significant observable inputs (including quoted prices for similar investments in active markets and other observable inputs, such as interest rates, prepayment rates, credit risk, etc.).
Level 3: Significant unobservable inputs, (including the Committee’s own assumptions in determining the fair value of investments), are generally applicable to investments fair valued with single broker quotes and other investments.
Portfolio investments with minimal, if any, market activity are characterized as Level 3 and are valued using significant unobservable inputs, typically including single broker quotes, which may be adjusted or unadjusted, related or comparable investments, last available transactions, and other relevant information. Valuations may also be based upon current market prices of securities that are comparable in coupon, rating, maturity and industry. An income based valuation approach would consider discounted anticipated future cash flows of the investment. Discounts may also be applied due to the nature or duration of any restrictions on the disposition of the investment. The derived value of a Level 3 investment may not represent the value which is received upon disposition.
The following table displays a summary of the fair value hierarchy measurements of the Fund’s investments as of March 31, 2014. In any instance when valuation inputs from more than one level are used to determine the fair value of a specific investment, the investment is placed in the level of the table based upon the lowest level input that is significant in determining the fair value of the investment:
| | | | | | | | | | | | | | | | |
| | �� | FAIR VALUE MEASUREMENTS AT MARCH 31, 2014 | |
| | | TOTAL | | | LEVEL 1 | | | LEVEL 2 | | | LEVEL 3(a) | |
Assets | | | | | | | | | | | | | | | | |
Investments in Securities | | | | | | | | | | | | | | | | |
U.S. Treasury Securities | | $ | 497,450 | | | $ | 497,450 | | | $ | — | | | $ | — | |
U.S. Government Agencies | | | 200,517 | | | | — | | | | 200,517 | | | | — | |
Other Government | | | 308,221 | | | | — | | | | 308,221 | | | | — | |
Asset Backed Securities | | | 1,240,266 | | | | — | | | | 1,041,079 | | | | 199,187 | |
Corporate Bonds | | | 2,738,079 | | | | — | | | | 2,738,079 | | | | — | |
Convertible Bonds | | | 48,250 | | | | — | | | | 48,250 | | | | — | |
Municipal Bonds | | | 413,563 | | | | — | | | | 413,563 | | | | — | |
Total Investments in Securities | | $ | 5,446,346 | | | $ | 497,450 | | | $ | 4,749,709 | | | $ | 199,187 | |
| (a) | In accordance with the guidance prescribed in Accounting Standards Update No. 2011-04 (“ASU no. 2011-04”), unadjusted broker quotes were applied to portfolio securities characterized as Level 3 investments at March 31, 2014. |
In accordance with the guidance prescribed in ASU No. 2011-04, it is the policy of the Fund to recognize transfers between levels and those underlying events which caused the movement. The Fund recognized no transfers between levels for the period ended March 31, 2014.
16 Certified Semi-Annual Report
| | |
| Notes to Financial Statements, Continued | | |
| |
Thornburg Low Duration Income Fund | | March 31, 2014 (Unaudited) |
A rollforward of fair value measurements using significant unobservable inputs (Level 3) for the period ended March 31, 2014 is as follows:
| | | | | | | | |
| | | ASSET BACKED
SECURITIES | | | TOTAL(c) | |
Beginning Balance 9/30/2013 | | $ | — | | | $ | — | |
Accrued Discounts (Premiums) | | | 474 | | | | 474 | |
Net Realized Gain (Loss) | | | — | | | | — | |
Gross Purchases | | | 197,750 | | | | 197,750 | |
Gross Sales | | | — | | | | — | |
Net Change in Unrealized Appreciation (Depreciation)(a) | | | 963 | | | | 963 | |
Transfers into Level 3(b) | | | — | | | | — | |
Transfers out of Level 3(b) | | | — | | | | — | |
Ending Balance 3/31/2014 | | $ | 199,187 | | | $ | 199,187 | |
| (a) | Amount of Net Change in Unrealized Appreciation (Depreciation) recognized in the net increase in net assets resulting from operations is included in the Fund’s Statement of Operations for the period ended March 31, 2014. |
| (b) | Transfers into or out of Level 3 were out of or into Level 2, and were due to changes in other significant observable inputs available during the period ended March 31, 2014. Transfers into or out of Level 3 are based on the beginning market value of the period in which they occurred. |
| (c) | Level 3 investments represent 3.43% of total Net Assets at the period ended March 31, 2014. Significant fluctuations of the unobservable inputs applied to portfolio investments characterized as Level 3 could be expected to increase or decrease the fair value of these portfolio investments. |
Federal Income Taxes: It is the policy of the Trust to comply with the provisions of the Internal Revenue Code applicable to “regulated investment companies” and to distribute to shareholders substantially all taxable income, including any net realized gain on investments of the Fund. Therefore, no provision for federal income taxes is required.
Management reviews each uncertain tax position believed to be material to the preparation of the Fund’s financial statements, to assess if it is more likely than not that the position would be sustained upon examination, based upon the technical merits of the position. As of March 31, 2014, management has not identified any such position for which an asset or liability must be reflected in the Statement of Assets and Liabilities. The Fund’s tax returns remain subject to examination for three years after filing.
When-Issued and Delayed Delivery Transactions: The Fund may engage in when-issued or delayed delivery transactions. To the extent the Fund engages in such transactions, it will do so for the purpose of acquiring portfolio investments consistent with the Fund’s investment objectives and not for the purpose of investment leverage or to speculate on interest rate and/or market changes. At the time the Fund makes a commitment to purchase an investment on a when-issued or delayed delivery basis, the Fund will record the transaction and reflect the value in determining its net asset value. When effecting such transactions, assets of an amount sufficient to make payment for the portfolio investments to be purchased will be segregated on the Fund’s records on the trade date. Investments purchased on a when-issued or delayed delivery basis do not earn interest until the settlement date.
Dividends: Net investment income of the Fund is declared daily as a dividend on shares for which the Fund has received payment. Dividends are paid monthly and are reinvested in additional shares of the Fund at net asset value per share at the close of business on the dividend payment date, or at the shareholder’s option, paid in cash. Net realized capital gains, to the extent available, will be distributed at least annually.
General: Investment transactions are accounted for on a trade date basis. Interest income is accrued as earned. Premiums and discounts on securities purchased are amortized over the life of the respective securities. Realized gains and losses from the sale of securities are recorded on an identified cost basis. The Fund may invest in various mortgage-backed securities. Such securities pay interest and a portion of principal each month, which is then available for investment in securities at prevailing prices. Paydown gains and losses on these securities are included in interest income. Net investment income (other than class specific expenses) and realized and unrealized gains and losses are allocated daily to each class of shares based upon the relative net asset value of outstanding shares (or the value of the dividend-eligible shares, as appropriate) of each class of shares at the beginning of the day (after adjusting for the current share activity of the respective class). Expenses common to all Funds are allocated among the Funds comprising the Trust based upon their relative net asset values or other appropriate allocation methods.
Certified Semi-Annual Report 17
| | |
| Notes to Financial Statements, Continued | | |
| |
Thornburg Low Duration Income Fund | | March 31, 2014 (Unaudited) |
Guarantees and Indemnifications: Under the Trust’s organizational documents (and under separate agreements with the independent Trustees), its officers and Trustees are indemnified against certain liabilities arising out of the performance of their duties to the Fund. Additionally, in the normal course of business the Trust enters into contracts with service providers that contain general indemnification clauses. The Trust’s maximum exposure under these arrangements is unknown. However, based on experience, the Trust expects the risk of loss to be remote.
Use of Estimates: The preparation of financial statements, in conformity with United States generally accepted accounting principles, requires management to make estimates and assumptions that affect the reported amounts of assets and liabilities and the disclosure of contingent assets and liabilities at the date of the financial statements and the reported amounts of increases and decreases in net assets from operations during the reporting period. Actual amounts could differ from those estimates.
NOTE 3 – INVESTMENT ADVISORY FEE AND OTHER TRANSACTIONS WITH AFFILIATES
Pursuant to an investment advisory agreement, Thornburg Investment Management, Inc. (the “Advisor”) serves as the investment advisor and performs services for the Fund for which the fees are payable at the end of each month. For the period ended March 31, 2014, these fees were payable at annual rates ranging from .40 of 1% to .225 of 1% per annum of the average daily net assets of the Fund depending on the Fund’s asset size. The Trust also has entered into administrative services agreements with the Advisor, whereby the Advisor will perform certain administrative services for the shareholders of each class of the Fund’s shares, and for which fees will be payable at an annual rate of up to .125 of 1% per annum of the average daily net assets attributable to each class of shares.
The Trust has an underwriting agreement with Thornburg Securities Corporation (the “Distributor,” an affiliate of the Advisor), which acts as the distributor of the Fund’s shares. For the period ended March 31, 2014, the Distributor has advised the Fund that it earned net commissions aggregating $13 from the sale of Class A shares of the Fund.
Pursuant to a service plan under Rule 12b-1 of the Investment Company Act of 1940, the Fund may reimburse to the Advisor an amount not to exceed .20 of 1% per annum of the average daily net assets attributable to each Class of shares of the Fund for payments made by the Advisor to securities dealers and other financial institutions to obtain various shareholder and distribution related services. For the period ended March 31, 2014, there were no 12b-1 service plan fees charged for Class I shares. The Advisor may pay out of its own resources additional expenses for distribution of the Fund’s shares.
The Advisor and Distributor have contractually agreed to waive fees and reimburse expenses incurred by the Fund so that actual expenses of certain share classes do not exceed specified levels. The agreement may be terminated by the Fund at any time, but may not be terminated by the Advisor or Distributor before February 1, 2015, unless the Advisor ceases to be the investment advisor to the Fund or the Distributor ceases to be the distributor of the Fund prior to that date. The Advisor and Distributor retain the right to be repaid by the Fund for fee waivers and expense reimbursements if expenses fall below the contractual limit prior to the end of the fiscal year.
For the period ended March 31, 2014, the Advisor contractually reimbursed certain class specific expenses and administrative fees of $6,384 for Class A shares and $5,890 for Class I shares, and voluntarily waived investment advisory fees of $17,652.
The Trust has an agreement with the custodian bank to indirectly pay a portion of the custodian’s fees through credits earned by the Fund’s cash on deposit with the bank. This deposit agreement is an alternative to overnight investments. Custodial fees are adjusted to reflect amounts that would have been paid without this agreement, with a corresponding adjustment reflected as fees paid indirectly in the Statement of Operations. For the period ended March 31, 2014, fees paid indirectly were $56.
Certain officers and Trustees of the Trust are also officers or directors of the Advisor and Distributor. The compensation of independent Trustees is borne by the Trust.
18 Certified Semi-Annual Report
| | |
| Notes to Financial Statements, Continued | | |
| |
Thornburg Low Duration Income Fund | | March 31, 2014 (Unaudited) |
NOTE 4 – SHARES OF BENEFICIAL INTEREST
At March 31, 2014, there were an unlimited number of shares of beneficial interest authorized. Transactions in shares of beneficial interest were as follows:
| | | | | | | | |
| | | PERIOD ENDED*
MARCH 31, 2014 | |
| | | SHARES | | | AMOUNT | |
Class A Shares | | | | | | | | |
Shares sold | | | 231,729 | | | $ | 2,854,341 | |
Shares issued to shareholders in reinvestment of dividends | | | 596 | | | | 7,366 | |
Shares repurchased | | | (11 | ) | | | (140 | ) |
| | | | | | | | |
| | |
Net increase (decrease) | | | 232,314 | | | $ | 2,861,567 | |
| | | | | | | | |
Class I Shares | | | | | | | | |
Shares sold | | | 257,053 | | | $ | 3,165,569 | |
Shares issued to shareholders in reinvestment of dividends | | | 800 | | | | 9,900 | |
Shares repurchased | | | (20,200 | ) | | | (250,000 | ) |
| | | | | | | | |
| | |
Net increase (decrease) | | | 237,653 | | | $ | 2,925,469 | |
| | | | | | | | |
| * | Fund commenced operations on December 30, 2013. |
NOTE 5 – INVESTMENT TRANSACTIONS
For the period ended March 31, 2014, the Fund had purchase and sale transactions of investments (excluding short-term investments and U. S. Government obligations) of $5,572,564 and $906,958, respectively.
NOTE 6 – INCOME TAXES
At March 31, 2014, information on the tax components of capital was as follows:
| | | | |
Cost of investments for tax purposes | | $ | 5,425,659 | |
| | | | |
Gross unrealized appreciation on a tax basis | | $ | 22,391 | |
Gross unrealized depreciation on a tax basis | | | (1,704 | ) |
| | | | |
Net unrealized appreciation (depreciation) on investments (tax basis) | | $ | 20,687 | |
| | | | |
OTHER NOTES
Risks: The Fund’s investments subject it to risks including, but not limited to, credit risk, interest rate risk, prepayment risk, management risk, market and economic risk, liquidity risk, risks affecting specific issuers, and the risks associated with investments in derivative instruments and smaller companies. Please see the Fund’s prospectus for a discussion of the risks associated with an investment in the Fund.
Subsequent Events: Fund management believes no events have occurred between March 31, 2014 and the date of issuance of the financial statements that require adjustment to or disclosure in the accompanying financial statements.
Certified Semi-Annual Report 19
Financial Highlights
Thornburg Low Duration Income Fund
| | | | | | | | | | | | | | | | | | | | | | | | | | | | | | | | | | | | | | | | | | | | | | | | |
| | | PER SHARE PERFORMANCE (FOR A SHARE OUTSTANDING THROUGHOUT THE PERIOD)+ | | RATIOS TO AVERAGE NET ASSETS | | | SUPPLEMENTAL DATA | |
UNLESS OTHERWISE NOTED, PERIODS ARE FISCAL YEARS ENDED SEPT. 30, | | NET ASSET
VALUE
BEGINNING
OF PERIOD | | | NET INVESTMENT INCOME (LOSS) | | NET
REALIZED
&
UNREALIZED
GAIN (LOSS)
ON
INVESTMENTS | | | TOTAL FROM INVESTMENT OPERATIONS | | DIVIDENDS
FROM NET
INVESTMENT
INCOME | | | DIVIDENDS FROM NET REALIZED GAINS | | TOTAL
DIVIDENDS | | | NET ASSET VALUE END OF PERIOD | | NET
INVESTMENT
INCOME
(LOSS)
(%) | | | EXPENSES,
AFTER
EXPENSE
REDUCTIONS
(%) | | | EXPENSES,
AFTER
EXPENSE
REDUCTIONS
AND
NET OF
CUSTODY
CREDITS (%) | | | EXPENSES,
BEFORE
EXPENSE
REDUCTIONS
(%) | | | TOTAL
RETURN
(%)(a) | | PORTFOLIO
TURNOVER
RATE (%)(a) | | NET
ASSETS
AT END
OF
PERIOD
(THOUSANDS) | |
Class A Shares | | | | | | | | | | | | | | | | | | | | | | | | | | | | | | | | | | | | | | | | | | |
2014(b)(c)(d) | | $ | 12.31 | | | 0.04 | | | 0.05 | | | 0.09 | | | (0.04 | ) | | — | | | (0.04 | ) | | $12.36 | | | 1.14 | (e) | | | 0.69 | (e) | | | 0.69 | (e) | | | 2.93 | (e) | | 0.69 | | 18.38 | | $ | 2,870 | |
Class I Shares | | | | | | | | | | | | | | | | | | | | | | | | | | | | | | | | | | | | | | | | | | |
2014(b)(d) | | $ | 12.31 | | | 0.04 | | | 0.05 | | | 0.09 | | | (0.04 | ) | | — | | | (0.04 | ) | | $12.36 | | | 1.34 | (e) | | | 0.50 | (e) | | | 0.49 | (e) | | | 2.56 | (e) | | 0.74 | | 18.38 | | $ | 2,937 | |
| (a) | Not annualized for periods less than one year. |
| (b) | Fund commenced operations on December 30, 2013. |
| (c) | Sales loads are not reflected in computing total return. |
| (d) | Unaudited Period Ended March 31. |
| + | Based on weighted average shares outstanding, except for Dividends from Net Investment Income and Net Realized Gains, which are actual amounts per share. |
See notes to financial statements.
| | | | |
| 20 Certified Semi-Annual Report | | | | Certified Semi-Annual Report 21 |
| | |
| Expense Example | | |
| |
Thornburg Low Duration Income Fund | | March 31, 2014 (Unaudited) |
As a shareholder of the Fund, you incur two types of costs:
| | (1) | transaction costs, including |
(a) sales charges (loads) on purchase payments, for Class A shares;
(b) a deferred sales charge on redemptions of any part or all of a purchase of $1 million of Class A shares within 12 months of purchase;
| | (2) | ongoing costs, including management fees; distribution and/ or service (12b-1) fees; and other Fund expenses. |
This example is intended to help you understand your ongoing costs (in dollars) of investing in the Fund and to compare these costs with the ongoing costs of investing in other mutual funds.
The example is based on a $1,000 investment beginning on October 1, 2013, and held until March 31, 2014.
| | | | | | | | | | | | |
| | | BEGINNING
ACCOUNT VALUE
10/1/13 | | | ENDING
ACCOUNT VALUE
3/31/14 | | | EXPENSES PAID
DURING PERIOD†
10/1/13–3/31/14 | |
Class A Shares | | | | | | | | | | | | |
Actual | | $ | 1,000.00 | | | $ | 1,006.90 | | | $ | 3.45 | |
Hypothetical* | | $ | 1,000.00 | | | $ | 1,021.49 | | | $ | 3.47 | |
Class I Shares | | | | | | | | | | | | |
Actual | | $ | 1,000.00 | | | $ | 1,007.40 | | | $ | 2.46 | |
Hypothetical* | | $ | 1,000.00 | | | $ | 1,022.48 | | | $ | 2.48 | |
| † | Expenses are equal to the annualized expense ratio for each class (A: 0.69%; I: 0.49%) multiplied by the average account value over the period, multiplied by 182/365 to reflect the one-half year period. |
| * | Hypothetical assumes a rate of return of 5% per year before expenses. |
Actual Expenses
For each class of shares, the first line of the accompanying table provides information about actual account values and actual expenses. You may use the information in this line, together with the amount you invested, to estimate the expenses that you paid over the period. Simply divide your account value by $1,000 (for example, an $8,600 account value divided by $1,000 = 8.6), then multiply the result by the number in the first line for your class of shares under the heading entitled “Expenses Paid During Period” to estimate the expenses you paid on your account during this period.
Hypothetical Example for Comparison Purposes
For each class of shares, the second line of the accompanying table provides information about hypothetical account values and hypothetical expenses based on the Fund’s actual expense ratio and an assumed rate of return of 5% per year before expenses, which is not the Fund’s actual return. The hypothetical account values and expenses may not be used to estimate the actual ending account balance or expenses you paid for the period. You may use this information to compare the ongoing costs of investing in the Fund and other funds. To do so, compare this 5% hypothetical example with the 5% hypothetical examples that appear in the shareholder reports of the other funds.
Please note that the expenses shown in the table are meant to highlight your ongoing costs only and do not reflect any transactional costs, such as sales charges (loads), redemption fees, or exchange fees. Therefore, the second line of the table for each class of shares is useful in comparing ongoing costs only, and will not help you determine the relative total costs of owning different funds. In addition, if these transactional costs were included, your costs would have been higher.
22 Certified Semi-Annual Report
| | |
| Other Information | | |
| |
Thornburg Low Duration Income Fund | | March 31, 2014 (Unaudited) |
Portfolio Proxy Voting
Policies and Procedures:
The Trust has delegated to Thornburg Investment Management, Inc. (the “Advisor”) voting decisions respecting proxies for the Fund’s voting securities. The Advisor makes voting decisions in accordance with its Proxy Voting Policy and Procedures. A description of the Policy and Procedures is available (i) without charge, upon request, by calling the Advisor toll-free at 1-800-847-0200, (ii) on the Thornburg website at www.thornburg.com, and (iii) on the Securities and Exchange Commission’s website at www.sec.gov.
No proxy voting information is currently available because the Fund commenced operations on December 30, 2013. The Fund expects to begin making annual proxy voting information available in accordance with applicable regulations commencing on or before August 31, 2014. This information is available (i) without charge, upon request by calling the Advisor toll-free at 1-800-847-0200, (ii) on the Thornburg website at www.thornburg.com, and (iii) on the Securities and Exchange Commission’s website at www.sec.gov.
Availability of Quarterly Portfolio Schedule
The Fund files with the Securities and Exchange Commission schedules of its portfolio holdings on Form N-Q for the first and third quarters of each fiscal year. The Fund’s Forms N-Q are available on the Commission’s website at www.sec.gov, or may be reviewed and copied at the Commission’s Public Reference Room in Washington, D.C. Information on the operation of the Public Reference Room may be obtained by calling 1-800-SEC-0330. The Fund also makes this information available on its website at www.thornburg. com/download or upon request by calling 1-800-847-0200.
Certified Semi-Annual Report 23
Trustees’ Statement to Shareholders
Not part of the Certified Semi-Annual Report
Reissued September 15, 2013
The Trustees believe current and prospective shareholders should know how we discharge our responsibilities in supervising the Funds’ investment advisor and in reviewing the advisor’s contract for renewal. Since 2005, we have issued a statement which sets out clearly the three principal guidelines that we follow in supervising the Trust’s investment advisor on your behalf. In accordance with our customary practice, in September of this year we again reviewed our statement and concluded we should reissue this statement outlining the principal features of our supervision of the advisor’s performance of investment management services for the Funds.
We begin with the premise that each shareholder selected his or her Fund because its investments are managed by the investment advisor identified in the prospectus and in accordance with the objective and policies described in the prospectus. We realize, as each of you do, that if you believe that your Fund’s stated objective and policies no longer serve your personal investment goals, you can sell your shares and leave the Fund.
Therefore, we believe that our primary supervisory task – our principal obligation to you – is to assess the nature and quality of the advisor’s services, and to confirm that the advisor actively and competently pursues the Fund’s objective, in accordance with the policies set out in the prospectus. To do this, we meet regularly with management to review your Fund’s portfolio and to discuss the advisor’s specific actions and judgments in pursuing the Fund’s objective. We do not substitute our own judgment for the advisor’s decisions in selecting investments; the advisor is paid to exercise its informed judgment on investment decisions, and we seek to confirm, in reviewing the advisor’s performance, that the advisor is doing just that.
Second, while we are conscious of costs and the effect that costs have on shareholders’ returns, we do not seek the lowest fees or expense ratio as our sole or primary objective. We try to make sure that your Fund’s fees and costs are reasonable in relationship to the services rendered and that they are generally in line with those charged by other expert investment advisors, consistent with our belief that the Fund’s investors searched for and expect that expertise and attention and have decided to pay a reasonable price for it. We do not put the management contract “out to bid” as a matter of course, and we would not do so unless we had concluded that the advisor materially had failed to pursue the Fund’s objectives in accordance with its policies, or for other equally important reasons. We believe that any other approach would be inconsistent with your interests and contrary to your expectations when you bought shares of the Fund in the first place.
Finally, because we believe that most Thornburg Fund shareholders have invested with a long-term perspective, we try not to focus too much on the fashions of the moment and on short-term performance. The market will not favor any specific investment objective or set of policies at all times and under all economic circumstances. A fund will experience periods of both high and low returns relative to other funds and other investments. Even if one of our Funds is not favored by the market at a particular time, we believe that the advisor is nonetheless obliged to remain true to the Fund’s objective and policies, and we watch to see that it does so.
24 This page is not part of the Semi-Annual Report
Retirement and Education Accounts
Thornburg Investment Management offers retirement and education savings accounts that can help you meet a variety of planning challenges. For account applications or further information on any of the accounts below, please call 1-800-847-0200 or go to www.thornburg.com/ira. Your financial advisor can help you determine which plan is right for you.
Individual Retirement Accounts
Individual Retirement Accounts (IRAs) provide a tax-advantaged means to save money for the future. For a detailed outline of the difference between retirement accounts, see www.thornburg.com/ira. Rollovers are available. Call 1-800-847-0200 for more information.
Traditional IRAs – Contributions to Traditional IRAs are tax deductible for eligible individuals, and withdrawals are taxed as additional ordinary income. You may contribute to an IRA if you receive compensation and are under 70 1/2, even if you are covered by an employer retirement plan. Deductible contributions are subject to certain qualifications. Please consult your tax advisor.
Roth IRAs – Under a Roth IRA, there is no tax deduction for contributions, but there is no income tax on qualified withdrawals. For a more detailed comparison of Traditional and Roth IRAs, please see our website at www.thornburg. com/ira.
SEP IRAs – Simplified Employee Pension (SEP) IRAs are established by employers. The employer is allowed a tax deduction for contributions made to the SEP Plan and makes contributions to each eligible employee’s SEP IRA on a discretionary basis.
SIMPLE IRAs – Savings Incentive Match Plan for Employees of Small Employers (SIMPLE) is designed to give small business owners a simplified method to establish and contribute to a retirement plan for employees. The employer is allowed a tax deduction for contributions and makes either matching or non-elective contributions to each eligible employee’s SIMPLE IRA. Employees may make salary deferral contributions.
Coverdell Education Savings Account
These savings accounts are designed to provide a way to save money for higher education expenses. In an Education Savings Account, earnings and interest grow tax-free, and qualified withdrawals used to pay for eligible higher-education expenses are tax- and penalty-free.
Funds Available
The following funds are available in the accounts listed above:
| | • | | Thornburg Core Growth Fund |
| | • | | Thornburg International Value Fund |
| | • | | Thornburg International Growth Fund |
| | • | | Thornburg Developing World Fund |
| | • | | Thornburg Investment Income Builder Fund |
| | • | | Thornburg Global Opportunities Fund |
| | • | | Thornburg Low Duration Income Fund |
| | • | | Thornburg Limited Term U.S. Government Fund |
| | • | | Thornburg Limited Term Income Fund |
| | • | | Thornburg Strategic Income Fund |
This page is not part of the Semi-Annual Report 25
Firm & Philosophy

The Firm
Founded in 1982 and headquartered in Santa Fe, New Mexico, Thornburg Investment Management advises a range of active investment strategies, each offered through multiple vehicles, to serve a broad spectrum of client needs worldwide. From short-term fixed income to flexible global equity, our objective is to help clients reach their long-term financial goals via active portfolio management. As of March 31, 2014, Thornburg managed approximately $90 billion in assets.
Investment Philosophy
We seek to preserve and increase the real wealth of shareholders after accounting for inflation, taxes, and investment expenses. We’re committed to disciplined investing and managing risk in all market environments.
Portfolio Holdings Commentary
At Thornburg, we believe you should know what you own. Our website keeps investors informed of the Funds’ equity holdings. Go to www.thornburg.com/funds for equity funds holdings and commentary.
Co-Ownership of Funds
We invest side-by-side with shareholders. Our employees have invested $387 million in Thornburg products as of March 31, 2014.
26 This page is not part of the Semi-Annual Report
Thornburg Fund Family
Thornburg Equity Funds
Thornburg’s equity research uses a fundamentally driven, bottom-up, comprehensive analytical approach. Thornburg equity funds generally focus on a limited number of securities so that each holding can impact performance. The team searches for firms believed to have a promising future and seeks to buy shares of those companies at a discount to their intrinsic or long-term value.
| | • | | Thornburg Core Growth Fund |
| | • | | Thornburg International Value Fund |
| | • | | Thornburg International Growth Fund |
| | • | | Thornburg Developing World Fund |
| | • | | Thornburg Investment Income Builder Fund |
| | • | | Thornburg Global Opportunities Fund |
Thornburg Bond Funds
Thornburg Investment Management applies a disciplined philosophy to fixed-income management. Since the launch of our first fixed-income fund over 25 years ago, we have been conducting fundamental, bottom-up research in an effort to identify bonds which we believe provide the best return for a given level of risk. We avoid leverage or complex strategies which could backfire in periods of market uncertainty.
| | • | | Thornburg Low Duration Income Fund |
| | • | | Thornburg Limited Term U.S. Government Fund |
| | • | | Thornburg Limited Term Income Fund |
| | • | | Thornburg Strategic Income Fund |
| | • | | Thornburg Low Duration Municipal Fund |
| | • | | Thornburg Limited Term Municipal Fund |
| | • | | Thornburg Intermediate Municipal Fund |
| | • | | Thornburg California Limited Term Municipal Fund |
| | • | | Thornburg New Mexico Intermediate Municipal Fund |
| | • | | Thornburg New York Intermediate Municipal Fund |
| | • | | Thornburg Strategic Municipal Income Fund |
Before investing, carefully consider the Fund’s investment goals, risks, charges, and expenses. For a prospectus or summary prospectus containing this and other information, contact your financial advisor or visit thornburg.com. Read it carefully before investing.
For additional information, please visit thornburg.com
Thornburg Investment Management, Inc. 2300 North Ridgetop Road, Santa Fe, NM 87506
This page is not part of the Semi-Annual Report 27
| | |
 | | Waste not, Wait not |

This Semi-Annual Report is submitted for the general information of shareholders of the Fund. It is not authorized for distribution to prospective investors in the Fund unless preceded or accompanied by an effective prospectus.
| | | | |
Investment Advisor: Thornburg Investment Management® 800.847.0200 | | Distributor: Thornburg Securities Corporation® 800.847.0200 | | TH3052 |


2 This page is not part of the Semi-Annual Report
IMPORTANT INFORMATION
The information presented on the following pages was current as of March 31, 2014. The managers’ views, portfolio holdings, and sector diversification are provided for the general information of the Funds’ shareholders; to the extent this information is historical, it should not be considered predictive of future circumstances. This material should not be deemed a recommendation to buy or sell any of the securities mentioned.
Investments in the Funds carry risks, including possible loss of principal. Bond funds have the same interest rate, inflation, and credit risks that are associated with the underlying bonds. The principal value of a bond will fluctuate relative to changes in interest rates, decreasing when interest rates rise. Unlike bonds, bond funds have ongoing fees and expenses. Funds invested in mortgage backed securities may bear additional risk. Please see each Fund’s Prospectus for a discussion of the risks associated with an investment in either Fund. Investments in the Funds are not FDIC insured, nor are they deposits of or guaranteed by a bank or any other entity. There is no guarantee that the Funds will meet their investment objectives. The laddering strategy does not assure or guarantee better performance and cannot eliminate the risk of investment losses.
Diversification does not assure or guarantee better performance and cannot eliminate the risk of investment losses.
Performance data given at net asset value (NAV) does not take into account applicable sales charges. If the sales charges had been included, the performance would have been lower.
Minimum investments for Class I shares maybe higher than those for other classes. Class I, R3, R4, and R5 shares may not be available to all investors.
| | | | |
Limited Term U.S. Government Fund | | NASDAQ Symbols | | CUSIPS |
Class A | | LTUSX | | 885-215-103 |
Class B | | LTUBX | | 885-215-848 |
Class C | | LTUCX | | 885-215-830 |
Class I | | LTUIX | | 885-215-699 |
Class R3 | | LTURX | | 885-215-491 |
Class R4 | | LTUGX | | 885-216-747 |
Class R5 | | LTGRX | | 885-216-861 |
| | |
Limited Term Income Fund | | | | |
Class A | | THIFX | | 885-215-509 |
Class C | | THICX | | 885-215-764 |
Class I | | THIIX | | 885-215-681 |
Class R3 | | THIRX | | 885-215-483 |
Class R4 | | THRIX | | 885-216-762 |
Class R5 | | THRRX | | 885-216-853 |
Glossary
Barclays Global Bond Index – A broad-based measure of the global investment-grade fixed-rate debt markets. It is comprised of the U.S. Aggregate, Pan European Aggregate, and the Asian-Pacific Aggregate indices. It also includes a wide range of standard and customized sub-indices by liquidity constraint, sector, quality, and maturity.
Barclays Intermediate Government/Credit Bond Index – An unmanaged, market-weighted index generally representative of intermediate government and investment-grade corporate debt securities having maturities from one up to ten years.
Barclays Intermediate Government Bond Index – An unmanaged, market-weighted index generally representative of all public obligations of the U.S. Government, its agencies and instrumentalities having maturities from one up to ten years.
Barclays U.S. Credit Index – An index composed of the U.S. Corporate Index and a non-corporate component that includes foreign agencies, sovereigns, supranationals, and local authorities. The U.S. Credit Index is a subset of the U.S. Government/Credit Index and the U.S. Aggregate Index.
S&P 500 Index – An unmanaged broad measure of the U.S. stock market.
Unless otherwise noted, index returns reflect the reinvestment of income dividends and capital gains, if any, but do not reflect fees, brokerage commissions or other expenses of investing. Investors may not make direct investments into any index.
Annualized Distribution Yield – The distribution yield reflects actual distributions made to shareholders. The annualized distribution yield is calculated by summing the last 30 days of income at a given month end and annualizing to a 360-day year. The result is divided by the ending maximum offering price.
Basis Point (bp) – A unit equal to 1/100th of 1%. 1% = 100 basis points (bps).
Bond Credit Ratings – A bond credit rating assesses the financial ability of a debt issuer to make timely payments of principal and interest. Ratings of AAA (the highest), AA, A, and BBB are investment-grade quality. Ratings of BB, B, CCC, CC, C, and D (the lowest) are considered below investment-grade, speculative-grade, or junk bonds. Unless otherwise noted, the ratings listed are from Bloomberg Market Data and are a combination of ratings from Standard and Poor’s, Moody’s Investors Service, and/or Fitch Ratings.
Consumer Price Index (CPI) – Index that measures prices of a fixed basket of goods bought by a typical consumer, including food, transportation, shelter, utilities, clothing, medical care, entertainment and other items. The CPI, published by the Bureau of Labor Statistics in the Department of Labor, is based at 100 in 1982 and is released monthly. It is widely used as a cost-of-living benchmark to adjust Social Security payments and other payment schedules, union contracts and tax brackets. Also known as the cost-of-living index.
Coupon – The interest rate stated on a bond when it’s issued. The coupon is typically paid semiannually.
Credit Spectrum – Refers to the range of credit quality ratings, from below investment grade to the highest quality.
Credit Spread/Quality Spread – The difference between the yields of securities with different credit qualities.
Duration – A bond’s sensitivity to interest rates. Bonds with longer durations experience greater price volatility than bonds with shorter durations.
Fed Funds Rate – The interest rate at which a depository institution lends immediately available funds (balances at the Federal Reserve) to another depository institution overnight.
Gross Domestic Product (GDP) – A country’s income minus foreign investments: the total value of all goods and services produced within a country in a year, minus net income from investments in other countries.
Lipper Short-Intermediate Investment-Grade Category – Funds that invest at least 65% of their assets in investment-grade debt issues (rated in top four grades) with dollar-weighted average maturities of one to five years.
Lipper Short-Intermediate U.S. Government Bond Category – Funds that invest at least 65% of assets in securities issued or guaranteed by the U.S. government, its agencies, or its instrumentalities, with dollar weighted average maturities of one to five years.
Mortgage-Backed Security – A type of asset-backed security that is secured by a mortgage or collection of mortgages. These securities must be grouped in one of the top two ratings as determined by a accredited credit rating agency and usually pay periodic payments that are similar to coupon payments. The mortgage must have originated from a regulated and authorized financial institution.
Quantitative Easing (QE) – The Federal Reserve’s monetary policy used to stimulate the U.S. economy following the recession that began in 2007/08.
Risk-Free Asset – An asset which has a virtually certain future return. Treasury bills are typically used to represent risk-free assets because they are backed by the U.S. government and have short maturities. Every investment carries some type of risk.
SEC Yield – SEC yield is computed in accordance with SEC standards measuring the net investment income per share over a specified 30-day period expressed as a percentage of the maximum offering price of the Fund’s shares at the end of the period.
U.S. Export-Import Bank Bond – A bond issued by the U.S. Export-Import Bank, the official export credit agency of the United States. These bonds facilitate international trade by financing the purchase of domestic exports and providing guarantees or insurance for foreign lines of credit.
U.S. Treasury Securities – U.S. Treasury securities, such as bills, notes and bonds, are negotiable debt obligations of the U.S. government. These debt obligations are backed by the “full faith and credit” of the government and issued at various schedules and maturities. Income from Treasury securities is exempt from state and local, but not federal income taxes.
Yield Curve – A line that plots the interest rates, at a set point in time, of bonds having equal credit quality, but differing maturity dates.
This page is not part of the Semi-Annual Report 3
| | |
| THORNBURG LIMITED TERM U.S. GOVERNMENT FUND | | |
| |
At Thornburg, our approach to management of the Thornburg Limited Term U.S. Government Fund is based on the premise that investors in the Fund seek preservation of capital along with an attractive, relatively stable yield. While aggressive bond strategies may generate stronger returns when the market is turning a blind eye towards risk, they often fail to stack up over longer periods of time. We apply time-tested techniques to manage risk and pursue attractive returns. These include: • Building a laddered portfolio. Laddering has been shown over time to mitigate reinvestment and interest-rate risk. • Investing on a cash-only basis without using leverage. While leveraged strategies may enhance returns when conditions are favorable, they can quickly compound losses when sentiment shifts. • Conducting careful research to invest where we see the best relative value among government and agency sectors. | |  |
Portfolio Manager

Jason Brady, CFA
Objectives and Strategies
The Fund’s primary objective is to obtain as high a level of current income as is consistent, in the view of the Fund’s investment advisor, with the preservation of capital. As a secondary goal, the Fund seeks to reduce changes in their share prices compared to longer term portfolios.
This Fund is a laddered portfolio primarily composed of short/intermediate debt obligations at least 80% of which are issued by the U.S. Government, its agencies or instrumentalities, with an average maturity of normally less than five years.
Long-Term Stability of Principal
Net Asset Value History of A shares from November 16, 1987 through March 31, 2014
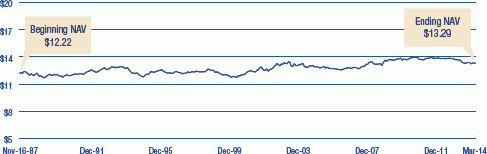
Average Annual Total returns
For Periods Ended March 31, 2014
| | | | | | | | | | | | | | | | | | | | |
| | | 1 Yr | | | 3 Yrs | | | 5 Yrs | | | 10 Yrs | | | Since
Inception | |
A Shares (Incep: 11/16/87) | | | | | | | | | | | | | | | | | | | | |
Without sales charge | | | -0.90 | % | | | 1.44 | % | | | 2.16 | % | | | 2.92 | % | | | 5.33 | % |
With sales charge | | | -2.40 | % | | | 0.93 | % | | | 1.85 | % | | | 2.76 | % | | | 5.26 | % |
Performance data shown represents past performance and is no guarantee of future results. Investment return and principal value will fluctuate so shares, when redeemed, may be worth more or less than their original cost. Current performance may be lower or higher than quoted. For performance current to the most recent month end, visit thornburg.com or call 800-847-0200.
The maximum sales charge for the Limited Term U.S. Government Fund’s Class A shares is 1.50%. The total annual fund operating expense of Class A shares is 0.89%, as disclosed in the most recent Prospectus.
Portfolio Ladder
As of March 31, 2014
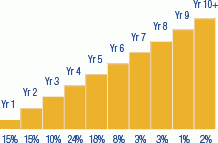
May not add up to 100% due to rounding.
30-Day Yields, A Shares
As of March 31, 2014
| | | | |
Annualized Distribution Yield | | SEC
Yield | |
2.77% | | | 1.75 | % |
Key Portfolio Attributes
As of March 31, 2014
| | | | |
Number of Bonds | | | 141 | |
| |
Effective Duration | | | 2.6Yrs | |
| |
Average Maturity | | | 3.4Yrs | |
See the entire portfolio in the Schedule of Investments beginning on page 9.
4 This page is not part of the Semi-Annual Report
| | |
THORNBURG LIMITED TERM INCOME FUND | | |
| |
The Thornburg Limited Term Income Fund takes the laddering strategy to the broader fixed-income market. Expanding beyond government and agency securities brings additional risks – as well as potentially higher returns. Our team addresses these uncertainties by employing a comprehensive approach to risk management. While utilizing the ladder to balance interest-rate and reinvestment risk, the team also: • Invests on a cash-only basis. While leveraged strategies may enhance returns when market conditions are favorable, they can quickly compound losses when sentiment shifts. • Conducts in-depth fundamental research on each credit issue under consideration. The goal of this research is identification of bonds which provide a reasonable return for their given level of risk. • Maintains a portfolio of high-quality bonds and diversifies among a large number of bonds to minimize the potential impact of default by any single issuer. | |  |
Portfolio Managers

Jason Brady, CFA, Lon Erickson, CFA
Objectives and Strategies
The Fund’s primary objective is to obtain as high a level of current income as is consistent, in the view of the Fund’s investment advisor, with the preservation of capital. As a secondary goal, the Fund seeks to reduce changes in their share prices compared to longer term portfolios.
This Fund is a laddered portfolio primarily composed of short/intermediate debt obligations which are investment grade or judged by the advisor to be of equivalent quality, with an average maturity of normally less than five years.
Long-Term Stability of Principal
Net Asset Value History of A shares from October 1, 1992 through March 31, 2014
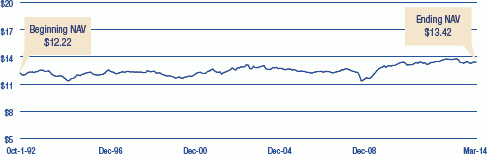
Average Annual Total returns
For Periods Ended March 31, 2014
| | | | | | | | | | | | | | | | | | | | |
| | | 1 Yr | | | 3 Yrs | | | 5 Yrs | | | 10 Yrs | | | Since
Inception | |
A Shares (Incep: 10/1/92) | | | | | | | | | | | | | | | | | | | | |
Without sales charge | | | 0.69 | % | | | 4.20 | % | | | 6.86 | % | | | 4.32 | % | | | 5.44 | % |
With sales charge | | | -0.82 | % | | | 3.68 | % | | | 6.53 | % | | | 4.17 | % | | | 5.37 | % |
Performance data shown represents past performance and is no guarantee of future results. Investment return and principal value will fluctuate so shares, when redeemed, may be worth more or less than their original cost. Current performance may be lower or higher than quoted. For performance current to the most recent month end, visit thornburg.com or call 800-847-0200.
The maximum sales charge for the Limited Term Income Fund’s Class A shares is 1.50%. The total annual operating expenses of Class A shares are 0.88% as disclosed in the most recent Prospectus.
Portfolio Ladder
As of March 31, 2014
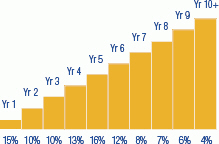
May not add up to 100% due to rounding.
30-Day Yields, A Shares
As of March 31, 2014
| | | | |
Annualized Distribution Yield | | SEC
Yield | |
2.24% | | | 1.80 | % |
Key Portfolio Attributes
As of March 31, 2014
| | | | |
Number of Bonds | | | 462 | |
| |
Effective Duration | | | 3.1Yrs | |
| |
Average Maturity | | | 4.2Yrs | |
See the entire portfolio in the Schedule of Investments beginning on page 12.
This page is not part of the Semi-Annual Report 5

Thornburg Limited Term Income Funds
March 31, 2014
This report is certified under the Sarbanes-Oxley Act of 2002, which requires that public companies, including mutual funds, affirm that the information provided in their annual and semi-annual shareholder reports fully and fairly represents their financial position and the results of their operations for the period presented.
6 Certified Semi-Annual Report
LETTER TO SHAREHOLDERS
April 15, 2014
Dear Fellow Shareholders:
We are pleased to present the semi-annual report for the Thornburg Limited Term U.S. Government Fund and the Thornburg Limited Term Income Fund for the six-month period ended March 31, 2014. The net asset value (NAV) of a Class A share of the Thornburg Limited Term U.S. Government Fund decreased 7 cents in the period to $13.29. If you were invested for the entire period, you received dividends of 12.1 cents per share. If you reinvested your dividends, you received 12.2 cents per share. The NAV of a Class A share of the Thornburg Limited Term Income Fund remained unchanged at period end at $13.42. If you were invested for the entire period, you received dividends of 15.4 cents per share. If you reinvested your dividends, you received 15.5 cents per share. Dividends per share were lower for Class B, C, R3, and R4 shares and higher for Class I and R5 shares to account for varying class-specific expenses. Please examine the accompanying exhibits for more detailed information.
The past half year has been quite eventful. The period started with the Federal government shutdown. It only lasted two weeks but was clearly a negative for the U.S. economy and general market confidence. Congress managed to pass a budget in December 2013, though it was rather uninspired. The economic data was mixed in the third quarter, with stronger-than-expected labor market performance being a notable bright spot. And while most investors (and market pundits) took this as a sign to sell bonds and buy stocks because the U.S. economy was accelerating, the weak U.S. economic data (and compounding disappointing forecasts around emerging markets/China) in January 2014, left everyone bewildered as bonds outperformed stocks and both asset classes ended the first quarter 2014 up about 1.8%. The period ended with Russia formally annexing Crimea from Ukraine. The impact on financial markets was short-lived, but it was a forceful reminder that geo-political risks, while always simmering, can boil over at any time.
And yet, like much of last year, nothing mattered to the financial markets as much as when the Fed was going to taper its “quantitative easing” (QE) purchases. In December 2013, buoyed by two months of good labor market data, the Fed announced a $10 billion per month reduction in purchases starting in January 2014, and set expectations for additional QE reductions at subsequent meetings. Equity markets staged a relief rally as the $10 billion per month cut was less than expected. The S&P 500 Index increased 2.53% in December 2013. Bonds were less receptive. U.S. Treasury rates had already started to rise before the meeting, given the strong jobs data and the U.S. budget compromise. Rates continued to rise across the curve, as the U.S. Treasury five-year and 10-year bonds rose 37 basis points and 28 basis points to end the year at 1.74% and 3.03%, respectively. Then 2014 started with weak U.S. economic data and struggling emerging markets (i.e., China slowdown). Treasuries rallied across the curve in January and remained flat through February, following Ben Bernanke’s final meeting as Fed Chairman and another expected $10 billion less per month in QE.
Financial markets remained fairly placid until new Fed Chairwoman Janet Yellen shook things up at her first meeting/press conference in March 2014 by suggesting the first target Fed Funds Rate increase could occur in early 2015, which was about six to nine months earlier than had been priced in by markets. Longer Treasury rates (10-year and 30-year) didn’t move much, but shorter rates rose (the two-year up around 7 basis points and the five-year up 17 basis points by the end of March). Equity markets largely yawned. Since the second quarter of 2014 began, financial markets have become a bit jittery, with global equities down around 2%, and U.S. Treasuries and risk-free assets higher, as they await a clear trend to emerge within global economic data.
Through this environment, the Class A shares of the Thornburg Limited Term U.S. Government Fund produced a total return of 0.39% at NAV over the six-month period. The Barclays Intermediate Government Bond Index produced a 0.21% total return over the same time period. The average return for the Lipper Short-Intermediate U.S. Government Bond Category was 1.08%. The Class A shares of the Thornburg Limited Term Income Fund produced a total return of 1.99% at NAV over the six-month period. The Barclays Intermediate Government/Credit Bond Index produced a 0.98% total return over the same time period. The average return for the Lipper Short-Intermediate Investment-Grade Category was 1.79%. Both Barclays indices reflect no deduction for fees, expenses, or taxes.
Investors continue their search for yield, buying up high-yield bonds and bank loans. And as the global economy got a bit iffy in the first quarter of 2014, high-grade bond funds began to see inflows again. Shorter-duration securities/funds appeared to be favored, but credit products of all kinds had strong demand. Over the six-month period, investment grade credit spreads, per the Barclays U.S. Credit Index, declined from 135 basis points to 103 basis points. Spreads also compressed along the credit spectrum (i.e.,
Certified Semi-Annual Report 7
LETTER TO SHAREHOLDERS,
CONTINUED
Baa to Aaa). We continue to prefer credit risk to duration risk, despite this spread tightening. Both Funds’ durations continue to be on the shorter end of the range. However, with this spread tightening, we view it as prudent to reduce overall credit risk by buying stronger fundamental securities, even if that means giving up a bit of yield. Sometimes this means trading out of a Baa-rated corporate bond into a higher-rated U.S. mortgage backed security, a U.S. Export-Import Bank bond, or a higher-rated corporate bond. Sometimes, it means swapping one Baa-rated security for another Baa-rated security that we believe has less credit risk. We have always done our own credit analysis and plan to continue doing so, believing it adds value over time (and occasionally we disagree with a rating agency’s assessment).
Given the low level of interest rates and credit spreads, high-quality bond funds might have limited potential for marked appreciation over the long term; however, we believe they can represent a good investment through various financial/economic cycles. No matter the direction of interest rates or credit spreads in the near term, we believe your Funds are well positioned to achieve their longer-term goals of principal stability and reasonably attractive income streams. We believe that the Thornburg Limited Term U.S. Government Fund and the Thornburg Limited Term Income Fund remain appropriate vehicles for those looking for core bond investments.
Thank you very much for investing in our Funds.
Sincerely,
| | |
 | |  |
Jason H. Brady, cfa Portfolio Manager Managing Director | | Lon R. Erickson, cfa Portfolio Manager Managing Director |
The matters discussed in this report may constitute forward-looking statements made pursuant to the safe harbor provisions of the Securities Litigation Reform Act of 1995. These include any advisor or portfolio manager prediction, assessment, analysis or outlook for individual securities, industries, investment styles, market sectors and/or markets. These statements involve risks and uncertainties. In addition to the general risks described for each fund in its current prospectus, other factors bearing on these reports include the accuracy of the advisor’s or portfolio manager’s forecasts and predictions, the appropriateness of the investment strategies designed by the advisor or portfolio manager and the ability of the advisor or portfolio manager to implement their strategies efficiently and successfully. Any one or more of these factors, as well as other risks affecting the securities markets generally, could cause the actual results of any fund to differ materially as compared to its benchmarks.
8 Certified Semi-Annual Report
| | |
| SCHEDULE OF INVESTMENTS | | |
| |
Thornburg Limited Term U.S. Government Fund | | March 31, 2014 (Unaudited) |
SUMMARY OF TYPES OF HOLDINGS
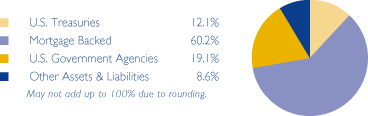
| | | | | | | | | | |
Issuer-Description | | | | Principal
Amount | | | Value | |
U.S. TREASURY SECURITIES — 12.13% | | | | | | | | | | |
United States Treasury Notes, 2.625%, 12/31/2014 | | | | $ | 2,000,000 | | | $ | 2,037,734 | |
United States Treasury Notes, 1.375%, 11/30/2015 | | | | | 2,500,000 | | | | 2,544,360 | |
United States Treasury Notes, 2.625%, 2/29/2016 | | | | | 2,000,000 | | | | 2,085,000 | |
United States Treasury Notes, 4.875%, 8/15/2016 | | | | | 5,000,000 | | | | 5,503,125 | |
United States Treasury Notes, 4.625%, 2/15/2017 | | | | | 4,000,000 | | | | 4,428,516 | |
United States Treasury Notes, 2.25%, 11/30/2017 | | | | | 3,500,000 | | | | 3,626,430 | |
United States Treasury Notes, 3.625%, 2/15/2020 | | | | | 1,000,000 | | | | 1,091,231 | |
United States Treasury Notes Inflationary Index, 2.00%, 7/15/2014 | | | | | 2,481,620 | | | | 2,521,915 | |
United States Treasury Notes Inflationary Index, 1.875%, 7/15/2015 | | | | | 4,809,800 | | | | 5,042,587 | |
United States Treasury Notes Inflationary Index, 2.00%, 1/15/2016 | | | | | 5,892,050 | | | | 6,253,124 | |
| | | | | | | | | | |
TOTAL U.S. TREASURY SECURITIES (Cost $33,332,946) | | | | | | | | | 35,134,022 | |
| | | | | | | | | | |
| | | |
U.S. GOVERNMENT AGENCIES — 19.05% | | | | | | | | | | |
Federal Agricultural Mtg Corp., 6.71%, 7/28/2014 | | | | | 200,000 | | | | 204,079 | |
Federal Farm Credit Bank, 3.98%, 1/22/2015 | | | | | 1,000,000 | | | | 1,030,309 | |
Federal Home Loan Bank, 5.375%, 6/13/2014 | | | | | 2,000,000 | | | | 2,020,240 | |
Federal Home Loan Bank, 5.00%, 12/8/2017 | | | | | 3,000,000 | | | | 3,403,393 | |
Federal Home Loan Bank, 1.50%, 10/25/2022 | | | | | 3,700,000 | | | | 3,554,076 | |
Federal National Mtg Assoc., 4.40%, 2/19/2015 | | | | | 1,585,000 | | | | 1,643,056 | |
a Government of Tunisia, (Guaranty: U.S. Agency for International Development), 1.686%, 7/16/2019 | | | | | 5,000,000 | | | | 4,876,220 | |
Mtg-Linked Amortizing Notes, Series 2012-1 Class A10, 2.06%, 1/15/2022 | | | | | 1,131,016 | | | | 1,137,934 | |
New Valley Generation I, Tennessee Valley Authority, 7.299%, 3/15/2019 | | | | | 2,078,774 | | | | 2,376,838 | |
a Petroleos Mexicanos, (Guaranty: Export-Import Bank of the United States), 1.70%, 12/20/2022 | | | | | 2,790,000 | | | | 2,723,930 | |
Private Export Funding Corp., (Guaranty: Export-Import Bank of the United States), 5.45%, 9/15/2017 | | | | | 3,000,000 | | | | 3,408,723 | |
Small Business Administration Participation Certificates, Series 2001-20D Class 1, 6.35%, 4/1/2021 | | | | | 2,233,539 | | | | 2,438,411 | |
Small Business Administration Participation Certificates, Series 2001-20F Class 1, 6.44%, 6/1/2021 | | | | | 1,318,418 | | | | 1,450,352 | |
Small Business Administration Participation Certificates, Series 2002-20A Class 1, 6.14%, 1/1/2022 | | | | | 729,701 | | | | 794,922 | |
Small Business Administration Participation Certificates, Series 2002-20K Class 1, 5.08%, 11/1/2022 | | | | | 811,668 | | | | 878,655 | |
Small Business Administration Participation Certificates, Series 2005-20H Class 1, 5.11%, 8/1/2025 | | | | | 646,313 | | | | 699,935 | |
Small Business Administration Participation Certificates, Series 2007-20D Class 1, 5.32%, 4/1/2027 | | | | | 1,306,944 | | | | 1,439,715 | |
Small Business Administration Participation Certificates, Series 2007-20F Class 1, 5.71%, 6/1/2027 | | | | | 747,961 | | | | 830,626 | |
Small Business Administration Participation Certificates, Series 2007-20I Class 1, 5.56%, 9/1/2027 | | | | | 2,420,893 | | | | 2,662,291 | |
Small Business Administration Participation Certificates, Series 2007-20K Class 1, 5.51%, 11/1/2027 | | | | | 1,472,848 | | | | 1,617,716 | |
Small Business Administration Participation Certificates, Series 2008-20G Class 1, 5.87%, 7/1/2028 | | | | | 3,605,178 | | | | 4,053,333 | |
Small Business Administration Participation Certificates, Series 2011-20G Class 1, 3.74%, 7/1/2031 | | | | | 3,342,616 | | | | 3,485,638 | |
Small Business Administration Participation Certificates, Series 2011-20K Class 1, 2.87%, 11/1/2031 | | | | | 3,535,272 | | | | 3,503,069 | |
b,c U.S. Department of Transportation, 5.594%, 12/7/2021 | | | | | 2,246,973 | | | | 2,437,965 | |
Union 13 Leasing LLC, (Guaranty: Export-Import Bank of the United States), 1.87%, 6/28/2024 | | | | | 2,602,857 | | | | 2,509,618 | |
| | | | | | | | | | |
TOTAL U.S. GOVERNMENT AGENCIES (Cost $54,396,759) | | | | | | | | | 55,181,044 | |
| | | | | | | | | | |
| | | |
MORTGAGE BACKED — 60.19% | | | | | | | | | | |
Federal Home Loan Mtg Corp., 4.875%, 6/13/2018 | | | | | 3,000,000 | | | | 3,413,100 | |
Federal Home Loan Mtg Corp., CMO Series 1321 Class TE, 7.00%, 8/15/2022 | | | | | 245,591 | | | | 269,378 | |
Federal Home Loan Mtg Corp., CMO Series 2420 Class MC, 6.00%, 2/15/2017 | | | | | 175,914 | | | | 184,265 | |
Federal Home Loan Mtg Corp., CMO Series 2527 Class BP, 5.00%, 11/15/2017 | | | | | 415,808 | | | | 438,805 | |
Federal Home Loan Mtg Corp., CMO Series 2529 Class MB, 5.00%, 11/15/2017 | | | | | 461,117 | | | | 486,735 | |
Federal Home Loan Mtg Corp., CMO Series 2553 Class GB, 5.00%, 1/15/2018 | | | | | 345,111 | | | | 364,608 | |
Federal Home Loan Mtg Corp., CMO Series 2558 Class BD, 5.00%, 1/15/2018 | | | | | 1,561,242 | | | | 1,649,631 | |
Certified Semi-Annual Report 9
| | |
| SCHEDULE OF INVESTMENTS, CONTINUED | | |
| |
Thornburg Limited Term U.S. Government Fund | | March 31, 2014 (Unaudited) |
| | | | | | | | | | |
Issuer-Description | | | | Principal
Amount | | | Value | |
Federal Home Loan Mtg Corp., CMO Series 2622 Class PE, 4.50%, 5/15/2018 | | | | $ | 765,605 | | | $ | 808,036 | |
Federal Home Loan Mtg Corp., CMO Series 2628 Class DQ, 3.00%, 11/15/2017 | | | | | 1,640 | | | | 1,640 | |
Federal Home Loan Mtg Corp., CMO Series 2641 Class WE, 4.50%, 1/15/2033 | | | | | 158,557 | | | | 167,518 | |
Federal Home Loan Mtg Corp., CMO Series 2642 Class JE, 5.00%, 9/15/2032 | | | | | 1,095,859 | | | | 1,143,373 | |
Federal Home Loan Mtg Corp., CMO Series 2649 Class QH, 4.50%, 7/15/2018 | | | | | 424,383 | | | | 448,351 | |
Federal Home Loan Mtg Corp., CMO Series 2692 Class QD, 5.00%, 12/15/2022 | | | | | 502,901 | | | | 512,835 | |
Federal Home Loan Mtg Corp., CMO Series 2808 Class VA, 5.50%, 5/15/2015 | | | | | 1,596,116 | | | | 1,632,707 | |
Federal Home Loan Mtg Corp., CMO Series 2814 Class GB, 5.00%, 6/15/2019 | | | | | 117,463 | | | | 120,074 | |
Federal Home Loan Mtg Corp., CMO Series 2827 Class BU, 3.50%, 7/15/2019 | | | | | 1,322,401 | | | | 1,381,525 | |
Federal Home Loan Mtg Corp., CMO Series 3291 Class BY, 4.50%, 3/15/2022 | | | | | 2,124,307 | | | | 2,274,193 | |
Federal Home Loan Mtg Corp., CMO Series 3480 Class VA, 6.00%, 6/15/2019 | | | | | 1,692,543 | | | | 1,733,464 | |
Federal Home Loan Mtg Corp., CMO Series 3589 Class CA, 4.00%, 10/15/2021 | | | | | 477,313 | | | | 500,817 | |
Federal Home Loan Mtg Corp., CMO Series 3640 Class EL, 4.00%, 3/15/2020 | | | | | 1,377,205 | | | | 1,449,814 | |
Federal Home Loan Mtg Corp., CMO Series 3678 Class AL, 4.50%, 10/15/2027 | | | | | 232,623 | | | | 237,550 | |
Federal Home Loan Mtg Corp., CMO Series 3704 Class DC, 4.00%, 11/15/2036 | | | | | 782,049 | | | | 838,932 | |
Federal Home Loan Mtg Corp., CMO Series 3867 Class VA, 4.50%, 3/15/2024 | | | | | 2,366,202 | | | | 2,552,686 | |
Federal Home Loan Mtg Corp., CMO Series 3922 Class PQ, 2.00%, 4/15/2041 | | | | | 2,200,845 | | | | 2,218,843 | |
Federal Home Loan Mtg Corp., CMO Series 4050 Class MV, 3.50%, 8/15/2023 | | | | | 3,019,854 | | | | 3,132,188 | |
Federal Home Loan Mtg Corp., CMO Series 4097 Class TE, 1.75%, 5/15/2039 | | | | | 3,607,936 | | | | 3,367,707 | |
Federal Home Loan Mtg Corp., CMO Series 4120 Class TC, 1.50%, 10/15/2027 | | | | | 4,232,640 | | | | 4,044,966 | |
Federal Home Loan Mtg Corp., CMO Series 4120 Class UE, 2.00%, 10/15/2027 | | | | | 4,139,952 | | | | 4,041,664 | |
Federal Home Loan Mtg Corp., CMO Series K035 Class A1, 2.615%, 3/25/2023 | | | | | 3,803,804 | | | | 3,845,305 | |
Federal Home Loan Mtg Corp., CMO Series K037 Class A1, 2.592%, 4/25/2023 | | | | | 2,000,000 | | | | 2,025,771 | |
Federal Home Loan Mtg Corp., CMO Series K709 Class A2, 2.086%, 3/25/2019 | | | | | 3,000,000 | | | | 3,005,192 | |
Federal Home Loan Mtg Corp., Pool AK6768, 3.00%, 3/1/2027 | | | | | 3,273,654 | | | | 3,370,713 | |
Federal Home Loan Mtg Corp., Pool B14155, 3.50%, 5/1/2019 | | | | | 264,006 | | | | 276,164 | |
Federal Home Loan Mtg Corp., Pool D37120, 7.00%, 7/1/2023 | | | | | 7,682 | | | | 8,615 | |
Federal Home Loan Mtg Corp., Pool D98887, 3.50%, 1/1/2032 | | | | | 2,323,151 | | | | 2,401,285 | |
Federal Home Loan Mtg Corp., Pool E96575, 4.50%, 6/1/2018 | | | | | 798,642 | | | | 845,094 | |
Federal Home Loan Mtg Corp., Pool G12079, 4.50%, 4/1/2019 | | | | | 787,410 | | | | 833,209 | |
Federal Home Loan Mtg Corp., Pool G12140, 4.00%, 2/1/2020 | | | | | 207,396 | | | | 218,884 | |
Federal Home Loan Mtg Corp., Pool G13804, 5.00%, 3/1/2025 | | | | | 1,051,697 | | | | 1,132,595 | |
Federal Home Loan Mtg Corp., Pool J11371, 4.50%, 12/1/2024 | | | | | 1,075,645 | | | | 1,147,621 | |
Federal Home Loan Mtg Corp., Pool J13583, 3.50%, 11/1/2025 | | | | | 1,656,571 | | | | 1,737,005 | |
Federal Home Loan Mtg Corp., Pool J14888, 3.50%, 4/1/2026 | | | | | 1,616,561 | | | | 1,694,042 | |
Federal Home Loan Mtg Corp., REMIC Series 4072 Class VA, 3.50%, 10/15/2023 | | | | | 2,626,056 | | | | 2,723,984 | |
Federal National Mtg Assoc., CMO Series 1993-32 Class H, 6.00%, 3/25/2023 | | | | | 30,935 | | | | 33,950 | |
Federal National Mtg Assoc., CMO Series 2002-18 Class PC, 5.50%, 4/25/2017 | | | | | 59 | | | | 60 | |
Federal National Mtg Assoc., CMO Series 2003-15 Class CY, 5.00%, 3/25/2018 | | | | | 273,779 | | | | 288,586 | |
Federal National Mtg Assoc., CMO Series 2003-4 Class PE, 5.00%, 2/25/2018 | | | | | 714,788 | | | | 759,251 | |
Federal National Mtg Assoc., CMO Series 2003-49 Class YD, 5.50%, 6/25/2023 | | | | | 356,667 | | | | 369,430 | |
Federal National Mtg Assoc., CMO Series 2003-9 Class DB, 5.00%, 2/25/2018 | | | | | 318,005 | | | | 337,224 | |
Federal National Mtg Assoc., CMO Series 2003-W3 Class 1A2, 7.00%, 8/25/2042 | | | | | 2,404,270 | | | | 2,681,515 | |
Federal National Mtg Assoc., CMO Series 2004-33 Class MW, 4.50%, 1/25/2030 | | | | | 619,630 | | | | 635,208 | |
Federal National Mtg Assoc., CMO Series 2005-26 Class G, 5.00%, 6/25/2032 | | | | | 206,599 | | | | 210,478 | |
Federal National Mtg Assoc., CMO Series 2005-99 Class VA, 5.50%, 11/25/2016 | | | | | 676,351 | | | | 696,403 | |
Federal National Mtg Assoc., CMO Series 2009-17 Class AH, 1.68%, 3/25/2039 | | | | | 599,069 | | | | 603,286 | |
Federal National Mtg Assoc., CMO Series 2009-49 Class KA, 5.00%, 2/25/2024 | | | | | 221,504 | | | | 231,932 | |
Federal National Mtg Assoc., CMO Series 2009-52 Class AJ, 4.00%, 7/25/2024 | | | | | 599,396 | | | | 632,576 | |
Federal National Mtg Assoc., CMO Series 2009-70 Class NK, 4.50%, 8/25/2019 | | | | | 365,086 | | | | 384,600 | |
Federal National Mtg Assoc., CMO Series 2009-78 Class A, 4.50%, 8/25/2019 | | | | | 511,235 | | | | 540,253 | |
Federal National Mtg Assoc., CMO Series 2010-46 Class VM, 5.00%, 5/25/2021 | | | | | 2,073,744 | | | | 2,124,115 | |
Federal National Mtg Assoc., CMO Series 2010-6 Class VA, 5.00%, 2/25/2021 | | | | | 2,343,968 | | | | 2,457,655 | |
Federal National Mtg Assoc., CMO Series 2010-69 Class EJ, 2.50%, 7/25/2024 | | | | | 291,840 | | | | 297,029 | |
Federal National Mtg Assoc., CMO Series 2011-103 Class VA, 4.00%, 12/25/2022 | | | | | 2,436,213 | | | | 2,567,921 | |
Federal National Mtg Assoc., CMO Series 2011-110 Class JV, 4.00%, 1/25/2023 | | | | | 2,718,809 | | | | 2,865,577 | |
Federal National Mtg Assoc., CMO Series 2011-118 Class V, 4.00%, 10/25/2029 | | | | | 2,882,704 | | | | 3,000,974 | |
Federal National Mtg Assoc., CMO Series 2011-124 Class QA, 2.00%, 12/25/2041 | | | | | 3,666,629 | | | | 3,438,625 | |
Federal National Mtg Assoc., CMO Series 2011-45 Class VA, 4.00%, 3/25/2024 | | | | | 3,261,543 | | | | 3,486,034 | |
Federal National Mtg Assoc., CMO Series 2011-63 Class MV, 3.50%, 7/25/2024 | | | | | 3,295,064 | | | | 3,454,866 | |
Federal National Mtg Assoc., CMO Series 2011-70 Class CA, 3.00%, 8/25/2026 | | | | | 5,995,345 | | | | 6,001,600 | |
Federal National Mtg Assoc., CMO Series 2011-72 Class KV, 3.50%, 11/25/2022 | | | | | 1,904,780 | | | | 2,002,300 | |
Federal National Mtg Assoc., CMO Series 2012-36 Class CV, 4.00%, 6/25/2023 | | | | | 3,404,206 | | | | 3,553,592 | |
Federal National Mtg Assoc., CMO Series 2012-50 Class LV, 3.50%, 8/25/2023 | | | | | 4,678,426 | | | | 4,775,739 | |
Federal National Mtg Assoc., Pool 044003, 8.00%, 6/1/2017 | | | | | 4,299 | | | | 4,643 | |
Federal National Mtg Assoc., Pool 076388, 9.25%, 9/1/2018 | | | | | 11,746 | | | | 12,795 | |
10 Certified Semi-Annual Report
| | |
| SCHEDULE OF INVESTMENTS, CONTINUED | | |
| |
Thornburg Limited Term U.S. Government Fund | | March 31, 2014 (Unaudited) |
| | | | | | | | | | |
Issuer-Description | | | | Principal
Amount | | | Value | |
Federal National Mtg Assoc., Pool 252648, 6.50%, 5/1/2022 | | | | $ | 37,589 | | | $ | 41,475 | |
Federal National Mtg Assoc., Pool 342947, 7.25%, 4/1/2024 | | | | | 82,721 | | | | 94,501 | |
Federal National Mtg Assoc., Pool 443909, 6.50%, 9/1/2018 | | | | | 24,487 | | | | 26,310 | |
Federal National Mtg Assoc., Pool 555207, 7.00%, 11/1/2017 | | | | | 13,314 | | | | 14,803 | |
Federal National Mtg Assoc., Pool 726308, 4.00%, 7/1/2018 | | | | | 482,391 | | | | 510,129 | |
Federal National Mtg Assoc., Pool 889906, 4.00%, 7/1/2023 | | | | | 408,196 | | | | 433,453 | |
Federal National Mtg Assoc., Pool 895572, 2.567%, 6/1/2036 | | | | | 479,436 | | | | 510,299 | |
Federal National Mtg Assoc., Pool 930986, 4.50%, 4/1/2019 | | | | | 762,934 | | | | 808,919 | |
Federal National Mtg Assoc., Pool AA2870, 4.00%, 3/1/2024 | | | | | 1,056,790 | | | | 1,122,839 | |
Federal National Mtg Assoc., Pool AB7997, 2.50%, 2/1/2023 | | | | | 1,993,156 | | | | 2,039,792 | |
Federal National Mtg Assoc., Pool AD8191, 4.00%, 9/1/2025 | | | | | 1,507,974 | | | | 1,604,107 | |
Federal National Mtg Assoc., Pool AJ1752, 3.50%, 9/1/2026 | | | | | 3,534,373 | | | | 3,712,196 | |
Federal National Mtg Assoc., Pool AK6518, 3.00%, 3/1/2027 | | | | | 3,368,750 | | | | 3,465,996 | |
Federal National Mtg Assoc., Pool MA0045, 4.00%, 4/1/2019 | | | | | 551,882 | | | | 583,615 | |
Federal National Mtg Assoc., Pool MA0071, 4.50%, 5/1/2019 | | | | | 402,880 | | | | 427,163 | |
Federal National Mtg Assoc., Pool MA0125, 4.50%, 7/1/2019 | | | | | 320,893 | | | | 340,234 | |
Federal National Mtg Assoc., Pool MA0380, 4.00%, 4/1/2020 | | | | | 775,279 | | | | 820,827 | |
Federal National Mtg Assoc., Pool MA1582, 3.50%, 9/1/2043 | | | | | 5,832,280 | | | | 5,807,903 | |
Federal National Mtg Assoc., Pool MA1585, 2.00%, 9/1/2023 | | | | | 3,719,502 | | | | 3,738,971 | |
Federal National Mtg Assoc., Pool MA1625, 3.00%, 10/1/2023 | | | | | 4,677,287 | | | | 4,864,195 | |
Government National Mtg Assoc., CMO Series 2004-45 Class C, 5.615%, 10/16/2033 | | | | | 521,197 | | | | 532,774 | |
Government National Mtg Assoc., CMO Series 2005-67 Class C, 4.907%, 3/16/2035 | | | | | 820,067 | | | | 858,302 | |
Government National Mtg Assoc., CMO Series 2009-92 Class VA, 5.00%, 10/20/2020 | | | | | 1,040,718 | | | | 1,103,522 | |
Government National Mtg Assoc., CMO Series 2010-160 Class VY, 4.50%, 1/20/2022 | | | | | 755,116 | | | | 820,354 | |
Government National Mtg Assoc., Pool 000623, 8.00%, 9/20/2016 | | | | | 3,841 | | | | 4,051 | |
Government National Mtg Assoc., Pool 003550, 5.00%, 5/20/2019 | | | | | 341,420 | | | | 363,253 | |
Government National Mtg Assoc., Pool 714631, 5.691%, 10/20/2059 | | | | | 1,735,344 | | | | 1,859,826 | |
Government National Mtg Assoc., Pool 721652, 5.044%, 5/20/2061 | | | | | 4,234,580 | | | | 4,663,895 | |
Government National Mtg Assoc., Pool 751388, 5.307%, 1/20/2061 | | | | | 3,010,802 | | | | 3,345,251 | |
Government National Mtg Assoc., Pool 751392, 5.00%, 2/20/2061 | | | | | 4,875,221 | | | | 5,468,307 | |
Government National Mtg Assoc., Pool 757313, 4.307%, 12/20/2060 | | | | | 5,986,687 | | | | 6,392,686 | |
Government National Mtg Assoc., Pool 894205, 4.00%, 8/20/2039 | | | | | 1,253,055 | | | | 1,325,951 | |
Government National Mtg Assoc., Pool MA0100, 2.50%, 5/20/2042 | | | | | 3,375,018 | | | | 3,461,386 | |
| | | | | | | | | | |
TOTAL MORTGAGE BACKED (Cost $174,705,407) | | | | | | | | | 174,296,386 | |
| | | | | | | | | | |
| | | |
SHORT TERM INVESTMENTS — 4.83% | | | | | | | | | | |
Bank of New York Tri-Party Repurchase Agreement 0.16% dated 3/31/2014 due 4/1/2014, repurchase price $14,000,062 collateralized by 30 U.S. Government debt securities, having an average coupon of 4.17%, a minimum credit rating of BBB-, maturity dates from 10/15/2018 to 8/15/2043, and having an aggregate market value of $14,246,680 at 3/31/2014 | | | | | 14,000,000 | | | | 14,000,000 | |
| | | | | | | | | | |
TOTAL SHORT TERM INVESTMENTS (Cost $14,000,000) | | | | | | | | | 14,000,000 | |
| | | | | | | | | | |
TOTAL INVESTMENTS — 96.20% (Cost $276,435,112) | | | | | | | | $ | 278,611,452 | |
OTHER ASSETS LESS LIABILITIES — 3.80% | | | | | | | | | 10,992,476 | |
| | | | | | | | | | |
NET ASSETS — 100.00% | | | | | | | | $ | 289,603,928 | |
| | | | | | | | | | |
Footnote Legend
| a | Yankee Bond - Denominated in U.S. dollars and is issued in the U.S. by foreign banks and corporations. |
| b | Security currently fair valued by the Valuation and Pricing Committee using procedures approved by the Trustees. |
| c | Securities exempt from registration under Rule 144A of the Securities Act of 1933, as amended. These securities may only be resold in the ordinary course of business in transactions exempt from registration, normally to qualified institutional buyers. As of March 31, 2014, the aggregate value of these securities in the Fund’s portfolio was $2,437,965, representing 0.84% of the Fund’s net assets. |
Portfolio Abbreviations
To simplify the listings of securities, abbreviations are used per the table below:
| | |
| CMO | | Collateralized Mortgage Obligation |
| Mtg | | Mortgage |
| REMIC | | Real Estate Mortgage Investment Conduit |
| VA | | Veterans Affairs |
See notes to financial statements.
Certified Semi-Annual Report 11
| | |
| SCHEDULE OF INVESTMENTS | | |
| |
Thornburg Limited Term Income Fund | | March 31, 2014 (Unaudited) |
SUMMARY OF SECURITY CREDIT RATING†
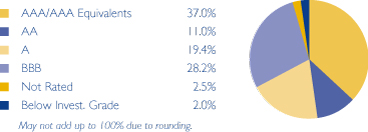
We have used ratings from Moody’s Investors Service. Where Moody’s ratings are not available, we have used Standard & Poor’s ratings. Where neither rating is available, we have used ratings from Fitch Ratings. “NR” = not rated.
| | | | | | | | | | |
Issuer-Description | | Credit Rating†
S&P/ Moody’s | | Principal
Amount | | | Value | |
U.S. TREASURY SECURITIES — 1.23% | | | | | | | | | | |
United States Treasury Notes, 2.50% due 3/31/2015 | | NR/Aaa | | $ | 6,500,000 | | | $ | 6,652,248 | |
United States Treasury Notes, 5.125% due 5/15/2016 | | NR/Aaa | | | 1,000,000 | | | | 1,097,813 | |
United States Treasury Notes, 4.875% due 8/15/2016 | | NR/Aaa | | | 2,000,000 | | | | 2,201,250 | |
United States Treasury Notes, 3.00% due 2/28/2017 | | NR/Aaa | | | 2,000,000 | | | | 2,122,344 | |
United States Treasury Notes, 1.625% due 3/31/2019 | | NR/NR | | | 15,000,000 | | | | 14,923,828 | |
United States Treasury Notes, 1.375% due 5/31/2020 | | NR/Aaa | | | 5,000,000 | | | | 4,789,160 | |
United States Treasury Notes, 2.125% due 8/15/2021 | | NR/Aaa | | | 5,000,000 | | | | 4,913,818 | |
| | | | | | | | | | |
TOTAL U.S. TREASURY SECURITIES (Cost $36,168,864) | | | | | | | | | 36,700,461 | |
| | | | | | | | | | |
| | | |
U.S. GOVERNMENT AGENCIES — 9.53% | | | | | | | | | | |
a Agribank FCB, 9.125% due 7/15/2019 | | A-/NR | | | 14,185,000 | | | | 18,134,898 | |
Alex Alpha LLC, (Guaranty: Export-Import Bank of the United States), 1.617% due 8/15/2024 | | NR/NR | | | 4,565,217 | | | | 4,360,659 | |
a CoBank ACB Floating Rate Note (Farm Credit Banks),
0.833% due 6/15/2022 | | A-/NR | | | 20,000,000 | | | | 18,050,000 | |
b Durrah MSN 35603, (Guaranty: Export-Import Bank of the United States), 1.684% due 1/22/2025 | | NR/NR | | | 13,850,344 | | | | 13,174,129 | |
Export Leasing (2009) LLC, (Guaranty: Export-Import Bank of the
United States), 1.859% due 8/28/2021 | | NR/NR | | | 6,689,585 | | | | 6,655,702 | |
Federal Home Loan Bank, 1.50% due 10/25/2022 | | AA+/Aaa | | | 16,000,000 | | | | 15,368,979 | |
b Gate Capital Cayman One Ltd., (Guaranty: Export-Import Bank of the United States), 1.839% due 3/27/2021 | | NR/NR | | | 11,252,834 | | | | 11,223,880 | |
b Government of Tunisia, (Guaranty: U.S. Agency for International Development), 1.686% due 7/16/2019 | | NR/NR | | | 10,000,000 | | | | 9,752,440 | |
Helios Leasing I LLC, (Guaranty: Export-Import Bank of the United States), 1.562% due 9/28/2024 | | NR/NR | | | 5,313,212 | | | | 5,028,679 | |
b Micron Semiconductor Ltd., (Guaranty: Export-Import Bank of the
United States), 1.258% due 1/15/2019 | | NR/NR | | | 4,400,000 | | | | 4,373,332 | |
b MSN 41079 and 41084 Ltd., (Guaranty: Export-Import Bank of the
United States), 1.717% due 7/13/2024 | | NR/NR | | | 10,641,267 | | | | 10,191,588 | |
Mtg-Linked Amortizing Notes, Series 2012-1 Class A10,
2.06% due 1/15/2022 | | AA+/NR | | | 1,555,147 | | | | 1,564,660 | |
b Petroleos Mexicanos, (Guaranty: Export-Import Bank of the
United States), 1.70% due 12/20/2022 | | NR/NR | | | 5,400,000 | | | | 5,272,123 | |
Private Export Funding Corp., (Guaranty: Export-Import Bank of the
United States, 3.55% due 1/15/2024 | | AA+/Aaa | | | 10,000,000 | | | | 10,257,250 | |
Private Export Funding Corp., (Guaranty: Export-Import Bank of the
United States), 5.45% due 9/15/2017 | | AA+/Aaa | | | 3,000,000 | | | | 3,408,723 | |
Santa Rosa Leasing LLC, (Guaranty: Export-Import Bank of the
United States), 1.693% due 8/15/2024 | | NR/NR | | | 5,307,967 | | | | 5,081,238 | |
Santa Rosa Leasing LLC, (Guaranty: Export-Import Bank of the
United States), 1.472% due 11/3/2024 | | NR/NR | | | 14,474,694 | | | | 13,640,474 | |
Small Business Administration Participation Certificates, Series 2001-20J Class 1, 5.76% due 10/1/2021 | | NR/NR | | | 665,722 | | | | 721,306 | |
Small Business Administration Participation Certificates, Series 2008-20D Class 1, 5.37% due 4/1/2028 | | NR/NR | | | 2,150,556 | | | | 2,373,627 | |
Small Business Administration Participation Certificates, Series 2009-20E Class 1, 4.43% due 5/1/2029 | | NR/NR | | | 1,629,346 | | | | 1,748,372 | |
Small Business Administration Participation Certificates, Series 2009-20K Class 1, 4.09% due 11/1/2029 | | NR/NR | | | 9,485,924 | | | | 10,058,651 | |
Small Business Administration Participation Certificates, Series 2011-20E Class 1, 3.79% due 5/1/2031 | | NR/NR | | | 12,770,620 | | | | 13,373,576 | |
Small Business Administration Participation Certificates, Series 2011-20G Class 1, 3.74% due 7/1/2031 | | NR/NR | | | 13,370,464 | | | | 13,942,551 | |
Small Business Administration Participation Certificates, Series 2011-20I Class 1, 2.85% due 9/1/2031 | | NR/NR | | | 17,537,886 | | | | 17,199,468 | |
Small Business Administration Participation Certificates, Series 2011-20K Class 1, 2.87% due 11/1/2031 | | NR/NR | | | 13,761,047 | | | | 13,635,696 | |
Small Business Administration Participation Certificates, Series 2012-20D Class 1, 2.67% due 4/1/2032 | | NR/NR | | | 13,757,507 | | | | 13,453,212 | |
Small Business Administration Participation Certificates, Series 2012-20J Class 1, 2.18% due 10/1/2032 | | NR/NR | | | 10,543,110 | | | | 9,956,336 | |
Small Business Administration Participation Certificates, Series 2012-20K Class 1, 2.09% due 11/1/2032 | | NR/NR | | | 6,323,105 | | | | 5,930,547 | |
Small Business Administration, Series 2005-P10A Class 1,
4.638% due 2/10/2015 | | NR/NR | | | 552,031 | | | | 565,479 | |
Southaven Combined Cycle Generation LLC (Tennessee Valley Authority), 3.846% due 8/15/2033 | | AA-/Aaa | | | 6,155,587 | | | | 6,225,428 | |
a,c U.S. Department of Transportation, 5.594% due 12/7/2021 | | NR/NR | | | 2,059,725 | | | | 2,234,802 | |
a,c U.S. Department of Transportation, 6.001% due 12/7/2021 | | NR/NR | | | 3,000,000 | | | | 3,285,000 | |
Union 13 Leasing LLC, (Guaranty: Export-Import Bank of the
United States), 1.682% due 12/19/2024 | | NR/NR | | | 13,557,108 | | | | 13,047,358 | |
| | | | | | | | | | |
TOTAL U.S. GOVERNMENT AGENCIES (Cost $290,616,292) | | | | | | | | | 283,290,163 | |
| | | | | | | | | | |
12 Certified Semi-Annual Report
| | |
| SCHEDULE OF INVESTMENTS, CONTINUED | | |
| |
Thornburg Limited Term Income Fund | | March 31, 2014 (Unaudited) |
| | | | | | | | | | |
Issuer-Description | | Credit Rating†
S&P/ Moody’s | | Principal
Amount | | | Value | |
OTHER GOVERNMENT — 3.21% | | | | | | | | | | |
a,b Brazilian Development Bank (BNDES), 3.375% due 9/26/2016 | | BBB-/Baa2 | | $ | 6,000,000 | | | $ | 6,112,500 | |
a,b Carpintero Finance Ltd., (Guaranty: Export Credits Guarantee Department of the United Kingdom), 2.004% due 9/18/2024 | | NR/NR | | | 10,152,104 | | | | 9,832,617 | |
a,b,c Carpintero Finance Ltd., (Guaranty: Export Credits Guarantee Department of the United Kingdom), 2.581% due 11/11/2024 | | NR/NR | | | 14,156,830 | | | | 14,032,958 | |
b Corp Andina de Fomento, 3.75% due 1/15/2016 | | AA-/Aa3 | | | 10,900,000 | | | | 11,363,174 | |
a,b Eurasian Development Bank, 5.00% due 9/26/2020 | | BBB/A3 | | | 8,000,000 | | | | 7,940,800 | |
b Export-Import Bank of Korea, 5.875% due 1/14/2015 | | A+/Aa3 | | | 2,900,000 | | | | 3,015,182 | |
a,b Government of Aruba, 6.80% due 4/2/2014 | | BBB+/NR | | | 5,516,000 | | | | 5,516,000 | |
a,b Government of Bermuda, 5.603% due 7/20/2020 | | AA-/Aa3 | | | 3,000,000 | | | | 3,269,556 | |
a,b Government of Bermuda, 4.138% due 1/3/2023 | | AA-/Aa3 | | | 4,000,000 | | | | 3,877,461 | |
a,b Korea National Oil Corp., 2.75% due 1/23/2019 | | A+/A1 | | | 5,000,000 | | | | 5,044,515 | |
b North American Development Bank, 4.375% due 2/11/2020 | | NR/Aa1 | | | 15,500,000 | | | | 16,735,350 | |
a,b Republic of Iceland, 4.875% due 6/16/2016 | | BBB-/Baa3 | | | 4,375,000 | | | | 4,610,156 | |
a,b State of Qatar, 3.125% due 1/20/2017 | | AA/Aa2 | | | 4,000,000 | | | | 4,210,000 | |
| | | | | | | | | | |
TOTAL OTHER GOVERNMENT (Cost $95,222,902) | | | | | | | | | 95,560,269 | |
| | | | | | | | | | |
| | | |
MORTGAGE BACKED — 7.38% | | | | | | | | | | |
Federal Home Loan Mtg Corp., CMO Interest Only Series K008 Class X1, 1.663% due 6/25/2020 | | NR/NR | | | 38,339,859 | | | | 2,956,168 | |
Federal Home Loan Mtg Corp., CMO Interest Only Series K710 Class X1, 1.782% due 5/25/2019 | | NR/NR | | | 49,580,912 | | | | 3,817,651 | |
Federal Home Loan Mtg Corp., CMO Series 2528 Class HN, 5.00% due 11/15/2017 | | NR/NR | | | 275,437 | | | | 289,367 | |
Federal Home Loan Mtg Corp., CMO Series 2627 Class GY, 4.50% due 6/15/2018 | | NR/NR | | | 1,561,321 | | | | 1,646,877 | |
Federal Home Loan Mtg Corp., CMO Series 2628 Class AB, 4.50% due 6/15/2018 | | NR/NR | | | 361,358 | | | | 372,372 | |
Federal Home Loan Mtg Corp., CMO Series 2654 Class OG, 5.00% due 2/15/2032 | | NR/NR | | | 49,701 | | | | 50,077 | |
Federal Home Loan Mtg Corp., CMO Series 2682 Class JG, 4.50% due 10/15/2023 | | NR/NR | | | 1,410,975 | | | | 1,504,387 | |
Federal Home Loan Mtg Corp., CMO Series 2778 Class JD, 5.00% due 12/15/2032 | | NR/NR | | | 270,478 | | | | 273,941 | |
Federal Home Loan Mtg Corp., CMO Series 2808 Class VA, 5.50% due 5/15/2015 | | NR/NR | | | 717,097 | | | | 733,537 | |
Federal Home Loan Mtg Corp., CMO Series 2814 Class GB, 5.00% due 6/15/2019 | | NR/NR | | | 117,463 | | | | 120,074 | |
Federal Home Loan Mtg Corp., CMO Series 2827 Class BU, 3.50% due 7/15/2019 | | NR/NR | | | 1,586,881 | | | | 1,657,830 | |
Federal Home Loan Mtg Corp., CMO Series 3195 Class PD, 6.50% due 7/15/2036 | | NR/NR | | | 2,234,765 | | | | 2,472,947 | |
Federal Home Loan Mtg Corp., CMO Series 3291 Class BY, 4.50% due 3/15/2022 | | NR/NR | | | 2,832,409 | | | | 3,032,257 | |
Federal Home Loan Mtg Corp., CMO Series 3504 Class PC, 4.00% due 1/15/2039 | | NR/NR | | | 347,615 | | | | 363,684 | |
Federal Home Loan Mtg Corp., CMO Series 3589 Class CA, 4.00% due 10/15/2021 | | NR/NR | | | 715,970 | | | | 751,225 | |
Federal Home Loan Mtg Corp., CMO Series 3919 Class VB, 4.00% due 8/15/2024 | | NR/NR | | | 5,063,430 | | | | 5,386,496 | |
Federal Home Loan Mtg Corp., CMO Series 3922 Class PQ, 2.00% due 4/15/2041 | | NR/NR | | | 3,301,267 | | | | 3,328,265 | |
Federal Home Loan Mtg Corp., CMO Series 4050 Class MV, 3.50% due 8/15/2023 | | NR/NR | | | 3,450,276 | | | | 3,578,621 | |
Federal Home Loan Mtg Corp., CMO Series 4079 Class WV, 3.50% due 3/15/2027 | | NR/NR | | | 3,455,340 | | | | 3,511,307 | |
Federal Home Loan Mtg Corp., CMO Series 4097 Class TE, 1.75% due 5/15/2039 | | NR/NR | | | 10,823,807 | | | | 10,103,120 | |
Federal Home Loan Mtg Corp., CMO Series 4120 Class TC, 1.50% due 10/15/2027 | | NR/NR | | | 5,496,119 | | | | 5,252,423 | |
Federal Home Loan Mtg Corp., Pool D98887, 3.50% due 1/1/2032 | | NR/NR | | | 7,776,737 | | | | 8,038,290 | |
Federal Home Loan Mtg Corp., Pool J17504, 3.00% due 12/1/2026 | | NR/NR | | | 3,645,969 | | | | 3,752,785 | |
Federal Home Loan Mtg Corp., REMIC Series 3838 Class GV, 4.00% due 3/15/2024 | | NR/NR | | | 9,956,715 | | | | 10,530,867 | |
Federal Home Loan Mtg Corp., REMIC Series 4072 Class VA, 3.50% due 10/15/2023 | | NR/NR | | | 2,642,532 | | | | 2,741,076 | |
Federal National Mtg Assoc., ARM Pool 20155, 7.491% due 8/1/2014 | | NR/NR | | | 2,413 | | | | 2,413 | |
Federal National Mtg Assoc., CMO Series 2003-4 Class PE, 5.00% due 2/25/2018 | | NR/NR | | | 720,310 | | | | 765,117 | |
Federal National Mtg Assoc., CMO Series 2003-74 Class KN, 4.50% due 8/25/2018 | | NR/NR | | | 282,850 | | �� | | 300,789 | |
Federal National Mtg Assoc., CMO Series 2003-92 Class VG, 5.00% due 9/25/2014 | | NR/NR | | | 81,614 | | | | 82,173 | |
Federal National Mtg Assoc., CMO Series 2003-W3 Class 1A2, 7.00% due 8/25/2042 | | NR/NR | | | 1,376,670 | | | | 1,535,419 | |
Federal National Mtg Assoc., CMO Series 2004-33 Class MW, 4.50% due 1/25/2030 | | NR/NR | | | 641,660 | | | | 657,792 | |
Federal National Mtg Assoc., CMO Series 2005-48 Class AR, 5.50% due 2/25/2035 | | NR/NR | | | 721,012 | | | | 783,221 | |
Federal National Mtg Assoc., CMO Series 2007-42 Class PA, 5.50% due 4/25/2037 | | NR/NR | | | 937,082 | | | | 1,001,572 | |
Federal National Mtg Assoc., CMO Series 2009-17 Class AH, 1.68% due 3/25/2039 | | NR/NR | | | 998,448 | | | | 1,005,477 | |
Federal National Mtg Assoc., CMO Series 2009-49 Class KA, 5.00% due 2/25/2024 | | NR/NR | | | 516,842 | | | | 541,176 | |
Federal National Mtg Assoc., CMO Series 2009-5 Class A, 4.50% due 12/25/2023 | | NR/NR | | | 1,541,245 | | | | 1,633,333 | |
Federal National Mtg Assoc., CMO Series 2009-52 Class AJ, 4.00% due 7/25/2024 | | NR/NR | | | 998,993 | | | | 1,054,294 | |
Federal National Mtg Assoc., CMO Series 2009-65 Class GA, 4.50% due 11/25/2023 | | NR/NR | | | 232,293 | | | | 239,382 | |
Federal National Mtg Assoc., CMO Series 2009-70 Class NK, 4.50% due 8/25/2019 | | NR/NR | | | 912,715 | | | | 961,501 | |
Federal National Mtg Assoc., CMO Series 2011-103 Class VA, 4.00% due 12/25/2022 | | NR/NR | | | 2,413,475 | | | | 2,543,954 | |
Federal National Mtg Assoc., CMO Series 2011-15 Class VA, 4.00% due 4/25/2022 | | NR/NR | | | 1,528,637 | | | | 1,631,241 | |
Federal National Mtg Assoc., CMO Series 2011-89 Class VA, 4.00% due 9/25/2023 | | NR/NR | | | 5,486,800 | | | | 5,544,572 | |
Federal National Mtg Assoc., CMO Series 2012-129 Class LA, 3.50% due 12/25/2042 | | NR/NR | | | 14,540,592 | | | | 14,887,002 | |
Federal National Mtg Assoc., CMO Series 2012-36 Class CV, 4.00% due 6/25/2023 | | NR/NR | | | 3,105,486 | | | | 3,241,764 | |
Federal National Mtg Assoc., CMO Series 2012-48 Class PD, 2.00% due 7/25/2041 | | NR/NR | | | 12,449,074 | | | | 12,140,972 | |
Federal National Mtg Assoc., Pool 357384, 4.50% due 5/1/2018 | | NR/NR | | | 235,388 | | | | 249,576 | |
Federal National Mtg Assoc., Pool 897936, 5.50% due 8/1/2021 | | NR/NR | | | 1,115,582 | | | | 1,209,287 | |
Federal National Mtg Assoc., Pool AB7997, 2.50% due 2/1/2023 | | NR/NR | | | 10,851,159 | | | | 11,105,059 | |
Certified Semi-Annual Report 13
| | |
| SCHEDULE OF INVESTMENTS, CONTINUED | | |
| |
Thornburg Limited Term Income Fund | | March 31, 2014 (Unaudited) |
| | | | | | | | | | |
Issuer-Description | | Credit Rating†
S&P/ Moody’s | | Principal
Amount | | | Value | |
Federal National Mtg Assoc., Pool AK6518, 3.00% due 3/1/2027 | | NR/NR | | $ | 4,698,977 | | | $ | 4,834,623 | |
Federal National Mtg Assoc., Pool MA1278, 2.50% due 12/1/2022 | | NR/NR | | | 12,963,755 | | | | 13,267,086 | |
Federal National Mtg Assoc., Pool MA1585, 2.00% due 9/1/2023 | | NR/NR | | | 14,087,614 | | | | 14,161,354 | |
Federal National Mtg Assoc., Pool MA1691, 3.00% due 12/1/2023 | | NR/NR | | | 13,942,431 | | | | 14,499,583 | |
Government National Mtg Assoc., CMO Series 2009-35 Series KV,
4.50% due 6/20/2020 | | NR/NR | | | 3,111,066 | | | | 3,244,205 | |
Government National Mtg Assoc., CMO Series 2009-68 Class DP,
4.50% due 11/16/2038 | | NR/NR | | | 951,214 | | | | 1,010,304 | |
Government National Mtg Assoc., Pool 003007, 8.50% due 11/20/2015 | | NR/NR | | | 5,183 | | | | 5,377 | |
Government National Mtg Assoc., Pool 714631, 5.691% due 10/20/2059 | | NR/NR | | | 4,685,429 | | | | 5,021,529 | |
Government National Mtg Assoc., Pool 721652, 5.044% due 5/20/2061 | | NR/NR | | | 6,173,825 | | | | 6,799,746 | |
Government National Mtg Assoc., Pool 731491, 5.156% due 12/20/2060 | | NR/NR | | | 3,591,426 | | | | 3,987,916 | |
Government National Mtg Assoc., Pool 751388, 5.307% due 1/20/2061 | | NR/NR | | | 4,731,260 | | | | 5,256,823 | |
Government National Mtg Assoc., Pool 783299, 4.50% due 2/15/2022 | | NR/NR | | | 4,297,561 | | | | 4,546,005 | |
Government National Mtg Assoc., Pool 827148, 1.625% due 2/20/2024 | | NR/NR | | | 25,118 | | | | 25,690 | |
Government National Mtg Assoc., Pool MA0100, 2.50% due 5/20/2042 | | NR/NR | | | 3,409,109 | | | | 3,496,350 | |
| | | | | | | | | | |
TOTAL MORTGAGE BACKED (Cost $221,081,845) | | | | | | | | | 219,539,321 | |
| | | | | | | | | | |
| | | |
ASSET BACKED SECURITIES — 15.81% | | | | | | | | | | |
ADVANCE RECEIVABLES — 2.54% | | | | | | | | | | |
a HLSS Servicer Advance Receivables Trust, Series 2013-T1 Class A2, 1.495% due 1/16/2046 | | AAA/NR | | | 5,000,000 | | | | 4,987,500 | |
a HLSS Servicer Advance Receivables Trust, Series 2013-T1 Class A3, 2.289% due 1/15/2048 | | AAA/NR | | | 10,000,000 | | | | 9,881,000 | |
a HLSS Servicer Advance Receivables Trust, Series 2013-T3 Class A3, 1.793% due 5/15/2046 | | AAA/NR | | | 8,500,000 | | | | 8,381,229 | |
a HLSS Servicer Advance Receivables Trust, Series 2013-T5 Class AT5, 1.979% due 8/15/2046 | | AAA/NR | | | 10,500,000 | | | | 10,534,650 | |
a HLSS Servicer Advance Receivables Trust, Series 2013-T7 Class A7, 1.981% due 11/15/2046 | | AAA/NR | | | 19,900,000 | | | | 19,925,870 | |
a HLSS Servicer Advance Receivables Trust, Series 2014-T2 Class AT2, 2.217% due 1/15/2047 | | AAA/NR | | | 11,900,000 | | | | 11,930,297 | |
a,c New Residential Advance Receivables Trust, Series 2014-T1 Class A1, 1.274% due 3/15/2045 | | AAA/NR | | | 9,900,000 | | | | 9,906,188 | |
| | | | | | | | | | |
| | | | | | | | | 75,546,734 | |
| | | | | | | | | | |
AUTO RECEIVABLES — 0.80% | | | | | | | | | | |
a CFC LLC, 1.65% due 7/17/2017 | | NR/A3 | | | 1,012,164 | | | | 1,015,625 | |
a Exeter Automobile Receivables Trust, 1.29% due 5/15/2018 | | AA/NR | | | 7,131,082 | | | | 7,150,037 | |
Ford Credit Auto Owner Trust, 1.25% due 10/15/2018 | | AAA/NR | | | 1,200,000 | | | | 1,204,994 | |
Santander Drive Auto Receivables Trust, 2.72% due 5/16/2016 | | AA+/Aaa | | | 2,500,000 | | | | 2,514,998 | |
a Santander Drive Auto Receivables Trust, 2.86% due 6/15/2017 | | AA/NR | | | 90,821 | | | | 91,105 | |
Santander Drive Auto Receivables Trust, 2.16% due 1/15/2020 | | AA/Aaa | | | 4,000,000 | | | | 4,067,713 | |
Santander Drive Auto Receivables Trust, 1.33% due 3/15/2018 | | AA/Aaa | | | 7,835,000 | | | | 7,875,306 | |
| | | | | | | | | | |
| | | | | | | | | 23,919,778 | |
| | | | | | | | | | |
COMMERCIAL MTG TRUST — 5.24% | | | | | | | | | | |
Banc of America Commercial Mtg Inc., Series 2006-6 Class A3,
5.369% due 10/10/2045 | | AAA/Aaa | | | 3,000,000 | | | | 3,076,385 | |
a Banc of America Re-REMIC Trust, Series 2012-CLRN Class A Floating Rate Note, 1.305% due 8/15/2029 | | NR/Aaa | | | 5,000,000 | | | | 5,011,178 | |
a CFCRE Commercial Mtg Trust, Series 2011-C1 Class A4,
4.961% due 4/15/2044 | | NR/Aaa | | | 11,877,000 | | | | 13,045,073 | |
Citigroup Commercial Mtg Trust, Series 2004-HYB2 Class B1,
3.26% due 3/25/2034 | | CCC/Caa2 | | | 314,958 | | | | 255,971 | |
a COMM Mtg Trust, Series 2012-MVP Class A Floating Rate Note,
2.094% due 11/17/2026 | | AAA/NR | | | 15,854,382 | | | | 15,924,633 | |
Credit Suisse Commercial Mtg Capital Certificates, Series 2007-C2
Class A2, 5.448% due 1/15/2049 | | AAA/Aaa | | | 8,184 | | | | 8,175 | |
a DBUBS Mtg Trust CMO, Series 2011-LC1A Class A1,
3.742% due 11/10/2046 | | NR/Aaa | | | 4,933,055 | | | | 5,151,207 | |
a DBUBS Mtg Trust CMO, Series 2011-LC2A Class A1FL,
1.505% due 7/12/2044 | | NR/Aaa | | | 1,128,679 | | | | 1,118,755 | |
a Extended Stay America Trust, Series 2013-ESH7 Class B7,
3.604% due 12/5/2031 | | AA-/NR | | | 11,380,000 | | | | 11,268,092 | |
a FREMF Mtg Trust, Series 2012-KF01 Class B Floating Rate Note,
2.757% due 10/25/2044 | | NR/A3 | | | 4,000,000 | | | | 4,082,138 | |
a FREMF Mtg Trust, Series 2013-K32 Class B, 3.536% due 10/25/2046 | | NR/NR | | | 10,753,000 | | | | 10,141,336 | |
a FREMF Mtg Trust, Series 2013-KF02 Class B Floating Rate Note,
2.823% due 12/25/2045 | | NR/Baa3 | | | 5,547,459 | | | | 5,664,130 | |
a Hilton USA Trust, Series 2013-HLT Class BFX, 3.367% due 11/5/2030 | | AA-/Aa3 | | | 18,500,000 | | | | 18,719,046 | |
JPMorgan Chase Commercial Mtg, Series 2004-C3 Class A-5,
4.878% due 1/15/2042 | | NR/Aaa | | | 5,000,000 | | | | 5,100,861 | |
a JPMorgan Chase Commercial Mtg, Series 2013-JWRZ Class B Floating Rate Note, 1.305% due 4/15/2030 | | AA-/Aa3 | | | 14,900,000 | | | | 14,812,294 | |
a Madison Avenue Trust, Series 2013-650M Class A,
3.843% due 10/12/2032 | | NR/Aaa | | | 6,000,000 | | | | 6,263,370 | |
a Morgan Stanley Re-REMIC Trust, Series 2009-GG10 Class A4A,
5.819% due 8/12/2045 | | NR/Aaa | | | 2,485,200 | | | | 2,751,733 | |
a Motel 6 Trust, Series 2012-MTL6 Class A2, 1.948% due 10/5/2025 | | AAA/NR | | | 6,900,000 | | | | 6,835,921 | |
a Motel 6 Trust, Series 2012-MTL6 Class C, 3.139% due 10/5/2025 | | A-/NR | | | 12,000,000 | | | | 11,969,016 | |
a Wells Fargo Commercial Mtg Trust, Series 2013-120B Class A,
2.71% due 3/18/2028 | | AAA/NR | | | 15,000,000 | | | | 14,703,180 | |
| | | | | | | | | | |
| | | | | | | | | 155,902,494 | |
| | | | | | | | | | |
CREDIT CARD — 0.51% | | | | | | | | | | |
a First Financial Bank USA, 3.72% due 6/17/2019 | | AAA/NR | | | 5,000,000 | | | | 5,010,325 | |
a,b Turquoise Card Backed Securities plc Floating Rate Note,
0.955% due 6/17/2019 | | NR/Aaa | | | 10,000,000 | | | | 10,070,080 | |
| | | | | | | | | | |
| | | | | | | | | 15,080,405 | |
| | | | | | | | | | |
OTHER ASSET BACKED — 4.33% | | | | | | | | | | |
a 321 Henderson Receivables LLC, 3.96% due 3/15/2063 | | NR/Aaa | | | 6,500,000 | | | | 6,529,354 | |
Appalachian Consumer Rate Relief Funding LLC, 2.008% due 2/1/2024 | | AAA/Aaa | | | 15,200,000 | | | | 15,063,367 | |
14 Certified Semi-Annual Report
| | |
| SCHEDULE OF INVESTMENTS, CONTINUED | | |
| |
Thornburg Limited Term Income Fund | | March 31, 2014 (Unaudited) |
| | | | | | | | | | |
Issuer-Description | | Credit Rating†
S&P/ Moody’s | | Principal
Amount | | | Value | |
a Ascentium Equipment Receivables LLC, 1.83% due 9/15/2019 | | NR/NR | | $ | 2,649,518 | | | $ | 2,650,618 | |
a,b Cie Financement Foncier, 2.50% due 9/16/2015 | | AAA/Aaa | | | 6,000,000 | | | | 6,157,020 | |
a,c Concord Funding Co. LLC, 2.42% due 2/15/2015 | | A/NR | | | 9,900,000 | | | | 9,813,375 | |
a,c Concord Funding Co. LLC, 3.92% due 2/15/2015 | | BBB/NR | | | 4,000,000 | | | | 3,945,000 | |
a,b Cronos Containers Program Ltd., 3.08% due 4/18/2028 | | A/NR | | | 9,083,333 | | | | 8,938,415 | |
a,b Cronos Containers Program Ltd., 3.81% due 9/18/2027 | | A/NR | | | 5,695,000 | | | | 5,738,902 | |
a Dominos Pizza Master Issuer LLC, 5.216% due 1/25/2042 | | BBB+/Baa1 | | | 6,935,500 | | | | 7,421,744 | |
a Fairway Outdoor Funding LLC, 4.212% due 10/15/2042 | | NR/NR | | | 6,730,120 | | | | 6,669,990 | |
a GTP Cellular Sites LLC, 3.721% due 3/15/2042 | | NR/NR | | | 9,374,813 | | | | 9,826,951 | |
a MIRAMAX LLC, 6.25% due 10/20/2021 | | BBB/Baa3 | | | 3,843,702 | | | | 3,965,886 | |
Northwest Airlines, Inc., 7.027% due 5/1/2021 | | A-/Baa1 | | | 4,565,110 | | | | 5,061,794 | |
a,c Northwind Holdings LLC Floating Rate Note, 1.016% due 12/1/2037 | | A/Baa1 | | | 3,718,750 | | | | 3,452,859 | |
a PFS Financing Corp. Floating Rate Note, 0.705% due 2/15/2018 | | AAA/Aaa | | | 9,000,000 | | | | 8,994,557 | |
a Sierra Receivables Funding Co. LLC, 2.07% due 3/20/2030 | | A/NR | | | 10,000,000 | | | | 9,998,905 | |
a Sierra Receivables Funding Co. LLC, 2.84% due 11/20/2028 | | A+/NR | | | 3,361,628 | | | | 3,418,878 | |
a Sonic Capital LLC, 5.438% due 5/20/2041 | | BBB/Baa2 | | | 4,580,800 | | | | 4,912,908 | |
a,b Trafigura Securitisation Finance plc Floating Rate Note,
2.555% due 10/15/2015 | | AAA/Aaa | | | 6,000,000 | | | | 6,064,800 | |
| | | | | | | | | | |
| | | | | | | | | 128,625,323 | |
| | | | | | | | | | |
RESIDENTIAL MTG TRUST — 1.52% | | | | | | | | | | |
Banc of America Mtg Securities, Inc., Series 2004-4 Class 1A2,
5.50% due 5/25/2034 | | A+/NR | | | 265,830 | | | | 266,728 | |
a Citigroup Mortgage Loan Trust Inc., Series 2014-A Class A,
4.00% due 1/25/2035 | | AA/NR | | | 9,710,160 | | | | 10,025,016 | |
Countrywide Home Loan, Series 2004 Class 1-A, 2.632% due 7/20/2034 | | A/B1 | | | 428,850 | | | | 441,607 | |
a FDIC Trust, Series 2013-R1 Class A, 1.15% due 3/25/2033 | | NR/NR | | | 5,706,782 | | | | 5,523,931 | |
FNBC Pass-Through Trust, Series 1993-A, 8.08% due 1/5/2018 | | A+/Aa1 | | | 570,786 | | | | 645,281 | |
Merrill Lynch Mtg Investors Trust, Series 2003 E Class B3,
2.404% due 10/25/2028 | | CCC/Caa2 | | | 1,006,462 | | | | 603,171 | |
Merrill Lynch Mtg Investors Trust, Series 2004-A4 Class M1,
2.49% due 8/25/2034 | | CCC/NR | | | 749,701 | | | | 632,906 | |
Option One Mtg Loan Trust, Series 2005-5 Class A3 Floating Rate Note, 0.364% due 12/25/2035 | | AA+/Baa2 | | | 1,144,722 | | | | 1,119,570 | |
Popular ABS Mtg Pass-Through Trust, Series 2005-4 Class AF5,
5.537% due 9/25/2035 | | BB+/A3 | | | 4,530,543 | | | | 4,708,026 | |
Residential Asset Mtg Products, Inc., 7.125% due 4/25/2031 | | AA+/NR | | | 2,049,263 | | | | 2,141,644 | |
Residential Asset Mtg Products, Inc., 0.454% due 3/25/2035 | | NR/Aa3 | | | 227,797 | | | | 224,636 | |
a RiverView HECM Trust Series 2007-1 Class A, 0.63% due 5/25/2047 | | A-/Ba3 | | | 5,537,597 | | | | 4,430,078 | |
a Shellpoint Asset Funding Trust, Series 2013-1 Class A1,
3.75% due 7/25/2043 | | AAA/NR | | | 10,680,690 | | | | 10,463,215 | |
Structured Asset Securities Corp., 5.50% due 3/25/2019 | | A+/Ba2 | | | 713,175 | | | | 724,101 | |
Structured Asset Securities Corp., 2.358% due 3/25/2033 | | AA+/Baa3 | | | 2,443,460 | | | | 2,417,379 | |
Washington Mutual Mtg, Series 2003-S13 Class 21-A1,
4.50% due 12/25/2018 | | A+/NR | | | 602,121 | | | | 603,436 | |
Wells Fargo Asset Securities Corp., Series 2005-AR1 Class 1B1,
2.615% due 2/25/2035 | | D/C | | | 665,325 | | | | 142,366 | |
| | | | | | | | | | |
| | | | | | | | | 45,113,091 | |
| | | | | | | | | | |
STUDENT LOAN — 0.87% | | | | | | | | | | |
a Nelnet Student Loan Trust Floating Rate Note, 0.754% due 6/25/2041 | | NR/Aaa | | | 12,924,617 | | | | 12,920,736 | |
a Pennsylvania Higher Education Assistance Agency Floating Rate Note, 0.704% due 5/25/2027 | | AA+/NR | | | 5,473,360 | | | | 5,432,983 | |
SLM Student Loan Trust, Series 2003-C Class A2 Floating Rate Note,
0.623% due 9/15/2020 | | A-/Aaa | | | 2,340,539 | | | | 2,318,786 | |
a SLM Student Loan Trust, Series 2011-B Class A2, 3.74% due 2/15/2029 | | AAA/Aaa | | | 5,000,000 | | | | 5,198,924 | |
| | | | | | | | | | |
| | | | | | | | | 25,871,429 | |
| | | | | | | | | | |
TOTAL ASSET BACKED SECURITIES (Cost $469,222,347) | | | | | | | | | 470,059,254 | |
| | | | | | | | | | |
| | | |
CORPORATE BONDS — 46.28% | | | | | | | | | | |
AUTOMOBILES & COMPONENTS — 1.47% | | | | | | | | | | |
Automobiles — 1.47% | | | | | | | | | | |
a American Honda Finance Corp., 2.60% due 9/20/2016 | | A+/A1 | | | 5,000,000 | | | | 5,196,690 | |
a American Honda Finance Corp., 1.00% due 8/11/2015 | | A+/A1 | | | 3,000,000 | | | | 3,017,388 | |
a Daimler Finance North America LLC, 1.25% due 1/11/2016 | | A-/A3 | | | 7,000,000 | | | | 7,039,249 | |
a,b Hyundai Capital Services, Inc., 6.00% due 5/5/2015 | | BBB+/Baa1 | | | 7,900,000 | | | | 8,323,077 | |
a,b Hyundai Capital Services, Inc. Floating Rate Note, 1.035% due 3/18/2017 | | BBB+/Baa1 | | | 5,000,000 | | | | 5,005,790 | |
a Nissan Motor Acceptance Corp., 1.95% due 9/12/2017 | | BBB+/A3 | | | 14,900,000 | | | | 14,965,351 | |
| | | | | | | | | | |
| | | | | | | | | 43,547,545 | |
| | | | | | | | | | |
BANKS — 7.18% | | | | | | | | | | |
Banks — 6.43% | | | | | | | | | | |
a,b ANZ National International Ltd., 3.125% due 8/10/2015 | | AA-/Aa3 | | | 4,000,000 | | | | 4,128,696 | |
a,b Banco Bradesco, 4.50% due 1/12/2017 | | BBB-/Baa1 | | | 2,500,000 | | | | 2,631,250 | |
a,b Banco BTG Pactual SA/Cayman Islands N.A., 4.00% due 1/16/2020 | | NR/Baa3 | | | 7,000,000 | | | | 6,545,000 | |
a,b Banco Latinoamericano de Comercio Exterior, S.A., 3.75% due 4/4/2017 | | BBB/NR | | | 4,000,000 | | | | 4,134,000 | |
a,b Banco Santander Chile Floating Rate Note, 2.109% due 6/7/2018 | | A/Aa3 | | | 21,000,000 | | | | 21,026,250 | |
Bank of America Corp., 2.65% due 4/1/2019 | | A-/Baa2 | | | 4,000,000 | | | | 4,012,756 | |
Bank of America Corp. Floating Rate Note, 1.104% due 4/1/2019 | | A-/Baa2 | | | 8,000,000 | | | | 7,992,240 | |
Certified Semi-Annual Report 15
| | |
| SCHEDULE OF INVESTMENTS, CONTINUED | | |
| |
Thornburg Limited Term Income Fund | | March 31, 2014 (Unaudited) |
| | | | | | | | | | |
Issuer-Description | | Credit Rating†
S&P/ Moody’s | | Principal
Amount | | | Value | |
a,b Bank of China Hong Kong, 3.75% due 11/8/2016 | | A+/Aa3 | | $ | 4,000,000 | | | $ | 4,194,916 | |
a,b Barclays Bank plc, 2.50% due 9/21/2015 | | AAA/Aaa | | | 14,650,000 | | | | 15,038,430 | |
a,b Caixa Economica Federal, 4.50% due 10/3/2018 | | BBB-/Baa2 | | | 15,000,000 | | | | 15,262,500 | |
a,b Danske Bank A/S, 3.75% due 4/1/2015 | | A-/Baa1 | | | 4,000,000 | | | | 4,117,040 | |
a,b DNB Bank ASA, 3.20% due 4/3/2017 | | A+/A1 | | | 10,000,000 | | | | 10,503,240 | |
a,b HSBC Bank plc, 3.50% due 6/28/2015 | | AA-/Aa3 | | | 2,000,000 | | | | 2,073,328 | |
a,b Kookmin Bank, 7.25% due 5/14/2014 | | AA/Aa1 | | | 7,000,000 | | | | 7,051,443 | |
Manufacturers & Traders Trust Co., 2.30% due 1/30/2019 | | A/A2 | | | 10,000,000 | | | | 9,971,950 | |
National City Bank Floating Rate Note, 0.604% due 6/7/2017 | | A-/A3 | | | 4,000,000 | | | | 3,969,164 | |
a,b Oversea-Chinese Banking Corp. Ltd., 3.15% due 3/11/2023 | | A+/Aa3 | | | 29,650,000 | | | | 29,506,613 | |
b Royal Bank of Scotland Group plc, 9.50% due 3/16/2022 | | BBB-/NR | | | 12,000,000 | | | | 14,070,000 | |
a Sovereign Bank, 12.18% due 6/30/2020 | | BBB/A2 | | | 5,920,404 | | | | 8,096,153 | |
a,b Standard Chartered plc, 3.20% due 5/12/2016 | | A+/A2 | | | 4,900,000 | | | | 5,113,826 | |
Wells Fargo Bank N.A., 0.446% due 5/16/2016 | | A+/A1 | | | 4,629,000 | | | | 4,606,929 | |
b Westpac Banking Corp., 3.00% due 8/4/2015 | | AA-/Aa2 | | | 2,000,000 | | | | 2,064,858 | |
a,b Westpac Banking Corp. Floating Rate Note, 1.038% due 7/17/2015 | | NR/Aaa | | | 5,000,000 | | | | 5,044,360 | |
| | | |
Thrifts & Mortgage Finance — 0.75% | | | | | | | | | | |
a,b Northern Rock Asset Management plc, 5.625% due 6/22/2017 | | AAA/Aaa | | | 19,900,000 | | | | 22,268,498 | |
| | | | | | | | | | |
| | | | | | | | | 213,423,440 | |
| | | | | | | | | | |
CAPITAL GOODS — 1.99% | | | | | | | | | | |
Aerospace & Defense — 0.39% | | | | | | | | | | |
Exelis, Inc., 5.55% due 10/1/2021 | | BBB-/Baa3 | | | 11,338,000 | | | | 11,692,052 | |
| | | |
Construction & Engineering — 0.31% | | | | | | | | | | |
URS Corp., 3.85% due 4/1/2017 | | BBB-/Baa3 | | | 8,895,000 | | | | 9,205,818 | |
| | | |
Industrial Conglomerates — 0.39% | | | | | | | | | | |
a,b Hutchison Whampoa Ltd., 3.50% due 1/13/2017 | | A-/A3 | | | 5,000,000 | | | | 5,252,830 | |
a,b Smiths Group plc, 6.05% due 5/15/2014 | | BBB+/Baa2 | | | 2,900,000 | | | | 2,915,341 | |
a,b Smiths Group plc, 7.20% due 5/15/2019 | | BBB+/Baa2 | | | 3,000,000 | | | | 3,508,596 | |
| | | |
Machinery — 0.64% | | | | | | | | | | |
Aeroquip Vickers, Inc., 6.875% due 4/9/2018 | | A-/NR | | | 1,500,000 | | | | 1,690,456 | |
Ingersoll Rand Co., 6.391% due 11/15/2027 | | BBB/Baa2 | | | 3,000,000 | | | | 3,497,730 | |
a,b Volvo Treasury AB, 5.95% due 4/1/2015 | | BBB/Baa2 | | | 13,000,000 | | | | 13,648,440 | |
| | | |
Trading Companies & Distributors — 0.26% | | | | | | | | | | |
a Aviation Capital Group Corp., 6.75% due 4/6/2021 | | BB+/NR | | | 3,000,000 | | | | 3,309,753 | |
a Aviation Capital Group Corp., 7.125% due 10/15/2020 | | BB+/NR | | | 3,912,000 | | | | 4,386,749 | |
| | | | | | | | | | |
| | | | | | | | | 59,107,765 | |
| | | | | | | | | | |
CONSUMER DURABLES & APPAREL — 0.18% | | | | | | | | | | |
Household Durables — 0.10% | | | | | | | | | | |
Newell Rubbermaid, Inc., 2.00% due 6/15/2015 | | BBB-/Baa3 | | | 2,900,000 | | | | 2,935,183 | |
| | | |
Textiles, Apparel & Luxury Goods — 0.08% | | | | | | | | | | |
Nike, Inc., 5.15% due 10/15/2015 | | AA-/A1 | | | 2,315,000 | | | | 2,454,235 | |
| | | | | | | | | | |
| | | | | | | | | 5,389,418 | |
| | | | | | | | | | |
CONSUMER SERVICES — 0.53% | | | | | | | | | | |
Diversified Consumer Services — 0.53% | | | | | | | | | | |
George Washington University, 4.411% due 9/15/2017 | | A+/A1 | | | 1,650,000 | | | | 1,737,991 | |
Rensselaer Polytechnic I, 5.60% due 9/1/2020 | | A-/A3 | | | 10,925,000 | | | | 12,150,960 | |
University of Chicago, 3.065% due 10/1/2024 | | AA/Aa1 | | | 1,747,000 | | | | 1,723,188 | |
| | | | | | | | | | |
| | | | | | | | | 15,612,139 | |
| | | | | | | | | | |
DIVERSIFIED FINANCIALS — 7.78% | | | | | | | | | | |
Capital Markets — 4.86% | | | | | | | | | | |
Ares Capital Corp., 4.875% due 11/30/2018 | | BBB/NR | | | 18,000,000 | | | | 18,591,534 | |
a,b BTG Investments LP, 4.50% due 4/17/2018 | | NR/NR | | | 20,000,000 | | | | 19,400,000 | |
a,b Credit Suisse Group AG - Guernsey, 1.625% due 3/6/2015 | | NR/Aaa | | | 13,000,000 | | | | 13,145,990 | |
b Deutsche Bank AG/London, 2.50% due 2/13/2019 | | A/A2 | | | 8,600,000 | | | | 8,626,720 | |
Deutsche Bank Financial LLC, 5.375% due 3/2/2015 | | BBB/Baa3 | | | 5,000,000 | | | | 5,206,430 | |
Goldman Sachs Group, Inc. Floating Rate Note, 1.436% due 4/30/2018 | | A-/Baa1 | | | 15,610,000 | | | | 15,809,231 | |
Goldman Sachs Group, Inc. Floating Rate Note, 1.336% due 11/15/2018 | | A-/Baa1 | | | 14,900,000 | | | | 15,033,966 | |
a,b IPIC GMTN Ltd., 3.125% due 11/15/2015 | | AA/Aa3 | | | 1,000,000 | | | | 1,033,500 | |
a,b IPIC GMTN Ltd., 5.00% due 11/15/2020 | | AA/Aa3 | | | 1,000,000 | | | | 1,103,750 | |
a,b IPIC GMTN Ltd., 3.75% due 3/1/2017 | | AA/Aa3 | | | 3,000,000 | | | | 3,195,000 | |
16 Certified Semi-Annual Report
| | |
| SCHEDULE OF INVESTMENTS, CONTINUED | | |
| |
Thornburg Limited Term Income Fund | | March 31, 2014 (Unaudited) |
| | | | | | | | | | |
Issuer-Description | | Credit Rating†
S&P/ Moody’s | | Principal
Amount | | | Value | |
a,b IPIC GMTN Ltd., 5.50% due 3/1/2022 | | AA/Aa3 | | $ | 3,500,000 | | | $ | 3,955,000 | |
Legg Mason, Inc., 5.50% due 5/21/2019 | | BBB/Baa1 | | | 13,065,000 | | | | 14,430,018 | |
a,b Macquarie Bank Ltd., 3.45% due 7/27/2015 | | A/A2 | | | 1,900,000 | | | | 1,960,952 | |
a,b Macquarie Group Ltd., 7.30% due 8/1/2014 | | BBB/A3 | | | 8,000,000 | | | | 8,174,176 | |
Merrill Lynch & Co., 0.788% due 5/2/2017 | | BBB+/Baa3 | | | 2,500,000 | | | | 2,446,720 | |
a,b Sberbank of Russia, 5.50% due 2/26/2024 | | NR/NR | | | 13,300,000 | | | | 12,452,125 | |
| | | |
Consumer Finance — 1.13% | | | | | | | | | | |
American Express Credit Co., 2.80% due 9/19/2016 | | A-/A2 | | | 8,000,000 | | | | 8,343,208 | |
American Express Credit Co., 5.125% due 8/25/2014 | | A-/A2 | | | 3,000,000 | | | | 3,055,974 | |
a,b Banque PSA Finance, 2.143% due 4/4/2014 | | BB/Ba1 | | | 7,000,000 | | | | 7,000,000 | |
a,b DFS Funding Corp. Floating Rate Note, 1.058% due 6/15/2015 | | NR/Baa3 | | | 2,000,000 | | | | 1,955,720 | |
Western Union Co., 3.35% due 5/22/2019 | | BBB/Baa2 | | | 11,350,000 | | | | 11,280,027 | |
Western Union Co., 3.65% due 8/22/2018 | | BBB/Baa2 | | | 2,000,000 | | | | 2,054,542 | |
| | | |
Diversified Financial Services — 1.79% | | | | | | | | | | |
b Barclays Bank plc, 2.50% due 2/20/2019 | | A/A2 | | | 3,000,000 | | | | 3,005,238 | |
Citigroup, Inc., 5.00% due 9/15/2014 | | BBB+/Baa3 | | | 3,000,000 | | | | 3,058,095 | |
a CME Group Index Services, 4.40% due 3/15/2018 | | AA-/Aa3 | | | 4,530,000 | | | | 4,904,749 | |
General Electric Capital Corp. Floating Rate Note, 1.233% due 3/15/2023 | | AA+/A1 | | | 7,725,000 | | | | 7,699,044 | |
General Electric Capital Corp. Floating Rate Note, 0.385% due 12/28/2018 | | AA+/A1 | | | 4,850,000 | | | | 4,680,250 | |
JPMorgan Chase Bank N.A. Floating Rate Note, 0.563% due 6/13/2016 | | A/A2 | | | 16,875,000 | | | | 16,788,532 | |
a,b National Agricultural Cooperative Federation, 5.00% due 9/30/2014 | | A/A1 | | | 2,000,000 | | | | 2,038,836 | |
National Rural Utilities CFC, 10.375% due 11/1/2018 | | A+/A1 | | | 2,000,000 | | | | 2,696,652 | |
a USAA Capital Corp., 2.25% due 12/13/2016 | | AA+/Aa1 | | | 8,000,000 | | | | 8,174,944 | |
| | | | | | | | | | |
| | | | | | | | | 231,300,923 | |
| | | | | | | | | | |
ENERGY — 4.84% | | | | | | | | | | |
Oil, Gas & Consumable Fuels — 4.84% | | | | | | | | | | |
a,b BG Energy Capital plc, 2.875% due 10/15/2016 | | A-/A2 | | | 5,000,000 | | | | 5,205,790 | |
b BP Capital Markets plc, 3.875% due 3/10/2015 | | A/A2 | | | 2,000,000 | | | | 2,065,890 | |
Buckeye Partners LP, 4.15% due 7/1/2023 | | BBB-/Baa3 | | | 7,000,000 | | | | 6,981,324 | |
a,b CNPC General Capital Ltd., 1.45% due 4/16/2016 | | A+/A1 | | | 3,000,000 | | | | 2,996,994 | |
a,b CNPC General Capital Ltd., 2.75% due 4/19/2017 | | A+/A1 | | | 5,000,000 | | | | 5,100,485 | |
Energen Corp., 4.625% due 9/1/2021 | | BBB-/Baa3 | | | 10,000,000 | | | | 9,938,070 | |
a Florida Gas Transmission Co. LLC, 4.00% due 7/15/2015 | | BBB/Baa2 | | | 2,000,000 | | | | 2,071,594 | |
a,b Gazprom, 4.95% due 5/23/2016 | | BBB/Baa1 | | | 4,000,000 | | | | 4,125,000 | |
a,b Gazprom Neft OAO, 6.00% due 11/27/2023 | | BBB-/Baa2 | | | 7,000,000 | | | | 6,860,000 | |
Gulf South Pipeline Co. LP, 4.00% due 6/15/2022 | | BBB-/Baa1 | | | 4,000,000 | | | | 3,946,316 | |
a,b Harvest Operations Corp., 2.125% due 5/14/2018 | | A+/A1 | | | 7,000,000 | | | | 6,921,824 | |
a,b Korea National Oil Corp., 4.00% due 10/27/2016 | | A+/A1 | | | 2,000,000 | | | | 2,129,062 | |
a Maritimes & Northeast Pipeline LLC, 7.50% due 5/31/2014 | | BBB-/Ba1 | | | 2,468,400 | | | | 2,489,265 | |
a Northern Natural Gas Co., 5.75% due 7/15/2018 | | A-/A2 | | | 50,000 | | | | 56,709 | |
NuStar Logistics LP, 4.75% due 2/1/2022 | | BB+/Ba1 | | | 5,000,000 | | | | 4,768,750 | |
a,b Odebrecht Offshore Drilling Finance Ltd., 6.75% due 10/1/2022 | | BBB-/Baa3 | | | 19,458,000 | | | | 20,187,675 | |
b Petrobras Global Finance B.V. Floating Rate Note, 2.593% due 3/17/2017 | | BBB-/Baa1 | | | 10,400,000 | | | | 10,439,000 | |
b Petroleos Mexicanos Floating Rate Note, 2.257% due 7/18/2018 | | BBB+/Baa1 | | | 10,000,000 | | | | 10,425,000 | |
b Sasol Financing International plc, 4.50% due 11/14/2022 | | BBB/Baa1 | | | 4,000,000 | | | | 3,880,000 | |
a Semco Energy, Inc., 5.15% due 4/21/2020 | | A-/A2 | | | 3,000,000 | | | | 3,121,293 | |
a,b Sinopec Capital (2013) Ltd., 1.875% due 4/24/2018 | | A+/Aa3 | | | 20,000,000 | | | | 19,428,620 | |
a,b Sinopec Group Overseas Development Ltd., 2.75% due 5/17/2017 | | A+/Aa3 | | | 6,000,000 | | | | 6,153,810 | |
a Texas Gas Transmission LLC, 4.50% due 2/1/2021 | | BBB-/Baa1 | | | 4,480,000 | | | | 4,539,069 | |
| | | | | | | | | | |
| | | | | | | | | 143,831,540 | |
| | | | | | | | | | |
FOOD, BEVERAGE & TOBACCO — 1.28% | | | | | | | | | | |
Beverages — 0.58% | | | | | | | | | | |
Coca Cola Enterprises, Inc., 5.71% due 3/18/2037 | | AA-/NR | | | 3,380,000 | | | | 3,692,708 | |
b Coca Cola HBC Finance BV, 5.50% due 9/17/2015 | | BBB/Baa1 | | | 7,885,000 | | | | 8,345,594 | |
a,b Coca Cola Icecek Uretim A.S., 4.75% due 10/1/2018 | | NR/Baa3 | | | 5,000,000 | | | | 5,162,500 | |
| | | |
Food Products — 0.03% | | | | | | | | | | |
Corn Products International, Inc., 3.20% due 11/1/2015 | | BBB/Baa2 | | | 1,000,000 | | | | 1,031,477 | |
| | | |
Tobacco — 0.67% | | | | | | | | | | |
a,b B.A.T International Finance plc, 2.125% due 6/7/2017 | | A-/A3 | | | 8,000,000 | | | | 8,144,560 | |
Lorillard Tobacco Co., 6.875% due 5/1/2020 | | BBB-/Baa2 | | | 5,000,000 | | | | 5,847,460 | |
Lorillard Tobacco Co., 3.75% due 5/20/2023 | | BBB-/Baa2 | | | 6,230,000 | | | | 5,872,155 | |
| | | | | | | | | | |
| | | | | | | | | 38,096,454 | |
| | | | | | | | | | |
Certified Semi-Annual Report 17
| | |
| SCHEDULE OF INVESTMENTS, CONTINUED | | |
| |
Thornburg Limited Term Income Fund | | March 31, 2014 (Unaudited) |
| | | | | | | | | | |
Issuer-Description | | Credit Rating†
S&P/ Moody’s | | Principal
Amount | | | Value | |
HEALTH CARE EQUIPMENT & SERVICES — 0.29% | | | | | | | | | | |
Health Care Providers & Services — 0.29% | | | | | | | | | | |
Catholic Health Initiatives, 1.60% due 11/1/2017 | | A+/NR | | $ | 1,900,000 | | | $ | 1,862,331 | |
Catholic Health Initiatives, 2.95% due 11/1/2022 | | A+/A1 | | | 7,000,000 | | | | 6,606,579 | |
| | | | | | | | | | |
| | | | | | | | | 8,468,910 | |
| | | | | | | | | | |
HOTELS RESTAURANTS & LEISURE — 0.06% | | | | | | | | | | |
Hotels, Restaurants & Leisure — 0.06% | | | | | | | | | | |
a,b TDIC Finance Ltd., 6.50% due 7/2/2014 | | AA/A1 | | | 1,900,000 | | | | 1,922,800 | |
| | | | | | | | | | |
| | | | | | | | | 1,922,800 | |
| | | | | | | | | | |
HOUSEHOLD & PERSONAL PRODUCTS — 0.07% | | | | | | | | | | |
Household Products — 0.07% | | | | | | | | | | |
Energizer Holdings, Inc., 4.70% due 5/24/2022 | | BBB-/Baa3 | | | 2,000,000 | | | | 2,050,994 | |
| | | | | | | | | | |
| | | | | | | | | 2,050,994 | |
| | | | | | | | | | |
INSURANCE — 2.13% | | | | | | | | | | |
Insurance — 2.13% | | | | | | | | | | |
a Forethought Financial Group, Inc., 8.625% due 4/15/2021 | | BBB-/Ba1 | | | 2,600,000 | | | | 2,935,296 | |
Hanover Insurance Group, Inc., 6.375% due 6/15/2021 | | BBB-/Baa3 | | | 2,480,000 | | | | 2,816,191 | |
Infinity Property & Casualty Corp., 5.00% due 9/19/2022 | | BBB/Baa2 | | | 3,000,000 | | | | 3,095,067 | |
a,b Lancashire Holdings Ltd., 5.70% due 10/1/2022 | | BBB/Baa2 | | | 10,000,000 | | | | 10,288,358 | |
a MassMutual Global Funding LLC, 2.00% due 4/5/2017 | | AA+/Aa2 | | | 8,000,000 | | | | 8,164,808 | |
a MetLife Institutional Funding II, 1.625% due 4/2/2015 | | AA-/Aa3 | | | 5,000,000 | | | | 5,059,645 | |
a Metropolitan Life Global Funding I, 1.70% due 6/29/2015 | | AA-/Aa3 | | | 4,000,000 | | | | 4,052,720 | |
b Montpelier Re Holdings Ltd., 4.70% due 10/15/2022 | | BBB/NR | | | 5,000,000 | | | | 5,072,120 | |
a Principal Life Global Funding II, 1.00% due 12/11/2015 | | A+/A1 | | | 7,000,000 | | | | 7,006,993 | |
a Prudential Covered Trust Co., 2.997% due 9/30/2015 | | A/Baa1 | | | 2,400,000 | | | | 2,463,566 | |
Unitrin, Inc., 6.00% due 11/30/2015 | | BBB-/Baa3 | | | 5,000,000 | | | | 5,309,250 | |
a,b White Mountains Re Group Ltd., 6.375% due 3/20/2017 | | BBB/Baa3 | | | 6,335,000 | | | | 7,074,561 | |
| | | | | | | | | | |
| | | | | | | | | 63,338,575 | |
| | | | | | | | | | |
MATERIALS — 3.43% | | | | | | | | | | |
Chemicals — 0.47% | | | | | | | | | | |
a Incitec Pivot Finance LLC, 6.00% due 12/10/2019 | | BBB/Baa3 | | | 4,538,000 | | | | 5,011,840 | |
a,b Incitec Pivot Ltd., 4.00% due 12/7/2015 | | BBB/Baa3 | | | 4,325,000 | | | | 4,493,882 | |
RPM International, Inc., 6.125% due 10/15/2019 | | BBB-/Baa3 | | | 4,000,000 | | | | 4,517,232 | |
| | | |
Construction Materials — 0.03% | | | | | | | | | | |
CRH America, Inc., 8.125% due 7/15/2018 | | BBB+/Baa2 | | | 650,000 | | | | 793,709 | |
| | | |
Metals & Mining — 2.93% | | | | | | | | | | |
a,b Anglo American Capital plc, 2.625% due 9/27/2017 | | BBB/Baa2 | | | 9,700,000 | | | | 9,848,740 | |
b Anglogold Holdings plc, 5.125% due 8/1/2022 | | BB+/Baa3 | | | 7,000,000 | | | | 6,526,660 | |
b Anglogold Holdings plc, 5.375% due 4/15/2020 | | BB+/Baa3 | | | 9,100,000 | | | | 9,074,056 | |
b ArcelorMittal, 4.25% due 8/5/2015 | | BB+/Ba1 | | | 3,000,000 | | | | 3,090,000 | |
b ArcelorMittal, 10.35% due 6/1/2019 | | BB+/Ba1 | | | 8,089,000 | | | | 10,242,696 | |
b ArcelorMittal, 5.00% due 2/25/2017 | | BB+/Ba1 | | | 3,000,000 | | | | 3,183,750 | |
a Glencore Funding LLC Floating Rate Note, 1.599% due 1/15/2019 | | BBB/Baa2 | | | 15,000,000 | | | | 14,951,940 | |
b Kinross Gold Corp., 3.625% due 9/1/2016 | | NR/Baa3 | | | 7,000,000 | | | | 7,244,580 | |
a,b Newcrest Finance Property Ltd., 4.20% due 10/1/2022 | | BBB-/Baa3 | | | 10,459,000 | | | | 9,022,132 | |
a,b Newcrest Finance Property Ltd., 4.45% due 11/15/2021 | | BBB-/Baa3 | | | 3,500,000 | | | | 3,133,484 | |
a,b Samarco Mineracao S.A., 4.125% due 11/1/2022 | | BBB-/NR | | | 6,000,000 | | | | 5,520,000 | |
a,b Xstrata Finance Canada Ltd., 4.95% due 11/15/2021 | | BBB/Baa2 | | | 5,000,000 | | | | 5,168,130 | |
| | | | | | | | | | |
| | | | | | | | | 101,822,831 | |
| | | | | | | | | | |
MEDIA — 0.59% | | | | | | | | | | |
Media — 0.59% | | | | | | | | | | |
DirecTV Holdings LLC/Financing Co. Inc., 4.45% due 4/1/2024 | | BBB/Baa2 | | | 10,000,000 | | | | 10,028,210 | |
The Washington Post Co., 7.25% due 2/1/2019 | | BBB/Baa1 | | | 5,000,000 | | | | 5,854,595 | |
Time Warner Cable, Inc., 8.05% due 1/15/2016 | | BBB/Baa2 | | | 200,000 | | | | 222,771 | |
Time Warner Cable, Inc., 7.50% due 4/1/2014 | | BBB/NR | | | 1,500,000 | | | | 1,500,000 | |
| | | | | | | | | | |
| | | | | | | | | 17,605,576 | |
| | | | | | | | | | |
18 Certified Semi-Annual Report
| | |
| SCHEDULE OF INVESTMENTS, CONTINUED | | |
| |
Thornburg Limited Term Income Fund | | March 31, 2014 (Unaudited) |
| | | | | | | | | | |
Issuer-Description | | Credit Rating†
S&P/ Moody’s | | Principal
Amount | | | Value | |
PHARMACEUTICALS, BIOTECHNOLOGY & LIFE SCIENCES — 0.10% | | | | | | | | | | |
Biotechnology — 0.10% | | | | | | | | | | |
Genzyme Corp., 3.625% due 6/15/2015 | | AA/A1 | | $ | 3,000,000 | | | $ | 3,107,223 | |
| | | | | | | | | | |
| | | | | | | | | 3,107,223 | |
| | | | | | | | | | |
REAL ESTATE — 1.65% | | | | | | | | | | |
Real Estate Investment Trusts — 1.21% | | | | | | | | | | |
Alexandria Real Estate Equities, Inc., 3.90% due 6/15/2023 | | BBB-/Baa2 | | | 11,700,000 | | | | 11,299,930 | |
Commonwealth REIT (HRPT Properties), 6.25% due 6/15/2017 | | BBB-/Baa3 | | | 4,000,000 | | | | 4,298,028 | |
Washington REIT, 4.95% due 10/1/2020 | | BBB/Baa2 | | | 19,100,000 | | | | 20,306,681 | |
| | | |
Real Estate Management & Development — 0.44% | | | | | | | | | | |
a,b Deutsche Annington Finance B.V., 3.20% due 10/2/2017 | | NR/NR | | | 10,000,000 | | | | 10,263,820 | |
Jones Lang LaSalle, Inc., 4.40% due 11/15/2022 | | BBB-/Baa2 | | | 3,000,000 | | | | 2,931,627 | |
| | | | | | | | | | |
| | | | | | | | | 49,100,086 | |
| | | | | | | | | | |
RETAILING — 0.86% | | | | | | | | | | |
Multiline Retail — 0.63% | | | | | | | | | | |
Family Dollar Stores, Inc., 5.00% due 2/1/2021 | | BBB-/Baa3 | | | 18,000,000 | | | | 18,819,558 | |
| | | |
Specialty Retail — 0.23% | | | | | | | | | | |
Advance Auto Parts, Inc., 4.50% due 1/15/2022 | | BBB-/Baa3 | | | 6,400,000 | | | | 6,638,176 | |
| | | | | | | | | | |
| | | | | | | | | 25,457,734 | |
| | | | | | | | | | |
SEMICONDUCTORS & SEMICONDUCTOR EQUIPMENT — 0.10% | | | | | | | | | | |
Semiconductors & Semiconductor Equipment — 0.10% | | | | | | | | | | |
KLA Tencor Corp., 6.90% due 5/1/2018 | | BBB/Baa1 | | | 2,610,000 | | | | 3,060,094 | |
| | | | | | | | | | |
| | | | | | | | | 3,060,094 | |
| | | | | | | | | | |
SOFTWARE & SERVICES — 1.86% | | | | | | | | | | |
Information Technology Services — 1.76% | | | | | | | | | | |
Broadridge Financial Solutions, Inc., 3.95% due 9/1/2020 | | BBB+/Baa1 | | | 8,000,000 | | | | 8,116,888 | |
Lender Processing Services, Inc./Black Knight Lending Solutions, Inc., 5.75% due 4/15/2023 | | BBB-/Baa3 | | | 12,469,000 | | | | 13,295,071 | |
Moody’s Corp., 4.875% due 2/15/2024 | | BBB+/NR | | | 17,000,000 | | | | 17,856,052 | |
SAIC, Inc., 4.45% due 12/1/2020 | | BBB/Baa2 | | | 2,000,000 | | | | 2,018,706 | |
Total System Services, Inc., 2.375% due 6/1/2018 | | BBB+/Baa3 | | | 11,145,000 | | | | 10,989,516 | |
| | | |
Software — 0.10% | | | | | | | | | | |
CA Technologies, Inc., 2.875% due 8/15/2018 | | BBB+/Baa2 | | | 2,925,000 | | | | 2,966,237 | |
| | | | | | | | | | |
| | | | | | | | | 55,242,470 | |
| | | | | | | | | | |
TECHNOLOGY HARDWARE & EQUIPMENT — 0.98% | | | | | | | | | | |
Communications Equipment — 0.49% | | | | | | | | | | |
b Ericsson LM, 4.125% due 5/15/2022 | | BBB+/A3 | | | 14,300,000 | | | | 14,607,064 | |
| | | |
Computers & Peripherals — 0.49% | | | | | | | | | | |
Hewlett-Packard Co., 3.30% due 12/9/2016 | | BBB+/Baa1 | | | 2,000,000 | | | | 2,103,492 | |
Lexmark International, Inc., 5.125% due 3/15/2020 | | BBB-/Baa3 | | | 12,000,000 | | | | 12,539,256 | |
| | | | | | | | | | |
| | | | | | | | | 29,249,812 | |
| | | | | | | | | | |
TELECOMMUNICATION SERVICES — 3.31% | | | | | | | | | | |
Diversified Telecommunication Services — 1.79% | | | | | | | | | | |
AT&T, Inc. Floating Rate Note, 1.144% due 11/27/2018 | | A-/A3 | | | 16,250,000 | | | | 16,486,908 | |
a,c Hidden Ridge Facility, 5.65% due 1/1/2022 | | NR/Baa2 | | | 3,284,541 | | | | 3,612,995 | |
Michigan Bell Telephone Co., 7.85% due 1/15/2022 | | A-/NR | | | 3,000,000 | | | | 3,726,084 | |
a,b Oi S.A., 5.75% due 2/10/2022 | | BBB-/Baa3 | | | 5,000,000 | | | | 4,787,500 | |
a,b Qtel International Finance Ltd., 6.50% due 6/10/2014 | | A-/A2 | | | 900,000 | | | | 907,110 | |
a,b Qtel International Finance Ltd., 3.375% due 10/14/2016 | | A-/A2 | | | 500,000 | | | | 524,920 | |
Qwest Corp., 6.75% due 12/1/2021 | | BBB-/Baa3 | | | 3,000,000 | | | | 3,349,812 | |
b Telecom Italia Capital SA, 6.175% due 6/18/2014 | | BB+/Ba1 | | | 1,950,000 | | | | 1,969,500 | |
b Telefonica Emisiones SAU, 6.421% due 6/20/2016 | | BBB/Baa2 | | | 9,900,000 | | | | 10,956,647 | |
Verizon Communications, Inc., 2.50% due 9/15/2016 | | BBB+/Baa1 | | | 4,830,000 | | | | 5,001,320 | |
Verizon Communications, Inc. Floating Rate Note, 1.984% due 9/14/2018 | | BBB+/Baa1 | | | 1,825,000 | | | | 1,916,606 | |
| | | |
Wireless Telecommunication Services — 1.52% | | | | | | | | | | |
a Crown Castle Towers LLC, 5.495% due 1/15/2037 | | NR/A2 | | | 8,120,000 | | | | 8,778,020 | |
a Crown Castle Towers LLC, 6.113% due 1/15/2040 | | NR/A2 | | | 4,395,000 | | | | 5,038,028 | |
a Richland Towers, 4.606% due 3/15/2041 | | NR/NR | | | 2,240,671 | | | | 2,306,388 | |
a SBA Tower Trust, 5.101% due 4/15/2042 | | NR/A2 | | | 2,305,000 | | | | 2,467,014 | |
Certified Semi-Annual Report 19
| | |
| SCHEDULE OF INVESTMENTS, CONTINUED | | |
| |
Thornburg Limited Term Income Fund | | March 31, 2014 (Unaudited) |
| | | | | | | | | | |
Issuer-Description | | Credit Rating†
S&P/ Moody’s | | Principal
Amount | | | Value | |
a SBA Tower Trust, 4.254% due 4/15/2040 | | NR/A2 | | $ | 14,125,000 | | | $ | 14,599,727 | |
a Unison Ground Lease Funding LLC, 5.349% due 4/15/2040 | | NR/NR | | | 2,470,000 | | | | 2,668,339 | |
a Unison Ground Lease Funding LLC, 6.392% due 4/15/2040 | | NR/NR | | | 8,540,000 | | | | 9,328,891 | |
| | | | | | | | | | |
| | | | | | | | | 98,425,809 | |
| | | | | | | | | | |
TRANSPORTATION — 1.36% | | | | | | | | | | |
Air Freight & Logistics — 0.11% | | | | | | | | | | |
FedEx Corp., 8.76% due 5/22/2015 | | BBB/A3 | | | 249,782 | | | | 256,651 | |
a FedEx Corp., 2.625% due 1/15/2018 | | BBB/A3 | | | 3,046,280 | | | | 3,106,547 | |
| | | |
Airlines — 0.74% | | | | | | | | | | |
a American Airlines, 4.95% due 7/15/2024 | | A-/NR | | | 2,723,914 | | | | 2,921,398 | |
a,b BAA Funding Ltd., 2.50% due 6/25/2017 | | A-/NR | | | 5,000,000 | | | | 5,060,295 | |
b,c Iberbond plc, 4.826% due 12/24/2017 | | NR/Baa3 | | | 1,769,456 | | | | 1,782,727 | |
US Airways, 6.25% due 10/22/2024 | | A-/Baa1 | | | 6,300,431 | | | | 7,119,486 | |
a,b Virgin Australia, 5.00% due 4/23/2025 | | NR/Baa2 | | | 5,000,000 | | | | 5,275,000 | |
| | | |
Road & Rail — 0.51% | | | | | | | | | | |
a,b Asciano Finance Ltd., 5.00% due 4/7/2018 | | BBB-/Baa2 | | | 2,000,000 | | | | 2,147,636 | |
a,b Asciano Finance Ltd., 3.125% due 9/23/2015 | | BBB-/Baa2 | | | 2,900,000 | | | | 2,973,489 | |
a,b LeasePlan Corp. NV, 2.50% due 5/16/2018 | | BBB+/Baa2 | | | 10,000,000 | | | | 9,929,500 | |
| | | | | | | | | | |
| | | | | | | | | 40,572,729 | |
| | | | | | | | | | |
UTILITIES — 4.24% | | | | | | | | | | |
Electric Utilities — 2.65% | | | | | | | | | | |
Detroit Edison Corporate Senior Note, 5.40% due 8/1/2014 | | A/Aa3 | | | 2,000,000 | | | | 2,030,330 | |
a,b Electricite de France S.A., 2.15% due 1/22/2019 | | NR/NR | | | 4,900,000 | | | | 4,875,196 | |
a,b Enel Finance International S.A., 6.25% due 9/15/2017 | | BBB/Baa2 | | | 9,500,000 | | | | 10,747,825 | |
Entergy Louisiana LLC, 4.80% due 5/1/2021 | | A-/A2 | | | 4,300,000 | | | | 4,728,448 | |
Entergy Texas, Inc., 7.125% due 2/1/2019 | | A-/Baa1 | | | 2,000,000 | | | | 2,355,166 | |
Entergy Texas, Inc., 3.60% due 6/1/2015 | | A-/Baa1 | | | 3,000,000 | | | | 3,096,156 | |
a,b Iberdrola Finance Ireland Ltd., 3.80% due 9/11/2014 | | BBB/Baa1 | | | 5,900,000 | | | | 5,977,172 | |
Idaho Power Corp., 6.025% due 7/15/2018 | | A-/A1 | | | 1,000,000 | | | | 1,139,613 | |
a,b Korea Western Power Co., Ltd., 2.875% due 10/10/2018 | | A+/A1 | | | 10,000,000 | | | | 10,150,070 | |
Metropolitan Edison Co., 7.70% due 1/15/2019 | | BBB-/Baa2 | | | 2,250,000 | | | | 2,703,184 | |
a Monongahela Power Co., 4.10% due 4/15/2024 | | BBB+/Baa1 | | | 5,000,000 | | | | 5,113,905 | |
a Monongahela Power Co., 5.70% due 3/15/2017 | | BBB+/Baa1 | | | 4,785,000 | | | | 5,166,838 | |
MP Environmental, 4.982% due 7/15/2016 | | AAA/Aaa | | | 366,096 | | | | 366,572 | |
Public Service Co. of New Mexico, 5.35% due 10/1/2021 | | BBB/Baa2 | | | 3,000,000 | | | | 3,255,093 | |
a Rochester Gas & Electric, 5.90% due 7/15/2019 | | A/A2 | | | 11,732,000 | | | | 13,240,712 | |
a Steelriver Transmission Co. LLC, 4.71% due 6/30/2017 | | NR/Baa2 | | | 3,365,537 | | | | 3,548,858 | |
Toledo Edison Co., 7.25% due 5/1/2020 | | BBB/Baa1 | | | 167,000 | | | | 197,898 | |
| | | |
Gas Utilities — 0.38% | | | | | | | | | | |
a,b APT Pipelines Ltd., 3.875% due 10/11/2022 | | BBB/Baa2 | | | 5,500,000 | | | | 5,294,916 | |
a Southern Star Central Gas Pipeline, Inc., 6.00% due 6/1/2016 | | BBB-/Baa3 | | | 5,715,000 | | | | 6,194,271 | |
| | | |
Independent Power & Renewable Electricity — 0.26% | | | | | | | | | | |
a Midland Cogeneration Venture, 6.00% due 3/15/2025 | | BBB-/NR | | | 7,374,144 | | | | 7,719,409 | |
| | | |
Multi-Utilities — 0.95% | | | | | | | | | | |
a Enogex LLC, 6.875% due 7/15/2014 | | BBB-/Baa3 | | | 4,000,000 | | | | 4,060,336 | |
a Enogex LLC, 6.25% due 3/15/2020 | | BBB-/Baa3 | | | 3,640,000 | | | | 3,962,944 | |
a,b Korea Hydro & Nuclear Power Co. Ltd., 2.875% due 10/2/2018 | | A+/A1 | | | 7,000,000 | | | | 7,116,536 | |
a Niagara Mohawk Power Corp., 4.881% due 8/15/2019 | | A-/A3 | | | 10,000,000 | | | | 11,065,920 | |
SCANA Corp., 4.125% due 2/1/2022 | | BBB/Baa3 | | | 2,000,000 | | | | 2,015,980 | |
| | | | | | | | | | |
| | | | | | | | | 126,123,348 | |
| | | | | | | | | | |
TOTAL CORPORATE BONDS (Cost $1,345,659,572) | | | | | | | | | 1,375,858,215 | |
| | | | | | | | | | |
| | | |
CONVERTIBLE BONDS — 0.65% | | | | | | | | | | |
REAL ESTATE — 0.65% | | | | | | | | | | |
Real Estate Investment Trusts — 0.65% | | | | | | | | | | |
a IAS Operating Partnership LP, 5.00% due 3/15/2018 | | NR/NR | | | 19,950,000 | | | | 19,251,750 | |
| | | | | | | | | | |
| | | | | | | | | 19,251,750 | |
| | | | | | | | | | |
TOTAL CONVERTIBLE BONDS (Cost $19,950,000) | | | | | | | | | 19,251,750 | |
| | | | | | | | | | |
20 Certified Semi-Annual Report
| | |
| SCHEDULE OF INVESTMENTS, CONTINUED | | |
| |
Thornburg Limited Term Income Fund | | March 31, 2014 (Unaudited) |
| | | | | | | | | | |
Issuer-Description | | Credit Rating†
S&P/ Moody’s | | Principal
Amount | | | Value | |
MUNICIPAL BONDS — 5.39% | | | | | | | | | | |
American Municipal Power Ohio, Inc., 5.072% due 2/15/2018 | | A/A3 | | $ | 5,000,000 | | | $ | 5,520,850 | |
Anaheim California Public Financing Authority, 5.316% due 9/1/2017 (Insured: Natl Re/FGIC) | | AA-/A1 | | | 1,840,000 | | | | 1,833,210 | |
Anaheim California Public Financing Authority, 5.486% due 9/1/2020 (Insured: Natl-Re) | | AA-/A1 | | | 3,270,000 | | | | 3,304,335 | |
Brentwood California Infrastructure Financing Authority,
6.16% due 10/1/2019 | | AA-/NR | | | 2,110,000 | | | | 2,335,749 | |
California Health Facilities Financing Authority, 6.76% due 2/1/2019 | | A/NR | | | 3,905,000 | | | | 4,289,057 | |
California School Finance Authority, 5.041% due 7/1/2020 (LOC: City National Bank) | | AA+/NR | | | 4,000,000 | | | | 4,154,000 | |
Camden County New Jersey, 5.47% due 7/1/2018 | | A+/A2 | | | 2,140,000 | | | | 2,313,105 | |
Camden County New Jersey, 5.62% due 7/1/2019 | | A+/A2 | | | 3,025,000 | | | | 3,237,052 | |
Carson California Redevelopment Agency, 4.511% due 10/1/2016 | | A-/NR | | | 3,955,000 | | | | 3,957,887 | |
City of North Little Rock Arkansas, 3.562% due 7/1/2022 (Insured: AGM) | | AA/NR | | | 8,185,000 | | | | 7,901,308 | |
City of Riverside California, 5.61% due 8/1/2017 | | A/Aa2 | | | 2,000,000 | | | | 2,201,580 | |
City of Wilkes-Barre Pennsylvania GO, 4.82% due 11/15/2014 (Insured: AMBAC) | | NR/NR | | | 425,000 | | | | 434,448 | |
Connecticut Housing Finance Authority, 5.071% due 11/15/2019 | | AAA/Aaa | | | 2,875,000 | | | | 2,900,357 | |
Denver Public Schools COP, 2.018% due 12/15/2019 (School District No. 1 Educational Facilities) | | NR/Aa3 | | | 3,000,000 | | | | 2,888,220 | |
Florida Hurricane Catastrophe Fund Finance Corp., 1.298% due 7/1/2016 (Reimbursement Contracts for Covered Event Losses) | | AA-/Aa3 | | | 7,500,000 | | | | 7,578,075 | |
Florida State Board of Education, 3.60% due 6/1/2015 | | AAA/Aa1 | | | 3,000,000 | | | | 3,113,880 | |
Fort Collins Colorado Electric Utility, 4.92% due 12/1/2020 | | AA-/NR | | | 2,250,000 | | | | 2,454,008 | |
Illinois Finance Authority, 5.629% due 7/1/2016 (Insured: Syncora) | | AA-/NR | | | 1,100,000 | | | | 1,133,187 | |
JobsOhio Beverage System, 2.217% due 1/1/2019 | | AA/A2 | | | 11,245,000 | | | | 10,989,401 | |
Kentucky Asset/Liability Commission, 2.099% due 4/1/2019 (Commonwealth of Kentucky State Medical Insurance and Teachers’ Retirement System Obligations) | | A+/Aa3 | | | 3,000,000 | | | | 2,915,550 | |
Los Angeles California Municipal Improvement Corp.,
6.165% due 11/1/2020 | | A+/A3 | | | 10,000,000 | | | | 10,869,900 | |
Los Angeles County California Public Works Financing Authority,
5.591% due 8/1/2020 | | AA/A1 | | | 3,000,000 | | | | 3,322,590 | |
Louisiana Public Facilities Authority, 5.72% due 7/1/2015 (Insured: CIFG) | | AA/A3 | | | 890,000 | | | | 888,371 | |
Maine Finance Authority, 4.55% due 10/1/2014 | | A/NR | | | 365,000 | | | | 370,490 | |
Massachusetts Housing Finance Agency, 1.45% due 12/1/2015 (Multi-Family Residential Development) | | A+/Aa3 | | | 8,550,000 | | | | 8,623,017 | |
Menomonee Falls Wisconsin GO, 4.25% due 11/1/2014 | | NR/Aa2 | | | 3,350,000 | | | | 3,361,390 | |
a Midwest Family Housing, 5.168% due 7/1/2016 (Insured: CIFG) | | AA-/Baa1 | | | 625,000 | | | | 652,923 | |
New York City Transitional Finance Authority, 4.075% due 11/1/2020 | | AAA/Aa1 | | | 2,500,000 | | | | 2,676,900 | |
Oakland California Redevelopment Agency, 8.00% due 9/1/2016 | | A-/NR | | | 4,200,000 | | | | 4,647,804 | |
Oklahoma Development Finance Authority, 8.00% due 5/1/2020 | | NR/NR | | | 6,705,000 | | | | 6,771,514 | |
Orleans Parish School Board Louisiana GO, 4.40% due 2/1/2021 (Insured: AGM) | | AA/A2 | | | 10,000,000 | | | | 10,361,700 | |
Port St. Lucie Florida, 4.457% due 9/1/2014 (Wyndcrest) | | A/A1 | | | 1,470,000 | | | | 1,487,184 | |
Redlands California Redevelopment Agency, 5.818% due 8/1/2022 (Insured: AMBAC) | | A-/NR | | | 2,075,000 | | | | 2,040,783 | |
Rutgers State University GO, 2.342% due 5/1/2019 (New Brunswick, Newark and Camden Campus Facilities ) | | AA-/Aa3 | | | 3,485,000 | | | | 3,419,099 | |
Rutgers State University GO, 3.028% due 5/1/2021 (New Brunswick, Newark and Camden Campus Facilities) | | AA-/Aa3 | | | 1,500,000 | | | | 1,462,965 | |
San Bernardino County California San Sevaine Redevelopment Agency, 7.135% due 9/1/2020 | | BBB/NR | | | 1,665,000 | | | | 1,710,488 | |
San Francisco California City and County Redevelopment Financing Authority, 8.00% due 8/1/2019 | | A/Ba1 | | | 6,500,000 | | | | 7,176,975 | |
San Jose California Redevelopment Agency, 4.281% due 8/1/2014 | | A/Ba1 | | | 750,000 | | | | 758,400 | |
Tampa-Hillsborough County Expressway Authority, 2.22% due 7/1/2018 (Electronic Tolling Program) | | A/A3 | | | 2,000,000 | | | | 1,988,700 | |
Tampa-Hillsborough County Expressway Authority, 2.49% due 7/1/2019 (Electronic Tolling Program) | | A/A3 | | | 2,500,000 | | | | 2,432,500 | |
Tampa-Hillsborough County Expressway Authority, 2.84% due 7/1/2020 (Electronic Tolling Program) | | A/A3 | | | 1,750,000 | | | | 1,693,265 | |
Town of Victor, New York, 9.20% due 5/1/2014 | | NR/NR | | | 255,000 | | | | 255,352 | |
Wallenpaupack Pennsylvania Area School District GO, 3.80% due 9/1/2019 (State Aid Withholding) | | AA/NR | | | 3,000,000 | | | | 3,003,750 | |
Wallenpaupack Pennsylvania Area School District GO, 4.00% due 9/1/2020 (State Aid Withholding) | | AA/NR | | | 2,750,000 | | | | 2,741,695 | |
Wisconsin State Health & Educational Facilities Authority,
7.08% due 6/1/2016 (Richland Hospital, Inc.; Insured: ACA) | | NR/NR | | | 945,000 | | | | 931,590 | |
Yuba California Levee Financing Authority, 6.375% due 9/1/2021 | | AA/NR | | | 1,000,000 | | | | 1,061,320 | |
| | | | | | | | | | |
TOTAL MUNICIPAL BONDS (Cost $155,858,790) | | | | | | | | | 160,165,924 | |
| | | | | | | | | | |
| | | |
OTHER SECURITIES — 0.67% | | | | | | | | | | |
LOAN PARTICIPATIONS — 0.67% | | | | | | | | | | |
Freeport-McMoRan Copper & Gold, Inc., 1.00% due 2/11/2018 | | NR/NR | | | 20,000,000 | | | | 19,845,000 | |
| | | | | | | | | | |
TOTAL OTHER SECURITIES (Cost $19,904,500) | | | | | | | | | 19,845,000 | |
| | | | | | | | | | |
| | | |
SHORT TERM INVESTMENTS — 8.16% | | | | | | | | | | |
Bank of New York Tri-Party Repurchase Agreement 0.24% dated 3/31/2014 due 4/1/2014, repurchase price $88,000,587 collateralized by 34 U.S. Government debt securities and 28 corporate debt securities, having an average coupon of 4.18%, a minimum credit rating of BBB-, maturity dates from 12/1/2015 to 3/4/2044, and having an aggregate market value of $92,735,910 at 3/31/2014 | | NR/NR | | | 88,000,000 | | | | 88,000,000 | |
Lowe’s Companies, Inc., 0.17% due 4/1/2014 | | NR/NR | | | 24,000,000 | | | | 24,000,000 | |
Lowe’s Companies, Inc., 0.18% due 4/3/2014 | | NR/NR | | | 45,987,000 | | | | 45,986,540 | |
Volkswagen Credit, Inc., 0.16% due 4/1/2014 | | NR/NR | | | 50,000,000 | | | | 50,000,000 | |
Certified Semi-Annual Report 21
| | |
| SCHEDULE OF INVESTMENTS, CONTINUED | | |
| |
Thornburg Limited Term Income Fund | | March 31, 2014 (Unaudited) |
| | | | | | | | | | |
Volkswagen Credit, Inc., 0.18% due 4/1/2014 | | NR/NR | | $ | 25,000,000 | | | $ | 25,000,000 | |
Volkswagen Credit, Inc., 0.19% due 4/1/2014 | | NR/NR | | | 9,500,000 | | | | 9,500,000 | |
| | | | | | | | | | |
TOTAL SHORT TERM INVESTMENTS (Cost $242,486,540) | | | | | | | | | 242,486,540 | |
| | | | | | | | | | |
TOTAL INVESTMENTS — 98.31% (Cost $2,896,171,652) | | | | | | | | $ | 2,922,756,897 | |
OTHER ASSETS LESS LIABILITIES — 1.69% | | | | | | | | | 50,380,504 | |
| | | | | | | | | | |
NET ASSETS — 100.00% | | | | | | | | $ | 2,973,137,401 | |
| | | | | | | | | | |
Footnote Legend
| † | Credit ratings are unaudited. Rating changes may have occurred subsequent to the reporting period end. Bonds issued with a maturity of one year or less are assigned Moody’s ratings from MIG-1 to MIG-4 and Standard and Poor’s ratings from SP-1+ to SP-3 with MIG-1 and SP-1+ being the strongest ratings. |
| a | Securities exempt from registration under Rule 144A of the Securities Act of 1933, as amended. These securities may only be resold in the ordinary course of business in transactions exempt from registration, normally to qualified institutional buyers. As of March 31, 2014, the aggregate value of these securities in the Fund’s portfolio was $1,278,440,198, representing 43.0% of the Fund’s net assets. |
| b | Yankee Bond - Denominated in U.S. dollars and is issued in the U.S. by foreign banks and corporations. |
| c | Security currently fair valued by the Valuation and Pricing Committee using procedures approved by the Trustees. |
Portfolio Abbreviations
To simplify the listings of securities, abbreviations are used per the table below:
| | |
| ACA | | Insured by American Capital Access |
| AGM | | Insured by Assured Guaranty Municipal Corp. |
| AMBAC | | Insured by American Municipal Bond Assurance Corp. |
| ARM | | Adjustable Rate Mortgage |
| CIFG | | Insured by CIFG Assurance North America Inc. |
| CMO | | Collateralized Mortgage Obligation |
| COP | | Certificates of Participation |
| FCB | | Farm Credit Bank |
| | |
| FGIC | | Insured by Financial Guaranty Insurance Co. |
| GO | | General Obligation |
| LOC | | Letter of Credit |
| Mtg | | Mortgage |
| Natl-Re | | Insured by National Public Finance Guarantee Corp. |
| REIT | | Real Estate Investment Trust |
| REMIC | | Real Estate Mortgage Investment Conduit |
| Syncora | | Insured by Syncora Guarantee Inc. |
| VA | | Veterans Affairs |
See notes to financial statements.
22 Certified Semi-Annual Report
This page intentionally left blank.
This page is not part of the Semi-Annual Report 23
| | |
| STATEMENTS OF ASSETS AND LIABILITIES | | |
| |
Thornburg Limited Term Income Funds | | March 31, 2014 (Unaudited) |
| | | | | | | | |
| | | Thornburg
Limited Term U.S.
Government Fund | | | Thornburg
Limited Term
Income Fund | |
ASSETS | | | | | | | | |
Investments at value (cost $276,435,112 and $2,896,171,652) (Note 2) | | $ | 278,611,452 | | | $ | 2,922,756,897 | |
Cash | | | 10,571,829 | | | | 30,945,126 | |
Receivable for investments sold | | | — | | | | 29,685,966 | |
Receivable for fund shares sold | | | 503,130 | | | | 11,818,379 | |
Interest receivable | | | 1,257,062 | | | | 20,010,315 | |
Prepaid expenses and other assets | | | 64,084 | | | | 72,781 | |
| | | | | | | | |
Total Assets | | | 291,007,557 | | | | 3,015,289,464 | |
| | | | | | | | |
| | |
LIABILITIES | | | | | | | | |
Payable for investments purchased | | | — | | | | 34,395,479 | |
Payable for fund shares redeemed | | | 1,080,729 | | | | 4,862,460 | |
Payable to investment advisor and other affiliates (Note 3) | | | 173,615 | | | | 1,652,528 | |
Accounts payable and accrued expenses | | | — | | | | 412,645 | |
Dividends payable | | | 149,285 | | | | 828,951 | |
| | | | | | | | |
Total Liabilities | | | 1,403,629 | | | | 42,152,063 | |
| | | | | | | | |
| | |
NET ASSETS | | $ | 289,603,928 | | | $ | 2,973,137,401 | |
| | | | | | | | |
NET ASSETS CONSIST OF | | | | | | | | |
Distribution in excess of net investment income | | $ | (781,809 | ) | | $ | (1,256,676 | ) |
Net unrealized appreciation on investments | | | 2,176,340 | | | | 26,585,245 | |
Accumulated net realized gain (loss) | | | (5,853,800 | ) | | | 14,954,550 | |
Net capital paid in on shares of beneficial interest | | | 294,063,197 | | | | 2,932,854,282 | |
| | | | | | | | |
| | $ | 289,603,928 | | | $ | 2,973,137,401 | |
| | | | | | | | |
24 Certified Semi-Annual Report
| | |
| STATEMENTS OF ASSETS AND LIABILITIES, CONTINUED | | |
| |
Thornburg Limited Term Income Funds | | March 31, 2014 (Unaudited) |
| | | | | | | | |
| | | Thornburg
Limited Term U.S.
Government Fund | | | Thornburg
Limited Term
Income Fund | |
NET ASSET VALUE | | | | | | | | |
Class A Shares: | | | | | | | | |
Net asset value and redemption price per share ($145,945,642 and $922,032,756 applicable to 10,983,888 and 68,721,542 shares of beneficial interest outstanding - Note 4) | | $ | 13.29 | | | $ | 13.42 | |
Maximum sales charge, 1.50% of offering price | | | 0.20 | | | | 0.20 | |
| | | | | | | | |
Maximum offering price per share | | $ | 13.49 | | | $ | 13.62 | |
| | | | | | | | |
| | |
Class B Shares: | | | | | | | | |
Net asset value per share* ($1,146,315 applicable to 86,469 shares of beneficial interest outstanding - Note 4) | | $ | 13.26 | | | $ | — | |
| | | | | | | | |
| | |
Class C Shares: | | | | | | | | |
Net asset value and offering price per share* ($59,382,976 and $593,388,683 applicable to 4,442,176 and 44,297,935 shares of beneficial interest outstanding - Note 4) | | $ | 13.37 | | | $ | 13.40 | |
| | | | | | | | |
| | |
Class I Shares: | | | | | | | | |
Net asset value, offering and redemption price per share ($67,178,730 and $1,338,004,329 applicable to 5,055,913 and 99,707,152 shares of beneficial interest outstanding - Note 4) | | $ | 13.29 | | | $ | 13.42 | |
| | | | | | | | |
| | |
Class R3 Shares: | | | | | | | | |
Net asset value, offering and redemption price per share ($15,055,228 and $107,545,315 applicable to 1,132,343 and 8,009,699 shares of beneficial interest outstanding - Note 4) | | $ | 13.30 | | | $ | 13.43 | |
| | | | | | | | |
| | |
Class R4 Shares: | | | | | | | | |
Net asset value, offering and redemption price per share ($15,226 and $15,299 applicable to 1,146 and 1,140 shares of beneficial interest outstanding - Note 4) | | $ | 13.28 | | | $ | 13.41 | |
| | | | | | | | |
| | |
Class R5 Shares: | | | | | | | | |
Net asset value, offering and redemption price per share ($879,811 and $12,151,019 applicable to 66,216 and 905,612 shares of beneficial interest outstanding - Note 4) | | $ | 13.29 | | | $ | 13.42 | |
| | | | | | | | |
| * | Redemption price per share is equal to net asset value less any applicable contingent deferred sales charge. |
See notes to financial statements.
Certified Semi-Annual Report 25
| | |
| STATEMENTS OF OPERATIONS | | |
| |
Thornburg Limited Term Income Funds | | Six Months Ended March 31, 2014 (Unaudited) |
| | | | | | | | |
| | | Thornburg
Limited Term U.S.
Government Fund | | | Thornburg
Limited Term
Income Fund | |
INVESTMENT INCOME | | | | | | | | |
Interest income (net of premium amortized of $561,556 and $4,568,413 and net of paydown losses of $1,150,485 and $1,218,561, respectively) | | $ | 3,357,428 | | | $ | 46,616,706 | |
| | | | | | | | |
| | |
EXPENSES | | | | | | | | |
Investment advisory fees (Note 3) | | | 562,457 | | | | 5,562,763 | |
Administration fees (Note 3) | | | | | | | | |
Class A Shares | | | 92,673 | | | | 597,178 | |
Class B Shares | | | 712 | | | | — | |
Class C Shares | | | 41,399 | | | | 379,222 | |
Class I Shares | | | 17,071 | | | | 322,026 | |
Class R3 Shares | | | 9,477 | | | | 60,642 | |
Class R4 Shares | | | 3 | | | | 3 | |
Class R5 Shares | | | 218 | | | | 2,588 | |
Distribution and service fees (Note 3) | | | | | | | | |
Class A Shares | | | 185,345 | | | | 1,194,356 | |
Class B Shares | | | 5,662 | | | | — | |
Class C Shares | | | 164,890 | | | | 1,515,220 | |
Class R3 Shares | | | 37,928 | | | | 242,874 | |
Class R4 Shares | | | 6 | | | | 6 | |
Transfer agent fees | | | | | | | | |
Class A Shares | | | 67,155 | | | | 460,350 | |
Class B Shares | | | 2,838 | | | | — | |
Class C Shares | | | 34,410 | | | | 236,840 | |
Class I Shares | | | 21,531 | | | | 379,290 | |
Class R3 Shares | | | 9,347 | | | | 35,555 | |
Class R4 Shares | | | 320 | | | | 351 | |
Class R5 Shares | | | 1,118 | | | | 2,822 | |
Registration and filing fees | | | | | | | | |
Class A Shares | | | 36,214 | | | | 43,624 | |
Class B Shares | | | 7,994 | | | | — | |
Class C Shares | | | 9,290 | | | | 18,461 | |
Class I Shares | | | 11,863 | | | | 44,663 | |
Class R3 Shares | | | 8,836 | | | | 9,995 | |
Class R4 Shares | | | 1,710 | | | | 1,710 | |
Class R5 Shares | | | 10,693 | | | | 11,670 | |
Custodian fees (Note 3) | | | 42,525 | | | | 152,324 | |
Professional fees | | | 19,778 | | | | 36,995 | |
Accounting fees | | | 5,450 | | | | 50,910 | |
Trustee fees | | | 6,871 | | | | 52,585 | |
Other expenses | | | 18,191 | | | | 145,107 | |
| | | | | | | | |
Total Expenses | | | 1,433,975 | | | | 11,560,130 | |
Less: | | | | | | | | |
Expenses reimbursed by investment advisor (Note 3) | | | (61,212 | ) | | | (71,101 | ) |
Fees paid indirectly (Note 3) | | | (1,130 | ) | | | (1,954 | ) |
| | | | | | | | |
Net Expenses | | | 1,371,633 | | | | 11,487,075 | |
| | | | | | | | |
Net Investment Income | | $ | 1,985,795 | | | $ | 35,129,631 | |
| | | | | | | | |
26 Certified Semi-Annual Report
| | |
| STATEMENTS OF OPERATIONS, CONTINUED | | |
| |
Thornburg Limited Term Income Funds | | Six Months Ended March 31, 2014 (Unaudited) |
| | | | | | | | |
| | | Thornburg
Limited Term U.S.
Government Fund | | | Thornburg
Limited Term
Income Fund | |
REALIZED AND UNREALIZED GAIN (LOSS) | | | | | | | | |
Net realized gain (loss) on investments | | $ | (211,144 | ) | | $ | 17,578,881 | |
Net change in unrealized appreciation (depreciation) of investments | | | (820,529 | ) | | | 7,386,847 | |
Net Realized and Unrealized Gain (Loss) | | | (1,031,673 | ) | | | 24,965,728 | |
| | | | | | | | |
Net Increase in Net Assets Resulting from Operations | | $ | 954,122 | | | $ | 60,095,359 | |
| | | | | | | | |
See notes to financial statements.
Certified Semi-Annual Report 27
| | |
| STATEMENTS OF CHANGES IN NET ASSETS | | |
| |
Thornburg Limited Term U.S. Government Fund | | |
| | | | | | | | |
| | | Six Months Ended
March 31, 2014* | | | Year Ended
September 30, 2013 | |
INCREASE (DECREASE) IN NET ASSETS FROM | | | | | | | | |
| | |
OPERATIONS | | | | | | | | |
Net investment income | | $ | 1,985,795 | | | $ | 5,697,395 | |
Net realized gain (loss) on investments | | | (211,144 | ) | | | 626,725 | |
Net unrealized appreciation (depreciation) on investments | | | (820,529 | ) | | | (11,595,653 | ) |
| | | | | | | | |
| | |
Net Increase (Decrease) in Net Assets Resulting from Operations | | | 954,122 | | | | (5,271,533 | ) |
| | |
DIVIDENDS TO SHAREHOLDERS | | | | | | | | |
From net investment income | | | | | | | | |
Class A Shares | | | (1,340,406 | ) | | | (4,531,628 | ) |
Class B Shares | | | (2,209 | ) | | | (24,774 | ) |
Class C Shares | | | (505,134 | ) | | | (1,885,254 | ) |
Class I Shares | | | (737,706 | ) | | | (2,383,641 | ) |
Class R3 Shares | | | (133,030 | ) | | | (347,980 | ) |
Class R4 Shares | | | (63 | ) | | | — | |
Class R5 Shares | | | (9,093 | ) | | | (7,818 | ) |
| | |
FUND SHARE TRANSACTIONS (NOTE 4) | | | | | | | | |
Class A Shares | | | (12,380,839 | ) | | | (48,398,759 | ) |
Class B Shares | | | (231,172 | ) | | | (1,982,954 | ) |
Class C Shares | | | (14,119,282 | ) | | | (25,554,347 | ) |
Class I Shares | | | (6,064,112 | ) | | | (21,174,045 | ) |
Class R3 Shares | | | (207,363 | ) | | | 446,203 | |
Class R4 Shares | | | 15,313 | | | | — | |
Class R5 Shares | | | 3,324 | | | | 589,772 | |
| | | | | | | | |
Net Decrease in Net Assets | | | (34,757,650 | ) | | | (110,526,758 | ) |
| | |
NET ASSETS | | | | | | | | |
Beginning of Period | | | 324,361,578 | | | | 434,888,336 | |
| | | | | | | | |
| | |
End of Period | | $ | 289,603,928 | | | $ | 324,361,578 | |
| | | | | | | | |
Distribution in excess of net investment income | | $ | (781,809 | ) | | $ | (39,963 | ) |
See notes to financial statements.
28 Certified Semi-Annual Report
| | |
| STATEMENTS OF CHANGES IN NET ASSETS | | |
| |
Thornburg Limited Term Income Fund | | |
| | | | | | | | |
| | | Six Months Ended
March 31, 2014* | | | Year Ended
September 30, 2013 | |
INCREASE (DECREASE) IN NET ASSETS FROM | | | | | | | | |
| | |
OPERATIONS | | | | | | | | |
Net investment income | | $ | 35,129,631 | | | $ | 72,638,282 | |
Net realized gain (loss) on investments | | | 17,578,881 | | | | 28,225,169 | |
Net unrealized appreciation (depreciation) on investments | | | 7,386,847 | | | | (83,862,744 | ) |
| | | | | | | | |
| | |
Net Increase (Decrease) in Net Assets Resulting from Operations | | | 60,095,359 | | | | 17,000,707 | |
| | |
DIVIDENDS TO SHAREHOLDERS | | | | | | | | |
From net investment income | | | | | | | | |
Class A Shares | | | (10,998,636 | ) | | | (27,240,915 | ) |
Class C Shares | | | (6,299,273 | ) | | | (14,464,450 | ) |
Class I Shares | | | (17,211,395 | ) | | | (32,980,072 | ) |
Class R3 Shares | | | (1,072,481 | ) | | | (1,861,254 | ) |
Class R4 Shares | | | (55 | ) | | | — | |
Class R5 Shares | | | (131,437 | ) | | | (125,608 | ) |
| | |
From realized gains | | | | | | | | |
Class A Shares | | | (8,162,458 | ) | | | (4,830,257 | ) |
Class C Shares | | | (5,067,874 | ) | | | (2,753,549 | ) |
Class I Shares | | | (10,507,616 | ) | | | (4,644,607 | ) |
Class R3 Shares | | | (758,459 | ) | | | (328,154 | ) |
Class R4 Shares | | | — | | | | — | |
Class R5 Shares | | | (61,655 | ) | | | (7,863 | ) |
| | |
FUND SHARE TRANSACTIONS (NOTE 4) | | | | | | | | |
Class A Shares | | | (107,268,392 | ) | | | 6,646,964 | |
Class C Shares | | | (39,491,799 | ) | | | 44,122,175 | |
Class I Shares | | | 77,374,589 | | | | 276,724,852 | |
Class R3 Shares | | | 25,932,400 | | | | 10,072,568 | |
Class R4 Shares | | | 15,305 | | | | — | |
Class R5 Shares | | | 3,942,921 | | | | 6,994,597 | |
| | | | | | | | |
Net Increase (Decrease) in Net Assets | | | (39,670,956 | ) | | | 272,325,134 | |
| | |
NET ASSETS | | | | | | | | |
Beginning of Period | | | 3,012,808,357 | | | | 2,740,483,223 | |
| | | | | | | | |
| | |
End of Period | | $ | 2,973,137,401 | | | $ | 3,012,808,357 | |
| | | | | | | | |
Distribution in excess of net investment income | | $ | (1,256,676 | ) | | $ | (673,030 | ) |
See notes to financial statements.
Certified Semi-Annual Report 29
| | |
| NOTES TO FINANCIAL STATEMENTS | | |
| |
Thornburg Limited Term Income Funds | | March 31, 2014 (Unaudited) |
NOTE 1 – ORGANIZATION
Thornburg Limited Term U.S. Government Fund (the “Government Fund”) and Thornburg Limited Term Income Fund (the “Income Fund”), collectively the “Funds,” are diversified series of Thornburg Investment Trust (the “Trust”). The Trust is organized as a Massachusetts business trust under a Declaration of Trust dated June 3, 1987 and is registered as a diversified, open-end management investment company under the Investment Company Act of 1940, as amended. The Funds are currently two of eighteen separate series of the Trust. Each series is considered to be a separate entity for financial reporting and tax purposes and bears expenses directly attributable to it. The Funds’ primary objectives are to obtain as high a level of current income as is consistent, in the view of the Funds’ investment advisor, with the safety of capital. As a secondary objective, the Funds seek to reduce changes in their share prices compared to longer term portfolios.
The Government Fund currently has seven classes of shares of beneficial interest outstanding: Class A, Class B, Class C, Institutional Class (“Class I”), and Retirement Classes (“Class R3,” “Class R4,” and “Class R5”). The Fund no longer offers Class B shares for sale. The Income Fund currently offers six classes of shares of beneficial interest outstanding, Class A, Class C, Institutional Class (“Class I”), and Retirement Classes (“Class R3,” “Class R4,” and “Class R5”). Each class of shares of the Funds represents an interest in the respective portfolio of investments, except that (i) Class A shares are sold subject to a front-end sales charge collected at the time the shares are purchased and bear a service fee, (ii) Class B shares were sold at net asset value without a sales charge at the time of purchase, but are subject to a contingent deferred sales charge upon redemption and bear both a service fee and distribution fee, (iii) Class C shares are sold at net asset value without a sales charge at the time of purchase, but are subject to a contingent deferred sales charge upon redemption within one year of purchase, and bear both a service fee and a distribution fee, (iv) Class I and Class R5 shares are sold at net asset value without a sales charge at the time of purchase and may be subject to a service fee, (v) Class R3 shares are sold at net asset value without a sales charge, but bear both a service fee and a distribution fee, (vi) Class R4 shares are sold at net asset value without sales charge, but bear a service fee, and (vii) the respective classes may have different reinvestment privileges and conversion rights. Additionally, each Fund may allocate among its classes certain expenses, to the extent allocable to specific classes, including transfer agent fees, government registration fees, certain printing and postage costs, and administrative and legal expenses. Currently, class specific expenses of the Funds are limited to distribution and service fees, administration fees, and certain registration and transfer agent expenses. Class B shares of the Government Fund outstanding for eight years will convert to Class A shares of the Government Fund.
NOTE 2 – SIGNIFICANT ACCOUNTING POLICIES
Significant accounting policies of the Trust are as follows:
Valuation Policy and Procedures: The Funds’ Trustees of the Trust (the “Trustees”) have authorized employees of the Funds’ investment advisor, acting as the Valuation and Pricing Committee (the “Committee”), to make certain valuation determinations, subject to oversight and review by the Trustees and the Audit Committee of the Trustees. The Committee and other employees of the Funds’ investment advisor administer and implement the valuation process. The Committee regularly reviews its own fair value decisions, as well as valuations, valuation techniques and services furnished by pricing services, considers circumstances in the markets which may require valuation determinations by the Committee and reviews previous valuation determinations. The Committee also reports on its activities, the performance of the pricing services and other matters to the Trustees and the Audit Committee of the Trustees. In determining a fair value for a portfolio investment, the Committee seeks to determine the price that the Funds would reasonably expect to receive upon a sale of the investment in an orderly transaction between market participants at the measurement date. Typically, the fair value process employs standing instructions to use quoted prices in active markets or the use of independent pricing services. Less frequently, the Committee may make a fair value determination using other methods. However, because fair value prices are estimated prices, the determination of fair value for an investment may differ from the value that would be realized by the Funds upon a sale of the investment, and that difference could be material to the Funds’ financial statements. The Committee’s determination of fair value for an investment may also differ from the prices obtained by other persons (including other mutual funds) for the investment.
Valuation of Investments: Debt obligations held by the Funds have a primary over-the-counter market and are valued by an independent pricing service approved by the Trustees. The pricing service ordinarily values debt obligations at quoted bid prices. When quotations are not available, debt obligations held by the Funds are valued at evaluated prices determined by the pricing service using methods which include consideration of yields or prices of debt obligations of comparable quality, type of issue, coupon, maturity and rating, and indications as to value from dealers and general market conditions. Short-term obligations having remaining maturities of 60 days or less are ordinarily valued at amortized cost, which approximates market value.
In any case when a pricing service fails to provide a price for a debt obligation held by the Funds, the Committee determines a fair value for the debt obligation using procedures in accordance with a policy approved by the Trustees, which may include the use of a price obtained from a different independent pricing service. Additionally, in any case when management believes that a price provided by a pricing service for a debt obligation held by the Funds may be unreliable, the Committee decides whether or not to use the pricing service’s valuation or to use an alternative method to determine a fair value for the debt obligation.
30 Certified Semi-Annual Report
| | |
| NOTES TO FINANCIAL STATEMENTS, CONTINUED | | |
| |
Thornburg Limited Term Income Funds | | March 31, 2014 (Unaudited) |
Valuation Measurements: The Funds categorize their investments based upon the inputs used in valuing those investments, according to a three-level hierarchy established by guidance from the Financial Account Standards Board, (the “FASB”). Categorization of investments using this hierarchy is intended by the FASB to maximize the use of observable valuation inputs and minimize the use of unobservable inputs by prioritizing that the most observable input be used when available. Observable inputs are those that market participants would use in valuing an investment based on available market data. Unobservable inputs are those that reflect the Funds’ assumptions about the information market participants would use in valuing an investment. An investment’s level within the hierarchy is based on the lowest level of any input that is deemed significant to the asset or liability’s fair value measurement. The inputs or methodologies used to value investments are not necessarily indications of the risk or liquidity associated with investing in those investments.
Various inputs are used in determining the fair value measurement of the Funds’ investments. These inputs are summarized according to the three-level hierarchy listed below:
Level 1: Quoted prices in active markets for identical investments.
Level 2: Other direct or indirect significant observable (including quoted prices for similar investments in active markets and other observable inputs, such as interest rates, prepayment rates, credit risk, etc.).
Level 3: Significant unobservable inputs, (including the Funds’ own assumptions in determining the fair value of investments), are generally applicable to investments fair valued with single broker quotes and other investments.
Portfolio investments with minimal, if any, market activity characterized as Level 3 and are valued using significant unobservable inputs, typically including single broker quotes, which may be adjusted or unadjusted, related or comparable investments, last available transactions, and other relevant information. Valuations may also be based upon current market prices of securities that are comparable in coupon, rating, maturity and industry. An income based valuation approach would consider discounted anticipated future cash flows of the investment. Discounts may also be applied due to the nature or duration of any restrictions on the disposition of the investment. The derived value of a Level 3 investment may not represent the value which is received upon disposition.
GOVERNMENT FUND
The following table displays a summary of the fair value hierarchy measurements of the Government Fund’s net investments as of March 31, 2014. In any instance when valuation inputs from more than one level are used to determine the fair value of a specific investment, the investment is placed in the level of the table based upon the lowest level input that is significant in determining the fair value of the investment:
| | | | | | | | | | | | | | | | |
| | | Fair Value Measurements at March 31, 2014 | |
| | | Total | | | Level 1 | | | Level 2 | | | Level 3(a) | |
Assets | | | | | | | | | | | | | | | | |
Investments in Securities | | | | | | | | | | | | | | | | |
U.S. Treasury Securities | | $ | 35,134,022 | | | $ | 35,134,022 | | | $ | — | | | $ | — | |
U.S. Government Agencies | | | 55,181,044 | | | | — | | | | 52,743,079 | | | | 2,437,965 | |
Mortgage Backed | | | 174,296,386 | | | | — | | | | 174,296,386 | | | | — | |
Short Term Investments | | | 14,000,000 | | | | — | | | | 14,000,000 | | | | — | |
| | | | | | | | | | | | | | | | |
Total Investments in Securities | | $ | 278,611,452 | | | $ | 35,134,022 | | | $ | 241,039,465 | | | $ | 2,437,965 | |
| (a) | In accordance with the guidance prescribed in Accounting Standards Update No. 2011-04 (“ASU No. 2011-04”), a portfolio security characterized as a Level 3 investment representing $2,437,965 market value in U.S. Government Agencies was fair valued by the Committee based upon current market prices/yields of comparable securities. |
Certified Semi-Annual Report 31
| | |
| NOTES TO FINANCIAL STATEMENTS, CONTINUED | | |
| |
Thornburg Limited Term Income Funds | | March 31, 2014 (Unaudited) |
In accordance with the guidance prescribed in ASU No. 2011-04, it is the policy of the Fund to recognize transfers between levels and those underlying events which caused the movement. The Fund recognized no transfers between levels for the six months ended March 31, 2014.
A rollforward of fair value measurements using significant unobservable inputs (Level 3) for the six months ended March 31, 2014 is as follows:
| | | | | | | | |
| | | U.S. & Other
Government | | | Total(d) | |
Beginning Balance 9/30/2013 | | $ | 2,604,074 | | | $ | 2,604,074 | |
Accrued Discounts (Premiums) | | | 1,585 | | | | 1,585 | |
Net Realized Gain (Loss)(a) | | | 979 | | | | 979 | |
Gross Purchases | | | — | | | | — | |
Gross Sales | | | (83,995 | ) | | | (83,995 | ) |
Net Change in Unrealized | | | | | | | | |
Appreciation (Depreciation)(b) | | | (84,678 | ) | | | (84,678 | ) |
Transfers into Level 3(c) | | | — | | | | — | |
Transfers out of Level 3(c) | | | — | | | | — | |
| | | | | | | | |
Ending Balance 3/31/2014 | | $ | 2,437,965 | | | $ | 2,437,965 | |
| (a) | Amount of Net Realized Gain (Loss) recognized in the net increase in net assets resulting from operations is included in the Fund’s Statement of Operations for the six months ended March 31, 2014. |
| (b) | Amount of Net Change in Unrealized Appreciation (Depreciation) recognized in the net increase in net assets resulting from operations is included in the Fund’s Statement of Operations for the six months ended March 31, 2014. |
| (c) | Transfers into or out of Level 3 were out of or into Level 2, and were due to changes in other significant observable inputs available during the six months ended March 31, 2014. Transfers into or out of Level 3 are based on the beginning market value of the period in which they occurred. |
| (d) | Level 3 investments represent 0.84% of total Net Assets at the six months ended March 31, 2014. Significant fluctuations of the unobservable inputs applied to portfolio investments characterized as Level 3 could be expected to increase or decrease the fair value of these portfolio investments. |
INCOME FUND
The following table displays a summary of the fair value hierarchy measurements of the Income Fund’s net investments as of March 31, 2014. In any instance when valuation inputs from more than one level are used to determine the fair value of a specific investment, the investment is placed in the level of the table based upon the lowest level input that is significant in determining the fair value of the investment:
| | | | | | | | | | | | | | | | |
| | | Fair Value Measurements At March 31, 2014 | |
| | | Total | | | Level 1 | | | Level 2 | | | Level 3(a) | |
Assets | | | | | | | | | | | | | | | | |
Investments in Securities | | | | | | | | | | | | | | | | |
U.S. Treasury Securities | | $ | 36,700,461 | | | $ | 36,700,461 | | | $ | — | | | $ | — | |
U.S. Government Agencies | | | 283,290,163 | | | | — | | | | 277,770,361 | | | | 5,519,802 | |
Other Government | | | 95,560,269 | | | | — | | | | 81,527,311 | | | | 14,032,958 | |
Mortgage Backed | | | 219,539,321 | | | | — | | | | 219,539,321 | | | | — | |
Asset Backed Securities | | | 470,059,254 | | | | — | | | | 442,941,832 | | | | 27,117,422 | |
Corporate Bonds | | | 1,375,858,215 | | | | — | | | | 1,370,462,493 | | | | 5,395,722 | |
Convertible Bonds | | | 19,251,750 | | | | — | | | | 19,251,750 | | | | — | |
Municipal Bonds | | | 160,165,924 | | | | — | | | | 160,165,924 | | | | — | |
Other Securities | | | 19,845,000 | | | | — | | | | 19,845,000 | | | | — | |
Short Term Investments | | | 242,486,540 | | | | — | | | | 242,486,540 | | | | — | |
| | | | | | | | | | | | | | | | |
Total Investments in Securities | | $ | 2,922,756,897 | | | $ | 36,700,461 | | | $ | 2,833,990,532 | | | $ | 52,065,904 | |
| (a) | In accordance with the guidance prescribed in Accounting Standards Update No. 2011-04 (“ASU No. 2011-04”), unadjusted broker quotes were applied to portfolio securities characterized as Level 3 investments at March 31, 2014. Portfolio securities characterized as Level 3 investments representing $5,519,802 market value in U.S. Government Agencies were fair valued by the Committee based upon current market prices/yields of comparable securities. |
32 Certified Semi-Annual Report
| | |
| NOTES TO FINANCIAL STATEMENTS, CONTINUED | | |
| |
Thornburg Limited Term Income Funds | | March 31, 2014 (Unaudited) |
In accordance with the guidance prescribed in ASU No. 2011-04, it is the policy of the Fund to recognize transfers between levels and those underlying events which caused the movement. The Fund recognized no transfers between Levels 1 and 2 for the six months ended March 31, 2014.
A rollforward of fair value measurements using significant unobservable inputs (Level 3) for the six months ended March 31, 2014 is as follows:
| | | | | | | | | | | | | | | | |
| | | Asset Backed
Securities | | | Corporate Bonds | | | U.S. & Other
Government | | | Total(d) | |
Beginning Balance 9/30/2013 | | $ | 17,301,500 | | | $ | 7,169,575 | | | $ | 46,112,272 | | | $ | 70,583,347 | |
Accrued Discounts (Premiums) | | | 11,969 | | | | 6,477 | | | | (16,656 | ) | | | 1,790 | |
Net Realized Gain (Loss)(a) | | | 36,608 | | | | 24,676 | | | | 1,000 | | | | 62,284 | |
Gross Purchases | | | 9,899,999 | | | | — | | | | — | | | | 9,899,999 | |
Gross Sales | | | (360,250 | ) | | | (1,735,048 | ) | | | (640,997 | ) | | | (2,736,295 | ) |
Net Change in Unrealized Appreciation (Depreciation)(b) | | | 227,596 | | | | (69,958 | ) | | | (99,495 | ) | | | 58,143 | |
Transfers into Level 3(c) | | | — | | | | — | | | | — | | | | — | |
Transfers out of Level 3(c) | | | — | | | | — | | | | (25,803,364 | ) | | | (25,803,364 | ) |
| | | | | | | | | | | | | | | | |
Ending Balance 3/31/2014 | | $ | 27,117,422 | | | $ | 5,395,722 | | | $ | 19,552,760 | | | $ | 52,065,904 | |
| (a) | Amount of Net Realized Gain (Loss) recognized in the net increase in net assets resulting from operations is included in the Fund’s Statement of Operations for the six months ended March 31, 2014. |
| (b) | Amount of Net Change in Unrealized Appreciation (Depreciation) recognized in the net increase in net assets resulting from operations is included in the Fund’s Statement of Operations for the six months ended March 31, 2014. |
| (c) | Transfers into or out of Level 3 were out of or into Level 2, and were due to changes in other significant observable inputs available during the six months ended March 31, 2014. Transfers into or out of Level 3 are based on the beginning market value of the period in which they occurred. |
| (d) | Level 3 investments represent 1.75% of total Net Assets at the six months ended March 31, 2014. Significant fluctuations of the unobservable inputs applied to portfolio investments characterized as Level 3 could be expected to increase or decrease the fair value of these portfolio investments. |
Federal Income Taxes: It is the policy of the Trust to comply with the provisions of the Internal Revenue Code applicable to “regulated investment companies” and to distribute to shareholders substantially all taxable income, including any net realized gain on investments of the Funds. Therefore, no provision for federal income taxes is required.
Management reviews each uncertain tax position believed to be material to the preparation of each Fund’s financial statements, to assess if it is more likely than not that the position would be sustained upon examination, based upon the technical merits of the position. As of March 31, 2014, management has not identified any such position for which an asset or liability must be reflected in the Statement of Assets and Liabilities. The Funds’ tax returns remain subject to examination for three years after filing.
When-Issued and Delayed Delivery Transactions: The Funds may engage in when-issued or delayed delivery transactions. To the extent a Fund engages in such transactions, it will do so for the purpose of acquiring portfolio securities consistent with the Fund’s investment objectives and not for the purpose of investment leverage or to speculate on interest rate and/or market changes. At the time a Fund makes a commitment to purchase a security on a when-issued or delayed delivery basis, the Fund will record the transaction and reflect the value in determining the Fund’s net asset value. When effecting such transactions, assets of an amount sufficient to make payment for the portfolio securities to be purchased will be segregated on the Fund’s records at the trade date. Securities purchased on a when-issued or delayed delivery basis do not earn interest until the settlement date.
Dividends: Net investment income of the Funds is declared daily as a dividend on shares for which the Funds have received payment. Dividends are paid monthly and are reinvested in additional shares of the Funds at net asset value per share at the close of business on the dividend payment date, or at the shareholder’s option, paid in cash. Net realized capital gains, to the extent available, will be distributed at least annually.
Repurchase Agreements: The Funds may invest excess cash in repurchase agreements whereby the Funds purchase investments, which serve as collateral, with an agreement to resell such collateral to the seller at an agreed upon price at the maturity date of the repurchase agreement. Investments pledged as collateral for repurchase agreements are held in custody until maturity of the repurchase agreement. Provisions in the agreements require that the market value of the collateral is at least equal to the repurchase value in the event of default. In the event of default, the Funds have the right to liquidate the collateral and apply the proceeds in satisfaction of the obligation. Under certain circumstances, in the event of default or bankruptcy by the other party to the agreement, realization and/ or retention of the collateral may be subject to legal proceedings.
Certified Semi-Annual Report 33
| | |
| NOTES TO FINANCIAL STATEMENTS, CONTINUED | | |
| |
Thornburg Limited Term Income Funds | | March 31, 2014 (Unaudited) |
General: Investment transactions are accounted for on a trade date basis. Interest income is accrued as earned. Premiums and discounts on securities purchased are amortized over the life of the respective securities. Realized gains and losses from the sale of securities are recorded on an identified cost basis. The Funds invest in various mortgage-backed securities. Such securities pay interest and a portion of principal each month, which is then available for investment in securities at prevailing prices. Paydown gains and losses on these securities are included in interest income. Net investment income (other than class specific expenses) and realized and unrealized gains and losses are allocated daily to each class of shares based upon the relative net asset value of outstanding shares (or the value of the dividend-eligible shares, as appropriate) of each class of shares at the beginning of the day (after adjusting for the current share activity of the respective class). Expenses common to all Funds are allocated among the Funds comprising the Trust based upon their relative net asset values or other appropriate allocation methods.
Foreign Currency Translation: With respect to the Income Fund, portfolio securities and other assets and liabilities denominated in foreign currencies are translated into U.S. dollars based on the rate of exchange of such currencies against U.S. dollars on the date of valuation. Purchases and sales of portfolio securities and interest denominated in foreign currencies are translated into U.S. dollar amounts on the respective dates of such transactions. Such spot contracts are included in receivable for investments sold and payable for investments purchased on the Statement of Assets and Liabilities.
The Income Fund does not isolate that portion of the results of operations resulting from changes in foreign exchange rates on investments from the fluctuations arising from changes in market prices of securities held. Such fluctuations are included with the net realized and unrealized gain or loss from investments.
Reported net realized foreign exchange gains or losses arise from sales of foreign currencies, currency gains or losses realized between the trade and settlement dates on securities transactions, and the difference between the amount of interest recorded on the Income Fund’s books and the U.S. dollar equivalent of the amounts actually received or paid.
Guarantees and Indemnifications: Under the Trust’s organizational documents, its officers and Trustees are indemnified against certain liabilities arising out of the performance of their duties to the Funds. Additionally, in the normal course of business the Trust enters into contracts with service providers that contain general indemnification clauses. The Trust’s maximum exposure under these arrangements is unknown. However, based on experience, the Trust expects the risk of loss to be remote.
Use of Estimates: The preparation of financial statements, in conformity with United States generally accepted accounting principles, requires management to make estimates and assumptions that affect the reported amounts of assets and liabilities and the disclosure of contingent assets and liabilities at the date of the financial statements and the reported amounts of increases and decreases in net assets from operations during the reporting period. Actual amounts could differ from those estimates.
NOTE 3 – INVESTMENT ADVISORY FEE AND OTHER TRANSACTIONS WITH AFFILIATES
Pursuant to an investment advisory agreement, Thornburg Investment Management, Inc. (the “Advisor”) serves as the investment advisor and performs services for the Funds for which the fees are payable at the end of each month. For the six months ended March 31, 2014, these fees were payable at annual rates ranging from .375 of 1% to .275 of 1% per annum of the average daily net assets of the Government Fund and .50 of 1% to .275 of 1% per annum of the average daily net assets of the Income Fund depending on each Fund’s asset size. The Trust also has entered into administrative services agreements with the Advisor, whereby the Advisor will perform certain administrative services for the shareholders of each class of each Fund’s shares, and for which fees will be payable at an annual rate of up to .125 of 1% per annum of the average daily net assets attributable to Class A, Class B, Class C, Class R3, and Class R4 shares, and up to .05 of 1% per annum of the average daily net assets attributable to Class I and Class R5 shares.
The Trust has an underwriting agreement with Thornburg Securities Corporation (the “Distributor,” an affiliate of the Advisor), which acts as the distributor of each Fund’s shares. For the six months ended March 31, 2014, the Distributor has advised the Funds that they earned net commissions aggregating $4 from the sale of Class A shares of the Government Fund and refunded $815 from the sale of Class A shares of the Income Fund, and collected contingent deferred sales charges aggregating $1,886 and $27,468 from redemptions of Class C shares of the Government Fund and Income Fund, respectively.
Pursuant to a service plan under Rule 12b-1 of the Investment Company Act of 1940, the Funds may reimburse to the Advisor an amount not to exceed .25 of 1% per annum of the average daily net assets attributable to the applicable Class A, Class B, Class C, Class I, Class R3 and Class R4 shares of the Funds for payments made by the Advisor to securities dealers and other financial institutions to obtain various shareholder and distribution related services. For the six months ended March 31, 2014, there were no 12b-1 service plan fees charged for Class I shares. The Advisor may pay out of its own resources additional expenses for distribution of each Fund’s shares.
The Trust has also adopted distribution plans pursuant to Rule 12b-1, applicable to each Fund’s Class C and Class R3 shares, and also applicable to Government Fund’s Class B shares, under which the Funds compensate the Distributor for services in promoting the sale of Class B, C, and R3 shares of the Funds at an annual rate of up to .75 of 1% per annum of the average daily net assets attributable to
34 Certified Semi-Annual Report
| | |
| NOTES TO FINANCIAL STATEMENTS, CONTINUED | | |
| |
Thornburg Limited Term Income Funds | | March 31, 2014 (Unaudited) |
Class B shares, and an annual rate of up to .25 of 1% per annum of the average daily net assets attributable to Class C and Class R3. Total fees incurred by each class of shares of the Funds under their respective service and distribution plans for the six months ended March 31, 2014, are set forth in the Statements of Operations.
The Advisor and Distributor have contractually agreed to waive fees and reimburse expenses incurred by the Fund so that actual expenses of certain share classes do not exceed specified levels. The agreement may be terminated by the Fund at any time, but may not be terminated by the Advisor or Distributor before February 1, 2015, unless the Advisor ceases to be the investment advisor to the Fund or the Distributor ceases to be the distributor of the Fund prior to that date. The Advisor and Distributor retain the right to be repaid by the Fund for fee waivers and expense reimbursements if expenses fall below the contractual limit prior to the end of the fiscal year.
For the six months ended March 31, 2014, the Advisor contractually reimbursed certain class specific expenses and administrative fees of $18,078 for the Class A shares, $6,498 for the Class B shares, $23,597 for the Class R3 shares, $2,026 for the Class R4 shares, and $11,013 for the Class R5 shares of the Government Fund and $65,582 for the Class R3 shares, $2,056 for the Class R4 shares, and $3,463 for the Class R5 shares of the Income Fund.
The Trust has an agreement with the custodian bank to indirectly pay a portion of the custodian’s fees through credits earned by each Fund’s cash on deposit with the bank. This deposit agreement is an alternative to overnight investments. Custodial fees are adjusted to reflect amounts that would have been paid without this agreement, with a corresponding adjustment reflected as fees paid indirectly in the Statements of Operations. For the six months ended March 31, 2014, fees paid indirectly were $1,130 for the Government Fund and $1,954 for the Income Fund.
Certain officers and Trustees of the Trust are also officers or directors of the Advisor and Distributor. The compensation of independent Trustees is borne by the Trust.
NOTE 4 – SHARES OF BENEFICIAL INTEREST
At March 31, 2014, there were an unlimited number of shares of beneficial interest authorized. Transactions in shares of beneficial interest were as follows:
GOVERNMENT FUND
| | | | | | | | | | | | | | | | |
| | | Six Months Ended
March 31, 2014 (Unaudited) | | | Year Ended
September 30, 2013 (Audited) | |
| | | Shares | | | Amount | | | Shares | | | Amount | |
Class A Shares | | | | | | | | | | | | | | | | |
Shares sold | | | 1,146,261 | | | $ | 15,296,262 | | | | 3,744,649 | | | $ | 51,296,981 | |
Shares issued to shareholders in reinvestment of dividends | | | 74,120 | | | | 987,728 | | | | 262,627 | | | | 3,580,624 | |
Shares repurchased | | | (2,150,641 | ) | | | (28,664,829 | ) | | | (7,590,101 | ) | | | (103,276,364 | ) |
| | | | | | | | | | | | | | | | |
| | | | |
Net increase (decrease) | | | (930,260 | ) | | $ | (12,380,839 | ) | | | (3,582,825 | ) | | $ | (48,398,759 | ) |
| | | | | | | | | | | | | | | | |
| | | | |
Class B Shares | | | | | | | | | | | | | | | | |
Shares sold | | | 18,097 | | | $ | 240,366 | | | | 30,862 | | | $ | 424,973 | |
Shares issued to shareholders in reinvestment of dividends | | | 162 | | | | 2,146 | | | | 1,752 | | | | 23,978 | |
Shares repurchased | | | (35,613 | ) | | | (473,684 | ) | | | (178,491 | ) | | | (2,431,905 | ) |
| | | | | | | | | | | | | | | | |
| | | | |
Net increase (decrease) | | | (17,354 | ) | | $ | (231,172 | ) | | | (145,877 | ) | | $ | (1,982,954 | ) |
| | | | | | | | | | | | | | | | |
| | | | |
Class C Shares | | | | | | | | | | | | | | | | |
Shares sold | | | 209,613 | | | $ | 2,813,383 | | | | 1,186,290 | | | $ | 16,337,002 | |
Shares issued to shareholders in reinvestment of dividends | | | 32,487 | | | | 435,555 | | | | 114,069 | | | | 1,565,457 | |
Shares repurchased | | | (1,294,503 | ) | | | (17,368,220 | ) | | | (3,178,713 | ) | | | (43,456,806 | ) |
| | | | | | | | | | | | | | | | |
| | | | |
Net increase (decrease) | | | (1,052,403 | ) | | $ | (14,119,282 | ) | | | (1,878,354 | ) | | $ | (25,554,347 | ) |
| | | | | | | | | | | | | | | | |
Certified Semi-Annual Report 35
| | |
| NOTES TO FINANCIAL STATEMENTS, CONTINUED | | |
| |
Thornburg Limited Term Income Funds | | March 31, 2014 (Unaudited) |
GOVERNMENT FUND (CONTINUED)
| | | | | | | | | | | | | | | | |
| | | Six Months Ended
March 31, 2014 (Unaudited) | | | Year Ended
September 30, 2013 (Audited) | |
| | | Shares | | | Amount | | | Shares | | | Amount | |
Class I Shares | | | | | | | | | | | | | | | | |
Shares sold | | | 853,887 | | | $ | 11,385,027 | | | | 2,977,369 | | | $ | 40,549,972 | |
Shares issued to shareholders in reinvestment of dividends | | | 46,822 | | | | 623,976 | | | | 138,069 | | | | 1,880,884 | |
Shares repurchased | | | (1,355,553 | ) | | | (18,073,115 | ) | | | (4,685,090 | ) | | | (63,604,901 | ) |
| | | | | | | | | | | | | | | | |
| | | | |
Net increase (decrease) | | | (454,844 | ) | | $ | (6,064,112 | ) | | | (1,569,652 | ) | | $ | (21,174,045 | ) |
| | | | | | | | | | | | | | | | |
| | | | |
Class R3 Shares | | | | | | | | | | | | | | | | |
Shares sold | | | 192,790 | | | $ | 2,573,396 | | | | 547,714 | | | $ | 7,478,100 | |
Shares issued to shareholders in reinvestment of dividends | | | 9,262 | | | | 123,513 | | | | 24,107 | | | | 328,636 | |
Shares repurchased | | | (217,565 | ) | | | (2,904,272 | ) | | | (540,789 | ) | | | (7,360,533 | ) |
| | | | | | | | | | | | | | | | |
| | | | |
Net increase (decrease) | | | (15,513 | ) | | $ | (207,363 | ) | | | 31,032 | | | $ | 446,203 | |
| | | | | | | | | | | | | | | | |
| | | | |
Class R4 Shares* | | | | | | | | | | | | | | | | |
Shares sold | | | 1,141 | | | $ | 15,250 | | | | — | | | $ | — | |
Shares issued to shareholders in reinvestment of dividends | | | 5 | | | | 63 | | | | — | | | | — | |
Shares repurchased | | | — | | | | — | | | | — | | | | — | |
| | | | | | | | | | | | | | | | |
| | | | |
Net increase (decrease) | | | 1,146 | | | $ | 15,313 | | | | — | | | $ | — | |
| | | | | | | | | | | | | | | | |
| | | | |
Class R5 Shares | | | | | | | | | | | | | | | | |
Shares sold | | | 2,521 | | | $ | 33,558 | | | | 58,893 | | | $ | 787,254 | |
Shares issued to shareholders in reinvestment of dividends | | | 682 | | | | 9,088 | | | | 576 | | | | 7,824 | |
Shares repurchased | | | (2,945 | ) | | | (39,322 | ) | | | (15,074 | ) | | | (205,306 | ) |
| | | | | | | | | | | | | | | | |
| | | | |
Net increase (decrease) | | | 258 | | | $ | 3,324 | | | | 44,395 | | | $ | 589,772 | |
| | | | | | | | | | | | | | | | |
| * | Effective date for this share Class was February 1, 2014. |
INCOME FUND
| | | | | | | | | | | | | | | | |
| | | Six Months Ended
March 31, 2014 (Unaudited) | | | Year Ended
September 30, 2013 (Audited) | |
| | | Shares | | | Amount | | | Shares | | | Amount | |
Class A Shares | | | | | | | | | | | | | | | | |
Shares sold | | | 9,224,733 | | | $ | 123,610,367 | | | | 37,040,545 | | | $ | 506,158,188 | |
Shares issued to shareholders in reinvestment of dividends | | | 1,297,472 | | | | 17,363,233 | | | | 2,050,915 | | | | 27,969,306 | |
Shares repurchased | | | (18,552,535 | ) | | | (248,241,992 | ) | | | (38,779,444 | ) | | | (527,480,530 | ) |
| | | | | | | | | | | | | | | | |
| | | | |
Net increase (decrease) | | | (8,030,330 | ) | | $ | (107,268,392 | ) | | | 312,016 | | | $ | 6,646,964 | |
| | | | | | | | | | | | | | | | |
| | | | |
Class C Shares | | | | | | | | | | | | | | | | |
Shares sold | | | 3,649,011 | | | $ | 48,802,236 | | | | 15,246,681 | | | $ | 208,208,645 | |
Shares issued to shareholders in reinvestment of dividends | | | 746,239 | | | | 9,971,285 | | | | 1,069,512 | | | | 14,558,205 | |
Shares repurchased | | | (7,349,705 | ) | | | (98,265,320 | ) | | | (13,169,974 | ) | | | (178,644,675 | ) |
| | | | | | | | | | | | | | | | |
| | | | |
Net increase (decrease) | | | (2,954,455 | ) | | $ | (39,491,799 | ) | | | 3,146,219 | | | $ | 44,122,175 | |
| | | | | | | | | | | | | | | | |
36 Certified Semi-Annual Report
| | |
| NOTES TO FINANCIAL STATEMENTS, CONTINUED | | |
| |
Thornburg Limited Term Income Funds | | March 31, 2014 (Unaudited) |
INCOME FUND (CONTINUED)
| | | | | | | | | | | | | | | | |
| | | Six Months Ended
March 31, 2014 (Unaudited) | | | Year Ended
September 30, 2013 (Audited) | |
| | | Shares | | | Amount | | | Shares | | | Amount | |
Class I Shares | | | | | | | | | | | | | | | | |
Shares sold | | | 25,023,793 | | | $ | 335,343,614 | | | | 54,510,358 | | | $ | 743,141,237 | |
Shares issued to shareholders in reinvestment of dividends | | | 1,770,006 | | | | 23,694,611 | | | | 2,278,660 | | | | 31,052,491 | |
Shares repurchased | | | (21,020,247 | ) | | | (281,663,636 | ) | | | (36,614,391 | ) | | | (497,468,876 | ) |
| | | | | | | | | | | | | | | | |
| | | | |
Net increase (decrease) | | | 5,773,552 | | | $ | 77,374,589 | | | | 20,174,627 | | | $ | 276,724,852 | |
| | | | | | | | | | | | | | | | |
| | | | |
Class R3 Shares | | | | | | | | | | | | | | | | |
Shares sold | | | 3,410,615 | | | $ | 45,745,110 | | | | 3,482,197 | | | $ | 47,470,330 | |
Shares issued to shareholders in reinvestment of dividends | | | 131,685 | | | | 1,763,720 | | | | 155,223 | | | | 2,117,877 | |
Shares repurchased | | | (1,609,261 | ) | | | (21,576,430 | ) | | | (2,903,508 | ) | | | (39,515,639 | ) |
| | | | | | | | | | | | | | | | |
| | | | |
Net increase (decrease) | | | 1,933,039 | | | $ | 25,932,400 | | | | 733,912 | | | $ | 10,072,568 | |
| | | | | | | | | | | | | | | | |
| | | | |
Class R4 Shares* | | | | | | | | | | | | | | | | |
Shares sold | | | 1,136 | | | $ | 15,250 | | | | — | | | $ | — | |
Shares issued to shareholders in reinvestment of dividends | | | 4 | | | | 55 | | | | — | | | | — | |
Shares repurchased | | | — | | | | — | | | | — | | | | — | |
| | | | | | | | | | | | | | | | |
| | | | |
Net increase (decrease) | | | 1,140 | | | $ | 15,305 | | | | — | | | $ | — | |
| | | | | | | | | | | | | | | | |
| | | | |
Class R5 Shares | | | | | | | | | | | | | | | | |
Shares sold | | | 495,529 | | | $ | 6,606,676 | | | | 594,497 | | | $ | 8,102,764 | |
Shares issued to shareholders in reinvestment of dividends | | | 14,326 | | | | 191,814 | | | | 9,774 | | | | 132,548 | |
Shares repurchased | | | (212,747 | ) | | | (2,855,569 | ) | | | (92,096 | ) | | | (1,240,715 | ) |
| | | | | | | | | | | | | | | | |
| | | | |
Net increase (decrease) | | | 297,108 | | | $ | 3,942,921 | | | | 512,175 | | | $ | 6,994,597 | |
| | | | | | | | | | | | | | | | |
| * | Effective date for this share Class was February 1, 2014. |
NOTE 5 – INVESTMENT TRANSACTIONS
For the six months ended March 31, 2014, the Government Fund had purchase and sale transactions of investments (excluding short-term investments) of $11,111,611 and $25,336,782, respectively, while the Income Fund had purchase and sale transactions of investments (excluding short-term investments and U.S. Government obligations) of $420,419,700 and $584,875,240, respectively.
Certified Semi-Annual Report 37
| | |
| NOTES TO FINANCIAL STATEMENTS, CONTINUED | | |
| |
Thornburg Limited Term Income Funds | | March 31, 2014 (Unaudited) |
NOTE 6 – INCOME TAXES
At March 31, 2014, information on the tax components of capital was as follows:
| | | | | | | | |
| | | Government
Fund | | | Income
Fund | |
Cost of investments for tax purposes | | $ | 276,435,112 | | | $ | 2,896,171,652 | |
| | | | | | | | |
Gross unrealized appreciation on a tax basis | | $ | 5,579,464 | | | $ | 55,768,115 | |
Gross unrealized depreciation on a tax basis | | | (3,403,124 | ) | | | (29,182,870 | ) |
| | | | | | | | |
Net unrealized appreciation (depreciation) on investments (tax basis) | | $ | 2,176,340 | | | $ | 26,585,245 | |
| | | | | | | | |
At March 31, 2014, the U.S. Government Fund had deferred tax basis capital losses occurring subsequent to October 31, 2012 of $2,175,318. For tax purposes, such losses will be reflected in the year ending September 30, 2014.
At March 31, 2014, the U.S. Government Fund had cumulative tax basis capital losses of $3,343,873, (of which $1,911,949 is short-term and $1,431,924 is long-term) generated after September 30, 2011, which may be carried forward to offset future capital gains. To the extent such carryforwards are used, capital gain distributions may be reduced to the extent provided by regulations. Such capital loss carryforwards do not expire but are required to be utilized to offset future gains prior to the utilization of losses that occured in years prior to October 1, 2011, which may expire prior to utilization.
Capital loss carryforwards that occurred prior to October 1, 2011, expire as follows:
| | | | |
2018 | | $ | 17,316 | |
2019 | | | 106,151 | |
| | | | |
| | $ | 123,467 | |
| | | | |
OTHER NOTES
Risks: Each Fund’s investments subject it to risks including, but not limited to, credit risk, interest rate risk, prepayment risk, management risk, market and economic risk, liquidity risk and, in the case of Income Fund, the risks associated with investments in non-U.S. issuers. Please see the Funds’ prospectus for a discussion of the risks associated with an investment in the Funds.
Subsequent Events: Fund management believes no events have occurred between March 31, 2014 and the date of issuance of the financial statements that require adjustment to or disclosure in the accompanying financial statements.
38 Certified Semi-Annual Report
This page intentionally left blank.
Certified Semi-Annual Report 39
Financial Highlights
Thornburg Limited Term U.S. Government Fund
| | | | | | | | | | | | | | | | | | | | | | | | | | | | | | | | | | | | | | | | | | | | | | | | |
| | | PER SHARE PERFORMANCE (for a share outstanding throughout the
Period)+ | | RATIOS TO AVERAGE NET ASSETS | | | SUPPLEMENTAL DATA | |
Unless
Otherwise
Noted,
Periods
are
Fiscal
Years
Ended
Sept. 30, | | Net Asset
Value
Beginning
of Period | | | Net
Investment
Income
(Loss) | | Net
Realized
&
Unrealized
Gain(Loss)
on
Investments | | | Total from
Investment
Operations | | Dividends
from Net
Investment
Income | | | Dividends
from Net
Realized
Gains | | Total
Dividends | | | Net
Asset
Value
End
of
Period | | Net
Investment
Income
(Loss)
(%) | | | Expenses,
After
Expense
Reductions
(%) | | | Expenses,
After
Expense
Reductions
and
Net of
Custody
Credits
(%) | | | Expenses,
Before
Expense
Reductions
(%) | | | Total
Return
(%)(a) | | Portfolio
Turnover
Rate
(%)(a) | | Net
Assets
at End
of
Period
(Thousands) | |
Class A Shares | | | | | | | | | | | | | | | | | | | | | | | | | | | | | | | | | | | | | | | | | | |
2014(b)(c) | | $ | 13.36 | | | 0.09 | | | (0.04 | ) | | 0.05 | | | (0.12 | ) | | — | | | (0.12 | ) | | $13.29 | | | 1.31 | (d) | | | 0.93 | (d) | | | 0.93 | (d) | | | 0.95 | (d) | | 0.39 | | 3.91 | | $ | 145,946 | |
2013(b) | | $ | 13.86 | | | 0.20 | | | (0.39 | ) | | (0.19) | | | (0.31 | ) | | — | | | (0.31 | ) | | $13.36 | | | 1.45 | | | | 0.89 | | | | 0.89 | | | | 0.89 | | | (1.38) | | 12.18 | | $ | 159,225 | |
2012(b) | | $ | 13.90 | | | 0.25 | | | 0.06 | | | 0.31 | | | (0.35 | ) | | — | | | (0.35 | ) | | $13.86 | | | 1.79 | | | | 0.89 | | | | 0.89 | | | | 0.89 | | | 2.29 | | 9.89 | | $ | 214,749 | |
2011(b) | | $ | 13.94 | | | 0.33 | | | 0.03 | | | 0.36 | | | (0.40 | ) | | — | | | (0.40 | ) | | $13.90 | | | 2.42 | | | | 0.90 | | | | 0.89 | | | | 0.90 | | | 2.66 | | 14.62 | | $ | 202,910 | |
2010(b) | | $ | 13.78 | | | 0.39 | | | 0.80 | | | 1.19 | | | (0.41 | ) | | (0.62) | | | (1.03 | ) | | $13.94 | | | 2.81 | | | | 0.93 | | | | 0.92 | | | | 0.93 | | | 4.69 | | 16.01 | | $ | 189,465 | |
2009(b) | | $ | 13.26 | | | 0.41 | | | 0.54 | | | 0.95 | | | (0.43 | ) | | — | | | (0.43 | ) | | $13.78 | | | 3.04 | | | | 0.94 | | | | 0.93 | | | | 0.94 | | | 7.21 | | 39.42 | | $ | 142,872 | |
Class B Shares | | | | | | | | | | | | | | | | | | | | | | | | | | | | | | | | | | | | | | | | | | |
2014(c) | | $ | 13.33 | | | (0.01) | | | (0.03 | ) | | (0.04) | | | (0.03 | ) | | — | | | (0.03 | ) | | $13.26 | | | (0.09 | )(d) | | | 2.32 | (d) | | | 2.32 | (d) | | | 3.46 | (d) | | (0.31) | | 3.91 | | $ | 1,146 | |
2013 | | $ | 13.83 | | | 0.01 | | | (0.39 | ) | | (0.38) | | | (0.12 | ) | | — | | | (0.12 | ) | | $13.33 | | | 0.07 | | | | 2.29 | | | | 2.29 | | | | 2.57 | | | (2.75) | | 12.18 | | $ | 1,384 | |
2012 | | $ | 13.87 | | | 0.06 | | | 0.06 | | | 0.12 | | | (0.16 | ) | | — | | | (0.16 | ) | | $13.83 | | | 0.42 | | | | 2.26 | | | | 2.25 | | | | 2.26 | | | 0.90 | | 9.89 | | $ | 3,452 | |
2011 | | $ | 13.91 | | | 0.16 | | | 0.02 | | | 0.18 | | | (0.22 | ) | | — | | | (0.22 | ) | | $13.87 | | | 1.13 | | | | 2.20 | | | | 2.19 | | | | 2.20 | | | 1.33 | | 14.62 | | $ | 4,368 | |
2010 | | $ | 13.75 | | | 0.23 | | | 0.80 | | | 1.03 | | | (0.25 | ) | | (0.62) | | | (0.87 | ) | | $13.91 | | | 1.65 | | | | 2.11 | | | | 2.11 | | | | 2.11 | | | 3.46 | | 16.01 | | $ | 5,215 | |
2009 | | $ | 13.23 | | | 0.27 | | | 0.53 | | | 0.80 | | | (0.28 | ) | | — | | | (0.28 | ) | | $13.75 | | | 1.96 | | | | 2.01 | | | | 2.01 | | | | 2.04 | | | 6.08 | | 39.42 | | $ | 5,950 | |
Class C Shares | | | | | | | | | | | | | | | | | | | | | | | | | | | | | | | | | | | | | | | | | | |
2014(c) | | $ | 13.45 | | | 0.07 | | | (0.05 | ) | | 0.02 | | | (0.10 | ) | | — | | | (0.10 | ) | | $13.37 | | | 1.04 | (d) | | | 1.19 | (d) | | | 1.19 | (d) | | | 1.19 | (d) | | 0.18 | | 3.91 | | $ | 59,383 | |
2013 | | $ | 13.94 | | | 0.16 | | | (0.37 | ) | | (0.21) | | | (0.28 | ) | | — | | | (0.28 | ) | | $13.45 | | | 1.17 | | | | 1.17 | | | | 1.17 | | | | 1.17 | | | (1.56) | | 12.18 | | $ | 73,877 | |
2012 | | $ | 13.98 | | | 0.21 | | | 0.07 | | | 0.28 | | | (0.32 | ) | | — | | | (0.32 | ) | | $13.94 | | | 1.51 | | | | 1.17 | | | | 1.17 | | | | 1.17 | | | 2.01 | | 9.89 | | $ | 102,790 | |
2011 | | $ | 14.03 | | | 0.30 | | | 0.02 | | | 0.32 | | | (0.37 | ) | | — | | | (0.37 | ) | | $13.98 | | | 2.15 | | | | 1.17 | | | | 1.16 | | | | 1.17 | | | 2.31 | | 14.62 | | $ | 100,212 | |
2010 | | $ | 13.87 | | | 0.35 | | | 0.81 | | | 1.16 | | | (0.38 | ) | | (0.62) | | | (1.00 | ) | | $14.03 | | | 2.53 | | | | 1.21 | | | | 1.20 | | | | 1.71 | | | 4.39 | | 16.01 | | $ | 99,430 | |
2009 | | $ | 13.34 | | | 0.37 | | | 0.55 | | | 0.92 | | | (0.39 | ) | | — | | | (0.39 | ) | | $13.87 | | | 2.74 | | | | 1.22 | | | | 1.21 | | | | 1.72 | | | 6.97 | | 39.42 | | $ | 80,039 | |
Class I Shares | | | | | | | | | | | | | | | | | | | | | | | | | | | | | | | | | | | | | | | | | | |
2014(c) | | $ | 13.36 | | | 0.11 | | | (0.04 | ) | | 0.07 | | | (0.14 | ) | | — | | | (0.14 | ) | | $13.29 | | | 1.66 | (d) | | | 0.58 | (d) | | | 0.58 | (d) | | | 0.58 | (d) | | 0.56 | | 3.91 | | $ | 67,179 | |
2013 | | $ | 13.86 | | | 0.24 | | | (0.38 | ) | | (0.14) | | | (0.36 | ) | | — | | | (0.36 | ) | | $13.36 | | | 1.78 | | | | 0.56 | | | | 0.56 | | | | 0.56 | | | (1.05) | | 12.18 | | $ | 73,645 | |
2012 | | $ | 13.90 | | | 0.29 | | | 0.07 | | | 0.36 | | | (0.40 | ) | | — | | | (0.40 | ) | | $13.86 | | | 2.12 | | | | 0.56 | | | | 0.55 | | | | 0.56 | | | 2.63 | | 9.89 | | $ | 98,112 | |
2011 | | $ | 13.94 | | | 0.37 | | | 0.04 | | | 0.41 | | | (0.45 | ) | | — | | | (0.45 | ) | | $13.90 | | | 2.71 | | | | 0.57 | | | | 0.57 | | | | 0.57 | | | 2.99 | | 14.62 | | $ | 82,994 | |
2010 | | $ | 13.78 | | | 0.42 | | | 0.82 | | | 1.24 | | | (0.46 | ) | | (0.62) | | | (1.08 | ) | | $13.94 | | | 3.09 | | | | 0.60 | | | | 0.59 | | | | 0.60 | | | 5.03 | | 16.01 | | $ | 55,398 | |
2009 | | $ | 13.26 | | | 0.45 | | | 0.53 | | | 0.98 | | | (0.46 | ) | | — | | | (0.46 | ) | | $13.78 | | | 3.31 | | | | 0.66 | | | | 0.66 | | | | 0.67 | | | 7.51 | | 39.42 | | $ | 24,887 | |
Class R3 Shares | | | | | | | | | | | | | | | | | | | | | | | | | | | | | | | | | | | | | | | | | | |
2014(c) | | $ | 13.37 | | | 0.08 | | | (0.03 | ) | | 0.05 | | | (0.12 | ) | | — | | | (0.12 | ) | | $13.30 | | | 1.25 | (d) | | | 0.99 | (d) | | | 0.99 | (d) | | | 1.30 | (d) | | 0.36 | | 3.91 | | $ | 15,055 | |
2013 | | $ | 13.87 | | | 0.18 | | | (0.38 | ) | | (0.20) | | | (0.30 | ) | | — | | | (0.30 | ) | | $13.37 | | | 1.35 | | | | 0.99 | | | | 0.99 | | | | 1.27 | | | (1.47) | | 12.18 | | $ | 15,350 | |
2012 | | $ | 13.91 | | | 0.23 | | | 0.07 | | | 0.30 | | | (0.34 | ) | | — | | | (0.34 | ) | | $13.87 | | | 1.69 | | | | 1.00 | | | | 0.99 | | | | 1.29 | �� | | 2.19 | | 9.89 | | $ | 15,486 | |
2011 | | $ | 13.95 | | | 0.32 | | | 0.03 | | | 0.35 | | | (0.39 | ) | | — | | | (0.39 | ) | | $13.91 | | | 2.33 | | | | 1.00 | | | | 0.99 | | | | 1.32 | | | 2.56 | | 14.62 | | $ | 12,749 | |
2010 | | $ | 13.79 | | | 0.38 | | | 0.80 | | | 1.18 | | | (0.40 | ) | | (0.62) | | | (1.02 | ) | | $13.95 | | | 2.73 | | | | 0.99 | | | | 0.99 | | | | 1.31 | | | 4.62 | | 16.01 | | $ | 12,631 | |
2009 | | $ | 13.27 | | | 0.41 | | | 0.53 | | | 0.94 | | | (0.42 | ) | | — | | | (0.42 | ) | | $13.79 | | | 3.00 | | | | 1.00 | | | | 0.99 | | | | 1.40 | | | 7.15 | | 39.42 | | $ | 7,625 | |
Class R4 Shares | | | | | | | | | | | | | | | | | | | | | | | | | | | | | | | | | | | | | | | | | | |
2014(c)(e) | | $ | 13.36 | | | 0.04 | | | (0.06 | ) | | (0.02) | | | (0.06 | ) | | — | | | (0.06 | ) | | $13.28 | | | 1.93 | (d) | | | 0.98 | (d) | | | 0.98 | (d) | | | 87.66 | (d)(f) | | (0.17) | | 3.91 | | $ | 15 | |
Class R5 Shares | | | | | | | | | | | | | | | | | | | | | | | | | | | | | | | | | | | | | | | | | | |
2014(c) | | $ | 13.36 | | | 0.11 | | | (0.04 | ) | | 0.07 | | | (0.14 | ) | | — | | | (0.14 | ) | | $13.29 | | | 1.58 | (d) | | | 0.67 | (d) | | | 0.67 | (d) | | | 3.20 | (d) | | 0.52 | | 3.91 | | $ | 880 | |
2013 | | $ | 13.85 | | | 0.24 | | | (0.39 | ) | | (0.15) | | | (0.34 | ) | | — | | | (0.34 | ) | | $13.36 | | | 1.83 | | | | 0.67 | | | | 0.67 | | | | 7.28 | (f) | | (1.09) | | 12.18 | | $ | 881 | |
2012(g) | | $ | 13.84 | | | 0.10 | | | 0.07 | | | 0.17 | | | (0.16 | ) | | — | | | (0.16 | ) | | $13.85 | | | 1.87 | (d) | | | 0.68 | (d) | | | 0.67 | (d) | | | 44.86 | (d)(f) | | 1.20 | | 9.89 | | $ | 299 | |
| (a) | Not annualized for periods less than one year. |
| (b) | Sales loads are not reflected in computing total return. |
| (c) | Unaudited Six Month Period Ended March 31. |
| (e) | Effective date of this Class of shares was February 1, 2014. |
| (f) | Due to the size of net assets and fixed expenses, ratios may appear disproportionate. (g) Effective date of this Class of shares was May 1, 2012. |
| + | Based on weighted average shares outstanding, except for Dividends from Net Investment Income and Net Realized Gains, which are actual amounts per share. |
See notes to financial statements.
| | | | |
| 40 Certified Semi-Annual Report | | | | Certified Semi-Annual Report 41 |
Financial Highlights
Thornburg Limited Term Income Fund
| | | | | | | | | | | | | | | | | | | | | | | | | | | | | | | | | | | | | | | | | | | | | | | | |
| | | PER SHARE PERFORMANCE (for a share outstanding throughout the
Period)+ | | RATIOS TO AVERAGE NET ASSETS | | | SUPPLEMENTAL DATA | |
Unless
Otherwise
Noted,
Periods are Fiscal Years
Ended
Sept. 30, | | Net Asset
Value
Beginning
of Period | | | Net
Investment
Income
(Loss) | | Net
Realized
&
Unrealized
Gain (loss)
on
Investments | | | Total from
Investment
Operations | | Dividends
from Net
Investment
Income | | | Dividends
from Net
Realized
Gains | | Total
Dividends | | | Net
Asset
Value
End of
Period | | Net
Investment
Income(Loss)
(%) | | | Expenses,
After Expense
Reductions(%) | | | Expenses,
After
Expense
Reductions
and
Net of
Custody
Credits(%) | | | Expenses,
Before
Expense
Reductions
(%) | | | Total
Return
(%)(a) | | Portfolio
Turnover
Rate (%)(a) | | Net
Assets
at End
of
Period
(Thousands) | |
Class A Shares | | | | | | | | | | | | | | | | | | | | | | | | | | | | | | | | | | | | | | | | | | |
2014(b)(c) | | $ | 13.42 | | | 0.15 | | | 0.11 | | | 0.26 | | | (0.15 | ) | | (0.11) | | | (0.26 | ) | | $13.42 | | | 2.27 | (d) | | | 0.89 | (d) | | | 0.89 | (d) | | | 0.89 | (d) | | 1.99 | | 18.39 | | $ | 922,033 | |
2013(b) | | $ | 13.72 | | | 0.32 | | | (0.22 | ) | | 0.10 | | | (0.34 | ) | | (0.06) | | | (0.40 | ) | | $13.42 | | | 2.33 | | | | 0.88 | | | | 0.88 | | | | 0.88 | | | 0.69 | | 36.66 | | $ | 1,029,692 | |
2012(b) | | $ | 13.32 | | | 0.39 | | | 0.52 | | | 0.91 | | | (0.42 | ) | | (0.09) | | | (0.51 | ) | | $13.72 | | | 2.94 | | | | 0.93 | | | | 0.93 | | | | 0.93 | | | 7.04 | | 23.72 | | $ | 1,049,044 | |
2011(b) | | $ | 13.41 | | | 0.46 | | | (0.04 | ) | | 0.42 | | | (0.47 | ) | | (0.04) | | | (0.51 | ) | | $13.32 | | | 3.44 | | | | 0.98 | | | | 0.97 | | | | 0.98 | | | 3.19 | | 24.86 | | $ | 578,731 | |
2010(b) | | $ | 12.81 | | | 0.51 | | | 0.61 | | | 1.12 | | | (0.52 | ) | | — | | | (0.52 | ) | | $13.41 | | | 3.88 | | | | 0.99 | | | | 0.99 | | | | 1.01 | | | 8.91 | | 16.35 | | $ | 459,532 | |
2009(b) | | $ | 11.92 | | | 0.60 | | | 0.90 | | | 1.50 | | | (0.61 | ) | | — | | | (0.61 | ) | | $12.81 | | | 5.04 | | | | 0.99 | | | | 0.99 | | | | 1.04 | | | 13.05 | | 45.31 | | $ | 243,141 | |
Class C Shares | | | | | | | | | | | | | | | | | | | | | | | | | | | | | | | | | | | | | | | | | | |
2014(c) | | $ | 13.39 | | | 0.14 | | | 0.12 | | | 0.26 | | | (0.14 | ) | | (0.11) | | | (0.25 | ) | | $13.40 | | | 2.04 | (d) | | | 1.11 | (d) | | | 1.11 | (d) | | | 1.11 | (d) | | 1.95 | | 18.39 | | $ | 593,389 | |
2013 | | $ | 13.70 | | | 0.28 | | | (0.23 | ) | | 0.05 | | | (0.30 | ) | | (0.06) | | | (0.36 | ) | | $13.39 | | | 2.09 | | | | 1.12 | | | | 1.12 | | | | 1.12 | | | 0.38 | | 36.66 | | $ | 632,918 | |
2012 | | $ | 13.30 | | | 0.36 | | | 0.52 | | | 0.88 | | | (0.39 | ) | | (0.09) | | | (0.48 | ) | | $13.70 | | | 2.70 | | | | 1.18 | | | | 1.18 | | | | 1.18 | | | 6.78 | | 23.72 | | $ | 604,314 | |
2011 | | $ | 13.39 | | | 0.42 | | | (0.04 | ) | | 0.38 | | | (0.43 | ) | | (0.04) | | | (0.47 | ) | | $13.30 | | | 3.19 | | | | 1.22 | | | | 1.22 | | | | 1.23 | | | 2.93 | | 24.86 | | $ | 366,822 | |
2010 | | $ | 12.79 | | | 0.47 | | | 0.61 | | | 1.08 | | | (0.48 | ) | | — | | | (0.48 | ) | | $13.39 | | | 3.62 | | | | 1.24 | | | | 1.24 | | | | 1.77 | | | 8.64 | | 16.35 | | $ | 257,869 | |
2009 | | $ | 11.90 | | | 0.57 | | | 0.90 | | | 1.47 | | | (0.58 | ) | | — | | | (0.58 | ) | | $12.79 | | | 4.79 | | | | 1.24 | | | | 1.24 | | | | 1.82 | | | 12.78 | | 45.31 | | $ | 117,950 | |
Class I Shares | | | | | | | | | | | | | | | | | | | | | | | | | | | | | | | | | | | | | | | | | | |
2014(c) | | $ | 13.42 | | | 0.18 | | | 0.11 | | | 0.29 | | | (0.18 | ) | | (0.11) | | | (0.29 | ) | | $13.42 | | | 2.63 | (d) | | | 0.52 | (d) | | | 0.52 | (d) | | | 0.52 | (d) | | 2.17 | | 18.39 | | $ | 1,338,004 | |
2013 | | $ | 13.73 | | | 0.36 | | | (0.23 | ) | | 0.13 | | | (0.38 | ) | | (0.06) | | | (0.44 | ) | | $13.42 | | | 2.68 | | | | 0.53 | | | | 0.53 | | | | 0.53 | | | 0.98 | | 36.66 | | $ | 1,260,449 | |
2012 | | $ | 13.32 | | | 0.44 | | | 0.53 | | | 0.97 | | | (0.47 | ) | | (0.09) | | | (0.56 | ) | | $13.73 | | | 3.27 | | | | 0.58 | | | | 0.58 | | | | 0.58 | | | 7.49 | | 23.72 | | $ | 1,012,430 | |
2011 | | $ | 13.41 | | | 0.50 | | | (0.04 | ) | | 0.46 | | | (0.51 | ) | | (0.04) | | | (0.55 | ) | | $13.32 | | | 3.79 | | | | 0.63 | | | | 0.63 | | | | 0.63 | | | 3.55 | | 24.86 | | $ | 448,669 | |
2010 | | $ | 12.82 | | | 0.55 | | | 0.60 | | | 1.15 | | | (0.56 | ) | | — | | | (0.56 | ) | | $13.41 | | | 4.22 | | | | 0.64 | | | | 0.64 | | | | 0.64 | | | 9.20 | | 16.35 | | $ | 295,433 | |
2009 | | $ | 11.92 | | | 0.64 | | | 0.90 | | | 1.54 | | | (0.64 | ) | | — | | | (0.64 | ) | | $12.82 | | | 5.39 | | | | 0.66 | | | | 0.66 | | | | 0.68 | | | 13.50 | | 45.31 | | $ | 146,099 | |
Class R3 Shares | | | | | | | | | | | | | | | | | | | | | | | | | | | | | | | | | | | | | | | | | | |
2014(c) | | $ | 13.43 | | | 0.14 | | | 0.12 | | | 0.26 | | | (0.15 | ) | | (0.11) | | | (0.26 | ) | | $13.43 | | | 2.16 | (d) | | | 0.99 | (d) | | | 0.99 | (d) | | | 1.13 | (d) | | 1.93 | | 18.39 | | $ | 107,545 | |
2013 | | $ | 13.73 | | | 0.30 | | | (0.22 | ) | | 0.08 | | | (0.32 | ) | | (0.06) | | | (0.38 | ) | | $13.43 | | | 2.22 | | | | 0.99 | | | | 0.99 | | | | 1.14 | | | 0.59 | | 36.66 | | $ | 81,585 | |
2012 | | $ | 13.33 | | | 0.39 | | | 0.52 | | | 0.91 | | | (0.42 | ) | | (0.09) | | | (0.51 | ) | | $13.73 | | | 2.88 | | | | 0.99 | | | | 0.99 | | | | 1.19 | | | 6.97 | | 23.72 | | $ | 73,373 | |
2011 | | $ | 13.42 | | | 0.45 | | | (0.03 | ) | | 0.42 | | | (0.47 | ) | | (0.04) | | | (0.51 | ) | | $13.33 | | | 3.42 | | | | 0.99 | | | | 0.99 | | | | 1.29 | | | 3.17 | | 24.86 | | $ | 30,022 | |
2010 | | $ | 12.82 | | | 0.51 | | | 0.61 | | | 1.12 | | | (0.52 | ) | | — | | | (0.52 | ) | | $13.42 | | | 3.89 | | | | 0.99 | | | | 0.99 | | | | 1.35 | | | 8.90 | | 16.35 | | $ | 18,767 | |
2009 | | $ | 11.92 | | | 0.61 | | | 0.90 | | | 1.51 | | | (0.61 | ) | | — | | | (0.61 | ) | | $12.82 | | | 5.08 | | | | 0.99 | | | | 0.99 | | | | 1.48 | | | 13.13 | | 45.31 | | $ | 10,091 | |
Class R4 Shares | | | | | | | | | | | | | | | | | | | | | | | | | | | | | | | | | | | | | | | | | | |
2014(c)(e) | | $ | 13.42 | | | 0.05 | | | 0.10 | | | 0.15 | | | (0.05 | ) | | (0.11) | | | (0.16 | ) | | $13.41 | | | 2.23 | (d) | | | 0.98 | (d) | | | 0.98 | (d) | | | 88.73 | (d)(g) | | 0.29 | | 18.39 | | $ | 15 | |
Class R5 Shares | | | | | | | | | | | | | | | | | | | | | | | | | | | | | | | | | | | | | | | | | | |
2014(c) | | $ | 13.42 | | | 0.17 | | | 0.11 | | | 0.28 | | | (0.17 | ) | | (0.11) | | | (0.28 | ) | | $13.42 | | | 2.49 | (d) | | | 0.67 | (d) | | | 0.67 | (d) | | | 0.74 | (d) | | 2.10 | | 18.39 | | $ | 12,151 | |
2013 | | $ | 13.72 | | | 0.34 | | | (0.21 | ) | | 0.13 | | | (0.37 | ) | | (0.06) | | | (0.43 | ) | | $13.42 | | | 2.52 | | | | 0.65 | | | | 0.65 | | | | 1.01 | | | 0.92 | | 36.66 | | $ | 8,164 | |
2012(f) | | $ | 13.47 | | | 0.16 | | | 0.27 | | | 0.43 | | | (0.18 | ) | | — | | | (0.18 | ) | | $13.72 | | | 2.96 | (d) | | | 0.67 | (d) | | | 0.67 | (d) | | | 25.61 | (d)(g) | | 3.19 | | 23.72 | | $ | 1,322 | |
| (a) | Not annualized for periods less than one year. |
| (b) | Sales loads are not reflected in computing total return. (c) Unaudited Six Month Period Ended March 31. |
| (e) | Effective date of this Class of shares was February 1, 2014. (f) Effective date of this Class of shares was May 1, 2012. |
| (g) | Due to the size of net assets and fixed expenses, ratios may appear disproportionate. |
| + | Based on weighted average shares outstanding, except for Dividends from Net Investment Income and Net Realized Gains, which are actual amounts per share. |
See notes to financial statements.
| | | | |
| 42 Certified Semi-Annual Report | | | | Certified Semi-Annual Report 43 |
| | |
| EXPENSE EXAMPLES | | |
| |
Thornburg Limited Term Income Funds | | March 31, 2014 (Unaudited) |
As a shareholder of the Fund, you incur two types of costs:
| | (1) | transaction costs, including |
(a) sales charges (loads) on purchase payments, for Class A shares;
(b) a deferred sales charge on redemptions of any part or all of a purchase of $1 million of Class A shares within 12 months of purchase;
(c) a deferred sales charge on redemptions of Class B shares within eight years of purchase;
(d) a deferred sales charge on redemptions of Class C shares within 12 months of purchase;
| | (2) | ongoing costs, including management fees; distribution and/or service (12b-1) fees; and other Fund expenses. |
This example is intended to help you understand your ongoing costs (in dollars) of investing in the Fund and to compare these costs with the ongoing costs of investing in other mutual funds.
The example is based on a $1,000 investment beginning on October 1, 2013, and held until March 31, 2014.
ACTUAL EXPENSES
For each class of shares, the first line of the accompanying table provides information about actual account values and actual expenses. You may use the information in this line, together with the amount you invested, to estimate the expenses that you paid over the period. Simply divide your account value by $1,000 (for example, an $8,600 account value divided by $1,000 = 8.6), then multiply the result by the number in the first line for your class of shares under the heading entitled “Expenses Paid During Period” to estimate the expenses you paid on your account during this period.
HYPOTHETICAL EXAMPLE FOR COMPARISON PURPOSES
For each class of shares, the second line of the accompanying table provides information about hypothetical account values and hypothetical expenses based on the Fund’s actual expense ratio and an assumed rate of return of 5% per year before expenses, which is not the Fund’s actual return. The hypothetical account values and expenses may not be used to estimate the actual ending account balance or expenses you paid for the period. You may use this information to compare the ongoing costs of investing in the Fund and other funds. To do so, compare this 5% hypothetical example with the 5% hypothetical examples that appear in the shareholder reports of the other funds.
Please note that the expenses shown in the table are meant to highlight your ongoing costs only and do not reflect any transactional costs, such as sales charges (loads), redemption fees, or exchange fees. Therefore, the second line of the table for each class of shares is useful in comparing ongoing costs only, and will not help you determine the relative total costs of owning different funds. In addition, if these transactional costs were included, your costs would have been higher.
| | | | | | | | | | | | |
| | | Beginning
Account Value
10/1/13 | | | Ending
Account Value
3/31/14 | | | Expenses paid
During period†
10/1/13–3/31/14 | |
Limited Term U.S. Government Fund | | | | | | | | | | | | |
Class A Shares | | | | | | | | | | | | |
Actual | | $ | 1,000.00 | | | $ | 1,003.90 | | | $ | 4.63 | |
Hypothetical* | | $ | 1,000.00 | | | $ | 1,020.31 | | | $ | 4.66 | |
Class B Shares | | | | | | | | | | | | |
Actual | | $ | 1,000.00 | | | $ | 996.90 | | | $ | 11.53 | |
Hypothetical* | | $ | 1,000.00 | | | $ | 1,013.39 | | | $ | 11.62 | |
Class C Shares | | | | | | | | | | | | |
Actual | | $ | 1,000.00 | | | $ | 1,001.80 | | | $ | 5.94 | |
Hypothetical* | | $ | 1,000.00 | | | $ | 1,018.99 | | | $ | 6.00 | |
Class I Shares | | | | | | | | | | | | |
Actual | | $ | 1,000.00 | | | $ | 1,005.60 | | | $ | 2.92 | |
Hypothetical* | | $ | 1,000.00 | | | $ | 1,022.02 | | | $ | 2.94 | |
Class R3 Shares | | | | | | | | | | | | |
Actual | | $ | 1,000.00 | | | $ | 1,003.60 | | | $ | 4.95 | |
Hypothetical* | | $ | 1,000.00 | | | $ | 1,020.00 | | | $ | 4.99 | |
Class R4 Shares | | | | | | | | | | | | |
Actual | | $ | 1,000.00 | | | $ | 998.30 | | | $ | 4.88 | |
Hypothetical* | | $ | 1,000.00 | | | $ | 1,020.04 | | | $ | 4.94 | |
Class R5 Shares | | | | | | | | | | | | |
Actual | | $ | 1,000.00 | | | $ | 1,005.20 | | | $ | 3.34 | |
Hypothetical* | | $ | 1,000.00 | | | $ | 1,021.60 | | | $ | 3.37 | |
| | | |
Limited Term Income Fund | | | | | | | | | | | | |
Class A Shares | | | | | | | | | | | | |
Actual | | $ | 1,000.00 | | | $ | 1,019.90 | | | $ | 4.46 | |
Hypothetical* | | $ | 1,000.00 | | | $ | 1,020.51 | | | $ | 4.46 | |
Class C Shares | | | | | | | | | | | | |
Actual | | $ | 1,000.00 | | | $ | 1,019.50 | | | $ | 5.61 | |
Hypothetical* | | $ | 1,000.00 | | | $ | 1,019.38 | | | $ | 5.61 | |
Class I Shares | | | | | | | | | | | | |
Actual | | $ | 1,000.00 | | | $ | 1,021.70 | | | $ | 2.63 | |
Hypothetical* | | $ | 1,000.00 | | | $ | 1,022.33 | | | $ | 2.63 | |
Class R3 Shares | | | | | | | | | | | | |
Actual | | $ | 1,000.00 | | | $ | 1,019.30 | | | $ | 4.98 | |
Hypothetical* | | $ | 1,000.00 | | | $ | 1,020.00 | | | $ | 4.99 | |
Class R4 Shares | | | | | | | | | | | | |
Actual | | $ | 1,000.00 | | | $ | 1,002.90 | | | $ | 4.90 | |
Hypothetical* | | $ | 1,000.00 | | | $ | 1,020.03 | | | $ | 4.95 | |
Class R5 Shares | | | | | | | | | | | | |
Actual | | $ | 1,000.00 | | | $ | 1,021.00 | | | $ | 3.37 | |
Hypothetical* | | $ | 1,000.00 | | | $ | 1,021.60 | | | $ | 3.37 | |
| † | Thornburg Limited Term U.S. Government Fund expenses are equal to the annualized expense ratio for each class (A: 0.93%; B: 2.31%; C: 1.19%; I: 0.58%; R3: 0.99% R4: 0.98% R5: 0.67%) multiplied by the average account value over the period, multiplied by 182/365 to reflect the one-half year period. |
| † | Thornburg Limited Term Income Fund expenses are equal to the annualized expense ratio for each class (A: 0.89%; C:1.11%; I: 0.52%; R3: 0.99%; R4: 0.98%; R5: 0.67%) multiplied by the average account value over the period, multiplied by 182/365 to reflect the one-half year period. |
| * | Hypothetical assumes a rate of return of 5% per year before expenses. |
44 Certified Semi-Annual Report
| | |
| OTHER INFORMATION | | |
| |
Thornburg Limited Term Income Funds | | March 31, 2014 (Unaudited) |
PORTFOLIO PROXY VOTING
Policies and Procedures:
The Trust has delegated to Thornburg Investment Management, Inc. (the “Advisor”) voting decisions respecting proxies for each of the Fund’s voting securities. The Advisor makes voting decisions in accordance with its Proxy Voting Policy. A description of the Policy is available (i) without charge, upon request, by calling the Advisor toll-free at 1-800-847-0200, (ii) on the Thornburg website at www. thornburg.com, and (iii) on the Securities and Exchange Commission’s website at www.sec.gov.
Information regarding how proxies were voted is available on or before August 31 of each year for the twelve months ending the preceding June 30. This information is available (i) without charge, upon request by calling the Advisor toll-free at 1-800-847-0200, (ii) on the Thornburg website at www.thornburg.com, and (iii) on the Securities and Exchange Commission’s website at www.sec.gov.
AVAILABILITY OF QUARTERLY PORTFOLIO SCHEDULE
The Funds file with the Securities and Exchange Commission schedules of their portfolio holdings on Form N-Q for the first and third quarters of each fiscal year. The Funds’ Forms N-Q are available on the Commission’s website at www.sec.gov, or may be reviewed and copied at the Commission’s Public Reference Room in Washington, D.C. Information on the operation of the Public Reference Room may be obtained by calling 1-800-SEC-0330. The Funds also make this information available on their website at www.thornburg. com/download or upon request by calling 1-800-847-0200.
Certified Semi-Annual Report 45
TRUSTEES’ STATEMENT TO SHAREHOLDERS
Not part of the Certified Semi-Annual Report
Reissued September 15, 2013
The Trustees believe current and prospective shareholders should know how we discharge our responsibilities in supervising the Funds’ investment advisor and in reviewing the advisor’s contract for renewal. Since 2005, we have issued a statement which sets out clearly the three principal guidelines that we follow in supervising the Trust’s investment advisor on your behalf. In accordance with our customary practice, in September of this year we again reviewed our statement and concluded we should reissue this statement outlining the principal features of our supervision of the advisor’s performance of investment management services for the Funds.
We begin with the premise that each shareholder selected his or her Fund because its investments are managed by the investment advisor identified in the prospectus and in accordance with the objective and policies described in the prospectus. We realize, as each of you do, that if you believe that your Fund’s stated objective and policies no longer serve your personal investment goals, you can sell your shares and leave the Fund.
Therefore, we believe that our primary supervisory task – our principal obligation to you – is to assess the nature and quality of the advisor’s services, and to confirm that the advisor actively and competently pursues the Fund’s objective, in accordance with the policies set out in the prospectus. To do this, we meet regularly with management to review your Fund’s portfolio and to discuss the advisor’s specific actions and judgments in pursuing the Fund’s objective. We do not substitute our own judgment for the advisor’s decisions in selecting investments; the advisor is paid to exercise its informed judgment on investment decisions, and we seek to confirm, in reviewing the advisor’s performance, that the advisor is doing just that.
Second, while we are conscious of costs and the effect that costs have on shareholders’ returns, we do not seek the lowest fees or expense ratio as our sole or primary objective. We try to make sure that your Fund’s fees and costs are reasonable in relationship to the services rendered and that they are generally in line with those charged by other expert investment advisors, consistent with our belief that the Fund’s investors searched for and expect that expertise and attention and have decided to pay a reasonable price for it. We do not put the management contract “out to bid” as a matter of course, and we would not do so unless we had concluded that the advisor materially had failed to pursue the Fund’s objectives in accordance with its policies, or for other equally important reasons. We believe that any other approach would be inconsistent with your interests and contrary to your expectations when you bought shares of the Fund in the first place.
Finally, because we believe that most Thornburg Fund shareholders have invested with a long-term perspective, we try not to focus too much on the fashions of the moment and on short-term performance. The market will not favor any specific investment objective or set of policies at all times and under all economic circumstances. A fund will experience periods of both high and low returns relative to other funds and other investments. Even if one of our Funds is not favored by the market at a particular time, we believe that the advisor is nonetheless obliged to remain true to the Fund’s objective and policies, and we watch to see that it does so.
46 This page is not part of the Semi-Annual Report
RETIREMENT AND EDUCATION ACCOUNTS
Thornburg Investment Management offers retirement and education savings accounts that can help you meet a variety of planning challenges. For account applications or further information on any of the accounts below, please call 1-800-847-0200 or go to www.thornburg.com/ira. Your financial advisor can help you determine which plan is right for you.
Individual Retirement Accounts
Individual Retirement Accounts (IRAs) provide a tax-advantaged means to save money for the future. For a detailed outline of the difference between retirement accounts, see www.thornburg.com/ira. Rollovers are available. Call 1-800-847-0200 for more information.
Traditional IRAs – Contributions to Traditional IRAs are tax deductible for eligible individuals, and withdrawals are taxed as additional ordinary income. You may contribute to an IRA if you receive compensation and are under 70 1/2, even if you are covered by an employer retirement plan. Deductible contributions are subject to certain qualifications. Please consult your tax advisor.
Roth IRAs – Under a Roth IRA, there is no tax deduction for contributions, but there is no income tax on qualified withdrawals. For a more detailed comparison of Traditional and Roth IRAs, please see our website at www.thornburg. com/ira.
SEP IRAs – Simplified Employee Pension (SEP) IRAs are established by employers. The employer is allowed a tax deduction for contributions made to the SEP Plan and makes contributions to each eligible employee’s SEP IRA on a discretionary basis.
SIMPLE IRAs – Savings Incentive Match Plan for Employees of Small Employers (SIMPLE) is designed to give small business owners a simplified method to establish and contribute to a retirement plan for employees. The employer is allowed a tax deduction for contributions and makes either matching or non-elective contributions to each eligible employee’s SIMPLE IRA. Employees may make salary deferral contributions.
Coverdell Education Savings Account
These savings accounts are designed to provide a way to save money for higher education expenses. In an Education Savings Account, earnings and interest grow tax-free, and qualified withdrawals used to pay for eligible higher-education expenses are tax- and penalty-free.
Funds Available
The following funds are available in the accounts listed above:
| | • | | Thornburg Core Growth Fund |
| | • | | Thornburg International Value Fund |
| | • | | Thornburg International Growth Fund |
| | • | | Thornburg Developing World Fund |
| | • | | Thornburg Investment Income Builder Fund |
| | • | | Thornburg Global Opportunities Fund |
| | • | | Thornburg Low Duration Income Fund |
| | • | | Thornburg Limited Term U.S. Government Fund |
| | • | | Thornburg Limited Term Income Fund |
| | • | | Thornburg Strategic Income Fund |
This page is not part of the Semi-Annual Report 47

48 This page is not part of the Semi-Annual Report
THORNBURG FUND FAMILY
Thornburg Equity Funds
Thornburg’s equity research uses a fundamentally driven, bottom-up, comprehensive analytical approach. Thornburg equity funds generally focus on a limited number of securities so that each holding can impact performance. The team searches for firms believed to have a promising future and seeks to buy shares of those companies at a discount to their intrinsic or long-term value.
| | • | | Thornburg Core Growth Fund |
| | • | | Thornburg International Value Fund |
| | • | | Thornburg International Growth Fund |
| | • | | Thornburg Developing World Fund |
| | • | | Thornburg Investment Income Builder Fund |
| | • | | Thornburg Global Opportunities Fund |
Thornburg Bond Funds
Thornburg Investment Management applies a disciplined philosophy to fixed-income management. Since the launch of our first fixed-income fund over 25 years ago, we have been conducting fundamental, bottom-up research in an effort to identify bonds which we believe provide the best return for a given level of risk. We avoid leverage or complex strategies which could backfire in periods of market uncertainty.
| | • | | Thornburg Low Duration Income Fund |
| | • | | Thornburg Limited Term U.S. Government Fund |
| | • | | Thornburg Limited Term Income Fund |
| | • | | Thornburg Strategic Income Fund |
| | • | | Thornburg Low Duration Municipal Fund |
| | • | | Thornburg Limited Term Municipal Fund |
| | • | | Thornburg Intermediate Municipal Fund |
| | • | | Thornburg California Limited Term Municipal Fund |
| | • | | Thornburg New Mexico Intermediate Municipal Fund |
| | • | | Thornburg New York Intermediate Municipal Fund |
| | • | | Thornburg Strategic Municipal Income Fund |
Before investing, carefully consider the Fund’s investment goals, risks, charges, and expenses. For a prospectus or summary prospectus containing this and other information, contact your financial advisor or visit thornburg.com. Read it carefully before investing.
For additional information, please visit thornburg.com
Thornburg Investment Management, Inc. 2300 North Ridgetop Road, Santa Fe, NM 87506
This page is not part of the Semi-Annual Report 49
This page intentionally left blank.
50 This page is not part of the Semi-Annual Report
This page intentionally left blank.
This page is not part of the Semi-Annual Report 51


2 This page is not part of the Semi-Annual Report
Important Information
The information presented on the following pages was current as of March 31, 2014. The managers’ views, portfolio holdings, and sector and country diversification are provided for the general information of the Fund’s shareholders; to the extent this information is historical, it should not be considered predictive of future circumstances. This material should not be deemed a recommendation to buy or sell any of the securities mentioned.
Investments in the Fund carry risks, including possible loss of principal. Bond funds have the same interest rate, inflation, and credit risks that are associated with the underlying bonds. The principal value of bonds will fluctuate relative to changes in interest rates, decreasing when interest rates rise. Unlike bonds, bond funds have ongoing fees and expenses. Funds invested in mortgage-backed securities may bear additional risk. Investments in lower-rated and unrated bonds may be more sensitive to default, downgrades, and market volatility; these investments may also be less liquid than higher-rated bonds. Investments in structured finance arrangements and other types of derivatives are subject to the risks associated with the securities or other assets underlying the pool of securities including illiquidity and difficulty in valuation. Investments in equity securities are subject to additional risks, such as greater market fluctuations. Special risks may be associated with investments outside the United States, especially in emerging markets, including currency fluctuations, illiquidity, volatility, and political and economic risks. Please see the Fund’s Prospectus for a discussion of the risks associated with an investment in the Fund. Investments in the Fund are not FDIC insured, nor are they deposits of or guaranteed by a bank or any other entity. There is no guarantee that the Fund will meet its investment objectives.
Diversification does not assure or guarantee better performance and cannot eliminate the risk of investment losses.
Performance data given at net asset value (NAV) does not take into account the applicable sales charges. If the sales charges had been included, the performance would have been lower.
Class I, R3, R4, and R5 shares may not be available to all investors. Minimum investments for Class I shares may be higher than those for other classes.
| | | | | | |
SHARE CLASS | | | | NASDAQ SYMBOL | | CUSIP |
Class A | | | | TSIAX | | 885-215-228 |
Class C | | | | TSICX | | 885-215-210 |
Class I | | | | TSIIX | | 885-215-194 |
Class R3 | | | | TSIRX | | 885-216-887 |
Class R4 | | | | TSRIX | | 885-216-754 |
Class R5 | | | | TSRRX | | 885-216-879 |
Glossary
Barclays U.S. High Yield Bond Index – This index represents a universe of fixed-rate, non-investment grade debt.
Blended Index – The Blended Index is composed of 80% Barclays U.S. Aggregate Bond Index and 20% MSCI World Index, rebalanced monthly. The Barclays U.S. Aggregate Bond Index is composed of approximately 8,000 publicly traded bonds including U.S. government, mortgage-backed, corporate, and Yankee bonds. The index is weighted by the market value of the bonds included in the index. The MSCI World Index is an unmanaged market-weighted index that consists of securities traded in 24 of the world’s most developed countries. Securities are listed on exchanges in the U.S., Europe, Canada, Australia, New Zealand, and the Far East. The index is calculated with net dividends reinvested, in U.S. dollars.
Barclays U.S. Universal Index – This index represents the union of the U.S. Aggregate Index, U.S. Corporate High-Yield, Investment Grade 144A Index, Eurodollar Index, U.S. Emerging Markets Index, and the non-ERISA eligible portion of the CMBS Index. The index covers USD denominated, taxable bonds that are rated either investment-grade or below investment-grade.
Unless otherwise noted, index returns reflect the reinvestment of income dividends and capital gains, if any, but do not reflect fees, brokerage commissions or other expenses of investing. Investors may not make direct investments into any index. The performance of any index is not indicative of the performance of any particular investment.
Annualized Distribution Yield – The distribution yield reflects actual distributions made to shareholders. The annualized distribution yield is calculated by summing the last 30 days of income at a given month end and annualizing to a 360-day year. The result is divided by the ending maximum offering price.
Bond Credit Ratings – A bond credit rating assesses the financial ability of a debt issuer to make timely payments of principal and interest. Ratings of AAA (the highest), AA, A, and BBB are investment-grade quality. Ratings of BB, B, CCC, CC, C, and D (the lowest) are considered below investment grade, speculative grade, or junk bonds. Unless otherwise noted, the ratings listed are from Bloomberg Market Data and are a combination of ratings from Standard and Poor’s, Moody’s Investors Service, and Fitch Ratings.
Coupon – The interest rate stated on a bond when its issued. The coupon is typically paid semi-annually.
Duration – A bond’s sensitivity to interest rates. Bonds with longer durations experience greater price volatility than bonds with shorter durations.
Effective Duration – A bond’s sensitivity to interest rates, incorporating the embedded option features, such as call provisions. Bonds with longer durations experience greater price volatility than bonds with shorter durations.
Median Market Capitalization – Market capitalization (market cap) is the total value of a company’s stock, calculated by multiplying the number of outstanding common shares by the current share price. The company whose market cap is in the middle of the portfolio is the median market cap. Half the companies in the portfolio have values greater than the median and half have values that are less.
Price to Earnings Ratio (P/E) – A valuation ratio equaling a company’s market value per share divided by earnings per share.
Quantitative Easing – The Federal Reserve’s monetary policy used to stimulate the U.S. economy following the recession that began in 2007/08.
SEC Yield – SEC yield is computed in accordance with SEC standards measuring the net investment income per share over a specified 30-day period expressed as a percentage of the maximum offering price of the Fund’s shares at the end of the period.
U.S. Treasury Securities – U.S. Treasury securities, such as bills, notes and bonds, are negotiable debt obligations of the U.S. government. These debt obligations are backed by the “full faith and credit” of the government and issued at various schedules and maturities. Income from Treasury securities is exempt from state and local, but not federal income taxes.
This page is not part of the Semi-Annual Report 3

Portfolio Manager

Jason Brady, CFA
Objectives and Strategies
The Fund’s primary investment goal is to seek a high level of current income. The Fund’s secondary investment goal is some long-term capital appreciation.
The Fund pursues its investment goals by investing in a broad range of income producing investments throughout the world, primarily including debt obligations and income producing stocks. The Fund expects, under normal conditions, to invest a majority of its assets in debt obligations, but the relative proportions of the Fund’s investments in debt obligations and in income producing stocks can be expected to vary over time.
Harvesting a Sustainable Yield
Many investors are in need of significant income and typically turn to “high-yield” funds to find notable dividends. But the simple measure of yield is potentially misleading. At Thornburg Investment Management, we believe we have developed a better income-generation mousetrap in the form of the Strategic Income Fund, which has a goal of high income, without having to resort solely to the below-investment-grade segment of the taxable fixed income universe.
The idea behind this fund is that high yield, in the context of a fund type, represents not an investment goal, but merely a type of asset. Why? Most taxable high-yield funds are solely focused on below-investment-grade corporate bonds. We believe this focus ultimately makes these funds less flexible and correspondingly less capable of succeeding in a variety of investment climates. Keep in mind that below-investment-grade corporate bonds represent less than 2% of the total taxable investment universe. There is simply no compelling reason to ignore vast swathes of income-producing markets merely because they do not have a very low credit quality! In fact, quite the opposite is true. By sifting through the available choices across many sub-asset classes, we seek to generate an interesting income stream from a variety of different sources. We believe this diversification is likely to lead to a more stable fund with a robust yield.
This is the reason the Thornburg Strategic Income Fund has a much broader purview than a typical high-yield fund. The Fund may invest in corporate bonds (both investment-grade and high-yield), asset-backed securities, mortgages, non-U.S. dollar securities, emerging-markets bonds, convertible securities, and more.
The Fund typically has a smaller allocation to equity securities. As such, the occasional “bond-like” equity, which typically exhibits little growth but relatively strong income generation, can be attractive. While adding equities to what is primarily a bond fund can add volatility, which we work hard to mitigate, we simply can find no good reason to ignore an asset class that can serve as another source of income for the Fund. Thornburg Investment Management seeks to go where the value is, regardless of the asset classes in which we invest.
4 This page is not part of the Semi-Annual Report
30-Day Yields, A Shares
As of March 31, 2014
| | | | |
SEC Yield | | | 5.41 | % |
Annualized Distribution Yield | | | 4.11 | % |
Without fee waivers and expense reimbursements, the 30-day SEC Yield would have been 5.40% and the Annualized Distribution Yield would have been 4.10%.
Key Portfolio Attributes
As of March 31, 2014
Fixed Income Statistics
| | | | |
Weighted Average Coupon | | | 5.7 | % |
Effective Duration | | | 3.1 Yrs | |
Average Maturity | | | 5.6 Yrs | |
Bond Holdings | | | 259 | |
Equity Statistics
| | | | |
Portfolio P/E (12-mo. trailing) | | | 7.36 | |
Median Market Cap | | $ | 2.9 B | |
Equity & Pref. Equity Holdings | | | 21 | |
Credit Quality Summary
As of March 31, 2014
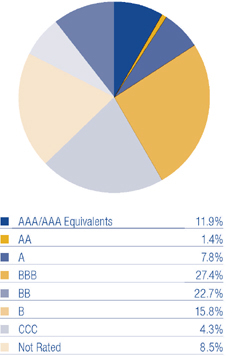
We have used ratings from Moody’s Investors Service. Where Moody’s ratings are not available, we have used Standard & Poor’s ratings. Where neither rating is available, we have used ratings from Fitch Ratings. Charts may not add to 100% due to rounding.
Portfolio Composition
As of March 31, 2014

May not add up to 100% due to rounding.
Average Annual Total Returns
For Periods Ended March 31, 2014
| | | | | | | | | | | | | | | | |
| A Shares (Incep: 12/19/07) | | 1 YR | | | 3 YRS | | | 5 YRS | | | SINCE
INCEPTION | |
Without sales charge | | | 5.21 | % | | | 7.22 | % | | | 13.95 | % | | | 8.20 | % |
With sales charge | | | 0.44 | % | | | 5.60 | % | | | 12.90 | % | | | 7.41 | % |
Barclays U.S. Universal Index | | | 0.51 | % | | | 4.23 | % | | | 5.74 | % | | | 5.06 | % |
Blended Index | | | 3.57 | % | | | 5.19 | % | | | 7.60 | % | | | 4.79 | % |
Performance data shown represents past performance and is no guarantee of future results. Investment return and principal value will fluctuate so shares, when redeemed, may be worth more or less than their original cost. Current performance may be lower or higher than quoted. For performance current to the most recent month end, visit thornburg.com or call 800-847-0200.
The maximum sales charge for Class A shares is 4.50%. The total annual operating expenses of Class A shares are 1.27%, as disclosed in the most recent prospectus. Thornburg Investment Management and/or Thornburg Securities Corporation have contractually agreed to waive fees and reimburse expenses until at least February 1, 2015, resulting in a net expense ratio of 1.25%. For more detailed information, please see the fund’s prospectus.
This page is not part of the Semi-Annual Report 5
2014 Certified Semi-Annual Report
Thornburg Strategic Income Fund
March 31, 2014
This report is certified under the Sarbanes-Oxley Act of 2002, which requires that public companies, including mutual funds, affirm that the information provided in their annual and semi-annual shareholder reports fully and fairly represents their financial position and the results of their operations for the period presented.
6 Certified Semi-Annual Report
Letter to Shareholders
April 24, 2014
Dear Fellow Shareholder:
| | |
We are happy to present the Thornburg Strategic Income Fund semi-annual report for the period ended March 31, 2014. The net asset value (NAV) of the Fund’s Class A share declined $0.03 to $12.16 over the past half-year. If you were invested for the entire period, you received dividends of 29.3 cents per share. If you reinvested your dividends, you received 29.5 cents per share. Please examine the accompanying exhibits for more detailed information. Putting income and price change together, the Class A shares of the Thornburg Strategic Income Fund produced a total return of 4.48% (at NAV) over the six-month period. The Blended Index of 80% of the Barclays U.S. Aggregate Bond Index and 20% of the MSCI World Index produced a 3.25% total return over the same time period. The Barclays U.S. Universal Index and the Barclays U.S. High Yield Index generated a 2.18% and a 6.67% total return, respectively. These indices reflect no deduction for fees, expenses, or taxes. The portfolio has continued to perform well, but that comes in a market of rising values among nearly every asset. A few rocky moments in recent years – notably the second half of 2011 and the middle of 2012 for credit, and the middle of 2013 for rate-sensitive products – provided good tests of our strategy over the short-term. But the quick return to “risk on” behavior means those testing moments have been fleeting. As we noted in our last letter, yields on “high-yield” bonds are hardly high at about 5%. Strategists have stopped discussing bond yields and spreads in terms of long-term averages, and instead are reduced to comparing today’s opportunity set to the pre-crisis lows in yields and spreads. They do so applying the following circular logic: because default rates are low, spreads and yields are reasonable, and the low cost of funding further encourages a low default rate. We note, however, that default rates were quite low toward the end of 2007 and into 2008, while any sale at that time of credit-sensitive instruments was a good sale. It is against today’s backdrop of high prices that we have pulled back from riskier assets within the Fund and moved our level of cash somewhat higher. | | Performance data shown represents past performance and is no guarantee of future results. Investment return and principal value will fluctuate so shares, when redeemed, may be worth more or less than their original cost. Current performance may be lower or higher than quoted. For performance current to the most recent month end, visit thornburg.com or call 800.847.0200. The maximum sales charge for Class A shares is 4.50%. The total annual fund operating expense of Class A shares is 1.27%, as disclosed in the most recent prospectus. Thornburg Investment Management and/or Thornburg Securities Corporation have contractually agreed to waive fees and reimburse expenses until at least February 1, 2015, resulting in a net expense ratio of 1.25%. For more detailed information, please see the fund’s prospectus. |
As for rate volatility, the continual failure of developed markets to generate so-called “above trend” growth has led to a subdued follow-through on last year’s notable rise in the back end of the yield curve. However, with the U.S. Federal Reserve (the Fed) apparently committed to exiting quantitative easing, it seems likely the market will continue struggling to find the clearing level for many types of rate products. Inflation has been falling, generally, which leads us to conclude that near-term risks of significantly higher rates are low. Yet the Fed seems too attached to the idea that the economy is undergoing a cyclical challenge, which may lead it to underestimate the employment rate that might stimulate wage inflation. Investors should be prepared, as always, for a much wider array of potential outcomes than the market is currently pricing.
We are in the fortunate position of not having to slavishly mimic a particular index in either rate or credit exposure, and as a result can continue to position the portfolio to take advantage of the best risk/reward tradeoff over a longer time horizon. The good news is that when yields are low and prices are high, the opportunity cost of holding a bit more cash or slightly shorter-term securities is correspondingly low. While we may “underperform” in a market that continues to trade to ever-higher prices, we are comfortable with our relative shedding of risk. We believe our job is to be good stewards of capital across market cycles. This is not to say the Fund has no risk, or that it will not trade to lower prices in a downturn stemming from either credit or rates. The fact of the matter is that when prices go up dramatically, we’re supposed to like risk less. As such, we are playing our cards close to the vest.
With regard to interest rate risk and the recent enthusiasm over so-called unconstrained bond funds touting “negative duration,” a few points are pertinent. Simply put, duration is a change in the price of a bond or a portfolio, given a change in the yield of that bond or portfolio. Yet many investors equate duration more to exposure to changes in U.S. Treasury rates. Given the move in the long end of the Treasury yield curve over the course of 2013, and the still historically minuscule rates on offer, investors are scrambling for strategies that are not exposed to significant price losses if rates on these high-quality bonds continue to rise. We note, however, that the U.S. Treasury market, while very large, is less than one-tenth of the overall global bond market. Furthermore, prices of the rest – more than 90% of that global bond market – are not perfectly correlated to U.S. Treasury prices.
Certified Semi-Annual Report 7
Letter to Shareholders, Continued
As a result, while the Thornburg Strategic Income Fund’s duration was 3.1 years at the end of March 2014 (a figure that didn’t change dramatically over the course of the year), the previous year’s results indicate a very low correlation to changes in U.S. Treasury prices. Indeed, the Fund’s performance was solidly positive (again, returning 4.48%, Class A shares at NAV), while the Barclays U.S. Universal Index (made up primarily of very high-quality bonds) was up 2.18%. We hope investors review our results over the past several years. Our flexible, global mandate has enabled us to find value in a market for income that is broad, deep and varied, without resorting to complex and opaque strategies.
Our management of the Fund will remain opportunistic, with an eye toward current income and long-term value accretion for our shareholders. While we have high hopes for our particular investments, we believe high market prices mean investors can no longer expect an interesting return if they allocate blindly to a broad income producing asset class, such as bank loans, high-yield bonds, or non-agency mortgages. Still, we expect income-producing assets will remain in high demand, and we are happy to be in a position to provide that income. The Fund seeks sustainable income from a wide variety of sources, which should be a source of strength and total return over time. In short, selectively investing in a broad range of interesting, income-producing global assets has so far served our shareholders well.
Thank you very much for investing alongside us in the Thornburg Strategic Income Fund.
|
| Sincerely, |
|
 |
| Jason H. Brady, CFA |
| Portfolio Manager |
| Managing Director |
The matters discussed in this report may constitute forward-looking statements made pursuant to the safe harbor provisions of the Securities Litigation Reform Act of 1995. These include any advisor or portfolio manager prediction, assessment, analysis or outlook for individual securities, industries, investment styles, market sectors and/or markets. These statements involve risks and uncertainties. In addition to the general risks described for each fund in its current prospectus, other factors bearing on these reports include the accuracy of the advisor’s or portfolio manager’s forecasts and predictions, the appropriateness of the investment strategies designed by the advisor or portfolio manager and the ability of the advisor or portfolio manager to implement their strategies efficiently and successfully. Any one or more of these factors, as well as other risks affecting the securities markets generally, could cause the actual results of any fund to differ materially as compared to its benchmarks.
8 Certified Semi-Annual Report
| | |
| Schedule of Investments | | |
| |
Thornburg Strategic Income Fund | | March 31, 2014 (Unaudited) |
Summary of Industry Exposure
As of 3/31/14
| | | | |
Energy | | | 10.3 | % |
Diversified Financials | | | 7.3 | % |
Telecommunication Services | | | 6.2 | % |
Banks | | | 5.6 | % |
Materials | | | 4.7 | % |
Transportation | | | 4.2 | % |
Capital Goods | | | 3.2 | % |
Utilities | | | 3.0 | % |
Food, Beverage & Tobacco | | | 2.6 | % |
Real Estate | | | 2.3 | % |
Miscellaneous | | | 2.2 | % |
Consumer Services | | | 2.0 | % |
Commercial & Professional Services | | | 1.9 | % |
Media | | | 1.6 | % |
Pharmaceuticals, Biotechnology & Life Sciences | | | 1.6 | % |
Software & Services | | | 1.5 | % |
Health Care Equipment & Services | | | 1.3 | % |
Insurance | | | 1.1 | % |
Retailing | | | 1.1 | % |
Food & Staples Retailing | | | 0.7 | % |
Commercial Services & Supplies | | | 0.5 | % |
Consumer Durables & Apparel | | | 0.5 | % |
Technology Hardware & Equipment | | | 0.3 | % |
Semiconductors & Semiconductor Equipment | | | 0.2 | % |
| |
OTHER NON-CLASSIFIED SECURITIES: | | | | |
Asset Backed Securities | | | 12.4 | % |
Other Securities | | | 9.0 | % |
Municipal Bonds | | | 0.9 | % |
Other Government | | | 0.5 | % |
U.S. Treasury Securities | | | 0.2 | % |
Mortgage Backed | | | 0.1 | % |
Warrants* | | | 0.0 | % |
Other Assets & Liabilities | | | 11.0 | % |
| * | Percentage was less than 0.1%. |
Summary of Country Exposure
As of 3/31/14
| | | | |
United States | | | 55.6 | % |
Brazil | | | 4.4 | % |
Mexico | | | 4.0 | % |
Russia | | | 2.5 | % |
Australia | | | 2.5 | % |
Cayman Islands | | | 2.4 | % |
United Kingdom | | | 2.2 | % |
Sweden | | | 2.0 | % |
Canada | | | 1.9 | % |
Netherlands | | | 1.5 | % |
Spain | | | 1.2 | % |
Ireland | | | 1.0 | % |
France | | | 0.8 | % |
Chile | | | 0.8 | % |
Bermuda | | | 0.7 | % |
Norway | | | 0.6 | % |
South Africa | | | 0.6 | % |
Peru | | | 0.5 | % |
Japan | | | 0.5 | % |
Germany | | | 0.5 | % |
Switzerland | | | 0.4 | % |
Panama | | | 0.4 | % |
Romania | | | 0.4 | % |
Italy | | | 0.4 | % |
Argentina | | | 0.3 | % |
Luxembourg | | | 0.3 | % |
Singapore | | | 0.2 | % |
Indonesia | | | 0.2 | % |
Czech Republic | | | 0.1 | % |
Iceland | | | 0.1 | % |
Other Assets & Liabilities | | | 11.0 | % |
Certified Semi-Annual Report 9
| | |
| Schedule of Investments, continued | | |
| |
Thornburg Strategic Income Fund | | March 31, 2014 (Unaudited) |
| | | | | | | | |
| | | SHARES/
PRINCIPAL
AMOUNT | | | VALUE | |
COMMON STOCK — 3.30% | | | | | | | | |
| | |
COMMERCIAL & PROFESSIONAL SERVICES — 0.34% | | | | | | | | |
Commercial Services & Supplies — 0.34% | | | | | | | | |
Republic Services, Inc. | | | 100,000 | | | $ | 3,416,000 | |
| | | | | | | | |
| | | | | | | 3,416,000 | |
| | | | | | | | |
ENERGY — 1.89% | | | | | | | | |
Oil, Gas & Consumable Fuels — 1.89% | | | | | | | | |
Eni S.p.A. | | | 147,400 | | | | 3,697,824 | |
a Halcon Resources Corp. | | | 48,492 | | | | 209,970 | |
Kinder Morgan, Inc. | | | 87,000 | | | | 2,826,630 | |
Linn Co., LLC | | | 167,800 | | | | 4,538,990 | |
Royal Dutch Shell plc ADR | | | 51,300 | | | | 3,747,978 | |
a Societatea Nationala De Gaze Naturale SA GDR 144a | | | 375,300 | | | | 3,753,000 | |
| | | | | | | | |
| | | | | | | 18,774,392 | |
| | | | | | | | |
REAL ESTATE — 0.57% | | | | | | | | |
Real Estate Investment Trusts — 0.57% | | | | | | | | |
Annaly Capital Management, Inc. | | | 212,700 | | | | 2,333,319 | |
Capstead Mortgage Corp. | | | 259,027 | | | | 3,279,282 | |
| | | | | | | | |
| | | | | | | 5,612,601 | |
| | | | | | | | |
TELECOMMUNICATION SERVICES — 0.50% | | | | | | | | |
Wireless Telecommunication Services — 0.50% | | | | | | | | |
Tele2 AB | | | 400,000 | | | | 4,962,687 | |
| | | | | | | | |
| | | | | | | 4,962,687 | |
| | | | | | | | |
TOTAL COMMON STOCK (Cost $36,946,097) | | | | | | | 32,765,680 | |
| | | | | | | | |
PREFERRED STOCK — 2.73% | | | | | | | | |
| | |
BANKS — 1.25% | | | | | | | | |
Banks — 0.94% | | | | | | | | |
b Cobank ACB Pfd, 6.25% | | | 50,000 | | | | 4,970,000 | |
First Niagara Financial Group Pfd, 8.625% | | | 17,732 | | | | 503,766 | |
GMAC Capital Trust I Pfd, 8.125% | | | 140,000 | | | | 3,822,000 | |
Thrifts & Mortgage Finance — 0.31% | | | | | | | | |
b Falcons Funding Trust I Pfd, 8.875% | | | 3,000 | | | | 3,112,500 | |
| | | | | | | | |
| | | | | | | 12,408,266 | |
| | | | | | | | |
ENERGY — 0.46% | | | | | | | | |
Oil, Gas & Consumable Fuels — 0.46% | | | | | | | | |
Halcon Resources Corp. Pfd, 5.75% | | | 6,135 | | | | 4,601,250 | |
| | | | | | | | |
| | | | | | | 4,601,250 | |
| | | | | | | | |
MISCELLANEOUS — 0.54% | | | | | | | | |
U.S. Government Agencies — 0.54% | | | | | | | | |
b AgriBank, FCB Pfd, 6.875% | | | 40,000 | | | | 4,123,752 | |
Farm Credit Bank of Texas Pfd, 10.00% | | | 1,000 | | | | 1,210,312 | |
| | | | | | | | |
| | | | | | | 5,334,064 | |
| | | | | | | | |
REAL ESTATE — 0.19% | | | | | | | | |
Real Estate Investment Trusts — 0.19% | | | | | | | | |
Alexandria Real Estate Pfd, 7.00% | | | 50,000 | | | | 1,343,500 | |
American Realty Capital Properties, Inc. Pfd, 6.70% | | | 25,857 | | | | 588,764 | |
| | | | | | | | |
| | | | | | | 1,932,264 | |
| | | | | | | | |
TELECOMMUNICATION SERVICES — 0.29% | | | | | | | | |
Diversified Telecommunication Services — 0.29% | | | | | | | | |
b,c Centaur Funding Corp. | | | 2,330 | | | | 2,846,969 | |
| | | | | | | | |
| | | | | | | 2,846,969 | |
| | | | | | | | |
TOTAL PREFERRED STOCK (Cost $26,948,806) | | | | | | | 27,122,813 | |
| | | | | | | | |
10 Certified Semi-Annual Report
| | |
| Schedule of Investments, continued | | |
| |
Thornburg Strategic Income Fund | | March 31, 2014 (Unaudited) |
| | | | | | | | |
| | | SHARES/
PRINCIPAL
AMOUNT | | | VALUE | |
ASSET BACKED SECURITIES — 12.40% | | | | | | | | |
| | |
COMMERCIAL MTG TRUST — 2.85% | | | | | | | | |
| | |
b Capital Automotive REIT, Series 2012-1A Class A, 4.70%, 7/15/2042 | | $ | 2,928,243 | | | $ | 2,924,524 | |
Citigroup Commercial Mtg Trust, Series 2004-HYB2 Class B1, 3.26%, 3/25/2034 | | | 141,873 | | | | 115,302 | |
b Commercial Mtg Pass-Through Certificates, Series 2011-FL1 Class B, 3.678%, 7/17/2028 | | | 645,827 | | | | 645,982 | |
b CVS Pass-Through Trust, 9.35%, 1/10/2023 | | | 4,605,000 | | | | 5,377,567 | |
b FREMF Mtg Trust, Series 2011-K704 Class B, 4.533%, 10/25/2030 | | | 4,000,000 | | | | 4,229,450 | |
b FREMF Mtg Trust, Series 2012-K709 Class C, 3.741%, 4/25/2045 | | | 3,046,000 | | | | 2,994,892 | |
b FREMF Mtg Trust, Series 2012-KF01 Class B Floating Rate Note, 2.757%, 10/25/2044 | | | 2,000,000 | | | | 2,041,069 | |
b FREMF Mtg Trust, Series 2013-KF02 Class B Floating Rate Note, 2.823%, 12/25/2045 | | | 2,894,326 | | | | 2,955,198 | |
b JP Morgan Chase Commercial Mtg Trust, Series 2013-JWRZ Class D Floating Rate Note, 3.145%, 4/15/2030 | | | 4,000,000 | | | | 3,995,921 | |
b Motel 6 Trust, Series 2012-MTL6 Class C, 3.139%, 10/5/2025 | | | 3,000,000 | | | | 2,992,254 | |
| | | | | | | | |
| | | | | | | 28,272,159 | |
| | | | | | | | |
OTHER ASSET BACKED — 4.62% | | | | | | | | |
| | |
b,d Aircraft Certificate Owner Trust, Series 2003-1A Class E, 7.001%, 9/20/2022 | | | 5,483,171 | | | | 5,726,487 | |
b,d Concord Funding Co., LLC, Series 2012-2 Class B, 4.145%, 1/15/2017 | | | 4,000,000 | | | | 3,980,000 | |
b,d Concord Funding Co., LLC, Series 2013-1 Class B, 3.92%, 2/15/2015 | | | 5,675,000 | | | | 5,596,969 | |
b Dominos Pizza Master Issuer, LLC, Series 2012-1A Class A2, 5.216%, 1/25/2042 | | | 9,748,500 | | | | 10,431,961 | |
b Fairway Outdoor Funding, LLC, Series 2012-1 Class B, 8.835%, 10/15/2042 | | | 3,000,000 | | | | 2,874,440 | |
b JPR Royalty, LLC, 14.00%, 9/1/2020 | | | 2,000,000 | | | | 1,299,690 | |
b MIRAMAX, LLC Series 2011-1A Class B, 10.00%, 10/20/2021 | | | 1,850,000 | | | | 1,918,086 | |
b MIRAMAX, LLC, Series 2011-1A Class A, 6.25%, 10/20/2021 | | | 768,740 | | | | 793,177 | |
b,d Northwind Holdings, LLC Floating Rate Note, 1.016%, 12/1/2037 | | | 1,062,500 | | | | 986,531 | |
b,d Progreso Receivables Funding I, LLC. Series 2013-A Class A, 4.00%, 7/9/2018 | | | 7,500,000 | | | | 7,493,262 | |
b Richland Towers, 7.87%, 3/15/2041 | | | 2,000,000 | | | | 2,109,908 | |
b,c Trafigura Securitisation Finance plc, Series 2012-1A Class B, 4.155%, 10/15/2015 | | | 2,000,000 | | | | 2,016,880 | |
b Westgate Resorts, Series 2012-1 Class C, 11.00%, 9/20/2025 | | | 624,404 | | | | 636,505 | |
| | | | | | | | |
| | | | | | | 45,863,896 | |
| | | | | | | | |
RESIDENTIAL MTG TRUST — 4.56% | | | | | | | | |
| | |
Banc of America Funding Corp., Series 2006-I Class SB1, 2.327%, 12/20/2036 | | | 890,085 | | | | 237,929 | |
Bear Stearns ARM Mtg, Series 2003-6 Class 2B-1, 2.487%, 8/25/2033 | | | 314,949 | | | | 292,756 | |
b CIT Mtg Loan Trust, Series 2007-1 Class 2A2, 1.404%, 10/25/2037 | | | 2,401,727 | | | | 2,398,063 | |
b Citigroup Mortgage Loan Trust Inc., Series 2014-A Class A, 4.00%, 1/25/2035 | | | 7,476,823 | | | | 7,719,262 | |
Countrywide, Series 2005-11 Class AF3, 4.778%, 2/25/2036 | | | 673,748 | | | | 674,564 | |
Countrywide, Series 2006-15 Class A6, 5.357%, 10/25/2046 | | | 323,563 | | | | 277,817 | |
b CS First Boston Mtg Securities Co., Series 2005-CF1 Class M1, 0.854%, 3/25/2045 | | | 2,037,181 | | | | 1,948,974 | |
FBR Securitization Trust, Series 2005-2 Class M1, 0.874%, 9/25/2035 | | | 3,000,000 | | | | 2,785,763 | |
JP Morgan Mtg Acquisition Corp., Series 2006-CH1 Class A4, 0.294%, 7/25/2036 | | | 1,334,173 | | | | 1,296,005 | |
Merrill Lynch Mtg Investors Trust, Series 2004-A4 Class M1, 2.49%, 8/25/2034 | | | 299,880 | | | | 253,162 | |
Morgan Stanley Capital, Inc., Series 2005-HE7 Class A2C, 0.474%, 11/25/2035 | | | 1,147,287 | | | | 1,122,802 | |
New Century Home Equity Loan Trust, Series 2005-2 Class M1, 0.584%, 6/25/2035 | | | 2,000,000 | | | | 1,942,902 | |
Park Place Securities, Inc., Series 2004- MHQ1 Class M2, 1.279%, 12/25/2034 | | | 2,250,000 | | | | 2,143,940 | |
Residential Asset Securities Corp., Series 2006-KS4 Class A3, 0.304%, 6/25/2036 | | | 778,782 | | | | 766,950 | |
b,d SHAP, Series 2013-RM1 Class A, 4.00%, 5/26/2053 | | | 4,111,740 | | | | 4,023,338 | |
Structured Asset Investment Loan Trust, Series 2003-BC9 Class 342, 1.114%, 8/25/2033 | | | 1,766,922 | | | | 1,703,102 | |
Structured Asset Securities Corp., Series 2004-20 Class 7A1, 5.25%, 11/25/2034 | | | 1,394,337 | | | | 1,407,574 | |
b TAL Advantage, LLC, Series 2014-1A Class A, 3.51%, 2/22/2039 | | | 8,677,083 | | | | 8,681,942 | |
b Vericrest Opportunity Loan Transferee, Series 2013-NPL1 Class A, 4.25%, 8/25/2058 | | | 5,557,953 | | | | 5,591,302 | |
Wells Fargo Asset Securities Corp., Series 2005-AR1 Class 1B1, 2.615%, 2/25/2035 | | | 266,130 | | | | 56,946 | |
| | | | | | | | |
| | | | | | | 45,325,093 | |
| | | | | | | | |
STUDENT LOAN — 0.37% | | | | | | | | |
| | |
Access Group, Inc., 0.639%, 7/25/2034 | | | 4,000,000 | | | | 3,654,831 | |
| | | | | | | | |
| | | | | | | 3,654,831 | |
| | | | | | | | |
TOTAL ASSET BACKED SECURITIES (Cost $120,441,690) | | | | | | | 123,115,979 | |
| | | | | | | | |
Certified Semi-Annual Report 11
| | |
| Schedule of Investments, continued | | |
| |
Thornburg Strategic Income Fund | | March 31, 2014 (Unaudited) |
| | | | | | | | |
| | | SHARES/
PRINCIPAL
AMOUNT | | | VALUE | |
CORPORATE BONDS — 50.52% | | | | | | | | |
| | |
BANKS — 3.77% | | | | | | | | |
Banks — 3.77% | | | | | | | | |
b,c Banco Santander Chile Floating Rate Note, 2.109%, 6/7/2018 | | $ | 4,000,000 | | | $ | 4,005,000 | |
b,c Caixa Economica Federal, 4.50%, 10/3/2018 | | | 7,700,000 | | | | 7,834,750 | |
a,b,c,e Islandsbanki, 4.41%, 10/15/2008 | | | 60,000 | | | | 17,400 | |
b,c Mizuho Financial Group, 4.60%, 3/27/2024 | | | 5,000,000 | | | | 5,022,075 | |
National City Bank Floating Rate Note, 0.604%, 6/7/2017 | | | 1,000,000 | | | | 992,291 | |
Provident Bank of Maryland, 9.50%, 5/1/2018 | | | 1,500,000 | | | | 1,504,693 | |
c Royal Bank of Scotland Group plc, 9.50%, 3/16/2022 | | | 2,000,000 | | | | 2,345,000 | |
c Royal Bank of Scotland Group plc, 6.125%, 12/15/2022 | | | 2,000,000 | | | | 2,094,554 | |
c Royal Bank of Scotland Group plc, 6.10%, 6/10/2023 | | | 5,000,000 | | | | 5,190,095 | |
b,c Sberbank of Russia, 5.50%, 2/26/2024 | | | 9,000,000 | | | | 8,426,250 | |
| | | | | | | | |
| | | | | | | 37,432,108 | |
| | | | | | | | |
CAPITAL GOODS — 2.83% | | | | | | | | |
Construction & Engineering — 0.55% | | | | | | | | |
b,c Ausdrill Finance Pty Ltd., 6.875%, 11/1/2019 | | | 6,000,000 | | | | 5,460,000 | |
Industrial Conglomerates — 0.71% | | | | | | | | |
b,c Alfa S.A., 5.25%, 3/25/2024 | | | 2,300,000 | | | | 2,357,500 | |
f Otter Tail Corp., 9.00%, 12/15/2016 | | | 4,000,000 | | | | 4,694,764 | |
Machinery — 0.08% | | | | | | | | |
b Waterjet Holdings, Inc., 7.625%, 2/1/2020 | | | 750,000 | | | | 795,000 | |
Trading Companies & Distributors — 1.49% | | | | | | | | |
b Aviation Capital Group Corp., 6.75%, 4/6/2021 | | | 2,500,000 | | | | 2,758,127 | |
b Aviation Capital Group Corp., 7.125%, 10/15/2020 | | | 1,881,000 | | | | 2,109,273 | |
c Fly Leasing Ltd., 6.75%, 12/15/2020 | | | 7,500,000 | | | | 7,837,500 | |
b International Lease Finance Corp., 6.50%, 9/1/2014 | | | 2,000,000 | | | | 2,042,500 | |
| | | | | | | | |
| | | | | | | 28,054,664 | |
| | | | | | | | |
COMMERCIAL & PROFESSIONAL SERVICES — 1.57% | | | | | | | | |
Commercial Services & Supplies — 1.18% | | | | | | | | |
Iron Mountain, Inc., 6.00%, 8/15/2023 | | | 3,000,000 | | | | 3,187,500 | |
RR Donnelley & Sons Co., 8.875%, 4/15/2021 | | | 4,500,000 | | | | 5,068,125 | |
RR Donnelley & Sons Co., 7.875%, 3/15/2021 | | | 3,000,000 | | | | 3,435,000 | |
Professional Services — 0.39% | | | | | | | | |
b,g Nielsen Finance, LLC, 5.00%, 4/15/2022 | | | 3,900,000 | | | | 3,909,750 | |
| | | | | | | | |
| | | | | | | 15,600,375 | |
| | | | | | | | |
CONSUMER DURABLES & APPAREL — 0.50% | | | | | | | | |
Leisure Equipment & Products — 0.50% | | | | | | | | |
b Gibson Brands, Inc., 8.875%, 8/1/2018 | | | 4,650,000 | | | | 4,952,250 | |
| | | | | | | | |
| | | | | | | 4,952,250 | |
| | | | | | | | |
CONSUMER SERVICES — 1.72% | | | | | | | | |
Diversified Consumer Services — 0.82% | | | | | | | | |
Coinstar, Inc., 6.00%, 3/15/2019 | | | 5,000,000 | | | | 5,225,000 | |
b,c Nord Anglia Education U.K., 10.25%, 4/1/2017 | | | 2,600,000 | | | | 2,899,000 | |
Hotels, Restaurants & Leisure — 0.90% | | | | | | | | |
b,c Arcos Dorados Holdings I, 6.625%, 9/27/2023 | | | 8,000,000 | | | | 8,200,000 | |
b Churchill Downs, Inc., 5.375%, 12/15/2021 | | | 750,000 | | | | 765,000 | |
| | | | | | | | |
| | | | | | | 17,089,000 | |
| | | | | | | | |
DIVERSIFIED FINANCIALS — 5.67% | | | | | | | | |
Capital Markets — 1.98% | | | | | | | | |
Ares Capital Corp., 4.875%, 11/30/2018 | | | 7,000,000 | | | | 7,230,041 | |
b,c BTG Investments LP, 4.50%, 4/17/2018 | | | 5,000,000 | | | | 4,850,000 | |
b,c Macquarie Group Ltd., 7.30%, 8/1/2014 | | | 1,000,000 | | | | 1,021,772 | |
Merrill Lynch & Co., 0.788%, 5/2/2017 | | | 2,500,000 | | | | 2,446,720 | |
Nationstar Mortgage Capital Corp., 9.625%, 5/1/2019 | | | 3,000,000 | | | | 3,315,000 | |
Oppenheimer Holdings, Inc., 8.75%, 4/15/2018 | | | 775,000 | | | | 825,375 | |
Consumer Finance — 2.09% | | | | | | | | |
Ally Financial, Inc., 4.75%, 9/10/2018 | | | 4,000,000 | | | | 4,230,000 | |
b,c Banque PSA Finance, 5.75%, 4/4/2021 | | | 7,700,000 | | | | 8,038,030 | |
12 Certified Semi-Annual Report
| | |
| Schedule of Investments, continued | | |
| |
Thornburg Strategic Income Fund | | March 31, 2014 (Unaudited) |
| | | | | | | | |
| | | SHARES/
PRINCIPAL
AMOUNT | | | VALUE | |
b,c DFS Funding Corp. Floating Rate Note, 1.058%, 6/15/2015 | | $ | 500,000 | | | $ | 488,930 | |
b First Cash Financial Services, Inc., 6.75%, 4/1/2021 | | | 7,800,000 | | | | 7,995,000 | |
Diversified Financial Services — 1.60% | | | | | | | | |
b,c CFG Holdings Ltd./CFG Finance, LLC, 11.50%, 11/15/2019 | | | 4,000,000 | | | | 4,300,000 | |
b Citicorp, 8.04%, 12/15/2019 | | | 250,000 | | | | 296,638 | |
Citigroup, Inc., 5.00%, 9/15/2014 | | | 750,000 | | | | 764,524 | |
d Counts Trust, Series 1998 II-A, 6.67%, 2/15/2018 | | | 410,631 | | | | 425,332 | |
f JP Morgan Chase & Co., 6.75%, 12/31/2049 | | | 7,500,000 | | | | 7,893,750 | |
b TMX Finance, LLC/Titlemax Finance, 8.50%, 9/15/2018 | | | 2,000,000 | | | | 2,190,000 | |
| | | | | | | | |
| | | | | | | 56,311,112 | |
| | | | | | | | |
ENERGY — 7.91% | | | | | | | | |
Energy Equipment & Services — 1.62% | | | | | | | | |
b,c Anton Oilfield Services Group, 7.50%, 11/6/2018 | | | 7,000,000 | | | | 7,315,000 | |
c Floatel International Ltd., 8.00%, 10/11/2017 | | | 4,900,000 | | | | 5,169,500 | |
b,c Schahin II Finance Co. (SPV) Ltd., 5.875%, 9/25/2023 | | | 3,714,667 | | | | 3,580,010 | |
Oil, Gas & Consumable Fuels — 6.29% | | | | | | | | |
Atlas Energy Holdings Operating Co., LLC, 7.75%, 1/15/2021 | | | 3,000,000 | | | | 3,150,000 | |
b Aurora USA Oil and Gas, Inc., 7.50%, 4/1/2020 | | | 3,000,000 | | | | 3,307,500 | |
b Aurora USA Oil and Gas, Inc., 9.875%, 2/15/2017 | | | 3,000,000 | | | | 3,307,500 | |
Energy Transfer Partners LP, 8.50%, 4/15/2014 | | | 500,000 | | | | 501,306 | |
Energy Transfer Partners LP, 3.255%, 11/1/2066 | | | 2,000,000 | | | | 1,830,000 | |
Enterprise Products Operating LP, 7.034%, 1/15/2068 | | | 1,400,000 | | | | 1,585,500 | |
b Gastar Exploration USA, Inc., 8.625%, 5/15/2018 | | | 5,000,000 | | | | 5,125,000 | |
b,c Gazprom Neft OAO, 6.00%, 11/27/2023 | | | 3,000,000 | | | | 2,940,000 | |
a,b,e Green Field Energy Services, 13.00%, 11/15/2016 | | | 2,000,000 | | | | 140,000 | |
a,b,e Green Field Energy Services, 13.25%, 11/15/2016 | | | 48,000 | | | | 3,360 | |
b Linc Energy U.S.A./Linc Energy Finance, 12.50%, 10/31/2017 | | | 3,000,000 | | | | 3,300,000 | |
b Maritimes & Northeast Pipeline, LLC, 7.50%, 5/31/2014 | | | 822,800 | | | | 829,755 | |
b NGL Energy Partners LP, 6.875%, 10/15/2021 | | | 6,000,000 | | | | 6,240,000 | |
b,c Odebrecht Offshore Drilling Finance Ltd., 6.75%, 10/1/2022 | | | 8,512,875 | | | | 8,832,108 | |
c Petrobras Global Finance B.V., 2.593%, 3/17/2017 | | | 8,300,000 | | | | 8,331,125 | |
c Petrobras Global Finance B.V., 3.00%, 1/15/2019 | | | 1,000,000 | | | | 945,059 | |
Plains All American Pipeline LP, 8.75%, 5/1/2019 | | | 1,000,000 | | | | 1,278,056 | |
b,c QGOG Atlantic/Alaskan Rigs Ltd., 5.25%, 7/30/2019 | | | 1,362,400 | | | | 1,407,359 | |
RAAM Global Energy Co., 12.50%, 10/1/2015 | | | 2,000,000 | | | | 2,060,000 | |
b Rockies Express Pipeline, LLC, 6.85%, 7/15/2018 | | | 2,000,000 | | | | 2,065,000 | |
b Rockies Express Pipeline, LLC, 3.90%, 4/15/2015 | | | 2,000,000 | | | | 2,015,000 | |
Tennessee Gas Pipeline Co., 8.00%, 2/1/2016 | | | 1,000,000 | | | | 1,116,146 | |
Tesoro Logistics LP, 6.125%, 10/15/2021 | | | 2,000,000 | | | | 2,120,000 | |
| | | | | | | | |
| | | | | | | 78,494,284 | |
| | | | | | | | |
FOOD, BEVERAGE & TOBACCO — 2.41% | | | | | | | | |
Beverages — 0.53% | | | | | | | | |
b,c Central America Bottling Corp., 6.75%, 2/9/2022 | | | 5,000,000 | | | | 5,250,000 | |
Food Products — 1.56% | | | | | | | | |
b,c Alicorp S.A.A., 3.875%, 3/20/2023 | | | 5,425,000 | | | | 5,045,250 | |
b,c Barry Callebaut Services NV, 5.50%, 6/15/2023 | | | 4,000,000 | | | | 4,164,560 | |
Bunge Ltd. Finance Co., 5.10%, 7/15/2015 | | | 321,000 | | | | 337,312 | |
b,c Comfeed Finance B.V., 6.00%, 5/2/2018 | | | 2,000,000 | | | | 1,925,000 | |
b Southern States Cooperative, Inc., 10.00%, 8/15/2021 | | | 4,000,000 | | | | 4,015,000 | |
Tobacco — 0.32% | | | | | | | | |
Vector Group Ltd., 7.75%, 2/15/2021 | | | 3,000,000 | | | | 3,225,000 | |
| | | | | | | | |
| | | | | | | 23,962,122 | |
| | | | | | | | |
HEALTH CARE EQUIPMENT & SERVICES — 1.30% | | | | | | | | |
Health Care Providers & Services — 0.38% | | | | | | | | |
b Prospect Medical Holdings, Inc., 8.375%, 5/1/2019 | | | 3,500,000 | | | | 3,832,500 | |
Health Care Services — 0.92% | | | | | | | | |
c Catamaran Corp., 4.75%, 3/15/2021 | | | 9,000,000 | | | | 9,123,750 | |
| | | | | | | | |
| | | | | | | 12,956,250 | |
| | | | | | | | |
INSURANCE — 0.94% | | | | | | | | |
Insurance — 0.94% | | | | | | | | |
b Forethought Financial Group, Inc., 8.625%, 4/15/2021 | | | 1,330,000 | | | | 1,501,517 | |
Certified Semi-Annual Report 13
| | |
| Schedule of Investments, continued | | |
| |
Thornburg Strategic Income Fund | | March 31, 2014 (Unaudited) |
| | | | | | | | |
| | | SHARES/
PRINCIPAL
AMOUNT | | | VALUE | |
b,c Lancashire Holdings Ltd., 5.70%, 10/1/2022 | | $ | 4,000,000 | | | $ | 4,115,343 | |
b National Life Insurance of Vermont, 10.50%, 9/15/2039 | | | 1,000,000 | | | | 1,389,141 | |
b Prudential Holdings, LLC, 8.695%, 12/18/2023 | | | 559,929 | | | | 705,350 | |
b ZFS Finance USA Trust II, 6.45%, 12/15/2065 | | | 1,460,000 | | | | 1,573,150 | |
| | | | | | | | |
| | | | | | | 9,284,501 | |
| | | | | | | | |
MATERIALS — 4.69% | | | | | | | | |
Chemicals — 0.35% | | | | | | | | |
b Iracore International Holdings, Inc., 9.50%, 6/1/2018 | | | 3,250,000 | | | | 3,453,125 | |
Construction Materials — 0.10% | | | | | | | | |
b Wesco Distribution, Inc., 5.375%, 12/15/2021 | | | 1,000,000 | | | | 1,022,500 | |
Metals & Mining — 3.66% | | | | | | | | |
c Anglogold Holdings, 8.50%, 7/30/2020 | | | 5,000,000 | | | | 5,513,750 | |
c ArcelorMittal, 10.35%, 6/1/2019 | | | 1,000,000 | | | | 1,266,250 | |
Coeur d’Alene Mines Corp., 7.875%, 2/1/2021 | | | 2,563,000 | | | | 2,575,815 | |
b Glencore Funding, LLC Floating Rate Note, 1.599%, 1/15/2019 | | | 5,000,000 | | | | 4,983,980 | |
b,c Newcrest Finance Property Ltd., 4.45%, 11/15/2021 | | | 3,000,000 | | | | 2,685,843 | |
b,c Newcrest Finance Property Ltd., 4.20%, 10/1/2022 | | | 7,000,000 | | | | 6,038,333 | |
b,c OJSC Novolipetsk Steel, 4.45%, 2/19/2018 | | | 6,000,000 | | | | 5,850,000 | |
c Rio Tinto Alcan, Inc., 5.00%, 6/1/2015 | | | 50,000 | | | | 52,344 | |
b,c Samarco Mineracao S.A., 4.125%, 11/1/2022 | | | 8,000,000 | | | | 7,360,000 | |
Paper & Forest Products — 0.58% | | | | | | | | |
b Neenah Paper, Inc., 5.25%, 5/15/2021 | | | 5,820,000 | | | | 5,790,900 | |
| | | | | | | | |
| | | | | | | 46,592,840 | |
| | | | | | | | |
MEDIA — 1.44% | | | | | | | | |
Media — 1.44% | | | | | | | | |
Comcast Holdings Corp., 2.00%, 10/15/2029 | | | 15,500,000 | | | | 6,806,050 | |
The Washington Post Co., 7.25%, 2/1/2019 | | | 500,000 | | | | 585,460 | |
c TV Azteca S.A. de C.V., 7.625%, 9/18/2020 | | | 1,580,000 | | | | 1,655,050 | |
c TV Azteca SAB de CV, 7.50%, 5/25/2018 | | | 5,000,000 | | | | 5,268,750 | |
| | | | | | | | |
| | | | | | | 14,315,310 | |
| | | | | | | | |
PHARMACEUTICALS, BIOTECHNOLOGY & LIFE SCIENCES — 0.82% | | | | | |
Pharmaceuticals — 0.82% | | | | | | | | |
b,d Atlas U.S. Royalty, LLC, 12.25%, 3/15/2027 | | | 5,450,000 | | | | 5,236,360 | |
b,c CFR International SpA Co., 5.125%, 12/6/2022 | | | 3,000,000 | | | | 2,898,018 | |
| | | | | | | | |
| | | | | | | 8,134,378 | |
| | | | | | | | |
REAL ESTATE — 0.67% | | | | | | | | |
Real Estate Investment Trusts — 0.67% | | | | | | | | |
EPR Properties, 5.25%, 7/15/2023 | | | 5,000,000 | | | | 5,080,970 | |
Retail Opportunity Investments Corp., 5.00%, 12/15/2023 | | | 1,500,000 | | | | 1,555,491 | |
| | | | | | | | |
| | | | | | | 6,636,461 | |
| | | | | | | | |
RETAILING — 1.11% | | | | | | | | |
Distributors — 0.60% | | | | | | | | |
b LKQ Corp., Inc., 4.75%, 5/15/2023 | | | 6,254,000 | | | | 5,925,665 | |
Multiline Retail — 0.51% | | | | | | | | |
b,c Grupo Famsa S.A.B. de C.V., 7.25%, 6/1/2020 | | | 5,000,000 | | | | 5,062,500 | |
| | | | | | | | |
| | | | | | | 10,988,165 | |
| | | | | | | | |
SEMICONDUCTORS & SEMICONDUCTOR EQUIPMENT — 0.21% | | | | | | | | |
Semiconductors & Semiconductor Equipment — 0.21% | | | | | | | | |
b,c Global A&T Electronics Ltd., 10.00%, 2/1/2019 | | | 2,500,000 | | | | 2,043,750 | |
| | | | | | | | |
| | | | | | | 2,043,750 | |
| | | | | | | | |
SOFTWARE & SERVICES — 1.50% | | | | | | | | |
Information Technology Services — 0.70% | | | | | | | | |
Neustar, Inc., 4.50%, 1/15/2023 | | | 8,000,000 | | | | 6,940,000 | |
Internet Software & Services — 0.80% | | | | | | | | |
Lending Processing Services/Black Knight, 5.75%, 4/15/2023 | | | 7,500,000 | | | | 7,996,875 | |
| | | | | | | | |
| | | | | | | 14,936,875 | |
| | | | | | | | |
14 Certified Semi-Annual Report
| | |
| Schedule of Investments, continued | | |
| |
Thornburg Strategic Income Fund | | March 31, 2014 (Unaudited) |
| | | | | | | | |
| | | SHARES/
PRINCIPAL
AMOUNT | | | VALUE | |
TECHNOLOGY HARDWARE & EQUIPMENT — 0.32% | | | | | | | | |
Computers & Peripherals — 0.32% | | | | | | | | |
Lexmark International, Inc., 5.125%, 3/15/2020 | | $ | 3,000,000 | | | $ | 3,134,814 | |
| | | | | | | | |
| | | | | | | 3,134,814 | |
| | | | | | | | |
TELECOMMUNICATION SERVICES — 4.53% | | | | | | | | |
Diversified Telecommunication Services — 1.62% | | | | | | | | |
b GTP Acquisition Partners I, LLC, 4.704%, 5/15/2043 | | | 1,000,000 | | | | 1,012,882 | |
Level 3 Communications, Inc., 11.875%, 2/1/2019 | | | 1,000,000 | | | | 1,130,000 | |
Level 3 Communications, Inc., 8.875%, 6/1/2019 | | | 1,000,000 | | | | 1,098,750 | |
c Telefonica Emisiones SAU, 5.134%, 4/27/2020 | | | 1,000,000 | | | | 1,081,125 | |
c Telefonica Emisiones SAU, 3.992%, 2/16/2016 | | | 1,000,000 | | | | 1,048,597 | |
c Telefonica Emisiones SAU, 6.221%, 7/3/2017 | | | 2,000,000 | | | | 2,262,336 | |
c Telefonica Emisiones SAU, 6.421%, 6/20/2016 | | | 1,000,000 | | | | 1,106,732 | |
b,c,g Videotron Ltd. Co., 5.375%, 6/15/2024 | | | 7,300,000 | | | | 7,336,500 | |
Wireless Telecommunication Services — 2.91% | | | | | | | | |
b,c Bharti Airtel International, 5.125%, 3/11/2023 | | | 6,000,000 | | | | 5,962,500 | |
b,c Comcel Trust Co., 6.875%, 2/6/2024 | | | 3,850,000 | | | | 4,028,062 | |
b,c MTS International Funding Ltd., 5.00%, 5/30/2023 | | | 6,000,000 | | | | 5,550,000 | |
b,c VimpelCom (UBS SA), 8.25%, 5/23/2016 | | | 500,000 | | | | 521,250 | |
b,c VimpelCom Holdings B.V., 7.504%, 3/1/2022 | | | 2,000,000 | | | | 2,027,200 | |
b,f WCP Issuer, LLC, 7.143%, 8/15/2043 | | | 6,000,000 | | | | 6,382,500 | |
b WCP Wireless Site Fund, 6.829%, 11/15/2040 | | | 4,240,000 | | | | 4,431,695 | |
| | | | | | | | |
| | | | | | | 44,980,129 | |
| | | | | | | | |
TRANSPORTATION — 3.56% | | | | | | | | |
Airlines — 2.55% | | | | | | | | |
b American Airlines, 5.60%, 1/15/2022 | | | 7,308,327 | | | | 7,618,931 | |
b American Airlines, 4.95%, 7/15/2024 | | | 2,911,201 | | | | 3,122,263 | |
Hawaiian Airlines, 4.95%, 1/15/2022 | | | 3,000,000 | | | | 2,880,000 | |
US Airways, 7.076%, 9/20/2022 | | | 2,164,212 | | | | 2,413,096 | |
US Airways, 5.90%, 4/1/2026 | | | 1,920,929 | | | | 2,146,638 | |
US Airways, 6.25%, 10/22/2024 | | | 1,677,208 | | | | 1,895,245 | |
b,c Virgin Australia, 5.00%, 4/23/2025 | | | 5,000,000 | | | | 5,275,000 | |
Marine — 0.47% | | | | | | | | |
b,c Stena International SA, 5.75%, 3/1/2024 | | | 4,650,000 | | | | 4,638,375 | |
Road & Rail — 0.54% | | | | | | | | |
b,c Empresa De Transportes, 4.75%, 2/4/2024 | | | 800,000 | | | | 830,902 | |
b J.B. Poindexter & Co., Inc., 9.00%, 4/1/2022 | | | 4,250,000 | | | | 4,547,500 | |
| | | | | | | | |
| | | | | | | 35,367,950 | |
| | | | | | | | |
UTILITIES — 3.05% | | | | | | | | |
Electric Utilities — 1.36% | | | | | | | | |
Alabama Power Capital Trust V, 3.347%, 10/1/2042 | | | 700,000 | | | | 654,073 | |
b Duquesne Light Holdings, 6.40%, 9/15/2020 | | | 2,000,000 | | | | 2,328,294 | |
b,c Enel Finance International S.A., 6.25%, 9/15/2017 | | | 1,500,000 | | | | 1,697,025 | |
Metropolitan Edison Co., 7.70%, 1/15/2019 | | | 250,000 | | | | 300,354 | |
PNM Resources, Inc., 9.25%, 5/15/2015 | | | 3,070,000 | | | | 3,354,006 | |
Puget Energy, Inc., 5.625%, 7/15/2022 | | | 2,500,000 | | | | 2,849,222 | |
Puget Energy, Inc., 6.50%, 12/15/2020 | | | 2,000,000 | | | | 2,331,874 | |
Gas Utilities — 0.35% | | | | | | | | |
b Source Gas, LLC., 5.90%, 4/1/2017 | | | 1,250,000 | | | | 1,320,735 | |
b Southern Star Central Gas Pipeline, Inc., 6.00%, 6/1/2016 | | | 2,000,000 | | | | 2,167,724 | |
Independent Power & Renewable Electricity — 0.68% | | | | | | | | |
b,c Inkia Energy Ltd., 8.375%, 4/4/2021 | | | 2,000,000 | | | | 2,160,000 | |
Ipalco Enterprises, Inc., 5.00%, 5/1/2018 | | | 2,500,000 | | | | 2,643,750 | |
b Midland Cogeneration Venture, 6.00%, 3/15/2025 | | | 1,843,536 | | | | 1,929,852 | |
Multi-Utilities — 0.66% | | | | | | | | |
CMS Energy Corp., 8.75%, 6/15/2019 | | | 2,000,000 | | | | 2,567,360 | |
b Enogex, LLC, 6.875%, 7/15/2014 | | | 1,000,000 | | | | 1,015,084 | |
b Topaz Solar Farms, LLC, 4.875%, 9/30/2039 | | | 3,000,000 | | | | 2,926,719 | |
| | | | | | | | |
| | | | | | | 30,246,072 | |
| | | | | | | | |
TOTAL CORPORATE BONDS (Cost $485,606,267) | | | | | | | 501,513,410 | |
| | | | | | | | |
Certified Semi-Annual Report 15
| | |
| Schedule of Investments, continued | | |
| |
Thornburg Strategic Income Fund | | March 31, 2014 (Unaudited) |
| | | | | | | | |
| | | SHARES/
PRINCIPAL
AMOUNT | | | VALUE | |
CONVERTIBLE BONDS — 1.55% | | | | | | | | |
| | |
MATERIALS — 0.01% | | | | | | | | |
Metals & Mining — 0.01% | | | | | | | | |
a,b,c,e Jaguar Mining, Inc., 4.50%, 11/1/2014 | | $ | 2,000,000 | | | $ | 100,000 | |
| | | | | | | | |
| | | | | | | 100,000 | |
| | | | | | | | |
PHARMACEUTICALS, BIOTECHNOLOGY & LIFE SCIENCES — 0.72% | | | | | |
Pharmaceuticals — 0.72% | | | | | | | | |
Pacira Pharmaceuticals, Inc., 3.25%, 2/1/2019 | | | 2,500,000 | | | | 7,110,937 | |
| | | | | | | | |
| | | | | | | 7,110,937 | |
| | | | | | | | |
REAL ESTATE — 0.81% | | | | | | | | |
Real Estate Investment Trusts — 0.81% | | | | | | | | |
American Realty Capital Properties, Inc., 3.00%, 8/1/2018 | | | 3,000,000 | | | | 3,191,250 | |
b IAS Operating Partnership LP, 5.00%, 3/15/2018 | | | 5,000,000 | | | | 4,825,000 | |
| | | | | | | | |
| | | | | | | 8,016,250 | |
| | | | | | | | |
TELECOMMUNICATION SERVICES — 0.01% | | | | | | | | |
Diversified Telecommunication Services — 0.01% | | | | | | | | |
b Alaska Communication Systems Group, Inc., 6.25%, 5/1/2018 | | | 154,000 | | | | 127,628 | |
| | | | | | | | |
| | | | | | | 127,628 | |
| | | | | | | | |
TOTAL CONVERTIBLE BONDS (Cost $12,574,085) | | | | | | | 15,354,815 | |
| | | | | | | | |
| | |
WARRANTS — 0.02% | | | | | | | | |
a,d Alexza Pharmaceuticals, Inc. | | | 41,863 | | | | 185,453 | |
a,b Green Field Energy Services | | | 2,000 | | | | 2,020 | |
| | | | | | | | |
TOTAL WARRANTS (Cost $292,058) | | | | | | | 187,473 | |
| | | | | | | | |
| | |
MUNICIPAL BONDS — 0.94% | | | | | | | | |
California Health Facilities Financing Authority (Developmental Disabilities), 7.875%, 2/1/2026 | | | 1,940,000 | | | | 2,167,698 | |
Los Angeles California Municipal Improvement Corp. (Build America Bonds), 6.165%, 11/1/2020 | | | 1,885,000 | | | | 2,048,976 | |
b Midwest Family Housing, 5.168%, 7/1/2016 | | | 405,000 | | | | 423,094 | |
Oakland California Redevelopment Agency, 8.00%, 9/1/2016 | | | 1,000,000 | | | | 1,106,620 | |
Oklahoma Development Finance Authority, 8.00%, 5/1/2020 | | | 1,185,000 | | | | 1,196,755 | |
San Bernardino County California Redevelopment Agency (San Sevaine), 8.45%, 9/1/2030 | | | 2,000,000 | | | | 2,163,740 | |
Wisconsin State Health & Educational Facilities Authority (Richland Hospital), 7.08%, 6/1/2016 | | | 265,000 | | | | 261,240 | |
| | | | | | | | |
TOTAL MUNICIPAL BONDS (Cost $8,566,586) | | | | | | | 9,368,123 | |
| | | | | | | | |
| | |
U.S. TREASURY SECURITIES — 0.21% | | | | | | | | |
U.S. Treasury, 2.25%, 1/31/2015 | | | 2,000,000 | | | | 2,035,312 | |
| | | | | | | | |
TOTAL U.S. TREASURY SECURITIES (Cost $1,998,525) | | | | | | | 2,035,312 | |
| | | | | | | | |
| | |
OTHER GOVERNMENT — 0.47% | | | | | | | | |
b,c Brazilian Development Bank (BNDES), 3.375%, 9/26/2016 | | | 2,000,000 | | | | 2,037,500 | |
b,c Eurasian Development Bank, 5.00%, 9/26/2020 | | | 2,000,000 | | | | 1,985,200 | |
b,c Republic of Iceland, 4.875%, 6/16/2016 | | | 625,000 | | | | 658,594 | |
| | | | | | | | |
TOTAL OTHER GOVERNMENT (Cost $4,587,997) | | | | | | | 4,681,294 | |
| | | | | | | | |
| | |
MORTGAGE BACKED — 0.10% | | | | | | | | |
Federal National Mtg Assoc., CMO Series 1994-37 Class L, 6.50%, 3/25/2024 | | | 4,930 | | | | 5,452 | |
d Reilly 1997 A Mtg, 6.896%, 7/1/2020 | | | 934,807 | | | | 972,200 | |
| | | | | | | | |
TOTAL MORTGAGE BACKED (Cost $965,582) | | | | | | | 977,652 | |
| | | | | | | | |
| | |
FOREIGN BONDS — 7.79% | | | | | | | | |
| | |
BANKS — 0.53% | | | | | | | | |
Banks — 0.53% | | | | | | | | |
b Banco Santander Brasil S.A. (BRL), 8.00%, 3/18/2016 | | | 13,000,000 | | | | 5,292,530 | |
| | | | | | | | |
| | | | | | | 5,292,530 | |
| | | | | | | | |
CAPITAL GOODS — 0.38% | | | | | | | | |
Trading Companies & Distributors — 0.38% | | | | | | | | |
b,d Wajax Corp. (CAD), 6.125%, 10/23/2020 | | | 4,000,000 | | | | 3,772,049 | |
| | | | | | | | |
| | | | | �� | | 3,772,049 | |
| | | | | | | | |
16 Certified Semi-Annual Report
| | |
| Schedule of Investments, continued | | |
| |
Thornburg Strategic Income Fund | | March 31, 2014 (Unaudited) |
| | | | | | | | |
| | | SHARES/
PRINCIPAL
AMOUNT | | | VALUE | |
COMMERCIAL SERVICES & SUPPLIES — 0.55% | | | | | | | | |
Diversified Support Services — 0.55% | | | | | | | | |
d,g Lavare Holding AB (SEK), 5.916%, 4/4/2019 | | $ | 35,000,000 | | | $ | 5,434,699 | |
| | | | | | | | |
| | | | | | | 5,434,699 | |
| | | | | | | | |
CONSUMER SERVICES — 0.33% | | | | | | | | |
Hotels, Restaurants & Leisure — 0.33% | | | | | | | | |
b Arcos Dorados Holdings, Inc. (BRL), 10.25%, 7/13/2016 | | | 8,000,000 | | | | 3,234,905 | |
| | | | | | | | |
| | | | | | | 3,234,905 | |
| | | | | | | | |
DIVERSIFIED FINANCIALS — 1.60% | | | | | | | | |
Consumer Finance — 0.42% | | | | | | | | |
b Cash Store Financial (CAD), 11.50%, 1/31/2017 | | | 1,750,000 | | | | 350,744 | |
b Lowell Group Financing plc (GBP), 10.75%, 4/1/2019 | | | 2,000,000 | | | | 3,776,095 | |
Diversified Financial Services — 1.18% | | | | | | | | |
General Electric Capital Corp. (MXN), 8.50%, 4/6/2018 | | | 80,000,000 | | | | 6,780,284 | |
KFW (BRL), 5.375%, 9/14/2015 | | | 12,000,000 | | | | 4,954,271 | |
| | | | | | | | |
| | | | | | | 15,861,394 | |
| | | | | | | | |
FOOD & STAPLES RETAILING — 0.68% | | | | | | | | |
Food & Staples Retailing — 0.68% | | | | | | | | |
Wesfarmers Ltd. (AUD), 5.245%, 9/11/2014 | | | 1,300,000 | | | | 1,216,273 | |
b Bakkavor Finance 2 plc (GBP), 8.75%, 6/15/2020 | | | 3,000,000 | | | | 5,576,617 | |
| | | | | | | | |
| | | | | | | 6,792,890 | |
| | | | | | | | |
FOOD, BEVERAGE & TOBACCO — 0.17% | | | | | | | | |
Beverages — 0.17% | | | | | | | | |
Ambev International Finance Co., Ltd. (BRL), 9.50%, 7/24/2017 | | | 2,000,000 | | | | 838,431 | |
Anheuser-Busch InBev (BRL), 9.75%, 11/17/2015 | | | 2,000,000 | | | | 872,631 | |
| | | | | | | | |
| | | | | | | 1,711,062 | |
| | | | | | | | |
INSURANCE — 0.19% | | | | | | | | |
Insurance — 0.19% | | | | | | | | |
ELM B.V. (AUD), 7.635%, 12/31/2049 | | | 1,000,000 | | | | 969,829 | |
ELM B.V. (AUD), 3.775%, 12/31/2049 | | | 1,000,000 | | | | 885,790 | |
| | | | | | | | |
| | | | | | | 1,855,619 | |
| | | | | | | | |
MEDIA — 0.15% | | | | | | | | |
Media — 0.15% | | | | | | | | |
b CET 21 SPOL S.R.O. (EUR), 9.00%, 11/1/2017 | | | 1,000,000 | | | | 1,474,085 | |
| | | | | | | | |
| | | | | | | 1,474,085 | |
| | | | | | | | |
MISCELLANEOUS — 1.69% | | | | | | | | |
Miscellaneous — 1.69% | | | | | | | | |
BK Nederlandse Gemeenten N.V. (NOK), 4.00%, 5/15/2015 | | | 5,000,000 | | | | 853,235 | |
International Bank for Reconstruction and Development (BRL), 9.00%, 4/28/2014 | | | 1,000,000 | | | | 440,194 | |
Kommunalbanken AS (NOK), 4.00%, 1/26/2015 | | | 5,000,000 | | | | 848,859 | |
Mexican Bonos (MXN), 5.00%, 6/15/2017 | | | 130,000,000 | | | | 10,144,938 | |
Norwegian Government (NOK), 4.25%, 5/19/2017 | | | 25,000,000 | | | | 4,493,178 | |
| | | | | | | | |
| | | | | | | 16,780,404 | |
| | | | | | | | |
TELECOMMUNICATION SERVICES — 0.86% | | | | | | | | |
Wireless Telecommunication Services — 0.86% | | | | | | | | |
America Movil Sab de CV (MXN), 6.45%, 12/5/2022 | | | 120,000,000 | | | | 8,560,879 | |
| | | | | | | | |
| | | | | | | 8,560,879 | |
| | | | | | | | |
TRANSPORTATION — 0.66% | | | | | | | | |
Airlines — 0.66% | | | | | | | | |
d Iberbond 2004 plc (EUR), 4.235%, 12/24/2017 | | | 4,749,686 | | | | 6,608,836 | |
| | | | | | | | |
| | | | | | | 6,608,836 | |
| | | | | | | | |
TOTAL FOREIGN BONDS (Cost $80,198,763) | | | | | | | 77,379,352 | |
| | | | | | | | |
| | |
OTHER SECURITIES — 8.99% | | | | | | | | |
Loan Participations — 8.99% | | | | | | | | |
5.11, Inc., 6.00%, 2/28/2020 | | | 2,000,000 | | | | 2,010,000 | |
Affinion Group, Inc., 5.00%-7.50%, 4/9/2015 (Note 2) | | | 3,515,152 | | | | 3,339,394 | |
Alvogen Pharma US, Inc., 7.00%, 5/23/2018 | | | 4,878,345 | | | | 4,908,835 | |
Certified Semi-Annual Report 17
| | |
| Schedule of Investments, continued | | |
| |
Thornburg Strategic Income Fund | | March 31, 2014 (Unaudited) |
| | | | | | | | |
| | | SHARES/
PRINCIPAL
AMOUNT | | | VALUE | |
Baker & Taylor Acquisitions Corp., 12.00%, 9/28/2016 | | $ | 5,000,000 | | | $ | 5,062,500 | |
BBTS Borrower LP, 7.75%, 5/31/2019 | | | 2,960,050 | | | | 2,985,033 | |
Del Monte Foods, Inc., 8.25%, 8/18/2021 | | | 2,000,000 | | | | 1,987,500 | |
Extreme Reach, Inc., 6.75%, 2/10/2020 | | | 5,400,000 | | | | 5,508,000 | |
Laureate Education, Inc., 5.00%, 6/15/2018 | | | 7,024,560 | | | | 6,954,315 | |
c Mood Media Corp., 7.00%, 5/6/2018 | | | 6,775,602 | | | | 6,826,419 | |
NCP Finance LP, 11.00%, 9/30/2018 | | | 2,985,000 | | | | 2,970,075 | |
North Atlantic Trading Co., Inc., 6.836%-8.75%, 12/30/2019 | | | 7,500,000 | | | | 7,556,250 | |
OCI Beaumont, LLC, 6.25%, 8/20/2019 | | | 3,593,056 | | | | 3,628,986 | |
c Pacific Industrial Service, 8.75%, 4/2/2019 | | | 2,000,000 | | | | 2,047,500 | |
Peroxygens Business Unit, 7.50%, 2/13/2020 | | | 5,000,000 | | | | 5,000,000 | |
Pitney Bowes Management, 7.50%, 10/1/2019 | | | 5,970,000 | | | | 5,999,850 | |
d Private Restaurants Properties, Inc., 9.00%, 4/10/2017 | | | 2,940,490 | | | | 2,969,895 | |
RCS Capital Corp., 10.50%, 1/16/2021 | | | 2,300,000 | | | | 2,349,841 | |
Rue21, Inc., 5.625%, 10/9/2020 | | | 2,985,000 | | | | 2,490,983 | |
Sorenson Communications, Inc., 11.50%, 10/31/2014 | | | 2,481,250 | | | | 2,487,453 | |
SourceHov, LLC, 8.75%, 4/30/2019 | | | 1,500,000 | | | | 1,533,750 | |
c Stena International S.A., 4.00%, 3/3/2021 | | | 4,650,000 | | | | 4,638,375 | |
d Synergy Aerospace Corp., 7.50%, 3/3/2015 | | | 4,000,000 | | | | 3,980,000 | |
Topps Co, Inc., 7.25%, 10/2/2020 | | | 1,995,000 | | | | 1,995,000 | |
Weight Watchers International, Inc., 4.00%, 4/2/2020 | | | 10,050 | | | | 7,775 | |
| | | | | | | | |
TOTAL OTHER SECURITIES (Cost $87,645,820) | | | | | | | 89,237,729 | |
| | | | | | | | |
| | |
SHORT TERM INVESTMENTS — 9.57% | | | | | | | | |
Ameren Corp., 0.25%, 4/1/2014 | | | 14,000,000 | | | | 14,000,000 | |
Bank of New York Tri-Party Repurchase Agreement 0.24% dated 3/31/2014, due 4/1/2014, repurchase price $14,000,093 collateralized by 13 corporate debt securities and 7 U.S. Government debt securities having an average coupon of 4.01%, a minimum credit rating of BBB-, maturity dates from 6/15/2016 to 3/30/2044, and having an aggregate market value of $14,810,725 at 3/31/2014 | | | 14,000,000 | | | | 14,000,000 | |
CBS Corp., 0.21%, 4/2/2014 | | | 14,000,000 | | | | 13,999,918 | |
Hitachi America Capital, 0.22%, 4/3/2014 | | | 14,000,000 | | | | 13,999,829 | |
Kansas City Power & Light, 0.19%, 4/1/2014 | | | 11,000,000 | | | | 11,000,000 | |
Union Electric Co., 0.20%, 4/1/2014 | | | 14,000,000 | | | | 14,000,000 | |
Volvo Group Treasury, 0.25%, 4/7/2014 | | | 14,000,000 | | | | 13,999,417 | |
| | | | | | | | |
TOTAL SHORT TERM INVESTMENTS (Cost $94,999,164) | | | | | | | 94,999,164 | |
| | | | | | | | |
TOTAL INVESTMENTS — 98.59% (Cost $961,771,440) | | | | | | $ | 978,738,796 | |
OTHER ASSETS LESS LIABILITIES — 1.41% | | | | | | | 13,990,450 | |
| | | | | | | | |
NET ASSETS — 100.00% | | | | | | $ | 992,729,246 | |
| | | | | | | | |
Footnote Legend
| b | Securities exempt from registration under Rule 144A of the Securities Act of 1933, as amended. These securities may only be resold in the ordinary course of business in transactions exempt from registration, normally to qualified institutional buyers. As of March 31, 2014, the aggregate value of these securities in the Fund’s portfolio was $464,913,531, representing 46.83% of the Fund’s net assets. |
| c | Yankee Bond – Denominated in U.S. dollars and is issued in the U.S. by foreign banks and corporations. |
| d | Security currently fair valued by the Valuation and Pricing Committee using procedures approved by the Trustees. |
| f | Segregated as collateral for a when-issued security. |
18 Certified Semi-Annual Report
| | |
| Schedule of Investments, continued | | |
| |
Thornburg Strategic Income Fund | | March 31, 2014 (Unaudited) |
Portfolio Abbreviations
To simplify the listings of securities, abbreviations are used per the table below:
| | |
| ADR | | American Depository Receipt |
| ARM | | Adjustable Rate Mortgage |
| AUD | | Denominated in Australian Dollars |
| BRL | | Denominated in Brazilian Real |
| CAD | | Denominated in Canadian Dollars |
| CHL | | Denominated in Chilean Peso |
| CMO | | Collateralized Mortgage Obligation |
| EUR | | Denominated in Euros |
| FCB | | Farm Credit Bank |
| GBP | | Denominated in Great Britain Pounds |
| GDR | | Global Depository Receipt |
| Mtg | | Mortgage |
| MXN | | Denominated in Mexican Pesos |
| NOK | | Denominated in Norwegian Krone |
| Pfd | | Preferred Stock |
| REIT | | Real Estate Investment Trust |
| SEK | | Denominated in Swedish Krona |
| SPV | | Special Purpose Vehicle |
See notes to financial statements.
Certified Semi-Annual Report 19
| | |
| Statement of Assets and Liabilities | | |
| |
Thornburg Strategic Income Fund | | March 31, 2014 (Unaudited) |
| | | | |
ASSETS | | | | |
Investments at value (cost $961,771,440) (Note 2) | | $ | 978,738,796 | |
Cash | | | 1,828,318 | |
Cash denominated in foreign currency (cost $3,421) | | | 3,444 | |
Receivable for investments sold | | | 21,950,556 | |
Receivable for fund shares sold | | | 6,301,290 | |
Unrealized appreciation on forward currency contracts (Note 7) | | | 6,205 | |
Dividends receivable | | | 350,330 | |
Interest receivable | | | 11,068,334 | |
Prepaid expenses and other assets | | | 76,145 | |
| | | | |
Total Assets | | | 1,020,323,418 | |
| | | | |
| |
LIABILITIES | | | | |
Payable for investments purchased | | | 22,368,125 | |
Payable for fund shares redeemed | | | 3,069,858 | |
Unrealized depreciation on forward currency contracts (Note 7) | | | 255,953 | |
Payable to investment advisor and other affiliates (Note 3) | | | 910,858 | |
Unfunded line of credit commitment (proceeds $231,941) (Note 2) | | | 324,242 | |
Accounts payable and accrued expenses | | | 82,322 | |
Dividends payable | | | 582,814 | |
| | | | |
Total Liabilities | | | 27,594,172 | |
| | | | |
| |
NET ASSETS | | $ | 992,729,246 | |
| | | | |
NET ASSETS CONSIST OF | | | | |
Undistributed net investment income | | $ | 58,484 | |
Net unrealized appreciation on investments | | | 16,773,383 | |
Accumulated net realized gain (loss) | | | 5,824,354 | |
Net capital paid in on shares of beneficial interest | | | 970,073,025 | |
| | | | |
| | $ | 992,729,246 | |
| | | | |
20 Certified Semi-Annual Report
| | |
| Statement of Assets and Liabilities, Continued | | |
| |
Thornburg Strategic Income Fund | | March 31, 2014 (Unaudited) |
| | | | |
NET ASSET VALUE | | | | |
Class A Shares: | | | | |
Net asset value and redemption price per share
($321,861,075 applicable to 26,458,390 shares of beneficial interest outstanding - Note 4) | | $ | 12.16 | |
Maximum sales charge, 4.50% of offering price | | | 0.57 | |
| | | | |
Maximum offering price per share | | $ | 12.73 | |
| | | | |
| |
Class C Shares: | | | | |
Net asset value and offering price per share*
($282,532,193 applicable to 23,258,616 shares of beneficial interest outstanding - Note 4) | | $ | 12.15 | |
| | | | |
| |
Class I Shares: | | | | |
Net asset value, offering and redemption price per share
($385,829,295 applicable to 31,785,365 shares of beneficial interest outstanding - Note 4) | | $ | 12.14 | |
| | | | |
| |
Class R3 Shares: | | | | |
Net asset value, offering and redemption price per share
($202,633 applicable to 16,655 shares of beneficial interest outstanding - Note 4) | | $ | 12.17 | |
| | | | |
| |
Class R4 Shares: | | | | |
Net asset value, offering and redemption price per share
($15,564 applicable to 1,279 shares of beneficial interest outstanding - Note 4) | | $ | 12.16 | |
| | | | |
| |
Class R5 Shares: | | | | |
Net asset value, offering and redemption price per share
($2,288,486 applicable to 188,592 shares of beneficial interest outstanding - Note 4) | | $ | 12.13 | |
| | | | |
| * | Redemption price per share is equal to net asset value less any applicable contingent deferred sales charge. |
See notes to financial statements.
Certified Semi-Annual Report 21
| | |
| Statement of Operations | | |
| |
Thornburg Strategic Income Fund | | Six Months Ended March 31, 2014 (Unaudited) |
| | | | |
INVESTMENT INCOME | | | | |
Dividend income (net of foreign taxes withheld of $31,008) | | $ | 1,795,922 | |
Interest income (net of premium amortized of $514,564) | | | 22,564,405 | |
| | | | |
Total Income | | | 24,360,327 | |
| | | | |
| |
EXPENSES | | | | |
Investment advisory fees (Note 3) | | | 3,033,576 | |
Administration fees (Note 3) | | | | |
Class A Shares | | | 176,867 | |
Class C Shares | | | 160,228 | |
Class I Shares | | | 75,646 | |
Class R3 Shares | | | 103 | |
Class R4 Shares | | | 3 | |
Class R5 Shares | | | 332 | |
Distribution and service fees (Note 3) | | | | |
Class A Shares | | | 356,093 | |
Class C Shares | | | 1,287,674 | |
Class R3 Shares | | | 431 | |
Class R4 Shares | | | 6 | |
Transfer agent fees | | | | |
Class A Shares | | | 87,635 | |
Class C Shares | | | 90,865 | |
Class I Shares | | | 74,300 | |
Class R3 Shares | | | 1,251 | |
Class R4 Shares | | | 258 | |
Class R5 Shares | | | 1,158 | |
Registration and filing fees | | | | |
Class A Shares | | | 43,018 | |
Class C Shares | | | 16,564 | |
Class I Shares | | | 17,782 | |
Class R3 Shares | | | 10,936 | |
Class R4 Shares | | | 1,710 | |
Class R5 Shares | | | 10,936 | |
Custodian fees (Note 3) | | | 92,700 | |
Professional fees | | | 39,347 | |
Accounting fees | | | 10,915 | |
Trustee fees | | | 11,370 | |
Other expenses | | | 53,703 | |
| | | | |
Total Expenses | | | 5,655,407 | |
Less: | | | | |
Expenses reimbursed by investment advisor (Note 3) | | | (275,573 | ) |
| | | | |
Net Expenses | | | 5,379,834 | |
| | | | |
Net Investment Income | | $ | 18,980,493 | |
| | | | |
22 Certified Semi-Annual Report
| | |
| Statement of Operations, Continued | | |
| |
Thornburg Strategic Income Fund | | Six Months Ended March 31, 2014 (Unaudited) |
| | | | |
REALIZED AND UNREALIZED GAIN (LOSS) | | | | |
Net realized gain (loss) from: | | | | |
Investments | | $ | 11,025,651 | |
Forward currency contracts (Note 7) | | | (655,309 | ) |
Foreign currency transactions | | | (42,003 | ) |
| | | | |
| | | 10,328,339 | |
| | | | |
Net change in unrealized appreciation (depreciation) on: | | | | |
Investments | | | 7,871,252 | |
Foreign currency translations | | | 8,839 | |
Forward currency contracts (Note 7) | | | 168,245 | |
| | | | |
| | | 8,048,336 | |
| | | | |
Net Realized and Unrealized Gain | | | 18,376,675 | |
| | | | |
Net Increase in Net Assets Resulting from Operations | | $ | 37,357,168 | |
| | | | |
See notes to financial statements.
Certified Semi-Annual Report 23
| | |
| Statements of Changes in Net Assets | | |
| |
Thornburg Strategic Income Fund | | |
| | | | | | | | |
| | | SIX MONTHS ENDED
MARCH 31, 2014* | | | YEAR ENDED
SEPTEMBER 30, 2013 | |
INCREASE (DECREASE) IN NET ASSETS FROM | | | | | | | | |
| | |
OPERATIONS | | | | | | | | |
Net investment income | | $ | 18,980,493 | | | $ | 35,737,760 | |
Net realized gain (loss) on investments, forward currency contracts, and foreign currency transactions | | | 10,328,339 | | | | 14,102,145 | |
Net unrealized appreciation (depreciation) on investments, forward currency contracts, and foreign currency translations | | | 8,048,336 | | | | (15,073,927 | ) |
| | | | | | | | |
| | |
Net Increase (Decrease) in Net Assets Resulting from Operations | | | 37,357,168 | | | | 34,765,978 | |
| | |
DIVIDENDS TO SHAREHOLDERS | | | | | | | | |
From net investment income | | | | | | | | |
Class A Shares | | | (6,802,325 | ) | | | (11,912,656 | ) |
Class C Shares | | | (5,443,260 | ) | | | (10,107,088 | ) |
Class I Shares | | | (7,757,574 | ) | | | (12,484,393 | ) |
Class R3 Shares | | | (3,917 | ) | | | (4,342 | ) |
Class R4 Shares | | | (106 | ) | | | — | |
Class R5 Shares | | | (32,449 | ) | | | (611 | ) |
From realized gains | | | | | | | | |
Class A Shares | | | (5,900,030 | ) | | | (2,285,280 | ) |
Class C Shares | | | (5,473,946 | ) | | | (2,208,844 | ) |
Class I Shares | | | (5,939,705 | ) | | | (2,229,497 | ) |
Class R3 Shares | | | (2,935 | ) | | | (396 | ) |
Class R5 Shares | | | (19,145 | ) | | | (120 | ) |
| | |
FUND SHARE TRANSACTIONS (NOTE 4) | | | | | | | | |
Class A Shares | | | 70,869,142 | | | | 53,440,558 | |
Class C Shares | | | 45,637,702 | | | | 50,193,875 | |
Class I Shares | | | 139,126,156 | | | | 57,806,097 | |
Class R3 Shares | | | 30,722 | | | | 159,687 | |
Class R4 Shares | | | 15,356 | | | | — | |
Class R5 Shares | | | 2,271,187 | | | | 730 | |
| | | | | | | | |
| | |
Net Increase in Net Assets | | | 257,932,041 | | | | 155,133,698 | |
| | |
NET ASSETS | | | | | | | | |
Beginning of Period | | | 734,797,205 | | | | 579,663,507 | |
| | | | | | | | |
| | |
End of Period | | $ | 992,729,246 | | | $ | 734,797,205 | |
| | | | | | | | |
| | |
Undistributed net investment income | | $ | 58,484 | | | $ | 1,117,622 | |
See notes to financial statements.
24 Certified Semi-Annual Report
| | |
| Notes to Financial Statements | | |
| |
Thornburg Strategic Income Fund | | March 31, 2014 (Unaudited) |
NOTE 1 – ORGANIZATION
Thornburg Strategic Income Fund, hereinafter referred to as the “Fund,” is a diversified series of Thornburg Investment Trust (the “Trust”). The Fund commenced operations on December 19, 2007. The Trust is organized as a Massachusetts business trust under a Declaration of Trust dated June 3, 1987 and is registered as a diversified, open-end management investment company under the Investment Company Act of 1940, as amended. The Fund is currently one of eighteen separate series of the Trust. Each series is considered to be a separate entity for financial reporting and tax purposes and bears expenses directly attributable to it. The Fund’s primary investment goal is to seek a high level of current income. The Fund’s secondary investment goal is some long-term capital appreciation.
The Fund currently offers six classes of shares of beneficial interest outstanding: Class A, Class C, Institutional Class (“Class I”) and Retirement Classes (“Class R3”, “Class R4”, and “Class R5”). Each class of shares of the Fund represents an interest in the same portfolio of investments, except that (i) Class A shares are sold subject to a front-end sales charge collected at the time the shares are purchased and bear a service fee, (ii) Class C shares are sold at net asset value without a sales charge at the time of purchase, but are subject to a contingent deferred sales charge upon redemption within one year of purchase, and bear both a service fee and a distribution fee, (iii) Class I shares are sold at net asset value without a sales charge at the time of purchase and may be subject to a service fee, (iv) Class R3 shares are sold at net asset value without a sales charge at the time of purchase, but bear both a service fee and distribution fee, (v) Class R4 shares are sold at net asset value without a sales charge at the time of purchase, but bear a service fee, (vi) Class R5 shares are sold at net asset value without a sales charge at the time of purchase, and (vii) the respective classes may have different reinvestment privileges and conversion rights. Additionally, the Fund may allocate among its classes certain expenses, to the extent allocable to specific classes, including transfer agent fees, government registration fees, certain printing and postage costs, and administrative and legal expenses. Currently, class specific expenses of the Fund are limited to service and distribution fees, administration fees, and certain registration and transfer agent expenses.
NOTE 2 – SIGNIFICANT ACCOUNTING POLICIES
Significant accounting policies of the Trust are as follows:
Valuation Policy and Procedures: The Fund’s Trustees of the Trust (the “Trustees”) have authorized employees of the Fund’s investment advisor, acting as the Valuation and Pricing Committee (the “Committee”), to make certain valuation determinations, subject to oversight and review by the Trustees and the Audit Committee of the Trustees. The Committee and other employees of the Fund’s investment advisor administer and implement the valuation process. The Committee regularly reviews its own fair value decisions, as well as valuations, valuation techniques and services furnished by pricing services, considers circumstances in the markets which may require valuation determinations by the Committee and reviews previous valuation determinations. The Committee also reports on its activities, the performance of the pricing services and other matters to the Trustees and the Audit Committee of the Trustees.
In determining a fair value for a portfolio investment, the Committee seeks to determine the price that the Fund would reasonably expect to receive upon a sale of the investment in an orderly transaction between market participants at the measurement date. Typically, the fair value process employs standing instructions to use quoted prices in active markets or the use of independent pricing services. Less frequently, the Committee may make a fair value determination using other methods. However, because fair value prices are estimated prices, the determination of fair value for an investment may differ from the value that would be realized by the Fund upon a sale of the investment, and that difference could be material to the Fund’s financial statements. The Committee’s determination of fair value for an investment may also differ from the prices obtained by other persons (including other mutual funds) for the investment.
Valuation of Investments: Portfolio investments listed or traded on a national securities exchange are valued on the valuation date at the last reported trade price on the exchange that is the primary market for the investment. Portfolio investments traded on an exchange for which there has been no trade that day and other equity investments traded in the over-the-counter market are valued at the mean between the last reported bid and ask prices. Portfolio investments reported by NASDAQ are valued at the NASDAQ official closing price. Any foreign investment traded on exchanges outside the United States is valued at the price of the investment on the exchange that is normally the investment’s primary market, as of the close of that exchange preceding the time of the Fund’s valuation measurement date.
In any case when the market value of an equity investment held by the Fund is not readily available, a determination of a fair value for the investment is made by the Committee. The Committee’s determinations are made using procedures in accordance with a policy approved by the Trustees, which may include the use of a price obtained from an independent pricing service. The pricing service ordinarily values equity investments in these instances using multi-factor models to adjust market prices based upon various inputs, including exchange data, depository receipt prices, futures, index data and other data. An investment’s market value is deemed not readily available whenever the exchange or market on which the investment is primarily traded is closed for the entire scheduled day of trading. Additionally, an investment’s market value may be deemed not readily available under other circumstances identified by the Trustees, including when developments occurring after the most recent close of the investment’s primary exchange or market, but before the most recent close of trading in Fund shares, or an unusual event or significant period of time occurring since the availability of a market quotation, create a question about the reliability of the investment’s market value. On days when market volatility thresholds
Certified Semi-Annual Report 25
| | |
| Notes to Financial Statements, Continued | | |
| |
Thornburg Strategic Income Fund | | March 31, 2014 (Unaudited) |
pre-determined by the Trustees are exceeded, foreign equity investments held by the Fund may be valued using synthetic pricing obtained from an independent pricing service approved by the Trustees, subject to the ability of the Committee to determine in any such instance to utilize market closing prices if the Committee considers closing prices to be more reliable.
Debt obligations held by the Fund have a primary over-the-counter market and are valued by an independent pricing service approved by the Trustees. The pricing service ordinarily values debt obligations at quoted bid prices. When quotations are not available, debt obligations held by the Fund are valued at evaluated prices determined by the pricing service using methods which include consideration of yields or prices of debt obligations of comparable quality, type of issue, coupon, maturity and rating, and indications as to value from dealers and general market conditions. Short-term obligations having remaining maturities of 60 days or less are ordinarily valued at amortized cost, which approximates market value.
In any case when a pricing service fails to provide a price for a debt obligation held by the Fund, the Committee determines a fair value for the debt obligation using procedures in accordance with a policy approved by the Trustees, which may include the use of a price obtained from a different independent pricing service. Additionally, in any case when management believes that a price provided by a pricing service for a debt obligation held by the Fund may be unreliable, the Committee decides whether or not to use the pricing service’s valuation or to use an alternative method to determine a fair value for the debt obligation.
Quotations in foreign currencies for foreign portfolio investments are converted to U.S. dollar equivalents using the foreign exchange quotation in effect at the time of valuation.
Valuation Measurements: The Fund categorizes its investments based upon the inputs used in valuing those investments, according to a three-level hierarchy established by guidance from the Financial Accounting Standards Board (the “FASB”). Categorization of investments using this hierarchy is intended by the FASB to maximize the use of observable inputs and minimize the use of unobservable inputs by prioritizing that the most observable input be used when available. Observable inputs are those that market participants would use in valuing an investment based on available market data. Unobservable inputs are those that reflect assumptions about the information market participants would use in valuing an investment. An investment’s level within the hierarchy is based on the lowest level input that is deemed significant to the fair value measurement. The methodologies and relative inputs used to value investments are not necessarily indications of the risk or liquidity associated with investing in those investments.
Various inputs are used in determining the fair value measurement of the Fund’s investments. These inputs are generally summarized according to the three-level hierarchy below:
Level 1: Quoted prices in active markets for identical investments.
Level 2: Other direct or indirect significant observable inputs (including quoted prices for similar investments in active markets and other observable inputs, such as interest rates, prepayment rates, credit risk, etc.).
When market volatility thresholds are exceeded, foreign equity investments may be fair valued according to other significant observable inputs rather than quoted market prices. The affected investments will be characterized as Level 2 within the valuation hierarchy and revert to Level 1 after the threshold is no longer exceeded.
Level 3: Significant unobservable inputs, (including the Committee’s own assumptions in determining the fair value of investments), are generally applicable to investments fair valued with single broker quotes and other investments.
Portfolio investments with minimal, if any, market activity are characterized as Level 3 and are valued using significant unobservable inputs, typically including single broker quotes, which may be adjusted or unadjusted, related or comparable investments, last available transactions, and other relevant information. Valuations may also be based upon current market prices of securities that are comparable in coupon, rating, maturity and industry. An income based valuation approach would consider discounted anticipated future cash flows of the investment. Discounts may also be applied due to the nature or duration of any restrictions on the disposition of the investment. The derived value of a Level 3 investment may not represent the value which is received upon disposition.
The following table displays a summary of the fair value hierarchy measurements of the Fund’s investments as of March 31, 2014. In any instance when valuation inputs from more than one level are used to determine the fair value of a specific investment, the investment is placed in the level of the table based upon the lowest level input that is significant in determining the fair value of the investment:
26 Certified Semi-Annual Report
| | |
| Notes to Financial Statements, Continued | | |
| |
Thornburg Strategic Income Fund | | March 31, 2014 (Unaudited) |
| | | | | | | | | | | | | | | | |
| | | FAIR VALUE MEASUREMENTS AT MARCH 31, 2014 | |
| | | TOTAL | | | LEVEL 1 | | | LEVEL 2 | | | LEVEL 3(b) | |
Assets | | | | | | | | | | | | | | | | |
Investments in Securities* | | | | | | | | | | | | | | | | |
Common Stock | | $ | 32,765,680 | | | $ | 29,012,680 | | | $ | 3,753,000 | | | $ | — | |
Preferred Stock(a) | | | 27,122,813 | | | | 6,258,030 | | | | 20,864,783 | | | | — | |
Asset Backed Securities | | | 123,115,979 | | | | — | | | | 95,309,392 | | | | 27,806,587 | |
Corporate Bonds | | | 501,513,410 | | | | — | | | | 495,851,718 | | | | 5,661,692 | |
Convertible Bonds | | | 15,354,815 | | | | — | | | | 15,354,815 | | | | — | |
Warrants | | | 187,473 | | | | — | | | | 2,020 | | | | 185,453 | |
Municipal Bonds | | | 9,368,123 | | | | — | | | | 9,368,123 | | | | — | |
U.S. Treasury Securities | | | 2,035,312 | | | | 2,035,312 | | | | — | | | | — | |
Other Government | | | 4,681,294 | | | | — | | | | 4,681,294 | | | | — | |
Mortgage Backed | | | 977,652 | | | | — | | | | 5,452 | | | | 972,200 | |
Foreign Bonds | | | 77,379,352 | | | | — | | | | 61,563,768 | | | | 15,815,584 | |
Other Securities | | | 89,237,729 | | | | — | | | | 82,287,834 | | | | 6,949,895 | |
Short Term Investments | | | 94,999,164 | | | | — | | | | 94,999,164 | | | | — | |
| | | | | | | | | | | | | | | | |
Total Investments in Securities | | $ | 978,738,796 | | | $ | 37,306,022 | | | $ | 884,041,363 | | | $ | 57,391,411 | |
Other Financial Instruments** | | | | | | | | | | | | | | | | |
Forward Currency Contracts | | $ | 6,205 | | | $ | — | | | $ | 6,205 | | | $ | — | |
Spot Currency | | $ | 20,758 | | | $ | 20,758 | | | $ | — | | | $ | — | |
Liabilities | | | | | | | | | | | | | | | | |
Other Financial Instruments** | | | | | | | | | | | | | | | | |
Forward Currency Contracts | | $ | (255,953 | ) | | $ | — | | | $ | (255,953 | ) | | $ | — | |
Spot Currency | | $ | (9,988 | ) | | $ | (9,988 | ) | | $ | — | | | $ | — | |
| (a) | At March 31, 2014, industry classifications for Preferred Stock in Level 2 consist of $8,082,500 in Banks, $4,601,250 in Energy, $5,334,064 in Miscellaneous, and $2,846,969 in Telecommunication Services. |
| (b) | In accordance with the guidance prescribed in Accounting Standards Update No. 2011-04 (“ASU No. 2011-04”), unadjusted broker quotes were applied to portfolio securities characterized as Level 3 investments at March 31, 2014. A portfolio security characterized as a Level 3 investment representing $4,023,338 in Asset Backed Securities was fair valued by the Committee based upon the consideration of discounted anticipated cash flows and, or current market prices/yields of comparable securities. A portfolio security characterized as a Level 3 investment representing $5,236,360 market value in Corporate Bonds was fair valued by the Committee at cost. A portfolio security characterized as a Level 3 investment representing $185,453 in Warrants was fair valued by the Committee at the market price of the underlying equity security which would have been received if the Warrants had been exercised. |
| * | See Schedule of Investments for a summary of the industry exposure as grouped according to the Global Industry Classification Standard (GICS), which is an industry taxonomy developed by MSCI, Inc. and Standard & Poor’s (S&P). |
| ** | Other Financial Instruments include investments not reflected in the Schedule of Investments, which may include futures, forwards and swap contracts, which are valued at the unrealized appreciation (depreciation) on the investment. |
In accordance with the guidance prescribed in ASU No. 2011-04, it is the policy of the Fund to recognize transfers between levels and those underlying events which caused the movement. The Fund recognized no significant transfers between Levels 1 and 2 for the six months ended March 31, 2014, other than when the Fund exceeded market volatility thresholds for foreign equity investments during the period.
A rollforward of fair value measurements using significant unobservable inputs (Level 3) for the six months ended March 31, 2014 is as follows:
| | | | | | | | | | | | | | | | | | | | | | | | | | | | |
| | | PREFERRED
STOCK | | | ASSET BACKED
SECURITIES | | | CORPORATE
BONDS | | | FOREIGN
BONDS | | | MORTGAGE
BACKED | | | OTHER
SECURITIES | | | TOTAL(d) | |
Beginning Balance 9/30/2013 | | $ | 4,850,000 | | | $ | 27,667,476 | | | $ | 8,250,060 | | | $ | 6,361,358 | | | $ | 1,033,463 | | | $ | 6,937,996 | | | $ | 55,100,353 | |
Accrued Discounts (Premiums) | | | — | | | | 6,388 | | | | 3,159 | | | | 34,806 | | | | (1,715 | ) | | | — | | | | 42,638 | |
Net Realized Gain (Loss)(a) | | | 157,650 | | | | 16,940 | | | | 1,176 | | | | — | | | | (1,943 | ) | | | — | | | | 173,823 | |
Gross Purchases | | | — | | | | 2,506,250 | | | | 5,236,360 | | | | 9,284,980 | | | | — | | | | 213,640 | | | | 17,241,230 | |
Gross Sales | | | (5,000,000 | ) | | | (1,303,745 | ) | | | (44,159 | ) | | | — | | | | (68,023 | ) | | | (17,506 | ) | | | (6,433,433 | ) |
Net Change in Unrealized Appreciation (Depreciation)(b) | | | (7,650 | ) | | | 313,278 | | | | (4,904 | ) | | | 134,440 | | | | 10,418 | | | | 1,218 | | | | 446,800 | |
Transfers into Level 3(c) | | | — | | | | — | | | | — | | | | — | | | | — | | | | — | | | | — | |
Transfers out of Level 3(c) | | | — | | | | (1,400,000 | ) | | | (7,780,000 | ) | | | — | | | | — | | | | — | | | | (9,180,000 | ) |
| | | | | | | | | | | | | | | | | | | | | | | | | | | | |
Ending Balance 3/31/2014 | | $ | — | | | $ | 27,806,587 | | | $ | 5,661,692 | | | $ | 15,815,584 | | | $ | 972,200 | | | $ | 7,135,348 | | | $ | 57,391,411 | |
Certified Semi-Annual Report 27
| | |
| Notes to Financial Statements, Continued | | |
| |
Thornburg Strategic Income Fund | | March 31, 2014 (Unaudited) |
| (a) | Amount of Net Realized Gain (Loss) recognized in the net increase in net assets resulting from operations is included in the Fund’s Statement of Operations for the six months ended March 31, 2014. |
| (b) | Amount of Net Change in Unrealized Appreciation (Depreciation) recognized in the net increase in net assets resulting from operations is included in the Fund’s Statement of Operations for the six months ended March 31, 2014. |
| (c) | Transfers into or out of Level 3 were out of or into Level 2, and were due to changes in other significant observable inputs available during the six months ended March 31, 2014. Transfers into or out of Level 3 are based on the beginning market value of the period in which they occurred. |
| (d) | Level 3 investments represent 5.78% of total Net Assets at March 31, 2014. Significant fluctuations of the unobservable inputs applied to portfolio investments characterized as Level 3 could be expected to increase or decrease the fair value of these portfolio investments. |
Foreign Currency Translation: Portfolio investments and other assets and liabilities denominated in foreign currencies are translated into U.S. dollars based on the exchange rate of such currencies against the U.S. dollar on the date of valuation. Purchases and sales of investments and income items denominated in foreign currencies are translated into U.S. dollars at the exchange rate in effect on the transaction date. When the Fund purchases or sells foreign investments, it will customarily enter into a foreign exchange contract to minimize foreign exchange risk from the trade date to the settlement date of such transactions. The values of such spot contracts are included in receivable for investments sold and payable for investments purchased on the Statement of Assets and Liabilities.
The Fund does not separately report the effect of changes in foreign exchange rates from changes in market prices on investments held. Such changes are included in net unrealized appreciation or depreciation from investments.
Reported net realized gains or losses from foreign currency transactions arise due to purchases and sales of foreign currencies, currency gains or losses realized between the trade and settlement dates on investment transactions and the difference between the amounts of dividends, interest, and foreign withholding taxes recorded on the Fund’s books, and the U.S. dollar equivalent of the amounts actually received or paid.
Net change in unrealized appreciation and depreciation on foreign currency translations arise from changes in the fair value of assets and liabilities, other than investments at fiscal period end, resulting from changes in exchange rates.
Deferred Taxes: The Fund is subject to a tax imposed on net realized gains of securities of certain foreign countries. The Fund records an estimated deferred tax liability for net unrealized gains on these investments as reflected in the accompanying financial statements.
Federal Income Taxes: It is the policy of the Trust to comply with the provisions of the Internal Revenue Code applicable to “regulated investment companies” and to distribute to shareholders substantially all taxable income, including any net realized gain on investments of the Fund. Therefore, no provision for federal income taxes is required.
Management reviews each uncertain tax position believed to be material to the preparation of the Fund’s financial statements, to assess if it is more likely than not that the position would be sustained upon examination, based upon the technical merits of the position. As of March 31, 2014, management has not identified any such position for which an asset or liability must be reflected in the Statement of Assets and Liabilities. The Fund’s tax returns remain subject to examination for three years after filing.
When-Issued and Delayed Delivery Transactions: The Fund may engage in when-issued or delayed delivery transactions. To the extent the Fund engages in such transactions, it will do so for the purpose of acquiring portfolio investments consistent with the Fund’s investment objectives and not for the purpose of investment leverage or to speculate on interest rate and/or market changes. At the time the Fund makes a commitment to purchase an investment on a when-issued or delayed delivery basis, the Fund will record the transaction and reflect the value in determining its net asset value. When effecting such transactions, assets of an amount sufficient to make payment for the portfolio investments to be purchased will be segregated on the Fund’s records on the trade date. Investments purchased on a when-issued or delayed delivery basis do not earn interest until the settlement date.
Dividends: Dividends to shareholders, if any, are generally paid monthly and are reinvested in additional shares of the Fund at net asset value per share at the close of business on the dividend payment date or, at the shareholder’s option, paid in cash. Net realized capital gains, to the extent available, will be distributed at least annually. Distributions to shareholders are based on income tax regulations and therefore, their characteristics may differ for financial statement and tax purposes.
Repurchase Agreements: The Fund may invest excess cash in repurchase agreements whereby the Fund purchases investments, which serve as collateral, with an agreement to resell such collateral to the seller at an agreed upon price at the maturity date of the repurchase agreement. Investments pledged as collateral for repurchase agreements are held in custody until maturity of the repurchase agreement. Provisions in the agreements require that the market value of the collateral is at least equal to the repurchase value in the event of default. In the event of default, the Fund has the right to liquidate the collateral and apply the proceeds in satisfaction of the obligation. Under certain circumstances, in the event of default or bankruptcy by the other party to the agreement, realization and/or retention of the collateral may be subject to legal proceedings.
28 Certified Semi-Annual Report
| | |
| Notes to Financial Statements, Continued | | |
| |
Thornburg Strategic Income Fund | | March 31, 2014 (Unaudited) |
Unfunded Line of Credit Commitments: On November 5, 2012, the Fund entered into a revolving line of credit commitment in the amount of $10,000,000 that the borrower, Affinion Group, Inc., can draw on at any time during the commitment, which expires on April 9, 2015. The Fund received approximately $1,225,000 by taking on the commitment. At March 31, 2014, $3,515,152 of the $10,000,000 line of credit was drawn upon by the borrower.
General: Investment transactions are accounted for on a trade date basis. Interest income is accrued as earned and dividend income is recorded on the ex-dividend date. Certain income from foreign investments is recognized as soon as information is available to the Fund. Realized gains and losses from the sale of investments are recorded on an identified cost basis. Net investment income (other than class specific expenses) and realized and unrealized gains and losses are allocated daily to each class of shares based upon the relative net asset value of outstanding shares of each class of shares at the beginning of the day (after adjusting for the current share activity of the respective class). Expenses common to all Funds are allocated among the Funds comprising the Trust based upon their relative net asset values or other appropriate allocation methods.
Guarantees and Indemnifications: Under the Trust’s organizational documents (and under separate agreements with the independent Trustees), its officers and Trustees are indemnified against certain liabilities arising out of the performance of their duties to the Fund. Additionally, in the normal course of business the Trust enters into contracts with service providers that contain general indemnification clauses. The Trust’s maximum exposure under these arrangements is unknown. However, based on experience, the Trust expects the risk of loss to be remote.
Use of Estimates: The preparation of financial statements, in conformity with United States generally accepted accounting principles, requires management to make estimates and assumptions that affect the reported amounts of assets and liabilities and the disclosure of contingent assets and liabilities at the date of the financial statements and the reported amounts of increases and decreases in net assets from operations during the reporting period. Actual amounts could differ from those estimates.
NOTE 3 – INVESTMENT ADVISORY FEE AND OTHER TRANSACTIONS WITH AFFILIATES
Pursuant to an investment advisory agreement, Thornburg Investment Management, Inc. (the “Advisor”) serves as the investment advisor and performs services for the Fund for which the fees are payable at the end of each month. For the six months ended March 31, 2014, these fees were payable at annual rates ranging from ..75 of 1% to .50 of 1% per annum of the average daily net assets of the Fund depending on the Fund’s asset size. The Trust also has entered into administrative services agreements with the Advisor, whereby the Advisor will perform certain administrative services for the shareholders of each class of the Fund’s shares, and for which fees will be payable at an annual rate of up to .125 of 1% per annum of the average daily net assets attributable to each class of shares.
The Trust has an underwriting agreement with Thornburg Securities Corporation (the “Distributor,” an affiliate of the Advisor), which acts as the distributor of the Fund’s shares. For the six months ended March 31, 2014, the Distributor has advised the Fund that it earned commissions aggregating $71,492 from the sale of Class A shares, and collected contingent deferred sales charges aggregating $8,995 from redemptions of Class C shares of the Fund.
Pursuant to a service plan under Rule 12b-1 of the Investment Company Act of 1940, the Fund may reimburse to the Advisor an amount not to exceed .25 of 1% per annum of the average daily net assets attributable to each class of shares of the Fund for payments made by the Advisor to securities dealers and other financial institutions to obtain various shareholder and distribution related services. For the six months ended March 31, 2014, there were no 12b-1 service plan fees charged for Class I shares. The Advisor may pay out of its own resources additional expenses for distribution of the Fund’s shares.
The Trust has also adopted a distribution plan pursuant to Rule 12b-1, applicable only to the Fund’s Class C shares, under which the Fund compensates the Distributor for services in promoting the sale of Class C and Class R3 shares of the Fund at an annual rate of up to .75 of 1% per annum of the average daily net assets attributable to Class C shares and an annual rate of .25 of 1% of the average daily net asset attributed to Class R3 shares. Total fees incurred by each class of shares of the Fund under their respective service and distribution plans for the six months ended March 31, 2014, are set forth in the Statement of Operations.
The Advisor and Distributor have contractually agreed to waive fees and reimburse expenses incurred by the Fund so that actual expenses of certain share classes do not exceed specified levels. The agreement may be terminated by the Fund at any time, but may not be terminated by the Advisor or Distributor before February 1, 2015, unless the Advisor ceases to be the investment advisor to the Fund or the Distributor ceases to be the distributor of the Fund prior to that date. The Advisor and Distributor retain the right to be repaid by the Fund for fee waivers and expense reimbursements if expenses fall below the contractual limit prior to the end of the fiscal year.
For the six months ended March 31, 2014, the Advisor contractually reimbursed certain class specific expenses, administrative fees, and distribution fees of $16,605 for Class A shares, $233,735 for Class C shares, $12,324 for Class R3 shares, $1,966 for Class R4 shares, and $10,943 for Class R5 shares.
Certified Semi-Annual Report 29
| | |
| Notes to Financial Statements, Continued | | |
| |
Thornburg Strategic Income Fund | | March 31, 2014 (Unaudited) |
The Trust has an agreement with the custodian bank to indirectly pay a portion of the custodian’s fees through credits earned by the Fund’s cash on deposit with the bank. This deposit agreement is an alternative to overnight investments. Custodial fees are adjusted to reflect amounts that would have been paid without this agreement, with a corresponding adjustment reflected as fees paid indirectly in the Statement of Operations. For the six months ended March 31, 2014, there were no fees paid indirectly.
Certain officers and Trustees of the Trust are also officers or directors of the Advisor and Distributor. The compensation of independent Trustees is borne by the Trust.
NOTE 4 — SHARES OF BENEFICIAL INTEREST
At March 31, 2014, there were an unlimited number of shares of beneficial interest authorized. Transactions in shares of beneficial interest were as follows:
| | | | | | | | | | | | | | | | |
| | | SIX MONTHS ENDED
MARCH 31, 2014 (UNAUDITED) | | | YEAR ENDED
SEPTEMBER 30, 2013 (AUDITED) | |
| | | SHARES | | | AMOUNT | | | SHARES | | | AMOUNT | |
Class A Shares | | | | | | | | | | | | | | | | |
Shares sold | | | 9,040,540 | | | $ | 109,328,497 | | | | 10,058,431 | | | $ | 123,667,059 | |
Shares issued to shareholders in reinvestment of dividends | | | 969,225 | | | | 11,692,156 | | | | 1,022,523 | | | | 12,513,293 | |
Shares repurchased | | | (4,148,037 | ) | | | (50,151,511 | ) | | | (6,752,417 | ) | | | (82,739,794 | ) |
| | | | | | | | | | | | | | | | |
| | | | |
Net increase (decrease) | | | 5,861,728 | | | $ | 70,869,142 | | | | 4,328,537 | | | $ | 53,440,558 | |
| | | | | | | | | | | | | | | | |
| | | | |
Class C Shares | | | | | | | | | | | | | | | | |
Shares sold | | | 5,391,228 | | | $ | 65,180,591 | | | | 7,166,676 | | | $ | 87,947,122 | |
Shares issued to shareholders in reinvestment of dividends | | | 790,398 | | | | 9,521,006 | | | | 847,660 | | | | 10,357,063 | |
Shares repurchased | | | (2,404,763 | ) | | | (29,063,895 | ) | | | (3,928,127 | ) | | | (48,110,310 | ) |
| | | | | | | | | | | | | | | | |
| | | | |
Net increase (decrease) | | | 3,776,863 | | | $ | 45,637,702 | | | | 4,086,209 | | | $ | 50,193,875 | |
| | | | | | | | | | | | | | | | |
| | | | |
Class I Shares | | | | | | | | | | | | | | | | |
Shares sold | | | 13,606,420 | | | $ | 164,062,778 | | | | 12,270,363 | | | $ | 150,879,431 | |
Shares issued to shareholders in reinvestment of dividends | | | 889,623 | | | | 10,714,976 | | | | 903,587 | | | | 11,036,909 | |
Shares repurchased | | | (2,957,939 | ) | | | (35,651,598 | ) | | | (8,520,072 | ) | | | (104,110,243 | ) |
| | | | | | | | | | | | | | | | |
| | | | |
Net increase (decrease) | | | 11,538,104 | | | $ | 139,126,156 | | | | 4,653,878 | | | $ | 57,806,097 | |
| | | | | | | | | | | | | | | | |
| | | | |
Class R3 Shares | | | | | | | | | | | | | | | | |
Shares sold | | | 7,869 | | | $ | 95,097 | | | | 18,755 | | | $ | 228,019 | |
Shares issued to shareholders in reinvestment of dividends | | | 505 | | | | 6,094 | | | | 387 | | | | 4,710 | |
Shares repurchased | | | (5,738 | ) | | | (70,469 | ) | | | (5,992 | ) | | | (73,042 | ) |
| | | | | | | | | | | | | | | | |
| | | | |
Net increase (decrease) | | | 2,636 | | | $ | 30,722 | | | | 13,150 | | | $ | 159,687 | |
| | | | | | | | | | | | | | | | |
| | | | |
Class R4 Shares* | | | | | | | | | | | | | | | | |
Shares sold | | | 1,271 | | | $ | 15,250 | | | | — | | | $ | — | |
Shares issued to shareholders in reinvestment of dividends | | | 8 | | | | 106 | | | | — | | | | — | |
Shares repurchased | | | — | | | | — | | | | — | | | | — | |
| | | | | | | | | | | | | | | | |
| | | | |
Net increase (decrease) | | | 1,279 | | | $ | 15,356 | | | | — | | | $ | — | |
| | | | | | | | | | | | | | | | |
| | | | |
Class R5 Shares | | | | | | | | | | | | | | | | |
Shares sold | | | 189,757 | | | $ | 2,296,030 | | | | — | | | $ | — | |
Shares issued to shareholders in reinvestment of dividends | | | 4,270 | | | | 51,378 | | | | 60 | | | | 730 | |
Shares repurchased | | | (6,367 | ) | | | (76,221 | ) | | | — | | | | — | |
| | | | | | | | | | | | | | | | |
| | | | |
Net increase (decrease) | | | 187,660 | | | $ | 2,271,187 | | | | 60 | | | $ | 730 | |
| | | | | | | | | | | | | | | | |
| * | Effective date of this Class of shares was February 1, 2014. |
30 Certified Semi-Annual Report
| | |
| Notes to Financial Statements, Continued | | |
| |
Thornburg Strategic Income Fund | | March 31, 2014 (Unaudited) |
NOTE 5 – INVESTMENT TRANSACTIONS
For the six months ended March 31, 2014, the Fund had purchase and sale transactions of investments (excluding short-term investments and U. S. Government obligations) of $379,974,530 and $199,779,151, respectively.
NOTE 6 – INCOME TAXES
At March 31, 2014, information on the tax components of capital was as follows:
| | | | |
Cost of investments for tax purposes | | $ | 961,771,440 | |
| | | | |
Gross unrealized appreciation on a tax basis | | $ | 37,819,579 | |
Gross unrealized depreciation on a tax basis | | | (20,852,223 | ) |
| | | | |
Net unrealized appreciation (depreciation) on investments (tax basis) | | $ | 16,967,356 | |
| | | | |
NOTE 7 – DERIVATIVE FINANCIAL INSTRUMENTS WITH OFF-BALANCE SHEET RISK AND FOREIGN INVESTMENT RISK
The Fund may use a variety of derivative financial instruments to hedge or adjust the risks affecting its investment portfolio or to enhance investment returns. Provisions of FASB Accounting Standards Codification 815-10-50 (“ASC 815”), require certain disclosures. The disclosures are intended to provide users of financial statements with an understanding of the use of derivative instruments by the Fund and how these derivatives affect the financial position, financial performance and cash flows of the Fund. The Fund does not designate any derivative instruments as hedging instruments under ASC 815. During the six months ended March 31, 2014, the Fund’s principal exposure to derivative financial instruments of the type addressed by ASC 815 was investment in foreign exchange contracts. A foreign exchange contract is an agreement between two parties to exchange different currencies at a specified rate of exchange at an agreed upon future date. Foreign exchange contracts involve risks to the Fund, including the risk that a contract’s counterparty will not meet its obligations to the Fund, the risk that a change in a contract’s value may not correlate perfectly with the currency the contract was intended to track, and the risk that the advisor is unable to correctly implement its strategy in using a contract. In any such instance, the Fund may not achieve the intended benefit of entering into a contract, and may experience a loss. Additionally, the Fund’s risk of loss may exceed the amounts recognized on the Statement of Assets and Liabilities.
The Fund entered into forward currency contracts during the six months ended March 31, 2014 in the normal course of pursuing its investment objectives, with the objective of reducing the risk to the value of the Fund’s foreign investments from adverse changes in the relationship between the U.S. dollar and foreign currencies. In each case these contracts have been initiated in conjunction with foreign investment transactions.
These contracts are accounted for by the Fund under ASC 815. Unrealized appreciation and depreciation on outstanding contracts are reported in the Fund’s Statement of Assets and Liabilities, as measured by the difference between the forward exchange rates at the reporting date and the forward exchange rates at each contract’s inception date. Net realized gain (loss) on contracts closed during the period, and changes in net unrealized appreciation (depreciation) on outstanding contracts are recognized in the Fund’s Statement of Operations. Values of open sell currency contracts are indicative of the activity for the six months ended March 31, 2014. Open buy currency contracts are entered into for the purpose of closing open sell currency contracts and the values are dependent upon the values of the open sell currency contracts to which they relate.
The following table displays the outstanding forward currency contracts at March 31, 2014:
| | | | | | | | | | | | | | | | | | | | | | | | |
| | | | | | OUTSTANDING FORWARD CURRENCY CONTRACTS TO BUY OR SELL AT
MARCH 31, 2014 | |
CONTRACT DESCRIPTION | | BUY/SELL | | | CONTRACT
AMOUNT | | | CONTRACT
VALUE
DATE | | | VALUE
USD | | | UNREALIZED
APPRECIATION | | | UNREALIZED
DEPRECIATION | |
Euro | | | Buy | | | | 2,782,200 | | | | 08/13/2014 | | | | 3,832,398 | | | $ | 6,205 | | | $ | — | |
Euro | | | Sell | | | | 11,295,300 | | | | 08/13/2014 | | | | 15,558,942 | | | | — | | | | (154,073 | ) |
Great Britain Pound | | | Sell | | | | 3,270,000 | | | | 06/11/2014 | | | | 5,448,723 | | | | — | | | | (101,880 | ) |
| | | | | | | | | | | | | | | | | | | | | | | | |
Total | | | | | | | | | | | | | | | | | | $ | 6,205 | | | $ | (255,953 | ) |
| | | | | | | | | | | | | | | | | | | | | | | | |
Certified Semi-Annual Report 31
| | |
| Notes to Financial Statements, Continued | | |
| |
Thornburg Strategic Income Fund | | March 31, 2014 (Unaudited) |
The foregoing forward currency contracts were entered into pursuant to an International Swaps and Derivatives Association (ISDA) Master Agreement. In the event of a default or termination under the ISDA Master Agreement, the non-defaulting party has the right to close out all outstanding forward currency contracts between the parties and to net any payment amounts under those contracts, resulting in a single net amount payable by one party to the other. Because the ISDA Master Agreement does not result in an offset of reported amounts of financial assets and financial liabilities in the Fund’s Statement of Assets and Liabilities unless there has been an event of default or termination event under that agreement, the Fund does not net its outstanding forward currency contracts for purposes of the disclosure in the Fund’s Statement of Assets and Liabilities. Instead the Fund recognizes the unrealized appreciation or depreciation on those forward currency contracts on a gross basis in the Fund’s Statement of Assets and Liabilities. At March 31, 2014, those recognized amounts are disclosed in the following table:
| | | | | | |
| FAIR VALUES OF DERIVATIVE FINANCIAL INSTRUMENTS AT MARCH 31, 2014 | |
ASSET DERIVATIVES | | BALANCE SHEET LOCATION | | FAIR VALUE | |
| | |
Foreign exchange contracts | | Assets - Unrealized appreciation on forward currency contracts | | $ | 6,205 | |
| | | | | | |
LIABILITY DERIVATIVES | | BALANCE SHEET LOCATION | | FAIR VALUE | |
| | |
Foreign exchange contracts | | Liabilities - Unrealized depreciation on forward currency contracts | | $ | (255,953 | ) |
Because the Fund does not currently receive or post cash collateral in connection with its currency forward contracts, and because all of the Fund’s outstanding currency forward contracts are with State Street Bank and Trust Company, the net amounts of the Fund’s assets and liabilities which are attributable to those contracts at March 31, 2014 can be determined by offsetting the dollar amounts shown in the preceding table. Based on those amounts, the net amount of the Fund’s assets which is attributable to its outstanding forward currency contracts at March 31, 2014 is $0, and the net amount of the Fund’s liabilities which is attributable to those contracts at that date is $249,748. The Fund’s forward currency contracts are valued each day, and the net amounts of the Fund’s assets and liabilities which are attributable to those contracts are expected to vary over time.
The net realized gain (loss) from forward currency contracts, and the net change in unrealized appreciation (depreciation) of outstanding forward currency contracts recognized in the Fund’s Statement of Operations for the six months ended March 31, 2014 are disclosed in the following tables:
| | | | |
AMOUNT OF NET REALIZED GAIN (LOSS) ON DERIVATIVE FINANCIAL INSTRUMENTS RECOGNIZED IN INCOME FOR THE SIX MONTHS ENDED MARCH 31, 2014 |
| | | TOTAL | | FORWARD CURRENCY
CONTRACTS |
Foreign exchange contracts | | $(655,309) | | $(655,309) |
|
AMOUNT OF NET CHANGE IN UNREALIZED APPRECIATION (DEPRECIATION) OF DERIVATIVE FINANCIAL INSTRUMENTS RECOGNIZED IN INCOME FOR THE SIX MONTHS ENDED MARCH 31, 2014 |
| | | TOTAL | | FORWARD CURRENCY
CONTRACTS |
Foreign exchange contracts | | $168,245 | | $168,245 |
OTHER NOTES
Risks: The Fund’s investments subject it to risks including, but not limited to, credit risk, interest rate risk, prepayment risk, management risk, market and economic risk, liquidity risk, risks affecting specific issuers, and the risks associated with investments in derivative instruments, smaller companies, non-U.S. issuers, real estate investment trusts, below investment grade debt obligations, and structured finance arrangements. Please see the Fund’s prospectus for a discussion of the risks associated with an investment in the Fund.
Subsequent Events: Fund management believes no events have occurred between March 31, 2014 and the date of issuance of the financial statements that require adjustment to or disclosure in the accompanying financial statements.
32 Certified Semi-Annual Report
This page intentionally left blank.
Certified Semi-Annual Report 33
Financial Highlights
Thornburg Strategic Income Fund
| | | | | | | | | | | | | | | | | | | | | | | | | | | | | | | | | | | | | | | | | | | | | | | | | | |
| | | PER SHARE PERFORMANCE (FOR A SHARE OUTSTANDING THROUGHOUT THE PERIOD)+ | | | RATIOS TO AVERAGE NET ASSETS | | | SUPPLEMENTAL DATA | |
UNLESS OTHERWISE NOTED, PERIODS ARE FISCAL YEARS ENDED SEPT. 30, | | NET ASSET
VALUE
BEGINNING
OF PERIOD | | | NET INVESTMENT INCOME (LOSS) | | NET
REALIZED
&
UNREALIZED
GAIN (LOSS)
ON
INVESTMENTS | | | TOTAL FROM INVESTMENT OPERATIONS | | DIVIDENDS
FROM NET
INVESTMENT
INCOME | | | DIVIDENDS FROM NET REALIZED GAINS | | TOTAL
DIVIDENDS | | | NET
ASSET
VALUE
END
OF
PERIOD | | | NET
INVESTMENT
INCOME
(LOSS)
(%) | | | EXPENSES,
AFTER
EXPENSE
REDUCTIONS
(%) | | | EXPENSES,
AFTER
EXPENSE
REDUCTIONS
AND
NET OF
CUSTODY
CREDITS (%) | | | EXPENSES,
BEFORE
EXPENSE
REDUCTIONS
(%) | | | TOTAL RETURN (%)(A) | | PORTFOLIO TURNOVER RATE (%)(a) | | NET
ASSETS
AT END
OF
PERIOD
(THOUSANDS) | |
CLASS A SHARES | | | | | | | | | | | | | | | | | | | | | | | | | | | | | | | | | | | | | | | | | | | | |
2014(b)(c) | | $ | 12.19 | | | 0.27 | | | 0.26 | | | 0.53 | | | (0.29 | ) | | (0.27) | | | (0.56 | ) | | $ | 12.16 | | | | 4.55 | (d) | | | 1.23 | (d) | | | 1.23 | (d) | | | 1.24 | (d) | | 4.48 | | 25.78 | | $ | 321,861 | |
2013(b) | | $ | 12.28 | | | 0.67 | | | 0.03 | | | 0.70 | | | (0.65 | ) | | (0.14) | | | (0.79 | ) | | $ | 12.19 | | | | 5.44 | | | | 1.25 | | | | 1.25 | | | | 1.27 | | | 5.79 | | 76.47 | | $ | 251,106 | |
2012(b) | | $ | 11.86 | | | 0.71 | | | 0.73 | | | 1.44 | | | (0.74 | ) | | (0.28) | | | (1.02 | ) | | $ | 12.28 | | | | 5.97 | | | | 1.25 | | | | 1.25 | | | | 1.31 | | | 12.73 | | 34.54 | | $ | 199,770 | |
2011(b) | | $ | 12.35 | | | 0.79 | | | (0.21 | ) | | 0.58 | | | (0.79 | ) | | (0.28) | | | (1.07 | ) | | $ | 11.86 | | | | 6.47 | | | | 1.20 | | | | 1.20 | | | | 1.32 | | | 4.78 | | 48.09 | | $ | 115,704 | |
2010(b) | | $ | 11.63 | | | 0.81 | | | 0.77 | | | 1.58 | | | (0.81 | ) | | (0.05) | | | (0.86 | ) | | $ | 12.35 | | | | 6.86 | | | | 1.25 | | | | 1.25 | | | | 1.35 | | | 14.07 | | 38.87 | | $ | 83,822 | |
2009(b) | | $ | 10.57 | | | 0.78 | | | 1.06 | | | 1.84 | | | (0.78 | ) | | — | | | (0.78 | ) | | $ | 11.63 | | | | 7.66 | | | | 1.25 | | | | 1.25 | | | | 1.49 | | | 18.67 | | 47.88 | | $ | 57,853 | |
CLASS C SHARES | | | | | | | | | | | | | | | | | | | | | | | | | | | | | | | | | | | | | | | | | | | | |
2014(c) | | $ | 12.17 | | | 0.24 | | | 0.27 | | | 0.51 | | | (0.26 | ) | | (0.27) | | | (0.53 | ) | | $ | 12.15 | | | | 3.98 | (d) | | | 1.80 | (d) | | | 1.80 | (d) | | | 1.98 | (d) | | 4.27 | | 25.78 | | $ | 282,532 | |
2013 | | $ | 12.26 | | | 0.60 | | | 0.03 | | | 0.63 | | | (0.58 | ) | | (0.14) | | | (0.72 | ) | | $ | 12.17 | | | | 4.88 | | | | 1.80 | | | | 1.80 | | | | 2.02 | | | 5.21 | | 76.47 | | $ | 237,177 | |
2012 | | $ | 11.84 | | | 0.64 | | | 0.73 | | | 1.37 | | | (0.67 | ) | | (0.28) | | | (0.95 | ) | | $ | 12.26 | | | | 5.42 | | | | 1.79 | | | | 1.79 | | | | 2.05 | | | 12.15 | | 34.54 | | $ | 188,782 | |
2011 | | $ | 12.34 | | | 0.72 | | | (0.22 | ) | | 0.50 | | | (0.72 | ) | | (0.28) | | | (1.00 | ) | | $ | 11.84 | | | | 5.86 | | | | 1.80 | | | | 1.80 | | | | 2.07 | | | 4.11 | | 48.09 | | $ | 106,684 | |
2010 | | $ | 11.62 | | | 0.75 | | | 0.77 | | | 1.52 | | | (0.75 | ) | | (0.05) | | | (0.80 | ) | | $ | 12.34 | | | | 6.31 | | | | 1.80 | | | | 1.80 | | | | 2.12 | | | 13.48 | | 38.87 | | $ | 81,841 | |
2009 | | $ | 10.57 | | | 0.73 | | | 1.04 | | | 1.77 | | | (0.72 | ) | | — | | | (0.72 | ) | | $ | 11.62 | | | | 7.13 | | | | 1.79 | | | | 1.79 | | | | 2.29 | | | 17.95 | | 47.88 | | $ | 51,789 | |
CLASS I SHARES | | | | | | | | | | | | | | | | | | | | | | | | | | | | | | | | | | | | | | | | | | | | |
2014(c) | | $ | 12.17 | | | 0.29 | | | 0.26 | | | 0.55 | | | (0.31 | ) | | (0.27) | | | (0.58 | ) | | $ | 12.14 | | | | 4.90 | (d) | | | 0.88 | (d) | | | 0.88 | (d) | | | 0.88 | (d) | | 4.66 | | 25.78 | | $ | 385,829 | |
2013 | | $ | 12.25 | | | 0.70 | | | 0.04 | | | 0.74 | | | (0.68 | ) | | (0.14) | | | (0.82 | ) | | $ | 12.17 | | | | 5.75 | | | | 0.94 | | | | 0.94 | | | | 0.94 | | | 6.21 | | 76.47 | | $ | 246,332 | |
2012 | | $ | 11.83 | | | 0.74 | | | 0.73 | | | 1.47 | | | (0.77 | ) | | (0.28) | | | (1.05 | ) | | $ | 12.25 | | | | 6.27 | | | | 0.96 | | | | 0.96 | | | | 0.97 | | | 13.06 | | 34.54 | | $ | 191,090 | |
2011 | | $ | 12.35 | | | 0.83 | | | (0.20 | ) | | 0.63 | | | (0.87 | ) | | (0.28) | | | (1.15 | ) | | $ | 11.83 | | | | 6.71 | | | | 0.97 | | | | 0.97 | | | | 0.98 | | | 5.16 | | 48.09 | | $ | 99,594 | |
2010 | | $ | 11.64 | | | 0.85 | | | 0.75 | | | 1.60 | | | (0.84 | ) | | (0.05) | | | (0.89 | ) | | $ | 12.35 | | | | 7.13 | | | | 0.98 | | | | 0.98 | | | | 1.00 | | | 14.27 | | 38.87 | | $ | 73,011 | |
2009 | | $ | 10.58 | | | 0.81 | | | 1.05 | | | 1.86 | | | (0.80 | ) | | — | | | (0.80 | ) | | $ | 11.64 | | | | 7.94 | | | | 0.99 | | | | 0.99 | | | | 1.12 | | | 18.95 | | 47.88 | | $ | 44,319 | |
CLASS R3 SHARES | | | | | | | | | | | | | | | | | | | | | | | | | | | | | | | | | | | | | | | | | | | | |
2014(c) | | $ | 12.19 | | | 0.27 | | | 0.27 | | | 0.54 | | | (0.29 | ) | | (0.27) | | | (0.56 | ) | | $ | 12.17 | | | | 4.53 | (d) | | | 1.25 | (d) | | | 1.25 | (d) | | | 16.23 | (d)(e) | | 4.54 | | 25.78 | | $ | 203 | |
2013 | | $ | 12.28 | | | 0.63 | | | 0.06 | | | 0.69 | | | (0.64 | ) | | (0.14) | | | (0.78 | ) | | $ | 12.19 | | | | 5.19 | | | | 1.25 | | | | 1.25 | | | | 32.64 | (e) | | 5.78 | | 76.47 | | $ | 171 | |
2012(f) | | $ | 12.03 | | | 0.30 | | | 0.25 | | | 0.55 | | | (0.30 | ) | | — | | | (0.30 | ) | | $ | 12.28 | | | | 5.93 | (d) | | | 1.22 | (d) | | | 1.22 | (d) | | | 373.07 | (d)(e) | | 4.63 | | 34.54 | | $ | 11 | |
CLASS R4 SHARES | | | | | | | | | | | | | | | | | | | | | | | | | | | | | | | | | | | | | | | | | | | | |
2014(c)(g) | | $ | 12.00 | | | 0.09 | | | 0.16 | | | 0.25 | | | (0.09 | ) | | — | | | (0.09 | ) | | $ | 12.16 | | | | 4.73 | (d) | | | 1.25 | (d) | | | 1.25 | (d) | | | 84.31 | (d)(e) | | 2.04 | | 25.78 | | $ | 16 | |
CLASS R5 SHARES | | | | | | | | | | | | | | | | | | | | | | | | | | | | | | | | | | | | | | | | | | | | |
2014(c) | | $ | 12.16 | | | 0.29 | | | 0.26 | | | 0.55 | | | (0.31 | ) | | (0.27) | | | (0.58 | ) | | $ | 12.13 | | | | 4.80 | (d) | | | 0.99 | (d) | | | 0.99 | (d) | | | 2.64 | (d) | | 4.60 | | 25.78 | | $ | 2,288 | |
2013 | | $ | 12.25 | | | 0.70 | | | 0.03 | | | 0.73 | | | (0.68 | ) | | (0.14) | | | (0.82 | ) | | $ | 12.16 | | | | 5.68 | | | | 0.99 | | | | 0.99 | | | | 227.33 | (e) | | 6.07 | | 76.47 | | $ | 11 | |
2012(f) | | $ | 12.00 | | | 0.31 | | | 0.25 | | | 0.56 | | | (0.31 | ) | | — | | | (0.31 | ) | | $ | 12.25 | | | | 6.22 | (d) | | | 0.97 | (d) | | | 0.97 | (d) | | | 372.35 | (d)(e) | | 4.75 | | 34.54 | | $ | 11 | |
| (a) | Not annualized for periods less than one year. |
| (b) | Sales loads are not reflected in computing total return. |
| (c) | Unaudited Six Month Period Ended March 31. |
| (e) | Due to the size of net assets and fixed expenses, ratios may appear disproportionate. |
| (f) | Effective date of this class of shares was May 1, 2012. |
| (g) | Effective date of this class of shares was February 1, 2014. |
| + | Based on weighted average shares outstanding, except for Dividends from Net Investment Income and Net Realized Gains, which are actual amounts per share. |
See notes to financial statements.
| | | | |
| 34 Certified Semi-Annual Report | | | | Certified Semi-Annual Report 35 |
| | |
| Expense Example | | |
| |
Thornburg Strategic Income Fund | | March 31, 2014 (Unaudited) |
As a shareholder of the Fund, you incur two types of costs:
| | (1) | transaction costs, including |
(a) sales charges (loads) on purchase payments, for Class A shares;
(b) a deferred sales charge on redemptions of any part or all of a purchase of $1 million of Class A shares within 12 months of purchase;
(c) a deferred sales charge on redemptions of Class C shares within 12 months of purchase;
| | (2) | ongoing costs, including management fees; distribution and/ or service (12b-1) fees; and other Fund expenses. |
This example is intended to help you understand your ongoing costs (in dollars) of investing in the Fund and to compare these costs with the ongoing costs of investing in other mutual funds.
The example is based on a $1,000 investment beginning on October 1, 2013, and held until March 31, 2014.
Actual Expenses
For each class of shares, the first line of the accompanying table provides information about actual account values and actual expenses. You may use the information in this line, together with the amount you invested, to estimate the expenses that you paid over the period. Simply divide your account value by $1,000 (for example, an $8,600 account value divided by $1,000 = 8.6), then multiply the result by the number in the first line for your class of shares under the heading entitled “Expenses Paid During Period” to estimate the expenses you paid on your account during this period.
| | | | | | | | | | | | |
| | | BEGINNING
ACCOUNT VALUE
10/1/13 | | | ENDING
ACCOUNT VALUE
3/31/14 | | | EXPENSES PAID
DURING PERIOD†
10/1/13–3/31/14 | |
Class A Shares | | | | | | | | | | | | |
Actual | | $ | 1,000.00 | | | $ | 1,044.80 | | | $ | 6.25 | |
Hypothetical* | | $ | 1,000.00 | | | $ | 1,018.82 | | | $ | 6.17 | |
Class C Shares | | | | | | | | | | | | |
Actual | | $ | 1,000.00 | | | $ | 1,042.70 | | | $ | 9.17 | |
Hypothetical* | | $ | 1,000.00 | | | $ | 1,015.96 | | | $ | 9.05 | |
Class I Shares | | | | | | | | | | | | |
Actual | | $ | 1,000.00 | | | $ | 1,046.60 | | | $ | 4.49 | |
Hypothetical* | | $ | 1,000.00 | | | $ | 1,020.55 | | | $ | 4.43 | |
Class R3 Shares | | | | | | | | | | | | |
Actual | | $ | 1,000.00 | | | $ | 1,045.40 | | | $ | 6.37 | |
Hypothetical* | | $ | 1,000.00 | | | $ | 1,018.70 | | | $ | 6.29 | |
Class R4 Shares | | | | | | | | | | | | |
Actual | | $ | 1,000.00 | | | $ | 1,020.40 | | | $ | 6.28 | |
Hypothetical* | | $ | 1,000.00 | | | $ | 1,018.71 | | | $ | 6.28 | |
Class R5 Shares | | | | | | | | | | | | |
Actual | | $ | 1,000.00 | | | $ | 1,046.00 | | | $ | 5.05 | |
Hypothetical* | | $ | 1,000.00 | | | $ | 1,020.00 | | | $ | 4.99 | |
| † | Expenses are equal to the annualized expense ratio for each class (A: 1.23%; C: 1.80%; I: 0.88% R3: 1.25% R4: 1.25% R5: 0.99%) multiplied by the average account value over the period, multiplied by 182/365 to reflect the one-half year period. |
| * | Hypothetical assumes a rate of return of 5% per year before expenses. |
Hypothetical Example for Comparison Purposes
For each class of shares, the second line of the accompanying table provides information about hypothetical account values and hypothetical expenses based on the Fund’s actual expense ratio and an assumed rate of return of 5% per year before expenses, which is not the Fund’s actual return. The hypothetical account values and expenses may not be used to estimate the actual ending account balance or expenses you paid for the period. You may use this information to compare the ongoing costs of investing in the Fund and other funds. To do so, compare this 5% hypothetical example with the 5% hypothetical examples that appear in the shareholder reports of the other funds.
Please note that the expenses shown in the table are meant to highlight your ongoing costs only and do not reflect any transactional costs, such as sales charges (loads), redemption fees, or exchange fees. Therefore, the second line of the table for each class of shares is useful in comparing ongoing costs only, and will not help you determine the relative total costs of owning different funds. In addition, if these transactional costs were included, your costs would have been higher.
36 Certified Semi-Annual Report
| | |
| Index Comparison | | |
| |
Thornburg Strategic Income Fund | | March 31, 2014 (Unaudited) |
Growth of a Hypothetical $10,000 Investment
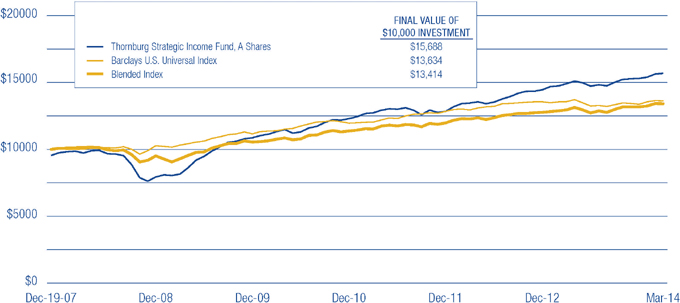
Average Annual Total Returns
For Periods Ended March 31, 2014 (with sales charge)
| | | | | | | | | | | | | | | | |
| | | 1 YR | | | 3 YRS | | | 5 YRS | | | SINCE
INCEPTION | |
Class A Shares (Incep: 12/19/07) | | | 0.44 | % | | | 5.60 | % | | | 12.90 | % | | | 7.41 | % |
Class C Shares (Incep: 12/19/07) | | | 3.65 | % | | | 6.63 | % | | | 13.34 | % | | | 7.61 | % |
Class I Shares (Incep: 12/19/07) | | | 5.54 | % | | | 7.59 | % | | | 14.29 | % | | | 8.53 | % |
Class R3 Shares (Incep: 5/1/12) | | | 5.28 | % | | | — | | | | — | | | | 7.92 | % |
Class R4 Shares (Incep: 2/1/14)* | | | — | | | | — | | | | — | | | | 2.04 | % |
Class R5 Shares (Incep: 5/1/12) | | | 5.47 | % | | | — | | | | — | | | | 8.17 | % |
| * | Not annualized for periods less than one year. |
Performance data shown represents past performance and is no guarantee of future results. Investment return and principal value will fluctuate so shares, when redeemed, may be worth more or less than their original cost. Current performance may be lower or higher than quoted. For performance current to the most recent month end, visit thornburg.com or call 800-847-0200. The performance data and graph do not reflect the deduction of taxes that a shareholder would pay on distributions or the redemption of Fund shares. Returns reflect the reinvestment of dividends and capital gains as well as applicable sales charges. Class A shares are sold with a maximum sales charge of 4.50%. Class C shares are subject to a 1% CDSC for the first year only. There is no up-front sales charge for Class I, R3, R4, and R5 shares.
Certified Semi-Annual Report 37
| | |
| Other Information | | |
| |
Thornburg Strategic Income Fund | | March 31, 2014 (Unaudited) |
Portfolio Proxy Voting
Policies and Procedures:
The Trust has delegated to Thornburg Investment Management, Inc. (the “Advisor”) voting decisions respecting proxies for the Fund’s voting securities. The Advisor makes voting decisions in accordance with its Proxy Voting Policy and Procedures. A description of the Policy and Procedures is available (i) without charge, upon request, by calling the Advisor toll-free at 1-800-847-0200, (ii) on the Thornburg website at www.thornburg.com, and (iii) on the Securities and Exchange Commission’s website at www.sec.gov.
Information regarding how proxies were voted is available on or before August 31 of each year for the twelve months ending the preceding June 30. This information is available (i) without charge, upon request by calling the Advisor toll-free at 1-800-847-0200, (ii) on the Thornburg website at www.thornburg.com, and (iii) on the Securities and Exchange Commission’s website at www.sec.gov.
Availability of Quarterly Portfolio Schedule
The Fund files with the Securities and Exchange Commission schedules of its portfolio holdings on Form N-Q for the first and third quarters of each fiscal year. The Fund’s Forms N-Q are available on the Commission’s website at www.sec.gov, or may be reviewed and copied at the Commission’s Public Reference Room in Washington, D.C. Information on the operation of the Public Reference Room may be obtained by calling 1-800-SEC-0330. The Fund also makes this information available on its website at www.thornburg. com/download or upon request by calling 1-800-847-0200.
38 Certified Semi-Annual Report
This page intentionally left blank.
This page is not part of the Semi-Annual Report 39
Trustees’ Statement to Shareholders
Not part of the Certified Semi-Annual Report
Reissued September 15, 2013
The Trustees believe current and prospective shareholders should know how we discharge our responsibilities in supervising the Funds’ investment advisor and in reviewing the advisor’s contract for renewal. Since 2005, we have issued a statement which sets out clearly the three principal guidelines that we follow in supervising the Trust’s investment advisor on your behalf. In accordance with our customary practice, in September of this year we again reviewed our statement and concluded we should reissue this statement outlining the principal features of our supervision of the advisor’s performance of investment management services for the Funds.
We begin with the premise that each shareholder selected his or her Fund because its investments are managed by the investment advisor identified in the prospectus and in accordance with the objective and policies described in the prospectus. We realize, as each of you do, that if you believe that your Fund’s stated objective and policies no longer serve your personal investment goals, you can sell your shares and leave the Fund.
Therefore, we believe that our primary supervisory task – our principal obligation to you – is to assess the nature and quality of the advisor’s services, and to confirm that the advisor actively and competently pursues the Fund’s objective, in accordance with the policies set out in the prospectus. To do this, we meet regularly with management to review your Fund’s portfolio and to discuss the advisor’s specific actions and judgments in pursuing the Fund’s objective. We do not substitute our own judgment for the advisor’s decisions in selecting investments; the advisor is paid to exercise its informed judgment on investment decisions, and we seek to confirm, in reviewing the advisor’s performance, that the advisor is doing just that.
Second, while we are conscious of costs and the effect that costs have on shareholders’ returns, we do not seek the lowest fees or expense ratio as our sole or primary objective. We try to make sure that your Fund’s fees and costs are reasonable in relationship to the services rendered and that they are generally in line with those charged by other expert investment advisors, consistent with our belief that the Fund’s investors searched for and expect that expertise and attention and have decided to pay a reasonable price for it. We do not put the management contract “out to bid” as a matter of course, and we would not do so unless we had concluded that the advisor materially had failed to pursue the Fund’s objectives in accordance with its policies, or for other equally important reasons. We believe that any other approach would be inconsistent with your interests and contrary to your expectations when you bought shares of the Fund in the first place.
Finally, because we believe that most Thornburg Fund shareholders have invested with a long-term perspective, we try not to focus too much on the fashions of the moment and on short-term performance. The market will not favor any specific investment objective or set of policies at all times and under all economic circumstances. A fund will experience periods of both high and low returns relative to other funds and other investments. Even if one of our Funds is not favored by the market at a particular time, we believe that the advisor is nonetheless obliged to remain true to the Fund’s objective and policies, and we watch to see that it does so.
40 This page is not part of the Semi-Annual Report
Retirement and Education Accounts
Thornburg Investment Management offers retirement and education savings accounts that can help you meet a variety of planning challenges. For account applications or further information on any of the accounts below, please call 1-800-847-0200 or go to www.thornburg.com/ira. Your financial advisor can help you determine which plan is right for you.
Individual Retirement Accounts
Individual Retirement Accounts (IRAs) provide a tax-advantaged means to save money for the future. For a detailed outline of the difference between retirement accounts, see www.thornburg.com/ira. Rollovers are available. Call 1-800-847-0200 for more information.
Traditional IRAs – Contributions to Traditional IRAs are tax deductible for eligible individuals, and withdrawals are taxed as additional ordinary income. You may contribute to an IRA if you receive compensation and are under 70 1⁄2, even if you are covered by an employer retirement plan. Deductible contributions are subject to certain qualifications. Please consult your tax advisor.
Roth IRAs – Under a Roth IRA, there is no tax deduction for contributions, but there is no income tax on qualified withdrawals. For a more detailed comparison of Traditional and Roth IRAs, please see our website at www.thornburg. com/ira.
SEP IRAs – Simplified Employee Pension (SEP) IRAs are established by employers. The employer is allowed a tax deduction for contributions made to the SEP Plan and makes contributions to each eligible employee’s SEP IRA on a discretionary basis.
SIMPLE IRAs – Savings Incentive Match Plan for Employees of Small Employers (SIMPLE) is designed to give small business owners a simplified method to establish and contribute to a retirement plan for employees. The employer is allowed a tax deduction for contributions and makes either matching or non-elective contributions to each eligible employee’s SIMPLE IRA. Employees may make salary deferral contributions.
Coverdell Education Savings Account
These savings accounts are designed to provide a way to save money for higher education expenses. In an Education Savings Account, earnings and interest grow tax-free, and qualified withdrawals used to pay for eligible higher-education expenses are tax- and penalty-free.
Funds Available
The following funds are available in the accounts listed above:
| | • | | Thornburg Core Growth Fund |
| | • | | Thornburg International Value Fund |
| | • | | Thornburg International Growth Fund |
| | • | | Thornburg Developing World Fund |
| | • | | Thornburg Investment Income Builder Fund |
| | • | | Thornburg Global Opportunities Fund |
| | • | | Thornburg Low Duration Income Fund |
| | • | | Thornburg Limited Term U.S. Government Fund |
| | • | | Thornburg Limited Term Income Fund |
| | • | | Thornburg Strategic Income Fund |
This page is not part of the Semi-Annual Report 41
Firm & Philosophy

The Firm
Founded in 1982 and headquartered in Santa Fe, New Mexico, Thornburg Investment Management advises a range of active investment strategies, each offered through multiple vehicles, to serve a broad spectrum of client needs worldwide. From short-term fixed income to flexible global equity, our objective is to help clients reach their long-term financial goals via active portfolio management. As of March 31, 2014, Thornburg managed approximately $90 billion in assets.
Investment Philosophy
We seek to preserve and increase the real wealth of shareholders after accounting for inflation, taxes, and investment expenses. We’re committed to disciplined investing and managing risk in all market environments.
Portfolio Holdings Commentary
At Thornburg, we believe you should know what you own. Our website keeps investors informed of the Funds’ equity holdings. Go to www.thornburg.com/funds for equity funds holdings and commentary.
Co-Ownership of Funds
We invest side-by-side with shareholders. Our employees have invested $387 million in Thornburg products as of March 31, 2014.
42 This page is not part of the Semi-Annual Report
Thornburg Fund Family
Thornburg Equity Funds
Thornburg’s equity research uses a fundamentally driven, bottom-up, comprehensive analytical approach. Thornburg equity funds generally focus on a limited number of securities so that each holding can impact performance. The team searches for firms believed to have a promising future and seeks to buy shares of those companies at a discount to their intrinsic or long-term value.
| | • | | Thornburg Core Growth Fund |
| | • | | Thornburg International Value Fund |
| | • | | Thornburg International Growth Fund |
| | • | | Thornburg Developing World Fund |
| | • | | Thornburg Investment Income Builder Fund |
| | • | | Thornburg Global Opportunities Fund |
Thornburg Bond Funds
Thornburg Investment Management applies a disciplined philosophy to fixed-income management. Since the launch of our first fixed-income fund over 25 years ago, we have been conducting fundamental, bottom-up research in an effort to identify bonds which we believe provide the best return for a given level of risk. We avoid leverage or complex strategies which could backfire in periods of market uncertainty.
| | • | | Thornburg Low Duration Income Fund |
| | • | | Thornburg Limited Term U.S. Government Fund |
| | • | | Thornburg Limited Term Income Fund |
| | • | | Thornburg Strategic Income Fund |
| | • | | Thornburg Low Duration Municipal Fund |
| | • | | Thornburg Limited Term Municipal Fund |
| | • | | Thornburg Intermediate Municipal Fund |
| | • | | Thornburg California Limited Term Municipal Fund |
| | • | | Thornburg New Mexico Intermediate Municipal Fund |
| | • | | Thornburg New York Intermediate Municipal Fund |
| | • | | Thornburg Strategic Municipal Income Fund |
Before investing, carefully consider the Fund’s investment goals, risks, charges, and expenses. For a prospectus or summary prospectus containing this and other information, contact your financial advisor or visit thornburg.com. Read it carefully before investing.
For additional information, please visit thornburg.com
Thornburg Investment Management, Inc. 2300 North Ridgetop Road, Santa Fe, NM 87506
This page is not part of the Semi-Annual Report 43
| | |
 | | Waste not, Wait not |

This Semi-Annual Report is submitted for the general information of shareholders of the Fund. It is not authorized for distribution to prospective investors in the Fund unless preceded or accompanied by an effective prospectus.
| | | | |
Investment Advisor: Thornburg Investment Management® 800.847.0200 | | Distributor: Thornburg Securities Corporation® 800.847.0200 | | TH1663 |

2 This page is not part of the Semi-Annual Report
Important Information
The information presented on the following pages was current as of March 31, 2014. The managers’ views, portfolio holdings, and sector diversification are provided for the general information of the Fund’s shareholders; to the extent this information is historical, it should not be considered predictive of future circumstances. This material should not be deemed a recommendation to buy or sell any of the securities mentioned.
Investments in the Fund carry risks, including possible loss of principal. Special risks may be associated with investments outside the United States, especially in emerging markets, including currency fluctuations, illiquidity, volatility, and political and economic risks. Investments in small capitalization companies may increase the risk of greater price fluctuations. Please see the Fund’s Prospectus for a discussion of the risks associated with an investment in the Fund. Investments in the Fund are not FDIC insured, nor are they deposits of or guaranteed by a bank or any other entity. There is no guarantee that the Fund will meet its investment objectives. Funds invested in a limited number of holdings may expose an investor to greater volatility.
Performance data given at net asset value (NAV) does not take into account the applicable sales charges. If the sales charges had been included, the performance would have been lower.
Class I, R3, R4, and R5 shares may not be available to all investors. Minimum investments for Class I shares may be higher than those for other classes.
| | | | |
SHARE CLASS | | NASDAQ SYMBOL | | CUSIP |
Class A | | TVAFX | | 885-215-731 |
Class B | | TVBFX | | 885-215-590 |
Class C | | TVCFX | | 885-215-715 |
Class I | | TVIFX | | 885-215-632 |
Class R3 | | TVRFX | | 885-215-533 |
Class R4 | | TVIRX | | 885-215-277 |
Class R5 | | TVRRX | | 885-215-376 |
Glossary
S&P 500 Index – The S&P 500 Index is a broad measure of the U.S. stock market.
Unless otherwise noted, index returns reflect the reinvestment of income dividends and capital gains, if any, but do not reflect fees, brokerage commissions or other expenses of investing. Investors may not make direct investments into any index. The performance of any index is not indicative of the performance of any particular investment.
Beta – A measure of market-related risk. Less than one means the portfolio is less volatile than the index, while greater than one indicates more volatility than the index.
Earnings per Share (EPS) – The total earnings divided by the number of shares outstanding.
Forward P/E – Price to earnings ratio, using earnings estimates for the next four quarters.
Intrinsic Value – A term that reflects Thornburg’s estimate of a company’s value, encompassing our collective investment judgment.
Median Market Capitalization – Market capitalization (market cap) is the total value of a company’s stock, calculated by multiplying the number of outstanding common shares by the current share price. The company whose market cap is in the middle of the portfolio is the median market cap. Half the companies in the portfolio have values greater than the median and half have values that are less.
Multiple – A term that measures some aspect of a company’s financial well-being, determined by dividing one metric by another metric. The metric in the numerator is typically larger than the one in the denominator, because the top metric is usually supposed to be many times larger than the bottom metric.
Price to Book Value (P/B) – A ratio used to compare a stock’s market value to its book value. It is calculated by dividing the current closing price of the stock by the latest quarter’s book value (book value is simply assets minus liabilities).
Price to Cash Flow Ratio – A measure of the market’s expectations of a firm’s future financial health. It is calculated by dividing the price per share by cash flow per share.
Price to Earnings Ratio (P/E) – A valuation ratio equaling a company’s market value per share divided by earnings per share.
This page is not part of the Semi-Annual Report 3

Portfolio Manager

Connor Browne, CFA
Objectives and Strategies
The Fund seeks long-term capital appreciation by investing in equity and debt securities of all types. As a secondary consideration, the Fund also seeks some current income.
The Fund expects to invest primarily in domestic equity securities (primarily common stocks) selected on a value basis. However, the Fund may own a variety of securities, including foreign equity securities, partnership interests, and foreign and domestic debt obligations which, in the opinion of the Fund’s investment advisor, offer prospects for meeting the Fund’s investment goals.
Finding Promising Companies at a Discount
The Thornburg Value Fund seeks to find promising companies at a discounted valuation. It differs from many other equity funds in two key ways. First, it typically invests in a limited number of stocks, and second, it takes a more comprehensive approach to value investing.
Our team is dedicated to providing value to shareholders. We strive to accomplish this through the application of seasoned investment principles with hands-on, company-oriented research. We use a collaborative research approach in identifying and analyzing investment ideas. Our focus is on finding promising companies available at a discount to our estimate of their intrinsic value.
In managing the Thornburg Value Fund, we take a bottom-up approach to stock selection. The Fund is not predisposed to an industry or sector. We use a combination of financial analysis, collaborative research, and business evaluation in an effort to gauge what we believe is the intrinsic value of a company based on its past record and future potential. The continuum of process moves from screens and idea generation, through conventional “Wall Street” research and documentation, to company contact, often including on-site visits. The focus of the analysis is on what’s behind the numbers, its revenue and cash-generating model. We make an effort to get to know the company’s reputation in the industry, its people and its corporate culture.
The current posture is to maintain a portfolio of 35–55 companies diversified by sector, industry, market capitalization, and our three categories of stocks: basic value, consistent earners and emerging franchises. Because of the limited number of stocks in the portfolio, every holding counts. At the time of purchase, we set a 12–18 month price target for each stock. The target is reviewed as the fundamentals of the stock change during the course of ownership.
The bottom line? Engendering a wide-open, collegial environment fosters information flow and critical thinking intended to benefit portfolio decision making. We do not view our location in Santa Fe, New Mexico as a disadvantage. While we have access to the best of Wall Street’s analysis, we are not ruled by it. Distance from the crowd serves to fortify independent and objective thinking.
4 This page is not part of the Semi-Annual Report
Key Portfolio Attributes
As of March 31, 2014
| | | | |
Portfolio P/E Trailing 12-months* | | | 20.5x | |
Portfolio Price to Cash Flow* | | | 10.6x | |
Portfolio Price to Book Value* | | | 2.5x | |
Median Market Cap* | | $ | 14.4 B | |
7-Year Beta (A Shares vs. S&P 500)* | | | 1.14 | |
Number of Companies | | | 57 | |
| * Source: FactSet | | | | |
Market Capitalization Exposure
As of March 31, 2014
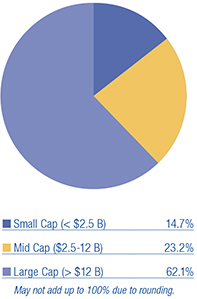
Basket Structure
As of March 31, 2014
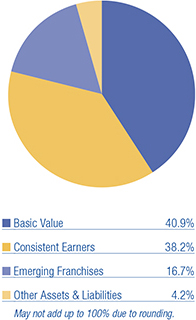
Average Annual Total Returns
For Periods Ended March 31, 2014
| | | | | | | | | | | | | | | | | | | | |
| A Shares (Incep: 10/2/95) | | 1 YR | | | 3 YRS | | | 5 YRS | | | 10 YRS | | | SINCE
INCEPTION | |
Without sales charge | | | 28.86 | % | | | 7.90 | % | | | 18.82 | % | | | 6.55 | % | | | 9.93 | % |
With sales charge | | | 23.04 | % | | | 6.25 | % | | | 17.73 | % | | | 6.06 | % | | | 9.65 | % |
S&P 500 Index (Since 10/2/95) | | | 21.86 | % | | | 14.66 | % | | | 21.16 | % | | | 7.42 | % | | | 8.52 | % |
Performance data shown represents past performance and is no guarantee of future results. Investment return and principal value will fluctuate so shares, when redeemed, may be worth more or less than their original cost. Current performance may be lower or higher than quoted. For performance current to the most recent month end, visit thornburg.com or call 800.847.0200.
The maximum sales charge for Class A shares is 4.50%. The total annual fund operating expense of Class A shares is 1.40%, as disclosed in the most recent Prospectus.
Stocks Contributing and Detracting
For the Six Months Ended March 31, 2014
| | |
TOP CONTRIBUTORS | | TOP DETRACTORS |
| Thermo Fisher Scientific, Inc. | | Anadarko Petroleum Corp. |
| Google, Inc. | | Tokyo Steel Manufacturing Co., Ltd. |
| Level 3 Communications, Inc. | | Covanta Holding Corp. |
| Gogo, Inc. | | China Mobile Ltd. |
| Aramark Holdings Corp. | | ADT Corp. |
Source: FactSet
This page is not part of the Semi-Annual Report 5
2014 Certified Semi-Annual Report
Thornburg Value Fund
March 31, 2014
This report is certified under the Sarbanes-Oxley Act of 2002, which requires that public companies, including mutual funds, affirm that the information provided in their annual and semi-annual shareholder reports fully and fairly represents their financial position and the results of their operations for the period presented.
6 Certified Semi-Annual Report
Letter to Shareholders
April 15, 2014
Dear Fellow Shareholders,
The first half of our current fiscal year proved strong for the Thornburg Value Fund and the U.S. equity market. The Fund returned 13.52% per Class A share at net asset value (NAV) in the six months ended March 31, 2014, versus a 12.51% advance for the S&P 500 Index. While most of the period was positive, we were pleased the Fund exhibited better downside protection than the market during January’s volatility, declining materially less than the S&P 500 Index did that month. We continue to work hard on bolstering its “consistent earnings” characteristics, and seeking to position the Fund for outperformance in any market environment.
The Thornburg Value Fund benefitted from positive stock selection in the period, with our best picks in the information technology, consumer discretionary and telecommunication sectors. Our stock selection was weak during the six months in the industrials, materials and health care sectors. Our relative exposure (what we call allocation effect) was a slight drag on the Fund’s performance, and our reasonably large cash position (5.8% on average for the six months) hurt performance given the considerable gains among both our stocks and the index during the period. We benefitted from our overweight position in health care stocks and our underweight in consumer staples stocks. Our overweight in telecommunication stocks hurt performance on an allocation basis, although we again benefitted from good stock picking within that sector during the period.
Our top contributors during the six months were Thermo Fisher Scientific, Google, Level 3 Communications, Gogo and Aramark. We have long believed that Thermo Fisher’s predictable top-line growth, steady operating margin expansion, strong cash return, and value-creating acquisitions were worth more than the low forward price/earnings valuation the market afforded the company over the last few years. We recently saw strong execution at the company, which garnered it a higher forward price/earnings multiple. Thermo Fisher has long been a large “consistent earner” in the Fund. Google, meanwhile, has continued to gain share within online advertising, which we will discuss a bit more below.
Level 3 Communications is another long-time holding of the Fund: we had invested successfully in the company’s debt before initiating our equity investment in the company in 2010. This year should mark a turn to strong free cash flow generation at Level 3, which we believe will make the company’s strategic fiber assets more appealing to both investors and potential acquirers. Gogo and Aramark both debuted with initial public offerings during 2013. Gogo is the leading provider of in-flight WiFi service on flights in the United States. We did a good job of sticking to our guns and adding during bouts of weakness in its share price. After going public at $17 in June 2013, the stock has traded as low as $9.71 and as high as $35.77 in the ensuing 10 months. Given the swings, the market gave us ample opportunity to both buy and sell Gogo shares during the period, generating a tidy profit for Fund shareholders. Aramark is a leading provider of food and other institutional services for large corporate clients all over the world. But it’s more than cafeteria food. The next time you get a Primanti Brothers sandwich at Heinz Field in Pittsburgh, try to remember it’s actually Aramark that is serving it up! Aramark was recently brought to market by private equity sponsors Warburg Pincus, Goldman Sachs, and Thomas H. Lee Partners, among others. This looks like a predictable, cash generative business to us, and we believe the company can support its lowered (though still reasonably high) leverage. Eric Foss, installed as Aramark’s new chief executive in 2012, and a Pepsi Beverage Co. alum, seems to have already improved Aramark’s corporate culture and driven robust operating metrics.
Given the strong market environment, it’s not surprising that our top-five contributors added more than 2.5 times what our bottom five cost during the period. ADT, Tokyo Steel, China Mobile, Covanta, and Anadarko were our five worst stocks from October 2013 through March 2014. ADT is the leading provider of home security systems in the U.S. We invested on the company’s spin-off from Tyco in late 2012. We like its leading position in a fragmented U.S. market, in which home security penetration reaches just 20% or so, yet has been growing steadily over the last few years. Further, the firm’s ADT Pulse offering hints at the promise of the connected home (and promised higher
Certified Semi-Annual Report 7
Letter to Shareholders,
Continued
average selling prices for ADT). Unfortunately, weak year-end 2013 results suggest that the competitive environment (with AT&T and Comcast now actively competing in this space) has intensified more than we had anticipated. We sold the stock on fundamental deterioration.
Tokyo Steel had been a long-time portfolio holding on the belief that a new mini-mill in Japan presented good upside relative to controlled downside, not to mention a solid balance sheet. However, we recently determined that our estimates of over-supply in Chinese steel manufacturing had been too low, and that overcapacity puts in jeopardy Tokyo Steel’s ability to monetize its new facility. We sold the stock in early 2014. Our original investment in Tokyo Steel came in 2010. Prior to our sale, the stock rebounded dramatically from its lows in late 2012. Still, we sold the stock at a price significantly lower than our original purchase price and cost basis.
China Mobile traded weaker during the first half of the six-month period on increasing costs associated with the rollout of its 4G network in China. We believe long-term promise remains as China Mobile works to monetize data usage on a faster network over the coming years. Covanta operates a network of waste-to-energy plants in the U.S., literally generating trash-fired electricity. Because landfills generate greenhouse gases (mostly methane), burning the trash to generate energy is actually cleaner than coal-fired generation. Covanta is undertaking investment to expand capacity, while maintenance spending has also ticked higher, causing some investors to question Covanta’s ability to generate free cash flow over the coming years. We are long-term believers in Covanta’s growth prospects. Anadarko traded lower due to an unfavorable court decision involving environmental liabilities related to a spinoff from its Kerr-McGee unit (known as the Tronox Lawsuit). We sold Anadarko on the news, a decision that, in retrospect, cost our shareholders money. At the time we were uncomfortable with the uncertainty introduced by this unfavorable court ruling. Since our sale, Anadarko settled the suit in a $5 billion deal — much less than the possible $15 billion liability. The stock rebounded on settlement news.
Separately, we highlight two recent areas of interest for the Fund: online advertising and energy. By one measure, worldwide advertising spending reached $490 billion last year, with online advertising representing $118 billion, or 24% of the total, up from just 13% five years ago. This growth may seem surprising. Perhaps more surprising is that television advertising still represents 40% of the total. You may now associate television advertising with the blurs that move across your screen when you fast-forward your digital video recorder to immediately continue with your favorite show. Or perhaps you use it for a run to the kitchen, or to look down at your tablet or smartphone. Yet even with increasing distractions and marginalization, television advertising remains the Holy Grail of brand advertisers. But we anticipate this will change over the coming years. We have long had a successful investment in Google, the leader in online advertising. During the latest six-month period, we participated in a successful investment in Facebook (recently sold at our price target). We also initiated a small position in Marin Software, a small-cap “emerging franchise” company that we believe is well-positioned to benefit from the growth in online advertising and looks very cheap relative to its prospects. This is an area the team is following closely and one in which we will likely invest for many years to come.
Within energy, sentiment has soured on the prospects for the companies that own vessels used for offshore drilling. We think this is primarily because we are on the cusp of a significant increase in the number of these vessels available to rent. With more supply relative to demand, it’s not surprising that the “day rates,” (i.e. the rental price) may head lower. What has been interesting to us is how many of the companies that supply goods to the offshore drilling space have been dragged lower as well. Frank’s International is an example of a “basic value” company in the portfolio. It mainly supplies tubular casing products and services to both offshore and onshore drillers. Our contention is that the volume of its casings, rather than the day rates of the ships that deploy Frank’s casings, is what will matter for its stock value. More drilling rigs, we believe, will mean more boreholes drilled. We have found a number of exciting investments within the energy space over the last year or so and today have an overweight position in the industry group relative to the S&P 500 Index.
8 Certified Semi-Annual Report
Letter to Shareholders,
Continued
In summary, it was a good first half year for the Thornburg Value Fund. We continue to work to bolster the “consistent earnings” aspects of the portfolio, and are pleased with our progress on this front over the last year and a half. In addition to work on the overall characteristics of Thornburg Value Fund, day in day out the investment team is also focused on finding the next great new investment idea for the portfolio. We are pleased with recent research activity and believe the group of stocks we own today represents a diverse selection of promising companies currently trading at a discount to our calculation of their intrinsic value.
Thank you for your continued trust.
Sincerely,

Connor Browne, CFA
Portfolio Manager
Managing Director
The matters discussed in this report may constitute forward-looking statements made pursuant to the safe harbor provisions of the Securities Litigation Reform Act of 1995. These include any advisor or portfolio manager prediction, assessment, analysis or outlook for individual securities, industries, investment styles, market sectors and/or markets. These statements involve risks and uncertainties. In addition to the general risks described for each fund in its current prospectus, other factors bearing on these reports include the accuracy of the advisor’s or portfolio manager’s forecasts and predictions, the appropriateness of the investment strategies designed by the advisor or portfolio manager and the ability of the advisor or portfolio manager to implement their strategies efficiently and successfully. Any one or more of these factors, as well as other risks affecting the securities markets generally, could cause the actual results of any fund to differ materially as compared to its benchmarks.
Certified Semi-Annual Report 9
| | |
| Schedule of Investments | | |
| |
Thornburg Value Fund | | March 31, 2014 (Unaudited) |
Top Ten Equity Holdings
As of 3/31/14
| | | | |
Gilead Sciences, Inc. | | | 4.2 | % |
Thermo Fisher Scientific, Inc. | | | 3.2 | % |
Total SA | | | 3.1 | % |
Google, Inc. | | | 3.0 | % |
Express Scripts Holding Company | | | 2.8 | % |
JPMorgan Chase & Co. | | | 2.6 | % |
Walgreen Co. | | | 2.4 | % |
INPEX Corp. | | | 2.3 | % |
Zoetis, Inc. | | | 2.3 | % |
Life Time Fitness, Inc. | | | 2.1 | % |
Summary of Industry Exposure
As of 3/31/14
| | | | |
Pharmaceuticals, Biotechnology & Life Sciences | | | 13.9 | % |
Energy | | | 13.4 | % |
Consumer Services | | | 12.2 | % |
Software & Services | | | 9.3 | % |
Diversified Financials | | | 5.7 | % |
Telecommunication Services | | | 5.5 | % |
Retailing | | | 5.0 | % |
Banks | | | 4.6 | % |
Food, Beverage & Tobacco | | | 4.1 | % |
Food & Staples Retailing | | | 3.8 | % |
Health Care Equipment & Services | | | 2.8 | % |
Insurance | | | 2.1 | % |
Real Estate | | | 2.1 | % |
Commercial & Professional Services | | | 2.0 | % |
Materials | | | 1.7 | % |
Utilities | | | 1.7 | % |
Consumer Durables & Apparel | | | 1.5 | % |
Technology Hardware & Equipment | | | 1.5 | % |
Transportation | | | 1.5 | % |
Capital Goods | | | 1.4 | % |
Other Assets & Liabilities | | | 4.2 | % |
| | | | | | | | |
| | | SHARES/
PRINCIPAL
AMOUNT | | | VALUE | |
COMMON STOCK — 95.76% | | | | | | | | |
| | |
BANKS — 4.58% | | | | | | | | |
| | |
Banks — 2.91% | | | | | | | | |
First Republic Bank | | | 286,300 | | | $ | 15,457,337 | |
Sterling Financial Corp. | | | 436,729 | | | | 14,556,178 | |
Thrifts & Mortgage Finance — 1.67% | | | | | | | | |
a NMI Holdings, Inc. | | | 1,469,000 | | | | 17,216,680 | |
| | | | | | | | |
| | | | | | | 47,230,195 | |
| | | | | | | | |
CAPITAL GOODS — 1.46% | | | | | | | | |
Building Products — 0.54% | | | | | | | | |
a Continental Building Products, Inc. | | | 295,400 | | | | 5,565,336 | |
Trading Companies & Distributors — 0.92% | | | | | | | | |
Fly Leasing Ltd. ADR | | | 635,593 | | | | 9,533,895 | |
| | | | | | | | |
| | | | | | | 15,099,231 | |
| | | | | | | | |
COMMERCIAL & PROFESSIONAL SERVICES — 1.99% | | | | | | | | |
Commercial Services & Supplies — 0.99% | | | | | | | | |
Covanta Holding Corp. | | | 564,300 | | | | 10,185,615 | |
Professional Services — 1.00% | | | | | | | | |
Nielsen Holdings N.V. | | | 230,533 | | | | 10,288,688 | |
| | | | | | | | |
| | | | | | | 20,474,303 | |
| | | | | | | | |
CONSUMER DURABLES & APPAREL — 1.55% | | | | | | | | |
Household Durables — 1.55% | | | | | | | | |
Tupperware Brands Corp. | | | 190,926 | | | | 15,991,962 | |
| | | | | | | | |
| | | | | | | 15,991,962 | |
| | | | | | | | |
10 Certified Semi-Annual Report
| | |
| Schedule of Investments, continued | | |
| |
Thornburg Value Fund | | March 31, 2014 (Unaudited) |
| | | | | | | | |
| | | SHARES/
PRINCIPAL
AMOUNT | | | VALUE | |
CONSUMER SERVICES — 12.18% | | | | | | | | |
Diversified Consumer Services — 2.82% | | | | | | | | |
a Bright Horizons Family Solutions, Inc. | | | 272,000 | | | $ | 10,637,920 | |
a Nord Anglia Education, Inc. | | | 963,594 | | | | 18,472,097 | |
Hotels, Restaurants & Leisure — 9.36% | | | | | | | | |
Aramark Holdings Corp. | | | 728,948 | | | | 21,081,176 | |
a Life Time Fitness, Inc. | | | 458,141 | | | | 22,036,582 | |
a MGM Resorts International | | | 499,941 | | | | 12,928,474 | |
a Norwegian Cruise Line Holdings Ltd. | | | 633,200 | | | | 20,433,364 | |
Starbucks Corp. | | | 272,300 | | | | 19,981,374 | |
| | | | | | | | |
| | | | | | | 125,570,987 | |
| | | | | | | | |
DIVERSIFIED FINANCIALS — 5.70% | | | | | | | | |
Capital Markets — 2.07% | | | | | | | | |
The Blackstone Group LP | | | 640,700 | | | | 21,303,275 | |
Diversified Financial Services — 3.63% | | | | | | | | |
Citigroup, Inc. | | | 214,400 | | | | 10,205,440 | |
JPMorgan Chase & Co. | | | 448,940 | | | | 27,255,147 | |
| | | | | | | | |
| | | | | | | 58,763,862 | |
| | | | | | | | |
ENERGY — 13.44% | | | | | | | | |
Energy Equipment & Services — 3.17% | | | | | | | | |
a Dresser-Rand Group, Inc. | | | 319,100 | | | | 18,638,631 | |
Frank’s International N.V. | | | 568,061 | | | | 14,076,552 | |
Oil, Gas & Consumable Fuels — 10.27% | | | | | | | | |
a Antero Resources Corp. | | | 129,000 | | | | 8,075,400 | |
a Bankers Petroleum Ltd. | | | 3,735,020 | | | | 18,176,759 | |
HollyFrontier Corp. | | | 312,000 | | | | 14,844,960 | |
INPEX Corp. | | | 1,834,800 | | | | 23,802,715 | |
Pacific Rubiales Energy Corp. | | | 525,300 | | | | 9,460,627 | |
Total SA | | | 480,800 | | | | 31,528,998 | |
| | | | | | | | |
| | | | | | | 138,604,642 | |
| | | | | | | | |
FOOD & STAPLES RETAILING — 3.85% | | | | | | | | |
Food & Staples Retailing — 3.85% | | | | | | | | |
Koninklijke Ahold NV | | | 722,215 | | | | 14,506,498 | |
Walgreen Co. | | | 381,900 | | | | 25,216,857 | |
| | | | | | | | |
| | | | | | | 39,723,355 | |
| | | | | | | | |
FOOD, BEVERAGE & TOBACCO — 4.11% | | | | | | | | |
Food Products — 4.11% | | | | | | | | |
Mead Johnson Nutrition Co. | | | 263,700 | | | | 21,924,018 | |
Mondelez International, Inc. | | | 593,000 | | | | 20,488,150 | |
| | | | | | | | |
| | | | | | | 42,412,168 | |
| | | | | | | | |
HEALTH CARE EQUIPMENT & SERVICES — 2.77% | | | | | | | | |
Health Care Providers & Services — 2.77% | | | | | | | | |
a Express Scripts Holding Company | | | 379,687 | | | | 28,510,697 | |
| | | | | | | | |
| | | | | | | 28,510,697 | |
| | | | | | | | |
INSURANCE — 2.09% | | | | | | | | |
Insurance — 2.09% | | | | | | | | |
MetLife, Inc. | | | 408,140 | | | | 21,549,792 | |
| | | | | | | | |
| | | | | | | 21,549,792 | |
| | | | | | | | |
MATERIALS — 1.68% | | | | | | | | |
Chemicals — 0.62% | | | | | | | | |
LyondellBasell Industries NV | | | 72,100 | | | | 6,412,574 | |
Metals & Mining — 1.06% | | | | | | | | |
a Horsehead Holding Corp. | | | 650,400 | | | | 10,939,728 | |
| | | | | | | | |
| | | | | | | 17,352,302 | |
| | | | | | | | |
Certified Semi-Annual Report 11
| | |
| Schedule of Investments, continued | | |
| |
Thornburg Value Fund | | March 31, 2014 (Unaudited) |
| | | | | | | | |
| | | SHARES/
PRINCIPAL
AMOUNT | | | VALUE | |
PHARMACEUTICALS, BIOTECHNOLOGY & LIFE SCIENCES — 13.92% | | | | | | | | |
Biotechnology — 4.22% | | | | | | | | |
a Gilead Sciences, Inc. | | | 613,486 | | | $ | 43,471,618 | |
Life Sciences Tools & Services — 3.19% | | | | | | | | |
Thermo Fisher Scientific, Inc. | | | 273,800 | | | | 32,921,712 | |
Pharmaceuticals — 6.51% | | | | | | | | |
a Endo International plc | | | 109,200 | | | | 7,496,580 | |
Roche Holding AG | | | 69,216 | | | | 20,747,967 | |
a Valeant Pharmaceuticals International, Inc. | | | 118,517 | | | | 15,624,096 | |
Zoetis, Inc. | | | 802,950 | | | | 23,237,373 | |
| | | | | | | | |
| | | | | | | 143,499,346 | |
| | | | | | | | |
REAL ESTATE — 2.08% | | | | | | | | |
Real Estate Investment Trusts — 2.08% | | | | | | | | |
Invesco Mortgage Capital, Inc. | | | 648,100 | | | | 10,674,207 | |
Two Harbors Investment Corp. | | | 1,048,400 | | | | 10,746,100 | |
| | | | | | | | |
| | | | | | | 21,420,307 | |
| | | | | | | | |
RETAILING — 4.99% | | | | | | | | |
Internet & Catalog Retail — 1.47% | | | | | | | | |
a Amazon.com, Inc. | | | 44,938 | | | | 15,122,536 | |
Multiline Retail — 2.04% | | | | | | | | |
Target Corp. | | | 346,900 | | | | 20,990,919 | |
Specialty Retail — 1.48% | | | | | | | | |
a AutoZone, Inc. | | | 28,449 | | | | 15,279,958 | |
| | | | | | | | |
| | | | | | | 51,393,413 | |
| | | | | | | | |
SOFTWARE & SERVICES — 9.27% | | | | | | | | |
Internet Software & Services — 7.73% | | | | | | | | |
a Facebook, Inc. | | | 164,700 | | | | 9,921,528 | |
a Google, Inc. | | | 28,174 | | | | 31,400,205 | |
a Marin Software, Inc. | | | 755,307 | | | | 7,983,595 | |
a VeriSign, Inc. | | | 333,500 | | | | 17,978,985 | |
a Yahoo!, Inc. | | | 345,093 | | | | 12,388,838 | |
Software — 1.54% | | | | | | | | |
Activision Blizzard, Inc. | | | 778,400 | | | | 15,910,496 | |
| | | | | | | | |
| | | | | | | 95,583,647 | |
| | | | | | | | |
TECHNOLOGY HARDWARE & EQUIPMENT — 1.49% | | | | | | | | |
Electronic Equipment, Instruments & Components — 1.49% | | | | | | | | |
CDW Corp. | | | 561,200 | | | | 15,399,328 | |
| | | | | | | | |
| | | | | | | 15,399,328 | |
| | | | | | | | |
TELECOMMUNICATION SERVICES — 5.46% | | | | | | | | |
Diversified Telecommunication Services — 1.90% | | | | | | | | |
a Level 3 Communications, Inc. | | | 500,951 | | | | 19,607,222 | |
Wireless Telecommunication Services — 3.56% | | | | | | | | |
China Mobile Ltd. | | | 2,088,888 | | | | 19,120,872 | |
SoftBank Corp. | | | 231,925 | | | | 17,526,668 | |
| | | | | | | | |
| | | | | | | 56,254,762 | |
| | | | | | | | |
TRANSPORTATION — 1.49% | | | | | | | | |
Airlines — 1.49% | | | | | | | | |
a American Airlines Group, Inc. | | | 420,500 | | | | 15,390,300 | |
| | | | | | | | |
| | | | | | | 15,390,300 | |
| | | | | | | | |
UTILITIES — 1.66% | | | | | | | | |
Electric Utilities — 1.66% | | | | | | | | |
ITC Holdings Corp. | | | 458,100 | | | | 17,110,035 | |
| | | | | | | | |
| | | | | | | 17,110,035 | |
| | | | | | | | |
TOTAL COMMON STOCK (Cost $717,749,104) | | | | | | | 987,334,634 | |
| | | | | | | | |
12 Certified Semi-Annual Report
| | |
| Schedule of Investments, continued | | |
| |
Thornburg Value Fund | | March 31, 2014 (Unaudited) |
| | | | | | | | |
| | | SHARES/
PRINCIPAL
AMOUNT | | | VALUE | |
SHORT TERM INVESTMENTS — 4.17% | | | | | | | | |
| | |
Ameren Corp., 0.25%, 4/1/2014 | | $ | 15,000,000 | | | $ | 15,000,000 | |
Bank of New York Tri-Party Repurchase Agreement 0.24% dated 3/31/2014 due 4/1/2014, repurchase price $14,000,093 collateralized by 6 U.S. Government debt securities and 13 corporate debt securities, having an average coupon of 4.50%, a minimum credit rating of BBB-, maturity dates from 3/1/2016 to 3/1/2044, and having an aggregate market value of $14,673,870 at 3/31/2014 | | | 14,000,000 | | | | 14,000,000 | |
Kansas City Power & Light, 0.19%, 4/1/2014 | | | 14,000,000 | | | | 14,000,000 | |
| | | | | | | | |
TOTAL SHORT TERM INVESTMENTS (Cost $43,000,000) | | | | | | | 43,000,000 | |
| | | | | | | | |
TOTAL INVESTMENTS — 99.93% (Cost $760,749,104) | | | | | | $ | 1,030,334,634 | |
OTHER ASSETS LESS LIABILITIES — 0.07% | | | | | | | 754,278 | |
| | | | | | | | |
NET ASSETS — 100.00% | | | | | | $ | 1,031,088,912 | |
| | | | | | | | |
Footnote Legend
Portfolio Abbreviations
To simplify the listings of securities, abbreviations are used per the table below:
| | |
| ADR | | American Depository Receipt |
See notes to financial statements.
Certified Semi-Annual Report 13
| | |
| Statement of Assets and Liabilities | | |
| |
Thornburg Value Fund | | March 31, 2014 (Unaudited) |
| | | | |
ASSETS | | | | |
Investments at value (cost $760,749,104) (Note 2) | | $ | 1,030,334,634 | |
Cash | | | 1,041,432 | |
Receivable for fund shares sold | | | 1,261,921 | |
Unrealized appreciation on forward currency contracts (Note 7) | | | 244,266 | |
Dividends receivable | | | 2,682,112 | |
Dividend and interest reclaim receivable | | | 1,057,829 | |
Interest receivable | | | 93 | |
Prepaid expenses and other assets | | | 26,620 | |
| | | | |
Total Assets | | | 1,036,648,907 | |
| | | | |
| |
LIABILITIES | | | | |
Payable for investments purchased | | | 433,886 | |
Payable for fund shares redeemed | | | 2,662,042 | |
Unrealized depreciation on forward currency contracts (Note 7) | | | 748,838 | |
Payable to investment advisor and other affiliates (Note 3) | | | 1,093,852 | |
Accounts payable and accrued expenses | | | 621,377 | |
| | | | |
Total Liabilities | | | 5,559,995 | |
| | | | |
| |
NET ASSETS | | $ | 1,031,088,912 | |
| | | | |
NET ASSETS CONSIST OF | | | | |
Undistributed net investment income | | $ | 2,253,299 | |
Net unrealized appreciation on investments | | | 269,129,654 | |
Accumulated net realized gain (loss) | | | (660,784,870 | ) |
Net capital paid in on shares of beneficial interest | | | 1,420,490,829 | |
| | | | |
| | $ | 1,031,088,912 | |
| | | | |
14 Certified Semi-Annual Report
| | |
| Statement of Assets and Liabilities, Continued |
| |
Thornburg Value Fund | | March 31, 2014 (Unaudited) |
| | | | |
NET ASSET VALUE | | | | |
Class A Shares: | | | | |
Net asset value and redemption price per share
($425,839,167 applicable to 9,197,385 shares of beneficial interest outstanding - Note 4) | | $ | 46.30 | |
Maximum sales charge, 4.50% of offering price | | | 2.18 | |
| | | | |
Maximum offering price per share | | $ | 48.48 | |
| | | | |
| |
Class B Shares: | | | | |
Net asset value per share*
($6,092,688 applicable to 143,598 shares of beneficial interest outstanding - Note 4) | | $ | 42.43 | |
| | | | |
| |
Class C Shares: | | | | |
Net asset value and offering price per share*
($179,591,723 applicable to 4,151,178 shares of beneficial interest outstanding - Note 4) | | $ | 43.26 | |
| | | | |
| |
Class I Shares: | | | | |
Net asset value, offering and redemption price per share
($289,413,577 applicable to 6,094,081 shares of beneficial interest outstanding - Note 4) | | $ | 47.49 | |
| | | | |
| |
Class R3 Shares: | | | | |
Net asset value, offering and redemption price per share
($80,601,863 applicable to 1,751,750 shares of beneficial interest outstanding - Note 4) | | $ | 46.01 | |
| | | | |
| |
Class R4 Shares: | | | | |
Net asset value, offering and redemption price per share
($13,834,018 applicable to 297,833 shares of beneficial interest outstanding - Note 4) | | $ | 46.45 | |
| | | | |
| |
Class R5 Shares: | | | | |
Net asset value, offering and redemption price per share
($35,715,876 applicable to 753,224 shares of beneficial interest outstanding - Note 4) | | $ | 47.42 | |
| | | | |
| * | Redemption price per share is equal to net asset value less any applicable contingent deferred sales charge. |
See notes to financial statements.
Certified Semi-Annual Report 15
| | |
| Statement of Operations | | |
| |
Thornburg Value Fund | | Six Months Ended March 31, 2014 (Unaudited) |
| | | | |
INVESTMENT INCOME | | | | |
Dividend income (net of foreign taxes withheld of $296,054) | | $ | 8,957,001 | |
Interest income | | | 187,421 | |
| | | | |
Total Income | | | 9,144,422 | |
| | | | |
| |
EXPENSES | | | | |
Investment advisory fees (Note 3) | | | 4,323,904 | |
Administration fees (Note 3) | | | | |
Class A Shares | | | 262,430 | |
Class B Shares | | | 4,379 | |
Class C Shares | | | 109,338 | |
Class I Shares | | | 71,039 | |
Class R3 Shares | | | 50,515 | |
Class R4 Shares | | | 8,513 | |
Class R5 Shares | | | 9,750 | |
Distribution and service fees (Note 3) | | | | |
Class A Shares | | | 525,385 | |
Class B Shares | | | 35,058 | |
Class C Shares | | | 875,769 | |
Class R3 Shares | | | 202,256 | |
Class R4 Shares | | | 16,519 | |
Transfer agent fees | | | | |
Class A Shares | | | 193,150 | |
Class B Shares | | | 8,469 | |
Class C Shares | | | 111,790 | |
Class I Shares | | | 148,900 | |
Class R3 Shares | | | 105,175 | |
Class R4 Shares | | | 28,715 | |
Class R5 Shares | | | 86,734 | |
Registration and filing fees | | | | |
Class A Shares | | | 26,336 | |
Class B Shares | | | 15,641 | |
Class C Shares | | | 16,503 | |
Class I Shares | | | 28,287 | |
Class R3 Shares | | | 14,191 | |
Class R4 Shares | | | 19,458 | |
Class R5 Shares | | | 17,178 | |
Custodian fees (Note 3) | | | 78,101 | |
Professional fees | | | 23,077 | |
Accounting fees | | | 11,275 | |
Trustee fees | | | 16,500 | |
Other expenses | | | 85,536 | |
| | | | |
Total Expenses | | | 7,529,871 | |
Less: | | | | |
Expenses reimbursed by investment advisor (Note 3) | | | (452,356 | ) |
Fees paid indirectly (Note 3) | | | (1,431 | ) |
| | | | |
Net Expenses | | | 7,076,084 | |
| | | | |
Net Investment Income | | $ | 2,068,338 | |
| | | | |
16 Certified Semi-Annual Report
| | |
| Statement of Operations, Continued | | |
| |
Thornburg Value Fund | | Six Months Ended March 31, 2014 (Unaudited) |
| | | | |
REALIZED AND UNREALIZED GAIN (LOSS) | | | | |
Net realized gain (loss) from: | | | | |
Investments | | $ | 93,904,639 | |
Forward currency contracts (Note 7) | | | 556,405 | |
Foreign currency transactions | | | 619 | |
| | | | |
| | | 94,461,663 | |
| | | | |
Net change in unrealized appreciation (depreciation) on: | | | | |
Investments | | | 31,122,457 | |
Forward currency contracts (Note 7) | | | 1,255,927 | |
Foreign currency translations | | | 19,179 | |
| | | | |
| | | 32,397,563 | |
| | | | |
Net Realized and Unrealized Gain | | | 126,859,226 | |
| | | | |
Net Increase in Net Assets Resulting from Operations | | $ | 128,927,564 | |
| | | | |
See notes to financial statements.
Certified Semi-Annual Report 17
| | |
| Statements of Changes in Net Assets | | |
| |
Thornburg Value Fund | | |
| | | | | | | | |
| ` | | SIX MONTHS ENDED
MARCH 31, 2014* | | | YEAR ENDED
SEPTEMBER 30, 2013 | |
INCREASE (DECREASE) IN NET ASSETS FROM | | | | | | | | |
| | |
OPERATIONS | | | | | | | | |
Net investment income | | $ | 2,068,338 | | | $ | 3,718,506 | |
Net realized gain (loss) on investments, forward currency contracts, and foreign currency transactions | | | 94,461,663 | | | | 331,336,839 | |
Net unrealized appreciation (depreciation) on investments, forward currency contracts, and foreign currency translations | | | 32,397,563 | | | | (27,191,377 | ) |
| | | | | | | | |
| | |
Net Increase (Decrease) in Net Assets Resulting from Operations | | | 128,927,564 | | | | 307,863,968 | |
| | |
DIVIDENDS TO SHAREHOLDERS | | | | | | | | |
From net investment income | | | | | | | | |
Class A Shares | | | (589,593 | ) | | | — | |
Class I Shares | | | (1,458,780 | ) | | | — | |
Class R3 Shares | | | (79,981 | ) | | | — | |
Class R5 Shares | | | (196,131 | ) | | | — | |
| | |
FUND SHARE TRANSACTIONS (NOTE 4) | | | | | | | | |
Class A Shares | | | (26,981,667 | ) | | | (172,341,686 | ) |
Class B Shares | | | (2,227,979 | ) | | | (3,907,108 | ) |
Class C Shares | | | (8,776,179 | ) | | | (59,014,808 | ) |
Class I Shares | | | (17,963,116 | ) | | | (946,785,706 | ) |
Class R3 Shares | | | (10,279,381 | ) | | | (73,825,363 | ) |
Class R4 Shares | | | (1,243,946 | ) | | | (38,506,401 | ) |
Class R5 Shares | | | (16,290,996 | ) | | | (101,143,356 | ) |
| | | | | | | | |
Net Increase (Decrease) in Net Assets | | | 42,839,815 | | | | (1,087,660,460 | ) |
| | |
NET ASSETS | | | | | | | | |
Beginning of Period | | | 988,249,097 | | | | 2,075,909,557 | |
| | | | | | | | |
| | |
End of Period | | $ | 1,031,088,912 | | | $ | 988,249,097 | |
| | | | | | | | |
Undistributed net investment income | | $ | 2,253,299 | | | $ | 2,509,446 | |
See notes to financial statements.
18 Certified Semi-Annual Report
| | |
| Notes to Financial Statements | | |
| |
Thornburg Value Fund | | March 31, 2014 (Unaudited) |
NOTE 1 – ORGANIZATION
Thornburg Value Fund, hereinafter referred to as the “Fund,” is a diversified series of Thornburg Investment Trust (the “Trust”). The Trust is organized as a Massachusetts business trust under a Declaration of Trust dated June 3, 1987 and is registered as a diversified, open-end management investment company under the Investment Company Act of 1940, as amended. The Fund is currently one of eighteen separate series of the Trust. Each series is considered to be a separate entity for financial reporting and tax purposes and bears expenses directly attributable to it. The Fund seeks long-term capital appreciation by investing in equity and debt securities of all types. As a secondary objective, the Fund also seeks some current income.
The Fund currently has seven classes of shares of beneficial interest: Class A, Class B, Class C, Institutional Class (“Class I”), and Retirement Classes (“Class R3,” “Class R4,” and “Class R5”). The Fund no longer offers Class B shares for sale. Each class of shares of the Fund represents an interest in the same portfolio of investments, except that (i) Class A shares are sold subject to a front-end sales charge collected at the time the shares are purchased and bear a service fee, (ii) Class B shares were sold at net asset value without a sales charge at the time of purchase, but are subject to a contingent deferred sales charge upon redemption and bear both a service fee and distribution fee, (iii) Class C shares are sold at net asset value without a sales charge at the time of purchase, but are subject to a contingent deferred sales charge upon redemption within one year of purchase, and bear both a service fee and a distribution fee, (iv) Class I and Class R5 shares are sold at net asset value without a sales charge at the time of purchase and may be subject to a service fee, (v) Class R3 shares are sold at net asset value without a sales charge at the time of purchase, but bear both a service fee and distribution fee, (vi) Class R4 shares are sold at net asset value without a sales charge at the time of purchase, but bear a service fee, and (vii) the respective classes may have different reinvestment privileges and conversion rights. Additionally, the Fund may allocate among its classes certain expenses, to the extent allocable to specific classes, including transfer agent fees, government registration fees, certain printing and postage costs, and administrative and legal expenses. Currently, class specific expenses of the Fund are limited to service and distribution fees, administration fees, and certain registration and transfer agent expenses. Class B shares of the Fund outstanding for eight years will convert to Class A shares of the Fund.
NOTE 2 – SIGNIFICANT ACCOUNTING POLICIES
Significant accounting policies of the Trust are as follows:
Valuation Policy and Procedures: The Fund’s Trustees of the Trust (the “Trustees”) have authorized employees of the Fund’s investment advisor, acting as the Valuation and Pricing Committee (the “Committee”), to make certain valuation determinations, subject to oversight and review by the Trustees and the Audit Committee of the Trustees. The Committee and other employees of the Fund’s investment advisor administer and implement the valuation process. The Committee regularly reviews its own fair value decisions, as well as valuations, valuation techniques and services furnished by pricing services, considers circumstances in the markets which may require valuation determinations by the Committee and reviews previous valuation determinations. The Committee also reports on its activities, the performance of the pricing services and other matters to the Trustees and the Audit Committee of the Trustees.
In determining a fair value for a portfolio investment, the Committee seeks to determine the price that the Fund would reasonably expect to receive upon a sale of the investment in an orderly transaction between market participants at the measurement date. Typically, the fair value process employs standing instructions to use quoted prices in active markets or the use of independent pricing services. Less frequently, the Committee may make a fair value determination using other methods. However, because fair value prices are estimated prices, the determination of fair value for an investment may differ from the value that would be realized by the Fund upon a sale of the investment, and that difference could be material to the Fund’s financial statements. The Committee’s determination of fair value for an investment may also differ from the prices obtained by other persons (including other mutual funds) for the investment.
Valuation of Investments: Portfolio investments listed or traded on a national securities exchange are valued on the valuation date at the last reported trade price on the exchange that is the primary market for the investment. Portfolio investments traded on an exchange for which there has been no trade that day and other equity investments traded in the over-the-counter market are valued at the mean between the last reported bid and ask prices. Portfolio investments reported by NASDAQ are valued at the NASDAQ official closing price. Any foreign investment traded on exchanges outside the United States is valued at the price of the investment on the exchange that is normally the investment’s primary market, as of the close of that exchange preceding the time of the Fund’s valuation measurement date.
In any case when the market value of an equity investment held by the Fund is not readily available, a determination of a fair value for the investment is made by the Committee. The Committee’s determinations are made using procedures in accordance with a policy approved by the Trustees, which may include the use of a price obtained from an independent pricing service. The pricing service ordinarily values equity investments in these instances using multi-factor models to adjust market prices based upon various inputs, including exchange data, depository receipt prices, futures, index data and other data. An investment’s market value is deemed not readily available whenever the exchange or market on which the investment is primarily traded is closed for the entire scheduled day of trading. Additionally, an investment’s market value may be deemed not readily available under other circumstances identified by the Trustees, including when developments occurring after the most recent close of the investment’s primary exchange or market, but
Certified Semi-Annual Report 19
| | |
| Notes to Financial Statements, Continued | | |
| |
Thornburg Value Fund | | March 31, 2014 (Unaudited) |
before the most recent close of trading in Fund shares, or an unusual event or significant period of time occurring since the availability of a market quotation, create a question about the reliability of the investment’s market value. On days when market volatility thresholds pre-determined by the Trustees are exceeded, foreign equity investments held by the Fund may be valued using synthetic pricing obtained from an independent pricing service approved by the Trustees, subject to the ability of the Committee to determine in any such instance to utilize market closing prices if the Committee considers closing prices to be more reliable.
Debt obligations held by the Fund have a primary over-the-counter market and are valued by an independent pricing service approved by the Trustees. The pricing service ordinarily values debt obligations at quoted bid prices. When quotations are not available, debt obligations held by the Fund are valued at evaluated prices determined by the pricing service using methods which include consideration of yields or prices of debt obligations of comparable quality, type of issue, coupon, maturity and rating, and indications as to value from dealers and general market conditions. Short-term obligations having remaining maturities of 60 days or less are ordinarily valued at amortized cost, which approximates market value.
In any case when a pricing service fails to provide a price for a debt obligation held by the Fund, the Committee determines a fair value for the debt obligation using procedures in accordance with a policy approved by the Trustees, which may include the use of a price obtained from a different independent pricing service. Additionally, in any case when management believes that a price provided by a pricing service for a debt obligation held by the Fund may be unreliable, the Committee decides whether or not to use the pricing service’s valuation or to use an alternative method to determine a fair value for the debt obligation.
Quotations in foreign currencies for foreign portfolio investments are converted to U.S. dollar equivalents using the foreign exchange quotation in effect at the time of valuation.
Valuation Measurements: The Fund categorizes its investments based upon the inputs used in valuing those investments, according to a three-level hierarchy established by guidance from the Financial Accounting Standards Board (the “FASB”). Categorization of investments using this hierarchy is intended by the FASB to maximize the use of observable inputs and minimize the use of unobservable inputs by prioritizing that the most observable input be used when available. Observable inputs are those that market participants would use in valuing an investment based on available market data. Unobservable inputs are those that reflect assumptions about the information market participants would use in valuing an investment. An investment’s level within the hierarchy is based on the lowest level input that is deemed significant to the fair value measurement. The methodologies and relative inputs used to value investments are not necessarily indications of the risk or liquidity associated with investing in those investments.
Various inputs are used in determining the fair value measurement of the Fund’s investments. These inputs are generally summarized according to the three-level hierarchy below:
Level 1: Quoted prices in active markets for identical investments.
Level 2: Other direct or indirect significant observable inputs (including quoted prices for similar investments in active markets and other observable inputs, such as interest rates, prepayment rates, credit risk, etc.).
When market volatility thresholds are exceeded, foreign equity investments may be fair valued according to other significant observable inputs rather than quoted market prices. The affected investments will be characterized as Level 2 within the valuation hierarchy and revert to Level 1 after the threshold is no longer exceeded.
Level 3: Significant unobservable inputs, (including the Committee’s own assumptions in determining the fair value of investments), are generally applicable to investments fair valued with single broker quotes and other investments.
Portfolio investments with minimal, if any, market activity are characterized as Level 3 and are valued using significant unobservable inputs, typically including single broker quotes, which may be adjusted or unadjusted, related or comparable investments, last available transactions, and other relevant information. Valuations may also be based upon current market prices of securities that are comparable in coupon, rating, maturity and industry. An income based valuation approach would consider discounted anticipated future cash flows of the investment. Discounts may also be applied due to the nature or duration of any restrictions on the disposition of the investment. The derived value of a Level 3 investment may not represent the value which is received upon disposition.
The following table displays a summary of the fair value hierarchy measurements of the Fund’s investments as of March 31, 2014. In any instance when valuation inputs from more than one level are used to determine the fair value of a specific investment, the investment is placed in the level of the table based upon the lowest level input that is significant in determining the fair value of the investment:
20 Certified Semi-Annual Report
| | |
| Notes to Financial Statements, Continued | | |
| |
Thornburg Value Fund | | March 31, 2014 (Unaudited) |
| | | | | | | | | | | | | | | | |
| | | FAIR VALUE MEASUREMENTS AT MARCH 31, 2014 | |
| | | TOTAL | | | LEVEL 1 | | | LEVEL 2 | | | LEVEL 3 | |
Assets | | | | | | | | | | | | | | | | |
Investments in Securities* | | | | | | | | | | | | | | | | |
Common Stock | | $ | 987,334,634 | | | $ | 987,334,634 | | | $ | — | | | $ | — | |
Short Term Investments | | | 43,000,000 | | | | — | | | | 43,000,000 | | | | — | |
| | | | | | | | | | | | | | | | |
Total Investments in Securities | | $ | 1,030,334,634 | | | $ | 987,334,634 | | | $ | 43,000,000 | | | $ | — | |
Other Financial Instruments** | | | | | | | | | | | | | | | | |
Forward Currency Contracts | | $ | 244,266 | | | $ | — | | | $ | 244,266 | | | $ | — | |
| | | | |
Liabilities | | | | | | | | | | | | | | | | |
Other Financial Instruments** | | | | | | | | | | | | | | | | |
Forward Currency Contracts | | $ | (748,838 | ) | | $ | — | | | $ | (748,838 | ) | | $ | — | |
| * | See Schedule of Investments for a summary of the industry exposure as grouped according to the Global Industry Classification Standard (GICS), which is an industry taxonomy developed by MSCI, Inc. and Standard & Poor’s (S&P). |
| ** | Other Financial Instruments include investments not reflected in the Schedule of Investments, which may include futures, forwards and swap contracts, which are valued at the unrealized appreciation (depreciation) on the investment. |
In accordance with the guidance prescribed in Accounting Standards Update No. 2011-04, it is the policy of the Fund to recognize transfers between levels and those underlying events which caused the movement. The Fund recognized no transfers between Levels 1 and 2 for the six months ended March 31, 2014, other than when the Fund exceeded market volatility thresholds for foreign equity investments during the period.
A rollforward of fair value measurements using significant unobservable inputs (Level 3) for the six months ended March 31, 2014 is as follows:
| | | | | | | | |
| | | COMMON STOCK | | | TOTAL(d) | |
Beginning Balance 9/30/2013 | | $ | 19,006,875 | | | $ | 19,006,875 | |
Accrued Discounts (Premiums) | | | — | | | | — | |
Net Realized Gain (Loss)(a) | | | 654,835 | | | | 654,835 | |
Gross Purchases | | | — | | | | — | |
Gross Sales | | | (17,549,835 | ) | | | (17,549,835 | ) |
Net Change in Unrealized Appreciation (Depreciation)(b) | | | (2,111,875 | ) | | | (2,111,875 | ) |
Transfers into Level 3(c) | | | — | | | | — | |
Transfers out of Level 3(c) | | | — | | | | — | |
| | | | | | | | |
Ending Balance 3/31/2014 | | $ | — | | | $ | — | |
| (a) | Total amount of Net Realized Gain (Loss) recognized in the net increase in net assets resulting from operations is included in the Fund’s Statement of Operations for the six months ended March 31, 2014. |
| (b) | Total amount of Net Change in Unrealized Appreciation (Depreciation) on investments recognized in the net increase in net assets resulting from operations is included in the Fund’s Statement of Operations for the six months ended March 31, 2014. |
| (c) | Transfers into or out of Level 3, if any, were out of or into Level 2, and were due to changes in other significant observable inputs available during the year ended September 30, 2013. Transfers into or out of Level 3 are based on the beginning market value of the period in which they occurred. |
| (d) | Level 3 investments represent 0.00% of total Net Assets at the six months ended March 31, 2014. Significant fluctuations of the unobservable inputs applied to portfolio investments characterized as Level 3 could be expected to increase or decrease the fair value of these portfolio investments. |
Federal Income Taxes: It is the policy of the Trust to comply with the provisions of the Internal Revenue Code applicable to “regulated investment companies” and to distribute to shareholders substantially all taxable income, including any net realized gain on investments of the Fund. Therefore, no provision for federal income taxes is required.
Management reviews each uncertain tax position believed to be material to the preparation of the Fund’s financial statements, to assess if it is more likely than not that the position would be sustained upon examination, based upon the technical merits of the position. As of March 31, 2014, management has not identified any such position for which an asset or liability must be reflected in the Statement of Assets and Liabilities. The Fund’s tax returns remain subject to examination for three years after filing.
Foreign Currency Translation: Portfolio investments and other assets and liabilities denominated in foreign currencies are translated into U.S. dollars based on the exchange rate of such currencies against the U.S. dollar on the date of valuation. Purchases and sales of
Certified Semi-Annual Report 21
| | |
| Notes to Financial Statements, Continued | | |
| |
Thornburg Value Fund | | March 31, 2014 (Unaudited) |
investments and income items denominated in foreign currencies are translated into U.S. dollars at the exchange rate in effect on the transaction date. When the Fund purchases or sells foreign investments, it will customarily enter into a foreign exchange contract to minimize foreign exchange risk from the trade date to the settlement date of such transactions. The values of such spot contracts are included in receivable for investments sold and payable for investments purchased on the Statement of Assets and Liabilities.
The Fund does not separately report the effect of changes in foreign exchange rates from changes in market prices on investments held. Such changes are included in net unrealized appreciation or depreciation from investments.
Reported net realized gains or losses from foreign currency transactions arise due to purchases and sales of foreign currencies, currency gains or losses realized between the trade and settlement dates on investment transactions and the difference between the amounts of dividends, interest, and foreign withholding taxes recorded on the Fund’s books, and the U.S. dollar equivalent of the amounts actually received or paid.
Net change in unrealized appreciation and depreciation on foreign currency translations arise from changes in the fair value of assets and liabilities, other than investments at fiscal period end, resulting from changes in exchange rates.
When-Issued and Delayed Delivery Transactions: The Fund may engage in when-issued or delayed delivery transactions. To the extent the Fund engages in such transactions, it will do so for the purpose of acquiring portfolio investments consistent with the Fund’s investment objectives and not for the purpose of investment leverage or to speculate on interest rate and/or market changes. At the time the Fund makes a commitment to purchase an investment on a when-issued or delayed delivery basis, the Fund will record the transaction and reflect the value in determining its net asset value. When effecting such transactions, assets of an amount sufficient to make payment for the portfolio investments to be purchased will be segregated on the Fund’s records on the trade date. Investments purchased on a when-issued or delayed delivery basis do not earn interest until the settlement date.
Dividends: Dividends to shareholders, if any, are generally paid quarterly and are reinvested in additional shares of the Fund at net asset value per share at the close of business on the dividend payment date or, at the shareholder’s option, paid in cash. Net realized capital gains, to the extent available, will be distributed at least annually. Distributions to shareholders are based on income tax regulations and therefore, their characteristics may differ for financial statement and tax purposes.
Repurchase Agreements: The Fund may invest excess cash in repurchase agreements whereby the Fund purchases investments, which serve as collateral, with an agreement to resell such collateral to the seller at an agreed upon price at the maturity date of the repurchase agreement. Investments pledged as collateral for repurchase agreements are held in custody until maturity of the repurchase agreement. Provisions in the agreements require that the market value of the collateral is at least equal to the repurchase value in the event of default. In the event of default, the Fund has the right to liquidate the collateral and apply the proceeds in satisfaction of the obligation. Under certain circumstances, in the event of default or bankruptcy by the other party to the agreement, realization and/ or retention of the collateral may be subject to legal proceedings.
General: Investment transactions are accounted for on a trade date basis. Interest income is accrued as earned and dividend income is recorded on the ex-dividend date. Certain income from foreign investments is recognized as soon as information is available to the Fund. Realized gains and losses from the sale of investments are recorded on an identified cost basis. Net investment income (other than class specific expenses) and realized and unrealized gains and losses are allocated daily to each class of shares based upon the relative net asset value of outstanding shares of each class of shares at the beginning of the day (after adjusting for the current share activity of the respective class). Expenses common to all Funds are allocated among the Funds comprising the Trust based upon their relative net asset values or other appropriate allocation methods.
Guarantees and Indemnifications: Under the Trust’s organizational documents (and under separate agreements with the independent Trustees), its officers and Trustees are indemnified against certain liabilities arising out of the performance of their duties to the Fund. Additionally, in the normal course of business the Trust enters into contracts with service providers that contain general indemnification clauses. The Trust’s maximum exposure under these arrangements is unknown. However, based on experience, the Trust expects the risk of loss to be remote.
Use of Estimates: The preparation of financial statements, in conformity with United States generally accepted accounting principles, requires management to make estimates and assumptions that affect the reported amounts of assets and liabilities and the disclosure of contingent assets and liabilities at the date of the financial statements and the reported amounts of increases and decreases in net assets from operations during the reporting period. Actual amounts could differ from those estimates.
NOTE 3 – INVESTMENT ADVISORY FEE AND OTHER TRANSACTIONS WITH AFFILIATES
Pursuant to an investment advisory agreement, Thornburg Investment Management, Inc. (the “Advisor”) serves as the investment advisor and performs services for the Fund for which the fees are payable at the end of each month. For the six months ended March 31, 2014, these fees were payable at annual rates ranging from .875 of 1% to .675 of 1% per annum of the average daily net assets of the Fund depending on the Fund’s asset size. The Trust also has entered into administrative services agreements with the Advisor, whereby
22 Certified Semi-Annual Report
| | |
| Notes to Financial Statements, Continued | | |
| |
Thornburg Value Fund | | March 31, 2014 (Unaudited) |
the Advisor will perform certain administrative services for the shareholders of each class of the Fund’s shares, and for which fees will be payable at an annual rate of up to .125 of 1% per annum of the average daily net assets attributable to each class of shares.
The Trust has an underwriting agreement with Thornburg Securities Corporation (the “Distributor,” an affiliate of the Advisor), which acts as the distributor of the Fund’s shares. For the six months ended March 31, 2014, the Distributor has advised the Fund that it earned net commissions aggregating $13,964 from the sale of Class A shares, and collected contingent deferred sales charges aggregating $1,527 from redemptions of Class C shares of the Fund.
Pursuant to a service plan under Rule 12b-1 of the Investment Company Act of 1940, the Fund may reimburse to the Advisor an amount not to exceed .25 of 1% per annum of the average daily net assets attributable to each class of shares of the Fund for payments made by the Advisor to securities dealers and other financial institutions to obtain various shareholder and distribution related services. For the six months ended March 31, 2014, there were no 12b-1 service plan fees charged for Class I and R5 shares. The Advisor may pay out of its own resources additional expenses for distribution of the Fund’s shares.
The Trust has also adopted distribution plans pursuant to Rule 12b-1, applicable only to the Fund’s Class B, Class C, and Class R3 shares, under which the Fund compensates the Distributor for services in promoting the sale of Class B, Class C, and Class R3 shares of the Fund at an annual rate of up to .75 of 1% per annum of the average daily net assets attributable to Class B and Class C shares, and an annual rate of up to .25 of 1% per annum of the average daily net assets attributable to Class R3 shares. Total fees incurred by each class of shares of the Fund under their respective service and distribution plans for the six months ended March 31, 2014, are set forth in the Statement of Operations.
The Advisor and Distributor have contractually agreed to waive fees and reimburse expenses incurred by the Fund so that actual expenses of certain share classes do not exceed specified levels. The agreement may be terminated by the Fund at any time, but may not be terminated by the Advisor or Distributor before February 1, 2015, unless the Advisor ceases to be the investment advisor to the Fund or the Distributor ceases to be the distributor of the Fund prior to that date. The Advisor and Distributor retain the right to be repaid by the Fund for fee waivers and expense reimbursements if expenses fall below the contractual limit prior to the end of the fiscal year.
For the six months ended March 31, 2014, the Advisor contractually reimbursed certain class specific expenses, administrative fees, and distribution fees of $12,730 for Class B shares, $108,625 for Class I shares, $186,275 for Class R3 shares, $49,185 for Class R4 Shares, and $95,541 for Class R5 shares.
The Trust has an agreement with the custodian bank to indirectly pay a portion of the custodian’s fees through credits earned by the Fund’s cash on deposit with the bank. This deposit agreement is an alternative to overnight investments. Custodial fees are adjusted to reflect amounts that would have been paid without this agreement, with a corresponding adjustment reflected as fees paid indirectly in the Statement of Operations. For the six months ended March 31, 2014, fees paid indirectly were $1,431.
Certain officers and Trustees of the Trust are also officers or directors of the Advisor and Distributor. The compensation of independent Trustees is borne by the Trust.
NOTE 4 – SHARES OF BENEFICIAL INTEREST
At March 31, 2014, there were an unlimited number of shares of beneficial interest authorized. Transactions in shares of beneficial interest were as follows:
| | | | | | | | | | | | | | | | |
| | | SIX MONTHS ENDED
MARCH 31, 2014 (UNAUDITED) | | | YEAR ENDED
SEPTEMBER 30, 2013 (AUDITED) | |
| | | SHARES | | | AMOUNT | | | SHARES | | | AMOUNT | |
Class A Shares | | | | | | | | | | | | | | | | |
Shares sold | | | 552,337 | | | $ | 23,903,990 | | | | 990,544 | | | $ | 35,429,228 | |
Shares issued to shareholders in reinvestment of dividends | | | 12,662 | | | | 566,734 | | | | — | | | | — | |
Shares repurchased | | | (1,169,586 | ) | | | (51,452,391 | ) | | | (6,108,915 | ) | | | (207,770,914 | ) |
| | | | | | | | | | | | | | | | |
| | | | |
Net increase (decrease) | | | (604,587 | ) | | $ | (26,981,667 | ) | | | (5,118,371 | ) | | $ | (172,341,686 | ) |
| | | | | | | | | | | | | | | | |
Certified Semi-Annual Report 23
| | |
| Notes to Financial Statements, Continued | | |
| |
Thornburg Value Fund | | March 31, 2014 (Unaudited) |
| | | | | | | | | | | | | | | | |
| | | SIX MONTHS ENDED
MARCH 31, 2014 (UNAUDITED) | | | YEAR ENDED
SEPTEMBER 30, 2013 (AUDITED) | |
| | | SHARES | | | AMOUNT | | | SHARES | | | AMOUNT | |
Class B Shares | | | | | | | | | | | | | | | | |
Shares sold | | | 2,561 | | | $ | 103,455 | | | | 11,596 | | | $ | 373,198 | |
Shares issued to shareholders in reinvestment of dividends | | | — | | | | — | | | | — | | | | — | |
Shares repurchased | | | (57,297 | ) | | | (2,331,434 | ) | | | (132,662 | ) | | | (4,280,306 | ) |
| | | | | | | | | | | | | | | | |
| | | | |
Net increase (decrease) | | | (54,736 | ) | | $ | (2,227,979 | ) | | | (121,066 | ) | | $ | (3,907,108 | ) |
| | | | | | | | | | | | | | | | |
| | | | |
Class C Shares | | | | | | | | | | | | | | | | |
Shares sold | | | 108,988 | | | $ | 4,474,444 | | | | 145,246 | | | $ | 4,955,724 | |
Shares issued to shareholders in reinvestment of dividends | | | — | | | | — | | | | — | | | | — | |
Shares repurchased | | | (322,343 | ) | | | (13,250,623 | ) | | | (2,009,306 | ) | | | (63,970,532 | ) |
| | | | | | | | | | | | | | | | |
| | | | |
Net increase (decrease) | | | (213,355 | ) | | $ | (8,776,179 | ) | | | (1,864,060 | ) | | $ | (59,014,808 | ) |
| | | | | | | | | | | | | | | | |
| | | | |
Class I Shares | | | | | | | | | | | | | | | | |
Shares sold | | | 443,630 | | | $ | 20,159,217 | | | | 1,635,597 | | | $ | 56,615,433 | |
Shares issued to shareholders in reinvestment of dividends | | | 30,667 | | | | 1,406,688 | | | | — | | | | — | |
Shares repurchased | | | (873,650 | ) | | | (39,529,021 | ) | | | (29,391,044 | ) | | | (1,003,401,139 | ) |
| | | | | | | | | | | | | | | | |
| | | | |
Net increase (decrease) | | | (399,353 | ) | | $ | (17,963,116 | ) | | | (27,755,447 | ) | | $ | (946,785,706 | ) |
| | | | | | | | | | | | | | | | |
| | | | |
Class R3 Shares | | | | | | | | | | | | | | | | |
Shares sold | | | 137,810 | | | $ | 6,025,475 | | | | 357,157 | | | $ | 12,317,281 | |
Shares issued to shareholders in reinvestment of dividends | | | 1,756 | | | | 78,091 | | | | — | | | | — | |
Shares repurchased | | | (376,611 | ) | | | (16,382,947 | ) | | | (2,557,083 | ) | | | (86,142,644 | ) |
| | | | | | | | | | | | | | | | |
| | | | |
Net increase (decrease) | | | (237,045 | ) | | $ | (10,279,381 | ) | | | (2,199,926 | ) | | $ | (73,825,363 | ) |
| | | | | | | | | | | | | | | | |
| | | | |
Class R4 Shares | | | | | | | | | | | | | | | | |
Shares sold | | | 31,395 | | | $ | 1,370,311 | | | | 206,484 | | | $ | 7,178,924 | |
Shares issued to shareholders in reinvestment of dividends | | | — | | | | — | | | | — | | | | — | |
Shares repurchased | | | (59,830 | ) | | | (2,614,257 | ) | | | (1,340,402 | ) | | | (45,685,325 | ) |
| | | | | | | | | | | | | | | | |
| | | | |
Net increase (decrease) | | | (28,435 | ) | | $ | (1,243,946 | ) | | | (1,133,918 | ) | | $ | (38,506,401 | ) |
| | | | | | | | | | | | | | | | |
| | | | |
Class R5 Shares | | | | | | | | | | | | | | | | |
Shares sold | | | 56,512 | | | $ | 2,542,855 | | | | 292,466 | | | $ | 10,395,703 | |
Shares issued to shareholders in reinvestment of dividends | | | 4,016 | | | | 183,909 | | | | — | | | | — | |
Shares repurchased | | | (431,163 | ) | | | (19,017,760 | ) | | | (3,207,257 | ) | | | (111,539,059 | ) |
| | | | | | | | | | | | | | | | |
| | | | |
Net increase (decrease) | | | (370,635 | ) | | $ | (16,290,996 | ) | | | (2,914,791 | ) | | $ | (101,143,356 | ) |
| | | | | | | | | | | | | | | | |
NOTE 5 – INVESTMENT TRANSACTIONS
For the six months ended March 31, 2014, the Fund had purchase and sale transactions of investments (excluding short-term investments) of $360,923,314 and $441,148,144, respectively.
24 Certified Semi-Annual Report
| | |
| Notes to Financial Statements, Continued | | |
| |
Thornburg Value Fund | | March 31, 2014 (Unaudited) |
NOTE 6 – INCOME TAXES
At March 31, 2014, information on the tax components of capital was as follows:
| | | | |
Cost of investments for tax purposes | | $ | 760,749,104 | |
| | | | |
Gross unrealized appreciation on a tax basis | | $ | 279,966,042 | |
Gross unrealized depreciation on a tax basis | | | (10,380,512 | ) |
| | | | |
Net unrealized appreciation (depreciation) on investments (tax basis) | | $ | 269,585,530 | |
| | | | |
At March 31, 2014, the Fund had cumulative tax basis capital losses of $308,498,210 (of which $141,061,115 is short-term and $167,437,095 is long-term) generated after September 30, 2011, which may be carried forward to offset future capital gains. To the extent such carryforwards are used, capital gain distributions may be reduced to the extent provided by regulations. Such capital loss carryforwards do not expire but are required to be utilized to offset future gains prior to the utilization of losses that occurred prior to October 31, 2011, which may expire prior to utilization.
Capital loss carryforwards that occurred prior October 31, 2011, expire as follows:
| | | | |
2017 | | $ | 204,425,697 | |
2018 | | | 242,353,997 | |
| | | | |
| | $ | 446,779,694 | |
| | | | |
NOTE 7 – DERIVATIVE FINANCIAL INSTRUMENTS WITH OFF-BALANCE SHEET RISK AND FOREIGN INVESTMENT RISK
The Fund may use a variety of derivative financial instruments to hedge or adjust the risks affecting its investment portfolio or to enhance investment returns. Provisions of FASB Accounting Standards Codification 815-10-50 (“ASC 815”), require certain disclosures. The disclosures are intended to provide users of financial statements with an understanding of the use of derivative instruments by the Fund and how these derivatives affect the financial position, financial performance and cash flows of the Fund. The Fund does not designate any derivative instruments as hedging instruments under ASC 815. During the six months ended March 31, 2014, the Fund’s principal exposure to derivative financial instruments of the type addressed by ASC 815 was investment in foreign exchange contracts. A foreign exchange contract is an agreement between two parties to exchange different currencies at a specified rate of exchange at an agreed upon future date. Foreign exchange contracts involve risks to the Fund, including the risk that a contract’s counterparty will not meet its obligations to the Fund, the risk that a change in a contract’s value may not correlate perfectly with the currency the contract was intended to track, and the risk that the advisor is unable to correctly implement its strategy in using a contract. In any such instance, the Fund may not achieve the intended benefit of entering into a contract, and may experience a loss. Additionally, the Fund’s risk of loss may exceed the amounts recognized on the Statement of Assets and Liabilities.
The Fund entered into forward currency contracts during the six months ended March 31, 2014 in the normal course of pursuing its investment objectives, with the objective of reducing the risk to the value of the Fund’s foreign investments from adverse changes in the relationship between the U.S. dollar and foreign currencies. In each case these contracts have been initiated in conjunction with foreign investment transactions.
These contracts are accounted for by the Fund under ASC 815. Unrealized appreciation and depreciation on outstanding contracts are reported in the Fund’s Statement of Assets and Liabilities, as measured by the difference between the forward exchange rates at the reporting date and the forward exchange rates at each contract’s inception date. Net realized gain (loss) on contracts closed during the period, and changes in net unrealized appreciation (depreciation) on outstanding contracts are recognized in the Fund’s Statement of Operations. Values of open sell currency contracts are indicative of the activity for the six months ended March 31, 2014. Open buy currency contracts are entered into for the purpose of closing open sell currency contracts and the values are dependent upon the values of the open sell currency contracts to which they relate.
Certified Semi-Annual Report 25
| | |
| Notes to Financial Statements, Continued | | |
| |
Thornburg Value Fund | | March 31, 2014 (Unaudited) |
The following table displays the outstanding forward currency contracts at March 31, 2014:
| | | | | | | | | | | | | | | | | | | | |
| | | OUTSTANDING FORWARD CURRENCY CONTRACTS TO BUY OR SELL AT
MARCH 31, 2014 | |
CONTRACT DESCRIPTION | | BUY/SELL | | CONTRACT
AMOUNT | | | CONTRACT
VALUE
DATE | | VALUE
USD | | | UNREALIZED
APPRECIATION | | | UNREALIZED
DEPRECIATION | |
Euro | | Sell | | | 31,026,600 | | | 05/30/2014 | | | 42,739,308 | | | $ | — | | | $ | (748,838 | ) |
Japanese Yen | | Sell | | | 3,475,780,200 | | | 08/26/2014 | | | 33,702,546 | | | | 244,266 | | | | — | |
| | | | | | | | | | | | | | | | | | | | |
Total | | | | | | | | | | | | | | $ | 244,266 | | | $ | (748,838 | ) |
| | | | | | | | | | | | | | | | | | | | |
The foregoing forward currency contracts were entered into pursuant to an International Swaps and Derivatives Association (ISDA) Master Agreement. In the event of a default or termination under the ISDA Master Agreement, the non-defaulting party has the right to close out all outstanding forward currency contracts between the parties and to net any payment amounts under those contracts, resulting in a single net amount payable by one party to the other. Because the ISDA Master Agreement does not result in an offset of reported amounts of financial assets and financial liabilities in the Fund’s Statement of Assets and Liabilities unless there has been an event of default or termination event under that agreement, the Fund does not net its outstanding forward currency contracts for purposes of the disclosure in the Fund’s Statement of Assets and Liabilities. Instead the Fund recognizes the unrealized appreciation or depreciation on those forward currency contracts on a gross basis in the Fund’s Statement of Assets and Liabilities. At March 31, 2014, those recognized amounts are disclosed in the following table:
| | | | |
FAIR VALUES OF DERIVATIVE FINANCIAL INSTRUMENTS AT MARCH 31, 2014 |
| | | | | | |
ASSET DERIVATIVES | | BALANCE SHEET LOCATION | | FAIR VALUE | |
Foreign exchange contracts | | Assets - Unrealized appreciation on
forward currency contracts | | $ | 244,266 | |
| | | | | | |
LIABILITY DERIVATIVES | | BALANCE SHEET LOCATION | | FAIR VALUE | |
Foreign exchange contracts | | Liabilities - Unrealized depreciation on
forward currency contracts | | $ | (748,838 | ) |
Because the Fund does not currently receive or post cash collateral in connection with its currency forward contracts, and because all of the Fund’s outstanding currency forward contracts are with State Street Bank and Trust Company, the net amounts of the Fund’s assets and liabilities which are attributable to those contracts at March 31, 2014 can be determined by offsetting the dollar amounts shown in the preceding table. Based on those amounts, the net amount of the Fund’s assets which is attributable to its outstanding forward currency contracts at March 31, 2014 is $0, and the net amount of the Fund’s liabilities which is attributable to those contracts at that date is $504,572. The Fund’s forward currency contracts are valued each day, and the net amounts of the Fund’s assets and liabilities which are attributable to those contracts are expected to vary over time.
The net realized gain (loss) from forward currency contracts, and the net change in unrealized appreciation (depreciation) of outstanding forward currency contracts recognized in the Fund’s Statement of Operations for the six months ended March 31, 2014 are disclosed in the following tables:
| | | | |
AMOUNT OF NET REALIZED GAIN (LOSS) ON DERIVATIVE FINANCIAL INSTRUMENTS RECOGNIZED IN INCOME FOR THE SIX MONTHS ENDED MARCH 31, 2014 |
| | | TOTAL | | FORWARD CURRENCY
CONTRACTS |
Foreign exchange contracts | | $556,405 | | $556,405 |
|
AMOUNT OF NET CHANGE IN UNREALIZED APPRECIATION (DEPRECIATION) OF DERIVATIVE FINANCIAL INSTRUMENTS RECOGNIZED IN INCOME FOR THE SIX MONTHS ENDED MARCH 31, 2014 |
| | | TOTAL | | FORWARD CURRENCY
CONTRACTS |
Foreign exchange contracts | | $1, 255,927 | | $1,255,927 |
26 Certified Semi-Annual Report
| | |
| Notes to Financial Statements, Continued | | |
| |
Thornburg Value Fund | | March 31, 2014 (Unaudited) |
OTHER NOTES
Risks: The Fund’s investments subject it to risks including, but not limited to, management risk, market and economic risk, risks affecting specific issuers, liquidity risk, the risks associated with investments in smaller companies and non-U.S. issuers, credit risk, and interest rate risk. Please see the Fund’s prospectus for a discussion of the risks associated with an investment in the Fund.
Subsequent Events: Fund management believes no events have occurred between March 31, 2014 and the date of issuance of the financial statements that require adjustment to or disclosure in the accompanying financial statements.
Certified Semi-Annual Report 27
Financial Highlights
Thornburg Value Fund
| | | | | | | | | | | | | | | | | | | | | | | | | | | | | | | | | | | | | | | | | | | | | | | | |
| | | PER SHARE PERFORMANCE (for a share outstanding throughout the period)+ | | RATIOS TO AVERAGE NET ASSETS | | | SUPPLEMENTAL DATA | |
UNLESS
OTHERWISE
NOTED,
PERIODS
ARE
FISCAL
YEARS
ENDED
SEPT. 30, | | NET ASSET
VALUE
BEGINNING
OF PERIOD | | | NET
INVESTMENT
INCOME
(LOSS) | | NET
REALIZED
&
UNREALIZED
GAIN (LOSS)
ON
INVESTMENTS | | | TOTAL FROM
INVESTMENT
OPERATIONS | | DIVIDENDS
FROM NET
INVESTMENT
INCOME | | | DIVIDENDS
FROM NET
REALIZED
GAINS | | TOTAL
DIVIDENDS | | | NET
ASSET
VALUE
END
OF
PERIOD | | NET
INVEST-
MENT
INCOME
(LOSS) (%) | | | EXPENSES,
AFTER EXPENSE
REDUCTIONS (%) | | | EXPENSES,
AFTER
EXPENSE
REDUCTIONS
AND
NET OF
CUSTODY
CREDITS (%) | | | EXPENSES,
BEFORE
EXPENSE
REDUCTIONS
(%) | | | TOTAL
RETURN
(%)(a) | | PORTFOLIO
TURNOVER
RATE
(%)(a) | | NET
ASSETS
AT END
OF
PERIOD
(THOUSANDS) | |
CLASS A SHARES | | | | | | | | | | | | | | | | | | | | | | | | | | | | | | | | | | | | | | | | | | |
2014(b)(c) | | $ | 40.84 | | | 0.09 | | | 5.43 | | | 5.52 | | | (0.06 | ) | | — | | | (0.06 | ) | | $46.30 | | | 0.43 | (d) | | | 1.37 | (d) | | | 1.37 | (d) | | | 1.37 | (d) | | 13.52 | | 37.49 | | $ | 425,839 | |
2013(b) | | $ | 31.51 | | | 0.08 | | | 9.25 | | | 9.33 | | | — | | | — | | | — | | | $40.84 | | | 0.23 | | | | 1.40 | | | | 1.40 | | | | 1.40 | | | 29.61 | | 61.50 | | $ | 400,275 | |
2012(b) | | $ | 27.71 | | | (0.10) | | | 3.90 | | | 3.80 | | | — | | | — | | | — | | | $31.51 | | | (0.32 | ) | | | 1.32 | | | | 1.32 | | | | 1.32 | | | 13.71 | | 54.16 | | $ | 470,120 | |
2011(b) | | $ | 30.44 | | | (0.03) | | | (2.70 | ) | | (2.73) | | | — | | | — | | | — | | | $27.71 | | | (0.10 | ) | | | 1.28 | | | | 1.28 | | | | 1.28 | | | (8.97) | | 64.14 | | $ | 825,700 | |
2010(b) | | $ | 29.66 | | | 0.20 | | | 0.76 | | | 0.96 | | | (0.18 | ) | | — | | | (0.18 | ) | | $30.44 | | | 0.65 | | | | 1.31 | | | | 1.31 | | | | 1.31 | | | 3.21 | | 72.75 | | $ | 1,131,594 | |
2009(b) | | $ | 28.02 | | | 0.37 | | | 1.67 | | | 2.04 | | | (0.40 | ) | | — | | | (0.40 | ) | | $29.66 | | | 1.58 | | | | 1.34 | | | | 1.34 | | | | 1.34 | | | 7.65 | | 83.00 | | $ | 1,204,450 | |
CLASS B SHARES | | | | | | | | | | | | | | | | | | | | | | | | | | | | | | | | | | | | | | | | | | |
2014(c) | | $ | 37.55 | | | (0.12) | | | 5.00 | | | 4.88 | | | — | | | — | | | — | | | $42.43 | | | (0.62 | )(d) | | | 2.34 | (d) | | | 2.34 | (d) | | | 2.70 | (d) | | 13.00 | | 37.49 | | $ | 6,093 | |
2013 | | $ | 29.25 | | | (0.24) | | | 8.54 | | | 8.30 | | | — | | | — | | | — | | | $37.55 | | | (0.74 | ) | | | 2.37 | | | | 2.37 | | | | 2.47 | | | 28.38 | | 61.50 | | $ | 7,448 | |
2012 | | $ | 25.99 | | | (0.38) | | | 3.64 | | | 3.26 | | | — | | | — | | | — | | | $29.25 | | | (1.33 | ) | | | 2.34 | | | | 2.34 | | | | 2.36 | | | 12.53 | | 54.16 | | $ | 9,344 | |
2011 | | $ | 28.81 | | | (0.33) | | | (2.49 | ) | | (2.82) | | | — | | | — | | | — | | | $25.99 | | | (1.03 | ) | | | 2.19 | | | | 2.19 | | | | 2.19 | | | (9.79) | | 64.14 | | $ | 13,616 | |
2010 | | $ | 28.21 | | | (0.04) | | | 0.69 | | | 0.65 | | | (0.05 | ) | | — | | | (0.05 | ) | | $28.81 | | | (0.13 | ) | | | 2.18 | | | | 2.18 | | | | 2.18 | | | 2.29 | | 72.75 | | $ | 22,036 | |
2009 | | $ | 26.66 | | | 0.16 | | | 1.58 | | | 1.74 | | | (0.19 | ) | | — | | | (0.19 | ) | | $28.21 | | | 0.74 | | | | 2.22 | | | | 2.22 | | | | 2.22 | | | 6.72 | | 83.00 | | $ | 38,630 | |
CLASS C SHARES | | | | | | | | | | | | | | | | | | | | | | | | | | | | | | | | | | | | | | | | | | |
2014(c) | | $ | 38.26 | | | (0.07) | | | 5.07 | | | 5.00 | | | — | | | — | | | — | | | $43.26 | | | (0.36 | )(d) | | | 2.16 | (d) | | | 2.16 | (d) | | | 2.16 | (d) | | 13.07 | | 37.49 | | $ | 179,592 | |
2013 | | $ | 29.75 | | | (0.18) | | | 8.69 | | | 8.51 | | | — | | | — | | | — | | | $38.26 | | | (0.55 | ) | | | 2.18 | | | | 2.18 | | | | 2.18 | | | 28.60 | | 61.50 | | $ | 166,971 | |
2012 | | $ | 26.36 | | | (0.32) | | | 3.71 | | | 3.39 | | | — | | | — | | | — | | | $29.75 | | | (1.09 | ) | | | 2.09 | | | | 2.09 | | | | 2.09 | | | 12.86 | | 54.16 | | $ | 185,286 | |
2011 | | $ | 29.18 | | | (0.28) | | | (2.54 | ) | | (2.82) | | | — | | | — | | | — | | | $26.36 | | | (0.85 | ) | | | 2.03 | | | | 2.03 | | | | 2.03 | | | (9.66) | | 64.14 | | $ | 253,065 | |
2010 | | $ | 28.55 | | | (0.03) | | | 0.73 | | | 0.70 | | | (0.07 | ) | | — | | | (0.07 | ) | | $29.18 | | | (0.09 | ) | | | 2.06 | | | | 2.06 | | | | 2.06 | | | 2.43 | | 72.75 | | $ | 329,761 | |
2009 | | $ | 26.99 | | | 0.18 | | | 1.61 | | | 1.79 | | | (0.23 | ) | | — | | | (0.23 | ) | | $28.55 | | | 0.81 | | | | 2.12 | | | | 2.12 | | | | 2.12 | | | 6.83 | | 83.00 | | $ | 361,966 | |
CLASS I SHARES | | | | | | | | | | | | | | | | | | | | | | | | | | | | | | | | | | | | | | | | | | |
2014(c) | | $ | 41.96 | | | 0.18 | | | 5.58 | | | 5.76 | | | (0.23 | ) | | — | | | (0.23 | ) | | $47.49 | | | 0.81 | (d) | | | 0.99 | (d) | | | 0.99 | (d) | | | 1.07 | (d) | | 13.75 | | 37.49 | | $ | 289,413 | |
2013 | | $ | 32.24 | | | 0.20 | | | 9.52 | | | 9.72 | | | — | | | — | | | — | | | $41.96 | | | 0.59 | | | | 0.98 | | | | 0.98 | | | | 1.01 | | | 30.15 | | 61.50 | | $ | 272,468 | |
2012 | | $ | 28.26 | | | 0.02 | | | 3.99 | | | 4.01 | | | (0.03 | ) | | — | | | (0.03 | ) | | $32.24 | | | 0.07 | | | | 0.93 | | | | 0.93 | | | | 0.93 | | | 14.18 | | 54.16 | | $ | 1,104,163 | |
2011 | | $ | 30.95 | | | 0.09 | | | (2.76 | ) | | (2.67) | | | (0.02 | ) | | — | | | (0.02 | ) | | $28.26 | | | 0.27 | | | | 0.91 | | | | 0.91 | | | | 0.91 | | | (8.65) | | 64.14 | | $ | 1,968,181 | |
2010 | | $ | 30.15 | | | 0.30 | | | 0.80 | | | 1.10 | | | (0.30 | ) | | — | | | (0.30 | ) | | $30.95 | | | 0.97 | | | | 0.94 | | | | 0.94 | | | | 0.94 | | | 3.62 | | 72.75 | | $ | 2,087,380 | |
2009 | | $ | 28.47 | | | 0.46 | | | 1.70 | | | 2.16 | | | (0.48 | ) | | — | | | (0.48 | ) | | $30.15 | | | 1.94 | | | | 0.98 | | | | 0.97 | | | | 1.00 | | | 8.04 | | 83.00 | | $ | 1,575,522 | |
CLASS R3 SHARES | | | | | | | | | | | | | | | | | | | | | | | | | | | | | | | | | | | | | | | | | | |
2014(c) | | $ | 40.56 | | | 0.09 | | | 5.40 | | | 5.49 | | | (0.04 | ) | | — | | | (0.04 | ) | | $46.01 | | | 0.43 | (d) | | | 1.35 | (d) | | | 1.35 | (d) | | | 1.81 | (d) | | 13.55 | | 37.49 | | $ | 80,602 | |
2013 | | $ | 31.28 | | | 0.10 | | | 9.18 | | | 9.28 | | | — | | | — | | | — | | | $40.56 | | | 0.29 | | | | 1.34 | | | | 1.34 | | | | 1.78 | | | 29.67 | | 61.50 | | $ | 80,671 | |
2012 | | $ | 27.51 | | | (0.10) | | | 3.87 | | | 3.77 | | | — | | | — | | | — | | | $31.28 | | | (0.34 | ) | | | 1.35 | | | | 1.35 | | | | 1.66 | | | 13.70 | | 54.16 | | $ | 131,013 | |
2011 | | $ | 30.24 | | | (0.06) | | | (2.67 | ) | | (2.73) | | | — | | | — | | | — | | | $27.51 | | | (0.17 | ) | | | 1.35 | | | | 1.35 | | | | 1.64 | | | (9.03) | | 64.14 | | $ | 169,234 | |
2010 | | $ | 29.48 | | | 0.17 | | | 0.76 | | | 0.93 | | | (0.17 | ) | | — | | | (0.17 | ) | | $30.24 | | | 0.57 | | | | 1.35 | | | | 1.35 | | | | 1.66 | | | 3.14 | | 72.75 | | $ | 200,362 | |
2009 | | $ | 27.86 | | | 0.36 | | | 1.66 | | | 2.02 | | | (0.40 | ) | | — | | | (0.40 | ) | | $29.48 | | | 1.57 | | | | 1.35 | | | | 1.35 | | | | 1.72 | | | 7.62 | | 83.00 | | $ | 162,231 | |
CLASS R4 SHARES | | | | | | | | | | | | | | | | | | | | | | | | | | | | | | | | | | | | | | | | | | |
2014(c) | | $ | 40.89 | | | 0.12 | | | 5.44 | | | 5.56 | | | — | | | — | | | — | | | $46.45 | | | 0.55 | (d) | | | 1.24 | (d) | | | 1.24 | (d) | | | 1.97 | (d) | | 13.60 | | 37.49 | | $ | 13,834 | |
2013 | | $ | 31.50 | | | 0.13 | | | 9.26 | | | 9.39 | | | — | | | — | | | — | | | $40.89 | | | 0.39 | | | | 1.25 | | | | 1.25 | | | | 1.67 | | | 29.81 | | 61.50 | | $ | 13,340 | |
2012 | | $ | 27.68 | | | (0.07) | | | 3.89 | | | 3.82 | | | — | | | — | | | — | | | $31.50 | | | (0.24 | ) | | | 1.25 | | | | 1.25 | | | | 1.50 | | | 13.80 | | 54.16 | | $ | 45,989 | |
2011 | | $ | 30.39 | | | (0.02) | | | (2.69 | ) | | (2.71) | | | — | | | — | | | — | | | $27.68 | | | (0.06 | ) | | | 1.25 | | | | 1.25 | | | | 1.47 | | | (8.92) | | 64.14 | | $ | 51,900 | |
2010 | | $ | 29.62 | | | 0.19 | | | 0.78 | | | 0.97 | | | (0.20 | ) | | — | | | (0.20 | ) | | $30.39 | | | 0.63 | | | | 1.25 | | | | 1.25 | | | | 1.49 | | | 3.25 | | 72.75 | | $ | 54,461 | |
2009 | | $ | 27.99 | | | 0.39 | | | 1.67 | | | 2.06 | | | (0.43 | ) | | — | | | (0.43 | ) | | $29.62 | | | 1.65 | | | | 1.25 | | | | 1.25 | | | | 1.54 | | | 7.74 | | 83.00 | | $ | 44,037 | |
CLASS R5 SHARES | | | | | | | | | | | | | | | | | | | | | | | | | | | | | | | | | | | | | | | | | | |
2014(c) | | $ | 41.89 | | | 0.17 | | | 5.58 | | | 5.75 | | | (0.22 | ) | | — | | | (0.22 | ) | | $47.42 | | | 0.74 | (d) | | | 0.98 | (d) | | | 0.98 | (d) | | | 1.47 | (d) | | 13.73 | | 37.49 | | $ | 35,716 | |
2013 | | $ | 32.19 | | | 0.22 | | | 9.48 | | | 9.70 | | | — | | | — | | | — | | | $41.89 | | | 0.63 | | | | 0.99 | | | | 0.99 | | | | 1.37 | | | 30.13 | | 61.50 | | $ | 47,076 | |
2012 | | $ | 28.22 | | | — (e) | | | 3.98 | | | 3.98 | | | (0.01 | ) | | — | | | (0.01 | ) | | $32.19 | | | — | (f) | | | 0.99 | | | | 0.99 | | | | 1.17 | | | 14.10 | | 54.16 | | $ | 129,995 | |
2011 | | $ | 30.92 | | | 0.07 | | | (2.76 | ) | | (2.69) | | | (0.01 | ) | | — | | | (0.01 | ) | | $28.22 | | | 0.20 | | | | 0.98 | | | | 0.99 | | | | 1.09 | | | (8.70) | | 64.14 | | $ | 215,364 | |
2010 | | $ | 30.13 | | | 0.28 | | | 0.79 | | | 1.07 | | | (0.28 | ) | | — | | | (0.28 | ) | | $30.92 | | | 0.91 | | | | 0.99 | | | | 0.99 | | | | 1.12 | | | 3.54 | | 72.75 | | $ | 228,768 | |
2009 | | $ | 28.45 | | | 0.46 | | | 1.71 | | | 2.17 | | | (0.49 | ) | | — | | | (0.49 | ) | | $30.13 | | | 1.93 | | | | 0.98 | | | | 0.98 | | | | 1.18 | | | 8.05 | | 83.00 | | $ | 165,663 | |
| (a) | Not annualized for periods less than one year. |
| (b) | Sales loads are not reflected in computing total return. |
| (c) | Unaudited Six Month Period Ended March 31. |
| (e) | Net Investment Income (Loss) was less than $0.01 per share. |
| (f) | Net Investment Income (Loss) was less than 0.01% per share. |
| + | Based on weighted average shares outstanding, except for Dividends from Net Investment Income and Net Realized Gains, which are actual amounts per share. |
See notes to financial statements.
| | | | |
| 28 Certified Semi-Annual Report | | | | Certified Semi-Annual Report 29 |
| | |
| Expense Example | | |
| |
Thornburg Value Fund | | March 31, 2014 (Unaudited) |
As a shareholder of the Fund, you incur two types of costs:
| | (1) | transaction costs, including |
(a) sales charges (loads) on purchase payments for Class A shares;
(b) a deferred sales charge on redemptions of any part or all of a purchase of $1 million of Class A shares within 12 months of purchase;
(c) a deferred sales charge on redemptions of Class B shares within eight years of purchase;
(d) a deferred sales charge on redemptions of Class C shares within 12 months of purchase;
| | (2) | ongoing costs, including management fees; distribution and/or service (12b-1) fees; and other Fund expenses. |
This example is intended to help you understand your ongoing costs (in dollars) of investing in the Fund and to compare these costs with the ongoing costs of investing in other mutual funds.
The example is based on a $1,000 investment beginning on October 1, 2013, and held until March 31, 2014.
Actual Expenses
For each class of shares, the first line of the accompanying table provides information about actual account values and actual expenses. You may use the information in this line, together with the amount you invested, to estimate the expenses that you paid over the period. Simply divide your account value by $1,000 (for example, an $8,600 account value divided by $1,000 = 8.6), then multiply the result by the number in the first line for your class of shares under the heading entitled “Expenses Paid During Period” to estimate the expenses you paid on your account during this period.
| | | | | | | | | | | | |
| | | BEGINNING
ACCOUNT VALUE
10/1/13 | | | ENDING
ACCOUNT VALUE
3/31/14 | | | EXPENSES PAID
DURING PERIOD†
10/1/13–3/31/14 | |
Class A Shares | | | | | | | | | | | | |
Actual | | $ | 1,000.00 | | | $ | 1,135.20 | | | $ | 7.29 | |
Hypothetical* | | $ | 1,000.00 | | | $ | 1,018.10 | | | $ | 6.89 | |
Class B Shares | | | | | | | | | | | | |
Actual | | $ | 1,000.00 | | | $ | 1,130.00 | | | $ | 12.43 | |
Hypothetical* | | $ | 1,000.00 | | | $ | 1,013.26 | | | $ | 11.75 | |
Class C Shares | | | | | | | | | | | | |
Actual | | $ | 1,000.00 | | | $ | 1,130.70 | | | $ | 11.49 | |
Hypothetical* | | $ | 1,000.00 | | | $ | 1,014.15 | | | $ | 10.86 | |
Class I Shares | | | | | | | | | | | | |
Actual | | $ | 1,000.00 | | | $ | 1,137.50 | | | $ | 5.27 | |
Hypothetical* | | $ | 1,000.00 | | | $ | 1,020.00 | | | $ | 4.98 | |
Class R3 Shares | | | | | | | | | | | | |
Actual | | $ | 1,000.00 | | | $ | 1,135.50 | | | $ | 7.19 | |
Hypothetical* | | $ | 1,000.00 | | | $ | 1,018.20 | | | $ | 6.79 | |
Class R4 Shares | | | | | | | | | | | | |
Actual | | $ | 1,000.00 | | | $ | 1,136.00 | | | $ | 6.62 | |
Hypothetical* | | $ | 1,000.00 | | | $ | 1,018.73 | | | $ | 6.25 | |
Class R5 Shares | | | | | | | | | | | | |
Actual | | $ | 1,000.00 | | | $ | 1,137.30 | | | $ | 5.24 | |
Hypothetical* | | $ | 1,000.00 | | | $ | 1,020.03 | | | $ | 4.95 | |
| † | Expenses are equal to the annualized expense ratio for each class (A: 1.37%; B: 2.34%; C: 2.16%; I: 0.99%; R3: 1.35%; R4: 1.24%; R5: 0.98%) multiplied by the average account value over the period, multiplied by 182/365 to reflect the one-half year period. |
| * | Hypothetical assumes a rate of return of 5% per year before expenses. |
Hypothetical Example for Comparison Purposes
For each class of shares, the second line of the accompanying table provides information about hypothetical account values and hypothetical expenses based on the Fund’s actual expense ratio and an assumed rate of return of 5% per year before expenses, which is not the Fund’s actual return. The hypothetical account values and expenses may not be used to estimate the actual ending account balance or expenses you paid for the period. You may use this information to compare the ongoing costs of investing in the Fund and other funds. To do so, compare this 5% hypothetical example with the 5% hypothetical examples that appear in the shareholder reports of the other funds.
Please note that the expenses shown in the table are meant to highlight your ongoing costs only and do not reflect any transactional costs, such as sales charges (loads), redemption fees, or exchange fees. Therefore, the second line of the table for each class of shares is useful in comparing ongoing costs only, and will not help you determine the relative total costs of owning different funds. In addition, if these transactional costs were included, your costs would have been higher.
30 Certified Semi-Annual Report
| | |
| Index Comparison | | |
| |
Thornburg Value Fund | | March 31, 2014 (Unaudited) |
Growth of a Hypothetical $10,000 Investment
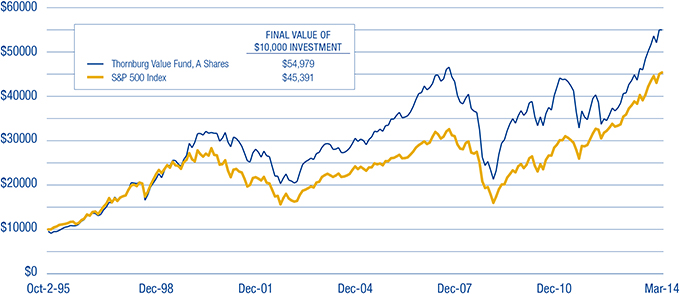
Average Annual Total Returns
For Periods Ended March 31, 2014 (with sales charge)
| | | | | | | | | | | | | | | | | | | | |
| | | 1 YR | | | 3 YRS | | | 5 YRS | | | 10 YRS | | | SINCE
INCEPTION | |
Class A Shares (Incep: 10/2/95) | | | 23.04 | % | | | 6.25 | % | | | 17.73 | % | | | 6.06 | % | | | 9.65 | % |
Class B Shares (Incep: 4/3/00) | | | 22.61 | % | | | 5.82 | % | | | 17.49 | % | | | 5.84 | % | | | 3.58 | % |
Class C Shares (Incep: 10/2/95) | | | 26.84 | % | | | 7.06 | % | | | 17.90 | % | | | 5.75 | % | | | 9.08 | % |
Class I Shares (Incep: 11/2/98) | | | 29.35 | % | | | 8.33 | % | | | 19.26 | % | | | 6.96 | % | | | 7.22 | % |
Class R3 Shares (Incep: 7/1/03) | | | 28.90 | % | | | 7.90 | % | | | 18.79 | % | | | 6.53 | % | | | 7.45 | % |
Class R4 Shares (Incep: 2/1/07) | | | 29.03 | % | | | 8.01 | % | | | 18.91 | % | | | — | | | | 3.69 | % |
Class R5 Shares (Incep: 2/1/05) | | | 29.32 | % | | | 8.29 | % | | | 19.22 | % | | | — | | | | 7.20 | % |
Performance data shown represents past performance and is no guarantee of future results. Investment return and principal value will fluctuate so shares, when redeemed, may be worth more or less than their original cost. Current performance may be lower or higher than quoted. For performance current to the most recent month end, visit thornburg.com or call 800.847.0200. The performance data and graph do not reflect the deduction of taxes that a shareholder would pay on distributions or the redemption of Fund shares. Returns reflect the reinvestment of dividends and capital gains as well as applicable sales charges. Class A shares are sold with a maximum sales charge of 4.50%. Class B shares carry a contingent deferred sales charge (CDSC) that declines from 5.00% to 0% depending upon the period of time the shares are held. Class B shares will automatically convert to Class A shares on a quarterly basis approximately eight years after purchase. Class C shares are subject to a 1% CDSC for the first year only. There is no up-front sales charge for Class I, R3, R4, and R5 shares.
Certified Semi-Annual Report 31
| | |
| Other Information | | |
| |
Thornburg Value Fund | | March 31, 2014 (Unaudited) |
Portfolio Proxy Voting
Policies and Procedures:
The Trust has delegated to Thornburg Investment Management, Inc. (the “Advisor”) voting decisions respecting proxies for the Fund’s voting securities. The Advisor makes voting decisions in accordance with its Proxy Voting Policy and Procedures. A description of the Policy and Procedures is available (i) without charge, upon request, by calling the Advisor toll-free at 1-800-847-0200, (ii) on the Thornburg website at www.thornburg.com, and (iii) on the Securities and Exchange Commission’s website at www.sec.gov.
Information regarding how proxies were voted is available on or before August 31 of each year for the twelve months ending the preceding June 30. This information is available (i) without charge, upon request by calling the Advisor toll-free at 1-800-847-0200, (ii) on the Thornburg website at www.thornburg.com, and (iii) on the Securities and Exchange Commission’s website at www.sec.gov.
Availability of Quarterly Portfolio Schedule
The Fund files with the Securities and Exchange Commission schedules of its portfolio holdings on Form N-Q for the first and third quarters of each fiscal year. The Fund’s Forms N-Q are available on the Commission’s website at www.sec.gov, or may be reviewed and copied at the Commission’s Public Reference Room in Washington, D.C. Information on the operation of the Public Reference Room may be obtained by calling 1-800-SEC-0330. The Fund also makes this information available on its website at www.thornburg. com/download or upon request by calling 1-800-847-0200.
32 Certified Semi-Annual Report
Trustees’ Statement to Shareholders
Not part of the Certified Semi-Annual Report
Reissued September 15, 2013
The Trustees believe current and prospective shareholders should know how we discharge our responsibilities in supervising the Funds’ investment advisor and in reviewing the advisor’s contract for renewal. Since 2005, we have issued a statement which sets out clearly the three principal guidelines that we follow in supervising the Trust’s investment advisor on your behalf. In accordance with our customary practice, in September of this year we again reviewed our statement and concluded we should reissue this statement outlining the principal features of our supervision of the advisor’s performance of investment management services for the Funds.
We begin with the premise that each shareholder selected his or her Fund because its investments are managed by the investment advisor identified in the prospectus and in accordance with the objective and policies described in the prospectus. We realize, as each of you do, that if you believe that your Fund’s stated objective and policies no longer serve your personal investment goals, you can sell your shares and leave the Fund.
Therefore, we believe that our primary supervisory task – our principal obligation to you – is to assess the nature and quality of the advisor’s services, and to confirm that the advisor actively and competently pursues the Fund’s objective, in accordance with the policies set out in the prospectus. To do this, we meet regularly with management to review your Fund’s portfolio and to discuss the advisor’s specific actions and judgments in pursuing the Fund’s objective. We do not substitute our own judgment for the advisor’s decisions in selecting investments; the advisor is paid to exercise its informed judgment on investment decisions, and we seek to confirm, in reviewing the advisor’s performance, that the advisor is doing just that.
Second, while we are conscious of costs and the effect that costs have on shareholders’ returns, we do not seek the lowest fees or expense ratio as our sole or primary objective. We try to make sure that your Fund’s fees and costs are reasonable in relationship to the services rendered and that they are generally in line with those charged by other expert investment advisors, consistent with our belief that the Fund’s investors searched for and expect that expertise and attention and have decided to pay a reasonable price for it. We do not put the management contract “out to bid” as a matter of course, and we would not do so unless we had concluded that the advisor materially had failed to pursue the Fund’s objectives in accordance with its policies, or for other equally important reasons. We believe that any other approach would be inconsistent with your interests and contrary to your expectations when you bought shares of the Fund in the first place.
Finally, because we believe that most Thornburg Fund shareholders have invested with a long-term perspective, we try not to focus too much on the fashions of the moment and on short-term performance. The market will not favor any specific investment objective or set of policies at all times and under all economic circumstances. A fund will experience periods of both high and low returns relative to other funds and other investments. Even if one of our Funds is not favored by the market at a particular time, we believe that the advisor is nonetheless obliged to remain true to the Fund’s objective and policies, and we watch to see that it does so.
This page is not part of the Semi-Annual Report 33
This page intentionally left blank.
34 This page is not part of the Semi-Annual Report
Retirement and Education Accounts
Thornburg Investment Management offers retirement and education savings accounts that can help you meet a variety of planning challenges. For account applications or further information on any of the accounts below, please call 1-800-847-0200 or go to www.thornburg.com/ira. Your financial advisor can help you determine which plan is right for you.
Individual Retirement Accounts
Individual Retirement Accounts (IRAs) provide a tax-advantaged means to save money for the future. For a detailed outline of the difference between retirement accounts, see www.thornburg.com/ira. Rollovers are available. Call 1-800-847-0200 for more information.
Traditional IRAs – Contributions to Traditional IRAs are tax deductible for eligible individuals, and withdrawals are taxed as additional ordinary income. You may contribute to an IRA if you receive compensation and are under 70 1⁄2, even if you are covered by an employer retirement plan. Deductible contributions are subject to certain qualifications. Please consult your tax advisor.
Roth IRAs – Under a Roth IRA, there is no tax deduction for contributions, but there is no income tax on qualified withdrawals. For a more detailed comparison of Traditional and Roth IRAs, please see our website at www.thornburg. com/ira.
SEP IRAs – Simplified Employee Pension (SEP) IRAs are established by employers. The employer is allowed a tax deduction for contributions made to the SEP Plan and makes contributions to each eligible employee’s SEP IRA on a discretionary basis.
SIMPLE IRAs – Savings Incentive Match Plan for Employees of Small Employers (SIMPLE) is designed to give small business owners a simplified method to establish and contribute to a retirement plan for employees. The employer is allowed a tax deduction for contributions and makes either matching or non-elective contributions to each eligible employee’s SIMPLE IRA. Employees may make salary deferral contributions.
Coverdell Education Savings Account
These savings accounts are designed to provide a way to save money for higher education expenses. In an Education Savings Account, earnings and interest grow tax-free, and qualified withdrawals used to pay for eligible higher-education expenses are tax- and penalty-free.
Funds Available
The following funds are available in the accounts listed above:
| | • | | Thornburg Core Growth Fund |
| | • | | Thornburg International Value Fund |
| | • | | Thornburg International Growth Fund |
| | • | | Thornburg Developing World Fund |
| | • | | Thornburg Investment Income Builder Fund |
| | • | | Thornburg Global Opportunities Fund |
| | • | | Thornburg Low Duration Income Fund |
| | • | | Thornburg Limited Term U.S. Government Fund |
| | • | | Thornburg Limited Term Income Fund |
| | • | | Thornburg Strategic Income Fund |
This page is not part of the Semi-Annual Report 35
Firm & Philosophy

The Firm
Founded in 1982 and headquartered in Santa Fe, New Mexico, Thornburg Investment Management advises a range of active investment strategies, each offered through multiple vehicles, to serve a broad spectrum of client needs worldwide. From short-term fixed income to flexible global equity, our objective is to help clients reach their long-term financial goals via active portfolio management. As of March 31, 2014, Thornburg managed approximately $90 billion in assets.
Investment Philosophy
We seek to preserve and increase the real wealth of shareholders after accounting for inflation, taxes, and investment expenses. We’re committed to disciplined investing and managing risk in all market environments.
Portfolio Holdings Commentary
At Thornburg, we believe you should know what you own. Our website keeps investors informed of the Funds’ equity holdings. Go to www.thornburg.com/funds for equity funds holdings and commentary.
Co-Ownership of Funds
We invest side-by-side with shareholders. Our employees have invested $387 million in Thornburg products as of March 31, 2014.
36 This page is not part of the Semi-Annual Report
Thornburg Fund Family
Thornburg Equity Funds
Thornburg’s equity research uses a fundamentally driven, bottom-up, comprehensive analytical approach. Thornburg equity funds generally focus on a limited number of securities so that each holding can impact performance. The team searches for firms believed to have a promising future and seeks to buy shares of those companies at a discount to their intrinsic or long-term value.
| | • | | Thornburg Core Growth Fund |
| | • | | Thornburg International Value Fund |
| | • | | Thornburg International Growth Fund |
| | • | | Thornburg Developing World Fund |
| | • | | Thornburg Investment Income Builder Fund |
| | • | | Thornburg Global Opportunities Fund |
Thornburg Bond Funds
Thornburg Investment Management applies a disciplined philosophy to fixed-income management. Since the launch of our first fixed-income fund over 25 years ago, we have been conducting fundamental, bottom-up research in an effort to identify bonds which we believe provide the best return for a given level of risk. We avoid leverage or complex strategies which could backfire in periods of market uncertainty.
| | • | | Thornburg Low Duration Income Fund |
| | • | | Thornburg Limited Term U.S. Government Fund |
| | • | | Thornburg Limited Term Income Fund |
| | • | | Thornburg Strategic Income Fund |
| | • | | Thornburg Low Duration Municipal Fund |
| | • | | Thornburg Limited Term Municipal Fund |
| | • | | Thornburg Intermediate Municipal Fund |
| | • | | Thornburg California Limited Term Municipal Fund |
| | • | | Thornburg New Mexico Intermediate Municipal Fund |
| | • | | Thornburg New York Intermediate Municipal Fund |
| | • | | Thornburg Strategic Municipal Income Fund |
Before investing, carefully consider the Fund’s investment goals, risks, charges, and expenses. For a prospectus or summary prospectus containing this and other information, contact your financial advisor or visit thornburg.com. Read it carefully before investing.
For additional information, please visit thornburg.com
Thornburg Investment Management, Inc. 2300 North Ridgetop Road, Santa Fe, NM 87506
This page is not part of the Semi-Annual Report 37
This page intentionally left blank.
38 This page is not part of the Semi-Annual Report
This page intentionally left blank.
This page is not part of the Semi-Annual Report 39
| | |
 | | Waste not, Wait not |

This Semi-Annual Report is submitted for the general information of shareholders of the Fund. It is not authorized for distribution to prospective investors in the Fund unless preceded or accompanied by an effective prospectus.
| | | | |
Investment Advisor: Thornburg Investment Management® 800.847.0200 | | Distributor: Thornburg Securities Corporation® 800.847.0200 | | TH170 |

2 This page is not part of the Semi-Annual Report
IMPORTANT INFORMATION
The information presented on the following pages was current as of March 31, 2014. The managers’ views, portfolio holdings, and sector and country diversification are provided for the general information of the Fund’s shareholders; to the extent this information is historical, it should not be considered predictive of future circumstances. This material should not be deemed a recommendation to buy or sell any of the securities mentioned.
Investments in the Fund carry risks, including possible loss of principal. Special risks may be associated with investments outside the United States, especially in emerging markets, including currency fluctuations, illiquidity, volatility, and political and economic risks. Investments in small capitalization companies may increase the risk of declines in value and greater price fluctuations. Please see the Fund’s Prospectus for a discussion of the risks associated with an investment in the Fund. Investments in the Fund are not FDIC insured, nor are they deposits of or guaranteed by a bank or any other entity. There is no guarantee that the Fund will meet its investment objectives. Funds invested in a limited number of holdings may expose an investor to greater volatility.
Performance data given at net asset value (NAV) does not take into account applicable sales charges. If the sales charges had been included, the performance would have been lower.
Class I, R3, R4, R5, and R6 shares may not be available to all investors. Minimum investments for Class I shares may be higher than those for other classes.
Diversification does not assure or guarantee better performance and cannot eliminate the risk of investment losses.
| | | | |
Share Class | | NASDAQ Symbol | | CUSIP |
Class A | | TGVAX | | 885-215-657 |
Class B | | THGBX | | 885-215-616 |
Class C | | THGCX | | 885-215-640 |
Class I | | TGVIX | | 885-215-566 |
Class R3 | | TGVRX | | 885-215-525 |
Class R4 | | THVRX | | 885-215-269 |
Class R5 | | TIVRX | | 885-215-368 |
Class R6 | | TGIRX | | 885-216-804 |
Glossary
MSCI EAFE (Europe, Australasia, Far East) Index – An unmanaged, market capitalization weighted index that is a common benchmark for international portfolio performance. The index is calculated with net dividends reinvested in U.S. dollars.
MSCI All Country (AC) World ex-US Index – A market capitalization weighted index representative of the market structure of 43 developed and emerging market countries in North and South America, Europe, Africa, and the Pacific Rim, excluding securities of United States’ issuers. The index is calculated with gross dividends reinvested in U.S. dollars.
Unless otherwise noted, index returns reflect the reinvestment of income dividends and capital gains, if any, but do not reflect fees, brokerage commissions or other expenses of investing. Investors may not make direct investments into any index. The performance of any index is not indicative of the performance of any particular investment.
Beta – A measure of market-related risk. Less than one means the portfolio is less volatile than the index, while greater than one indicates more volatility than the index.
Median Market Capitalization – Market capitalization (market cap) is the total value of a company’s stock, calculated by multiplying the number of outstanding common shares by the current share price. The company whose market cap is in the middle of the portfolio is the median market cap. Half the companies in the portfolio have values greater than the median and half have values that are less.
Price to Book Value – A ratio used to compare a stock’s market value to its book value. It is calculated by dividing the current closing price of the stock by the latest quarter’s book value (book value is simply assets minus liabilities).
Price to Cash Flow Ratio – A measure of the market’s expectations of a firm’s future financial health. It is calculated by dividing the price per share by cash flow per share.
Price to Earnings Ratio (P/E) – A valuation ratio equaling a company’s market value per share divided by earnings per share.
This page is not part of the Semi-Annual Report 3

Portfolio Managers

Lei Wang, CFA Bill Fries, CFA
Objectives and Strategies
The Fund seeks long-term capital appreciation by investing in equity and debt securities of all types. As a secondary consideration, the Fund also seeks some current income.
The Fund invests primarily in foreign securities or depository receipts of foreign securities. The Fund may invest in developing countries.
Finding Promising Companies at a Discount
The Thornburg International Value Fund seeks to find value in overseas markets. It differs from many other international equity funds in two key ways. First, it typically invests in a limited number of stocks, and second, it takes a more comprehensive approach to value investing.
Our team is dedicated to providing value to shareholders. We accomplish this through the application of seasoned investment principles with hands-on, company-oriented research. We use a collaborative approach in implementing our investment research process. Our focus is on finding promising companies available at a discount to our estimate of their intrinsic value, no matter where they are located outside the United States. Geographic location is secondary to individual stock merit.
In managing the Thornburg International Value Fund, we take a bottom-up approach to stock selection. The Fund is not predisposed to a particular geographic region or industry. We use a variety of valuation methods and business evaluations in an effort to gauge the intrinsic value of a company based on its past record and future potential. The continuum of process moves from screens and idea generation, through conventional “Wall Street” research and documentation, to company contact, the latter often including on-site visits. The focus of the analysis is on what’s behind the numbers: its revenue and cash-generating model. We make an effort to get to know the company’s reputation in the industry, its people and its corporate culture.
The current posture is to maintain a portfolio diversified by country, sector, industry, market capitalization, and our three categories of stocks: basic value, consistent earners and emerging franchises. Because of the limited number of stocks in the portfolio, every holding counts. At the time of purchase, we set a 12-8 month price target for each stock. The target is reviewed as the fundamentals of the stock change during the course of ownership.
The bottom line? Engendering a wide-open, collegial environment fosters information flows and critical thinking intended to benefit portfolio decision making. We do not view our location in Santa Fe, New Mexico, as a disadvantage. While we have access to the best of Wall Street’s analysis, we are not ruled by it. Distance from the crowd serves to fortify independent and objective thinking.
4 This page is not part of the Semi-Annual Report
Key Portfolio Attributes
As of March 31, 2014
| | | | |
Portfolio P/E Trailing 12-months* | | | 17.4x | |
| |
Portfolio Price to Cash Flow* | | | 10.3x | |
| |
Portfolio Price to Book Value* | | | 1.9x | |
| |
Median Market Cap* | | $ | 45.6 B | |
| |
7-Year Beta (A Shares vs. MSCI EAFE)* | | | 0.89 | |
| |
Number of Companies | | | 68 | |
* Source: FactSet
Market Capitalization Exposure
As of March 31, 2014
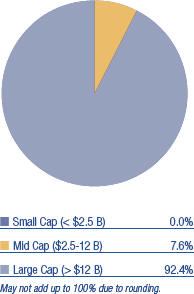
Basket Structure
As of March 31, 2014
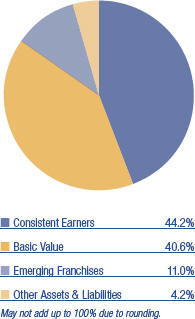
Average Annual Total returns
For Periods Ended March 31, 2014
| | | | | | | | | | | | | | | | | | | | |
| | | 1 Yr | | | 3 Yrs | | | 5 Yrs | | | 10 Yrs | | | Since
Inception | |
A Shares (Incep: 5/28/98) | | | | | | | | | | | | | | | | | | | | |
Without sales charge | | | 7.25 | % | | | 1.77 | % | | | 12.94 | % | | | 7.29 | % | | | 8.17 | % |
With sales charge | | | 2.44 | % | | | 0.22 | % | | | 11.91 | % | | | 6.80 | % | | | 7.86 | % |
MSCI EAFE Index (Since 5/28/98) | | | 17.56 | % | | | 7.21 | % | | | 16.02 | % | | | 6.53 | % | | | 4.58 | % |
MSCI AC World ex-U.S. Index (Since 5/28/98) | | | 12.81 | % | | | 4.63 | % | | | 16.04 | % | | | 7.59 | % | | | 5.55 | % |
Performance data shown represents past performance and is no guarantee of future results. Investment return and principal value will fluctuate so shares, when redeemed, may be worth more or less than their original cost. Current performance may be lower or higher than quoted. For performance current to the most recent month end, visit thornburg.com or call 800.847.0200.
The maximum sales charge for Class A shares is 4.50%. The total annual fund operating expense of Class A shares is 1.25%, as disclosed in the most recent Prospectus.
Stocks Contributing and Detracting
For the Six Months Ended March 31, 2014
| | |
Top Contributors | | Top Detractors |
| Novo Nordisk A/S | | Mitsubishi UFJ Financial Group, Inc. |
| Intesa Sanpaolo S.p.A. | | Lululemon Athletica, Inc. |
| Roche Holding AG | | Komatsu Ltd. |
| Kingfisher plc | | China Mobile Ltd. |
| ING Groep N.V. | | Toyota Motor Corp. |
| | |
Source: FactSet
This page is not part of the Semi-Annual Report 5

Thornburg International Value Fund –
March 31, 2014
This report is certified under the Sarbanes-Oxley Act of 2002, which requires that public companies, including mutual funds, affirm that the information provided in their annual and semi-annual shareholder reports fully and fairly represents their financial position and the results of their operations for the period presented.
6 Certified Semi-Annual Report
LETTER TO SHAREHOLDERS
April 22, 2014
Dear Fellow Shareholder:
This letter will highlight the results of Thornburg International Value Fund’s investment activities for the six-month period ended March 31, 2014. In addition, we will comment on the overall investment landscape. Developed-market indices remained resilient through the six months ended March 31, 2014, with the notable exception of Japan, which gave back some of the pronounced 2013 strength. Stocks have now reversed much of the valuation de-rating since the Great Financial Crisis. In contrast, emerging markets remained choppy as concerns about the timing of the U.S. Federal Reserve’s stimulus “taper,” slowing growth in China, currency issues and geopolitical uncertainty surrounding Russia and the Ukraine weighed on returns. Near the end of the period, global markets began a rotation favoring value over growth stocks that resulted in a downturn in higher-valuation equities, including the technology sector, where some issues, including our holdings in the emerging-market Internet space, corrected sharply.
For the six-months ended March 31, 2014, the Thornburg International Value Fund returned a negative 0.73% for Class A shares at net asset value (NAV), versus a 5.45% advance for the MSCI All Country World ex-U.S. Index and 6.41% gain for the MSCI EAFE Index. The disappointing results reflect exposure to the above mentioned factors as well as to a variety of company specific issues. We are active managers, typically holding less than 10% of the stocks in the benchmark indices. This often serves as an enabler of better-than-benchmark returns, but also opens the possibility of underperformance, such as we just experienced. Nonetheless, we remain confident in our pursuit of benchmark-beating returns over time.
In general, our best-performing stocks benefitted from better macroeconomic conditions in Europe, valuation re-rating, and company specific developments. Intesa Sanpaolo, a leading Italian bank with a sound capital structure, returned 64% amid an improving domestic economy. Novo Nordisk, the Danish pharmaceutical leader in diabetes treatments and our largest holding, was up 35% as risks to its drug development subsided and competitive challenges abated. ING Groep, the Dutch bank and insurance company that is restructuring to concentrate on its banking franchise, gained 25%. Roche’s continued progress on its cancer therapy portfolio and Kingfisher’s strong position in the U.K. home improvement market led to both stocks contributing positively in the period.
Detractors were disproportionately weighted toward Asia and emerging-market stocks. Japanese financials, including Mitsubishi UFJ Financial, Sumitomo Mitsui Trust, and Mitsubishi Estate, undercut performance amid growing concerns about the ultimate success of Prime Minister Shinzo Abe’s reform initiatives and the impact of the country’s consumption tax increases. Many emerging-market holdings trended lower on worries over growth, currency movements and increased political and economic uncertainty. Poor performance in China Mobile, Industrial and Commercial Bank of China, Natura Cosmeticos (a Brazilian cosmetics manufacturer), Yandex (the leading Russian Internet search engine), MercadoLibre (the Latin American e-commerce retailer), and Standard Chartered Bank all reflect these issues to varying degrees. Athletic apparel company Lululemon Athletica declined amid a product snafu, supply chain issues and its transition to becoming a wider-reaching international company with a broader line of merchandise. Rolls-Royce and Syngenta each suffered declines in the outlook for their respective end-markets, leading us to trim these positions in favor of better opportunities.
Broadly speaking, equities currently stand at valuation levels close to long-term averages. Most macroeconomic indicators point to improving, though arguably sluggish growth in a subdued inflation and interest-rate environment. Given this backdrop, stocks remain an appealing alternative for investors to fulfill long-term investment objectives for income, capital appreciation, or both. New purchases included companies undergoing change to unlock value and generate attractive levels of cash. For example, Rio Tinto (a leading Australian metals and minerals miner) and Total (a French integrated oil and gas company) are both entering phases of significant operational improvement and lower capital expenditure that should yield considerable free cash flow. Our purchase of Sony reflects the early stages of an effort to boost shareholder returns, as it restructures loss-generating television and personal computing businesses and builds its Playstation franchise into an integrated platform incorporating access to content delivered over the Internet. Tencent and Sands China reflect our pursuit of emerging franchises that have scalable business models. Tencent’s mobile-focused social media services in China, and Sands China Macau gaming properties also encompass hard-to-replicate assets with compelling long-term prospects.
Certified Semi-Annual Report 7
LETTER TO SHAREHOLDERS,
CONTINUED
Stock sales and trims reflected both changes to our assessment of companies’ earnings power and our attention to risk management. We eliminated positions in various basic-value stocks, including Tullow Oil, Teck Resources and CNOOC, where a reassessment of free cash flow generation over the next few years led to a diminished risk-reward balance compared to new positions discussed above. In addition, we eliminated two emerging-franchise stocks in Yandex and MercadoLibre, as noted above, due to increased geopolitical and foreign exchange risks.
Despite recent results, we remain confident in our approach to stock selection. Please review our long-term performance and current portfolio holdings, which are readily available at www.thornburginvestments.com and also listed in this report. We take comfort in the quality and potential of the companies we hold, and expect you will, too.
Thank you for your trust and confidence.
Sincerely,
| | | | |
 | |  | | |
| William V. Fries, CFA | | Lei Wang, CFA | | |
| Portfolio Manager | | Portfolio Manager | | |
| Managing Director | | Managing Director | | |
The matters discussed in this report may constitute forward-looking statements made pursuant to the safe harbor provisions of the Securities Litigation Reform Act of 1995. These include any advisor or portfolio manager prediction, assessment, analysis or outlook for individual securities, industries, investment styles, market sectors and/or markets. These statements involve risks and uncertainties. In addition to the general risks described for each fund in its current prospectus, other factors bearing on these reports include the accuracy of the advisor’s or portfolio manager’s forecasts and predictions, the appropriateness of the investment strategies designed by the advisor or portfolio manager and the ability of the advisor or portfolio manager to implement their strategies efficiently and successfully. Any one or more of these factors, as well as other risks affecting the securities markets generally, could cause the actual results of any fund to differ materially as compared to its benchmarks.
8 Certified Semi-Annual Report
| | |
| SCHEDULE OF INVESTMENTS | | |
| |
Thornburg International Value Fund | | March 31, 2014 (Unaudited) |
Top Ten Equity Holdings
As of 3/31/14
| | | | |
Novo Nordisk A/S | | | 3.0 | % |
Mitsubishi UFJ Financial Group, Inc. | | | 2.9 | % |
Roche Holding AG | | | 2.7 | % |
Toyota Motor Corp. | | | 2.6 | % |
Kingfisher plc | | | 2.5 | % |
| | | | |
Publicis Groupe | | | 2.4 | % |
LVMH Moet Hennessy Louis Vuitton SA | | | 2.3 | % |
Novartis AG | | | 2.2 | % |
Reckitt Benckiser plc | | �� | 2.2 | % |
Schlumberger Ltd. | | | 2.1 | % |
Summary of Industry Exposure
As of 3/31/14
| | | | |
Banks | | | 11.8 | % |
Pharmaceuticals, Biotechnology & Life Sciences | | | 9.0 | % |
Diversified Financials | | | 8.2 | % |
Software & Services | | | 7.7 | % |
Consumer Durables & Apparel | | | 7.6 | % |
Automobiles & Components | | | 5.6 | % |
Capital Goods | | | 5.4 | % |
Food, Beverage & Tobacco | | | 5.4 | % |
Media | | | 5.2 | % |
Retailing | | | 4.2 | % |
Energy | | | 4.1 | % |
| | | | |
Consumer Services | | | 4.0 | % |
Telecommunication Services | | | 3.6 | % |
Health Care Equipment & Services | | | 2.5 | % |
Semiconductors & Semiconductor Equipment | | | 2.3 | % |
Household & Personal Products | | | 2.2 | % |
Materials | | | 2.1 | % |
Insurance | | | 1.5 | % |
Transportation | | | 1.3 | % |
Real Estate | | | 1.1 | % |
Commercial & Professional Services | | | 1.0 | % |
Other Assets & Liabilities | | | 4.2 | % |
Summary of Country Exposure
As of 3/31/14 (percent of equity holdings)
| | | | |
Japan | | | 17.7 | % |
United Kingdom | | | 15.3 | % |
Switzerland | | | 10.3 | % |
France | | | 9.9 | % |
China | | | 8.2 | % |
Germany | | | 6.7 | % |
Netherlands | | | 5.1 | % |
United States | | | 3.5 | % |
Hong Kong | | | 3.3 | % |
Denmark | | | 3.1 | % |
| | | | |
Ireland | | | 3.1 | % |
Canada | | | 2.8 | % |
Spain | | | 2.6 | % |
Italy | | | 2.0 | % |
Sweden | | | 1.7 | % |
Belgium | | | 1.6 | % |
Finland | | | 1.0 | % |
Macao | | | 0.9 | % |
Taiwan | | | 0.7 | % |
Brazil | | | 0.5 | % |
| | | | | | | | |
| | | Shares/
Principal Amount | | | Value | |
COMMON STOCK — 95.77% | | | | | | | | |
AUTOMOBILES & COMPONENTS — 5.64% | | | | | | | | |
Auto Components — 3.03% | | | | | | | | |
Bridgestone Corp. | | | 8,622,601 | | | $ | 305,757,106 | |
Compagnie Generale des Establissements Michelin | | | 3,346,099 | | | | 418,473,271 | |
Automobiles — 2.61% | | | | | | | | |
Toyota Motor Corp. | | | 11,026,510 | | | | 622,394,490 | |
| | | | | | | | |
| | | | | | | 1,346,624,867 | |
| | | | | | | | |
Certified Semi-Annual Report 9
| | |
| SCHEDULE OF INVESTMENTS, CONTINUED | | |
| |
Thornburg International Value Fund | | March 31, 2014 (Unaudited) |
| | | | | | | | |
| | | Shares/
Principal Amount | | | Value | |
BANKS — 11.75% | | | | | | | | |
Banks — 11.75% | | | | | | | | |
Banco Bilbao Vizcaya Argentaria, S.A. | | | 26,943,162 | | | $ | 323,596,776 | |
HSBC Holdings plc | | | 18,226,143 | | | | 184,575,973 | |
Industrial and Commercial Bank of China Ltd. | | | 798,834,688 | | | | 491,257,843 | |
Intesa Sanpaolo S.p.A. | | | 133,332,419 | | | | 451,865,959 | |
Mitsubishi UFJ Financial Group, Inc. | | | 124,095,734 | | | | 681,705,964 | |
Standard Chartered plc | | | 8,703,731 | | | | 181,888,194 | |
Sumitomo Mitsui Trust Holdings, Inc. | | | 108,540,245 | | | | 490,042,670 | |
| | | | | | | | |
| | | | | | | 2,804,933,379 | |
| | | | | | | | |
CAPITAL GOODS — 5.44% | | | | | | | | |
Aerospace & Defense — 1.62% | | | | | | | | |
Embraer S.A. | | | 3,567,945 | | | | 126,626,368 | |
Rolls-Royce Holdings plc | | | 14,565,682 | | | | 260,801,340 | |
Machinery — 3.82% | | | | | | | | |
Fanuc Ltd. | | | 2,197,272 | | | | 387,553,522 | |
KONE Oyj | | | 5,728,170 | | | | 240,214,548 | |
Kubota Corp. | | | 16,542,447 | | | | 219,091,460 | |
Pentair Ltd. | | | 819,300 | | | | 65,003,262 | |
| | | | | | | | |
| | | | | | | 1,299,290,500 | |
| | | | | | | | |
COMMERCIAL & PROFESSIONAL SERVICES — 1.01% | | | | | | | | |
Professional Services — 1.01% | | | | | | | | |
Experian plc | | | 13,367,390 | | | | 240,905,673 | |
| | | | | | | | |
| | | | | | | 240,905,673 | |
| | | | | | | | |
CONSUMER DURABLES & APPAREL — 7.60% | | | | | | | | |
Household Durables — 1.31% | | | | | | | | |
Sony Corp. | | | 16,354,865 | | | | 312,471,964 | |
Textiles, Apparel & Luxury Goods — 6.29% | | | | | | | | |
adidas AG | | | 3,362,088 | | | | 363,779,928 | |
Burberry Group plc | | | 11,590,448 | | | | 269,556,087 | |
a,b Lululemon Athletica, Inc. | | | 5,980,852 | | | | 314,533,007 | |
LVMH Moet Hennessy Louis Vuitton SA | | | 3,051,669 | | | | 554,735,016 | |
| | | | | | | | |
| | | | | | | 1,815,076,002 | |
| | | | | | | | |
CONSUMER SERVICES — 3.95% | | | | | | | | |
Hotels, Restaurants & Leisure — 3.95% | | | | | | | | |
Carnival plc | | | 6,952,624 | | | | 264,739,995 | |
Sands China Ltd. | | | 26,780,789 | | | | 199,738,109 | |
Yum! Brands, Inc. | | | 6,361,206 | | | | 479,571,320 | |
| | | | | | | | |
| | | | | | | 944,049,424 | |
| | | | | | | | |
DIVERSIFIED FINANCIALS — 8.20% | | | | | | | | |
Capital Markets — 4.67% | | | | | | | | |
Deutsche Bank AG | | | 10,444,048 | | | | 467,258,035 | |
Julius Baer Group Ltd. | | | 5,798,963 | | | | 257,330,828 | |
UBS AG | | | 18,875,395 | | | | 389,870,158 | |
Diversified Financial Services — 3.53% | | | | | | | | |
Hong Kong Exchanges and Clearing Ltd. | | | 25,269,358 | | | | 383,120,802 | |
b ING Groep N.V. | | | 32,496,914 | | | | 460,005,168 | |
| | | | | | | | |
| | | | | | | 1,957,584,991 | |
| | | | | | | | |
ENERGY — 4.10% | | | | | | | | |
Energy Equipment & Services — 2.09% | | | | | | | | |
Schlumberger Ltd. | | | 5,115,126 | | | | 498,724,785 | |
Oil, Gas & Consumable Fuels — 2.01% | | | | | | | | |
Total SA | | | 7,318,759 | | | | 479,935,813 | |
| | | | | | | | |
| | | | | | | 978,660,598 | |
| | | | | | | | |
FOOD, BEVERAGE & TOBACCO — 5.42% | | | | | | | | |
Beverages — 2.68% | | | | | | | | |
Anheuser-Busch InBev N.V. | | | 3,420,403 | | | | 358,592,081 | |
SABMiller plc | | | 5,649,492 | | | | 282,085,614 | |
10 Certified Semi-Annual Report
| | |
| SCHEDULE OF INVESTMENTS, CONTINUED | | |
| |
Thornburg International Value Fund | | March 31, 2014 (Unaudited) |
| | | | | | | | |
| | | Shares/
Principal Amount | | | Value | |
Food Products — 1.40% | | | | | | | | |
Nestle SA | | | 4,432,974 | | | $ | 333,707,844 | |
Tobacco — 1.34% | | | | | | | | |
Japan Tobacco, Inc. | | | 10,196,844 | | | | 320,086,950 | |
| | | | | | | | |
| | | | | | | 1,294,472,489 | |
| | | | | | | | |
HEALTH CARE EQUIPMENT & SERVICES — 2.46% | | | | | | | | |
Health Care Providers & Services — 2.46% | | | | | | | | |
Fresenius Medical Care AG & Co. | | | 6,186,130 | | | | 431,655,473 | |
Sinopharm Group Co. H | | | 56,829,792 | | | | 155,693,042 | |
| | | | | | | | |
| | | | | | | 587,348,515 | |
| | | | | | | | |
HOUSEHOLD & PERSONAL PRODUCTS — 2.19% | | | | | | | | |
Household Products — 2.19% | | | | | | | | |
Reckitt Benckiser plc | | | 6,419,674 | | | | 523,034,127 | |
| | | | | | | | |
| | | | | | | 523,034,127 | |
| | | | | | | | |
INSURANCE — 1.54% | | | | | | | | |
Insurance — 1.54% | | | | | | | | |
AIA Group Ltd. | | | 77,524,615 | | | | 367,808,397 | |
| | | | | | | | |
| | | | | | | 367,808,397 | |
| | | | | | | | |
MATERIALS — 2.14% | | | | | | | | |
Chemicals — 1.63% | | | | | | | | |
Air Liquide SA | | | 1,804,591 | | | | 244,432,762 | |
Syngenta AG | | | 379,078 | | | | 143,346,842 | |
Metals & Mining — 0.51% | | | | | | | | |
Rio Tinto plc | | | 2,197,600 | | | | 122,276,961 | |
| | | | | | | | |
| | | | | | | 510,056,565 | |
| | | | | | | | |
MEDIA — 5.15% | | | | | | | | |
Media — 5.15% | | | | | | | | |
b Liberty Global plc Class A | | | 4,688,192 | | | | 195,028,787 | |
b Liberty Global plc Class C | | | 4,755,179 | | | | 193,583,337 | |
Publicis Groupe | | | 6,378,102 | | | | 576,237,652 | |
WPP plc | | | 12,828,625 | | | | 264,560,208 | |
| | | | | | | | |
| | | | | | | 1,229,409,984 | |
| | | | | | | | |
PHARMACEUTICALS, BIOTECHNOLOGY & LIFE SCIENCES — 9.04% | | | | | | | | |
Biotechnology — 0.69% | | | | | | | | |
b Gilead Sciences, Inc. | | | 2,332,300 | | | | 165,266,778 | |
Pharmaceuticals — 8.35% | | | | | | | | |
b Actavis plc | | | 577,300 | | | | 118,837,205 | |
Novartis AG | | | 6,266,847 | | | | 531,659,437 | |
Novo Nordisk A/S | | | 15,476,608 | | | | 704,812,727 | |
Roche Holding AG | | | 2,124,145 | | | | 636,726,910 | |
| | | | | | | | |
| | | | | | | 2,157,303,057 | |
| | | | | | | | |
REAL ESTATE — 1.08% | | | | | | | | |
Real Estate Management & Development — 1.08% | | | | | | | | |
Mitsubishi Estate Company Ltd. | | | 10,881,822 | | | | 257,878,570 | |
| | | | | | | | |
| | | | | | | 257,878,570 | |
| | | | | | | | |
RETAILING — 4.15% | | | | | | | | |
Specialty Retail — 4.15% | | | | | | | | |
Hennes & Mauritz AB | | | 9,246,213 | | | | 394,288,705 | |
Kingfisher plc | | | 84,960,673 | | | | 596,880,222 | |
| | | | | | | | |
| | | | | | | 991,168,927 | |
| | | | | | | | |
SEMICONDUCTORS & SEMICONDUCTOR EQUIPMENT — 2.26% | | | | | | | | |
Semiconductors & Semiconductor Equipment — 2.26% | | | | | | | | |
ARM Holdings plc | | | 9,873,407 | | | | 164,275,310 | |
ASML Holding N.V. | | | 2,283,422 | | | | 211,489,130 | |
Taiwan Semiconductor Manufacturing Co., Ltd. ADR | | | 8,199,700 | | | | 164,157,994 | |
| | | | | | | | |
| | | | | | | 539,922,434 | |
| | | | | | | | |
Certified Semi-Annual Report 11
| | |
| SCHEDULE OF INVESTMENTS, CONTINUED | | |
| |
Thornburg International Value Fund | | March 31, 2014 (Unaudited) |
| | | | | | | | |
| | | Shares/
Principal Amount | | | Value | |
SOFTWARE & SERVICES — 7.68% | | | | | | | | |
Information Technology Services — 3.24% | | | | | | | | |
Accenture plc | | | 4,286,449 | | | $ | 341,715,714 | |
Amadeus IT Holding SA | | | 6,725,035 | | | | 279,331,958 | |
MasterCard, Inc. | | | 2,032,700 | | | | 151,842,690 | |
Internet Software & Services — 3.36% | | | | | | | | |
b Baidu, Inc. ADR | | | 2,697,444 | | | | 411,036,517 | |
b SINA Corp. | | | 2,602,100 | | | | 157,192,861 | |
Tencent Holdings Ltd. | | | 3,351,488 | | | | 233,111,297 | |
Software — 1.08% | | | | | | | | |
SAP AG | | | 3,202,179 | | | | 259,218,594 | |
| | | | | | | | |
| | | | | | | 1,833,449,631 | |
| | | | | | | | |
TELECOMMUNICATION SERVICES — 3.63% | | | | | | | | |
Wireless Telecommunication Services — 3.63% | | | | | | | | |
China Mobile Ltd. | | | 45,857,792 | | | | 419,764,486 | |
SoftBank Corp. | | | 5,906,262 | | | | 446,338,648 | |
| | | | | | | | |
| | | | | | | 866,103,134 | |
| | | | | | | | |
TRANSPORTATION — 1.34% | | | | | | | | |
Road & Rail — 1.34% | | | | | | | | |
Canadian National Railway Co. | | | 5,680,000 | | | | 319,117,865 | |
| | | | | | | | |
| | | | | | | 319,117,865 | |
| | | | | | | | |
TOTAL COMMON STOCK (Cost $17,257,475,242) | | | | | | | 22,864,199,129 | |
| | | | | | | | |
RIGHTS — 0.03% | | | | | | | | |
Banco Bilbao Vizcaya Argentaria, S.A. Rights | | | 26,943,162 | | | | 6,310,100 | |
| | | | | | | | |
TOTAL RIGHTS (Cost $6,238,580) | | | | | | | 6,310,100 | |
| | | | | | | | |
SHORT TERM INVESTMENTS — 1.15% | | | | | | | | |
Airgas, Inc., 0.18%, 4/1/2014 | | $ | 17,000,000 | | | | 17,000,000 | |
Ameren Corp., 0.20%, 4/1/2014 | | | 10,000,000 | | | | 10,000,000 | |
Atlantic City Electric, 0.18%, 4/1/2014 | | | 25,500,000 | | | | 25,500,000 | |
Autozone, Inc., 0.17%, 4/1/2014 | | | 16,900,000 | | | | 16,900,000 | |
Avery Dennison Corp., 0.19%, 4/1/2014 | | | 44,750,000 | | | | 44,750,000 | |
Bank of New York Tri-Party Repurchase Agreement 0.24% dated 3/31/2014 due 4/1/2014, repurchase price $31,000,207 collateralized by 16 corporate debt securities and 18 U.S. Government debt securities, having an average coupon of 3.769%, a minimum credit rating of BBB-, maturity dates from 6/15/2016 to 3/4/2044, and having an aggregate market value of $32,834,095 at 3/31/2014 | | | 31,000,000 | | | | 31,000,000 | |
Delmarva Power & Light, 0.18%, 4/1/2014 | | | 15,400,000 | | | | 15,400,000 | |
Kansas City Power & Light, 0.20%, 4/1/2014 | | | 30,700,000 | | | | 30,700,000 | |
Kinder Morgan Energy, 0.20%, 4/1/2014 | | | 16,000,000 | | | | 16,000,000 | |
Kroger Co., 0.20%, 4/1/2014 | | | 22,700,000 | | | | 22,700,000 | |
Union Electric Co., 0.20%, 4/1/2014 | | | 15,000,000 | | | | 15,000,000 | |
Western Union Co., 0.20%, 4/1/2014 | | | 30,272,000 | | | | 30,272,000 | |
| | | | | | | | |
TOTAL SHORT TERM INVESTMENTS (Cost $275,222,000) | | | | | | | 275,222,000 | |
| | | | | | | | |
TOTAL INVESTMENTS — 96.95% (Cost $17,538,935,822) | | | | | | $ | 23,145,731,229 | |
OTHER ASSETS LESS LIABILITIES — 3.05% | | | | | | | 729,322,004 | |
| | | | | | | | |
NET ASSETS — 100.00% | | | | | | $ | 23,875,053,233 | |
| | | | | | | | |
12 Certified Semi-Annual Report
| | |
| SCHEDULE OF INVESTMENTS, CONTINUED | | |
| |
Thornburg International Value Fund | | March 31, 2014 (Unaudited) |
Footnote Legend
| a | Investment in Affiliates – Holdings of voting securities of each portfolio company which is considered “affiliated” to the Fund under the Investment Company Act of 1940 because the Fund’s holding represented 5% or more of the company’s voting securities during the period, are shown below: |
| | | | | | | | | | | | | | | | | | | | | | | | | | | | |
Issuer | | Shares/Principal
September 30,
2013 | | | Gross
Additions | | | Gross
Reductions | | | Shares/Principal
March 31,
2014 | | | Market Value
March 31,
2014 | | | Investment
Income | | | Realized
Gain (Loss) | |
Lululemon Athletica, Inc. | | | 6,333,152 | | | | — | | | | 352,300 | | | | 5,980,852 | | | $ | 314,533,007 | | | $ | — | | | $ | (6,997,353 | ) |
Carnival plc* | | | 10,379,403 | | | | | | | | | | | | | | | | | | | | | | | | | |
| | | | | | | | | | | | | | | | | | | | | | | | | | | | |
Total non-controlled affiliated issuers – 1.32% of net assets | | | $ | 314,533,007 | | | $ | — | | | $ | (6,997,353 | ) |
| | | | | | | | | | | | | | | | | | | | | | | | | | | | |
*Issuer not affiliated at March 31, 2014. | | | | | | | | | | | | | | | | | | | | | | | | | |
Portfolio Abbreviations
To simplify the listings of securities, abbreviations are used per the table below:
| | |
| ADR | | American Depository Receipt |
| ARM | | Adjustable Rate Mortgage |
See notes to financial statements.
Certified Semi-Annual Report 13
| | |
| STATEMENT OF ASSETS AND LIABILITIES | | |
| |
Thornburg International Value Fund | | March 31, 2014 (Unaudited) |
| | | | |
ASSETS | | | | |
Investments at value | | | | |
Non-affiliated issuers (cost $17,144,663,358) (Note 2) | | $ | 22,831,198,222 | |
Non-controlled affiliated issuers (cost $394,272,464) (Note 2) | | | 314,533,007 | |
Cash | | | 681,234,837 | |
Cash denominated in foreign currency (cost $1,091,653) | | | 1,091,653 | |
Receivable for investments sold | | | 76,804,250 | |
Receivable for fund shares sold | | | 41,372,158 | |
Unrealized appreciation on forward currency contracts (Note 7) | | | 7,943,726 | |
Dividends receivable | | | 74,910,595 | |
Dividend and interest reclaim receivable | | | 48,258,187 | |
Interest receivable | | | 207 | |
Prepaid expenses and other assets | | | 308,286 | |
| | | | |
Total Assets | | | 24,077,655,128 | |
| | | | |
| |
LIABILITIES | | | | |
Payable for investments purchased | | | 6,236,417 | |
Payable for fund shares redeemed | | | 97,740,270 | |
Unrealized depreciation on forward currency contracts (Note 7) | | | 70,934,904 | |
Payable to investment advisor and other affiliates (Note 3) | | | 17,731,219 | |
Accounts payable and accrued expenses | | | 9,959,085 | |
| | | | |
Total Liabilities | | | 202,601,895 | |
| | | | |
| |
NET ASSETS | | $ | 23,875,053,233 | |
| | | | |
NET ASSETS CONSIST OF | | | | |
Undistributed net investment income | | $ | 56,437,435 | |
Net unrealized appreciation on investments | | | 5,545,301,638 | |
Accumulated net realized gain (loss) | | | (1,958,104,656 | ) |
Net capital paid in on shares of beneficial interest | | | 20,231,418,816 | |
| | | | |
| | $ | 23,875,053,233 | |
| | | | |
14 Certified Semi-Annual Report
| | |
| STATEMENT OF ASSETS AND LIABILITIES, CONTINUED | | |
| |
Thornburg International Value Fund | | March 31, 2014 (Unaudited) |
| | | | |
NET ASSET VALUE | | | | |
Class A Shares: | | | | |
Net asset value and redemption price per share ($3,960,003,796 applicable to 132,419,949 shares of beneficial interest outstanding - Note 4) | | $ | 29.90 | |
Maximum sales charge, 4.50% of offering price | | | 1.41 | |
| | | | |
Maximum offering price per share | | $ | 31.31 | |
| | | | |
| |
Class B Shares: | | | | |
Net asset value per share* ($24,201,331 applicable to 873,482 shares of beneficial interest outstanding - Note 4) | | $ | 27.71 | |
| | | | |
| |
Class C Shares: | | | | |
Net asset value and offering price per share* ($1,052,618,124 applicable to 37,769,493 shares of beneficial interest outstanding - Note 4) | | $ | 27.87 | |
| | | | |
| |
Class I Shares: | | | | |
Net asset value, offering and redemption price per share ($11,481,004,018 applicable to 375,495,469 shares of beneficial interest outstanding - Note 4) | | $ | 30.58 | |
| | | | |
| |
Class R3 Shares: | | | | |
Net asset value, offering and redemption price per share ($950,591,135 applicable to 31,790,894 shares of beneficial interest outstanding - Note 4) | | $ | 29.90 | |
| | | | |
| |
Class R4 Shares: | | | | |
Net asset value, offering and redemption price per share ($1,086,101,961 applicable to 36,488,816 shares of beneficial interest outstanding - Note 4) | | $ | 29.77 | |
| | | | |
| |
Class R5 Shares: | | | | |
Net asset value, offering and redemption price per share ($3,688,706,656 applicable to 120,840,261 shares of beneficial interest outstanding - Note 4) | | $ | 30.53 | |
| | | | |
| |
Class R6 Shares: | | | | |
Net asset value, offering and redemption price per share ($1,631,826,212 applicable to 53,446,695 shares of beneficial interest outstanding - Note 4) | | $ | 30.53 | |
| | | | |
| * | Redemption price per share is equal to net asset value less any applicable contingent deferred sales charge. |
See notes to financial statements.
Certified Semi-Annual Report 15
| | |
| STATEMENT OF OPERATIONS | | |
| |
Thornburg International Value Fund | | Six Months Ended March 31, 2014 (Unaudited) |
| | | | |
INVESTMENT INCOME | | | | |
Dividend income | | | | |
Non-affiliated issuers (net of foreign taxes withheld of $19,759,621) | | $ | 195,653,007 | |
Interest income | | | 527,867 | |
| | | | |
Total Income | | | 196,180,874 | |
| | | | |
| |
EXPENSES | | | | |
Investment advisory fees (Note 3) | | | 92,928,415 | |
Administration fees (Note 3) | | | | |
Class A Shares | | | 3,015,426 | |
Class B Shares | | | 18,387 | |
Class C Shares | | | 710,826 | |
Class I Shares | | | 3,310,252 | |
Class R3 Shares | | | 668,044 | |
Class R4 Shares | | | 769,154 | |
Class R5 Shares | | | 1,011,422 | |
Distribution and service fees (Note 3) | | | | |
Class A Shares | | | 6,094,116 | |
Class B Shares | | | 147,091 | |
Class C Shares | | | 5,687,125 | |
Class R3 Shares | | | 2,663,054 | |
Class R4 Shares | | | 1,542,659 | |
Transfer agent fees | | | | |
Class A Shares | | | 3,486,993 | |
Class B Shares | | | 33,320 | |
Class C Shares | | | 759,750 | |
Class I Shares | | | 5,217,300 | |
Class R3 Shares | | | 1,349,500 | |
Class R4 Shares | | | 2,056,560 | |
Class R5 Shares | | | 5,255,552 | |
Class R6 Shares | | | 3,547 | |
Registration and filing fees | | | | |
Class A Shares | | | 27,268 | |
Class B Shares | | | 8,137 | |
Class C Shares | | | 10,647 | |
Class I Shares | | | 138,670 | |
Class R3 Shares | | | 11,869 | |
Class R4 Shares | | | 17,118 | |
Class R5 Shares | | | 19,006 | |
Class R6 Shares | | | 22,154 | |
Custodian fees (Note 3) | | | 3,529,707 | |
Professional fees | | | 174,310 | |
Accounting fees | | | 442,700 | |
Trustee fees | | | 451,700 | |
Other expenses | | | 1,133,090 | |
| | | | |
Total Expenses | | | 142,714,869 | |
Less: | | | | |
Expenses reimbursed by investment advisor (Note 3) | | | (2,938,277 | ) |
Fees paid indirectly (Note 3) | | | (40,707 | ) |
| | | | |
Net Expenses | | | 139,735,885 | |
| | | | |
Net Investment Income | | $ | 56,444,989 | |
| | | | |
16 Certified Semi-Annual Report
| | |
| STATEMENT OF OPERATIONS, CONTINUED | | |
| |
Thornburg International Value Fund | | Six Months Ended March 31, 2014 (Unaudited) |
| | | | |
REALIZED AND UNREALIZED GAIN (LOSS) | | | | |
Net realized gain (loss) from: | | | | |
Investments | | | | |
Non-affiliated issuers | | $ | 1,462,391,779 | |
Non-controlled affiliated issuers | | | (6,997,353 | ) |
Forward currency contracts (Note 7) | | | 8,907,373 | |
Foreign currency transactions | | | (6,534,064 | ) |
| | | | |
| | | 1,457,767,735 | |
| | | | |
Net change in unrealized appreciation (depreciation) on: | | | | |
Investments | | | | |
Non-affiliated issuers | | | (1,633,520,377 | ) |
Non-controlled affiliated issuers | | | (49,229,691 | ) |
Foreign currency contracts (Note 7) | | | 36,993,689 | |
Forward currency translations | | | 735,492 | |
| | | | |
| | | (1,645,020,887 | ) |
| | | | |
Net Realized and Unrealized Loss | | | (187,253,152 | ) |
| | | | |
Net Decrease in Net Assets Resulting from Operations | | $ | (130,808,163 | ) |
| | | | |
See notes to financial statements.
Certified Semi-Annual Report 17
| | |
| STATEMENTS OF CHANGES IN NET ASSETS | | |
| |
Thornburg International Value Fund | | |
| | | | | | | | |
| | | Six Months Ended
March 31, 2014* | | | Year Ended
September 30, 2013 | |
INCREASE (DECREASE) IN NET ASSETS FROM | | | | | | | | |
| | |
OPERATIONS | | | | | | | | |
Net investment income | | $ | 56,444,989 | | | $ | 323,515,655 | |
Net realized gain (loss) on investments, forward currency contracts, and foreign currency transactions | | | 1,457,767,735 | | | | 1,613,463,236 | |
Net realized appreciation (depreciation) on investments, forward currency contracts, and foreign currency translations | | | (1,645,020,887 | ) | | | 2,423,863,558 | |
| | | | | | | | |
| | |
Net Increase (Decrease) in Net Assets Resulting from Operations | | | (130,808,163 | ) | | | 4,360,842,449 | |
| | |
DIVIDENDS TO SHAREHOLDERS | | | | | | | | |
From net investment income | | | | | | | | |
Class A Shares | | | — | | | | (43,423,103 | ) |
Class B Shares | | | — | | | | (135,243 | ) |
Class C Shares | | | — | | | | (5,193,481 | ) |
Class I Shares | | | (11,017,765 | ) | | | (182,275,885 | ) |
Class R3 Shares | | | — | | | | (7,770,990 | ) |
Class R4 Shares | | | — | | | | (11,150,837 | ) |
Class R5 Shares | | | (1,900,263 | ) | | | (51,989,824 | ) |
Class R6 Shares | | | (1,911,867 | ) | | | (16,473,662 | ) |
| | |
FUND SHARE TRANSACTIONS (NOTE 4) | | | | | | | | |
Class A Shares | | | (1,227,277,187 | ) | | | (987,000,465 | ) |
Class B Shares | | | (9,090,568 | ) | | | (15,869,634 | ) |
Class C Shares | | | (117,296,494 | ) | | | (243,715,095 | ) |
Class I Shares | | | (3,054,067,136 | ) | | | 162,757,464 | |
Class R3 Shares | | | (195,513,742 | ) | | | (351,918,980 | ) |
Class R4 Shares | | | (251,173,917 | ) | | | (350,116,790 | ) |
Class R5 Shares | | | (670,811,808 | ) | | | (789,848,411 | ) |
Class R6 Shares | | | 298,307,894 | | | | 737,341,228 | |
| | | | | | | | |
Net Increase (Decrease) in Net Assets | | | (5,372,561,016 | ) | | | 2,204,058,741 | |
| | |
NET ASSETS | | | | | | | | |
Beginning of Period | | | 29,247,614,249 | | | | 27,043,555,508 | |
| | | | | | | | |
| | |
End of Period | | $ | 23,875,053,233 | | | $ | 29,247,614,249 | |
| | | | | | | | |
Undistributed net investment income | | $ | 56,437,435 | | | $ | 14,822,341 | |
See notes to financial statements.
18 Certified Semi-Annual Report
| | |
| NOTES TO FINANCIAL STATEMENTS | | |
| |
Thornburg International Value Fund | | March 31, 2014 (Unaudited) |
NOTE 1 – ORGANIZATION
Thornburg International Value Fund, hereinafter referred to as the “Fund,” is a diversified series of Thornburg Investment Trust (the “Trust”). The Trust is organized as a Massachusetts business trust under a Declaration of Trust dated June 3, 1987 and is registered as a diversified, open-end management investment company under the Investment Company Act of 1940, as amended. The Fund is currently one of eighteen separate series of the Trust. Each series is considered to be a separate entity for financial reporting and tax purposes and bears expenses directly attributable to it. The Fund seeks long-term capital appreciation by investing in equity and debt securities of all types. As a secondary objective, the Fund also seeks some current income.
The Fund currently has eight classes of shares of beneficial interest: Class A, Class B, Class C, Institutional Class (“Class I”), and Retirement Classes (“Class R3,” “Class R4,” “Class R5,” and “Class R6”). The Fund no longer offers Class B shares for sale. Each class of shares of the Fund represents an interest in the same portfolio of investments, except that (i) Class A shares are sold subject to a front-end sales charge collected at the time the shares are purchased and bear a service fee, (ii) Class B shares were sold at net asset value without a sales charge at the time of purchase, but are subject to a contingent deferred sales charge upon redemption and bear both a service fee and distribution fee, (iii) Class C shares are sold at net asset value without a sales charge at the time of purchase, but are subject to a contingent deferred sales charge upon redemption within one year of purchase, and bear both a service fee and a distribution fee, (iv) Class I and Class R5 shares are sold at net asset value without a sales charge at the time of purchase and may be subject to a service fee, (v) Class R3 shares are sold at net asset value without a sales charge at the time of purchase, but bear both a service fee and distribution fee, (vi) Class R4 shares are sold at net asset value without a sales charge at the time of purchase, but bear a service fee, (vii) Class R6 shares are sold at net asset value without a sales charge at the time of purchase, and (viii) the respective classes may have different reinvestment privileges and conversion rights. Additionally, the Fund may allocate among its classes certain expenses, to the extent allocable to specific classes, including transfer agent fees, government registration fees, certain printing and postage costs, and administrative and legal expenses. Currently, class specific expenses of the Fund are limited to service and distribution fees, administration fees, and certain registration and transfer agent expenses. Class B shares of the Fund outstanding for eight years will convert to Class A shares of the Fund.
NOTE 2 – SIGNIFICANT ACCOUNTING POLICIES
Significant accounting policies of the Trust are as follows:
Valuation Policy and Procedures: The Fund’s Trustees of the Trust (the “Trustees”) have authorized employees of the Fund’s investment advisor, acting as the Valuation and Pricing Committee (the “Committee”), to make certain valuation determinations, subject to oversight and review by the Trustees and the Audit Committee of the Trustees. The Committee and other employees of the Fund’s investment advisor administer and implement the valuation process. The Committee regularly reviews its own fair value decisions, as well as valuations, valuation techniques and services furnished by pricing services, considers circumstances in the markets which may require valuation determinations by the Committee and reviews previous valuation determinations. The Committee also reports on its activities, the performance of the pricing services and other matters to the Trustees and the Audit Committee of the Trustees.
In determining a fair value for a portfolio investment, the Committee seeks to determine the price that the Fund would reasonably expect to receive upon a sale of the investment in an orderly transaction between market participants at the measurement date. Typically, the fair value process employs standing instructions to use quoted prices in active markets or the use of independent pricing services. Less frequently, the Committee may make a fair value determination using other methods. However, because fair value prices are estimated prices, the determination of fair value for an investment may differ from the value that would be realized by the Fund upon a sale of the investment, and that difference could be material to the Fund’s financial statements. The Committee’s determination of fair value for an investment may also differ from the prices obtained by other persons (including other mutual funds) for the investment.
Valuation of Investments: Portfolio investments listed or traded on a national securities exchange are valued on the valuation date at the last reported trade price on the exchange that is the primary market for the investment. Portfolio investments traded on an exchange for which there has been no trade that day and other equity investments traded in the over-the-counter market are valued at the mean between the last reported bid and ask prices. Portfolio investments reported by NASDAQ are valued at the NASDAQ official closing price. Any foreign investment traded on exchanges outside the United States is valued at the price of the investment on the exchange that is normally the investment’s primary market, as of the close of that exchange preceding the time of the Fund’s valuation measurement date.
In any case when the market value of an equity investment held by the Fund is not readily available, a determination of a fair value for the investment is made by the Committee. The Committee’s determinations are made using procedures in accordance with a policy approved by the Trustees, which may include the use of a price obtained from an independent pricing service. The pricing service ordinarily values equity investments in these instances using multi-factor models to adjust market prices based upon various inputs, including exchange data, depository receipt prices, futures, index data and other data. An investment’s market value is deemed not readily available whenever the exchange or market on which the investment is primarily traded is closed for the entire scheduled day of trading. Additionally, an investment’s market value may be deemed not readily available under other circumstances identified by the
Certified Semi-Annual Report 19
| | |
| NOTES TO FINANCIAL STATEMENTS, CONTINUED | | |
| |
Thornburg International Value Fund | | March 31, 2014 (Unaudited) |
Trustees, including when developments occurring after the most recent close of the investment’s primary exchange or market, but before the most recent close of trading in Fund shares, or an unusual event or significant period of time occurring since the availability of a market quotation, create a question about the reliability of the investment’s market value. On days when market volatility thresholds pre-determined by the Trustees are exceeded, foreign equity investments held by the Fund may be valued using synthetic pricing obtained from an independent pricing service approved by the Trustees, subject to the ability of the Committee to determine in any such instance to utilize market closing prices if the Committee considers closing prices to be more reliable.
Debt obligations held by the Fund have a primary over-the-counter market and are valued by an independent pricing service approved by the Trustees. The pricing service ordinarily values debt obligations at quoted bid prices. When quotations are not available, debt obligations held by the Fund are valued at evaluated prices determined by the pricing service using methods which include consideration of yields or prices of debt obligations of comparable quality, type of issue, coupon, maturity and rating, and indications as to value from dealers and general market conditions. Short-term obligations having remaining maturities of 60 days or less are ordinarily valued at amortized cost, which approximates market value.
In any case when a pricing service fails to provide a price for a debt obligation held by the Fund, the Committee determines a fair value for the debt obligation using procedures in accordance with a policy approved by the Trustees, which may include the use of a price obtained from a different independent pricing service. Additionally, in any case when management believes that a price provided by a pricing service for a debt obligation held by the Fund may be unreliable, the Committee decides whether or not to use the pricing service’s valuation or to use an alternative method to determine a fair value for the debt obligation.
Quotations in foreign currencies for foreign portfolio investments are converted to U.S. dollar equivalents using the foreign exchange quotation in effect at the time of valuation.
Valuation Measurements: The Fund categorizes its investments based upon the inputs used in valuing those investments, according to a three-level hierarchy established by guidance from the Financial Accounting Standards Board (the “FASB”). Categorization of investments using this hierarchy is intended by the FASB to maximize the use of observable inputs and minimize the use of unobservable inputs by prioritizing that the most observable input be used when available. Observable inputs are those that market participants would use in valuing an investment based on available market data. Unobservable inputs are those that reflect assumptions about the information market participants would use in valuing an investment. An investment’s level within the hierarchy is based on the lowest level input that is deemed significant to the fair value measurement. The methodologies and relative inputs used to value investments are not necessarily indications of the risk or liquidity associated with investing in those investments.
Various inputs are used in determining the fair value measurement of the Fund’s investments. These inputs are generally summarized according to the three-level hierarchy below:
Level 1: Quoted prices in active markets for identical investments.
Level 2: Other direct or indirect significant observable inputs (including quoted prices for similar investments in active markets and other observable inputs, such as interest rates, prepayment rates, credit risk, etc.).
When market volatility thresholds are exceeded, foreign equity investments may be fair valued according to other significant observable inputs rather than quoted market prices. The affected investments will be characterized as Level 2 within the valuation hierarchy and revert to Level 1 after the threshold is no longer exceeded.
Level 3: Significant unobservable inputs, (including the Committee’s own assumptions in determining the fair value of investments), are generally applicable to investments fair valued with single broker quotes and other investments.
Portfolio investments with minimal, if any, market activity are characterized as Level 3 and are valued using significant unobservable inputs, typically including single broker quotes, which may be adjusted or unadjusted, related or comparable investments, last available transactions, and other relevant information. Valuations may also be based upon current market prices of securities that are comparable in coupon, rating, maturity and industry. An income based valuation approach would consider discounted anticipated future cash flows of the investment. Discounts may also be applied due to the nature or duration of any restrictions on the disposition of the investment. The derived value of a Level 3 investment may not represent the value which is received upon disposition.
The following table displays a summary of the fair value hierarchy measurements of the Fund’s investments as of March 31, 2014. In any instance when valuation inputs from more than one level are used to determine the fair value of a specific investment, the investment is placed in the level of the table based upon the lowest level input that is significant in determining the fair value of the investment:
20 Certified Semi-Annual Report
| | |
| NOTES TO FINANCIAL STATEMENTS, CONTINUED | | |
| |
Thornburg International Value Fund | | March 31, 2014 (Unaudited) |
| | | | | | | | | | | | | | | | |
| | | Fair Value Measurements at March 31, 2014 | |
| | | Total | | | Level 1 | | | Level 2 | | | Level 3 | |
Assets | | | | | | | | | | | | | | | | |
Investments in Securities* | | | | | | | | | | | | | | | | |
Common Stock | | $ | 22,864,199,129 | | | $ | 22,864,199,129 | | | $ | — | | | $ | — | |
Rights | | | 6,310,100 | | | | 6,310,100 | | | | — | | | | — | |
Short Term Investments | | | 275,222,000 | | | | — | | | | 275,222,000 | | | | — | |
| | | | | | | | | | | | | | | | |
Total Investments in Securities | | $ | 23,145,731,229 | | | $ | 22,870,509,229 | | | $ | 275,222,000 | | | $ | — | |
| | | | |
Other Financial Instruments** | | | | | | | | | | | | | | | | |
Forward Currency Contracts | | $ | 7,943,726 | | | $ | — | | | $ | 7,943,726 | | | $ | — | |
Spot Currency | | $ | 207,738 | | | $ | 207,738 | | | $ | — | | | $ | — | |
| | | | |
Liabilities | | | | | | | | | | | | | | | | |
Other Financial Instruments** | | | | | | | | | | | | | | | | |
Forward Currency Contracts | | $ | (70,934,904 | ) | | $ | — | | | $ | (70,934,904 | ) | | $ | — | |
Spot Currency | | $ | (553 | ) | | $ | (553 | ) | | $ | — | | | $ | — | |
| * | See Schedule of Investments for a summary of the industry exposure as grouped according to the Global Industry Classification Standard (GICS), which is an industry taxonomy developed by MSCI, Inc. and Standard & Poor’s (S&P). |
| ** | Other Financial Instruments include investments not reflected in the Schedule of Investments, which may include futures, forwards and swap contracts, which are valued at the unrealized appreciation (depreciation) on the investment. |
In accordance with the guidance prescribed in Accounting Standards Update No. 2011-04, it is the policy of the Fund to recognize transfers between levels and those underlying events which caused the movement. The Fund recognized no transfers between levels for the six months ended March 31, 2014, other than when the Fund exceeded market volatility thresholds for foreign equity investments during the period.
Foreign Currency Translation: Portfolio investments and other assets and liabilities denominated in foreign currencies are translated into U.S. dollars based on the exchange rate of such currencies against the U.S. dollar on the date of valuation. Purchases and sales of investments and income items denominated in foreign currencies are translated into U.S. dollars at the exchange rate in effect on the transaction date. When the Fund purchases or sells foreign investments, it will customarily enter into a foreign exchange contract to minimize foreign exchange risk from the trade date to the settlement date of such transactions. The values of such spot contracts are included in receivable for investments sold and payable for investments purchased on the Statement of Assets and Liabilities.
The Fund does not separately report the effect of changes in foreign exchange rates from changes in market prices on investments held. Such changes are included in net unrealized appreciation or depreciation from investments.
Reported net realized gains or losses from foreign currency transactions arise due to purchases and sales of foreign currencies, currency gains or losses realized between the trade and settlement dates on investment transactions and the difference between the amounts of dividends, interest, and foreign withholding taxes recorded on the Fund’s books, and the U.S. dollar equivalent of the amounts actually received or paid.
Net change in unrealized appreciation and depreciation on foreign currency translations arise from changes in the fair value of assets and liabilities, other than investments at fiscal period end, resulting from changes in exchange rates.
Deferred Taxes: The Fund is subject to a tax imposed on net realized gains of securities of certain foreign countries. The Fund records an estimated deferred tax liability for net unrealized gains on these investments as reflected in the accompanying financial statements.
Federal Income Taxes: It is the policy of the Trust to comply with the provisions of the Internal Revenue Code applicable to “regulated investment companies” and to distribute to shareholders substantially all taxable income, including any net realized gain on investments of the Fund. Therefore, no provision for federal income taxes is required.
Management reviews each uncertain tax position believed to be material to the preparation of the Fund’s financial statements, to assess if it is more likely than not that the position would be sustained upon examination, based upon the technical merits of the position. As of March 31, 2014, management has not identified any such position for which an asset or liability must be reflected in the Statement of Assets and Liabilities. The Fund’s tax returns remain subject to examination for three years after filing.
When-Issued and Delayed Delivery Transactions: The Fund may engage in when-issued or delayed delivery transactions. To the extent the Fund engages in such transactions, it will do so for the purpose of acquiring portfolio investments consistent with the Fund’s investment objectives and not for the purpose of investment leverage or to speculate on interest rate and/or market changes. At the time the
Certified Semi-Annual Report 21
| | |
| NOTES TO FINANCIAL STATEMENTS, CONTINUED | | |
| |
Thornburg International Value Fund | | March 31, 2014 (Unaudited) |
Fund makes a commitment to purchase an investment on a when-issued or delayed delivery basis, the Fund will record the transaction and reflect the value in determining its net asset value. When effecting such transactions, assets of an amount sufficient to make payment for the portfolio investments to be purchased will be segregated on the Fund’s records on the trade date. Investments purchased on a when-issued or delayed delivery basis do not earn interest until the settlement date.
Dividends: Dividends to shareholders, if any, are generally paid quarterly and are reinvested in additional shares of the Fund at net asset value per share at the close of business on the dividend payment date or, at the shareholder’s option, paid in cash. Net realized capital gains, to the extent available, will be distributed at least annually. Distributions to shareholders are based on income tax regulations and therefore, their characteristics may differ for financial statement and tax purposes.
Repurchase Agreements: The Fund may invest excess cash in repurchase agreements whereby the Fund purchases investments, which serve as collateral, with an agreement to resell such collateral to the seller at an agreed upon price at the maturity date of the repurchase agreement. Investments pledged as collateral for repurchase agreements are held in custody until maturity of the repurchase agreement. Provisions in the agreements require that the market value of the collateral is at least equal to the repurchase value in the event of default. In the event of default, the Fund has the right to liquidate the collateral and apply the proceeds in satisfaction of the obligation. Under certain circumstances, in the event of default or bankruptcy by the other party to the agreement, realization and/ or retention of the collateral may be subject to legal proceedings.
General: Investment transactions are accounted for on a trade date basis. Interest income is accrued as earned and dividend income is recorded on the ex-dividend date. Certain income from foreign investments is recognized as soon as information is available to the Fund. Realized gains and losses from the sale of investments are recorded on an identified cost basis. Net investment income (other than class specific expenses) and realized and unrealized gains and losses are allocated daily to each class of shares based upon the relative net asset value of outstanding shares of each class of shares at the beginning of the day (after adjusting for the current share activity of the respective class). Expenses common to all Funds are allocated among the Funds comprising the Trust based upon their relative net asset values or other appropriate allocation methods.
Guarantees and Indemnifications: Under the Trust’s organizational documents (and under separate agreements with the independent Trustees), its officers and Trustees are indemnified against certain liabilities arising out of the performance of their duties to the Fund. Additionally, in the normal course of business the Trust enters into contracts with service providers that contain general indemnification clauses. The Trust’s maximum exposure under these arrangements is unknown. However, based on experience, the Trust expects the risk of loss to be remote.
Use of Estimates: The preparation of financial statements, in conformity with United States generally accepted accounting principles, requires management to make estimates and assumptions that affect the reported amounts of assets and liabilities and the disclosure of contingent assets and liabilities at the date of the financial statements and the reported amounts of increases and decreases in net assets from operations during the reporting period. Actual amounts could differ from those estimates.
NOTE 3 – INVESTMENT ADVISORY FEE AND OTHER TRANSACTIONS WITH AFFILIATES
Pursuant to an investment advisory agreement, Thornburg Investment Management, Inc. (the “Advisor”) serves as the investment advisor and performs services for the Fund for which the fees are payable at the end of each month. For the six months ended March 31, 2014, these fees were payable at annual rates ranging from .875 of 1% to .675 of 1% per annum of the average daily net assets of the Fund depending on the Fund’s asset size. The Trust also has entered into administrative services agreements with the Advisor, whereby the Advisor will perform certain administrative services for the shareholders of each class of the Fund’s shares (except for Class R6 shares, which do not have an administrative services agreement) and for which fees will be payable at an annual rate of up to .125 of 1% per annum of the average daily net assets attributable to each class of shares.
The Trust has an underwriting agreement with Thornburg Securities Corporation (the “Distributor,” an affiliate of the Advisor), which acts as the distributor of the Fund’s shares. For the six months ended March 31, 2014, the Distributor has advised the Fund that it earned net commissions aggregating $57,160 from the sale of Class A shares, and collected contingent deferred sales charges aggregating $22,907 from redemptions of Class C shares of the Fund.
Pursuant to a service plan under Rule 12b-1 of the Investment Company Act of 1940, the Fund may reimburse to the Advisor an amount not to exceed .25 of 1% per annum of the average daily net assets attributable to each class of shares of the Fund (except for Class R6 shares, which do not have a Rule 12b-1 service plan) for payments made by the Advisor to securities dealers and other financial institutions to obtain various shareholder and distribution related services. For the six months ended March 31, 2014, there were no 12b-1 service plan fees charged for Class I and R5 shares. The Advisor may pay out of its own resources additional expenses for distribution of the Fund’s shares.
The Trust has also adopted distribution plans pursuant to Rule 12b-1, applicable only to the Fund’s Class B, Class C, and Class R3 shares, under which the Fund compensates the Distributor for services in promoting the sale of Class B, Class C, and Class R3 shares
22 Certified Semi-Annual Report
| | |
| NOTES TO FINANCIAL STATEMENTS, CONTINUED | | |
| |
Thornburg International Value Fund | | March 31, 2014 (Unaudited) |
of the Fund at an annual rate of up to .75 of 1% per annum of the average daily net assets attributable to Class B and Class C shares, and an annual rate of up to .25 of 1% per annum of the average daily net assets attributable to Class R3 shares. Total fees incurred by each class of shares of the Fund under their respective service and distribution plans for the six months ended March 31, 2014, are set forth in the Statement of Operations.
The Advisor and Distributor have contractually agreed to waive fees and reimburse expenses incurred by the Fund so that actual expenses of certain share classes do not exceed specified levels. The agreement may be terminated by the Fund at any time, but may not be terminated by the Advisor or Distributor before February 1, 2015, unless the Advisor ceases to be the investment advisor to the Fund or the Distributor ceases to be the distributor of the Fund prior to that date. The Advisor and Distributor retain the right to be repaid by the Fund for fee waivers and expense reimbursements if expenses fall below the contractual limit prior to the end of the fiscal year.
For the six months ended March 31, 2014, the Advisor contractually reimbursed certain class specific expenses, administrative fees, and distribution fees of $827,883 for Class R3 shares, $1,161,558 for Class R4 shares, and $948,836 for Class R5 shares.
The Trust has an agreement with the custodian bank to indirectly pay a portion of the custodian’s fees through credits earned by the Fund’s cash on deposit with the bank. This deposit agreement is an alternative to overnight investments. Custodial fees are adjusted to reflect amounts that would have been paid without this agreement, with a corresponding adjustment reflected as fees paid indirectly in the Statement of Operations. For the six months ended March 31, 2014, fees paid indirectly were $40,707.
Certain officers and Trustees of the Trust are also officers or directors of the Advisor and Distributor. The compensation of independent Trustees is borne by the Trust.
NOTE 4 – SHARES OF BENEFICIAL INTEREST
At March 31, 2014, there were an unlimited number of shares of beneficial interest authorized. Transactions in shares of beneficial interest were as follows:
| | | | | | | | | | | | | | | | |
| | | Six Months Ended
March 31, 2014 (Unaudited) | | | Year Ended
September 30, 2013 (Audited) | |
| | | Shares | | | Amount | | | Shares | | | Amount | |
Class A Shares | | | | | | | | | | | | | | | | |
Shares sold | | | 11,913,196 | | | $ | 360,591,794 | | | | 33,281,289 | | | $ | 934,420,102 | |
Shares issued to shareholders in reinvestment of dividends | | | — | | | | — | | | | 1,439,461 | | | | 39,862,622 | |
Shares repurchased | | | (52,587,449 | ) | | | (1,587,868,981 | ) | | | (69,820,089 | ) | | | (1,961,283,189 | ) |
| | | | | | | | | | | | | | | | |
| | | | |
Net increase (decrease) | | | (40,674,253 | ) | | $ | (1,227,277,187 | ) | | | (35,099,339 | ) | | $ | (987,000,465 | ) |
| | | | | | | | | | | | | | | | |
| | | | |
Class B Shares | | | | | | | | | | | | | | | | |
Shares sold | | | 925 | | | $ | 26,700 | | | | 11,496 | | | $ | 294,911 | |
Shares issued to shareholders in reinvestment of dividends | | | — | | | | — | | | | 3,696 | | | | 92,758 | |
Shares repurchased | | | (325,030 | ) | | | (9,117,268 | ) | | | (623,836 | ) | | | (16,257,303 | ) |
| | | | | | | | | | | | | | | | |
| | | | |
Net increase (decrease) | | | (324,105 | ) | | $ | (9,090,568 | ) | | | (608,644 | ) | | $ | (15,869,634 | ) |
| | | | | | | | | | | | | | | | |
| | | | |
Class C Shares | | | | | | | | | | | | | | | | |
Shares sold | | | 1,208,681 | | | $ | 34,183,014 | | | | 2,906,313 | | | $ | 76,626,452 | |
Shares issued to shareholders in reinvestment of dividends | | | — | | | | — | | | | 151,395 | | | | 3,840,256 | |
Shares repurchased | | | (5,379,723 | ) | | | (151,479,508 | ) | | | (12,367,528 | ) | | | (324,181,803 | ) |
| | | | | | | | | | | | | | | | |
| | | | |
Net increase (decrease) | | | (4,171,042 | ) | | $ | (117,296,494 | ) | | $ | (9,309,820 | ) | | $ | (243,715,095 | ) |
| | | | | | | | | | | | | | | | |
| | | | |
Class I Shares | | | | | | | | | | | | | | | | |
Shares sold | | | 65,478,957 | | | $ | 2,024,282,927 | | | | 157,447,422 | | | $ | 4,532,061,713 | |
Shares issued to shareholders in reinvestment of dividends | | | 286,221 | | | | 9,010,229 | | | | 5,248,430 | | | | 149,632,653 | |
Shares repurchased | | | (165,037,848 | ) | | | (5,087,360,292 | ) | | | (157,064,440 | ) | | | (4,518,936,902 | ) |
| | | | | | | | | | | | | | | | |
| | | | |
Net increase (decrease) | | | (99,272,670 | ) | | $ | (3,054,067,136 | ) | | | 5,631,412 | | | $ | 162,757,464 | |
| | | | | | | | | | | | | | | | |
Certified Semi-Annual Report 23
| | |
| NOTES TO FINANCIAL STATEMENTS, CONTINUED | | |
| |
Thornburg International Value Fund | | March 31, 2014 (Unaudited) |
| | | | | | | | | | | | | | | | |
| | | Six Months Ended
March 31, 2014 (Unaudited) | | | Year Ended
September 30, 2013 (Audited) | |
| | | Shares | | | Amount | | | Shares | | | Amount | |
Class R3 Shares | | | | | | | | | | | | | | | | |
Shares sold | | | 3,379,396 | | | $ | 102,301,614 | | | | 8,044,211 | | | $ | 225,644,378 | |
Shares issued to shareholders in reinvestment of dividends | | | — | | | | — | | | | 264,385 | | | | 7,292,297 | |
Shares repurchased | | | (9,833,922 | ) | | | (297,815,356 | ) | | | (20,769,217 | ) | | | (584,855,655 | ) |
| | | | | | | | | | | | | | | | |
| | | | |
Net increase (decrease) | | | (6,454,526 | ) | | $ | (195,513,742 | ) | | | (12,460,621 | ) | | $ | (351,918,980 | ) |
| | | | | | | | | | | | | | | | |
| | | | |
Class R4 Shares | | | | | | | | | | | | | | | | |
Shares sold | | | 5,043,891 | | | $ | 151,791,350 | | | | 13,283,270 | | | $ | 371,895,750 | |
Shares issued to shareholders in reinvestment of dividends | | | — | | | | — | | | | 323,914 | | | | 8,936,132 | |
Shares repurchased | | | (13,355,182 | ) | | | (402,965,267 | ) | | | (26,439,756 | ) | | | (730,948,672 | ) |
| | | | | | | | | | | | | | | | |
| | | | |
Net increase (decrease) | | | (8,311,291 | ) | | $ | (251,173,917 | ) | | | (12,832,572 | ) | | $ | (350,116,790 | ) |
| | | | | | | | | | | | | | | | |
| | | | |
Class R5 Shares | | | | | | | | | | | | | | | | |
Shares sold | | | 12,608,362 | | | $ | 389,216,857 | | | | 35,326,999 | | | $ | 1,001,908,594 | |
Shares issued to shareholders in reinvestment of dividends | | | 57,338 | | | | 1,802,134 | | | | 1,744,635 | | | | 49,503,898 | |
Shares repurchased | | | (34,315,198 | ) | | | (1,061,830,799 | ) | | | (64,140,808 | ) | | | (1,841,260,903 | ) |
| | | | | | | | | | | | | | | | |
| | | | |
Net increase (decrease) | | | (21,649,498 | ) | | $ | (670,811,808 | ) | | | (27,069,174 | ) | | $ | (789,848,411 | ) |
| | | | | | | | | | | | | | | | |
| | | | |
Class R6 Shares | | | | | | | | | | | | | | | | |
Shares sold | | | 16,821,230 | | | $ | 519,244,710 | | | | 30,928,332 | | | $ | 885,306,945 | |
Shares issued to shareholders in reinvestment of dividends | | | 60,528 | | | | 1,901,791 | | | | 572,781 | | | | 16,354,593 | |
Shares repurchased | | | (7,263,402 | ) | | | (222,838,607 | ) | | | (5,631,004 | ) | | | (164,320,310 | ) |
| | | | | | | | | | | | | | | | |
| | | | |
Net increase (decrease) | | | 9,618,356 | | | $ | 298,307,894 | | | | 25,870,109 | | | $ | 737,341,228 | |
| | | | | | | | | | | | | | | | |
NOTE 5 – INVESTMENT TRANSACTIONS
For the six months ended March 31, 2014, the Fund had purchase and sale transactions of investments (excluding short-term investments) of $4,263,179,246 and $9,588,603,913, respectively.
NOTE 6 – INCOME TAXES
At March 31, 2014, information on the tax components of capital was as follows:
| | | | |
Cost of investments for tax purposes | | $ | 17,538,935,822 | |
| | | | |
Gross unrealized appreciation on a tax basis | | $ | 6,026,641,280 | |
Gross unrealized depreciation on a tax basis | | | (419,845,873 | ) |
| | | | |
Net unrealized appreciation (depreciation) on investments (tax basis) | | $ | 5,606,795,407 | |
| | | | |
At March 31, 2014, the Fund had deferred tax basis capital losses occurring subsequent to October 31, 2012 of $40,355,184. For tax purposes, such losses will be reflected in the year ending September 30, 2014.
24 Certified Semi-Annual Report
| | |
| NOTES TO FINANCIAL STATEMENTS, CONTINUED | | |
| |
Thornburg International Value Fund | | March 31, 2014 (Unaudited) |
At March 31, 2014, the Fund had cumulative tax basis capital losses generated prior to October 1, 2011, which may be carried forward to offset future capital gains. To the extent such carryforwards are used, capital gain distributions may be reduced to the extent provided by regulations.
Such capital loss carryforwards expire as follows:
| | | | |
2017 | | $ | 913,543,812 | |
2018 | | | 1,792,171,182 | |
2019 | | | 753,530,754 | |
| | | | |
| | $ | 3,459,245,748 | |
| | | | |
NOTE 7 – DERIVATIVE FINANCIAL INSTRUMENTS WITH OFF-BALANCE SHEET RISK AND FOREIGN INVESTMENT RISK
The Fund may use a variety of derivative financial instruments to hedge or adjust the risks affecting its investment portfolio or to enhance investment returns. Provisions of FASB Accounting Standards Codification 815-10-50 (“ASC 815”), require certain disclosures. The disclosures are intended to provide users of financial statements with an understanding of the use of derivative instruments by the Fund and how these derivatives affect the financial position, financial performance and cash flows of the Fund. The Fund does not designate any derivative instruments as hedging instruments under ASC 815. During the six months ended March 31, 2014, the Fund’s principal exposure to derivative financial instruments of the type addressed by ASC 815 was investment in foreign exchange contracts. A foreign exchange contract is an agreement between two parties to exchange different currencies at a specified rate of exchange at an agreed upon future date. Foreign exchange contracts involve risks to the Fund, including the risk that a contract’s counterparty will not meet its obligations to the Fund, the risk that a change in a contract’s value may not correlate perfectly with the currency the contract was intended to track, and the risk that the advisor is unable to correctly implement its strategy in using a contract. In any such instance, the Fund may not achieve the intended benefit of entering into a contract, and may experience a loss. Additionally, the Fund’s risk of loss may exceed the amounts recognized on the Statement of Assets and Liabilities.
The Fund entered into forward currency contracts during the six months ended March 31, 2014 in the normal course of pursuing its investment objectives, with the objective of reducing the risk to the value of the Fund’s foreign investments from adverse changes in the relationship between the U.S. dollar and foreign currencies. In each case these contracts have been initiated in conjunction with foreign investment transactions.
These contracts are accounted for by the Fund under ASC 815. Unrealized appreciation and depreciation on outstanding contracts are reported in the Fund’s Statement of Assets and Liabilities, as measured by the difference between the forward exchange rates at the reporting date and the forward exchange rates at each contract’s inception date. Net realized gain (loss) on contracts closed during the period, and changes in net unrealized appreciation (depreciation) on outstanding contracts are recognized in the Fund’s Statement of Operations. Values of open sell currency contracts are indicative of the activity for the six months ended March 31, 2014. Open buy currency contracts are entered into for the purpose of closing open sell currency contracts and the values are dependent upon the values of the open sell currency contracts to which they relate.
The following table displays the outstanding forward currency contracts at March 31, 2014:
| | | | | | | | | | | | | | | | | | | | |
| | | | | OUTSTANDING FORWARD CURRENCY CONTRACTS TO BUY OR SELL AT
MARCH 31, 2014 | |
CONTRACT DESCRIPTION | | BUY/SELL | | CONTRACT
AMOUNT | | | CONTRACT
VALUE
DATE | | VALUE
USD | | | UNREALIZED
APPRECIATION | | | UNREALIZED
DEPRECIATION | |
Euro | | Sell | | | 1,177,174,000 | | | 04/28/2014 | | | 1,621,641,429 | | | $ | 3,517,909 | | | $ | — | |
Euro | | Buy | | | 356,737,500 | | | 04/28/2014 | | | 491,431,436 | | | | — | | | | (5,629,830 | ) |
Euro | | Sell | | | 441,531,800 | | | 04/28/2014 | | | 608,241,653 | | | | — | | | | (12,063,340 | ) |
Japanese Yen | | Sell | | | 52,844,867,200 | | | 07/07/2014 | | | 512,247,862 | | | | 4,425,817 | | | | — | |
Japanese Yen | | Buy | | | 74,586,298,300 | | | 07/07/2014 | | | 722,996,837 | | | | — | | | | (13,057,486 | ) |
Japanese Yen | | Sell | | | 275,623,765,900 | | | 07/07/2014 | | | 2,671,738,850 | | | | — | | | | (40,184,248 | ) |
| | | | | | | | | | | | | | | | | | | | |
Total | | | | | | | | | | | | | | $ | 7,943,726 | | | $ | (70,934,904 | ) |
| | | | | | | | | | | | | | | | | | | | |
Certified Semi-Annual Report 25
| | |
| NOTES TO FINANCIAL STATEMENTS, CONTINUED | | |
| |
Thornburg International Value Fund | | March 31, 2014 (Unaudited) |
The foregoing forward currency contracts were entered into pursuant to an International Swaps and Derivatives Association (ISDA) Master Agreement. In the event of a default or termination under the ISDA Master Agreement, the non-defaulting party has the right to close out all outstanding forward currency contracts between the parties and to net any payment amounts under those contracts, resulting in a single net amount payable by one party to the other. Because the ISDA Master Agreement does not result in an offset of reported amounts of financial assets and financial liabilities in the Fund’s Statement of Assets and Liabilities unless there has been an event of default or termination event under that agreement, the Fund does not net its outstanding forward currency contracts for purposes of the disclosure in the Fund’s Statement of Assets and Liabilities. Instead the Fund recognizes the unrealized appreciation or depreciation on those forward currency contracts on a gross basis in the Fund’s Statement of Assets and Liabilities. At March 31, 2014, those recognized amounts are disclosed in the following table:
| | | | |
| Fair Values of Derivative Financial Instruments at March 31, 2014 |
Asset Derivatives | | Balance Sheet Location | | Fair Value |
Foreign exchange contracts | | Assets – Unrealized appreciation on forward currency contracts | | $7,943,726 |
| | |
Liability Derivatives | | Balance Sheet Location | | Fair Value |
Foreign exchange contracts | | Liabilities – Unrealized depreciation on forward currency contracts | | $(70,934,904) |
Because the Fund does not currently receive or post cash collateral in connection with its currency forward contracts, and because all of the Fund’s outstanding currency forward contracts are with State Street Bank and Trust Company, the net amounts of the Fund’s assets and liabilities which are attributable to those contracts at March 31, 2014 can be determined by offsetting the dollar amounts shown in the preceding table. Based on those amounts, the net amount of the Fund’s assets which is attributable to its outstanding forward currency contracts at March 31, 2014 is $0, and the net amount of the Fund’s liabilities which is attributable to those contracts at that date is $62,991,178. The Fund’s forward currency contracts are valued each day, and the net amounts of the Fund’s assets and liabilities which are attributable to those contracts are expected to vary over time.
The net realized gain (loss) from forward currency contracts, and the net change in unrealized appreciation (depreciation) of outstanding forward currency contracts recognized in the Fund’s Statement of Operations for the six months ended March 31, 2014 are disclosed in the following tables:
| | | | |
Amount of Net Realized Gain (loss) on Derivative Financial Instruments
Recognized in Income for the Six Months Ended March 31, 2014 |
| | | Total | | Forward Currency Contracts |
Foreign exchange contracts | | $8,907,373 | | $ 8,907,373 |
|
Amount of Net Change in Unrealized Appreciation (Depreciation) of Derivative Financial Instruments
Recognized in Income for the Six Months Ended March 31, 2014 |
| | | Total | | Forward Currency Contracts |
Foreign exchange contracts | | $36,993,689 | | $ 36,993,689 |
OTHER NOTES
Risks: The Fund’s investments subject it to risks including, but not limited to, management risk, market and economic risk, risks affecting specific issuers, liquidity risk, the risks associated with investments in smaller companies and non-U.S. issuers, credit risk, and interest rate risk. Please see the Fund’s prospectus for a discussion of the risks associated with an investment in the Fund.
Subsequent Events: Fund management believes no events have occurred between March 31, 2014 and the date of issuance of the financial statements that require adjustment to or disclosure in the accompanying financial statements.
26 Certified Semi-Annual Report
This page intentionally left blank.
Certified Semi-Annual Report 27
FINANCIAL HIGHLIGHTS
Thornburg International Value Fund
| | | | | | | | | | | | | | | | | | | | | | | | | | | | | | | | | | | | | | | | | | | | | | | | | | | | | | |
| | | PER SHARE PERFORMANCE (for a share outstanding throughout the Period)+ | | RATIOS TO AVERAGE NET ASSETS | | | SUPPLEMENTAL DATA | |
Unless Otherwise Noted, Periods are
Fiscal Years Ended Sept. 30, | | Net Asset
Value
Beginning
of Period | | | Net
Investment
Income
(Loss) | | | Net
Realized
&
Unrealized
Gain (Loss)
on
Investments | | | Total from
Investment
Operations | | | Dividends
from Net
Investment
Income | | | Dividends
from Net
Realized
Gains | | Total
Dividends | | | Net Asset Value End of Period | | Net
Investment
Income
(Loss)
(%) | | | Expenses,
After
Expense
Reductions
(%) | | | Expenses,
After
Expense
Reductions
and
Net of
Custody
Credits
(%) | | | Expenses,
Before
Expense
Reductions
(%) | | | Total
Return
(%)(a) | | | Portfolio
Turnover
Rate
(%)(a) | | Net
Assets
at End
of
Period
(Thousands) | |
Class A Shares | | | | | | | | | | | | | | | | | | | | | | | | | | | | | | | | | | | | | | | | | | | | | | | |
2014(b)(c) | | $ | 30.12 | | | | 0.02 | | | | (0.24 | ) | | | (0.22 | ) | | | — | | | — | | | — | | | $29.90 | | | 0.14 | (d) | | | 1.25 | (d) | | | 1.25 | (d) | | | 1.25 | (d) | | | (0.73 | ) | | 16.07 | | $ | 3,960,004 | |
2013(b) | | $ | 26.08 | | | | 0.26 | | | | 4.02 | | | | 4.28 | | | | (0.24 | ) | | — | | | (0.24 | ) | | $30.12 | | | 0.92 | | | | 1.25 | | | | 1.25 | | | | 1.25 | | | | 16.49 | | | 34.67 | | $ | 5,212,813 | |
2012(b) | | $ | 23.14 | | | | 0.28 | | | | 2.95 | | | | 3.23 | | | | (0.29 | ) | | — | | | (0.29 | ) | | $26.08 | | | 1.09 | | | | 1.29 | | | | 1.29 | | | | 1.29 | | | | 14.02 | | | 17.86 | | $ | 5,429,316 | |
2011(b) | | $ | 26.00 | | | | 0.30 | | | | (2.89 | ) | | | (2.59 | ) | | | (0.27 | ) | | — | | | (0.27 | ) | | $23.14 | | | 1.06 | | | | 1.25 | | | | 1.25 | | | | 1.25 | | | | (10.10 | ) | | 20.78 | | $ | 5,932,896 | |
2010(b) | | $ | 23.91 | | | | 0.18 | | | | 2.07 | | | | 2.25 | | | | (0.16 | ) | | — | | | (0.16 | ) | | $26.00 | | | 0.72 | | | | 1.33 | | | | 1.33 | | | | 1.33 | | | | 9.43 | | | 22.26 | | $ | 6,704,550 | |
2009(b) | | $ | 23.68 | | | | 0.21 | | | | 0.24 | | | | 0.45 | | | | (0.22 | ) | | — | | | (0.22 | ) | | $23.91 | | | 1.09 | | | | 1.34 | | | | 1.34 | | | | 1.34 | | | | 2.05 | | | 32.76 | | $ | 5,309,704 | |
Class B Shares | | | | | | | | | | | | | | | | | | | | | | | | | | | | | | | | | | | | | | | | | | | | | | | |
2014(c) | | $ | 28.02 | | | | (0.10 | ) | | | (0.21 | ) | | | (0.31 | ) | | | — | | | — | | | — | | | $27.71 | | | (0.73 | )(d) | | | 2.13 | (d) | | | 2.13 | (d) | | | 2.13 | (d) | | | (1.11 | ) | | 16.07 | | $ | 24,201 | |
2013 | | $ | 24.37 | | | | 0.01 | | | | 3.74 | | | | 3.75 | | | | (0.10 | ) | | — | | | (0.10 | ) | | $28.02 | | | 0.02 | | | | 2.10 | | | | 2.10 | | | | 2.10 | | | | 15.45 | | | 34.67 | | $ | 33,562 | |
2012 | | $ | 21.67 | | | | 0.06 | | | | 2.77 | | | | 2.83 | | | | (0.13 | ) | | — | | | (0.13 | ) | | $24.37 | | | 0.26 | | | | 2.09 | | | | 2.09 | | | | 2.09 | | | | 13.07 | | | 17.86 | | $ | 44,009 | |
2011 | | $ | 24.43 | | | | 0.05 | | | | (2.67 | ) | | | (2.62 | ) | | | (0.14 | ) | | — | | | (0.14 | ) | | $21.67 | | | 0.21 | | | | 2.06 | | | | 2.06 | | | | 2.06 | | | | (10.80 | ) | | 20.78 | | $ | 56,002 | |
2010 | | $ | 22.56 | | | | (0.02 | ) | | | 1.95 | | | | 1.93 | | | | (0.06 | ) | | — | | | (0.06 | ) | | $24.43 | | | (0.10 | ) | | | 2.10 | | | | 2.10 | | | | 2.10 | | | | 8.59 | | | 22.26 | | $ | 74,083 | |
2009 | | $ | 22.37 | | | | 0.05 | | | | 0.22 | | | | 0.27 | | | | (0.08 | ) | | — | | | (0.08 | ) | | $22.56 | | | 0.29 | | | | 2.13 | | | | 2.13 | | | | 2.13 | | | | 1.24 | �� | | 32.76 | | $ | 80,908 | |
Class C Shares | | | | | | | | | | | | | | | | | | | | | | | | | | | | | | | | | | | | | | | | | | | | | | | |
2014(c) | | $ | 28.17 | | | | (0.07 | ) | | | (0.23 | ) | | | (0.30 | ) | | | — | | | — | | | — | | | $27.87 | | | (0.51 | )(d) | | | 1.99 | (d) | | | 1.99 | (d) | | | 1.99 | (d) | | | (1.06 | ) | | 16.07 | | $ | 1,052,618 | |
2013 | | $ | 24.48 | | | | 0.04 | | | | 3.77 | | | | 3.81 | | | | (0.12 | ) | | — | | | (0.12 | ) | | $28.17 | | | 0.15 | | | | 2.01 | | | | 2.01 | | | | 2.01 | | | | 15.62 | | | 34.67 | | $ | 1,181,438 | |
2012 | | $ | 21.77 | | | | 0.08 | | | | 2.77 | | | | 2.85 | | | | (0.14 | ) | | — | | | (0.14 | ) | | $24.48 | | | 0.35 | | | | 2.03 | | | | 2.03 | | | | 2.03 | | | | 13.14 | | | 17.86 | | $ | 1,254,732 | |
2011 | | $ | 24.54 | | | | 0.08 | | | | (2.70 | ) | | | (2.62 | ) | | | (0.15 | ) | | — | | | (0.15 | ) | | $21.77 | | | 0.31 | | | | 1.99 | | | | 1.99 | | | | 1.99 | | | | (10.78 | ) | | 20.78 | | $ | 1,391,173 | |
2010 | | $ | 22.65 | | | | (0.01 | ) | | | 1.97 | | | | 1.96 | | | | (0.07 | ) | | — | | | (0.07 | ) | | $24.54 | | | (0.03 | ) | | | 2.06 | �� | | | 2.06 | | | | 2.06 | | | | 8.67 | | | 22.26 | | $ | 1,643,753 | |
2009 | | $ | 22.46 | | | | 0.06 | | | | 0.22 | | | | 0.28 | | | | (0.09 | ) | | — | | | (0.09 | ) | | $22.65 | | | 0.34 | | | | 2.06 | | | | 2.06 | | | | 2.06 | | | | 1.31 | | | 32.76 | | $ | 1,551,488 | |
Class I Shares | | | | | | | | | | | | | | | | | | | | | | | | | | | | | | | | | | | | | | | | | | | | | | | |
2014(c) | | $ | 30.76 | | | | 0.09 | | | | (0.24 | ) | | | (0.15 | ) | | | (0.03 | ) | | — | | | (0.03 | ) | | $30.58 | | | 0.59 | (d) | | | 0.86 | (d) | | | 0.86 | (d) | | | 0.86 | (d) | | | (0.50 | ) | | 16.07 | | $ | 11,481,004 | |
2013 | | $ | 26.66 | | | | 0.38 | | | | 4.10 | | | | 4.48 | | | | (0.38 | ) | | — | | | (0.38 | ) | | $30.76 | | | 1.34 | | | | 0.86 | | | | 0.86 | | | | 0.86 | | | | 16.94 | | | 34.67 | | $ | 14,601,876 | |
2012 | | $ | 23.65 | | | | 0.40 | | | | 3.00 | | | | 3.40 | | | | (0.39 | ) | | — | | | (0.39 | ) | | $26.66 | | | 1.53 | | | | 0.88 | | | | 0.88 | | | | 0.88 | | | | 14.47 | | | 17.86 | | $ | 12,505,553 | |
2011 | | $ | 26.57 | | | | 0.41 | | | | (2.96 | ) | | | (2.55 | ) | | | (0.37 | ) | | — | | | (0.37 | ) | | $23.65 | | | 1.45 | | | | 0.88 | | | | 0.88 | | | | 0.88 | | | | (9.77 | ) | | 20.78 | | $ | 10,942,112 | |
2010 | | $ | 24.42 | | | | 0.29 | | | | 2.11 | | | | 2.40 | | | | (0.25 | ) | | — | | | (0.25 | ) | | $26.57 | | | 1.17 | | | | 0.92 | | | | 0.92 | | | | 0.92 | | | | 9.90 | | | 22.26 | | $ | 9,693,445 | |
2009 | | $ | 24.18 | | | | 0.31 | | | | 0.24 | | | | 0.55 | | | | (0.31 | ) | | — | | | (0.31 | ) | | $24.42 | | | 1.54 | | | | 0.92 | | | | 0.92 | | | | 0.92 | | | | 2.46 | | | 32.76 | | $ | 6,330,268 | |
Class R3 Shares | | | | | | | | | | | | | | | | | | | | | | | | | | | | | | | | | | | | | | | | | | | | | | | |
2014(c) | | $ | 30.14 | | | | — | (f) | | | (0.24 | ) | | | (0.24 | ) | | | — | | | — | | | — | | | $29.90 | | | — | (d)(g) | | | 1.45 | (d) | | | 1.45 | (d) | | | 1.60 | (d) | | | (0.80 | ) | | 16.07 | | $ | 950,591 | |
2013 | | $ | 26.11 | | | | 0.20 | | | | 4.02 | | | | 4.22 | | | | (0.19 | ) | | — | | | (0.19 | ) | | $30.14 | | | 0.71 | | | | 1.45 | | | | 1.45 | | | | 1.57 | | | | 16.23 | | | 34.67 | | $ | 1,152,795 | |
2012 | | $ | 23.17 | | | | 0.24 | | | | 2.95 | | | | 3.19 | | | | (0.25 | ) | | — | | | (0.25 | ) | | $26.11 | | | 0.95 | | | | 1.45 | | | | 1.45 | | | | 1.60 | | | | 13.82 | | | 17.86 | | $ | 1,323,765 | |
2011 | | $ | 26.04 | | | | 0.24 | | | | (2.89 | ) | | | (2.65 | ) | | | (0.22 | ) | | — | | | (0.22 | ) | | $23.17 | | | 0.86 | | | | 1.45 | | | | 1.45 | | | | 1.58 | | | | (10.27 | ) | | 20.78 | | $ | 1,270,000 | |
2010 | | $ | 23.96 | | | | 0.15 | | | | 2.07 | | | | 2.22 | | | | (0.14 | ) | | — | | | (0.14 | ) | | $26.04 | | | 0.61 | | | | 1.45 | | | | 1.45 | | | | 1.63 | | | | 9.30 | | | 22.26 | | $ | 1,311,041 | |
2009 | | $ | 23.73 | | | | 0.20 | | | | 0.23 | | | | 0.43 | | | | (0.20 | ) | | — | | | (0.20 | ) | | $23.96 | | | 1.02 | | | | 1.45 | | | | 1.45 | | | | 1.64 | | | | 1.96 | | | 32.76 | | $ | 1,042,248 | |
Class R4 Shares | | | | | | | | | | | | | | | | | | | | | | | | | | | | | | | | | | | | | | | | | | | | | | | |
2014(c) | | $ | 29.98 | | | | 0.03 | | | | (0.24 | ) | | | (0.21 | ) | | | — | | | — | | | — | | | $29.77 | | | 0.19 | (d) | | | 1.25 | (d) | | | 1.25 | (d) | | | 1.44 | (d) | | | (0.70 | ) | | 16.07 | | $ | 1,086,102 | |
2013 | | $ | 25.96 | | | | 0.25 | | | | 4.01 | | | | 4.26 | | | | (0.24 | ) | | — | | | (0.24 | ) | | $29.98 | | | 0.91 | | | | 1.25 | | | | 1.25 | | | | 1.38 | | | | 16.49 | | | 34.67 | | $ | 1,342,883 | |
2012 | | $ | 23.04 | | | | 0.29 | | | | 2.93 | | | | 3.22 | | | | (0.30 | ) | | — | | | (0.30 | ) | | $25.96 | | | 1.16 | | | | 1.25 | | | | 1.25 | | | | 1.45 | | | | 14.05 | | | 17.86 | | $ | 1,495,958 | |
2011 | | $ | 25.90 | | | | 0.31 | | | | (2.89 | ) | | | (2.58 | ) | | | (0.28 | ) | | — | | | (0.28 | ) | | $23.04 | | | 1.12 | | | | 1.25 | | | | 1.25 | | | | 1.41 | | | | (10.11 | ) | | 20.78 | | $ | 1,296,493 | |
2010 | | $ | 23.82 | | | | 0.21 | | | | 2.05 | | | | 2.26 | | | | (0.18 | ) | | — | | | (0.18 | ) | | $25.90 | | | 0.85 | | | | 1.25 | | | | 1.25 | | | | 1.49 | | | | 9.53 | | | 22.26 | | $ | 872,122 | |
2009 | | $ | 23.60 | | | | 0.26 | | | | 0.21 | | | | 0.47 | | | | (0.25 | ) | | — | | | (0.25 | ) | | $23.82 | | | 1.29 | | | | 1.25 | | | | 1.25 | | | | 1.50 | | | | 2.16 | | | 32.76 | | $ | 522,363 | |
Class R5 Shares | | | | | | | | | | | | | | | | | | | | | | | | | | | | | | | | | | | | | | | | | | | | | | | |
2014(c) | | $ | 30.71 | | | | 0.07 | | | | (0.24 | ) | | | (0.17 | ) | | | (0.01 | ) | | — | | | (0.01 | ) | | $30.53 | | | 0.48 | (d) | | | 0.99 | (d) | | | 0.99 | (d) | | | 1.04 | (d) | | | (0.54 | ) | | 16.07 | | $ | 3,688,707 | |
2013 | | $ | 26.61 | | | | 0.34 | | | | 4.10 | | | | 4.44 | | | | (0.34 | ) | | — | | | (0.34 | ) | | $30.71 | | | 1.20 | | | | 0.96 | | | | 0.96 | | | | 1.00 | | | | 16.80 | | | 34.67 | | $ | 4,376,567 | |
2012 | | $ | 23.61 | | | | 0.37 | | | | 3.00 | | | | 3.37 | | | | (0.37 | ) | | — | | | (0.37 | ) | | $26.61 | | | 1.44 | | | | 0.99 | | | | 0.99 | | | | 1.06 | | | | 14.33 | | | 17.86 | | $ | 4,512,144 | |
2011 | | $ | 26.53 | | | | 0.40 | | | | (2.98 | ) | | | (2.58 | ) | | | (0.34 | ) | | — | | | (0.34 | ) | | $23.61 | | | 1.39 | | | | 0.99 | | | | 0.99 | | | | 1.04 | | | | (9.88 | ) | | 20.78 | | $ | 3,709,978 | |
2010 | | $ | 24.38 | | | | 0.28 | | | | 2.11 | | | | 2.39 | | | | (0.24 | ) | | — | | | (0.24 | ) | | $26.53 | | | 1.11 | | | | 0.99 | | | | 0.99 | | | | 1.08 | | | | 9.86 | | | 22.26 | | $ | 2,462,021 | |
2009 | | $ | 24.14 | | | | 0.30 | | | | 0.23 | | | | 0.53 | | | | (0.29 | ) | | — | | | (0.29 | ) | | $24.38 | | | 1.51 | | | | 0.99 | | | | 0.99 | | | | 1.08 | | | | 2.40 | | | 32.76 | | $ | 1,414,122 | |
Class R6 Shares | | | | | | | | | | | | | | | | | | | | | | | | | | | | | | | | | | | | | | | | | | | | | | | |
2014(c) | | $ | 30.70 | | | | 0.12 | | | | (0.25 | ) | | | (0.13 | ) | | | (0.04 | ) | | — | | | (0.04 | ) | | $30.53 | | | 0.80 | (d) | | | 0.73 | (d) | | | 0.73 | (d) | | | 0.73 | (d) | | | (0.44 | ) | | 16.07 | | $ | 1,631,826 | |
2013 | | $ | 26.62 | | | | 0.46 | | | | 4.05 | | | | 4.51 | | | | (0.43 | ) | | — | | | (0.43 | ) | | $30.70 | | | 1.59 | | | | 0.74 | | | | 0.74 | | | | 0.74 | | | | 17.07 | | | 34.67 | | $ | 1,345,680 | |
2012(e) | | $ | 27.14 | | | | 0.15 | | | | (0.38 | ) | | | (0.23 | ) | | | (0.29 | ) | | — | | | (0.29 | ) | | $26.62 | | | 1.35 | (d) | | | 0.76 | (d) | | | 0.76 | (d) | | | 0.76 | (d) | | | (0.77 | ) | | 17.86 | | $ | 478,078 | |
| (a) | Not annualized for periods less than one year. |
| (b) | Sales loads are not reflected in computing total return. |
| (c) | Unaudited Six Month Period Ended March 31. |
| (e) | Effective date of this class of shares was May 1, 2012. |
| (f) | Net investment income (loss) was less than $0.01 per share. |
| (g) | Net investment income (loss) percentage was less than 0.01% per share. |
| + | Based on weighted average shares outstanding, except for Dividends from Net Investment Income and Net Realized Gains, which are actual amounts per share. |
See Notes to financial statements.
| | | | |
| 28 Certified Semi-Annual Report | | | | Certified Semi-Annual Report 29 |
| | |
| EXPENSE EXAMPLE | | |
| |
Thornburg International Value Fund | | March 31, 2014 (Unaudited) |
As a shareholder of the Fund, you incur two types of costs:
| | (1) | transaction costs, including |
(a) sales charges (loads) on purchase payments for Class A shares;
(b) a deferred sales charge on redemptions of any part or all of a purchase of $1 million of Class A shares within 12 months of purchase;
(c) a deferred sales charge on redemptions of Class B shares within eight years of purchase;
(d) a deferred sales charge on redemptions of Class C shares within 12 months of purchase;
| | (2) | ongoing costs, including management fees; distribution and/or service (12b-1) fees; and other Fund expenses. |
This example is intended to help you understand your ongoing costs (in dollars) of investing in the Fund and to compare these costs with the ongoing costs of investing in other mutual funds.
The example is based on a $1,000 investment beginning on October 1, 2013, and held until March 31, 2014.
ACTUAL EXPENSES
For each class of shares, the first line of the accompanying table provides information about actual account values and actual expenses. You may use the information in this line, together with the amount you invested, to estimate the expenses that you paid over the period. Simply divide your account value by $1,000 (for example, an $8,600 account value divided by $1,000 = 8.6), then multiply the result by the number in the first line for your class of shares under the heading entitled “Expenses Paid During Period” to estimate the expenses you paid on your account during this period.
| | | | | | | | | | | | |
| | | Beginning
Account Value
10/1/13 | | | Ending
Account Value
3/31/14 | | | Expenses Paid
During period†
10/1/13–3/31/14 | |
Class A Shares | | | | | | | | | | | | |
Actual | | $ | 1,000.00 | | | $ | 992.70 | | | $ | 6.21 | |
Hypothetical* | | $ | 1,000.00 | | | $ | 1,018.70 | | | $ | 6.29 | |
Class B Shares | | | | | | | | | | | | |
Actual | �� | $ | 1,000.00 | | | $ | 988.90 | | | $ | 10.58 | |
Hypothetical* | | $ | 1,000.00 | | | $ | 1,014.30 | | | $ | 10.71 | |
Class C Shares | | | | | | | | | | | | |
Actual | | $ | 1,000.00 | | | $ | 989.40 | | | $ | 9.85 | |
Hypothetical* | | $ | 1,000.00 | | | $ | 1,015.03 | | | $ | 9.98 | |
Class I Shares | | | | | | | | | | | | |
Actual | | $ | 1,000.00 | | | $ | 995.00 | | | $ | 4.26 | |
Hypothetical* | | $ | 1,000.00 | | | $ | 1,020.66 | | | $ | 4.32 | |
Class R3 Shares | | | | | | | | | | | | |
Actual | | $ | 1,000.00 | | | $ | 992.00 | | | $ | 7.20 | |
Hypothetical* | | $ | 1,000.00 | | | $ | 1,017.71 | | | $ | 7.29 | |
Class R4 Shares | | | | | | | | | | | | |
Actual | | $ | 1,000.00 | | | $ | 993.00 | | | $ | 6.21 | |
Hypothetical* | | $ | 1,000.00 | | | $ | 1,018.70 | | | $ | 6.29 | |
Class R5 Shares | | | | | | | | | | | | |
Actual | | $ | 1,000.00 | | | $ | 994.60 | | | $ | 4.92 | |
Hypothetical* | | $ | 1,000.00 | | | $ | 1,020.00 | | | $ | 4.99 | |
Class R6 Shares | | | | | | | | | | | | |
Actual | | $ | 1,000.00 | | | $ | 995.60 | | | $ | 3.63 | |
Hypothetical* | | $ | 1,000.00 | | | $ | 1,021.29 | | | $ | 3.68 | |
| † | Expenses are equal to the annualized expense ratio for each class (A: 1.25%; B: 2.13%; C: 1.99%; I: 0.86%; R3: 1.45%; R4: 1.25%; R5: 0.99%; R6: 0.73%) multiplied by the average account value over the period, multiplied by 182/365 to reflect the one-half year period. |
| * | Hypothetical assumes a rate of return of 5% per year before expenses. |
HYPOTHETICAL EXAMPLE FOR COMPARISON PURPOSES
For each class of shares, the second line of the accompanying table provides information about hypothetical account values and hypothetical expenses based on the Fund’s actual expense ratio and an assumed rate of return of 5% per year before expenses, which is not the Fund’s actual return. The hypothetical account values and expenses may not be used to estimate the actual ending account balance or expenses you paid for the period. You may use this information to compare the ongoing costs of investing in the Fund and other funds. To do so, compare this 5% hypothetical example with the 5% hypothetical examples that appear in the shareholder reports of the other funds.
Please note that the expenses shown in the table are meant to highlight your ongoing costs only and do not reflect any transactional costs, such as sales charges (loads), redemption fees, or exchange fees. Therefore, the second line of the table for each class of shares is useful in comparing ongoing costs only, and will not help you determine the relative total costs of owning different funds. In addition, if these transactional costs were included, your costs would have been higher.
30 Certified Semi-Annual Report
| | |
| INDEX COMPARISON | | |
| |
Thornburg International Value Fund | | March 31, 2014 (Unaudited) |
Growth of a Hypothetical $10,000 Investment
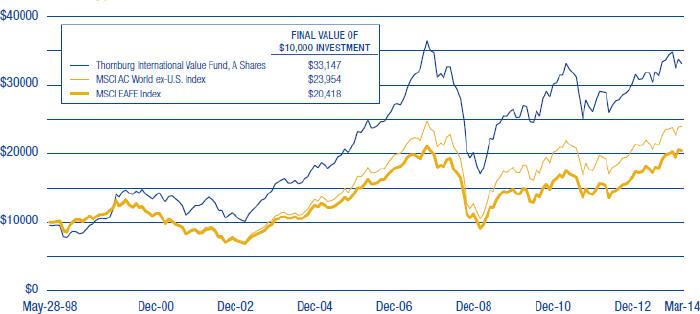
Average Annual Total Returns
For Periods Ended March 31, 2014 (with sales charge)
| | | | | | | | | | | | | | | | | | | | |
| | | 1 Yr | | | 3 Yrs | | | 5 Yrs | | | 10 Yrs | | | Since
Inception | |
Class A Shares (Incep: 5/28/98) | | | 2.44 | % | | | 0.22 | % | | | 11.91 | % | | | 6.80 | % | | | 7.86 | % |
Class B Shares (Incep: 4/3/00) | | | 1.36 | % | | | -0.23 | % | | | 11.78 | % | | | 6.61 | % | | | 5.54 | % |
Class C Shares (Incep: 5/28/98) | | | 5.47 | % | | | 1.03 | % | | | 12.12 | % | | | 6.51 | % | | | 7.32 | % |
Class I Shares (Incep: 3/30/01) | | | 7.72 | % | | | 2.19 | % | | | 13.41 | % | | | 7.74 | % | | | 7.90 | % |
Class R3 Shares (Incep: 7/1/03) | | | 7.06 | % | | | 1.59 | % | | | 12.76 | % | | | 7.15 | % | | | 9.66 | % |
Class R4 Shares (Incep: 2/1/07) | | | 7.29 | % | | | 1.80 | % | | | 12.99 | % | | | — | | | | 2.67 | % |
Class R5 Shares (Incep: 2/1/05) | | | 7.60 | % | | | 2.06 | % | | | 13.28 | % | | | — | | | | 7.20 | % |
Class R6 Shares (Incep: 5/1/12) | | | 7.84 | % | | | — | | | | — | | | | — | | | | 7.89 | % |
Performance data shown represents past performance and is no guarantee of future results. Investment return and principal value will fluctuate so shares, when redeemed, may be worth more or less than their original cost. Current performance may be lower or higher than quoted. For performance current to the most recent month end, visit thornburg.com or call 800.847.0200. The performance data and graph do not reflect the deduction of taxes that a shareholder would pay on distributions or the redemption of Fund shares. Returns reflect the reinvestment of dividends and capital gains as well as applicable sales charges. Class A shares are sold with a maximum sales charge of 4.50%. Class B shares carry a contingent deferred sales charge (CDSC) that declines from 5.00% to 0% depending upon the period of time the shares are held. Class B shares will automatically convert to Class A shares on a quarterly basis approximately eight years after purchase. Class C shares are subject to a 1% CDSC for the first year only. There is no up-front sales charge for Class I, R3, R4, R5, and R6 shares.
Certified Semi-Annual Report 31
| | |
| OTHER INFORMATION | | |
| |
Thornburg International Value Fund | | March 31, 2014 (Unaudited) |
PORTFOLIO PROXY VOTING
Policies and Procedures:
The Trust has delegated to Thornburg Investment Management, Inc. (the “Advisor”) voting decisions respecting proxies for the Fund’s voting securities. The Advisor makes voting decisions in accordance with its Proxy Voting Policy and Procedures. A description of the Policy and Procedures is available (i) without charge, upon request, by calling the Advisor toll-free at 1-800-847-0200, (ii) on the Thornburg website at www.thornburg.com, and (iii) on the Securities and Exchange Commission’s website at www.sec.gov.
Information regarding how proxies were voted is available on or before August 31 of each year for the twelve months ending the preceding June 30. This information is available (i) without charge, upon request by calling the Advisor toll-free at 1-800-847-0200, (ii) on the Thornburg website at www.thornburg.com, and (iii) on the Securities and Exchange Commission’s website at www.sec.gov.
AVAILABILITY OF QUARTERLY PORTFOLIO SCHEDULE
The Fund files with the Securities and Exchange Commission schedules of its portfolio holdings on Form N-Q for the first and third quarters of each fiscal year. The Fund’s Forms N-Q are available on the Commission’s website at www.sec.gov, or may be reviewed and copied at the Commission’s Public Reference Room in Washington, D.C. Information on the operation of the Public Reference Room may be obtained by calling 1-800-SEC-0330. The Fund also makes this information available on its website at www.thornburg.com/download or upon request by calling 1-800-847-0200.
32 Certified Semi-Annual Report
TRUSTEES’ STATEMENT TO SHAREHOLDERS
Not part of the Certified Semi-Annual Report
Reissued September 15, 2013
The Trustees believe current and prospective shareholders should know how we discharge our responsibilities in supervising the Funds’ investment advisor and in reviewing the advisor’s contract for renewal. Since 2005, we have issued a statement which sets out clearly the three principal guidelines that we follow in supervising the Trust’s investment advisor on your behalf. In accordance with our customary practice, in September of this year we again reviewed our statement and concluded we should reissue this statement outlining the principal features of our supervision of the advisor’s performance of investment management services for the Funds.
We begin with the premise that each shareholder selected his or her Fund because its investments are managed by the investment advisor identified in the prospectus and in accordance with the objective and policies described in the prospectus. We realize, as each of you do, that if you believe that your Fund’s stated objective and policies no longer serve your personal investment goals, you can sell your shares and leave the Fund.
Therefore, we believe that our primary supervisory task – our principal obligation to you – is to assess the nature and quality of the advisor’s services, and to confirm that the advisor actively and competently pursues the Fund’s objective, in accordance with the policies set out in the prospectus. To do this, we meet regularly with management to review your Fund’s portfolio and to discuss the advisor’s specific actions and judgments in pursuing the Fund’s objective. We do not substitute our own judgment for the advisor’s decisions in selecting investments; the advisor is paid to exercise its informed judgment on investment decisions, and we seek to confirm, in reviewing the advisor’s performance, that the advisor is doing just that.
Second, while we are conscious of costs and the effect that costs have on shareholders’ returns, we do not seek the lowest fees or expense ratio as our sole or primary objective. We try to make sure that your Fund’s fees and costs are reasonable in relationship to the services rendered and that they are generally in line with those charged by other expert investment advisors, consistent with our belief that the Fund’s investors searched for and expect that expertise and attention and have decided to pay a reasonable price for it. We do not put the management contract “out to bid” as a matter of course, and we would not do so unless we had concluded that the advisor materially had failed to pursue the Fund’s objectives in accordance with its policies, or for other equally important reasons. We believe that any other approach would be inconsistent with your interests and contrary to your expectations when you bought shares of the Fund in the first place.
Finally, because we believe that most Thornburg Fund shareholders have invested with a long-term perspective, we try not to focus too much on the fashions of the moment and on short-term performance. The market will not favor any specific investment objective or set of policies at all times and under all economic circumstances. A fund will experience periods of both high and low returns relative to other funds and other investments. Even if one of our Funds is not favored by the market at a particular time, we believe that the advisor is nonetheless obliged to remain true to the Fund’s objective and policies, and we watch to see that it does so.
This page is not part of the Semi-Annual Report 33
This page intentionally left blank.
34 This page is not part of the Semi-Annual Report
RETIREMENT AND EDUCATION ACCOUNTS
Thornburg Investment Management offers retirement and education savings accounts that can help you meet a variety of planning challenges. For account applications or further information on any of the accounts below, please call 1-800-847-0200 or go to www.thornburg.com/ira. Your financial advisor can help you determine which plan is right for you.
Individual Retirement Accounts
Individual Retirement Accounts (IRAs) provide a tax-advantaged means to save money for the future. For a detailed outline of the difference between retirement accounts, see www.thornburg.com/ira. Rollovers are available. Call 1-800-847-0200 for more information.
Traditional IRAs – Contributions to Traditional IRAs are tax deductible for eligible individuals, and withdrawals are taxed as additional ordinary income. You may contribute to an IRA if you receive compensation and are under 70 1/2, even if you are covered by an employer retirement plan. Deductible contributions are subject to certain qualifications. Please consult your tax advisor.
Roth IRAs – Under a Roth IRA, there is no tax deduction for contributions, but there is no income tax on qualified withdrawals. For a more detailed comparison of Traditional and Roth IRAs, please see our website at www.thornburg.com/ira.
SEP IRAs – Simplified Employee Pension (SEP) IRAs are established by employers. The employer is allowed a tax deduction for contributions made to the SEP Plan and makes contributions to each eligible employee’s SEP IRA on a discretionary basis.
SIMPLE IRAs – Savings Incentive Match Plan for Employees of Small Employers (SIMPLE) is designed to give small business owners a simplified method to establish and contribute to a retirement plan for employees. The employer is allowed a tax deduction for contributions and makes either matching or non-elective contributions to each eligible employee’s SIMPLE IRA. Employees may make salary deferral contributions.
Coverdell Education Savings Account
These savings accounts are designed to provide a way to save money for higher education expenses. In an Education Savings Account, earnings and interest grow tax-free, and qualified withdrawals used to pay for eligible higher-education expenses are tax- and penalty-free.
Funds Available
The following funds are available in the accounts listed above:
| | • | | Thornburg Core Growth Fund |
| | • | | Thornburg International Value Fund |
| | • | | Thornburg International Growth Fund |
| | • | | Thornburg Developing World Fund |
| | • | | Thornburg Investment Income Builder Fund |
| | • | | Thornburg Global Opportunities Fund |
| | • | | Thornburg Low Duration Income Fund |
| | • | | Thornburg Limited Term U.S. Government Fund |
| | • | | Thornburg Limited Term Income Fund |
| | • | | Thornburg Strategic Income Fund |
This page is not part of the Semi-Annual Report 35

36 This page is not part of the Semi-Annual Report
THORNBURG FUND FAMILY
Thornburg Equity Funds
Thornburg’s equity research uses a fundamentally driven, bottom-up, comprehensive analytical approach. Thornburg equity funds generally focus on a limited number of securities so that each holding can impact performance. The team searches for firms believed to have a promising future and seeks to buy shares of those companies at a discount to their intrinsic or long-term value.
| | • | | Thornburg Core Growth Fund |
| | • | | Thornburg International Value Fund |
| | • | | Thornburg International Growth Fund |
| | • | | Thornburg Developing World Fund |
| | • | | Thornburg Investment Income Builder Fund |
| | • | | Thornburg Global Opportunities Fund |
Thornburg Bond Funds
Thornburg Investment Management applies a disciplined philosophy to fixed-income management. Since the launch of our first fixed-income fund over 25 years ago, we have been conducting fundamental, bottom-up research in an effort to identify bonds which we believe provide the best return for a given level of risk. We avoid leverage or complex strategies which could backfire in periods of market uncertainty.
| | • | | Thornburg Low Duration Income Fund |
| | • | | Thornburg Limited Term U.S. Government Fund |
| | • | | Thornburg Limited Term Income Fund |
| | • | | Thornburg Strategic Income Fund |
| | • | | Thornburg Low Duration Municipal Fund |
| | • | | Thornburg Limited Term Municipal Fund |
| | • | | Thornburg Intermediate Municipal Fund |
| | • | | Thornburg California Limited Term Municipal Fund |
| | • | | Thornburg New Mexico Intermediate Municipal Fund |
| | • | | Thornburg New York Intermediate Municipal Fund |
| | • | | Thornburg Strategic Municipal Income Fund |
Before investing, carefully consider the Fund’s investment goals, risks, charges, and expenses. For a prospectus or summary prospectus containing this and other information, contact your financial advisor or visit thornburg.com. Read it carefully before investing.
For additional information, please visit thornburg.com
Thornburg Investment Management, Inc. 2300 North Ridgetop Road, Santa Fe, NM 87506
This page is not part of the Semi-Annual Report 37
This page intentionally left blank.
38 This page is not part of the Semi-Annual Report
This page intentionally left blank.
This page is not part of the Semi-Annual Report 39


2 This page is not part of the Semi-Annual Report
IMPORTANT INFORMATION

Best Multi-Cap Growth Fund
Lipper Classification Awards are granted annually to the fund in each Lipper classification that consistently delivered the strongest risk-adjusted performance (calculated with dividends reinvested). Fund Classification Awards were given for three-year, five-year, and ten-year periods ended 11/30/13. In 2014, Class R5 shares won for the three-year period ended 11/30/13 among 432 funds. The Fund did not win the award for other time periods.
The information presented on the following pages was current as of March 31, 2014. The managers’ views, portfolio holdings, and sector and country diversification are provided for the general information of the Fund’s shareholders; to the extent this information is historical, it should not be considered predictive of future circumstances. This material should not be deemed a recommendation to buy or sell any of the securities mentioned.
Investments in the Fund carry risks, including possible loss of principal. Special risks may be associated with investments outside the United States, especially in emerging markets, including currency fluctuations, illiquidity, volatility, and political and economic risks. Investments in small capitalization companies may increase the risk of greater price fluctuations. Please see the Fund’s Prospectus for a discussion of the risks associated with an investment in the Fund. Investments in the Fund are not FDIC insured, nor are they deposits of or guaranteed by a bank or any other entity. There is no guarantee that the Fund will meet its investment objective. Funds invested in a limited number of holdings may expose an investor to greater volatility.
Performance data given at net asset value (NAV) does not take into account the applicable sales charges. If the sales charges had been included, the performance would have been lower.
Class I, R3, R4, and R5 shares may not be available to all investors. Minimum investments for Class I shares may be higher than those for other classes.
From time to time, the Fund may invest in shares of companies through initial public offerings (IPOs). IPOs have the potential to produce substantial gains for the Fund. There is no assurance that the Fund will have continued access to profitable IPOs and as the Fund’s assets grow, the impact of IPO investments may decline. Therefore, investors should not rely on these past gains as an indication of future performance.
| | | | |
Share Class | | NASDAQ Symbol | | Cusip |
Class A | | THCGX | | 885-215-582 |
Class C | | TCGCX | | 885-215-574 |
Class I | | THIGX | | 885-215-475 |
Class R3 | | THCRX | | 885-215-517 |
Class R4 | | TCGRX | | 885-215-251 |
Class R5 | | THGRX | | 885-215-350 |
Glossary
Russell 3000 Growth Index – The Russell 3000 Growth Index (Russell 3K G) is an unmanaged index comprised of those Russell 3000 companies with higher price-to-book ratios and higher forecasted growth values.
Unless otherwise noted, index returns reflect the reinvestment of income dividends and capital gains, if any, but do not reflect fees, brokerage commissions or other expenses of investing. Investors may not make direct investments into any index. The performance of any index is not indicative of the performance of any particular investment.
Beta – Beta is a measure of market-related risk. Less than one means the portfolio is less volatile than the index, while greater than one indicates more volatility than the index.
Median Market Capitalization – Market capitalization (market cap) is the total value of a company’s stock, calculated by multiplying the number of outstanding common shares by the current share price. The company whose market cap is in the middle of the portfolio is the median market cap. Half the companies in the portfolio have values greater than the median, and half have values that are less.
Multiple – A financial value derived from dividing one metric by another. A price/earnings ratio, for example, reflects how much investors are willing to pay per dollar of earnings.
Price to Book Value (P/B) – A ratio used to compare a stock’s market value to its book value. It is calculated by dividing the current closing price of the stock by the latest quarter’s book value (book value is simply assets minus liabilities).
Price to Cash Flow Ratio – A measure of the market’s expectations of a firm’s future financial health. It is calculated by dividing the price per share by cash flow per share.
Price to Earnings Ratio (P/E) – A valuation ratio equaling a company’s market value per share divided by earnings per share.
This page is not part of the Semi-Annual Report 3

Portfolio Managers

Tim Cunningham, CFA Greg Dunn
The Fund seeks long-term growth of capital by investing in equity securities selected for their growth potential.
The Fund expects to invest primarily in domestic equity securities (primarily common stocks) selected for their growth potential. However, the Fund may own a variety of securities, including foreign equity securities, partnership interests, and domestic and foreign debt obligations. The Fund may also invest in developing countries.
Continually Evaluating the Risk Equation
Growth stocks are often referred to as “glamour” stocks, and it is easy to understand why. Growth stocks generate excitement. These are stocks whose rapid earnings growth is expected to be followed by rapid price appreciation. Growth stocks capture the imagination, and investing in them may potentially offer considerable opportunities for reward.
But growth stocks can also be volatile. Identifying which companies will succeed takes work. It takes digging down to the nuts and bolts of companies. The management team of Thornburg Core Growth Fund understands this. They know that it is grit, not glamour, that creates a successful growth fund.
Portfolio managers Tim Cunningham and Greg Dunn apply a rigorous stock selection process to the investments that comprise the Thornburg Core Growth Fund. This is a portfolio run on common sense, not on abstract theory. Their overarching philosophy is to create a fund that pursues good performance over the long term, while seeking to reduce volatility in the interim. Intensive, hands-on, independent research is the central theme. While many other growth funds rely on broad portfolio diversification to temper volatility, the Thornburg Core Growth Fund typically invests in a limited number of stocks and diversifies those investments among three segments of the growth fund universe: consistent growth companies, growth industry leaders, and emerging growth companies. By limiting the number of securities, the Fund’s managers can evaluate each stock in greater depth. We believe that diversifying among three growth baskets further mitigates risk because each of these segments typically reacts differently than the equity markets as a whole.
How does the stock selection process work? Before adding a stock to the Fund’s portfolio, we drill down into the company and its business. The team believes that an intimate understanding of the companies in the portfolio is one of the most effective forms of risk management.
Companies are initially screened using a variety of quantitative factors. Most are rejected and logged as a screening rejection. Only those with the most appealing opportunities to expand margins and grow earnings move on to the next step – the construction of a company-specific model. The goal is to cut to the quick and scrutinize the underlying business. The team uses SEC filings to construct proprietary income statement, balance sheet and cash flow statement models for each remaining company. From these they analyze historical data, monitor current conditions, identify red flags, and estimate future growth potential.
We are not “go-along-with-the-crowd” types and are not tied to mainstream thinking. While we have access to the best of Wall Street’s analysis, we are not ruled by it.
The team tests the strength of a company’s underlying business model against a variety of what-if screens. Besides conducting site visits and interviewing company management, they also check in with a company’s major customers, suppliers, and distributors to get a complete picture of a company before investing. Revenue and cost of goods sold are given particular attention. All data points are broken down in several ways before reaching an investment decision.
4 This page is not part of the Semi-Annual Report
Key Portfolio Attributes
As of March 31, 2014
| | | | |
Portfolio P/E Trailing 12-months* | | | 27.4x | |
| |
Portfolio Price to Cash Flow* | | | 18.7x | |
| |
Portfolio Price to Book Value* | | | 4.6x | |
| |
Median Market Cap* | | $ | 8.1 B | |
| |
7-Year Beta (A Shares vs. S&P 500)* | | | 1.14 | |
| |
Number of Companies | | | 61 | |
Market Capitalization Exposure
As of March 31, 2014
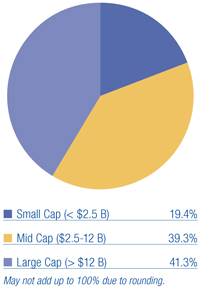
Basket Structure
As of March 31, 2014
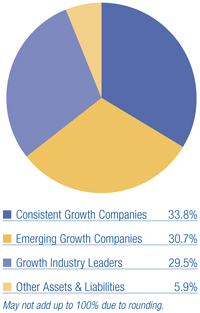
Average Annual Total Returns
For Periods Ended March 31, 2014
| | | | | | | | | | | | | | | | | | | | |
| | | 1 Yr | | | 3 Yrs | | | 5 Yrs | | | 10 Yrs | | | Since
Inception | |
A Shares (Incep: 12/27/00) | | | | | | | | | | | | | | | | | | | | |
Without sales charge | | | 25.22 | % | | | 17.80 | % | | | 22.61 | % | | | 9.45 | % | | | 6.38 | % |
With sales charge | | | 19.61 | % | | | 16.00 | % | | | 21.50 | % | | | 8.95 | % | | | 6.02 | % |
Russell 3000G Index (Since: 12/27/00) | | | 23.53 | % | | | 14.53 | % | | | 21.94 | % | | | 7.95 | % | | | 3.71 | % |
Performance data shown represents past performance and is no guarantee of future results. Investment return and principal value will fluctuate so shares, when redeemed, may be worth more or less than their original cost. Current performance may be lower or higher than quoted. For performance current to the most recent month end, visit thornburg.com or call 800.847.0200.
The maximum sales charge for Class A shares is 4.50%. The total annual fund operating expense of Class A shares is 1.45%, as disclosed in the most recent Prospectus.
Stocks Contributing and Detracting
For the Six Months Ended March 31, 2014
| | |
Top Contributors | | Top Detractors |
| Valeant Pharmaceuticals International, Inc. | | CommVault Systems, Inc. |
| SVB Financial Group | | LinkedIn Corp. |
| Google, Inc. | | Ellie Mae, Inc. |
| Alexion Pharmaceuticals, Inc. | | Sirius XM Holdings, Inc. |
| Monster Beverage Corp. | | MercadoLibre SA |
Source: FactSet
This page is not part of the Semi-Annual Report 5

Thornburg Core Growth Fund
March 31, 2014
This report is certified under the Sarbanes-Oxley Act of 2002, which requires that public companies, including mutual funds, affirm that the information provided in their annual and semi-annual shareholder reports fully and fairly represents their financial position and the results of their operations for the period presented.
6 Certified Semi-Annual Report
LETTER TO SHAREHOLDERS
April 15, 2014
Dear Fellow Shareholder,
For the six-month period ended March 31, 2014 the Thornburg Core Growth Fund returned 9.49% for the Class A shares at net asset value (NAV), underperforming its benchmark, the Russell 3000 Growth Index, which returned 11.43%. On March 31, 2014, the NAV of the Class A shares was $26.66, up from $24.35 at September 30, 2013.
We would obviously enjoy beating our benchmark in every reporting period and in all market cycles. But the frequent volatility inherent to growth investing often results in broad asset-price swings, sweeping up, or down, the shares of strong and struggling companies alike. We work to take the measure of companies and their prospects beyond any rapid rises and falls within shorter measurement periods, and focus on outperformance over the long run. We are pleased the Thornburg Core Growth Fund won a Lipper Fund Award for 2014, with the Fund’s Class R5 shares recognized as Lipper’s Best Multi-Cap Growth Fund for the three-year period ended November 30, 2013, among 432 funds, based on risk-adjusted returns.
At the end of the six-month period, we saw a sudden and severe shift out of growth stocks and into deep value and defensive stocks. All of our underperformance occurred in the month of March 2014. The current correction is different than the other corrections we’ve seen since the crisis in 2008, as it has been a rotation out of high-growth companies rather than a broad “risk-off” market correction. Companies with revenue growth of 30% – 40% and higher have been punished the most. These are the same kind of companies that have driven our outperformance over the last few years. Growth is scarce and the kinds of stocks we like have gained favor as investors inevitably chased returns, creating momentum in this group of stocks with similar characteristics. We believe this correction is healthy, probably a bit overdue, and will set up attractive entry points in high-quality growth stocks.
The recent underperformance gives us an opportunity to evaluate what worked, what did not, and to revisit the Fund’s current positioning. Our best performers last year – and especially in the last three months of 2013, when the Fund returned 12.2% alone – became our biggest detractors during the first three months of 2014. The strong performance of high-growth stocks in the software & services, e-commerce, non-bank financials, and consumer discretionary industries that had catapulted the Fund higher early in the period, dragged it down in the latter half, especially in March.
In March, it appears investors began to question their assumptions on economic growth, future interest rate levels, and earnings forecasts. Heading into 2014, the U.S. economic recovery seemed to be steadily gaining steam, even as inflation was still far from the Federal Reserve’s (the Fed) 2% target. And while the unemployment rate was declining, so was labor force participation. The market had taken to heart the Fed’s “qualitative guidance,” which indicated that the economy was healthy enough to handle the January 2014 start of reductions in the Fed’s monthly asset purchases and that key interest rates would stay low for long. Its unprecedented monetary stimulus over the last five years culminated with the steady, if modest, economic recovery and the strong market rally in 2013, when the Russell 3000 Growth Index returned 34% and the Core Growth Fund advanced 43%.
The marked expansion in growth stocks’ share-price multiples was to be supported this year with robust revenue and earnings growth. But a harsh U.S. winter and Easter falling in April rather than March (as it did last year) undercut retail sales, housing, and construction more generally in the first quarter. Disappointing economic data out of China, the world’s second-largest economy, and heightened geo-political risk surrounding Russia’s annexation of Crimea from the Ukraine also hurt investor sentiment. Then the Fed’s new chair suggested on March 19th that benchmark interest rates could start rising six months after the end of its asset purchases (sooner than the market had been expecting). The rate curve quickly moved, share-price multiples appeared too high as earnings forecasts – and share-price targets – started being cut.
After the banner year in 2013, which included a wave of initial public offerings that carried over into the first quarter 2014, investors started to take profit on ostensibly pricey growth stocks. Many of them, especially in the social media, e-commerce and bio-technology segments, were trading at multiples roughly double those of the S&P 500 Index, which was trading slightly above its historical average of 15x trailing earnings. Our positions were hit, and while we trimmed a number of those positions – some repeatedly – we did not do enough. We also struggled to find attractively priced defensive or value stocks with good growth prospects to move into. Hence the Fund had a higher than normal cash position during the period. Fund investments in initial public offerings contributed 1.28% to performance for the six-month period ended March 31, 2014.
Performance data shown represents past performance and is no guarantee of future results. Investment return and principal value will fluctuate so shares, when redeemed, may be worth more or less than their original cost. Current performance may be lower or higher than quoted. For performance current to the most recent month end, visit thornburg. com or call 800.847.0200.
The maximum sales charge for Class A shares is 4.50%. The total annual fund operating expense of Class A shares is 1.45%, as disclosed in the most recent Prospectus.
Certified Semi-Annual Report 7
LETTER TO SHAREHOLDERS,
CONTINUED
It has been unclear if the selling over the last month of the six-month period is the start of a real downturn or simply a healthy correction. Company fundamentals and the overall health of the economy appear largely intact. First-quarter 2014 earnings have started trickling out and for the most part, so far, have been encouraging. Economic data may also surprise on the upside: retail sales in March marked the highest monthly gain in two-and-a-half years, and weekly jobless claims fell to their lowest level since 2007. U.S. consumer sentiment data has also appeared recently to improve.
Given the current volatile environment, we are proceeding cautiously. While we keep an eye on the prevailing economic backdrop, we will continue to search for attractively priced, quality growth companies that exhibit durable structural drivers of long-run earnings growth.
Top contributors to performance included Valeant Pharmaceuticals, Inc., SVB Financial Group, Google, Inc., Alexion Pharmaceuticals, and Monster Beverage Corp.
Valeant is a multi-national specialty pharmaceutical company based in Montreal, Canada. It develops, manufactures, and markets a broad range of pharmaceutical products primarily in eye health, dermatology, branded generics, and over-the-counter (OTC) drugs. Valeant has a unique operating philosophy for a pharmaceutical company: it focuses on management and operations rather than research and development, which of late has been an unproductive allocation of shareholder capital. Valeant acquires undermanaged businesses and products and seeks to drive operational efficiencies through cost cutting and revenue optimization. Its approach is very similar to private equity firms. During the quarter, Valeant reported financial results that were ahead of street expectations. Management said the firm intends to continue acquiring companies and laid out a longer-term goal of becoming a top-five global pharmaceutical company.
SVB Financial specializes in providing banking services to early stage, often venture-backed companies, as well as providing broader banking services to technology firms. SVB has had significant net income margin pressure from historically low interest rates. As the outlook for interest rates improves, so does the outlook for future SVB results. In the meantime, SVB has done a good job growing its loan book.
Google is a global technology company with a stated mission to “organize the world’s information and make it universally accessible and useful.” Google is best known for their internet search engine. Google reported strong results during the period that showed accelerating revenue growth in their ‘Google Sites’ segment, as well as their international segment. We also saw a sequential improvement in operating margins.
Alexion researches and develops treatments for life-threatening and ultra-rare or ‘Orphan’ diseases. Alexion’s primary product is Soliris, a first-in-class terminal complement inhibitor currently approved in more than 40 countries as a treatment for patients with PNH (paroxysmal nocturnal hemoglobinuria). Soliris is also approved in the U.S. and EU as a treatment for patients with aHUS (atypical hemolytic uremic syndrome). Alexion is investigating Soliris and additional product candidates as treatments for patients with other rare and severe diseases. During the quarter, the firm reported results that exceeded expectations. Alexion also announced it is restructuring part of its business into an Irish affiliate, significantly lowering its effective corporate tax rate.
Monster is a leading energy drink company. We bought the stock when health and safety concerns surrounding energy drinks surfaced knocking the stock down to attractive valuation levels. The stock continues to be volatile as safety concerns periodically resurface and the weak economic recovery cause sales to be choppy.
The detractors to performance were CommVault, LinkedIn, Ellie Mae, Sirius XM Holdings and MercadoLibre SA.
CommVault is a technology company that provides a software solution for managing backup, archive and recovery functionality. CommVault reported solid results with greater than 20% growth, but cautious macro-commentary from management and weak results across technology hardware and storage companies along with a premium valuation led to weak stock performance. We believe fundamentals are strong, and that CommVault gets unfairly lumped together with companies like its main competitor EMC2 Corp., even though they are a PurePlay software company and actually benefit from the commoditization of hardware.
After appreciating 170% since our initial purchase in November 2012, LinkedIn has corrected about 30% from its highpoint. As the stock appreciated we trimmed nearly half of our position and now that the company is trading at the low end of its valuation range, we are cautiously adding back to our position. There has been some concern about comparisons getting tougher as some site upgrades age. We continue to believe LinkedIn is uniquely positioned as the dominant professional network in the world with a proven ability to monetize their userbase through products and advertising.
Ellie Mae continued to be a volatile stock. After trading at all-time highs to end the third quarter of 2013, the stock sold off on a weaker than expected earnings report and guidance. Some of the weakness in the quarter appeared transitory, driven by the government shutdown and two large customers exiting the business. Choppy results and our concern about continuing weak mortgage activity led us to sell our position in Ellie Mae in favor of new portfolio ideas.
8 Certified Semi-Annual Report
LETTER TO SHAREHOLDERS,
CONTINUED
Sirius XM Holdings operates a satellite radio service in North America. Sirius XM offers 165+ channels of premium audio content, including commercial-free music, sports, talk radio, comedy, weather, and news. Sirius XM has over 25.5 million subscribers. The stock has underperformed since Liberty Media decided to withdraw an offer to purchase the remaining Sirius XM Holdings shares it did not already own. We believe that the withdrawal of the offer is a net positive, as the initial offer to purchase the rest of Sirius XM Holdings clearly undervalued the stock. We like that Sirius XM Holdings has one of the highest free cash flow growth profiles in the content and distribution space, and this growth profile, coupled with an under-leveraged balance sheet, provides Sirius XM Holdings with the capacity to return substantial amounts of cash flow to shareholders through share buy-backs. Part of the recent underperformance has been due to subscriber growth concerns on the back of conservative company guidance and weak vehicle sales over the past several months, as cold weather kept many consumers away from automobile showrooms.
As noted, growth investing can be a volatile exercise, with higher or lower trends often hard to discern in shorter measurement periods. Whether the market dynamic over the last month or so is a technical break marking a healthy correction or a structural downturn is not clear. But we would note that talk of a “tech bubble” and loose comparisons to the year 2000 strike us as ill-conceived. Multiples now are not nearly as high in the technology sector (nor among the S&P 500 Index components) as they were back then, and neither are benchmark interest rates, which in all likelihood will remain at historic lows well into 2015. Annual inflation in March was 1.5%, far less than the 3.5% pace of 14 years ago, while forecasted economic growth this year, at 2.5% to 3%, is also less than half what it was then.
Current economic conditions seem generally favorable, and growth stocks may just be taking a breather after a strong recent run. One thing is certain: market volatility is more the norm than the exception. For our part, we will stay focused on the fundamentals of the companies that offer the best growth prospects at the best price, throughout economic and market cycles. We believe good long-term performance depends on it.
Thank you for investing alongside us in the Thornburg Core Growth Fund.
Sincerely,
| | | | |
 | |  | | |
| Greg Dunn | | Tim Cunningham, CFA | | |
| Managing Director | | Managing Director | | |
| Portfolio Manager | | Portfolio Manager | | |
The matters discussed in this report may constitute forward-looking statements made pursuant to the safe harbor provisions of the Securities Litigation Reform Act of 1995. These include any advisor or portfolio manager prediction, assessment, analysis or outlook for individual securities, industries, investment styles, market sectors and/or markets. These statements involve risks and uncertainties. In addition to the general risks described for each fund in its current prospectus, other factors bearing on these reports include the accuracy of the advisor’s or portfolio manager’s forecasts and predictions, the appropriateness of the investment strategies designed by the advisor or portfolio manager and the ability of the advisor or portfolio manager to implement their strategies efficiently and successfully. Any one or more of these factors, as well as other risks affecting the securities markets generally, could cause the actual results of any fund to differ materially as compared to its benchmarks.
Certified Semi-Annual Report 9
| | |
| SCHEDULE OF INVESTMENTS | | |
| |
Thornburg Core Growth Fund | | March 31, 2014 (Unaudited) |
Top Ten Equity Holdings
As of 3/31/14
| | | | |
Amazon.com, Inc. | | | 2.9 | % |
Visa, Inc. | | | 2.8 | % |
Gilead Sciences, Inc. | | | 2.7 | % |
Google, Inc. | | | 2.6 | % |
Affiliated Managers Group, Inc. | | | 2.5 | % |
| | | | |
Catamaran Corp. | | | 2.4 | % |
SVB Financial Group | | | 2.3 | % |
Charles Schwab Corp. | | | 2.1 | % |
VeriSign, Inc. | | | 2.0 | % |
Vitamin Shoppe, Inc. | | | 2.0 | % |
Summary of Industry Exposure
As of 3/31/14
| | | | |
Software & Services | | | 26.2 | % |
Retailing | | | 13.7 | % |
Diversified Financials | | | 11.8 | % |
Pharmaceuticals, Biotechnology & Life Sciences | | | 7.4 | % |
Technology Hardware & Equipment | | | 6.7 | % |
Health Care Equipment & Services | | | 6.6 | % |
Consumer Services | | | 5.3 | % |
Commercial & Professional Services | | | 4.3 | % |
| | | | |
Food, Beverage & Tobacco | | | 3.8 | % |
Banks | | | 2.3 | % |
Automobiles & Components | | | 1.9 | % |
Media | | | 1.5 | % |
Energy | | | 1.4 | % |
Real Estate | | | 1.2 | % |
Other Assets & Liabilities | | | 5.9 | % |
Summary of Country Exposure
As of 3/31/14 (percent of equity holdings)
| | | | |
United States | | | 90.8 | % |
Canada | | | 3.1 | % |
Ireland | | | 2.8 | % |
| | | | |
United Kingdom | | | 2.0 | % |
Israel | | | 1.3 | % |
| | | | | | | | |
| | | Shares/
Principal Amount | | | Value | |
COMMON STOCK — 94.07% | | | | | | | | |
AUTOMOBILES & COMPONENTS — 1.85% | | | | | | | | |
Auto Components — 1.85% | | | | | | | | |
Delphi Automotive plc | | | 265,100 | | | $ | 17,989,686 | |
| | | | | | | | |
| | | | | | | 17,989,686 | |
| | | | | | | | |
BANKS — 2.26% | | | | | | | | |
Banks — 2.26% | | | | | | | | |
a SVB Financial Group | | | 170,130 | | | | 21,909,341 | |
| | | | | | | | |
| | | | | | | 21,909,341 | |
| | | | | | | | |
COMMERCIAL & PROFESSIONAL SERVICES — 4.31% | | | | | | | | |
Commercial Services & Supplies — 1.95% | | | | | | | | |
a Stericycle, Inc. | | | 166,561 | | | | 18,924,661 | |
Professional Services — 2.36% | | | | | | | | |
a The Advisory Board Co. | | | 200,100 | | | | 12,856,425 | |
a Verisk Analytics, Inc. | | | 167,200 | | | | 10,025,312 | |
| | | | | | | | |
| | | | | | | 41,806,398 | |
| | | | | | | | |
CONSUMER SERVICES — 5.32% | | | | | | | | |
Hotels, Restaurants & Leisure — 5.32% | | | | | | | | |
Las Vegas Sands Corp. | | | 232,500 | | | | 18,781,350 | |
a MGM Resorts International | | | 554,400 | | | | 14,336,784 | |
a Norwegian Cruise Line Holdings Ltd. | | | 575,600 | | | | 18,574,612 | |
| | | | | | | | |
| | | | | | | 51,692,746 | |
| | | | | | | | |
10 Certified Semi-Annual Report
| | |
| SCHEDULE OF INVESTMENTS, CONTINUED | | |
| |
Thornburg Core Growth Fund | | March 31, 2014 (Unaudited) |
| | | | | | | | |
| | | Shares/
Principal Amount | | | Value | |
DIVERSIFIED FINANCIALS — 11.79% | | | | | | | | |
Capital Markets — 7.99% | | | | | | | | |
a Affiliated Managers Group, Inc. | | | 122,687 | | | $ | 24,543,535 | |
Charles Schwab Corp. | | | 751,335 | | | | 20,533,986 | |
Financial Engines, Inc. | | | 218,344 | | | | 11,087,508 | |
a Virtus Investment Partners, Inc. | | | 66,101 | | | | 11,446,710 | |
a WisdomTree Investments, Inc. | | | 763,519 | | | | 10,017,369 | |
Consumer Finance — 3.80% | | | | | | | | |
Capital One Financial Corp. | | | 189,000 | | | | 14,583,240 | |
a JGWPT Holdings, Inc. | | | 423,356 | | | | 7,730,480 | |
a Portfolio Recovery Associates, Inc. | | | 251,773 | | | | 14,567,586 | |
| | | | | | | | |
| | | | | | | 114,510,414 | |
| | | | | | | | |
ENERGY — 1.36% | | | | | | | | |
Oil, Gas & Consumable Fuels — 1.36% | | | | | | | | |
a Oasis Petroleum, Inc. | | | 316,300 | | | | 13,199,199 | |
| | | | | | | | |
| | | | | | | 13,199,199 | |
| | | | | | | | |
FOOD, BEVERAGE & TOBACCO — 3.83% | | | | | | | | |
Beverages — 1.40% | | | | | | | | |
a Monster Beverage Corp. | | | 195,700 | | | | 13,591,365 | |
Food Products — 2.43% | | | | | | | | |
a Annie’s, Inc. | | | 338,700 | | | | 13,612,353 | |
Mead Johnson Nutrition Co. | | | 120,200 | | | | 9,993,428 | |
| | | | | | | | |
| | | | | | | 37,197,146 | |
| | | | | | | | |
HEALTH CARE EQUIPMENT & SERVICES — 6.63% | | | | | | | | |
Health Care Equipment & Supplies — 1.12% | | | | | | | | |
a Novadaq Technologies, Inc. | | | 488,157 | | | | 10,876,138 | |
Health Care Providers & Services — 4.05% | | | | | | | | |
a Catamaran Corp. | | | 513,200 | | | | 22,970,832 | |
a Express Scripts Holding Company | | | 218,000 | | | | 16,369,620 | |
Health Care Technology — 1.46% | | | | | | | | |
a HMS Holdings Corp. | | | 382,500 | | | | 7,286,625 | |
a Veeva Systems, Inc. | | | 259,500 | | | | 6,928,650 | |
| | | | | | | | |
| | | | | | | 64,431,865 | |
| | | | | | | | |
MEDIA — 1.53% | | | | | | | | |
Media — 1.53% | | | | | | | | |
a Sirius XM Holdings, Inc. | | | 4,635,400 | | | | 14,833,280 | |
| | | | | | | | |
| | | | | | | 14,833,280 | |
| | | | | | | | |
PHARMACEUTICALS, BIOTECHNOLOGY & LIFE SCIENCES — 7.38% | | | | | | | | |
Biotechnology — 4.12% | | | | | | | | |
a Alexion Pharmaceuticals, Inc. | | | 88,200 | | | | 13,417,866 | |
a Gilead Sciences, Inc. | | | 374,558 | | | | 26,541,180 | |
Pharmaceuticals — 3.26% | | | | | | | | |
a Actavis plc | | | 67,081 | | | | 13,808,624 | |
a Valeant Pharmaceuticals International, Inc. | | | 135,700 | | | | 17,889,331 | |
| | | | | | | | |
| | | | | | | 71,657,001 | |
| | | | | | | | |
REAL ESTATE — 1.16% | | | | | | | | |
Real Estate Investment Trusts — 1.16% | | | | | | | | |
NorthStar Realty Finance Corp. | | | 700,200 | | | | 11,301,228 | |
| | | | | | | | |
| | | | | | | 11,301,228 | |
| | | | | | | | |
RETAILING — 13.74% | | | | | | | | |
Distributors — 1.60% | | | | | | | | |
a LKQ Corp. | | | 591,800 | | | | 15,593,930 | |
Internet & Catalog Retail — 6.01% | | | | | | | | |
a Amazon.com, Inc. | | | 82,300 | | | | 27,695,596 | |
Expedia, Inc. | | | 218,500 | | | | 15,841,250 | |
a priceline.com, Inc. | | | 12,432 | | | | 14,817,576 | |
Certified Semi-Annual Report 11
| | |
| SCHEDULE OF INVESTMENTS, CONTINUED | | |
| |
Thornburg Core Growth Fund | | March 31, 2014 (Unaudited) |
| | | | | | | | |
| | | Shares/
Principal Amount | | | Value | |
Multiline Retail — 1.92% | | | | | | | | |
a Dollar Tree, Inc. | | | 357,250 | | | $ | 18,641,305 | |
Specialty Retail — 4.21% | | | | | | | | |
a Francescas Holdings Corp. | | | 647,500 | | | | 11,745,650 | |
a Ulta Salon, Cosmetics & Fragrance, Inc. | | | 103,800 | | | | 10,118,424 | |
a Vitamin Shoppe, Inc. | | | 399,650 | | | | 18,991,368 | |
| | | | | | | | |
| | | | | | | 133,445,099 | |
| | | | | | | | |
SOFTWARE & SERVICES — 26.17% | | | | | | | | |
Information Technology Services — 3.97% | | | | | | | | |
a NeuStar, Inc. | | | 338,400 | | | | 11,001,384 | |
Visa, Inc. | | | 127,806 | | | | 27,588,203 | |
Internet Software & Services — 13.71% | | | | | | | | |
a eBay, Inc. | | | 320,100 | | | | 17,682,324 | |
a Equinix, Inc. | | | 82,200 | | | | 15,193,848 | |
a Google, Inc. | | | 22,566 | | | | 25,150,033 | |
a LinkedIn Corp. | | | 94,000 | | | | 17,384,360 | |
a Trulia, Inc. | | | 443,100 | | | | 14,710,920 | |
a VeriSign, Inc. | | | 358,327 | | | | 19,317,408 | |
a Yahoo!, Inc. | | | 399,300 | | | | 14,334,870 | |
a Yelp, Inc. | | | 121,000 | | | | 9,308,530 | |
Software — 8.49% | | | | | | | | |
a CommVault Systems, Inc. | | | 250,219 | | | | 16,251,724 | |
a Fleetmatics Group plc | | | 345,800 | | | | 11,567,010 | |
a Gigamon, Inc. | | | 351,600 | | | | 10,685,124 | |
a Guidewire Software, Inc. | | | 243,666 | | | | 11,951,817 | |
a Imperva, Inc. | | | 132,962 | | | | 7,405,984 | |
Solera Holdings, Inc. | | | 181,634 | | | | 11,504,698 | |
a Workday, Inc. | | | 142,800 | | | | 13,056,204 | |
| | | | | | | | |
| | | | | | | 254,094,441 | |
| | | | | | | | |
TECHNOLOGY HARDWARE & EQUIPMENT — 6.74% | | | | | | | | |
Communications Equipment — 3.65% | | | | | | | | |
a Aruba Networks, Inc. | | | 575,000 | | | | 10,781,250 | |
a F5 Networks, Inc. | | | 85,200 | | | | 9,084,876 | |
Qualcomm, Inc. | | | 198,144 | | | | 15,625,636 | |
Technology, Hardware, Storage & Peripherals — 3.09% | | | | | | | | |
Apple, Inc. | | | 33,361 | | | | 17,906,183 | |
a Stratasys Ltd. | | | 113,663 | | | | 12,058,508 | |
| | | | | | | | |
| | | | | | | 65,456,453 | |
| | | | | | | | |
TOTAL COMMON STOCK (Cost $675,344,495) | | | | | | | 913,524,297 | |
| | | | | | | | |
SHORT TERM INVESTMENTS — 4.68% | | | | | | | | |
Ameren Corp., 0.20%, 4/1/2014 | | $ | 9,400,000 | | | | 9,400,000 | |
Bank of New York Tri-Party Repurchase Agreement 0.24% dated 3/31/2014, due 4/1/2014, repurchase price $14,000,093 collateralized by 13 corporate debt securities and 8 U.S. government debt securities having an average coupon of 3.91%, a minimum credit rating of BBB-, maturity dates from 9/15/2018 to 3/30/2044, and having an aggregate market value of $14,660,580 at 3/31/2014 | | | 14,000,000 | | | | 14,000,000 | |
Kansas City Power & Light, 0.20%, 4/1/2014 | | | 8,000,000 | | | | 8,000,000 | |
Union Electric Co., 0.20%, 4/1/2014 | | | 14,000,000 | | | | 14,000,000 | |
| | | | | | | | |
TOTAL SHORT TERM INVESTMENTS (Cost $45,400,000) | | | | | | | 45,400,000 | |
| | | | | | | | |
TOTAL INVESTMENTS — 98.75% (Cost $720,744,495) | | | | | | $ | 958,924,297 | |
OTHER ASSETS LESS LIABILITIES — 1.25% | | | | | | | 12,176,160 | |
| | | | | | | | |
NET ASSETS — 100.00% | | | | | | $ | 971,100,457 | |
| | | | | | | | |
Footnote Legend
See notes to financial statements.
12 Certified Semi-Annual Report
This page intentionally left blank.
Certified Semi-Annual Report 13
| | |
| STATEMENT OF ASSETS AND LIABILITIES | | |
| |
Thornburg Core Growth Fund | | March 31, 2014 (Unaudited) |
| | | | |
ASSETS | | | | |
Investments at value (cost $720,744,495) (Note 2) | | $ | 958,924,297 | |
Cash | | | 710,018 | |
Receivable for investments sold | | | 16,043,261 | |
Receivable for fund shares sold | | | 2,841,586 | |
Dividends receivable | | | 67,400 | |
Interest receivable | | | 93 | |
Prepaid expenses and other assets | | | 32,484 | |
| | | | |
Total Assets | | | 978,619,139 | |
| | | | |
| |
LIABILITIES | | | | |
Payable for investments purchased | | | 4,556,267 | |
Payable for fund shares redeemed | | | 1,719,145 | |
Payable to investment advisor and other affiliates (Note 3) | | | 1,064,553 | |
Accounts payable and accrued expenses | | | 178,717 | |
| | | | |
Total Liabilities | | | 7,518,682 | |
| | | | |
| |
NET ASSETS | | $ | 971,100,457 | |
| | | | |
NET ASSETS CONSIST OF | | | | |
Net investment loss | | $ | (10,957,888 | ) |
Net unrealized appreciation on investments | | | 238,179,802 | |
Accumulated net realized gain (loss) | | | (398,394,770 | ) |
Net capital paid in on shares of beneficial interest | | | 1,142,273,313 | |
| | | | |
| | $ | 971,100,457 | |
| | | | |
14 Certified Semi-Annual Report
| | |
| STATEMENT OF ASSETS AND LIABILITIES, CONTINUED | | |
| |
Thornburg Core Growth Fund | | March 31, 2014 (Unaudited) |
| | | | |
| |
NET ASSET VALUE | | | | |
Class A Shares: | | | | |
Net asset value and redemption price per share ($332,777,050 applicable to 12,480,317 shares of beneficial interest outstanding - Note 4) | | $ | 26.66 | |
Maximum sales charge, 4.50% of offering price | | | 1.26 | |
| | | | |
Maximum offering price per share | | $ | 27.92 | |
| | | | |
| |
Class C Shares: | | | | |
Net asset value and offering price per share* ($211,808,066 applicable to 8,834,050 shares of beneficial interest outstanding - Note 4) | | $ | 23.98 | |
| | | | |
| |
Class I Shares: | | | | |
Net asset value, offering and redemption price per share ($243,350,975 applicable to 8,668,338 shares of beneficial interest outstanding - Note 4) | | $ | 28.07 | |
| | | | |
| |
Class R3 Shares: | | | | |
Net asset value, offering and redemption price per share ($102,454,716 applicable to 3,848,209 shares of beneficial interest outstanding - Note 4) | | $ | 26.62 | |
| | | | |
| |
Class R4 Shares: | | | | |
Net asset value, offering and redemption price per share ($11,215,291 applicable to 419,007 shares of beneficial interest outstanding - Note 4) | | $ | 26.77 | |
| | | | |
| |
Class R5 Shares: | | | | |
Net asset value, offering and redemption price per share ($69,494,359 applicable to 2,478,067 shares of beneficial interest outstanding - Note 4) | | $ | 28.04 | |
| | | | |
| * | Redemption price per share is equal to net asset value less any applicable contingent deferred sales charge. |
See notes to financial statements.
Certified Semi-Annual Report 15
| | |
| STATEMENT OF OPERATIONS | | |
| |
Thornburg Core Growth Fund | | Six Months Ended March 31, 2014 (Unaudited) |
| | | | |
INVESTMENT INCOME | | | | |
Dividend income | | $ | 1,435,730 | |
Interest income | | | 74,224 | |
| | | | |
Total Income | | | 1,509,954 | |
| | | | |
| |
EXPENSES | | | | |
Investment advisory fees (Note 3) | | | 3,943,323 | |
Administration fees (Note 3) | | | | |
Class A Shares | | | 198,431 | |
Class C Shares | | | 127,089 | |
Class I Shares | | | 55,983 | |
Class R3 Shares | | | 64,817 | |
Class R4 Shares | | | 6,973 | |
Class R5 Shares | | | 16,551 | |
Distribution and service fees (Note 3) | | | | |
Class A Shares | | | 397,904 | |
Class C Shares | | | 1,017,835 | |
Class R3 Shares | | | 259,600 | |
Class R4 Shares | | | 13,871 | |
Transfer agent fees | | | | |
Class A Shares | | | 161,020 | |
Class C Shares | | | 117,630 | |
Class I Shares | | | 45,427 | |
Class R3 Shares | | | 122,850 | |
Class R4 Shares | | | 14,910 | |
Class R5 Shares | | | 62,696 | |
Registration and filing fees | | | | |
Class A Shares | | | 1,820 | |
Class C Shares | | | 9,380 | |
Class I Shares | | | 9,982 | |
Class R3 Shares | | | 9,645 | |
Class R4 Shares | | | 9,616 | |
Class R5 Shares | | | 4,599 | |
Custodian fees (Note 3) | | | 48,850 | |
Professional fees | | | 35,160 | |
Accounting fees | | | 4,876 | |
Trustee fees | | | 11,520 | |
Other expenses | | | 55,150 | |
| | | | |
Total Expenses | | | 6,827,508 | |
Less: | | | | |
Expenses reimbursed by investment advisor (Note 3) | | | (205,943 | ) |
| | | | |
Net Expenses | | | 6,621,565 | |
| | | | |
Net Investment Loss | | $ | (5,111,611 | ) |
| | | | |
16 Certified Semi-Annual Report
| | |
| STATEMENT OF OPERATIONS, CONTINUED | | |
| |
Thornburg Core Growth Fund | | Six Months Ended March 31, 2014 (Unaudited) |
| | | | |
REALIZED AND UNREALIZED GAIN (LOSS) | | | | |
Net realized gain (loss) on investments | | $ | 74,797,182 | |
Net change in unrealized appreciation (depreciation) of investments | | | 7,150,451 | |
| | | | |
Net Realized and Unrealized Gain | | | 81,947,633 | |
| | | | |
Net Increase in Net Assets Resulting from Operations | | $ | 76,836,022 | |
| | | | |
See notes to financial statements.
Certified Semi-Annual Report 17
| | |
| STATEMENTS OF CHANGES IN NET ASSETS | | |
| |
Thornburg Core Growth Fund | | |
| | | | | | | | |
| | | Six Months Ended
March 31, 2014* | | | Year Ended
September 30, 2013 | |
INCREASE (DECREASE) IN NET ASSETS FROM | | | | | | | | |
| | |
OPERATIONS | | | | | | | | |
Net investment income (loss) | | $ | (5,111,611 | ) | | $ | (7,467,201 | ) |
Net realized gain (loss) on investments | | | 74,797,182 | | | | 89,533,234 | |
Net unrealized appreciation (depreciation) on investments | | | 7,150,451 | | | | 91,899,455 | |
| | | | | | | | |
| | |
Net Increase (Decrease) in Net Assets Resulting from Operations | | | 76,836,022 | | | | 173,965,488 | |
| | |
FUND SHARE TRANSACTIONS (NOTE 4) | | | | | | | | |
Class A Shares | | | 26,703,518 | | | | (4,076,655 | ) |
Class C Shares | | | 12,382,103 | | | | (11,865,291 | ) |
Class I Shares | | | 33,936,863 | | | | 35,348,688 | |
Class R3 Shares | | | (2,331,427 | ) | | | (33,481,490 | ) |
Class R4 Shares | | | (44,531 | ) | | | (1,324,992 | ) |
Class R5 Shares | | | 1,809,518 | | | | (12,974,765 | ) |
| | | | | | | | |
Net Increase in Net Assets | | | 149,292,066 | | | | 145,590,983 | |
| | |
NET ASSETS | | | | | | | | |
Beginning of Period | | | 821,808,391 | | | | 676,217,408 | |
| | | | | | | | |
| | |
End of Period | | $ | 971,100,457 | | | $ | 821,808,391 | |
| | | | | | | | |
See notes to financial statements.
18 Certified Semi-Annual Report
| | |
| NOTES TO FINANCIAL STATEMENTS | | |
| |
Thornburg Core Growth Fund | | March 31, 2014 (Unaudited) |
NOTE 1 – ORGANIZATION
Thornburg Core Growth Fund, hereinafter referred to as the “Fund,” is a diversified series of Thornburg Investment Trust (the “Trust”). The Trust is organized as a Massachusetts business trust under a Declaration of Trust dated June 3, 1987 and is registered as a diversified, open-end management investment company under the Investment Company Act of 1940, as amended. The Fund is currently one of eighteen separate series of the Trust. Each series is considered to be a separate entity for financial reporting and tax purposes and bears expenses directly attributable to it. The Fund seeks long-term capital appreciation by investing in equity securities selected for their growth potential.
The Fund currently offers six classes of shares of beneficial interest outstanding: Class A, Class C, Institutional Class (“Class I”), and Retirement Classes (“Class R3,” “Class R4,” and “Class R5”). Each class of shares of the Fund represents an interest in the same portfolio of investments, except that (i) Class A shares are sold subject to a front-end sales charge collected at the time the shares are purchased and bear a service fee, (ii) Class C shares are sold at net asset value without a sales charge at the time of purchase, but are subject to a contingent deferred sales charge upon redemption within one year of purchase, and bear both a service fee and a distribution fee, (iii) Class I and Class R5 shares are sold at net asset value without a sales charge at the time of purchase and may be subject to a service fee, (iv) Class R3 shares are sold at net asset value without a sales charge at the time of purchase, but bear both a service fee and distribution fee, (v) Class R4 shares are sold at net asset value without sales charge at the time of purchase, but bear a service fee, and (vi) the respective classes may have different reinvestment privileges and conversion rights. Additionally, the Fund may allocate among its classes certain expenses, to the extent allocable to specific classes, including transfer agent fees, government registration fees, certain printing and postage costs, and administrative and legal expenses. Currently, class specific expenses of the Fund are limited to service and distribution fees, administration fees, and certain registration and transfer agent expenses.
NOTE 2 – SIGNIFICANT ACCOUNTING POLICIES
Significant accounting policies of the Trust are as follows:
Valuation Policy and Procedures: The Fund’s Trustees of the Trust (the “Trustees”) have authorized employees of the Fund’s investment advisor, acting as the Valuation and Pricing Committee (the “Committee”), to make certain valuation determinations, subject to oversight and review by the Trustees and the Audit Committee of the Trustees. The Committee and other employees of the Fund’s investment advisor administer and implement the valuation process. The Committee regularly reviews its own fair value decisions, as well as valuations, valuation techniques and services furnished by pricing services, considers circumstances in the markets which may require valuation determinations by the Committee and reviews previous valuation determinations. The Committee also reports on its activities, the performance of the pricing services and other matters to the Trustees and the Audit Committee of the Trustees.
In determining a fair value for a portfolio investment, the Committee seeks to determine the price that the Fund would reasonably expect to receive upon a sale of the investment in an orderly transaction between market participants at the measurement date. Typically, the fair value process employs standing instructions to use quoted prices in active markets or the use of independent pricing services. Less frequently, the Committee may make a fair value determination using other methods. However, because fair value prices are estimated prices, the determination of fair value for an investment may differ from the value that would be realized by the Fund upon a sale of the investment, and that difference could be material to the Fund’s financial statements. The Committee’s determination of fair value for an investment may also differ from the prices obtained by other persons (including other mutual funds) for the investment.
Valuation of Investments: Portfolio investments listed or traded on a national securities exchange are valued on the valuation date at the last reported trade price on the exchange that is the primary market for the investment. Portfolio investments traded on an exchange for which there has been no trade that day and other equity investments traded in the over-the-counter market are valued at the mean between the last reported bid and ask prices. Portfolio investments reported by NASDAQ are valued at the NASDAQ official closing price. Any foreign investment traded on exchanges outside the United States is valued at the price of the investment on the exchange that is normally the investment’s primary market, as of the close of that exchange preceding the time of the Fund’s valuation measurement date.
In any case when the market value of an equity investment held by the Fund is not readily available, a determination of a fair value for the investment is made by the Committee. The Committee’s determinations are made using procedures in accordance with a policy approved by the Trustees, which may include the use of a price obtained from an independent pricing service. The pricing service ordinarily values equity investments in these instances using multi-factor models to adjust market prices based upon various inputs, including exchange data, depository receipt prices, futures, index data and other data. An investment’s market value is deemed not readily available whenever the exchange or market on which the investment is primarily traded is closed for the entire scheduled day of trading. Additionally, an investment’s market value may be deemed not readily available under other circumstances identified by the Trustees, including when developments occurring after the most recent close of the investment’s primary exchange or market, but before the most recent close of trading in Fund shares, or an unusual event or significant period of time occurring since the availability of a market quotation, create a question about the reliability of the investment’s market value. On days when market volatility thresholds pre-determined by the Trustees are exceeded, foreign equity investments held by the Fund may be valued using synthetic pricing obtained from
Certified Semi-Annual Report 19
| | |
| NOTES TO FINANCIAL STATEMENTS, CONTINUED | | |
| |
Thornburg Core Growth Fund | | March 31, 2014 (Unaudited) |
an independent pricing service approved by the Trustees, subject to the ability of the Committee to determine in any such instance to utilize market closing prices if the Committee considers closing prices to be more reliable.
Debt obligations held by the Fund have a primary over-the-counter market and are valued by an independent pricing service approved by the Trustees. The pricing service ordinarily values debt obligations at quoted bid prices. When quotations are not available, debt obligations held by the Fund are valued at evaluated prices determined by the pricing service using methods which include consideration of yields or prices of debt obligations of comparable quality, type of issue, coupon, maturity and rating, and indications as to value from dealers and general market conditions. Short-term obligations having remaining maturities of 60 days or less are ordinarily valued at amortized cost, which approximates market value.
In any case when a pricing service fails to provide a price for a debt obligation held by the Fund, the Committee determines a fair value for the debt obligation using procedures in accordance with a policy approved by the Trustees, which may include the use of a price obtained from a different independent pricing service. Additionally, in any case when management believes that a price provided by a pricing service for a debt obligation held by the Fund may be unreliable, the Committee decides whether or not to use the pricing service’s valuation or to use an alternative method to determine a fair value for the debt obligation.
Quotations in foreign currencies for foreign portfolio investments are converted to U.S. dollar equivalents using the foreign exchange quotation in effect at the time of valuation.
Valuation Measurements: The Fund categorizes its investments based upon the inputs used in valuing those investments, according to a three-level hierarchy established by guidance from the Financial Accounting Standards Board (the “FASB”). Categorization of investments using this hierarchy is intended by the FASB to maximize the use of observable inputs and minimize the use of unobservable inputs by prioritizing that the most observable input be used when available. Observable inputs are those that market participants would use in valuing an investment based on available market data. Unobservable inputs are those that reflect assumptions about the information market participants would use in valuing an investment. An investment’s level within the hierarchy is based on the lowest level input that is deemed significant to the fair value measurement. The methodologies and relative inputs used to value investments are not necessarily indications of the risk or liquidity associated with investing in those investments.
Various inputs are used in determining the fair value measurement of the Fund’s investments. These inputs are generally summarized according to the three-level hierarchy below:
Level 1: Quoted prices in active markets for identical investments.
Level 2: Other direct or indirect significant observable inputs (including quoted prices for similar investments in active markets and other observable inputs, such as interest rates, prepayment rates, credit risk, etc.).
When market volatility thresholds are exceeded, foreign equity investments may be fair valued according to other significant observable inputs rather than quoted market prices. The affected investments will be characterized as Level 2 within the valuation hierarchy and revert to Level 1 after the threshold is no longer exceeded.
Level 3: Significant unobservable inputs, (including the Committee’s own assumptions in determining the fair value of investments), are generally applicable to investments fair valued with single broker quotes and other investments.
Portfolio investments with minimal, if any, market activity are characterized as Level 3 and are valued using significant unobservable inputs, typically including single broker quotes, which may be adjusted or unadjusted, related or comparable investments, last available transactions, and other relevant information. Valuations may also be based upon current market prices of securities that are comparable in coupon, rating, maturity and industry. An income based valuation approach would consider discounted anticipated future cash flows of the investment. Discounts may also be applied due to the nature or duration of any restrictions on the disposition of the investment. The derived value of a Level 3 investment may not represent the value which is received upon disposition.
The following table displays a summary of the fair value hierarchy measurements of the Fund’s investments as of March 31, 2014. In any instance when valuation inputs from more than one level are used to determine the fair value of a specific investment, the investment is placed in the level of the table based upon the lowest level input that is significant in determining the fair value of the investment:
20 Certified Semi-Annual Report
| | |
| NOTES TO FINANCIAL STATEMENTS, CONTINUED | | |
| |
Thornburg Core Growth Fund | | March 31, 2014 (Unaudited) |
| | | | | | | | | | | | | | | | |
| | | Fair Value Measurements at March 31, 2014 | |
| | | Total | | | Level 1 | | | Level 2 | | | Level 3 | |
Assets | | | | | | | | | | | | | | | | |
Investments in Securities* | | | | | | | | | | | | | | | | |
Common Stock | | $ | 913,524,297 | | | $ | 913,524,297 | | | $ | — | | | $ | — | |
Short Term Investments | | | 45,400,000 | | | | — | | | | 45,400,000 | | | | — | |
| | | | | | | | | | | | | | | | |
Total Investments in Securities | | $ | 958,924,297 | | | $ | 913,524,297 | | | $ | 45,400,000 | | | $ | — | |
| * | See Schedule of Investments for a summary of the industry exposure as grouped according to the Global Industry Classification Standard (GICS), which is an industry taxonomy developed by MSCI, Inc. and Standard & Poor’s (S&P). |
In accordance with the guidance prescribed in Accounting Standards Update No. 2011-04, it is the policy of the Fund to recognize transfers between levels and those underlying events which caused the movement. The Fund recognized no transfers between levels for the six months ended March 31, 2014, other than when the Fund exceeded market volatility thresholds for foreign equity investments during the period.
Foreign Currency Translation: Portfolio investments and other assets and liabilities denominated in foreign currencies are translated into U.S. dollars based on the exchange rate of such currencies against the U.S. dollar on the date of valuation. Purchases and sales of investments and income items denominated in foreign currencies are translated into U.S. dollars at the exchange rate in effect on the transaction date. When the Fund purchases or sells foreign investments, it will customarily enter into a foreign exchange contract to minimize foreign exchange risk from the trade date to the settlement date of such transactions. The values of such spot contracts are included in receivable for investments sold and payable for investments purchased on the Statement of Assets and Liabilities.
The Fund does not separately report the effect of changes in foreign exchange rates from changes in market prices on investments held. Such changes are included in net unrealized appreciation or depreciation from investments.
Reported net realized gains or losses from foreign currency transactions arise due to purchases and sales of foreign currencies, currency gains or losses realized between the trade and settlement dates on investment transactions and the difference between the amounts of dividends, interest, and foreign withholding taxes recorded on the Fund’s books, and the U.S. dollar equivalent of the amounts actually received or paid.
Net change in unrealized appreciation and depreciation on foreign currency translations arise from changes in the fair value of assets and liabilities, other than investments at fiscal period end, resulting from changes in exchange rates.
Deferred Taxes: The Fund is subject to a tax imposed on net realized gains of securities of certain foreign countries. The Fund records an estimated deferred tax liability for net unrealized gains on these investments as reflected in the accompanying financial statements.
Federal Income Taxes: It is the policy of the Trust to comply with the provisions of the Internal Revenue Code applicable to “regulated investment companies” and to distribute to shareholders substantially all taxable income, including any net realized gain on investments of the Fund. Therefore, no provision for federal income taxes is required.
Management reviews each uncertain tax position believed to be material to the preparation of the Fund’s financial statements, to assess if it is more likely than not that the position would be sustained upon examination, based upon the technical merits of the position. As of March 31, 2014, management has not identified any such position for which an asset or liability must be reflected in the Statement of Assets and Liabilities. The Fund’s tax returns remain subject to examination for three years after filing.
When-Issued and Delayed Delivery Transactions: The Fund may engage in when-issued or delayed delivery transactions. To the extent the Fund engages in such transactions, it will do so for the purpose of acquiring portfolio investments consistent with the Fund’s investment objectives and not for the purpose of investment leverage or to speculate on interest rate and/or market changes. At the time the Fund makes a commitment to purchase an investment on a when-issued or delayed delivery basis, the Fund will record the transaction and reflect the value in determining its net asset value. When effecting such transactions, assets of an amount sufficient to make payment for the portfolio investments to be purchased will be segregated on the Fund’s records on the trade date. Investments purchased on a when-issued or delayed delivery basis do not earn interest until the settlement date.
Dividends: Dividends to shareholders, if any, are generally paid quarterly and are reinvested in additional shares of the Fund at net asset value per share at the close of business on the dividend payment date or, at the shareholder’s option, paid in cash. Net realized capital gains, to the extent available, will be distributed at least annually. Distributions to shareholders are based on income tax regulations and therefore, their characteristics may differ for financial statement and tax purposes.
Repurchase Agreements: The Fund may invest excess cash in repurchase agreements whereby the Fund purchases investments, which serve as collateral, with an agreement to resell such collateral to the seller at an agreed upon price at the maturity date of the repurchase agreement. Investments pledged as collateral for repurchase agreements are held in custody until maturity of the repurchase
Certified Semi-Annual Report 21
| | |
| NOTES TO FINANCIAL STATEMENTS, CONTINUED | | |
| |
Thornburg Core Growth Fund | | March 31, 2014 (Unaudited) |
agreement. Provisions in the agreements require that the market value of the collateral is at least equal to the repurchase value in the event of default. In the event of default, the Fund has the right to liquidate the collateral and apply the proceeds in satisfaction of the obligation. Under certain circumstances, in the event of default or bankruptcy by the other party to the agreement, realization and/or retention of the collateral may be subject to legal proceedings.
General: Investment transactions are accounted for on a trade date basis. Interest income is accrued as earned and dividend income is recorded on the ex-dividend date. Certain income from foreign investments is recognized as soon as information is available to the Fund. Realized gains and losses from the sale of investments are recorded on an identified cost basis. Net investment income (other than class specific expenses) and realized and unrealized gains and losses are allocated daily to each class of shares based upon the relative net asset value of outstanding shares of each class of shares at the beginning of the day (after adjusting for the current share activity of the respective class). Expenses common to all Funds are allocated among the Funds comprising the Trust based upon their relative net asset values or other appropriate allocation methods.
Guarantees and Indemnifications: Under the Trust’s organizational documents (and under separate agreements with the independent Trustees), its officers and Trustees are indemnified against certain liabilities arising out of the performance of their duties to the Fund. Additionally, in the normal course of business the Trust enters into contracts with service providers that contain general indemnification clauses. The Trust’s maximum exposure under these arrangements is unknown. However, based on experience, the Trust expects the risk of loss to be remote.
Use of Estimates: The preparation of financial statements, in conformity with United States generally accepted accounting principles, requires management to make estimates and assumptions that affect the reported amounts of assets and liabilities and the disclosure of contingent assets and liabilities at the date of the financial statements and the reported amounts of increases and decreases in net assets from operations during the reporting period. Actual amounts could differ from those estimates.
NOTE 3 – INVESTMENT ADVISORY FEE AND OTHER TRANSACTIONS WITH AFFILIATES
Pursuant to an investment advisory agreement, Thornburg Investment Management, Inc. (the “Advisor”) serves as the investment advisor and performs services for the Fund for which the fees are payable at the end of each month. For the six months ended March 31, 2014, these fees were payable at annual rates ranging from .875 of 1% to .675 of 1% per annum of the average daily net assets of the Fund depending on the Fund’s asset size. The Trust also has entered into administrative services agreements with the Advisor, whereby the Advisor will perform certain administrative services for the shareholders of each class of the Fund’s shares, and for which fees will be payable at an annual rate of up to .125 of 1% per annum of the average daily net assets attributable to each class of shares.
The Trust has an underwriting agreement with Thornburg Securities Corporation (the “Distributor,” an affiliate of the Advisor), which acts as the distributor of the Fund’s shares. For the six months ended March 31, 2014, the Distributor has advised the Fund that it earned commissions aggregating $68,918 from the sale of Class A shares, and collected contingent deferred sales charges aggregating $3,721 from redemptions of Class C shares of the Fund.
Pursuant to a service plan under Rule 12b-1 of the Investment Company Act of 1940, the Fund may reimburse to the Advisor an amount not to exceed .25 of 1% per annum of the average daily net assets attributable to each class of shares of the Fund for payments made by the Advisor to securities dealers and other financial institutions to obtain various shareholder and distribution related services. For the six months ended March 31, 2014, there were no 12b-1 service plan fees charged for Class I and R5 shares. The Advisor may pay out of its own resources additional expenses for distribution of the Fund’s shares.
The Trust has also adopted distribution plans pursuant to Rule 12b-1, applicable only to the Fund’s Class C and Class R3 shares, under which the Fund compensates the Distributor for services in promoting the sale of Class C and Class R3 shares of the Fund at an annual rate of up to .75 of 1% per annum of the average daily net assets attributable to Class C shares, and an annual rate of up to .25 of 1% per annum of the average daily net assets attributable to Class R3 shares. Total fees incurred by each class of shares of the Fund under their respective service and distribution plans for the six months ended March 31, 2014, are set forth in the Statement of Operations.
The Advisor and Distributor have contractually agreed to waive fees and reimburse expenses incurred by the Fund so that actual expenses of certain share classes do not exceed specified levels. The agreement may be terminated by the Fund at any time, but may not be terminated by the Advisor or Distributor before February 1, 2015, unless the Advisor ceases to be the investment advisor to the Fund or the Distributor ceases to be the distributor of the Fund prior to that date. The Advisor and Distributor retain the right to be repaid by the Fund for fee waivers and expense reimbursements if expenses fall below the contractual limit prior to the end of the fiscal year.
For the six months ended March 31, 2014, the Advisor contractually reimbursed certain class specific expenses, administrative fees, and distribution fees of $125 for Class I shares, $138,298 for Class R3 shares, $16,718 for Class R4 shares, and $50,802 for Class R5 shares.
22 Certified Semi-Annual Report
| | |
| NOTES TO FINANCIAL STATEMENTS, CONTINUED | | |
| |
Thornburg Core Growth Fund | | March 31, 2014 (Unaudited) |
The Trust has an agreement with the custodian bank to indirectly pay a portion of the custodian’s fees through credits earned by the Fund’s cash on deposit with the bank. This deposit agreement is an alternative to overnight investments. Custodial fees are adjusted to reflect amounts that would have been paid without this agreement, with a corresponding adjustment reflected as fees paid indirectly in the Statement of Operations. For the six months ended March 31, 2014, there were no fees paid indirectly.
Certain officers and Trustees of the Trust are also officers or directors of the Advisor and Distributor. The compensation of independent Trustees is borne by the Trust.
NOTE 4 – SHARES OF BENEFICIAL INTEREST
At March 31, 2014, there were an unlimited number of shares of beneficial interest authorized. Transactions in shares of beneficial interest were as follows:
| | | | | | | | | | | | | | | | |
| | | Six Months Ended
March 31, 2014 (Unaudited) | | | Year Ended
September 30, 2013 (Audited) | |
| | | Shares | | | Amount | | | Shares | | | Amount | |
Class A Shares | | | | | | | | | | | | | | | | |
Shares sold | | | 2,062,487 | | | $ | 54,841,087 | | | | 2,284,279 | | | $ | 50,203,570 | |
Shares issued to shareholders in reinvestment of dividends | | | — | | | | — | | | | — | | | | — | |
Shares repurchased | | | (1,061,223 | ) | | | (28,137,569 | ) | | | (2,627,034 | ) | | | (54,280,225 | ) |
| | | | | | | | | | | | | | | | |
| | | | |
Net increase (decrease) | | | 1,001,264 | | | $ | 26,703,518 | | | | (342,755 | ) | | $ | (4,076,655 | ) |
| | | | | | | | | | | | | | | | |
| | | | |
Class C Shares | | | | | | | | | | | | | | | | |
Shares sold | | | 1,073,445 | | | $ | 25,963,787 | | | | 860,568 | | | $ | 16,907,911 | |
Shares issued to shareholders in reinvestment of dividends | | | — | | | | — | | | | — | | | | — | |
Shares repurchased | | | (566,486 | ) | | | (13,581,684 | ) | | | (1,543,834 | ) | | | (28,773,202 | ) |
| | | | | | | | | | | | | | | | |
| | | | |
Net increase (decrease) | | | 506,959 | | | $ | 12,382,103 | | | | (683,266 | ) | | $ | (11,865,291 | ) |
| | | | | | | | | | | | | | | | |
| | | | |
Class I Shares | | | | | | | | | | | | | | | | |
Shares sold | | | 2,083,913 | | | $ | 58,988,104 | | | | 3,194,049 | | | $ | 69,306,485 | |
Shares issued to shareholders in reinvestment of dividends | | | — | | | | — | | | | — | | | | — | |
Shares repurchased | | | (894,798 | ) | | | (25,051,241 | ) | | | (1,545,666 | ) | | | (33,957,797 | ) |
| | | | | | | | | | | | | | | | |
| | | | |
Net increase (decrease) | | | 1,189,115 | | | $ | 33,936,863 | | | | 1,648,383 | | | $ | 35,348,688 | |
| | | | | | | | | | | | | | | | |
| | | | |
Class R3 Shares | | | | | | | | | | | | | | | | |
Shares sold | | | 765,917 | | | $ | 20,172,698 | | | | 1,081,265 | | | $ | 22,913,573 | |
Shares issued to shareholders in reinvestment of dividends | | | — | | | | — | | | | — | | | | — | |
Shares repurchased | | | (845,393 | ) | | | (22,504,125 | ) | | | (2,720,256 | ) | | | (56,395,063 | ) |
| | | | | | | | | | | | | | | | |
| | | | |
Net increase (decrease) | | | (79,476 | ) | | $ | (2,331,427 | ) | | | (1,638,991 | ) | | $ | (33,481,490 | ) |
| | | | | | | | | | | | | | | | |
| | | | |
Class R4 Shares | | | | | | | | | | | | | | | | |
Shares sold | | | 101,645 | | | $ | 2,727,736 | | | | 227,815 | | | $ | 4,772,964 | |
Shares issued to shareholders in reinvestment of dividends | | | — | | | | — | | | | — | | | | — | |
Shares repurchased | | | (103,092 | ) | | | (2,772,267 | ) | | | (294,538 | ) | | | (6,097,956 | ) |
| | | | | | | | | | | | | | | | |
| | | | |
Net increase (decrease) | | | (1,447 | ) | | $ | (44,531 | ) | | | (66,723 | ) | | $ | (1,324,992 | ) |
| | | | | | | | | | | | | | | | |
| | | | |
Class R5 Shares | | | | | | | | | | | | | | | | |
Shares sold | | | 575,191 | | | $ | 16,092,194 | | | | 669,413 | | | $ | 14,671,998 | |
Shares issued to shareholders in reinvestment of dividends | | | — | | | | — | | | | — | | | | — | |
Shares repurchased | | | (528,739 | ) | | | (14,282,676 | ) | | | (1,312,898 | ) | | | (27,646,763 | ) |
| | | | | | | | | | | | | | | | |
| | | | |
Net increase (decrease) | | | 46,452 | | | $ | 1,809,518 | | | | (643,485 | ) | | $ | (12,974,765 | ) |
| | | | | | | | | | | | | | | | |
Certified Semi-Annual Report 23
| | |
| NOTES TO FINANCIAL STATEMENTS, CONTINUED | | |
| |
Thornburg Core Growth Fund | | March 31, 2014 (Unaudited) |
NOTE 5 – INVESTMENT TRANSACTIONS
For the six months ended March 31, 2014, the Fund had purchase and sale transactions of investments (excluding short-term investments) of $458,487,973 and $370,014,724, respectively.
NOTE 6 – INCOME TAXES
At March 31, 2014, information on the tax components of capital was as follows:
| | | | |
Cost of investments for tax purposes | | $ | 720,744,495 | |
| | | | |
Gross unrealized appreciation on a tax basis | | $ | 256,870,953 | |
Gross unrealized depreciation on a tax basis | | | (18,691,151 | ) |
| | | | |
Net unrealized appreciation (depreciation) on investments (tax basis) | | $ | 238,179,802 | |
| | | | |
At March 31, 2014, the Fund had deferred tax basis late-year net ordinary investment losses of $5,846,277. For tax purposes, such losses will be reflected in the year ending September 30, 2014.
At March 31, 2014, the Fund had cumulative tax basis capital losses generated prior to October 1, 2011, which may be carried forward to offset future capital gains. To the extent such carryforwards are used, capital gain distributions may be reduced to the extent provided by regulations.
Such capital loss carryforwards expire as follows:
| | | | |
2017 | | $ | 219,766,404 | |
2018 | | | 253,358,410 | |
| | | | |
| | $ | 473,124,814 | |
| | | | |
NOTE 7 – DERIVATIVE FINANCIAL INSTRUMENTS WITH OFF-BALANCE SHEET RISK AND FOREIGN INVESTMENT RISK
The Fund may use a variety of derivative financial instruments to hedge or adjust the risks affecting its investment portfolio or to enhance investment returns. Provisions of FASB Accounting Standards Codification ASC 815-10-50 (“ASC 815”), require certain disclosures. The disclosures are intended to provide users of financial statements with an understanding of the use of derivative instruments by the Fund and how these derivatives affect the financial position, financial performance and cash flows of the Fund. The Fund does not designate any derivative instruments as hedging instruments under ASC 815. Additionally, the Fund’s risk of loss may exceed the amounts recognized on the Statement of Assets and Liabilities.
During the six months ended March 31, 2014, the Fund did not invest in any derivative financial instruments of the type addressed by ASC 815.
OTHER NOTES:
Risks: The Fund’s investments subject it to risks including, but not limited to, management risk, market and economic risk, risks affecting specific issuers, liquidity risk, the risks associated with investments in smaller companies and non-U.S. issuers, credit risk, and interest rate risk. Please see the Fund’s prospectus for a discussion of the risks associated with an investment in the Fund.
Subsequent Events: Fund management believes no events have occurred between March 31, 2014 and the date of issuance of the financial statements that require adjustment to or disclosure in the accompanying financial statements.
24 Certified Semi-Annual Report
This page intentionally left blank.
Certified Semi-Annual Report 25
FINANCIAL HIGHLIGHTS
Thornburg Core Growth Fund
| | | | | | | | | | | | | | | | | | | | | | | | | | | | | | | | | | | | | | | | | | | | | | | | | | | | | | |
| | | PER SHARE PERFORMANCE (for a share outstanding throughout the
Period)+ | | RATIOS TO AVERAGE NET ASSETS | | | SUPPLEMENTAL DATA | |
Unless
Otherwise
Noted,
Periods
are
Fiscal
Years
Ended
Sept. 30, | | Net Asset
Value
Beginning
of Period | | | Net
Investment
Income
(Loss) | | | Net
Realized
&
Unrealized
Gain(Loss)
on
Investments | | | Total from
Investment
Operations | | | Dividends
from Net
Investment
Income | | | Dividends
from Net
Realized
Gains | | Total
Dividends | | | Net
Asset
Value
End
of
Period | | Net
Investment
Income
(Loss)
(%) | | | Expenses,
After
Expense
Reductions
(%) | | | Expenses,
After
Expense
Reductions
and
Net of
Custody
Credits
(%) | | | Expenses,
Before
Expense
Reductions
(%) | | | Total
Return
(%)(a) | | | Portfolio
Turnover
Rate
(%)(a) | | Net
Assets
at End
of
Period
(Thousands) | |
Class A Shares | | | | | | | | | | | | | | | | | | | | | | | | | | | | | | | | | | | | | | | | | | | | | | | |
2014(b)(c) | | $ | 24.35 | | | | (0.14 | ) | | | 2.45 | | | | 2.31 | | | | — | | | — | | | — | | | $26.66 | | | (1.04 | )(d) | | | 1.36 | (d) | | | 1.36 | (d) | | | 1.36 | (d) | | | 9.49 | | | 43.15 | | $ | 332,777 | |
2013(b) | | $ | 19.11 | | | | (0.21 | ) | | | 5.45 | | | | 5.24 | | | | — | | | — | | | — | | | $24.35 | | | (1.01 | ) | | | 1.45 | | | | 1.45 | | | | 1.45 | | | | 27.42 | | | 91.92 | | $ | 279,483 | |
2012(b) | | $ | 13.33 | | | | (0.17 | ) | | | 5.95 | | | | 5.78 | | | | — | | | — | | | — | | | $19.11 | | | (1.02 | ) | | | 1.48 | | | | 1.49 | | | | 1.48 | | | | 43.36 | | | 122.93 | | $ | 225,945 | |
2011(b) | | $ | 13.81 | | | | (0.15 | ) | | | (0.33 | ) | | | (0.48 | ) | | | — | | | — | | | — | | | $13.33 | | | (0.96 | ) | | | 1.45 | | | | 1.45 | | | | 1.45 | | | | (3.48 | ) | | 80.53 | | $ | 208,135 | |
2010(b) | | $ | 13.61 | | | | (0.15 | ) | | | 0.35 | | | | 0.20 | | | | — | | | — | | | — | | | $13.81 | | | (1.09 | ) | | | 1.48 | | | | 1.48 | | | | 1.48 | | | | 1.47 | | | 75.06 | | $ | 372,954 | |
2009(b) | | $ | 13.36 | | | | (0.09 | ) | | | 0.34 | | | | 0.25 | | | | — | | | — | | | — | | | $13.61 | | | (0.81 | ) | | | 1.48 | | | | 1.48 | | | | 1.49 | | | | 1.87 | | | 82.86 | | $ | 511,065 | |
Class C Shares | | | | | | | | | | | | | | | | | | | | | | | | | | | | | | | | | | | | | | | | | | | | | | | |
2014(c) | | $ | 21.98 | | | | (0.22 | ) | | | 2.22 | | | | 2.00 | | | | — | | | — | | | — | | | $23.98 | | | (1.81 | )(d) | | | 2.14 | (d) | | | 2.14 | (d) | | | 2.14 | (d) | | | 9.10 | | | 43.15 | | $ | 211,808 | |
2013 | | $ | 17.38 | | | | (0.34 | ) | | | 4.94 | | | | 4.60 | | | | — | | | — | | | — | | | $21.98 | | | (1.76 | ) | | | 2.20 | | | | 2.20 | | | | 2.20 | | | | 26.47 | | | 91.92 | | $ | 182,999 | |
2012 | | $ | 12.22 | | | | (0.28 | ) | | | 5.44 | | | | 5.16 | | | | — | | | — | | | — | | | $17.38 | | | (1.79 | ) | | | 2.25 | | | | 2.25 | | | | 2.25 | | | | 42.23 | | | 122.93 | | $ | 156,597 | |
2011 | | $ | 12.75 | | | | (0.24 | ) | | | (0.29 | ) | | | (0.53 | ) | | | — | | | — | | | — | | | $12.22 | | | (1.71 | ) | | | 2.20 | | | | 2.20 | | | | 2.20 | | | | (4.16 | ) | | 80.53 | | $ | 137,799 | |
2010 | | $ | 12.66 | | | | (0.23 | ) | | | 0.32 | | | | 0.09 | | | | — | | | — | | | — | | | $12.75 | | | (1.84 | ) | | | 2.23 | | | | 2.23 | | | | 2.23 | | | | 0.71 | | | 75.06 | | $ | 215,413 | |
2009 | | $ | 12.53 | | | | (0.16 | ) | | | 0.29 | | | | 0.13 | | | | — | | | — | | | — | | | $12.66 | | | (1.59 | ) | | | 2.26 | | | | 2.26 | | | | 2.26 | | | | 1.04 | | | 82.86 | | $ | 289,224 | |
Class I Shares | | | | | | | | | | | | | | | | | | | | | | | | | | | | | | | | | | | | | | | | | | | | | | | |
2014(c) | | $ | 25.59 | | | | (0.09 | ) | | | 2.57 | | | | 2.48 | | | | — | | | — | | | — | | | $28.07 | | | (0.66 | )(d) | | | 0.98 | (d) | | | 0.98 | (d) | | | 0.98 | (d) | | | 9.69 | | | 43.15 | | $ | 243,351 | |
2013 | | $ | 19.99 | | | | (0.12 | ) | | | 5.72 | | | | 5.60 | | | | — | | | — | | | — | | | $25.59 | | | (0.55 | ) | | | 0.99 | | | | 0.99 | | | | 1.02 | | | | 28.01 | | | 91.92 | | $ | 191,358 | |
2012 | | $ | 13.88 | | | | (0.09 | ) | | | 6.20 | | | | 6.11 | | | | — | | | — | | | — | | | $19.99 | | | (0.52 | ) | | | 0.99 | | | | 0.99 | | | | 1.08 | | | | 44.02 | | | 122.93 | | $ | 116,567 | |
2011 | | $ | 14.31 | | | | (0.08 | ) | | | (0.35 | ) | | | (0.43 | ) | | | — | | | — | | | — | | | $13.88 | | | (0.49 | ) | | | 0.99 | | | | 0.99 | | | | 1.07 | | | | (3.00 | ) | | 80.53 | | $ | 114,679 | |
2010 | | $ | 14.04 | | | | (0.09 | ) | | | 0.36 | | | | 0.27 | | | | — | | | — | | | — | | | $14.31 | | | (0.60 | ) | | | 0.99 | | | | 0.99 | | | | 1.08 | | | | 1.92 | | | 75.06 | | $ | 172,126 | |
2009 | | $ | 13.71 | | | | (0.03 | ) | | | 0.36 | | | | 0.33 | | | | — | | | — | | | — | | | $14.04 | | | (0.29 | ) | | | 0.97 | | | | 0.97 | | | | 1.08 | | | | 2.41 | | | 82.86 | | $ | 218,300 | |
Class R3 Shares | | | | | | | | | | | | | | | | | | | | | | | | | | | | | | | | | | | | | | | | | | | | | | | |
2014(c) | | $ | 24.33 | | | | (0.16 | ) | | | 2.45 | | | | 2.29 | | | | — | | | — | | | — | | | $26.62 | | | (1.18 | )(d) | | | 1.50 | (d) | | | 1.50 | (d) | | | 1.77 | (d) | | | 9.41 | | | 43.15 | | $ | 102,455 | |
2013 | | $ | 19.11 | | | | (0.22 | ) | | | 5.44 | | | | 5.22 | | | | — | | | — | | | — | | | $24.33 | | | (1.06 | ) | | | 1.50 | | | | 1.50 | | | | 1.79 | | | | 27.32 | | | 91.92 | | $ | 95,545 | |
2012 | | $ | 13.33 | | | | (0.18 | ) | | | 5.96 | | | | 5.78 | | | | — | | | — | | | — | | | $19.11 | | | (1.04 | ) | | | 1.50 | | | | 1.50 | | | | 1.80 | | | | 43.36 | | | 122.93 | | $ | 106,353 | |
2011 | | $ | 13.82 | | | | (0.16 | ) | | | (0.33 | ) | | | (0.49 | ) | | | — | | | — | | | — | | | $13.33 | | | (1.01 | ) | | | 1.50 | | | | 1.50 | | | | 1.77 | | | | (3.55 | ) | | 80.53 | | $ | 109,127 | |
2010 | | $ | 13.62 | | | | (0.15 | ) | | | 0.35 | | | | 0.20 | | | | — | | | — | | | — | | | $13.82 | | | (1.11 | ) | | | 1.50 | | | | 1.50 | | | | 1.79 | | | | 1.47 | | | 75.06 | | $ | 212,360 | |
2009 | | $ | 13.37 | | | | (0.09 | ) | | | 0.34 | | | | 0.25 | | | | — | | | — | | | — | | | $13.62 | | | (0.84 | ) | | | 1.49 | | | | 1.49 | | | | 1.76 | | | | 1.87 | | | 82.86 | | $ | 278,576 | |
Class R4 Shares | | | | | | | | | | | | | | | | | | | | | | | | | | | | | | | | | | | | | | | | | | | | | | | |
2014(c) | | $ | 24.44 | | | | (0.14 | ) | | | 2.47 | | | | 2.33 | | | | — | | | — | | | — | | | $26.77 | | | (1.07 | )(d) | | | 1.40 | (d) | | | 1.40 | (d) | | | 1.70 | (d) | | | 9.53 | | | 43.15 | | $ | 11,215 | |
2013 | | $ | 19.18 | | | | (0.20 | ) | | | 5.46 | | | | 5.26 | | | | — | | | — | | | — | | | $24.44 | | | (0.96 | ) | | | 1.40 | | | | 1.40 | | | | 1.79 | | | | 27.42 | | | 91.92 | | $ | 10,277 | |
2012 | | $ | 13.37 | | | | (0.16 | ) | | | 5.97 | | | | 5.81 | | | | — | | | — | | | — | | | $19.18 | | | (0.93 | ) | | | 1.40 | | | | 1.40 | | | | 1.78 | | | | 43.46 | | | 122.93 | | $ | 9,344 | |
2011 | | $ | 13.84 | | | | (0.14 | ) | | | (0.33 | ) | | | (0.47 | ) | | | — | | | — | | | — | | | $13.37 | | | (0.91 | ) | | | 1.40 | | | | 1.40 | | | | 1.76 | | | | (3.40 | ) | | 80.53 | | $ | 10,423 | |
2010 | | $ | 13.63 | | | | (0.14 | ) | | | 0.35 | | | | 0.21 | | | | — | | | — | | | — | | | $13.84 | | | (1.01 | ) | | | 1.40 | | | | 1.40 | | | | 1.73 | | | | 1.54 | | | 75.06 | | $ | 24,968 | |
2009 | | $ | 13.37 | | | | (0.08 | ) | | | 0.34 | | | | 0.26 | | | | — | | | — | | | — | | | $13.63 | | | (0.77 | ) | | | 1.40 | | | | 1.40 | | | | 1.83 | | | | 1.94 | | | 82.86 | | $ | 30,871 | |
Class R5 Shares | | | | | | | | | | | | | | | | | | | | | | | | | | | | | | | | | | | | | | | | | | | | | | | |
2014(c) | | $ | 25.56 | | | | (0.09 | ) | | | 2.57 | | | | 2.48 | | | | — | | | — | | | — | | | $28.04 | | | (0.66 | )(d) | | | 0.99 | (d) | | | 0.99 | (d) | | | 1.14 | (d) | | | 9.70 | | | 43.15 | | $ | 69,494 | |
2013 | | $ | 19.97 | | | | (0.12 | ) | | | 5.71 | | | | 5.59 | | | | — | | | — | | | — | | | $25.56 | | | (0.55 | ) | | | 0.99 | | | | 0.99 | | | | 1.12 | | | | 27.99 | | | 91.92 | | $ | 62,146 | |
2012 | | $ | 13.86 | | | | (0.09 | ) | | | 6.20 | | | | 6.11 | | | | — | | | — | | | — | | | $19.97 | | | (0.52 | ) | | | 0.98 | | | | 0.99 | | | | 1.32 | | | | 44.08 | | | 122.93 | | $ | 61,411 | |
2011 | | $ | 14.30 | | | | (0.08 | ) | | | (0.36 | ) | | | (0.44 | ) | | | — | | | — | | | — | | | $13.86 | | | (0.51 | ) | | | 0.99 | | | | 0.99 | | | | 1.22 | | | | (3.08 | ) | | 80.53 | | $ | 66,901 | |
2010 | | $ | 14.02 | | | | (0.08 | ) | | | 0.36 | | | | 0.28 | | | | — | | | — | | | — | | | $14.30 | | | (0.60 | ) | | | 0.99 | | | | 0.99 | | | | 1.18 | | | | 2.00 | | | 75.06 | | $ | 324,963 | |
2009 | | $ | 13.70 | | | | (0.04 | ) | | | 0.36 | | | | 0.32 | | | | — | | | — | | | — | | | $14.02 | | | (0.34 | ) | | | 0.99 | | | | 0.99 | | | | 1.27 | | | | 2.34 | | | 82.86 | | $ | 323,268 | |
| (a) | Not annualized for periods less than one year. |
| (b) | Sales loads are not reflected in computing total return. |
| (c) | Unaudited Six Month Period Ended March 31. |
| + | Based on weighted average shares outstanding, except for Dividends from Net Investment Income and Net Realized Gains, which are actual amounts per share. |
See notes to financial statements.
| | | | |
| 26 Certified Semi-Annual Report | | | | Certified Semi-Annual Report 27 |
| | |
| EXPENSE EXAMPLE | | |
| |
Thornburg Core Growth Fund | | March 31, 2014 (Unaudited) |
As a shareholder of the Fund, you incur two types of costs:
| | (1) | transaction costs, including |
(a) sales charges (loads) on purchase payments, for Class A shares;
(b) a deferred sales charge on redemptions of any part or all of a purchase of $1 million of Class A shares within 12 months of purchase;
(c) a deferred sales charge on redemptions of Class C shares within 12 months of purchase;
| | (2) | ongoing costs, including management fees; distribution and/or service (12b-1) fees; and other Fund expenses. |
This example is intended to help you understand your ongoing costs (in dollars) of investing in the Fund and to compare these costs with the ongoing costs of investing in other mutual funds.
The example is based on a $1,000 investment beginning on October 1, 2013, and held until March 31, 2014.
| | | | | | | | | | | | |
| | | Beginning
Account Value
10/1/13 | | | Ending
Account Value
3/31/14 | | | Expenses paid
During period†
10/1/13–3/31/14 | |
Class A Shares | | | | | | | | | | | | |
Actual | | $ | 1,000.00 | | | $ | 1,094.90 | | | $ | 7.12 | |
Hypothetical* | | $ | 1,000.00 | | | $ | 1,018.13 | | | $ | 6.86 | |
Class C Shares | | | | | | | | | | | | |
Actual | | $ | 1,000.00 | | | $ | 1,091.00 | | | $ | 11.14 | |
Hypothetical* | | $ | 1,000.00 | | | $ | 1,014.28 | | | $ | 10.73 | |
Class I Shares | | | | | | | | | | | | |
Actual | | $ | 1,000.00 | | | $ | 1,096.90 | | | $ | 5.15 | |
Hypothetical* | | $ | 1,000.00 | | | $ | 1,020.02 | | | $ | 4.96 | |
Class R3 Shares | | | | | | | | | | | | |
Actual | | $ | 1,000.00 | | | $ | 1,094.10 | | | $ | 7.83 | |
Hypothetical* | | $ | 1,000.00 | | | $ | 1,017.45 | | | $ | 7.54 | |
Class R4 Shares | | | | | | | | | | | | |
Actual | | $ | 1,000.00 | | | $ | 1,095.30 | | | $ | 7.31 | |
Hypothetical* | | $ | 1,000.00 | | | $ | 1,017.95 | | | $ | 7.04 | |
Class R5 Shares | | | | | | | | | | | | |
Actual | | $ | 1,000.00 | | | $ | 1,097.00 | | | $ | 5.15 | |
Hypothetical* | | $ | 1,000.00 | | | $ | 1,020.02 | | | $ | 4.96 | |
| † | Expenses are equal to the annualized expense ratio for each class (A: 1.36%; C: 2.14%; I: 0.98%; R3: 1.50%; R4: 1.40%; R5: 0.99%) multiplied by the average account value over the period, multiplied by 182/365 to reflect the one-half year period. |
| * | Hypothetical assumes a rate of return of 5% per year before expenses. |
ACTUAL EXPENSES
For each class of shares, the first line of the accompanying table provides information about actual account values and actual expenses. You may use the information in this line, together with the amount you invested, to estimate the expenses that you paid over the period. Simply divide your account value by $1,000 (for example, an $8,600 account value divided by $1,000 = 8.6), then multiply the result by the number in the first line for your class of shares under the heading entitled “Expenses Paid During Period” to estimate the expenses you paid on your account during this period.
HYPOTHETICAL EXAMPLE FOR COMPARISON PURPOSES
For each class of shares, the second line of the accompanying table provides information about hypothetical account values and hypothetical expenses based on the Fund’s actual expense ratio and an assumed rate of return of 5% per year before expenses, which is not the Fund’s actual return. The hypothetical account values and expenses may not be used to estimate the actual ending account balance or expenses you paid for the period. You may use this information to compare the ongoing costs of investing in the Fund and other funds. To do so, compare this 5% hypothetical example with the 5% hypothetical examples that appear in the shareholder reports of the other funds.
Please note that the expenses shown in the table are meant to highlight your ongoing costs only and do not reflect any transactional costs, such as sales charges (loads), redemption fees, or exchange fees. Therefore, the second line of the table for each class of shares is useful in comparing ongoing costs only, and will not help you determine the relative total costs of owning different funds. In addition, if these transactional costs were included, your costs would have been higher.
28 Certified Semi-Annual Report
| | |
| INDEX COMPARISON | | |
| |
Thornburg Core Growth Fund | | March 31, 2014 (Unaudited) |
Growth of a Hypothetical $10,000 Investment
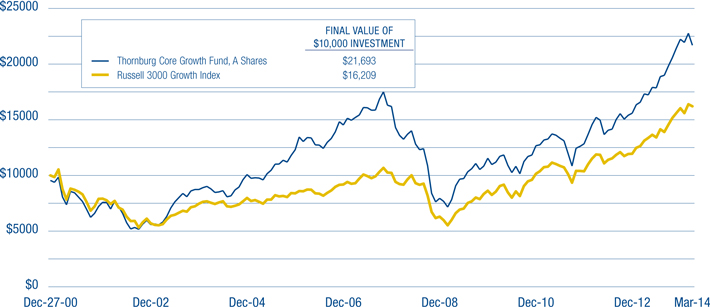
Average Annual Total Returns
For Periods Ended March 31, 2014 (with sales charge)
| | | | | | | | | | | | | | | | | | | | |
| | | 1 Yr | | | 3 Yrs | | | 5 Yrs | | | 10 Yrs | | | Since
Inception | |
Class A Shares (Incep: 12/27/00) | | | 19.61 | % | | | 16.00 | % | | | 21.50 | % | | | 8.95 | % | | | 6.02 | % |
Class C Shares (Incep: 12/27/00) | | | 23.31 | % | | | 16.90 | % | | | 21.71 | % | | | 8.63 | % | | | 5.54 | % |
Class I Shares (Incep: 11/3/03) | | | 25.71 | % | | | 18.33 | % | | | 23.20 | % | | | 9.99 | % | | | 9.72 | % |
Class R3 Shares (Incep: 7/1/03) | | | 25.09 | % | | | 17.71 | % | | | 22.55 | % | | | 9.32 | % | | | 10.14 | % |
Class R4 Shares (Incep: 2/1/07) | | | 25.27 | % | | | 17.86 | % | | | 22.69 | % | | | — | | | | 4.99 | % |
Class R5 Shares (Incep: 10/3/05) | | | 25.74 | % | | | 18.32 | % | | | 23.17 | % | | | — | | | | 8.35 | % |
Performance data shown represents past performance and is no guarantee of future results. Investment return and principal value will fluctuate so shares, when redeemed, may be worth more or less than their original cost. Current performance may be lower or higher than quoted. For performance current to the most recent month end, visit thornburg.com or call 800.847.0200. The performance data and graph do not reflect the deduction of taxes that a shareholder would pay on distributions or the redemption of Fund shares. Returns reflect the reinvestment of dividends and capital gains as well as applicable sales charges. Class A shares are sold with a maximum sales charge of 4.50%. Class C shares are subject to a 1% contingent deferred sales charge (CDSC) for the first year only. There is no up-front sales charge for Class I, R3, R4, and R5 shares.
Certified Semi-Annual Report 29
| | |
| OTHER INFORMATION | | |
| |
Thornburg Core Growth Fund | | March 31, 2014 (Unaudited) |
PORTFOLIO PROXY VOTING
Policies and Procedures:
The Trust has delegated to Thornburg Investment Management, Inc. (the “Advisor”) voting decisions respecting proxies for the Fund’s voting securities. The Advisor makes voting decisions in accordance with its Proxy Voting Policy and Procedures. A description of the Policy and Procedures is available (i) without charge, upon request, by calling the Advisor toll-free at 1-800-847-0200, (ii) on the Thornburg website at www.thornburg.com, and (iii) on the Securities and Exchange Commission’s website at www.sec.gov.
Information regarding how proxies were voted is available on or before August 31 of each year for the twelve months ending the preceding June 30. This information is available (i) without charge, upon request by calling the Advisor toll-free at 1-800-847-0200, (ii) on the Thornburg website at www.thornburg.com, and (iii) on the Securities and Exchange Commission’s website at www.sec.gov.
AVAILABILITY OF QUARTERLY PORTFOLIO SCHEDULE
The Fund files with the Securities and Exchange Commission schedules of its portfolio holdings on Form N-Q for the first and third quarters of each fiscal year. The Fund’s Forms N-Q are available on the Commission’s website at www.sec.gov, or may be reviewed and copied at the Commission’s Public Reference Room in Washington, D.C. Information on the operation of the Public Reference Room may be obtained by calling 1-800-SEC-0330. The Fund also makes this information available on its website at www.thornburg. com/download or upon request by calling 1-800-847-0200.
30 Certified Semi-Annual Report
TRUSTEES’ STATEMENT TO SHAREHOLDERS
Not part of the Certified Semi-Annual Report
Reissued September 15, 2013
The Trustees believe current and prospective shareholders should know how we discharge our responsibilities in supervising the Funds’ investment advisor and in reviewing the advisor’s contract for renewal. Since 2005, we have issued a statement which sets out clearly the three principal guidelines that we follow in supervising the Trust’s investment advisor on your behalf. In accordance with our customary practice, in September of this year we again reviewed our statement and concluded we should reissue this statement outlining the principal features of our supervision of the advisor’s performance of investment management services for the Funds.
We begin with the premise that each shareholder selected his or her Fund because its investments are managed by the investment advisor identified in the prospectus and in accordance with the objective and policies described in the prospectus. We realize, as each of you do, that if you believe that your Fund’s stated objective and policies no longer serve your personal investment goals, you can sell your shares and leave the Fund.
Therefore, we believe that our primary supervisory task – our principal obligation to you – is to assess the nature and quality of the advisor’s services, and to confirm that the advisor actively and competently pursues the Fund’s objective, in accordance with the policies set out in the prospectus. To do this, we meet regularly with management to review your Fund’s portfolio and to discuss the advisor’s specific actions and judgments in pursuing the Fund’s objective. We do not substitute our own judgment for the advisor’s decisions in selecting investments; the advisor is paid to exercise its informed judgment on investment decisions, and we seek to confirm, in reviewing the advisor’s performance, that the advisor is doing just that.
Second, while we are conscious of costs and the effect that costs have on shareholders’ returns, we do not seek the lowest fees or expense ratio as our sole or primary objective. We try to make sure that your Fund’s fees and costs are reasonable in relationship to the services rendered and that they are generally in line with those charged by other expert investment advisors, consistent with our belief that the Fund’s investors searched for and expect that expertise and attention and have decided to pay a reasonable price for it. We do not put the management contract “out to bid” as a matter of course, and we would not do so unless we had concluded that the advisor materially had failed to pursue the Fund’s objectives in accordance with its policies, or for other equally important reasons. We believe that any other approach would be inconsistent with your interests and contrary to your expectations when you bought shares of the Fund in the first place.
Finally, because we believe that most Thornburg Fund shareholders have invested with a long-term perspective, we try not to focus too much on the fashions of the moment and on short-term performance. The market will not favor any specific investment objective or set of policies at all times and under all economic circumstances. A fund will experience periods of both high and low returns relative to other funds and other investments. Even if one of our Funds is not favored by the market at a particular time, we believe that the advisor is nonetheless obliged to remain true to the Fund’s objective and policies, and we watch to see that it does so.
This page is not part of the Semi-Annual Report 31
This page intentionally left blank.
32 This page is not part of the Semi-Annual Report
RETIREMENT AND EDUCATION ACCOUNTS
Thornburg Investment Management offers retirement and education savings accounts that can help you meet a variety of planning challenges. For account applications or further information on any of the accounts below, please call 1-800-847-0200 or go to www.thornburg.com/ira. Your financial advisor can help you determine which plan is right for you.
Individual Retirement Accounts
Individual Retirement Accounts (IRAs) provide a tax-advantaged means to save money for the future. For a detailed outline of the difference between retirement accounts, see www.thornburg.com/ira. Rollovers are available. Call 1-800-847-0200 for more information.
Traditional IRAs – Contributions to Traditional IRAs are tax deductible for eligible individuals, and withdrawals are taxed as additional ordinary income. You may contribute to an IRA if you receive compensation and are under 70 1/2, even if you are covered by an employer retirement plan. Deductible contributions are subject to certain qualifications. Please consult your tax advisor.
Roth IRAs – Under a Roth IRA, there is no tax deduction for contributions, but there is no income tax on qualified withdrawals. For a more detailed comparison of Traditional and Roth IRAs, please see our website at www.thornburg. com/ira.
SEP IRAs – Simplified Employee Pension (SEP) IRAs are established by employers. The employer is allowed a tax deduction for contributions made to the SEP Plan and makes contributions to each eligible employee’s SEP IRA on a discretionary basis.
SIMPLE IRAs – Savings Incentive Match Plan for Employees of Small Employers (SIMPLE) is designed to give small business owners a simplified method to establish and contribute to a retirement plan for employees. The employer is allowed a tax deduction for contributions and makes either matching or non-elective contributions to each eligible employee’s SIMPLE IRA. Employees may make salary deferral contributions.
Coverdell Education Savings Account
These savings accounts are designed to provide a way to save money for higher education expenses. In an Education Savings Account, earnings and interest grow tax-free, and qualified withdrawals used to pay for eligible higher-education expenses are tax- and penalty-free.
Funds Available
The following funds are available in the accounts listed above:
| | • | | Thornburg Core Growth Fund |
| | • | | Thornburg International Value Fund |
| | • | | Thornburg International Growth Fund |
| | • | | Thornburg Developing World Fund |
| | • | | Thornburg Investment Income Builder Fund |
| | • | | Thornburg Global Opportunities Fund |
| | • | | Thornburg Low Duration Income Fund |
| | • | | Thornburg Limited Term U.S. Government Fund |
| | • | | Thornburg Limited Term Income Fund |
| | • | | Thornburg Strategic Income Fund |
This page is not part of the Semi-Annual Report 33

34 This page is not part of the Semi-Annual Report
THORNBURG FUND FAMILY
Thornburg Equity Funds
Thornburg’s equity research uses a fundamentally driven, bottom-up, comprehensive analytical approach. Thornburg equity funds generally focus on a limited number of securities so that each holding can impact performance. The team searches for firms believed to have a promising future and seeks to buy shares of those companies at a discount to their intrinsic or long-term value.
| | • | | Thornburg Core Growth Fund |
| | • | | Thornburg International Value Fund |
| | • | | Thornburg International Growth Fund |
| | • | | Thornburg Developing World Fund |
| | • | | Thornburg Investment Income Builder Fund |
| | • | | Thornburg Global Opportunities Fund |
Thornburg Bond Funds
Thornburg Investment Management applies a disciplined philosophy to fixed-income management. Since the launch of our first fixed-income fund over 25 years ago, we have been conducting fundamental, bottom-up research in an effort to identify bonds which we believe provide the best return for a given level of risk. We avoid leverage or complex strategies which could backfire in periods of market uncertainty.
| | • | | Thornburg Low Duration Income Fund |
| | • | | Thornburg Limited Term U.S. Government Fund |
| | • | | Thornburg Limited Term Income Fund |
| | • | | Thornburg Strategic Income Fund |
| | • | | Thornburg Low Duration Municipal Fund |
| | • | | Thornburg Limited Term Municipal Fund |
| | • | | Thornburg Intermediate Municipal Fund |
| | • | | Thornburg California Limited Term Municipal Fund |
| | • | | Thornburg New Mexico Intermediate Municipal Fund |
| | • | | Thornburg New York Intermediate Municipal Fund |
| | • | | Thornburg Strategic Municipal Income Fund |
Before investing, carefully consider the Fund’s investment goals, risks, charges, and expenses. For a prospectus or summary prospectus containing this and other information, contact your financial advisor or visit thornburg.com. Read it carefully before investing.
For additional information, please visit thornburg.com
Thornburg Investment Management, Inc. 2300 North Ridgetop Road, Santa Fe, NM 87506
This page is not part of the Semi-Annual Report 35

This Semi-Annual Report is submitted for the general information of shareholders of the Fund. It is not authorized for distribution to prospective investors in the Fund unless preceded or accompanied by an effective prospectus.
| | | | |
| Investment Advisor: | | Distributor: | | |
| Thornburg Investment Management® | | Thornburg Securities Corporation® | | |
| 800.847.0200 | | 800.847.0200 | | TH180 |

2 This page is not part of the Semi-Annual Report
Important Information

Best International Multi-Cap Growth Fund
Lipper Fund Awards are granted annually to the fund in each Lipper classification that consistently delivered the strongest risk-adjusted performance (calculated with dividends reinvested). In 2014, Class I shares won for the three- and five-year periods ended 11/30/2013, among 312 and 276 funds, respectively. In 2013, the fund won for the three- and five-year periods ended 11/30/2012, among 264 and 205 funds, respectively. The fund was not eligible for other time periods.
The information presented on the following pages was current as of March 31, 2014. The managers’ views, portfolio holdings, and sector and country diversification are provided for the general information of the Fund’s shareholders; to the extent this information is historical, it should not be considered predictive of future circumstances. This material should not be deemed a recommendation to buy or sell any of the securities mentioned.
Investments in the Fund carry risks, including possible loss of principal. Special risks may be associated with investments outside the United States, especially in emerging markets, including currency fluctuations, illiquidity, volatility, and political and economic risks. Investments in small capitalization companies may increase the risk of greater price fluctuations. Please see the Fund’s Prospectus for a discussion of the risks associated with an investment in the Fund. Investments in the Fund are not FDIC insured, nor are they deposits of or guaranteed by a bank or any other entity. There is no guarantee that the Fund will meet its investment objectives. Funds invested in a limited number of holdings may expose an investor to greater volatility.
Performance data given at net asset value (NAV) does not take into account the applicable sales charges. If the sales charges had been included, the performance would have been lower.
Class I, R3, R4, R5, and R6 shares may not be available to all investors. Minimum investments for Class I shares may be higher than those for other classes.
From time to time, the Fund may invest in shares of companies through initial public offerings (IPOs). IPOs have the potential to produce substantial gains for the Fund. There is no assurance that the Fund will have continued access to profitable IPOs and, as the Fund’s assets grow, the impact of IPO investments may decline. Therefore, investors should not rely on these past gains as an indication of future performance.
| | | | |
SHARE CLASS | | NASDAQ SYMBOL | | CUSIP |
Class A | | TIGAX | | 885-215-319 |
Class C | | TIGCX | | 885-215-293 |
Class I | | TINGX | | 885-215-244 |
Class R3 | | TIGVX | | 885-215-178 |
Class R4 | | TINVX | | 885-215-160 |
Class R5 | | TINFX | | 885-215-152 |
Class R6 | | THGIX | | 885-216-820 |
Glossary
MSCI All Country (AC) World ex-U.S. Growth Index – A market capitalization weighted index that includes growth companies in developed and emerging markets throughout the world, excluding the United States.
MSCI EAFE (Europe, Australasia, Far East) Index – An unmanaged, market capitalization weighted index that is a common benchmark for international portfolio performance. The index is calculated with net dividends reinvested in U.S. dollars.
MSCI Emerging Markets Index – A free float-adjusted market capitalization index that is designed to measure equity market performance of emerging markets. The MSCI Emerging Markets Index consists of the following 21 emerging market country indices: Brazil, Chile, China, Colombia, Czech Republic, Egypt, Greece, Hungary, India, Indonesia, Korea, Malaysia, Mexico, Peru, Philippines, Poland, Russia, South Africa, Taiwan, Thailand, and Turkey.
Unless otherwise noted, index returns reflect the reinvestment of income dividends and capital gains, if any, but do not reflect fees, brokerage commissions or other expenses of investing. Investors may not make direct investments into any index. The performance of any index is not indicative of the performance of any particular investment.
Median Market Capitalization – Market capitalization (market cap) is the total value of a company’s stock, calculated by multiplying the number of outstanding common shares by the current share price. The company whose market cap is in the middle of the portfolio is the median market cap. Half the companies in the portfolio have values greater than the median, and half have values that are less.
Price to Book Value (P/B) – A ratio used to compare a stock’s market value to its book value. It is calculated by dividing the current closing price of the stock by the latest quarter’s book value. Book value is simply assets minus liabilities.
Price to Cash Flow Ratio – A measure of the market’s expectations of a firm’s future financial health. It is calculated by dividing the price per share by cash flow per share.
Price to Earnings Ratio (P/E) – A valuation ratio equaling a company’s market value per share divided by earnings per share.
This page is not part of the Semi-Annual Report 3

Portfolio Managers

Tim Cunningham, CFA Greg Dunn
The Fund seeks long-term growth of capital by investing in equity securities selected for their growth potential.
The Fund normally invests at least 75% of its assets in foreign securities or depository receipts of foreign securities. However, the Fund may own a variety of securities, including domestic equity securities, partnership interests, and debt obligations. The Fund may also invest in developing countries and in smaller companies with market capitalizations of less than $500 million.
Comprehensive International Growth Investing
A major benefit of an interconnected global economy is the ability to tap into a country’s or region’s comparative advantages. Some countries have abundant natural resources, while others excel at manufacturing or engineering. The ability to allocate capital across borders allows the entire globe to benefit from these advantages. In an effort to capture these opportunities, Thornburg Investment Management launched the Thornburg International Growth Fund in 2007.
The Fund’s process is centered on identifying attractively valued international growth companies from the bottom up. The management team will leave it to others to make broad-based calls on the direction of the market. Instead, the team employs a comprehensive, “go-everywhere” approach to growth investing. The team classifies stocks into various growth baskets: growth industry leaders, consistent growth companies, or emerging growth companies. From those baskets, the team will typically build a portfolio of well under 100 stocks, which they believe provides the best long-term prospects for investors. While stocks are analyzed on their individual merits, their role as part of a diversified portfolio is also taken into account.
Equity investing, especially disciplines focused on growing companies, can bring volatility. The Thornburg International Growth Fund team recognizes this and strives to balance the aims of generating a strong long-term record while attempting to manage downside volatility. Portfolio construction and geographic diversification provide part of the answer, but fundamental analysis can often play a more important role. While other growth funds limit volatility by diversifying across a large number of names, the team managing the Thornburg International Growth Fund believes that a more robust understanding of a smaller number of portfolio holdings is one of the most effective forms of risk management.
Average Annual Total Returns
For Periods Ended March 31, 2014
| | | | | | | | | | | | | | | | |
| | | 1 YR | | | 3 YRS | | | 5 YRS | | | SINCE
INCEPTION | |
A Shares (Incep: 2/1/07) | | | | | | | | | | | | | | | | |
Without sales charge | | | 16.72 | % | | | 13.70 | % | | | 25.10 | % | | | 9.02 | % |
With sales charge | | | 11.48 | % | | | 11.96 | % | | | 23.94 | % | | | 8.33 | % |
MSCI AC World ex-U.S. Growth Index (Since 2/1/07) | | | 10.83 | % | | | 4.27 | % | | | 15.22 | % | | | 2.45 | % |
Performance data shown represents past performance and is no guarantee of future results. Investment return and principal value will fluctuate so shares, when redeemed, may be worth more or less than their original cost. Current performance may be lower or higher than quoted. For performance current to the most recent month end, visit thornburg. com or call 800.847.0200.
The maximum sales charge for Class A shares is 4.50%. The total annual fund operating expense of Class A shares is 1.41%, as disclosed in the most recent Prospectus.
4 This page is not part of the Semi-Annual Report
Key Portfolio Attributes
As of March 31, 2014
| | | | |
Portfolio P/E Trailing 12-months* | | | 25.4x | |
Portfolio Price to Cash Flow* | | | 15.6x | |
Portfolio Price to Book Value* | | | 4.5x | |
Median Market Cap* | | $ | 5.4 B | |
5-Year Beta (A Shares vs. MSCI ACWI ex-US G)* | | | 0.82 | |
Number of Companies | | | 65 | |
Market Capitalization Exposure
As of March 31, 2014
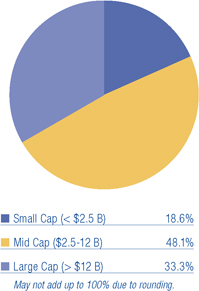
Basket Structure
As of March 31, 2014
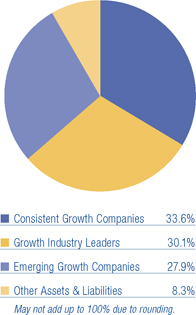
Much of the research process is focused on identifying how the overall market came to price a security. Many of the ideas are sourced through a quantitative screening process of the universe of international companies. Only those with the most appealing growth and valuation characteristics pass on to the step of having a complex financial model built. Thornburg’s growth investment team scours regulatory filings, visits company management, and interviews suppliers and customers. By doing this work, they develop their own view of the intrinsic value of the company. Only if their view is materially higher than the market do they make an investment.
Others may question how the team manages a growth portfolio, especially an international one, from Santa Fe, New Mexico. At Thornburg Investment Management, we embrace our location, away from the ancillary noise of the major money centers. We have access to Wall Street research, but prefer to come to our own conclusions about the value of an investment. The investment process allows the team to take a very broad view of what an attractively valued, international growth company looks like, and invest in those few companies that they believe provide the most attractive risk-reward trade-off. The result is a portfolio which at any given time will look quite unlike the MSCI All Country (AC) World ex-U.S. Growth Index or the competition. All of this is done with a goal of providing attractive returns over the long term.
Stocks Contributing and Detracting
For the Six Months Ended March 31, 2014
| | |
TOP CONTRIBUTORS | | TOP DETRACTORS |
| Hargreaves Lansdown plc | | boohoo.com plc |
| Constellation Software, Inc. | | MercadoLibre SA |
| Valeant Pharmaceuticals International, Inc. | | Banco BTG Pactual Participations Ltd. |
| Sands China Ltd. | | Telecity Group plc |
| Wirecard AG | | Sberbank Russia OJSC Sponsored ADR |
Source: FactSet
This page is not part of the Semi-Annual Report 5
2014 Certified Semi-Annual Report
Thornburg International Growth Fund
March 31, 2014
This report is certified under the Sarbanes-Oxley Act of 2002, which requires that public companies, including mutual funds, affirm that the information provided in their annual and semi-annual shareholder reports fully and fairly represents their financial position and the results of their operations for the period presented.
6 Certified Semi-Annual Report
Letter to Shareholders
April 15, 2014
Dear Fellow Shareholder,
For the semi-annual period ended March 31, 2014, the Thornburg International Growth Fund returned 2.74% for the Class A shares at net asset value (NAV), underperforming the benchmark, the MSCI All Country (AC) World ex-U.S. Growth Index, which returned 4.97%. On March 31, 2014, the NAV of the Class A shares was $20.54, unchanged from September 30, 2013, after paying a 57 cent capital gain distribution.
It was a tale of two quarters with the Fund significantly outperforming in the fourth quarter of 2013 and significantly under-performing in the first quarter of 2014. What changed? Market consensus assumed that last year’s rally would spill over to this year, amid a generally favorable environment: expectations for the global economic recovery to accelerate, modest inflation, and accommodative central banks, including the U.S. Federal Reserve (the Fed). The Fed’s announcement of the first “taper” of asset purchases in January 2014 had been offset by its “lower for longer” interest rate guidance.
But that same month, disappointing economic data out of the U.S. and China (which also saw its first corporate bond defaults) spooked the market. Growing doubts about the momentum of Japan’s structural reform program and worries about the impact on economic growth from its recent consumption tax hike spurred investors to take profit following last year’s exceptional stock market rally there. Meanwhile, hopes that Europe’s deflationary symptoms would abate failed to pan out. So when the Fed’s new chairwoman suggested in mid-March that U.S. interest rate hikes could come sooner than previously expected, earnings forecasts and share price targets were quickly revised downward. And thus began a broad rotation out of high multiple growth stocks into defensive and less volatile value stocks, a rotation which has only accelerated since then with Russia’s annexation of Crimea from the Ukraine adding a heavy dose of geo-political risk.
Although we reduced our position sizes in many of our more richly valued holdings (often several times over), we clearly did not do enough. Part of the problem is that stock valuations have moved up significantly over the past few years making it difficult to find attractively valued stocks in any category, let alone stocks with good growth prospects.
Nonetheless, the recent underperformance also affords us an opportunity to re-examine what worked and what did not, and to re-assess our current positioning of the Fund. Our best performers last year — and especially in the last three months of 2013, when the Fund returned 8.45% alone — became our biggest detractors during the first three months of 2014. The overweight positions in software and services, e-commerce, non-bank financials, and consumer discretionary stocks that catapulted the Fund higher early in the period, dragged it down in the latter half, especially in the last few weeks of March.
Top performers in the six months ended March 31, 2014 include Hargreaves Landsdown plc, Constellation Software, Inc., Valeant Pharmaceuticals International, Inc., Sands China Ltd., and Wirecard AG.
Hargreaves is the largest do-it-yourself (DIY) brokerage firm in the United Kingdom, similar to The Charles Schwab Corp. in the U.S. The U.K. is in the early stages of moving from defined benefit pension plans to defined contribution plans (similar to 401(k)s). We expect assets to slowly shift to self-managed accounts over time. As the dominant DIY provider, Hargreaves should benefit from these new asset flows for many years.
Constellation Software comprises a large number of small, diverse software companies mainly built via acquisition. It targets mission-critical software providers, but often operates in small markets. Typically these firms are too small for larger software companies or private equity firms to be interested in acquiring, leaving the founders with no exit strategy other than to sell to Constellation at an attractive valuation. Given its diversification, Constellation tends to deliver steady growth.
Valeant is a multi-national specialty pharmaceutical company based in Montreal, Canada. It develops, manufactures, and markets a broad range of pharmaceutical products primarily in eye health, dermatology, branded generics, and over-the-counter (OTC) drugs. Valeant has a unique operating philosophy for a pharmaceutical company: it focuses on management and operations rather than research and development, which of late has been a bad allocation of shareholder capital. Valeant acquires undermanaged businesses and products and seeks to drive operational efficiencies through cost-cutting and revenue optimization. Its approach is very similar to private equity.
Sands China operates casinos in Macau, which is the Las Vegas of Asia, and is actually larger than Las Vegas by some measures. Macau regulators have awarded six licenses to operate casinos, one of which went to Sands. While VIP gaming (high roller) has slowed with the Chinese economy, it continues to grow at a reasonable rate. Mass gaming (smaller players) continues to grow very nicely (Sands has significant mass exposure). And overall activity in Macau has been stronger than expected.
Certified Semi-Annual Report 7
Letter to Shareholders,
Continued
Wirecard is an online payments processor based in Germany. The company collects a small fee on e-commerce transactions it processes for its customers. Online retail continues to take share from offline retail, creating a natural growth tailwind. In addition, Wirecard continues to take share in its core European market, while expanding into Asia.
The top detractors included boohoo.com, MercadoLibre, Inc., BTG Pactual, TelecityGroup plc, and Sberbank.
boohoo.com is a U.K.-based online fashion retailer focused on fashion-forward 16-24 year olds, offering exclusive, yet affordable apparel. boohoo sells clothing that is entirely its own label and its supply chain expertise allows it to have short lead times, in some cases just six weeks from design to product. The company went public in March and we purchased the stock because we saw an attractive opportunity to own a fast-growing company at a clear valuation discount to peers. The stock has underperformed because a peer (ASOS) released results that disappointed the market, leading to broad-based selloff of European e-commerce names.
MercadoLibre is an eBay-like, e-commerce platform serving Latin America. MercadoLibre is benefiting from the long-term structural trends of increased broadband penetration in Latin America and the movement of offline retail to online, while facing relatively little competition. However, recently the currencies of most countries in which it operates have weakened substantially versus the U.S. dollar, which the company converts to for reporting purposes. This weighs on reported revenues and earnings. There is also some concern that Venezuela will devalue its currency again, which would cause a step-down in revenue and earnings growth.
Telecity Group owns and operates premium carrier-neutral data centers in city locations across Europe. During the fourth quarter of 2013, the CFO unexpectedly resigned, which the market read as a major negative and the shares sold off. The stock continued to perform poorly after 2013 second-half results were released in the first quarter of this year. Reported results were in-line, but 2014 guidance was below expectations, partly on elevated churn.
Sberbank is the largest bank in Russia. Geo-political tensions have grown due to Russia’s annexation of Crimea from the Ukraine. While Western European and U.S. sanctions against Russia have so far been limited, there has been a spike in capital flight from Russia and a broad selloff in Russian stocks. We sold this position immediately following Russia’s move into Crimea.
Needless to say, we would like to beat our benchmark in every reporting period and in all market conditions. But unfortunately, given market volatility and shifts in short-term sentiment, that is not a realistic goal. Instead, we strive for consistent outperformance over the long run. In this we have been successful. We are pleased the Thornburg International Growth Fund received two Lipper Fund Awards, with the Fund’s Class I shares recognized as Lipper’s Best International Multi-Cap Growth Fund over three- and five-year periods ended November 30, 2013, among 312 and 276 funds, respectively, based on risk-adjusted returns. This brings the total number of Lipper Fund Awards to the Fund to four since its February 2007 inception.
The broad sell-off in growth stocks has been severe, and there may be more pain still to come. But corrections typically result in attractive entry points for high-quality growth stocks and bode well for future performance.
Thank you for investing alongside us in the Thornburg International Growth Fund.
Sincerely,
| | |
 | |  |
| Greg Dunn | | Tim Cunningham,CFA |
| Managing Director | | Managing Director |
| Portfolio Manager | | Portfolio Manager |
The matters discussed in this report may constitute forward-looking statements made pursuant to the safe harbor provisions of the Securities Litigation Reform Act of 1995. These include any advisor or portfolio manager prediction, assessment, analysis or outlook for individual securities, industries, investment styles, market sectors and/or markets. These statements involve risks and uncertainties. In addition to the general risks described for each fund in its current prospectus, other factors bearing on these reports include the accuracy of the advisor’s or portfolio manager’s forecasts and predictions, the appropriateness of the investment strategies designed by the advisor or portfolio manager and the ability of the advisor or portfolio manager to implement their strategies efficiently and successfully. Any one or more of these factors, as well as other risks affecting the securities markets generally, could cause the actual results of any fund to differ materially as compared to its benchmarks.
8 Certified Semi-Annual Report
| | |
| Schedule of Investments | | |
| |
Thornburg International Growth Fund | | March 31, 2014 (Unaudited) |
Top Ten Equity Holdings
As of 3/31/14
| | | | |
MasterCard, Inc. | | | 2.8 | % |
Partners Group Holding AG | | | 2.7 | % |
Constellation Software, Inc. | | | 2.7 | % |
Dollarama, Inc. | | | 2.3 | % |
Catamaran Corp. | | | 2.2 | % |
Gildan Activewear, Inc. | | | 2.2 | % |
Valeant Pharmaceuticals International, Inc. | | | 2.1 | % |
Compagnie Financiere Richemont SA | | | 2.1 | % |
Investment AB Kinnevik | | | 2.0 | % |
Domino’s Pizza UK & IRL plc | | | 2.0 | % |
Summary of Industry Exposure
As of 3/31/14
| | | | |
Software & Services | | | 20.1 | % |
Diversified Financials | | | 12.9 | % |
Retailing | | | 8.2 | % |
Consumer Durables & Apparel | | | 7.3 | % |
Consumer Services | | | 6.3 | % |
Health Care Equipment & Services | | | 4.8 | % |
Media | | | 4.7 | % |
Commercial & Professional Services | | | 4.3 | % |
Pharmaceuticals, Biotechnology & Life Sciences | | | 4.2 | % |
Food, Beverage & Tobacco | | | 3.8 | % |
Food & Staples Retailing | | | 3.2 | % |
Transportation | | | 3.1 | % |
Semiconductors & Semiconductor Equipment | | | 1.7 | % |
Automobiles & Components | | | 1.6 | % |
Materials | | | 1.5 | % |
Technology Hardware & Equipment | | | 1.3 | % |
Capital Goods | | | 1.1 | % |
Energy | | | 0.8 | % |
Telecommunication Services | | | 0.8 | % |
Other Assets & Liabilities | | | 8.3 | % |
Summary of Country Exposure
As of 3/31/14 (percent of equity holdings)
| | | | |
United Kingdom | | | 26.0 | % |
United States | | | 14.0 | % |
Canada | | | 10.1 | % |
Switzerland | | | 5.2 | % |
China | | | 5.0 | % |
Brazil | | | 4.5 | % |
Denmark | | | 4.4 | % |
Australia | | | 3.7 | % |
Sweden | | | 3.6 | % |
Ireland | | | 3.2 | % |
Japan | | | 3.2 | % |
India | | | 2.3 | % |
Hong Kong | | | 2.1 | % |
Germany | | | 1.8 | % |
Russia | | | 1.8 | % |
Netherlands | | | 1.5 | % |
Taiwan | | | 1.4 | % |
France | | | 1.2 | % |
Israel | | | 1.2 | % |
Italy | | | 1.2 | % |
Costa Rica | | | 1.1 | % |
Spain | | | 0.9 | % |
Mexico | | | 0.6 | % |
Certified Semi-Annual Report 9
| | |
| Schedule of Investments, continued | | |
| |
Thornburg International Growth Fund | | March 31, 2014 (Unaudited) |
| | | | | | | | |
| | | SHARES/
PRINCIPAL AMOUNT | | | VALUE | |
COMMON STOCK — 91.67% | | | | | | | | |
| | |
AUTOMOBILES & COMPONENTS — 1.64% | | | | | | | | |
Auto Components — 1.64% | | | | | | | | |
Delphi Automotive plc | | | 556,300 | | | $ | 37,750,518 | |
| | | | | | | | |
| | | | | | | 37,750,518 | |
| | | | | | | | |
CAPITAL GOODS — 1.09% | | | | | | | | |
Machinery — 1.09% | | | | | | | | |
a Arcam AB | | | 827,244 | | | | 25,179,158 | |
| | | | | | | | |
| | | | | | | 25,179,158 | |
| | | | | | | | |
COMMERCIAL & PROFESSIONAL SERVICES — 4.31% | | | | | | | | |
Professional Services — 4.31% | | | | | | | | |
ALS Ltd. | | | 2,909,173 | | | | 19,776,105 | |
Experian plc | | | 2,340,319 | | | | 42,176,979 | |
Intertek Group plc | | | 731,625 | | | | 37,470,066 | |
| | | | | | | | |
| | | | | | | 99,423,150 | |
| | | | | | | | |
CONSUMER DURABLES & APPAREL — 7.25% | | | | | | | | |
Household Durables — 1.70% | | | | | | | | |
a Persimmon plc | | | 1,751,886 | | | | 39,312,043 | |
Textiles, Apparel & Luxury Goods — 5.55% | | | | | | | | |
Compagnie Financiere Richemont SA | | | 506,903 | | | | 48,393,884 | |
Eclat Textile Co. Ltd. | | | 2,563,575 | | | | 29,632,326 | |
Gildan Activewear, Inc. | | | 991,652 | | | | 49,959,428 | |
| | | | | | | | |
| | | | | | | 167,297,681 | |
| | | | | | | | |
CONSUMER SERVICES — 6.34% | | | | | | | | |
Hotels, Restaurants & Leisure — 6.34% | | | | | | | | |
Domino’s Pizza Group plc | | | 5,010,039 | | | | 46,063,967 | |
a Galaxy Entertainment Group Ltd. | | | 4,811,773 | | | | 41,873,871 | |
a Jubilant FoodWorks Ltd. | | | 814,603 | | | | 14,483,422 | |
Sands China Ltd. | | | 5,883,200 | | | | 43,878,440 | |
| | | | | | | | |
| | | | | | | 146,299,700 | |
| | | | | | | | |
DIVERSIFIED FINANCIALS — 12.86% | | | | | | | | |
Capital Markets — 6.48% | | | | | | | | |
Daiwa Securities Group Inc. | | | 5,066,666 | | | | 44,081,442 | |
Hargreaves Lansdown plc | | | 1,764,357 | | | | 42,886,312 | |
Partners Group Holding AG | | | 222,491 | | | | 62,515,429 | |
Consumer Finance — 1.41% | | | | | | | | |
a First Cash Financial Services, Inc. | | | 642,586 | | | | 32,424,889 | |
Diversified Financial Services — 4.97% | | | | | | | | |
IG Group Holdings plc | | | 3,118,747 | | | | 32,626,357 | |
Investment AB Kinnevik | | | 1,264,756 | | | | 46,703,133 | |
a OzForex Group Ltd. | | | 11,587,500 | | | | 35,462,629 | |
| | | | | | | | |
| | | | | | | 296,700,191 | |
| | | | | | | | |
ENERGY — 0.81% | | | | | | | | |
Oil, Gas & Consumable Fuels — 0.81% | | | | | | | | |
CNOOC Ltd. | | | 12,360,969 | | | | 18,581,693 | |
| | | | | | | | |
| | | | | | | 18,581,693 | |
| | | | | | | | |
FOOD & STAPLES RETAILING — 3.24% | | | | | | | | |
Food & Staples Retailing — 3.24% | | | | | | | | |
Magnit OJCS GDR | | | 699,550 | | | | 38,335,340 | |
PriceSmart, Inc. | | | 231,150 | | | | 23,329,969 | |
Wal-Mart de Mexico SAB de C.V. | | | 5,499,887 | | | | 13,101,489 | |
| | | | | | | | |
| | | | | | | 74,766,798 | |
| | | | | | | | |
FOOD, BEVERAGE & TOBACCO — 3.76% | | | | | | | | |
Food Products — 2.31% | | | | | | | | |
BRF SA | | | 1,538,800 | | | | 30,721,746 | |
Mead Johnson Nutrition Co. | | | 271,400 | | | | 22,564,196 | |
10 Certified Semi-Annual Report
| | |
| Schedule of Investments, continued | | |
| |
Thornburg International Growth Fund | | March 31, 2014 (Unaudited) |
| | | | | | | | |
| | | SHARES/
PRINCIPAL AMOUNT | | | VALUE | |
Tobacco — 1.45% | | | | | | | | |
ITC Ltd. | | | 5,680,600 | | | $ | 33,571,397 | |
| | | | | | | | |
| | | | | | | 86,857,339 | |
| | | | | | | | |
HEALTH CARE EQUIPMENT & SERVICES — 4.76% | | | | | | | | |
Health Care Equipment & Supplies — 2.52% | | | | | | | | |
Coloplast A/S | | | 272,700 | | | | 22,065,183 | |
GN Store Nord A/S | | | 1,455,300 | | | | 36,118,326 | |
Health Care Providers & Services — 2.24% | | | | | | | | |
a Catamaran Corp. | | | 1,155,157 | | | | 51,704,827 | |
| | | | | | | | |
| | | | | | | 109,888,336 | |
| | | | | | | | |
MATERIALS — 1.53% | | | | | | | | |
Chemicals — 1.53% | | | | | | | | |
Christian Hansen Holding AS | | | 892,300 | | | | 35,399,910 | |
| | | | | | | | |
| | | | | | | 35,399,910 | |
| | | | | | | | |
MEDIA — 4.70% | | | | | | | | |
Media — 4.70% | | | | | | | | |
a Liberty Global plc | | | 689,700 | | | | 28,077,687 | |
a Liberty Global plc | | | 550,300 | | | | 22,892,480 | |
REA Group Ltd. | | | 496,478 | | | | 22,446,151 | |
Rightmove plc | | | 799,718 | | | | 35,171,134 | |
| | | | | | | | |
| | | | | | | 108,587,452 | |
| | | | | | | | |
PHARMACEUTICALS, BIOTECHNOLOGY & LIFE SCIENCES — 4.20% | | | | | | | | |
Biotechnology — 0.99% | | | | | | | | |
Abcam plc | | | 3,522,310 | | | | 22,842,934 | |
Life Sciences Tools & Services — 1.07% | | | | | | | | |
Eurofins Scientific | | | 82,583 | | | | 24,716,627 | |
Pharmaceuticals — 2.14% | | | | | | | | |
a Valeant Pharmaceuticals International, Inc. | | | 374,317 | | | | 49,346,210 | |
| | | | | | | | |
| | | | | | | 96,905,771 | |
| | | | | | | | |
RETAILING — 8.19% | | | | | | | | |
Internet & Catalog Retail — 4.98% | | | | | | | | |
a AO World plc | | | 2,367,881 | | | | 12,395,505 | |
a ASOS plc | | | 282,229 | | | | 24,396,364 | |
a boohoo.com plc | | | 27,049,732 | | | | 23,900,861 | |
a Priceline.com, Inc. | | | 23,635 | | | | 28,170,320 | |
a YOOX S.p.A | | | 758,808 | | | | 25,956,575 | |
Multiline Retail — 3.21% | | | | | | | | |
Dollarama, Inc. | | | 686,480 | | | | 52,297,916 | |
a Poundland Group plc | | | 3,452,700 | | | | 21,873,443 | |
| | | | | | | | |
| | | | | | | 188,990,984 | |
| | | | | | | | |
SEMICONDUCTORS & SEMICONDUCTOR EQUIPMENT — 1.67% | | | | | | | | |
Semiconductors & Semiconductor Equipment — 1.67% | | | | | | | | |
ARM Holdings plc | | | 2,320,944 | | | | 38,616,234 | |
| | | | | | | | |
| | | | | | | 38,616,234 | |
| | | | | | | | |
SOFTWARE & SERVICES — 20.11% | | | | | | | | |
Information Technology Services — 5.34% | | | | | | | | |
MasterCard, Inc. | | | 874,148 | | | | 65,298,856 | |
a Optimal Payments plc | | | 3,387,975 | | | | 20,333,747 | |
Wirecard AG | | | 907,815 | | | | 37,669,606 | |
Internet Software & Services — 7.93% | | | | | | | | |
a Baidu, Inc. ADR | | | 171,470 | | | | 26,128,599 | |
F@N Communications, Inc. | | | 1,336,800 | | | | 23,895,713 | |
MercadoLibre, Inc. | | | 261,677 | | | | 24,888,099 | |
a SINA Corp. | | | 309,100 | | | | 18,672,731 | |
Telecity Group plc | | | 2,501,485 | | | | 29,109,050 | |
a Yahoo!, Inc. | | | 888,100 | | | | 31,882,790 | |
a Yandex NV | | | 936,900 | | | | 28,285,011 | |
Certified Semi-Annual Report 11
| | |
| Schedule of Investments, continued | | |
| |
Thornburg International Growth Fund | | March 31, 2014 (Unaudited) |
| | | | | | | | |
| | | SHARES/ | | | | |
| | | PRINCIPAL AMOUNT | | | VALUE | |
Software — 6.84% | | | | | | | | |
Aveva Group plc | | | 972,719 | | | $ | 33,957,741 | |
Constellation Software, Inc. | | | 255,850 | | | | 62,024,242 | |
a Fleetmatics Group plc | | | 771,471 | | | | 25,805,705 | |
Solera Holdings, Inc. | | | 570,700 | | | | 36,148,138 | |
| | | | | | | | |
| | | | | | | 464,100,028 | |
| | | | | | | | |
TECHNOLOGY HARDWARE & EQUIPMENT — 1.33% | | | | | | | | |
Electronic Equipment, Instruments & Components — 0.18% | | | | | | | | |
Hexagon AB | | | 123,649 | | | | 4,201,044 | |
Technology, Hardware, Storage & Periphals — 1.15% | | | | | | | | |
a Stratasys Ltd. | | | 249,150 | | | | 26,432,323 | |
| | | | | | | | |
| | | | | | | 30,633,367 | |
| | | | | | | | |
TELECOMMUNICATION SERVICES — 0.79% | | | | | | | | |
Diversified Telecommunication Services — 0.79% | | | | | | | | |
a Jazztel plc | | | 1,205,461 | | | | 18,334,159 | |
| | | | | | | | |
| | | | | | | 18,334,159 | |
| | | | | | | | |
TRANSPORTATION — 3.09% | | | | | | | | |
Air Freight & Logistics — 1.39% | | | | | | | | |
TNT Express N.V. | | | 3,267,900 | | | | 32,094,908 | |
Road & Rail — 1.70% | | | | | | | | |
Localiza Rent a Car S.A. | | | 2,678,800 | | | | 39,196,192 | |
| | | | | | | | |
| | | | | | | 71,291,100 | |
| | | | | | | | |
TOTAL COMMON STOCK (Cost $1,868,000,768) | | | | | | | 2,115,603,569 | |
| | | | | | | | |
SHORT TERM INVESTMENTS — 10.94% | | | | | | | | |
Ameren Corp., 0.25%, 4/1/2014 | | $ | 15,500,000 | | | | 15,500,000 | |
Avery Dennison Corp., 0.19%, 4/1/2014 | | | 21,000,000 | | | | 21,000,000 | |
Bank of New York Tri-Party Repurchase Agreement 0.24% dated 3/31/2014 due 4/1/2014, repurchase price $31,000,207 collateralized by 19 U.S. Government debt securities and 14 corporate debt securities, having an average coupon of 3.56%, a minimum credit rating of BBB-, maturity dates from 9/26/2016 to 3/30/2044, and having an aggregate market value of $32,527,314 at 3/31/2014 | | | 31,000,000 | | | | 31,000,000 | |
CBS Corp., 0.21%, 4/2/2014 | | | 18,000,000 | | | | 17,999,895 | |
Hitachi America Capital, 0.22%, 4/3/2014 | | | 34,000,000 | | | | 33,999,585 | |
Kansas City Power & Light, 0.19%, 4/1/2014 | | | 12,000,000 | | | | 12,000,000 | |
Plains All American Pipeline, 0.25%, 4/1/2014 | | | 66,000,000 | | | | 66,000,000 | |
Union Electric Co., 0.20%, 4/1/2014 | | | 34,000,000 | | | | 34,000,000 | |
Volvo Group Treasury, 0.25%, 4/7/2014 | | | 21,000,000 | | | | 20,999,125 | |
| | | | | | | | |
TOTAL SHORT TERM INVESTMENTS (Cost $252,498,605) | | | | | | | 252,498,605 | |
| | | | | | | | |
TOTAL INVESTMENTS — 102.61% (Cost $2,120,499,373) | | | | | | $ | 2,368,102,174 | |
LIABILITIES NET OF OTHER ASSETS — (2.61)% | | | | | | | (60,280,377 | ) |
| | | | | | | | |
NET ASSETS — 100.00% | | | | | | $ | 2,307,821,797 | |
| | | | | | | | |
Footnote Legend
Portfolio Abbreviations
To simplify the listings of securities, abbreviations are used per the table below:
| ADR | American Depository Receipt |
| GDR | Global Depository Receipt |
See notes to financial statements.
12 Certified Semi-Annual Report
This page intentionally left blank.
Certified Semi-Annual Report 13
| | |
| Statement of Assets and Liabilities | | |
| |
Thornburg International Growth Fund | | March 31, 2014 (Unaudited) |
| | | | |
ASSETS | | | | |
Investments at value (cost $2,120,499,373) (Note 2) | | $ | 2,368,102,174 | |
Cash | | | 266,694 | |
Cash denominated in foreign currency (cost $11,929,668) | | | 11,933,027 | |
Receivable for investments sold | | | 19,452 | |
Receivable for fund shares sold | | | 15,521,077 | |
Unrealized appreciation on forward currency contracts (Note 7) | | | 3,644,646 | |
Dividends receivable | | | 2,378,259 | |
Dividend and interest reclaim receivable | | | 66,107 | |
Interest receivable | | | 207 | |
Prepaid expenses and other assets | | | 192,847 | |
| | | | |
Total Assets | | | 2,402,124,490 | |
| | | | |
| |
LIABILITIES | | | | |
Payable for investments purchased | | | 81,493,315 | |
Payable for fund shares redeemed | | | 4,972,048 | |
Unrealized depreciation on forward currency contracts (Note 7) | | | 5,351,558 | |
Payable to investment advisor and other affiliates (Note 3) | | | 2,070,552 | |
Deferred taxes payable | | | 384,721 | |
Accounts payable and accrued expenses | | | 29,188 | |
Dividends payable | | | 1,311 | |
| | | | |
Total Liabilities | | | 94,302,693 | |
| | | | |
| |
NET ASSETS | | $ | 2,307,821,797 | |
| | | | |
NET ASSETS CONSIST OF | | | | |
Net investment income (loss) | | $ | (1,755,160 | ) |
Net unrealized appreciation on investments | | | 245,501,641 | |
Accumulated net realized gain (loss) | | | 39,788,750 | |
Net capital paid in on shares of beneficial interest | | | 2,024,286,566 | |
| | | | |
| | $ | 2,307,821,797 | |
| | | | |
14 Certified Semi-Annual Report
| | |
| Statement of Assets and Liabilities, Continued | | |
| |
Thornburg International Growth Fund | | March 31, 2014 (Unaudited) |
| | | | |
NET ASSET VALUE | | | | |
Class A Shares: | | | | |
Net asset value and redemption price per share
($835,183,636 applicable to 40,671,193 shares of beneficial interest outstanding - Note 4) | | $ | 20.54 | |
Maximum sales charge, 4.50% of offering price | | | 0.97 | |
| | | | |
Maximum offering price per share | | $ | 21.51 | |
| | | | |
| |
Class C Shares: | �� | | | |
Net asset value and offering price per share*
($167,206,655 applicable to 8,396,310 shares of beneficial interest outstanding - Note 4) | | $ | 19.91 | |
| | | | |
| |
Class I Shares: | | | | |
Net asset value, offering and redemption price per share
($1,158,050,406 applicable to 55,134,491 shares of beneficial interest outstanding - Note 4) | | $ | 21.00 | |
| | | | |
| |
Class R3 Shares: | | | | |
Net asset value, offering and redemption price per share
($17,051,794 applicable to 834,522 shares of beneficial interest outstanding - Note 4) | | $ | 20.43 | |
| | | | |
| |
Class R4 Shares: | | | | |
Net asset value, offering and redemption price per share
($42,883,763 applicable to 2,099,211 shares of beneficial interest outstanding - Note 4) | | $ | 20.43 | |
| | | | |
| |
Class R5 Shares: | | | | |
Net asset value, offering and redemption price per share
($83,648,256 applicable to 3,974,242 shares of beneficial interest outstanding - Note 4) | | $ | 21.05 | |
| | | | |
| |
Class R6 Shares: | | | | |
Net asset value, offering and redemption price per share
($3,797,287 applicable to 179,959 shares of beneficial interest outstanding - Note 4) | | $ | 21.10 | |
| | | | |
| * | Redemption price per share is equal to net asset value less any applicable contingent deferred sales charge. |
See notes to financial statements.
Certified Semi-Annual Report 15
| | |
| Statement of Operations | | |
| |
Thornburg International Growth Fund | | Six Months Ended March 31, 2014 (Unaudited) |
| | | | |
INVESTMENT INCOME | | | | |
Dividend income (net of foreign taxes withheld of $499,293) | | $ | 9,414,720 | |
Interest income | | | 158,005 | |
| | | | |
Total Income | | | 9,572,725 | |
| | | | |
| |
EXPENSES | | | | |
Investment advisory fees (Note 3) | | | 7,781,102 | |
Administration fees (Note 3) | | | | |
Class A Shares | | | 452,819 | |
Class C Shares | | | 91,365 | |
Class I Shares | | | 238,768 | |
Class R3 Shares | | | 9,851 | |
Class R4 Shares | | | 22,600 | |
Class R5 Shares | | | 16,290 | |
Distribution and service fees (Note 3) | | | | |
Class A Shares | | | 875,470 | |
Class C Shares | | | 732,679 | |
Class R3 Shares | | | 39,558 | |
Class R4 Shares | | | 44,886 | |
Transfer agent fees | | | | |
Class A Shares | | | 252,735 | |
Class C Shares | | | 57,110 | |
Class I Shares | | | 146,450 | |
Class R3 Shares | | | 17,501 | |
Class R4 Shares | | | 41,608 | |
Class R5 Shares | | | 45,938 | |
Class R6 Shares | | | 670 | |
Registration and filing fees | | | | |
Class A Shares | | | 28,047 | |
Class C Shares | | | 1,820 | |
Class I Shares | | | 44,662 | |
Class R3 Shares | | | 9,297 | |
Class R4 Shares | | | 8,736 | |
Class R5 Shares | | | 11,324 | |
Class R6 Shares | | | 7,263 | |
Custodian fees (Note 3) | | | 234,550 | |
Professional fees | | | 32,085 | |
Accounting fees | | | 17,060 | |
Trustee fees | | | 20,710 | |
Other expenses | | | 130,727 | |
| | | | |
Total Expenses | | | 11,413,681 | |
Less: | | | | |
Expenses reimbursed by investment advisor (Note 3) | | | (83,956 | ) |
| | | | |
Net Expenses | | | 11,329,725 | |
| | | | |
Net Investment Loss | | $ | (1,757,000 | ) |
| | | | |
16 Certified Semi-Annual Report
| | |
| Statement of Operations, Continued | | |
| |
Thornburg International Growth Fund | | Six Months Ended March 31, 2014 (Unaudited) |
| | | | |
REALIZED AND UNREALIZED GAIN (LOSS) | | | | |
Net realized gain (loss) from: | | | | |
Investments | | $ | 81,384,784 | |
Forward currency contracts (Note 7) | | | (8,735,068 | ) |
Foreign currency transactions | | | 233,376 | |
| | | | |
| | | 72,883,092 | |
| | | | |
Net change in unrealized appreciation (depreciation) on: | | | | |
Investments | | | (47,696,951 | ) |
Forward currency contracts (Note 7) | | | 3,831,297 | |
Foreign currency translations | | | (26,071 | ) |
| | | | |
| | | (43,891,725 | ) |
| | | | |
Net Realized and Unrealized Gain | | | 28,991,367 | |
| | | | |
Net Increase in Net Assets Resulting from Operations | | $ | 27,234,367 | |
| | | | |
See notes to financial statements.
Certified Semi-Annual Report 17
| | |
| Statements of Changes in Net Assets | | |
| |
Thornburg International Growth Fund | | |
| | | | | | | | |
| | | SIX MONTHS ENDED
MARCH 31, 2014* | | | YEAR ENDED
SEPTEMBER 30, 2013 | |
INCREASE (DECREASE) IN NET ASSETS FROM | | | | | | | | |
| | |
OPERATIONS | | | | | | | | |
Net investment income (loss) | | $ | (1,757,000 | ) | | $ | 774,113 | |
Net realized gain (loss) on investments, forward currency contracts, and foreign currency transactions | | | 72,883,092 | | | | 39,755,422 | |
Net unrealized appreciation (depreciation) on investments, forward currency contracts, and foreign currency translations | | | (43,891,725 | ) | | | 221,261,446 | |
| | | | | | | | |
| | |
Net Increase (Decrease) in Net Assets Resulting from Operations | | | 27,234,367 | | | | 261,790,981 | |
| | |
DIVIDENDS TO SHAREHOLDERS | | | | | | | | |
From realized gains | | | | | | | | |
Class A Shares | | | (17,999,580 | ) | | | — | |
Class C Shares | | | (3,700,916 | ) | | | — | |
Class I Shares | | | (22,590,256 | ) | | | — | |
Class R3 Shares | | | (398,754 | ) | | | — | |
Class R4 Shares | | | (774,775 | ) | | | — | |
Class R5 Shares | | | (1,254,132 | ) | | | — | |
Class R6 Shares | | | (76,351 | ) | | | — | |
| | |
FUND SHARE TRANSACTIONS (NOTE 4) | | | | | | | | |
Class A Shares | | | 261,439,431 | | | | 219,316,525 | |
Class C Shares | | | 52,699,466 | | | | 39,396,378 | |
Class I Shares | | | 430,168,829 | | | | 420,392,597 | |
Class R3 Shares | | | 3,169,129 | | | | 5,686,471 | |
Class R4 Shares | | | 16,761,626 | | | | 11,731,139 | |
Class R5 Shares | | | 41,504,849 | | | | 15,049,318 | |
Class R6 Shares | | | 1,270,531 | | | | 2,399,571 | |
| | | | | | | | |
Net Increase in Net Assets | | | 787,453,464 | | | | 975,762,980 | |
| | |
NET ASSETS | | | | | | | | |
Beginning of Period | | | 1,520,368,333 | | | | 544,605,353 | |
| | | | | | | | |
| | |
End of Period | | $ | 2,307,821,797 | | | $ | 1,520,368,333 | |
| | | | | | | | |
Undistributed net investment income (loss) | | $ | (1,755,160 | ) | | $ | 1,840 | |
See notes to financial statements.
18 Certified Semi-Annual Report
| | |
| Notes to Financial Statements | | |
| |
Thornburg International Growth Fund | | March 31, 2014 (Unaudited) |
NOTE 1 – ORGANIZATION
Thornburg International Growth Fund, hereinafter referred to as the “Fund,” is a diversified series of Thornburg Investment Trust (the “Trust”). The Fund commenced operations on February 1, 2007. The Trust is organized as a Massachusetts business trust under a Declaration of Trust dated June 3, 1987 and is registered as a diversified, open-end management investment company under the Investment Company Act of 1940, as amended. The Fund is currently one of eighteen separate series of the trust. Each series is considered to be a separate entity for financial reporting and tax purposes and bears expenses directly attributable to it. The Fund seeks long-term capital appreciation by investing in equity securities selected for their growth potential.
The Fund currently offers seven classes of shares of beneficial interest: Class A, Class C, Institutional Class (“Class I”), and Retirement Classes (“Class R3,” “Class R4,” “Class R5,” and “Class R6”). Each class of shares of the Fund represents an interest in the same portfolio of investments, except that (i) Class A shares are sold subject to a front-end sales charge collected at the time the shares are purchased and bear a service fee, (ii) Class C shares are sold at net asset value without a sales charge at the time of purchase, but are subject to a contingent deferred sales charge upon redemption within one year of purchase, and bear both a service fee and a distribution fee, (iii) Class I and Class R5 shares are sold at net asset value without a sales charge at the time of purchase and may be subject to a service fee, (iv) Class R3 shares are sold at net asset value without a sales charge at the time of purchase, but bear both a service fee and distribution fee, (v) Class R4 shares are sold at net asset value without a sales charge at the time of purchase, but bear a service fee, (vi) Class R6 shares are sold at net asset value without a sales charge at the time of purchase, and (vii) the respective classes may have different reinvestment privileges and conversion rights. Additionally, the Fund may allocate among its classes certain expenses, to the extent allocable to specific classes, including transfer agent fees, government registration fees, certain printing and postage costs, and administrative and legal expenses. Currently, class specific expenses of the Fund are limited to service and distribution fees, administration fees, and certain registration and transfer agent expenses.
NOTE 2 – SIGNIFICANT ACCOUNTING POLICIES
Significant accounting policies of the Trust are as follows:
Valuation Policy and Procedures: The Fund’s Trustees of the Trust (the “Trustees”) have authorized employees of the Fund’s investment advisor, acting as the Valuation and Pricing Committee (the “Committee”), to make certain valuation determinations, subject to oversight and review by the Trustees and the Audit Committee of the Trustees. The Committee and other employees of the Fund’s investment advisor administer and implement the valuation process. The Committee regularly reviews its own fair value decisions, as well as valuations, valuation techniques and services furnished by pricing services, considers circumstances in the markets which may require valuation determinations by the Committee and reviews previous valuation determinations. The Committee also reports on its activities, the performance of the pricing services and other matters to the Trustees and the Audit Committee of the Trustees.
In determining a fair value for a portfolio investment, the Committee seeks to determine the price that the Fund would reasonably expect to receive upon a sale of the investment in an orderly transaction between market participants at the measurement date. Typically, the fair value process employs standing instructions to use quoted prices in active markets or the use of independent pricing services. Less frequently, the Committee may make a fair value determination using other methods. However, because fair value prices are estimated prices, the determination of fair value for an investment may differ from the value that would be realized by the Fund upon a sale of the investment, and that difference could be material to the Fund’s financial statements. The Committee’s determination of fair value for an investment may also differ from the prices obtained by other persons (including other mutual funds) for the investment.
Valuation of Investments: Portfolio investments listed or traded on a national securities exchange are valued on the valuation date at the last reported trade price on the exchange that is the primary market for the investment. Portfolio investments traded on an exchange for which there has been no trade that day and other equity investments traded in the over-the-counter market are valued at the mean between the last reported bid and ask prices. Portfolio investments reported by NASDAQ are valued at the NASDAQ official closing price. Any foreign investment traded on exchanges outside the United States is valued at the price of the investment on the exchange that is normally the investment’s primary market, as of the close of that exchange preceding the time of the Fund’s valuation measurement date.
In any case when the market value of an equity investment held by the Fund is not readily available, a determination of a fair value for the investment is made by the Committee. The Committee’s determinations are made using procedures in accordance with a policy approved by the Trustees, which may include the use of a price obtained from an independent pricing service. The pricing service ordinarily values equity investments in these instances using multi-factor models to adjust market prices based upon various inputs, including exchange data, depository receipt prices, futures, index data and other data. An investment’s market value is deemed not readily available whenever the exchange or market on which the investment is primarily traded is closed for the entire scheduled day of trading. Additionally, an investment’s market value may be deemed not readily available under other circumstances identified by the Trustees, including when developments occurring after the most recent close of the investment’s primary exchange or market, but before the most recent close of trading in Fund shares, or an unusual event or significant period of time occurring since the availability of a market quotation, create a question about the reliability of the investment’s market value. On days when market volatility thresholds pre-deter-
Certified Semi-Annual Report 19
| | |
| Notes to Financial Statements, Continued | | |
| |
Thornburg International Growth Fund | | March 31, 2014 (Unaudited) |
mined by the Trustees are exceeded, foreign equity investments held by the Fund may be valued using synthetic pricing obtained from an independent pricing service approved by the Trustees, subject to the ability of the Committee to determine in any such instance to utilize market closing prices if the Committee considers closing prices to be more reliable.
Debt obligations held by the Fund have a primary over-the-counter market and are valued by an independent pricing service approved by the Trustees. The pricing service ordinarily values debt obligations at quoted bid prices. When quotations are not available, debt obligations held by the Fund are valued at evaluated prices determined by the pricing service using methods which include consideration of yields or prices of debt obligations of comparable quality, type of issue, coupon, maturity and rating, and indications as to value from dealers and general market conditions. Short-term obligations having remaining maturities of 60 days or less are ordinarily valued at amortized cost, which approximates market value.
In any case when a pricing service fails to provide a price for a debt obligation held by the Fund, the Committee determines a fair value for the debt obligation using procedures in accordance with a policy approved by the Trustees, which may include the use of a price obtained from a different independent pricing service. Additionally, in any case when management believes that a price provided by a pricing service for a debt obligation held by the Fund may be unreliable, the Committee decides whether or not to use the pricing service’s valuation or to use an alternative method to determine a fair value for the debt obligation.
Quotations in foreign currencies for foreign portfolio investments are converted to U.S. dollar equivalents using the foreign exchange quotation in effect at the time of valuation.
Valuation Measurements: The Fund categorizes its investments based upon the inputs used in valuing those investments, according to a three-level hierarchy established by guidance from the Financial Accounting Standards Board (the “FASB”). Categorization of investments using this hierarchy is intended by the FASB to maximize the use of observable inputs and minimize the use of unobservable inputs by prioritizing that the most observable input be used when available. Observable inputs are those that market participants would use in valuing an investment based on available market data. Unobservable inputs are those that reflect assumptions about the information market participants would use in valuing an investment. An investment’s level within the hierarchy is based on the lowest level input that is deemed significant to the fair value measurement. The methodologies and relative inputs used to value investments are not necessarily indications of the risk or liquidity associated with investing in those investments.
Various inputs are used in determining the fair value measurement of the Fund’s investments. These inputs are generally summarized according to the three-level hierarchy below:
Level 1: Quoted prices in active markets for identical investments.
Level 2: Other direct or indirect significant observable inputs (including quoted prices for similar investments in active markets and other observable inputs, such as interest rates, prepayment rates, credit risk, etc.).
When market volatility thresholds are exceeded, foreign equity investments may be fair valued according to other significant observable inputs rather than quoted market prices. The affected investments will be characterized as Level 2 within the valuation hierarchy and revert to Level 1 after the threshold is no longer exceeded.
Level 3: Significant unobservable inputs, (including the Committee’s own assumptions in determining the fair value of investments), are generally applicable to investments fair valued with single broker quotes and other investments.
Portfolio investments with minimal, if any, market activity are characterized as Level 3 and are valued using significant unobservable inputs, typically including single broker quotes, which may be adjusted or unadjusted, related or comparable investments, last available transactions, and other relevant information. Valuations may also be based upon current market prices of securities that are comparable in coupon, rating, maturity and industry. An income based valuation approach would consider discounted anticipated future cash flows of the investment. Discounts may also be applied due to the nature or duration of any restrictions on the disposition of the investment. The derived value of a Level 3 investment may not represent the value which is received upon disposition.
The following table displays a summary of the fair value hierarchy measurements of the Fund’s investments as of March 31, 2014. In any instance when valuation inputs from more than one level are used to determine the fair value of a specific investment, the investment is placed in the level of the table based upon the lowest level input that is significant in determining the fair value of the investment:
20 Certified Semi-Annual Report
| | |
| Notes to Financial Statements, Continued | | |
| |
Thornburg International Growth Fund | | March 31, 2014 (Unaudited) |
| | | | | | | | | | | | | | | | |
| | | FAIR VALUE MEASUREMENTS AT MARCH 31, 2014 | |
| | | TOTAL | | | LEVEL 1 | | | LEVEL 2 | | | LEVEL 3 | |
Assets | | | | | | | | | | | | | | | | |
Investments in Securities* | | | | | | | | | | | | | | | | |
Common Stock | | $ | 2,115,603,569 | | | $ | 2,115,603,569 | | | $ | — | | | $ | — | |
Short Term Investments | | | 252,498,605 | | | | — | | | | 252,498,605 | | | | — | |
| | | | | | | | | | | | | | | | |
Total Investments in Securities | | $ | 2,368,102,174 | | | $ | 2,115,603,569 | | | $ | 252,498,605 | | | $ | — | |
Other Financial Instruments** | | | | | | | | | | | | | | | | |
Forward Currency Contracts | | $ | 3,644,646 | | | $ | — | | | $ | 3,644,646 | | | $ | — | |
Spot Currency | | $ | 19,452 | | | $ | 19,452 | | | $ | — | | | $ | — | |
| | | | |
Liabilities | | | | | | | | | | | | | | | | |
Other Financial Instruments** | | | | | | | | | | | | | | | | |
Forward Currency Contracts | | $ | (5,351,558 | ) | | $ | — | | | $ | (5,351,558 | ) | | $ | — | |
| * | See Schedule of Investments for a summary of the industry exposure as grouped according to the Global Industry Classification Standard (GICS), which is an industry taxonomy developed by MSCI, Inc. and Standard & Poor’s (S&P). |
| ** | Other Financial Instruments include investments not reflected in the Schedule of Investments, which may include futures, forwards and swap contracts, which are valued at the unrealized appreciation (depreciation) on the investment. |
In accordance with the guidance prescribed in Accounting Standards Update No. 2011-04, it is the policy of the Fund to recognize transfers between levels and those underlying events which caused the movement. The Fund recognized no transfers between levels for the six months ended March 31, 2014, other than when the Fund exceeded market volatility thresholds for foreign equity investments during the period.
Foreign Currency Translation: Portfolio investments and other assets and liabilities denominated in foreign currencies are translated into U.S. dollars based on the exchange rate of such currencies against the U.S. dollar on the date of valuation. Purchases and sales of investments and income items denominated in foreign currencies are translated into U.S. dollars at the exchange rate in effect on the transaction date. When the Fund purchases or sells foreign investments, it will customarily enter into a foreign exchange contract to minimize foreign exchange risk from the trade date to the settlement date of such transactions. The values of such spot contracts are included in receivable for investments sold and payable for investments purchased on the Statement of Assets and Liabilities.
The Fund does not separately report the effect of changes in foreign exchange rates from changes in market prices on investments held. Such changes are included in net unrealized appreciation or depreciation from investments.
Reported net realized gains or losses from foreign currency transactions arise due to purchases and sales of foreign currencies, currency gains or losses realized between the trade and settlement dates on investment transactions and the difference between the amounts of dividends, interest, and foreign withholding taxes recorded on the Fund’s books, and the U.S. dollar equivalent of the amounts actually received or paid.
Net change in unrealized appreciation and depreciation on foreign currency translations arise from changes in the fair value of assets and liabilities, other than investments at fiscal period end, resulting from changes in exchange rates.
Deferred Taxes: The Fund is subject to a tax imposed on net realized gains of securities of certain foreign countries. The Fund records an estimated deferred tax liability for net unrealized gains on these investments as reflected in the accompanying financial statements.
Federal Income Taxes: It is the policy of the Trust to comply with the provisions of the Internal Revenue Code applicable to “regulated investment companies” and to distribute to shareholders substantially all taxable income, including any net realized gain on investments of the Fund. Therefore, no provision for federal income taxes is required.
Management reviews each uncertain tax position believed to be material to the preparation of the Fund’s financial statements, to assess if it is more likely than not that the position would be sustained upon examination, based upon the technical merits of the position. As of March 31, 2014, management has not identified any such position for which an asset or liability must be reflected in the Statement of Assets and Liabilities. The Fund’s tax returns remain subject to examination for three years after filing.
When-Issued and Delayed Delivery Transactions: The Fund may engage in when-issued or delayed delivery transactions. To the extent the Fund engages in such transactions, it will do so for the purpose of acquiring portfolio investments consistent with the Fund’s investment objectives and not for the purpose of investment leverage or to speculate on interest rate and/or market changes. At the time the Fund makes a commitment to purchase an investment on a when-issued or delayed delivery basis, the Fund will record the transaction and reflect the value in determining its net asset value. When effecting such transactions, assets of an amount sufficient to make payment for the portfolio investments to be purchased will be segregated on the Fund’s records on the trade date. Investments purchased on a when-issued or delayed delivery basis do not earn interest until the settlement date.
Certified Semi-Annual Report 21
| | |
| Notes to Financial Statements, Continued | | |
| |
Thornburg International Growth Fund | | March 31, 2014 (Unaudited) |
Dividends: Dividends to shareholders, if any, are generally paid quarterly and are reinvested in additional shares of the Fund at net asset value per share at the close of business on the dividend payment date or, at the shareholder’s option, paid in cash. Net realized capital gains, to the extent available, will be distributed at least annually. Distributions to shareholders are based on income tax regulations and therefore, their characteristics may differ for financial statement and tax purposes.
Repurchase Agreements: The Fund may invest excess cash in repurchase agreements whereby the Fund purchases investments, which serve as collateral, with an agreement to resell such collateral to the seller at an agreed upon price at the maturity date of the repurchase agreement. Investments pledged as collateral for repurchase agreements are held in custody until maturity of the repurchase agreement. Provisions in the agreements require that the market value of the collateral is at least equal to the repurchase value in the event of default. In the event of default, the Fund has the right to liquidate the collateral and apply the proceeds in satisfaction of the obligation. Under certain circumstances, in the event of default or bankruptcy by the other party to the agreement, realization and/or retention of the collateral may be subject to legal proceedings.
General: Investment transactions are accounted for on a trade date basis. Interest income is accrued as earned and dividend income is recorded on the ex-dividend date. Certain income from foreign investments is recognized as soon as information is available to the Fund. Realized gains and losses from the sale of investments are recorded on an identified cost basis. Net investment income (other than class specific expenses) and realized and unrealized gains and losses are allocated daily to each class of shares based upon the relative net asset value of outstanding shares of each class of shares at the beginning of the day (after adjusting for the current share activity of the respective class). Expenses common to all Funds are allocated among the Funds comprising the Trust based upon their relative net asset values or other appropriate allocation methods.
Guarantees and Indemnifications: Under the Trust’s organizational documents (and under separate agreements with the independent Trustees), its officers and Trustees are indemnified against certain liabilities arising out of the performance of their duties to the Fund. Additionally, in the normal course of business the Trust enters into contracts with service providers that contain general indemnification clauses. The Trust’s maximum exposure under these arrangements is unknown. However, based on experience, the Trust expects the risk of loss to be remote.
Use of Estimates: The preparation of financial statements, in conformity with United States generally accepted accounting principles, requires management to make estimates and assumptions that affect the reported amounts of assets and liabilities and the disclosure of contingent assets and liabilities at the date of the financial statements and the reported amounts of increases and decreases in net assets from operations during the reporting period. Actual amounts could differ from those estimates.
NOTE 3 – INVESTMENT ADVISORY FEE AND OTHER TRANSACTIONS WITH AFFILIATES
Pursuant to an investment advisory agreement, Thornburg Investment Management, Inc. (the “Advisor”) serves as the investment advisor and performs services for the Fund for which the fees are payable at the end of each month. For the six months ended March 31, 2014, these fees were payable at annual rates ranging from .875 of 1% to .675 of 1% per annum of the average daily net assets of the Fund depending on the Fund’s asset size. The Trust has also entered into administrative services agreements with the Advisor, whereby the Advisor will perform certain administrative services for the shareholders of each class of the Fund’s shares (except for Class R6 shares, which do not have an administrative services agreement) and for which fees will be payable at an annual rate of up to .125 of 1% per annum of the average daily net assets attributable to each class of shares. The Trust has an underwriting agreement with Thornburg Securities Corporation (the “Distributor,” an affiliate of the Advisor), which acts as the distributor of the Fund’s shares. For the six months ended March 31, 2014, the Distributor has advised the Fund that it earned commissions aggregating $90,470 from the sale of Class A shares, and collected contingent deferred sales charges aggregating $18,873 from redemptions of Class C shares of the Fund.
Pursuant to a service plan under Rule 12b-1 of the Investment Company Act of 1940, the Fund may reimburse to the Advisor an amount not to exceed .25 of 1% per annum of the average daily net assets attributable to each class of shares of the Fund (except for Class R6 shares, which do not have a Rule 12b-1 service plan) for payments made by the Advisor to securities dealers and other financial institutions to obtain various shareholder and distribution related services. For the six months ended March 31, 2014, there were no 12b-1 service plan fees charged for Class I and R5 shares. The Advisor may pay out of its own resources additional expenses for distribution of the Fund’s shares.
The Trust has also adopted distribution plans pursuant to Rule 12b-1, applicable only to the Fund’s Class C and Class R3 shares, under which the Fund compensates the Distributor for services in promoting the sale of Class C and Class R3 shares of the Fund at an annual rate of up to .75 of 1% per annum of the average daily net assets attributable to Class C shares, and an annual rate of up to .25 of 1% per annum of the average daily net assets attributable to Class R3 shares. Total fees incurred by each class of shares of the Fund under their respective service and distribution plans for the six months ended March 31, 2014, are set forth in the Statement of Operations.
The Advisor and Distributor have contractually agreed to waive fees and reimburse expenses incurred by the Fund so that actual expenses of certain share classes do not exceed specified levels. The agreement may be terminated by the Fund at any time, but may
22 Certified Semi-Annual Report
| | |
| Notes to Financial Statements, Continued | | |
| |
Thornburg International Growth Fund | | March 31, 2014 (Unaudited) |
not be terminated by the Advisor or Distributor before February 1, 2015, unless the Advisor ceases to be the investment advisor to the Fund or the Distributor ceases to be the distributor of the Fund prior to that date. The Advisor and Distributor retain the right to be repaid by the Fund for fee waivers and expense reimbursements if expenses fall below the contractual limit prior to the end of the fiscal year.
For the six months ended March 31, 2014, the Advisor contractually reimbursed certain class specific expenses, administrative fees, and distribution fees of $4,972 for Class I shares, $24,604 for Class R3 shares, $20,553 for Class R4 shares, $26,654 for Class R5 shares, and $7,173 for Class R6 shares.
The Trust has an agreement with the custodian bank to indirectly pay a portion of the custodian’s fees through credits earned by the Fund’s cash on deposit with the bank. This deposit agreement is an alternative to overnight investments. Custodial fees are adjusted to reflect amounts that would have been paid without this agreement, with a corresponding adjustment reflected as fees paid indirectly in the Statement of Operations. For the six months ended March 31, 2014, there were no fees paid indirectly.
Certain officers and Trustees of the Trust are also officers or directors of the Advisor and Distributor. The compensation of independent Trustees is borne by the Trust.
NOTE 4 – SHARES OF BENEFICIAL INTEREST
At March 31, 2014, there were an unlimited number of shares of beneficial interest authorized. Transactions in shares of beneficial interest were as follows:
| | | | | | | | | | | | | | | | |
| | | SIX MONTHS ENDED | | | YEAR ENDED | |
| | | MARCH 31, 2014 (UNAUDITED) | | | SEPTEMBER 30, 2013 (AUDITED) | |
| | | SHARES | | | AMOUNT | | | SHARES | | | AMOUNT | |
Class A Shares | | | | | | | | | | | | | | | | |
Shares sold | | | 15,456,051 | | | $ | 325,044,985 | | | | 18,072,733 | | | $ | 325,534,070 | |
Shares issued to shareholders in reinvestment of dividends | | | 810,018 | | | | 16,767,379 | | | | — | | | | — | |
Shares repurchased | | | (3,838,843 | ) | | | (80,372,933 | ) | | | (6,034,639 | ) | | | (106,217,545 | ) |
| | | | | | | | | | | | | | | | |
| | | | |
Net increase (decrease) | | | 12,427,226 | | | $ | 261,439,431 | | | | 12,038,094 | | | $ | 219,316,525 | |
| | | | | | | | | | | | | | | | |
| | | | |
Class C Shares | | | | | | | | | | | | | | | | |
Shares sold | | | 2,878,242 | | | $ | 58,907,327 | | | | 2,888,564 | | | $ | 50,987,977 | |
Shares issued to shareholders in reinvestment of dividends | | | 158,203 | | | | 3,184,629 | | | | — | | | | — | |
Shares repurchased | | | (459,213 | ) | | | (9,392,490 | ) | | | (663,227 | ) | | | (11,591,599 | ) |
| | | | | | | | | | | | | | | | |
| | | | |
Net increase (decrease) | | | 2,577,232 | | | $ | 52,699,466 | | | | 2,225,337 | | | $ | 39,396,378 | |
| | | | | | | | | | | | | | | | |
| | | | |
Class I Shares | | | | | | | | | | | | | | | | |
Shares sold | | | 25,399,021 | | | $ | 546,720,743 | | | | 27,208,099 | | | $ | 501,442,073 | |
Shares issued to shareholders in reinvestment of dividends | | | 928,994 | | | | 19,648,214 | | | | — | | | | — | |
Shares repurchased | | | (6,378,058 | ) | | | (136,200,128 | ) | | | (4,429,838 | ) | | | (81,049,476 | ) |
| | | | | | | | | | | | | | | | |
| | | | |
Net increase (decrease) | | | 19,949,957 | | | $ | 430,168,829 | | | | 22,778,261 | | | $ | 420,392,597 | |
| | | | | | | | | | | | | | | | |
| | | | |
Class R3 Shares | | | | | | | | | | | | | | | | |
Shares sold | | | 239,082 | | | $ | 5,013,628 | | | | 467,014 | | | $ | 8,214,767 | |
Shares issued to shareholders in reinvestment of dividends | | | 15,665 | | | | 323,012 | | | | — | | | | — | |
Shares repurchased | | | (103,525 | ) | | | (2,167,511 | ) | | | (146,581 | ) | | | (2,528,296 | ) |
| | | | | | | | | | | | | | | | |
| | | | |
Net increase (decrease) | | | 151,222 | | | $ | 3,169,129 | | | | 320,433 | | | $ | 5,686,471 | |
| | | | | | | | | | | | | | | | |
Certified Semi-Annual Report 23
| | |
| Notes to Financial Statements, Continued | | |
| |
Thornburg International Growth Fund | | March 31, 2014 (Unaudited) |
| | | | | | | | | | | | | | | | |
| | | SIX MONTHS ENDED | | | YEAR ENDED | |
| | | MARCH 31, 2014 (UNAUDITED) | | | SEPTEMBER 30, 2013 (AUDITED) | |
| | | SHARES | | | AMOUNT | | | SHARES | | | AMOUNT | |
Class R4 Shares | | | | | | | | | | | | | | | | |
Shares sold | | | 1,165,707 | | | $ | 24,304,239 | | | | 1,044,260 | | | $ | 17,883,776 | |
Shares issued to shareholders in reinvestment of dividends | | | 27,047 | | | | 557,168 | | | | — | | | | — | |
Shares repurchased | | | (386,702 | ) | | | (8,099,781 | ) | | | (344,989 | ) | | | (6,152,637 | ) |
| | | | | | | | | | | | | | | | |
| | | | |
Net increase (decrease) | | | 806,052 | | | $ | 16,761,626 | | | | 699,271 | | | $ | 11,731,139 | |
| | | | | | | | | | | | | | | | |
| | | | |
Class R5 Shares | | | | | | | | | | | | | | | | |
Shares sold | | | 2,292,356 | | | $ | 49,575,793 | | | | 1,964,624 | | | $ | 34,202,940 | |
Shares issued to shareholders in reinvestment of dividends | | | 59,061 | | | | 1,252,102 | | | | — | | | | — | |
Shares repurchased | | | (433,754 | ) | | | (9,323,046 | ) | | | (1,105,700 | ) | | | (19,153,622 | ) |
| | | | | | | | | | | | | | | | |
| | | | |
Net increase (decrease) | | | 1,917,663 | | | $ | 41,504,849 | | | | 858,924 | | | $ | 15,049,318 | |
| | | | | | | | | | | | | | | | |
| | | | |
Class R6 Shares* | | | | | | | | | | | | | | | | |
Shares sold | | | 80,483 | | | $ | 1,742,795 | | | | 121,272 | | | $ | 2,399,571 | |
Shares issued to shareholders in reinvestment of dividends | | | 3,595 | | | | 76,351 | | | | — | | | | — | |
Shares repurchased | | | (25,391 | ) | | | (548,615 | ) | | | — | | | | — | |
| | | | | | | | | | | | | | | | |
| | | | |
Net increase (decrease) | | | 58,687 | | | $ | 1,270,531 | | | | 121,272 | | | $ | 2,399,571 | |
| | | | | | | | | | | | | | | | |
| * | Effective date for this Class of shares was February 1, 2013. |
NOTE 5 – INVESTMENT TRANSACTIONS
For the six months ended March 31, 2014, the Fund had purchase and sale transactions of investments (excluding short-term investments) of $1,522,374,633 and $806,568,513, respectively.
NOTE 6 – INCOME TAXES
At March 31, 2014, information on the tax components of capital was as follows:
| | | | |
Cost of investments for tax purposes | | $ | 2,120,499,373 | |
| | | | |
Gross unrealized appreciation on a tax basis | | $ | 313,005,916 | |
Gross unrealized depreciation on a tax basis | | | (65,403,115 | ) |
| | | | |
Net unrealized appreciation (depreciation) on investments (tax basis) | | $ | 247,602,801 | |
| | | | |
NOTE 7 – DERIVATIVE FINANCIAL INSTRUMENTS WITH OFF-BALANCE SHEET RISK AND FOREIGN INVESTMENT RISK
The Fund may use a variety of derivative financial instruments to hedge or adjust the risks affecting its investment portfolio or to enhance investment returns. Provisions of FASB Accounting Standards Codification 815-10-50 (“ASC 815”), require certain disclosures. The disclosures are intended to provide users of financial statements with an understanding of the use of derivative instruments by the Fund and how these derivatives affect the financial position, financial performance and cash flows of the Fund. The Fund does not designate any derivative instruments as hedging instruments under ASC 815. During the six months ended March 31, 2014, the Fund’s principal exposure to derivative financial instruments of the type addressed by ASC 815 was investment in foreign exchange contracts. A foreign exchange contract is an agreement between two parties to exchange different currencies at a specified rate of exchange at an agreed upon future date. Foreign exchange contracts involve risks to the Fund, including the risk that a contract’s counterparty will not meet its obligations to the Fund, the risk that a change in a contract’s value may not correlate perfectly with the currency the
24 Certified Semi-Annual Report
| | |
| Notes to Financial Statements, Continued | | |
| |
Thornburg International Growth Fund | | March 31, 2014 (Unaudited) |
contract was intended to track, and the risk that the advisor is unable to correctly implement its strategy in using a contract. In any such instance, the Fund may not achieve the intended benefit of entering into a contract, and may experience a loss. Additionally, the Fund’s risk of loss may exceed the amounts recognized on the Statement of Assets and Liabilities.
The Fund entered into forward currency contracts during the six months ended March 31, 2014 in the normal course of pursuing its investment objectives, with the objective of reducing the risk to the value of the Fund’s foreign investments from adverse changes in the relationship between the U.S. dollar and foreign currencies. In each case these contracts have been initiated in conjunction with foreign investment transactions.
These contracts are accounted for by the Fund under ASC 815. Unrealized appreciation and depreciation on outstanding contracts are reported in the Fund’s Statement of Assets and Liabilities, as measured by the difference between the forward exchange rates at the reporting date and the forward exchange rates at each contract’s inception date. Net realized gain (loss) on contracts closed during the period, and changes in net unrealized appreciation (depreciation) on outstanding contracts are recognized in the Fund’s Statement of Operations. Values of open sell currency contracts are indicative of the activity for the six months ended March 31, 2014. Open buy currency contracts are entered into for the purpose of closing open sell currency contracts and the values are dependent upon the values of the open sell currency contracts to which they relate.
The following table displays the outstanding forward currency contracts at March 31, 2014:
| | | | | | | | | | | | | | | | | | | | | | |
| OUTSTANDING FORWARD CURRENCY CONTRACTS TO BUY OR SELL AT MARCH 31, 2014 | |
CONTRACT DESCRIPTION BUY/SELL | | | | CONTRACT
AMOUNT | | | CONTRACT
VALUE DATE | | | VALUE USD | | | UNREALIZED
APPRECIATION | | | UNREALIZED
DEPRECIATION | |
Australian Dollar | | Buy | | | 28,317,100 | | | | 07/29/2014 | | | | 26,050,667 | | | $ | 700,633 | | | $ | — | |
Australian Dollar | | Sell | | | 28,317,100 | | | | 07/29/2014 | | | | 26,050,667 | | | | — | | | | (1,601,400 | ) |
Euro | | Sell | | | 23,664,800 | | | | 09/12/2014 | | | | 32,597,408 | | | | 253,003 | | | | — | |
Great Britain Pound | | Buy | | | 37,522,900 | | | | 07/21/2014 | | | | 62,504,150 | | | | 129,833 | | | | — | |
Great Britain Pound | | Sell | | | 105,930,400 | | | | 07/21/2014 | | | | 176,454,634 | | | | — | | | | (2,587,891 | ) |
Japanese Yen | | Sell | | | 8,023,609,400 | | | | 05/20/2014 | | | | 77,756,841 | | | | 2,561,177 | | | | — | |
Japanese Yen | | Sell | | | 2,451,336,200 | | | | 05/20/2014 | | | | 23,755,912 | | | | — | | | | (122 | ) |
Japanese Yen | | Buy | | | 1,496,278,300 | | | | 05/20/2014 | | | | 14,500,441 | | | | — | | | | (37,825 | ) |
Japanese Yen | | Buy | | | 776,543,000 | | | | 05/20/2014 | | | | 7,525,482 | | | | — | | | | (82,389 | ) |
Japanese Yen | | Sell | | | 1,009,927,400 | | | | 05/20/2014 | | | | 9,787,212 | | | | — | | | | (138,439 | ) |
Japanese Yen | | Buy | | | 3,059,599,800 | | | | 05/20/2014 | | | | 29,650,598 | | | | — | | | | (168,900 | ) |
Japanese Yen | | Sell | | | 2,060,814,200 | | | | 05/20/2014 | | | | 19,971,361 | | | | — | | | | (310,105 | ) |
Japanese Yen | | Buy | | | 2,223,541,800 | | | | 05/20/2014 | | | | 21,548,355 | | | | — | | | | (424,487 | ) |
| | | | | | | | | | | | | | | | | | | | | | |
Total | | | | | | | | | | | | | | | | $ | 3,644,646 | | | $ | (5,351,558 | ) |
| | | | | | | | | | | | | | | | | | | | | | |
Certified Semi-Annual Report 25
| | |
| Notes to Financial Statements, Continued | | |
| |
Thornburg International Growth Fund | | March 31, 2014 (Unaudited) |
The foregoing forward currency contracts were entered into pursuant to an International Swaps and Derivatives Association (ISDA) Master Agreement. In the event of a default or termination under the ISDA Master Agreement, the non-defaulting party has the right to close out all outstanding forward currency contracts between the parties and to net any payment amounts under those contracts, resulting in a single net amount payable by one party to the other. Because the ISDA Master Agreement does not result in an offset of reported amounts of financial assets and financial liabilities in the Fund’s Statement of Assets and Liabilities unless there has been an event of default or termination event under that agreement, the Fund does not net its outstanding forward currency contracts for purposes of the disclosure in the Fund’s Statement of Assets and Liabilities. Instead the Fund recognizes the unrealized appreciation or depreciation on those forward currency contracts on a gross basis in the Fund’s Statement of Assets and Liabilities. At March 31, 2014, those recognized amounts are disclosed in the following table:
| | | | |
| FAIR VALUES OF DERIVATIVE FINANCIAL INSTRUMENTS AT MARCH 31, 2014 |
ASSET DERIVATIVES | | BALANCE SHEET LOCATION | | FAIR VALUE |
Foreign exchange contracts | | Assets - Unrealized appreciation on forward currency contracts | | $3,644,646 |
| | |
LIABILITY DERIVATIVES | | BALANCE SHEET LOCATION | | FAIR VALUE |
Foreign exchange contracts | | Liabilities - Unrealized depreciation on forward currency contracts | | $(5,351,558) |
Because the Fund does not currently receive or post cash collateral in connection with its currency forward contracts, and because all of the Fund’s outstanding currency forward contracts are with State Street Bank and Trust Company, the net amounts of the Fund’s assets and liabilities which are attributable to those contracts at March 31, 2014 can be determined by offsetting the dollar amounts shown in the preceding table. Based on those amounts, the net amount of the Fund’s assets which is attributable to its outstanding forward currency contracts at March 31, 2014 is $0, and the net amount of the Fund’s liabilities which is attributable to those contracts at that date is $1,706,912. The Fund’s forward currency contracts are valued each day, and the net amounts of the Fund’s assets and liabilities which are attributable to those contracts are expected to vary over time.
The net realized gain (loss) from forward currency contracts, and the net change in unrealized appreciation (depreciation) of outstanding forward currency contracts recognized in the Fund’s Statement of Operations for the six months ended March 31, 2014 are disclosed in the following tables:
| | | | |
| AMOUNT OF NET REALIZED GAIN (LOSS) ON DERIVATIVE FINANCIAL INSTRUMENTS |
| RECOGNIZED IN INCOME FOR THE SIX MONTHS ENDED MARCH 31, 2014 |
| | | TOTAL | | FORWARD CURRENCY CONTRACTS |
Foreign exchange contracts | | $(8,735,068) | | $(8,735,068) |
|
| AMOUNT OF NET CHANGE IN UNREALIZED APPRECIATION (DEPRECIATION) OF DERIVATIVE FINANCIAL INSTRUMENTS |
| RECOGNIZED IN INCOME FOR THE SIX MONTHS ENDED MARCH 31, 2014 |
| | | TOTAL | | FORWARD CURRENCY CONTRACTS |
Foreign exchange contracts | | $ 3,831,297 | | $ 3,831,297 |
OTHER NOTES
Risks: The Fund’s investments subject it to risks including, but not limited to, management risk, market and economic risk, risks affecting specific issuers, liquidity risk, the risks associated with investments in smaller companies and non-U.S. issuers, credit risk, and interest rate risk. Please see the Fund’s prospectus for a discussion of the risks associated with an investment in the Fund.
Subsequent Events: Fund management believes no events have occurred between March 31, 2014 and the date of issuance of the financial statements that require adjustment to or disclosure in the accompanying financial statements.
26 Certified Semi-Annual Report
This page intentionally left blank.
Certified Semi-Annual Report 27
Financial Highlights
Thornburg International Growth Fund
| | | | | | | | | | | | | | | | | | | | | | | | | | | | | | | | | | | | | | | | | | | | | | | | | | | | | | | | | | | | |
| | | PER SHARE PERFORMANCE (FOR A SHARE OUTSTANDING THROUGHOUT THE PERIOD)+ | | | RATIOS TO AVERAGE NET ASSETS | | | SUPPLEMENTAL DATA | |
UNLESS OTHERWISE NOTED, PERIODS ARE FISCAL YEARS ENDED SEPT. 30, | | NET ASSET
VALUE
BEGINNING
OF
PERIOD | | | NET
INVESTMENT
INCOME
(LOSS) | | | NET
REALIZED
&
UNREALIZED
GAIN
(LOSS)
ON
INVESTMENTS | | | TOTAL
FROM
INVESTMENT
OPERATIONS | | | DIVIDENDS
FROM
NET
INVESTMENT
INCOME | | | DIVIDENDS
FROM
NET
REALIZED
GAINS | | | TOTAL
DIVIDENDS | | | NET
ASSET
VALUE
END OF
PERIOD | | | NET
INVESTMENT
INCOME
(LOSS)
(%) | | | EXPENSES,
AFTER
EXPENSE
REDUCTIONS
(%) | | | EXPENSES,
AFTER
EXPENSE
REDUCTIONS
AND
NET
OF
CUSTODY
CREDITS
(%) | | | EXPENSES,
BEFORE
EXPENSE
REDUCTIONS
(%) | | | TOTAL
RETURN
(%)(a) | | | PORTFOLIO
TURNOVER
RATE
(%)(a) | | | NET
ASSETS
AT END
OF
PERIOD
(THOUSANDS) | |
CLASS A SHARES | | | | | | | | | | | | | | | | | | | | | | | | | | | | | | | | | | | | | | | | | | | | | | | | | | | | | |
2014(b)(c) | | $ | 20.54 | | | | (0.03 | ) | | | 0.60 | | | | 0.57 | | | | — | | | | (0.57 | ) | | | (0.57 | ) | | $ | 20.54 | | | | (0.30 | )(d) | | | 1.29 | (d) | | | 1.29 | (d) | | | 1.29 | (d) | | | 2.74 | | | | 44.87 | | | $ | 835,184 | |
2013(b) | | $ | 15.78 | | | | (0.01 | ) | | | 4.77 | | | | 4.76 | | | | — | | | | — | | | | — | | | $ | 20.54 | | | | (0.06 | ) | | | 1.41 | | | | 1.41 | | | | 1.42 | | | | 30.16 | | | | 89.17 | | | $ | 580,194 | |
2012(b) | | $ | 13.37 | | | | (0.06 | ) | | | 2.47 | | | | 2.41 | | | | — | (e) | | | — | | | | — | | | $ | 15.78 | | | | (0.41 | ) | | | 1.51 | | | | 1.51 | | | | 1.52 | | | | 18.03 | | | | 95.17 | | | $ | 255,725 | |
2011(b) | | $ | 12.25 | | | | 0.03 | | | | 1.13 | | | | 1.16 | | | | (0.04 | ) | | | — | | | | (0.04 | ) | | $ | 13.37 | | | | 0.19 | | | | 1.51 | | | | 1.50 | | | | 1.54 | | | | 9.43 | | | | 142.59 | | | $ | 104,918 | |
2010(b) | | $ | 10.36 | | | | — | (f) | | | 1.94 | | | | 1.94 | | | | (0.05 | ) | | | — | | | | (0.05 | ) | | $ | 12.25 | | | | (0.02 | ) | | | 1.61 | | | | 1.60 | | | | 1.70 | | | | 18.82 | | | | 128.86 | | | $ | 36,527 | |
2009(b) | | $ | 10.35 | | | | 0.04 | | | | 0.10 | | | | 0.14 | | | | (0.13 | ) | | | — | | | | (0.13 | ) | | $ | 10.36 | | | | 0.52 | | | | 1.62 | | | | 1.61 | | | | 1.95 | | | | 1.89 | | | | 103.57 | | | $ | 24,015 | |
CLASS C SHARES | | | | | | | | | | | | | | | | | | | | | | | | | | | | | | | | | | | | | | | | | | | | | | | | | | | | | |
2014(c) | | $ | 20.01 | | | | (0.11 | ) | | | 0.58 | | | | 0.47 | | | | — | | | | (0.57 | ) | | | (0.57 | ) | | $ | 19.91 | | | | (1.07 | )(d) | | | 2.05 | (d) | | | 2.05 | (d) | | | 2.05 | (d) | | | 2.31 | | | | 44.87 | | | $ | 167,207 | |
2013 | | $ | 15.49 | | | | (0.14 | ) | | | 4.66 | | | | 4.52 | | | | — | | | | — | | | | — | | | $ | 20.01 | | | | (0.81 | ) | | | 2.15 | | | | 2.15 | | | | 2.17 | | | | 29.18 | | | | 89.17 | | | $ | 116,453 | |
2012 | | $ | 13.23 | | | | (0.17 | ) | | | 2.43 | | | | 2.26 | | | | — | | | | — | | | | — | | | $ | 15.49 | | | | (1.19 | ) | | | 2.27 | | | | 2.27 | | | | 2.28 | | | | 17.08 | | | | 95.17 | | | $ | 55,656 | |
2011 | | $ | 12.18 | | | | (0.11 | ) | | | 1.16 | | | | 1.05 | | | | — | | | | — | | | | — | | | $ | 13.23 | | | | (0.77 | ) | | | 2.30 | | | | 2.30 | | | | 2.34 | | | | 8.62 | | | | 142.59 | | | $ | 35,706 | |
2010 | | $ | 10.33 | | | | (0.09 | ) | | | 1.94 | | | | 1.85 | | | | — | | | | — | | | | — | | | $ | 12.18 | | | | (0.81 | ) | | | 2.38 | | | | 2.38 | | | | 2.51 | | | | 17.91 | | | | 128.86 | | | $ | 24,829 | |
2009 | | $ | 10.22 | | | | (0.02 | ) | | | 0.18 | | | | 0.16 | | | | (0.05 | ) | | | — | | | | (0.05 | ) | | $ | 10.33 | | | | (0.21 | ) | | | 2.37 | | | | 2.37 | | | | 2.72 | | | | 1.76 | | | | 103.57 | | | $ | 19,233 | |
CLASS I SHARES | | | | | | | | | | | | | | | | | | | | | | | | | | | | | | | | | | | | | | | | | | | | | | | | | | | | | |
2014(c) | | $ | 20.96 | | | | 0.01 | | | | 0.60 | | | | 0.61 | | | | — | | | | (0.57 | ) | | | (0.57 | ) | | $ | 21.00 | | | | 0.05 | (d) | | | 0.93 | (d) | | | 0.93 | (d) | | | 0.93 | (d) | | | 2.88 | | | | 44.87 | | | $ | 1,158,050 | |
2013 | | $ | 16.04 | | | | 0.07 | | | | 4.85 | | | | 4.92 | | | | — | | | | — | | | | — | | | $ | 20.96 | | | | 0.38 | | | | 0.99 | | | | 0.99 | | | | 1.04 | | | | 30.67 | | | | 89.17 | | | $ | 737,536 | |
2012 | | $ | 13.55 | | | | 0.02 | | | | 2.50 | | | | 2.52 | | | | (0.03 | ) | | | — | | | | (0.03 | ) | | $ | 16.04 | | | | 0.10 | | | | 0.99 | | | | 0.99 | | | | 1.14 | | | | 18.60 | | | | 95.17 | | | $ | 198,938 | |
2011 | | $ | 12.38 | | | | 0.10 | | | | 1.14 | | | | 1.24 | | | | (0.07 | ) | | | — | | | | (0.07 | ) | | $ | 13.55 | | | | 0.66 | | | | 0.99 | | | | 0.98 | | | | 1.16 | | | | 10.03 | | | | 142.59 | | | $ | 75,538 | |
2010 | | $ | 10.44 | | | | 0.07 | | | | 1.96 | | | | 2.03 | | | | (0.09 | ) | | | — | | | | (0.09 | ) | | $ | 12.38 | | | | 0.58 | | | | 0.99 | | | | 0.99 | | | | 1.25 | | | | 19.60 | | | | 128.86 | | | $ | 39,169 | |
2009 | | $ | 10.46 | | | | 0.10 | | | | 0.08 | | | | 0.18 | | | | (0.20 | ) | | | — | | | | (0.20 | ) | | $ | 10.44 | | | | 1.17 | | | | 0.99 | | | | 0.99 | | | | 1.42 | | | | 2.56 | | | | 103.57 | | | $ | 24,313 | |
CLASS R3 SHARES | | | | | | | | | | | | | | | | | | | | | | | | | | | | | | | | | | | | | | | | | | | | | | | | | | | | | |
2014(c) | | $ | 20.46 | | | | (0.05 | ) | | | 0.59 | | | | 0.54 | | | | — | | | | (0.57 | ) | | | (0.57 | ) | | $ | 20.43 | | | | (0.52 | )(d) | | | 1.50 | (d) | | | 1.50 | (d) | | | 1.81 | (d) | | | 2.60 | | | | 44.87 | | | $ | 17,052 | |
2013 | | $ | 15.73 | | | | (0.03 | ) | | | 4.76 | | | | 4.73 | | | | — | | | | — | | | | — | | | $ | 20.46 | | | | (0.15 | ) | | | 1.50 | | | | 1.50 | | | | 2.01 | | | | 30.07 | | | | 89.17 | | | $ | 13,982 | |
2012 | | $ | 13.34 | | | | (0.06 | ) | | | 2.45 | | | | 2.39 | | | | — | (e) | | | — | | | | — | | | $ | 15.73 | | | | (0.40 | ) | | | 1.50 | | | | 1.50 | | | | 2.49 | | | | 17.94 | | | | 95.17 | | | $ | 5,709 | |
2011 | | $ | 12.22 | | | | 0.01 | | | | 1.15 | | | | 1.16 | | | | (0.04 | ) | | | — | | | | (0.04 | ) | | $ | 13.34 | | | | 0.06 | | | | 1.50 | | | | 1.49 | | | | 3.27 | | | | 9.46 | | | | 142.59 | | | $ | 1,925 | |
2010 | | $ | 10.33 | | | | 0.01 | | | | 1.94 | | | | 1.95 | | | | (0.06 | ) | | | — | | | | (0.06 | ) | | $ | 12.22 | | | | 0.07 | | | | 1.50 | | | | 1.50 | | | | 4.34 | | | | 18.98 | | | | 128.86 | | | $ | 1,094 | |
2009 | | $ | 10.36 | | | | 0.08 | | | | 0.06 | | | | 0.14 | | | | (0.17 | ) | | | — | | | | (0.17 | ) | | $ | 10.33 | | | | 0.94 | | | | 1.46 | | | | 1.46 | | | | 6.14 | (g) | | | 2.09 | | | | 103.57 | | | $ | 748 | |
CLASS R4 SHARES | | | | | | | | | | | | | | | | | | | | | | | | | | | | | | | | | | | | | | | | | | | | | | | | | | | | | |
2014(c) | | $ | 20.45 | | | | (0.04 | ) | | | 0.59 | | | | 0.55 | | | | — | | | | (0.57 | ) | | | (0.57 | ) | | $ | 20.43 | | | | (0.41 | )(d) | | | 1.38 | (d) | | | 1.38 | (d) | | | 1.50 | (d) | | | 2.66 | | | | 44.87 | | | $ | 42,884 | |
2013 | | $ | 15.70 | | | | (0.01 | ) | | | 4.76 | | | | 4.75 | | | | — | | | | — | | | | — | | | $ | 20.45 | | | | (0.04 | ) | | | 1.38 | | | | 1.38 | | | | 1.68 | | | | 30.25 | | | | 89.17 | | | $ | 26,441 | |
2012 | | $ | 13.31 | | | | (0.04 | ) | | | 2.46 | | | | 2.42 | | | | (0.03 | ) | | | — | | | | (0.03 | ) | | $ | 15.70 | | | | (0.29 | ) | | | 1.40 | | | | 1.40 | | | | 2.23 | | | | 18.17 | | | | 95.17 | | | $ | 9,326 | |
2011 | | $ | 12.18 | | | | 0.07 | | | | 1.10 | | | | 1.17 | | | | (0.04 | ) | | | — | | | | (0.04 | ) | | $ | 13.31 | | | | 0.46 | | | | 1.40 | | | | 1.40 | | | | 32.23 | (g) | | | 9.62 | | | | 142.59 | | | $ | 146 | |
2010 | | $ | 10.29 | | | | 0.02 | | | | 1.94 | | | | 1.96 | | | | (0.07 | ) | | | — | | | | (0.07 | ) | | $ | 12.18 | | | | 0.15 | | | | 1.42 | | | | 1.40 | | | | 738.92 | (g) | | | 19.11 | | | | 128.86 | | | $ | 3 | |
2009 | | $ | 10.36 | | | | 0.07 | | | | 0.06 | | | | 0.13 | | | | (0.20 | ) | | | — | | | | (0.20 | ) | | $ | 10.29 | | | | 0.82 | | | | 1.40 | | | | 1.40 | | | | 980.09 | (g) | | | 2.10 | | | | 103.57 | | | $ | 2 | |
CLASS R5 SHARES | | | | | | | | | | | | | | | | | | | | | | | | | | | | | | | | | | | | | | | | | | | | | | | | | | | | | |
2014(c) | | $ | 21.01 | | | | — | (f) | | | 0.61 | | | | 0.61 | | | | — | | | | (0.57 | ) | | | (0.57 | ) | | $ | 21.05 | | | | (0.01 | )(d) | | | 0.99 | (d) | | | 0.99 | (d) | | | 1.07 | (d) | | | 2.88 | | | | 44.87 | | | $ | 83,648 | |
2013 | | $ | 16.07 | | | | 0.07 | | | | 4.87 | | | | 4.94 | | | | — | | | | — | | | | — | | | $ | 21.01 | | | | 0.35 | | | | 0.99 | | | | 0.99 | | | | 1.22 | | | | 30.74 | | | | 89.17 | | | $ | 43,209 | |
2012 | | $ | 13.58 | | | | 0.02 | | | | 2.50 | | | | 2.52 | | | | (0.03 | ) | | | — | | | | (0.03 | ) | | $ | 16.07 | | | | 0.13 | | | | 0.99 | | | | 0.99 | | | | 1.29 | | | | 18.56 | | | | 95.17 | | | $ | 19,251 | |
2011 | | $ | 12.40 | | | | 0.08 | | | | 1.17 | | | | 1.25 | | | | (0.07 | ) | | | — | | | | (0.07 | ) | | $ | 13.58 | | | | 0.55 | | | | 0.99 | | | | 0.99 | | | | 10.60 | (g) | | | 10.09 | | | | 142.59 | | | $ | 393 | |
2010 | | $ | 10.46 | | | | (0.09 | ) | | | 2.12 | | | | 2.03 | | | | (0.09 | ) | | | — | | | | (0.09 | ) | | $ | 12.40 | | | | (0.83 | ) | | | 0.99 | | | | 0.99 | | | | 17.58 | (g) | | | 19.56 | | | | 128.86 | | | $ | 171 | |
2009 | | $ | 10.46 | | | | 0.08 | | | | 0.11 | | | | 0.19 | | | | (0.19 | ) | | | — | | | | (0.19 | ) | | $ | 10.46 | | | | 0.92 | | | | 0.97 | | | | 0.97 | | | | 522.27 | (g) | | | 2.53 | | | | 103.57 | | | $ | 9 | |
CLASS R6 SHARES | | | | | | | | | | | | | | | | | | | | | | | | | | | | | | | | | | | | | | | | | | | | | | | | | | | | | |
2014(c) | | $ | 21.05 | | | | 0.01 | | | | 0.61 | | | | 0.62 | | | | — | | | | (0.57 | ) | | | (0.57 | ) | | $ | 21.10 | | | | 0.09 | (d) | | | 0.89 | | | | 0.89 | (d) | | | 1.32 | (d) | | | 2.92 | | | | 44.87 | | | $ | 3,797 | |
2013(h) | | $ | 17.54 | | | | 0.46 | | | | 3.05 | | | | 3.51 | | | | — | | | | — | | | | — | | | $ | 21.05 | | | | 2.21 | (d) | | | 0.89 | (d) | | | 0.89 | (d) | | | 11.83 | (d)(g) | | | 20.01 | | | | 89.17 | | | $ | 2,553 | |
| (a) | Not annualized for periods less than one year. |
| (b) | Sales loads are not reflected in computing total return. |
| (c) | Unaudited Six Month Period Ended March 31. |
| (e) | Dividends from net investment income per share were less than $(0.01). |
| (f) | Net Investment Income (Loss) was less than $0.01 per share. |
| (g) | Due to the size of net assets and fixed expenses, ratios may appear disproportionate. |
| (h) | Effective date of this Class of shares was February 1, 2013. |
| + | Based on weighted average shares outstanding, except for Dividends from Net Investment Income and Net Realized Gains, which are actual amounts per share. |
See notes to financial statements.
| | | | |
| 28 Certified Semi-Annual Report | | | | Certified Semi-Annual Report 29 |
| | |
| Expense Example | | |
| |
Thornburg International Growth Fund | | March 31, 2014 (Unaudited) |
As a shareholder of the Fund, you incur two types of costs:
| | (1) | transaction costs, including |
(a) sales charges (loads) on purchase payments, for Class A shares;
(b) a deferred sales charge on redemptions of any part or all of a purchase of $1 million of Class A shares within 12 months of purchase;
(c) a deferred sales charge on redemptions of Class C shares within 12 months of purchase;
| | (2) | ongoing costs, including management fees; distribution and/or service (12b-1) fees; and other Fund expenses. |
This example is intended to help you understand your ongoing costs (in dollars) of investing in the Fund and to compare these costs with the ongoing costs of investing in other mutual funds.
The example is based on a $1,000 investment beginning on October 1, 2013, and held until March 31, 2014.
Actual Expenses
For each class of shares, the first line of the accompanying table provides information about actual account values and actual expenses. You may use the information in this line, together with the amount you invested, to estimate the expenses that you paid over the period. Simply divide your account value by $1,000 (for example, an $8,600 account value divided by $1,000 = 8.6), then multiply the result by the number in the first line for your class of shares under the heading entitled “Expenses Paid During Period” to estimate the expenses you paid on your account during this period.
| | | | | | | | | | | | |
| | | BEGINNING | | | ENDING | | | EXPENSES PAID | |
| | | ACCOUNT VALUE | | | ACCOUNT VALUE | | | DURING PERIOD† | |
| | | 10/1/13 | | | 3/31/14 | | | 10/1/13–3/31/14 | |
Class A Shares | | | | | | | | | | | | |
Actual | | $ | 1,000.00 | | | $ | 1,027.40 | | | $ | 6.51 | |
Hypothetical* | | $ | 1,000.00 | | | $ | 1,018.51 | | | $ | 6.49 | |
Class C Shares | | | | | | | | | | | | |
Actual | | $ | 1,000.00 | | | $ | 1,023.10 | | | $ | 10.35 | |
Hypothetical* | | $ | 1,000.00 | | | $ | 1,014.70 | | | $ | 10.31 | |
Class I Shares | | | | | | | | | | | | |
Actual | | $ | 1,000.00 | | | $ | 1,028.80 | | | $ | 4.72 | |
Hypothetical* | | $ | 1,000.00 | | | $ | 1,020.28 | | | $ | 4.70 | |
Class R3 Shares | | | | | | | | | | | | |
Actual | | $ | 1,000.00 | | | $ | 1,026.00 | | | $ | 7.58 | |
Hypothetical* | | $ | 1,000.00 | | | $ | 1,017.45 | | | $ | 7.54 | |
Class R4 Shares | | | | | | | | | | | | |
Actual | | $ | 1,000.00 | | | $ | 1,026.60 | | | $ | 6.98 | |
Hypothetical* | | $ | 1,000.00 | | | $ | 1,018.04 | | | $ | 6.95 | |
Class R5 Shares | | | | | | | | | | | | |
Actual | | $ | 1,000.00 | | | $ | 1,028.80 | | | $ | 4.99 | |
Hypothetical* | | $ | 1,000.00 | | | $ | 1,020.01 | | | $ | 4.97 | |
Class R6 Shares | | | | | | | | | | | | |
Actual | | $ | 1,000.00 | | | $ | 1,029.20 | | | $ | 4.50 | |
Hypothetical* | | $ | 1,000.00 | | | $ | 1,020.49 | | | $ | 4.48 | |
| † | Expenses are equal to the annualized expense ratio for each class (A: 1.29%; C: 2.05%; I: 0.93%; R3: 1.50%; R4: 1.38%; R5: 0.99%; R6: 0.89%) multiplied by the average account value over the period, multiplied by 182/365 to reflect the one-half year period. |
| * | Hypothetical assumes a rate of return of 5% per year before expenses. |
Hypothetical Example for Comparison Purposes
For each class of shares, the second line of the accompanying table provides information about hypothetical account values and hypothetical expenses based on the Fund’s actual expense ratio and an assumed rate of return of 5% per year before expenses, which is not the Fund’s actual return. The hypothetical account values and expenses may not be used to estimate the actual ending account balance or expenses you paid for the period. You may use this information to compare the ongoing costs of investing in the Fund and other funds. To do so, compare this 5% hypothetical example with the 5% hypothetical examples that appear in the shareholder reports of the other funds.
Please note that the expenses shown in the table are meant to highlight your ongoing costs only and do not reflect any transactional costs, such as sales charges (loads), redemption fees, or exchange fees. Therefore, the second line of the table for each class of shares is useful in comparing ongoing costs only, and will not help you determine the relative total costs of owning different funds. In addition, if these transactional costs were included, your costs would have been higher.
30 Certified Semi-Annual Report
| | |
| Index Comparison | | |
| |
Thornburg International Growth Fund | | March 31, 2014 (Unaudited) |
Growth of a Hypothetical $10,000 Investment
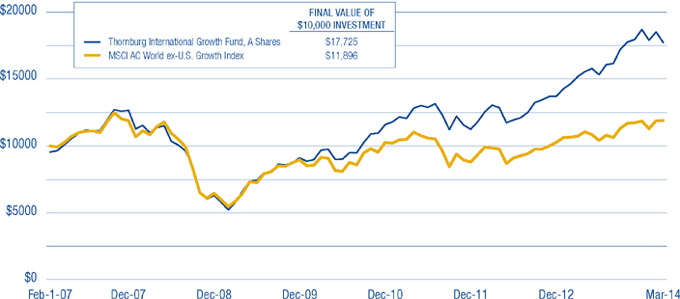
Average Annual Total Returns
For Periods Ended March 31, 2014 (with sales charge)
| | | | | | | | | | | | | | | | |
| | | 1 YR | | | 3 YRS | | | 5 YRS | | | SINCE
INCEPTION | |
Class A Shares (Incep: 2/1/07) | | | 11.48 | % | | | 11.96 | % | | | 23.94 | % | | | 8.33 | % |
Class C Shares (Incep: 2/1/07) | | | 14.79 | % | | | 12.81 | % | | | 24.26 | % | | | 8.28 | % |
Class I Shares (Incep: 2/1/07) | | | 17.07 | % | | | 14.19 | % | | | 25.74 | % | | | 9.62 | % |
Class R3 Shares (Incep: 2/1/08) | | | 16.50 | % | | | 13.61 | % | | | 25.07 | % | | | 7.43 | % |
Class R4 Shares (Incep: 2/1/08) | | | 16.63 | % | | | 13.80 | % | | | 25.24 | % | | | 7.54 | % |
Class R5 Shares (Incep: 2/1/08) | | | 17.09 | % | | | 14.20 | % | | | 25.72 | % | | | 7.97 | % |
Class R6 Shares (Incep: 2/1/13) | | | 17.17 | % | | | — | | | | — | | | | 19.99 | % |
Performance data shown represents past performance and is no guarantee of future results. Investment return and principal value will fluctuate so shares, when redeemed, may be worth more or less than their original cost. Current performance may be lower or higher than quoted. For performance current to the most recent month end, visit thornburg.com or call 800.847.0200. The performance data and graph do not reflect the deduction of taxes that a shareholder would pay on distributions or the redemption of Fund shares. Returns reflect the reinvestment of dividends and capital gains as well as applicable sales charges. Class A shares are sold with a maximum sales charge of 4.50%. Class C shares are subject to a 1% CDSC for the first year only. There is no up-front sales charge for Class I, R3, R4, R5, and R6 shares.
Certified Semi-Annual Report 31
| | |
| Other Information | | |
| |
Thornburg International Growth Fund | | March 31, 2014 (Unaudited) |
Portfolio Proxy Voting
Policies and Procedures:
The Trust has delegated to Thornburg Investment Management, Inc. (the “Advisor”) voting decisions respecting proxies for the Fund’s voting securities. The Advisor makes voting decisions in accordance with its Proxy Voting Policy and Procedures. A description of the Policy and Procedures is available (i) without charge, upon request, by calling the Advisor toll-free at 1-800-847-0200, (ii) on the Thornburg website at www.thornburg.com, and (iii) on the Securities and Exchange Commission’s website at www.sec.gov.
Information regarding how proxies were voted is available on or before August 31 of each year for the twelve months ending the preceding June 30. This information is available (i) without charge, upon request by calling the Advisor toll-free at 1-800-847-0200, (ii) on the Thornburg website at www.thornburg.com, and (iii) on the Securities and Exchange Commission’s website at www.sec.gov.
Availability of Quarterly Portfolio Schedule
The Fund files with the Securities and Exchange Commission schedules of its portfolio holdings on Form N-Q for the first and third quarters of each fiscal year. The Fund’s Forms N-Q are available on the Commission’s website at www.sec.gov, or may be reviewed and copied at the Commission’s Public Reference Room in Washington, D.C. Information on the operation of the Public Reference Room may be obtained by calling 1-800-SEC-0330. The Fund also makes this information available on its website at www.thornburg. com/download or upon request by calling 1-800-847-0200.
32 Certified Semi-Annual Report
| | |
| Trustees’ Statement to Shareholders | | |
| |
Not part of the Certified Semi-Annual Report | | |
Reissued September 15, 2013
The Trustees believe current and prospective shareholders should know how we discharge our responsibilities in supervising the Funds’ investment advisor and in reviewing the advisor’s contract for renewal. Since 2005, we have issued a statement which sets out clearly the three principal guidelines that we follow in supervising the Trust’s investment advisor on your behalf. In accordance with our customary practice, in September of this year we again reviewed our statement and concluded we should reissue this statement outlining the principal features of our supervision of the advisor’s performance of investment management services for the Funds.
We begin with the premise that each shareholder selected his or her Fund because its investments are managed by the investment advisor identified in the prospectus and in accordance with the objective and policies described in the prospectus. We realize, as each of you do, that if you believe that your Fund’s stated objective and policies no longer serve your personal investment goals, you can sell your shares and leave the Fund.
Therefore, we believe that our primary supervisory task – our principal obligation to you – is to assess the nature and quality of the advisor’s services, and to confirm that the advisor actively and competently pursues the Fund’s objective, in accordance with the policies set out in the prospectus. To do this, we meet regularly with management to review your Fund’s portfolio and to discuss the advisor’s specific actions and judgments in pursuing the Fund’s objective. We do not substitute our own judgment for the advisor’s decisions in selecting investments; the advisor is paid to exercise its informed judgment on investment decisions, and we seek to confirm, in reviewing the advisor’s performance, that the advisor is doing just that.
Second, while we are conscious of costs and the effect that costs have on shareholders’ returns, we do not seek the lowest fees or expense ratio as our sole or primary objective. We try to make sure that your Fund’s fees and costs are reasonable in relationship to the services rendered and that they are generally in line with those charged by other expert investment advisors, consistent with our belief that the Fund’s investors searched for and expect that expertise and attention and have decided to pay a reasonable price for it. We do not put the management contract “out to bid” as a matter of course, and we would not do so unless we had concluded that the advisor materially had failed to pursue the Fund’s objectives in accordance with its policies, or for other equally important reasons. We believe that any other approach would be inconsistent with your interests and contrary to your expectations when you bought shares of the Fund in the first place.
Finally, because we believe that most Thornburg Fund shareholders have invested with a long-term perspective, we try not to focus too much on the fashions of the moment and on short-term performance. The market will not favor any specific investment objective or set of policies at all times and under all economic circumstances. A fund will experience periods of both high and low returns relative to other funds and other investments. Even if one of our Funds is not favored by the market at a particular time, we believe that the advisor is nonetheless obliged to remain true to the Fund’s objective and policies, and we watch to see that it does so.
This page is not part of the Semi-Annual Report 33
This page intentionally left blank.
34 This page is not part of the Semi-Annual Report
Retirement and Education Accounts
Thornburg Investment Management offers retirement and education savings accounts that can help you meet a variety of planning challenges. For account applications or further information on any of the accounts below, please call 1-800-847-0200 or go to www.thornburg.com/ira. Your financial advisor can help you determine which plan is right for you.
Individual Retirement Accounts
Individual Retirement Accounts (IRAs) provide a tax-advantaged means to save money for the future. For a detailed outline of the difference between retirement accounts, see www.thornburg.com/ira. Rollovers are available. Call 1-800-847-0200 for more information.
Traditional IRAs – Contributions to Traditional IRAs are tax deductible for eligible individuals, and withdrawals are taxed as additional ordinary income. You may contribute to an IRA if you receive compensation and are under 70 1⁄2, even if you are covered by an employer retirement plan. Deductible contributions are subject to certain qualifications. Please consult your tax advisor.
Roth IRAs – Under a Roth IRA, there is no tax deduction for contributions, but there is no income tax on qualified withdrawals. For a more detailed comparison of Traditional and Roth IRAs, please see our website at www.thornburg. com/ira.
SEP IRAs – Simplified Employee Pension (SEP) IRAs are established by employers. The employer is allowed a tax deduction for contributions made to the SEP Plan and makes contributions to each eligible employee’s SEP IRA on a discretionary basis.
SIMPLE IRAs – Savings Incentive Match Plan for Employees of Small Employers (SIMPLE) is designed to give small business owners a simplified method to establish and contribute to a retirement plan for employees. The employer is allowed a tax deduction for contributions and makes either matching or non-elective contributions to each eligible employee’s SIMPLE IRA. Employees may make salary deferral contributions.
Coverdell Education Savings Account
These savings accounts are designed to provide a way to save money for higher education expenses. In an Education Savings Account, earnings and interest grow tax-free, and qualified withdrawals used to pay for eligible higher-education expenses are tax- and penalty-free.
Funds Available
The following funds are available in the accounts listed above:
| | • | | Thornburg Core Growth Fund |
| | • | | Thornburg International Value Fund |
| | • | | Thornburg International Growth Fund |
| | • | | Thornburg Developing World Fund |
| | • | | Thornburg Investment Income Builder Fund |
| | • | | Thornburg Global Opportunities Fund |
| | • | | Thornburg Low Duration Income Fund |
| | • | | Thornburg Limited Term U.S. Government Fund |
| | • | | Thornburg Limited Term Income Fund |
| | • | | Thornburg Strategic Income Fund |
This page is not part of the Semi-Annual Report 35
Firm & Philosophy

The Firm
Founded in 1982 and headquartered in Santa Fe, New Mexico, Thornburg Investment Management advises a range of active investment strategies, each offered through multiple vehicles, to serve a broad spectrum of client needs worldwide. From short-term fixed income to flexible global equity, our objective is to help clients reach their long-term financial goals via active portfolio management. As of March 31, 2014, Thornburg managed approximately $90 billion in assets.
Investment Philosophy
We seek to preserve and increase the real wealth of shareholders after accounting for inflation, taxes, and investment expenses. We’re committed to disciplined investing and managing risk in all market environments.
Portfolio Holdings Commentary
At Thornburg, we believe you should know what you own. Our website keeps investors informed of the Funds’ equity holdings. Go to www.thornburg.com/funds for equity funds holdings and commentary.
Co-Ownership of Funds
We invest side-by-side with shareholders. Our employees have invested $387 million in Thornburg products as of March 31, 2014.
36 This page is not part of the Semi-Annual Report
| | |
| Thornburg Fund Family | | |
| |
| Thornburg Equity Funds | | |
Thornburg’s equity research uses a fundamentally driven, bottom-up, comprehensive analytical approach. Thornburg equity funds generally focus on a limited number of securities so that each holding can impact performance. The team searches for firms believed to have a promising future and seeks to buy shares of those companies at a discount to their intrinsic or long-term value.
| | • | | Thornburg Core Growth Fund |
| | • | | Thornburg International Value Fund |
| | • | | Thornburg International Growth Fund |
| | • | | Thornburg Developing World Fund |
| | • | | Thornburg Investment Income Builder Fund |
| | • | | Thornburg Global Opportunities Fund |
Thornburg Bond Funds
Thornburg Investment Management applies a disciplined philosophy to fixed-income management. Since the launch of our first fixed-income fund over 25 years ago, we have been conducting fundamental, bottom-up research in an effort to identify bonds which we believe provide the best return for a given level of risk. We avoid leverage or complex strategies which could backfire in periods of market uncertainty.
| | • | | Thornburg Low Duration Income Fund |
| | • | | Thornburg Limited Term U.S. Government Fund |
| | • | | Thornburg Limited Term Income Fund |
| | • | | Thornburg Strategic Income Fund |
| | • | | Thornburg Low Duration Municipal Fund |
| | • | | Thornburg Limited Term Municipal Fund |
| | • | | Thornburg Intermediate Municipal Fund |
| | • | | Thornburg California Limited Term Municipal Fund |
| | • | | Thornburg New Mexico Intermediate Municipal Fund |
| | • | | Thornburg New York Intermediate Municipal Fund |
| | • | | Thornburg Strategic Municipal Income Fund |
Before investing, carefully consider the Fund’s investment goals, risks, charges, and expenses. For a prospectus or summary prospectus containing this and other information, contact your financial advisor or visit thornburg.com. Read it carefully before investing.
For additional information, please visit thornburg.com
Thornburg Investment Management, Inc. 2300 North Ridgetop Road, Santa Fe, NM 87506
This page is not part of the Semi-Annual Report 37
This page intentionally left blank.
38 This page is not part of the Semi-Annual Report
This page intentionally left blank.
This page is not part of the Semi-Annual Report 39
| | |

| | Waste not, Wait not |

This Semi-Annual Report is submitted for the general information of shareholders of the Fund. It is not authorized for distribution to prospective investors in the Fund unless preceded or accompanied by an effective prospectus.
| | | | |
Investment Advisor: Thornburg Investment Management® 800.847.0200 | | Distributor: Thornburg Securities Corporation® 800.847.0200 | | TH1409 |

2 This page is not part of the Semi-Annual Report
Important Information
The information presented on the following pages was current as of March 31, 2014. The managers’ views, portfolio holdings, and sector and country diversification are provided for the general information of the Fund’s shareholders; to the extent this information is historical, it should not be considered predictive of future circumstances. This material should not be deemed a recommendation to buy or sell any of the securities mentioned.
Investments in the Fund carry risks including possible loss of principal. Special risks may be associated with investments outside the United States, especially in emerging markets, including currency fluctuations, illiquidity, volatility, and political and economic risks. Additionally, the Fund may invest a portion of the assets in small capitalization companies, which may increase the risk of greater price fluctuations. As with direct bond ownership, funds that invest in bonds are subject to certain risks including interest-rate risk, credit risk, and inflation risk. The principal value of bonds will fluctuate relative to changes in interest rates, decreasing when interest rates rise. Please see the Fund’s Prospectus for a discussion of the risks associated with an investment in the Fund. Investments in the Fund are not deposits or obligations of, or guaranteed or endorsed by, any bank, the Federal Deposit Insurance Corporation, the Federal Reserve Board or any government agency. There is no guarantee that the Fund will meet its investment objectives.
Performance data given at net asset value (NAV) does not take into account the applicable sales charges. If the sales charges had been included, the performance would have been lower.
Class I, R3, R4, and R5 shares may not be available to all investors. Minimum investments for Class I shares may be higher than those for other classes.
| | | | |
SHARE CLASS | | NASDAQ SYMBOL | | CUSIP |
Class A | | TIBAX | | 885-215-558 |
Class C | | TIBCX | | 885-215-541 |
Class I | | TIBIX | | 885-215-467 |
Class R3 | | TIBRX | | 885-215-384 |
Class R4 | | TIBGX | | 885-215-186 |
Class R5 | | TIBMX | | 885-215-236 |
Glossary
Barclays U.S. Aggregate Bond Index – An index composed of approximately 8,000 publicly traded bonds including U.S. government, mortgage-backed, corporate and Yankee bonds. The index is weighted by the market value of the bonds included in the index.
Blended Index – The Blended Index is composed of 25% Barclays U.S. Aggregate Bond Index and 75% MSCI World Index. The Barclays U.S. Aggregate Bond Index is composed of approximately 8,000 publicly traded bonds including U.S. government, mortgage-backed, corporate and Yankee bonds. The index is weighted by the market value of the bonds included in the index. The MSCI World Index is an unmanaged market-weighted index that consists of securities traded in 24 of the world’s most developed countries. Securities are listed on exchanges in the U.S., Europe, Canada, Australia, New Zealand, and the Far East. The index is calculated with net dividends reinvested, in U.S. dollars.
FlNRA-Bloomberg Active Investment Grade U.S. Corporate Bond Index – This index is comprised of the “active” (most frequently traded) fixed-coupon, investment-grade bonds represented by FINRA TRACE, FINRA’s transaction reporting facility that disseminates all over-the-counter secondary market transactions in these public bonds.
MSCI All Country (AC) World Index – A market capitalization weighted index that is representative of the market structure of 45 developed and emerging market countries in North and South America, Europe, Africa, and the Pacific Rim. The index is calculated with net dividends reinvested in U.S. dollars.
MSCI Country Indices – Free float-adjusted market capitalization indices that are designed to measure equity market performance in that specific country in U.S. dollars.
MSCI EM (Emerging Markets) Latin America Index – A free float-adjusted market capitalization weighted index that is designed to measure the equity market performance of emerging markets in Latin America. The index consists of the following 5 emerging market country indices: Brazil, Chile, Colombia, Mexico, and Peru.
MSCI Europe ex-U.K. – A free float-adjusted market capitalization weighted index that is designed to measure the equity market performance of the developed markets in Europe. The MSCI Europe Index consists of the following 15 developed market country indices: Austria, Belgium, Denmark, Finland, France, Germany, Greece, Ireland, Italy, the Netherlands, Norway, Portugal, Spain, Sweden, and Switzerland.
MSCI Nordic Countries – A free float-adjusted market capitalization weighted index that is designed to measure the equity market performance of the Nordic region. The index consists of the following four developed market country indices: Denmark, Finland, Norway, and Sweden.
Russell 1000 Index – An index that measures the performance of the large-cap segment of the U.S. equity universe. It is a subset of the Russell 3000 Index and includes approximately 1,000 of the largest securities based on a combination of their market cap and current index membership.
Russell 2000 Index – An index that measures the performance of the small-cap segment of the U.S. equity universe. The Russell 2000 Index is a subset of the Russell 3000 Index including approximately 2,000 of the smallest securities based on a combination of their market cap and current index membership.
S&P 500 Stock Index – An unmanaged index generally representative of the U.S. stock market.
Unless otherwise noted, index returns reflect the reinvestment of income dividends and capital gains, if any, but do not reflect fees, brokerage commissions or other expenses of investing. Investors may not make direct investments into any index. The performance of any index is not indicative of the performance of any particular investment.
Basis Point (bp) – A unit equal to 1/100th of 1%. 1% = 100 basis points (bps).
Bond Credit Ratings – A bond credit rating assesses the financial ability of a debt issuer to make timely payments of principal and interest. Ratings of AAA (the highest), AA, A, and BBB are investment-grade quality. Ratings of BB, B, CCC, CC, C, and D (the lowest) are considered below investment grade, speculative grade, or junk bonds. Unless otherwise noted, the ratings listed are from Bloomberg Market Data and are a combination of ratings from Standard and Poor’s, Moody’s Investors Service, and Fitch Ratings.
Coupon – The interest rate stated on a bond when it’s issued. The coupon is typically paid semi-annually.
Dividend Payout Ratio – The percentage of earnings paid to shareholders in dividends calculated as yearly dividend per share over earnings per share.
Effective Duration – A bond’s sensitivity to interest rates, incorporating the embedded option features, such as call provisions. Bonds with longer durations experience greater price volatility than bonds with shorter durations.
Intrinsic Value – A term that reflects Thornburg’s estimate of a company’s value, encompassing our collective investment judgment.
Median Market Capitalization – Market capitalization (market cap) is the total value of a company’s stock, calculated by multiplying the number of outstanding common shares by the current share price. The company whose market cap is in the middle of the portfolio is the median market cap. Half the companies in the portfolio have values greater than the median, and half have values that are less.
Price to Earnings Ratio (P/E) – A valuation ratio equaling a company’s market value per share divided by earnings per share.
U.S. Treasury Securities – U.S. Treasury securities, such as bills, notes and bonds, are negotiable debt obligations of the U.S. government. These debt obligations are backed by the “full faith and credit” of the government and issued at various schedules and maturities. Income from Treasury securities is exempt from state and local, but not federal income taxes.
This page is not part of the Semi-Annual Report 3
The Dividend Landscape
To appreciate the investment environment in which Thornburg Investment Income Builder Fund operates, you may wish to review these highlights of the “dividend landscape.”
The S&P 500 Index Payout Ratio – A Historical Perspective
The dividend payout ratio is a fraction that expresses dividend payments as a percentage of per-share earnings. As the economy slowed in the recent downturn, earnings-per-share on average declined, causing the payout ratio to climb, even as dividends paid by the S&P 500 portfolio declined by more than 10% in 2010. Earnings have since materially improved, bringing the payout ratio back in line with the overall recent trend.
S&P 500 Index Payout Ratio
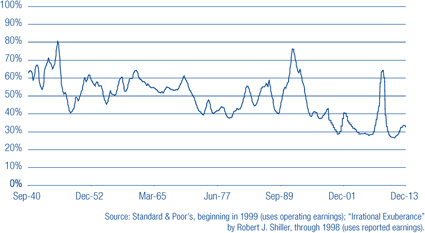
Corporate Willingness to Pay Dividends is Key to the Fund’s Investment Process
The Russell 1000 Index includes approximately 1,000 public companies that are supposed to be generally representative of corporate America. Between 1980 and 1993, at least 75% of these firms paid some dividend. Between 1994 and 2001, the percentage of Russell 1000 companies paying dividends sank to just over 50%, indicating a preference towards reinvesting retained earnings in growth initiatives. Dividends returned to fashion between 2002 and 2008. A reduction in the number of Russell 1000 firms paying dividends followed the 2008 recession. However, an upward trend appears to be emerging since 2008.
Percentage of Companies Paying Dividends in Russell 1000 Index
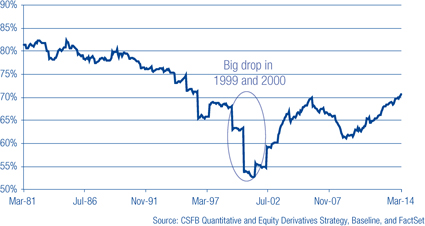
Rising Dividend Payments Despite Decreasing Dividend Yields
Over time, the dollar dividend per unit of the S&P 500 Index has generally increased. Because the price of the index itself has increased even more, the yield on the S&P 500 Index, as a percentage of the current index price, has generally decreased in recent decades. You should note, however, that the yield on an original investment made at a fixed point in time (say, 1970 or 1989) has increased, even without reinvestment of dividends.
Hypothetical chart is for illustration purposes only and is not indicative of an investment in any particular security. Investors may not invest directly in an index.
S&P 500 Index Average Yield vs. Annual Dividends from a Hypothetical $10,000 Investment (Dividends not Reinvested)
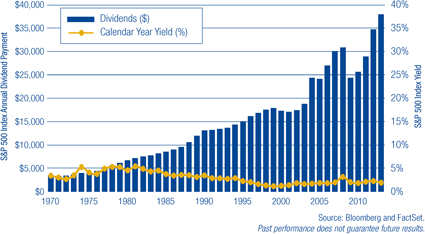
4 This page is not part of the Semi-Annual Report
The Top 100 Dividend Yields
| | | | | | | | |
| | | RUSSELL 1000 INDEX | | | RUSSELL 2000 INDEX | |
Financials | | | 50 | % | | | 85 | % |
Utilities | | | 20 | % | | | 1 | % |
Energy | | | 9 | % | | | 1 | % |
Consumer Discretionary | | | 7 | % | | | 3 | % |
Telecommunication Services | | | 5 | % | | | 2 | % |
Consumer Staples | | | 4 | % | | | 2 | % |
Industrials | | | 3 | % | | | 4 | % |
Information Technology | | | 1 | % | | | 1 | % |
Materials | | | 1 | % | | | 0 | % |
Health Care | | | 0 | % | | | 1 | % |
Source: FactSet as of March 31, 2014.
Past performance does not guarantee future results.
Average Dividend Yields (MSCI Indices) of Markets Around the Globe
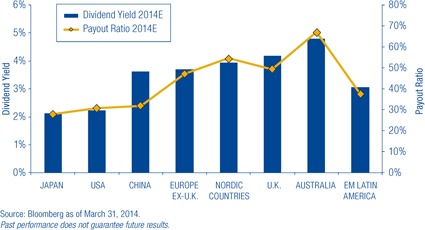
Source: Bloomberg as of March 31, 2014.
Past performance does not guarantee future results.
A Truly Diversified Dividend-Paying Portfolio Must Look Beyond the Obvious High-Yield Stocks!
In the (large cap) Russell 1000 Index, 70% of the top 100 dividend payers are in the financials and utilities sectors. In the (small cap) Russell 2000 Index, 85% of the top 100 dividend-yielding stocks are financial companies. In order to construct a diversified portfolio of attractive yielding stocks, one must look beyond these two sectors. We do!
Dividend yield is a ratio that shows how much a company pays out in dividends each year relative to its share price.
Global Diversification Can Improve the Portfolio Yield
Since firms outside the U.S. tend to pay higher dividends than U.S. firms, particularly outside the real estate and utility sectors, we maintain the ability to diversify the Thornburg Investment Income Builder Fund into foreign dividend-paying stocks to try to take advantage of these opportunities.
Diversification does not assure or guarantee better performance and cannot eliminate the risk of investment losses.
Dividends are not guaranteed.
This page is not part of the Semi-Annual Report 5

Portfolio Managers

Jason Brady, CFA Brian McMahon Ben Kirby, CFA
Objectives and Strategies
The Fund seeks to provide a level of current income which exceeds the average yield on U.S. stocks generally, and which will generally grow, subject to periodic fluctuations, over the years on a per share basis. The Fund’s secondary investment objective is long-term capital appreciation.
The Fund may invest in any domestic or foreign equity or debt security which Thornburg Investment Management believes may assist the Fund in pursuing its investment goals, although the Fund expects that equity securities in its portfolio will normally be weighted in favor of companies that pay dividends or other current income.
A Global Search for Growing Income & Price Appreciation
The primary investment objective of Thornburg Investment Income Builder Fund is to provide a level of current income which exceeds the average yield on U.S. stocks, and which will generally grow, subject to periodic fluctuations, over the years on a per share basis. The Fund’s secondary objective is long-term capital appreciation. These objectives remain constant over time. However, the specific investments we have used to try to reach our objectives have changed over time. There is no guarantee the Fund will meet its investment objectives.
Business conditions for various industries and operating effectiveness at individual firms change over time. Investor preferences, expressed as both absolute and relative prices, also change over time. In the view of your portfolio management team, “some doors close and others open.” As shown in the top ten industry tables on the opposite page, the percentage industry allocations of your Fund evolve to reflect these changing conditions.
Key Portfolio Attributes
As of March 31, 2014
| | | | |
Equity Statistics | | | | |
Portfolio P/E (12-mo. trailing) | | | 14.0x | |
Median Market Cap | | $ | 15.8 B | |
Equity & Pref. Equity Holdings | | | 125 | |
| |
Fixed Income Statistics | | | | |
Weighted Avg. Coupon | | | 7.98 | % |
Average Maturity | | | 10.97 yrs | |
Effective Duration | | | 3.56 yrs | |
Bond Holdings | | | 129 | |
Portfolio Composition
As of March 31, 2014
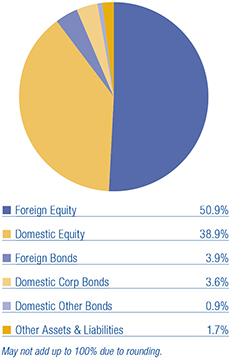
6 This page is not part of the Semi-Annual Report
Quarterly Dividend History, Class A
| | | | | | | | | | | | | | | | | | | | |
| YEAR | | Q1 | | | Q2 | | | Q3 | | | Q4 | | | TOTAL | |
2003 | | | 9.2 | ¢ | | | 11.2 | ¢ | | | 12.4 | ¢ | | | 17.5 | ¢ | | | 50.3 | ¢ |
2004 | | | 10.2 | ¢ | | | 12.5 | ¢ | | | 15.0 | ¢ | | | 21.8 | ¢ | | | 59.5 | ¢ |
2005 | | | 11.0 | ¢ | | | 13.6 | ¢ | | | 17.4 | ¢ | | | 29.0 | ¢ | | | 71.0 | ¢ |
2006 | | | 12.5 | ¢ | | | 16.0 | ¢ | | | 19.2 | ¢ | | | 33.0 | ¢ | | | 80.7 | ¢ |
2007 | | | 14.2 | ¢ | | | 18.5 | ¢ | | | 21.5 | ¢ | | | 36.8 | ¢ | | | 91.0 | ¢ |
2008 | | | 17.9 | ¢ | | | 21.8 | ¢ | | | 26.0 | ¢ | | | 36.8 | ¢ | | | 102.4 | ¢ |
2009 | | | 18.0 | ¢ | | | 24.2 | ¢ | | | 28.0 | ¢ | | | 34.5 | ¢ | | | 104.7 | ¢ |
2010 | | | 19.8 | ¢ | | | 25.0 | ¢ | | | 32.0 | ¢ | | | 36.0 | ¢ | | | 112.8 | ¢ |
2011 | | | 21.0 | ¢ | | | 26.0 | ¢ | | | 32.0 | ¢ | | | 37.5 | ¢ | | | 116.5 | ¢ |
2012 | | | 21.5 | ¢ | | | 26.0 | ¢ | | | 28.5 | ¢ | | | 36.0 | ¢ | | | 112.0 | ¢ |
2013 | | | 21.5 | ¢ | | | 25.3 | ¢ | | | 25.0 | ¢ | | | 24.5 | ¢ | | | 96.3 | ¢ |
2014 | | | 22.5 | ¢ | | | | | | | | | | | | | | | | |
30-day SEC Yield as of 3/31/14 (A Shares): 3.46%
We do not expect each sequential quarter’s dividend to increase over that of the prior quarter, since dividend payments outside the United States tend to be seasonal. Rather, the Fund aspires to increase the dividend paid on an annual basis.
Average Annual Total Returns
For Periods Ended March 31, 2014
| | | | | | | | | | | | | | | | | | | | |
| A Shares (Incep: 12/24/02) | | 1 YR | | | 3 YRS | | | 5 YRS | | | 10 YRS | | | SINCE
INCEPTION | |
Without sales charge | | | 11.32 | % | | | 8.85 | % | | | 17.83 | % | | | 9.40 | % | | | 11.34 | % |
With sales charge | | | 6.29 | % | | | 7.20 | % | | | 16.75 | % | | | 8.90 | % | | | 10.89 | % |
Blended Index (Since 12/24/02) | | | 14.08 | % | | | 8.79 | % | | | 15.05 | % | | | 6.51 | % | | | 8.12 | % |
S&P 500 Index (Since 12/24/02) | | | 21.86 | % | | | 14.66 | % | | | 21.16 | % | | | 7.42 | % | | | 9.00 | % |
Performance data shown represents past performance and is no guarantee of future results. Investment return and principal value will fluctuate so shares, when redeemed, may be worth more or less than their original cost. Current performance may be lower or higher than quoted. For performance current to the most recent month end, visit thornburg.com or call 800.847.0200.
The maximum sales charge for Class A shares is 4.50%. The total annual fund operating expense of Class A shares is 1.39%, as disclosed in the most recent Prospectus.
Top Ten Industries
As of 3/31/14
| | | | |
Telecommunication Services | | | 18.4 | % |
Energy | | | 11.4 | % |
Utilities | | | 10.5 | % |
Diversified Financials | | | 9.0 | % |
Real Estate | | | 6.8 | % |
Pharmaceuticals, Biotechnology & Life Sciences | | | 6.4 | % |
Food, Beverage & Tobacco | | | 4.6 | % |
Banks | | | 3.8 | % |
Consumer Services | | | 3.6 | % |
Materials | | | 3.6 | % |
As of 12/31/13
| | | | |
Telecommunication Services | | | 18.7 | % |
Energy | | | 10.4 | % |
Diversified Financials | | | 9.5 | % |
Utilities | | | 8.8 | % |
Real Estate | | | 7.2 | % |
Pharmaceuticals, Biotechnology & Life Sciences | | | 6.9 | % |
Food, Beverage & Tobacco | | | 5.7 | % |
Banks | | | 3.8 | % |
Materials | | | 3.8 | % |
Consumer Services | | | 3.7 | % |
As of 9/30/13
| | | | |
Telecommunication Services | | | 18.5 | % |
Energy | | | 11.4 | % |
Utilities | | | 10.5 | % |
Diversified Financials | | | 9.0 | % |
Real Estate | | | 6.8 | % |
Pharmaceuticals, Biotechnology & Life Sciences | | | 6.4 | % |
Food, Beverage & Tobacco | | | 4.6 | % |
Banks | | | 3.8 | % |
Consumer Services | | | 3.6 | % |
Materials | | | 3.6 | % |
As of 6/30/13
| | | | |
Telecommunication Services | | | 18.6 | % |
Energy | | | 9.8 | % |
Diversified Financials | | | 9.6 | % |
Utilities | | | 9.3 | % |
Pharmaceuticals, Biotechnology & Life Sciences | | | 9.1 | % |
Real Estate | | | 8.5 | % |
Food, Beverage & Tobacco | | | 4.4 | % |
Banks | | | 4.4 | % |
Materials | | | 3.8 | % |
Consumer Services | | | 3.3 | % |
This page is not part of the Semi-Annual Report 7
2014 Certified Semi-Annual Report
Thornburg Investment Income Builder Fund
March 31, 2014
This report is certified under the Sarbanes-Oxley Act of 2002, which requires that public companies, including mutual funds, affirm that the information provided in their annual and semi-annual shareholder reports fully and fairly represents their financial position and the results of their operations for the period presented.
8 Certified Semi-Annual Report
Letter to Shareholders
April 22, 2014
Dear Fellow Shareholder,
| | |
This letter will review the basic results of Thornburg Investment Income Builder Fund’s investment activities for the six-month fiscal period ended March 31, 2014 and comment on the overall investment landscape, which continues to evolve in important ways. Thornburg Investment Income Builder Fund paid ordinary quarterly dividends of 47¢ per Class A share in the six-month period ending March 31, 2014, down from 57.5¢ in the comparable six-month period of the prior fiscal year. The dividend per share was higher for Class I and R5 shares and lower for C, R3 and R4 shares, to account for varying class-specific expenses. The year-over-year decline in the income dividend was largely attributable to a decline in the fourth-quarter 2013 dividend to 24.5¢ per share from 36¢ per share in fourth-quarter 2012. In case you missed the explanation of the dividend decline from the shareholder letter of the Fund’s September 2013 Annual Report, or have forgotten the details and care to review them, we refer you to the quarterly commentary for Thornburg Investment Income Builder Fund for the March 2014 quarter on our website, www.thornburg.com/commentary. Your Fund’s net asset value (NAV) per Class A share increased $1.18 per share during the six-month period under review, to $21.31, bringing the six-month total return to 8.28%. | | Performance data shown represents past performance and is no guarantee of future results. Investment return and principal value will fluctuate so shares, when redeemed, may be worth more or less than their original cost. Current performance may be lower or higher than quoted. For performance current to the most recent month end, visit thornburg. com or call 800.847.0200. The maximum sales charge for Class A shares is 4.50%. The total annual fund operating expense of Class A shares is 1.39%, as disclosed in the most recent prospectus. |
The Fund’s Class A share return of 8.28%, at NAV for the six-month period, outperformed its own Blended Index (75% MSCI World Index and 25% Barclays U.S. Aggregate Bond Index) benchmark by 0.82% and underperformed the S&P 500 Index by 4.23% for the period. Performance comparisons of Investment Income Builder to each of these benchmarks over various periods are shown on page 7 of this report. Reviewing these, you will see that the performance of the Fund compares very well to both benchmarks over various longer periods. We would like to outperform benchmark returns in all market conditions, but it is not unusual for Investment Income Builder to lag the benchmarks over shorter measurement periods, especially when annualized benchmark returns are significantly above 10%.
The quarter ending March 31, 2014 was the 45th full calendar quarter since the inception of Thornburg Investment Income Builder Fund in December 2002. In 34 of these quarters, the Fund delivered a positive total return. The Fund has delivered positive total returns in 10 of its 11 calendar years of existence. As of March 31, 2014, Thornburg Investment Income Builder Fund has delivered tax-efficient average annual total returns in excess of 11% since its inception (Class A shares at NAV).
We do not expect to pay any capital gain dividends for 2014. At March 31, 2014 the Fund had realized capital losses of approximately $1 billion, which may be carried forward to offset future capital gains to the extent permitted by regulations.
In assessing the performance of Thornburg Investment Income Builder Fund during the semi-annual period under review, it is constructive to consider the performance in U.S. dollars of the sector components of the MSCI World Index over the six months ended March 31, 2014. The MSCI World Index comprises 75%, and the entire equity portion, of your Fund’s global performance benchmark:
| | 1. | All 10 index sectors showed positive total returns for the period, ranging from approximately 6% (consumer discretionary) to more than 15% (health care). |
| | 2. | Income Builder Fund investments in firms in the financials (20% Fund weighting), telecommunications (17%), energy (10%), utilities (10%), and consumer staples (8%) sectors comprised the largest sector weightings in the Fund portfolio. The Fund’s performance relative to the MSCI World Index was helped by comparative outperformance from our holdings in the financial services, industrials, and consumer staples sectors, and was hindered by comparative underperformance from our holdings in the telecommunications sector. |
| | 3. | In the Income Builder portfolio, 60 equity investments contributed positive returns of at least 0.05% to the portfolio during the six-month period under review. Six of the Fund’s equity investments contributed returns of negative 0.05% or worse. |
The Fund’s bond holdings delivered modest positive returns during the period, but were a drag on overall portfolio returns relative to the Barclays U.S. Aggregate Bond Index (25% of the Fund’s Blended Index benchmark) for the period.
Your Fund’s average return from its investments in the financial sector exceeded the performance of the equities in the finance sector of the MSCI World Index in the semi-annual period, led by JPMorgan Chase and Fifth Third Bancorp. Asset managers Och-Ziff Capital, Blackstone Group, and KKR Financial Holdings delivered strong returns, and relatively small positions in individual mortgage real estate investment trusts (REITs) – MFA Financial, Invesco Mortgage Capital, Two Harbors Investment,
Certified Semi-Annual Report 9
Letter to Shareholders,
Continued
and Chimera Investment – combined to make a significant contribution to portfolio performance. On the negative side, U.K. based Standard Chartered and Banco Santander Brasil were negative contributors for the period, though their respective share prices have stabilized in recent weeks.
Your Fund’s significant holdings in the telecommunications sector delivered mixed performances in the semi-annual period, and lagged the index returns of the telecommunications sector. Swisscom and Denmark’s TDC were among the best performers in the portfolio, while developing market firms China Mobile, Russian firms MegaFon and Vimpelcom, and Turkey’s Turkcell were among the worst. Long-time Income Builder holding Vodafone paid a large first-quarter 2014 dividend, and spun off its holding of shares in Verizon Communications to Vodafone shareholders, following conversion of its 45% holding in Verizon Wireless into a cash payment and shares of Verizon Communications. Vodafone no longer has a presence in the U.S. telecommunications market.
Among Income Builder’s investments in the energy sector, French integrated hydrocarbon producer Total SA, Royal Dutch Shell, refiner HollyFrontier Corporation, and Canadian Oil Sands Ltd. each delivered good portfolio performance in the semi-annual period. U.S. energy infrastructure owner Kinder Morgan was among the weaker performers in the portfolio. While Kinder Morgan holds a valuable collection of assets, it faces questions regarding its ability to grow its dividend while simultaneously investing to maintain existing assets and acquire new ones.
Returns from your Fund’s holdings in the utilities sector exceeded the strong market returns from this sector. Positive performers included Electricite de France, GDF Suez, Italian and Spanish gas transmission line operators Snam and Enagas, and U.S. diversified utilities Dominion Resources and Sempra Energy.
Among Fund investments in the consumer staples sector, Walgreen’s delivered a strong performance during the period after improving same-store sales reversed the negative performance seen earlier last year. The Fund’s staples sector investments (Coca-Cola, Nestle, McDonald’s, Reckitt Benckiser Group, Lorillard, Netherlands-based grocer Royal Ahold, and Philip Morris International) outpaced the performance of the index during the period. We limited the damage from subpar returns to Coca Cola and Philip Morris by reducing the position sizes significantly.
Investment Income Builder’s semi-annual period returns from its holdings in the health care sector lagged those of the index. Positive performances from Roche, Novartis, and Pfizer were weighed down by a sluggish performance from France’s Sanofi, which faced inventory problems in Brazil and delayed new drug approvals. Stock prices of a majority of firms in this sector have risen more than the market as a whole in recent years. As a consequence of higher stock prices, dividend yields are dropping, and we have reduced the portfolio’s percentage weighting in health care stocks.
Among other portfolio holdings, notable contributors included casino operators Wynn Resorts and Sands China, Italian toll-road operator Atlantia SpA, French infrastructure builder/operator Vinci, communication chip designer Qualcomm, technology giants Microsoft and Intel, and chemicals producer LyondellBasell Industries. Negative contributors included office supplies retailer Staples, Brazilian utility EDP Energias do Brasil, industrial conglomerate China Merchants Holdings, and Washington REIT. How’s that for a diverse group of dividend payers!
The euro and British pound each appreciated vis-à-vis the U.S. dollar during the period. We hedged a majority of the currency exposure to the euro and other European currencies tied to it, since we are more focused on risk management than on reaping possible currency gains from exposure to assets denominated in these currencies. This hurt our performance relative to the index, since we missed out on a modest performance tailwind from currency appreciation. The Australian dollar and Brazilian real each appreciated relative to the U.S. dollar during the first quarter of 2014, partially reversing depreciation trends in the fourth quarter of last year.
Within its bond portfolio, Investment Income Builder owned significantly fewer U.S. government and agency bonds than the Barclays U.S. Aggregate Bond Index. This fact was helpful again in the six-month period under review, since yield spreads of corporate credits over comparable maturity U.S. government yield levels fell. Corporate bond prices have increased as their yields have declined, leading us to allocate most incoming cash flows to equities in recent quarters. You can expect us to increase the portfolio’s allocation to bonds if rising yields lead to lower bond prices. Readers of this commentary who are long-time shareholders of Income Builder will recall that the interest-bearing debt portion of the Fund’s portfolio has varied over time, ranging from less than 12% (currently, and in mid-2005) to 45% at June 30, 2009 (See Chart I).
As of March 31, 2014, the Fund’s portfolio included approximately 160 bonds and hybrid securities.
Since its inception, the dividend increases paid by Investment Income Builder have been powered primarily by dividend increases from the Fund’s equity holdings. These increases slowed significantly during the global financial crisis, due to more than 20% aggregate declines in dividends paid in 2009 in most developed country equity markets. Dividend increases since 2010 have brought aggregate dividends paid by U.S. listed firms back above pre-financial crisis levels. For the U.S. equity market as a
10 Certified Semi-Annual Report
Letter to Shareholders,
Continued
Chart I : Interest Bearing Investments as a Percentage of Total Portfolio as of March 31, 2014
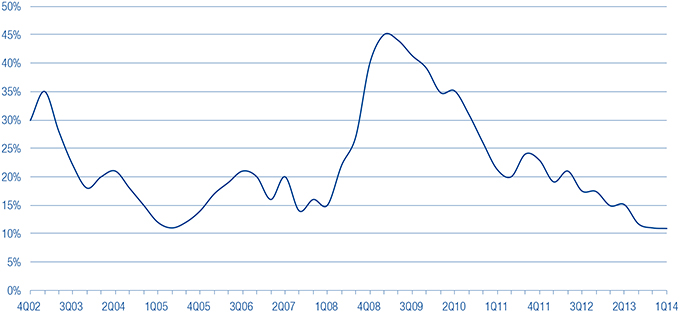
whole, the dividend payout ratio is around 33% of corporate earnings. For the Income Builder equity portfolio as a whole, the dividend payout ratio is slightly above 60%, reflecting our preference for owning firms with both the ability and willingness to pay attractive dividends. Outside the U.S., dividend yields and payout ratios tend to be higher, but dividend growth has been lower since 2010. Readers should be aware that the reduced yields now available from bond investments pose a formidable near-term challenge to delivering year-over-year dividend increases on Investment Income Builder shares.
If the global economy recovers, we expect firming interest rates, better business conditions, and reduced anxiety from corporate boards about distributing retained earnings. To the extent that the global economy does not recover… and this is always a possibility, we can expect the opposite.
During the early months of 2014, investors have debated the future direction of the economies of China and Japan, potential policy actions by various branches of the U.S. government, the strength and durability of the nascent European economic recovery, and the financial condition of various emerging market economies. For the most part, these issues remain open. In March, Russian military actions in Crimea took center stage, re-awakened Cold War memories, and cast a shadow over investor enthusiasm for purchasing financial assets.
Global economic growth, while positive, has been below prior expectations. It grows increasingly difficult for firms to generate significant revenue growth. Most major central banks around the world continue to pursue easy monetary conditions, though the U.S. Federal Reserve has reduced its program of unconventional monetary easing. Yields available to investors in the U.S. bond market were mixed at the end of March 2014, compared to six months earlier:
| | • | | Intermediate maturity U.S. Government bond yields moved approximately 0.20% higher, though these remain low by historical standards. |
| | • | | Investment-grade corporate bond yields declined, as indicated by the 0.32% decrease in the FINRA-Bloomberg Index of Active Investment Grade U.S. Corporate Bond Yields, from 3.97% on September 30, 2013 to 3.65% at March 31, 2014. |
| | • | | High-yield (“junk”) corporate bond yields declined, as indicated by the 0.66% decrease in the FINRA-Bloomberg Index of Active High Yield U.S. Corporate Bond Yields, from 6.36% on September 30, 2013 to 5.70% at March 31, 2014. |
While lower interest rates are good news for borrowers, they have negative consequences for conservative savers. Interest income as a percentage of overall personal income in the United States has fallen from more than 11% in 2008 to around 7% today. The interest contribution to personal income is likely to continue dropping in 2014 as previously issued bonds and CDs mature.
Investors must consider other options. Yields on taxable and tax-exempt money funds remain below 1/5 of one percent. Banks have aggressively reduced yields on all deposits. A very large pool of investor dollars is looking for better returns elsewhere, but
Certified Semi-Annual Report 11
Letter to Shareholders,
Continued
in sensible investments. We are optimistic that the types of income producing investments owned by the Thornburg Investment Income Builder Fund will experience sustainable popularity among investors as their intrinsic values for income production are recognized. A high percentage of investor funds belong to people over the age of 55, for whom income is an increasingly necessary and desirable attribute.
Thank you for being a shareholder of the Thornburg Investment Income Builder Fund. Remember that you can review descriptions of many of the stocks in your portfolio at your leisure by going to our internet site, www.thornburginvestments.com/funds. Best wishes for a wonderful summer.
Sincerely,
| | | | |
 | |  | |  |
| Brian McMahon | | Jason Brady, CFA | | Ben Kirby, CFA |
| Portfolio Manager | | Portfolio Manager | | Portfolio Manager |
| CEO & Chief Investment Officer | | Managing Director | | Managing Director |
The matters discussed in this report may constitute forward-looking statements made pursuant to the safe harbor provisions of the Securities Litigation Reform Act of 1995. These include any advisor or portfolio manager prediction, assessment, analysis or outlook for individual securities, industries, investment styles, market sectors and/or markets. These statements involve risks and uncertainties. In addition to the general risks described for each fund in its current prospectus, other factors bearing on these reports include the accuracy of the advisor’s or portfolio manager’s forecasts and predictions, the appropriateness of the investment strategies designed by the advisor or portfolio manager and the ability of the advisor or portfolio manager to implement their strategies efficiently and successfully. Any one or more of these factors, as well as other risks affecting the securities markets generally, could cause the actual results of any fund to differ materially as compared to its benchmarks.
12 Certified Semi-Annual Report
| | |
| Schedule of Investments | | |
| |
Thornburg Investment Income Builder Fund | | March 31, 2014 (Unaudited) |
Summary of Industry Exposure
As of 3/31/14
| | | | |
Telecommunication Services | | | 18.4 | % |
Energy | | | 11.4 | % |
Utilities | | | 10.5 | % |
Diversified Financials | | | 9.0 | % |
Real Estate | | | 6.8 | % |
Pharmaceuticals, Biotechnology & Life Sciences | | | 6.4 | % |
Food, Beverage & Tobacco | | | 4.6 | % |
Banks | | | 3.8 | % |
Consumer Services | | | 3.6 | % |
Materials | | | 3.6 | % |
Insurance | | | 3.1 | % |
Food & Staples Retailing | | | 2.6 | % |
Capital Goods | | | 2.2 | % |
Semiconductors & Semiconductor Equipment | | | 2.0 | % |
Transportation | | | 2.0 | % |
Technology Hardware & Equipment | | | 1.9 | % |
Media | | | 1.3 | % |
Retailing | | | 1.2 | % |
Household & Personal Products | | | 1.0 | % |
Software & Services | | | 0.9 | % |
Miscellaneous | | | 0.5 | % |
Health Care Equipment & Services | | | 0.2 | % |
Other Non-Classified Securities: | | | | |
Other Securities | | | 0.6 | % |
Asset Backed Securities | | | 0.6 | % |
U.S. Government Agencies | | | 0.1 | % |
Municipal Bonds* | | | 0.0 | % |
Other Government* | | | 0.0 | % |
Other Assets & Liabilities | | | 1.7 | % |
| * | Industry percentage was less than 0.1%. |
Top Ten Equity Holdings
As of 3/31/14
| | | | |
Total SA | | | 2.6 | % |
JPMorgan Chase & Co. | | | 2.5 | % |
Royal Dutch Shell plc ADR | | | 2.2 | % |
Walgreen Co. | | | 2.1 | % |
GDF Suez | | | 2.0 | % |
Telefonica Brasil SA ADR | | | 2.0 | % |
Sanofi-Aventis | | | 1.9 | % |
TDC A/S | | | 1.9 | % |
Pfizer, Inc. | | | 1.9 | % |
Eni S.p.A. | | | 1.7 | % |
Summary of Country Exposure
As of 3/31/14 (percent of equity holdings)
| | | | |
United States | | | 43.6 | % |
France | | | 9.8 | % |
Switzerland | | | 6.0 | % |
Netherlands | | | 4.9 | % |
Brazil | | | 4.6 | % |
Italy | | | 4.0 | % |
United Kingdom | | | 3.4 | % |
China | | | 2.6 | % |
Australia | | | 2.0 | % |
Denmark | | | 1.9 | % |
Canada | | | 1.9 | % |
Hong Kong | | | 1.7 | % |
Singapore | | | 1.6 | % |
Norway | | | 1.5 | % |
Russia | | | 1.3 | % |
Spain | | | 1.3 | % |
Mexico | | | 0.8 | % |
Saudi Arabia | | | 0.7 | % |
Turkey | | | 0.7 | % |
Taiwan | | | 0.6 | % |
Philippines | | | 0.5 | % |
Bermuda | | | 0.4 | % |
South Korea | | | 0.4 | % |
New Zealand | | | 0.3 | % |
Luxembourg | | | 0.3 | % |
Cayman Islands | | | 0.3 | % |
Thailand | | | 0.2 | % |
Argentina | | | 0.2 | % |
Panama | | | 0.2 | % |
Japan | | | 0.2 | % |
Germany | | | 0.2 | % |
South Africa | | | 0.1 | % |
Ireland | | | 0.1 | % |
Trinidad and Tobago* | | | 0.0 | % |
Scotland* | | | 0.0 | % |
Other Assets & Liabilities | | | 1.7 | % |
| * | Country percentage was less than 0.01%. |
Certified Semi-Annual Report 13
| | |
| Schedule of Investments, continued | | |
| |
Thornburg Investment Income Builder Fund | | March 31, 2014 (Unaudited) |
| | | | | | | | |
| | | SHARES/
PRINCIPAL
AMOUNT | | | VALUE | |
| | |
COMMON STOCK — 88.96% | | | | | | | | |
| | |
BANKS — 5.71% | | | | | | | | |
Banks — 5.71% | | | | | | | | |
Banco Santander Brasil S.A. | | | 10,831,900 | | | $ | 60,333,683 | |
Banque Cantonale Vaudoise | | | 44,400 | | | | 25,890,164 | |
Fifth Third Bancorp | | | 4,626,700 | | | | 106,182,765 | |
JPMorgan Chase & Co. | | | 7,950,000 | | | | 482,644,500 | |
Liechtensteinische Landesbank AG | | | 1,150,000 | | | | 55,545,501 | |
Nordea Bank AB | | | 6,870,500 | | | | 97,447,878 | |
St. Galler Kantonalbank | | | 78,741 | | | | 32,732,671 | |
Standard Chartered plc | | | 6,325,000 | | | | 132,178,123 | |
| | | | | | | | |
| | | | | | | 992,955,285 | |
| | | | | | | | |
CAPITAL GOODS — 2.34% | | | | | | | | |
Construction & Engineering — 1.26% | | | | | | | | |
Vinci S.A. | | | 2,940,900 | | | | 218,417,961 | |
Industrial Conglomerates — 1.08% | | | | | | | | |
Hopewell Holdings Ltd. | | | 36,270,840 | | | | 124,386,559 | |
NWS Holdings Ltd. | | | 38,000,000 | | | | 64,374,396 | |
| | | | | | | | |
| | | | | | | 407,178,916 | |
| | | | | | | | |
CONSUMER DURABLES & APPAREL — 0.52% | | | | | | | | |
Textiles, Apparel & Luxury Goods — 0.52% | | | | | | | | |
Coach, Inc. | | | 1,837,100 | | | | 91,230,386 | |
| | | | | | | | |
| | | | | | | 91,230,386 | |
| | | | | | | | |
CONSUMER SERVICES — 2.74% | | | | | | | | |
Hotels, Restaurants & Leisure — 2.74% | | | | | | | | |
McDonald’s Corp. | | | 1,410,000 | | | | 138,222,300 | |
Sands China Ltd. | | | 11,150,000 | | | | 83,159,608 | |
SJM Holdings Ltd. | | | 11,397,000 | | | | 32,031,793 | |
Wynn Resorts Ltd. | | | 1,000,000 | | | | 222,150,000 | |
| | | | | | | | |
| | | | | | | 475,563,701 | |
| | | | | | | | |
DIVERSIFIED FINANCIALS — 5.71% | | | | | | | | |
Capital Markets — 4.65% | | | | | | | | |
Apollo Global Management, LLC | | | 3,238,100 | | | | 102,971,580 | |
a Apollo Investment Corp. | | | 12,500,000 | | | | 103,875,000 | |
Ares Capital Corp. | | | 8,650,000 | | | | 152,413,000 | |
GAM Holding AG | | | 4,440,982 | | | | 80,124,046 | |
KKR & Co. LP | | | 700,000 | | | | 15,988,000 | |
Och-Ziff Capital Management Group, LLC | | | 8,400,000 | | | | 115,668,000 | |
a Solar Capital Ltd. | | | 4,607,900 | | | | 100,360,062 | |
The Blackstone Group LP | | | 4,105,000 | | | | 136,491,250 | |
Consumer Finance — 0.28% | | | | | | | | |
Capital One Financial Corp. | | | 630,000 | | | | 48,610,800 | |
Diversified Financial Services — 0.78% | | | | | | | | |
a KKR Financial Holdings, LLC | | | 11,700,000 | | | | 135,369,000 | |
| | | | | | | | |
| | | | | | | 991,870,738 | |
| | | | | | | | |
ENERGY — 10.33% | | | | | | | | |
Energy Equipment & Services — 0.59% | | | | | | | | |
Ensco plc | | | 1,936,000 | | | | 102,182,080 | |
Oil, Gas & Consumable Fuels — 9.74% | | | | | | | | |
Canadian Oil Sands Ltd. | | | 8,125,000 | | | | 170,437,585 | |
b Halcon Resources Corp. | | | 259,140 | | | | 1,122,076 | |
HollyFrontier Corp. | | | 3,204,700 | | | | 152,479,626 | |
Husky Energy, Inc. | | | 7,250,600 | | | | 217,485,207 | |
Kinder Morgan, Inc. | | | 4,725,000 | | | | 153,515,250 | |
Linn Co., LLC | | | 3,060,000 | | | | 82,773,000 | |
Royal Dutch Shell plc ADR | | | 6,100,000 | | | | 445,666,000 | |
Statoil ASA | | | 2,657,900 | | | | 75,016,717 | |
Total SA | | | 6,020,300 | | | | 394,787,911 | |
| | | | | | | | |
| | | | | | | 1,795,465,452 | |
| | | | | | | | |
14 Certified Semi-Annual Report
| | |
| Schedule of Investments, continued | | |
| |
Thornburg Investment Income Builder Fund | | March 31, 2014 (Unaudited) |
| | | | | | | | |
| | | SHARES/
PRINCIPAL
AMOUNT | | | VALUE | |
FOOD & STAPLES RETAILING — 3.70% | | | | | | | | |
Food & Staples Retailing — 3.70% | | | | | | | | |
Koninklijke Ahold NV | | | 13,419,125 | | | $ | 269,538,299 | |
Walgreen Co. | | | 5,650,000 | | | | 373,069,500 | |
| | | | | | | | |
| | | | | | | 642,607,799 | |
| | | | | | | | |
FOOD, BEVERAGE & TOBACCO — 5.97% | | | | | | | | |
Beverages — 1.66% | | | | | | | | |
Ambev SA ADR | | | 14,188,000 | | | | 105,133,080 | |
Coca Cola Co. | | | 3,369,300 | | | | 130,257,138 | |
Coca-Cola Amatil Ltd. | | | 5,272,581 | | | | 53,934,420 | |
Food Products — 1.30% | | | | | | | | |
Nestle SA | | | 3,001,600 | | | | 225,956,088 | |
Tobacco — 3.01% | | | | | | | | |
British American Tobacco plc | | | 1,552,600 | | | | 86,336,659 | |
Korean Tobacco & Ginseng Corp. | | | 1,673,100 | | | | 125,743,812 | |
Lorillard, Inc. | | | 3,452,700 | | | | 186,722,016 | |
Philip Morris USA, Inc. | | | 1,510,000 | | | | 123,623,700 | |
| | | | | | | | |
| | | | | | | 1,037,706,913 | |
| | | | | | | | |
HOUSEHOLD & PERSONAL PRODUCTS — 1.08% | | | | | | | | |
Household Products — 0.94% | | | | | | | | |
Reckitt Benckiser plc | | | 2,013,500 | | | | 164,047,149 | |
Personal Products — 0.14% | | | | | | | | |
Hengan International Group Co. Ltd. | | | 2,304,500 | | | | 23,931,860 | |
| | | | | | | | |
| | | | | | | 187,979,009 | |
| | | | | | | | |
INSURANCE — 2.82% | | | | | | | | |
Insurance — 2.82% | | | | | | | | |
BB Seguridade Participacoes S.A. | | | 4,000,000 | | | | 44,266,196 | |
Gjensidige Forsikring ASA | | | 5,100,000 | | | | 103,740,940 | |
Scor SE | | | 2,982,500 | | | | 104,364,532 | |
Zurich Financial Services AG | | | 775,200 | | | | 237,983,462 | |
| | | | | | | | |
| | | | | | | 490,355,130 | |
| | | | | | | | |
MATERIALS — 3.34% | | | | | | | | |
Chemicals — 1.68% | | | | | | | | |
LyondellBasell Industries NV | | | 1,826,300 | | | | 162,431,122 | |
Saudi Basic Industries Corp. | | | 2,808,000 | | | | 87,975,789 | |
Yanbu National Petrochemical Co. | | | 2,200,022 | | | | 41,503,208 | |
Metals & Mining — 1.66% | | | | | | | | |
Nucor Corp. | | | 3,250,000 | | | | 164,255,000 | |
Southern Copper Corp. | | | 4,275,000 | | | | 124,445,250 | |
| | | | | | | | |
| | | | | | | 580,610,369 | |
| | | | | | | | |
MEDIA — 0.21% | | | | | | | | |
Media — 0.21% | | | | | | | | |
Eutelsat Communications | | | 1,054,000 | | | | 35,792,851 | |
| | | | | | | | |
| | | | | | | 35,792,851 | |
| | | | | | | | |
PHARMACEUTICALS, BIOTECHNOLOGY & LIFE SCIENCES — 6.92% | | | | | | | | |
Pharmaceuticals — 6.92% | | | | | | | | |
Novartis AG | | | 3,936,800 | | | | 333,985,635 | |
Pfizer, Inc. | | | 8,820,000 | | | | 283,298,400 | |
Roche Holding AG | | | 1,177,200 | | | | 352,873,706 | |
Sanofi-Aventis | | | 2,237,200 | | | | 233,251,633 | |
| | | | | | | | |
| | | | | | | 1,203,409,374 | |
| | | | | | | | |
REAL ESTATE — 6.18% | | | | | | | | |
Real Estate Investment Trusts — 6.18% | | | | | | | | |
Capstead Mortgage Corp. | | | 3,250,000 | | | | 41,145,000 | |
Chimera Investment Corp. | | | 47,850,000 | | | | 146,421,000 | |
Digital Realty Trust, Inc. | | | 1,940,000 | | | | 102,975,200 | |
a Dynex Capital, Inc. | | | 5,062,000 | | | | 45,304,900 | |
a Invesco Mortgage Capital, Inc. | | | 9,420,000 | | | | 155,147,400 | |
a MFA Financial, Inc. | | | 25,500,000 | | | | 197,625,000 | |
Certified Semi-Annual Report 15
| | |
| Schedule of Investments, continued | | |
| |
Thornburg Investment Income Builder Fund | | March 31, 2014 (Unaudited) |
| | | | | | | | |
| | | SHARES/
PRINCIPAL
AMOUNT | | | VALUE | |
Senior Housing Properties Trust | | | 4,670,000 | | | $ | 104,934,900 | |
Two Harbors Investment Corp. | | | 14,000,000 | | | | 143,500,000 | |
a Washington REIT | | | 5,721,000 | | | | 136,617,480 | |
| | | | | | | | |
| | | | | | | 1,073,670,880 | |
| | | | | | | | |
RETAILING — 1.46% | | | | | | | | |
Specialty Retail — 1.46% | | | | | | | | |
Staples, Inc. | | | 15,000,000 | | | | 170,100,000 | |
The Home Depot, Inc. | | | 1,051,100 | | | | 83,173,543 | |
| | | | | | | | |
| | | | | | | 253,273,543 | |
| | | | | | | | |
SEMICONDUCTORS & SEMICONDUCTOR EQUIPMENT — 1.75% | | | | | | | | |
Semiconductors & Semiconductor Equipment — 1.75% | | | | | | | | |
Intel Corp. | | | 8,175,000 | | | | 210,996,750 | |
Taiwan Semiconductor Manufacturing Co. Ltd. | | | 24,123,000 | | | | 93,869,978 | |
| | | | | | | | |
| | | | | | | 304,866,728 | |
| | | | | | | | |
SOFTWARE & SERVICES — 1.31% | | | | | | | | |
Internet Software & Services — 0.57% | | | | | | | | |
Mail.ru Group Ltd. | | | 2,791,400 | | | | 98,955,130 | |
Software — 0.74% | | | | | | | | |
Microsoft Corp. | | | 3,150,000 | | | | 129,118,500 | |
| | | | | | | | |
| | | | | | | 228,073,630 | |
| | | | | | | | |
TECHNOLOGY HARDWARE & EQUIPMENT — 2.67% | | | | | | | | |
Communications Equipment — 1.52% | | | | | | | | |
Qualcomm, Inc. | | | 3,351,000 | | | | 264,259,860 | |
Technology, Hardware, Storage & Periphals — 1.15% | | | | | | | | |
Apple, Inc. | | | 372,000 | | | | 199,667,280 | |
| | | | | | | | |
| | | | | | | 463,927,140 | |
| | | | | | | | |
TELECOMMUNICATION SERVICES — 15.10% | | | | | | | | |
Diversified Telecommunication Services — 11.31% | | | | | | | | |
AT&T, Inc. | | | 3,550,000 | | | | 124,498,500 | |
BT Group plc | | | 26,215,000 | | | | 165,857,974 | |
Singapore Telecommunications Ltd. | | | 70,628,600 | | | | 204,378,809 | |
Swisscom AG | | | 479,000 | | | | 294,210,735 | |
TDC A/S | | | 32,111,900 | | | | 296,863,312 | |
Telefonica Brasil SA ADR | | | 13,900,000 | | | | 295,236,000 | |
Telenor ASA | | | 8,350,100 | | | | 185,052,652 | |
TeliaSonera AB | | | 6,985,909 | | | | 52,672,521 | |
Telstra Corp. Ltd. | | | 54,699,000 | | | | 257,697,580 | |
Verizon Communications, Inc. | | | 1,865,805 | | | | 88,961,583 | |
Wireless Telecommunication Services — 3.79% | | | | | | | | |
China Mobile Ltd. | | | 17,599,849 | | | | 161,102,208 | |
Etihad Etisalat Co. | | | 3,380,000 | | | | 83,590,864 | |
MegaFon OAO | | | 3,278,300 | | | | 92,284,145 | |
MegaFon OAO GDR | | | 1,407,400 | | | | 39,618,310 | |
Philippine Long Distance Telephone Co. | | | 836,400 | | | | 50,916,980 | |
b Turkcell Iletisim Hizmetleri AS | | | 17,450,300 | | | | 97,458,095 | |
Vodafone Group plc | | | 36,596,127 | | | | 134,407,758 | |
| | | | | | | | |
| | | | | | | 2,624,808,026 | |
| | | | | | | | |
TRANSPORTATION — 2.55% | | | | | | | | |
Transportation Infrastructure — 2.55% | | | | | | | | |
Atlantia S.p.A. | | | 8,645,800 | | | | 222,137,960 | |
China Merchants Holdings International Co., Ltd. | | | 20,720,430 | | | | 71,325,402 | |
Jiangsu Express Co., Ltd. | | | 36,530,000 | | | | 41,679,946 | |
Santos Brasil Participacoes S.A. | | | 3,970,750 | | | | 29,312,500 | |
Sydney Airport | | | 20,265,009 | | | | 78,745,921 | |
| | | | | | | | |
| | | | | | | 443,201,729 | |
| | | | | | | | |
UTILITIES — 6.55% | | | | | | | | |
Electric Utilities — 3.42% | | | | | | | | |
Duke Energy Corp. | | | 2,872,000 | | | | 204,543,840 | |
EDP — Energias do Brasil SA | | | 14,054,100 | | | | 63,797,810 | |
16 Certified Semi-Annual Report
| | |
| Schedule of Investments, continued | | |
| |
Thornburg Investment Income Builder Fund | | March 31, 2014 (Unaudited) |
| | | | | | | | |
| | | SHARES/
PRINCIPAL
AMOUNT | | | VALUE | |
Electricite de France SA | | | 2,044,600 | | | $ | 80,882,755 | |
Entergy Corp. | | | 1,317,200 | | | | 88,054,820 | |
Mighty River Power Ltd. | | | 26,500,000 | | | | 50,365,668 | |
Terna Rete Elettrica Nazionale S.p.A. | | | 19,889,716 | | | | 106,535,316 | |
Gas Utilities — 1.11% | | | | | | | | |
Enagas SA | | | 3,483,600 | | | | 105,941,899 | |
Snam S.p.A. | | | 15,000,600 | | | | 87,828,673 | |
Independent Power & Renewable Electricity — 0.22% | | | | | | | | |
China Resources Power Holdings Co. | | | 3,900,000 | | | | 10,156,643 | |
Huaneng Power International, Inc. | | | 28,620,000 | | | | 27,304,583 | |
Multi-Utilities — 1.80% | | | | | | | | |
Dominion Resources, Inc. | | | 1,770,000 | | | | 125,652,300 | |
GDF Suez | | | 2,804,800 | | | | 76,739,665 | |
Sempra Energy | | | 1,150,000 | | | | 111,274,000 | |
| | | | | | | | |
| | | | | | | 1,139,077,972 | |
| | | | | | | | |
TOTAL COMMON STOCK (Cost $13,069,570,907) | | | | | | | 15,463,625,571 | |
| | | | | | | | |
PREFERRED STOCK — 0.85% | | | | | | | | |
| | |
BANKS — 0.20% | | | | | | | | |
Banks — 0.20% | | | | | | | | |
Barclays Bank plc Pfd, 7.10% | | | 200,000 | | | | 5,134,000 | |
First Niagara Financial Group Pfd, 8.625% | | | 143,295 | | | | 4,071,011 | |
First Tennessee Bank Pfd, 3.75% | | | 12,000 | | | | 8,283,750 | |
GMAC Capital Trust I Pfd, 8.125% | | | 628,126 | | | | 17,147,840 | |
| | | | | | | | |
| | | | | | | 34,636,601 | |
| | | | | | | | |
DIVERSIFIED FINANCIALS — 0.16% | | | | | | | | |
Capital Markets — 0.01% | | | | | | | | |
Morgan Stanley Pfd, 4.00% | | | 120,000 | | | | 2,389,200 | |
Consumer Finance — 0.15% | | | | | | | | |
Ally Financial, Inc. Pfd, 8.50% | | | 930,495 | | | | 25,449,038 | |
| | | | | | | | |
| | | | | | | 27,838,238 | |
| | | | | | | | |
ENERGY — 0.11% | | | | | | | | |
Oil, Gas & Consumable Fuels — 0.11% | | | | | | | | |
Halcon Resources Corp. Pfd, 5.75% | | | 26,000 | | | | 19,500,000 | |
| | | | | | | | |
| | | | | | | 19,500,000 | |
| | | | | | | | |
INSURANCE — 0.14% | | | | | | | | |
Insurance — 0.14% | | | | | | | | |
Principal Financial Group Pfd, 5.563% | | | 234,400 | | | | 24,157,850 | |
| | | | | | | | |
| | | | | | | 24,157,850 | |
| | | | | | | | |
MISCELLANEOUS — 0.06% | | | | | | | | |
U.S. Government Agencies — 0.06% | | | | | | | | |
Farm Credit Bank of Texas Pfd, 10.00% | | | 9,000 | | | | 10,892,813 | |
| | | | | | | | |
| | | | | | | 10,892,813 | |
| | | | | | | | |
REAL ESTATE — 0.07% | | | | | | | | |
Real Estate Investment Trusts — 0.07% | | | | | | | | |
Alexandria Real Estate Pfd, 7.00% | | | 463,500 | | | | 12,454,245 | |
| | | | | | | | |
| | | | | | | 12,454,245 | |
| | | | | | | | |
TELECOMMUNICATION SERVICES — 0.11% | | | | | | | | |
Wireless Telecommunication Services — 0.11% | | | | | | | | |
Centaur Funding Corp. Pfd, 9.08% | | | 15,000 | | | | 18,328,125 | |
| | | | | | | | |
| | | | | | | 18,328,125 | |
| | | | | | | | |
TOTAL PREFERRED STOCK (Cost $145,828,528) | | | | | | | 147,807,872 | |
| | | | | | | | |
Certified Semi-Annual Report 17
| | |
| Schedule of Investments, continued | | |
| |
Thornburg Investment Income Builder Fund | | March 31, 2014 (Unaudited) |
| | | | | | | | |
| | | SHARES/
PRINCIPAL
AMOUNT | | | VALUE | |
ASSET BACKED SECURITIES — 0.46% | | | | | | | | |
| | |
COMMERCIAL MTG TRUST — 0.11% | | | | | | | | |
Citigroup Commercial Mtg Trust, Series 2004-HYB2 Class B1, 3.26%, 3/25/2034 | | $ | 1,134,983 | | | $ | 922,418 | |
c CVS Pass-Through Trust, 9.35%, 1/10/2023 | | | 15,000,000 | | | | 17,516,505 | |
| | | | | | | | |
| | | | | | | 18,438,923 | |
| | | | | | | | |
OTHER ASSET BACKED — 0.15% | | | | | | | | |
c Fairway Outdoor Funding, LLC, 8.835%, 10/15/2042 | | | 7,000,000 | | | | 6,707,028 | |
c JPR Royalty, LLC, 14.00%, 9/1/2020 | | | 5,000,000 | | | | 3,249,225 | |
c MIRAMAX, LLC, 10.00%, 10/20/2021 | | | 12,025,000 | | | | 12,467,556 | |
c,d Northwind Holdings, LLC Floating Rate Note, 1.016%, 12/1/2037 | | | 3,718,750 | | | | 3,452,859 | |
| | | | | | | | |
| | | | | | | 25,876,668 | |
| | | | | | | | |
RESIDENTIAL MTG TRUST — 0.20% | | | | | | | | |
Banc of America Funding Corp., Series 2006-I Class SB1, 2.327%, 12/20/2036 | | | 2,990,239 | | | | 799,323 | |
Bear Stearns ARM Mtg, Series 2003-6 Class 2B-1, 2.487%, 8/25/2033 | | | 314,949 | | | | 292,756 | |
FBR Securitization Trust, Series 2005-2 Class M1, 0.874%, 9/25/2035 | | | 20,100,000 | | | | 18,664,611 | |
Merrill Lynch Mtg Investors Trust, Series 2004-A4 Class M1, 2.49%, 8/25/2034 | | | 5,517,797 | | | | 4,658,190 | |
Morgan Stanley Capital, Inc., Series 2005-HE7 Class A2C, 0.474%, 11/25/2035 | | | 6,109,092 | | | | 5,978,713 | |
Residential Asset Securities Corp., Series 2006-KS4 Class A3, 0.304%, 6/25/2036 | | | 3,155,845 | | | | 3,107,902 | |
Wells Fargo Asset Securities Corp., Series 2005-AR1 Class 1B1, 2.615%, 2/25/2035 | | | 7,059,099 | | | | 1,510,503 | |
| | | | | | | | |
| | | | | | | 35,011,998 | |
| | | | | | | | |
TOTAL ASSET BACKED SECURITIES (Cost $81,259,813) | | | | | | | 79,327,589 | |
| | | | | | | | |
CORPORATE BONDS — 5.86% | | | | | | | | |
| | |
BANKS — 0.21% | | | | | | | | |
Banks — 0.21% | | | | | | | | |
c,e Groupe BPCE, 12.50%, 8/29/2049 | | | 10,211,000 | | | | 13,172,190 | |
PNC Financial Services Group, Inc., 4.454%, 5/29/2049 | | | 10,000,000 | | | | 10,030,000 | |
Provident Bank of Maryland, 9.50%, 5/1/2018 | | | 5,600,000 | | | | 5,617,522 | |
e Royal Bank of Scotland Group plc, 6.10%, 6/10/2023 | | | 7,000,000 | | | | 7,266,133 | |
| | | | | | | | |
| | | | | | | 36,085,845 | |
| | | | | | | | |
CAPITAL GOODS — 0.11% | | | | | | | | |
Industrial Conglomerates — 0.11% | | | | | | | | |
Otter Tail Corp., 9.00%, 12/15/2016 | | | 17,000,000 | | | | 19,952,747 | |
| | | | | | | | |
| | | | | | | 19,952,747 | |
| | | | | | | | |
CONSUMER SERVICES — 0.02% | | | | | | | | |
Hotels, Restaurants & Leisure — 0.02% | | | | | | | | |
c,e Arcos Dorados Holdings I, 6.625%, 9/27/2023 | | | 3,000,000 | | | | 3,075,000 | |
| | | | | | | | |
| | | | | | | 3,075,000 | |
| | | | | | | | |
DIVERSIFIED FINANCIALS — 0.62% | | | | | | | | |
Capital Markets — 0.05% | | | | | | | | |
Goldman Sachs Group, Inc., 5.625%, 1/15/2017 | | | 8,000,000 | | | | 8,831,704 | |
Consumer Finance — 0.16% | | | | | | | | |
Capital One Bank, 6.15%, 9/1/2016 | | | 25,000,000 | | | | 27,900,250 | |
Diversified Financial Services — 0.41% | | | | | | | | |
c,e CFG Holdings Ltd./CFG Finance, LLC, 11.50%, 11/15/2019 | | | 20,100,000 | | | | 21,607,500 | |
Citigroup, Inc., 5.00%, 9/15/2014 | | | 16,250,000 | | | | 16,564,681 | |
JPMorgan Chase & Co., 7.90%, 12/31/2049 | | | 15,000,000 | | | | 16,950,000 | |
National Rural Utilities CFC, 10.375%, 11/1/2018 | | | 5,000,000 | | | | 6,741,630 | |
c TMX Finance, LLC/Titlemax Finance, 8.50%, 9/15/2018 | | | 8,000,000 | | | | 8,760,000 | |
| | | | | | | | |
| | | | | | | 107,355,765 | |
| | | | | | | | |
ENERGY — 1.05% | | | | | | | | |
Energy Equipment & Services — 0.10% | | | | | | | | |
e Floatel International Ltd., 8.00%, 10/11/2017 | | | 15,500,000 | | | | 16,352,500 | |
Oil, Gas & Consumable Fuels — 0.95% | | | | | | | | |
c DCP Midstream, LLC, 9.75%, 3/15/2019 | | | 5,000,000 | | | | 6,374,465 | |
Enbridge Energy Partners LP, 9.875%, 3/1/2019 | | | 9,750,000 | | | | 12,772,900 | |
Energy Transfer Partners LP, 3.255%, 11/1/2066 | | | 23,020,000 | | | | 21,063,300 | |
Enterprise Products Operating LP, 7.034%, 1/15/2068 | | | 14,480,000 | | | | 16,398,600 | |
c Gastar Exploration USA, Inc., 8.625%, 5/15/2018 | | | 18,000,000 | | | | 18,450,000 | |
18 Certified Semi-Annual Report
| | |
| Schedule of Investments, continued | | |
| |
Thornburg Investment Income Builder Fund | | March 31, 2014 (Unaudited) |
| | | | | | | | |
| | | SHARES/
PRINCIPAL
AMOUNT | | | VALUE | |
c,e Gaz Capital SA, 8.146%, 4/11/2018 | | $ | 2,000,000 | | | $ | 2,260,000 | |
b,c,f Green Field Energy Services, 13.25%, 11/15/2016 | | | 379,000 | | | | 26,530 | |
b,c,f Green Field Energy Services, 13.00%, 11/15/2016 | | | 16,000,000 | | | | 1,120,000 | |
Kinder Morgan Energy Partners LP, 9.00%, 2/1/2019 | | | 8,000,000 | | | | 10,128,856 | |
c Linc Energy U.S.A./Linc Energy Finance, 12.50%, 10/31/2017 | | | 8,000,000 | | | | 8,800,000 | |
c Maritimes & Northeast Pipeline, LLC, 7.50%, 5/31/2014 | | | 6,171,000 | | | | 6,223,163 | |
NuStar Logistics LP, 8.15%, 4/15/2018 | | | 18,000,000 | | | | 20,520,000 | |
Oneok Partners LP, 8.625%, 3/1/2019 | | | 8,000,000 | | | | 10,027,256 | |
c,e Petro Co., Trinidad Tobago Ltd., 9.75%, 8/14/2019 | | | 4,000,000 | | | | 4,990,000 | |
e Petrobras Global Finance BV, 3.00%, 1/15/2019 | | | 4,000,000 | | | | 3,780,236 | |
RAAM Global Energy Co., 12.50%, 10/1/2015 | | | 15,000,000 | | | | 15,450,000 | |
Teppco Partners LP, 7.00%, 6/1/2067 | | | 7,000,000 | | | | 7,175,000 | |
| | | | | | | | |
| | | | | | | 181,912,806 | |
| | | | | | | | |
FOOD, BEVERAGE & TOBACCO — 0.06% | | | | | | | | |
Tobacco — 0.06% | | | | | | | | |
Altria Group, Inc., 9.70%, 11/10/2018 | | | 2,376,000 | | | | 3,118,776 | |
c,e B.A.T. International Finance, plc, 9.50%, 11/15/2018 | | | 5,000,000 | | | | 6,523,100 | |
| | | | | | | | |
| | | | | | | 9,641,876 | |
| | | | | | | | |
HEALTH CARE EQUIPMENT & SERVICES — 0.15% | | | | | | | | |
Health Care Providers & Services — 0.15% | | | | | | | | |
c Prospect Medical Holdings, Inc., 8.375%, 5/1/2019 | | | 23,500,000 | | | | 25,732,500 | |
| | | | | | | | |
| | | | | | | 25,732,500 | |
| | | | | | | | |
INSURANCE — 0.97% | | | | | | | | |
Insurance — 0.97% | | | | | | | | |
c,e Dai Ichi Mutual Life Insurance Co., Ltd., 7.25%, 12/29/2049 | | | 9,000,000 | | | | 10,620,000 | |
Hartford Financial Services Group, 8.125%, 6/15/2068 | | | 9,650,000 | | | | 11,326,688 | |
c MetLife Capital Trust X, 9.25%, 4/8/2068 | | | 12,000,000 | | | | 15,720,000 | |
MetLife, Inc., 6.817%, 8/15/2018 | | | 4,000,000 | | | | 4,773,692 | |
c National Life Insurance of Vermont, 10.50%, 9/15/2039 | | | 2,000,000 | | | | 2,778,282 | |
c Prudential Holdings, LLC, 8.695%, 12/18/2023 | | | 4,307,143 | | | | 5,425,772 | |
c,e QBE Capital Funding III Ltd., 7.25%, 5/24/2041 | | | 40,000,000 | | | | 42,800,000 | |
Transatlantic Holdings, Inc., 5.75%, 12/14/2015 | | | 14,647,000 | | | | 15,793,992 | |
c,e White Mountains Re Group Ltd., 7.506%, 12/31/2049 | | | 28,590,000 | | | | 30,014,468 | |
c ZFS Finance USA Trust II, 6.45%, 12/15/2065 | | | 25,748,000 | | | | 27,743,470 | |
c ZFS Finance USA Trust V, 6.50%, 5/9/2067 | | | 1,260,000 | | | | 1,351,350 | |
| | | | | | | | |
| | | | | | | 168,347,714 | |
| | | | | | | | |
MATERIALS — 0.33% | | | | | | | | |
Construction Materials — 0.09% | | | | | | | | |
c,e CEMEX Espana Luxembourg, 9.875%, 4/30/2019 | | | 1,460,000 | | | | 1,693,600 | |
CRH America, Inc., 8.125%, 7/15/2018 | | | 12,000,000 | | | | 14,653,092 | |
Metals & Mining — 0.24% | | | | | | | | |
c,e Anglo American Capital plc, 9.375%, 4/8/2014 | | | 3,500,000 | | | | 3,504,368 | |
e Anglogold Holdings, 8.50%, 7/30/2020 | | | 20,000,000 | | | | 22,055,000 | |
Coeur d’Alene Mines Corp., 7.875%, 2/1/2021 | | | 7,687,000 | | | | 7,725,435 | |
c,e GTL Trade Finance, Inc., 7.25%, 10/20/2017 | | | 7,000,000 | | | | 7,866,250 | |
| | | | | | | | |
| | | | | | | 57,497,745 | |
| | | | | | | | |
MEDIA — 0.23% | | | | | | | | |
Media — 0.23% | | | | | | | | |
Comcast Cable Communications, LLC, 8.875%, 5/1/2017 | | | 5,000,000 | | | | 6,100,090 | |
c,e Nara Cable Funding Ltd., 8.875%, 12/1/2018 | | | 8,985,000 | | | | 9,782,419 | |
Time Warner Cable, Inc., 8.75%, 2/14/2019 | | | 14,000,000 | | | | 17,710,322 | |
WMG Holdings Corp., 13.75%, 10/1/2019 | | | 6,000,000 | | | | 7,215,000 | |
| | | | | | | | |
| | | | | | | 40,807,831 | |
| | | | | | | | |
SEMICONDUCTORS & SEMICONDUCTOR EQUIPMENT — 0.11% | | | | | | | | |
Semiconductors & Semiconductor Equipment — 0.11% | | | | | | | | |
c,e Global A&T Electronics Ltd., 10.00%, 2/1/2019 | | | 10,000,000 | | | | 8,175,000 | |
KLA Tencor Corp., 6.90%, 5/1/2018 | | | 10,000,000 | | | | 11,724,500 | |
| | | | | | | | |
| | | | | | | 19,899,500 | |
| | | | | | | | |
Certified Semi-Annual Report 19
| | |
| Schedule of Investments, continued | | |
| |
Thornburg Investment Income Builder Fund | | March 31, 2014 (Unaudited) |
| | | | | | | | |
| | | SHARES/
PRINCIPAL
AMOUNT | | | VALUE | |
SOFTWARE & SERVICES — 0.08% | | | | | | | | |
Internet Software & Services — 0.08% | | | | | | | | |
c,e eAccess Ltd., 8.25%, 4/1/2018 | | $ | 5,600,000 | | | $ | 6,090,000 | |
d Yahoo!, Inc., 6.65%, 8/10/2026 | | | 7,626,458 | | | | 8,465,368 | |
| | | | | | | | |
| | | | | | | 14,555,368 | |
| | | | | | | | |
TELECOMMUNICATION SERVICES — 1.11% | | | | | | | | |
Diversified Telecommunication Services — 1.03% | | | | | | | | |
e Deutsche Telekom International Finance BV, 8.75%, 6/15/2030 | | | 26,150,000 | | | | 37,738,843 | |
Level 3 Communications, Inc., 11.875%, 2/1/2019 | | | 6,000,000 | | | | 6,780,000 | |
Level 3 Communications, Inc., 8.875%, 6/1/2019 | | | 9,000,000 | | | | 9,888,750 | |
Qwest Corp., 6.75%, 12/1/2021 | | | 9,000,000 | | | | 10,049,436 | |
e Telefonica Emisiones SAU, 7.045%, 6/20/2036 | | | 85,390,000 | | | | 103,352,384 | |
e Telefonica Emisiones SAU, 6.221%, 7/3/2017 | | | 2,770,000 | | | | 3,133,336 | |
c,e Telemar Norte Leste SA, 5.50%, 10/23/2020 | | | 9,065,000 | | | | 8,929,025 | |
Wireless Telecommunication Services — 0.08% | | | | | | | | |
c,e VimpelCom (UBS SA), 8.25%, 5/23/2016 | | | 4,500,000 | | | | 4,691,250 | |
c,e VimpelCom Holdings BV, 7.504%, 3/1/2022 | | | 8,735,000 | | | | 8,853,796 | |
| | | | | | | | |
| | | | | | | 193,416,820 | |
| | | | | | | | |
TRANSPORTATION — 0.05% | | | | | | | | |
Airlines — 0.05% | | | | | | | | |
c American Airlines, 4.95%, 7/15/2024 | | | 5,167,382 | | | | 5,542,017 | |
US Airways, 6.25%, 10/22/2024 | | | 2,515,812 | | | | 2,842,867 | |
| | | | | | | | |
| | | | | | | 8,384,884 | |
| | | | | | | | |
UTILITIES — 0.76% | | | | | | | | |
Electric Utilities — 0.39% | | | | | | | | |
Alabama Power Capital Trust V, 3.347%, 10/1/2042 | | | 4,000,000 | | | | 3,737,560 | |
Arizona Public Service Co., 8.75%, 3/1/2019 | | | 6,500,000 | | | | 8,313,838 | |
c,e Enel Finance International S.A., 6.25%, 9/15/2017 | | | 40,000,000 | | | | 45,254,000 | |
Entergy Gulf States Louisiana, LLC, 6.00%, 5/1/2018 | | | 8,000,000 | | | | 9,058,496 | |
c Great River Energy, 5.829%, 7/1/2017 | | | 1,030,247 | | | | 1,108,637 | |
Independent Power & Renewable Electricity — 0.11% | | | | | | | | |
c,e Inkia Energy Ltd., 8.375%, 4/4/2021 | | | 18,000,000 | | | | 19,440,000 | |
Multi-Utilities — 0.26% | | | | | | | | |
Ameren Illinois Co., 9.75%, 11/15/2018 | | | 5,000,000 | | | | 6,550,245 | |
c Enogex, LLC, 6.875%, 7/15/2014 | | | 2,000,000 | | | | 2,030,168 | |
c Enogex, LLC, 6.25%, 3/15/2020 | | | 2,500,000 | | | | 2,721,802 | |
NiSource Finance Corp., 6.40%, 3/15/2018 | | | 20,000,000 | | | | 23,069,600 | |
Sempra Energy, 9.80%, 2/15/2019 | | | 7,750,000 | | | | 10,263,395 | |
| | | | | | | | |
| | | | | | | 131,547,741 | |
| | | | | | | | |
TOTAL CORPORATE BONDS (Cost $860,788,394) | | | | | | | 1,018,214,142 | |
| | | | | | | | |
| | |
CONVERTIBLE BONDS — 0.05% | | | | | | | | |
| | |
MATERIALS — 0.00% | | | | | | | | |
Metals & Mining — 0.00% | | | | | | | | |
b,c,e,f Jaguar Mining, Inc., 4.50%, 11/1/2014 | | | 11,000,000 | | | | 550,000 | |
| | | | | | | | |
| | | | | | | 550,000 | |
| | | | | | | | |
TELECOMMUNICATION SERVICES — 0.05% | | | | | | | | |
Diversified Telecommunication Services — 0.05% | | | | | | | | |
c Alaska Communication Systems Group, Inc., 6.25%, 5/1/2018 | | | 5,700,000 | | | | 4,723,875 | |
Level 3 Communications, Inc., 7.00%, 3/15/2015 | | | 2,000,000 | | | | 3,075,000 | |
| | | | | | | | |
| | | | | | | 7,798,875 | |
| | | | | | | | |
TOTAL CONVERTIBLE BONDS (Cost $17,368,514) | | | | | | | 8,348,875 | |
| | | | | | | | |
| | |
WARRANTS — 0.00% | | | | | | | | |
b,c Green Field Energy Services | | | 16,000 | | | | 16,160 | |
| | | | | | | | |
TOTAL WARRANTS (Cost $627,343) | | | | | | | 16,160 | |
| | | | | | | | |
20 Certified Semi-Annual Report
| | |
| Schedule of Investments, continued | | |
| |
Thornburg Investment Income Builder Fund | | March 31, 2014 (Unaudited) |
| | | | | | | | |
| | | SHARES/
PRINCIPAL
AMOUNT | | | VALUE | |
MUNICIPAL BONDS — 0.02% | | | | | | | | |
San Bernardino County California Redevelopment Agency (San Sevaine), 8.45%, 9/1/2030 | | $ | 2,555,000 | | | $ | 2,764,178 | |
Town of Victor, New York, 9.20%, 5/1/2014 | | | 410,000 | | | | 410,566 | |
| | | | | | | | |
TOTAL MUNICIPAL BONDS (Cost $2,913,955) | | | | | | | 3,174,744 | |
| | | | | | | | |
| | |
U.S. GOVERNMENT AGENCIES — 0.05% | | | | | | | | |
c Agribank FCB, 9.125%, 7/15/2019 | | | 6,750,000 | | | | 8,629,578 | |
| | | | | | | | |
TOTAL U.S. GOVERNMENT AGENCIES (Cost $6,750,000) | | | | | | | 8,629,578 | |
| | | | | | | | |
| | |
FOREIGN BONDS — 1.43% | | | | | | | | |
| | |
BANKS — 0.15% | | | | | | | | |
Banks — 0.15% | | | | | | | | |
c Banco Santander Brasil S.A. (BRL), 8.00%, 3/18/2016 | | | 54,000,000 | | | | 21,984,355 | |
c Itau Unibanco Holding S.A. (BRL), 10.50%, 11/23/2015 | | | 10,000,000 | | | | 4,319,083 | |
| | | | | | | | |
| | | | | | | 26,303,438 | |
| | | | | | | | |
CONSUMER SERVICES — 0.15% | | | | | | | | |
Hotels, Restaurants & Leisure — 0.15% | | | | | | | | |
c Arcos Dorados Holdings, Inc. (BRL), 10.25%, 7/13/2016 | | | 66,000,000 | | | | 26,687,968 | |
| | | | | | | | |
| | | | | | | 26,687,968 | |
| | | | | | | | |
DIVERSIFIED FINANCIALS — 0.31% | | | | | | | | |
Capital Markets — 0.01% | | | | | | | | |
Morgan Stanley (BRL), 10.09%, 5/3/2017 | | | 4,560,000 | | | | 1,912,226 | |
Consumer Finance — 0.14% | | | | | | | | |
c Cash Store Financial (CAD), 11.50%, 1/31/2017 | | | 10,250,000 | | | | 2,054,358 | |
c Lowell Group Financing plc (GBP), 10.75%, 4/1/2019 | | | 12,000,000 | | | | 22,656,570 | |
Diversified Financial Services — 0.16% | | | | | | | | |
Bank of America Corp. (BRL), 10.00%, 11/19/2014 | | | 6,500,000 | | | | 2,821,728 | |
d Bank of America Corp. (BRL), 10.75%, 8/20/2018 | | | 5,000,000 | | | | 2,115,469 | |
KFW (BRL), 5.375%, 9/14/2015 | | | 53,000,000 | | | | 21,881,362 | |
| | | | | | | | |
| | | | | | | 53,441,713 | |
| | | | | | | | |
FOOD & STAPLES RETAILING — 0.14% | | | | | | | | |
Food & Staples Retailing — 0.14% | | | | | | | | |
Wesfarmers Ltd. (AUD), 5.245%, 9/11/2014 | | | 2,000,000 | | | | 1,871,190 | |
c Bakkavor Finance 2 plc (GBP), 8.75%, 6/15/2020 | | | 12,000,000 | | | | 22,306,469 | |
| | | | | | | | |
| | | | | | | 24,177,659 | |
| | | | | | | | |
FOOD, BEVERAGE & TOBACCO — 0.10% | | | | | | | | |
Beverages — 0.10% | | | | | | | | |
Ambev International Finance Co., Ltd. (BRL), 9.50%, 7/24/2017 | | | 21,669,000 | | | | 9,083,981 | |
Anheuser-Busch InBev (BRL), 9.75%, 11/17/2015 | | | 20,000,000 | | | | 8,726,311 | |
| | | | | | | | |
| | | | | | | 17,810,292 | |
| | | | | | | | |
INSURANCE — 0.10% | | | | | | | | |
Insurance — 0.10% | | | | | | | | |
ELM BV (AUD), 7.635%, 12/31/2049 | | | 10,500,000 | | | | 10,183,203 | |
ELM BV (AUD), 3.775%, 12/31/2049 | | | 8,000,000 | | | | 7,086,318 | |
| | | | | | | | |
| | | | | | | 17,269,521 | |
| | | | | | | | |
MISCELLANEOUS — 0.35% | | | | | | | | |
Miscellaneous — 0.35% | | | | | | | | |
Federative Republic of Brazil (BRL), 12.50%, 1/5/2022 | | | 20,000,000 | | | | 10,136,624 | |
Federative Republic of Brazil (BRL), 12.50%, 1/5/2016 | | | 109,401,000 | | | | 50,626,289 | |
| | | | | | | | |
| | | | | | | 60,762,913 | |
| | | | | | | | |
SOFTWARE & SERVICES — 0.04% | | | | | | | | |
Internet Software & Services — 0.04% | | | | | | | | |
c eAccess Ltd. (EUR), 8.375%, 4/1/2018 | | | 4,600,000 | | | | 6,924,328 | |
| | | | | | | | |
| | | | | | | 6,924,328 | |
| | | | | | | | |
Certified Semi-Annual Report 21
| | |
| Schedule of Investments, continued | | |
| |
Thornburg Investment Income Builder Fund | | March 31, 2014 (Unaudited) |
| | | | | | | | |
| | | SHARES/
PRINCIPAL
AMOUNT | | | VALUE | |
TRANSPORTATION — 0.06% | | | | | | | | |
Airlines — 0.06% | | | | | | | | |
d Iberbond 2004 plc (EUR), 4.235%, 12/24/2017 | | $ | 7,599,497 | | | $ | 10,574,138 | |
| | | | | | | | |
| | | | | | | 10,574,138 | |
| | | | | | | | |
UTILITIES — 0.03% | | | | | | | | |
Electric Utilities — 0.03% | | | | | | | | |
Cia de Eletricidade do Estado da Bahia (BRL), 11.75%, 4/27/2016 | | | 12,000,000 | | | | 5,011,018 | |
| | | | | | | | |
| | | | | | | 5,011,018 | |
| | | | | | | | |
TOTAL FOREIGN BONDS (Cost $274,792,771) | | | | | | | 248,962,988 | |
| | | | | | | | |
| | |
OTHER SECURITIES — 0.58% | | | | | | | | |
Loan Participations — 0.58% | | | | | | | | |
Baker & Taylor Acquisitions Corp., 12.00%, 9/28/2016 | | | 13,000,000 | | | | 13,162,500 | |
CEMEX S.A.B. de C.V., 4.656%, 2/17/2017 | | | 3,373,420 | | | | 3,381,854 | |
NCP Finance LP, 11.00%, 9/30/2018 | | | 12,940,000 | | | | 12,875,300 | |
North Atlantic Trading Co., Inc., 6.836%-8.75%, 12/30/2019 | | | 10,000,000 | | | | 10,075,000 | |
d Private Restaurants Properties, Inc., 9.00%, 4/10/2017 | | | 15,290,548 | | | | 15,443,453 | |
Rue21, Inc., 5.625%, 10/9/2020 | | | 6,965,000 | | | | 5,812,293 | |
d Synergy Aerospace Corp., 7.50%, 3/3/2015 | | | 26,000,000 | | | | 25,870,000 | |
Texas Competitive Electric Holdings Co., LLC, 3.7369%,10/10/2014 | | | 20,669,860 | | | | 14,772,542 | |
| | | | | | | | |
TOTAL OTHER SECURITIES (Cost $105,598,517) | | | | | | | 101,392,942 | |
| | | | | | | | |
SHORT TERM INVESTMENTS — 0.83% | | | | | | | | |
Bank of New York Tri-Party Repurchase Agreement 0.23%
dated 3/31/2014 due 4/1/2014 repurchase price $31,000,207 collateralized by
16 corporate debt securities and 4 U.S. Government debt securities, having an average coupon of 4.46%, a minimum credit rating of BBB-, maturity dates from 1/15/2016 to 1/1/2044, and having an aggregate market value of $32,863,956 at 3/31/2014. | | | 31,000,000 | | | | 31,000,000 | |
Hitachi America Capital, 0.22%, 4/3/2014 | | | 6,000,000 | | | | 5,999,927 | |
Plains All American Pipeline, 0.25%, 4/1/2014 | | | 58,000,000 | | | | 58,000,000 | |
Union Electric Co., 0.20%, 4/1/2014 | | | 50,000,000 | | | | 50,000,000 | |
| | | | | | | | |
TOTAL SHORT TERM INVESTMENTS (Cost $144,999,927) | | | | | | | 144,999,927 | |
| | | | | | | | |
TOTAL INVESTMENTS — 99.09% (Cost $14,710,498,669) | | | | | | $ | 17,224,500,388 | |
OTHER ASSETS LESS LIABILITIES — 0.91% | | | | | | | 157,437,531 | |
| | | | | | | | |
NET ASSETS — 100.00% | | | | | | $ | 17,381,937,919 | |
| | | | | | | | |
Footnote Legend
| a | Investment in Affiliates - Holdings of voting securities of each portfolio company which is considered “affiliated” to the Fund under the Investment Company Act of 1940 because the Fund’s holding represented 5% or more of the company’s voting securities during the period, are shown below: |
| | | | | | | | | | | | | | | | | | | | | | | | | | | | |
ISSUER | | SHARES/PRINCIPAL
SEPTEMBER 30,
2013 | | | GROSS
ADDITIONS | | | GROSS
REDUCTIONS | | | SHARES/PRINCIPAL
MARCH
31, 2014 | | | MARKET VALUE
MARCH 31, 2014 | | | INVESTMENT
INCOME | | | REALIZED
GAIN (LOSS) | |
Apollo Investment Corp. | | | 13,316,000 | | | | — | | | | 816,000 | | | | 12,500,000 | | | $ | 103,875,000 | | | $ | 5,163,200 | | | $ | (2,465,737 | ) |
Dynex Capital, Inc. | | | 4,562,000 | | | | 500,000 | | | | — | | | | 5,062,000 | | | | 45,304,900 | | | | 2,598,480 | | | | — | |
Invesco Mortgage Capital, Inc. | | | 9,970,000 | | | | — | | | | 550,000 | | | | 9,420,000 | | | | 155,147,400 | | | | 9,695,000 | | | | (4,181,369 | ) |
KKR Financial Holdings, LLC | | | 12,530,000 | | | | — | | | | 830,000 | | | | 11,700,000 | | | | 135,369,000 | | | | 5,330,600 | | | | (3,407,077 | ) |
MFA Financial, Inc. | | | 23,250,000 | | | | 2,250,000 | | | | — | | | | 25,500,000 | | | | 197,625,000 | | | | 15,315,000 | | | | — | |
Och-Ziff Capital Management Group, LLC* | | | 7,835,000 | | | | | | | | | | | | | | | | | | | | | | | | | |
Solar Capital Ltd. | | | 4,607,900 | | | | — | | | | — | | | | 4,607,900 | | | | 100,360,062 | | | | 3,686,320 | | | | — | |
Washington REIT | | | 5,170,000 | | | | 551,000 | | | | — | | | | 5,721,000 | | | | 136,617,480 | | | | 1,782,600 | | | | — | |
| | | | | | | | | | | | | | | | | | | | | | | | | | | | |
Total non-controlled affiliated issuers - 5.03% of net assets | | | | | | | | | | | | | | | | | | $ | 874,298,842 | | | $ | 43,571,200 | | | $ | (10,054,183 | ) |
| | | | | | | | | | | | | | | | | | | | | | | | | | | | |
*Issuer not affiliated at March 31, 2014. | | | | | | | | | | | | | | | | | | | | | |
22 Certified Semi-Annual Report
| | |
| Schedule of Investments, continued | | |
| |
Thornburg Investment Income Builder Fund | | March 31, 2014 (Unaudited) |
| c | Securities exempt from registration under Rule 144A of the Securities Act of 1933, as amended. These securities may only be resold in the ordinary course of business in transactions exempt from registration, normally to qualified institutional buyers. As of March 31, 2014, the aggregate value of these securities in the Fund’s portfolio was $563,496,039, representing 3.24% of the Fund’s net assets. |
| d | Security currently fair valued by the Valuation and Pricing Committee using procedures approved by the Trustees. |
| e | Yankee Bond - Denominated in U.S. dollars and is issued in the U.S. by foreign banks and corporations. |
Portfolio Abbreviations
To simplify the listings of securities, abbreviations are used per the table below:
| | |
| ADR | | American Depository Receipt |
| ARM | | Adjustable Rate Mortgage |
| AUD | | Denominated in Australian Dollars |
| BRL | | Denominated in Brazilian Real |
| CAD | | Denominated in Canadian Dollars |
| CMO | | Collateralized Mortgage Obligation |
| EUR | | Denominated in Euros |
| FCB | | Farm Credit Bank |
| GBP | | Denominated in Great Britain Pounds |
| GDR | | Global Depository Receipt |
| MFA | | Mortgage Finance Authority |
| Mtg | | Mortgage |
| Pfd | | Preferred Stock |
| REIT | | Real Estate Investment Trust |
See notes to financial statements.
Certified Semi-Annual Report 23
| | |
| Statement of Assets and Liabilities | | |
| |
Thornburg Investment Income Builder Fund | | March 31, 2014 (Unaudited) |
| | | | |
ASSETS | | | | |
Investments at value | | | | |
Non-affiliated issuers (cost $13,862,301,688) (Note 2) | | $ | 16,350,201,546 | |
Non-controlled affiliated issuers (cost $848,196,981) (Note 2) | | | 874,298,842 | |
Cash | | | 5,774,704 | |
Cash denominated in foreign currency (cost $4,896,931) | | | 4,905,439 | |
Receivable for investments sold | | | 79,657,764 | |
Receivable for fund shares sold | | | 44,815,404 | |
Unrealized appreciation on forward currency contracts (Note 7) | | | 5,839,388 | |
Dividends receivable | | | 89,988,063 | |
Dividend and interest reclaim receivable | | | 24,219,890 | |
Interest receivable | | | 27,951,255 | |
Prepaid expenses and other assets | | | 152,426 | |
| | | | |
Total Assets | | | 17,507,804,721 | |
| | | | |
| |
LIABILITIES | | | | |
Payable for investments purchased | | | 36,318,390 | |
Payable for fund shares redeemed | | | 19,043,707 | |
Unrealized depreciation on forward currency contracts (Note 7) | | | 37,415,051 | |
Payable to investment advisor and other affiliates (Note 3) | | | 17,197,776 | |
Accounts payable and accrued expenses | | | 3,928,129 | |
Dividends payable | | | 11,963,749 | |
| | | | |
Total Liabilities | | | 125,866,802 | |
| | | | |
| |
NET ASSETS | | $ | 17,381,937,919 | |
| | | | |
NET ASSETS CONSIST OF | | | | |
Undistributed net investment income | | $ | 128,718,422 | |
Net unrealized appreciation on investments | | | 2,483,503,852 | |
Accumulated net realized gain (loss) | | | (1,001,577,777 | ) |
Net capital paid in on shares of beneficial interest | | | 15,771,293,422 | |
| | | | |
| | $ | 17,381,937,919 | |
| | | | |
24 Certified Semi-Annual Report
| | |
| Statement of Assets and Liabilities, Continued |
| |
Thornburg Investment Income Builder Fund | | March 31, 2014 (Unaudited) |
| | | | |
NET ASSET VALUE | | | | |
Class A Shares: | | | | |
Net asset value and redemption price per share
($4,826,647,588 applicable to 226,510,328 shares of beneficial interest outstanding - Note 4) | | $ | 21.31 | |
| |
Maximum sales charge, 4.50% of offering price | | | 1.00 | |
| | | | |
| |
Maximum offering price per share | | $ | 22.31 | |
| | | | |
| |
Class C Shares: | | | | |
Net asset value and offering price per share*
($5,934,501,322 applicable to 278,594,428 shares of beneficial interest outstanding - Note 4) | | $ | 21.30 | |
| | | | |
| |
Class I Shares: | | | | |
Net asset value, offering and redemption price per share
($6,472,601,813 applicable to 301,635,862 shares of beneficial interest outstanding - Note 4) | | $ | 21.46 | |
| | | | |
| |
Class R3 Shares: | | | | |
Net asset value, offering and redemption price per share
($73,743,924 applicable to 3,461,620 shares of beneficial interest outstanding - Note 4) | | $ | 21.30 | |
| | | | |
| |
Class R4 Shares: | | | | |
Net asset value, offering and redemption price per share
($30,641,967 applicable to 1,435,419 shares of beneficial interest outstanding - Note 4) | | $ | 21.35 | |
| | | | |
| |
Class R5 Shares: | | | | |
Net asset value, offering and redemption price per share
($43,801,305 applicable to 2,042,431 shares of beneficial interest outstanding - Note 4) | | $ | 21.45 | |
| | | | |
| * | Redemption price per share is equal to net asset value less any applicable contingent deferred sales charge. |
See notes to financial statements.
Certified Semi-Annual Report 25
| | |
| Statement of Operations | | |
| |
Thornburg Investment Income Builder Fund | | Six Months Ended March 31, 2014 (Unaudited) |
| | | | |
INVESTMENT INCOME | | | | |
Dividend income | | | | |
Non-affiliated issuers (net of foreign taxes withheld of $22,859,036) | | $ | 482,829,670 | |
Non-controlled affiliated issuers | | | 43,139,294 | |
Interest income (net of premium amortized of $1,354,628) | | | 58,303,222 | |
| | | | |
Total Income | | | 584,272,186 | |
| | | | |
| |
EXPENSES | | | | |
Investment advisory fees (Note 3) | | | 55,788,837 | |
Administration fees (Note 3) | | | | |
Class A Shares | | | 2,832,273 | |
Class C Shares | | | 3,444,258 | |
Class I Shares | | | 1,495,343 | |
Class R3 Shares | | | 41,730 | |
Class R4 Shares | | | 17,592 | |
Class R5 Shares | | | 10,484 | |
Distribution and service fees (Note 3) | | | | |
Class A Shares | | | 5,679,085 | |
Class C Shares | | | 27,628,376 | |
Class R3 Shares | | | 167,309 | |
Class R4 Shares | | | 34,916 | |
Transfer agent fees | | | | |
Class A Shares | | | 1,349,200 | |
Class C Shares | | | 1,776,050 | |
Class I Shares | | | 1,578,875 | |
Class R3 Shares | | | 50,170 | |
Class R4 Shares | | | 25,130 | |
Class R5 Shares | | | 46,757 | |
Registration and filing fees | | | | |
Class A Shares | | | 60,023 | |
Class C Shares | | | 45,701 | |
Class I Shares | | | 52,560 | |
Class R3 Shares | | | 1,820 | |
Class R4 Shares | | | 6,711 | |
Class R5 Shares | | | 10,850 | |
Custodian fees (Note 3) | | | 1,434,897 | |
Professional fees | | | 113,390 | |
Accounting fees | | | 200,900 | |
Trustee fees | | | 230,800 | |
Other expenses | | | 778,996 | |
| | | | |
Total Expenses | | | 104,903,033 | |
Less: | | | | |
Expenses reimbursed by investment advisor (Note 3) | | | (528,025 | ) |
Fees paid indirectly (Note 3) | | | (2,397 | ) |
| | | | |
Net Expenses | | | 104,372,611 | |
| | | | |
Net Investment Income | | $ | 479,899,575 | |
| | | | |
26 Certified Semi-Annual Report
| | |
| Statement of Operations, Continued | | |
| |
Thornburg Investment Income Builder Fund | | Six Months Ended March 31, 2014 (Unaudited) |
| | | | |
REALIZED AND UNREALIZED GAIN (LOSS) | | | | |
Net realized gain (loss) from: | | | | |
Investments | | | | |
Non-affiliated issuers | | $ | 132,069,173 | |
Non-controlled affiliated issuers | | | (10,054,183 | ) |
Forward currency contracts (Note 7) | | | (82,449,296 | ) |
Foreign currency transactions | | | (1,400,773 | ) |
| | | | |
| | | 38,164,921 | |
| | | | |
| |
Net change in unrealized appreciation (depreciation) on: | | | | |
Investments | | | | |
Non-affiliated issuers | | | 702,646,543 | |
Non-controlled affiliated issuers | | | 33,260,232 | |
Foreign currency translations | | | 1,064,240 | |
Forward currency contracts (Note 7) | | | 21,909,634 | |
| | | | |
| | | 758,880,649 | |
| | | | |
Net Realized and Unrealized Gain | | | 797,045,570 | |
| | | | |
Net Increase in Net Assets Resulting from Operations | | $ | 1,276,945,145 | |
| | | | |
See notes to financial statements.
Certified Semi-Annual Report 27
| | |
| Statements of Changes in Net Assets | | |
| |
Thornburg Investment Income Builder Fund | | |
| | | | | | | | |
| | | SIX MONTHS ENDED
MARCH 31, 2014* | | | YEAR ENDED
SEPTEMBER 30, 2013 | |
INCREASE (DECREASE) IN NET ASSETS FROM | | | | | | | | |
| | |
OPERATIONS | | | | | | | | |
Net investment income | | $ | 479,899,575 | | | $ | 667,325,892 | |
Net realized gain (loss) on investments, forward currency contracts, and foreign currency transactions | | | 38,164,921 | | | | (32,591,869 | ) |
Net unrealized appreciation (depreciation) on investments, forward currency contracts, and foreign currency translations | | | 758,880,649 | | | | 849,681,070 | |
| | | | | | | | |
| | |
Net Increase (Decrease) in Net Assets Resulting from Operations | | | 1,276,945,145 | | | | 1,484,415,093 | |
| | |
DIVIDENDS TO SHAREHOLDERS | | | | | | | | |
From net investment income | | | | | | | | |
Class A Shares | | | (103,299,629 | ) | | | (205,343,348 | ) |
Class C Shares | | | (106,142,607 | ) | | | (213,857,190 | ) |
Class I Shares | | | (146,007,442 | ) | | | (265,016,275 | ) |
Class R3 Shares | | | (1,420,532 | ) | | | (2,752,237 | ) |
Class R4 Shares | | | (621,864 | ) | | | (1,115,335 | ) |
Class R5 Shares | | | (991,285 | ) | | | (1,318,893 | ) |
| | |
FUND SHARE TRANSACTIONS (NOTE 4) | | | | | | | | |
Class A Shares | | | 288,035,668 | | | | 629,134,038 | |
Class C Shares | | | 460,697,695 | | | | 831,493,667 | |
Class I Shares | | | 564,989,205 | | | | 1,305,774,533 | |
Class R3 Shares | | | 8,595,891 | | | | 10,859,379 | |
Class R4 Shares | | | 4,142,438 | | | | 4,113,121 | |
Class R5 Shares | | | 1,406,791 | | | | 23,739,677 | |
| | | | | | | | |
Net Increase in Net Assets | | | 2,246,329,474 | | | | 3,600,126,230 | |
| | |
NET ASSETS | | | | | | | | |
Beginning of Period | | | 15,135,608,445 | | | | 11,535,482,215 | |
| | | | | | | | |
| | |
End of Period | | $ | 17,381,937,919 | | | $ | 15,135,608,445 | |
| | | | | | | | |
| | |
Undistributed net investment income | | $ | 128,718,422 | | | $ | 22,151,818 | |
See notes to financial statements.
28 Certified Semi-Annual Report
| | |
| Notes to Financial Statements | | |
| |
Thornburg Investment Income Builder Fund | | March 31, 2014 (Unaudited) |
NOTE 1 – ORGANIZATION
Thornburg Investment Income Builder Fund (the “Fund”) is a diversified series of Thornburg Investment Trust (the “Trust”). The Trust was organized as a Massachusetts business trust under a Declaration of Trust dated June 3, 1987 and is registered as a diversified, open-end management investment company under the Investment Company Act of 1940, as amended. The Fund is currently one of eighteen separate series of the Trust. Each series is considered to be a separate entity for financial reporting and tax purposes and bears expenses directly attributable to it. The Fund’s primary investment goal is to provide a level of current income which exceeds the average yield on U.S. stocks generally, and which will generally grow, subject to periodic fluctuations, over the years on a per share basis. The Fund’s secondary investment goal is long-term capital appreciation.
The Fund currently offers six classes of shares of beneficial interest: Class A, Class C, Institutional Class (“Class I”), and Retirement Classes (“Class R3,” “Class R4,” and “Class R5”). Each class of shares of the Fund represents an interest in the same portfolio of investments, except that (i) Class A shares are sold subject to a front-end sales charge collected at the time the shares are purchased and bear a service fee, (ii) Class C shares are sold at net asset value without a sales charge at the time of purchase, but are subject to a contingent deferred sales charge upon redemption within one year of purchase, and bear both a service fee and a distribution fee, (iii) Class I shares are sold at net asset value without a sales charge at the time of purchase and may be subject to a service fee, (iv) Class R3 shares are sold at net asset value without a sales charge at the time of purchase, but bear both a service fee and distribution fee, (v) Class R4 shares are sold at net asset value without sales charge at the time of purchase, but bear a service fee, (vi) Class R5 shares are sold at net asset value without a sales charge at the time of purchase, and (vii) the respective classes may have different reinvestment privileges and conversion rights. Additionally, the Fund may allocate among its classes certain expenses, to the extent allowable to specific classes, including transfer agent fees, government registration fees, certain printing and postage costs, and administrative and legal expenses. Currently, class specific expenses of the Fund are limited to service and distribution fees, administration fees, and certain registration and transfer agent expenses.
NOTE 2 – SIGNIFICANT ACCOUNTING POLICIES
Significant accounting policies of the Trust are as follows:
Valuation Policy and Procedures: The Fund’s Trustees of the Trust (the “Trustees”) have authorized employees of the Fund’s investment advisor, acting as the Valuation and Pricing Committee (the “Committee”), to make certain valuation determinations, subject to oversight and review by the Trustees and the Audit Committee of the Trustees. The Committee and other employees of the Fund’s investment advisor administer and implement the valuation process. The Committee regularly reviews its own fair value decisions, as well as valuations, valuation techniques and services furnished by pricing services, considers circumstances in the markets which may require valuation determinations by the Committee and reviews previous valuation determinations. The Committee also reports on its activities, the performance of the pricing services and other matters to the Trustees and the Audit Committee of the Trustees.
In determining a fair value for a portfolio investment, the Committee seeks to determine the price that the Fund would reasonably expect to receive upon a sale of the investment in an orderly transaction between market participants at the measurement date. Typically, the fair value process employs standing instructions to use quoted prices in active markets or the use of independent pricing services. Less frequently, the Committee may make a fair value determination using other methods. However, because fair value prices are estimated prices, the determination of fair value for an investment may differ from the value that would be realized by the Fund upon a sale of the investment, and that difference could be material to the Fund’s financial statements. The Committee’s determination of fair value for an investment may also differ from the prices obtained by other persons (including other mutual funds) for the investment.
Valuation of Investments: Portfolio investments listed or traded on a national securities exchange are valued on the valuation date at the last reported trade price on the exchange that is the primary market for the investment. Portfolio investments traded on an exchange for which there has been no trade that day and other equity investments traded in the over-the-counter market are valued at the mean between the last reported bid and ask prices. Portfolio investments reported by NASDAQ are valued at the NASDAQ official closing price. Any foreign investment traded on exchanges outside the United States is valued at the price of the investment on the exchange that is normally the investment’s primary market, as of the close of that exchange preceding the time of the Fund’s valuation measurement date.
In any case when the market value of an equity investment held by the Fund is not readily available, a determination of a fair value for the investment is made by the Committee. The Committee’s determinations are made using procedures in accordance with a policy approved by the Trustees, which may include the use of a price obtained from an independent pricing service. The pricing service ordinarily values equity investments in these instances using multi-factor models to adjust market prices based upon various inputs, including exchange data, depository receipt prices, futures, index data and other data. An investment’s market value is deemed not readily available whenever the exchange or market on which the investment is primarily traded is closed for the entire scheduled day of trading. Additionally, an investment’s market value may be deemed not readily available under other circumstances identified by the Trustees, including when developments occurring after the most recent close of the investment’s primary exchange or market, but before the most recent close of trading in Fund shares, or an unusual event or significant period of time occurring since the availability of a market
Certified Semi-Annual Report 29
| | |
| Notes to Financial Statements, Continued | | |
| |
Thornburg Investment Income Builder Fund | | March 31, 2014 (Unaudited) |
quotation, create a question about the reliability of the investment’s market value. On days when market volatility thresholds pre-determined by the Trustees are exceeded, foreign equity investments held by the Fund may be valued using synthetic pricing obtained from an independent pricing service approved by the Trustees, subject to the ability of the Committee to determine in any such instance to utilize market closing prices if the Committee considers closing prices to be more reliable.
Debt obligations held by the Fund have a primary over-the-counter market and are valued by an independent pricing service approved by the Trustees. The pricing service ordinarily values debt obligations at quoted bid prices. When quotations are not available, debt obligations held by the Fund are valued at evaluated prices determined by the pricing service using methods which include consideration of yields or prices of debt obligations of comparable quality, type of issue, coupon, maturity and rating, and indications as to value from dealers and general market conditions. Short-term obligations having remaining maturities of 60 days or less are ordinarily valued at amortized cost, which approximates market value.
In any case when a pricing service fails to provide a price for a debt obligation held by the Fund, the Committee determines a fair value for the debt obligation using procedures in accordance with a policy approved by the Trustees, which may include the use of a price obtained from a different independent pricing service. Additionally, in any case when management believes that a price provided by a pricing service for a debt obligation held by the Fund may be unreliable, the Committee decides whether or not to use the pricing service’s valuation or to use an alternative method to determine a fair value for the debt obligation.
Quotations in foreign currencies for foreign portfolio investments are converted to U.S. dollar equivalents using the foreign exchange quotation in effect at the time of valuation.
Valuation Measurements: The Fund categorizes its investments based upon the inputs used in valuing those investments, according to a three-level hierarchy established by guidance from the Financial Accounting Standards Board (the “FASB”). Categorization of investments using this hierarchy is intended by the FASB to maximize the use of observable inputs and minimize the use of unobservable inputs by prioritizing that the most observable input be used when available. Observable inputs are those that market participants would use in valuing an investment based on available market data. Unobservable inputs are those that reflect assumptions about the information market participants would use in valuing an investment. An investment’s level within the hierarchy is based on the lowest level input that is deemed significant to the fair value measurement. The methodologies and relative inputs used to value investments are not necessarily indications of the risk or liquidity associated with investing in those investments.
Various inputs are used in determining the fair value measurement of the Fund’s investments. These inputs are generally summarized according to the three-level hierarchy below:
Level 1: Quoted prices in active markets for identical investments.
Level 2: Other direct or indirect significant observable inputs (including quoted prices for similar investments in active markets and other observable inputs, such as interest rates, prepayment rates, credit risk, etc.).
When market volatility thresholds are exceeded, foreign equity investments may be fair valued according to other significant observable inputs rather than quoted market prices. The affected investments will be characterized as Level 2 within the valuation hierarchy and revert to Level 1 after the threshold is no longer exceeded.
Level 3: Significant unobservable inputs, (including the Committee’s own assumptions in determining the fair value of investments), are generally applicable to investments fair valued with single broker quotes and other investments.
Portfolio investments with minimal, if any, market activity are characterized as Level 3 and are valued using significant unobservable inputs, typically including single broker quotes, which may be adjusted or unadjusted, related or comparable investments, last available transactions, and other relevant information. Valuations may also be based upon current market prices of securities that are comparable in coupon, rating, maturity and industry. An income based valuation approach would consider discounted anticipated future cash flows of the investment. Discounts may also be applied due to the nature or duration of any restrictions on the disposition of the investment. The derived value of a Level 3 investment may not represent the value which is received upon disposition.
30 Certified Semi-Annual Report
| | |
| Notes to Financial Statements, Continued | | |
| |
Thornburg Investment Income Builder Fund | | March 31, 2014 (Unaudited) |
The following table displays a summary of the fair value hierarchy measurements of the Fund’s investments as of March 31, 2014. In any instance when valuation inputs from more than one level are used to determine the fair value of a specific investment, the investment is placed in the level of the table based upon the lowest level input that is significant in determining the fair value of the investment:
| | | | | | | | | | | | | | | | |
| | | FAIR VALUE MEASUREMENTS AT MARCH 31, 2014 | |
| | | TOTAL | | | LEVEL 1 | | | LEVEL 2 | | | LEVEL 3(b) | |
Assets | | | | | | | | | | | | | | | | |
Investments in Securities* | | | | | | | | | | | | | | | | |
Common Stock | | $ | 15,463,625,571 | | | $ | 15,463,625,571 | | | $ | — | | | $ | — | |
Preferred Stock(a) | | | 147,807,872 | | | | 66,645,334 | | | | 81,162,538 | | | | — | |
Asset Backed Securities | | | 79,327,589 | | | | — | | | | 75,874,730 | | | | 3,452,859 | |
Corporate Bonds | | | 1,018,214,142 | | | | — | | | | 1,009,748,774 | | | | 8,465,368 | |
Convertible Bonds | | | 8,348,875 | | | | — | | | | 8,348,875 | | | | — | |
Warrants | | | 16,160 | | | | — | | | | 16,160 | | | | — | |
Municipal Bonds | | | 3,174,744 | | | | — | | | | 3,174,744 | | | | — | |
U.S. Government Agencies | | | 8,629,578 | | | | — | | | | 8,629,578 | | | | — | |
Foreign Bonds | | | 248,962,988 | | | | — | | | | 236,273,380 | | | | 12,689,608 | |
Other Securities | | | 101,392,942 | | | | — | | | | 60,079,489 | | | | 41,313,453 | |
Short Term Investments | | | 144,999,927 | | | | — | | | | 144,999,927 | | | | — | |
| | | | | | | | | | | | | | | | |
Total Investments in Securities | | $ | 17,224,500,388 | | | $ | 15,530,270,905 | | | $ | 1,628,308,195 | | | $ | 65,921,288 | |
| | | | |
Other Financial Instruments** | | | | | | | | | | | | | | | | |
Forward Currency Contracts | | $ | 5,839,388 | | | $ | — | | | $ | 5,839,388 | | | $ | — | |
| | | | |
Liabilities | | | | | | | | | | | | | | | | |
Other Financial Instruments** | | | | | | | | | | | | | | | | |
Forward Currency Contracts | | $ | (37,415,051 | ) | | $ | — | | | $ | (37,415,051 | ) | | $ | — | |
Spot Currency | | $ | (101,676 | ) | | $ | (101,676 | ) | | $ | — | | | $ | — | |
| (a) | At March 31, 2014, industry classifications for Preferred Stock in Level 2 consist of $8,283,750 in Banks, $19,500,000 in Energy, $24,157,850 in Insurance, $10,892,813 in Miscellaneous, and $18,328,125 in Telecommunication Services. |
| (b) | In accordance with the guidance prescribed in Accounting Standards Update No. 2011-04 (“ASU No. 2011-04”), unadjusted broker quotes were applied to portfolio securities characterized as Level 3 investments at March 31, 2014. A portfolio security characterized as a Level 3 investment representing $2,115,469 market value in Foreign Bonds was fair valued by the Committee based upon an income approach given anticipated cash flows, current market prices/yields of comparable securities and may have included an illiquid market adjustment. |
| * | See Schedule of Investments for a summary of the industry exposure as grouped according to the Global Industry Classification Standard (GICS), which is an industry taxonomy developed by MSCI, Inc. and Standard & Poor’s (S&P). |
| ** | Other Financial Instruments include investments not reflected in the Schedule of Investments, which may include futures, forwards and swap contracts, which are valued at the unrealized appreciation (depreciation) on the investment. |
In accordance with the guidance prescribed in ASU No. 2011-04, it is the policy of the Fund to recognize transfers between levels and those underlying events which caused the movement. The Fund recognized no significant transfers between Levels 1 and 2 for the six months ended March 31, 2014, other than when the Fund exceeded market volatility thresholds for foreign equity investments during the period.
A rollforward of fair value measurements using significant unobservable inputs (Level 3) for the six months ended March 31, 2014 is as follows:
| | | | | | | | | | | | | | | | | | | | | | | | |
| | | PREFERRED
STOCK | | | ASSET BACKED
SECURITIES | | | CORPORATE
BONDS | | | FOREIGN
BONDS | | | OTHER
SECURITIES | | | TOTAL(d) | |
Beginning Balance 9/30/2013 | | $ | 33,950,000 | | | $ | 7,162,750 | | | $ | 8,596,378 | | | $ | 12,411,625 | | | $ | 41,251,578 | | | $ | 103,372,331 | |
Accrued Discounts (Premiums) | | | — | | | | 11,969 | | | | 24,041 | | | | 72,596 | | | | — | | | | 108,606 | |
Net Realized Gain (Loss)(a) | | | 1,103,550 | | | | 38,857 | | | | 4,286 | | | | — | | | | — | | | | 1,146,693 | |
Gross Purchases | | | — | | | | — | | | | — | | | | — | | | | — | | | | — | |
Gross Sales | | | (35,000,000 | ) | | | (262,500 | ) | | | (118,027 | ) | | | — | | | | (91,030 | ) | | | (35,471,557 | ) |
Net Change in Unrealized | | | | | | | | | | | | | | | | | | | | | | | | |
Appreciation (Depreciation)(b) | | | (53,550 | ) | | | 1,783 | | | | (41,310 | ) | | | 205,387 | | | | 152,905 | | | | 265,215 | |
Transfers into Level 3(c) | | | — | | | | — | | | | — | | | | — | | | | — | | | | — | |
Transfers out of Level 3(c) | | | — | | | | (3,500,000 | ) | | | — | | | | — | | | | — | | | | (3,500,000 | ) |
| | | | | | | | | | | | | | | | | | | | | | | | |
Ending Balance 3/31/2014 | | $ | — | | | $ | 3,452,859 | | | $ | 8,465,368 | | | $ | 12,689,608 | | | $ | 41,313,453 | | | $ | 65,921,288 | |
| | | | | | | | | | | | | | | | | | | | | | | | |
Certified Semi-Annual Report 31
| | |
| Notes to Financial Statements, Continued | | |
| |
Thornburg Investment Income Builder Fund | | March 31, 2014 (Unaudited) |
| (a) | Amount of Net Realized Gain (Loss) recognized in the net increase in net assets resulting from operations is included in the Fund’s Statement of Operations for the six months ended March 31, 2014. |
| (b) | Amount of Net Change in Unrealized Appreciation (Depreciation) recognized in the net increase in net assets resulting from operations is included in the Fund’s Statement of Operations for the six months ended March 31, 2014. |
| (c) | Transfers into or out of Level 3 were out of or into Level 2, and were due to changes in other significant observable inputs available during the six months ended March 31, 2014. Transfers into or out of Level 3 are based on the beginning market value of the period in which they occurred. |
| (d) | Level 3 investments represent 0.38% of total Net Assets at March 31, 2014. Significant fluctuations of the unobservable inputs applied to portfolio investments characterized as Level 3 could be expected to increase or decrease the fair value of these portfolio investments. |
Foreign Currency Translation: Portfolio investments and other assets and liabilities denominated in foreign currencies are translated into U.S. dollars based on the exchange rate of such currencies against the U.S. dollar on the date of valuation. Purchases and sales of investments and income items denominated in foreign currencies are translated into U.S. dollars at the exchange rate in effect on the transaction date. When the Fund purchases or sells foreign investments, it will customarily enter into a foreign exchange contract to minimize foreign exchange risk from the trade date to the settlement date of such transactions. The values of such spot contracts are included in receivable for investments sold and payable for investments purchased on the Statement of Assets and Liabilities.
The Fund does not separately report the effect of changes in foreign exchange rates from changes in market prices on investments held. Such changes are included in net unrealized appreciation or depreciation from investments.
Reported net realized gains or losses from foreign currency transactions arise due to purchases and sales of foreign currencies, currency gains or losses realized between the trade and settlement dates on investment transactions and the difference between the amounts of dividends, interest, and foreign withholding taxes recorded on the Fund’s books, and the U.S. dollar equivalent of the amounts actually received or paid.
Net change in unrealized appreciation and depreciation on foreign currency translations arise from changes in the fair value of assets and liabilities, other than investments at fiscal period end, resulting from changes in exchange rates.
Deferred Taxes: The Fund is subject to a tax imposed on net realized gains of securities of certain foreign countries. The Fund records an estimated deferred tax liability for net unrealized gains on these investments as reflected in the accompanying financial statements.
Federal Income Taxes: It is the policy of the Trust to comply with the provisions of the Internal Revenue Code applicable to “regulated investment companies” and to distribute to shareholders substantially all taxable income, including any net realized gain on investments of the Fund. Therefore, no provision for federal income taxes is required.
Management reviews each uncertain tax position believed to be material to the preparation of the Fund’s financial statements, to assess if it is more likely than not that the position would be sustained upon examination, based upon the technical merits of the position. As of March 31, 2014, management has not identified any such position for which an asset or liability must be reflected in the Statement of Assets and Liabilities. The Fund’s tax returns remain subject to examination for three years after filing.
When-Issued and Delayed Delivery Transactions: The Fund may engage in when-issued or delayed delivery transactions. To the extent the Fund engages in such transactions, it will do so for the purpose of acquiring portfolio investments consistent with the Fund’s investment objectives and not for the purpose of investment leverage or to speculate on interest rate and/or market changes. At the time the Fund makes a commitment to purchase an investment on a when-issued or delayed delivery basis, the Fund will record the transaction and reflect the value in determining its net asset value. When effecting such transactions, assets of an amount sufficient to make payment for the portfolio investments to be purchased will be segregated on the Fund’s records on the trade date. Investments purchased on a when-issued or delayed delivery basis do not earn interest until the settlement date.
Dividends: Net investment income of the Fund is declared daily as a dividend on shares for which the Fund has received payment. Dividends are paid quarterly and are reinvested in additional shares of the Fund at net asset value per share at the close of business on the dividend payment date, or at the shareholder’s option, paid in cash. Net realized capital gains, to the extent available, will be distributed at least annually. Distributions to shareholders are based on income tax regulations and therefore, their characteristics may differ for financial statement and tax purposes.
Repurchase Agreements: The Fund may invest excess cash in repurchase agreements whereby the Fund purchases investments, which serve as collateral, with an agreement to resell such collateral to the seller at an agreed upon price at the maturity date of the repurchase agreement. Investments pledged as collateral for repurchase agreements are held in custody until maturity of the repurchase agreement. Provisions in the agreements require that the market value of the collateral is at least equal to the repurchase value in the event of default. In the event of default, the Fund has the right to liquidate the collateral and apply the proceeds in satisfaction of the obligation. Under certain circumstances, in the event of default or bankruptcy by the other party to the agreement, realization and/or retention of the collateral may be subject to legal proceedings.
General: Investment transactions are accounted for on a trade date basis. Interest income is accrued as earned and dividend income is recorded on the ex-dividend date. Certain income from foreign investments is recognized as soon as information is available to the
32 Certified Semi-Annual Report
| | |
| Notes to Financial Statements, Continued | | |
| |
Thornburg Investment Income Builder Fund | | March 31, 2014 (Unaudited) |
Fund. Realized gains and losses from the sale of investments are recorded on an identified cost basis. Net investment income (other than class specific expenses) and realized and unrealized gains and losses are allocated daily to each class of shares based upon the relative net asset value of outstanding shares of each class of shares at the beginning of the day (after adjusting for the current share activity of the respective class). Expenses common to all Funds are allocated among the Funds comprising the Trust based upon their relative net asset values or other appropriate allocation methods.
Guarantees and Indemnifications: Under the Trust’s organizational documents (and under separate agreements with the independent Trustees), its officers and Trustees are indemnified against certain liabilities arising out of the performance of their duties to the Fund. Additionally, in the normal course of business the Trust enters into contracts with service providers that contain general indemnification clauses. The Trust’s maximum exposure under these arrangements is unknown. However, based on experience, the Trust expects the risk of loss to be remote.
Use of Estimates: The preparation of financial statements, in conformity with United States generally accepted accounting principles, requires management to make estimates and assumptions that affect the reported amounts of assets and liabilities and the disclosure of contingent assets and liabilities at the date of the financial statements and the reported amounts of increases and decreases in net assets from operations during the reporting period. Actual amounts could differ from those estimates.
NOTE 3 – INVESTMENT ADVISORY FEE AND OTHER TRANSACTIONS WITH AFFILIATES
Pursuant to an investment advisory agreement, Thornburg Investment Management, Inc. (the “Advisor”) serves as the investment advisor and performs services to the Fund for which the fees are payable at the end of each month. For the six months ended March 31, 2014, these fees were payable at annual rates ranging from .875 of 1% to .675 of 1% per annum of the average daily net assets of the Fund depending on the Fund’s asset size. The Trust also has entered into administrative services agreements with the Advisor, whereby the Advisor will perform certain administrative services for the shareholders of each class of the Fund’s shares, and for which fees will be payable at an annual rate of up to .125 of 1% per annum of the average daily net assets attributable to each class of shares.
The Trust has an underwriting agreement with Thornburg Securities Corporation (the “Distributor,” an affiliate of the Advisor), which acts as the distributor of the Fund’s shares. For the six months ended March 31, 2014, the Distributor has advised the Fund that it earned commissions aggregating $1,097,178 from the sale of Class A shares, and collected contingent deferred sales charges aggregating $236,735 from redemptions of Class C shares of the Fund.
Pursuant to a service plan under Rule 12b-1 of the Investment Company Act of 1940, the Fund may reimburse to the Advisor an amount not to exceed .25 of 1% per annum of the average daily net assets attributable to each class of shares of the Fund for payments made by the Advisor to securities dealers and other financial institutions to obtain various shareholder and distribution related services. For the six months ended March 31, 2014, there were no 12b-1 service plan fees charged for Class I and R5 shares. The Advisor may pay out of its own resources additional expenses for distribution of the Fund’s shares.
The Trust has also adopted distribution plans pursuant to Rule 12b-1, applicable only to the Fund’s Class C and Class R3 shares, under which the Fund compensates the Distributor for services in promoting the sale of Class C and Class R3 shares of the Fund at an annual rate of up to .75 of 1% per annum of the average daily net assets attributable to Class C shares, and an annual rate of up to .25 of 1% per annum of the average daily net assets attributable to Class R3 shares. Total fees incurred by each class of shares of the Fund under their respective service and distribution plans for the six months ended March 31, 2014, are set forth in the Statement of Operations.
The Advisor and Distributor have contractually agreed to waive fees and reimburse expenses incurred by the Fund so that actual expenses of certain share classes do not exceed specified levels. The agreement may be terminated by the Fund at any time, but may not be terminated by the Advisor or Distributor before February 1, 2015, unless the Advisor ceases to be the investment advisor to the Fund or the Distributor ceases to be the distributor of the Fund prior to that date. The Advisor and Distributor retain the right to be repaid by the Fund for fee waivers and expense reimbursements if expenses fall below the contractual limit prior to the end of the fiscal year.
For the six months ended March 31, 2014, the Advisor contractually reimbursed certain class specific expenses, administrative fees, and distribution fees of $505,676 for Class C shares, $7,712 for Class R3 shares, $1,326 for Class R4 shares, and $13,311 for Class R5 shares.
The Trust has an agreement with the custodian bank to indirectly pay a portion of the custodian’s fees through credits earned by the Fund’s cash on deposit with the bank. This deposit agreement is an alternative to overnight investments. Custodial fees are adjusted to reflect amounts that would have been paid without this agreement, with a corresponding adjustment reflected as fees paid indirectly in the Statement of Operations. For the six months ended March 31, 2014, fees paid indirectly were $2,397.
Certain officers and Trustees of the Trust are also officers or directors of the Advisor and Distributor. The compensation of independent Trustees is borne by the Trust.
Certified Semi-Annual Report 33
| | |
| Notes to Financial Statements, Continued | | |
| |
Thornburg Investment Income Builder Fund | | March 31, 2014 (Unaudited) |
NOTE 4 – SHARES OF BENEFICIAL INTEREST
At March 31, 2014, there were an unlimited number of shares of beneficial interest authorized. Transactions in shares of beneficial interest were as follows:
| | | | | | | | | | | | | | | | |
| | | SIX MONTHS ENDED
MARCH 31, 2014 (UNAUDITED) | | | YEAR ENDED
SEPTEMBER 30, 2013 (AUDITED) | |
| | | SHARES | | | AMOUNT | | | SHARES | | | AMOUNT | |
Class A Shares | | | | | | | | | | | | | | | | |
Shares sold | | | 27,136,500 | | | $ | 561,717,537 | | | | 56,970,888 | | | $ | 1,125,365,545 | |
Shares issued to shareholders in reinvestment of dividends | | | 4,534,414 | | | | 94,676,113 | | | | 9,381,689 | | | | 182,426,914 | |
Shares repurchased | | | (17,781,032 | ) | | | (368,357,982 | ) | | | (34,776,902 | ) | | | (678,658,421 | ) |
| | | | | | | | | | | | | | | | |
| | | | |
Net increase (decrease) | | | 13,889,882 | | | $ | 288,035,668 | | | | 31,575,675 | | | $ | 629,134,038 | |
| | | | | | | | | | | | | | | | |
| | | | |
Class C Shares | | | | | | | | | | | | | | | | |
Shares sold | | | 32,135,590 | | | $ | 664,993,623 | | | | 62,020,435 | | | $ | 1,225,172,608 | |
Shares issued to shareholders in reinvestment of dividends | | | 4,223,739 | | | | 88,149,756 | | | | 8,853,712 | | | | 172,055,086 | |
Shares repurchased | | | (14,120,725 | ) | | | (292,445,684 | ) | | | (28,937,060 | ) | | | (565,734,027 | ) |
| | | | | | | | | | | | | | | | |
| | | | |
Net increase (decrease) | | | 22,238,604 | | | $ | 460,697,695 | | | | 41,937,087 | | | $ | 831,493,667 | |
| | | | | | | | | | | | | | | | |
| | | | |
Class I Shares | | | | | | | | | | | | | | | | |
Shares sold | | | 51,711,722 | | | $ | 1,077,976,808 | | | | 105,352,628 | | | $ | 2,095,655,160 | |
Shares issued to shareholders in reinvestment of dividends | | | 5,964,853 | | | | 125,413,175 | | | | 11,370,112 | | | | 222,794,617 | |
Shares repurchased | | | (30,647,523 | ) | | | (638,400,778 | ) | | | (51,415,753 | ) | | | (1,012,675,244 | ) |
| | | | | | | | | | | | | | | | |
| | | | |
Net increase (decrease) | | | 27,029,052 | | | $ | 564,989,205 | | | | 65,306,987 | | | $ | 1,305,774,533 | |
| | | | | | | | | | | | | | | | |
| | | | |
Class R3 Shares | | | | | | | | | | | | | | | | |
Shares sold | | | 690,386 | | | $ | 14,304,180 | | | | 1,295,541 | | | $ | 25,313,825 | |
Shares issued to shareholders in reinvestment of dividends | | | 60,341 | | | | 1,259,803 | | | | 127,777 | | | | 2,482,674 | |
Shares repurchased | | | (335,962 | ) | | | (6,968,092 | ) | | | (865,614 | ) | | | (16,937,120 | ) |
| | | | | | | | | | | | | | | | |
| | | | |
Net increase (decrease) | | | 414,765 | | | $ | 8,595,891 | | | | 557,704 | | | $ | 10,859,379 | |
| | | | | | | | | | | | | | | | |
| | | | |
Class R4 Shares | | | | | | | | | | | | | | | | |
Shares sold | | | 414,138 | | | $ | 8,578,085 | | | | 613,261 | | | $ | 12,094,390 | |
Shares issued to shareholders in reinvestment of dividends | | | 16,715 | | | | 349,693 | | | | 32,911 | | | | 640,829 | |
Shares repurchased | | | (230,201 | ) | | | (4,785,340 | ) | | | (439,983 | ) | | | (8,622,098 | ) |
| | | | | | | | | | | | | | | | |
| | | | |
Net increase (decrease) | | | 200,652 | | | $ | 4,142,438 | | | | 206,189 | | | $ | 4,113,121 | |
| | | | | | | | | | | | | | | | |
| | | | |
Class R5 Shares | | | | | | | | | | | | | | | | |
Shares sold | | | 532,315 | | | $ | 11,055,946 | | | | 1,478,004 | | | $ | 29,474,397 | |
Shares issued to shareholders in reinvestment of dividends | | | 40,121 | | | | 843,236 | | | | 60,502 | | | | 1,187,546 | |
Shares repurchased | | | (503,254 | ) | | | (10,492,391 | ) | | | (349,610 | ) | | | (6,922,266 | ) |
| | | | | | | | | | | | | | | | |
| | | | |
Net increase (decrease) | | | 69,182 | | | $ | 1,406,791 | | | | 1,188,896 | | | $ | 23,739,677 | |
| | | | | | | | | | | | | | | | |
34 Certified Semi-Annual Report
| | |
| Notes to Financial Statements, Continued | | |
| |
Thornburg Investment Income Builder Fund | | March 31, 2014 (Unaudited) |
NOTE 5 – INVESTMENT TRANSACTIONS
For the six months ended March 31, 2014, the Fund had purchase and sale transactions of investments (excluding short-term investments and U. S. Government obligations) of $4,782,792,472 and $3,442,783,008, respectively.
NOTE 6 – INCOME TAXES
At March 31, 2014, information on the tax components of capital was as follows:
| | | | |
Cost of investments for tax purposes | | $ | 14,740,401,217 | |
| | | | |
Gross unrealized appreciation on a tax basis | | $ | 2,946,204,676 | |
Gross unrealized depreciation on a tax basis | | | (462,105,505 | ) |
| | | | |
Net unrealized appreciation (depreciation) on investments (tax basis) | | $ | 2,484,099,171 | |
| | | | |
At March 31, 2014, the Fund had deferred tax basis capital losses occurring subsequent to October 31, 2012 of $55,174,063. For tax purposes, such losses will be reflected in the year ending September 30, 2014.
At March 31, 2014, the Fund had cumulative tax basis capital losses of $263,075,947 (of which $108,948,442 is short-term and $154,127,505 is long-term) generated after September 30, 2011, which may be carried forward to offset future capital gains. To the extent such carryforwards are used, capital gain distributions may be reduced to the extent provided by regulations. Such capital loss carryforwards do not expire, but are required to be utilized to offset future gains prior to the utilization of losses that occurred prior to October 1, 2011, which may expire prior to utilization.
Capital loss carryforwards that occurred prior to October 1, 2011 expire as follows:
| | | | |
2017 | | $ | 229,347,589 | |
2018 | | | 493,662,779 | |
| | | | |
| | $ | 723,010,368 | |
| | | | |
NOTE 7 – DERIVATIVE FINANCIAL INSTRUMENTS WITH OFF-BALANCE SHEET RISK AND FOREIGN INVESTMENT RISK
The Fund may use a variety of derivative financial instruments to hedge or adjust the risks affecting its investment portfolio or to enhance investment returns. Provisions of FASB Accounting Standards Codification 815-10-50 (“ASC 815”), require certain disclosures. The disclosures are intended to provide users of financial statements with an understanding of the use of derivative instruments by the Fund and how these derivatives affect the financial position, financial performance and cash flows of the Fund. The Fund does not designate any derivative instruments as hedging instruments under ASC 815. During the six months ended March 31, 2014, the Fund’s principal exposure to derivative financial instruments of the type addressed by ASC 815 was investment in foreign exchange contracts. A foreign exchange contract is an agreement between two parties to exchange different currencies at a specified rate of exchange at an agreed upon future date. Foreign exchange contracts involve risks to the Fund, including the risk that a contract’s counterparty will not meet its obligations to the Fund, the risk that a change in a contract’s value may not correlate perfectly with the currency the contract was intended to track, and the risk that the advisor is unable to correctly implement its strategy in using a contract. In any such instance, the Fund may not achieve the intended benefit of entering into a contract, and may experience a loss. Additionally, the Fund’s risk of loss may exceed the amounts recognized on the Statement of Assets and Liabilities.
The Fund entered into forward currency contracts during the six months ended March 31, 2014 in the normal course of pursuing its investment objectives, with the objective of reducing the risk to the value of the Fund’s foreign investments from adverse changes in the relationship between the U.S. dollar and foreign currencies. In each case these contracts have been initiated in conjunction with foreign investment transactions.
These contracts are accounted for by the Fund under ASC 815. Unrealized appreciation and depreciation on outstanding contracts are reported in the Fund’s Statement of Assets and Liabilities, as measured by the difference between the forward exchange rates at the reporting date and the forward exchange rates at each contract’s inception date. Net realized gain (loss) on contracts closed during the period, and changes in net unrealized appreciation (depreciation) on outstanding contracts are recognized in the Fund’s Statement of Operations. Values of open sell currency contracts are indicative of the activity for the six months ended March 31, 2014. Open buy currency contracts are entered into for the purpose of closing open sell currency contracts and the values are dependent upon the values of the open sell currency contracts to which they relate.
Certified Semi-Annual Report 35
| | |
| Notes to Financial Statements, Continued | | |
| |
Thornburg Investment Income Builder Fund | | March 31, 2014 (Unaudited) |
The following table displays the outstanding forward currency contracts at March 31, 2014:
| | | | | | | | | | | | | | | | | | | | | | | | |
| | | | | | OUTSTANDING FORWARD CURRENCY CONTRACTS TO BUY OR SELL AT
MARCH 31, 2014 | |
CONTRACT DESCRIPTION | | BUY/SELL | | | CONTRACT
AMOUNT | | | CONTRACT
VALUE
DATE | | | VALUE
USD | | | UNREALIZED
APPRECIATION | | | UNREALIZED
DEPRECIATION | |
Australian Dollar | | | Sell | | | | 211,716,800 | | | | 05/08/2014 | | | | 195,861,807 | | | $ | 3,450,505 | | | $ | — | |
Australian Dollar | | | Sell | | | | 40,634,500 | | | | 05/08/2014 | | | | 37,591,474 | | | | — | | | | (1,322,338 | ) |
Euro | | | Sell | | | | 1,484,371,800 | | | | 08/29/2014 | | | | 2,044,673,105 | | | | — | | | | (13,147,015 | ) |
Great Britain Pound | | | Buy | | | | 27,253,700 | | | | 04/08/2014 | | | | 45,433,938 | | | | 168,813 | | | | — | |
Great Britain Pound | | | Sell | | | | 39,000,000 | | | | 04/08/2014 | | | | 65,015,891 | | | | — | | | | (332,831 | ) |
Great Britain Pound | | | Sell | | | | 72,660,200 | | | | 04/08/2014 | | | | 121,129,940 | | | | — | | | | (351,249 | ) |
Great Britain Pound | | | Sell | | | | 59,087,500 | | | | 04/08/2014 | | | | 98,503,243 | | | | — | | | | (2,424,013 | ) |
Great Britain Pound | | | Sell | | | | 205,675,500 | | | | 04/08/2014 | | | | 342,876,305 | | | | — | | | | (13,223,727 | ) |
Swiss Franc | | | Buy | | | | 70,125,300 | | | | 04/07/2014 | | | | 79,325,916 | | | | 2,220,070 | | | | — | |
Swiss Franc | | | Sell | | | | 45,416,400 | | | | 04/07/2014 | | | | 51,375,146 | | | | — | | | | (757,590 | ) |
Swiss Franc | | | Sell | | | | 278,487,700 | | | | 04/07/2014 | | | | 315,025,989 | | | | — | | | | (5,856,288 | ) |
| | | | | | | | | | | | | | | | | | | | | | | | |
Total | | | | | | | | | | | | | | | | | | $ | 5,839,388 | | | $ | (37,415,051 | ) |
| | | | | | | | | | | | | | | | | | | | | | | | |
The foregoing forward currency contracts were entered into pursuant to an International Swaps and Derivatives Association (ISDA) Master Agreement. In the event of a default or termination under the ISDA Master Agreement, the non-defaulting party has the right to close out all outstanding forward currency contracts between the parties and to net any payment amounts under those contracts, resulting in a single net amount payable by one party to the other. Because the ISDA Master Agreement does not result in an offset of reported amounts of financial assets and financial liabilities in the Fund’s Statement of Assets and Liabilities unless there has been an event of default or termination event under that agreement, the Fund does not net its outstanding forward currency contracts for purposes of the disclosure in the Fund’s Statement of Assets and Liabilities. Instead the Fund recognizes the unrealized appreciation or depreciation on those forward currency contracts on a gross basis in the Fund’s Statement of Assets and Liabilities. At March 31, 2014, those recognized amounts are disclosed in the following table:
| | | | |
FAIR VALUES OF DERIVATIVE FINANCIAL INSTRUMENTS AT MARCH 31, 2014 |
| | | | | | |
ASSET DERIVATIVES | | BALANCE SHEET LOCATION | | FAIR VALUE | |
Foreign exchange contracts | | Assets - Unrealized appreciation on
forward currency contracts | | $ | 5,839,388 | |
| | | | | | |
LIABILITY DERIVATIVES | | BALANCE SHEET LOCATION | | FAIR VALUE | |
Foreign exchange contracts | | Liabilities - Unrealized depreciation on
forward currency contracts | | $ | (37,415,051 | ) |
Because the Fund does not currently receive or post cash collateral in connection with its currency forward contracts, and because all of the Fund’s outstanding currency forward contracts are with State Street Bank and Trust Company, the net amounts of the Fund’s assets and liabilities which are attributable to those contracts at March 31, 2014 can be determined by offsetting the dollar amounts shown in the preceding table. Based on those amounts, the net amount of the Fund’s assets which is attributable to its outstanding forward currency contracts at March 31, 2014 is $0, and the net amount of the Fund’s liabilities which is attributable to those contracts at that date is $31,575,663. The Fund’s forward currency contracts are valued each day, and the net amounts of the Fund’s assets and liabilities which are attributable to those contracts are expected to vary over time.
36 Certified Semi-Annual Report
| | |
| Notes to Financial Statements, Continued | | |
| |
Thornburg Investment Income Builder Fund | | March 31, 2014 (Unaudited) |
The net realized gain (loss) from forward currency contracts, and the net change in unrealized appreciation (depreciation) of outstanding forward currency contracts recognized in the Fund’s Statement of Operations for the six months ended March 31, 2014 are disclosed in the following tables:
| | | | |
AMOUNT OF NET REALIZED GAIN (LOSS) ON DERIVATIVE FINANCIAL INSTRUMENTS RECOGNIZED IN INCOME FOR THE SIX MONTHS ENDED MARCH 31, 2014 |
| | | TOTAL | | FORWARD CURRENCY CONTRACTS |
Foreign exchange contracts | | $(82,449,296) | | $(82,449,296) |
|
AMOUNT OF NET CHANGE IN UNREALIZED APPRECIATION (DEPRECIATION) OF DERIVATIVE FINANCIAL INSTRUMENTS RECOGNIZED IN INCOME FOR THE SIX MONTHS ENDED MARCH 31, 2014 |
| | | TOTAL | | FORWARD CURRENCY CONTRACTS |
Foreign exchange contracts | | $21,909,634 | | $21,909,634 |
OTHER NOTES
Risks: The Fund’s investments subject it to risks including, but not limited to, management risk, market and economic risk, risks affecting specific issuers, credit risk, interest rate risk, high yield risk, prepayment risk, liquidity risk, and the risks associated with investments in smaller companies, non-U.S. issuers, and real estate investment trusts. Please see the Fund’s prospectus for a discussion of the risks associated with an investment in the Fund.
Subsequent Events: Fund management believes no events have occurred between March 31, 2014 and the date of issuance of the financial statements that require adjustment to or disclosure in the accompanying financial statements.
Certified Semi-Annual Report 37
Financial Highlights
Thornburg Investment Income Builder Fund
| | | | | | | | | | | | | | | | | | | | | | | | | | | | | | | | | | | | | | | | | | | | | | | | | | |
| | | PER SHARE PERFORMANCE (FOR A SHARE OUTSTANDING THROUGHOUT THE
PERIOD)+ | | | RATIOS TO AVERAGE NET ASSETS | | | SUPPLEMENTAL DATA | |
UNLESS
OTHERWISE
NOTED,
PERIODS
ARE
FISCAL
YEARS
ENDED
SEPT. 30, | | NET ASSET
VALUE
BEGINNING
OF PERIOD | | | NET
INVESTMENT
INCOME
(LOSS) | | NET REALIZED
&
UNREALIZED
GAIN (LOSS)
ON
INVESTMENTS | | | TOTAL FROM
INVESTMENT
OPERATIONS | | DIVIDENDS
FROM NET
INVESTMENT
INCOME | | | DIVIDENDS
FROM NET
REALIZED
GAINS | | TOTAL
DIVIDENDS | | | NET
ASSET
VALUE
END OF
PERIOD | | | NET
INVESTMENT
INCOME
(LOSS)
(%) | | | EXPENSES,
AFTER
EXPENSE
REDUCTIONS
(%) | | | EXPENSES,
AFTER
EXPENSE
REDUCTIONS
AND
NET OF
CUSTODY
CREDITS (%) | | | EXPENSES,
BEFORE
EXPENSE
REDUCTIONS
(%) | | | TOTAL
RETURN
(%)(A) | | PORTFOLIO
TURNOVER RATE (%)(A) | | NET
ASSETS
AT END
OF
PERIOD
(THOUSANDS) | |
CLASS A SHARES | | | | | | | | | | | | | | | | | | | | | | | | | | | | | | | | | | | | | | | | | | | | |
2014(b)(c) | | $ | 20.13 | | | 0.62 | | | 1.03 | | | 1.65 | | | (0.47 | ) | | — | | | (0.47 | ) | | $ | 21.31 | | | | 6.06 | (d) | | | 1.16 | (d) | | | 1.16 | (d) | | | 1.16 | (d) | | 8.28 | | 21.46 | | $ | 4,826,648 | |
2013(b) | | $ | 18.90 | | | 1.03 | | | 1.27 | | | 2.30 | | | (1.07 | ) | | — | | | (1.07 | ) | | $ | 20.13 | | | | 5.26 | | | | 1.18 | | | | 1.18 | | | | 1.18 | | | 12.51 | | 46.14 | | $ | 4,281,060 | |
2012(b) | | $ | 17.29 | | | 1.15 | | | 1.60 | | | 2.75 | | | (1.14 | ) | | — | | | (1.14 | ) | | $ | 18.90 | | | | 6.32 | | | | 1.20 | | | | 1.20 | | | | 1.20 | | | 16.26 | | 40.96 | | $ | 3,420,877 | |
2011(b) | | $ | 18.31 | | | 1.12 | | | (0.99 | ) | | 0.13 | | | (1.15 | ) | | — | | | (1.15 | ) | | $ | 17.29 | | | | 5.91 | | | | 1.21 | | | | 1.21 | | | | 1.21 | | | 0.42 | | 30.34 | | $ | 2,734,845 | |
2010(b) | | $ | 17.38 | | | 1.14 | | | 0.90 | | | 2.04 | | | (1.11 | ) | | — | | | (1.11 | ) | | $ | 18.31 | | | | 6.47 | | | | 1.25 | | | | 1.25 | | | | 1.25 | | | 12.08 | | 35.50 | | $ | 2,018,202 | |
2009(b) | | $ | 16.86 | | | 1.01 | | | 0.58 | | | 1.59 | | | (1.07 | ) | | — | | | (1.07 | ) | | $ | 17.38 | | | | 7.03 | | | | 1.30 | | | | 1.30 | | | | 1.30 | | | 10.89 | | 63.05 | | $ | 1,400,454 | |
CLASS C SHARES | | | | | | | | | | | | | | | | | | | | | | | | | | | | | | | | | | | | | | | | | | | | |
2014(c) | | $ | 20.13 | | | 0.55 | | | 1.02 | | | 1.57 | | | (0.40 | ) | | — | | | (0.40 | ) | | $ | 21.30 | | | | 5.33 | (d) | | | 1.90 | (d) | | | 1.90 | (d) | | | 1.92 | (d) | | 7.85 | | 21.46 | | $ | 5,934,501 | |
2013 | | $ | 18.89 | | | 0.89 | | | 1.28 | | | 2.17 | | | (0.93 | ) | | — | | | (0.93 | ) | | $ | 20.13 | | | | 4.55 | | | | 1.90 | | | | 1.90 | | | | 1.94 | | | 11.78 | | 46.14 | | $ | 5,160,706 | |
2012 | | $ | 17.29 | | | 1.02 | | | 1.59 | | | 2.61 | | | (1.01 | ) | | — | | | (1.01 | ) | | $ | 18.89 | | | | 5.63 | | | | 1.90 | | | | 1.90 | | | | 1.97 | | | 15.43 | | 40.96 | | $ | 4,051,242 | |
2011 | | $ | 18.31 | | | 0.99 | | | (0.99 | ) | | . — | | | (1.02 | ) | | — | | | (1.02 | ) | | $ | 17.29 | | | | 5.23 | | | | 1.90 | | | | 1.90 | | | | 1.96 | | | (0.26) | | 30.34 | | $ | 3,167,624 | |
2010 | | $ | 17.39 | | | 1.03 | | | 0.89 | | | 1.92 | | | (1.00 | ) | | — | | | (1.00 | ) | | $ | 18.31 | | | | 5.86 | | | | 1.90 | | | | 1.90 | | | | 2.02 | | | 11.32 | | 35.50 | | $ | 2,234,953 | |
2009 | | $ | 16.87 | | | 0.92 | | | 0.59 | | | 1.51 | | | (0.99 | ) | | — | | | (0.99 | ) | | $ | 17.39 | | | | 6.44 | | | | 1.90 | | | | 1.90 | | | | 2.08 | | | 10.27 | | 63.05 | | $ | 1,426,613 | |
Class I Shares | | | | | | | | | | | | | | | | | | | | | | | | | | | | | | | | | | | | | | | | | | | | |
2014(c) | | $ | 20.27 | | | 0.66 | | | 1.04 | | | 1.70 | | | (0.51 | ) | | — | | | (0.51 | ) | | $ | 21.46 | | | | 6.41 | (d) | | | 0.83 | (d) | | | 0.83 | (d) | | | 0.83 | (d) | | 8.46 | | 21.46 | | $ | 6,472,602 | |
2013 | | $ | 19.03 | | | 1.10 | | | 1.28 | | | 2.38 | | | (1.14 | ) | | — | | | (1.14 | ) | | $ | 20.27 | | | | 5.58 | | | | 0.85 | | | | 0.85 | | | | 0.85 | | | 12.94 | | 46.14 | | $ | 5,567,617 | |
2012 | | $ | 17.40 | | | 1.22 | | | 1.61 | | | 2.83 | | | (1.20 | ) | | — | | | (1.20 | ) | | $ | 19.03 | | | | 6.67 | | | | 0.89 | | | | 0.89 | | | | 0.89 | | | 16.61 | | 40.96 | | $ | 3,981,955 | |
2011 | | $ | 18.43 | | | 1.21 | | | (1.02 | ) | | 0.19 | | | (1.22 | ) | | — | | | (1.22 | ) | | $ | 17.40 | | | | 6.31 | | | | 0.87 | | | | 0.87 | | | | 0.87 | | | 0.74 | | 30.34 | | $ | 2,878,655 | |
2010 | | $ | 17.50 | | | 1.22 | | | 0.89 | | | 2.11 | | | (1.18 | ) | | — | | | (1.18 | ) | | $ | 18.43 | | | | 6.87 | | | | 0.93 | | | | 0.93 | | | | 0.93 | | | 12.39 | | 35.50 | | $ | 1,682,616 | |
2009 | | $ | 16.97 | | | 1.07 | | | 0.59 | | | 1.66 | | | (1.13 | ) | | — | | | (1.13 | ) | | $ | 17.50 | | | | 7.39 | | | | 0.97 | | | | 0.97 | | | | 0.97 | | | 11.29 | | 63.05 | | $ | 908,126 | |
CLASS R3 SHARES | | | | | | | | | | | | | | | | | | | | | | | | | | | | | | | | | | | | | | | | | | | | |
2014(c) | | $ | 20.13 | | | 0.60 | | | 1.01 | | | 1.61 | | | (0.44 | ) | | — | | | (0.44 | ) | | $ | 21.30 | | | | 5.81 | (d) | | | 1.48 | (d) | | | 1.48 | (d) | | | 1.51 | (d) | | 8.06 | | 21.46 | | $ | 73,744 | |
2013 | | $ | 18.89 | | | 0.97 | | | 1.28 | | | 2.25 | | | (1.01 | ) | | — | | | (1.01 | ) | | $ | 20.13 | | | | 4.96 | | | | 1.49 | | | | 1.49 | | | | 1.70 | | | 12.23 | | 46.14 | | $ | 61,334 | |
2012 | | $ | 17.28 | | | 1.10 | | | 1.60 | | | 2.70 | | | (1.09 | ) | | — | | | (1.09 | ) | | $ | 18.89 | | | | 6.05 | | | | 1.50 | | | | 1.50 | | | | 1.59 | | | 15.94 | | 40.96 | | $ | 47,023 | |
2011 | | $ | 18.30 | | | 1.08 | | | (1.00 | ) | | 0.08 | | | (1.10 | ) | | — | | | (1.10 | ) | | $ | 17.28 | | | | 5.67 | | | | 1.50 | | | | 1.50 | | | | 1.58 | | | 0.13 | | 30.34 | | $ | 34,861 | |
2010 | | $ | 17.38 | | | 1.11 | | | 0.88 | | | 1.99 | | | (1.07 | ) | | — | | | (1.07 | ) | | $ | 18.30 | | | | 6.27 | | | | 1.50 | | | | 1.50 | | | | 1.69 | | | 11.75 | | 35.50 | | $ | 23,550 | |
2009 | | $ | 16.85 | | | 1.00 | | | 0.58 | | | 1.58 | | | (1.05 | ) | | — | | | (1.05 | ) | | $ | 17.38 | | | | 6.93 | | | | 1.50 | | | | 1.50 | | | | 1.87 | | | 10.74 | | 63.05 | | $ | 14,828 | |
CLASS R4 SHARES | | | | | | | | | | | | | | | | | | | | | | | | | | | | | | | | | | | | | | | | | | | | |
2014(c) | | $ | 20.17 | | | 0.61 | | | 1.03 | | | 1.64 | | | (0.46 | ) | | — | | | (0.46 | ) | | $ | 21.35 | | | | 5.92 | (d) | | | 1.31 | (d) | | | 1.31 | (d) | | | 1.32 | (d) | | 8.19 | | 21.46 | | $ | 30,642 | |
2013 | | $ | 18.93 | | | 0.99 | | | 1.29 | | | 2.28 | | | (1.04 | ) | | — | | | (1.04 | ) | | $ | 20.17 | | | | 5.05 | | | | 1.37 | | | | 1.37 | | | | 1.41 | | | 12.35 | | 46.14 | | $ | 24,906 | |
2012 | | $ | 17.31 | | | 1.12 | | | 1.61 | | | 2.73 | | | (1.11 | ) | | — | | | (1.11 | ) | | $ | 18.93 | | | | 6.14 | | | | 1.39 | | | | 1.39 | | | | 1.53 | | | 16.10 | | 40.96 | | $ | 19,471 | |
2011 | | $ | 18.34 | | | 1.15 | | | (1.06 | ) | | 0.09 | | | (1.12 | ) | | — | | | (1.12 | ) | | $ | 17.31 | | | | 6.02 | | | | 1.40 | | | | 1.40 | | | | 1.65 | | | 0.19 | | 30.34 | | $ | 10,162 | |
2010 | | $ | 17.47 | | | 1.22 | | | 0.74 | | | 1.96 | | | (1.09 | ) | | — | | | (1.09 | ) | | $ | 18.34 | | | | 6.89 | | | | 1.40 | | | | 1.40 | | | | 3.60 | | | 11.52 | | 35.50 | | $ | 1,950 | |
2009 | | $ | 16.94 | | | 1.01 | | | 0.59 | | | 1.60 | | | (1.07 | ) | | — | | | (1.07 | ) | | $ | 17.47 | | | | 7.02 | | | | 1.40 | | | | 1.40 | | | | 9.54 | (e) | | 10.83 | | 63.05 | | $ | 48 | |
CLASS R5 SHARES | | | | | | | | | | | | | | | | | | | | | | | | | | | | | | | | | | | | | | | | | | | | |
2014(c) | | $ | 20.26 | | | 0.64 | | | 1.04 | | | 1.68 | | | (0.49 | ) | | — | | | (0.49 | ) | | $ | 21.45 | | | | 6.21 | (d) | | | 0.99 | (d) | | | 0.99 | (d) | | | 1.05 | (d) | | 8.38 | | 21.46 | | $ | 43,801 | |
2013 | | $ | 19.01 | | | 1.07 | | | 1.30 | | | 2.37 | | | (1.12 | ) | | — | | | (1.12 | ) | | $ | 20.26 | | | | 5.37 | | | | 0.99 | | | | 0.98 | | | | 1.05 | | | 12.80 | | 46.14 | | $ | 39,985 | |
2012 | | $ | 17.40 | | | 1.21 | | | 1.58 | | | 2.79 | | | (1.18 | ) | | — | | | (1.18 | ) | | $ | 19.01 | | | | 6.61 | | | | 0.99 | | | | 0.99 | | | | 1.29 | | | 16.44 | | 40.96 | | $ | 14,914 | |
2011 | | $ | 18.42 | | | 1.18 | | | (1.00 | ) | | 0.18 | | | (1.20 | ) | | — | | | (1.20 | ) | | $ | 17.40 | | | | 6.16 | | | | 0.99 | | | | 0.99 | | | | 1.51 | | | 0.68 | | 30.34 | | $ | 4,424 | |
2010 | | $ | 17.50 | | | 1.36 | | | 0.74 | | | 2.10 | | | (1.18 | ) | | — | | | (1.18 | ) | | $ | 18.42 | | | | 7.67 | | | | 0.99 | | | | 0.99 | | | | 2.35 | | | 12.31 | | 35.50 | | $ | 3,366 | |
2009 | | $ | 16.98 | | | 1.04 | | | 0.61 | | | 1.65 | | | (1.13 | ) | | — | | | (1.13 | ) | | $ | 17.50 | | | | 7.14 | | | | 0.99 | | | | 0.99 | | | | 9.20 | (e) | | 11.19 | | 63.05 | | $ | 427 | |
| (a) | Not annualized for periods less than one year. |
| (b) | Sales loads are not reflected in computing total return. |
| (c) | Unaudited Six Month Period Ended March 31. |
| (e) | Due to the size of net assets and fixed expenses, ratios may appear disproportionate. |
| + | Based on weighted average shares outstanding, except for Dividends from Net Investment Income and Net Realized Gains, which are actual amounts per share. |
See notes to financial statements.
| | | | |
| 38 Certified Semi-Annual Report | | | | Certified Semi-Annual Report 39 |
| | |
| Expense Example | | |
| |
Thornburg Investment Income Builder Fund | | March 31, 2014 (Unaudited) |
As a shareholder of the Fund, you incur two types of costs:
| | (1) | transaction costs, including |
(a) sales charges (loads) on purchase payments, for Class A shares;
(b) a deferred sales charge on redemptions of any part or all of a purchase of $1 million of Class A shares within 12 months of purchase;
(c) a deferred sales charge on redemptions of Class C shares within 12 months of purchase;
| | (2) | ongoing costs, including management fees; distribution and/or service (12b-1) fees; and other Fund expenses. |
This example is intended to help you understand your ongoing costs (in dollars) of investing in the Fund and to compare these costs with the ongoing costs of investing in other mutual funds.
The example is based on a $1,000 investment beginning on October 1, 2013, and held until March 31, 2014.
Actual Expenses
For each class of shares, the first line of the table above provides information about actual account values and actual expenses. You may use the information in this line, together with the amount you invested, to estimate the expenses that you paid over the period. Simply divide your account value by $1,000 (for example, an $8,600 account value divided by $1,000 = 8.6), then multiply the result by the number in the first line for your class of shares under the heading entitled “Expenses Paid During Period” to estimate the expenses you paid on your account during this period.
| | | | | | | | | | | | |
| | | BEGINNING
ACCOUNT VALUE
10/1/13 | | | ENDING
ACCOUNT VALUE
3/31/14 | | | EXPENSES PAID
DURING PERIOD†
10/1/13–3/31/14 | |
Class A Shares | | | | | | | | | | | | |
Actual | | $ | 1,000.00 | | | $ | 1,082.80 | | | $ | 6.04 | |
Hypothetical* | | $ | 1,000.00 | | | $ | 1,019.14 | | | $ | 5.85 | |
Class C Shares | | | | | | | | | | | | |
Actual | | $ | 1,000.00 | | | $ | 1,078.50 | | | $ | 9.85 | |
Hypothetical* | | $ | 1,000.00 | | | $ | 1,015.46 | | | $ | 9.55 | |
Class I Shares | | | | | | | | | | | | |
Actual | | $ | 1,000.00 | | | $ | 1,084.60 | | | $ | 4.31 | |
Hypothetical* | | $ | 1,000.00 | | | $ | 1,020.80 | | | $ | 4.18 | |
Class R3 Shares | | | | | | | | | | | | |
Actual | | $ | 1,000.00 | | | $ | 1,080.60 | | | $ | 7.69 | |
Hypothetical* | | $ | 1,000.00 | | | $ | 1,017.54 | | | $ | 7.46 | |
Class R4 Shares | | | | | | | | | | | | |
Actual | | $ | 1,000.00 | | | $ | 1,081.90 | | | $ | 6.82 | |
Hypothetical* | | $ | 1,000.00 | | | $ | 1,018.38 | | | $ | 6.61 | |
Class R5 Shares | | | | | | | | | | | | |
Actual | | $ | 1,000.00 | | | $ | 1,083.80 | | | $ | 5.12 | |
Hypothetical* | | $ | 1,000.00 | | | $ | 1,020.02 | | | $ | 4.96 | |
| † | Expenses are equal to the annualized expense ratio for each class (A: 1.16%; C: 1.90%; I: 0.83%; R3: 1.48%; R4: 1.31%; R5: 0.99%) multiplied by the average account value over the period, multiplied by 182/365 to reflect the one-half year period. |
| * | Hypothetical assumes a rate of return of 5% per year before expenses. |
Hypothetical Example for Comparison Purposes
For each class of shares, the second line of the table above provides information about hypothetical account values and hypothetical expenses based on the Fund’s actual expense ratio and an assumed rate of return of 5% per year before expenses, which is not the Fund’s actual return. The hypothetical account values and expenses may not be used to estimate the actual ending account balance or expenses you paid for the period. You may use this information to compare the ongoing costs of investing in the Fund and other funds. To do so, compare this 5% hypothetical example with the 5% hypothetical examples that appear in the shareholder reports of the other funds.
Please note that the expenses shown in the table are meant to highlight your ongoing costs only and do not reflect any transactional costs, such as sales charges (loads), redemption fees, or exchange fees. Therefore, the second line of the table for each class of shares is useful in comparing ongoing costs only, and will not help you determine the relative total costs of owning different funds. In addition, if these transactional costs were included, your costs would have been higher.
40 Certified Semi-Annual Report
| | |
| Index Comparison | | |
| |
Thornburg Investment Income Builder Fund | | March 31, 2014 (Unaudited) |
Growth of a Hypothetical $10,000 Investment
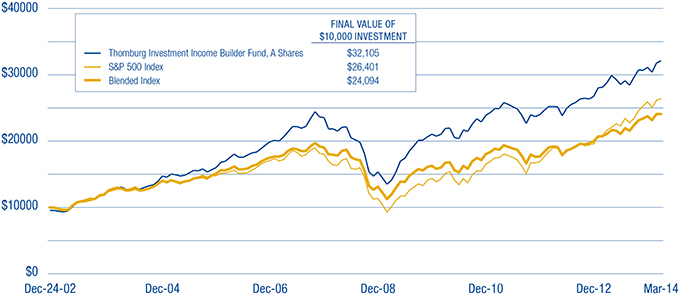
Average Annual Total Returns
For Periods Ended March 31, 2014 (with sales charge)
| | | | | | | | | | | | | | | | | | | | |
| | | 1 YR | | | 3 YRS | | | 5 YRS | | | 10 YRS | | | SINCE
INCEPTION | |
Class A Shares (Incep: 12/24/02) | | | 6.29 | % | | | 7.20 | % | | | 16.75 | % | | | 8.90 | % | | | 10.89 | % |
Class C Shares (Incep: 12/24/02) | | | 9.48 | % | | | 8.08 | % | | | 17.04 | % | | | 8.74 | % | | | 10.69 | % |
Class I Shares (Incep: 11/3/03) | | | 11.70 | % | | | 9.21 | % | | | 18.20 | % | | | 9.80 | % | | | 10.40 | % |
Class R3 Shares (Incep: 2/1/05) | | | 10.94 | % | | | 8.51 | % | | | 17.50 | % | | | — | | | | 8.64 | % |
Class R4 Shares (Incep: 2/1/08) | | | 11.12 | % | | | 8.67 | % | | | 17.57 | % | | | — | | | | 6.06 | % |
Class R5 Shares (Incep: 2/1/07) | | | 11.54 | % | | | 9.06 | % | | | 18.10 | % | | | — | | | | 6.94 | % |
Performance data shown represents past performance and is no guarantee of future results. Investment return and principal value will fluctuate so shares, when redeemed, may be worth more or less than their original cost. Current performance may be lower or higher than quoted. For performance current to the most recent month end, visit thornburg.com or call 800-847-0200. The performance data and graph do not reflect the deduction of taxes that a shareholder would pay on distributions or the redemption of Fund shares. Returns reflect the reinvestment of dividends and capital gains as well as applicable sales charges. Class A shares are sold with a maximum sales charge of 4.50%. Class C shares are subject to a 1% CDSC for the first year only. There is no up-front sales charge for Class I, R3, R4, and R5 shares.
Certified Semi-Annual Report 41
| | |
| Other Information | | |
| |
Thornburg Investment Income Builder Fund | | March 31, 2014 (Unaudited) |
Portfolio Proxy Voting
Policies and Procedures:
The Trust has delegated to Thornburg Investment Management, Inc. (the “Advisor”) voting decisions respecting proxies for the Fund’s voting securities. The Advisor makes voting decisions in accordance with its Proxy Voting Policy and Procedures. A description of the Policy and Procedures is available (i) without charge, upon request, by calling the Advisor toll-free at 1-800-847-0200, (ii) on the Thornburg website at www.thornburg.com, and (iii) on the Securities and Exchange Commission’s website at www.sec.gov.
Information regarding how proxies were voted is available on or before August 31 of each year for the twelve months ending the preceding June 30. This information is available (i) without charge, upon request by calling the Advisor toll-free at 1-800-847-0200, (ii) on the Thornburg website at www.thornburg.com, and (iii) on the Securities and Exchange Commission’s website at www.sec.gov.
Availability of Quarterly Portfolio Schedule
The Fund files with the Securities and Exchange Commission schedules of its portfolio holdings on Form N-Q for the first and third quarters of each fiscal year. The Fund’s Forms N-Q are available on the Commission’s website at www.sec.gov, or may be reviewed and copied at the Commission’s Public Reference Room in Washington, D.C. Information on the operation of the Public Reference Room may be obtained by calling 1-800-SEC-0330. The Fund also makes this information available on its website at www.thornburg.com/download or upon request by calling 1-800-847-0200.
42 Certified Semi-Annual Report
Trustees’ Statement to Shareholders
Not part of the Certified Semi-Annual Report
Reissued September 15, 2013
The Trustees believe current and prospective shareholders should know how we discharge our responsibilities in supervising the Funds’ investment advisor and in reviewing the advisor’s contract for renewal. Since 2005, we have issued a statement which sets out clearly the three principal guidelines that we follow in supervising the Trust’s investment advisor on your behalf. In accordance with our customary practice, in September of this year we again reviewed our statement and concluded we should reissue this statement outlining the principal features of our supervision of the advisor’s performance of investment management services for the Funds.
We begin with the premise that each shareholder selected his or her Fund because its investments are managed by the investment advisor identified in the prospectus and in accordance with the objective and policies described in the prospectus. We realize, as each of you do, that if you believe that your Fund’s stated objective and policies no longer serve your personal investment goals, you can sell your shares and leave the Fund.
Therefore, we believe that our primary supervisory task – our principal obligation to you – is to assess the nature and quality of the advisor’s services, and to confirm that the advisor actively and competently pursues the Fund’s objective, in accordance with the policies set out in the prospectus. To do this, we meet regularly with management to review your Fund’s portfolio and to discuss the advisor’s specific actions and judgments in pursuing the Fund’s objective. We do not substitute our own judgment for the advisor’s decisions in selecting investments; the advisor is paid to exercise its informed judgment on investment decisions, and we seek to confirm, in reviewing the advisor’s performance, that the advisor is doing just that.
Second, while we are conscious of costs and the effect that costs have on shareholders’ returns, we do not seek the lowest fees or expense ratio as our sole or primary objective. We try to make sure that your Fund’s fees and costs are reasonable in relationship to the services rendered and that they are generally in line with those charged by other expert investment advisors, consistent with our belief that the Fund’s investors searched for and expect that expertise and attention and have decided to pay a reasonable price for it. We do not put the management contract “out to bid” as a matter of course, and we would not do so unless we had concluded that the advisor materially had failed to pursue the Fund’s objectives in accordance with its policies, or for other equally important reasons. We believe that any other approach would be inconsistent with your interests and contrary to your expectations when you bought shares of the Fund in the first place.
Finally, because we believe that most Thornburg Fund shareholders have invested with a long-term perspective, we try not to focus too much on the fashions of the moment and on short-term performance. The market will not favor any specific investment objective or set of policies at all times and under all economic circumstances. A fund will experience periods of both high and low returns relative to other funds and other investments. Even if one of our Funds is not favored by the market at a particular time, we believe that the advisor is nonetheless obliged to remain true to the Fund’s objective and policies, and we watch to see that it does so.
This page is not part of the Semi-Annual Report 43
This page intentionally left blank.
44 This page is not part of the Semi-Annual Report
Retirement and Education Accounts
Thornburg Investment Management offers retirement and education savings accounts that can help you meet a variety of planning challenges. For account applications or further information on any of the accounts below, please call 1-800-847-0200 or go to www.thornburg.com/ira. Your financial advisor can help you determine which plan is right for you.
Individual Retirement Accounts
Individual Retirement Accounts (IRAs) provide a tax-advantaged means to save money for the future. For a detailed outline of the difference between retirement accounts, see www.thornburg.com/ira. Rollovers are available. Call 1-800-847-0200 for more information.
Traditional IRAs – Contributions to Traditional IRAs are tax deductible for eligible individuals, and withdrawals are taxed as additional ordinary income. You may contribute to an IRA if you receive compensation and are under 70 1/2, even if you are covered by an employer retirement plan. Deductible contributions are subject to certain qualifications. Please consult your tax advisor.
Roth IRAs – Under a Roth IRA, there is no tax deduction for contributions, but there is no income tax on qualified withdrawals. For a more detailed comparison of Traditional and Roth IRAs, please see our website at www.thornburg. com/ira.
SEP IRAs – Simplified Employee Pension (SEP) IRAs are established by employers. The employer is allowed a tax deduction for contributions made to the SEP Plan and makes contributions to each eligible employee’s SEP IRA on a discretionary basis.
SIMPLE IRAs – Savings Incentive Match Plan for Employees of Small Employers (SIMPLE) is designed to give small business owners a simplified method to establish and contribute to a retirement plan for employees. The employer is allowed a tax deduction for contributions and makes either matching or non-elective contributions to each eligible employee’s SIMPLE IRA. Employees may make salary deferral contributions.
Coverdell Education Savings Account
These savings accounts are designed to provide a way to save money for higher education expenses. In an Education Savings Account, earnings and interest grow tax-free, and qualified withdrawals used to pay for eligible higher-education expenses are tax- and penalty-free.
Funds Available
The following funds are available in the accounts listed above:
| | • | | Thornburg Core Growth Fund |
| | • | | Thornburg International Value Fund |
| | • | | Thornburg International Growth Fund |
| | • | | Thornburg Developing World Fund |
| | • | | Thornburg Investment Income Builder Fund |
| | • | | Thornburg Global Opportunities Fund |
| | • | | Thornburg Low Duration Income Fund |
| | • | | Thornburg Limited Term U.S. Government Fund |
| | • | | Thornburg Limited Term Income Fund |
| | • | | Thornburg Strategic Income Fund |
This page is not part of the Semi-Annual Report 45
Firm & Philosophy

The Firm
Founded in 1982 and headquartered in Santa Fe, New Mexico, Thornburg Investment Management advises a range of active investment strategies, each offered through multiple vehicles, to serve a broad spectrum of client needs worldwide. From short-term fixed income to flexible global equity, our objective is to help clients reach their long-term financial goals via active portfolio management. As of March 31, 2014, Thornburg managed approximately $90 billion in assets.
Investment Philosophy
We seek to preserve and increase the real wealth of shareholders after accounting for inflation, taxes, and investment expenses. We’re committed to disciplined investing and managing risk in all market environments.
Portfolio Holdings Commentary
At Thornburg, we believe you should know what you own. Our website keeps investors informed of the Funds’ equity holdings. Go to www.thornburg.com/funds for equity funds holdings and commentary.
Co-Ownership of Funds
We invest side-by-side with shareholders. Our employees have invested $387 million in Thornburg products as of March 31, 2014.
46 This page is not part of the Semi-Annual Report
Thornburg Fund Family
Thornburg Equity Funds
Thornburg’s equity research uses a fundamentally driven, bottom-up, comprehensive analytical approach. Thornburg equity funds generally focus on a limited number of securities so that each holding can impact performance. The team searches for firms believed to have a promising future and seeks to buy shares of those companies at a discount to their intrinsic or long-term value.
| | • | | Thornburg Core Growth Fund |
| | • | | Thornburg International Value Fund |
| | • | | Thornburg International Growth Fund |
| | • | | Thornburg Developing World Fund |
| | • | | Thornburg Investment Income Builder Fund |
| | • | | Thornburg Global Opportunities Fund |
Thornburg Bond Funds
Thornburg Investment Management applies a disciplined philosophy to fixed-income management. Since the launch of our first fixed-income fund over 25 years ago, we have been conducting fundamental, bottom-up research in an effort to identify bonds which we believe provide the best return for a given level of risk. We avoid leverage or complex strategies which could backfire in periods of market uncertainty.
| | • | | Thornburg Low Duration Income Fund |
| | • | | Thornburg Limited Term U.S. Government Fund |
| | • | | Thornburg Limited Term Income Fund |
| | • | | Thornburg Strategic Income Fund |
| | • | | Thornburg Low Duration Municipal Fund |
| | • | | Thornburg Limited Term Municipal Fund |
| | • | | Thornburg Intermediate Municipal Fund |
| | • | | Thornburg California Limited Term Municipal Fund |
| | • | | Thornburg New Mexico Intermediate Municipal Fund |
| | • | | Thornburg New York Intermediate Municipal Fund |
| | • | | Thornburg Strategic Municipal Income Fund |
Before investing, carefully consider the Fund’s investment goals, risks, charges, and expenses. For a prospectus or summary prospectus containing this and other information, contact your financial advisor or visit thornburg.com. Read it carefully before investing.
For additional information, please visit thornburg.com
Thornburg Investment Management, Inc. 2300 North Ridgetop Road, Santa Fe, NM 87506
This page is not part of the Semi-Annual Report 47
| | |
 | | Waste not, Wait not |

This Semi-Annual Report is submitted for the general information of shareholders of the Fund. It is not authorized for distribution to prospective investors in the Fund unless preceded or accompanied by an effective prospectus.
| | | | |
Investment Advisor: Thornburg Investment Management® 800.847.0200 | | Distributor: Thornburg Securities Corporation® 800.847.0200 | | TH1075 |

2 This page is not part of the Semi-Annual Report
Important Information
The information presented on the following pages was current as of March 31, 2014. The managers’ views, portfolio holdings, and sector and country diversification are provided for the general information of the Fund’s shareholders; to the extent this information is historical, it should not be considered predictive of future circumstances. This material should not be deemed a recommendation to buy or sell any of the securities mentioned.
Investments in the Fund carry risks, including possible loss of principal. Special risks may be associated with investments outside the United States, especially in emerging markets, including currency fluctuations, illiquidity, volatility, and political and economic risks. Investments in small capitalization companies may increase the risk of greater price fluctuations. Please see the Fund’s Prospectus for a discussion of the risks associated with an investment in the Fund. Investments in the Fund are not FDIC insured, nor are they deposits of or guaranteed by a bank or any other entity. There is no guarantee that the Fund will meet its investment objectives. Funds invested in a limited number of holdings may expose an investor to greater volatility.
Performance data given at net asset value (NAV) does not take into account the applicable sales charges. If the sales charges had been included, the performance would have been lower.
Class I, R3, R4, and R5 shares may not be available to all investors. Minimum investments for Class I shares may be higher than those for other classes.
From time to time, the Fund may invest in shares of companies through initial public offerings (IPOs). IPOs have the potential to produce substantial gains for the Fund. There is no assurance that the Fund will have continued access to profitable IPOs and as the Fund’s assets grow, the impact of IPO investments may decline. Therefore, investors should not rely on these past gains as an indication of future performance.
| | | | |
SHARE CLASS | | NASDAQ SYMBOL | | CUSIP |
Class A | | THOAX | | 885-215-343 |
Class C | | THOCX | | 885-215-335 |
Class I | | THOIX | | 885-215-327 |
Class R3 | | THORX | | 885-215-145 |
Class R4 | | THOVX | | 885-215-137 |
Class R5 | | THOFX | | 885-215-129 |
Morningstar Ranking
As of March 31, 2014, Morningstar ranked the Fund’s Class A shares 160 out of 1066 funds (15th percentile) in the world stock category for the one-year period, 128 out of 804 funds (16th percentile) for the three-year period, and 25 out of 642 funds (4th percentile) for the five-year period. Past performance does not guarantee future results.
Glossary
EURO STOXX 50 Index – A Blue-chip representation of supersector leaders in the Eurozone. The index covers 50 stocks from 12 Eurozone countries: Austria, Belgium, Finland, France, Germany, Greece, Ireland, Italy, Luxembourg, the Netherlands, Portugal and Spain.
Japan’s Nikkei 225 Stock Average – The leading index of Japanese stocks. It is a price-weighted index comprised of Japan’s top 225 blue-chip companies on the Tokyo Stock Exchange.
MSCI All Country (AC) World Index – A market capitalization weighted index that is representative of the market structure of 44 developed and emerging market countries in North and South America, Europe, Africa, and the Pacific Rim. The index is calculated with net dividends reinvested in U.S. dollars.
MSCI Emerging Markets Index – A free float-adjusted market capitalization index that is designed to measure equity market performance of emerging markets. The MSCI Emerging Markets Index consists of the following 21 emerging market country indices: Brazil, Chile, China, Colombia, Czech Republic, Egypt, Hungary, India, Indonesia, Korea, Malaysia, Mexico, Morocco, Peru, Philippines, Poland, Russia, South Africa, Taiwan, Thailand, and Turkey.
S&P 500 Index – An unmanaged broad measure of the U.S. stock market.
S&P/Case-Shiller 20-City Composite Home Price Index – An index that measures the value of residential real estate in 20 metropolitan areas of the U.S.
Unless otherwise noted, index returns reflect the reinvestment of income dividends and capital gains, if any, but do not reflect fees, brokerage commissions or other expenses of investing. Investors may not make direct investments into any index. The performance of any index is not indicative of the performance of any particular investment.
Basis Point (bp) – A unit equal to 1/100th of 1%. 1% = 100 basis points (bps).
Beta – A measure of market-related risk. Less than one means the portfolio is less volatile than the index, while greater than one indicates more volatility than the index.
Earnings Per Share (EPS) – The total earnings divided by the number of shares outstanding.
Gross Domestic Product (GDP) – A country’s income minus foreign investments: the total value of all goods and services produced within a country in a year, minus net income from investments in other countries.
Median Market Capitalization – Market capitalization (market cap) is the total value of a company’s stock, calculated by multiplying the number of outstanding common shares by the current share price. The company whose market cap is in the middle of the portfolio is the median market cap. Half the companies in the portfolio have values greater than the median, and half have values that are less.
Multiple – A term that measures some aspect of a company’s financial well-being, determined by dividing one metric by another metric. The metric in the numerator is typically larger than the one in the denominator, because the top metric is usually supposed to be many times larger than the bottom metric.
Organisation for Economic Co-operation and Development (OECD) – An international economic organisation of 34 countries founded in 1961 to stimulate economic progress and world trade.
Price to Book Value (P/B) – A ratio used to compare a stock’s market value to its book value. It is calculated by dividing the current closing price of the stock by the latest quarter’s book value (book value is simply assets minus liabilities).
Price to Cash Flow Ratio – A measure of the market’s expectations of a firm’s future financial health. It is calculated by dividing the price per share by cash flow per share.
Price to Earnings Ratio (P/E) – A valuation ratio equaling a company’s market value per share divided by earnings per share. Forward P/E is not intended to be a forecast of the Fund’s future performance.
This page is not part of the Semi-Annual Report 3

Portfolio Managers

W. Vinson Walden,CFA BRIAN MCMAHON
Objectives and Strategies
The Fund seeks long-term capital appreciation by investing in equity and debt securities of all types from issuers around the world.
The Fund pursues its investment goals by investing primarily in a broad range of equity securities, including common stocks, preferred stocks, real estate investment trusts, other equity trusts, and partnership interests. The Fund may invest in any stock or other equity security which the investment advisor believes may assist the Fund in pursuing its goals, including smaller companies with market capitalizations of less than $500 million. The Fund may also invest in debt obligations of any kind.
Focused Global Value Investing
At Thornburg Investment Management, we believe that the soundest long-term investments are conceptually simple and grounded in common sense. We created the Thornburg Global Opportunities Fund to pursue that philosophy almost eight years ago, in 2006. We attempt to capitalize on what Thornburg is best known for: fundamentally oriented, bottom-up research based on a flexible approach to uncovering value. The Fund is focused on a limited number of holdings the management team believes are undervalued by the market, yet is well diversified.
The philosophy is straightforward — to maintain a globally flexible focused portfolio of value-oriented holdings. The management team has been constant since the inception of the Fund, now approaching its ninth year. The results have been satisfying; the team has added significant value over the long term versus world equity benchmarks.
The Fund is different in that it typically concentrates on 30 to 40 stocks that the management team believes have a compelling combination of quality, promise, and value characteristics. Each stock is analyzed on its own merits, and the team then combines those selected into a portfolio with, in their view, attractive long-term prospects. The result: the fund looks quite unlike either the MSCI All Country World Index (ACWI) or its global-stock-fund peers.
Global Opportunities Fund is distinctive in the marketplace. Currently, assets in the global stock fund universe are concentrated in a small number of very large funds. Because they are so large, these funds must focus strictly on the largest companies in the world or spread their assets across many holdings. About 63% of category assets are concentrated in just ten funds, and the average world stock fund holds approximately 161 stocks (as of 3/31/14). Thornburg Global Opportunities Fund is distinguished from these peers in that it is a focused, flexible, and diversified portfolio constructed via a value-based framework.
4 This page is not part of the Semi-Annual Report
Key Portfolio Attributes
As of March 31, 2014
| | | | |
Portfolio P/E Trailing 12-months* | | | 19.5x | |
| |
Portfolio Price to Cash Flow* | | | 9.2x | |
| |
Portfolio Price to Book Value* | | | 2.1x | |
| |
Median Market Cap* | | $ | 19.1 B | |
| |
7-Year Beta (A Shares vs. MSCI ACWI)* | | | 1.11 | |
| |
Number of Companies | | | 34 | |
* Source: FactSet
Market Capitalization Exposure
As of March 31, 2014
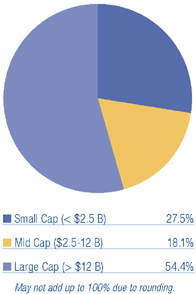
Asset Structure
As of March 31, 2014
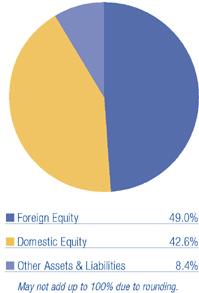
Average Annual Total Returns
For Periods Ended March 31, 2014
| | | | | | | | | | | | | | | | |
| | | 1 YR | | | 3 YRS | | | 5 YRS | | | SINCE
INCEPTION | |
A Shares (Incep: 7/28/06) | | | | | | | | | | | | | | | | |
Without sales charge | | | 23.36 | % | | | 11.97 | % | | | 24.01 | % | | | 10.56 | % |
With sales charge | | | 17.82 | % | | | 10.27 | % | | | 22.89 | % | | | 9.91 | % |
MSCI AC World Index (Since: 7/28/06) | | | 16.55 | % | | | 8.55 | % | | | 17.80 | % | | | 5.24 | % |
Performance data shown represents past performance and is no guarantee of future results. Investment return and principal value will fluctuate so shares, when redeemed, may be worth more or less than their original cost. Current performance may be lower or higher than quoted. For performance current to the most recent month end, visit thornburg.com or call 800.847.0200.
The maximum sales charge for Class A shares is 4.50%. The total annual fund operating expense of Class A shares is 1.48%, as disclosed in the most recent Prospectus.
Stocks Contributing and Detracting
For the Six Months Ended March 31, 2014
| | |
| TOP CONTRIBUTORS | | TOP DETRACTORS |
| Level 3 Communications, Inc. | | PDG Realty SA |
| Valeant Pharmaceuticals International, Inc. | | Frank’s International NV |
| Google, Inc. | | General Motors Company |
| Paradise Co. Ltd. | | Baidu, Inc. ADR |
| Bankers Petroleum Ltd. | | Telefonica Brasil S.A. ADR |
Source: FactSet
This page is not part of the Semi-Annual Report 5
2014 Certified Semi-Annual Report
Thornburg Global Opportunities Fund
March 31, 2014
This report is certified under the Sarbanes-Oxley Act of 2002, which requires that public companies, including mutual funds, affirm that the information provided in their annual and semi-annual shareholder reports fully and fairly represents their financial position and the results of their operations for the period presented.
6 Certified Semi-Annual Report
Letter to Shareholders
April 14, 2014
Dear Fellow Shareholder:
| | |
This letter will highlight the results of Thornburg Global Opportunities Fund’s investment activities for the six-month period ended March 31, 2014. In addition, we will comment on the overall investment landscape. Recall that the Thornburg Global Opportunities Fund seeks capital appreciation from a portfolio of typically 30–40 equity investments from around the world. We believe that the structure of the Fund — built on our core investment principles of flexibility, focus, and value — gives us a durable framework for value-added investing. In the six months ended March 31, 2014, the Thornburg Global Opportunities Fund net asset value (NAV) per Class A share increased 12.32% from $19.72 to $22.15. Your Fund also paid dividends of 5 cents per share to give a total return for the period of 12.61%. The dividends per share were higher for Class I and R5 shares, and lower for the Class C, R3, and R4 shares to account for varying class-specific expenses. | | Performance data shown represents past performance and is no guarantee of future results. Investment return and principal value will fluctuate so shares, when redeemed, may be worth more or less than their original cost. Current performance may be lower or higher than quoted. For performance current to the most recent month end, visit thornburg.com or call 800.847.0200. The maximum sales charge for Class A shares is 4.50%. The total annual fund operating expense of Class A shares is 1.48%, as disclosed in the most recent Prospectus. |
For the six-month period, Thornburg Global Opportunities Fund Class A shares outperformed the MSCI All Country World Index (ACWI) by approximately 4.13%. For the one, three, and five-year periods ended March 31, 2014, Thornburg Global Opportunities Fund Class A shares outperformed the MSCI ACWI. Since its inception on July 28, 2006, Thornburg Global Opportunities Fund has outperformed the same index by an average annualized margin of 5.32%. As of March 2014, the Fund’s Class A shares ranked in the top percentile of Morningstar’s World Stock Funds for the time period starting August 2006 (based on total returns without sales charge, among 587 funds). Performance data for various measurement periods is included on page 31 of this report.
We manage the Fund with tax efficiency in mind. Despite the Fund’s recent positive results, we do not expect to pay a capital gain distribution in 2014. At March 31, 2014, the Fund had realized capital losses of approximately $110 million, which may be carried forward to offset future capital gains to the extent permitted by regulations. This tax loss carryforward is material relative to the Fund’s $633 million total assets as of March 31, 2014.
As shown in Table I, global equity markets were mixed in the semi-annual period ended March 31, 2014. Strong gains in the U.S. and Eurozone contrasted with a negative return for Japan’s Nikkei 225 Stock Average Benchmark Index. Emerging markets were turbulent, but eked out a modest positive result. In the first months of 2014, we have seen notable volatility attributable to the continuation of the Federal Reserve’s (the Fed) tapering program, political conflict in Crimea, and slowing growth in China. Amid these challenges, the major western economies continued to show broadly improving economic indicators.
During the period under review, 30 stocks contributed at least five basis points (.05%) to overall Fund performance, while nine subtracted at least five basis points. Contribution to overall Fund performance takes into account both position size and return on the individual investment.
The greatest contributors to the performance of the Thornburg Global Opportunities Fund were our long-time investments in U.S. fiber-optic network Level 3 Communications and Canadian drug maker Valeant Pharmaceuticals International. Rounding out the top five contributors were U.S. technology company Google, South Korean casino operator Paradise Co. Ltd., and Canadian energy company Bankers Petroleum.
Other significant contributors to positive portfolio performance included a diverse set of businesses: U.S. hotel owner Ryman Hospitality, Hong Kong casino operator Galaxy Entertainment Group, Netherlands bank ING Groep, and U.S. financial institution Bank of America.
Table I Equity Returns in the Six-Month Period
10/1/2013 – 3/31/2014
| | | | |
| | | RETURN IN USD | |
S&P 500 Index (USA) | | | 12.51 | % |
MSCI All Country World Index | | | 8.48 | % |
Nikkei 225 (Japan) | | | -1.45 | % |
EURO STOXX 50 (European Blue Chip Stocks) | | | 12.19 | % |
MSCI Emerging Markets | | | 1.39 | % |
Thornburg Global Opportunities Fund | | | 12.61 | % |
Significant detractors from portfolio performance during the six-month period were also a diverse bunch: Brazilian real estate company PDG Realty, Dutch energy services firm Frank’s International, U.S. automaker General Motors, Chinese internet leader Baidu, Inc., and Brazilian telecommunications operator Telefonica Brasil.
Certified Semi-Annual Report 7
Letter to Shareholders,
Continued
Turnover during the six-month period was moderate; we sold technology bellwether Microsoft, Australian telecommunication operator Telstra, Bank of America, Frank’s International N.V., and U.S. animal health company Zoetis. New purchases included global pharmaceutical concern Endo International plc, specialty real estate owner Gaming and Leisure Properties, Baidu, Inc., U.S. pharmacy benefit manager Express Scripts, and French cable network operator Numericable SA.
Table II Country Fund Weighting
(percent of equity holdings)
| | | | |
USA | | | 46.5 | % |
Netherlands | | | 11.7 | % |
Canada | | | 9.3 | % |
South Korea | | | 6.1 | % |
Following several acquisitions, Numericable Group now owns and operates one of France’s two large terrestrial broadband communications networks. The company holds a leading market share (above 50%) in the high-speed broadband market (commonly defined as data speeds exceeding 30 megabits per second), which is experiencing solid growth as accelerating data consumption requires faster network speeds. This has important implications for the French economy. A recent study of 33 Organization for Economic Cooperation and Development (OECD) countries concluded that doubling the broadband speed for an economy increases gross domestic product (GDP) by 0.3%. Numericable is currently upgrading and expanding its high-speed network to meet rising demand — an endeavor consisting primarily of software upgrades. Most competitors, by comparison, require more costly and time-intensive upgrades to their own networks. Another interesting facet of our Numericable investment is the potential for industry consolidation.
Top industry weightings as of March 31, 2014 were: information technology (22.1%); financials (16.7%); consumer discretionary (16.2%); healthcare (12.7%); industrials (8.6%); and consumer staples (5.9%). As of March 31, 2014, the average expected price-to-earnings multiple for 2014 on the portfolio companies owned in the Thornburg Global Opportunities Fund stands at 15.4x versus 14.6x for the MSCI ACWI portfolio. We have relatively low direct exposure to Europe, and companies based in emerging markets currently constitute about 15% of the Fund. The table above illustrates the Fund’s largest geographic weightings, based on the country of domicile.
Investors believe that both the U.S. and Eurozone economies are recovering. We agree. Leading indicators (e.g. consumer sentiment, industrial production, and housing) have improved, which should support employment and capital spending in the near future. Interest rates and inflation in the developed economies remain low. A plain effect of this easy monetary policy backdrop has been the inflation of corporate profits and asset prices — both to the benefit of equity investors. Emerging market equities and many industrial commodities have fared less well, due to reduced growth expectations in most developing markets and significant shifts in the asset allocations of global investors toward the developed markets. Because the recent appreciation of developed-world equity markets has outpaced profit growth, valuation multiples have expanded and the opportunity set seems more narrow today for value-oriented investors. For example, over the past three years, the expected price-to-earnings multiple for the MSCI ACWI portfolio has increased from 11.9x to 15.4x. In this setting, we believe the Fund’s geographic flexibility could be a virtue. We have modestly increased our exposure to emerging markets this year.
We urge fellow shareholders of the Fund to maintain a long-term investment perspective. Recent years have been notably rewarding, yet we continue to expect periods of volatility. The strategy of the Thornburg Global Opportunities Fund is based on fundamental analysis of individual businesses. The performance of the Fund since 2006 suggests that this investment framework can add value over time.
Thank you for being a shareholder of the Thornburg Global Opportunities Fund. Remember that you can review descriptions of many of the stocks in your portfolio at www.thornburg.com/funds.
Best wishes for a terrific summer.
Sincerely,
| | | | |
 | |  | | |
| Brian McMahon | | W. Vinson Walden,CFA | | |
| Portfolio Manager | | Portfolio Manager | | |
| CEO & Chief Investment Officer | | Managing Director | | |
The matters discussed in this report may constitute forward-looking statements made pursuant to the safe harbor provisions of the Securities Litigation Reform Act of 1995. These include any advisor or portfolio manager prediction, assessment, analysis or outlook for individual securities, industries, investment styles, market sectors and/or markets. These statements involve risks and uncertainties. In addition to the general risks described for each fund in its current prospectus, other factors bearing on these reports include the accuracy of the advisor’s or portfolio manager’s forecasts and predictions, the appropriateness of the investment strategies designed by the advisor or portfolio manager and the ability of the advisor or portfolio manager to implement their strategies efficiently and successfully. Any one or more of these factors, as well as other risks affecting the securities markets generally, could cause the actual results of any fund to differ materially as compared to its benchmarks.
8 Certified Semi-Annual Report
This page intentionally left blank.
Certified Semi-Annual Report 9
| | |
| Schedule of Investments | | |
| |
Thornburg Global Opportunities Fund | | March 31, 2014 (Unaudited) |
Top Ten Equity Holdings
As of 3/31/14
| | | | |
Level 3 Communications, Inc. | | | 5.4 | % |
Valeant Pharmaceuticals International, Inc. | | | 5.2 | % |
InterXion Holding NV | | | 5.2 | % |
EchoStar Corp. | | | 4.3 | % |
Numericable SAS | | | 4.1 | % |
Ryman Hospitality Properties, Inc. | | | 3.9 | % |
Express Scripts Holding Company | | | 3.9 | % |
Citigroup, Inc. | | | 3.9 | % |
BRF SA | | | 3.8 | % |
Apple, Inc. | | | 3.4 | % |
Summary of Industry Exposure
As of 3/31/14
| | | | |
Diversified Financials | | | 11.0 | % |
Software & Services | | | 10.7 | % |
Pharmaceuticals, Biotechnology & Life Sciences | | | 8.8 | % |
Technology Hardware & Equipment | | | 7.7 | % |
Real Estate | | | 5.8 | % |
Media | | | 5.4 | % |
Telecommunication Services | | | 5.4 | % |
Transportation | | | 5.2 | % |
Consumer Services | | | 5.1 | % |
Automobiles & Components | | | 5.1 | % |
Health Care Equipment & Services | | | 3.9 | % |
| Food, Beverage & Tobacco | | | 3.8 | % |
| Semiconductors & Semiconductor Equipment | | | 3.8 | % |
| Energy | | | 3.3 | % |
| Capital Goods | | | 2.4 | % |
| Food & Staples Retailing | | | 2.0 | % |
| Commercial & Professional Services | | | 1.0 | % |
| Materials | | | 0.6 | % |
| Consumer Durables & Apparel | | | 0.5 | % |
| Exchange-Traded Funds | | | 0.1 | % |
| Other Assets & Liabilities | | | 8.4 | % |
| | | | |
Summary of Country Exposure
As of 3/31/14 (percent of equity holdings)
| | | | |
United States | | | 46.5 | % |
Netherlands | | | 11.7 | % |
Canada | | | 9.3 | % |
South Korea | | | 6.1 | % |
Brazil | | | 4.7 | % |
China | | | 4.6 | % |
| France | | | 4.5 | % |
| Switzerland | | | 3.8 | % |
| United Kingdom | | | 3.7 | % |
| Ireland | | | 2.6 | % |
| Singapore | | | 1.4 | % |
| Australia | | | 1.1 | % |
10 Certified Semi-Annual Report
| | |
| Schedule of Investments, continued | | |
| |
Thornburg Global Opportunities Fund | | March 31, 2014 (Unaudited) |
| | | | | | | | |
| | | SHARES/
PRINCIPAL AMOUNT | | | VALUE | |
COMMON STOCK — 91.48% | | | | | | | | |
AUTOMOBILES & COMPONENTS — 5.11% | | | | | | | | |
Auto Components — 3.33% | | | | | | | | |
Delphi Automotive plc | | | 310,700 | | | $ | 21,084,102 | |
Automobiles — 1.78% | | | | | | | | |
General Motors Co. | | | 327,800 | | | | 11,282,876 | |
| | | | | | | | |
| | | | | | | 32,366,978 | |
| | | | | | | | |
CAPITAL GOODS — 2.41% | | | | | | | | |
Trading Companies & Distributors — 2.41% | | | | | | | | |
Fly Leasing Ltd. ADR | | | 1,017,995 | | | | 15,269,925 | |
| | | | | | | | |
| | | | | | | 15,269,925 | |
| | | | | | | | |
COMMERCIAL & PROFESSIONAL SERVICES — 1.03% | | | | | | | | |
Commercial Services & Supplies — 1.03% | | | | | | | | |
Mineral Resources Ltd. | | | 611,239 | | | | 6,507,590 | |
| | | | | | | | |
| | | | | | | 6,507,590 | |
| | | | | | | | |
CONSUMER DURABLES & APPAREL — 0.51% | | | | | | | | |
Household Durables — 0.51% | | | | | | | | |
a PDG Realty SA | | | 5,057,800 | | | | 3,209,886 | |
| | | | | | | | |
| | | | | | | 3,209,886 | |
| | | | | | | | |
CONSUMER SERVICES — 5.12% | | | | | | | | |
Hotels, Restaurants & Leisure — 5.12% | | | | | | | | |
a Galaxy Entertainment Group Ltd. | | | 1,333,109 | | | | 11,601,219 | |
Paradise Co. Ltd. | | | 682,174 | | | | 20,796,230 | |
| | | | | | | | |
| | | | | | | 32,397,449 | |
| | | | | | | | |
DIVERSIFIED FINANCIALS — 10.93% | | | | | | | | |
Capital Markets — 2.25% | | | | | | | | |
UBS AG | | | 689,946 | | | | 14,250,793 | |
Consumer Finance — 2.12% | | | | | | | | |
Capital One Financial Corp. | | | 174,042 | | | | 13,429,081 | |
Diversified Financial Services — 6.56% | | | | | | | | |
Citigroup, Inc. | | | 516,390 | | | | 24,580,164 | |
a ING Groep N.V. | | | 1,196,610 | | | | 16,938,433 | |
| | | | | | | | |
| | | | | | | 69,198,471 | |
| | | | | | | | |
ENERGY — 3.28% | | | | | | | | |
Oil, Gas & Consumable Fuels — 3.28% | | | | | | | | |
a Bankers Petroleum Ltd. | | | 4,266,495 | | | | 20,763,223 | |
| | | | | | | | |
| | | | | | | 20,763,223 | |
| | | | | | | | |
FOOD & STAPLES RETAILING — 2.03% | | | | | | | | |
Food & Staples Retailing — 2.03% | | | | | | | | |
Walgreen Co. | | | 195,150 | | | | 12,885,754 | |
| | | | | | | | |
| | | | | | | 12,885,754 | |
| | | | | | | | |
FOOD, BEVERAGE & TOBACCO — 3.81% | | | | | | | | |
Food Products — 3.81% | | | | | | | | |
BRF SA | | | 1,209,400 | | | | 24,145,359 | |
| | | | | | | | |
| | | | | | | 24,145,359 | |
| | | | | | | | |
HEALTH CARE EQUIPMENT & SERVICES — 3.93% | | | | | | | | |
Health Care Providers & Services — 3.93% | | | | | | | | |
a Express Scripts Holding Company | | | 331,100 | | | | 24,862,299 | |
| | | | | | | | |
| | | | | | | 24,862,299 | |
| | | | | | | | |
MATERIALS — 0.62% | | | | | | | | |
Metals & Mining — 0.62% | | | | | | | | |
a Constellium N.V. | | | 134,500 | | | | 3,947,575 | |
| | | | | | | | |
| | | | | | | 3,947,575 | |
| | | | | | | | |
Certified Semi-Annual Report 11
| | |
| Schedule of Investments, continued | | |
| |
Thornburg Global Opportunities Fund | | March 31, 2014 (Unaudited) |
| | | | | | | | |
| | | SHARES/
PRINCIPAL AMOUNT | | | VALUE | |
MEDIA — 5.42% | | | | | | | | |
Media — 5.42% | | | | | | | | |
Asian Pay Television Trust | | | 13,664,793 | | | $ | 8,038,753 | |
a Numericable SAS | | | 668,078 | | | | 26,258,366 | |
| | | | | | | | |
| | | | | | | 34,297,119 | |
| | | | | | | | |
PHARMACEUTICALS, BIOTECHNOLOGY & LIFE SCIENCES — 8.78% | | | | | | | | |
Pharmaceuticals — 8.78% | | | | | | | | |
a Endo International plc | | | 214,200 | | | | 14,704,830 | |
Roche Holding AG | | | 26,580 | | | | 7,967,536 | |
a Valeant Pharmaceuticals International, Inc. | | | 249,517 | | | | 32,893,826 | |
| | | | | | | | |
| | | | | | | 55,566,192 | |
| | | | | | | | |
REAL ESTATE — 5.78% | | | | | | | | |
Real Estate Investment Trusts — 5.78% | | | | | | | | |
Ryman Hospitality Properties, Inc. | | | 586,259 | | | | 24,927,733 | |
Gaming & Leisure Properties, Inc. | | | 320,000 | | | | 11,667,200 | |
| | | | | | | | |
| | | | | | | 36,594,933 | |
| | | | | | | | |
SEMICONDUCTORS & SEMICONDUCTOR EQUIPMENT — 3.77% | | | | | | | | |
Semiconductors & Semiconductor Equipment — 3.77% | | | | | | | | |
a Micron Technology, Inc. | | | 394,500 | | | | 9,333,870 | |
Samsung Electronics Co. Ltd. | | | 11,496 | | | | 14,504,324 | |
| | | | | | | | |
| | | | | | | 23,838,194 | |
| | | | | | | | |
SOFTWARE & SERVICES — 10.64% | | | | | | | | |
Information Technology Services — 5.15% | | | | | | | | |
a InterXion Holding NV | | | 1,359,787 | | | | 32,607,692 | |
Internet Software & Services — 5.49% | | | | | | | | |
a Baidu, Inc. ADR | | | 97,000 | | | | 14,780,860 | |
a Google, Inc. | | | 17,908 | | | | 19,958,645 | |
| | | | | | | | |
| | | | | | | 67,347,197 | |
| | | | | | | | |
TECHNOLOGY HARDWARE & EQUIPMENT — 7.72% | | | | | | | | |
Communications Equipment — 4.28% | | | | | | | | |
a EchoStar Corp. | | | 568,872 | | | | 27,055,552 | |
Technology, Hardware, Storage & Periphals — 3.44% | | | | | | | | |
Apple, Inc. | | | 40,605 | | | | 21,794,328 | |
| | | | | | | | |
| | | | | | | 48,849,880 | |
| | | | | | | | |
TELECOMMUNICATION SERVICES — 5.38% | | | | | | | | |
Diversified Telecommunication Services — 5.38% | | | | | | | | |
a Level 3 Communications, Inc. | | | 869,800 | | | | 34,043,972 | |
| | | | | | | | |
| | | | | | | 34,043,972 | |
| | | | | | | | |
TRANSPORTATION — 5.21% | | | | | | | | |
Air Freight & Logistics — 2.27% | | | | | | | | |
TNT Express N.V. | | | 1,465,900 | | | | 14,396,991 | |
Airlines — 2.94% | | | 507,600 | | | | 18,578,160 | |
| | | | | | | | |
a American Airlines Group, Inc. | | | | | | | 32,975,151 | |
| | | | | | | | |
TOTAL COMMON STOCK (Cost $454,243,898) | | | | | | | 579,067,147 | |
| | | | | | | | |
EXCHANGE-TRADED FUNDS— 0.08% | | | | | | | | |
a SPDR Gold Trust | | | 4,160 | | | | 514,218 | |
| | | | | | | | |
TOTAL EXCHANGE-TRADED FUNDS (Cost $640,605) | | | | | | | 514,218 | |
| | | | | | | | |
12 Certified Semi-Annual Report
| | |
| Schedule of Investments, continued | | |
| |
Thornburg Global Opportunities Fund | | March 31, 2014 (Unaudited) |
| | | | | | | | |
| | | SHARES/
PRINCIPAL
AMOUNT | | | VALUE | |
SHORT TERM INVESTMENTS — 8.22% | | | | | | | | |
Ameren Corp., 0.20%, 4/1/2014 | | $ | 9,000,000 | | | $ | 9,000,000 | |
Bank of New York Tri-Party Repurchase Agreement 0.24% dated 3/31/2014 due 4/1/2014, repurchase price $8,000,053 collateralized by 16 corporate debt securities and 2 U. S. government debt securities, having an average coupon of 4.92%, a minimum credit rating of BBB-, maturity dates from 9/15/2018 to 3/30/2044, and having an aggregate market value of $8,441,249 at 3/31/2014 | | | 8,000,000 | | | | 8,000,000 | |
Hitachi America Capital, 0.22%, 4/3/2014 | | | 9,000,000 | | | | 8,999,890 | |
Kansas City Power & Light, 0.20%, 4/1/2014 | | | 8,000,000 | | | | 8,000,000 | |
Plains All American Pipeline, 0.25%, 4/1/2014 | | | 9,000,000 | | | | 9,000,000 | |
Union Electric Co., 0.20%, 4/1/2014 | | | 9,000,000 | | | | 9,000,000 | |
| | | | | | | | |
TOTAL SHORT TERM INVESTMENTS (Cost $51,999,890) | | | | | | | 51,999,890 | |
| | | | | | | | |
TOTAL INVESTMENTS — 99.78% (Cost $506,884,393) | | | | | | $ | 631,581,255 | |
OTHER ASSETS LESS LIABILITIES — 0.22% | | | | | | | 1,411,505 | |
| | | | | | | | |
NET ASSETS — 100.00% | | | | | | $ | 632,992,760 | |
| | | | | | | | |
Footnote Legend
Portfolio Abbreviations
To simplify the listings of securities, abbreviations are used per the table below:
| | |
| ADR | | American Depository Receipt |
See notes to financial statements.
Certified Semi-Annual Report 13
| | |
| Statement of Assets and Liabilities | | |
| |
Thornburg Global Opportunities Fund | | March 31, 2014 (Unaudited) |
| | | | |
ASSETS | | | | |
Investments at value (cost $506,884,393) (Note 2) | | $ | 631,581,255 | |
Cash | | | 203,292 | |
Receivable for investments sold | | | 1,561,103 | |
Receivable for fund shares sold | | | 1,849,523 | |
Unrealized appreciation on forward currency contracts (Note 7) | | | 557,701 | |
Dividends receivable | | | 911,714 | |
Dividend and interest reclaim receivable | | | 206,599 | |
Interest receivable | | | 53 | |
Prepaid expenses and other assets | | | 56,355 | |
| | | | |
Total Assets | | | 636,927,595 | |
| | | | |
| |
LIABILITIES | | | | |
Payable for investments purchased | | | 2,113,173 | |
Payable for fund shares redeemed | | | 336,373 | |
Unrealized depreciation on forward currency contracts (Note 7) | | | 752,162 | |
Payable to investment advisor and other affiliates (Note 3) | | | 584,642 | |
Accounts payable and accrued expenses | | | 148,343 | |
Dividends payable | | | 142 | |
| | | | |
Total Liabilities | | | 3,934,835 | |
| | | | |
| |
NET ASSETS | | $ | 632,992,760 | |
| | | | |
NET ASSETS CONSIST OF | | | | |
Distribution in excess of net investment income | | $ | (2,672,022 | ) |
Net unrealized appreciation on investments | | | 124,578,929 | |
Accumulated net realized gain (loss) | | | (117,996,657 | ) |
Net capital paid in on shares of beneficial interest | | | 629,082,510 | |
| | | | |
| | $ | 632,992,760 | |
| | | | |
14 Certified Semi-Annual Report
| | |
| Statement of Assets and Liabilities, continued | | |
| |
Thornburg Global Opportunities Fund | | March 31, 2014 (Unaudited) |
| | | | |
NET ASSET VALUE | | | | |
| |
Class A Shares: | | | | |
Net asset value and redemption price per share ($132,918,394 applicable to 6,000,375 shares of beneficial interest outstanding—Note 4) | | $ | 22.15 | |
Maximum sales charge, 4.50% of offering price | | | 1.04 | |
| | | | |
Maximum offering price per share | | $ | 23.19 | |
| | | | |
| |
Class C Shares: | | | | |
Net asset value and offering price per share*
($106,113,702 applicable to 4,883,898 shares of beneficial interest outstanding—Note 4) | | $ | 21.73 | |
| | | | |
| |
Class I Shares: | | | | |
Net asset value, offering and redemption price per share ($323,809,270 applicable to 14,585,506 shares of beneficial interest outstanding—Note 4) | | $ | 22.20 | |
| | | | |
| |
Class R3 Shares: | | | | |
Net asset value, offering and redemption price per share ($1,968,628 applicable to 89,648 shares of beneficial interest outstanding—Note 4) | | $ | 21.96 | |
| | | | |
| |
Class R4 Shares: | | | | |
Net asset value, offering and redemption price per share
($2,900,945 applicable to 131,871 shares of beneficial interest outstanding—Note 4) | | $ | 22.00 | |
| | | | |
| |
Class R5 Shares: | | | | |
Net asset value, offering and redemption price per share ($65,281,821 applicable to 2,938,511 shares of beneficial interest outstanding—Note 4) | | $ | 22.22 | |
| | | | |
| * | Redemption price per share is equal to net asset value less any applicable contingent deferred sales charge. |
See notes to financial statements.
Certified Semi-Annual Report 15
| | |
| Statement of Operations | | |
| |
Thornburg Global Opportunities Fund | | Six Months Ended March 31, 2014 (Unaudited) |
| | | | |
INVESTMENT INCOME | | | | |
Dividend income (net of foreign taxes withheld of $178,321) | | $ | 4,012,284 | |
Interest income | | | 38,776 | |
| | | | |
Total Income | | | 4,051,060 | |
| | | | |
| |
EXPENSES | | | | |
Investment advisory fees (Note 3) | | | 2,417,246 | |
Administration fees (Note 3) | | | | |
Class A Shares | | | 70,702 | |
Class C Shares | | | 60,619 | |
Class I Shares | | | 72,132 | |
Class R3 Shares | | | 1,142 | |
Class R4 Shares | | | 1,621 | |
Class R5 Shares | | | 13,188 | |
Distribution and service fees (Note 3) | | | | |
Class A Shares | | | 141,715 | |
Class C Shares | | | 485,633 | |
Class R3 Shares | | | 4,595 | |
Class R4 Shares | | | 3,250 | |
Transfer agent fees | | | | |
Class A Shares | | | 44,565 | |
Class C Shares | | | 50,310 | |
Class I Shares | | | 107,053 | |
Class R3 Shares | | | 2,654 | |
Class R4 Shares | | | 4,493 | |
Class R5 Shares | | | 28,336 | |
Registration and filing fees | | | | |
Class A Shares | | | 9,351 | |
Class C Shares | | | 8,849 | |
Class I Shares | | | 13,270 | |
Class R3 Shares | | | 6,063 | |
Class R4 Shares | | | 8,530 | |
Class R5 Shares | | | 8,666 | |
Custodian fees (Note 3) | | | 74,971 | |
Professional fees | | | 30,999 | |
Accounting fees | | | 6,459 | |
Trustee fees | | | 8,495 | |
Other expenses | | | 33,615 | |
| | | | |
Total Expenses | | | 3,718,522 | |
| |
Less: | | | | |
Expenses reimbursed by investment advisor (Note 3) | | | (153,333 | ) |
Fees paid indirectly (Note 3) | | | (71 | ) |
| | | | |
Net Expenses | | | 3,565,118 | |
| | | | |
Net Investment Income | | $ | 485,942 | |
| | | | |
16 Certified Semi-Annual Report
| | |
| Statement of Operations, continued | | |
| |
Thornburg Global Opportunities Fund | | Six Months Ended March 31, 2014 (Unaudited) |
| | | | |
REALIZED AND UNREALIZED GAIN (LOSS) | | | | |
Net realized gain (loss) from: | | | | |
Investments | | $ | 33,832,368 | |
Forward currency contracts (Note 7) | | | (1,282,032 | ) |
Foreign currency transactions | | | (110,105 | ) |
| | | | |
| | | 32,440,231 | |
| | | | |
Net change in unrealized appreciation (depreciation) on: | | | | |
Investments | | | 31,072,750 | |
Foreign currency translations | | | 6,562 | |
Forward currency contracts (Note 7) | | | 404,530 | |
| | | | |
| | | 31,483,842 | |
| | | | |
Net Realized and Unrealized Gain | | | 63,924,073 | |
| | | | |
Net Increase in Net Assets Resulting from Operations | | $ | 64,410,015 | |
| | | | |
See notes to financial statements.
Certified Semi-Annual Report 17
| | |
| Statements of Changes in Net Assets | | |
| |
Thornburg Global Opportunities Fund | | |
| | | | | | | | |
| | | SIX MONTHS ENDED
MARCH 31, 2014* | | | YEAR ENDED
SEPTEMBER 30, 2013 | |
INCREASE (DECREASE) IN NET ASSETS FROM | | | | | | | | |
| | |
OPERATIONS | | | | | | | | |
Net investment income | | $ | 485,942 | | | $ | 3,028,820 | |
Net realized gain (loss) on investments, forward currency contracts, and foreign currency transactions | | | 32,440,231 | | | | 34,117,989 | |
Net unrealized appreciation (depreciation) on investments, forward currency contracts, and foreign currency translations | | | 31,483,842 | | | | 55,095,058 | |
| | | | | | | | |
Net Increase (Decrease) in Net Assets Resulting from Operations | | | 64,410,015 | | | | 92,241,867 | |
| | |
DIVIDENDS TO SHAREHOLDERS | | | | | | | | |
From net investment income | | | | | | | | |
Class A Shares | | | (276,892 | ) | | | (718,838 | ) |
Class C Shares | | | (72,787 | ) | | | – | |
Class I Shares | | | (1,017,615 | ) | | | (3,552,432 | ) |
Class R3 Shares | | | (4,336 | ) | | | (15,293 | ) |
Class R4 Shares | | | (7,111 | ) | | | (18,722 | ) |
Class R5 Shares | | | (177,425 | ) | | | (880,174 | ) |
FUND SHARE TRANSACTIONS (NOTE 4) | | | | | | | | |
Class A Shares | | | 23,524,664 | | | | 1,325,826 | |
Class C Shares | | | 7,448,415 | | | | (6,075,308 | ) |
Class I Shares | | | 41,610,870 | | | | 38,975,631 | |
Class R3 Shares | | | 107,829 | | | | 481,465 | |
Class R4 Shares | | | 449,675 | | | | 460,617 | |
Class R5 Shares | | | 10,214,248 | | | | (11,216,085 | ) |
| | | | | | | | |
Net Increase in Net Assets | | | 146,209,550 | | | | 111,008,554 | |
NET ASSETS | | | | | | | | |
Beginning of Period | | | 486,783,210 | | | | 375,774,656 | |
| | | | | | | | |
| | |
End of Period | | $ | 632,992,760 | | | $ | 486,783,210 | |
| | | | | | | | |
Distribution in excess of net investment income | | $ | (2,672,022 | ) | | $ | (1,505,544 | ) |
See notes to financial statements.
18 Certified Semi-Annual Report
| | |
| Notes to Financial Statements | | |
| |
Thornburg Global Opportunities Fund | | March 31, 2014 (Unaudited) |
NOTE 1 – ORGANIZATION
Thornburg Global Opportunities Fund, hereinafter referred to as the “Fund,” is a diversified series of Thornburg Investment Trust (the “Trust”). The Trust is organized as a Massachusetts business trust under a Declaration of Trust dated June 3, 1987 and is registered as a diversified, open-end management investment company under the Investment Company Act of 1940, as amended. The Fund is currently one of eighteen separate series of the Trust. Each series is considered to be a separate entity for financial reporting and tax purposes and bears expenses directly attributable to it. The Fund seeks long-term capital appreciation by investing in equity and debt securities of all types from issuers around the world.
The Fund currently offers six classes of shares of beneficial interest: Class A, Class C, Institutional Class (“Class I”), and Retirement Classes (“Class R3,” “Class R4,” and “Class R5”). Each class of shares of the Fund represents an interest in the same portfolio of investments, except that (i) Class A shares are sold subject to a front-end sales charge collected at the time the shares are purchased and bear a service fee, (ii) Class C shares are sold at net asset value without a sales charge at the time of purchase, but are subject to a contingent deferred sales charge upon redemption within one year of purchase, and bear both a service fee and a distribution fee, (iii) Class I and Class R5 shares are sold at net asset value without a sales charge at the time of purchase and may be subject to a service fee, (iv) Class R3 shares are sold at net asset value without a sales charge at the time of purchase, but bear both a service fee and distribution fee, (v) Class R4 shares are sold at net asset value without a sales charge at the time of purchase, but bear a service fee, and (vi) the respective classes may have different reinvestment privileges and conversion rights. Additionally, the Fund may allocate among its classes certain expenses, to the extent allocable to specific classes, including transfer agent fees, government registration fees, certain printing and postage costs, and administrative and legal expenses. Currently, class specific expenses of the Fund are limited to service and distribution fees, administration fees, and certain registration and transfer agent expenses.
NOTE 2 – SIGNIFICANT ACCOUNTING POLICIES
Significant accounting policies of the Trust are as follows:
Valuation Policy and Procedures: The Fund’s Trustees of the Trust (the “Trustees”) have authorized employees of the Fund’s investment advisor, acting as the Valuation and Pricing Committee (the “Committee”), to make certain valuation determinations, subject to oversight and review by the Trustees and the Audit Committee of the Trustees. The Committee and other employees of the Fund’s investment advisor administer and implement the valuation process. The Committee regularly reviews its own fair value decisions, as well as valuations, valuation techniques and services furnished by pricing services, considers circumstances in the markets which may require valuation determinations by the Committee and reviews previous valuation determinations. The Committee also reports on its activities, the performance of the pricing services and other matters to the Trustees and the Audit Committee of the Trustees.
In determining a fair value for a portfolio investment, the Committee seeks to determine the price that the Fund would reasonably expect to receive upon a sale of the investment in an orderly transaction between market participants at the measurement date. Typically, the fair value process employs standing instructions to use quoted prices in active markets or the use of independent pricing services. Less frequently, the Committee may make a fair value determination using other methods. However, because fair value prices are estimated prices, the determination of fair value for an investment may differ from the value that would be realized by the Fund upon a sale of the investment, and that difference could be material to the Fund’s financial statements. The Committee’s determination of fair value for an investment may also differ from the prices obtained by other persons (including other mutual funds) for the investment.
Valuation of Investments: Portfolio investments listed or traded on a national securities exchange are valued on the valuation date at the last reported trade price on the exchange that is the primary market for the investment. Portfolio investments traded on an exchange for which there has been no trade that day and other equity investments traded in the over-the-counter market are valued at the mean between the last reported bid and ask prices. Portfolio investments reported by NASDAQ are valued at the NASDAQ official closing price. Any foreign investment traded on exchanges outside the United States is valued at the price of the investment on the exchange that is normally the investment’s primary market, as of the close of that exchange preceding the time of the Fund’s valuation measurement date.
In any case when the market value of an equity investment held by the Fund is not readily available, a determination of a fair value for the investment is made by the Committee. The Committee’s determinations are made using procedures in accordance with a policy approved by the Trustees, which may include the use of a price obtained from an independent pricing service. The pricing service ordinarily values equity investments in these instances using multi-factor models to adjust market prices based upon various inputs, including exchange data, depository receipt prices, futures, index data and other data. An investment’s market value is deemed not readily available whenever the exchange or market on which the investment is primarily traded is closed for the entire scheduled day of trading. Additionally, an investment’s market value may be deemed not readily available under other circumstances identified by the Trustees, including when developments occurring after the most recent close of the investment’s primary exchange or market, but before the most recent close of trading in Fund shares, or an unusual event or significant period of time occurring since the availability of a market quotation, create a question about the reliability of the investment’s market value. On days when market volatility thresholds pre-determined by the Trustees are exceeded, foreign equity investments held by the Fund may be valued using synthetic pricing obtained from
Certified Semi-Annual Report 19
| | |
| Notes to Financial Statements, Continued | | |
| |
Thornburg Global Opportunities Fund | | March 31, 2014 (Unaudited) |
an independent pricing service approved by the Trustees, subject to the ability of the Committee to determine in any such instance to utilize market closing prices if the Committee considers closing prices to be more reliable.
Debt obligations held by the Fund have a primary over-the-counter market and are valued by an independent pricing service approved by the Trustees. The pricing service ordinarily values debt obligations at quoted bid prices. When quotations are not available, debt obligations held by the Fund are valued at evaluated prices determined by the pricing service using methods which include consideration of yields or prices of debt obligations of comparable quality, type of issue, coupon, maturity and rating, and indications as to value from dealers and general market conditions. Short-term obligations having remaining maturities of 60 days or less are ordinarily valued at amortized cost, which approximates market value.
In any case when a pricing service fails to provide a price for a debt obligation held by the Fund, the Committee determines a fair value for the debt obligation using procedures in accordance with a policy approved by the Trustees, which may include the use of a price obtained from a different independent pricing service. Additionally, in any case when management believes that a price provided by a pricing service for a debt obligation held by the Fund may be unreliable, the Committee decides whether or not to use the pricing service’s valuation or to use an alternative method to determine a fair value for the debt obligation.
Quotations in foreign currencies for foreign portfolio investments are converted to U.S. dollar equivalents using the foreign exchange quotation in effect at the time of valuation.
Valuation Measurements: The Fund categorizes its investments based upon the inputs used in valuing those investments, according to a three-level hierarchy established by guidance from the Financial Accounting Standards Board (the “FASB”). Categorization of investments using this hierarchy is intended by the FASB to maximize the use of observable inputs and minimize the use of unobservable inputs by prioritizing that the most observable input be used when available. Observable inputs are those that market participants would use in valuing an investment based on available market data. Unobservable inputs are those that reflect assumptions about the information market participants would use in valuing an investment. An investment’s level within the hierarchy is based on the lowest level input that is deemed significant to the fair value measurement. The methodologies and relative inputs used to value investments are not necessarily indications of the risk or liquidity associated with investing in those investments.
Various inputs are used in determining the fair value measurement of the Fund’s investments. These inputs are generally summarized according to the three-level hierarchy below:
Level 1: Quoted prices in active markets for identical investments.
Level 2: Other direct or indirect significant observable inputs (including quoted prices for similar investments in active markets and other observable inputs, such as interest rates, prepayment rates, credit risk, etc.).
When market volatility thresholds are exceeded, foreign equity investments may be fair valued according to other significant observable inputs rather than quoted market prices. The affected investments will be characterized as Level 2 within the valuation hierarchy and revert to Level 1 after the threshold is no longer exceeded.
Level 3: Significant unobservable inputs, (including the Committee’s own assumptions in determining the fair value of investments), are generally applicable to investments fair valued with single broker quotes and other investments.
Portfolio investments with minimal, if any, market activity are characterized as Level 3 and are valued using significant unobservable inputs, typically including single broker quotes, which may be adjusted or unadjusted, related or comparable investments, last available transactions, and other relevant information. Valuations may also be based upon current market prices of securities that are comparable in coupon, rating, maturity and industry. An income based valuation approach would consider discounted anticipated future cash flows of the investment. Discounts may also be applied due to the nature or duration of any restrictions on the disposition of the investment. The derived value of a Level 3 investment may not represent the value which is received upon disposition.
20 Certified Semi-Annual Report
| | |
| Notes to Financial Statements, Continued | | |
| |
Thornburg Global Opportunities Fund | | March 31, 2014 (Unaudited) |
The following table displays a summary of the fair value hierarchy measurements of the Fund’s investments as of March 31, 2014. In any instance when valuation inputs from more than one level are used to determine the fair value of a specific investment, the investment is placed in the level of the table based upon the lowest level input that is significant in determining the fair value of the investment:
| | | | | | | | | | | | | | | | |
| | | FAIR VALUE MEASUREMENTS AT MARCH 31, 2014 | |
| | | TOTAL | | | LEVEL 1 | | | LEVEL 2 | | | LEVEL 3 | |
Assets | | | | | | | | | | | | | | | | |
Investments in Securities* | | | | | | | | | | | | | | | | |
Common Stock | | $ | 579,067,147 | | | $ | 579,067,147 | | | $ | — | | | $ | — | |
Exchange–Traded Funds | | | 514,218 | | | | 514,218 | | | | — | | | | — | |
Short Term Investments | | | 51,999,890 | | | | — | | | | 51,999,890 | | | | — | |
| | | | | | | | | | | | | | | | |
Total Investments in Securities | | $ | 631,581,255 | | | $ | 579,581,365 | | | $ | 51,999,890 | | | $ | — | |
Other Financial Instruments** | | | | | | | | | | | | | | | | |
Forward Currency Contracts | | $ | 557,701 | | | $ | — | | | $ | 557,701 | | | $ | — | |
Spot Currency | | $ | 124 | | | $ | 124 | | | $ | — | | | $ | — | |
Liabilities | | | | | | | | | | | | | | | | |
Other Financial Instruments** | | | | | | | | | | | | | | | | |
Forward Currency Contracts | | $ | (752,162 | ) | | $ | — | | | $ | (752,162 | ) | | $ | — | |
| * | See Schedule of Investments for a summary of the industry exposure as grouped according to the Global Industry Classification Standard (GICS), which is an industry taxonomy developed by MSCI, Inc. and Standard & Poor’s (S&P). |
| ** | Other Financial Instruments include investments not reflected in the Schedule of Investments, which may include futures, forwards and swap contracts, which are valued at the unrealized appreciation (depreciation) on the investment. |
In accordance with the guidance prescribed in Accounting Standards Update No. 2011-04, it is the policy of the Fund to recognize transfers between levels and those underlying events which caused the movement. The Fund recognized no transfers between levels for the six months ended March 31, 2014, other than when the Fund exceeded market volatility thresholds for foreign equity investments during the period.
Foreign Currency Translation: Portfolio investments and other assets and liabilities denominated in foreign currencies are translated into U.S. dollars based on the exchange rate of such currencies against the U.S. dollar on the date of valuation. Purchases and sales of investments and income items denominated in foreign currencies are translated into U.S. dollars at the exchange rate in effect on the transaction date. When the Fund purchases or sells foreign investments, it will customarily enter into a foreign exchange contract to minimize foreign exchange risk from the trade date to the settlement date of such transactions. The values of such spot contracts are included in receivable for investments sold and payable for investments purchased on the Statement of Assets and Liabilities.
The Fund does not separately report the effect of changes in foreign exchange rates from changes in market prices on investments held. Such changes are included in net unrealized appreciation or depreciation from investments.
Reported net realized gains or losses from foreign currency transactions arise due to purchases and sales of foreign currencies, currency gains or losses realized between the trade and settlement dates on investment transactions and the difference between the amounts of dividends, interest, and foreign withholding taxes recorded on the Fund’s books, and the U.S. dollar equivalent of the amounts actually received or paid.
Net change in unrealized appreciation and depreciation on foreign currency translations arise from changes in the fair value of assets and liabilities, other than investments at fiscal period end, resulting from changes in exchange rates.
Deferred Taxes: The Fund is subject to a tax imposed on net realized gains of securities of certain foreign countries. The Fund records an estimated deferred tax liability for net unrealized gains on these investments as reflected in the accompanying financial statements.
Federal Income Taxes: It is the policy of the Trust to comply with the provisions of the Internal Revenue Code applicable to “regulated investment companies” and to distribute to shareholders substantially all taxable income, including any net realized gain on investments of the Fund. Therefore, no provision for federal income taxes is required.
Management reviews each uncertain tax position believed to be material to the preparation of the Fund’s financial statements, to assess if it is more likely than not that the position would be sustained upon examination, based upon the technical merits of the position. As of March 31, 2014, management has not identified any such position for which an asset or liability must be reflected in the Statement of Assets and Liabilities. The Fund’s tax returns remain subject to examination for three years after filing.
Certified Semi-Annual Report 21
| | |
| Notes to Financial Statements, Continued | | |
| |
Thornburg Global Opportunities Fund | | March 31, 2014 (Unaudited) |
When-Issued and Delayed Delivery Transactions: The Fund may engage in when-issued or delayed delivery transactions. To the extent the Fund engages in such transactions, it will do so for the purpose of acquiring portfolio investments consistent with the Fund’s investment objectives and not for the purpose of investment leverage or to speculate on interest rate and/or market changes. At the time the Fund makes a commitment to purchase an investment on a when-issued or delayed delivery basis, the Fund will record the transaction and reflect the value in determining its net asset value. When effecting such transactions, assets of an amount sufficient to make payment for the portfolio investments to be purchased will be segregated on the Fund’s records on the trade date. Investments purchased on a when-issued or delayed delivery basis do not earn interest until the settlement date.
Dividends: Dividends to shareholders, if any, are generally paid quarterly and are reinvested in additional shares of the Fund at net asset value per share at the close of business on the dividend payment date or, at the shareholder’s option, paid in cash. Net realized capital gains, to the extent available, will be distributed at least annually. Distributions to shareholders are based on income tax regulations and therefore, their characteristics may differ for financial statement and tax purposes.
Repurchase Agreements: The Fund may invest excess cash in repurchase agreements whereby the Fund purchases investments, which serve as collateral, with an agreement to resell such collateral to the seller at an agreed upon price at the maturity date of the repurchase agreement. Investments pledged as collateral for repurchase agreements are held in custody until maturity of the repurchase agreement. Provisions in the agreements require that the market value of the collateral is at least equal to the repurchase value in the event of default. In the event of default, the Fund has the right to liquidate the collateral and apply the proceeds in satisfaction of the obligation. Under certain circumstances, in the event of default or bankruptcy by the other party to the agreement, realization and/or retention of the collateral may be subject to legal proceedings.
General: Investment transactions are accounted for on a trade date basis. Interest income is accrued as earned and dividend income is recorded on the ex-dividend date. Certain income from foreign investments is recognized as soon as information is available to the Fund. Realized gains and losses from the sale of investments are recorded on an identified cost basis. Net investment income (other than class specific expenses) and realized and unrealized gains and losses are allocated daily to each class of shares based upon the relative net asset value of outstanding shares of each class of shares at the beginning of the day (after adjusting for the current share activity of the respective class). Expenses common to all Funds are allocated among the Funds comprising the Trust based upon their relative net asset values or other appropriate allocation methods.
Guarantees and Indemnifications: Under the Trust’s organizational documents (and under separate agreements with the independent Trustees), its officers and Trustees are indemnified against certain liabilities arising out of the performance of their duties to the Fund. Additionally, in the normal course of business the Trust enters into contracts with service providers that contain general indemnification clauses. The Trust’s maximum exposure under these arrangements is unknown. However, based on experience, the Trust expects the risk of loss to be remote.
Use of Estimates: The preparation of financial statements, in conformity with United States generally accepted accounting principles, requires management to make estimates and assumptions that affect the reported amounts of assets and liabilities and the disclosure of contingent assets and liabilities at the date of the financial statements and the reported amounts of increases and decreases in net assets from operations during the reporting period. Actual amounts could differ from those estimates.
NOTE 3 – INVESTMENT ADVISORY FEE AND OTHER TRANSACTIONS WITH AFFILIATES
Pursuant to an investment advisory agreement, Thornburg Investment Management, Inc. (the “Advisor”) serves as the investment advisor and performs services for the Fund for which the fees are payable at the end of each month. For the six months ended March 31, 2014, these fees were payable at annual rates ranging from .875 of 1% to .675 of 1% per annum of the average daily net assets of the Fund depending on the Fund’s asset size. The Trust also has entered into administrative services agreements with the Advisor, whereby the Advisor will perform certain administrative services for the shareholders of each class of the Fund’s shares, and for which fees will be payable at an annual rate of up to .125 of 1% per annum of the average daily net assets attributable to each class of shares.
The Trust has an underwriting agreement with Thornburg Securities Corporation (the “Distributor,” an affiliate of the Advisor), which acts as the distributor of the Fund’s shares. For the six months ended March 31, 2014, the Distributor has advised the Fund that it earned commissions aggregating $27,482 from the sale of Class A shares, and collected contingent deferred sales charges aggregating $1,830 from redemptions of Class C shares of the Fund.
Pursuant to a service plan under Rule 12b-1 of the Investment Company Act of 1940, the Fund may reimburse to the Advisor an amount not to exceed .25 of 1% per annum of the average daily net assets attributable to each class of shares of the Fund for payments made by the Advisor to securities dealers and other financial institutions to obtain various shareholder and distribution related services. For the six months ended March 31, 2014, there were no 12b-1 service plan fees charged for Class I and R5 shares. The Advisor may pay out of its own resources additional expenses for distribution of the Fund’s shares.
The Trust has also adopted distribution plans pursuant to Rule 12b-1, applicable only to the Fund’s Class C and Class R3 shares, under which the Fund compensates the Distributor for services in promoting the sale of Class C and Class R3 shares of the Fund at an annual
22 Certified Semi-Annual Report
| | |
| Notes to Financial Statements, Continued | | |
| |
Thornburg Global Opportunities Fund | | March 31, 2014 (Unaudited) |
rate of up to .75 of 1% per annum of the average daily net assets attributable to Class C shares, and an annual rate of up to .25 of 1% per annum of the average daily net assets attributable to Class R3 shares. Total fees incurred by each class of shares of the Fund under their respective service and distribution plans for the six months ended March 31, 2014, are set forth in the Statement of Operations.
The Advisor and Distributor have contractually agreed to waive fees and reimburse expenses incurred by the Fund so that actual expenses of certain share classes do not exceed specified levels. The agreement may be terminated by the Fund at any time, but may not be terminated by the Advisor or Distributor before February 1, 2015, unless the Advisor ceases to be the investment advisor to the Fund or the Distributor ceases to be the distributor of the Fund prior to that date. The Advisor and Distributor retain the right to be repaid by the Fund for fee waivers and expense reimbursements if expenses fall below the contractual limit prior to the end of the fiscal year.
For the six months ended March 31, 2014, the Advisor contractually reimbursed certain class specific expenses, administrative fees, and distribution fees of $99,265 for Class I shares, $9,207 for Class R3 shares, $11,739 for Class R4 shares, and $33,122 for Class R5 shares.
The Trust has an agreement with the custodian bank to indirectly pay a portion of the custodian’s fees through credits earned by the Fund’s cash on deposit with the bank. This deposit agreement is an alternative to overnight investments. Custodial fees are adjusted to reflect amounts that would have been paid without this agreement, with a corresponding adjustment reflected as fees paid indirectly in the Statement of Operations. For the six months ended March 31, 2014, fees paid indirectly were $71.
Certain officers and Trustees of the Trust are also officers or directors of the Advisor and Distributor. The compensation of independent Trustees is borne by the Trust.
NOTE 4 – SHARES OF BENEFICIAL INTEREST
At March 31, 2014, there were an unlimited number of shares of beneficial interest authorized. Transactions in shares of beneficial interest were as follows:
| | | | | | | | | | | | | | | | |
| | | SIX MONTHS ENDED MARCH 31, 2014 (UNAUDITED) | | | YEAR ENDED SEPTEMBER 30, 2013 (AUDITED) | |
| | | SHARES | | | AMOUNT | | | SHARES | | | AMOUNT | |
Class A Shares | | | | | | | | | | | | | | | | |
Shares sold | | | 1,538,322 | | | $ | 33,093,410 | | | | 1,046,884 | | | $ | 18,540,353 | |
Shares issued to shareholders in reinvestment of dividends | | | 12,590 | | | | 265,891 | | | | 37,924 | | | | 680,864 | |
Shares repurchased | | | (462,330 | ) | | | (9,834,637 | ) | | | (1,001,012 | ) | | | (17,895,391 | ) |
| | | | | | | | | | | | | | | | |
| | | | |
Net increase (decrease) | | | 1,088,582 | | | $ | 23,524,664 | | | | 83,796 | | | $ | 1,325,826 | |
| | | | | | | | | | | | | | | | |
| | | | |
Class C Shares | | | | | | | | | | | | | | | | |
Shares sold | | | 585,045 | | | $ | 12,299,928 | | | | 428,607 | | | $ | 7,505,412 | |
Shares issued to shareholders in reinvestment of dividends | | | 3,176 | | | | 65,901 | | | | — | | | | — | |
Shares repurchased | | | (234,819 | ) | | | (4,917,414 | ) | | | (789,625 | ) | | | (13,580,720 | ) |
| | | | | | | | | | | | | | | | |
| | | | |
Net increase (decrease) | | | 353,402 | | | $ | 7,448,415 | | | | (361,018 | ) | | $ | (6,075,308 | ) |
| | | | | | | | | | | | | | | | |
| | | | |
Class I Shares | | | | | | | | | | | | | | | | |
Shares sold | | | 3,418,020 | | | $ | 73,183,898 | | | | 4,300,906 | | | $ | 78,134,818 | |
Shares issued to shareholders in reinvestment of dividends | | | 42,854 | | | | 905,923 | | | | 184,266 | | | | 3,302,095 | |
Shares repurchased | | | (1,501,849 | ) | | | (32,478,951 | ) | | | (2,403,672 | ) | | | (42,461,282 | ) |
| | | | | | | | | | | | | | | | |
| | | | |
Net increase (decrease) | | | 1,959,025 | | | $ | 41,610,870 | | | | 2,081,500 | | | $ | 38,975,631 | |
| | | | | | | | | | | | | | | | |
| | | | |
Class R3 Shares | | | | | | | | | | | | | | | | |
Shares sold | | | 7,032 | | | $ | 148,025 | | | | 36,597 | | | $ | 621,846 | |
Shares issued to shareholders in reinvestment of dividends | | | 96 | | | | 2,008 | | | | 359 | | | | 6,326 | |
Shares repurchased | | | (2,012 | ) | | | (42,204 | ) | | | (8,663 | ) | | | (146,707 | ) |
| | | | | | | | | | | | | | | | |
| | | | |
Net increase (decrease) | | | 5,116 | | | $ | 107,829 | | | | 28,293 | | | $ | 481,465 | |
| | | | | | | | | | | | | | | | |
Certified Semi-Annual Report 23
| | |
| Notes to Financial Statements, Continued | | |
| |
Thornburg Global Opportunities Fund | | March 31, 2014 (Unaudited) |
| | | | | | | | | | | | | | | | |
| | | SIX MONTHS ENDED
MARCH 31, 2014 (UNAUDITED) | | | YEAR ENDED
SEPTEMBER 30, 2013 (AUDITED) | |
| | | SHARES | | | AMOUNT | | | SHARES | | | AMOUNT | |
Class R4 Shares | | | | | | | | | | | | | | | | |
Shares sold | | | 33,485 | | | $ | 708,728 | | | | 54,964 | | | $ | 960,249 | |
Shares issued to shareholders in reinvestment of dividends | | | 315 | | | | 6,603 | | | | 1,032 | | | | 18,376 | |
Shares repurchased | | | (12,274 | ) | | | (265,656 | ) | | | (29,237 | ) | | | (518,008 | ) |
| | | | | | | | | | | | | | | | |
| | | | |
Net increase (decrease) | | | 21,526 | | | $ | 449,675 | | | | 26,759 | | | $ | 460,617 | |
| | | | | | | | | | | | | | | | |
| | | | |
Class R5 Shares | | | | | | | | | | | | | | | | |
Shares sold | | | 655,880 | | | $ | 14,307,895 | | | | 134,426 | | | $ | 2,354,735 | |
Shares issued to shareholders in reinvestment of dividends | | | 8,386 | | | | 177,425 | | | | 49,731 | | | | 880,175 | |
Shares repurchased | | | (207,049 | ) | | | (4,271,072 | ) | | | (833,812 | ) | | | (14,450,995 | ) |
| | | | | | | | | | | | | | | | |
| | | | |
Net increase (decrease) | | | 457,217 | | | $ | 10,214,248 | | | | (649,655 | ) | | $ | (11,216,085 | ) |
| | | | | | | | | | | | | | | | |
NOTE 5 – INVESTMENT TRANSACTIONS
For the six months ended March 31, 2014, the Fund had purchase and sale transactions of investments (excluding short-term investments) of $259,716,996 and $201,651,513, respectively.
NOTE 6 – INCOME TAXES
At March 31, 2014, information on the tax components of capital was as follows:
| | | | |
Cost of investments for tax purposes | | $ | 506,884,393 | |
| | | | |
Gross unrealized appreciation on a tax basis | | $ | 138,936,415 | |
Gross unrealized depreciation on a tax basis | | | (14,239,553 | ) |
| | | | |
Net unrealized appreciation (depreciation) on investments (tax basis) | | $ | 124,696,862 | |
| | | | |
At March 31, 2014, the Fund had cumulative tax basis capital losses generated prior to October 1, 2011, which may be carried forward to offset future capital gains. To the extent such carryforwards are used, capital gain distributions may be reduced to the extent provided by regulations.
Such capital loss carryforwards expire as follows:
| | | | |
2017 | | $ | 7,829,388 | |
2018 | | | 140,739,212 | |
| | | | |
| | $ | 148,568,600 | |
| | | | |
NOTE 7 – DERIVATIVE FINANCIAL INSTRUMENTS WITH OFF-BALANCE SHEET RISK AND FOREIGN INVESTMENT RISK
The Fund may use a variety of derivative financial instruments to hedge or adjust the risks affecting its investment portfolio or to enhance investment returns. Provisions of FASB Accounting Standards Codification 815-10-50 (“ASC 815”), require certain disclosures. The disclosures are intended to provide users of financial statements with an understanding of the use of derivative instruments by the Fund and how these derivatives affect the financial position, financial performance and cash flows of the Fund. The Fund does not designate any derivative instruments as hedging instruments under ASC 815. During the six months ended March 31, 2014, the Fund’s principal exposure to derivative financial instruments of the type addressed by ASC 815 was investment in foreign exchange contracts.
24 Certified Semi-Annual Report
| | |
| Notes to Financial Statements, Continued | | |
| |
Thornburg Global Opportunities Fund | | March 31, 2014 (Unaudited) |
A foreign exchange contract is an agreement between two parties to exchange different currencies at a specified rate of exchange at an agreed upon future date. Foreign exchange contracts involve risks to the Fund, including the risk that a contract’s counterparty will not meet its obligations to the Fund, the risk that a change in a contract’s value may not correlate perfectly with the currency the contract was intended to track, and the risk that the advisor is unable to correctly implement its strategy in using a contract. In any such instance, the Fund may not achieve the intended benefit of entering into a contract, and may experience a loss. Additionally, the Fund’s risk of loss may exceed the amounts recognized on the Statement of Assets and Liabilities.
The Fund entered into forward currency contracts during the six months ended March 31, 2014 in the normal course of pursuing its investment objectives, with the objective of reducing the risk to the value of the Fund’s foreign investments from adverse changes in the relationship between the U.S. dollar and foreign currencies. In each case these contracts have been initiated in conjunction with foreign investment transactions.
These contracts are accounted for by the Fund under ASC 815. Unrealized appreciation and depreciation on outstanding contracts are reported in the Fund’s Statement of Assets and Liabilities, as measured by the difference between the forward exchange rates at the reporting date and the forward exchange rates at each contract’s inception date. Net realized gain (loss) on contracts closed during the period, and changes in net unrealized appreciation (depreciation) on outstanding contracts are recognized in the Fund’s Statement of Operations. Values of open sell currency contracts were indicative of the activity for the six months ended March 31, 2014. Open buy currency contracts are entered into for the purpose of closing open sell currency contracts and the values are dependent upon the values of the open sell currency contracts to which they relate.
The following table displays the outstanding forward currency contracts at March 31, 2014:
| | | | | | | | | | | | | | | | | | | | | | |
| | | OUTSTANDING FORWARD CURRENCY CONTRACTS TO BUY OR SELL
AT MARCH 31, 2014 | | | | |
CONTRACT DESCRIPTION | | BUY/SELL | | CONTRACT
AMOUNT | | | CONTRACT
VALUE DATE | | | VALUE
USD | | | UNREALIZED
APPRECIATION | | | UNREALIZED
DEPRECIATION | |
Australian Dollar | | Buy | | | 6,837,700 | | | | 05/08/2014 | | | | 6,325,640 | | | $ | 246,241 | | | $ | — | |
Australian Dollar | | Sell | | | 15,044,900 | | | | 05/08/2014 | | | | 13,918,221 | | | | 245,198 | | | | — | |
Australian Dollar | | Buy | | | 2,637,600 | | | | 05/08/2014 | | | | 2,440,076 | | | | 66,262 | | | | — | |
Euro | | Sell | | | 37,470,300 | | | | 08/11/2014 | | | | 51,614,247 | | | | — | | | | (619,979 | ) |
Swiss Franc | | Sell | | | 1,331,300 | | | | 04/03/2014 | | | | 1,505,922 | | | | — | | | | (42,810 | ) |
Swiss Franc | | Sell | | | 3,326,700 | | | | 04/03/2014 | | | | 3,763,052 | | | | — | | | | (89,373 | ) |
| | | | | | | | | | | | | | | | | | | | | | |
Total | | | | | | | | | | | | | | | | $ | 557,701 | | | $ | (752,162 | ) |
| | | | | | | | | | | | | | | | | | | | | | |
The foregoing forward currency contracts were entered into pursuant to an International Swaps and Derivatives Association (ISDA) Master Agreement. In the event of a default or termination under the ISDA Master Agreement, the non-defaulting party has the right to close out all outstanding forward currency contracts between the parties and to net any payment amounts under those contracts, resulting in a single net amount payable by one party to the other. Because the ISDA Master Agreement does not result in an offset of reported amounts of financial assets and financial liabilities in the Fund’s Statement of Assets and Liabilities unless there has been an event of default or termination event under that agreement, the Fund does not net its outstanding forward currency contracts for purposes of the disclosure in the Fund’s Statement of Assets and Liabilities. Instead the Fund recognizes the unrealized appreciation or depreciation on those forward currency contracts on a gross basis in the Fund’s Statement of Assets and Liabilities. At March 31, 2014, those recognized amounts are disclosed in the following table:
| | | | | | |
| FAIR VALUES OF DERIVATIVE FINANCIAL INSTRUMENTS AT MARCH 31, 2014 | |
ASSET DERIVATIVES | | BALANCE SHEET LOCATION | | FAIR VALUE | |
Foreign exchange contracts | | Assets - Unrealized appreciation on forward currency contracts | | $ | 557,701 | |
| | |
LIABILITY DERIVATIVES | | BALANCE SHEET LOCATION | | FAIR VALUE | |
Foreign exchange contracts | | Liabilities - Unrealized depreciation on forward currency contracts | | $ | (752,162 | ) |
Certified Semi-Annual Report 25
| | |
| Notes to Financial Statements, Continued | | |
| |
Thornburg Global Opportunities Fund | | March 31, 2014 (Unaudited) |
Because the Fund does not currently receive or post cash collateral in connection with its currency forward contracts, and because all of the Fund’s outstanding currency forward contracts are with State Street Bank and Trust Company, the net amounts of the Fund’s assets and liabilities which are attributable to those contracts at March 31, 2014 can be determined by offsetting the dollar amounts shown in the preceding table. Based on those amounts, the net amount of the Fund’s assets which is attributable to its outstanding forward currency contracts at March 31, 2014 is $0, and the net amount of the Fund’s liabilities which is attributable to those contracts at that date is $194,461. The Fund’s forward currency contracts are valued each day, and the net amounts of the Fund’s assets and liabilities which are attributable to those contracts are expected to vary over time.
The net realized gain (loss) from forward currency contracts, and the net change in unrealized appreciation (depreciation) of outstanding forward currency contracts recognized in the Fund’s Statement of Operations for the six months ended March 31, 2014 are disclosed in the following tables:
| | | | | | |
AMOUNT OF NET REALIZED GAIN (LOSS) ON DERIVATIVE FINANCIAL INSTRUMENTS RECOGNIZED IN INCOME FOR THE SIX MONTHS ENDED MARCH 31, 2014 | |
| | | TOTAL | | FORWARD CURRENCY CONTRACTS | |
Foreign exchange contracts | | $ (1,282,032) | | $ | (1,282,032 | ) |
| | | | | | |
AMOUNT OF NET CHANGE IN UNREALIZED APPRECIATION (DEPRECIATION) OF DERIVATIVE FINANCIAL INSTRUMENTS RECOGNIZED IN INCOME FOR THE SIX MONTHS ENDED MARCH 31, 2014 | |
| | | TOTAL | | FORWARD CURRENCY CONTRACTS | |
Foreign exchange contracts | | $ 404,530 | | $ | 404,530 | |
OTHER NOTES
Risks: The Fund’s investments subject it to risks including, but not limited to, management risk, market and economic risk, risks affecting specific issuers, liquidity risk, the risks associated with investments in smaller companies, real estate investment trusts, and non-U.S. issuers, credit risk, and interest rate risk. Please see the Fund’s prospectus for a discussion of the risks associated with an investment in the Fund.
Subsequent Events: Fund management believes no events have occurred between March 31, 2014 and the date of issuance of the financial statements that require adjustment to or disclosure in the accompanying financial statements.
26 Certified Semi-Annual Report
This page intentionally left blank.
Certified Semi-Annual Report 27
Financial Highlights
Thornburg Global Opportunities Fund
| | | | | | | | | | | | | | | | | | | | | | | | | | | | | | | | | | | | | | | | | | | | | | | | | | | | | | | | |
| | | PER SHARE PERFORMANCE (FOR A SHARE OUTSTANDING THROUGHOUT THE PERIOD)+ | | | RATIOS TO AVERAGE NET ASSETS | | | SUPPLEMENTAL DATA | |
UNLESS
OTHERWISE
NOTED,
PERIODS
ARE
FISCAL
YEARS
ENDED
SEPT.
30, | | NET
ASSET
VALUE
BEGINNING
OF
PERIOD | | | NET
INVESTMENT
INCOME
(LOSS) | | | NET
REALIZED &
UNREALIZED
GAIN
(LOSS) ON
INVESTMENTS | | | TOTAL
FROM
INVESTMENT
OPERATIONS | | | DIVIDENDS
FROM NET
INVESTMENT
INCOME | | | DIVIDENDS FROM NET REALIZED GAINS | | TOTAL
DIVIDENDS | | | NET
ASSET
VALUE
END OF
PERIOD | | | NET
INVESTMENT
INCOME
(LOSS)
(%) | | | EXPENSES,
AFTER
EXPENSE
REDUCTIONS
(%) | | | EXPENSES,
AFTER
EXPENSE
REDUCTIONS
AND
NET OF
CUSTODY
CREDITS
(%) | | | EXPENSES,
BEFORE
EXPENSE
REDUCTIONS
(%) | | | TOTAL
RETURN
(%)(a) | | | PORTFOLIO TURNOVER RATE (%)(a) | | NET
ASSETS
AT
END
OF
PERIOD
(THOUSANDS) | |
CLASS A SHARES | | | | | | | | | | | | | | | | | | | | | | | | | | | | | | | | | | | | | | | | | | | | | | | | | |
2014(b)(c) | | $ | 19.72 | | | | 0.01 | | | | 2.47 | | | | 2.48 | | | | (0.05 | ) | | — | | | (0.05 | ) | | $ | 22.15 | | | | 0.08 | (d) | | | 1.40 | (d) | | | 1.40 | (d) | | | 1.40 | (d) | | | 12.61 | | | 38.59 | | $ | 132,918 | |
2013(b) | | $ | 15.97 | | | | 0.11 | | | | 3.79 | | | | 3.90 | | | | (0.15 | ) | | — | | | (0.15 | ) | | $ | 19.72 | | | | 0.60 | | | | 1.46 | | | | 1.46 | | | | 1.46 | | | | 24.50 | | | 66.12 | | $ | 96,855 | |
2012(b) | | $ | 13.15 | | | | 0.14 | | | | 2.89 | | | | 3.03 | | | | (0.21 | ) | | — | | | (0.21 | ) | | $ | 15.97 | | | | 0.94 | | | | 1.49 | | | | 1.49 | | | | 1.49 | | | | 23.22 | | | 66.07 | | $ | 77,103 | |
2011(b) | | $ | 13.98 | | | | 0.18 | | | | (0.82 | ) | | | (0.64 | ) | | | (0.19 | ) | | — | | | (0.19 | ) | | $ | 13.15 | | | | 1.13 | | | | 1.48 | | | | 1.48 | | | | 1.48 | | | | (4.81 | ) | | 70.33 | | $ | 73,538 | |
2010(b) | | $ | 13.10 | | | | 0.18 | | | | 0.86 | | | | 1.04 | | | | (0.16 | ) | | — | | | (0.16 | ) | | $ | 13.98 | | | | 1.29 | | | | 1.47 | | | | 1.47 | | | | 1.47 | | | | 7.98 | | | 66.27 | | $ | 92,927 | |
2009(b) | | $ | 13.38 | | | | 0.29 | | | | 0.03 | | | | 0.32 | | | | (0.60 | ) | | — | | | (0.60 | ) | | $ | 13.10 | | | | 2.96 | | | | 1.53 | | | | 1.52 | | | | 1.55 | | | | 3.60 | | | 103.02 | | $ | 82,309 | |
CLASS C SHARES | | | | | | | | | | | | | | | | | | | | | | | | | | | | | | | | | | | | | | | | | | | | | | | | | |
2014(c) | | $ | 19.38 | | | | (0.08 | ) | | | 2.45 | | | | 2.37 | | | | (0.02 | ) | | — | | | (0.02 | ) | | $ | 21.73 | | | | (0.73 | )(d) | | | 2.17 | (d) | | | 2.17 | (d) | | | 2.17 | (d) | | | 12.21 | | | 38.59 | | $ | 106,114 | |
2013 | | $ | 15.69 | | | | (0.03 | ) | | | 3.72 | | | | 3.69 | | | | — | | | — | | | — | | | $ | 19.38 | | | | (0.18 | ) | | | 2.22 | | | | 2.22 | | | | 2.22 | | | | 23.52 | | | 66.12 | | $ | 87,808 | |
2012 | | $ | 12.98 | | | | 0.02 | | | | 2.84 | | | | 2.86 | | | | (0.15 | ) | | — | | | (0.15 | ) | | $ | 15.69 | | | | 0.17 | | | | 2.27 | | | | 2.27 | | | | 2.27 | | | | 22.21 | | | 66.07 | | $ | 76,738 | |
2011 | | $ | 13.83 | | | | 0.06 | | | | (0.80 | ) | | | (0.74 | ) | | | (0.11 | ) | | — | | | (0.11 | ) | | $ | 12.98 | | | | 0.40 | | | | 2.23 | | | | 2.23 | | | | 2.23 | | | | (5.45 | ) | | 70.33 | | $ | 70,643 | |
2010 | | $ | 12.96 | | | | 0.07 | | | | 0.85 | | | | 0.92 | | | | (0.05 | ) | | — | | | (0.05 | ) | | $ | 13.83 | | | | 0.48 | | | | 2.28 | | | | 2.28 | | | | 2.28 | | | | 7.10 | | | 66.27 | | $ | 82,139 | |
2009 | | $ | 13.22 | | | | 0.23 | | | | 0.01 | | | | 0.24 | | | | (0.50 | ) | | — | | | (0.50 | ) | | $ | 12.96 | | | | 2.36 | | | | 2.31 | | | | 2.31 | | | | 2.35 | | | | 2.79 | | | 103.02 | | $ | 81,334 | |
CLASS I SHARES | | | | | | | | | | | | | | | | | | | | | | | | | | | | | | | | | | | | | | | | | | | | | | | | | |
2014(c) | | $ | 19.74 | | | | 0.05 | | | | 2.49 | | | | 2.54 | | | | (0.08 | ) | | — | | | (0.08 | ) | | $ | 22.20 | | | | 0.46 | (d) | | | 0.99 | (d) | | | 0.99 | (d) | | | 1.06 | (d) | | | 12.86 | | | 38.59 | | $ | 323,809 | |
2013 | | $ | 16.06 | | | | 0.19 | | | | 3.80 | | | | 3.99 | | | | (0.31 | ) | | — | | | (0.31 | ) | | $ | 19.74 | | | | 1.07 | | | | 0.99 | | | | 0.99 | | | | 1.11 | | | | 25.08 | | | 66.12 | | $ | 249,283 | |
2012 | | $ | 13.20 | | | | 0.21 | | | | 2.90 | | | | 3.11 | | | | (0.25 | ) | | — | | | (0.25 | ) | | $ | 16.06 | | | | 1.44 | | | | 0.99 | | | | 0.99 | | | | 1.21 | | | | 23.82 | | | 66.07 | | $ | 169,384 | |
2011 | | $ | 14.01 | | | | 0.26 | | | | (0.83 | ) | | | (0.57 | ) | | | (0.24 | ) | | — | | | (0.24 | ) | | $ | 13.20 | | | | 1.65 | | | | 0.99 | | | | 0.99 | | | | 1.11 | | | | (4.30 | ) | | 70.33 | | $ | 115,837 | |
2010 | | $ | 13.13 | | | | 0.24 | | | | 0.87 | | | | 1.11 | | | | (0.23 | ) | | — | | | (0.23 | ) | | $ | 14.01 | | | | 1.78 | | | | 0.99 | | | | 0.99 | | | | 1.19 | | | | 8.48 | | | 66.27 | | $ | 131,892 | |
2009 | | $ | 13.45 | | | | 0.37 | | | | (0.01 | ) | | | 0.36 | | | | (0.68 | ) | | — | | | (0.68 | ) | | $ | 13.13 | | | | 3.65 | | | | 0.99 | | | | 0.99 | | | | 1.33 | | | | 4.16 | | | 103.02 | | $ | 107,132 | |
CLASS R3 SHARES | | | | | | | | | | | | | | | | | | | | | | | | | | | | | | | | | | | | | | | | | | | | | | | | | |
2014(c) | | $ | 19.55 | | | | (0.01 | ) | | | 2.47 | | | | 2.46 | | | | (0.05 | ) | | — | | | (0.05 | ) | | $ | 21.96 | | | | (0.07 | )(d) | | | 1.50 | (d) | | | 1.50 | (d) | | | 2.51 | (d) | | | 12.59 | | | 38.59 | | $ | 1,969 | |
2013 | | $ | 15.91 | | | | 0.11 | | | | 3.74 | | | | 3.85 | | | | (0.21 | ) | | — | | | (0.21 | ) | | $ | 19.55 | | | | 0.60 | | | | 1.49 | | | | 1.49 | | | | 3.41 | | | | 24.37 | | | 66.12 | | $ | 1,653 | |
2012 | | $ | 13.11 | | | | 0.11 | | | | 2.90 | | | | 3.01 | | | | (0.21 | ) | | — | | | (0.21 | ) | | $ | 15.91 | | | | 0.75 | | | | 1.50 | | | | 1.50 | | | | 9.01 | (e) | | | 23.22 | | | 66.07 | | $ | 894 | |
2011 | | $ | 13.93 | | | | 0.18 | | | | (0.82 | ) | | | (0.64 | ) | | | (0.18 | ) | | — | | | (0.18 | ) | | $ | 13.11 | | | | 1.12 | | | | 1.49 | | | | 1.49 | | | | 14.23 | (e) | | | (4.77 | ) | | 70.33 | | $ | 75 | |
2010 | | $ | 13.08 | | | | 0.17 | | | | 0.87 | | | | 1.04 | | | | (0.19 | ) | | — | | | (0.19 | ) | | $ | 13.93 | | | | 1.28 | | | | 1.46 | | | | 1.46 | | | | 32.05 | (e) | | | 7.97 | | | 66.27 | | $ | 151 | |
2009 | | $ | 13.37 | | | | 0.26 | | | | 0.05 | | | | 0.31 | | | | (0.60 | ) | | — | | | (0.60 | ) | | $ | 13.08 | | | | 2.57 | | | | 1.50 | | | | 1.49 | | | | 116.95 | (e) | | | 3.61 | | | 103.02 | | $ | 20 | |
CLASS R4 SHARES | | | | | | | | | | | | | | | | | | | | | | | | | | | | | | | | | | | | | | | | | | | | | | | | | |
2014(c) | | $ | 19.59 | | | | — | (f) | | | 2.47 | | | | 2.47 | | | | (0.06 | ) | | — | | | (0.06 | ) | | $ | 22.00 | | | | 0.05 | (d) | | | 1.40 | (d) | | | 1.40 | (d) | | | 2.31 | (d) | | | 12.60 | | | 38.59 | | $ | 2,901 | |
2013 | | $ | 15.90 | | | | 0.12 | | | | 3.76 | | | | 3.88 | | | | (0.19 | ) | | — | | | (0.19 | ) | | $ | 19.59 | | | | 0.68 | | | | 1.40 | | | | 1.40 | | | | 2.76 | | | | 24.57 | | | 66.12 | | $ | 2,161 | |
2012 | | $ | 13.09 | | | | 0.15 | | | | 2.88 | | | | 3.03 | | | | (0.22 | ) | | — | | | (0.22 | ) | | $ | 15.90 | | | | 1.05 | | | | 1.40 | | | | 1.40 | | | | 3.72 | | | | 23.36 | | | 66.07 | | $ | 1,329 | |
2011 | | $ | 13.90 | | | | 0.19 | | | | (0.81 | ) | | | (0.62 | ) | | | (0.19 | ) | | — | | | (0.19 | ) | | $ | 13.09 | | | | 1.23 | | | | 1.40 | | | | 1.40 | | | | 3.16 | | | | (4.66 | ) | | 70.33 | | $ | 900 | |
2010 | | $ | 13.04 | | | | 0.19 | | | | 0.84 | | | | 1.03 | | | | (0.17 | ) | | — | | | (0.17 | ) | | $ | 13.90 | | | | 1.38 | | | | 1.40 | | | | 1.40 | | | | 3.29 | | | | 7.96 | | | 66.27 | | $ | 1,345 | |
2009 | | $ | 13.38 | | | | 0.40 | | | | (0.08 | ) | | | 0.32 | | | | (0.66 | ) | | — | | | (0.66 | ) | | $ | 13.04 | | | | 3.19 | | | | 1.40 | | | | 1.40 | | | | 14.73 | (e) | | | 3.73 | | | 103.02 | | $ | 1,244 | |
CLASS R5 SHARES | | | | | | | | | | | | | | | | | | | | | | | | | | | | | | | | | | | | | | | | | | | | | | | | | |
2014(c) | | $ | 19.76 | | | | 0.05 | | | | 2.49 | | | | 2.54 | | | | (0.08 | ) | | — | | | (0.08 | ) | | $ | 22.22 | | | | 0.49 | (d) | | | 0.99 | (d) | | | 0.99 | (d) | | | 1.12 | (d) | | | 12.85 | | | 38.59 | | $ | 65,282 | |
2013 | | $ | 16.07 | | | | 0.18 | | | | 3.82 | | | | 4.00 | | | | (0.31 | ) | | — | | | (0.31 | ) | | $ | 19.76 | | | | 1.03 | | | | 0.99 | | | | 0.99 | | | | 1.15 | | | | 25.13 | | | 66.12 | | $ | 49,023 | |
2012 | | $ | 13.21 | | | | 0.21 | | | | 2.90 | | | | 3.11 | | | | (0.25 | ) | | — | | | (0.25 | ) | | $ | 16.07 | | | | 1.44 | | | | 0.99 | | | | 0.99 | | | | 1.15 | | | | 23.80 | | | 66.07 | | $ | 50,327 | |
2011 | | $ | 14.02 | | | | 0.29 | | | | (0.86 | ) | | | (0.57 | ) | | | (0.24 | ) | | — | | | (0.24 | ) | | $ | 13.21 | | | | 1.84 | | | | 0.99 | | | | 0.99 | | | | 1.24 | | | | (4.29 | ) | | 70.33 | | $ | 32,223 | |
2010 | | $ | 13.15 | | | | 0.34 | | | | 0.76 | | | | 1.10 | | | | (0.23 | ) | | — | | | (0.23 | ) | | $ | 14.02 | | | | 2.46 | | | | 0.99 | | | | 0.99 | | | | 1.64 | | | | 8.41 | | | 66.27 | | $ | 16,380 | |
2009 | | $ | 13.46 | | | | 0.53 | | | | (0.15 | ) | | | 0.38 | | | | (0.69 | ) | | — | | | (0.69 | ) | | $ | 13.15 | | | | 4.36 | | | | 0.97 | | | | 0.97 | | | | 239.11 | (e) | | | 4.25 | | | 103.02 | | $ | 86 | |
| (a) | Not annualized for periods less than one year. |
| (b) | Sales loads are not reflected in computing total return. |
| (c) | Unaudited Six Month Period Ended March 31. |
| (e) | Due to the size of net assets and fixed expenses, ratios may appear disproportionate. |
| (f) | Net Investment Income (Loss) was less than $0.01 per share. |
| + | Based on weighted average shares outstanding, except for Dividends from Net Investment Income and Net Realized Gains, which are actual amounts per share. |
See notes to financial statements.
| | | | |
| 28 Certified Semi-Annual Report | | | | Certified Semi-Annual Report 29 |
| | |
| Expense Example | | |
| |
Thornburg Global Opportunities Fund | | March 31, 2014 (Unaudited) |
As a shareholder of the Fund, you incur two types of costs:
| | (1) | transaction costs, including |
(a) sales charges (loads) on purchase payments, for Class A shares;
(b) a deferred sales charge on redemptions of any part or all of a purchase of $1 million of Class A shares within 12 months of purchase;
(c) a deferred sales charge on redemptions of Class C shares within 12 months of purchase;
| | (2) | ongoing costs, including management fees; distribution and/or service (12b-1) fees; and other Fund expenses. |
This example is intended to help you understand your ongoing costs (in dollars) of investing in the Fund and to compare these costs with the ongoing costs of investing in other mutual funds.
The example is based on a $1,000 investment beginning on October 1, 2013, and held until March 31, 2014.
| | | | | | | | | | | | |
| | | BEGINNING
ACCOUNT VALUE
10/1/13 | | | ENDING
ACCOUNT VALUE
3/31/14 | | | EXPENSES PAID
DURING PERIOD†
10/1/13–3/31/14 | |
Class A Shares | | | | | | | | | | | | |
Actual | | $ | 1,000.00 | | | $ | 1,126.10 | | | $ | 7.40 | |
Hypothetical* | | $ | 1,000.00 | | | $ | 1,017.97 | | | $ | 7.02 | |
Class C Shares | | | | | | | | | | | | |
Actual | | $ | 1,000.00 | | | $ | 1,122.10 | | | $ | 11.50 | |
Hypothetical* | | $ | 1,000.00 | | | $ | 1,014.09 | | | $ | 10.92 | |
Class I Shares | | | | | | | | | | | | |
Actual | | $ | 1,000.00 | | | $ | 1,128.60 | | | $ | 5.25 | |
Hypothetical* | | $ | 1,000.00 | | | $ | 1,020.00 | | | $ | 4.99 | |
Class R3 Shares | | | | | | | | | | | | |
Actual | | $ | 1,000.00 | | | $ | 1,125.90 | | | $ | 7.95 | |
Hypothetical* | | $ | 1,000.00 | | | $ | 1,017.45 | | | $ | 7.54 | |
Class R4 Shares | | | | | | | | | | | | |
Actual | | $ | 1,000.00 | | | $ | 1,126.00 | | | $ | 7.42 | |
Hypothetical* | | $ | 1,000.00 | | | $ | 1,017.95 | | | $ | 7.04 | |
Class R5 Shares | | | | | | | | | | | | |
Actual | | $ | 1,000.00 | | | $ | 1,128.50 | | | $ | 5.25 | |
Hypothetical* | | $ | 1,000.00 | | | $ | 1,020.00 | | | $ | 4.99 | |
| † | Expenses are equal to the annualized expense ratio for each class (A: 1.40%; C: 2.17%; I: 0.99%; R3: 1.50%; R4: 1.40%; R5: 0.99%) multiplied by the average account value over the period, multiplied by 182/365 to reflect the one-half year period. |
| * | Hypothetical assumes a rate of return of 5% per year before expenses. |
Actual Expenses
For each class of shares, the first line of the accompanying table provides information about actual account values and actual expenses. You may use the information in this line, together with the amount you invested, to estimate the expenses that you paid over the period. Simply divide your account value by $1,000 (for example, an $8,600 account value divided by $1,000 = 8.6), then multiply the result by the number in the first line for your class of shares under the heading entitled “Expenses Paid During Period” to estimate the expenses you paid on your account during this period.
Hypothetical Example for Comparison Purposes
For each class of shares, the second line of the accompanying table provides information about hypothetical account values and hypothetical expenses based on the Fund’s actual expense ratio and an assumed rate of return of 5% per year before expenses, which is not the Fund’s actual return. The hypothetical account values and expenses may not be used to estimate the actual ending account balance or expenses you paid for the period. You may use this information to compare the ongoing costs of investing in the Fund and other funds. To do so, compare this 5% hypothetical example with the 5% hypothetical examples that appear in the shareholder reports of the other funds.
Please note that the expenses shown in the table are meant to highlight your ongoing costs only and do not reflect any transactional costs, such as sales charges (loads), redemption fees, or exchange fees. Therefore, the second line of the table for each class of shares is useful in comparing ongoing costs only, and will not help you determine the relative total costs of owning different funds. In addition, if these transactional costs were included, your costs would have been higher.
30 Certified Semi-Annual Report
| | |
| Index Comparison | | |
| |
Thornburg Global Opportunities Fund | | March 31, 2014 (Unaudited) |
Growth of a Hypothetical $10,000 Investment
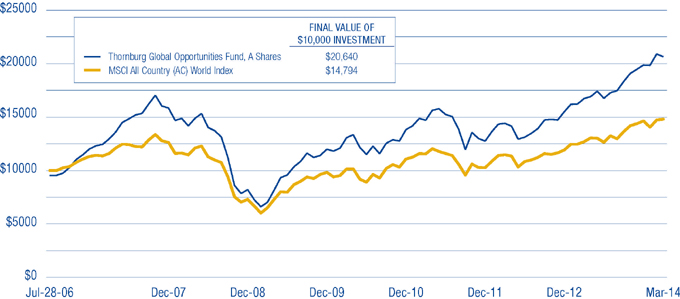
Average Annual Total Returns
For Periods Ended March 31, 2014 (with sales charge)
| | | | | | | | | | | | | | | | |
| | | 1 YR | | | 3 YRS | | | 5 YRS | | | SINCE
INCEPTION | |
Class A Shares (Incep: 7/28/06) | | | 17.82 | % | | | 10.27 | % | | | 22.89 | % | | | 9.91 | % |
Class C Shares (Incep: 7/28/06) | | | 21.45 | % | | | 11.13 | % | | | 23.05 | % | | | 9.71 | % |
Class I Shares (Incep: 7/28/06) | | | 23.96 | % | | | 12.50 | % | | | 24.60 | % | | | 11.11 | % |
Class R3 Shares (Incep: 2/1/08) | | | 23.31 | % | | | 11.94 | % | | | 23.96 | % | | | 5.40 | % |
Class R4 Shares (Incep: 2/1/08) | | | 23.43 | % | | | 12.06 | % | | | 24.06 | % | | | 5.49 | % |
Class R5 Shares (Incep: 2/1/08) | | | 23.93 | % | | | 12.51 | % | | | 24.60 | % | | | 5.95 | % |
Performance data shown represents past performance and is no guarantee of future results. Investment return and principal value will fluctuate so shares, when redeemed, may be worth more or less than their original cost. Current performance may be lower or higher than quoted. For performance current to the most recent month end, visit thornburg.com or call 800.847.0200. The performance data and graph do not reflect the deduction of taxes that a shareholder would pay on distributions or the redemption of Fund shares. Returns reflect the reinvestment of dividends and capital gains as well as applicable sales charges. Class A shares are sold with a maximum sales charge of 4.50%. Class C shares are subject to a 1% CDSC for the first year only. There is no up-front sales charge for Class I, R3, R4, and R5 shares.
Certified Semi-Annual Report 31
| | |
| Other Information | | |
| |
Thornburg Global Opportunities Fund | | March 31, 2014 (Unaudited) |
Portfolio Proxy Voting
Policies and Procedures:
The Trust has delegated to Thornburg Investment Management, Inc. (the “Advisor”) voting decisions respecting proxies for the Fund’s voting securities. The Advisor makes voting decisions in accordance with its Proxy Voting Policy and Procedures. A description of the Policy and Procedures is available (i) without charge, upon request, by calling the Advisor toll-free at 1-800-847-0200, (ii) on the Thornburg website at www.thornburg.com, and (iii) on the Securities and Exchange Commission’s website at www.sec.gov.
Information regarding how proxies were voted is available on or before August 31 of each year for the twelve months ending the preceding June 30. This information is available (i) without charge, upon request by calling the Advisor toll-free at 1-800-847-0200, (ii) on the Thornburg website at www.thornburg.com, and (iii) on the Securities and Exchange Commission’s website at www.sec.gov.
Availability of Quarterly Portfolio Schedule
The Fund files with the Securities and Exchange Commission schedules of its portfolio holdings on Form N-Q for the first and third quarters of each fiscal year. The Fund’s Forms N-Q are available on the Commission’s website at www.sec.gov, or may be reviewed and copied at the Commission’s Public Reference Room in Washington, D.C. Information on the operation of the Public Reference Room may be obtained by calling 1-800-SEC-0330. The Fund also makes this information available on its website at www.thornburg.com/download or upon request by calling 1-800-847-0200.
32 Certified Semi-Annual Report
Trustees’ Statement to Shareholders
Not part of the Certified Semi-Annual Report
Reissued September 15, 2013
The Trustees believe current and prospective shareholders should know how we discharge our responsibilities in supervising the Funds’ investment advisor and in reviewing the advisor’s contract for renewal. Since 2005, we have issued a statement which sets out clearly the three principal guidelines that we follow in supervising the Trust’s investment advisor on your behalf. In accordance with our customary practice, in September of this year we again reviewed our statement and concluded we should reissue this statement outlining the principal features of our supervision of the advisor’s performance of investment management services for the Funds.
We begin with the premise that each shareholder selected his or her Fund because its investments are managed by the investment advisor identified in the prospectus and in accordance with the objective and policies described in the prospectus. We realize, as each of you do, that if you believe that your Fund’s stated objective and policies no longer serve your personal investment goals, you can sell your shares and leave the Fund.
Therefore, we believe that our primary supervisory task – our principal obligation to you – is to assess the nature and quality of the advisor’s services, and to confirm that the advisor actively and competently pursues the Fund’s objective, in accordance with the policies set out in the prospectus. To do this, we meet regularly with management to review your Fund’s portfolio and to discuss the advisor’s specific actions and judgments in pursuing the Fund’s objective. We do not substitute our own judgment for the advisor’s decisions in selecting investments; the advisor is paid to exercise its informed judgment on investment decisions, and we seek to confirm, in reviewing the advisor’s performance, that the advisor is doing just that.
Second, while we are conscious of costs and the effect that costs have on shareholders’ returns, we do not seek the lowest fees or expense ratio as our sole or primary objective. We try to make sure that your Fund’s fees and costs are reasonable in relationship to the services rendered and that they are generally in line with those charged by other expert investment advisors, consistent with our belief that the Fund’s investors searched for and expect that expertise and attention and have decided to pay a reasonable price for it. We do not put the management contract “out to bid” as a matter of course, and we would not do so unless we had concluded that the advisor materially had failed to pursue the Fund’s objectives in accordance with its policies, or for other equally important reasons. We believe that any other approach would be inconsistent with your interests and contrary to your expectations when you bought shares of the Fund in the first place.
Finally, because we believe that most Thornburg Fund shareholders have invested with a long-term perspective, we try not to focus too much on the fashions of the moment and on short-term performance. The market will not favor any specific investment objective or set of policies at all times and under all economic circumstances. A fund will experience periods of both high and low returns relative to other funds and other investments. Even if one of our Funds is not favored by the market at a particular time, we believe that the advisor is nonetheless obliged to remain true to the Fund’s objective and policies, and we watch to see that it does so.
This page is not part of the Semi-Annual Report 33
This page intentionally left blank.
34 This page is not part of the Semi-Annual Report
Retirement and Education Accounts
Thornburg Investment Management offers retirement and education savings accounts that can help you meet a variety of planning challenges. For account applications or further information on any of the accounts below, please call 1-800-847-0200 or go to www.thornburg.com/ira. Your financial advisor can help you determine which plan is right for you.
Individual Retirement Accounts
Individual Retirement Accounts (IRAs) provide a tax-advantaged means to save money for the future. For a detailed outline of the difference between retirement accounts, see www.thornburg.com/ira. Rollovers are available. Call 1-800-847-0200 for more information.
Traditional IRAs – Contributions to Traditional IRAs are tax deductible for eligible individuals, and withdrawals are taxed as additional ordinary income. You may contribute to an IRA if you receive compensation and are under 70 1⁄2, even if you are covered by an employer retirement plan. Deductible contributions are subject to certain qualifications. Please consult your tax advisor.
Roth IRAs – Under a Roth IRA, there is no tax deduction for contributions, but there is no income tax on qualified withdrawals. For a more detailed comparison of Traditional and Roth IRAs, please see our website at www.thornburg. com/ira.
SEP IRAs – Simplified Employee Pension (SEP) IRAs are established by employers. The employer is allowed a tax deduction for contributions made to the SEP Plan and makes contributions to each eligible employee’s SEP IRA on a discretionary basis.
SIMPLE IRAs – Savings Incentive Match Plan for Employees of Small Employers (SIMPLE) is designed to give small business owners a simplified method to establish and contribute to a retirement plan for employees. The employer is allowed a tax deduction for contributions and makes either matching or non-elective contributions to each eligible employee’s SIMPLE IRA. Employees may make salary deferral contributions.
Coverdell Education Savings Account
These savings accounts are designed to provide a way to save money for higher education expenses. In an Education Savings Account, earnings and interest grow tax-free, and qualified withdrawals used to pay for eligible higher-education expenses are tax- and penalty-free.
Funds Available
The following funds are available in the accounts listed above:
| | • | | Thornburg Core Growth Fund |
| | • | | Thornburg International Value Fund |
| | • | | Thornburg International Growth Fund |
| | • | | Thornburg Developing World Fund |
| | • | | Thornburg Investment Income Builder Fund |
| | • | | Thornburg Global Opportunities Fund |
| | • | | Thornburg Low Duration Income Fund |
| | • | | Thornburg Limited Term U.S. Government Fund |
| | • | | Thornburg Limited Term Income Fund |
| | • | | Thornburg Strategic Income Fund |
This page is not part of the Semi-Annual Report 35

The Firm
Founded in 1982 and headquartered in Santa Fe, New Mexico, Thornburg Investment Management advises a range of active investment strategies, each offered through multiple vehicles, to serve a broad spectrum of client needs worldwide. From short-term fixed income to flexible global equity, our objective is to help clients reach their long-term financial goals via active portfolio management. As of March 31, 2014, Thornburg managed approximately $90 billion in assets.
Investment Philosophy
We seek to preserve and increase the real wealth of shareholders after accounting for inflation, taxes, and investment expenses. We’re committed to disciplined investing and managing risk in all market environments.
Portfolio Holdings Commentary
At Thornburg, we believe you should know what you own. Our website keeps investors informed of the Funds’ equity holdings. Go to www.thornburg.com/funds for equity funds holdings and commentary.
Co-Ownership of Funds
We invest side-by-side with shareholders. Our employees have invested $387 million in Thornburg products as of March 31, 2014.
36 This page is not part of the Semi-Annual Report
Thornburg Fund Family
Thornburg Equity Funds
Thornburg’s equity research uses a fundamentally driven, bottom-up, comprehensive analytical approach. Thornburg equity funds generally focus on a limited number of securities so that each holding can impact performance. The team searches for firms believed to have a promising future and seeks to buy shares of those companies at a discount to their intrinsic or long-term value.
| | • | | Thornburg Core Growth Fund |
| | • | | Thornburg International Value Fund |
| | • | | Thornburg International Growth Fund |
| | • | | Thornburg Developing World Fund |
| | • | | Thornburg Investment Income Builder Fund |
| | • | | Thornburg Global Opportunities Fund |
Thornburg Bond Funds
Thornburg Investment Management applies a disciplined philosophy to fixed-income management. Since the launch of our first fixed-income fund over 25 years ago, we have been conducting fundamental, bottom-up research in an effort to identify bonds which we believe provide the best return for a given level of risk. We avoid leverage or complex strategies which could backfire in periods of market uncertainty.
| | • | | Thornburg Low Duration Income Fund |
| | • | | Thornburg Limited Term U.S. Government Fund |
| | • | | Thornburg Limited Term Income Fund |
| | • | | Thornburg Strategic Income Fund |
| | • | | Thornburg Low Duration Municipal Fund |
| | • | | Thornburg Limited Term Municipal Fund |
| | • | | Thornburg Intermediate Municipal Fund |
| | • | | Thornburg California Limited Term Municipal Fund |
| | • | | Thornburg New Mexico Intermediate Municipal Fund |
| | • | | Thornburg New York Intermediate Municipal Fund |
| | • | | Thornburg Strategic Municipal Income Fund |
Before investing, carefully consider the Fund’s investment goals, risks, charges, and expenses. For a prospectus or summary prospectus containing this and other information, contact your financial advisor or visit thornburg.com. Read it carefully before investing.
For additional information, please visit thornburg.com
Thornburg Investment Management, Inc. 2300 North Ridgetop Road, Santa Fe, NM 87506
This page is not part of the Semi-Annual Report 37
This page intentionally left blank.
This page is not part of the Semi-Annual Report 38
This page intentionally left blank.
This page is not part of the Semi-Annual Report 39
| | |
 | | Waste not, Wait not |

This Semi-Annual Report is submitted for the general information of shareholders of the Fund. It is not authorized for distribution to prospective investors in the Fund unless preceded or accompanied by an effective prospectus.
| | | | |
| Investment Advisor: | | Distributor: | | |
| Thornburg Investment Management® | | Thornburg Securities Corporation® | | |
| 800.847.0200 | | 800.847.0200 | | TH1411 |

2 This page is not part of the Semi-Annual Report
Important Information
The information presented on the following pages was current as of March 31, 2014. The manager’s views, portfolio holdings, and sector and country diversification are provided for the general information of the Fund’s shareholders and are subject to change; to the extent this information is historical, it should not be considered predictive of future circumstances. This material should not be deemed a recommendation to buy or sell any of the securities mentioned.
Investments in the Fund carry risks, including possible loss of principal. Special risks may be associated with investments outside the United States, especially in emerging markets, including currency fluctuations, illiquidity, volatility, and political and economic risks. Investments in small capitalization companies may increase the risk of greater price fluctuations. Please see the Fund’s Prospectus for a discussion of the risks associated with an investment in the Fund. Investments in the Fund are not FDIC insured, nor are they deposits of or guaranteed by a bank or any other entity. There is no guarantee that the Fund will meet its investment objectives. Funds invested in a limited number of holdings may expose an investor to greater volatility.
Performance data given at net asset value (NAV) does not take into account the applicable sales charges. If the sales charges had been included, the performance would have been lower.
Class I, R5, and R6 shares may not be available to all investors. Minimum investments for Class I shares may be higher than those for other classes.
From time to time, the Fund may invest in shares of companies through initial public offerings (IPOs). IPOs have the potential to produce substantial gains for the Fund. There is no assurance that the Fund will have continued access to profitable IPOs and, as the Fund’s assets grow, the impact of IPO investments may decline. Therefore, investors should not rely on these past gains as an indication of future performance.
| | | | |
SHARE CLASS | | NASDAQ SYMBOL | | CUSIP |
Class A | | THDAX | | 885-216-408 |
Class C | | THDCX | | 885-216-507 |
Class I | | THDIX | | 885-216-606 |
Class R5 | | THDRX | | 885-216-846 |
Class R6 | | TDWRX | | 885-216-838 |
Glossary
MSCI Country Indices (Brazil, India, Indonesia, Philippines, and Russia) – Free float-adjusted market capitalization indices that are designed to measure equity market performance in that specific country.
MSCI Emerging Markets Index – A free float-adjusted market capitalization index that is designed to measure equity market performance of emerging markets. The MSCI Emerging Markets Index consists of the following 21 emerging market country indices: Brazil, Chile, China, Colombia, Czech Republic, Egypt, Greece, Hungary, India, Indonesia, Korea, Malaysia, Mexico, Peru, Philippines, Poland, Russia, South Africa, Taiwan, Thailand, and Turkey.
MSCI Emerging Markets (EM) Large Cap Index – This index targets approximately 70% of the free-float adjusted market capitalization of the emerging markets investable equity universe.
MSCI Emerging Markets (EM) Small Cap Index – This index targets approximately 14% of the free-float adjusted market capitalization of the emerging markets investable equity universe.
S&P 500 Index – An unmanaged broad measure of the U.S. stock market.
Unless otherwise noted, index returns reflect the reinvestment of income dividends and capital gains, if any, but do not reflect fees, brokerage commissions or other expenses of investing. Investors may not make direct investments into any index.
Basis Point (bp) – A unit equal to 1/100th of 1%. 1% = 100 basis points (bps).
BRIC Countries – A reference to the emerging market countries of Brazil, Russia, India and China.
Consumer Price Index (CPI) – An index that measures prices of a fixed basket of goods bought by a typical consumer, including food, transportation, shelter, utilities, clothing, medical care, entertainment and other items. The CPI, published by the Bureau of Labor Statistics in the Department of Labor, is based at 100 in 1982 and is released monthly. It is widely used as a cost-of-living benchmark to adjust Social Security payments and other payment schedules, union contracts and tax brackets. Also known as the cost-of-living index.
Gross Domestic Product (GDP) – A country’s income minus foreign investments: the total value of all goods and services produced within a country in a year, minus net income from investments in other countries.
Leverage – The amount of debt used to finance a firm’s assets. A firm with significantly more debt than equity is considered to be highly leveraged.
Median Market Capitalization – Market capitalization (market cap) is the total value of a company’s stock, calculated by multiplying the number of outstanding common shares by the current share price. The company whose market cap is in the middle of the portfolio is the median market cap. Half the companies in the portfolio have values greater than the median and half have values that are less.
Multiple – A term that measures some aspect of a company’s financial well-being, determined by dividing one metric by another metric. The metric in the numerator is typically larger than the one in the denominator, because the top metric is usually supposed to be many times larger than the bottom metric.
Price to Book Ratio (P/B ratio) – A ratio used to compare a stock’s market value to its book value. It is calculated by dividing the current closing price of the stock by the latest quarter’s book value per share.
Price to Cash Flow – The measure of the market’s expectations regarding a firm’s future financial health. It is calculated by dividing price per share by cash flow per share.
Price to Earnings Ratio (P/E) – A valuation ratio of a company’s current share price compared to its per-share earnings. P/E equals a company’s market value per share divided by earnings per share.
This page is not part of the Semi-Annual Report 3

Portfolio Manager

Lewis Kaufman,CFA
Objectives and Strategies
The Fund seeks long-term capital appreciation. Under normal market conditions the Fund invests at least 80% of its assets in equity securities and debt obligations of developing country issuers. A developing country issuer is a company or sovereign entity that is domiciled or otherwise tied economically to one or more developing countries. The Fund expects that investment in the Fund’s portfolio normally will be weighted in favor of equity securities.
Philosophy/Strategy
| • | | A flexible approach to developing markets targeting long-term capital appreciation, with an emphasis on risk-adjusted return. |
| • | | Focus on self-funding businesses predicated on sound business fundamentals rather than financial leverage. |
| • | | The ability to pursue the best risk-adjusted developing country opportunities, irrespective of domicile. |
| • | | The portfolio is diversified across basic value, consistent earner, and emerging franchise companies. |
A Case for Developing Markets
| • | | The Developing World Fund can complement the dollar diversification provided by other international strategies. Developing world currencies may benefit from manageable public debt/ gross domestic product (GDP) ratios, current account and budget surpluses, and above-average GDP growth potential. |
| • | | Household debt levels in the developing world are generally lower than those in the developed world, thereby presenting the possibility of increasing credit penetration and stronger domestic consumption. |
| • | | Structural reforms surrounding health insurance, social security, education and currency should lead to stronger domestic consumption in many developing markets, while helping to smooth the transition away from export-driven growth models. |
| • | | Many developing world countries have funded recent stimulus initiatives through reserves built earlier in the decade, and remain on sound fiscal footing. |
Why Thornburg?
| • | | We have aligned interests. We are a privately held business, we invest side by side with our clients, and we are investment driven not market driven. |
| • | | Collaborative, team-oriented approach provides for input from multiple members of the Thornburg Investment Management team and provides an installed base of knowledge on existing holdings. |
| • | | We believe that stock selection is the best form of risk management. In-depth research allows the team to have a more intimate understanding of the companies in the portfolio. |
Basket Summary
| • | | Basic Value Companies – Companies which, in Thornburg’s opinion, are financially sound with well established businesses selling at low valuations relative to the companies’ net assets or potential earning power. |
| • | | Consistent Earners – Companies which normally exhibit steady earnings growth, cashflow characteristics, and/or dividend growth. These companies may have above average profitability measures and normally sell at above average valuations. |
| • | | Emerging Franchises – Companies which, in Thornburg’s opinion, are in the process of establishing a leading position in a product, service, or market with the potential to grow at an above average rate. |
4 This page is not part of the Semi-Annual Report
Key Portfolio Attributes
As of March 31, 2014
| | | | |
Portfolio P/E Trailing 12-months* | | | 22.5x | |
Portfolio Price to Cash Flow* | | | 16.7x | |
Portfolio Price to Book Value* | | | 4.5x | |
Median Market Cap* | | $ | 4.3 B | |
Number of Companies | | | 64 | |
Market Capitalization Exposure
As of March 31, 2014
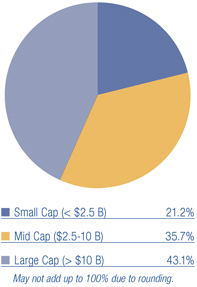
Basket Structure
As of March 31, 2014
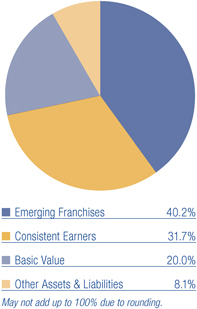
Average Annual Total Returns
For Periods Ended March 31, 2014
| | | | | | | | | | | | |
| A Shares (Incep: 12/16/09) | | 1 YR | | | 3 YRS | | | SINCE
INCEPTION | |
Without sales charge | | | 4.30 | % | | | 5.74 | % | | | 11.03 | % |
With sales charge | | | -0.37 | % | | | 4.14 | % | | | 9.85 | % |
MSCI Emerging Markets Index | | | | | | | | | | | | |
(Since 12/16/09) | | | -1.43 | % | | | -2.86 | % | | | 2.91 | % |
Performance data shown represents past performance and is no guarantee of future results. Investment return and principal value will fluctuate so shares, when redeemed, may be worth more or less than their original cost. Current performance may be lower or higher than quoted. For performance current to the most recent month end, visit thornburg.com or call 800.847.0200.
The maximum sales charge for Class A shares is 4.50%. The total annual fund operating expense of Class A shares is 1.59%, as disclosed in the most recent Prospectus.
Stocks Contributing and Detracting
For the Six Months Ended March 31, 2014
| | |
TOP CONTRIBUTORS | | TOP DETRACTORS |
| Kroton Educacional S.A. | | Sberbank Russia OJSC |
| Al Tayyar Travel Group | | MercadoLibre SA |
| HDFC Bank, Ltd. | | Prince Frog International Holdings Ltd. |
| Galaxy Entertainment Group Ltd. | | Jeronimo Martins SGPS SA |
| Eclat Textile Co., Ltd. | | Prada S.p.A. |
Source: FactSet
This page is not part of the Semi-Annual Report 5
2014 Certified Semi-Annual Report
Thornburg Developing World Fund
March 31, 2014
This report is certified under the Sarbanes-Oxley Act of 2002, which requires that public companies, including mutual funds, affirm that the information provided in their annual and semi-annual shareholder reports fully and fairly represents their financial position and the results of their operations for the period presented.
The matters discussed in this report may constitute forward-looking statements made pursuant to the safe harbor provisions of the Securities Litigation Reform Act of 1995. These include any advisor or portfolio manager prediction, assessment, analysis or outlook for individual securities, industries, investment styles, market sectors and/or markets. These statements involve risks and uncertainties. In addition to the general risks described for each fund in its current prospectus, other factors bearing on these reports include the accuracy of the advisor’s or portfolio manager’s forecasts and predictions, the appropriateness of the investment strategies designed by the advisor or portfolio manager and the ability of the advisor or portfolio manager to implement their strategies efficiently and successfully. Any one or more of these factors, as well as other risks affecting the securities markets generally, could cause the actual results of any fund to differ materially as compared to its benchmarks.
6 Certified Semi-Annual Report
Letter to Shareholders
April 13, 2014
Dear Fellow Shareholder:
| | |
We are pleased to present the fifth semi-annual report for the Thornburg Developing World Fund for the period ended March 31, 2014. The Class A shares of the Thornburg Developing World Fund produced a total return of 5.06% at net asset value (NAV) in the six-month period ended March 31, 2014, compared to 1.39% for the MSCI Emerging Markets Index. Since inception of December 16, 2009, the Class A shares of the Thornburg Developing World Fund produced a total return of 56.64% (at NAV), compared to 13.07% for the MSCI Emerging Markets Index. The six-month period ended March 31, 2014 was a tale of two distinct periods. The 171-day period ended March 20, 2014 can be broadly characterized by narrowing relative growth rate differentials versus the developed world, emerging markets capital flight, policy response from emerging market (EM) central bankers in the form of higher interest rates, and escalating fears over Chinese debt levels – all of which were then punctuated by currency devaluations in Venezuela and Argentina, domestic political standoff in Turkey, and political unrest in Crimea. During this 171-day period, the MSCI Emerging Markets Index declined 4.01%. Then, in the mere 11 days subsequent to March 20, the MSCI Emerging Markets Index rebounded 5.83%, and all 20 countries we track rose in dollar terms. While it is difficult to pinpoint a precise trigger for the reversal in EM market sentiment, Russia’s official annexation of Crimea seems to have mitigated the specter of | | Performance data shown represents past performance and is no guarantee of future results. Investment return and principal value will fluctuate so shares, when redeemed, may be worth more or less than their original cost. Current performance may be lower or higher than quoted. For performance current to the most recent month end, visit thornburg. com or call 800.847.0200. The maximum sales charge for Class A shares is 4.50%. The total annual fund operating expense of Class A shares is 1.59%, as disclosed in the most recent prospectus. |
| emerging markets “tail risk” in what remains a depressed asset class. We would also note an unintended consequence of the reversal in EM market sentiment: a rotation out of high-quality, high-multiple, high-growth stocks into index constituents that dominate most market gauges. Perhaps reflecting this phenomenon, the MSCI Emerging Markets Large Cap Index returned 5.97% in the final 11 days of the quarter, versus 1.95% for the MSCI Emerging Markets Small Cap Index. Perhaps also reflecting this phenomenon, the Thornburg Developing World Fund rose 4.00% during the first 171 days of the six-month period against a backdrop of market declines, but just 1.03% in the final 11 days of the period as the broader EM indices lifted. |
While the fundamental outlook for emerging markets is not necessarily supportive of a continued recovery in share prices, there is intuitive appeal to the notion that the rebound in EM indices and currencies may continue. Most notably, there is a lot of bad news “in the price.” In fact, for the three years ended March 31, 2014, the MSCI Emerging Markets Index underperformed the S&P 500 Index by 59.10%, while EM mutual fund outflows approached record levels by some measures – all for an asset class that remains promising in the long term due to low per-capita gross domestic product (GDP) levels, and low consumer and government indebtedness. We are very much encouraged by the spate of interest rate increases from the world’s emerging markets central banks. Indeed, interest rate increases represent the collective policy response that is a necessary precondition for a correction in current account deficits, currency depreciation, inflationary pressures, and capital flight. It is also worth noting that an extended rise in emerging markets share prices would likely result in upward currency pressures, which would in turn preempt a more protracted cyclical adjustment process.
At the same time, we must acknowledge that the near-term fundamental outlook for emerging markets remains challenging. In particular, tighter monetary policy certainly introduces a negative bias to growth in the coming quarters, and it is hard to envision an earnings-based market recovery until we have fully cycled through the rate increases. Moreover, it is still possible that despite the recent recovery in market sentiment, the implications of the U.S. Federal Reserve’s tapering of its monthly purchases of long-term debt may not be fully factored into share prices. These implications could include further currency depreciation, inflationary pressures, and tighter monetary policy not just in the U.S. but in the emerging markets, and the likelihood of additional negative growth surprises. We may also experience bumps in the road as China continues down the path of better capital allocation, reduced debt intensity, and ultimately lower economic growth. Given this backdrop, it seems reasonable to assume that we are in the middle-to-later stages of a cyclical correction in the emerging markets, though we will of course be delighted to see full resolution of cyclical EM pressures sooner than we expect.
We invite you to visit our website at www.thornburg.com, where you will find additional information about the Thornburg Developing World Fund. We thank you for your trust and confidence.
Sincerely,

Lewis Kaufman,CFA
Portfolio Manager
Managing Director
Certified Semi-Annual Report 7
| | |
| Schedule of Investments | | |
| |
Thornburg Developing World Fund | | March 31, 2014 (Unaudited) |
Top Ten Equity Holdings
As of 3/31/14
| | | | |
Magnit OJCS GDR | | | 3.1 | % |
Kroton Educacional S.A. | | | 2.7 | % |
Al Tayyar Travel Group | | | 2.4 | % |
HDFC Bank Ltd. ADR | | | 2.4 | % |
Galaxy Entertainment Group Ltd. | | | 2.4 | % |
| Facebook, Inc. | | | 2.2 | % |
| Credicorp Ltd. | | | 2.2 | % |
| PT Bank Mandiri | | | 2.2 | % |
| Compagnie Financiere Richemont SA | | | 2.1 | % |
| Siam Commercial Bank plc | | | 2.1 | % |
Summary of Industry Exposure
As of 3/31/14
| | | | |
Consumer Services | | | 15.3 | % |
Banks | | | 12.1 | % |
Software & Services | | | 12.1 | % |
Food & Staples Retailing | | | 7.7 | % |
Consumer Durables & Apparel | | | 7.2 | % |
Food, Beverage & Tobacco | | | 6.3 | % |
Energy | | | 5.5 | % |
Retailing | | | 4.1 | % |
Transportation | | | 3.7 | % |
Household & Personal Products | | | 3.1 | % |
| Health Care Equipment & Services | | | 2.9 | % |
| Technology Hardware & Equipment | | | 2.7 | % |
| Insurance | | | 1.9 | % |
| Diversified Financials | | | 1.9 | % |
| Semiconductors & Semiconductor Equipment | | | 1.7 | % |
| Materials | | | 1.7 | % |
| Pharmaceuticals, Biotechnology & Life Sciences | | | 1.0 | % |
| Media | | | 1.0 | % |
| Other Assets & Liabilities | | | 8.1 | % |
Summary of Country Exposure
As of 3/31/14 (percent of equity holdings)
| | | | |
United States | | | 12.8 | % |
Brazil | | | 12.0 | % |
China | | | 11.9 | % |
Mexico | | | 6.9 | % |
India | | | 6.1 | % |
Russia | | | 6.1 | % |
Philippines | | | 5.7 | % |
Taiwan | | | 4.9 | % |
Thailand | | | 4.2 | % |
Indonesia | | | 4.1 | % |
Poland | | | 2.7 | % |
Saudi Arabia | | | 2.7 | % |
| Peru | | | 2.4 | % |
| Switzerland | | | 2.3 | % |
| Nigeria | | | 2.0 | % |
| Panama | | | 2.0 | % |
| Cambodia | | | 1.9 | % |
| Italy | | | 1.7 | % |
| Lao People’s Republic | | | 1.6 | % |
| South Korea | | | 1.6 | % |
| South Africa | | | 1.2 | % |
| Colombia | | | 1.1 | % |
| Norway | | | 1.1 | % |
| Romania | | | 1.0 | % |
| | | | | | | | |
| | | SHARES/ | | | | |
| | | PRINCIPAL
AMOUNT | | | VALUE | |
COMMON STOCK — 91.87% | | | | | | | | |
| | |
BANKS — 12.08% | | | | | | | | |
Banks — 12.08% | | | | | | | | |
Alliance Global Group, Inc. | | | 37,998,677 | | | $ | 24,149,009 | |
Credicorp Ltd. | | | 403,674 | | | | 55,674,718 | |
Guaranty Trust Bank plc | | | 156,678,433 | | | | 24,206,604 | |
HDFC Bank Ltd. ADR | | | 1,495,870 | | | | 61,375,546 | |
Itau Unibanco Holding SA ADR | | | 1,790,400 | | | | 26,605,344 | |
PT Bank Mandiri | | | 66,363,737 | | | | 55,205,750 | |
Security Bank Corp. | | | 3,408,276 | | | | 8,056,132 | |
Siam Commercial Bank plc | | | 10,752,460 | | | | 52,204,453 | |
| | | | | | | | |
| | | | | | | 307,477,556 | |
| | | | | | | | |
8 Certified Semi-Annual Report
| | |
| Schedule of Investments, continued | | |
| |
Thornburg Developing World Fund | | March 31, 2014 (Unaudited) |
| | | | | | | | |
| | | SHARES/ | | | | |
| | | PRINCIPAL
AMOUNT | | | VALUE | |
CONSUMER DURABLES & APPAREL — 7.25% | | | | | | | | |
Household Durables — 0.74% | | | | | | | | |
TTK Prestige Ltd. | | | 371,217 | | | $ | 18,964,094 | |
Textiles, Apparel & Luxury Goods — 6.51% | | | | | | | | |
Compagnie Financiere Richemont SA | | | 552,348 | | | | 52,732,505 | |
Eclat Textile Co. Ltd. | | | 4,100,864 | | | | 47,401,827 | |
LPP S.A. | | | 8,376 | | | | 24,619,977 | |
Prada S.p.A. | | | 5,284,382 | | | | 40,911,125 | |
| | | | | | | | |
| | | | | | | 184,629,528 | |
| | | | | | | | |
CONSUMER SERVICES — 15.33% | | | | | | | | |
Diversified Consumer Services — 3.68% | | | | | | | | |
a Fu Shou Yuan International Group, Ltd. | | | 43,203,841 | | | | 24,173,876 | |
Kroton Educacional S.A. | | | 3,162,102 | | | | 69,541,159 | |
Hotels, Restaurants & Leisure — 11.65% | | | | | | | | |
Al Tayyar Travel Group | | | 2,043,315 | | | | 62,110,979 | |
a Alsea S.A.B. de C.V. | | | 10,084,129 | | | | 36,573,361 | |
a Bloomberry Resorts Corp. | | | 60,603,351 | | | | 13,568,015 | |
a Galaxy Entertainment Group Ltd. | | | 6,925,413 | | | | 60,267,566 | |
a International Meal Company Holdings S.A. | | | 3,219,723 | | | | 24,435,271 | |
a Jubilant FoodWorks Ltd. | | | 866,080 | | | | 15,398,670 | |
NagaCorp Ltd. | | | 43,178,000 | | | | 44,978,823 | |
Yum! Brands, Inc. | | | 518,984 | | | | 39,126,204 | |
| | | | | | | | |
| | | | | | | 390,173,924 | |
| | | | | | | | |
DIVERSIFIED FINANCIALS — 1.87% | | | | | | | | |
Consumer Finance — 1.87% | | | | | | | | |
a First Cash Financial Services, Inc. | | | 944,258 | | | | 47,647,259 | |
| | | | | | | | |
| | | | | | | 47,647,259 | |
| | | | | | | | |
ENERGY — 5.50% | | | | | | | | |
Energy Equipment & Services — 1.70% | | | | | | | | |
Anton Oilfield Services Group | | | 67,969,051 | | | | 43,200,854 | |
Oil, Gas & Consumable Fuels — 3.80% | | | | | | | | |
a DNO International ASA | | | 6,816,209 | | | | 26,011,286 | |
a Gran Tierra Energy, Inc. | | | 3,328,038 | | | | 24,986,626 | |
a Heritage Oil plc | | | 5,846,096 | | | | 23,147,509 | |
a,b ROMGAZ SA-GDR 144a | | | 1,984,965 | | | | 19,849,650 | |
a ROMGAZ SA-GDR REGS | | | 288,500 | | | | 2,885,000 | |
| | | | | | | | |
| | | | | | | 140,080,925 | |
| | | | | | | | |
FOOD & STAPLES RETAILING — 7.68% | | | | | | | | |
Food & Staples Retailing — 7.68% | | | | | | | | |
Clicks Group Ltd. | | | 4,697,995 | | | | 29,250,909 | |
Jeronimo Martins SGPS SA | | | 2,262,670 | | | | 37,967,086 | |
Magnit OJCS GDR | | | 1,447,535 | | | | 79,324,918 | |
PriceSmart, Inc. | | | 131,918 | | | | 13,314,484 | |
Puregold Price Club, Inc. | | | 36,234,260 | | | | 35,551,509 | |
| | | | | | | | |
| | | | | | | 195,408,906 | |
| | | | | | | | |
FOOD, BEVERAGE & TOBACCO — 6.34% | | | | | | | | |
Beverages — 1.67% | | | | | | | | |
Fomento Economico Mexicano SAB de CV ADR | | | 454,762 | | | | 42,402,009 | |
Food Products — 4.67% | | | | | | | | |
a Amira Nature Foods Ltd. | | | 1,354,845 | | | | 23,086,559 | |
Biostime International Holdings Ltd. | | | 4,595,297 | | | | 31,547,678 | |
Grupo Lala, S.A.B. de C.V. | | | 18,716,637 | | | | 38,707,763 | |
Universal Robina Corp. | | | 8,078,613 | | | | 25,580,623 | |
| | | | | | | | |
| | | | | | | 161,324,632 | |
| | | | | | | | |
Certified Semi-Annual Report 9
| | |
| Schedule of Investments, continued | | |
| |
Thornburg Developing World Fund | | March 31, 2014 (Unaudited) |
| | | | | | | | |
| | | SHARES/ | | | | |
| | | PRINCIPAL
AMOUNT | | | VALUE | |
HEALTH CARE EQUIPMENT & SERVICES — 2.88% | | | | | | | | |
Health Care Equipment & Supplies — 0.93% | | | | | | | | |
St. Shine Optical Co. Ltd. | | | 1,053,732 | | | $ | 23,495,083 | |
Health Care Providers & Services — 1.95% | | | | | | | | |
a Qualicorp SA | | | 4,913,954 | | | | 49,702,620 | |
| | | | | | | | |
| | | | | | | 73,197,703 | |
| | | | | | | | |
HOUSEHOLD & PERSONAL PRODUCTS — 3.14% | | | | | | | | |
Household Products — 1.74% | | | | | | | | |
Colgate Palmolive Co. | | | 682,466 | | | | 44,271,569 | |
Personal Products — 1.40% | | | | | | | | |
Hengan International Group Co. Ltd. | | | 3,439,596 | | | | 35,719,649 | |
| | | | | | | | |
| | | | | | | 79,991,218 | |
| | | | | | | | |
INSURANCE — 1.95% | | | | | | | | |
Insurance — 1.95% | | | | | | | | |
BB Seguridade Participacoes S.A. | | | 4,488,100 | | | | 49,667,779 | |
| | | | | | | | |
| | | | | | | 49,667,779 | |
| | | | | | | | |
MATERIALS — 1.68% | | | | | | | | |
Metals & Mining — 1.68% | | | | | | | | |
Southern Copper Corp. | | | 1,466,113 | | | | 42,678,549 | |
| | | | | | | | |
| | | | | | | 42,678,549 | |
| | | | | | | | |
MEDIA — 0.98% | | | | | | | | |
Media — 0.98% | | | | | | | | |
Zee Entertainment Enterprises, Ltd. | | | 5,488,130 | | | | 24,995,125 | |
| | | | | | | | |
| | | | | | | 24,995,125 | |
| | | | | | | | |
PHARMACEUTICALS, BIOTECHNOLOGY & LIFE
SCIENCES — 1.01% | | | | | | | | |
Pharmaceuticals — 1.01% | | | | | | | | |
China Medical System Holdings Ltd. | | | 22,800,711 | | | | 25,809,353 | |
| | | | | | | | |
| | | | | | | 25,809,353 | |
| | | | | | | | |
RETAILING — 4.06% | | | | | | | | |
Multiline Retail — 2.59% | | | | | | | | |
a Matahari Department Store Tbk | | | 33,041,355 | | | | 40,429,123 | |
a Robinsons Retail Holdings, Inc. | | | 16,836,183 | | | | 25,529,277 | |
Specialty Retail — 1.47% | | | | | | | | |
Kolao Holdings | | | 1,607,034 | | | | 37,365,862 | |
| | | | | | | | |
| | | | | | | 103,324,262 | |
| | | | | | | | |
SEMICONDUCTORS & SEMICONDUCTOR EQUIPMENT — 1.71% | | | | | | | | |
Semiconductors & Semiconductor Equipment — 1.71% | | | | | | | | |
Hermes Microvision, Inc. | | | 1,088,094 | | | | 43,591,649 | |
| | | | | | | | |
| | | | | | | 43,591,649 | |
| | | | | | | | |
SOFTWARE & SERVICES — 12.07% | | | | | | | | |
Information Technology Services — 0.52% | | | | | | | | |
QIWI plc ADR | | | 385,392 | | | | 13,353,833 | |
Internet Software & Services — 10.08% | | | | | | | | |
a Facebook, Inc. | | | 950,760 | | | | 57,273,783 | |
MercadoLibre, Inc. | | | 250,684 | | | | 23,842,555 | |
Naver Corp. | | | 50,612 | | | | 36,801,811 | |
Tencent Holdings Ltd. | | | 560,548 | | | | 38,988,674 | |
a Yahoo!, Inc. | | | 1,361,868 | | | | 48,891,061 | |
a Yandex NV | | | 1,686,565 | | | | 50,917,397 | |
Software — 1.47% | | | | | | | | |
Linx S.A. | | | 1,897,000 | | | | 37,296,240 | |
| | | | | | | | |
| | | | | | | 307,365,354 | |
| | | | | | | | |
10 Certified Semi-Annual Report
| | |
| Schedule of Investments, continued | | |
| |
Thornburg Developing World Fund | | March 31, 2014 (Unaudited) |
| | | | | | | | |
| | | SHARES/ | | | | |
| | | PRINCIPAL
AMOUNT | | | VALUE | |
TECHNOLOGY HARDWARE & EQUIPMENT — 2.67% | | | | | | | | |
Communications Equipment — 1.94% | | | | | | | | |
Qualcomm, Inc. | | | 627,196 | | | $ | 49,460,676 | |
Technology, Hardware, Storage & Periphals — 0.73% | | | | | | | | |
a Goldpac Group Ltd. | | | 19,322,245 | | | | 18,508,900 | |
| | | | | | | | |
| | | | | | | 67,969,576 | |
| | | | | | | | |
TRANSPORTATION — 3.67% | | | | | | | | |
Airlines — 1.81% | | | | | | | | |
Copa Holdings SA | | | 318,542 | | | | 46,249,113 | |
Transportation Infrastructure — 1.86% | | | | | | | | |
Airports of Thailand Public Company Ltd. | | | 7,907,091 | | | | 47,286,549 | |
| | | | | | | | |
| | | | | | | 93,535,662 | |
| | | | | | | | |
TOTAL COMMON STOCK (Cost $2,163,353,746) | | | | | | | 2,338,868,960 | |
| | | | | | | | |
SHORT TERM INVESTMENTS — 7.31% | | | | | | | | |
| | |
Ameren Corp., 0.25%, 4/1/2014 | | $ | 37,000,000 | | | | 37,000,000 | |
Bank of New York Tri-Party Repurchase Agreement 0.24% dated 3/31/2014, due 4/1/2014, repurchase price $30,000,200 collateralized by 12 corporate debt securities and 9 U.S. Government securities having an average coupon of 4.06%, a minimum credit rating of BBB-, maturity dates from 8/21/2017 to 3/4/2044 and having an aggregate market value of $31,490,896 at 3/31/2014 | | | 30,000,000 | | | | 30,000,000 | |
Hitachi America Capital, 0.22%, 4/3/2014 | | | 37,000,000 | | | | 36,999,548 | |
Kansas City Power & Light, 0.19%, 4/1/2014 | | | 33,000,000 | | | | 33,000,000 | |
Plains All American Pipeline, 0.25%, 4/1/2014 | | | 12,000,000 | | | | 12,000,000 | |
Union Electric Co., 0.20%, 4/1/2014 | | | 37,000,000 | | | | 37,000,000 | |
| | | | | | | | |
TOTAL SHORT TERM INVESTMENTS (Cost $185,999,548) | | | | | | | 185,999,548 | |
| | | | | | | | |
TOTAL INVESTMENTS — 99.18% (Cost $2,349,353,294) | | | | | | $ | 2,524,868,508 | |
OTHER ASSETS LESS LIABILITIES — 0.82% | | | | | | | 20,886,067 | |
| | | | | | | | |
NET ASSETS — 100.00% | | | | | | $ | 2,545,754,575 | |
| | | | | | | | |
Footnote Legend
| b | Securities exempt from registration under Rule 144A of the Securities Act of 1933, as amended. These securities may only be resold in the ordinary course of business in transactions exempt from registration, normally to qualified institutional buyers. As of March 31, 2014, the aggregate value of these securities in the Fund’s portfolio was $19,849,650, representing 0.78% of the Fund’s net assets. |
Portfolio Abbreviations
To simplify the listings of securities, abbreviations are used per the table below:
ADR American Depository Receipt
GDR Global Depository Receipt
See notes to financial statements.
Certified Semi-Annual Report 11
| | |
| Statement of Assets And Liabilities | | |
| |
Thornburg Developing World Fund | | March 31, 2014 (Unaudited) |
| | | | |
ASSETS | | | | |
Investments at value (cost $2,349,353,294) (Note 2) | | $ | 2,524,868,508 | |
Cash | | | 142,060 | |
Cash denominated in foreign currency (cost $6,501,055) | | | 6,499,582 | |
Receivable for investments sold | | | 27,605,803 | |
Receivable for fund shares sold | | | 26,542,278 | |
Unrealized appreciation on forward currency contracts (Note 7) | | | 164,340 | |
Dividends receivable | | | 2,982,961 | |
Dividend and interest reclaim receivable | | | 78,631 | |
Interest receivable | | | 200 | |
Prepaid expenses and other assets | | | 130,269 | |
| | | | |
Total Assets | | | 2,589,014,632 | |
| | | | |
| |
LIABILITIES | | | | |
Payable for investments purchased | | | 35,836,627 | |
Payable for fund shares redeemed | | | 3,778,096 | |
Unrealized depreciation on forward currency contracts (Note 7) | | | 1,212,996 | |
Payable to investment advisor and other affiliates (Note 3) | | | 2,266,295 | |
Accounts payable and accrued expenses | | | 166,043 | |
| | | | |
Total Liabilities | | | 43,260,057 | |
| | | | |
| |
NET ASSETS | | $ | 2,545,754,575 | |
| | | | |
NET ASSETS CONSIST OF | | | | |
Distribution in excess of net investment income | | $ | (2,122,564 | ) |
Net unrealized appreciation on investments | | | 174,484,608 | |
Accumulated net realized gain (loss) | | | (51,199,043 | ) |
Net capital paid in on shares of beneficial interest | | | 2,424,591,574 | |
| | | | |
| | $ | 2,545,754,575 | |
| | | | |
12 Certified Semi-Annual Report
| | |
| Statement of Assets and Liabilities, Continued | | |
| |
Thornburg Developing World Fund | | March 31, 2014 (Unaudited) |
| | | | |
NET ASSET VALUE | | | | |
Class A Shares: | | | | |
Net asset value and redemption price per share
($629,152,128 applicable to 33,702,191 shares of beneficial interest outstanding - Note 4) | | $ | 18.67 | |
Maximum sales charge, 4.50% of offering price | | | 0.88 | |
| | | | |
Maximum offering price per share | | $ | 19.55 | |
| | | | |
Class C Shares: | | | | |
Net asset value and offering price per share*
($187,645,857 applicable to 10,338,890 shares of beneficial interest outstanding - Note 4) | | $ | 18.15 | |
| | | | |
Class I Shares: | | | | |
Net asset value, offering and redemption price per share
($1,709,945,935 applicable to 90,011,570 shares of beneficial interest outstanding - Note 4) | | $ | 19.00 | |
| | | | |
Class R5 Shares: | | | | |
Net asset value, offering and redemption price per share
($3,131,399 applicable to 165,311 shares of beneficial interest outstanding - Note 4) | | $ | 18.94 | |
| | | | |
Class R6 Shares: | | | | |
Net asset value, offering and redemption price per share
($15,879,256 applicable to 835,995 shares of beneficial interest outstanding - Note 4) | | $ | 18.99 | |
| | | | |
| * | Redemption price per share is equal to net asset value less any applicable contingent deferred sales charge. |
See notes to financial statements.
Certified Semi-Annual Report 13
| | |
| Statement of Operations | | |
| |
Thornburg Developing World Fund | | Six Months Ended March 31, 2014 (Unaudited) |
| | | | |
INVESTMENT INCOME | | | | |
Dividend income (net of foreign taxes withheld of $751,440) | | $ | 9,596,693 | |
Interest income | | | 145,902 | |
| | | | |
Total Income | | | 9,742,595 | |
| | | | |
| |
EXPENSES | | | | |
Investment advisory fees (Note 3) | | | 8,629,776 | |
Administration fees (Note 3) | | | | |
Class A Shares | | | 316,265 | |
Class C Shares | | | 92,775 | |
Class I Shares | | | 311,749 | |
Class R5 Shares | | | 482 | |
Distribution and service fees (Note 3) | | | | |
Class A Shares | | | 616,846 | |
Class C Shares | | | 748,720 | |
Transfer agent fees | | | | |
Class A Shares | | | 140,190 | |
Class C Shares | | | 58,905 | |
Class I Shares | | | 174,330 | |
Class R5 Shares | | | 1,545 | |
Class R6 Shares | | | 2,953 | |
Registration and filing fees | | | | |
Class A Shares | | | 40,891 | |
Class C Shares | | | 14,258 | |
Class I Shares | | | 59,755 | |
Class R5 Shares | | | 13,165 | |
Class R6 Shares | | | 7,994 | |
Custodian fees (Note 3) | | | 413,884 | |
Professional fees | | | 32,460 | |
Accounting fees | | | 10,430 | |
Trustee fees | | | 13,750 | |
Other expenses | | | 173,450 | |
| | | | |
Total Expenses | | | 11,874,573 | |
Less: | | | | |
Expenses reimbursed by investment advisor (Note 3) | | | (51,653 | ) |
Fees paid indirectly (Note 3) | | | (2,635 | ) |
| | | | |
Net Expenses | | | 11,820,285 | |
| | | | |
Net Investment Loss | | $ | (2,077,690 | ) |
| | | | |
14 Certified Semi-Annual Report
| | |
| Statement of Operations, Continued | | |
| |
Thornburg Developing World Fund | | Six Months Ended March 31, 2014 (Unaudited) |
| | | | |
REALIZED AND UNREALIZED GAIN (LOSS) | | | | |
Net realized gain (loss) from: | | | | |
Investments | | $ | (26,598,654 | ) |
Forward currency contracts (Note 7) | | | (3,241,858 | ) |
Foreign currency transactions | | | (459,442 | ) |
| | | | |
| | | (30,299,954 | ) |
| | | | |
Net change in unrealized appreciation (depreciation) on: | | | | |
Investments | | | 113,626,080 | |
Foreign currency translations | | | 20,888 | |
Forward currency contracts (Note 7) | | | 1,742,428 | |
| | | | |
| | | 115,389,396 | |
| | | | |
Net Realized and Unrealized Gain | | | 85,089,442 | |
| | | | |
Net Increase in Net Assets Resulting from Operations | | $ | 83,011,752 | |
| | | | |
See notes to financial statements.
Certified Semi-Annual Report 15
| | |
| Statements of Changes in Net Assets | | |
| |
Thornburg Developing World Fund | | |
| | | | | | | | | | |
| | | SIX MONTHS ENDED
MARCH 31, 2014* | | YEAR ENDED
SEPTEMBER 30, 2013 |
INCREASE (DECREASE) IN NET ASSETS FROM | | | | | | | | | | |
| | |
OPERATIONS | | | | | | | | | | |
Net investment income (loss) | | | $ | (2,077,690 | ) | | | $ | 1,396,670 | |
Net realized gain (loss) on investments, forward currency contracts, and foreign currency transactions | | | | (30,299,954 | ) | | | | (15,988,371 | ) |
Net unrealized appreciation (depreciation) on investments, forward currency contracts, and foreign currency translations | | | | 115,389,396 | | | | | 46,005,009 | |
| | | | | | | | | | |
| | |
Net Increase (Decrease) in Net Assets Resulting from Operations | | | | 83,011,752 | | | | | 31,413,308 | |
| | |
DIVIDENDS TO SHAREHOLDERS | | | | | | | | | | |
From net investment income | | | | | | | | | | |
Class A Shares | | | | — | | | | | (30,996 | ) |
Class I Shares | | | | (470,033 | ) | | | | (445,713 | ) |
Class R5 Shares | | | | (4,741 | ) | | | | — | |
Class R6 Shares | | | | (35,991 | ) | | | | — | |
| | |
FUND SHARE TRANSACTIONS (NOTE 4) | | | | | | | | | | |
Class A Shares | | | | 261,739,320 | | | | | 297,364,931 | |
Class C Shares | | | | 75,751,864 | | | | | 94,374,393 | |
Class I Shares | | | | 826,164,794 | | | | | 756,746,811 | |
Class R5 Shares | | | | 2,374,606 | | | | | 683,542 | |
Class R6 Shares | | | | 716,168 | | | | | 13,901,372 | |
| | | | | | | | | | |
Net Increase in Net Assets | | | | 1,249,247,739 | | | | | 1,194,007,648 | |
| | |
NET ASSETS | | | | | | | | | | |
Beginning of Period | | | | 1,296,506,836 | | | | | 102,499,188 | |
| | | | | | | | | | |
| | |
End of Period | | | $ | 2,545,754,575 | | | | $ | 1,296,506,836 | |
| | | | | | | | | | |
| | |
Undistributed (distribution in excess of) net investment income | | | $ | (2,122,564 | ) | | | $ | 465,891 | |
See notes to financial statements.
16 Certified Semi-Annual Report
| | |
| Notes to Financial Statements | | |
| |
Thornburg Developing World Fund | | March 31, 2014 (Unaudited) |
NOTE 1 – ORGANIZATION
Thornburg Developing World Fund, hereinafter referred to as the “Fund,” is a diversified series of Thornburg Investment Trust (the “Trust”). The Fund commenced operations on December 16, 2009. The Trust was organized as a Massachusetts business trust under a Declaration of Trust dated June 3, 1987 and is registered as a diversified, open-end management investment company under the Investment Company Act of 1940, as amended. The Fund is currently one of eighteen separate series of the Trust. Each series is considered to be a separate entity for financial reporting and tax purposes and bears expenses directly attributable to it. The Fund seeks long-term capital appreciation.
The Fund currently offers five classes of shares of beneficial interest: Class A, Class C, Institutional Class (“Class I”) and Retirement Classes (“Class R5” and “Class R6”). Each class of shares of the Fund represents an interest in the same portfolio of investments, except that (i) Class A shares are sold subject to a front-end sales charge collected at the time the shares are purchased and bear a service fee, (ii) Class C shares are sold at net asset value without a sales charge at the time of purchase, but are subject to a contingent deferred sales charge upon redemption within one year of purchase, and bear both a service fee and a distribution fee, (iii) Class I and Class R5 shares are sold at net asset value without a sales charge at the time of purchase and may be subject to a service fee, (iv) Class R6 shares are sold at net asset value without a sales charge at the time of purchase, and (v) the respective classes may have different reinvestment privileges and conversion rights. Additionally, the Fund may allocate among its classes certain expenses, to the extent allocable to specific classes, including transfer agent fees, government registration fees, certain printing and postage costs, and administrative and legal expenses. Currently, class specific expenses of the Fund are limited to service and distribution fees, administration fees, and certain registration and transfer agent expenses.
NOTE 2 – SIGNIFICANT ACCOUNTING POLICIES
Significant accounting policies of the Trust are as follows:
Valuation Policy and Procedures: The Fund’s Trustees of the Trust (the “Trustees”) have authorized employees of the Fund’s investment advisor, acting as the Valuation and Pricing Committee (the “Committee”), to make certain valuation determinations, subject to oversight and review by the Trustees and the Audit Committee of the Trustees. The Committee and other employees of the Fund’s investment advisor administer and implement the valuation process. The Committee regularly reviews its own fair value decisions, as well as valuations, valuation techniques and services furnished by pricing services, considers circumstances in the markets which may require valuation determinations by the Committee and reviews previous valuation determinations. The Committee also reports on its activities, the performance of the pricing services and other matters to the Trustees and the Audit Committee of the Trustees.
In determining a fair value for a portfolio investment, the Committee seeks to determine the price that the Fund would reasonably expect to receive upon a sale of the investment in an orderly transaction between market participants at the measurement date. Typically, the fair value process employs standing instructions to use quoted prices in active markets or the use of independent pricing services. Less frequently, the Committee may make a fair value determination using other methods. However, because fair value prices are estimated prices, the determination of fair value for an investment may differ from the value that would be realized by the Fund upon a sale of the investment, and that difference could be material to the Fund’s financial statements. The Committee’s determination of fair value for an investment may also differ from the prices obtained by other persons (including other mutual funds) for the investment.
Valuation of Investments: Portfolio investments listed or traded on a national securities exchange are valued on the valuation date at the last reported trade price on the exchange that is the primary market for the investment. Portfolio investments traded on an exchange for which there has been no trade that day and other equity investments traded in the over-the-counter market are valued at the mean between the last reported bid and ask prices. Portfolio investments reported by NASDAQ are valued at the NASDAQ official closing price. Any foreign investment traded on exchanges outside the United States is valued at the price of the investment on the exchange that is normally the investment’s primary market, as of the close of that exchange preceding the time of the Fund’s valuation measurement date.
In any case when the market value of an equity investment held by the Fund is not readily available, a determination of a fair value for the investment is made by the Committee. The Committee’s determinations are made using procedures in accordance with a policy approved by the Trustees, which may include the use of a price obtained from an independent pricing service. The pricing service ordinarily values equity investments in these instances using multi-factor models to adjust market prices based upon various inputs, including exchange data, depository receipt prices, futures, index data and other data. An investment’s market value is deemed not readily available whenever the exchange or market on which the investment is primarily traded is closed for the entire scheduled day of trading. Additionally, an investment’s market value may be deemed not readily available under other circumstances identified by the Trustees, including when developments occurring after the most recent close of the investment’s primary exchange or market, but before the most recent close of trading in Fund shares, or an unusual event or significant period of time occurring since the availability of a market quotation, create a question about the reliability of the investment’s market value. On days when market volatility thresholds pre-determined by the Trustees are exceeded, foreign equity investments held by the Fund may be valued using synthetic pricing obtained from an independent pricing service approved by the Trustees, subject to the ability of the Committee to determine in any such instance to utilize market closing prices if the Committee considers closing prices to be more reliable.
Certified Semi-Annual Report 17
| | |
| Notes to Financial Statements, Continued | | |
| |
Thornburg Developing World Fund | | March 31, 2014 (Unaudited) |
Debt obligations held by the Fund have a primary over-the-counter market and are valued by an independent pricing service approved by the Trustees. The pricing service ordinarily values debt obligations at quoted bid prices. When quotations are not available, debt obligations held by the Fund are valued at evaluated prices determined by the pricing service using methods which include consideration of yields or prices of debt obligations of comparable quality, type of issue, coupon, maturity and rating, and indications as to value from dealers and general market conditions. Short-term obligations having remaining maturities of 60 days or less are ordinarily valued at amortized cost, which approximates market value.
In any case when a pricing service fails to provide a price for a debt obligation held by the Fund, the Committee determines a fair value for the debt obligation using procedures in accordance with a policy approved by the Trustees, which may include the use of a price obtained from a different independent pricing service. Additionally, in any case when management believes that a price provided by a pricing service for a debt obligation held by the Fund may be unreliable, the Committee decides whether or not to use the pricing service’s valuation or to use an alternative method to determine a fair value for the debt obligation.
Quotations in foreign currencies for foreign portfolio investments are converted to U.S. dollar equivalents using the foreign exchange quotation in effect at the time of valuation.
Valuation Measurements: The Fund categorizes its investments based upon the inputs used in valuing those investments, according to a three-level hierarchy established by guidance from the Financial Accounting Standards Board (the “FASB”). Categorization of investments using this hierarchy is intended by the FASB to maximize the use of observable inputs and minimize the use of unobservable inputs by prioritizing that the most observable input be used when available. Observable inputs are those that market participants would use in valuing an investment based on available market data. Unobservable inputs are those that reflect assumptions about the information market participants would use in valuing an investment. An investment’s level within the hierarchy is based on the lowest level input that is deemed significant to the fair value measurement. The methodologies and relative inputs used to value investments are not necessarily indications of the risk or liquidity associated with investing in those investments.
Various inputs are used in determining the fair value measurement of the Fund’s investments. These inputs are generally summarized according to the three-level hierarchy below:
Level 1: Quoted prices in active markets for identical investments.
Level 2: Other direct or indirect significant observable inputs (including quoted prices for similar investments in active markets and other observable inputs, such as interest rates, prepayment rates, credit risk, etc.).
When market volatility thresholds are exceeded, foreign equity investments may be fair valued according to other significant observable inputs rather than quoted market prices. The affected investments will be characterized as Level 2 within the valuation hierarchy and revert to Level 1 after the threshold is no longer exceeded.
Level 3: Significant unobservable inputs, (including the Committee’s own assumptions in determining the fair value of investments), are generally applicable to investments fair valued with single broker quotes and other investments.
Portfolio investments with minimal, if any, market activity are characterized as Level 3 and are valued using significant unobservable inputs, typically including single broker quotes, which may be adjusted or unadjusted, related or comparable investments, last available transactions, and other relevant information. Valuations may also be based upon current market prices of securities that are comparable in coupon, rating, maturity and industry. An income based valuation approach would consider discounted anticipated future cash flows of the investment. Discounts may also be applied due to the nature or duration of any restrictions on the disposition of the investment. The derived value of a Level 3 investment may not represent the value which is received upon disposition.
The following table displays a summary of the fair value hierarchy measurements of the Fund’s investments as of March 31, 2014. In any instance when valuation inputs from more than one level are used to determine the fair value of a specific investment, the investment is placed in the level of the table based upon the lowest level input that is significant in determining the fair value of the investment:
18 Certified Semi-Annual Report
| | |
| Notes to Financial Statements, Continued | | |
| |
Thornburg Developing World Fund | | March 31, 2014 (Unaudited) |
| | | | | | | | | | | | | | | | |
| | | FAIR VALUE MEASUREMENTS AT MARCH 31, 2014 | |
| | | TOTAL | | | LEVEL 1 | | | LEVEL 2 | | | LEVEL 3 | |
Assets | | | | | | | | | | | | | | | | |
Investments in Securities* | | | | | | | | | | | | | | | | |
Common Stock | | $ | 2,338,868,960 | | | $ | 2,219,528,308 | | | $ | 119,340,652 | | | $ | — | |
Short Term Investments | | | 185,999,548 | | | | — | | | | 185,999,548 | | | | — | |
| | | | | | | | | | | | | | | | |
Total Investments in Securities | | $ | 2,524,868,508 | | | $ | 2,219,528,308 | | | $ | 305,340,200 | | | $ | — | |
Other Financial Instruments** | | | | | | | | | | | | | | | | |
Forward Currency Contracts | | $ | 164,340 | | | $ | — | | | $ | 164,340 | | | $ | — | |
Liabilities | | | | | | | | | | | | | | | | |
Other Financial Instruments** | | | | | | | | | | | | | | | | |
Forward Currency Contracts | | $ | (1,212,996 | ) | | $ | — | | | $ | (1,212,996 | ) | | $ | — | |
Spot Currency | | $ | (384 | ) | | $ | (384 | ) | | $ | — | | | $ | — | |
| * | See Schedule of Investments for a summary of the industry exposure as grouped according to the Global Industry Classification Standard (GICS), which is an industry taxonomy developed by MSCI, Inc. and Standard & Poor’s (S&P). |
| ** | Other Financial Instruments include investments not reflected in the Schedule of Investments, which may include futures, forwards and swap contracts, which are valued at the unrealized appreciation (depreciation) on the investment. |
In accordance with the guidance prescribed in Accounting Standards Update No. 2011-04, it is the policy of the Fund to recognize transfers between levels and those underlying events which caused the movement. The Fund recognized no transfers between levels for the six months ended March 31, 2014, other than when the Fund exceeded market volatility thresholds for foreign equity investments during the period.
Foreign Currency Translation: Portfolio investments and other assets and liabilities denominated in foreign currencies are translated into U.S. dollars based on the exchange rate of such currencies against the U.S. dollar on the date of valuation. Purchases and sales of investments and income items denominated in foreign currencies are translated into U.S. dollars at the exchange rate in effect on the transaction date. When the Fund purchases or sells foreign investments, it will customarily enter into a foreign exchange contract to minimize foreign exchange risk from the trade date to the settlement date of such transactions. The values of such spot contracts are included in receivable for investments sold and payable for investments purchased on the Statement of Assets and Liabilities.
The Fund does not separately report the effect of changes in foreign exchange rates from changes in market prices on investments held. Such changes are included in net unrealized appreciation or depreciation from investments.
Reported net realized gains or losses from foreign currency transactions arise due to purchases and sales of foreign currencies, currency gains or losses realized between the trade and settlement dates on investment transactions and the difference between the amounts of dividends, interest, and foreign withholding taxes recorded on the Fund’s books, and the U.S. dollar equivalent of the amounts actually received or paid.
Net change in unrealized appreciation and depreciation on foreign currency translations arise from changes in the fair value of assets and liabilities, other than investments at fiscal period end, resulting from changes in exchange rates.
Deferred Taxes: The Fund is subject to a tax imposed on net realized gains of securities of certain foreign countries. The Fund records an estimated deferred tax liability for net unrealized gains on these investments as reflected in the accompanying financial statements.
Federal Income Taxes: It is the policy of the Trust to comply with the provisions of the Internal Revenue Code applicable to “regulated investment companies” and to distribute to shareholders substantially all taxable income, including any net realized gain on investments of the Fund. Therefore, no provision for federal income taxes is required.
Management reviews each uncertain tax position believed to be material to the preparation of the Fund’s financial statements, to assess if it is more likely than not that the position would be sustained upon examination, based upon the technical merits of the position. As of March 31, 2014, management has not identified any such position for which an asset or liability must be reflected in the Statement of Assets and Liabilities. The Fund’s tax returns remain subject to examination for three years after filing.
When-Issued and Delayed Delivery Transactions: The Fund may engage in when-issued or delayed delivery transactions. To the extent the Fund engages in such transactions, it will do so for the purpose of acquiring portfolio investments consistent with the Fund’s investment objectives and not for the purpose of investment leverage or to speculate on interest rate and/or market changes. At the time the Fund makes a commitment to purchase an investment on a when-issued or delayed delivery basis, the Fund will record the transaction and reflect the value in determining its net asset value. When effecting such transactions, assets of an amount sufficient to make
Certified Semi-Annual Report 19
| | |
| Notes to Financial Statements, Continued | | |
| |
Thornburg Developing World Fund | | March 31, 2014 (Unaudited) |
payment for the portfolio investments to be purchased will be segregated on the Fund’s records on the trade date. Investments purchased on a when-issued or delayed delivery basis do not earn interest until the settlement date.
Dividends: Dividends to shareholders, if any, are generally paid quarterly and are reinvested in additional shares of the Fund at net asset value per share at the close of business on the dividend payment date or, at the shareholder’s option, paid in cash. Net realized capital gains, to the extent available, will be distributed at least annually. Distributions to shareholders are based on income tax regulations and therefore, their characteristics may differ for financial statement and tax purposes.
Repurchase Agreements: The Fund may invest excess cash in repurchase agreements whereby the Fund purchases investments, which serve as collateral, with an agreement to resell such collateral to the seller at an agreed upon price at the maturity date of the repurchase agreement. Investments pledged as collateral for repurchase agreements are held in custody until maturity of the repurchase agreement. Provisions in the agreements require that the market value of the collateral is at least equal to the repurchase value in the event of default. In the event of default, the Fund has the right to liquidate the collateral and apply the proceeds in satisfaction of the obligation. Under certain circumstances, in the event of default or bankruptcy by the other party to the agreement, realization and/or retention of the collateral may be subject to legal proceedings.
General: Investment transactions are accounted for on a trade date basis. Interest income is accrued as earned and dividend income is recorded on the ex-dividend date. Certain income from foreign investments is recognized as soon as information is available to the Fund. Realized gains and losses from the sale of investments are recorded on an identified cost basis. Net investment income (other than class specific expenses) and realized and unrealized gains and losses are allocated daily to each class of shares based upon the relative net asset value of outstanding shares of each class of shares at the beginning of the day (after adjusting for the current share activity of the respective class). Expenses common to all Funds are allocated among the Funds comprising the Trust based upon their relative net asset values or other appropriate allocation methods.
Guarantees and Indemnifications: Under the Trust’s organizational documents (and under separate agreements with the independent Trustees), its officers and Trustees are indemnified against certain liabilities arising out of the performance of their duties to the Fund. Additionally, in the normal course of business the Trust enters into contracts with service providers that contain general indemnification clauses. The Trust’s maximum exposure under these arrangements is unknown. However, based on experience, the Trust expects the risk of loss to be remote.
Use of Estimates: The preparation of financial statements, in conformity with United States generally accepted accounting principles, requires management to make estimates and assumptions that affect the reported amounts of assets and liabilities and the disclosure of contingent assets and liabilities at the date of the financial statements and the reported amounts of increases and decreases in net assets from operations during the reporting period. Actual amounts could differ from those estimates.
NOTE 3 – INVESTMENT ADVISORY FEE AND OTHER TRANSACTIONS WITH AFFILIATES
Pursuant to an investment advisory agreement, Thornburg Investment Management, Inc. (the “Advisor”) serves as the investment advisor and performs services for the Fund for which the fees are payable at the end of each month. For the six months ended March 31, 2014, these fees were payable at annual rates ranging from .975 of 1% to .775 of 1% per annum of the average daily net assets of the Fund depending on the Fund’s asset size. The Trust also has entered into administrative services agreements with the Advisor, whereby the Advisor will perform certain administrative services for the shareholders of each class of the Fund’s shares (except for Class R6 shares, which do not have an administrative services agreement) and for which fees will be payable at an annual rate of up to .125 of 1% per annum of the average daily net assets attributable to each class of shares. The Trust has an underwriting agreement with Thornburg Securities Corporation (the “Distributor,” an affiliate of the Advisor), which acts as the distributor of the Fund’s shares. For the six months ended March 31, 2014, the Distributor has advised the Fund that it earned commissions aggregating $114,447 from the sale of Class A shares, and collected contingent deferred sales charges aggregating $51,753 from redemptions of Class C shares of the Fund.
Pursuant to a service plan under Rule 12b-1 of the Investment Company Act of 1940, the Fund may reimburse to the Advisor an amount not to exceed .25 of 1% per annum of the average daily net assets attributable to each class of shares of the Fund (except for Class R6 shares, which do not have a Rule 12b-1 service plan) for payments made by the Advisor to securities dealers and other financial institutions to obtain various shareholder and distribution related services. For the six months ended March 31, 2014, there were no 12b-1 service plan fees charged for Class I shares. The Advisor may pay out of its own resources additional expenses for distribution of the Fund’s shares.
The Trust has also adopted a distribution plan pursuant to Rule 12b-1, applicable only to the Fund’s Class C shares under which the Fund compensates the Distributor for services in promoting the sale of Class C shares of the Fund at an annual rate of up to .75 of 1% per annum of the average daily net assets attributable to Class C shares. Total fees incurred by each class of shares of the Fund under their respective service and distribution plans for the six months ended March 31, 2014, are set forth in the Statement of Operations.
20 Certified Semi-Annual Report
| | |
| Notes to Financial Statements, continued | | |
| |
Thornburg Developing World Fund | | March 31, 2014 (Unaudited) |
The Advisor and Distributor have contractually agreed to waive fees and reimburse expenses incurred by the Fund so that actual expenses of certain share classes do not exceed specified levels. The agreement may be terminated by the Fund at any time, but may not be terminated by the Advisor or Distributor before February 1, 2015, unless the Advisor ceases to be the investment advisor to the Fund or the Distributor ceases to be the distributor of the Fund prior to that date. The Advisor and Distributor retain the right to be repaid by the Fund for fee waivers and expense reimbursements if expenses fall below the contractual limit prior to the end of the fiscal year.
For the six months ended March 31, 2014, the Advisor contractually reimbursed certain class specific expenses, administrative fees, and distribution fees of $28,246 for Class I shares, $13,953 for Class R5 shares, and $9,454 for Class R6 shares.
The Trust has an agreement with the custodian bank to indirectly pay a portion of the custodian’s fees through credits earned by the Fund’s cash on deposit with the bank. This deposit agreement is an alternative to overnight investments. Custodial fees are adjusted to reflect amounts that would have been paid without this agreement, with a corresponding adjustment reflected as fees paid indirectly in the Statement of Operations. For the six months ended March 31, 2014, fees paid indirectly were $2,635.
Certain officers and Trustees of the Trust are also officers or directors of the Advisor and Distributor. The compensation of independent Trustees is borne by the Trust.
NOTE 4 – SHARES OF BENEFICIAL INTEREST
At March 31, 2014, there were an unlimited number of shares of beneficial interest authorized. Transactions in shares of beneficial interest were as follows:
| | | | | | | | | | | | | | | | |
| | | SIX MONTHS ENDED | | | YEAR ENDED | |
| | | MARCH 31, 2014 (UNAUDITED) | | | SEPTEMBER 30, 2013 (AUDITED) | |
| | | SHARES | | | AMOUNT | | | SHARES | | | AMOUNT | |
Class A Shares | | | | | | | | | | | | | | | | |
Shares sold | | | 19,023,441 | | | $ | 349,967,151 | | | | 19,453,529 | | | $ | 338,888,450 | |
Shares issued to shareholders in reinvestment of dividends | | | — | | | | — | | | | 1,867 | | | | 29,767 | |
Shares repurchased | | | (4,857,115 | ) | | | (88,227,831 | ) | | | (2,427,380 | ) | | | (41,553,286 | ) |
| | | | | | | | | | | | | | | | |
| | | | |
Net increase (decrease) | | | 14,166,326 | | | $ | 261,739,320 | | | | 17,028,016 | | | $ | 297,364,931 | |
| | | | | | | | | | | | | | | | |
| | | | |
Class C Shares | | | | | | | | | | | | | | | | |
Shares sold | | | 4,753,492 | | | $ | 85,301,059 | | | | 5,727,322 | | | $ | 98,637,056 | |
Shares issued to shareholders in reinvestment of dividends | | | — | | | | — | | | | — | | | | — | |
Shares repurchased | | | (537,199 | ) | | | (9,549,195 | ) | | | (252,716 | ) | | | (4,262,663 | ) |
| | | | | | | | | | | | | | | | |
| | | | |
Net increase (decrease) | | | 4,216,293 | | | $ | 75,751,864 | | | | 5,474,606 | | | $ | 94,374,393 | |
| | | | | | | | | | | | | | | | |
| | | | |
Class I Shares | | | | | | | | | | | | | | | | |
Shares sold | | | 53,257,778 | | | $ | 995,342,923 | | | | 49,361,214 | | | $ | 874,895,509 | |
Shares issued to shareholders in reinvestment of dividends | | | 21,088 | | | | 398,558 | | | | 21,647 | | | | 349,371 | |
Shares repurchased | | | (9,139,278 | ) | | | (169,576,687 | ) | | | (6,837,358 | ) | | | (118,498,069 | ) |
| | | | | | | | | | | | | | | | |
| | | | |
Net increase (decrease) | | | 44,139,588 | | | $ | 826,164,794 | | | | 42,545,503 | | | $ | 756,746,811 | |
| | | | | | | | | | | | | | | | |
| | | | |
Class R5 Shares* | | | | | | | | | | | | | | | | |
Shares sold | | | 146,852 | | | $ | 2,752,875 | | | | 39,400 | | | $ | 696,856 | |
Shares issued to shareholders in reinvestment of dividends | | | 251 | | | | 4,741 | | | | — | | | | — | |
Shares repurchased | | | (20,440 | ) | | | (383,010 | ) | | | (752 | ) | | | (13,314 | ) |
| | | | | | | | | | | | | | | | |
| | | | |
Net increase (decrease) | | | 126,663 | | | $ | 2,374,606 | | | | 38,648 | | | $ | 683,542 | |
| | | | | | | | | | | | | | | | |
Certified Semi-Annual Report 21
| | |
| Notes to Financial Statements, continued | | |
| |
Thornburg Developing World Fund | | March 31, 2014 (Unaudited) |
| | | | | | | | | | | | | | | | |
| | | SIX MONTHS ENDED | | | YEAR ENDED | |
| | | MARCH 31, 2014 (UNAUDITED) | | | SEPTEMBER 30, 2013 (AUDITED) | |
| | | SHARES | | | AMOUNT | | | SHARES | | | AMOUNT | |
Class R6 Shares* | | | | | | | | | | | | | | | | |
Shares sold | | | 444,455 | | | $ | 8,314,706 | | | | 841,101 | | | $ | 14,680,898 | |
Shares issued to shareholders in reinvestment of dividends | | | 1,210 | | | | 22,853 | | | | — | | | | — | |
Shares repurchased | | | (407,177 | ) | | | (7,621,391 | ) | | | (43,594 | ) | | | (779,526 | ) |
| | | | | | | | | | | | | | | | |
| | | | |
Net increase (decrease) | | | 38,488 | | | $ | 716,168 | | | | 797,507 | | | $ | 13,901,372 | |
| | | | | | | | | | | | | | | | |
| * | Effective date of this Class of shares was February 1, 2013. |
NOTE 5 – INVESTMENT TRANSACTIONS
For the six months ended March 31, 2014, the Fund had purchase and sale transactions of investments (excluding short-term investments) of $1,477,335,978 and $414,433,619, respectively.
NOTE 6 – INCOME TAXES
At March 31, 2014, information on the tax components of capital was as follows:
| | | | |
Cost of investments for tax purposes | | $ | 2,349,353,294 | |
| | | | |
Gross unrealized appreciation on a tax basis | | $ | 244,361,488 | |
Gross unrealized depreciation on a tax basis | | | (68,846,274 | ) |
| | | | |
Net unrealized appreciation (depreciation) on investments (tax basis) | | $ | 175,515,214 | |
| | | | |
At March 31, 2014, the Fund had deferred tax basis capital losses occurring subsequent to October 31, 2012 of $14,340,933. For tax purposes, such losses will be reflected in the year ending September 30, 2014.
At March 31, 2014, the Fund had cumulative tax basis short-term capital losses of $3,737,233 generated after September 30, 2011, which may be carried forward to offset future capital gains. To the extent such carryforwards are used, capital gain distributions may be reduced to the extent provided by regulations. Such capital loss carryforwards may be carried forward indefinitely.
NOTE 7 – DERIVATIVE FINANCIAL INSTRUMENTS WITH OFF-BALANCE SHEET RISK AND FOREIGN INVESTMENT RISK
The Fund may use a variety of derivative financial instruments to hedge or adjust the risks affecting its investment portfolio or to enhance investment returns. Provisions of FASB Accounting Standards Codification 815-10-50 (“ASC 815”), require certain disclosures. The disclosures are intended to provide users of financial statements with an understanding of the use of derivative instruments by the Fund and how these derivatives affect the financial position, financial performance and cash flows of the Fund. The Fund does not designate any derivative instruments as hedging instruments under ASC 815. During the six months ended March 31, 2014, the Fund’s principal exposure to derivative financial instruments of the type addressed by ASC 815 was investment in foreign exchange contracts. A foreign exchange contract is an agreement between two parties to exchange different currencies at a specified rate of exchange at an agreed upon future date. Foreign exchange contracts involve risks to the Fund, including the risk that a contract’s counterparty will not meet its obligations to the Fund, the risk that a change in a contract’s value may not correlate perfectly with the currency the contract was intended to track, and the risk that the advisor is unable to correctly implement its strategy in using a contract. In any such instance, the Fund may not achieve the intended benefit of entering into a contract, and may experience a loss. Additionally, the Fund’s risk of loss may exceed the amounts recognized on the Statement of Assets and Liabilities.
22 Certified Semi-Annual Report
| | |
| NOTES TO FINANCIAL STATEMENTS, CONTINUED | | |
| |
Thornburg Developing World Fund | | March 31, 2014 (Unaudited) |
The Fund entered into forward currency contracts during the six months ended March 31, 2014 in the normal course of pursuing its investment objectives, with the objective of reducing the risk to the value of the Fund’s foreign investments from adverse changes in the relationship between the U.S. dollar and foreign currencies. In each case these contracts have been initiated in conjunction with foreign investment transactions.
These contracts are accounted for by the Fund under ASC 815. Unrealized appreciation and depreciation on outstanding contracts are reported in the Fund’s Statement of Assets and Liabilities, as measured by the difference between the forward exchange rates at the reporting date and the forward exchange rates at each contract’s inception date. Net realized gain (loss) on contracts closed during the period, and changes in net unrealized appreciation (depreciation) on outstanding contracts are recognized in the Fund’s Statement of Operations. Values of open sell currency contracts were indicative of the activity for the six months ended March 31, 2014. Open buy currency contracts are entered into for the purpose of closing open sell currency contracts and the values are dependent upon the values of the open sell currency contracts to which they relate.
The following table displays the outstanding forward currency contracts at March 31, 2014:
| | | | | | | | | | | | | | | | | | | | | | |
| | | | | OUTSTANDING FORWARD CURRENCY CONTRACTS TO BUY OR SELL AT MARCH 31, 2014 | |
CONTRACT DESCRIPTION | | BUY/SELL | | CONTRACT
AMOUNT | | | CONTRACT
VALUE
DATE | | | VALUE
USD | | | UNREALIZED
APPRECIATION | | | UNREALIZED
DEPRECIATION | |
Euro | | Buy | | | 5,606,500 | | | | 07/10/2014 | | | | 7,722,829 | | | $ | 96,756 | | | $ | — | |
Euro | | Buy | | | 5,852,500 | | | | 07/10/2014 | | | | 8,061,689 | | | | 67,584 | | | | — | |
Euro | | Sell | | | 4,980,100 | | | | 07/10/2014 | | | | 6,859,977 | | | | — | | | | (4,272 | ) |
Euro | | Sell | | | 69,356,000 | | | | 07/10/2014 | | | | 95,536,352 | | | | — | | | | (1,208,724 | ) |
| | | | | | | | | | | | | | | | | | | | | | |
Total | | | | | | | | | | | | | | | | $ | 164,340 | | | $ | (1,212,996 | ) |
| | | | | | | | | | | | | | | | | | | | | | |
The foregoing forward currency contracts were entered into pursuant to an International Swaps and Derivatives Association (ISDA) Master Agreement. In the event of a default or termination under the ISDA Master Agreement, the non-defaulting party has the right to close out all outstanding forward currency contracts between the parties and to net any payment amounts under those contracts, resulting in a single net amount payable by one party to the other. Because the ISDA Master Agreement does not result in an offset of reported amounts of financial assets and financial liabilities in the Fund’s Statement of Assets and Liabilities unless there has been an event of default or termination event under that agreement, the Fund does not net its outstanding forward currency contracts for purposes of the disclosure in the Fund’s Statement of Assets and Liabilities. Instead the Fund recognizes the unrealized appreciation or depreciation on those forward currency contracts on a gross basis in the Fund’s Statement of Assets and Liabilities. At March 31, 2014, those recognized amounts are disclosed in the following table:
| | | | | | |
| FAIR VALUES OF DERIVATIVE FINANCIAL INSTRUMENTS AT MARCH 31, 2014 | |
ASSET DERIVATIVES | | BALANCE SHEET LOCATION | | FAIR VALUE | |
| | |
Foreign exchange contracts | | Assets - Unrealized appreciation on
forward currency contracts | | $ | 164,340 | |
| | | | | | |
LIABILITY DERIVATIVES | | BALANCE SHEET LOCATION | | FAIR VALUE | |
| | |
Foreign exchange contracts | | Liabilities - Unrealized depreciation on
forward currency contracts | | $ | (1,212,996 | ) |
Because the Fund does not currently receive or post cash collateral in connection with its currency forward contracts, and because all of the Fund’s outstanding currency forward contracts are with State Street Bank and Trust Company, the net amounts of the Fund’s assets and liabilities which are attributable to those contracts at March 31, 2014 can be determined by offsetting the dollar amounts shown in the preceding table. Based on those amounts, the net amount of the Fund’s assets which is attributable to its outstanding forward currency contracts at March 31, 2014 is $0, and the net amount of the Fund’s liabilities which is attributable to those contracts at that date is $1,048,656. The Fund’s forward currency contracts are valued each day, and the net amounts of the Fund’s assets and liabilities which are attributable to those contracts are expected to vary over time.
Certified Semi-Annual Report 23
| | |
| NOTES TO FINANCIAL STATEMENTS, CONTINUED | | |
| |
Thornburg Developing World Fund | | March 31, 2014 (Unaudited) |
The net realized gain (loss) from forward currency contracts, and the net change in unrealized appreciation (depreciation) of outstanding forward currency contracts recognized in the Fund’s Statement of Operations for the six months ended March 31, 2014 are disclosed in the following tables:
| | | | | | | | | | |
AMOUNT OF NET REALIZED GAIN (LOSS) ON DERIVATIVE FINANCIAL INSTRUMENTS
RECOGNIZED IN INCOME FOR THE SIX MONTHS ENDED MARCH 31, 2014 |
| | | TOTAL | | FORWARD
CURRENCY CONTRACTS |
Foreign exchange contracts | | | $ | (3,241,858 | ) | | | $ | (3,241,858 | ) |
|
AMOUNT OF NET CHANGE IN UNREALIZED APPRECIATION (DEPRECIATION) OF DERIVATIVE FINANCIAL INSTRUMENTS RECOGNIZED IN INCOME FOR THE SIX MONTHS ENDED MARCH 31, 2014 |
| | | TOTAL | | FORWARD
CURRENCY CONTRACTS |
Foreign exchange contracts | | | $ | 1,742,428 | | | | $ | 1,742,428 | |
OTHER NOTES
Risks: The Fund’s investments subject it to risks including, but not limited to, management risk, market and economic risk, risks affecting specific issuers, liquidity risk, the risks associated with investments in smaller companies and non-U.S. issuers (including developing country issuers), credit risk, and interest rate risk. Please see the Fund’s prospectus for a discussion of the risks associated with an investment in the Fund.
Subsequent Events: Fund management believes no events have occurred between March 31, 2014 and the date of issuance of the financial statements that require adjustment to or disclosure in the accompanying financial statements.
24 Certified Semi-Annual Report
This page intentionally left blank.
Certified Semi-Annual Report 25
Financial Highlights
Thornburg Developing World Fund
| | | | | | | | | | | | | | | | | | | | | | | | | | | | | | | | | | | | | | | | | | | | | | | | | | | | | | | | | | |
| | | PER SHARE PERFORMANCE (FOR A SHARE OUTSTANDING THROUGHOUT THE PERIOD)+ | | | RATIOS TO AVERAGE NET ASSETS | | | SUPPLEMENTAL DATA | |
UNLESS
OTHERWISE
NOTED,
PERIODS
ARE
FISCAL
YEARS
ENDED
SEPT. 30, | | NET ASSET
VALUE
BEGINNING
OF PERIOD | | | NET
INVESTMENT
INCOME
(LOSS) | | | NET
REALIZED &
UNREALIZED
GAIN (LOSS)
ON
INVESTMENTS | | | TOTAL
FROM
INVESTMENT
OPERATIONS | | | DIVIDENDS
FROM NET
INVESTMENT
INCOME | | | DIVIDENDS
FROM NET
REALIZED
GAINS | | TOTAL
DIVIDENDS | | | NET
ASSET
VALUE
END OF
PERIOD | | | NET
INVESTMENT
INCOME
(LOSS) (%) | | | EXPENSES,
AFTER
EXPENSE
REDUCTIONS
(%) | | | EXPENSES,
AFTER
EXPENSE
REDUCTIONS
AND NET OF
CUSTODY
CREDITS (%) | | | EXPENSES,
BEFORE
EXPENSE
REDUCTIONS
(%) | | | TOTAL
RETURN
(%)(a) | | | PORTFOLIO
TURNOVER
RATE
(%)(a) | | | NET
ASSETS
AT END
OF
PERIOD
(THOUSANDS) | |
CLASS A SHARES | | | | | | | | | | | | | | | | | | | | | | | | | | | | | | | | | | | | | | | | | | | | | | | | | | | |
2014(b)(c) | | $ | 17.77 | | | | (0.04 | ) | | | 0.94 | | | | 0.90 | | | | — | | | — | | | — | | | $ | 18.67 | | | | (0.40 | )(d) | | | 1.41 | (d) | | | 1.41 | (d) | | | 1.41 | (d) | | | 5.06 | | | | 23.47 | | | $ | 629,152 | |
2013(b) | | $ | 15.71 | | | | 0.01 | | | | 2.06 | | | | 2.07 | | | | (0.01 | ) | | — | | | (0.01 | ) | | $ | 17.77 | | | | 0.05 | | | | 1.48 | | | | 1.48 | | | | 1.59 | | | | 13.19 | | | | 61.67 | | | $ | 347,073 | |
2012(b) | | $ | 12.50 | | | | (0.01 | ) | | | 3.22 | | | | 3.21 | | | | — | | | — | | | — | | | $ | 15.71 | | | | (0.05 | ) | | | 1.69 | | | | 1.69 | | | | 1.85 | | | | 25.68 | | | | 129.49 | | | $ | 39,390 | |
2011(b) | | $ | 14.44 | | | | (0.01 | ) | | | (1.91 | ) | | | (1.92 | ) | | | (0.02 | ) | | — | | | (0.02 | ) | | $ | 12.50 | | | | (0.05 | ) | | | 1.63 | | | | 1.62 | | | | 1.89 | | | | (13.34 | ) | | | 129.15 | | | $ | 24,929 | |
2010(b)(e) | | $ | 11.94 | | | | 0.06 | | | | 2.44 | | | | 2.50 | | | | — | | | — | | | — | | | $ | 14.44 | | | | 0.55 | (d) | | | 1.83 | (d) | | | 1.82 | (d) | | | 3.30 | (d) | | | 20.94 | | | | 47.37 | | | $ | 14,116 | |
CLASS C SHARES | | | | | | | | | | | | | | | | | | | | | | | | | | | | | | | | | | | | | | | | | | | | | | | | | | | |
2014(c) | | $ | 17.34 | | | | (0.11 | ) | | | 0.92 | | | | 0.81 | | | | — | | | — | | | — | | | $ | 18.15 | | | | (1.19 | )(d) | | | 2.20 | (d) | | | 2.20 | (d) | | | 2.20 | (d) | | | 4.67 | | | | 23.47 | | | $ | 187,646 | |
2013 | | $ | 15.44 | | | | (0.12 | ) | | | 2.02 | | | | 1.90 | | | | — | | | — | | | — | | | $ | 17.34 | | | | (0.71 | ) | | | 2.26 | | | | 2.26 | | | | 2.40 | | | | 12.31 | | | | 61.67 | | | $ | 106,168 | |
2012 | | $ | 12.37 | | | | (0.11 | ) | | | 3.18 | | | | 3.07 | | | | — | | | — | | | — | | | $ | 15.44 | | | | (0.76 | ) | | | 2.38 | | | | 2.38 | | | | 2.86 | | | | 24.82 | | | | 129.49 | | | $ | 10,006 | |
2011 | | $ | 14.39 | | | | (0.11 | ) | | | (1.90 | ) | | | (2.01 | ) | | | (0.01 | ) | | — | | | (0.01 | ) | | $ | 12.37 | | | | (0.74 | ) | | | 2.34 | | | | 2.34 | | | | 2.89 | | | | (13.96 | ) | | | 129.15 | | | $ | 7,258 | |
2010(e) | | $ | 11.94 | | | | (0.01 | ) | | | 2.46 | | | | 2.45 | | | | — | | | — | | | — | | | $ | 14.39 | | | | (0.11 | )(d) | | | 2.39 | (d) | | | 2.38 | (d) | | | 6.89 | (d) | | | 20.52 | | | | 47.37 | | | $ | 2,889 | |
CLASS I SHARES | | | | | | | | | | | | | | | | | | | | | | | | | | | | | | | | | | | | | | | | | | | | | | | | | | | |
2014(c) | | $ | 18.05 | | | | — | (f) | | | 0.96 | | | | 0.96 | | | | (0.01 | ) | | — | | | (0.01 | ) | | $ | 19.00 | | | | (0.03 | )(d) | | | 1.05 | (d) | | | 1.05 | (d) | | | 1.05 | (d) | | | 5.30 | | | | 23.47 | | | $ | 1,709,946 | |
2013 | | $ | 15.96 | | | | 0.09 | | | | 2.09 | | | | 2.18 | | | | (0.09 | ) | | — | | | (0.09 | ) | | $ | 18.05 | | | | 0.52 | | | | 1.04 | | | | 1.04 | | | | 1.22 | | | | 13.74 | | | | 61.67 | | | $ | 828,147 | |
2012 | | $ | 12.62 | | | | 0.08 | | | | 3.26 | | | | 3.34 | | | | — | | | — | | | — | | | $ | 15.96 | | | | 0.57 | | | | 1.09 | | | | 1.09 | | | | 1.45 | | | | 26.47 | | | | 129.49 | | | $ | 53,103 | |
2011 | | $ | 14.52 | | | | 0.09 | | | | (1.96 | ) | | | (1.87 | ) | | | (0.03 | ) | | — | | | (0.03 | ) | | $ | 12.62 | | | | 0.55 | | | | 1.04 | | | | 1.04 | | | | 1.47 | | | | (12.89 | ) | | | 129.15 | | | $ | 27,019 | |
2010(e) | | $ | 11.94 | | | | 0.11 | | | | 2.47 | | | | 2.58 | | | | — | | | — | | | — | | | $ | 14.52 | | | | 1.09 | (d) | | | 1.10 | (d) | | | 1.09 | (d) | | | 2.63 | (d) | | | 21.61 | | | | 47.37 | | | $ | 17,581 | |
CLASS R5 SHARES | | | | | | | | | | | | | | | | | | | | | | | | | | | | | | | | | | | | | | | | | | | | | | | | | | | |
2014(c) | | $ | 18.04 | | | | — | (f) | | | 0.95 | | | | 0.95 | | | | (0.05 | ) | | — | | | (0.05 | ) | | $ | 18.94 | | | | (0.03 | )(d) | | | 1.09 | (d) | | | 1.09 | (d) | | | 2.54 | (d) | | | 5.25 | | | | 23.47 | | | $ | 3,132 | |
2013(g) | | $ | 17.49 | | | | 0.08 | | | | 0.47 | | | | 0.55 | | | | — | | | — | | | — | | | $ | 18.04 | | | | 0.47 | (d) | | | 1.07 | (d) | | | 1.07 | (d) | | | 17.45 | (d)(h) | | | 3.14 | | | | 61.67 | | | $ | 697 | |
CLASS R6 SHARES | | | | | | | | | | | | | | | | | | | | | | | | | | | | | | | | | | | | | | | | | | | | | | | | | | | |
2014(c) | | $ | 18.08 | | | | — | (f) | | | 0.96 | | | | 0.96 | | | | (0.05 | ) | | — | | | (0.05 | ) | | $ | 18.99 | | | | (0.02 | )(d) | | | 0.99 | | | | 0.99 | (d) | | | 1.12 | (d) | | | 5.29 | | | | 23.47 | | | $ | 15,879 | |
2013(g) | | $ | 17.51 | | | | 0.04 | | | | 0.53 | | | | 0.57 | | | | — | | | — | | | — | | | $ | 18.08 | | | | 0.20 | (d) | | | 0.98 | (d) | | | 0.98 | (d) | | | 1.99 | (d) | | | 3.26 | | | | 61.67 | | | $ | 14,422 | |
| (a) | Not annualized for periods less than one year. |
| (b) | Sales loads are not reflected in computing total return. |
| (c) | Unaudited Six Month Period Ended March 31. |
| (e) | Fund commenced operations on December 16, 2009. |
| (f) | Net Investment Income (Loss) was less than $0.01 per share. |
| (g) | Effective date of this class of shares was February 1, 2013. |
| (h) | Due to the size of net assets and fixed expenses, ratios may appear disproportionate. |
| + | Based on weighted average shares outstanding, except for Dividends from Net Investment Income and Net Realized Gains, which are actual amounts per share. |
See notes to financial statements.
| | | | |
| 26 Certified Semi-Annual Report | | | | Certified Semi-Annual Report 27 |
| | |
| Expense Example | | |
| |
Thornburg Developing World Fund | | March 31, 2014 (Unaudited) |
As a shareholder of the Fund, you incur two types of costs:
| | (1) | transaction costs, including |
(a) sales charges (loads) on purchase payments, for Class A shares;
(b) a deferred sales charge on redemptions of any part or all of a purchase of $1 million of Class A shares within 12 months of purchase;
(c) a deferred sales charge on redemptions of Class C shares within 12 months of purchase;
| | (2) | ongoing costs, including management fees; distribution and/or service (12b-1) fees; and other Fund expenses. |
This example is intended to help you understand your ongoing costs (in dollars) of investing in the Fund and to compare these costs with the ongoing costs of investing in other mutual funds.
The example is based on a $1,000 investment beginning on October 1, 2013, and held until March 31, 2014.
ACTUAL EXPENSES
For each class of shares, the first line of the accompanying table provides information about actual account values and actual expenses. You may use the information in this line, together with the amount you invested, to estimate the expenses that you paid over the period. Simply divide your account value by $1,000 (for example, an $8,600 account value divided by $1,000 = 8.6), then multiply the result by the number in the first line for your class of shares under the heading entitled “Expenses Paid During Period” to estimate the expenses you paid on your account during this period.
| | | | | | | | | | | | |
| | | BEGINNING | | | ENDING | | | EXPENSES PAID | |
| | | ACCOUNT VALUE | | | ACCOUNT VALUE | | | DURING PERIOD† | |
| | | 10/1/13 | | | 3/31/14 | | | 10/1/13–3/31/14 | |
Class A Shares | | | | | | | | | | | | |
Actual | | $ | 1,000.00 | | | $ | 1,050.60 | | | $ | 7.20 | |
Hypothetical* | | $ | 1,000.00 | | | $ | 1,017.91 | | | $ | 7.08 | |
Class C Shares | | | | | | | | | | | | |
Actual | | $ | 1,000.00 | | | $ | 1,046.70 | | | $ | 11.22 | |
Hypothetical* | | $ | 1,000.00 | | | $ | 1,013.96 | | | $ | 11.04 | |
Class I Shares | | | | | | | | | | | | |
Actual | | $ | 1,000.00 | | | $ | 1,053.00 | | | $ | 5.37 | |
Hypothetical* | | $ | 1,000.00 | | | $ | 1,019.70 | | | $ | 5.28 | |
Class R5 Shares | | | | | | | | | | | | |
Actual | | $ | 1,000.00 | | | $ | 1,052.50 | | | $ | 5.58 | |
Hypothetical* | | $ | 1,000.00 | | | $ | 1,019.50 | | | $ | 5.49 | |
Class R6 Shares | | | | | | | | | | | | |
Actual | | $ | 1,000.00 | | | $ | 1,052.90 | | | $ | 5.07 | |
Hypothetical* | | $ | 1,000.00 | | | $ | 1,020.00 | | | $ | 4.99 | |
| † | Expenses are equal to the annualized expense ratio for each class (A: 1.41%; C: 2.20%; I: 1.05%; R5: 1.09%; R6: 0.99%;) multiplied by the average account value over the period, multiplied by 182/365 to reflect the one-half year period. |
| * | Hypothetical assumes a rate of return of 5% per year before expenses. |
HYPOTHETICAL EXAMPLE FOR COMPARISON PURPOSES
For each class of shares, the second line of the accompanying table provides information about hypothetical account values and hypothetical expenses based on the Fund’s actual expense ratio and an assumed rate of return of 5% per year before expenses, which is not the Fund’s actual return. The hypothetical account values and expenses may not be used to estimate the actual ending account balance or expenses you paid for the period. You may use this information to compare the ongoing costs of investing in the Fund and other funds. To do so, compare this 5% hypothetical example with the 5% hypothetical examples that appear in the shareholder reports of the other funds.
Please note that the expenses shown in the table are meant to highlight your ongoing costs only and do not reflect any transactional costs, such as sales charges (loads), redemption fees, or exchange fees. Therefore, the second line of the table for each class of shares is useful in comparing ongoing costs only, and will not help you determine the relative total costs of owning different funds. In addition, if these transactional costs were included, your costs would have been higher.
28 Certified Semi-Annual Report
| | |
| Index Comparison | | |
| |
Thornburg Developing World Fund | | March 31, 2014 (Unaudited) |
Growth of a Hypothetical $10,000 Investment
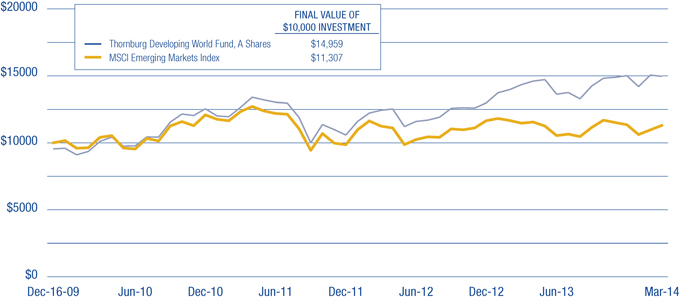
Average Annual Total Returns
For Periods Ended March 31, 2014 (with sales charge)
| | | | | | | | | | | | |
| | | 1 YR | | | 3 YRS | | | SINCE
INCEPTION | |
Class A Shares (Incep: 12/16/09) | | | -0.37 | % | | | 4.14 | % | | | 9.85 | % |
Class C Shares (Incep: 12/16/09) | | | 2.48 | % | | | 4.97 | % | | | 10.28 | % |
Class I Shares (Incep: 12/16/09) | | | 4.72 | % | | | 6.31 | % | | | 11.66 | % |
Class R5 Shares (Incep: 2/1/13) | | | 4.61 | % | | | — | | | | 7.34 | % |
Class R6 Shares (Incep: 2/1/13) | | | 4.72 | % | | | — | | | | 7.48 | % |
Performance data shown represents past performance and is no guarantee of future results. Investment return and principal value will fluctuate so shares, when redeemed, may be worth more or less than their original cost. Current performance may be lower or higher than quoted. For performance current to the most recent month end, visit thornburg.com or call 800.847.0200. The performance data and graph do not reflect the deduction of taxes that a shareholder would pay on distributions or the redemption of Fund shares. Returns reflect the reinvestment of dividends and capital gains as well as applicable sales charges. Class A shares are sold with a maximum sales charge of 4.50%. Class C shares are subject to a 1% CDSC for the first year only. There is no up-front sales charge for Class I, R5, and R6 shares.
Certified Semi-Annual Report 29
| | |
| Other Information | | |
| |
Thornburg Developing World Fund | | March 31, 2014 (Unaudited) |
Portfolio Proxy Voting
Policies and Procedures:
The Trust has delegated to Thornburg Investment Management, Inc. (the “Advisor”) voting decisions respecting proxies for the Fund’s voting securities. The Advisor makes voting decisions in accordance with its Proxy Voting Policy and Procedures. A description of the Policy and Procedures is available (i) without charge, upon request, by calling the Advisor toll-free at
1-800-847-0200, (ii) on the Thornburg website at www.thornburg.com, and (iii) on the Securities and Exchange Commission’s website at www.sec.gov.
Information regarding how proxies were voted is available on or before August 31 of each year for the twelve months ending the preceding June 30. This information is available (i) without charge, upon request by calling the Advisor toll-free at 1-800-847-0200, (ii) on the Thornburg website at www.thornburg.com, and (iii) on the Securities and Exchange Commission’s website at www.sec.gov.
Availability of Quarterly Portfolio Schedule
The Fund files with the Securities and Exchange Commission schedules of its portfolio holdings on Form N-Q for the first and third quarters of each fiscal year. The Fund’s Forms N-Q are available on the Commission’s website at www.sec.gov, or may be reviewed and copied at the Commission’s Public Reference Room in Washington, D.C. Information on the operation of the Public Reference Room may be obtained by calling 1-800-SEC-0330. The Fund also makes this information available on its website at www.thornburg. com/download or upon request by calling 1-800-847-0200.
30 Certified Semi-Annual Report
Trustees’ Statement to Shareholders
Not part of the Certified Semi-Annual Report
Reissued September 15, 2013
The Trustees believe current and prospective shareholders should know how we discharge our responsibilities in supervising the Funds’ investment advisor and in reviewing the advisor’s contract for renewal. Since 2005, we have issued a statement which sets out clearly the three principal guidelines that we follow in supervising the Trust’s investment advisor on your behalf. In accordance with our customary practice, in September of this year we again reviewed our statement and concluded we should reissue this statement outlining the principal features of our supervision of the advisor’s performance of investment management services for the Funds.
We begin with the premise that each shareholder selected his or her Fund because its investments are managed by the investment advisor identified in the prospectus and in accordance with the objective and policies described in the prospectus. We realize, as each of you do, that if you believe that your Fund’s stated objective and policies no longer serve your personal investment goals, you can sell your shares and leave the Fund.
Therefore, we believe that our primary supervisory task – our principal obligation to you – is to assess the nature and quality of the advisor’s services, and to confirm that the advisor actively and competently pursues the Fund’s objective, in accordance with the policies set out in the prospectus. To do this, we meet regularly with management to review your Fund’s portfolio and to discuss the advisor’s specific actions and judgments in pursuing the Fund’s objective. We do not substitute our own judgment for the advisor’s decisions in selecting investments; the advisor is paid to exercise its informed judgment on investment decisions, and we seek to confirm, in reviewing the advisor’s performance, that the advisor is doing just that.
Second, while we are conscious of costs and the effect that costs have on shareholders’ returns, we do not seek the lowest fees or expense ratio as our sole or primary objective. We try to make sure that your Fund’s fees and costs are reasonable in relationship to the services rendered and that they are generally in line with those charged by other expert investment advisors, consistent with our belief that the Fund’s investors searched for and expect that expertise and attention and have decided to pay a reasonable price for it. We do not put the management contract “out to bid” as a matter of course, and we would not do so unless we had concluded that the advisor materially had failed to pursue the Fund’s objectives in accordance with its policies, or for other equally important reasons. We believe that any other approach would be inconsistent with your interests and contrary to your expectations when you bought shares of the Fund in the first place.
Finally, because we believe that most Thornburg Fund shareholders have invested with a long-term perspective, we try not to focus too much on the fashions of the moment and on short-term performance. The market will not favor any specific investment objective or set of policies at all times and under all economic circumstances. A fund will experience periods of both high and low returns relative to other funds and other investments. Even if one of our Funds is not favored by the market at a particular time, we believe that the advisor is nonetheless obliged to remain true to the Fund’s objective and policies, and we watch to see that it does so.
This page is not part of the Semi-Annual Report 31
This page intentionally left blank.
32 This page is not part of the Semi-Annual Report
Retirement and Education Accounts
Thornburg Investment Management offers retirement and education savings accounts that can help you meet a variety of planning challenges. For account applications or further information on any of the accounts below, please call 1-800-847-0200 or go to www.thornburg.com/ira. Your financial advisor can help you determine which plan is right for you.
Individual Retirement Accounts
Individual Retirement Accounts (IRAs) provide a tax-advantaged means to save money for the future. For a detailed outline of the difference between retirement accounts, see www.thornburg.com/ira. Rollovers are available. Call 1-800-847-0200 for more information.
Traditional IRAs – Contributions to Traditional IRAs are tax deductible for eligible individuals, and withdrawals are taxed as additional ordinary income. You may contribute to an IRA if you receive compensation and are under 70 1⁄2, even if you are covered by an employer retirement plan. Deductible contributions are subject to certain qualifications. Please consult your tax advisor.
Roth IRAs – Under a Roth IRA, there is no tax deduction for contributions, but there is no income tax on qualified withdrawals. For a more detailed comparison of Traditional and Roth IRAs, please see our website at www.thornburg. com/ira.
SEP IRAs – Simplified Employee Pension (SEP) IRAs are established by employers. The employer is allowed a tax deduction for contributions made to the SEP Plan and makes contributions to each eligible employee’s SEP IRA on a discretionary basis.
SIMPLE IRAs – Savings Incentive Match Plan for Employees of Small Employers (SIMPLE) is designed to give small business owners a simplified method to establish and contribute to a retirement plan for employees. The employer is allowed a tax deduction for contributions and makes either matching or non-elective contributions to each eligible employee’s SIMPLE IRA. Employees may make salary deferral contributions.
Coverdell Education Savings Account
These savings accounts are designed to provide a way to save money for higher education expenses. In an Education Savings Account, earnings and interest grow tax-free, and qualified withdrawals used to pay for eligible higher-education expenses are tax- and penalty-free.
Funds Available
The following funds are available in the accounts listed above:
| | • | | Thornburg Core Growth Fund |
| | • | | Thornburg International Value Fund |
| | • | | Thornburg International Growth Fund |
| | • | | Thornburg Developing World Fund |
| | • | | Thornburg Investment Income Builder Fund |
| | • | | Thornburg Global Opportunities Fund |
| | • | | Thornburg Low Duration Income Fund |
| | • | | Thornburg Limited Term U.S. Government Fund |
| | • | | Thornburg Limited Term Income Fund |
| | • | | Thornburg Strategic Income Fund |
This page is not part of the Semi-Annual Report 33
Firm & Philosophy

The Firm
Founded in 1982 and headquartered in Santa Fe, New Mexico, Thornburg Investment Management advises a range of active investment strategies, each offered through multiple vehicles, to serve a broad spectrum of client needs worldwide. From short-term fixed income to flexible global equity, our objective is to help clients reach their long-term financial goals via active portfolio management. As of March 31, 2014, Thornburg managed approximately $90 billion in assets.
Investment Philosophy
We seek to preserve and increase the real wealth of shareholders after accounting for inflation, taxes, and investment expenses. We’re committed to disciplined investing and managing risk in all market environments.
Portfolio Holdings Commentary
At Thornburg, we believe you should know what you own. Our website keeps investors informed of the Funds’ equity holdings. Go to www.thornburg.com/funds for equity funds holdings and commentary.
Co-Ownership of Funds
We invest side-by-side with shareholders. Our employees have invested $387 million in Thornburg products as of March 31, 2014.
34 This page is not part of the Semi-Annual Report
Thornburg Fund Family
Thornburg Equity Funds
Thornburg’s equity research uses a fundamentally driven, bottom-up, comprehensive analytical approach. Thornburg equity funds generally focus on a limited number of securities so that each holding can impact performance. The team searches for firms believed to have a promising future and seeks to buy shares of those companies at a discount to their intrinsic or long-term value.
| | • | | Thornburg Core Growth Fund |
| | • | | Thornburg International Value Fund |
| | • | | Thornburg International Growth Fund |
| | • | | Thornburg Developing World Fund |
| | • | | Thornburg Investment Income Builder Fund |
| | • | | Thornburg Global Opportunities Fund |
Thornburg Bond Funds
Thornburg Investment Management applies a disciplined philosophy to fixed-income management. Since the launch of our first fixed-income fund over 25 years ago, we have been conducting fundamental, bottom-up research in an effort to identify bonds which we believe provide the best return for a given level of risk. We avoid leverage or complex strategies which could backfire in periods of market uncertainty.
| | • | | Thornburg Low Duration Income Fund |
| | • | | Thornburg Limited Term U.S. Government Fund |
| | • | | Thornburg Limited Term Income Fund |
| | • | | Thornburg Strategic Income Fund |
| | • | | Thornburg Low Duration Municipal Fund |
| | • | | Thornburg Limited Term Municipal Fund |
| | • | | Thornburg Intermediate Municipal Fund |
| | • | | Thornburg California Limited Term Municipal Fund |
| | • | | Thornburg New Mexico Intermediate Municipal Fund |
| | • | | Thornburg New York Intermediate Municipal Fund |
| | • | | Thornburg Strategic Municipal Income Fund |
Before investing, carefully consider the Fund’s investment goals, risks, charges, and expenses. For a prospectus or summary prospectus containing this and other information, contact your financial advisor or visit thornburg.com. Read it carefully before investing.
For additional information, please visit thornburg.com
Thornburg Investment Management, Inc. 2300 North Ridgetop Road, Santa Fe, NM 87506
This page is not part of the Semi-Annual Report 35
| | |
 | | Waste not, Wait not |

This Semi-Annual Report is submitted for the general information of shareholders of the Fund. It is not authorized for distribution to prospective investors in the Fund unless preceded or accompanied by an effective prospectus.
| | | | |
Investment Advisor: Thornburg Investment Management® 800.847.0200 | | Distributor: Thornburg Securities Corporation® 800.847.0200 | | TH2148 |
Item 2. Code of Ethics
Not applicable.
Item 3. Audit Committee Financial Expert
Not applicable.
Item 4. Principal Accountant Fees and Services
Not applicable.
Item 5. Audit Committee of Listed Registrants
Not applicable.
Item 6. Schedule of Investments
Filed as part of the reports to shareholders filed under item 1 of this Form.
Item 7. Disclosure of Proxy Voting Policies and Procedures for Closed-End Management Investment Companies
Not applicable.
Item 8. Portfolio Managers of Closed-End Management Investment Companies
Not applicable.
Item 9. Purchases of Equity Securities by Closed-End Management Investment Companies and Affiliated Purchasers.
Not applicable.
Item 10. Submission of Matters to a Vote of Security Holders
The authority to consider candidates recommended by the shareholders in accordance with the Trust’s Procedures for Shareholder Communications is committed to the Governance and Nominating Committee.
Item 11. Controls and Procedures
(a) The principal executive officer and the principal financial officer have concluded that Thornburg Investment Trust’s disclosure controls and procedures provide reasonable assurance that material information relating to Thornburg Investment Trust is made known to them by the appropriate persons, based on their evaluation of these controls and procedures as of a date within 90 days prior to the filing date of this report.
(b) There was no change in Thornburg Investment Trust’s internal control over financial reporting that occurred during the registrant’s second fiscal quarter of the period covered by this report (that is, the registrant’s second fiscal quarter) that has materially affected, or is reasonably likely to materially affect, the registrant’s internal control over financial reporting.
Item 12. Exhibits
(a) (1) Not Applicable
(a) (2) Certifications pursuant to Rule 30a-2(a) under the Investment Company Act of 1940 (17 CFR 70.30a-2(a)) attached hereto as Exhibit 99.CERT.
(a) (3) Not Applicable
(b) Certification pursuant to Section 906 of the Sarbanes-Oxley Act of 2002 and Rule 30a-2(b) under the Investment Company Act of 1940 (17 CFR 70.30a-2(b)) attached hereto as Exhibit 99.906CERT.
SIGNATURES
Pursuant to the requirements of the Securities Exchange Act of 1934 and the Investment Company Act of 1940, the registrant has duly caused this report to be signed on its behalf by the undersigned, thereunto duly authorized.
Thornburg Investment Trust, in respect of the following Thornburg Funds: Low Duration Municipal Fund, Limited Term Municipal Fund, Intermediate Municipal Fund, Strategic Municipal Income Fund, California Limited Term Municipal Fund, New Mexico Intermediate Municipal Fund, New York Intermediate Municipal Fund, Limited Term U.S. Government Fund, Low Duration Income Fund, Limited Term Income Fund, Strategic Income Fund, Value Fund, International Value Fund, Core Growth Fund, International Growth Fund, Investment Income Builder Fund, Global Opportunities Fund, and Developing World Fund.
Brian J. McMahon
President and principal executive officer
Pursuant to the requirements of the Securities Exchange Act of 1934 and the Investment Company Act of 1940, this report has been signed below by the following persons on behalf of the registrant and in the capacities and on the dates indicated.
Brian J. McMahon
President and principal executive officer
Jason H. Brady
Treasurer and principal financial officer